ict system architecture for smart energy container464065/fulltext02.pdf · ict system architecture...
TRANSCRIPT

ICT System Architecture For SmartEnergy Container
YIMING WU
Master’s Degree ProjectStockholm, Sweden April 2011
XR-EE-ICS 2011:013

ICT SYSTEM ARCHITECTURE FOR SMART
ENERGY CONTAINER
Yiming Wu
A Master Thesis Report written in collaboration with
Department of Industrial Information and Control Systems Royal Institute of Technology
Stockholm, Sweden
March, 2011
I
Abstract. Hybrid Energy Resource System (HERS) is studied and applied around
world in recent years. Control and monitor of them are quite important in real
application. HERS also has the requirement to integral with power grid such as
distribution grid networks. Therefore, to design and implement the information
communication system following IEC 61850, which is most promising standard for
design of substation communication and automation system, is necessary. This paper
presents the design of Information Communication Technology (ICT) architecture
and Unified Modeling Language (UML) models and final implementation through
LabVIEW programming for Smart Energy Container. Applying design following IEC
61850 series standards allow the HERS can communicate and interoperate with other
IEC61850 devices and SCADA systems. The implementation is applied to Smart
Energy Container which contains wind power, solar power, battery energy storage
system, and hydrogen energy storage system. Verification and testing results shows the
design is qualified to control and monitor Smart Energy Container.
Keywords. IEC 61850. Hybrid Energy Resource System. Distributed Energy
Resources. ICT architecture. UML model. Design Methodology.

II
Table of Contents
Abstract. I
Keywords. I
Table of Contents II
1 INTRODUCTION 1
1.1 Introduction of Smart Grid, DG(or DER) and HERS 1
1.2 Introduction of Study Case 1
1.3 Purpose of Study 2
2 RELATED WORK 3
2.1 Hybrid Energy Resource System Part 3
2.2 Microgrid Part 4
2.3 IEC61850 Part 4
3 DESCRIPTION OF SMART ENERGY CONTAINER (SEC) 6
3.1 Hardware Part 6
3.2 Software Part 10
4 ICT ARCHITECTURE DESIGN FOLLOWING IEC-61850 STANDARD
11
4.1 Communication Architecture of Smart Energy Container 12
4.2 UML Model Design of Smart Energy Container 23
4.3 Conclusion of Design part 40
5 IMPLEMENTATION OF CONTROL SYSTEM OF SMART ENERGY
CONTAINER 41
5.1 Data Acquisition and Command Output of the System 41
5.2 Basic Functions Applied with Manual Control 45
5.3 Automation Control Design 54
5.4 Flexible for Optimization Control 62
5.5 Additional Function 63

III
5.6 Conclusion of implementation part 65
6 VERIFICATION AND TESTING OF THE CONTROL SYSTEM 66
6.1 Parameters Setting 66
6.2 Response Time Detection 69
6.3 Protection Function Testing 70
6.4 Interlocking Function Testing 71
6.5 Manual Control Verification Result 76
6.6 Remote Control Verification Result 77
6.7 Automatic Control Testing 80
6.8 C&MS Execution Time Detection 81
7 ANALYSIS AND DISCUSSION 83
8 FUTURE WORK 85
9 CONCLUSION 86
10 ACKNOWLEDGEMENTS 87
11 REFERENCE 88
APPENDIX 91
Description and Class of Additional LNs 91

Dept. of Industrial Information and Control Systems
KTH, Royal Institute of Technology, Stockholm, Sweden
-1-
1 INTRODUCTION
1.1 Introduction of Smart Grid, DG(or DER) and HERS
Although Smart-Grids do not have a standard global definition, it is also attractive for most countries to invest billions of money on its research and development. Commonly, Smart-Grids contain such specification as intelligent monitoring, control communication, self- healing technologies and so on. In order to obtain such characteristics smart energy supply and smart energy demand are needed. To describe energy user component of smart grid, smart energy demand is used. Smart energy demand should enclosed such functions like reducing peak demand, shifting usage from rush hour to off-peak hour, reducing the losses, electric vehicle charging and other loads management corresponding to solar, wind and other renewable energy resource. On the other hand, from energy producer point of view, more and more renewable of energy is used in real life. Power generation is changed from centralized generation to Distributed Generation (DG) or Distributed Energy Resource (DER). [] [] [] Recently distributed generation or distributed energy resource is commonly referred to small-scale electricity generation which is connected to the distribution network directly or on the customer site. In decades, more and more engineer, energy companies and even countries pay attention on this kind of resource instead of centralized energy source. There are three main reasons push emphasis to the distributed generation side such liberalization of electricity markets, quality of energy supply and environmental concerns. For many distributed generation technology is flexible for operation, size and expandability which allow user to have flexible strategy face to electricity price evolutions. It is also what customers need in liberalization of electricity market. Distributed generation also can enhance the reliability of power supply from a large range view point. For instance, failure occurs in one part of distributed networks will not have serious influence to power supply of other parts. Environmental is also concerned by more and more people. In distributed generation, renewable energy is used to increase environment protection and decrease green house gas exhausting such CO2 emission. However distributed generation also has some disadvantages such high financial cost, economic efficiency, connection issues and so on. [1] [2] In this paper Smart Energy Container can be seen as a Distributed Generation Device which is located at consumer site and connect with a distribution network substation. Hybrid Energy Resource Systems (HERS) are becoming very popular these years. Due to hybrid power production is commonly from wind power and solar power which is non-costly, eco-friendly and sustainable, almost all European countries are beginning investing and investigation HERS. [3] [4] However, as the main energy production, wind power and solar power are weather dependent. Naturally power output from Solar panel and Wind turbine has the intermittent characteristic. Quality of the output power from solar- and wind-system is also the problem of HERS. The crucial drawback is that it is difficult to balance the demand and supply of electricity in real time. [5] In order to eliminate the problem mentioned above, the microgrid analysis is used to find a feasible solution for the HERS. Energy Storage System (ESS) is accepted to increased generation stability, reliability and power quality of HERS. For microgrid is sensitivity to load/ generation changes, both high energy and power densities storage system are needed. Unfortunately, there is no ESS can meet these two requirements recently. Hybrid Energy Storage System (HESS) is applied to improve the HERS further. [6]
1.2 Introduction of Study Case
In this paper, a Hybrid Energy Resource System coupling a wind turbine with solar panels, battery storage and hydrogen production/storage systems are considered. In order to allow this HERS case to be expandable and interoperable, ICT architecture and UML models design are following IEC-

Dept. of Industrial Information and Control Systems
KTH, Royal Institute of Technology, Stockholm, Sweden
-2-
61850 standard as much as it can. After that, control and monitoring system is implemented through LabVIEW software according to designed ICT architecture and UML models. Graphical User Interface (GUI) of SCADA system of smart energy container is developed. In the next section, a brief review of related work. In third section, research platform is introduced. In forth section, ICT architecture design will be described which include communication architecture of LNs and UML model design of smart energy container. In fifth section, according to UML model, implementation of control system of smart energy container is given. In sixth section, verification and testing result of control system is presented. Finally, conclusions and possible future development of the system are discussed.
1.3 Purpose of Study
This thesis focuses on the study of design a HERS control and monitoring system following IEC61850 standard. At same time, implement the design by LabVIEW software and verify the design. In the verification part, the implementation software should meet the requirement that enable basic protection functions which has the ability to protect devices of system avoid damage by too high voltage and/or current. At same time, the implementation system should give the solution to other functions such as manual control and automatic control, local control and remote control. The design of the ICT architecture and UML model should following IEC61850 standard. The implementation should following the design as much as possible.

Dept. of Industrial Information and Control Systems
KTH, Royal Institute of Technology, Stockholm, Sweden
-3-
2 RELATED WORK
2.1 Hybrid Energy Resource System Part
In the past few years, hybrid energy resource system has been studied from several different angles of view. They are mainly focus on the following three areas: Modelling and simulation of HERS, Control strategy of HERS and Economic analysis of HERS.
Modelling and Simulation Modelling and simulation are widely applied in power system analysis. From HERS point of view, it can be seen as a micro-grid. Therefore, the modelling and simulation which is used in power system can also be transferred and applied to the HER systems. In HER systems components are designed as non-linear model due to the characteristics of components. Mathematical model is applied to describe the physical characteristic of the component. [7] Dynamic modelling and simulation is commonly used to get transient responses of the system from step changes and their general performance. [8] [9] Some other modelling and simulation methods also can be found such as object oriented model [10] and demand side simulation [11]. Modelling and simulation are always used as tool for design, control/operation strategy developing and demonstration even economic benefits demonstration.
Control Strategy The control strategies designed by different designer is quite different in order to meet different control conditions. From time object point of view, control strategy is designed base on different time interval. Dagdougui’s work presents the real time control strategy [12]. Magnus makes schedule for specific hour of each next according maximizing the expected profit [13]. Bernal-Augustin uses hourly management to control the wind-hydrogen power, which simulates the system during a full year in hours with power curve to estimate the output power from wind turbine [14]. To make the schedule for control, different approach methods are used. For instant, dynamic decision is used to make real time operational management [14]. RETScreen wind energy model is used to estimation of wind power production meanwhile to decide hydrogen production in HERS of Ghardaia [15]. A receding horizon strategy is applied to determine the parameters setting for hybrid plant with wind power and hydrogen storage by M. Korpass [16]. A novel strategy is applied to control stand-alone Hybrid Renewable Energy System (HRES) with hydrogen storage by genetic algorithms [17]. Schönberger uses DC-bus signalling (DBS) to control a nanogrid(nanogrid is a single domain for voltage, reliability, and administration). By control based on the voltage level of the dc bus, it can be ensure that high-priority loads in DC system can obtain an uninterrupted supply of power under overload condition [18]. And there are some other control strategies be studied, which are not presented here. Overall point of view, most control strategies are based on optimal functions. Some are focusing on profit. Others are paying attention on environment friendly.
Economic Analysis Economic analysis can help making decision of hybrid energy resource system investigating. Through economic analysis, depreciation cost of device, prediction of future electricity price can also be obtained and used as foundation for the cost of operation. Furthermore, cost of operation will be used to plan control strategy scheme.

Dept. of Industrial Information and Control Systems
KTH, Royal Institute of Technology, Stockholm, Sweden
-4-
Proton Exchange Membrane (PEM) fuel cells and batteries are commonly used in electric vehicles (EVs) and energy storage systems (ESS) of microgrid. The lifecycle replacement and initial cost are significant factor which affect the investing of relevant project. In the early years, cost of platinum in original PEM fuel cells is significant barrier to PEM fuel cells to be used for commercial application. Through reconfiguration of the PEM fuel cell, some new technologies such as PTFE-bound methods, Thin-film methods, Vacuum deposition methods, Electrodeposition methods appeared, the platinum in the electrodes is reduced which becomes the driving force for further research on PEM fuel cell. [19] In order to get some detail information of cost fuel cells some estimation model like the cost model by Lomax et al. of Direct Technologies Inc. (DTI) and the Arthur D. Little (ADL) cost model are used. The case study based on ADI design assumption indicates to cost of manufacturing and implications of design choices, further, identify the opportunities for cost reducing. [20] However, a strong relationship between efficiency and economics of PEM fuel cells is existed. High efficiency will lead to low economics and low efficiency will give high economics when the output power is located at the range closing to maximum output power of fuel cell. For instance, the electrical efficiency of fuel cells at their maximum output power is about 30% and 50% when the output power is lower than the maximum output power.[21] The batteries also face to the similar problem of cost of manufacturing. For example, when batteries are applying to EVs, in order to be cost-competitive with gasoline internal-combustion engine vehicle, it is crucial to reduce their manufacturing cost to $100/kWh or less, reach 1200 or more cycle life, at least 12 years calendar life and with around 100Wh/kg specific energy. [22] When using batteries energy storage system of the microgrid charge and dispatch strategy also affect the operation cost of the system.[23]
2.2 Microgrid Part
Microgrids are localized contributed with several kinds of electricity generation, energy storage, and loads. They are normally connected with traditional centralized generation power grid and with some kind of running modes such as grid-connected operation with fixed local generation, grid-connected operation with load following local generation and island operation and so on. An electronically-interfaced distributed generation unit is used to simulate the concept of micro-grid which confirms micro-grid to be further investigations technically.[24] However, in order to integrating microgrid into traditional power grid, some operation and control issues such as sharing steady-state load between generating sets, sharing transient load between sets, seamlessly mode changing between grid-connected to island operation, power quality management and so on.[25] A study of controller design and analysis gives a solution to ensure synchronous between microgrid and utility grid.[26] Power quality compensator is used to enhance the microgrid power quality at the same time quality of current flow between microgrid and utility grid is also increased.[27] By applying Multiple voltage source converters (VSCs) to microgrid following a voltage-power droop/frequency-reactive power boost (VPD/FQB) control scheme can help regulating the voltage and frequency of the microgrid through injection of active power and reactive power from VSCs.[28]
2.3 IEC61850 Part
In the substation, using of different Intelligent Electronic Devices (IEDs) from different vendor will due to the difficulty of information exchange among IEDs. IEC61850 is written to solve such problem. In order to meet the requirement of interoperation and expandable, IEC61850 is applied to design more and more substations around world in recent years. Through Applying IEC61850 to develop advanced integrated protection scheme has been studied and it shows application of IEC61850 make it easy to realized the real time data exchange in substation. Furthermore, it is also helpful to promote the power system protection in further development. [29] In United States a 500kV project, which is multi-vendor project, is tested by applying IEC61850 standard as practically as possible. The result of the project gives the confirmation of the standard. [30] Another simulations

Dept. of Industrial Information and Control Systems
KTH, Royal Institute of Technology, Stockholm, Sweden
-5-
are tested which indicated that the IEC61850 substation communication system based on Ethernet has sufficient performance to meet the time critical messages in substation automation system. [31] Applying multi-agents withIEC61850-based substation automation (SA) can enhance the reliability and increasing system-level fault tolerant. [32] In order to meet the growing requirement of DER communication, IEC61850-7-420 is written to helps vendors of DER devices to face with the age-old issue of communication standards and protocols of DER devices. [33]

Dept. of Industrial Information and Control Systems
KTH, Royal Institute of Technology, Stockholm, Sweden
-6-
3 DESCRIPTION OF SMART ENERGY CONTAINER (SEC)
The specific Smart Energy Container also called Research Development and Demonstration platform (RD2) is built by STRI AB and the project is cooperated with KTH. The platform is mainly contributed with wind power production device, solar power production device, battery energy storage system, hydrogen energy storage system, isolation transformer, energy hub device, SCADA system (Control and Monitoring System) of the Smart Energy Container and some other devices. The SCADA system is developed by author and following the ICT architecture which is also designed by the author.
3.1 Hardware Part
System Overall View The system connection of Smart Energy Container is shown in figure 1. Power input from grid or sell to grid uses 1-phase AC transmission line which is connected with Smart Energy Container and substation of distributed network. There are three buses, an AC-bus, a DC-bus and a DC-Section-Bus. AC-bus and DC-bus can be seen as backup of each other.
CM
Local Power
UPS-1 kVA,Warm-1 kW,Vent-1 kW
CM
CMCM
ChargerCapacity 2 kW
Battery 48 V,15 kWh, 5 kW
Energy Hub5 kW
CM
CM CM
Fuel Cell 3 kW
H2 Production 4 kW
HydrogenStorage
CM
Wind Power2 kW
CM
Solar Power3 kW
CM CM
230 V AC, 50Hz, 1-phase
48-250 V DC
CM
CM
CM
Green Electricity
Electricity Car ChargerSTRI server,
Emergency light
CM
One Phase 230V
Isolation Transformer
Safety Switch
F1 50A
Ik=32A
F2 25A F3 25A F4 25A F5 25A F6 25A
F7 63AF8 63A F9 63A F10 63A F11 63A
F12 125A
M
M
M
M M
M
MM
MM
M
M
M
M
M
Figure 1 – Smart Energy Container system connection diagram.
Control Modular Box (CM Box) Control Modular box is contributed by a protection fuse, a switch, a current transformer (CT) and a voltage transformer (VT). Both AC CM box and DC CM box have the same structure as shown in figure 2.

Dept. of Industrial Information and Control Systems
KTH, Royal Institute of Technology, Stockholm, Sweden
-7-
Figure 2 – Control Modular Box structure. One CM box has two main ports, as the square blocks in the figure 2. These two ports are used to connect with devices or buses. CM box also has nine interfaces as small circle in the figure 2. Top two of them are used to get status of breaker. Following two under them are the control interfaces which is used to control the breaker. Next three interfaces are designed for current transformer and the two at bottom are voltage transformer interfaces. Status of breaker, control of breaker, current transformer and voltage transformer interfaces are connected with hardware of SCADA system.
There are two things should be mentioned here. One is about DC CM box, the direction of connection is important for control and monitoring. Since the current read from CM boxes depends on the direction of current flow. Opposite direction will lead to opposite sign of the current value. The other is measurement side should be notification. For the measurement unit (CT and VT) are on the same side of the breaker. When breaker is turn off, the value read from CT and VT depends on the connection of CM box. “M” is signed as measurement side as in the figure 1.
Isolation Transformer Isolation Transformer (ITR000702000) is applied to AC-bus of SEC in order to make SEC to be independent of distribution network grid. Therefore, the voltage and current are not required to be synchronized with grid. By applying this device, the SEC can be seen as island from power system grid.
Solar Power Production System Solar Power Production system is comprised by Photovoltaic (PV) panel and inverter. Solar power is sold to both DC bus and AC bus of the system. In this case, PV panel (PVE-MTF1-170-s) is connected to AC bus through inverter (Sunny Boy-SB1100) and corresponding CM box. Meanwhile PV panel is connected to DC bus through the CM box. Totally, 18 PV panels are used on the roof of the SEC, of which each 6 PV panels are series connected as a group and connect to one inverter. Three groups also will be connected parallel while working.
Figure 3 – Solar power production connection structure.

Dept. of Industrial Information and Control Systems
KTH, Royal Institute of Technology, Stockholm, Sweden
-8-
Wind Power Production System In Wind Power Production system, a wind turbine, a protection box (rectifier included) and an inverter is used. Wind turbine (Energy ball-V200) is used to transform the mechanic energy of wind into electrical power. Protection box (AeroCraftode) is used to convert AC power to DC form which also intergrading overvoltage protection therefore, it is called protection box. Its output is also used as power supply to DC bus. Inverter (Wind Boy-WB1100LV) is used to convert DC power to AC power (one phase) and run as AC output.
Figure 4 – Wind power production connection structure.
Hydrogen Energy Storage System The Hydrogen Energy Storage System has a hydrogen electrolyzer, hydrogen storage container, and fuel cell. In this case, Hydrogen electrolyzer (HOGEN Hydrogen Generation Systems-S20) can use both AC and DC power as input to produce hydrogen. Produced hydrogen will be stored into the metal absorb hydrogen storage container or tank container. If necessary the hydrogen container can be expanded to increase the capacity of storage. Fuel cell (Cellkraft S-3000) is used to consume hydrogen and produce DC electrical power which is fully automatic. Fuel cell also radiates heating energy as the side production of electrical power generation. It also has some additional equipment such as hydrogen detector which is used to identify if there is hydrogen leakage or not.
Figure 5 – Hydrogen energy storage system connection structure.
Battery Energy Storage System Battery Energy Storage System is contributed with battery bank, charger, and inverter. Battery bank is built with eight battery units (in this case T12250 is used). Each four of them are series connected as a group and two groups are parallel connected. Charger (PAC3200) is applied to charge battery bank using either AC or DC source as power input.
The main sources of green energy output from SEC are wind power and solar power. However, both wind power and solar power are highly dependent on weather condition. Therefore, high risk that intermittence of power output from renewable energy is existed. In order to increase the reliability and quality of output energy of renewable energy, battery bank is used as buffer to give a continuous energy output.

Dept. of Industrial Information and Control Systems
KTH, Royal Institute of Technology, Stockholm, Sweden
-9-
Figure 6 – Battery energy storage system connection structure.
Energy Hub Energy Hub (XW4548-230-50) is the key device of the system. It has two bilateral AC ports, one DC port and an AC output port. Two AC bilateral ports are designed for a generator and grid separately. In this case, only one bilateral AC port is used to connect with AC bus. The AC output port connects with load through the CM box. DC port is connected with DC section bus through another CM box.
The Energy Hub has several work modes. Its DC port can be used as inverter using power from battery bank to load or used as charger to send power to the battery. Bilateral AC port connected to the AC bus can be working as getting power from the AC bus or selling power to the grid. And AC output port can supply power to the load. By using this device, the load can be seen as island.
Figure 7 – Energy hub connection structure.
Local Power In this case, local power is connected to AC bus here, which contains UPS, heater and cooler.
Green Power Load Load is connected to the AC output port of energy hub. In this case, the load is assumed as electrical car charger, STRI server power supply and source of emergency light.
Hardware of SCADA System of the Smart Energy Container Hardware of SCADA system is contributed with data acquisition device, I/O interfaces and processor of SCADA. In this paper, data acquisition device, I/O interfaces and processor are using National Instrument Devices as two NI9205 as analog input modular, a NI9476 as digital output modular, NI9425 as digital input modular and a NI9211 as temperature data input modular.
Analog input modular is used to get real time voltage and current value. Digital output modular is used to send action command from processor to actuators. Digital input modular is applied to read status of breakers.
An industry computer is used to run the SCADA System. It also can be applied to communicate with high level SCADA system such as distribution network substation.

Dept. of Industrial Information and Control Systems
KTH, Royal Institute of Technology, Stockholm, Sweden
-10-
3.2 Software Part
Software part includes given software and software developed by author. For some devices use the their embedded software to work automatic such as wind power inverter, wind power protection box, solar power inverter, fuel cell and hydrogen electrolyzer. Except these softwares, a SCADA software is developed by author to meet the functions such as field control and monitoring, remote control and monitoring. Field monitoring means the container is monitored and controlled in the container. Remote monitor make it possible to control and monitor the container through internet and support software.
Control function is used to control the system. It also contains several parts. First it should ensure the safety running of the system which is protection function. Overcurrent or overvoltage can be detected and system should control the breakers to avoid destroy of the devices. Based on this, automatic control function and optimized control function can be added into the system also which will be discussed in later section.

Dept. of Industrial Information and Control Systems
KTH, Royal Institute of Technology, Stockholm, Sweden
-11-
4 ICT ARCHITECTURE DESIGN FOLLOWING IEC-61850 STANDARD
IEC61850 standard is used for designing of electrical substation automation. Furthermore it is also suitable for other industry automation design. IEC61850 is a part of the International Electrotechnical Commission’s (IEC) Technical Committee 57 (TC57) reference architecture for electric power systems. Detailed separation of IEC61850 standard documents are described in the Table 1:
Table 1 – IEC61850 standard documents name and description
Documents name Description
IEC 61850-1 Introduction and overviewIEC 61850-2 Glossary IEC 61850-3 General requirementsIEC 61850-4 System and project managementIEC 61850-5 Communication requirements for functions and device models IEC 61850-6 Configuration language for communication in electrical substations IEC 61850-7 Basic communication structure for substation and feeder equipment IEC 61850-7-1 Principles and modelsIEC 61850-7-2 Abstract communication service interface(ACSI)IEC 61850-7-3 Common Data ClassesIEC 61850-7-4 Compatible logical node classes and data classesIEC 61850-7-10 Communication networks and systems in power utility automation–
Requirements for web-based and structured access to the IEC61850 information models[Approved new work]
IEC 61850-7-410 Hydroelectric Power Plants – Communication for monitoring and control IEC 61850-7-420 Communications systems for Distributed Energy Resources (DER) – Logical
nodes IEC 61850-7-500 Use of logical nodes to model functions of a substation Automation
system[Approved new work] IEC 61850-7-510 Use of logical nodes to model functions of a Hydro Power Plant[Approved
new work] IEC 61850-8 Specific Communication service mapping (SCSM)IEC 61850-8-1 Mapping to MMS (ISO/IEC9506-1 and ISO/IEC 9506-2)IEC 61850-9 Specific communication service mapping (SCSM)IEC 61850-9-1 Sampled values over serial unidirectional multidrop point to point link IEC 61850-9-2 Sampled values over ISO/IEC 8802-3IEC 61850-10 Conformance testingIEC 61850-80-1 Guideline to exchanging information from a CDC-based data model using
IEC 60870-5-101 or IEC 60870-5-104 IEC 61850-90-1 Use of IEC 61850 for the communication between substations IEC 61850-90-2 Use of IEC 61850 for communication between control centers and

Dept. of Industrial Information and Control Systems
KTH, Royal Institute of Technology, Stockholm, Sweden
-12-
substations[Approved new work]IEC 61850-90-3 Using IEC 61850 for Condition Monitoring[Approved new work] IEC 61850-90-4 IEC 61850 Network Engineering [Approved new work]IEC 61850-90-5 GuidelinesUse of IEC 61850 to transmit synchrophasor information
according to IEEE C37.118[Approved new work] In this paper, design of the communication architecture and UML model Logical Nodes are mainly following IEC 61850-5, IEC 61850-7-3, IEC 61850-7-4 and IEC 61850-7-420. Data attribution, data type and setting are following IEC 61850-7-3 and IEC 61850-7-4.
4.1 Communication Architecture of Smart Energy Container
Before describing the communication architecture, some definitions should be mentioned here.[34] Substation automation system (SAS): System which operates, protects, monitors, etc. the substation, i.e. the primary system. Primary system: Common term for all power system equipment and switchgear. Secondary system: Interaction set of all components and systems in the substation for operation, protection, monitoring, etc, i.e. the primary system. Function: Task, which is performed by the substation automation. Logical system: Communication set of all application functions performing some overall task. Logical Node (LN): Smallest part of a function that exchanges data. Bay: Closely connected subparts of the substation with some common functionality. Station level functions: Refer to the substation as a whole. Bay level functions: Functions using mainly the data of one bay and acting mainly on the primary equipment of one bay. Process level functions: All functions interfacing to the process.
Overview Architecture of Smart Energy Container The study system can be divided into several bays following the IEC 61850 standard which is shown in the figure 8.

Dept. of Industrial Information and Control Systems
KTH, Royal Institute of Technology, Stockholm, Sweden
-13-
Figure 8 – Bay division of the system. In figure 8, the system is divided into 7 bays such as “Grid Incoming Bay”, “Battery Energy Storage Bay”, “Hydrogen Energy Storage Bay”, “Wind Power Production Bay”, “Solar Power Production Bay”, and “Energy Hub Bay”. The rest of system belongs to “Other Part Bay”. According to the IEC61850 paradigm, the control and monitor system is divided into three hierarchical levels: process, bay and station level as shown in figure 9.
Figure 9 – Concept of three hierarchical levels. The LNs at all three levels associated with a single control module. For the purposes of the Smart Energy Container, components are considered to encapsulate a substation. Thus, the process (lowest) level models the control module functionality and any other sensors or actuators in the system. The bay level represents the individual production sources or loads. Functions at the bay level therefore include interlocking, protection and low-level process control functions. Finally, the station level functions implement high-level busbar protection and interlocking, especially for safety functionality. Communication functionality for remote monitoring and control as well as alarm handling are also supported here. In IEC61850 standard, LNs have their specific symbol name. Table 2 gives the symbol name of LNs, which is used in this case, and corresponding description.

Dept. of Industrial Information and Control Systems
KTH, Royal Institute of Technology, Stockholm, Sweden
-14-
Table 2 – IEC61850 standard LNs name and their description [34] [35] [36] [37]
Logical Node Name IEC61850 Symbol
Description or Comments
(Time) Undervoltage protection
PTUV An undervoltage relay is a relay which operates when its input voltage is less than a predetermined value.
AC time overcurrent protection
PTOC AC time overcurrent relay is a relay when the AC input current exceeds a predetermined value, and in which the input current and operating time are inversely related through a substantial portion of the performance range.
(Time) Overvoltage protection
PTOV Overvoltage relay is a relay which operates when its input voltage is more than a predetermined value.
Busbar protection PBDF The complexity of the busbar node with changing topology up to a split into two or more nodes needs special means such as a dynamic busbar image. It has to be considered that at least a second busbar protection algorithm exits which is based on the direction comparison of the fault direction in all feeders.
Differential PDIF This LN shall be used for all kinds of current differential protection.
Alarm handling (creation of group alarms and group events)
CALH For the communication, there is no difference between alarms and events if a time tag is added to any data transmitted. If several events or alarms have to be combined to group alarms, a separate, configurable function is needed. The related LN may be used to calculate new data out of individual data from different logical nodes. Remote acknowledgement with different priority and authority shall be possible. The definition and handling of alarms is an engineering issue.
Switch controller Controls any switchgear, i.e. the devices described by XCBR and XSWI
CSWI The switch control LN handles all switchgear operations from the operators and from related automatics. It checks the authorization of the commands. It supervises the command execution and gives an alarm in case of an improper ending of the command. It asks for releases from interlocking, synchrocheck, autoreclosure, etc. If applicable.
Interlocking function -at station level And/or -at bay level
CILO Interlocking may by totally centralized or totally decentralized. Since the interlocking rules are basically the same on bay and station level and based on all related position indications, the different interlocking LNs may be seen as instances of the same LN class Interlocking (IL). Interlocking of switchgear at bay level All interlocking rules referring to a bay are included in this LN. Releases or blockings of requested commands are issued. In the case of status changes affecting interlocking, blocking commands are issued. Interlocking of switchgear at station level All interlocking rules referring to the station are included in this LN. Releases or blockings of requested commands are issued. Information with the LN bay interlocking is exchanged.
Operator interface-control local at bay
IHMI Front-panel operator interface at bay level to be used for configuration, etc. and local control.

Dept. of Industrial Information and Control Systems
KTH, Royal Institute of Technology, Stockholm, Sweden
-15-
level -control at station level
Local operator interface at station level to be used as workplace for the station operator. The role of the different HMI is not fixed for most of the functions and is defined in the engineering phase.
Remote control interface or telecontrol interface
ITCI Telecontrol interface to be used for remote control from higher control level. Basically, the TCI will communicate the same data as the station level HMI or a subset of these data. The role of the different interfaces is not fixed for most of the functions and is defined in the engineering phase.
Remote monitoring interface or telemonitoring interface
ITMI Telemonitoring interface to be used for remote monitoring andmaintenance using a subset of all information available in the substation and allows no control. The role of the different interfaces is not fixed for most of the functions and is defined in the engineering phase.
Automatic process control (a generic, programmable LN for sequences, unknown functions, etc.)
GAPC Several functions are sequences. They are collected in the LN type Generic Automatic Process Control (GPAC). This is a generic node for all undefined functions. These sequences may be implemented with standard PLC languages. The data access and exchange is entirely the same as for all other LNs.
Measuring -For operative purpose
MMXU To acquire values from CTs and VTs and calculate measurands such as r.m.s. values for current and voltage or power flows out of the acquired voltage and current samples. These values are normally used for operational purposes such as power flow supervision and management, screen displays, state estimation, etc. The requested accuracy for these functions has to be provided. NOTE The measuring procedures in the protection devices are part of the dedicated protection algorithm represented by the logical nodes Pxyz. Protection algorithms such as any function are outside the scope of the IEC 61850 series. Therefore, the LN Mxyz shall not be used as input for Pxyz. Fault related data such as fault peak value, etc. are always provided by the LNs of type Pxyz and not by LNs of type Mxyz.
DC measurement MMDC MMDC shall be used to represent measurements in a DC system: current, voltage, power and resistance
The LN “circuit breaker” covers all kinds of circuit breakers, i.e. switches able to interrupt short circuits Without point-on-wave switching capability With point-on-wave switching capability
XCBR An AC circuit breaker is a device that is used to close and interrupt an AC power circuit under normal conditions or to interrupt this circuit under fault or emergency conditions. If there is a single-phase breaker, this LN has an instance per phase. These three instances may be allocated to three physical devices mounted in the switchgear.
The LN “switch” covers all kinds of
XSWI Line switch is a switch used as a disconnecting, load-interrupter, or isolating switch on an AC or DC power circuit.

Dept. of Industrial Information and Control Systems
KTH, Royal Institute of Technology, Stockholm, Sweden
-16-
switching devices not able to switch short circuits Load breakers Disconnectors Earthing switchings High-speed earthing switches
If there is a single-phase switch, this LN has an instance per phase. These three instances may be allocated to three physical devices mounted in the switchgear.
Current transformer TCTR There is one instance per phase. These three/four instances may be allocated to different physical devices mounted in the instrument transformer per phase.
Voltage transformer TVTR There is one instance per phase. These three/four instances may be allocated to different physical devices mounted in the instrument transformer per phase.
Generic I/O GGIO Outputs such as analog outputs, auxiliary relays, etc. not covered by the above-mentioned switchgear related LNs are sometimes needed. In addition, there are additional I/O’s representing devices not predefined such as horn, bell, target value etc. There are input and outputs from non-defined auxiliary devices also. For all these I/O’s, the Generic Logical Node GIO is used to represent a generic primary or auxiliary device (type X…, Y…, Z…).
Battery ZBAT Provides data about battery status and for control of the charging/de-charging cycles.
Battery charger ZBTC The battery charger characteristics covered in the ZBTC logical node reflect those required for remote monitoring and control of critical auxiliary battery charger.
Inverter ZINV The ZINV logical node defines the characteristics of the inverter, which converts DC to AC. The DC may be the output of the generator or may be the intermediate energy form after a generator’s AC output has been rectified.
Rectifier ZRCT The ZRCT logical node defines the characteristics of the rectifier, which converts generator output AC to intermediate DC.
Fuel cell controller DFCL The fuel cell characteristics covered in the DFCL logical node reflect those required for remote monitoring of critical functions and states of the fuel cell itself.
Fuel cell stack DSTK Fuel cells are stacked together to provide the desired voltage level. The characteristics of a fuel cell stack that are included in the DSTK logical node are those required for remote monitoring of the fuel cell stack.
Photovoltaics module ratings
DPVM The photovoltaics module ratings covered in the DPVM logical node describes the photovoltaic characteristics of a module.
Photovoltaics array characteristics
DPVA The photovoltaics array characteristics covered in the DPVA logical node describe the configuration of the PV array. The logical node may be used to provide configuration information on the number of strings and panels or the number of sub-arrays in parallel.
Photovoltaics array controller
DPVC The photovoltaics array controller coverd in the DPVC logical node reflects the information required for remote monitoring of

Dept. of Industrial Information and Control Systems
KTH, Royal Institute of Technology, Stockholm, Sweden
-17-
critical photovoltaic functions and states. If the strings are individually controlled, one DPVC per string would be required to describe the controls. This logical node also provides list of the possible control modes that can be applied by the array controller. The control mode may change during the operation. The present status is then given by the array control status attribute.
Fuse XFUS The XFUS logical node is used to model a fuse which can be described as a switch that is normally closed but can only open once.
Temperature measurements
STMP This LN provides temperature measurements.
Pressure measurements
MPRS This LN provides pressure measurements.
Wind turbine general infromation
WTUR The logical node comprises the data classes that represent the wind turbine general information.
Wind turbine rotor information
WROT This logical node shall comprise the data classes that represent the wind turbine rotor information.
Wind turbine nacelle information
WNAC This logical node shall comprise the data classes that represent information concerning the wind turbine nacelle.
Wind turbine yawing information
WYAW This logical node shall comprise the data classes that represent the wind turbine yawing information.
Wind power plant alarm information
WALM This logical node shall comprise the data classes that represent alarm information of a wind power plant.
DER controller characteristics
DRCT The control characteristics and capabilities of one DER unit or aggregations of one type of DER device with a single controller.
DER controller status
DRCS The control status of one DER unit or aggregations of one type of DER device with a single controller.
DER supervisory control
DRCC The control actions for one DER unit or aggregations of one type of DER device with a single controller.
Except the LNs given by IEC61850, some other LNs are defined by author and used in ICT architecture design. These LNs are described in table 3.
Table 3 – LNs name and their description designed by author
Logical Node Name Symbol Description or Comments
Temperature sensor TTEM The logical node “TTEM” is used to give ambient temperature. Pressure sensor TPRE The logical node “TPRE” is used to give pressure value of the
air. Hydrogen generation controller
DHGC The logical node “DHGC” is used to control the hydrogen generation devices
Hydrogen generation characteristic rating
DHGI The logical node “DHGI” is used to give the hydrogen generation device characteristic rating value and status.
ICT architecture is following the principle as figure10, in this figure LNs are distributed into different level of function. Each part of ICT architecture design should follow this principle and described in detail later.

Dept. of Industrial Information and Control Systems
KTH, Royal Institute of Technology, Stockholm, Sweden
-18-
Figure 10 – LNs and their corresponding function level. It should be mentioned that there are two “CILO”-interlocking logical nodes in figure 10. The one located in station level is for interlocking function between different bays. Therefore it is interlocking function from station level point of view. The other belongs to bay level which means the objects of interlocking is in the same bay. Similarly, there are two “GPAC” logical nodes also. The station level one is used to control the process for different bays. The other is used for handling the process in same bay. In station level, the LNs functions are used as mentioned in figure 10 for each part of the system. “CALM” (Alarm handling), “PBDF” (Busbar protection), “PDIF” (Differential protection), “CILO” (Station level interlocking), “IHMI” (Human machine interface), “ITCI” (Remote control/ Telecontrol interface), “ITMI” (Remote mornitoring/ Telemonitoring interface), “GAPC” (Generic automatic process control) are used as functions of station level. Functions of bay level and process level are chosen according to requirement of each bay. The ICT architecture of each bay is described in detail as following. One thing should be mentioned here that according to IEC61850 standard, “MMXU” is used in three-phase system. In this case, the system is demonstrated in single phase which means “MMXN” should be used. However, “MMXU” is also applied to make the design is generalized for further using.
Wind Power Production Part “WTUR”, “WROT”, “WYAW”, “WNAC” and “WALM” are specified used in wind power production bay level function according to the IEC61400-25-2.[36] The functions of these LNs have been described in table 2. In station level, “ITMI”, “IHMI”, “PDIF” are supposed to acquire information from “WTUR”, “WROT”, “WYAW”, “WNAC”, “ZINV”, “ZRCT”, “DRCT”, “DRCS”, “MMDC”, and “MMXU”. In bay level, information from “XFUS”, “TCTR”, “TVTR” and “GGIO” are sent to “MMXU” and “MMDC”. “MMXU” is focused on AC data and signal processing meanwhile “MMDC” is emphasis on DC data and signal. According to this, monitoring function as “ITMI” and “IHMI” can obtain all needed data and information from process level and bay level. As the station level protection function “PDIF” can obtain the sufficient data to support protection for busbar. Alarm signals for alarm handling function “CALH” are from bay level protection and wind turbine alarm functions such as “WALM”, “PTUV”, “PTOV” and “PTOC”. Since “IHMI” also have the function as control, interlocking function should be sent from “CILO” to “IHMI” also. Combined information of “IHMI”, “CILO”, “PBDF”, “CALH”, and “ITCI” is sent to “GAPC” to obtained high level control information. This information is sent to bay level “GAPC”. In order to adjust control of all parts, bay level “GAPC” function also feedback bay status and information to station level “GAPC”.

Dept. of Industrial Information and Control Systems
KTH, Royal Institute of Technology, Stockholm, Sweden
-19-
In bay level, “MMXU” and “MMDC” send their information, which is obtained from process level functions, to protection function like “PTUV”, “PTOV” and “PTOC”. Protection functions create alarm signals and send to automatic process control – “GAPC” with alarm signal of wind turbine alarm function “WALM”. “GAPC” identify the situation of wind power production bay with station level command and applying interlocking function from bay level interlocking function “CILO” to control the break controller - “CSWI” to control the process level device breakers. “DRCC” also receive the command information from bay level “GAPC”. At same time, situation of wind power production bay is also feedback to station level “GAPC” function. The information communication architecture of wind power production bay is shown in figure 11.
IHMI
LN for station level
functions
LN for bay level functions
LN for process images
(process equipment)
TVTRTCTR
MMXU
PTOV
PTOC
PTUV
CSWI
CILO
XCBRGGIO
GAPC
CALHCILO PDIFITMI ITCI
XFUS
GAPC
WTUR
WROT
WNAC
WYAW
WALM
ZINV
ZRCT
Telemonitoring
Human Machine Interface
AC Measurement
Overvoltage Protecion
Undervoltage Protection
Interlocking (Station Level)
Differential Protection
Telecontrolling
Alarm Handling
Automatic process control (Station Level)
Overcurrent Protecion
Interlocking (Bay Level)
Automatic process control
(Bay Level)
Break Controller
Circuit BreakerVoltage Transformer
Current Transformer
Fuse Generic Process I/O
DRCT
DRCS
DER controller Status
DER controller Characteristics
DRCC
DER Supervisor Control
DC Measurement
Inverter
Rectifier
MMDC
Wind power plant alarm information
Wind turbine general information
Wind turbine rotor information
Wind turbine yawing information
Wind turbine nacelle information
Figure 11 – ICT architecture for Wind power production part.
Solar Power Production Part In solar power production bay level, specified LNs as “DPVM”, “DPVA”, “DPVC” are used to give the information of photovaltic panel such as controller, ratings, and characteristics. In process level, Fuse, Current Transformer (CT) and Voltage Transformer (VT) send information of status and values to measurement function “MMXU” and “MMDC”. Some other information also can be sent to “MMXU” and “MMDC” through Generic I/O interface by function “GGIO”. Breakers and switches are controlled by “CSWI” function. In bay level, “CSWI” gets command information directly from “GAPC” which process information from station level “GAPC”, protection functions and bay level interlocking functions. Protection information is obtained from “PTUV”, “PTOV” and “PTOC” through comparison of set value and real value read from “MMDC” and “MMXU”. The protection information will also be sent to alarm handling function of station level. “MMXU” and “MMDC” function also communicates with photovoltaic array controlling function “DPVC” to control the photovoltaic and get relevant information from photovoltaic array. Information of photovoltaic module ratings, photovoltaic array characteristic combined with inverter information, converter information and data values from “MMXU” and “MMDC” sent to the monitoring and protection function of station level. DER controller function “DRCC” receives the command information from bay level “GAPC” function. In station level the information communication structure is same as wind power part. The information communication architecture of solar power production part is shown in figure 12.

Dept. of Industrial Information and Control Systems
KTH, Royal Institute of Technology, Stockholm, Sweden
-20-
Figure 12 – ICT architecture for Solar power production part.
Hydrogen Energy Storage System Part In this part two LNs designed by author are used. One is “DHGC” which is used to control the hydrogen production. The other is “DHGI” which gives the information about the hydrogen production device, working status, working modes and so on. The station level of the ICT architecture of hydrogen energy storage system is same as wind power part. However, in bay level functions, “DHGI” and “DHGC” are applied for hydrogen generation information acquisition and control. Similarly, utility of “DSTK” and “DFCL” are aim for obtain the information of fuel cell and control fuel cell. “MMXU” and “MMDC” obtain information such as status, current value, and voltage value from “XFUS”, “TCTR”, “TVTR” and “GGIO”. Furthermore, temperature and pressure value should be obtained in hydrogen energy storage system due to monitoring the hydrogen pressure in the ordinary hydrogen storage bottle and temperature of deionized water are important for safety of the hydrogen energy storage system. Therefore, “STMP” and “MPRS” functions are added into the bay level functions. Correspondingly, “TTEM” and “TPRE” are needed in the process level function. The value of temperature and pressure output from “STMP” and “MPRS” are sent to “MMXU” and used by sink function. Bay level “GAPC” also gets value and status from “MMXU” and alarm signal from protection functions combined with bay level interlocking function and station level “GAPC” information to create the breaker and switch controller command. “CSWI” receive the command information to control the breaker and switch in the process level. DER control command also is created by “GAPC” and sent to “DRCC”. The information flow also can be seen from figure13.
Figure 13 – ICT architecture for Hydrogen energy storage systems part.

Dept. of Industrial Information and Control Systems
KTH, Royal Institute of Technology, Stockholm, Sweden
-21-
Battery Energy Storage System Part The station level functions and communication of battery energy storage system is same as wind power part. In the bay level, battery characteristic logical node “ZBAT” and charger logical node “ZBTC” are applied. For the inverter of battery is installed in energy hub, inverter logical node “ZINV” is not included in battery energy storage system part. “MMDC” and “MMXU” receive the voltage and current value from CTs and VTs. The information of temperature and fuse are also sent to “MMDC”. “ZBTC” has the intercommunication with “MMDC” and “MMXU”. At same time it uses relevant information to control the battery charger. Battery information from “ZBAT”, charger information from “ZBTC” and “MMDC” information are used for high level monitoring, protection and control. The source of protection functions input in bay level is also “MMDC” or “MMXU” and output alarm signals are sent to high level alarm handling function and bay level “GAPC”. After processing the information from high level “GAPC” function and checking the bay level interlocking function and alarm signal, “GAPC” send control command to breaker and switch controller. Through “CSWI”, breakers can be controlled. The information flow of the Battery energy storage system can be found in figure 14 also.
Figure 14 – ICT architecture for Battery energy storage systems part.
Energy Hub Part For the energy hub’s DC port can be used as inverter or as charger of battery. “ZINV” and “ZBTC” functions are applied. The station level has the same architecture as wind power part. In the process level, CT, VT, Generic I/O interface and Fuse give their measuring value and setting value to “MMXU” and “MMDC”. The temperature measurement is used for battery also send value to “MMDC”. The breakers are controlled by the command from “CSWI”. In bay level, “MMXU” and “MMDC” transfer the information to battery charger or battery inverter LNs which also send to the high level monitoring and protection functions. “ZBTC” and “ZINV” push their information to high level functions also. The protection functions obtain the needed information from “MMXU” and “MMDC”. According judgment of the value of voltage and current reaching their setting alarm level or not, alarm signals are set or eliminated by protection functions. The alarm signals are used by bay level “GAPC” and station level alarm handling function. Bay level “GAPC” also get command from high level “GAPC” and interlocking information combined with alarm signals. Applying such information and using its judgment process to obtain the control command for the “CSWI” and “DRCC”. Finally actuators are controlled following the command.

Dept. of Industrial Information and Control Systems
KTH, Royal Institute of Technology, Stockholm, Sweden
-22-
The information flow of the Battery energy storage system can be found in figure 15 also.
Figure 15 – ICT architecture for Energy hub part.
Grid Connection Part In Grid connection part, the station level functions and communications are same as the wind power part. In bay level function, “MMXU” get information from “TCTR”, “TVTR”, “GGIO” and obtain the temperature value for isolation transformer by “STMP” which get temperature signal from “TTEM” LN. “MMXU” also plays as information supplier of protection functions in bay level and monitoring, protection functions in station level at the same time. Protection functions in bay level send alarm signals to bay level “GAPC” and station level “CALH”. Later uses such signals to create information which will be used by station level “GAPC”. Former combined this signals with information from station level automatic control process and bay level interlocking to obtain the control command for breaker controller. Figure 16 also gives the information flow and architecture of the grid connection part.
Figure 16 – ICT architecture for Grid connection part.

Dept. of Industrial Information and Control Systems
KTH, Royal Institute of Technology, Stockholm, Sweden
-23-
Other Part of System The other part of the system is put into this bay as description of figure 8. The information and architecture of this part is shown in the figure 17. The station level is also same as the wind power part. The bay level is contributed by measurement LN-“MMXU”, overcurrent protection LN-“PTOC”, undervoltage protection LN-“PTUV”, overvoltage protection LN-“PTOV”, Temperature measurement LN-“STMP”, air pressure measurement LN-“MPRS”, Generic automatic process control LN-“GAPC”, interlocking function LN-“CILO”, and breaker and switch controller LN-“CSWI”, DER controller status LN-“DRCS”, DER controller characteristics LN-“DRCT”, and DER Supervisor Controller LN-“DRCC”. “MMXU” obtain the information from process LNs such as “TCTR”, “TVTR”, “GGIO”, “XFUS” and from bay level LNs as “MPRS” and “STMP” also. “GAPC” processes the information of bay level “CILO”, alarms from protection functions with command from high level “GAPC” to obtain the control information for “CSWI” to control the breaker LN-“XCBR” and switch LN-“XSWI”.
Figure 17 – ICT architecture for Other part.
4.2 UML Model Design of Smart Energy Container
Unified Modelling Language (UML) is commonly used to specify, visualize, modify, construct and document the artifacts of an object-oriented software-intensive system under development. In this section, UML model of smart energy container is designed according to the ICT architecture which has been described before.
Composition Relation of System and Subsystem UML models The composition relation of Smart Energy Container Control and Monitoring System is shown in the figure 18. It contains seven subsystems such as “wind power production” system, “solar power production” system, “battery energy storage” system, “hydrogen energy storage” system, “energy hub” system, “grid connection” system, and “other part” system. It also contains seven LNs such as “ITMI”, “IHMI”, “PDIF”, “ITCI”, “CALH”, “CILO”, and “GAPC”.

Dept. of Industrial Information and Control Systems
KTH, Royal Institute of Technology, Stockholm, Sweden
-24-
Figure 18 – Composition relation of Smart Energy Container Control and Monitoring System. Wind power production subsystem contains LNs functions from process level such as “TVTR”, “TCTR”, “XFUS”, and “GGIO”. It also includes LNs functions from bay level like wind turbine specific LNs(“WALM”, “WNAC”, “WTUR”, “WYAW”, “WRDT”), inverter and converter LNs ( “ZINV”, “ZRCT”), Measurement LNs-“MMXU” and “MMDC”, Protection (“PTOC”, “PTOV”, “PTUV”), interlocking function-“CILO”, Automatic process control-“GAPC”, DER controller characteristic-“DRCT”, DER controller status-“DRCS”, DER supervisory control-“DRCC” Breaker controller-“CSWI” and Breakers “XCBR”. The composition of wind power production system is also shown in figure 19a. There are four voltage transformers using for AC-Bus voltage, DC-Bus voltage, AC output voltage, DC output voltage. Two current transformers are used for AC output current and DC output current.

Dept. of Industrial Information and Control Systems
KTH, Royal Institute of Technology, Stockholm, Sweden
-25-
Figure 19a – Composition relation of Wind power production Subsystem. From figure 19a, wind power production subsystem is contributed by several LNs such as “MMXU”, “MMDC”, “ZINV”, “DRCT” and so on. Each LN contains several data objects and each data object also belongs to corresponding data class.

Dept. of Industrial Information and Control Systems
KTH, Royal Institute of Technology, Stockholm, Sweden
-26-
Figure 19b – LN MMXU of wind power production subsystem UML model. For instance, logic node “MMXU” contains data objects such as “TotW”, “TotVAr”, “TotVA”, “TotPF”, “Hz”, “PPV”, “PhV”, “A”, “W”, “VAr”, “VA”, “PF”, and “Z”. “TotW” is for total active power, “TotVAr” is for total reactive power, “TotVA” is for total apparent power, “TotPF” is for average power factor, “Hz” is for frequency, “PPV” is for phase to phase voltages, “PhV” is for phase to ground voltage, “A” is for phase currents, “W” is for phase active power, “VAr” is for phase reactive power, “VA” is for phase apparent power, “PF” is for phase power factor, and “Z” is for phase impedance. To some logical nodes, some data objects are mandatory and some are optional. To optional data objects, they can be chosen when necessary. To mandatory data objects, they must be chosen as requirement by standard. Each data object belongs to one common data class. In this case, “TotW”, “TotVAr”, “TotVA”, “TotPF”, and “Hz” belong to “MV” common data class. “PPV” belongs to “DEL” common data class. “PhV”, “A”, “W”, “VAr”, “VA”, “PF”, and “Z” belong to “WYE” common data class. Each common data class contains several Data Attributes. For example, Measured value “MV” contains “instMag”, “mag”, “range”, “q”, “t”, “subEna”, “subMag”, “subQ”, “subID” and so on. Some of them are mandatory, some others are optional, and the others depend on condition. [38] Therefore, Data attributes, data classes, and data objects build the mapping of the whole system. For different design, data attributes, data classes, and data objects can be chosen as need. Composition of Solar power production subsystem is shown in figure 20. “DPVA”, “DPVM”, “DPVC” are specific LNs in solar power system. Inverter and rectifier are also used for solar power output. Solar power production subsystem should use AC-Bus voltage, DC-Bus voltage, AC output voltage and DC output voltage for voltage measurement. Therefore, four “TVTR” are used separated for the subsystem. Similarly, two current transformers are used for AC output current and DC output current.

Dept. of Industrial Information and Control Systems
KTH, Royal Institute of Technology, Stockholm, Sweden
-27-
Figure 20 – Composition relation of Solar power production Subsystem. Composition of Battery energy storage subsystem is shown in figure 21. Three CTs and three VTs are used in battery energy storage subsystem. “ZBAT” and “ZBTC” are specifically used here. “TTEM” is used to measure the temperature of the battery. Protection functions, interlocking function, generic automatic process control function are also applied as mentioned in battery energy storage subsystem ICT architecture.

Dept. of Industrial Information and Control Systems
KTH, Royal Institute of Technology, Stockholm, Sweden
-28-
«subsystem»Station Level::Battery Energy Storage System
DC Section Breaker
DC Bus Breaker
AC Bus Breaker
BatteryTemperature
DC Bus Current
AC Bus Current
DC Section Current
DC Section Fuse
AC Bus Fuse
DC Bus Fuse
DC Section Voltage
AC Bus Voltage
DC Bus Voltage
+EEName() : DPL+OpTmh() : INS+Amp() : SAV+ARtg() : ASG
-LNNameTCTR
+EEName() : DPL+OpTmh() : INS+Amp() : SAV+ARtg() : ASG
-LNNameTCTR
+EEName() : DPL+OpTmh() : INS+Amp() : SAV+ARtg() : ASG
-LNNameTCTR
+EEname() : DPL+Tmp() : SAV+TmpAlm() : ASG+TmpMax() : ASG
-LNNameTTEM
+EEName() : DPL+OpTmh() : INS+Vol() : SAV+VRtg() : ASG
-LNNameTVTR
+EEName() : DPL+OpTmh() : INS+Vol() : SAV+VRtg() : ASG
-LNNameTVTR
+EEName() : DPL+OpTmh() : INS+Vol() : SAV+VRtg() : ASG
-LNNameTVTR
+TypFus() : ENS+FusA() : ASG
-LNNameXFUS
+TypFus() : ENS+FusA() : ASG
-LNNameXFUS
+TypFus() : ENS+FusA() : ASG
-LNNameXFUS
+EEName() : DPL+Loc() : SPS+OpCntRs() : INC+AnIn() : MV+SPCSO() : SPC+DPCSO() : DPC+ISCSO() : INC+IntIn() : INS+Ind() : SPS
-LNNameGGIO
+EEName() : DPL+OpTmh() : INS+Vol() : MV+VolChgRte() : MV+Amp() : MV+BatHi() : SPS+BatLo() : SPS+LoBatVal() : ASG+HiBatVal() : ASG
-LNNameZBAT
+TmpST() : SPS+TmpRteSt() : SPS+MaxTmp() : ASG+MinTmp() : ASG+MaxTmpRte() : ASG+Tmp() : MV
-LNNameSTMP
+BatChaSt() : ENG+BatChaTyp() : ENG+BatChaMod() : ENG+ChaV() : MV+ChaA() : MV
-LNNameZBTC
+OpCntRs() : INC+Str() : ACD+Op() : ACT+TmVSt() : CSD+TmVCrv() : CURVE+StrVal() : ASG
-LNNamePTUV
+Loc() : SPS+OpCntRs() : INC+SPCSO() : SPC+DPCSO() : DPC+ISCSO() : INC+Auto() : SPS+Str() : ACD+Op() : ACT
-LNNameGAPC
+OpCntRs() : INC+Str() : ACD+Op() : ACT+TmASt() : CSD+TmACrv() : CURVE+StrVal() : ASG
-LNNamePTOC
+OpCntRs() : INC+Str() : ACD+Op() : ACT+TmVSt() : CSD+TmVCrv() : CURVE+StrVal() : ASG
-LNNamePTOV
+EnaOpn() : SPS+EnaCls() : SPS
-LNNameCILO
+Loc() : SPC+Pos() : DPC+OpOpn() : ACT+OpCls() : ACT
-LNNameCSWI
+Loc() : SPS+OpCnt() : INS+Pos() : DPC+BlkOpn() : SPC+BlkCls() : SPC+CBOpCap() : INS
-LNNameXCBR
+Loc() : SPS+OpCnt() : INS+Pos() : DPC+BlkOpn() : SPC+BlkCls() : SPC+CBOpCap() : INS
-LNNameXCBR
+Loc() : SPS+OpCnt() : INS+Pos() : DPC+BlkOpn() : SPC+BlkCls() : SPC+CBOpCap() : INS
-LNNameXCBR
+Watt() : MV+Amp() : MV+Vol() : MV+VolPsGnd() : MV+VolNgGnd() : MV+Ris() : MV+RisPsGnd() : MV+RisNgGnd() : MV
-LNNameMMDC
+DERNum() : ING+DERtyp() : ING+MaxWLim() : ASG+MaxVarLim() : ASG+StrDITms() : ING+StopDITms() : ING+LodRampRte() : ING
-LNNameDRCT
+AutoMan() : SPS+Loc() : SPS+ModOnConn() : SPS+ModOnAval() : SPS+ModOnUnav() : SPS+ModOffAval() : SPS+ModOffUnav() : SPS+ModStr() : SPS+ModStop() : SPS+DCPowStat() : SPS
-LNNameDRCS
+DERStr() : SPC+DERStop() : SPC+AutoManCtl() : SPC+LocRemCtl() : SPC+OpModAval() : SPC+OpModOff() : SPC+OpModOff() : SPC+DCPowStat() : SPC
-LNNameDRCC
11111 11111
11111 11
1111
111 111
+TotW() : MV+TotVAr() : MV+TotVA() : MV+TotPF() : MV+Hz() : MV+PPV() : DEL+PhV() : WYE+A() : WYE+W() : WYE+VAr() : WYE+VA() : WYE+PF() : WYE+Z() : WYE
-LNNameMMXU
1
Figure 21 – Composition relation of Battery Energy Storage Subsystem. Hydrogen energy storage subsystem UML composition is shown in figure 22. For the subsystem need to monitoring the voltage of AC-Bus, DC-Bus, DC Section bus, three VTs are used here. Similarly, three CTs are used for AC Bus input current and DC bus input current of Hydrogen production, and DC output current from fuel cell. Fuel Cell specific LNs “DSTK” and “DFCL” are applied here same as Hydrogen Electrolyzer specific LNs “DHGI” and “DHGC”. In order to avoid frozen of deionized water, “TTEM” and “STMP” are used. To obtain the pressure of stored hydrogen, “TPRE” and “MPRS” are used. Protection functions, interlocking function, and breaker controller belongs to hydrogen energy storage system also. Breakers are the actuators here.

Dept. of Industrial Information and Control Systems
KTH, Royal Institute of Technology, Stockholm, Sweden
-29-
«subsystem»Station Level::Hydrogen Energy Storage System
+HGCfgTyp() : ENG+VRtgDC() : ASG+ARtgDC() : ASG+VRtgAC() : ASG+ARtgAC() : ASG+MaxInVDC() : ASG+MaxInCDC() : ASG+MaxInVAC() : ASG+MaxInCAC() : ASG
-LNNameDHGI
+CtrModSt() : INS+TDlWupTms() : ING+TDlSlpTms() : ING+PGModCtr() : ENC
-LNNameDHGC
+StrCnt() : INS+OpTms() : INS+LifeEfcPct() : INS+InstEfcPct() : INS+GriIndWRtg() : ASG+GriDepRtg() : ASG+VRtg() : ASG+FuelTyp() : ENG+FuelCsmpRte() : ASG+Alim() : ASG+Vlim() : ASG+FuelShut() : DPC+EmgCtl() : DPC+LifeWh() : MV
-LNNameDFCL
+Stkst() : SPS+StkWRtg() : ASG+StkVRtg() : ASG+StkARtg() : ASG+StkFuelTyp() : ASG+StkEfcPct() : MV+OutDCV() : MV+OutDCA() : MV+InCoolTmp() : MV+OutCoolTmp() : MV+InHydPres() : MV
-LNNameDSTK
+EnaOpn() : SPS+EnaCls() : SPS
-LNNameCILO
+Loc() : SPS+OpCntRs() : INC+SPCSO() : SPC+DPCSO() : DPC+ISCSO() : INC+Auto() : SPS+Str() : ACD+Op() : ACT
-LNNameGAPC
+OpCntRs() : INC+Str() : ACD+Op() : ACT+TmVSt() : CSD+TmVCrv() : CURVE+StrVal() : ASG
-LNNamePTUV
+Loc() : SPC+Pos() : DPC+OpOpn() : ACT+OpCls() : ACT
-LNNameCSWI
+EEName() : DPL+OpTmh() : INS+Amp() : SAV+ARtg() : ASG
-LNNameTCTR
+EEName() : DPL+OpTmh() : INS+Amp() : SAV+ARtg() : ASG
-LNNameTCTR
+EEName() : DPL+OpTmh() : INS+Amp() : SAV+ARtg() : ASG
-LNNameTCTR
+EEName() : DPL+OpTmh() : INS+Vol() : SAV+VRtg() : ASG
-LNNameTVTR
+EEName() : DPL+OpTmh() : INS+Vol() : SAV+VRtg() : ASG
-LNNameTVTR
+EEName() : DPL+OpTmh() : INS+Vol() : SAV+VRtg() : ASG
-LNNameTVTR
+TypFus() : ENS+FusA() : ASG
-LNNameXFUS
+TypFus() : ENS+FusA() : ASG
-LNNameXFUS
+TypFus() : ENS+FusA() : ASG
-LNNameXFUS
+EEName() : DPL+Pres() : SAV+PresAlm() : ASG
-LNNameTPRE
+EEname() : DPL+Tmp() : SAV+TmpAlm() : ASG+TmpMax() : ASG
-LNNameTTEM
+EEName() : DPL+Loc() : SPS+OpCntRs() : INC+AnIn() : MV+SPCSO() : SPC+DPCSO() : DPC+ISCSO() : INC+IntIn() : INS+Ind() : SPS
-LNNameGGIO
+TotW() : MV+TotVAr() : MV+TotVA() : MV+TotPF() : MV+Hz() : MV+PPV() : DEL+PhV() : WYE+A() : WYE+W() : WYE+VAr() : WYE+VA() : WYE+PF() : WYE+Z() : WYE
-LNNameMMXU
+PresST() : SPS+PresRteSt() : SPS+MaxPres() : ASG+MinPres() : ASG+MaxPresRte() : ASG+Pres() : MV
-LNNameMPRS
+TmpST() : SPS+TmpRteSt() : SPS+MaxTmp() : ASG+MinTmp() : ASG+MaxTmpRte() : ASG+Tmp() : MV
-LNNameSTMP
+OpCntRs() : INC+Str() : ACD+Op() : ACT+TmASt() : CSD+TmACrv() : CURVE+StrVal() : ASG
-LNNamePTOC
+OpCntRs() : INC+Str() : ACD+Op() : ACT+TmVSt() : CSD+TmVCrv() : CURVE+StrVal() : ASG
-LNNamePTOV
+Loc() : SPS+OpCnt() : INS+Pos() : DPC+BlkOpn() : SPC+BlkCls() : SPC+CBOpCap() : INS
-LNNameXCBR
+Loc() : SPS+OpCnt() : INS+Pos() : DPC+BlkOpn() : SPC+BlkCls() : SPC+CBOpCap() : INS
-LNNameXCBR
+Loc() : SPS+OpCnt() : INS+Pos() : DPC+BlkOpn() : SPC+BlkCls() : SPC+CBOpCap() : INS
-LNNameXCBR
111111111111
11111
11111
11 11 11AC Bus Input Current
DC Bus Input Current
DC Bus Output Current
AC Bus Input Voltage
DC Bus Input Voltage
Fuel Cell Output Voltage
AC Bus Connection Fuse
DC Bus Connection Fuse
DC Bus Output Fuse
Water Temperature
Hydrogen Pressue
AC Input Breaker
DC Input Breaker
DC Output Breaker
+Watt() : MV+Amp() : MV+Vol() : MV+VolPsGnd() : MV+VolNgGnd() : MV+Ris() : MV+RisPsGnd() : MV+RisNgGnd() : MV
-LNNameMMDC
+DERNum() : ING+DERtyp() : ING+MaxWLim() : ASG+MaxVarLim() : ASG+StrDITms() : ING+StopDITms() : ING+LodRampRte() : ING
-LNNameDRCT +AutoMan() : SPS
+Loc() : SPS+ModOnConn() : SPS+ModOnAval() : SPS+ModOnUnav() : SPS+ModOffAval() : SPS+ModOffUnav() : SPS+ModStr() : SPS+ModStop() : SPS+DCPowStat() : SPS
-LNNameDRCS
+DERStr() : SPC+DERStop() : SPC+AutoManCtl() : SPC+LocRemCtl() : SPC+OpModAval() : SPC+OpModOff() : SPC+OpModOff() : SPC+DCPowStat() : SPC
-LNNameDRCC
1 11
1
Figure 22 – Composition relation of Hydrogen Energy Storage Subsystem.

Dept. of Industrial Information and Control Systems
KTH, Royal Institute of Technology, Stockholm, Sweden
-30-
Energy hub subsystem Composition is shown in figure 23. The DC port of energy hub can be used as charger or inverter of the battery. Therefore, “ZBTC” and “ZINV” are used here as the ICT architecture of energy hub parts said. Process level CTs, VTs are needed by the subsystem. “TTEM” is prepared for DC port is used as charger. Correspondingly, “STMP” is needed also. Like the subsystem has been discussed, protection functions, interlocking function, measurement, automatic processes controller, breaker controller and breaker are part of the subsystem.
«subsystem»Station Level::Energy Hub
11111
11 1111
1111
DC Section Voltage
AC Bus Voltage
AC Bus Current
DC Section Current
Battery Temperature
+EEName() : DPL+OpTmh() : INS+Vol() : SAV+VRtg() : ASG
-LNNameTVTR
+EEName() : DPL+OpTmh() : INS+Vol() : SAV+VRtg() : ASG
-LNNameTVTR
+EEName() : DPL+OpTmh() : INS+Vol() : SAV+VRtg() : ASG
-LNNameTVTR
+EEName() : DPL+OpTmh() : INS+Amp() : SAV+ARtg() : ASG
-LNNameTCTR
+EEName() : DPL+Loc() : SPS+OpCntRs() : INC+AnIn() : MV+SPCSO() : SPC+DPCSO() : DPC+ISCSO() : INC+IntIn() : INS+Ind() : SPS
-LNNameGGIO
+EEname() : DPL+Tmp() : SAV+TmpAlm() : ASG+TmpMax() : ASG
-LNNameTTEM
+TotW() : MV+TotVAr() : MV+TotVA() : MV+TotPF() : MV+Hz() : MV+PPV() : DEL+PhV() : WYE+A() : WYE+W() : WYE+VAr() : WYE+VA() : WYE+PF() : WYE+Z() : WYE
-LNNameMMXU
+TmpST() : SPS+TmpRteSt() : SPS+MaxTmp() : ASG+MinTmp() : ASG+MaxTmpRte() : ASG+Tmp() : MV
-LNNameSTMP
+BatChaSt() : ENG+BatChaTyp() : ENG+BatChaMod() : ENG+ChaV() : MV+ChaA() : MV
-LNNameZBTC
+WRtg() : ASG+CoolTyp() : ENG+GridModSt() : ENS+Stdby() : SPS+ACTyp() : ENG+PQVLimSet() : CSG+OutWSet() : ASG+InALim() : ASG+InVLim() : ASG+HeatSinkTmp() : MV+EnclTmp() : MV+AmbAirTemp() : MV
-LNNameZINV
+OpCntRs() : INC+Str() : ACD+Op() : ACT+TmVSt() : CSD+TmVCrv() : CURVE+StrVal() : ASG
-LNNamePTUV
+OpCntRs() : INC+Str() : ACD+Op() : ACT+TmVSt() : CSD+TmVCrv() : CURVE+StrVal() : ASG
-LNNamePTOV
+OpCntRs() : INC+Str() : ACD+Op() : ACT+TmASt() : CSD+TmACrv() : CURVE+StrVal() : ASG
-LNNamePTOC
+EnaOpn() : SPS+EnaCls() : SPS
-LNNameCILO
+Loc() : SPS+OpCntRs() : INC+SPCSO() : SPC+DPCSO() : DPC+ISCSO() : INC+Auto() : SPS+Str() : ACD+Op() : ACT
-LNNameGAPC
+Loc() : SPC+Pos() : DPC+OpOpn() : ACT+OpCls() : ACT
-LNNameCSWI
+Loc() : SPS+OpCnt() : INS+Pos() : DPC+BlkOpn() : SPC+BlkCls() : SPC+CBOpCap() : INS
-LNNameXCBR
+Watt() : MV+Amp() : MV+Vol() : MV+VolPsGnd() : MV+VolNgGnd() : MV+Ris() : MV+RisPsGnd() : MV+RisNgGnd() : MV
-LNNameMMDC
+DERNum() : ING+DERtyp() : ING+MaxWLim() : ASG+MaxVarLim() : ASG+StrDITms() : ING+StopDITms() : ING+LodRampRte() : ING
-LNNameDRCT
+AutoMan() : SPS+Loc() : SPS+ModOnConn() : SPS+ModOnAval() : SPS+ModOnUnav() : SPS+ModOffAval() : SPS+ModOffUnav() : SPS+ModStr() : SPS+ModStop() : SPS+DCPowStat() : SPS
-LNNameDRCS
+DERStr() : SPC+DERStop() : SPC+AutoManCtl() : SPC+LocRemCtl() : SPC+OpModAval() : SPC+OpModOff() : SPC+OpModOff() : SPC+DCPowStat() : SPC
-LNNameDRCC
1
111 1
1
Figure 23 – Composition relation of Energy Hub Subsystem. The composition of Grid connection subsystem is given in figure 24. For there is requirement of temperature monitoring of isolation transformer, “TTEM” and “STMP” are composited in this subsystem. Current and voltage of AC-bus and Grid side should be monitored also. Therefore, two CTs and two VTs are applied here. The subsystem also has some other components like protection LNs, interlocking LN, breaker controller and breakers.

Dept. of Industrial Information and Control Systems
KTH, Royal Institute of Technology, Stockholm, Sweden
-31-
«subsystem»Station Level::Grid Connection
1111111
11 111
1111
+EEName() : DPL+OpTmh() : INS+Amp() : SAV+ARtg() : ASG
-LNNameTCTR
+EEName() : DPL+OpTmh() : INS+Amp() : SAV+ARtg() : ASG
-LNNameTCTR
+EEName() : DPL+OpTmh() : INS+Vol() : SAV+VRtg() : ASG
-LNNameTVTR
+EEName() : DPL+OpTmh() : INS+Vol() : SAV+VRtg() : ASG
-LNNameTVTR
+TypFus() : ENS+FusA() : ASG
-LNNameXFUS
+EEName() : DPL+Loc() : SPS+OpCntRs() : INC+AnIn() : MV+SPCSO() : SPC+DPCSO() : DPC+ISCSO() : INC+IntIn() : INS+Ind() : SPS
-LNNameGGIO
+EEname() : DPL+Tmp() : SAV+TmpAlm() : ASG+TmpMax() : ASG
-LNNameTTEM
+TotW() : MV+TotVAr() : MV+TotVA() : MV+TotPF() : MV+Hz() : MV+PPV() : DEL+PhV() : WYE+A() : WYE+W() : WYE+VAr() : WYE+VA() : WYE+PF() : WYE+Z() : WYE
-LNNameMMXU
+TmpST() : SPS+TmpRteSt() : SPS+MaxTmp() : ASG+MinTmp() : ASG+MaxTmpRte() : ASG+Tmp() : MV
-LNNameSTMP
Grid Current
AC Bus Current
Grid Voltage
AC Bus Voltage
Isolation Transformer Temperature
+OpCntRs() : INC+Str() : ACD+Op() : ACT+TmASt() : CSD+TmACrv() : CURVE+StrVal() : ASG
-LNNamePTOC
+OpCntRs() : INC+Str() : ACD+Op() : ACT+TmVSt() : CSD+TmVCrv() : CURVE+StrVal() : ASG
-LNNamePTOV
+OpCntRs() : INC+Str() : ACD+Op() : ACT+TmVSt() : CSD+TmVCrv() : CURVE+StrVal() : ASG
-LNNamePTUV
+EnaOpn() : SPS+EnaCls() : SPS
-LNNameCILO
+Loc() : SPS+OpCntRs() : INC+SPCSO() : SPC+DPCSO() : DPC+ISCSO() : INC+Auto() : SPS+Str() : ACD+Op() : ACT
-LNNameGAPC
+Loc() : SPC+Pos() : DPC+OpOpn() : ACT+OpCls() : ACT
-LNNameCSWI
+Loc() : SPS+OpCnt() : INS+Pos() : DPC+BlkOpn() : SPC+BlkCls() : SPC+CBOpCap() : INS
-LNNameXCBR
+DERNum() : ING+DERtyp() : ING+MaxWLim() : ASG+MaxVarLim() : ASG+StrDITms() : ING+StopDITms() : ING+LodRampRte() : ING
-LNNameDRCT
+AutoMan() : SPS+Loc() : SPS+ModOnConn() : SPS+ModOnAval() : SPS+ModOnUnav() : SPS+ModOffAval() : SPS+ModOffUnav() : SPS+ModStr() : SPS+ModStop() : SPS+DCPowStat() : SPS
-LNNameDRCS
+DERStr() : SPC+DERStop() : SPC+AutoManCtl() : SPC+LocRemCtl() : SPC+OpModAval() : SPC+OpModOff() : SPC+OpModOff() : SPC+DCPowStat() : SPC
-LNNameDRCC
1 1
1
Figure 24 – Composition relation of Grid Connection Subsystem. The last subsystem is “Other part” subsystem. The composition of it is shown in figure 25. For this subsystem is focus on the green power load, connection of DC-Bus and DC-Section, and local load part. There are four VTs are used to monitor the voltage of different place such as Energy Hub Output voltage, DC-Bus voltage, DC-Section voltage, and AC-Bus voltage. Three CTs are used to monitor the Energy Hub output current, AC current of local power, DC current from DC to DC Section. Temperature and Pressure of Smart Energy Container are measured in this subsystem. Protection functions, interlocking function, generic automatic processes controller, breaker and switch controller, breakers, and switches are also included in this subsystem.

Dept. of Industrial Information and Control Systems
KTH, Royal Institute of Technology, Stockholm, Sweden
-32-
«subsystem»Station Level::Other Part
+EEname() : DPL+Tmp() : SAV+TmpAlm() : ASG+TmpMax() : ASG
-LNNameStation Level::TTEM
+EEName() : DPL+Pres() : SAV+PresAlm() : ASG
-LNNameStation Level::TPRE
+EEName() : DPL+Loc() : SPS+OpCntRs() : INC+AnIn() : MV+SPCSO() : SPC+DPCSO() : DPC+ISCSO() : INC+IntIn() : INS+Ind() : SPS
-LNNameStation Level::GGIO
+EEName() : DPL+OpTmh() : INS+Vol() : SAV+VRtg() : ASG
-LNNameTVTR
+EEName() : DPL+OpTmh() : INS+Vol() : SAV+VRtg() : ASG
-LNNameTVTR
+EEName() : DPL+OpTmh() : INS+Vol() : SAV+VRtg() : ASG
-LNNameTVTR
Energy Hub Output Voltage
DC Bus Voltage
AC Bus Voltage
+EEName() : DPL+OpTmh() : INS+Vol() : SAV+VRtg() : ASG
-LNNameTVTR
DC Section Voltage
Energy Hub Output Current
+EEName() : DPL+OpTmh() : INS+Amp() : SAV+ARtg() : ASG
-LNNameTCTR
+EEName() : DPL+OpTmh() : INS+Amp() : SAV+ARtg() : ASG
-LNNameTCTR
+EEName() : DPL+OpTmh() : INS+Amp() : SAV+ARtg() : ASG
-LNNameTCTR
AC Current for local power
DC Current from DC Bus to DC Section
Container Temperature
Container Pressure
+TotW() : MV+TotVAr() : MV+TotVA() : MV+TotPF() : MV+Hz() : MV+PPV() : DEL+PhV() : WYE+A() : WYE+W() : WYE+VAr() : WYE+VA() : WYE+PF() : WYE+Z() : WYE
-LNNameMMXU
+TmpST() : SPS+TmpRteSt() : SPS+MaxTmp() : ASG+MinTmp() : ASG+MaxTmpRte() : ASG+Tmp() : MV
-LNNameSTMP
+PresST() : SPS+PresRteSt() : SPS+MaxPres() : ASG+MinPres() : ASG+MaxPresRte() : ASG+Pres() : MV
-LNNameMPRS
+OpCntRs() : INC+Str() : ACD+Op() : ACT+TmASt() : CSD+TmACrv() : CURVE+StrVal() : ASG
-LNNamePTOC
+OpCntRs() : INC+Str() : ACD+Op() : ACT+TmVSt() : CSD+TmVCrv() : CURVE+StrVal() : ASG
-LNNamePTOV
+OpCntRs() : INC+Str() : ACD+Op() : ACT+TmVSt() : CSD+TmVCrv() : CURVE+StrVal() : ASG
-LNNamePTUV
+EnaOpn() : SPS+EnaCls() : SPS
-LNNameCILO
+Loc() : SPS+OpCntRs() : INC+SPCSO() : SPC+DPCSO() : DPC+ISCSO() : INC+Auto() : SPS+Str() : ACD+Op() : ACT
-LNNameGAPC
+Loc() : SPC+Pos() : DPC+OpOpn() : ACT+OpCls() : ACT
-LNNameCSWI
+Loc() : SPS+OpCnt() : INS+Pos() : DPC+BlkOpn() : SPC+BlkCls() : SPC+CBOpCap() : INS
-LNNameXCBR
+Loc() : SPS+OpCnt() : INS+Pos() : DPC+BlkOpn() : SPC+BlkCls() : SPC+CBOpCap() : INS
-LNNameXCBR
+Loc() : SPS+OpCnt() : INS+Pos() : DPC+BlkOpn() : SPC+BlkCls() : SPC+CBOpCap() : INS
-LNNameXCBR
+Loc() : SPS+EEName() : DPL+OpCnt() : INS+Pos() : DPC+BlkOpn() : SPC+BlkCls() : SPC+SwTyp() : INS+SwOpCap() : INS
-LNNameXSWI+Loc() : SPS
+EEName() : DPL+OpCnt() : INS+Pos() : DPC+BlkOpn() : SPC+BlkCls() : SPC+SwTyp() : INS+SwOpCap() : INS
-LNNameXSWI
Breaker between DC Bus and DC Section
Breaker of Load
Breaker of Local Power
AC Bus Safety Switch
DC Bus Safety Switch
1 1111 11111
111111
1*
1111111
+DERNum() : ING+DERtyp() : ING+MaxWLim() : ASG+MaxVarLim() : ASG+StrDITms() : ING+StopDITms() : ING+LodRampRte() : ING
-LNNameDRCT
+AutoMan() : SPS+Loc() : SPS+ModOnConn() : SPS+ModOnAval() : SPS+ModOnUnav() : SPS+ModOffAval() : SPS+ModOffUnav() : SPS+ModStr() : SPS+ModStop() : SPS+DCPowStat() : SPS
-LNNameDRCS
+DERStr() : SPC+DERStop() : SPC+AutoManCtl() : SPC+LocRemCtl() : SPC+OpModAval() : SPC+OpModOff() : SPC+OpModOff() : SPC+DCPowStat() : SPC
-LNNameDRCC
111
Figure 25 – Composition relation of “Other Part” Subsystem.
UML Model of Smart Energy Container Control and Monitoring System From station level point of view, information from subsystem are sent to the station level function “ITMI”, “IHMI”, and “PDIF” as design of the ICT architecture of the smart energy container. The alarm signals from each subsystem are sent to alarm handling. Station level GAPC will collection information from “IHMI”, “PDIF”, “CALH”, “ITCI”, and “CILO” to create the control information for each subsystem. The status, values, alarm signal, and subsystem information are read from each subsystem. According to different usage, they are received by “ITMI”, “IHMI”, “PDIF”, and “CALH” separately. For each subsystem “GAPC” function has communication with station level system, the interface “Subsystem GAPC information” is applied as shown in figure 26. “IHMI”, “PDIF”, “CALH”, “ITCI”, “CILO” are supposed to give information to “GAPC” function to control the whole system. The command of each subsystem from top system here is applied through “Station Level Command to Subsystem” interface.

Dept. of Industrial Information and Control Systems
KTH, Royal Institute of Technology, Stockholm, Sweden
-33-
«topLevelPackage»UML Model::Station Level
«subsystem»Battery Energy Storage System
«subsystem»Energy Hub
«subsystem»Grid Connection
«subsystem»Hydrogen Energy Storage System
«subsystem»Other Part
«subsystem»Solar Power Production System
«subsystem»Wind Power Production System
-LNNameITMI
-LNNameIHMI
+GrAlm() : SPS+GrWrn() : SPS
-LNNameCALH
-LNNameITCI
+EnaOpn() : SPS+EnaCls() : SPS
-LNNameCILO
+Loc() : SPS+OpCntRs() : INC+SPCSO() : SPC+DPCSO() : DPC+ISCSO() : INC+Auto() : SPS+Str() : ACD+Op() : ACT
-LNNameGAPC
Station Level Command
Station Level Command
Station Level Command
Station Level Command
Station Level Command
Station Level Command
Station Level Command
Subsystem Information
Subsystem Alarm
«interface»Station Level Command to Subsystem
Subsystem Alarm
Subsystem Information
Subsystem GAPC information
Subsystem InformationSubsystem GAPC information
Subsystem Alarm
Subsystem AlarmSubsystem GAPC information
Subsystem Information
Subsystem GAPC information
Subsystem AlarmSubsystem GAPC information
Subsystem Information
Subsystem AlarmSubsystem GAPC information
Subsystem Information
Subsystem AlarmSubsystem GAPC information
Subsystem Information
+Op() : ACT+TmASt() : CSD+DifAClc() : WYE+RstA() : WYE+LinCapac() : ASG+LoSet() : ASG+HiSet() : ASG
-LNNamePDIF
Figure 26 – UML model of Smart Energy Container Control and Monitoring System.
UML Model of Wind Power Production Subsystem Wind Power Production Subsystem is used to control two output breakers, wind turbine, and its inverter and converter. The current and voltage value is obtained through read waveform or input signal from CTs and VTs and process by measurement units “MMXU” and “MMDC”. “MMXU” and “MMDC” also receive other information such as Fuses setting value and extra information from “GGIO”. After process the input signal, “MMXU” and “MMDC” send data of the subsystem with relevant information to “Subsystem information” interface which also get information from “WNAC”, “WTUR”, “WYAW”, “WROT”, “DRCS”, “DRCT”, “ZINV”, and “ZRCT”. The voltage and current data are also sent to protection functions. The protection functions “PTOC”, “PTOV”, “PTUV” compare the real data with set point to create alarm/normal signals. Combined with wind turbine alarm “WALM” status, such signals are sent to “Subsystem Alarm” interface and “GAPC” function at same time. Except alarm signal, “GAPC” also obtain the information from “CILO” and “Station level Command to Subsystem”. After handling obtained information, “GAPC” creates control information which is used by “CSWI” and “DRCC”. Meanwhile, subsystem “GAPC” send feedback information to the station level “GAPC” through the interface “Subsystem GAPC information”. Finally, “CSWI” gives breaker control command signal such as “0” to turn off the switch and “1” to turn on the switch to control the actuator like “XCBR”.
As description above, The UML model of wind power production subsystem is shown in figure 27.

Dept. of Industrial Information and Control Systems
KTH, Royal Institute of Technology, Stockholm, Sweden
-34-
«subsystem»Station Level::Wind Power Production System
+TotW() : MV+TotVAr() : MV+TotVA() : MV+TotPF() : MV+Hz() : MV+PPV() : DEL+PhV() : WYE+A() : WYE+W() : WYE+VAr() : WYE+VA() : WYE+PF() : WYE+Z() : WYE
-LNNameStation Level::MMXU
AC Bus Voltage
DC Bus Voltage
AC Output Voltage
DC Output Voltage
AC Output Current
DC Output Current
AC Output Fuse
DC Output Fuse
+EEName() : DPL+OpTmh() : INS+Vol() : SAV+VRtg() : ASG
-LNNameTVTR
+EEName() : DPL+OpTmh() : INS+Vol() : SAV+VRtg() : ASG
-LNNameTVTR
+EEName() : DPL+OpTmh() : INS+Vol() : SAV+VRtg() : ASG
-LNNameTVTR
+EEName() : DPL+OpTmh() : INS+Vol() : SAV+VRtg() : ASG
-LNNameTVTR
+EEName() : DPL+OpTmh() : INS+Amp() : SAV+ARtg() : ASG
-LNNameTCTR
+EEName() : DPL+OpTmh() : INS+Amp() : SAV+ARtg() : ASG
-LNNameTCTR
+TypFus() : ENS+FusA() : ASG
-LNNameXFUS
+TypFus() : ENS+FusA() : ASG
-LNNameXFUS
+EEName() : DPL+Loc() : SPS+OpCntRs() : INC+AnIn() : MV+SPCSO() : SPC+DPCSO() : DPC+ISCSO() : INC+IntIn() : INS+Ind() : SPS
-LNNameGGIO
+AlmSt() : ASS-LNName
WALM
+BecBulbSt() : STV+WdHtSt() : STV+IceSt() : STV+AneSt() : STV+Dir() : MV+WdSpd() : MV+WdDir() : MV+ExTmp() : MV+IntlTmp() : MV+IntlHum() : MV+DispXdir() : MV+DispYdir() : MV+SetBecMod() : CMD+SetBecLev() : SPV
-LNNameWNAC
+StrCnt() : CTE+StopCnt() : CTE+TotWh() : CTE+TotVArh() : CTE+DmdWh() : BCR+DmdVArh() : BCR+SupWh() : BCR+SupVArh() : BCR+TurSt() : STV+W() : MV+Var() : MV+SetTurOp() : CMD+VArOvW() : CMD+VArRefPri() : CMD+DmdW() : SPV+DmdVAr() : SPV+DmdPF() : SPV
-LNNameWTUR
+YwSt() : STV+YwBrakeSt() : STV+YwSpd() : MV+Tmp() : MV+YawAng() : MV+CabWup() : MV+AtvYw() : CMD
-LNNameWYAW
+RotSt() : STV+BlStBl1() : STV+BlStBl2() : STV+BlStBl3() : STV+PtCtlSt() : STV+RotSpd() : MV+RotPos() : MV+HubTmp() : MV+BlkRot() : CMD+PtEmgChk() : CMD
-LNNameWROT
+WRtg() : ASG+CoolTyp() : ENG+GridModSt() : ENS+Stdby() : SPS+ACTyp() : ENG+PQVLimSet() : CSG+OutWSet() : ASG+InALim() : ASG+InVLim() : ASG+HeatSinkTmp() : MV+EnclTmp() : MV+AmbAirTemp() : MV
-LNNameZINV
+CmutTyp() : ENG+IsoTyp() : ENG+VRegTyp() : ENG+ConvTyp() : ENG+CoolTyp() : ENG+ACTyp() : ENG+OutWSet() : ASG+InAlim() : ASG+OutVSet() : ASG+OutALim() : ASG+InVlim() : ASG
-LNNameZRCT
+OpCntRs() : INC+Str() : ACD+Op() : ACT+TmASt() : CSD+TmACrv() : CURVE+StrVal() : ASG
-LNNamePTOC
+OpCntRs() : INC+Str() : ACD+Op() : ACT+TmVSt() : CSD+TmVCrv() : CURVE+StrVal() : ASG
-LNNamePTOV
+OpCntRs() : INC+Str() : ACD+Op() : ACT+TmVSt() : CSD+TmVCrv() : CURVE+StrVal() : ASG
-LNNamePTUV
+EnaOpn() : SPS+EnaCls() : SPS
-LNNameCILO
+Loc() : SPS+OpCntRs() : INC+SPCSO() : SPC+DPCSO() : DPC+ISCSO() : INC+Auto() : SPS+Str() : ACD+Op() : ACT
-LNNameGAPC
+Loc() : SPC+Pos() : DPC+OpOpn() : ACT+OpCls() : ACT
-LNNameCSWI
+Loc() : SPS+OpCnt() : INS+Pos() : DPC+BlkOpn() : SPC+BlkCls() : SPC+CBOpCap() : INS
-LNNameXCBR
+Loc() : SPS+OpCnt() : INS+Pos() : DPC+BlkOpn() : SPC+BlkCls() : SPC+CBOpCap() : INS
-LNNameXCBR
AC Output Breaker
DC Output Breaker
«interface»Subsystem Information
«interface»Subsystem Alarm
«interface»Subsystem GAPC information
Station Level Command to Subsystem
VTs Signal
CTs Signal
Information
Voltage value
Current value
Subsystem Information
Subsystem Alarm
Interlocking Information
Feedback Information
Control Information
Breaker Control Command
Alarm Signal
+Watt() : MV+Amp() : MV+Vol() : MV+VolPsGnd() : MV+VolNgGnd() : MV+Ris() : MV+RisPsGnd() : MV+RisNgGnd() : MV
-LNNameMMDC
+DERNum() : ING+DERtyp() : ING+MaxWLim() : ASG+MaxVarLim() : ASG+StrDITms() : ING+StopDITms() : ING+LodRampRte() : ING
-LNNameDRCT
+AutoMan() : SPS+Loc() : SPS+ModOnConn() : SPS+ModOnAval() : SPS+ModOnUnav() : SPS+ModOffAval() : SPS+ModOffUnav() : SPS+ModStr() : SPS+ModStop() : SPS+DCPowStat() : SPS
-LNNameDRCS
+DERStr() : SPC+DERStop() : SPC+AutoManCtl() : SPC+LocRemCtl() : SPC+OpModAval() : SPC+OpModOff() : SPC+OpModOff() : SPC+DCPowStat() : SPC
-LNNameDRCC
Current value
Voltage value
Information
VTs Signal
CTs Signal
Figure 27 – UML model of Wind Power Production Subsystem.
UML Model of Solar Power Production Subsystem Similar with the wind power production subsystem, solar power production subsystem is applied to control two output breakers and solar panel controller. The basic things such as reading value from CTs and VTs, data processing by “MMXU” and “MMDC”, alarm handling and command creation by “GAPC”, final actuator control by “CSWI” are same as wind power part. The difference in this subsystem compared with wind power production subsystem is subsystem information contains data information from “MMXU”, “MMDC”, “DRCT”, “DRCS” and some Photovoltaic Panel information from “DPVA” and “DPVM”. Inverter and rectifier are also used here. It also can be seen from figure 28.

Dept. of Industrial Information and Control Systems
KTH, Royal Institute of Technology, Stockholm, Sweden
-35-
+Typ() : ENG+GrndConn() : ENG+MdulCnt() : ING+StrgCnt() : ING+SubArrCnt() : ING+ArrWRtg() : ASG
-LNNameDPVA
+CtrModSt() : INS+TrkRefV() : ASG+TrkDlWupTms() : ING+ArrModCtr() : ENC
-LNNameDPVC
+AVCrv() : INS+MdulCfgTyp() : ENG+MdulAVCrv() : CSG+MdulWRtg() : ASG+MaxMdulV() : ASG+MaxMdulA() : ASG+MdulOpnCctV() : ASG+MdulSrtCctA() : ASG
-LNNameDPVM
AC Bus Voltage
+EEName() : DPL+OpTmh() : INS+Vol() : SAV+VRtg() : ASG
-LNNameTVTR
+EEName() : DPL+OpTmh() : INS+Vol() : SAV+VRtg() : ASG
-LNNameTVTR
+EEName() : DPL+OpTmh() : INS+Vol() : SAV+VRtg() : ASG
-LNNameTVTR
+EEName() : DPL+OpTmh() : INS+Vol() : SAV+VRtg() : ASG
-LNNameTVTR
+EEName() : DPL+OpTmh() : INS+Amp() : SAV+ARtg() : ASG
-LNNameTCTR
+EEName() : DPL+OpTmh() : INS+Amp() : SAV+ARtg() : ASG
-LNNameTCTR
+TypFus() : ENS+FusA() : ASG
-LNNameXFUS
+TypFus() : ENS+FusA() : ASG
-LNNameXFUS
DC Bus Voltage
AC Output Voltage
DC Output Voltage
«subsystem»Station Level::Solar Power Production System
+EEName() : DPL+Loc() : SPS+OpCntRs() : INC+AnIn() : MV+SPCSO() : SPC+DPCSO() : DPC+ISCSO() : INC+IntIn() : INS+Ind() : SPS
-LNNameGGIO
+TotW() : MV+TotVAr() : MV+TotVA() : MV+TotPF() : MV+Hz() : MV+PPV() : DEL+PhV() : WYE+A() : WYE+W() : WYE+VAr() : WYE+VA() : WYE+PF() : WYE+Z() : WYE
-LNNameMMXU
+WRtg() : ASG+CoolTyp() : ENG+GridModSt() : ENS+Stdby() : SPS+ACTyp() : ENG+PQVLimSet() : CSG+OutWSet() : ASG+InALim() : ASG+InVLim() : ASG+HeatSinkTmp() : MV+EnclTmp() : MV+AmbAirTemp() : MV
-LNNameZINV
+CmutTyp() : ENG+IsoTyp() : ENG+VRegTyp() : ENG+ConvTyp() : ENG+CoolTyp() : ENG+ACTyp() : ENG+OutWSet() : ASG+InAlim() : ASG+OutVSet() : ASG+OutALim() : ASG+InVlim() : ASG
-LNNameZRCT
+OpCntRs() : INC+Str() : ACD+Op() : ACT+TmASt() : CSD+TmACrv() : CURVE+StrVal() : ASG
-LNNamePTOC
+OpCntRs() : INC+Str() : ACD+Op() : ACT+TmVSt() : CSD+TmVCrv() : CURVE+StrVal() : ASG
-LNNamePTOV
+OpCntRs() : INC+Str() : ACD+Op() : ACT+TmVSt() : CSD+TmVCrv() : CURVE+StrVal() : ASG
-LNNamePTUV
+Loc() : SPS+OpCntRs() : INC+SPCSO() : SPC+DPCSO() : DPC+ISCSO() : INC+Auto() : SPS+Str() : ACD+Op() : ACT
-LNNameStation Level::GAPC
+Loc() : SPC+Pos() : DPC+OpOpn() : ACT+OpCls() : ACT
-LNNameStation Level::CSWI
+EnaOpn() : SPS+EnaCls() : SPS
-LNNameStation Level::CILO
+Loc() : SPS+OpCnt() : INS+Pos() : DPC+BlkOpn() : SPC+BlkCls() : SPC+CBOpCap() : INS
-LNNameStation Level::XCBR
+Loc() : SPS+OpCnt() : INS+Pos() : DPC+BlkOpn() : SPC+BlkCls() : SPC+CBOpCap() : INS
-LNNameStation Level::XCBR
AC Output Current
DC Output Current
AC Output Fuse
DC Output Fuse
AC Output Breaker
DC Output Breaker
«interface»Subsystem Information
«interface»Subsystem Alarm
«interface»Subsystem GAPC information
Station Level Command to Subsystem
Breaker Control Command
Control Information
Feedback Information
Interlocking Information
Subsystem Information
Subsystem Alarm
Voltage value
Current value
PV Control parameter
Interface Information
CTs Signal
VTs Signal
+Watt() : MV+Amp() : MV+Vol() : MV+VolPsGnd() : MV+VolNgGnd() : MV+Ris() : MV+RisPsGnd() : MV+RisNgGnd() : MV
-LNNameMMDC
+DERNum() : ING+DERtyp() : ING+MaxWLim() : ASG+MaxVarLim() : ASG+StrDITms() : ING+StopDITms() : ING+LodRampRte() : ING
-LNNameDRCT
+AutoMan() : SPS+Loc() : SPS+ModOnConn() : SPS+ModOnAval() : SPS+ModOnUnav() : SPS+ModOffAval() : SPS+ModOffUnav() : SPS+ModStr() : SPS+ModStop() : SPS+DCPowStat() : SPS
-LNNameDRCS
+DERStr() : SPC+DERStop() : SPC+AutoManCtl() : SPC+LocRemCtl() : SPC+OpModAval() : SPC+OpModOff() : SPC+OpModOff() : SPC+DCPowStat() : SPC
-LNNameDRCC
Interface Information
Current value
Voltage value
VTs Signal
CTs Signal
Figure 28 – UML model of Solar Power Production Subsystem.
UML Model of Battery Energy Storage Subsystem The UML model of Battery Energy Storage Subsystem is shown in the figure 29. “ZBAT” and “ZBTC” are used to give battery information and battery charger information separately. “ZBCT” also obtained information and parameters from “MMDC” and “MMXU”. The temperature sensor is used to monitor the temperature of battery. However, the temperature signal cannot be read by “MMDC” directly, “STMP” is used to identify the temperature signal and transfer it to numeric value which can be identified by “MMDC”. Other function and communication are similar with wind power production subsystem.

Dept. of Industrial Information and Control Systems
KTH, Royal Institute of Technology, Stockholm, Sweden
-36-
«subsystem»Station Level::Battery Energy Storage System
DC Section Breaker
DC Bus Breaker
AC Bus Breaker
BatteryTemperature
DC Bus Current
AC Bus Current
DC Section Current
DC Section Fuse
AC Bus Fuse
DC Bus Fuse
DC Section Voltage
AC Bus Voltage
DC Bus Voltage
+EEName() : DPL+OpTmh() : INS+Amp() : SAV+ARtg() : ASG
-LNNameTCTR
+EEName() : DPL+OpTmh() : INS+Amp() : SAV+ARtg() : ASG
-LNNameTCTR
+EEName() : DPL+OpTmh() : INS+Amp() : SAV+ARtg() : ASG
-LNNameTCTR
+EEname() : DPL+Tmp() : SAV+TmpAlm() : ASG+TmpMax() : ASG
-LNNameTTEM
+EEName() : DPL+OpTmh() : INS+Vol() : SAV+VRtg() : ASG
-LNNameTVTR
+EEName() : DPL+OpTmh() : INS+Vol() : SAV+VRtg() : ASG
-LNNameTVTR
+EEName() : DPL+OpTmh() : INS+Vol() : SAV+VRtg() : ASG
-LNNameTVTR
+TypFus() : ENS+FusA() : ASG
-LNNameXFUS
+TypFus() : ENS+FusA() : ASG
-LNNameXFUS
+TypFus() : ENS+FusA() : ASG
-LNNameXFUS
+EEName() : DPL+Loc() : SPS+OpCntRs() : INC+AnIn() : MV+SPCSO() : SPC+DPCSO() : DPC+ISCSO() : INC+IntIn() : INS+Ind() : SPS
-LNNameGGIO
+EEName() : DPL+OpTmh() : INS+Vol() : MV+VolChgRte() : MV+Amp() : MV+BatHi() : SPS+BatLo() : SPS+LoBatVal() : ASG+HiBatVal() : ASG
-LNNameZBAT
+TmpST() : SPS+TmpRteSt() : SPS+MaxTmp() : ASG+MinTmp() : ASG+MaxTmpRte() : ASG+Tmp() : MV
-LNNameSTMP
+BatChaSt() : ENG+BatChaTyp() : ENG+BatChaMod() : ENG+ChaV() : MV+ChaA() : MV
-LNNameZBTC
+OpCntRs() : INC+Str() : ACD+Op() : ACT+TmVSt() : CSD+TmVCrv() : CURVE+StrVal() : ASG
-LNNamePTUV
+Loc() : SPS+OpCntRs() : INC+SPCSO() : SPC+DPCSO() : DPC+ISCSO() : INC+Auto() : SPS+Str() : ACD+Op() : ACT
-LNNameGAPC
+OpCntRs() : INC+Str() : ACD+Op() : ACT+TmASt() : CSD+TmACrv() : CURVE+StrVal() : ASG
-LNNamePTOC
+OpCntRs() : INC+Str() : ACD+Op() : ACT+TmVSt() : CSD+TmVCrv() : CURVE+StrVal() : ASG
-LNNamePTOV
+EnaOpn() : SPS+EnaCls() : SPS
-LNNameCILO
+Loc() : SPC+Pos() : DPC+OpOpn() : ACT+OpCls() : ACT
-LNNameCSWI
+Loc() : SPS+OpCnt() : INS+Pos() : DPC+BlkOpn() : SPC+BlkCls() : SPC+CBOpCap() : INS
-LNNameXCBR
+Loc() : SPS+OpCnt() : INS+Pos() : DPC+BlkOpn() : SPC+BlkCls() : SPC+CBOpCap() : INS
-LNNameXCBR
+Loc() : SPS+OpCnt() : INS+Pos() : DPC+BlkOpn() : SPC+BlkCls() : SPC+CBOpCap() : INS
-LNNameXCBR
CTs SignalVTs
SignalInformation
Battery Temperature
Signal
Battery Temperature
Charger Information
Voltage value
Current value
«interface»Subsystem Information
«interface»Subsystem Alarm
Interlocking Information
Control Order
Control Order
Control Order
Alarm Signal Feedback Information
Station Level Command to Subsystem
«interface»Subsystem GAPC information
+Watt() : MV+Amp() : MV+Vol() : MV+VolPsGnd() : MV+VolNgGnd() : MV+Ris() : MV+RisPsGnd() : MV+RisNgGnd() : MV
-LNNameMMDC
+DERNum() : ING+DERtyp() : ING+MaxWLim() : ASG+MaxVarLim() : ASG+StrDITms() : ING+StopDITms() : ING+LodRampRte() : ING
-LNNameDRCT
+AutoMan() : SPS+Loc() : SPS+ModOnConn() : SPS+ModOnAval() : SPS+ModOnUnav() : SPS+ModOffAval() : SPS+ModOffUnav() : SPS+ModStr() : SPS+ModStop() : SPS+DCPowStat() : SPS
-LNNameDRCS
+DERStr() : SPC+DERStop() : SPC+AutoManCtl() : SPC+LocRemCtl() : SPC+OpModAval() : SPC+OpModOff() : SPC+OpModOff() : SPC+DCPowStat() : SPC
-LNNameDRCC
+TotW() : MV+TotVAr() : MV+TotVA() : MV+TotPF() : MV+Hz() : MV+PPV() : DEL+PhV() : WYE+A() : WYE+W() : WYE+VAr() : WYE+VA() : WYE+PF() : WYE+Z() : WYE
-LNNameMMXU
Information
VTs Signal
CTs Signal
Voltage value
Current value
Figure 29 – UML model of Battery Energy Storage Subsystem.
UML Model of Hydrogen Energy Storage Subsystem In hydrogen energy storage subsystem, “TPRE” and “TTEM” are used to obtain the signal of pressure of stored hydro and temperature of deionized water which is used to electrolyzed. However, temperature signal and pressure signal cannot be directly used by “MMDC”. Therefore, “MPRS” is used to process pressure signal and get the numeric value. “STMP” is used for temperature value identified as “STMP” used in UML model of battery energy storage subsystem. “DHGI” and “DHGC” are used to give hydrogen electrolyzer general information and control information separately. Similarly, “DSTK” and “DFCL” are applied to give fuel cell stack information and fuel cell control information. Both “DHGC” and “DFCL” get data value and parameters from “MMXU” and “MMDC”. “Subsystem Information” composites information from “DHGI”, “DSTK”, “DHGC”,
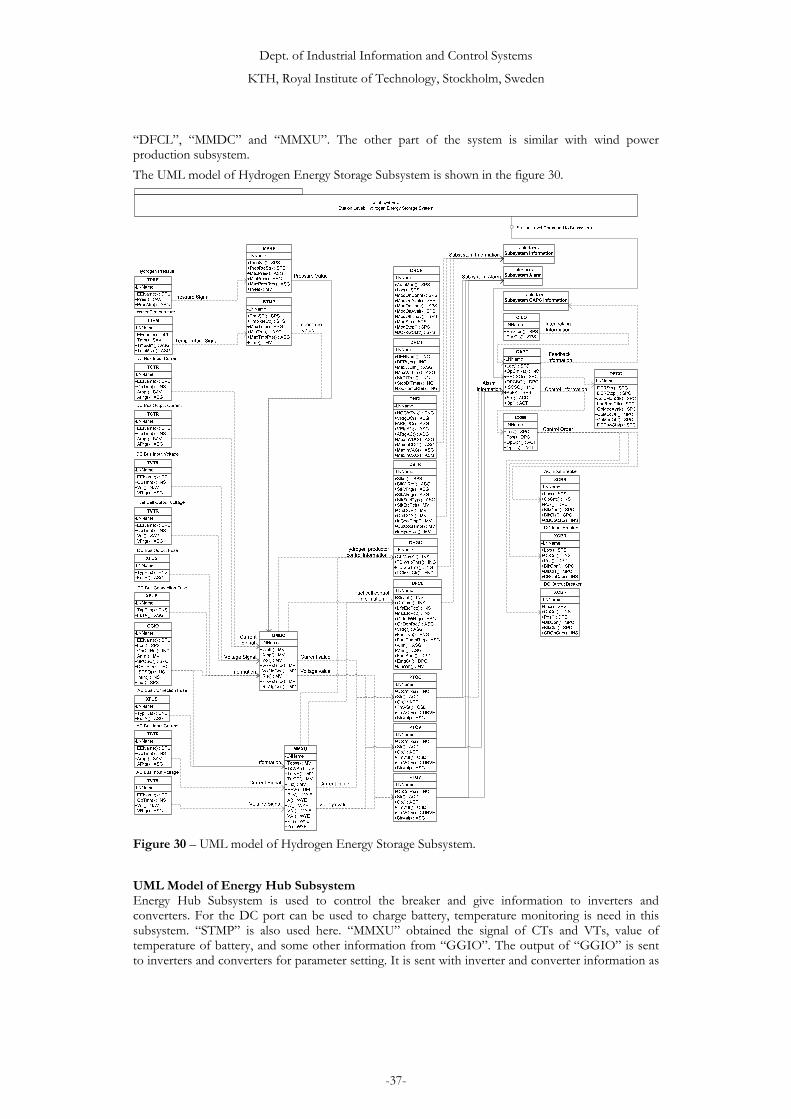
Dept. of Industrial Information and Control Systems
KTH, Royal Institute of Technology, Stockholm, Sweden
-37-
“DFCL”, “MMDC” and “MMXU”. The other part of the system is similar with wind power production subsystem. The UML model of Hydrogen Energy Storage Subsystem is shown in the figure 30.
Figure 30 – UML model of Hydrogen Energy Storage Subsystem.
UML Model of Energy Hub Subsystem Energy Hub Subsystem is used to control the breaker and give information to inverters and converters. For the DC port can be used to charge battery, temperature monitoring is need in this subsystem. “STMP” is also used here. “MMXU” obtained the signal of CTs and VTs, value of temperature of battery, and some other information from “GGIO”. The output of “GGIO” is sent to inverters and converters for parameter setting. It is sent with inverter and converter information as

Dept. of Industrial Information and Control Systems
KTH, Royal Institute of Technology, Stockholm, Sweden
-38-
subsystem information to station level system. Other part of the subsystem is similar with wind power production subsystem. The UML model of Energy Hub Subsystem is shown in the figure 31.
«subsystem»Station Level::Energy Hub
DC Section Voltage
AC Bus Voltage
AC Bus Current
DC Section Current
Battery Temperature
+EEName() : DPL+OpTmh() : INS+Vol() : SAV+VRtg() : ASG
-LNNameTVTR
+EEName() : DPL+OpTmh() : INS+Vol() : SAV+VRtg() : ASG
-LNNameTVTR
+EEName() : DPL+OpTmh() : INS+Vol() : SAV+VRtg() : ASG
-LNNameTVTR
+EEName() : DPL+OpTmh() : INS+Amp() : SAV+ARtg() : ASG
-LNNameTCTR
+EEName() : DPL+Loc() : SPS+OpCntRs() : INC+AnIn() : MV+SPCSO() : SPC+DPCSO() : DPC+ISCSO() : INC+IntIn() : INS+Ind() : SPS
-LNNameGGIO
+EEname() : DPL+Tmp() : SAV+TmpAlm() : ASG+TmpMax() : ASG
-LNNameTTEM
+TotW() : MV+TotVAr() : MV+TotVA() : MV+TotPF() : MV+Hz() : MV+PPV() : DEL+PhV() : WYE+A() : WYE+W() : WYE+VAr() : WYE+VA() : WYE+PF() : WYE+Z() : WYE
-LNNameMMXU
+TmpST() : SPS+TmpRteSt() : SPS+MaxTmp() : ASG+MinTmp() : ASG+MaxTmpRte() : ASG+Tmp() : MV
-LNNameSTMP
+BatChaSt() : ENG+BatChaTyp() : ENG+BatChaMod() : ENG+ChaV() : MV+ChaA() : MV
-LNNameZBTC
+WRtg() : ASG+CoolTyp() : ENG+GridModSt() : ENS+Stdby() : SPS+ACTyp() : ENG+PQVLimSet() : CSG+OutWSet() : ASG+InALim() : ASG+InVLim() : ASG+HeatSinkTmp() : MV+EnclTmp() : MV+AmbAirTemp() : MV
-LNNameZINV
+OpCntRs() : INC+Str() : ACD+Op() : ACT+TmVSt() : CSD+TmVCrv() : CURVE+StrVal() : ASG
-LNNamePTUV
+OpCntRs() : INC+Str() : ACD+Op() : ACT+TmVSt() : CSD+TmVCrv() : CURVE+StrVal() : ASG
-LNNamePTOV
+OpCntRs() : INC+Str() : ACD+Op() : ACT+TmASt() : CSD+TmACrv() : CURVE+StrVal() : ASG
-LNNamePTOC
+EnaOpn() : SPS+EnaCls() : SPS
-LNNameCILO
+Loc() : SPS+OpCntRs() : INC+SPCSO() : SPC+DPCSO() : DPC+ISCSO() : INC+Auto() : SPS+Str() : ACD+Op() : ACT
-LNNameGAPC
+Loc() : SPC+Pos() : DPC+OpOpn() : ACT+OpCls() : ACT
-LNNameCSWI
+Loc() : SPS+OpCnt() : INS+Pos() : DPC+BlkOpn() : SPC+BlkCls() : SPC+CBOpCap() : INS
-LNNameXCBR
«interface»Subsystem Information
«interface»Subsystem Alarm
CT Signal
VTs Signal
Information
Station Level Command to Subsystem
«interface»Subsystem GAPC information
Interlocking Information
Feedback Information
Control Signal
Control Information
Subsystem Information
Subsystem Alarm
Voltage value
Current value
Inverter Information
Charger Information
Temperature Signal
Temperature Value
Alarm Signal
+Watt() : MV+Amp() : MV+Vol() : MV+VolPsGnd() : MV+VolNgGnd() : MV+Ris() : MV+RisPsGnd() : MV+RisNgGnd() : MV
-LNNameMMDC
+DERNum() : ING+DERtyp() : ING+MaxWLim() : ASG+MaxVarLim() : ASG+StrDITms() : ING+StopDITms() : ING+LodRampRte() : ING
-LNNameDRCT
+AutoMan() : SPS+Loc() : SPS+ModOnConn() : SPS+ModOnAval() : SPS+ModOnUnav() : SPS+ModOffAval() : SPS+ModOffUnav() : SPS+ModStr() : SPS+ModStop() : SPS+DCPowStat() : SPS
-LNNameDRCS
+DERStr() : SPC+DERStop() : SPC+AutoManCtl() : SPC+LocRemCtl() : SPC+OpModAval() : SPC+OpModOff() : SPC+OpModOff() : SPC+DCPowStat() : SPC
-LNNameDRCC
VTs Signal
CT Signal
Voltage value
Current value
Figure 31 – UML model of Energy Hub Subsystem.
UML Model of Grid Connection Subsystem The UML model of Grid connection subsystem is shown in figure 32. “TTEM” and “STMP” are used to obtain the temperature of isolation transformer. The other part of the subsystem is similar with the wind power.

Dept. of Industrial Information and Control Systems
KTH, Royal Institute of Technology, Stockholm, Sweden
-39-
«subsystem»Station Level::Grid Connection
+EEName() : DPL+OpTmh() : INS+Amp() : SAV+ARtg() : ASG
-LNNameTCTR
+EEName() : DPL+OpTmh() : INS+Amp() : SAV+ARtg() : ASG
-LNNameTCTR
+EEName() : DPL+OpTmh() : INS+Vol() : SAV+VRtg() : ASG
-LNNameTVTR
+EEName() : DPL+OpTmh() : INS+Vol() : SAV+VRtg() : ASG
-LNNameTVTR
+TypFus() : ENS+FusA() : ASG
-LNNameXFUS
+EEName() : DPL+Loc() : SPS+OpCntRs() : INC+AnIn() : MV+SPCSO() : SPC+DPCSO() : DPC+ISCSO() : INC+IntIn() : INS+Ind() : SPS
-LNNameGGIO
+EEname() : DPL+Tmp() : SAV+TmpAlm() : ASG+TmpMax() : ASG
-LNNameTTEM
+TotW() : MV+TotVAr() : MV+TotVA() : MV+TotPF() : MV+Hz() : MV+PPV() : DEL+PhV() : WYE+A() : WYE+W() : WYE+VAr() : WYE+VA() : WYE+PF() : WYE+Z() : WYE
-LNNameMMXU
+TmpST() : SPS+TmpRteSt() : SPS+MaxTmp() : ASG+MinTmp() : ASG+MaxTmpRte() : ASG+Tmp() : MV
-LNNameSTMP
Grid Current
AC Bus Current
Grid Voltage
AC Bus Voltage
Isolation Transformer Temperature
+OpCntRs() : INC+Str() : ACD+Op() : ACT+TmASt() : CSD+TmACrv() : CURVE+StrVal() : ASG
-LNNamePTOC
+OpCntRs() : INC+Str() : ACD+Op() : ACT+TmVSt() : CSD+TmVCrv() : CURVE+StrVal() : ASG
-LNNamePTOV
+OpCntRs() : INC+Str() : ACD+Op() : ACT+TmVSt() : CSD+TmVCrv() : CURVE+StrVal() : ASG
-LNNamePTUV
+EnaOpn() : SPS+EnaCls() : SPS
-LNNameCILO
+Loc() : SPS+OpCntRs() : INC+SPCSO() : SPC+DPCSO() : DPC+ISCSO() : INC+Auto() : SPS+Str() : ACD+Op() : ACT
-LNNameGAPC
+Loc() : SPC+Pos() : DPC+OpOpn() : ACT+OpCls() : ACT
-LNNameCSWI
+Loc() : SPS+OpCnt() : INS+Pos() : DPC+BlkOpn() : SPC+BlkCls() : SPC+CBOpCap() : INS
-LNNameXCBR
«interface»Subsystem Information
«interface»Subsystem Alarm
«interface»Subsystem GAPC information
Station Level Command to Subsystem
Current Signal
Voltage Signal
Information
Current value
Voltage value
Subsystem Alarm
Subsystem Information
Interlocking Information
Control Information
Feedback Information
Control Order
Alarm Signal
+DERNum() : ING+DERtyp() : ING+MaxWLim() : ASG+MaxVarLim() : ASG+StrDITms() : ING+StopDITms() : ING+LodRampRte() : ING
-LNNameDRCT
+AutoMan() : SPS+Loc() : SPS+ModOnConn() : SPS+ModOnAval() : SPS+ModOnUnav() : SPS+ModOffAval() : SPS+ModOffUnav() : SPS+ModStr() : SPS+ModStop() : SPS+DCPowStat() : SPS
-LNNameDRCS
+DERStr() : SPC+DERStop() : SPC+AutoManCtl() : SPC+LocRemCtl() : SPC+OpModAval() : SPC+OpModOff() : SPC+OpModOff() : SPC+DCPowStat() : SPC
-LNNameDRCC
Figure 32 – UML model of Grid Connection Subsystem.
UML Model of “Other part” Subsystem The “Other part” Subsystem is simple and communication of functions and interface is similar with the subsystems which are described above. The UML model of “Other part” Subsystem is shown in figure 33.

Dept. of Industrial Information and Control Systems
KTH, Royal Institute of Technology, Stockholm, Sweden
-40-
Figure 33 – UML model of “Other Part” Subsystem.
4.3 Conclusion of Design part
It can be found that ICT architecture design for each part has the same top level function. Therefore, the system is easy to be expanded with some new renewable energy production or energy storage parts. The procedure of expansion can be described as 3 steps: Adding a new bay for each new renewable energy production system or each energy storage system Design the corresponding ICT architecture for them Upgrading some functions of top level Then the system can be used again. For the information are following IEC61850 standard, the system can be interoperation or integrated into any system following IEC61850 standard.

Dept. of Industrial Information and Control Systems
KTH, Royal Institute of Technology, Stockholm, Sweden
-41-
5 IMPLEMENTATION OF CONTROL SYSTEM OF SMART ENERGY CONTAINER
In this section, implementation of control system of smart energy container is illustrated in detail. Author uses LabVIEW as the programming software to implement the design, described in section 4, to the executable program (Control And Monitoring System). Data acquisition of the system, basic functions implementation, automatic control, and possible of optimization control are introduced in the following separate parts. The built program is used for control and monitoring of smart energy container. Therefore the program is called as C&MS in short.
5.1 Data Acquisition and Command Output of the System
The data acquisition and command output of the system is composited by sensors (voltage transformers, current transformers, and temperature sensors), data sampling modules, data acquisition devices, and industrial computer as shown in the figure 34.
Figure 34 – Data acquisition and command output of the smart energy container system. Each CM box is connected with digital input module, digital output module, and analog input modules. In the study case, one digital input module, one digital output module, two analog input modules are used to obtain the data and status from the system. Digital input is used to obtain the status of the breakers in the CM boxes. Digital output is applied to control the breakers in the CM boxes. Two analog input modules are applied to get the voltage and current value separately. In order to separate different signal from each other, different channels are used for data acquisition. In other words, to each input variable or output variable, its address is specific. The following tables give the address information of each variable from CM box system. Table 4 gives digital input address. Table 5 gives digital output address. Table 6 describes voltage analog input address and table 7 illustrates the current analog input address.

Dept. of Industrial Information and Control Systems
KTH, Royal Institute of Technology, Stockholm, Sweden
-42-
Table 4 – Digital input address and corresponding CM box number.
CM box Number Address Description
CM 1 cDAQ1Mod3/Port0/line0 Incoming TransformerCM 2 cDAQ1Mod3/Port0/line2 Green Power LoadCM 3 cDAQ1Mod3/Port0/line15 Energy Hub DC portCM 4 cDAQ1Mod3/Port0/line4 Charger AC inputCM 5 cDAQ1Mod3/Port0/line6 Hydrogen Electrolyzer AC input CM 6 cDAQ1Mod3/Port0/line8 Wind Power AC outputCM 7 cDAQ1Mod3/Port0/line10 Solar Power AC outputCM 8 cDAQ1Mod3/Port0/line12 Local PowerCM 9 cDAQ1Mod3/Port0/line13 Connection of DC-Bus and DC-Section CM 10 cDAQ1Mod3/Port0/line3 Battery outputCM 11 cDAQ1Mod3/Port0/line5 Charger DC inputCM 12 cDAQ1Mod3/Port0/line1 Fuelcell outputCM 13 cDAQ1Mod3/Port0/line7 Hydrogen Electrolyzer DC input CM 14 cDAQ1Mod3/Port0/line9 Wind Power DC outputCM 15 cDAQ1Mod3/Port0/line11 Solar Power AC output
Table 5 – Digital output address and corresponding CM box number.
CM box Number Address Description
CM 1 cDAQ1Mod4/Port0/line0 Incoming TransformerCM 2 cDAQ1Mod4/Port0/line2 Green Power LoadCM 3 cDAQ1Mod4/Port0/line15 Energy Hub DC portCM 4 cDAQ1Mod4/Port0/line4 Charger AC inputCM 5 cDAQ1Mod4/Port0/line6 Hydrogen Electrolyzer AC input CM 6 cDAQ1Mod4/Port0/line8 Wind Power AC outputCM 7 cDAQ1Mod4/Port0/line10 Solar Power AC outputCM 8 cDAQ1Mod4/Port0/line12 Local PowerCM 9 cDAQ1Mod4/Port0/line13 Connection of DC-Bus and DC-Section CM 10 cDAQ1Mod4/Port0/line3 Battery outputCM 11 cDAQ1Mod4/Port0/line5 Charger DC inputCM 12 cDAQ1Mod4/Port0/line1 Fuelcell outputCM 13 cDAQ1Mod4/Port0/line7 Hydrogen Electrolyzer DC input CM 14 cDAQ1Mod4/Port0/line9 Wind Power DC outputCM 15 cDAQ1Mod4/Port0/line11 Solar Power AC output
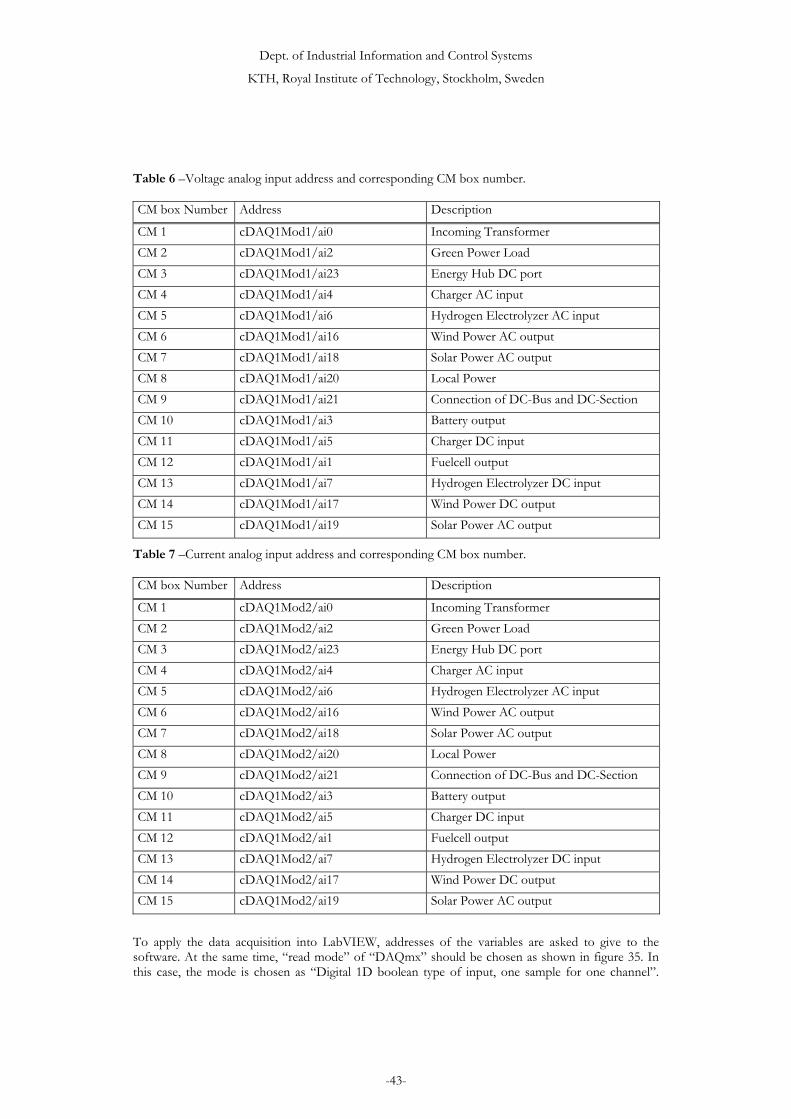
Dept. of Industrial Information and Control Systems
KTH, Royal Institute of Technology, Stockholm, Sweden
-43-
Table 6 –Voltage analog input address and corresponding CM box number.
CM box Number Address Description
CM 1 cDAQ1Mod1/ai0 Incoming TransformerCM 2 cDAQ1Mod1/ai2 Green Power LoadCM 3 cDAQ1Mod1/ai23 Energy Hub DC portCM 4 cDAQ1Mod1/ai4 Charger AC inputCM 5 cDAQ1Mod1/ai6 Hydrogen Electrolyzer AC input CM 6 cDAQ1Mod1/ai16 Wind Power AC outputCM 7 cDAQ1Mod1/ai18 Solar Power AC outputCM 8 cDAQ1Mod1/ai20 Local PowerCM 9 cDAQ1Mod1/ai21 Connection of DC-Bus and DC-Section CM 10 cDAQ1Mod1/ai3 Battery outputCM 11 cDAQ1Mod1/ai5 Charger DC inputCM 12 cDAQ1Mod1/ai1 Fuelcell outputCM 13 cDAQ1Mod1/ai7 Hydrogen Electrolyzer DC input CM 14 cDAQ1Mod1/ai17 Wind Power DC outputCM 15 cDAQ1Mod1/ai19 Solar Power AC output
Table 7 –Current analog input address and corresponding CM box number.
CM box Number Address Description
CM 1 cDAQ1Mod2/ai0 Incoming TransformerCM 2 cDAQ1Mod2/ai2 Green Power LoadCM 3 cDAQ1Mod2/ai23 Energy Hub DC portCM 4 cDAQ1Mod2/ai4 Charger AC inputCM 5 cDAQ1Mod2/ai6 Hydrogen Electrolyzer AC input CM 6 cDAQ1Mod2/ai16 Wind Power AC outputCM 7 cDAQ1Mod2/ai18 Solar Power AC outputCM 8 cDAQ1Mod2/ai20 Local PowerCM 9 cDAQ1Mod2/ai21 Connection of DC-Bus and DC-Section CM 10 cDAQ1Mod2/ai3 Battery outputCM 11 cDAQ1Mod2/ai5 Charger DC inputCM 12 cDAQ1Mod2/ai1 Fuelcell outputCM 13 cDAQ1Mod2/ai7 Hydrogen Electrolyzer DC input CM 14 cDAQ1Mod2/ai17 Wind Power DC outputCM 15 cDAQ1Mod2/ai19 Solar Power AC output
To apply the data acquisition into LabVIEW, addresses of the variables are asked to give to the software. At the same time, “read mode” of “DAQmx” should be chosen as shown in figure 35. In this case, the mode is chosen as “Digital 1D boolean type of input, one sample for one channel”.

Dept. of Industrial Information and Control Systems
KTH, Royal Institute of Technology, Stockholm, Sweden
-44-
Then the input of the digital signal is read as array into the C&MS. Then just applying “index array” function given by LabVIEW, the status of breaker of each CM box can be obtained.
Figure 35 – Block diagram of data acquisition of digital input. In order to control the breakers, digital output is used as shown in figure 36. The address should be set as the command object. The output mode is set as “Digital 1D Boolean, one sample for one channel”. For the digital output module has totally 32 channels, the reserved 17 channels are set to be constant “0” as output. The output data is used as array. Therefore, “build array” block is used to combine each breaker command to an array signal.
Figure 36 – Block diagram of data handling of command output. Different from digital input, analog input should include other configuration of the devices such as sampling ratio, sampling points, maximum input value, minimum input value, input terminal configuration, sample mode and variable unit. To this case, the input voltage value is set between -5V to 5V. According to signal processing principle, sampling rate should be set more than twice of object frequency. The higher sample ratio is the more accuracy the result gives. However, too high sample ratio also brings the problem such as take much resource of processor and waste of space of computer. To be balanced, sample mode is set as finite mode and sampling rate is set to 8000 times per second. The number of sample point is set as 200 per channel which ensure at least one period of fundamental frequency (50Hz) can be rebuilt from obtained point. For the connection of physic devices is using differential connection, input terminal configuration is set as differential. After such setting, analog signal can be read by C&MS. The voltage signal input block diagram is given in figure 37 and current signal input block diagram is same as voltage one.
Figure 37 – Block diagram of voltage signal input.

Dept. of Industrial Information and Control Systems
KTH, Royal Institute of Technology, Stockholm, Sweden
-45-
5.2 Basic Functions Applied with Manual Control
Human Machine Interface (IHMI) Generally, human-machine interface (HMI) is built to make operation of a machine or system easy, efficient, and enjoyable. It also means that the operator should give minimal input to the machine or system and achieve the desired outputs, and the system or machine should decrease the undesired outputs as much as possible to the human. The design of HMI also involves disciplines as ergonomics and psychology which won’t be discussed here. This part is focus on the design of the HMI in this case and how it is built by LabVIEW program. The HMI used in this case is designed by author and shown in the figure 38. In the right top of the panel real time is given which contains two functions. One is to give the time to the user. The other is to show the program is running or not which can help user to check the program is dead or not. The button under the time displayer shows “Weather Information”. When user clicks this button, a new window will pop out and give the weather information of outside of the smart energy container which will be illustrated in “Additional Functions” part. On the right of the time displayer there are three big buttons and one switch. The square button is used to “logout” from this panel to the “login” panel which is illustrated in “Additional Functions” part also. The button with white light is “Advanced Functions” button. After pressing it, new buttons will appears in the panel which are used to setting parameters of different subsystems. The switch “Manual/Auto” is used to switch the control mode between automatic control to manual control. The button with green light is “Remote Control” button. When it is turned on, the whole system is controlled remotely. Otherwise, it is controlled locally. Two status lights below the “Remote Control” button is used to show alarm signals of interlocking error and communication error when errors occur. There are 15 virtual CM boxes built in the panel. Each of them contains three lights, two numeric displayer, one button, and label. Two square lights are used to give the breaker position of CM box. Green light means breaker is connected. Red one means breaker is open. The other round light is alarm/warning signal light. When there is alarm or warning in corresponding CM box the light will be turned to yellow or red. Yellow means warning and red means alarm. When it is normal, the light is green. Two numeric displayers give voltage and current value separately. The label is used to give the information of where the CM box is located. Button allows user of the panel to control the corresponding breaker of the CM box. For wind power production, solar power production, local power, battery charger, fuel cell, hydrogen electrolyzer and energy hub, they have corresponding lights to show the status of the devices. To isolation transformer, the frequency and voltage in the secondary side is shown in the figure. The green power load is electrical car charger, STRI server, and emergency lighting. The power consumed by load is shown both in numeric and meter. This panel also gives information of battery and hydrogen storage. Progress bars is used to show the remained capacity of the battery and voltage of the battery. The numeric display is also used to shown the remained capacity of the battery. Hydrogen storage is shown by the tank and numeric way at the same time.

Dept. of Industrial Information and Control Systems
KTH, Royal Institute of Technology, Stockholm, Sweden
-46-
Figure 38 – Human machine interface of the C&MS.
Measuring function (MMXU) In Part 5.1, data acquisition is discussed. However, the output of data acquisition is still signal or waveform of voltage and current. Moreover, CTs and VTs transfer the signal of current and voltage to low voltage signal (around 5± V). In order to indentify the real peak value or rms value of the real-time current and voltage, signal processing block is added to obtain the peak value (low voltage signal) of the input waveform, range factor is used to multiply with the identified peak value (low voltage signal) and finally get the real peak value. The peak value signal is sent to the “RMS value identifier” block to obtain the rms-value of the voltage and current. The procedure is shown in the figure 39.
Figure 39 – Block diagram of the MMXU function. Generally, CTs and VTs are realized as transformer. According to the principle of transformer, the turn-ratio proportion with voltage of primary side and secondary side is also valid in this case. In an ideal transformer, the induced voltage in the secondary winding ( sV ) is in proportion to the primary
voltage ( pV ), and is given by the ratio of the number of turns in the secondary ( sN ) to the number
of turns in the primary ( pN ) as follows:
s s
p p
V NV N
=
By the same way, turn to CTs and VTs the relationship of real value ( RV ) and measured value ( MV )
has such equation with range factor ( MR ):

Dept. of Industrial Information and Control Systems
KTH, Royal Institute of Technology, Stockholm, Sweden
-47-
RM R M M
M
V R V V RV
= ⇒ = ⋅
However, the range factor is different for different CM box and even different for VT and CT in each CM box. Table 8 gives the range factors for CTs and VTs of CM boxes.
Table 8 –Range factor of CT and VT with their corresponding CM box number.
CM Box Number Current Range Factor Voltage Range Factor
CM 1 10.627 199.80CM 2 5.336 199.60CM 3 21.277 100.76CM 4 5.330 199.67CM 5 5.313 199.27CM 6 5.316 199.70CM 7 12.870 199.50CM 8 10.684 199.21CM 9 5.858 101.47CM 10 21.277 103.52CM 11 5.342 100.40CM 12 21.186 100.39CM 13 10.638 100.44CM 14 5.345 101.47CM 15 10.604 101.21
Protection Functions (PTUV, PTOC, PTOV) Protection functions are used to create alarm of the system through comparison of real value to set value. The object of protection functions is to avoid damage of the device and ensure the safety of running of the system. The idea of protection functions such as PTUV and PTOV can be illustrated by the figure 40.
Figure 40 – Example of PTUV and PTOV status with real voltage value.

Dept. of Industrial Information and Control Systems
KTH, Royal Institute of Technology, Stockholm, Sweden
-48-
In figure 40, green line gives the real time value of the voltage level. Red dot-lines are for “PTOV”-overvoltage protection and blue dot-lines are for “PTUV” - undervoltage protection. According to relationship between real-time voltage ( realV ) value with “PTOV” limited level ( _ limOVV ), “PTOV”
warning level ( _OV warV ), “PTUV” limited level ( _ limUVV ), and “PTUV” warning level ( _UV warV ), the time zone is divided into 16 zones. The principle of alarm, warning signal exciting is as following:
When _ lim _OV real OV warV V V> > , overvoltage warning is excited.
When _ limreal OVV V> , overvoltage alarm is excited.
When _ _ limUV war real UVV V V> > , undervoltage warning is excited.
When _ limUV realV V> , undervoltage alarm is excited.
The judgment results table is shown as following.
Table 9 –PTOV and PTUV status according to figure 40.
Time Period PTOV status PTUV status
0-t1 normal alarmt1-t2 normal warningt2-t3 normal normalt3-t4 warning normalt4-t5 alarm normalt5-t6 warning normalt6-t7 normal normalt7-t8 normal warningt8-t9 normal alarmt9-t10 normal warningt10-t11 normal normalt11-t12 warning normalt12-13 alarm normalt13-t14 warning normalt14-t15 normal normalt15-t16 normal warning
In LabVIEW program, PTOV function, PTUV function, and PTOC function are programmed by two comparison blocks which give warning signal and alarm signal. The input of the PTOV, PTUV, and PTOC functions are real value of voltage or current and setting parameter of warning level and limitation level as shown in the figure 41.
(a) PTOV function

Dept. of Industrial Information and Control Systems
KTH, Royal Institute of Technology, Stockholm, Sweden
-49-
(b) PTOC function
(a) PTUV function
Figure 41 – Block diagram of protection functions.
Interlocking Functions (CILO) Interlocking functions can be realized by mechanical method or logical method. In this case logical-based interlocking function is used to ensure safety running of the system. For example, charger of battery can use either DC or AC power as input power. However DC and AC cannot be connected to the input of charger at the same time. To avoid such situation occurs, interlocking function is applied to breakers of DC and AC input of charger. Similarly, input of hydrogen electronlyzer, output of wind power and output of solar power also need interlocking function. In program implementation of this case, two kinds of interlocking function are built to meet different control requirement. To manual control, the interlocking function is built as figure 42.
Figure 42 – Block diagram of interlocking function used for manual control. This interlocking function is based on two breakers case. When one breaker is asked to turn on, then interlocking function will check the command of the other breaker. If that command of that breaker is off, then this breaker can be turned on. If that breaker’s command is on, then interlocking function is activated. A dialog window will pop out and ask user to choose one of these two breakers to connect or turn off both breaker. Therefore, the situation that two breakers are turn on at same time is avoid. The other kind of interlocking function realized in this case is used when the system is running at remote control mode. The interlocking function is applied into the remote control interface as shown in figure 43.
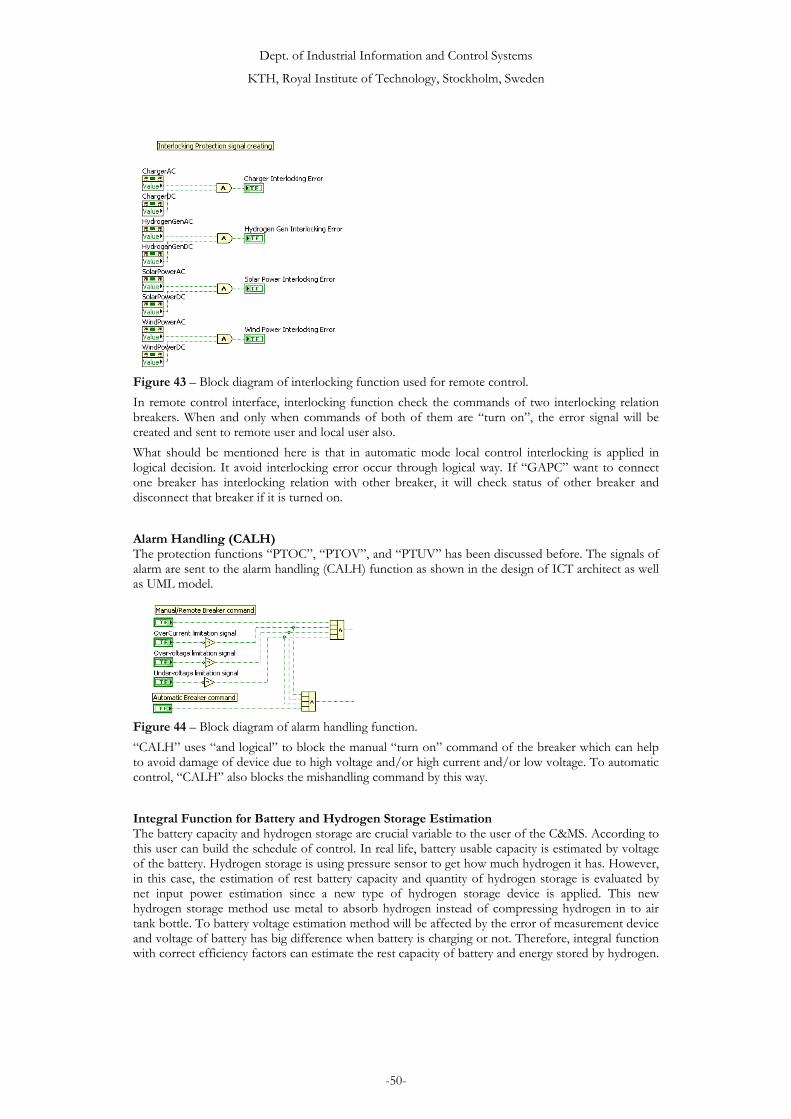
Dept. of Industrial Information and Control Systems
KTH, Royal Institute of Technology, Stockholm, Sweden
-50-
Figure 43 – Block diagram of interlocking function used for remote control. In remote control interface, interlocking function check the commands of two interlocking relation breakers. When and only when commands of both of them are “turn on”, the error signal will be created and sent to remote user and local user also. What should be mentioned here is that in automatic mode local control interlocking is applied in logical decision. It avoid interlocking error occur through logical way. If “GAPC” want to connect one breaker has interlocking relation with other breaker, it will check status of other breaker and disconnect that breaker if it is turned on.
Alarm Handling (CALH) The protection functions “PTOC”, “PTOV”, and “PTUV” has been discussed before. The signals of alarm are sent to the alarm handling (CALH) function as shown in the design of ICT architect as well as UML model.
Figure 44 – Block diagram of alarm handling function. “CALH” uses “and logical” to block the manual “turn on” command of the breaker which can help to avoid damage of device due to high voltage and/or high current and/or low voltage. To automatic control, “CALH” also blocks the mishandling command by this way.
Integral Function for Battery and Hydrogen Storage Estimation The battery capacity and hydrogen storage are crucial variable to the user of the C&MS. According to this user can build the schedule of control. In real life, battery usable capacity is estimated by voltage of the battery. Hydrogen storage is using pressure sensor to get how much hydrogen it has. However, in this case, the estimation of rest battery capacity and quantity of hydrogen storage is evaluated by net input power estimation since a new type of hydrogen storage device is applied. This new hydrogen storage method use metal to absorb hydrogen instead of compressing hydrogen in to air tank bottle. To battery voltage estimation method will be affected by the error of measurement device and voltage of battery has big difference when battery is charging or not. Therefore, integral function with correct efficiency factors can estimate the rest capacity of battery and energy stored by hydrogen.

Dept. of Industrial Information and Control Systems
KTH, Royal Institute of Technology, Stockholm, Sweden
-51-
However, there is no real time integral function given by LabVIEW library. Therefore, the integral function shown in figure 45 is built by author.
Figure 45 – Block diagram of real time integral function. The integral function can be built as a block and be used as figure 46.
Figure 46 – Block diagram of real hydrogen storage estimation.

Dept. of Industrial Information and Control Systems
KTH, Royal Institute of Technology, Stockholm, Sweden
-52-
The estimation of hydrogen storage is realized by using net input power as time function and calculating the integral of net input power. For example, assume AC input power as ( )ACP t (kW),
DC input power as ( )DCP t (kW), Fuel cell consumed power ( )FCP t (kW), hydrogen electronlyzer
efficiency as hydgenK (L/kW), fuel cell efficiency as FCK (L/kW) and constant constantC (kW).
Therefore, the storage of hydrogen ( )S t (L) can be calculated as.
( )constant0
( ) (0) ( ( ) ( )) ( )t
DC AC hydgen FC FCS t S P t P t K P t K C dt= + + − −∫
where (0)S (L) is initial (reset) value of stored hydrogen quantity.
Similarly battery energy storage subsystem also uses such method to estimate the rest capacity.
Manual Control of C&MS Manual Control of C&MS has three main objects as following:
1. Breakers of the system can be controlled the by user through click buttons in the HMI. 2. Interlocking function should be activated when it is necessary. 3. Protection function should be activated when necessary.
Integration of interlocking function for solar power production output and wind power production output are shown in figure 47. The CILO function is built as a block. According to the requirement, input the command of breakers and relevant text string then the output can be connected to the GPAC function as shown in figure 48. Alarm handling function is put inside of the “GPAC” block. GPAC function sends control command to the breaker controller “CSWI” block to control the breaker.
Figure 47 – Interlocking functions applied for solar power and wind power in C&MS.
Figure 48 – Block diagram relationship of protection function, GPAC function and CSWI function.

Dept. of Industrial Information and Control Systems
KTH, Royal Institute of Technology, Stockholm, Sweden
-53-
Remote Monitoring/Telemonitoring and Remote Control/Telecontrol (ITCI, ITMI) The idea of remote monitoring and remote control is shown in the following figure.
Figure 49 – Idea of remote monitoring and remote control of C&MS. A data base built to store system information and remote control information. Using of Data Base can increase the security of the system and give a flexible remote control foundation. Remote Control interface is applied here as a translator to transfer the remote control information into the command which can be known by C&MS. However, the remote control information should follow the standard form. The system information storage will be introduced in later part. Interlocking function used in remote control is different from interlocking function used in manual control. Interlocking alarm signal is used here instead of dialog with user since time consumption of communication between remote user and C&MS cannot be neglected. Therefore, when interlocking error occurs in the command from remote control, “remote control interface” block will automatic disable the remote control and enable the manual control and give the alarm signal in the HMI panel as shown in figure 50.
Figure 50 – Block diagram of interlocking function in remote control interface. When interlocking error occurs, relevant information will also be sent to data base which can be read by the remote control user or monitor. Communication problem is also considered in this part. When network interruption occurs, the timer will be activated to compare with the setting parameter. If interruption occurs for a long time, timeout

Dept. of Industrial Information and Control Systems
KTH, Royal Institute of Technology, Stockholm, Sweden
-54-
signal will be given to the system to set the communication error flag. The system will automatic switch back to the local manual control mode. The time counter is shown in the figure 51.
Figure 51 – Block diagram of time counter in remote control interface.
5.3 Automation Control Design
Author has developed two versions of automation control function (GAPC). First version is contribution automation control which means all subsystems are controlled by one GAPC. Second version is subsystem based GAPC (or distributed automatic control) which means each subsystem has its own GAPC and these subsystem GAPC communicate with system GAPC as shown in figure 26. Both of them will be introduced in this part.
Contributed Automatic Control Design The object of automatic control design is using as much renewable energy as possible. The battery is used as buffer. Therefore, in control schema, wind power, solar power and output of fuel cell will be used to charge battery. At same time energy can be used from battery to load. Wind power and solar power will be used to cover the load first. When it is not enough to cover all loads, battery will be used to output more energy to cover the rest loads. Whether use fuel cell or not depend on electricity price from grid since fuel cell energy storage efficiency is quite low at around 50%. When the electricity price is higher than the set value of the fuel cell, the fuel cell will be used. Therefore, the grid power will be used when one of the following situations occurs:
1. Battery is empty 2. Maximum inverter output power is reached
When the load is smaller than production, the rest power from wind power and solar power will be used to charge the battery first. If the battery is full, the rest power will be used to produce hydrogen by hydrogen electronlyzer. If there is still more power output, rest power will be sold to grid. According to the schema described above, the flow chart of the automatic control is drawn and shown in figure 52.

Dept. of Industrial Information and Control Systems
KTH, Royal Institute of Technology, Stockholm, Sweden
-55-
Figure 52 – Flow chart of automatic control decision. The interlocking function is realized by the flow chart. For instance, when it wants to use battery DC input as charger source, it will check the status of AC input breaker. If AC input breaker is “ON”, it will turn off the breaker and check again. If AC input breaker is “OFF”, it is possible to turn on the DC input breaker. By this way, interlocking function is combined with decision making. The protection function is similar with manual control. When there is alarm for the CM box, the “turn on” command will be blocked by the system automatically. To implement automatic control into C&MS, first thing is to send information of the system to the “GAPC” block as shown in figure 53.

Dept. of Industrial Information and Control Systems
KTH, Royal Institute of Technology, Stockholm, Sweden
-56-
Figure 53 – Block diagram input and output of “GAPC” function. The input information includes voltage values, current values of each CTs and VTs, Status of each breaker in the system, Energy Hub set parameter, battery reserved capacity, reserved hydrogen storage. The output of the “GAPC” is the control command information which will be sent to “CSWI” function. The block diagram of “GAPC” is mainly divided into two parts as shown in figure 54. Left part is used to deal with input information of “GAPC” and build output control command as array type of data. Right part is using case structure to apply the flow chart into program.

Dept. of Industrial Information and Control Systems
KTH, Royal Institute of Technology, Stockholm, Sweden
-57-
Figure 54 – Block diagram of “GAPC” function. Therefore the “GAPC” function is build up by LabVIEW and can be used in C&MS.
Distributed Automatic Control Design Distributed automatic control means the control of system is not contributed in one “GAPC” process controller. Subsystem “GAPC” is applied in each part of system which is divided as bays of the system. The station level “GAPC” communicates with bay level “GAPC” functions. The flow chart of Station level “GAPC” is shown in following figure 55 -58.
Start
Is Battery Empty?
Is Battery Full?No
Yes Yes
No
1 2 3
Figure 55 – Flow chart of Distributed automatic control top level. In station level “GAPC”, according to the status of battery storage system, there are three situations such as “Battery Empty”, “Battery Full”, and “Battery is neither empty nor full”. The decision processes of each situation are shown in figure 56 for battery empty part, figure 57 for battery full part, and figure 58 for battery is neither empty nor full part. When battery is empty as shown in figure 56, system will try to charge the battery. DC charge will be used first if possible. If DC bus does not have good electrical condition to charge the battery AC charger will be used when AC input electrical condition is well. When DC charger is applied, Wind power production system and Solar power production system will be asked using DC as output type. Fuel Cell is also used when battery is empty. Before using fuel cell, reservation of hydrogen will be checked first. If DC bus hasn’t good electrical condition to charge the battery, Fuel cell will be turn off. Wind power production system and Solar power production system will be turn to AC power output mode. If AC charger does not work also, wind power and solar power will use AC as output type to supply to load through AC bus and energy hub.

Dept. of Industrial Information and Control Systems
KTH, Royal Institute of Technology, Stockholm, Sweden
-58-
Figure 56 – Flow chart when battery is empty situation. When battery is full as shown in figure 57, rest power will be used to electrolyze hydrogen when hydrogen storage is not full. If hydrogen storage is full, the power rest power will sent to AC bus to be used sell to grid or to load.

Dept. of Industrial Information and Control Systems
KTH, Royal Institute of Technology, Stockholm, Sweden
-59-
Figure 57 – Flow chart when battery is full situation. When the battery is neither full nor empty as shown in figure 58, the power produced by wind turbine or photovoltaic panel will be used charge battery and battery will afford the load through energy output from battery to energy hub to load. For economic reason, fuel cell only will be used when battery is empty.

Dept. of Industrial Information and Control Systems
KTH, Royal Institute of Technology, Stockholm, Sweden
-60-
Battery is neither Empty
nor Full
Battery Output
Available?
Turn off the Fuel Cell Output
DC Charger
Available?
Turn Off the Battery Output
No
Turn On the Battery Output
Yes
Solar and/or Wind Power DC output available?
Yes
Solar Power DC
Output available?
Wind Power DC
Output available? Is AC
charger Off?
Yes
Turn Off the AC charger
No
Turn On the DC charger
Yes
Is Solar AC Output
Off?
Yes
Turn on the Solar DC Output
Yes
Turn Off the Solar AC Output
No
Solar Power AC
Output Available?
No
Is Solar DC Output
Off?
Yes
Turn On the Solar AC Output
Yes
Turn Off the Solar DC Output
No
Is Wind AC Output
Off?
YesWind Power AC
Output Available?
No
Is Wind DC Output
Off?
Turn On the Wind AC Output
Yes
Turn Off the Wind DC Output
NoTurn On The
Wind DC Output
Yes
Turn Off the Wind AC Output
No
Turn Off the Solar Power AC Output
Turn Off the Wind AC Output
No
No
3
6
Figure 58 – Flow chart when battery is neither full nor empty situation. The implementation of Station level “GAPC” function is shown in the following figure. In order to applied the flow chart design into the LabVIEW program, some case structures are used to build the main choice decision. Main choice decision part is used to create the control command of wind power production system, solar power production, battery energy storage system, and hydrogen energy storage system. Grid connection part, energy hub part, and other part are trying to be connected to the system if the electrical condition is available. Inputs of Station level “GAPC” are information from every bay level “GAPC” status. Outputs of Station level “GAPC” are control command to each bay.

Dept. of Industrial Information and Control Systems
KTH, Royal Institute of Technology, Stockholm, Sweden
-61-
Figure 59 – Block diagram of decision choice of station level “GAPC” function. Following figure gives the input and output of each bay level “GAPC”. Left part variables are inputs of the “GAPC” function and right part variables are the outputs.
Figure 60 – Block diagram of input and output of bay level “GAPC” function of wind power. For simplified implementation reason, the protection function is integrated in the bay level GAPC as shown in the figure 61. Then the alarm signal can be used in bay level “GAPC” itself. At same time it will be transferred to high level “GAPC” as the subsystem information.

Dept. of Industrial Information and Control Systems
KTH, Royal Institute of Technology, Stockholm, Sweden
-62-
Figure 61 – Block diagram of protection function integrated in bay level “GAPC” function of wind power (Here use wind power production subsystem “GAPC” as example). In each subsystem “GAPC” function, it also uses case choosing to determine the decision of control command as shown in figure 62. The output of subsystem “GAPC” function will be sent to “CSWI” to control the breaker in real life.
Figure 62 – Block diagram of bay level “GAPC” function (Here using wind power production system “GAPC” as example).
5.4 Flexible for Optimization Control
In real life, economic profit is also considered by the user. In order to maximum the profit to the customer or minimum the cost of operation. The optimization control is needed in this case. Here author gives some kind of solution to ensure the possible optimization control. The basic rule of optimization control is to maximum the profit. Assume profit is considered for the trading period of a day. At same time, profit optimization calculation is based on day (24 hours). The profit can be formulated as following equation:
24
( ( ) ( ) ( ) ( ) ( ))t
sell sell buy buyt
p t Q t t Q t C tλ λ+
= − −∑
where t t is the current time, p is the profit which equals income minus outcome minus cost of
operation, ( )sell tλ is for energy price selling to the grid during current hour t , ( )buy tλ is for the
energy price buying from the grid during current hour t , ( )sellQ t is the quantity of energy selling to
the grid during current hour t , ( )buyQ t is the quantity of energy buying from grid during current
hour t and ( )C t is for the operation cost which covered by depreciation of wind turbine, solar power, battery, fuel cell, hydrogen electronlyzer, and some other devices. The equation can be set as following:
arg( ) ( ) ( ) ( )
( ) ( ) ( ) ( ) ( )sell load hydroprod ch er
buy wind solar battery fuelcell
Q t Q t Q t Q t
Q t Q t Q t Q t Q t
+ + +
= + + + +
where ( )loadQ t is energy consumed by load during current hour t ,

Dept. of Industrial Information and Control Systems
KTH, Royal Institute of Technology, Stockholm, Sweden
-63-
( )windQ t is energy produced by wind during current hour t ,
( )solarQ t is energy produced by solar during current hour t ,
( )batteryQ t is energy output by battery during current hour t ,
( )fuelcellQ t is energy output by fuel cell during current hour t ,
( )hydroprodQ t is energy used by hydrogen electronlyzer during current hout t .
arg ( )ch erQ t is energy used to charge battery during current hout t .
Storage of Battery Energy and Hydrogen can be obtained as:
arg arg arg( ) ( 1) ( 1) ( 1)battery battery ch e ch e battery disch eS t S t Q t K Q t K= − + − − −
( ) ( 1) ( 1) ( 1)hydrogen hydrogen hydroprod hydroprod fuelcell fuelcellS t S t Q t K Q t K= − + − − −
where argch eK is efficiency factor of battery charger, argdisch eK is efficiency factor of battery
discharger, hydroprodK is efficiency factor of hydrogen production, fuelcellK is efficiency factor of fuel cell. The constraints can be set as following:
0 ( )battery batteryQ t Q≤ ≤ , 0 ( )fuelcell fuelcellQ t Q≤ ≤ ,
0 ( )hydroprod hydroprodQ t Q≤ ≤ , arg arg0 ( )ch er ch erQ t Q≤ ≤ ,
( )battery battery batteryS S t S≤ ≤ , ( )hydrogen hydrogen hydrogenS S t S≤ ≤
where batteryQ is maximum energy output by battery, fuelcellQ is maximum energy output by fuel cell,
hydroprodQ is maximum energy consumed by hydrogen electronlyzer, argch erQ is maximum energy
consumed by charger, batteryS is minimum limitation of battery energy storage, batteryS is maximum
limitation of battery energy storage, hydrogenS is minimum limitation of hydrogen storage, hydrogenS is maximum limitation of hydrogen storage. By applying these equations and constraints into the optimization object:
Maximum 24
( ( ) ( ) ( ) ( ) ( ))t
sell sell buy buyt
p t Q t t Q t C tλ λ+
= − −∑ , the control strategy can be created.
The optimization function can be realized by software such as HUMER or Matlab or other software. Both HUMER and Matlab support result output by text file. Such result file is readable to C&MS. Therefore, any software can create optimization control result through text file is suitable to C&MS. From this point of view, C&MS is flexible for optimization control.
5.5 Additional Function
In order to increased the informative and secure of the C&MS, some additional function is applied such as “Login Interface”, “System Information Recorder”, “Weather Information”.

Dept. of Industrial Information and Control Systems
KTH, Royal Institute of Technology, Stockholm, Sweden
-64-
Login Interface Panel The login interface panel is shown in the following figure. Users should choose the user name and enter the password then they can open the C&MS main window to control or monitor the system. Login interface increased the security of the system. Only user has the operation right can enter the system.
Figure 63 – Panel of the login interface.
Weather Information Acquisition In order to supply more information of the smart energy container, a weather station is installed on the roof of the container. It uses series communication port to communicate with computer. However its refresh cycle is quite long as 2.5 second to update. To integrate it into C&MS directly will lead to decrease the frequency of the update of the whole system. Therefore, an interface of weather station and C&MS is built. It also used the structure like remote control. Data base is used here to receive the information from weather station, and C&MS can obtain the information from database directly with high update frequency. The weather station supply the information such as wind speed, wind direction, temperature, pressure, and rain and hail data as shown in following figure.
Figure 64 – Weather Information Panel of the C&MS.

Dept. of Industrial Information and Control Systems
KTH, Royal Institute of Technology, Stockholm, Sweden
-65-
System Information Recorder System information recorder uses database to store the information such as voltage value and current value of each VTs and CTs, status of breakers, command of breaker, control mode, alarm information, remote control information, and weather information are stored as well.
5.6 Conclusion of implementation part
In this section, implementation of ICT architecture and UML design to C&MS program is illustrated. Firstly, functions such “IHMI”, “PTOV”, “PTOC”, “PTUV” and “CALH” are introduced and detail implementation methods are given also. After that, as basis of automatic control, the estimation of reservation of battery energy and hydrogen storage is discussed. Then manual control and remote control implementation is introduced step by step. After that, Author also gives the possibility of optimization control function and its theoretical formulas and methods. Finally, some additional functions used in C&MS are discussed. What should be mentioned here is that in this section, two automatic control designs are given. Distributed automatic control compared to contributed automatic control is easy to built when the system is a little complex. However, when the system is simple, contributed automatic control maybe is a better efficient solution. In order to make system easy to extension, the distributed automatic control should be chosen.

Dept. of Industrial Information and Control Systems
KTH, Royal Institute of Technology, Stockholm, Sweden
-66-
6 VERIFICATION AND TESTING OF THE CONTROL SYSTEM
In this section, parameters of the C&MS are given and set. The observation of delay time detection, protection function, interlocking function, manual control and automatic control are also.
6.1 Parameters Setting
Protection Function Parameters Settings The set values for protection function such as overvoltage protection, overcurrent protection, and undervoltage protection is chosen according to the technical data from the vendor of the devices. The principle of value chosen is that based on safety range let device output as much energy as possible. The detail value setting is shown in the table 10-12.
Table 10 –PTOV set value for each device.
Device Name Measurement Point Set Value
Wind Power AC Output 260VAC Bus 260VDC Output 53VDC Bus 53V
Solar Power AC Output 253VAC Bus 253VDC Output 214.8VDC Bus 214.8V
Hydrogen Electrolyzer AC Bus 240VDC Bus 120V
Fuel Cell DC Output 80VDC Bus 80V
Charger AC Bus 264VDC Bus 369V
Battery DC Output 60VDC Section Bus 60V
Energy Hub AC Bus 280VDC Section Bus 64VAC Output 237V
Isolation Transformer AC Bus 253VTransformer secondary side 253V
Local Power AC Bus 264VGreen Power Load Input side 253V

Dept. of Industrial Information and Control Systems
KTH, Royal Institute of Technology, Stockholm, Sweden
-67-
Table 11 –PTUV set value for each device.
Device Name Measurement Point Set Value
Wind Power AC Output 0VAC Bus 160VDC Output 43.2VDC Bus 43.2V
Solar Power AC Output 0VAC Bus 198VDC Output 0VDC Bus 0V
Hydrogen Electrolyzer AC Bus 190VDC Bus 48V
Fuel Cell DC Output 0VDC Bus 0V
Charger AC Bus 70VDC Bus 70V
Battery DC Output 44VDC Section Bus 0V
Energy Hub AC Bus 165VDC Section Bus 0VAC Output 223V
Isolation Transformer AC Bus 207VTransformer secondary side 207V
Local Power AC Bus 180VGreen Power Load Input side 0V
Table 12 –PTOC set value for each device.
Device Name Measurement Point Set Value
Wind Power AC Output 5ADC Output 20A
Solar Power AC Output 16ADC Output 15.6A
Hydrogen Electrolyzer AC Input 25ADC Input 63A
Fuel Cell DC Output 60ACharger AC Input 16A
DC Input 16ABattery DC Output 120AEnergy Hub AC Port 60A

Dept. of Industrial Information and Control Systems
KTH, Royal Institute of Technology, Stockholm, Sweden
-68-
DC Port 100AAC Output Port 40A
Isolation Transformer Secondary side Input/Output Current
35A
Local Power AC Input 10Green Power Load AC Input 40
Energy Storage Devices Parameters Settings To the energy storage devices, the parameters of battery empty, battery full, hydrogen empty and hydrogen full are set. Considering the protection of the battery and hydrogen storage, “empty” is not means absolute discharge all capacity of the battery or using hydrogen empty in real. Here “empty” means the level of battery storage or hydrogen storage reaches a low setting value (not zero). Similarly, “Full” means a high setting value. The battery storage is 15kWh. Therefore the settings of battery are shown in following table.
Table 13 –Parameters setting of Battery Energy Storage System
Parameter Name Setting Value
Storage of battery full level 13kWhHigh level buffer area 3kWhStorage of battery empty level 5kWhLow level buffer area 3kWh
In some situations, for example, battery output power is lower than input power, which will lead exchange of battery charge and discharge very often at full storage level. In opposite situation, battery output power is higher than input power, which will lead exchange of battery charge and discharge very often at empty level. In order to avoid such quick exchanges occur, two buffer areas are set for full level and empty level. Which means when battery reaches the full level, it won’t be charge again until the storage level below the full level minus high level buffer area, in this case is 13kWh-3kWh=10kWh. Similarly, when battery storage level reaches the empty level, it won’t be used as output, until its storage is above the empty level plus low level buffer area, in this case is 3kWh+5kWh=8kWh. For the battery output power can be measured and calculated direct from CT and VT value, it can be obtained _battery output output outputP U I= where _battery outputP is power output from battery, outputU is battery output voltage, and outputI is battery output current. However, charge power is measured through power input to charger and efficiency of charger is 90%. The capacity of hydrogen storage is 2000L. Therefore the settings of hydrogen storage are shown in following table.
Table 14 –Parameters setting of Hydrogen Energy Storage System
Parameter Name Setting Value
Storage of hydrogen full level 1800LHigh level buffer area 300LStorage of hydrogen empty level 300LLow level buffer area 200L
The convert rate of electrolyzer convert electrical power to hydrogen is 0.067kWh/L. On the other hand the convert rate of fuel cell convert hydrogen to electrical power is 986.92L/kWh.
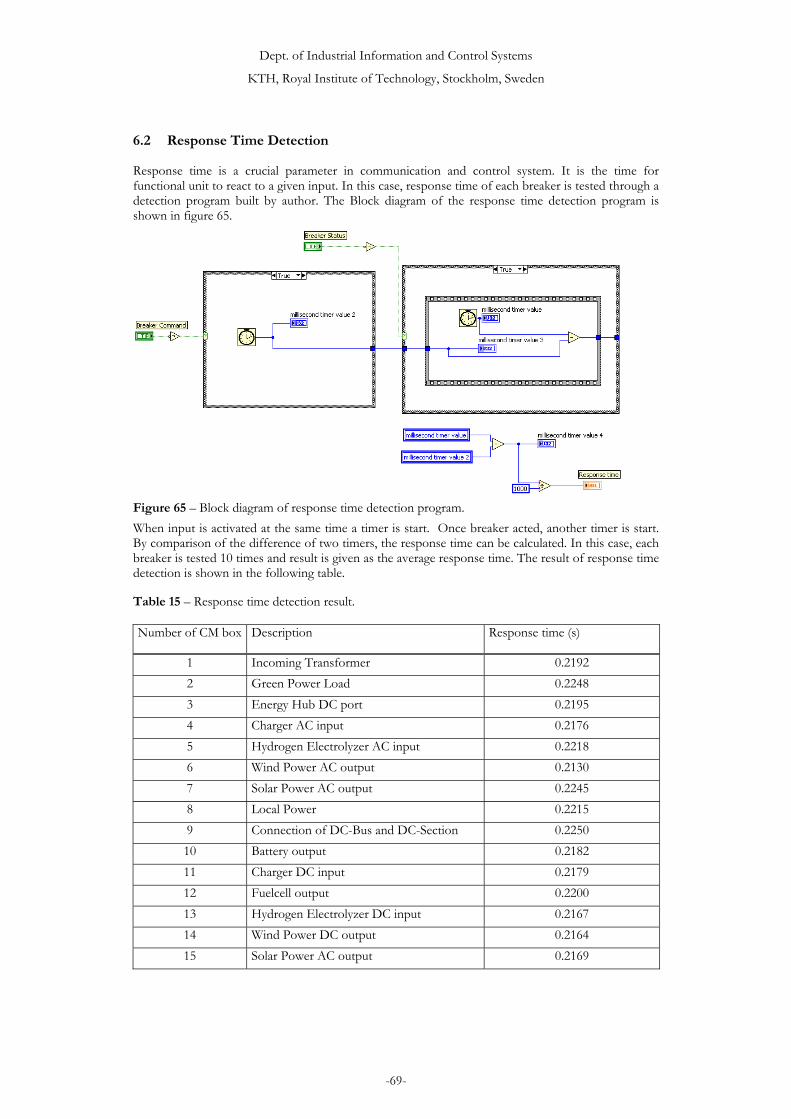
Dept. of Industrial Information and Control Systems
KTH, Royal Institute of Technology, Stockholm, Sweden
-69-
6.2 Response Time Detection
Response time is a crucial parameter in communication and control system. It is the time for functional unit to react to a given input. In this case, response time of each breaker is tested through a detection program built by author. The Block diagram of the response time detection program is shown in figure 65.
Figure 65 – Block diagram of response time detection program. When input is activated at the same time a timer is start. Once breaker acted, another timer is start. By comparison of the difference of two timers, the response time can be calculated. In this case, each breaker is tested 10 times and result is given as the average response time. The result of response time detection is shown in the following table.
Table 15 – Response time detection result.
Number of CM box Description Response time (s)
1 Incoming Transformer 0.2192 2 Green Power Load 0.2248 3 Energy Hub DC port 0.2195 4 Charger AC input 0.2176 5 Hydrogen Electrolyzer AC input 0.2218 6 Wind Power AC output 0.2130 7 Solar Power AC output 0.2245 8 Local Power 0.2215 9 Connection of DC-Bus and DC-Section 0.2250 10 Battery output 0.2182 11 Charger DC input 0.2179 12 Fuelcell output 0.2200 13 Hydrogen Electrolyzer DC input 0.2167 14 Wind Power DC output 0.2164 15 Solar Power AC output 0.2169

Dept. of Industrial Information and Control Systems
KTH, Royal Institute of Technology, Stockholm, Sweden
-70-
From storage data, the response time also can be shown by plot the breaker command versus time figure with breaker status versus time. In this case, Matlab is used to plot the response time figure of the breaker in CM box number 10. As shown in figure 66.
Figure 66 – Breaker status and breaker command versus time. In this figure, red line shows the command of this breaker and black line shows the status of the breaker. When the time is 316.5 second, breaker command is turned to “0” which means disconnection of the breaker. After 0.3 second, the breaker is turned off. When time is 317.4s, command of the breaker is turned to “1” which means connection of the breaker. After 0.3 second, the breaker is turned on at 317.7s. The difference of result in figure and table is discussed in the section 7.
6.3 Protection Function Testing
Protection function is testing in simulation environment. The input signal is given by simulation input from LabVIEW itself. Overvoltage protection, Overcurrent protection, and Undervoltage protection are tested as shown in the following figure.

Dept. of Industrial Information and Control Systems
KTH, Royal Institute of Technology, Stockholm, Sweden
-71-
Figure 67 – Simulation test of protection function. In this figure, the top one shows the voltage value from VT in blue and Overvoltage protection set value as upper red line and Undervoltage protection set value as lower red line. Middle one shows the current value from CT in blue and Overcurrent protection set value as red line. The bottom one shows the user control command which is in blue and set as one in constant which means user always asking to connect the breaker. The red one is control command by C&MS and black one is the status of the breaker. When time is 2956 as shown in middle figure, the current value is higher than the PTOC set value, and user control command is blocked as shown in bottom figure. Therefore, the status of the breaker is turned off. When time is 2975 as shown in middle figure, the current is decreased to the level below the set value of PTOC, the block is eliminated and switch can be connected again. When time is 3003s as shown in top figure, the voltage value is over the PTOV set value, and user command is blocked again. After 3022s the value of voltage is back to normal value and user get the control of the breaker. When time is 3045s the value of the voltage is below the set value of PTUV, the user control command is blocked once again, until 3056s, the voltage value back to the normal value.
6.4 Interlocking Function Testing
Manual Control Interlocking Function Verification Result The interlocking function has been tested on breakers of battery charger. In this case, battery charger can use either AC or DC as power input. However it cannot use AC and DC as source at same time. Therefore, the interlocking function has been applied here. In Section 5.2 Interlocking Functions part, manual control interlocking function has been introduced in principle and realized by programming. In testing, breaker of charger DC input was connected firstly as shown in following figure.

Dept. of Industrial Information and Control Systems
KTH, Royal Institute of Technology, Stockholm, Sweden
-72-
Figure 68 – Manual control interlocking function testing step 1: Connection of DC part. Then in order to test interlocking function works or not, AC input breaker of charger is also sent the connection command without disconnecting DC input breaker as shown in following figure.
Figure 69 – Manual control interlocking function testing step 2: Connection of AC part. In this figure, when AC and DC inputs were asked to connect at same time a machine-user dialog window is popped up to ask for choice from user. While the status is kept as previous status, DC input is connected and AC is opened. Then “Connect Charger AC side” option in dialog window. The result is shown in following figure.

Dept. of Industrial Information and Control Systems
KTH, Royal Institute of Technology, Stockholm, Sweden
-73-
Figure 70 – Manual control interlocking function testing step 3: Choice of AC connection. After choose the “Connect Charger AC side” option, the DC input breaker is automatically disconnected and AC input breaker is connected.
Figure 71 – Status of Charger AC and DC input Breaker. This figure also shows the status of charger AC and DC input breaker. It is drawn by using the recording data of breaker status. The upper figure shows the status of charger AC input breaker and lower figure shows the status of charger DC input breaker. At time 1696s, user want to connect AC input breaker to charge the battery then DC input breaker is disconnected by the system.

Dept. of Industrial Information and Control Systems
KTH, Royal Institute of Technology, Stockholm, Sweden
-74-
Remote Control Interlocking Function Verification Result Remote control interlocking function is realized by different methods compared with local control interlocking function which is introduced in section 5. When testing the interlocking function of remote control, firstly, breaker of wind power DC output is connected by remote control panel as shown in following.
Figure 72 – Remote control interlocking function testing step 1: Connection of DC part. Then Solar power AC output breaker is attempted to connect as shown in following figure.
Figure 73 – Remote control interlocking function testing step 2: Connection of DC part. After trying to connecting both AC and DC Solar power output breakers, C&MS automatically detected the fault of command from remote control, and turn back the system to the manual control mode. At the same time, the “interlocking error signal” is turn on to give the information to the user of the C&MS. The result is shown in following figure.

Dept. of Industrial Information and Control Systems
KTH, Royal Institute of Technology, Stockholm, Sweden
-75-
Figure 74 – Remote control interlocking function testing step 3: C&MS back to manual control. What should be mentioned here is the “Interlocking Error Signal” light will keep on until the interlocking fault in remote control panel is eliminated.
Figure 75 – Remote control interlocking function testing of Solar Power output. From the bottom figure, the remote control is activated from 2485s. Therefore, the remote control command is not applied before 2485s. Until 2577s, the remote has test connection AC output and DC output separated as shown in top and middle figures. When time is 2577s, remote control user connecting both AC and DC output of solar power at same time. It is an error controlling which lead remote control disabled as shown in bottom figure.

Dept. of Industrial Information and Control Systems
KTH, Royal Institute of Technology, Stockholm, Sweden
-76-
6.5 Manual Control Verification Result
In Manual Control mode, C&MS can be controlled by main panel. Manual Control command is sent to the system by pressing the buttons of the control panel. When voltage and current of the device are in the range of accepted range which means no protection function is activated in the system, the breaker can be manually controlled directly. However, when any protection such as overvoltage, overcurrent, and undervoltage is activated to the device, the connection breaker command will be blocked by the system. For instance, the control of electrolyzer AC input is described.
Figure 76 – C&MS control panel when electrolyzer AC input is asked to turn on. In this panel button of breaker control of electrolyzer AC input is pressed to try to connect electrolyzer to AC bus. However protection function is activated as shown in figure. The red instrument light of blocking signal is on.
Figure 77 – Electrolyzer AC input breaker status, manual command, and blocking signal relations.

Dept. of Industrial Information and Control Systems
KTH, Royal Institute of Technology, Stockholm, Sweden
-77-
From this figure, when time is 688.8s, user sent command of electrolyzer AC input breaker to turn on. At same time the blocking signal is “1” which means there is protection function detects voltage and/or current value is not located in safety range. Therefore the connection command is blocked by protection function. The wind power AC output is also controlled manually in verification testing. The result is shown in following figure.
Figure 78 – Wind Power AC output breaker status, manual control command, and power relations. In bottom subfigure of this figure, the wind power AC output at around 80 VA. When time was 1135s, breaker of Wind power AC output was turned off by user through button of the control panel. Correspondingly, status of this breaker was “OFF” which is read as “0” in binary in the top subfigure. Therefore, the output power became zero immediately. When time ran to 1229, the wind power AC output was connected to AC bus again manually. However the output power kept a quite low level until time is 1229s. Finally, the output power became around 77.6 VA.
6.6 Remote Control Verification Result
The remote control verification is simulated in one computer. C&MS has an interface to obtain the control command by reading the remote control file. This file is controlled by the remote control program. In order to verifying the remote control of C&MS, remote control panel is programmed. It writes remote control command into the file which will be read by C&MS and control the system. In the remote control interface of C&MS, it will feed back the error to remote controller and also give the information to local controller through the panel. Remote control interface also contains two additional functions. One is “Interlocking Error” checking function which is introduced in part 6.4. The other is “Communication Error” checking function which will check the time stamp of the remote control file. If remote command time stamp has passed for 5 second, the system will see it as communication error and switch the remote control back to local manual control mode.

Dept. of Industrial Information and Control Systems
KTH, Royal Institute of Technology, Stockholm, Sweden
-78-
As shown in following figure, when remote panel is not activated, the “communication error signal is on.
Figure 79 – Remote control “Communication Error Signal” is activated. After running the remote control panel, the remote control file is updated by the program. At same time the time stamp of the file is also updated. Therefore, the communication error is eliminated as shown in following figure. Then C&MS can be controlled remotely.
Figure 80 – Remote control enabled. By pressing the button of “HydroGenAC” in the remote control panel, the breaker of electrolyzer AC input can be connected as shown in following figure.

Dept. of Industrial Information and Control Systems
KTH, Royal Institute of Technology, Stockholm, Sweden
-79-
Figure 81 – Remote control the breaker of Electrolyzer AC input. Storage data also can be used to draw the figure as following which shows the relationship of Remote control command of breaker, breaker status, and remote mode.
Figure 82 – Remote control the breaker of Electrolyzer AC input. Top figure is remote control command of electrolyzer AC input breaker. Middle figure is breaker Status of electrolyzer AC input breaker. Bottom figure is C&MS remote control mode. In this figure, when remote control mode value becomes “1”, C&MS is controlled by remote user. When remote control mode value is “0”, C&MS is controlled locally. In bottom figure, when time is 2485s, C&MS switch to the remote control mode. After time is 2578s, C&MS is switch back to local control. In top figure, remote control of electrolyzer AC input breaker is turned on at 2516s and keep connection status. Correspondingly, status of the break is “ON” after 2516s. However it turned back to “OFF” after 2578s.

Dept. of Industrial Information and Control Systems
KTH, Royal Institute of Technology, Stockholm, Sweden
-80-
6.7 Automatic Control Testing
Testing of automatic control is applied for both contributed automatic control design and distributed automatic control design. However for contributed automatic control design is failed for the automatic process system is failure to handle the system when protection function is activated. On the other hand, distributed automatic control process runs satisfactory. In this part the results are obtained by applying distributed automatic control design. In each bay control, parameters can be setting for “PTOV”, “PTOC”, and “PTUV” through the bay control panel as shown in following figure.
Figure 83 – Battery Energy Storage System bay control panel. This figure gives the battery energy storage system bay control panel. In this panel, energy stored in battery, input and output voltage and current are shown as numeric. Parameters of protection function can be set. Lights give the situation of the battery energy storage system. Red lights give the alarm signal which shows some part of this system is not available such as AC charge input, DC charge input, and battery output. The situation information is also sent to system level “GAPC” function to be used determining control of the overall system. It also receive control command from station level “GAPC” such as buttons named “AC Charge Battery”, “DC Charge Battery”, and “Battery output”. The energy stored in battery also gives the system to charge and/or discharge battery.
Figure 84 – Battery Energy Storage System information in station level system control panel.

Dept. of Industrial Information and Control Systems
KTH, Royal Institute of Technology, Stockholm, Sweden
-81-
In this figure, battery energy storage system information is accepted by station level “GAPC” and shown in “IHMI” panel. Correspondingly, it shows “Charger DC port” is not available and “Charger AC port” is available. In station level control, according to station level “GAPC” design, battery will not be charged when it is full and charged when it is not full. Two buffer areas is added to avoid fast frequency of exchange of charge and discharge of battery. The result is shown in following figure.
Figure 85 – Automatic control result of battery energy storage system. From this figure, system is running at automatically control mode from 1300s to 1801s. Initially, energy in battery is located in 10 to 15kWh. Battery is not charged, until 1403s its energy reached 10 kWh. According to the parameter setting in table 13, breaker of charge AC port is connected which can charge battery by using power from AC bus. It can be seen from third and forth subfigure, Charge power is around 1411W and discharge power is around 70W. Therefore, the energy of battery is increased as shown in bottom figure. When it reaches 15kWh, breaker of Charge AC port is disconnected to stop charging battery. Due to the power consuming of load, energy of battery is decreased as initial. In this figure, it gives three cycles of battery charging and discharging by automatic control.
6.8 C&MS Execution Time Detection
The execution time is the time which program takes to run a whole loop. It is another crucial factor which affects the program’s execution. To detect the execution time C&MS used, a given example from LabVIEW, named “Timing Template” is used. In this test, number of trials is set as 10. C&MS is tested both in simulation environment and real environment. It is tested 10 times to obtain the average execution time. In simulation environment the result is shown in following table.
Table 16 – Execution time of C&MS in simulation environment.
Number of Test Average execution time of 10 Trials (Second) Average execution time (Second)
1 0.076 0.0792 0.085 3 0.080 4 0.076

Dept. of Industrial Information and Control Systems
KTH, Royal Institute of Technology, Stockholm, Sweden
-82-
5 0.075 6 0.086 7 0.075 8 0.079 9 0.077 10 0.081
The average execution time of C&MS in simulation environment is 0.079 second. The execution time of C&MS in real environment is shown in following table.
Table 17 – Execution time of C&MS in real environment.
Number of Test Average execution time of 10 Trials (Second) Average execution time (Second)
1 0.164 0.169
2 0.168 3 0.172 4 0.169 5 0.162 6 0.172 7 0.17 8 0.17 9 0.171 10 0.167
From this table, it is obvious that execution time is longer in real testing environment than in simulation environment. The reason of the difference will be discussed in section 7.

Dept. of Industrial Information and Control Systems
KTH, Royal Institute of Technology, Stockholm, Sweden
-83-
7 ANALYSIS AND DISCUSSION
In this section analysis and discussion will be divided into three parts. In first part, design of ICT architecture and UML model will be discussed. In second part the implementation of design will be discussed and some restrictions will be given. The other part will focus on verification and testing result analysis.
Design of ICT architecture and UML model The ICT architecture and UML model design are following the IEC 61850 and IEC 61400. For some part of system has not corresponding logical node, two logical nodes are designed by author. ICT architecture and UML model is designed more generalized. Therefore, some functions are not implemented in implementation part due to the restrictions which will be described in next part. General design of ICT architecture and UML model can help applying the design in other system with different size and/or contributions.
Implementation Analysis of Design to C&MS In this case study, implementation of UML to LabVIEW program is not prefect due to the restriction of LabVIEW and limitation of obtained information from real devices. In LabVIEW program, it has its own data attribution and data type which does not follow the IEC615850 standard. Therefore, it is unable to apply the design totally following IEC 61850 standard. Some modification or replacement of data type is applied during LabVIEW implementation. However, the ICT structure is applied well as design. Another restriction of implementation is lack of information from real devices. For instance, according to IEC61850 standard, charger of battery has corresponding logical node “ZBTC”. From description of “ZBTC” in IEC 61850-7-420 the “battery charger mode setting” is mandatory choice which should be used in design. However, in implementation, it is unable to obtain the setting from charge itself now. Such problem also occurs in inverters, rectifiers of wind and solar power subsystems. These problems can be solved by applying other interfaces between LabVIEW and hardware devices in future work. Beside the restrictions mentioned above, C&MS can implement design of ICT architecture and UML model well. The strength of LabVIEW implementation is it can be started programming quickly and easy to realize the control system. When the object system is not so complex and not contain so much information, it can build a system in a short time and easy to debug the system. The GUI program environment is also friendly to user. According to designed ICT architecture and UML model, the C&MS also can be implemented in other type of program language such as C++, C#, and Java and so on.
Verification and Test Result Analysis In verification and test part, applied functions of C&MS are tested. In part 6.1 setting parameters of the system are important for protection function to give the right reflection. Wrong setting of parameters will lead to waste of energy or make the protection function useless. For example, if an overvoltage protection setting value of power output is set too low, it is unable for the device to output power when the electrical condition is acceptable to output power. On the other hand if the setting value of overvoltage protection is set too high, the device will be damaged due to the overvoltage which is not detected by the protection function. Response time testing gives the response time of breakers action at around 0.22s. However, the figure drawn from recording file shows the response time of breaker is about 0.3s. The difference here is due to the recording file sampling ratio. In this case, 2-3 samples will be written to recording file which means the interval time between two samples is around 0.5-0.3s. Therefore, the response time can be reflected from recording file but not accuracy. Table 15 gives a more accuracy response time of breakers. It is possible to increase the accuracy of recording through increasing the sampling ratio.

Dept. of Industrial Information and Control Systems
KTH, Royal Institute of Technology, Stockholm, Sweden
-84-
However, it also will increase the size of recording file. Double sampling ratio means the recording file size will double also. The response time of breaker can be tested before installed in the system. The protection functions and interlocking function works well in verification test. Turn to automatic control function in section 5, two kind of automatic control process are introduced. In verification stage, contributed automatic control process is failed. In order to find the problem, the “GAPC” function is tested step by step. The problem is due to its wrong handling of protection function. When some protection functions are activated in the system, “GAPC” is failed to recognize and keep connection of the breaker which is blocked to connection by protection function. After find out the problem, the “GAPC” is tried to be fixed. However, the characteristic of contributed control function make it is too complex to modify the original function. Therefore, the contributed automatic control function is given up. Oppositely, distributed automatic control function works well. Some problems occur in battery and hydrogen energy storage system can be easily solved due to each subsystem is more simplified than one contributed system. In part 6.8, execution time is detected from simulation and real environment. In simulation environment, the execution time is around 0.079s per scanning period. However, in real environment the execution time is around 0.169s approximate two times of it in simulation environment. There are two main reasons lead to this difference. One is program in real environment need more time to obtain the value from real device to C&MS. In simulation environment it almost not cost time to. The other reason is simulation environment use less function in LabVIEW than real environment. Therefore the difference of execution time mentioned here is reasonable.

Dept. of Industrial Information and Control Systems
KTH, Royal Institute of Technology, Stockholm, Sweden
-85-
8 FUTURE WORK
The methodology, development and implementation in this paper can be used in several future studies which are shown in following figure.
Figure 86 – Some possible future work. Firstly, the existing ICT architecture and UML model can be used to extend to meet with different size of the system. In this study case, only one wind turbine, one solar panel, a battery storage system, and one hydrogen energy storage system are used. To different system, the combination of different number and size of wind power, solar power, battery storage, and hydrogen energy storage can be applied based on the ICT architecture and UML model which is used in this case with little modification for system matching. Since both ICT architecture design and UML model implementation are following IEC61850 standard, the extending of the system for user who is familiar with IEC61850 standard will be convenience. Secondly, integration of designed C&MS with Smart Energy Container to IEC61850 substation can be studied in future. Thirdly, during implementation of C&MS, some simulation inputs to the system are used to test the behavior of the control system without real devices. From education or consult point of view, C&MS is also suitable to interface the models where the devices behavior of generation source and consumption are demonstrated. Finally, Smart Energy Container can be seen as a part of multi-agent system. Based on designed ICT architecture, UML model and C&MS system, information communication between current system and multi-agent system can be studied in depth level.

Dept. of Industrial Information and Control Systems
KTH, Royal Institute of Technology, Stockholm, Sweden
-86-
9 CONCLUSION
ICT architecture of Smart Energy Container is developed in this paper. According the designed ICT architectures, UML models are built and implementation into programming stage. Finally, C&MS is achieved to monitoring and control the smart energy container. In design stage, ICT architecture and UML model design are following IEC 61850 standard and IEC61400 standard. During this stage two new logic nodes are designed to cover the blank which is not covered by standard. In implementation stage, the functions supplied by C&MS are able to meet the requirement of safety operation and protection. Following IEC 61850 standard and IEC 61400 standard allow the system can communicate with IEC 61850 standard substation and easily extend to different size and configuration. The interface of C&MS allow it be applied different usage and application.

Dept. of Industrial Information and Control Systems
KTH, Royal Institute of Technology, Stockholm, Sweden
-87-
10 ACKNOWLEDGEMENTS
This master thesis project is a part of joint development project at HVV (www.highvoltagevalley.se) and financed by the Swedish Governmental Agency for Innovation Systems. STRI AB provide support during design and implementation of the ICT architecture of control system and access to the RD2 platform for development and testing. Department of Industrial Information and Control System (ICS), School of Electrical Engineering, Royal Institute of Technology (KTH) also provide a nice working environment. During my thesis work, many people support me a lot in different angle. Firstly, I would like to appreciate my supervisor Nicholas Honeth. Sometimes I feel it is so luck for me to be supervised by him. Since he always takes care of my thesis project and gives me many suggestions to solve the problem I have meet in my work. In daily life, he is more like a friend of me. I have to thank Lars Nordström to offer me the opportunity to finish this work. And he also organizes the IEC61850 training course at ICS. The experience of the course helps me a lot during my latter study and finally finished my thesis. I would like to appreciate Henrik Stomberg and Michael Gudmundsson. Later is supervisor from STRI. He is an experienced LabView programmer. I got many smart ideas from him which helps me simplified my programming a lot. Former is my project manager of STRI who gives me many support and valuable suggestion from industry application view of point. They help me to improve my design and implementation a lot. Thanks to Nicholas Etherden who gives me many valuable comments on my design. Also Thanks to Erika Jansson helping me arrange my accommodation during my visiting in Ludvika. I would like to express my thanks to senior students who encourage and help me like Zhu Kun, Moustafa, Hannes, Arshad, and so on. I also want to thanks Mats Leksell, Huang Wenkan and some other people who help me. Last but not least, sincere thanks to my parents and other family members. Since their supports are always my best drive force pushing me to reach new milestone again and again.

Dept. of Industrial Information and Control Systems
KTH, Royal Institute of Technology, Stockholm, Sweden
-88-
11 REFERENCE
[1] Thomas, A.; Göran, A.;, Lennart, S.;, "Distributed generation: a definition," Electric Power System Research, vol.57, pp.195-204, 2001
[2] Pepermans, G.; Driesen, J.; Haeseldonckx, D.; D’haeseleer, W.; Belmans, R.;, "Distributed Generation: Definition, Benefits and Issues," Energy Transport & Environment, Belgium, 2003
[3] Gota, D.I.; Vigu, C.; Capatana, O.;, "A power consumption optimization method for a hybrid renewable energy making system," Automation Quality and Testing Robotics (AQTR), 2010 IEEE International Conference on , vol.3, no., pp.1-4, 28-30 May 2010
[4] Baumann, L.; Boggasch, E.; Rylatt, M.; Wright, A.;, "Energy flow management of a hybrid renewable energy system with hydrogen," Innovative Technologies for an Efficient and Reliable Electricity Supply (CITRES), 2010 IEEE Conference on, vol., no., pp.78-85, 27-29 Sept. 2010
[5] Dagdougui, H.; Minciardi, R.; Ouammi, A.; Robba, M.; Sacile, R.;, "A Dynamic Decision Model for the Real-Time Control of Hybrid Renewable Energy Production System," System Journal, IEEE, vol.4, no.3, pp.323-333, Sept. 2010
[6] Etxeberria, A.; Vechiu, I.; Camblong, H.; Vinassa, J.M.; Camblong, H.;, "Hybrid Energy Storage Systems for renewable Energy Source Integration in microgrids: A review," IPEC, 2010 Conference Proceedings, vol., no., pp.532-537, 27-29 Oct. 2010
[7] Belfkira, R.; Nichita, C.; Reghem, P.; Barakat, G.;, "Modeling and optimal sizing of hybrid renewable energy system," Power Electronics and Motion Control Conference, 2008. EPE-PEMC 2008. 13th, vol., no., pp.1834-1839, 1-3 Seot. 2008
[8] Khan, M.J.; Iqbal, M.T.;, "Dynamic modeling and simulation of a small wind-fuel cell hybrid energy system," Renewable Energy, vol.30, no.3, pp.421-439, 2005
[9] Doumbia, M.L.; Agbossou, K.; Granger, E.;, "Modelling and Simulation of a Hydrogen Based Photovoltaic/Wind Energy System," Industrial Electronics, 2007. ISIE 2007, IEEE International Symposium on , vol., no., pp.2601-2606, 4-7 June 2007
[10] de Durana, J.M.G; Barambones, O.;, "Object oriented simulation of Hybrid Renewable Energy Systems focused on Supervisor Control," Emerging Technologies & Factory Automation, 2009. ETFA 2009. IEEE Conference on , vol., no., pp.1-8, 22-25 Sept. 2009
[11] Gudi, N.; Lingfeng Wang; Devabhaktuni, V.; Depuru, S.S.S.R.;, "Demand response simulation implementing heuristic optimization for home energy management," North American Power Symposium (NAPS), 2010, vol., no., pp.1-6, 26-28 Sept. 2010
[12] Dagdougui, H.; Minciardi, R.; Ouammi, A.; Robba, M.; Sacile, R.;, "A Dynamic Decision Model for the Real-Time Control of Hybrid Renewable Energy Production Systems," Systems Journal, IEEE, vol.4, no.3, pp.323-333, Sept. 2010
[13] Korpaas, M.; Holen, A.T.; hildrum, R.;, "Operation and sizing of energy storage for wind power plants in a market system," International Jounal of Electrical Power and Energy System, vol.25, no.8, pp.599-606, 2003
[14] Bernal-Agustin, J.L.; Dufo-Lopez, R.;, "Hourly energy management for grid-connected wind-hydrogen system," Int. J. Hydro. Energy, vol.33, no., pp.6401-6413, Sep. 2008
[15] Aiche-Hamane, L.; Belhamela, M.; Benyoucef, B.; Hamane, M.;, "Feasibility study of hydrogen production from wind power in the region of Ghardaia," Int. J. Hydro. Energy, vol.34, pp.4947-4952, Feb. 2009
[16] Korpaas, M.; Holen, A.T.;, "Operation planning of hydrogen storage connected to wind power operating in a power market," IEEE Trans. Energy Convers., vol.21, no.3, pp.742-749, Sep. 2006
[17] Dufo-Lopez, R.; Bernal-Agustin, J.L.; Contreras, J.;, "Optimization of control strategies for stand-alone renewable energy systems with hydrogen storage," Renew. Energy, vol.32, no., pp. 1102-1126, Jun. 2007

Dept. of Industrial Information and Control Systems
KTH, Royal Institute of Technology, Stockholm, Sweden
-89-
[18] Schönberger, J.; Duke, R.; Round, S.D.;, "DC-bus signalling: A distributed control strategy for a hybrid renewable nanogrid," IEEE Transactions on Industrial Electronics, vol.53, no.5, pp.1453-1460, 2006
[19] Deluca, N.W.; Elabd, Y.A.;, "Polymer electrolyte membranes for the direct methanol fuel cell: A review," Journal of Polymer Science, Part B: Polymer Physics, vol.44, no.16, pp.2201-2225, 2006
[20] Bar-On, I.; Kirchain, R.; Roth, R.;, "Technical cost analysis for PEM fuel cells," Journal of Power Sources, vol.109, no.1, pp.71-75, 2002
[21] Barbir, F.; Gómez, T.;, "Efficiency and economics of proton exchange membrane (PEM) fuels cells," International Journal of Hydrogen Energy, vol.21, no.10, pp.891-901, 1996
[22] Delucchi, M.A.; Lipman, T.E.;, "An analysis of the retail and lifecycle cost of battery-powered electric vehicles," Transportation Research Part D: Transport and Environment, vol.6, no.6, pp.371-404, 2001
[23] Ashari, M.; Nayar, C.V.;, "An optimum dispatch strategy using set points for a photovoltaic (PV)-diesel-battery hybrid power system," Solar Energy, vol.66, no.1, pp.1-9, 1999
[24] Katiraei, F.; Iravani, M.R.; Lehn, P.W.;, "Micro-grid autonomous operation during and subsequent to islanding process," IEEE Transactions on Power Delivery, vol.20, no.1, pp.248-257, 2005
[25] Green, T.C.; Prodanovic, M.;, "Control of inverter-based micro-grids," Electric Power Systems Research, vol.77, no.9, pp.1204-1213, 2007
[26] Li, Y.; Vilathgamuwa, D.M.; Loh, P.C.;, " Design, analysis, and real-time testing of a controller for multibus microgrid system," IEEE Transactions on Power Electronics, vol.19, no.5, pp.1195-1204, 2004
[27] Li, Y.; Vilathgamuwa, D.M.; Loh, P.C.;, "Microgrid power quality enhancement using a three-phase four-wire grid-interfacing compensator," IEEE Transactions on Industry Applications, vol.41, no.6, pp.1707-1719, 2005
[28] Sao, C.K.; Lehn, P.W.;, "Control and power management of converter fed microgrid," IEEE Transactions on Power Systems, vol.23, no.3, pp.1088-1098, 2008
[29] Yingli Ren; Jinghan He; Bo, Z.Q.; Richards, S.; Klimek, A.;, "Research on Real-Time Communication Capacity of IEC61850 Applied in Integrated Protection Systems," Developments in Power System Protection, 2008. DPSP 2008. IET 9th International Conference on, vol., no., pp.218-223, 17-20 March 2008
[30] Holbach, J.; Rodriguez, J.; Wester, C.; Baigent, D.; Frisk, L.; Kunsman, S.; Hossenlopp, L.;, "Status on the first IEC61850 based protection and control, multi-vendor project in the United States," Power Systems Conference: Advanced Metering, protection, Control, Communication, and Distributed Resources, 2007. PSC 2007., vol., no., pp.254-277, 13-16 March 2007
[31] Sidhu, T.S.; Yin, Y.;, "Modelling and simulation for performance evaluation of IEC61850- based substation communication system," IEEE Transactions on Power Delivery, vol.22, no.3, pp.1482-1489, 2007
[32] Seong-Jeong Rim; Seong-II Lim; Seung-Jae Lee;, "Multi-agent based reliability enhancement scheme for IEC61850 substation," Transmission and Distribution Conference and Exposition, 2008. T&D. IEEE/PES, vol., no., pp.1-6, 21-24 April 2008
[33] Cleveland, F.M.;, "IEC 61850-7-420 communications standard for distributed energy resources (DER) ," Power and Energy Society General Meeting – Conversion and Delivery of Electrical Energy in the 21st Century, 2008 IEEE, vol., no., pp.1-4, 20-24 July 2008
[34] IEC, Communication networks and systems in substations – Part5: Communication requirements for functions and device models, IEC Std. 61850 Part 5, 2003
[35] IEC, Communication networks and systems for power utility automation – Part7-420: Basic communication structure – Distributed energy resources logical nodes, IEC Std. 61850 Part 7-420, 2008
[36] IEC, Wind turbines - Communications for monitoring and control of wind power plants – information models, IEC Std. 61400 Part 25-2, 2006

Dept. of Industrial Information and Control Systems
KTH, Royal Institute of Technology, Stockholm, Sweden
-90-
[37] IEC, Communication networks and systems in substations – Part7-4: Basic communication structure for substation and feeder equipment – Compatible logical node classes and data classes, IEC Std. 61850 Part 7-4, 2010
[38] IEC, Communication networks and systems in substations – Part 7-3: Basic communication structure for substation and feeder equipment – Common data classes, IEC Std. 61850 Part 7-3, 2005

Dept. of Industrial Information and Control Systems
KTH, Royal Institute of Technology, Stockholm, Sweden
-91-
APPENDIX
Description and Class of Additional LNs
Additional LNs are designed by author and used in ICT architecture and UML model design.
Temperature Sensor LN: Temperature Sensor Name: TTEM The temperature is delivered as sampled values. The sampled values are transmitted as engineering values.
TTEM class Attribute Name Attr. Type Explanation T M/O
LNName Shall be inherited from logical-node class (see IEC 61850-7-2)
Common Logical Node Information
LN shall inherit all Mandatory Data from Common Logical Node Class M
EEHealth INS External equipment health O EEName DPL External equipment name plate O OpTmh INS Operation time O Measured values Tmp SAV Temperature (sampled value) M Status InformtaionFuFail SPS TTEM fuse failure O Settings
TmpAlm ASG Temperature alarm because of an abnormal condition (FALSE = Normal, TRUE = alert). O
TmpMax ASG Maximum temperature O

Dept. of Industrial Information and Control Systems
KTH, Royal Institute of Technology, Stockholm, Sweden
-92-
Pressure Sensor LN: Pressure Sensor Name: TPRE The pressure is delivered as sampled values. The sampled values are transmitted as engineering values.
TPRE class Attribute Name Attr. Type Explanation T M/O
LNName Shall be inherited from logical-node class (see IEC 61850-7-2)
Common Logical Node Information
LN shall inherit all Mandatory Data from Common Logical Node Class M
EEHealth INS External equipment health O EEName DPL External equipment name plate O OpTmh INS Operation time O Measured values Pres SAV Pressure in a specific volume M Status InformtaionFuFail SPS TTEM fuse failure O Settings
PresAlm ASG Pressure alarm because of an abnormal condition (FALSE = Normal, TRUE = alert). O
Hydrogen Generator Controller LN: Hydrogen Generator Controller Name: DHGC The control information of hydrogen generator is covered by “DHGC” logical node. It reflects the required information of remote control and monitoring.
DHGC class Attribute Name Attr. Type Explanation T M/O
LNName Shall be inherited from logical-node class (see IEC 61850-7-2)
Data System logical node data
LN shall inherit all mandatory data from common logical node class M
The data from LLN0 may optionally be used O Status information CtrModSt INS Control mode status O Settings TDlWupTms ING Time delay for Hydrogen Generator wake-up O TDlSlpTms ING Time delay for hydrogen Generator sleep test O Controls
PGModCtr ENC
Mode selected to control the hydrogen output of the hydrogen generator:
Value Explanation0 Not applicable/Unknown1 Maximum hydrogen generation 2 Power limited controller99 Other
O

Dept. of Industrial Information and Control Systems
KTH, Royal Institute of Technology, Stockholm, Sweden
-93-
Hydrogen Generator General Information LN: Hydrogen Generation Characteristic Rating Name: DHGI The hydrogen generator characteristics covered in the “DHGI” logical node reflect those required for remote monitoring of critical functions and states of the hydrogen generator itself.
DHGI class Attribute Name Attr. Type Explanation T M/O
Shall be inherited from logical-node class (see IEC 61850-7-2)
Data System logical node data
LN shall inherit all mandatory data from common logical node class M
The data from LLN0 may optionally be used O Status Information
HGCfgTyp ENG
Hydrogen Generator configuration type:Value Explanation0 Not applicable/Unknown1 AC power input mode2 DC power input mode99 Other
O
VRtgDC ASG DC voltage level rating O ARtgDC ASG DC current rating O VRtgAC ASG AC voltage level rating O ARtgAC ASG AC current rating O MaxInVDC ASG Maximum input DC voltage O MaxInCDC ASG Maximum input DC current O MaxInVAC ASG Maximum input AC voltage O MaxInCAC ASG Maximum input AC current O LoTmp ASG Low limitation temperature O HiTmp ASG High limitation temperature O