ict prices and ict services: what do they tell us about ... prices and ict services: what do they...
TRANSCRIPT

EEccoonnoommiiccss PPrrooggrraamm WWoorrkkiinngg PPaappeerr SSeerriieess
ICT Prices and ICT Services:
What do they tell us about Productivity and Technology?
David Byrne
Board of Governors of the Federal Reserve System
Carol Corrado The Conference Board and
Georgetown University Center for Business and Public Policy
May 2016 (Revised July 2016)
EEPPWWPP ##1166 -- 0055
Economics Program 845 Third Avenue
New York, NY 10022-6679 Tel. 212-759-0900
www.conference-board.org/economics

ICT Prices and ICT Services:
What do they tell us about Productivity and Technology?
Dave Byrne∗ and Carol Corrado†‡§
May 16, 2016
(Revised, July 11, 2016)
Abstract
This paper reassesses the link between ICT prices, technology, and productivity. Tounderstand how the ICT sector could come to the rescue of a whole economy, we introducea simple model that sets out the steady-state contribution of the sector to the growth inU.S. labor productivity. The model extends Oulton (2012) to include ICT services anddraws conclusions about the relationship between prices for ICT services and prices for thecapital stocks (i.e., ICT assets) used to supply them. ICT asset prices are then put undera microscope, and official prices are found to substantially understate ICT price declines.And because ICT capital continues to grow and penetrate the economy—increasingly viacloud services which are not fully accounted for in the standard narrative on ICT’s contri-bution to economic growth—the contribution of ICT to growth in output per hour goingforward is calibrated to be substantially larger than it has been in the past.
Keywords: Cloud services; Information and Communication Technology (ICT); High-performance computing; Productivity, Technology, Price measurement
∗Board of Governors of the Federal Reserve System, Washington, D.C.†The Conference Board and Center for Business and Public Policy, McDonough School, Georgetown University.‡Corresponding author: [email protected]§We thank participants in the World KLEMS conference (Madrid) and in workshops at Kings College (London) and
the Federal Reserve (Washington, D.C.) for feedback on earlier drafts. This paper reflects the sole opinions of the authorsand does not reflect opinions of the Board of Governors of the Federal Reserve System or other members of its staff.

Contents
1 Framework 3
1.1 Expanded two-sector model . . . . . . . . . . . . . . . . . . . . . . . . . . . . . . . . . . 4
1.2 ICT services prices vs. ICT asset prices . . . . . . . . . . . . . . . . . . . . . . . . . . . 7
1.3 Quality change or productive externality? . . . . . . . . . . . . . . . . . . . . . . . . . . 9
2 ICT sector trends 10
2.1 Technology and R&D . . . . . . . . . . . . . . . . . . . . . . . . . . . . . . . . . . . . . 11
2.2 ICT services and software investment . . . . . . . . . . . . . . . . . . . . . . . . . . . . . 15
2.3 Sector final output and capital income . . . . . . . . . . . . . . . . . . . . . . . . . . . . 18
3 ICT investment prices 20
3.1 New ICT product prices . . . . . . . . . . . . . . . . . . . . . . . . . . . . . . . . . . . . 21
3.2 New Software Prices . . . . . . . . . . . . . . . . . . . . . . . . . . . . . . . . . . . . . . 24
3.3 New ICT Investment Prices . . . . . . . . . . . . . . . . . . . . . . . . . . . . . . . . . . 26
3.4 Implications . . . . . . . . . . . . . . . . . . . . . . . . . . . . . . . . . . . . . . . . . . . 27
4 Summary and conclusion 31
Appendix 37
A1 The steady-state solution of the two-sector model 37
A2 Nominal ICT investment deflators 40
i
ICT Prices and ICT Services:
What do they tell us about Productivity and Technology?
The importance of computers, computer microprocessors, and productivity-enhancing computer
software in driving the step up in U.S. productivity growth in the mid-1990s is well established.1 But
the Internet and mobile telephony—two of the 20th century’s greatest inventions—have been largely
absent in the macroeconomic work on U.S productivity performance until recently. Our research on
communications technology and communication equipment price measurement (Byrne and Corrado,
2015a,b) and its implications for interpreting U.S. productivity (Corrado, 2011; Corrado and Jager,
2014) puts these innovations front and center and offers a story in which communication and com-
munication networks (more than computer microprocessors) drove productivity developments in the
1990s and the 2000s. An overarching story of productivity performance for nearly 25 years is all to the
good, but it begs the question of why the recent performance of U.S. productivity has been so dismal,
given that advances in information and communications technology (ICT) have continued to be strong
to this day.
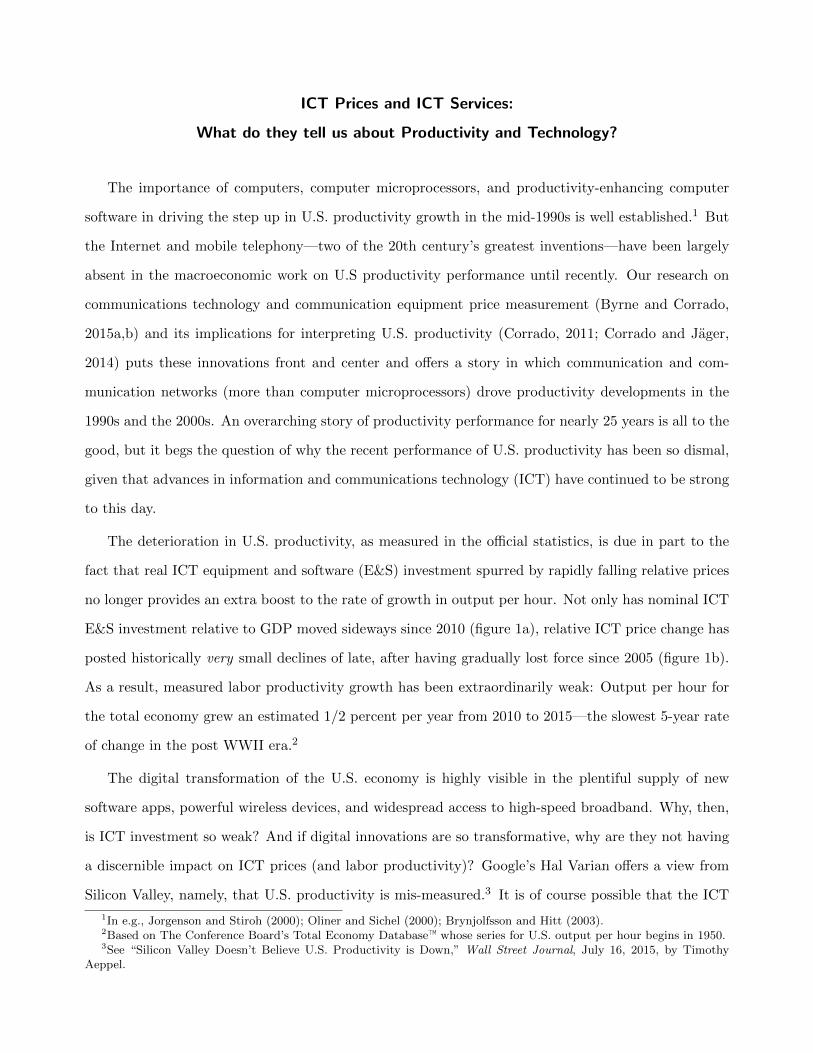
The deterioration in U.S. productivity, as measured in the official statistics, is due in part to the
fact that real ICT equipment and software (E&S) investment spurred by rapidly falling relative prices
no longer provides an extra boost to the rate of growth in output per hour. Not only has nominal ICT
E&S investment relative to GDP moved sideways since 2010 (figure 1a), relative ICT price change has
posted historically very small declines of late, after having gradually lost force since 2005 (figure 1b).
As a result, measured labor productivity growth has been extraordinarily weak: Output per hour for
the total economy grew an estimated 1/2 percent per year from 2010 to 2015—the slowest 5-year rate
of change in the post WWII era.2
The digital transformation of the U.S. economy is highly visible in the plentiful supply of new
software apps, powerful wireless devices, and widespread access to high-speed broadband. Why, then,
is ICT investment so weak? And if digital innovations are so transformative, why are they not having
a discernible impact on ICT prices (and labor productivity)? Google’s Hal Varian offers a view from
Silicon Valley, namely, that U.S. productivity is mis-measured.3 It is of course possible that the ICT
1In e.g., Jorgenson and Stiroh (2000); Oliner and Sichel (2000); Brynjolfsson and Hitt (2003).2Based on The Conference Board’s Total Economy Database™ whose series for U.S. output per hour begins in 1950.3See “Silicon Valley Doesn’t Believe U.S. Productivity is Down,” Wall Street Journal, July 16, 2015, by Timothy
Aeppel.
Figure 1: ICT Equipment and Software Investment and Prices in the United States
(a) Nominal ICT E&S Investment, percent of GDP (b) ICT Relative Price Change, annual rate
Note: Private investment only.Source: Authors’ elaboration of data from U.S. BEA. The investment ratio for 2015 is based on partial yeardata. Nominal ICT investment and ICT price change are measured relative to nominal GDP and the GDPdeflator, respectively, and exclude software R&D.
sector—about 6 percent of the economy in value added terms—is innovating and prospering while the
overall economy continues to suffer from weak demand in the aftermath of the Great Recession and/or
demographic and other headwinds as argued by Gordon (2014a,b). Nevertheless, Varian’s comments
suggest a conundrum, which this paper addresses.
Recent ICT developments are a new era in which mobile and cloud platforms, enabled by high-
speed broadband, are transforming the means organizations use to interact with both customers and
employees. Some prominent technologies in this transformation enable server and storage consolidation
(virtualization) and more efficient development and deployment of apps (containers).4 The standard
narrative used to analyze the diffusion of ICT technology in economies does not capture the uptake
of these technologies, and the activities touched most directly by them are not very evident in official
statistics. To remedy this situation, this paper introduces new ICT asset prices and incorporates ICT
services (i.e., cloud computing and related services) in the modeling and quantitative analysis of the
contribution of ICT to labor productivity growth.
4Virtualization allows users/apps to use the same ICT resources while facing distinct operating environments withouthaving to allocate a fixed amount of physical resources to a user and/or application. The related container technologydoes not require software developers to change the O/S environment when a product is tested or goes “live”.
2
We proceed as follows: First, to understand how a small sector can be a driver of growth in an
economy, we extend a simple two-sector model, originally due to Oulton (2012), to include ICT services.
In the extended model, as in Oulton’s original model, the pace of decline in relative ICT prices is an
indicator of productivity change in the ICT sector relative to the rest of the economy. The extended
model implies, and we further posit via the user cost framework, that price change for marketed ICT
services is proportional to price change for the productive assets used to produce them; thus the model
implies that purchases of certain ICT services are similar to services provided via direct ownership of
ICT capital. Second, the model is used to set out the contribution of ICT technology to total economy
labor productivity growth in the medium- to long-term. This involves documenting the growing role
of ICT services in the United States, the growing intensity of ICT R&D, and assessing the extent to
which official measures of ICT price change are capturing all that is going on.
In our review of ICT price measures, we introduce a new, quality-adjusted price index for commu-
nications equipment investment that draws upon our own prior work on the measurement of telecom-
munications and networking equipment. We also introduce new price indexes for enterprise software
products, high-end computers and computer storage systems, which, along with high-speed broadband,
have made the growth of cloud computing and data analytics possible, i.e., they reflect prices of assets
used to generate these ICT services. All told, our findings suggest that ongoing ICT technological
change potentially contributes as much as 1.4 percentage points per year to labor productivity growth
in the United States and that trends in official ICT prices suffer from substantial mismeasurement,
especially recently, and especially in software, which accounts for more than half of ICT investment.
It should be underscored that the assessment conducted in this paper keeps the scope of GDP as
in official statistics and addresses the measurement of technology via ICT prices included in existing
national accounts. The paper thus bears most directly on interpreting recent trends in ICT investment
and ICT services use by the producing sectors of the economy. Subsequent work (under way) uses the
framework developed in this paper to address the impact of digitization on the consumer sector and
the scope of its measured activity.
1 Framework
ICT plays a central role in modern economies, and quantitative assessments of longer-term economic
growth prospects depend heavily on estimates of the contribution of ICT to productivity change for
3

the years ahead. Oulton (2012) proposed an approach to making long-term growth projections based
on a two-sector model of an open economy where one sector is an ICT-producing/supplying sector. His
approach is in the spirit of the growth accounting approach to making economic projections (Jorgenson,
Ho, and Stiroh, 2004; Jorgenson and Vu, 2010; The Conference Board, 2015), in which one of the key
drivers of economic growth is growth of total factor productivity (TFP) in the ICT-producing sector
relative to the rest of the economy.
Benefits to economic growth accrue to faster relative growth of ICT TFP because faster relative
ICT TFP growth manifests as faster relative ICT price declines, which then enables faster growth of
income and consumption per hour. Oulton’s model makes these features of a Jorgenson-style growth
projection explicit, along with its corollary that economies with little or no domestic ICT production
derive benefits from faster TFP growth in ICT investment goods production elsewhere in the form of
improving terms of trade.
To account for the growth and popularity of cloud services enabled by high-speed broadband,
this paper expands the Oulton model to include intermediate uses of ICT services. The expression
for the steady state contribution of ICT to the growth of OPH in the expanded model is unaffected
by assuming a closed economy, as in the original Oulton model. Proceeding with a closed economy
assumption for simplicity, the expanded model is set out below.
1.1 Expanded two-sector model
Total final demand Y consists of investment (I) and consumption (C) produced in two sectors of the
economy. The two producing sectors are (1) an ICT sector (denoted by the subscript T ) and (2) a
general business sector excluding ICT producers (denoted by the subscript N). Thus we have
Y = C + I = YT + YN ; YT = CT + IT ; YN = CN + IN ;(1)
PY = PTYT + PNYN ; wT =PTYTPY
.(2)
Each sector produces investment and consumer goods and services for final use. With regard to
intermediates, the ICT sector is assumed to supply services for its own intermediate use, as well as for
intermediate use by other producers. The general business sector is assumed to produce intermediates
for its own use only; these intermediates are omitted from its production function to keep the exposition
4
simple.5 With sector N producing for final demand only, and each sector’s output (production net
of own use) denoted by QT and QN , respectively, sectoral production may be written in terms of the
following outputs and inputs
QT ≡ YT + SNT = ATF (KTN ,K
TT , S
TT , L
T ) ;(3)
QN ≡ YN = ANF (KNN ,K
NT , S
NT , L
N )
where Kji denotes sector j’s capital input from its stock of investment goods of type i (i = T,N) and
SjT is sector j’s intermediate use of ICT services. Lj = hHj is sector j’s labor input, Hj is hours
worked in the sector, and h is a labor composition index applicable to the economy as a whole.
The value of each sector’s factor payments is given by
PiQi = RNKiN +RTK
iT +WH i + PTS
iT , i = T,N ,(4)
with relevant factor shares given by
vKT=RT (KT
T +KNT )
PY; vL =
W (HN +HT )
PY; ζ
NT =
PTSNT
PY.(5)
In equation (4), RN and RT are the nominal rental prices of capital and W is the hourly wage, and in
(5), vKTand vL are the shares of ICT capital and labor in total income, respectively, and ζ
NT is ICT
business services purchased by sector N relative to total income in the economy.
The model assumes there is faster technical progress in the ICT sector. Denoting the rate of growth
in the Hicksian shifter (Ai) in the sectoral production functions (3) as µi, this assumption is expressed
as µT > µN . A major simplifying assumption is then employed to solve the model, namely, that the
sectoral production functions exhibit constant returns and differ only by their Ai terms. This implies
factor shares and input quantities are the same in both sectors, in which case log differentiation of the
factor payments equations (4) yields the result shown by Oulton that relative ICT price change equals
(the negative of) relative ICT TFP growth. Defining the relative ICT price as p = PT /PN , this result
5The complications of chain weighting also are ignored.
5

is expressed as a steady-state rate of change in relative prices p given by
p = µN − µT < 0 .(6)
As may be seen, relative ICT price change is negative, reflecting the extent to which the relative growth
of productivity in the ICT sector exceeds the growth of productivity elsewhere in an economy.
The expanded model’s solution for the contribution of ICT to the growth in GDP per hour ( ˙OPH)
is given by
Contribution of ICT sector to ˙OPH =(7)
vKT+ ζ
NT
vL(−p)︸ ︷︷ ︸
Investment (use) and diffusion (productivity) effects
+ wT (−p)︸ ︷︷ ︸Production effect
.
For details of this solution, see appendix A1. Equation (7) differs from the solution to the original
Oulton model due to the presence of the term ζNT capturing the ICT services-using intensity of the
economy. The solution nonetheless aligns with the usual growth accounting approach in which the
contribution of ICT capital to growth in output per hour is identified as flowing through two channels:
ICT use and ICT production. It is typical to consider the ICT use effect as operating through services
provided by producers’ own investment in ICT capital, i.e., via services generated by ICT assets
that producers’ own themselves. In the expanded model, however, the channel also operates via the
contribution of producers’ purchases of ICT services, e.g., purchases of computing, storage, and software
services generated by ICT assets owned by ICT services producers, to total factor productivity.
In steady-state growth, output and output per hour in the N sector grow less rapidly than output
and output per hour in the T sector, the sector producing ICT goods and services. In fact, this growth
differential is −p, a result that follows from equality of the marginal product of factors used in the two
sectors, which follows from the assumption of perfect competition; see appendix A1 for further details.
The model thus implies that, to the extent µT really is greater than µN , real ICT services prices fall
(as they are on par with real ICT asset prices), and real ICT services output growth is faster than
growth of real output of the general production sector, evidence for which shall be shown.
6

1.2 ICT services prices vs. ICT asset prices
The ICT sector’s output price is a single price PT by assumption in a two-sector model. The strictness
of this assumption may be readily relaxed, however, yielding the usual multiple sector framework with
many relative prices and an aggregate production possibilities frontier that generates multiple types of
C and I for final use (e.g., Jorgenson 1966; Jorgenson, Ho, and Stiroh 2005). In what follows, the user
cost expression is used to set out the conditions under which a multiple sector framework generates
essentially the same implication for ICT services prices as did the simple two-sector model.
Consider the determinants of prices for two types of ICT services in a multiple sector setting. The
first is where ICT services production is highly ICT-capital intensive, as in the production of “public”
cloud services by the ICT sector for sale to the nonICT-producing sector. The second is where ICT
services are for designing “private” cloud services facilities within firms in the nonICT producing
sector, e.g., services for transitioning from traditional uses of IT datacenter assets to one based on
virtualization.
In each case, the value of the produced ICT services will be denoted as PSTSNT , where PST is a
quality-adjusted price specific to each type of service. P IT will denote the quality-adjusted price of
ICT assets relevant to each case (i.e., it is an investment price index). These prices are expressed below
as real prices pST , pIT , relative to, say, the PCE or GDP deflator, below. A steady state required real
rate of return on assets ρ is defined consistently (i.e., the price change element is in the same relative
terms).
Case 1. Cloud services prices are per period charges for ICT capital services (i.e., an asset rental
price) and production of such services is highly ICT-capital intensive. Assume then that the services
produced are proportional to the flow of services generated by the ICT assets,
pSTSNT = [(ρ+ δT ) pITKTT ] λ(8)
where the expression in brackets on the RHS is the real rental price of ICT capital and λ is the factor of
proportionality. (Appendix A1 sets out the four real rental prices in the two-sector model, where, note,
δT is the depreciation rate of ICT capital). λ and δT are constant by assumption, and ρ is constant
in steady state growth by definition. Now, if the real price of cloud services pST is falling rapidly in
7
constant quality terms, equation (8) suggests that the driver of that change is falling real prices of ICT
investment goods pIT .
Under what conditions might these prices not be in sync? One possibility is when λ is not constant,
as would be the case in the presence of increasing returns, e.g., if ICT assets were more or less a large
fixed cost that substantially inflated average costs relative to marginal costs (a huge server farm, say).
Increased utilization of the relevant assets leads to declines in average costs, and if such declines are
passed on to customers, declines in pST exceed those for pIT until steady state growth is achieved.6 In
other words, from (8) we then have
pST ≈ pIT + λT(9)
where, note, pST , pIT , and λT are all < 0. λT reflects the drop in underutilization, which augments
declines in cloud services prices relative to declines in prices of ICT assets used by the vendors of cloud
services.7
Case 2. System design services are purchased to improve the flow of ICT services produced within
firms, and the services price is a fee proportional to the services-induced volume improvement in own-
produced ICT services.8 System design services may then be modeled as an increase in the efficiency
of installed ICT asset stocks, an approach relevant to the spread and adoption of cloud technology,
i.e., as in designing and installing a “private” cloud with significant server consolidation.
Note first that the real price of ICT capital services rNT and ICT capital owned within the nonICT
producing sector KNT are the subjects of analysis, and that rNT K
NT = [(ρ+δT ) pITKN
T ] is the real income
attributed to nonICT producers’ deployment of ICT capital. Consider next that producers will pay
for system design services up to the point where fees do not exceed the present discounted value of per
6Note that equation (8) did not suggest or specify that ρ exhausted observed capital income, which is to say thenominal interest rate in ρ is an ex ante rate. As shown by Berndt and Fuss (1986), the marginal product of capital variesdirectly with capital utilization and is absorbed in capital income and attributed to capital rental prices only when expost calculated rates of return are used.
7 To see this, let λT vary with capital utilization, e.g., as in λT = 1− d where d is a measure of the underutilization ofICT assets (and can be calculated so as to exhaust capital income). Equation (8) then suggests that improvements in theutilization of ICT capital assets in the public cloud services-producing industry introduce a wedge λT between changesin observed prices for cloud services and prices for ICT assets. Such wedges presumably surface for only periods of time,as changes in utilization usually are a temporary phenomenon.
8Note that in the very different case of ICT installation services, the price is simply a margin, i.e., an add-on to thepurchase price of ICT assets that has no independent impact on the effectiveness of the investment beyond what is builtinto a quality-adjusted investment price index.
8
period benefits provided. Let α denote the proportional fee and −λN the proportional improvement
in rNT that is provided.9 Ignoring discounting, the effective decline in real ICT asset prices faced by
nonICT producers using system design services peIT is given by
peIT = pIT + λN (1 − α)(10)
and industry revenues are expressed as
pSTSNT = α rNT KNT (−λN ) .(11)
Equation (10) suggests that ICT capital packs an extra punch to nonICT producers’ productivity, as
the effective growth in real services will exceed real growth in stocks due to increases in utilization
of the stocks. Equation (11) suggests that ICT services will grow relative to ICT capital income
when substantial improvements are being made by providers (and the improvements they make are
long-lived, not shown).
All told, the λ’s represent efficiencies enjoyed by companies that move from a traditional IT dat-
acenter to a public or private cloud computing platform; for new firms, efficiencies represent lower
capital required to start a business. Combined, these efficiencies have the potential to be large because
cloud computing refers not only to shifts in workload location (from on-premises environments to the
public cloud) but also to increased take up of many IT technologies—server virtualization, containers,
and grid computing—all of which result in much denser workload-to-IT capital ratios.
1.3 Quality change or productive externality?
From a macroeconomic point of view, increased demand for cloud computing leads to decreased de-
mand for computing hardware (for a given volume of ICT services) and increased demand for the
software developers and software products that enable machine virtualization and application con-
tainerization. Over time, the associated extra kick in effective ICT price declines implied by equation
10 would lead to greater computerization/digitization of an economy, which would then translate into
a restoration of the share of computer hardware in the mix of ICT investment in the longer run. With
regard to communication equipment, although high-speed broadband is a fundamental enabler of cloud
services, virtualization and its associated efficiencies do not have first order impacts on the demand
for communication equipment beyond the fundamental need to support datacenter IP traffic.
9Where, as in footnote 7, there is an implicit term d capturing underutilization reflects the potential for improvement.
9

Before we go further, let us underscore that the server, storage, software product and computing
services prices developed and used in section 3 of this paper do not treat the application workload of IT
capital, or the capability of software products or systems design services to enable cloud computing,
as quality change. The macroeconomic impact of the adoption of cloud technology rather is via
its contribution to productivity growth, much as is done when analyzing network externalities (or
spillovers to ICT capital in general).10 Cost savings due to virtualization, whether via direct purchases
of cloud services or via lower user costs of IT capital in the nonICT-producing sector, thus are viewed
as productive externalities, not part of the contribution of ICT capital to growth in output per hour.
While this position may have parallels to treating the productivity enhancing impacts of Internet-
platform business models as a (network) externality, virtualization as a computing technology is similar
to multiplexing in communication where more and more signals are transmitted over physical networks
(or spectrum), and where, to the extent possible, increases in capacity are built into quality-adjusted
price indexes such as those developed for communications equipment in Byrne and Corrado (2015a,b).
Comparable work on prices of servers, storage, software products, and systems design services to
consistently account for virtualization and other aspects of cloud technologies is a related challenge,
but one well beyond the scope of this paper.
2 ICT sector trends
This section reviews indicators that support the model of the previous section. This requires (a)
defining the ICT sector, which is done in in columns 1 and 2 of table 1 below, (b) examining indicators
that suggest ICT technology continues to increase at a relatively fast pace, (c) pinning down the relative
growth of ICT services (which also bears on the diffusion of cloud technologies), and (d) examining
the relative pattern of ICT investment by major component.
The section concludes with an explicit quantification of the model’s parameters reflecting the rel-
ative size of the ICT sector and the diffusion of its technology in the economy, namely, wT , vKT, and
ζNT . Relative ICT asset price change is presented in section 3, and quantitative implications of the
model are drawn there.10In this work, a separate channel is added to decompositions such as equation (7) to account for the contribution of
ICT to productivity growth beyond the direct capital contributions captured in growth accounting. For example, Corrado(2011) and Corrado and Jager (2014) showed that network externalities were a noteworthy contributor to productivitygrowth in the United States and 8 major European countries during the Internet and wireless network expansion in thefirst half of the 2000s. Beyond broadband, however, spillovers to ICT have not been found in macro or industry-level data(Stiroh, 2002), despite a large micro-based literature suggesting externalities to IT use by individual firms. See Corradoand van Ark (2016) for further discussion.
10

Table 1: ICT-producing Industries
NAICS 2007 Primary BEA industrycode Description Use data code
(1) (2) (3) (4)
Manufacturing:3341, 3344 Computers and semiconductors Final and 334 (pt)
Intermediate3342, 3343, 334511 Communication equipment Final 334 (pt)3346 Magnetic and optical recording media Final 334 (pt)
Services:5112 Software publishing Final 511 (pt)515 Broadcasting Final 513 (pt)517 (pt) Telecommunications, excluding wireline Final and 513 (pt)
telephony (but including internet access) Intermediate5182 Data processing, hosting, and related Intermediate 514 (pt)51913 Internet publishing and broadcasting Intermediate 514 (pt)
and web search portals541511 Custom computer programming Final 5415541512 (pt) Computer systems design (integrators) Final and 5415
Intermediate541512 (pt) Computer systems design (consultants) Intermediate 5415541513,9 Other computer related services Intermediate 5415
Note: (pt) after an industry codes denotes that not all of the industry consists of ICT production.
2.1 Technology and R&D
Internet and wireless technologies. Faster relative growth of TFP in ICT production is usually
attributed to the relatively rapid pace of advances in computing and semiconductor technology, es-
pecially in the speed of microprocessors (MPUs) used in personal computers (Jorgenson, 2001)—and,
according to many accounts, such advances stepped down a notch in the first half-decade of the 2000s
(Hilbert and Lopez, 2011; Pillai, 2011, 2013). By contrast, advances in communications technology,
i.e., internet and wireless technologies, continue to be rapid (Byrne and Corrado, 2015a,b).
Internet and wireless technologies are not single identifiable inventions, but rather a suite of com-
munications technologies, protocols, and standards for networking computers and mobile devices.11
Advances in these technologies have been very rapid in the past 25 years and continue at blistering
rates to this day. Without continued increases in internet technology and capacity from 2010 to 2015,
11This paraphrases (Greenstein, 2000, p. 391), who was describing internet technology.
11

Figure 2: Global IP Traffic and U.S. Telecommunications Patents
(a) Global IP Traffic, 1993 to 2019 (incl. forecast). (b) U.S. Wireless-related Telecom Patents, 1993 to 2014
the world could not have achieved the reported 29 percent per year increase in IP traffic and nearly
78 percent per year increase in wireless data traffic that it did during this period (figure 2, left panel).12
All told, the internet markets of the G-20 are projected to reach $4.2 trillion in 2016—nearly double
the size they were in 2010. Three out of four data center workloads are expected to be processed in
the cloud by 2018, and IoT devices attached to the Internet—most of them wirelessly—are expected
to increase more than 25 fold, from nearly 1 billion units in 2010 to 26 billion units by 2020 (IoT
devices exclude PCs, tablets and smartphones).13 These estimates plus a continuation of the demand
for mobility and hotspots cannot be realized without continued, rapid increases in communications
capacity, especially wireless capacity. The panel on the right of figure 2 shows that by one measure
(the rate at which wireless-related telecommunications patents are filed in the United States), the
current pace of change in communications technology is as brisk as it was in the late 1990s.
Cloud technologies. The virtualization technology that is the primary enabler of cloud computing has
been in commercial use since the 1970s via IBM mainframes, but cloud vendors have made increasing
12The calculations are based on the historical data and 2015 estimate reported in issues of Cisco’s Visual NetworkingIndex and Global Mobile Data Forecast Update.
13The sources for these forecasts are Boston Consulting Group (http://www.marketwired.com/press-release/g-20s-internet-economy-is-set-reach-42-trillion-2016-up-from-23-trillion-2010-as-nearly-1611718.htm),Gartner (http://www.gartner.com/newsroom/id/2636073), and Cisco’s Global Cloud Index (2013-2018)(http://www.cisco.com/c/en/us/solutions/service-provider/global-cloud-index-gci/index.html).
12
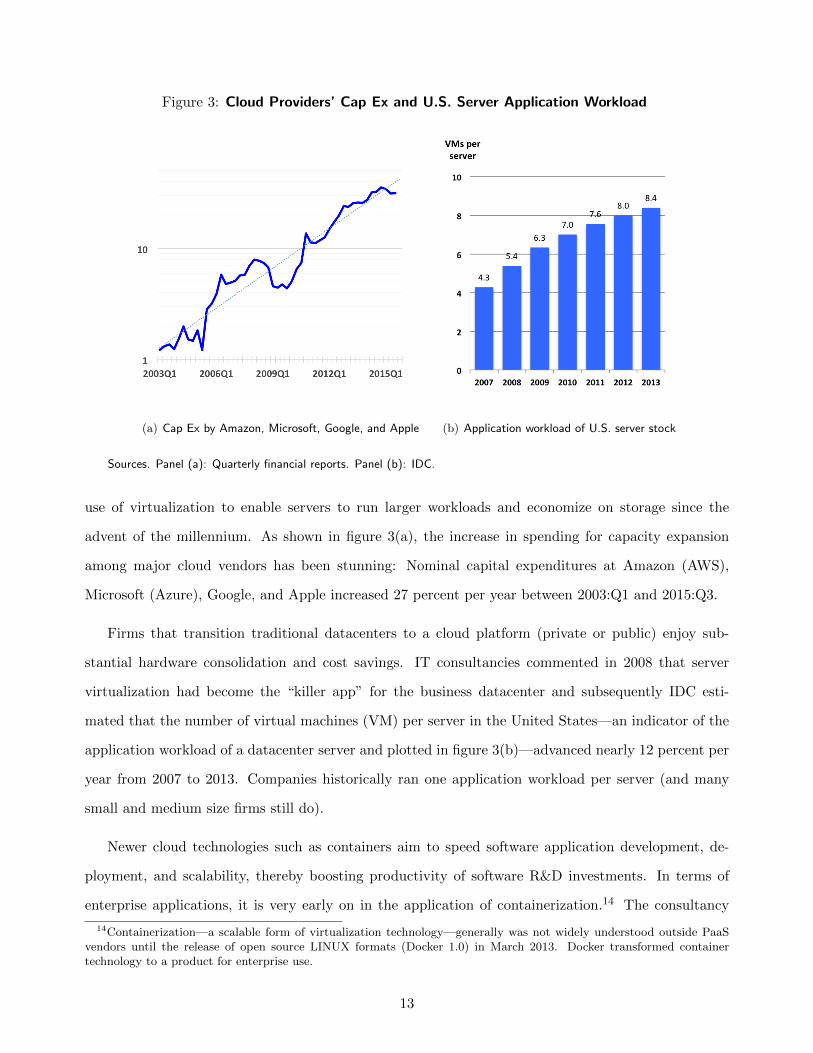
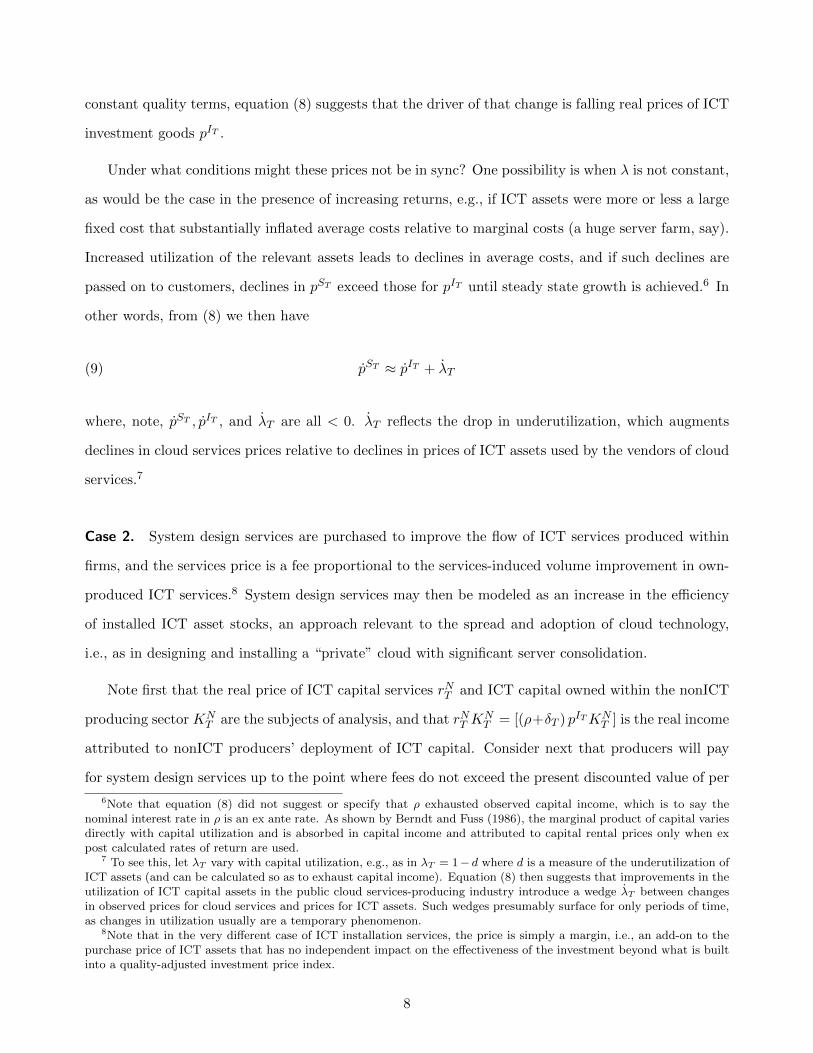
Figure 3: Cloud Providers’ Cap Ex and U.S. Server Application Workload
(a) Cap Ex by Amazon, Microsoft, Google, and Apple (b) Application workload of U.S. server stock
Sources. Panel (a): Quarterly financial reports. Panel (b): IDC.
use of virtualization to enable servers to run larger workloads and economize on storage since the
advent of the millennium. As shown in figure 3(a), the increase in spending for capacity expansion
among major cloud vendors has been stunning: Nominal capital expenditures at Amazon (AWS),
Microsoft (Azure), Google, and Apple increased 27 percent per year between 2003:Q1 and 2015:Q3.
Firms that transition traditional datacenters to a cloud platform (private or public) enjoy sub-
stantial hardware consolidation and cost savings. IT consultancies commented in 2008 that server
virtualization had become the “killer app” for the business datacenter and subsequently IDC esti-
mated that the number of virtual machines (VM) per server in the United States—an indicator of the
application workload of a datacenter server and plotted in figure 3(b)—advanced nearly 12 percent per
year from 2007 to 2013. Companies historically ran one application workload per server (and many
small and medium size firms still do).
Newer cloud technologies such as containers aim to speed software application development, de-
ployment, and scalability, thereby boosting productivity of software R&D investments. In terms of
enterprise applications, it is very early on in the application of containerization.14 The consultancy
14Containerization—a scalable form of virtualization technology—generally was not widely understood outside PaaSvendors until the release of open source LINUX formats (Docker 1.0) in March 2013. Docker transformed containertechnology to a product for enterprise use.
13
IDC estimates that only 1 percent of enterprise applications are running on containers that can readily
be scaled.
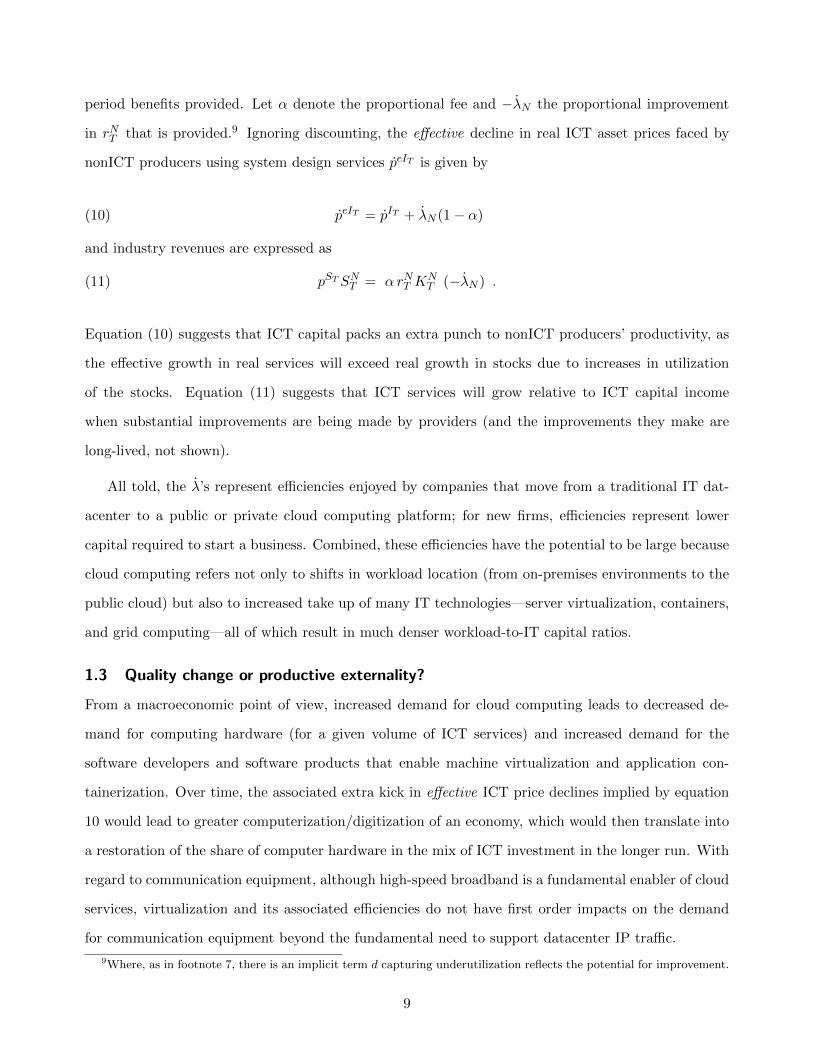
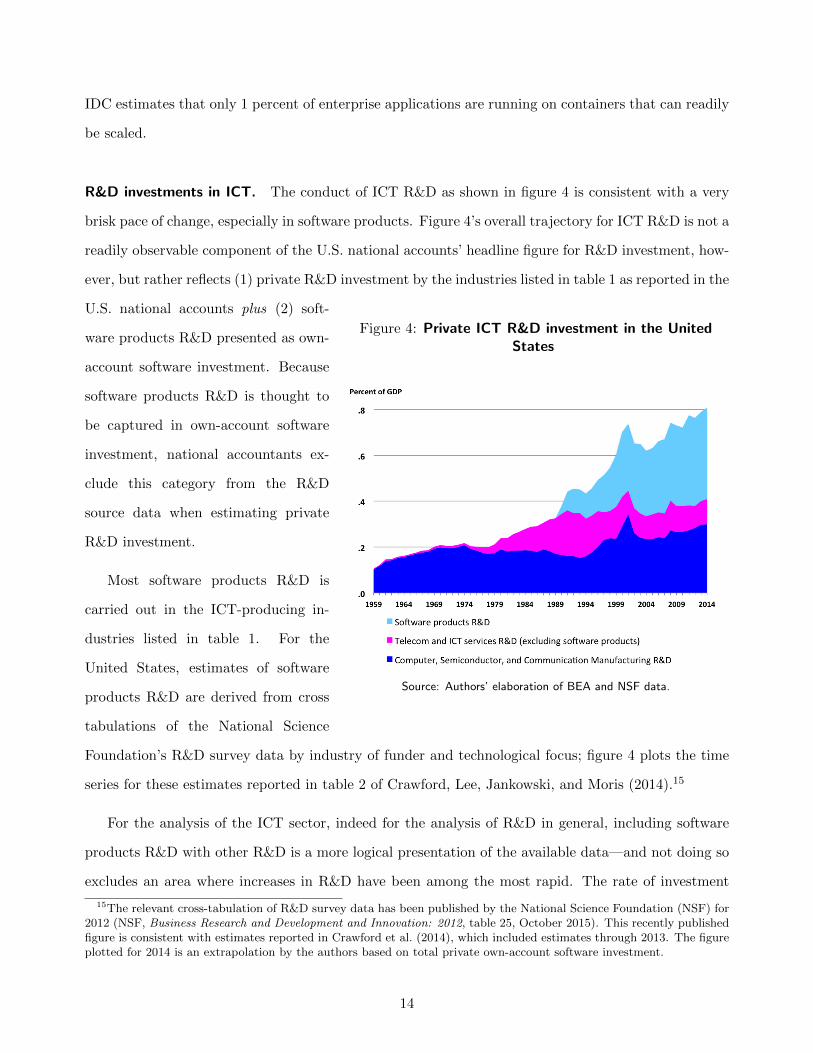
R&D investments in ICT. The conduct of ICT R&D as shown in figure 4 is consistent with a very
brisk pace of change, especially in software products. Figure 4’s overall trajectory for ICT R&D is not a
readily observable component of the U.S. national accounts’ headline figure for R&D investment, how-
ever, but rather reflects (1) private R&D investment by the industries listed in table 1 as reported in the
Figure 4: Private ICT R&D investment in the UnitedStates
Source: Authors’ elaboration of BEA and NSF data.
U.S. national accounts plus (2) soft-
ware products R&D presented as own-
account software investment. Because
software products R&D is thought to
be captured in own-account software
investment, national accountants ex-
clude this category from the R&D
source data when estimating private
R&D investment.
Most software products R&D is
carried out in the ICT-producing in-
dustries listed in table 1. For the
United States, estimates of software
products R&D are derived from cross
tabulations of the National Science
Foundation’s R&D survey data by industry of funder and technological focus; figure 4 plots the time
series for these estimates reported in table 2 of Crawford, Lee, Jankowski, and Moris (2014).15
For the analysis of the ICT sector, indeed for the analysis of R&D in general, including software
products R&D with other R&D is a more logical presentation of the available data—and not doing so
excludes an area where increases in R&D have been among the most rapid. The rate of investment
15The relevant cross-tabulation of R&D survey data has been published by the National Science Foundation (NSF) for2012 (NSF, Business Research and Development and Innovation: 2012, table 25, October 2015). This recently publishedfigure is consistent with estimates reported in Crawford et al. (2014), which included estimates through 2013. The figureplotted for 2014 is an extrapolation by the authors based on total private own-account software investment.
14

in ICT R&D in recent years continues unabated in this presentation, suggesting that ICT innovation
could not have slowed for lack of investment in the development of new ICT technologies and products.
2.2 ICT services and software investment
Intermediate uses of ICT. ICT R&D historically has been oriented toward producing better and
faster computers and more powerful productivity-enhancing computer software (installed locally) for
businesses and other organizations (i.e., investment goods). But with the locus of ICT R&D having
shifted toward software apps and services enabled by high-speed communication and high performance
computing systems, one should not be surprised to see an associated shift in ICT spending, too.
Figure 5: Intermediate Uses of Information and Computer Services, percent of GDP
(a) Data processing and related services (b) Computer systems design
Note. Estimates are net of own sector, i.e, ICT-producing sector, use; see table 1 for industries comprisingthe ICT-producing sector. Figures are through 2014.Source: Authors’ elaboration of data from U.S. BEA.
Private demand for data processing, hosting, and related information services (NAICS 5182, 51913)
and for computer systems design services and related computer services (NAICS 54152,3,9) rose sharply
relative to GDP in the United States in recent years (the solid blue shaded areas of the left and right
panels of figure 5, respectively). These developments reflect the both the growth of cloud services
(which are in NAICS 5182 and has seen steady growth) and a remarkable surge in systems design
services that likely also owes to the demand for cloud-based IT systems to the extent that systems
design services are co-investments with the demand for cloud computing.16 All told, the analysis in
16 To be clear, spending on computer systems design is not counted as investment in national accounts but would beincluded in expanded frameworks that recognize a portion of professional consulting expenditures as long-lived investment
15

section 1 suggested that the relative growth of ICT services industries would be strong if there were
real gains to reconfiguring IT departments to capture cost savings due to cloud technologies. The
prospective cost savings, along with a growing demand for data analytics and revenue momentum of
the “subscription” business model that has been widely used to deliver ICT services, all underscore
that the relative growth of ICT services since 2000 is unsurprising.17
Figure 6: Intermediate and Final Uses (PCE) of Telecommunications andBroadcasting Services, percent of GDP
(a) Intermediate Telecom Use (b) Final Telecom and Broadcasting Use (PCE)
Note. Estimates are net of own sector, i.e., ICT-producing sector, use; see table 1 for industries comprisingthe ICT-producing sector. Broadcasting is in the right panel only because intermediate uses of the output ofthis industry are essentially nil. Figures are through 2014.Source: Authors’ elaboration of data from U.S. BEA.
Trends in intermediate and final uses of telecommunications and broadcasting services are shown
in figure 6. Traditional wireline telephone services ideally would be excluded from this analysis, but a
split of traditional vs. IP telephony and internet access services in data on intermediate purchases by
industry is not available. As may be seen in panel (a), business demand for wireless services is robust,
especially from 2010 on, whereas total private telecommunications services (which adds in wireline
telecom and internet access services) has moved down since peaking in 2000. By contrast as shown
(e.g., as in Corrado, Hulten, and Sichel 2005, 2009). About 35 percent of the intermediate uses of NAICS 5415 areestimated to be long-lived computer design services, but note, this was not a component of the intangible investmentestimates developed in Corrado et al. (2005, 2009) and maintained in the INTAN-Invest internationally comparabledatabase covering 22 EU countries and the United States (Corrado, Haskel, Jona-Lasinio, and Iommi, 2012, 2013).
17For further discussion of the role of business models in ICT services provision, see OECD (2014), chapter 4, “TheDigital Economy, New Business Models and Key Features.”
16
in panel (b), consumer total telecom demand has not declined since 2000 but the relative pattern of
consumer total telecom versus consumer wireless demand is similar to private industry. A breakdown
of landline telephone and internet access services is available for consumers, and the detail shows, as
expected, that wireline telephone services are a sharply declining component of total consumer NAICS
515,7 services spending whereas internet access is a growing component.
All told, information, computer, and wireless communication services supplied to private industries
net of the ICT-producing sector’s own use has increased .06 percentage points per year relative to
nominal GDP during the past 19 years, i.e., the ratio of such services to GDP rose from .7 percent
in 1995 to 1.9 percent in 2014. To put this in perspective, consider again figure 1(a). This increase
ICT business services use by other private producers is in fact a tad larger than the long-term increase
in private spending on ICT investment goods (relative to GDP), i.e., the coefficient on time in the
regression trend line plotted in figure 1(a) is .05.
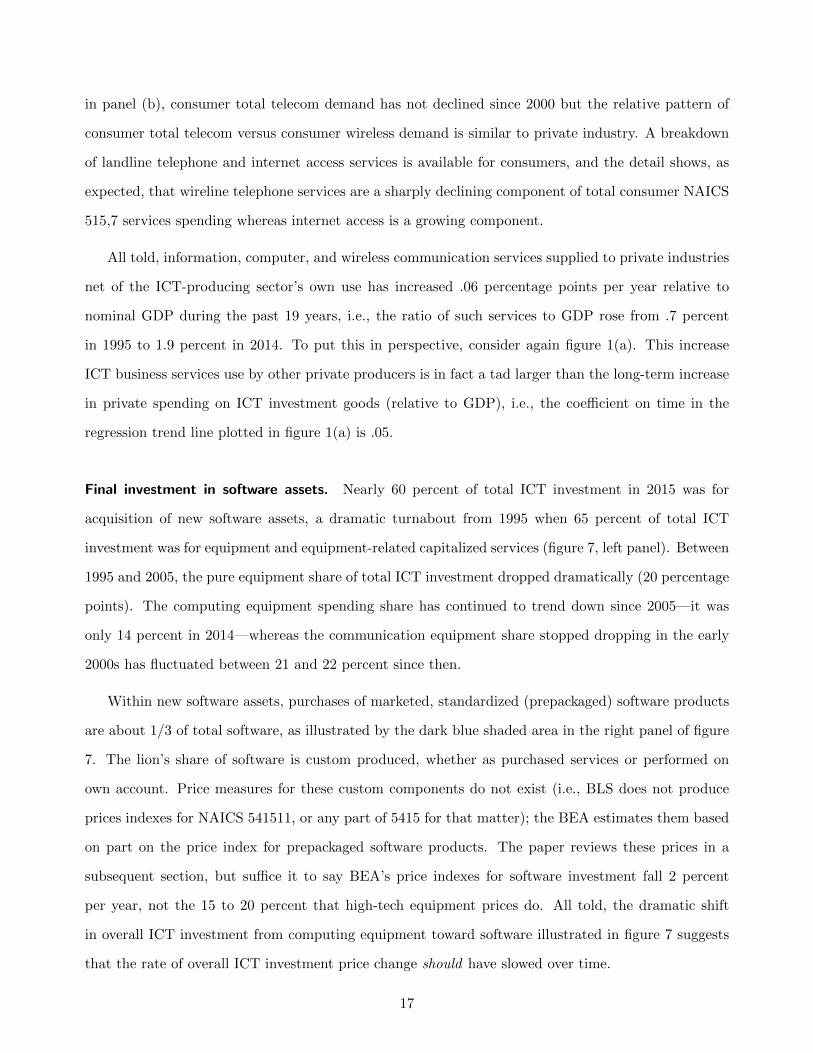
Final investment in software assets. Nearly 60 percent of total ICT investment in 2015 was for
acquisition of new software assets, a dramatic turnabout from 1995 when 65 percent of total ICT
investment was for equipment and equipment-related capitalized services (figure 7, left panel). Between
1995 and 2005, the pure equipment share of total ICT investment dropped dramatically (20 percentage
points). The computing equipment spending share has continued to trend down since 2005—it was
only 14 percent in 2014—whereas the communication equipment share stopped dropping in the early
2000s has fluctuated between 21 and 22 percent since then.
Within new software assets, purchases of marketed, standardized (prepackaged) software products
are about 1/3 of total software, as illustrated by the dark blue shaded area in the right panel of figure
7. The lion’s share of software is custom produced, whether as purchased services or performed on
own account. Price measures for these custom components do not exist (i.e., BLS does not produce
prices indexes for NAICS 541511, or any part of 5415 for that matter); the BEA estimates them based
on part on the price index for prepackaged software products. The paper reviews these prices in a
subsequent section, but suffice it to say BEA’s price indexes for software investment fall 2 percent
per year, not the 15 to 20 percent that high-tech equipment prices do. All told, the dramatic shift
in overall ICT investment from computing equipment toward software illustrated in figure 7 suggests
that the rate of overall ICT investment price change should have slowed over time.
17
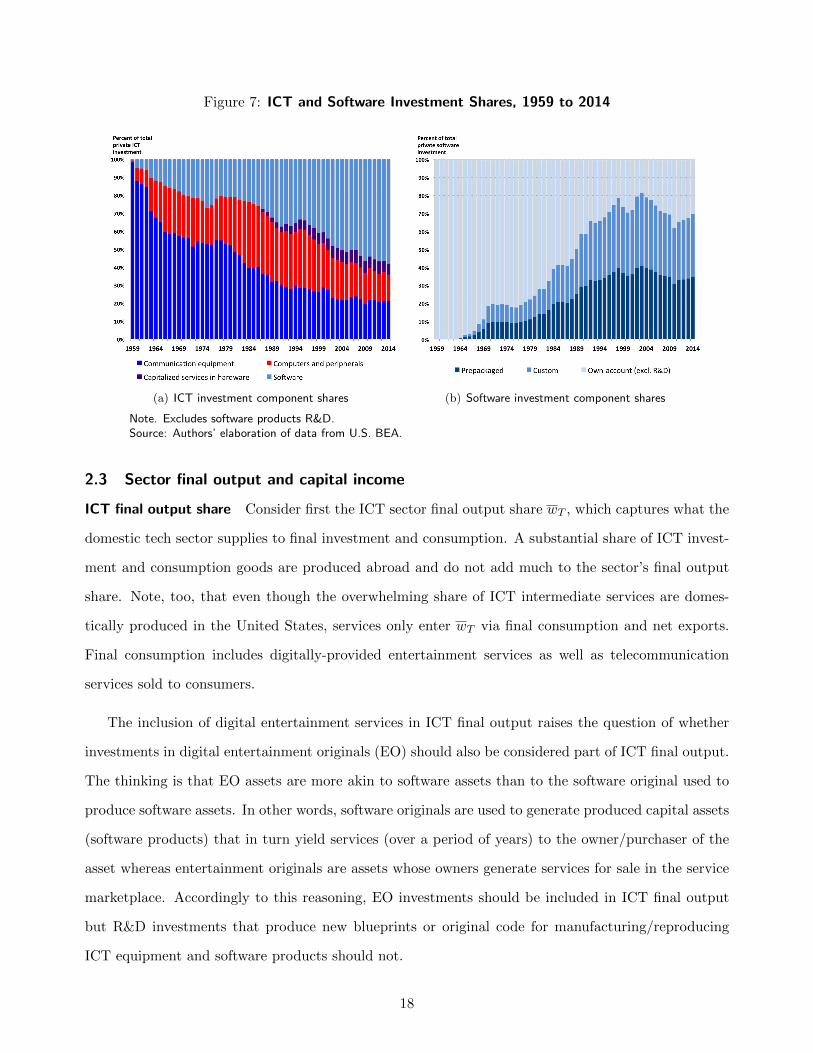
Figure 7: ICT and Software Investment Shares, 1959 to 2014
(a) ICT investment component shares (b) Software investment component shares
Note. Excludes software products R&D.Source: Authors’ elaboration of data from U.S. BEA.
2.3 Sector final output and capital income
ICT final output share Consider first the ICT sector final output share wT , which captures what the
domestic tech sector supplies to final investment and consumption. A substantial share of ICT invest-
ment and consumption goods are produced abroad and do not add much to the sector’s final output
share. Note, too, that even though the overwhelming share of ICT intermediate services are domes-
tically produced in the United States, services only enter wT via final consumption and net exports.
Final consumption includes digitally-provided entertainment services as well as telecommunication
services sold to consumers.
The inclusion of digital entertainment services in ICT final output raises the question of whether
investments in digital entertainment originals (EO) should also be considered part of ICT final output.
The thinking is that EO assets are more akin to software assets than to the software original used to
produce software assets. In other words, software originals are used to generate produced capital assets
(software products) that in turn yield services (over a period of years) to the owner/purchaser of the
asset whereas entertainment originals are assets whose owners generate services for sale in the service
marketplace. Accordingly to this reasoning, EO investments should be included in ICT final output
but R&D investments that produce new blueprints or original code for manufacturing/reproducing
ICT equipment and software products should not.
18

Figure 8: ICT Final Output Share
Note: E&S is equipment and software. PFI = private fixed investment.PFI ICT E&S excludes software R&D. PCE ICT components include videoand cellular equipment and exclude landline telecommunications.Source: Authors’ elaboration of BEA’s NIPA data.
The ICT final output share wT and
its major components are shown in fig-
ure 8. As may be seen, the share
trended down in the early 2000s, but
has been about flat at 5.6 percent of
GDP for the past ten years (2004 to
2014). Its ICT goods net exports com-
ponent has been stable of late, while
ICT final services (PCE and net ex-
ports) has expanded to offset the down-
ward drift in ICT final goods (PCE
and PFI E&S, the dark and light blue
shaded areas). Note that if ICT final
PCE services and EO capital were not
included in the analysis, the ICT final
output share would average 2.6 percent
per year from 2004 to 2014—just a tad higher than the final output share of software over the same
period (2.4 percent per year according to NIPA table 9.3U).
ICT income and services shares Consider now the shares defined in equation (5): ICT and EO
capital’s share of total income (vKT), labor’ share (vL), and ICT services share net of sector own use
(ζNT ). Consistent with the pattern shown by the ICT investment rate, the share of capital income
earned by ICT (and EO) capital has edged down since the mid-2000s, after having climbed steadily
over the 1990s (the blue shaded area in the right panel of figure 9).
Capital income is the nominal value of the flow of services provided by capital assets owned and
used in production, and it is typical to regard vKTas a basic indicator of the extent to which ICT has
diffused via use in production in an economy. ICT business services also are inputs to production but
may be marketed versions of the same services provided via direct ownership of ICT capital. As may be
seen, the trajectory of the total income generated by the use of ICT capital assets in the U.S. economy
changes rather dramatically with the inclusion of marketed services, suggesting that vKT, alone, is an
19
Figure 9: ICT capital income and services shares
Source: Authors’ elaboration of capital and labor income data from U.S. BLS productivity major sector andtotal economy systems and U.S. BEA input-output data. BLS capital income for software was adjusted toexclude software products R&D.
insufficient indicator of ICT use in production. The left panel plots the capital income share relative
to the labor share (a ratio of the compensations for ICT capital and labor). This combination of
parameters is applied to the ICT productivity differential captured by the steady state rate of decline
in real ICT asset prices (or effective asset prices) to determine the contribution of the ICT “use and
diffusion” effect to OPH growth. The parameter combination averages 11.3 percent for the past 10
years, considerably higher than the 7.7 percent share implied by ICT capital ownership alone.18
3 ICT investment prices
Relative ICT investment prices are used to evaluate the model’s implication for ICT’s contribution
to productivity growth. In this section, we first examine price change for selected ICT products, in
part to confirm the basic trends in technology and R&D discussed in the previous section, but also to
examine nuances and developments revealed by the newly developed price statistics themselves. The
strategy is to present results of new price research and contrast those results with official statistics.
18Consider further that national accounts do not capitalize consumer investments in durable goods and that capital-ization requires that the implicit services provided by consumers’ ownership of ICT assets be included in GDP and totalincome. An extension of the national accounts (not the model) is thus required to analyze the consumer sector in thesame fashion used here to analyze the producer sector; moreover, the model has the same implications for consumer ICTservices prices as it does for intermediate ICT services. Note further that the outstanding consumer-owned stocks arerather consequential (or at least as consequential as producer stocks, as suggested by the relative size of the light bluePCE E&S share in figure 8), suggesting that imputed PCE ICT services likewise are consequential. The calibration ofthe contribution of consumer ICT services to augmented GDP growth and productivity is is reported in a follow on,forthcoming paper.
20
Second, the new ICT product price indexes are used to build a new research price index for ICT
assets. This index is then used to ascertain (a) the most likely contribution of ICT to growth in output
per hour in balanced growth and (b) the impact of ICT investment price mismeasurement on recent
macro-productivity growth statistics for the United States.
The new price results presented in this section reflects work that (a) was conducted by the authors
as part of writing this paper or (b) appears in the literature but has not been incorporated into BEA’s
official ICT price statistics, e.g., Berndt and Rappaport (2003); Abel, Berndt, and White (2007);
Copeland (2013); Byrne and Corrado (2015a). Further information and details may be found in a
separate, supplemental paper available here.
3.1 New ICT product prices
Table 2 reports prices for selected ICT products. More than a dozen new research price indexes are
shown. Four are price indexes for the telecom products newly developed and analyzed in Byrne and
Corrado (2015a,b); the computer storage device index was introduced in Byrne (2015). The remainder
are price indexes newly developed for this paper and whose construction is discussed detailed in the
supplemental paper. Of these, the indexes for servers, enterprise software, enterprise wireline telecom
services, along with telecom products, are notable in that their results are particularly relevant to
understanding developments in the last decade.
Key features of the new price indexes for software and telecom services are presented below shortly.
With regard to servers, the new price index extends BEA’s index from 1996 on based on the BLS
PPI and unit prices from IDC and Gartner adjusted by performance scores from System Performance
Evaluation Corporation (SPEC) and Hilbert and Lopez (2011).19 Price/performance trends of IBM
mainframes show a trend similar to the new server index, as discussed in the supplemental paper.
Regarding table 2, the following observations emerge: First, prices for telecom equipment products
(lines 1 to 4) fall relatively rapidly—between 12 and about 18 percent per year during the last decade
(column 2). Although these are noteworthy rates of decline—especially for cellular networking equip-
ment, the red circled item in column 2—they are slower than price declines estimated for computing
equipment (lines 5 to 7). Second, computer price declines have slowed in the past decade and the gap
between rates of decline for computers and communications equipment has dwindled from about 20 to
19The new PC price index was constructed in a similar fashion. Results for laptops and desktops from Berndt andRappaport (2003) from 1983 to 2002 are combined and extended by the BLS PPI adjusted for the contribution ofperformance (relative to clockspeed) based on results from Byrne, Oliner, and Sichel (2015).
21
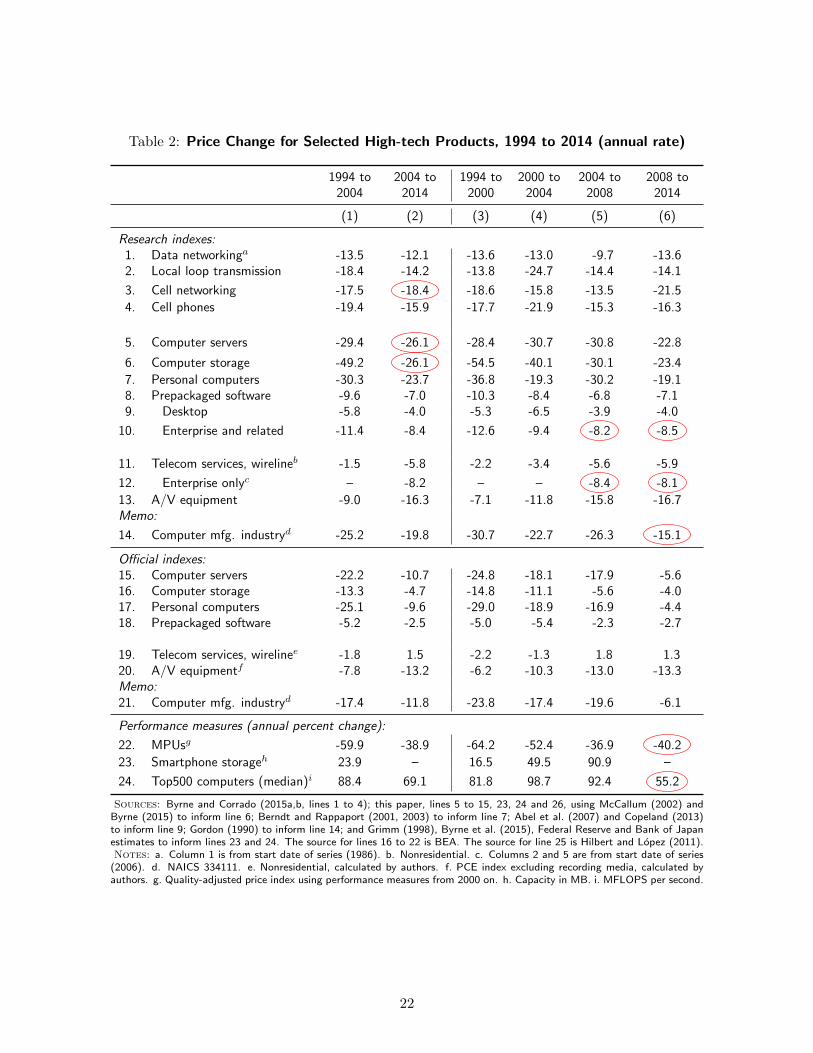
Table 2: Price Change for Selected High-tech Products, 1994 to 2014 (annual rate)
1994 to 2004 to 1994 to 2000 to 2004 to 2008 to2004 2014 2000 2004 2008 2014
(1) (2) (3) (4) (5) (6)
Research indexes:1. Data networkinga -13.5 -12.1 -13.6 -13.0 -9.7 -13.62. Local loop transmission -18.4 -14.2 -13.8 -24.7 -14.4 -14.1
3. Cell networking -17.5 -18.4 -18.6 -15.8 -13.5 -21.5
4. Cell phones -19.4 -15.9 -17.7 -21.9 -15.3 -16.3
5. Computer servers -29.4 -26.1 -28.4 -30.7 -30.8 -22.8
6. Computer storage -49.2 -26.1 -54.5 -40.1 -30.1 -23.4
7. Personal computers -30.3 -23.7 -36.8 -19.3 -30.2 -19.18. Prepackaged software -9.6 -7.0 -10.3 -8.4 -6.8 -7.19. Desktop -5.8 -4.0 -5.3 -6.5 -3.9 -4.0
10. Enterprise and related -11.4 -8.4 -12.6 -9.4 -8.2 -8.5
11. Telecom services, wirelineb -1.5 -5.8 -2.2 -3.4 -5.6 -5.9
12. Enterprise onlyc – -8.2 – – -8.4 -8.1
13. A/V equipment -9.0 -16.3 -7.1 -11.8 -15.8 -16.7Memo:
14. Computer mfg. industryd -25.2 -19.8 -30.7 -22.7 -26.3 -15.1
Official indexes:15. Computer servers -22.2 -10.7 -24.8 -18.1 -17.9 -5.616. Computer storage -13.3 -4.7 -14.8 -11.1 -5.6 -4.017. Personal computers -25.1 -9.6 -29.0 -18.9 -16.9 -4.418. Prepackaged software -5.2 -2.5 -5.0 -5.4 -2.3 -2.7
19. Telecom services, wirelinee -1.8 1.5 -2.2 -1.3 1.8 1.320. A/V equipmentf -7.8 -13.2 -6.2 -10.3 -13.0 -13.3Memo:21. Computer mfg. industryd -17.4 -11.8 -23.8 -17.4 -19.6 -6.1
Performance measures (annual percent change):
22. MPUsg -59.9 -38.9 -64.2 -52.4 -36.9 -40.2
23. Smartphone storageh 23.9 – 16.5 49.5 90.9 –
24. Top500 computers (median)i 88.4 69.1 81.8 98.7 92.4 55.2
Sources: Byrne and Corrado (2015a,b, lines 1 to 4); this paper, lines 5 to 15, 23, 24 and 26, using McCallum (2002) andByrne (2015) to inform line 6; Berndt and Rappaport (2001, 2003) to inform line 7; Abel et al. (2007) and Copeland (2013)to inform line 9; Gordon (1990) to inform line 14; and Grimm (1998), Byrne et al. (2015), Federal Reserve and Bank of Japanestimates to inform lines 23 and 24. The source for lines 16 to 22 is BEA. The source for line 25 is Hilbert and Lopez (2011).Notes: a. Column 1 is from start date of series (1986). b. Nonresidential. c. Columns 2 and 5 are from start date of series
(2006). d. NAICS 334111. e. Nonresidential, calculated by authors. f. PCE index excluding recording media, calculated byauthors. g. Quality-adjusted price index using performance measures from 2000 on. h. Capacity in MB. i. MFLOPS per second.
22
10 percentage points. Third, the greatest computer declines, and the greatest gap, occurs in the 1994
to 2000 period, when MPU prices were falling especially fast (line 23). The post-2004 slowddown in
MPU prices is not evident in servers (line 5) and PCs (line 7) until the 2008-2014 period, however.
Prices for storage equipment—a product based on a magnetic density, not semiconductors—also slow
during the same period. Finally, and by contrast, prices for enterprise and other software products
(which includes systems software as well as application software) maintain relatively strong declines
through the most recent period (the red circled items in line 10).
More broadly, when we think of digitization and connectivity of the economy, and specifically of
enablers of growth in cloud computing and other online services, computing capacity and data/content
storage capacity emerge as important factors (along with broadband capacity, discussed previously).
Declines in the research price indexes for servers and storage shown in the table 2 (the red circled
items in column 2, lines 5 and 6) are fairly close to the rate of decline in cloud services prices implied
in press reports—about 30 percent per year.20 From equation (9), prices for cloud computing and
storage services cannot plausibly be falling so rapidly unless prices of the large-scale equipment and
software assets that enable the provision of these services—load-balancing routers, multiple servers,
and storage systems for handling data for multiple sessions across servers, etc.—are falling rapidly too,
as we find. By contrast, official ICT price measures (lines 15 and 16, column 2) suggest a gap of 20 to
25 percentage points between price change for ICT equipment and ICT cloud computing and storage
services.
Consider further prices of telecom and internet access services in light of the analysis in section 1.
Imperfect competition and large fixed costs (in the form of nonICT assets) clearly create potential
for these prices to deviate from the prediction that changes in ICT services prices should align with
changes in prices for the underlying ICT assets used to produce them. Services of nonICT capital
assets (including land) are a substantial fraction (51 percent) of total capital income in the telecom
and internet access services industry, whereas such assets play a less material role (16 percent) in the
20Silicon Valley’s Mark Andreessen, wrote in the Wall Street Journal in 2011, “... the cost to a customer running abasic internet application [at the first cloud computing company Loudcloud] was approximately $150,000 per month [in2000]. Running that same application today in Amazon’s cloud costs about $1,500 per month.” Andreessen’s figuresimply a price drop of more than 30 percent per year for cloud services during the first decade of the 2000s, a pace ofchange that has apparently continued. In March 2014 Google announced price cuts for its cloud computing services andstorage by 30 percent, only to be followed in May 2915 by further cuts in the 20 to 30 percent range. (See this 2014 TechCrunch article and this 2015 InfoWorld article for reports on these changes.)
23
capital of the information processing services industry, which includes cloud computing and storage
services, suggesting the potential for substantial deviation.21
We focus on the enterprise segment of wireline telecom services using data from Telegeography,
who report prices of individual service offerings for four groups of enterprise business services (virtual
private network; dedicated internet access; IP private line, domestic; and IP private line, international)
from 2006 on. The results of computing a matched model price index for enterprise wireline telecom
services yields a price index that falls 8.2 percent per year from 2006 to 2014 (line 12 in the table)—a
pace of change on par with the results of the new price index for enterprise software (line 10) but below
that for the relevant telecom equipment (lines 1 and 2). Although the enterprise wireline segment of
telecom and internet access services is not necessarily representative of the total industry (see again
figure 6), the fact that enterprise wireline telecom prices fall about as fast as software assets (i,e.,
an ICT asset) but not less than 1/2 the declines seen for telecom equipment is very relevant to the
arguments put forth in this paper.22
3.2 New Software Prices
Table 3: New Software Price Index
Structure of the new index
1. Software products2. Software products, except games3. Desktop and portable device softwarea
4. Enterprise, networking, database,tools/languages, and other software
5. Application software6. System software7. Game software products
a. Covers both application and system softwareproducts.
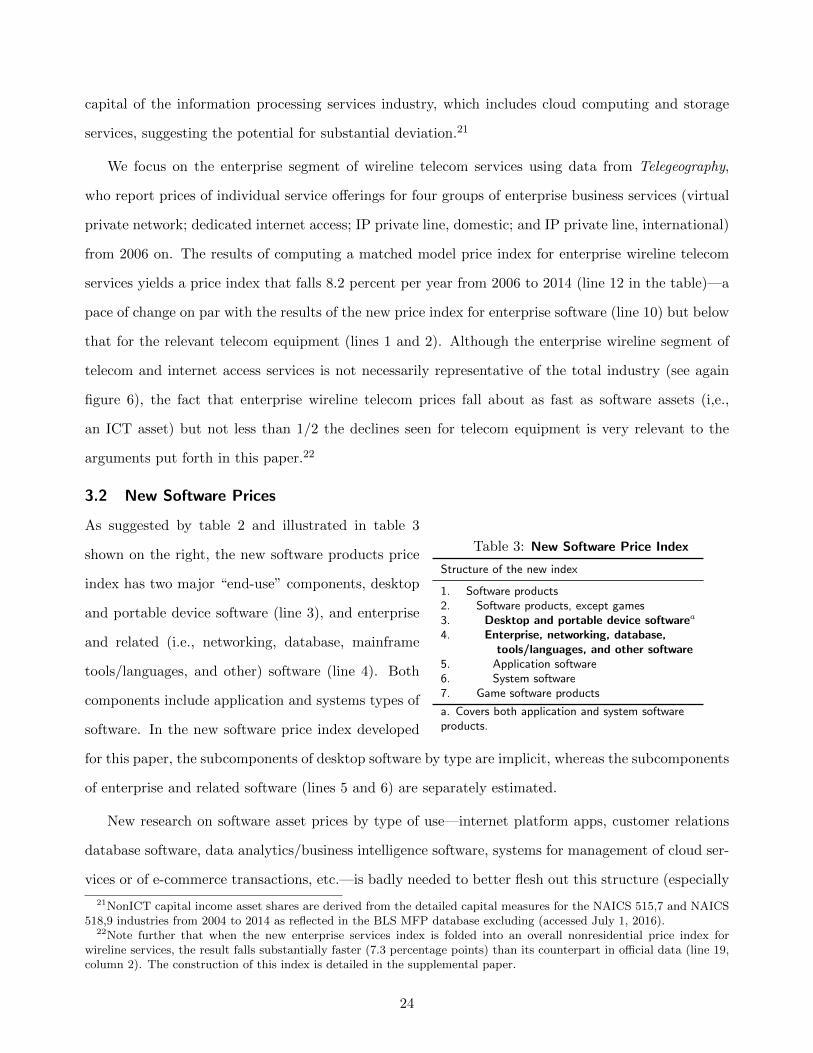
As suggested by table 2 and illustrated in table 3
shown on the right, the new software products price
index has two major “end-use” components, desktop
and portable device software (line 3), and enterprise
and related (i.e., networking, database, mainframe
tools/languages, and other) software (line 4). Both
components include application and systems types of
software. In the new software price index developed
for this paper, the subcomponents of desktop software by type are implicit, whereas the subcomponents
of enterprise and related software (lines 5 and 6) are separately estimated.
New research on software asset prices by type of use—internet platform apps, customer relations
database software, data analytics/business intelligence software, systems for management of cloud ser-
vices or of e-commerce transactions, etc.—is badly needed to better flesh out this structure (especially
21NonICT capital income asset shares are derived from the detailed capital measures for the NAICS 515,7 and NAICS518,9 industries from 2004 to 2014 as reflected in the BLS MFP database excluding (accessed July 1, 2016).
22Note further that when the new enterprise services index is folded into an overall nonresidential price index forwireline services, the result falls substantially faster (7.3 percentage points) than its counterpart in official data (line 19,column 2). The construction of this index is detailed in the supplemental paper.
24
its enterprise component), but we were able to make sufficient headway to inform the measurement
and analysis of recent price change for software investment for this paper. The most important new
source of information that has been incorporated is our own inference of recent trends in prices for
system software based on the PPI for overall software publishing relative to certain of its components.
Without going into details, what has been done can be understood from the following: (1) prices for
system software are collected by the BLS, but a PPI component for systems software is unpublished
because estimates do not meet standards for disclosure; (2) the PPI for application software is the
primary source data for U.S. national accounts estimates of software investment prices, and (3) recent
trends in BLS prices for application software (a published index) and systems software (our inference)
diverge substantially, imparting a notable bias in the BEA’s software investment price index.
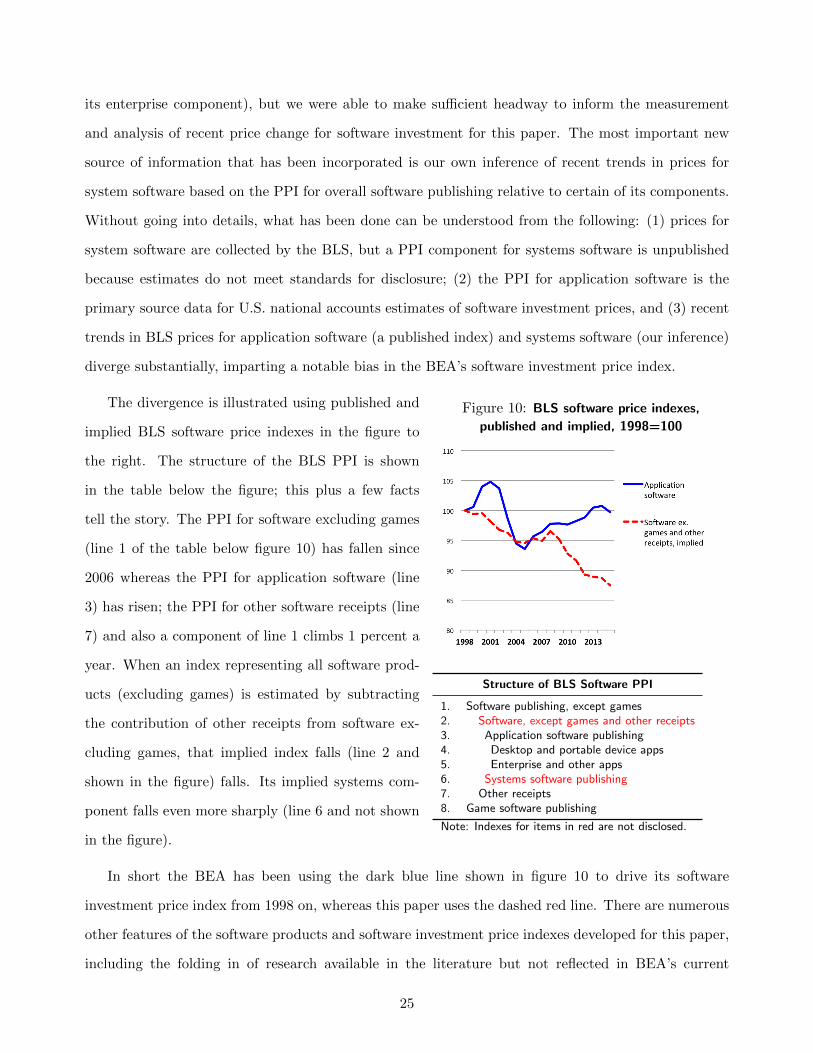
Figure 10: BLS software price indexes,
published and implied, 1998=100
Structure of BLS Software PPI
1. Software publishing, except games2. Software, except games and other receipts3. Application software publishing4. Desktop and portable device apps5. Enterprise and other apps6. Systems software publishing7. Other receipts8. Game software publishing
Note: Indexes for items in red are not disclosed.
The divergence is illustrated using published and
implied BLS software price indexes in the figure to
the right. The structure of the BLS PPI is shown
in the table below the figure; this plus a few facts
tell the story. The PPI for software excluding games
(line 1 of the table below figure 10) has fallen since
2006 whereas the PPI for application software (line
3) has risen; the PPI for other software receipts (line
7) and also a component of line 1 climbs 1 percent a
year. When an index representing all software prod-
ucts (excluding games) is estimated by subtracting
the contribution of other receipts from software ex-
cluding games, that implied index falls (line 2 and
shown in the figure) falls. Its implied systems com-
ponent falls even more sharply (line 6 and not shown
in the figure).
In short the BEA has been using the dark blue line shown in figure 10 to drive its software
investment price index from 1998 on, whereas this paper uses the dashed red line. There are numerous
other features of the software products and software investment price indexes developed for this paper,
including the folding in of research available in the literature but not reflected in BEA’s current
25

methodology and an effort to align our new work to BEA’s history so that figures are comparable over
time. (The supplement to this paper includes these details.)
It is important to underscore that most existing research on software prices, and essentially all of the
work that informed BEA’s software price methodology reported in Parker and Grimm (2000), pertains
to PC desktop application software.23 Greenstein and Nagle (2014) looked at the economic benefits
of Apache, a widely-used open source software system used to manage e-commerce transactions in
the 1990s, and found substantial benefits even after accounting for substitution with priced products.
This suggests there could be large price declines in the systems software in wide use today, but we
cannot really know without additional research. The implied systems software component in the PPI
in fact drops relatively rapidly, and while its incorporation in an ICT asset price index is a major
step forward (sales of systems software accounted for about 47 percent of all domestically-produced
software product sales in the United States in 2013 and 2014, according to the Census Bureau’s 2014
Services Annual Survey), its impact on the new price index for enterprise software is partially offset
by the rising PPI for enterprise and network application software (a component of the applications
software PPI shown in figure 10). Many new products in the data analytics/business intelligence
and marketing/management of customer relationships space have been introduced in recent years—
consistent with the strong software products R&D shown in the previous section. All told, additional
research is badly needed to assess/further improve the price measures for enterprise software (apps
and systems/infrastructure) reported in this paper.
3.3 New ICT Investment Prices
To assess the macroeconomic implications of the ICT goods and services prices just discussed, the
indexes must be folded into national accounts-style investment price indexes. Detailed components of
the investment price indexes are reported in the appendix to this paper (table A1, page 40), where it
may be seen that the results are largely presaged by the results presented in table 2. The procedures
used for constructing the new investment price indexes are detailed in the supplement to this paper.
23One study available to Parker and Grimm (Harhoff and Moch, 1997) covered a PC database platform for businessapplications, but prices for PC desktop operating systems were not studied until much later (Abel et al., 2007; Copeland,2013). As discussed in the supplemental paper, systems software includes enterprise databases as well as operatingsystems.
26
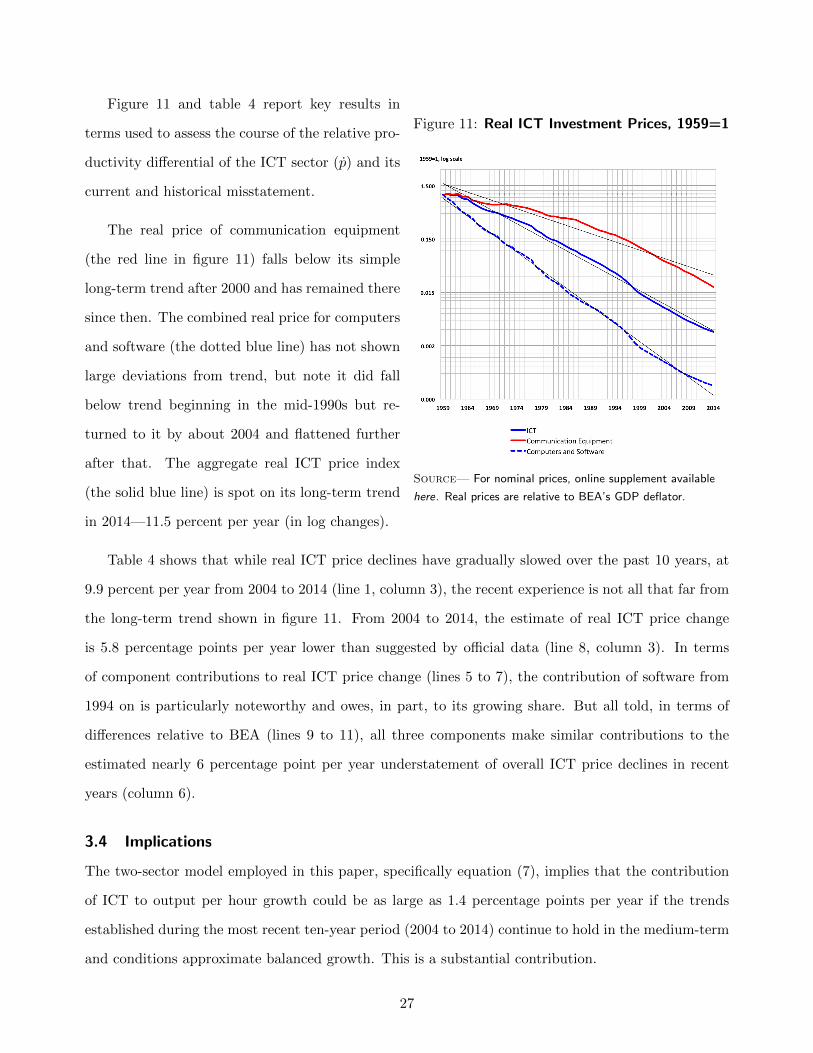
Figure 11: Real ICT Investment Prices, 1959=1
Source— For nominal prices, online supplement available
here. Real prices are relative to BEA’s GDP deflator.
Figure 11 and table 4 report key results in
terms used to assess the course of the relative pro-
ductivity differential of the ICT sector (p) and its
current and historical misstatement.
The real price of communication equipment
(the red line in figure 11) falls below its simple
long-term trend after 2000 and has remained there
since then. The combined real price for computers
and software (the dotted blue line) has not shown
large deviations from trend, but note it did fall
below trend beginning in the mid-1990s but re-
turned to it by about 2004 and flattened further
after that. The aggregate real ICT price index
(the solid blue line) is spot on its long-term trend
in 2014—11.5 percent per year (in log changes).
Table 4 shows that while real ICT price declines have gradually slowed over the past 10 years, at
9.9 percent per year from 2004 to 2014 (line 1, column 3), the recent experience is not all that far from
the long-term trend shown in figure 11. From 2004 to 2014, the estimate of real ICT price change
is 5.8 percentage points per year lower than suggested by official data (line 8, column 3). In terms
of component contributions to real ICT price change (lines 5 to 7), the contribution of software from
1994 on is particularly noteworthy and owes, in part, to its growing share. But all told, in terms of
differences relative to BEA (lines 9 to 11), all three components make similar contributions to the
estimated nearly 6 percentage point per year understatement of overall ICT price declines in recent
years (column 6).
3.4 Implications
The two-sector model employed in this paper, specifically equation (7), implies that the contribution
of ICT to output per hour growth could be as large as 1.4 percentage points per year if the trends
established during the most recent ten-year period (2004 to 2014) continue to hold in the medium-term
and conditions approximate balanced growth. This is a substantial contribution.
27
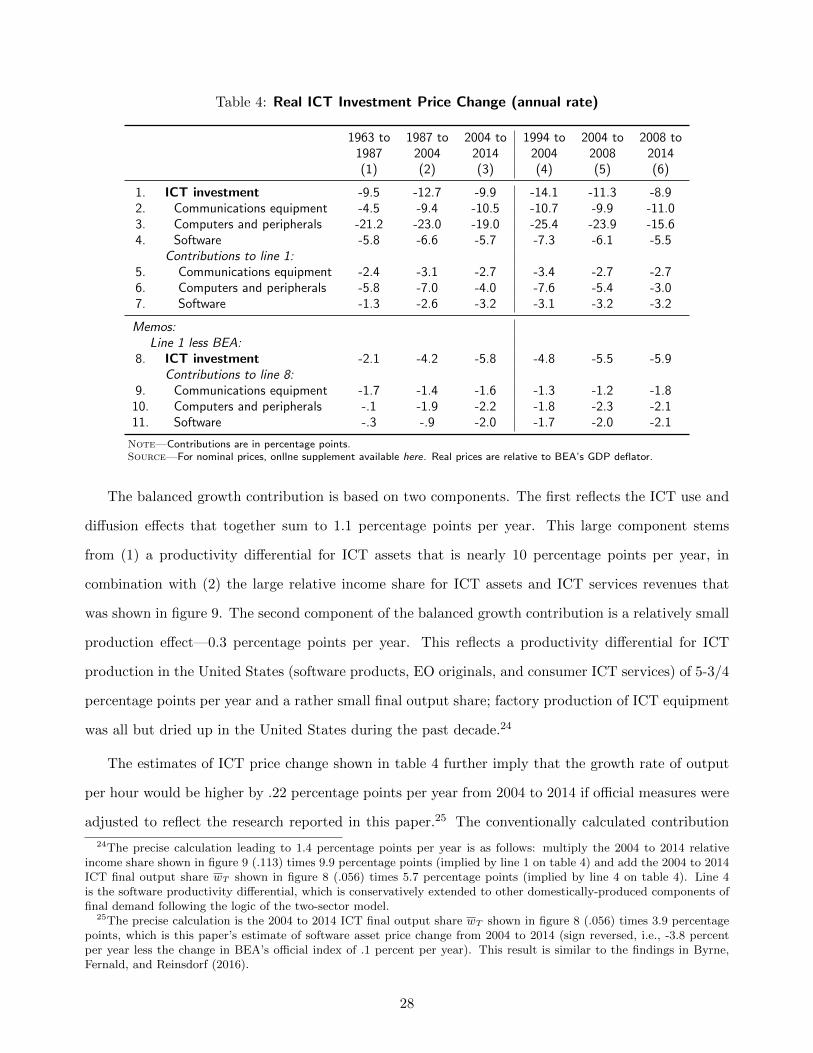
Table 4: Real ICT Investment Price Change (annual rate)
1963 to 1987 to 2004 to 1994 to 2004 to 2008 to1987 2004 2014 2004 2008 2014(1) (2) (3) (4) (5) (6)
1. ICT investment -9.5 -12.7 -9.9 -14.1 -11.3 -8.92. Communications equipment -4.5 -9.4 -10.5 -10.7 -9.9 -11.03. Computers and peripherals -21.2 -23.0 -19.0 -25.4 -23.9 -15.64. Software -5.8 -6.6 -5.7 -7.3 -6.1 -5.5
Contributions to line 1:5. Communications equipment -2.4 -3.1 -2.7 -3.4 -2.7 -2.76. Computers and peripherals -5.8 -7.0 -4.0 -7.6 -5.4 -3.07. Software -1.3 -2.6 -3.2 -3.1 -3.2 -3.2
Memos:Line 1 less BEA:
8. ICT investment -2.1 -4.2 -5.8 -4.8 -5.5 -5.9Contributions to line 8:
9. Communications equipment -1.7 -1.4 -1.6 -1.3 -1.2 -1.810. Computers and peripherals -.1 -1.9 -2.2 -1.8 -2.3 -2.111. Software -.3 -.9 -2.0 -1.7 -2.0 -2.1
Note—Contributions are in percentage points.Source—For nominal prices, onllne supplement available here. Real prices are relative to BEA’s GDP deflator.
The balanced growth contribution is based on two components. The first reflects the ICT use and
diffusion effects that together sum to 1.1 percentage points per year. This large component stems
from (1) a productivity differential for ICT assets that is nearly 10 percentage points per year, in
combination with (2) the large relative income share for ICT assets and ICT services revenues that
was shown in figure 9. The second component of the balanced growth contribution is a relatively small
production effect—0.3 percentage points per year. This reflects a productivity differential for ICT
production in the United States (software products, EO originals, and consumer ICT services) of 5-3/4
percentage points per year and a rather small final output share; factory production of ICT equipment
was all but dried up in the United States during the past decade.24
The estimates of ICT price change shown in table 4 further imply that the growth rate of output
per hour would be higher by .22 percentage points per year from 2004 to 2014 if official measures were
adjusted to reflect the research reported in this paper.25 The conventionally calculated contribution
24The precise calculation leading to 1.4 percentage points per year is as follows: multiply the 2004 to 2014 relativeincome share shown in figure 9 (.113) times 9.9 percentage points (implied by line 1 on table 4) and add the 2004 to 2014ICT final output share wT shown in figure 8 (.056) times 5.7 percentage points (implied by line 4 on table 4). Line 4is the software productivity differential, which is conservatively extended to other domestically-produced components offinal demand following the logic of the two-sector model.
25The precise calculation is the 2004 to 2014 ICT final output share wT shown in figure 8 (.056) times 3.9 percentagepoints, which is this paper’s estimate of software asset price change from 2004 to 2014 (sign reversed, i.e., -3.8 percentper year less the change in BEA’s official index of .1 percent per year). This result is similar to the findings in Byrne,Fernald, and Reinsdorf (2016).
28
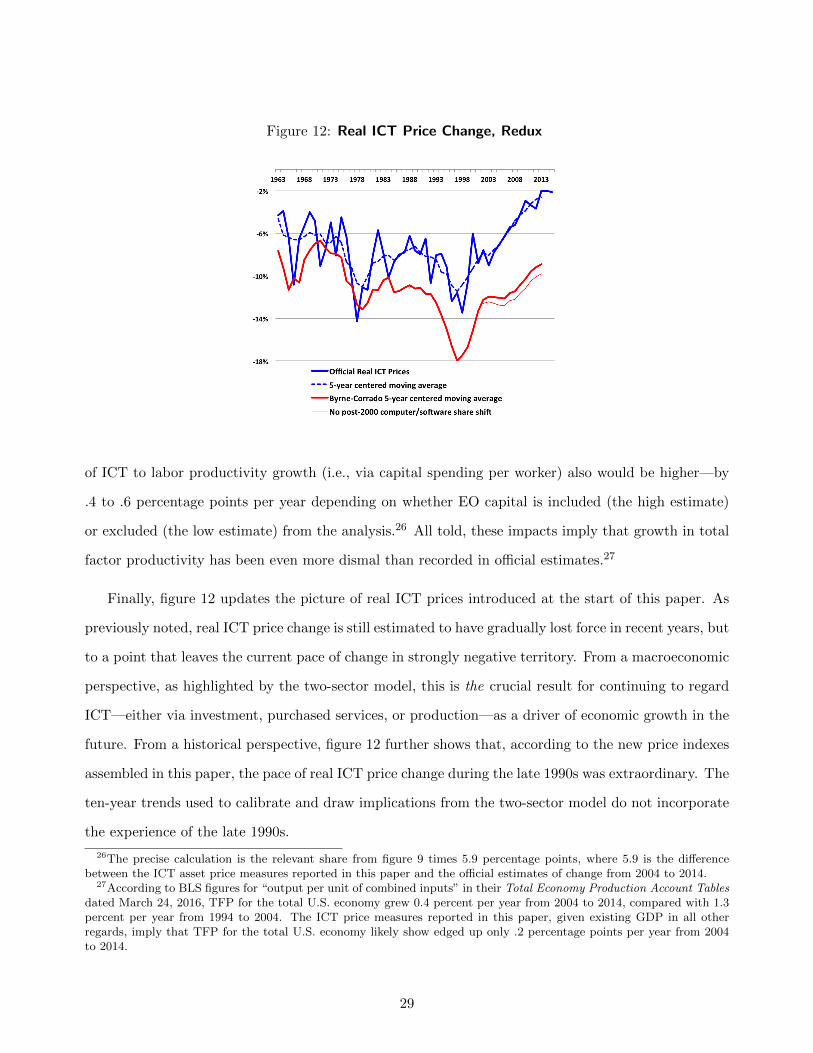
Figure 12: Real ICT Price Change, Redux
of ICT to labor productivity growth (i.e., via capital spending per worker) also would be higher—by
.4 to .6 percentage points per year depending on whether EO capital is included (the high estimate)
or excluded (the low estimate) from the analysis.26 All told, these impacts imply that growth in total
factor productivity has been even more dismal than recorded in official estimates.27
Finally, figure 12 updates the picture of real ICT prices introduced at the start of this paper. As
previously noted, real ICT price change is still estimated to have gradually lost force in recent years, but
to a point that leaves the current pace of change in strongly negative territory. From a macroeconomic
perspective, as highlighted by the two-sector model, this is the crucial result for continuing to regard
ICT—either via investment, purchased services, or production—as a driver of economic growth in the
future. From a historical perspective, figure 12 further shows that, according to the new price indexes
assembled in this paper, the pace of real ICT price change during the late 1990s was extraordinary. The
ten-year trends used to calibrate and draw implications from the two-sector model do not incorporate
the experience of the late 1990s.
26The precise calculation is the relevant share from figure 9 times 5.9 percentage points, where 5.9 is the differencebetween the ICT asset price measures reported in this paper and the official estimates of change from 2004 to 2014.
27According to BLS figures for “output per unit of combined inputs” in their Total Economy Production Account Tablesdated March 24, 2016, TFP for the total U.S. economy grew 0.4 percent per year from 2004 to 2014, compared with 1.3percent per year from 1994 to 2004. The ICT price measures reported in this paper, given existing GDP in all otherregards, imply that TFP for the total U.S. economy likely show edged up only .2 percentage points per year from 2004to 2014.
29
That said, a balanced growth calculation does not incorporate temporary factors that might disturb
productivity outcomes, and the last ten years witnessed a major financial crisis. Although a thorough
review of influences on productivity growth during this period is beyond the scope of this paper,
it is possible to close the loop on the central macroeconomic implications of the paper’s two-sector
model discussed in section 1.3. Consider (a) that computer demand is unlikely to remain as weak in the
medium term as it has been during a period of adjusting to a cloud platform, and (b) that weak demand
and slow income growth and/or costs of adjusting to a new ICT platform have obscured nonICT
producers’ gains from increased ICT capital utilization due to the adoption of cloud technologies.
With regard to (a), the thin red line in figure 12 shows a counterfactual for real ICT price change
in which the computer and software shares did not shift after 2000. The counterfactual closes the gap
between the end point of the centered moving average of real ICT price change (about 9 percent) and
the long-term trend used to determine the contribution of ICT to growth in output per hour (about
10 percent). This then mitigates the concern that ICT price change continued to slow over the 10
year period used to calibrate the model, i.e., that the calibrations are based on an adjustment phase
during which growth in unit computer demand has been substantially diminished by the spread of
cloud technologies suggests the last 10 years of actual ICT price declines were unusually slow.
With regard to (b), figure 13 uses industry-level changes in total factor productivity growth before
and after the Great Recession and relates them to the increase in intensity of ICT services use. The
figure suggests that nonICT producers have not reaped the gains in productivity that should have
been enjoyed by the adoption of cloud platforms.28 And figure 14 suggests that the failure of nonICT
producers to reap productivity gains did not owe to a lack of co-investments in the intangible assets that
are crucial during the installation phase of new ICT platforms, e.g., investments in business process
change and employer-specific training.
It is unclear why industries whose usage of ICT services increased the most after 2007 had weaker
rates of change in productivity from 2010 to 2013 relative to prior performance despite their co-
investments in ICT-related intangibles, but several possibilities are likely. First, the very swift pace
28Although this paper has shown a disturbing degree of price mismeasurement that would feed directly into the TFPestimates plotted in this figure, these concerns are somewhat ameliorated because the figure uses changes in the rate ofproductivity growth (i.e., double differences) and examines nonICT-producing industries only.
30
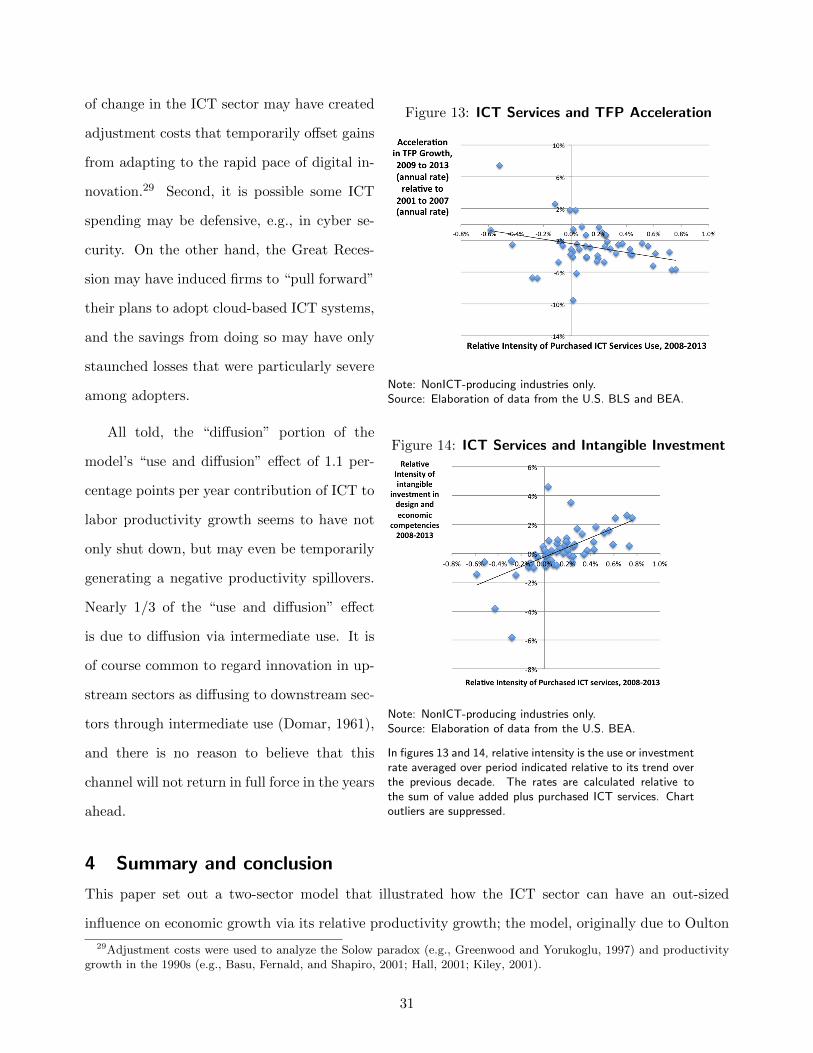
Figure 13: ICT Services and TFP Acceleration
Note: NonICT-producing industries only.Source: Elaboration of data from the U.S. BLS and BEA.
Figure 14: ICT Services and Intangible Investment
Note: NonICT-producing industries only.Source: Elaboration of data from the U.S. BEA.
In figures 13 and 14, relative intensity is the use or investmentrate averaged over period indicated relative to its trend overthe previous decade. The rates are calculated relative tothe sum of value added plus purchased ICT services. Chartoutliers are suppressed.
of change in the ICT sector may have created
adjustment costs that temporarily offset gains
from adapting to the rapid pace of digital in-
novation.29 Second, it is possible some ICT
spending may be defensive, e.g., in cyber se-
curity. On the other hand, the Great Reces-
sion may have induced firms to “pull forward”
their plans to adopt cloud-based ICT systems,
and the savings from doing so may have only
staunched losses that were particularly severe
among adopters.
All told, the “diffusion” portion of the
model’s “use and diffusion” effect of 1.1 per-
centage points per year contribution of ICT to
labor productivity growth seems to have not
only shut down, but may even be temporarily
generating a negative productivity spillovers.
Nearly 1/3 of the “use and diffusion” effect
is due to diffusion via intermediate use. It is
of course common to regard innovation in up-
stream sectors as diffusing to downstream sec-
tors through intermediate use (Domar, 1961),
and there is no reason to believe that this
channel will not return in full force in the years
ahead.
4 Summary and conclusion
This paper set out a two-sector model that illustrated how the ICT sector can have an out-sized
influence on economic growth via its relative productivity growth; the model, originally due to Oulton
29Adjustment costs were used to analyze the Solow paradox (e.g., Greenwood and Yorukoglu, 1997) and productivitygrowth in the 1990s (e.g., Basu, Fernald, and Shapiro, 2001; Hall, 2001; Kiley, 2001).
31

(2012), was expanded to include ICT services for improved relevancy. A central feature of the model
is that relative ICT asset prices reflect the relative productivity of the sector. Official measures of ICT
prices suggest that the relative productivity of ICT capital has been gradually eroding for 10 years
and that its current advantage is close to nil. This paper found no evidence in support of this central
implication of the current official ICT price measures.
The paper first found that ICT R&D has not only been well-maintained, but that software products
R&D has enjoying a stunning rise. If technical change in the ICT sector has ground to a halt, then
the return to software R&D must have fallen dramatically, which seems unlikely in the face of more
than a decade of relative growth in investments in this area and the advent of cloud technologies that
should have boosted the productivity of the conduct software R&D. Second, the model developed
in this paper predicted strong growth in ICT services use and strong relative growth of ICT design
services to the extent that cloud technologies had taken hold. The overt, first order macroeconomic
effects of the transition to cloud technologies—weak computer hardware demand and increase in ICT
capital utilization—are not easy to detect in macrodata. But strong relative growth in cloud services
and systems design services is a key feature of the current ICT landscape and one of the most relevant
signs that innovation is still driving the sector. All told, via the user cost relationship as well as the
paper’s two-sector model, ICT services price change is driven by ICT asset price change, and while
cloud services providers enjoy scale and perhaps unique abilities to harness advanced technologies, it
seems unlikely that cloud computing and storage services prices which reportedly are dropping about
30 percent per year, could be dropping so much faster (20 to 25 percentage points!) than official prices
for the equipment deployed in the delivery of these services.
Finally, the paper introduced new measures of relative ICT price change that incorporated available
research as well as new work conducted expressly for this paper. More than a dozen new ICT product
price indexes were introduced, and new ICT investment price indexes for communication equipment,
computers, and software were developed. The new results feature substantial innovations for total
telecom equipment, computer servers, software products, and enterprise telecom services (wireline).
Although much new evidence on ICT asset prices and ICT services prices was marshaled for the analysis
reported in this paper, large gaps in evidence remain—enterprise software products and differentiated
computer design services are notable examples of these holes.
32
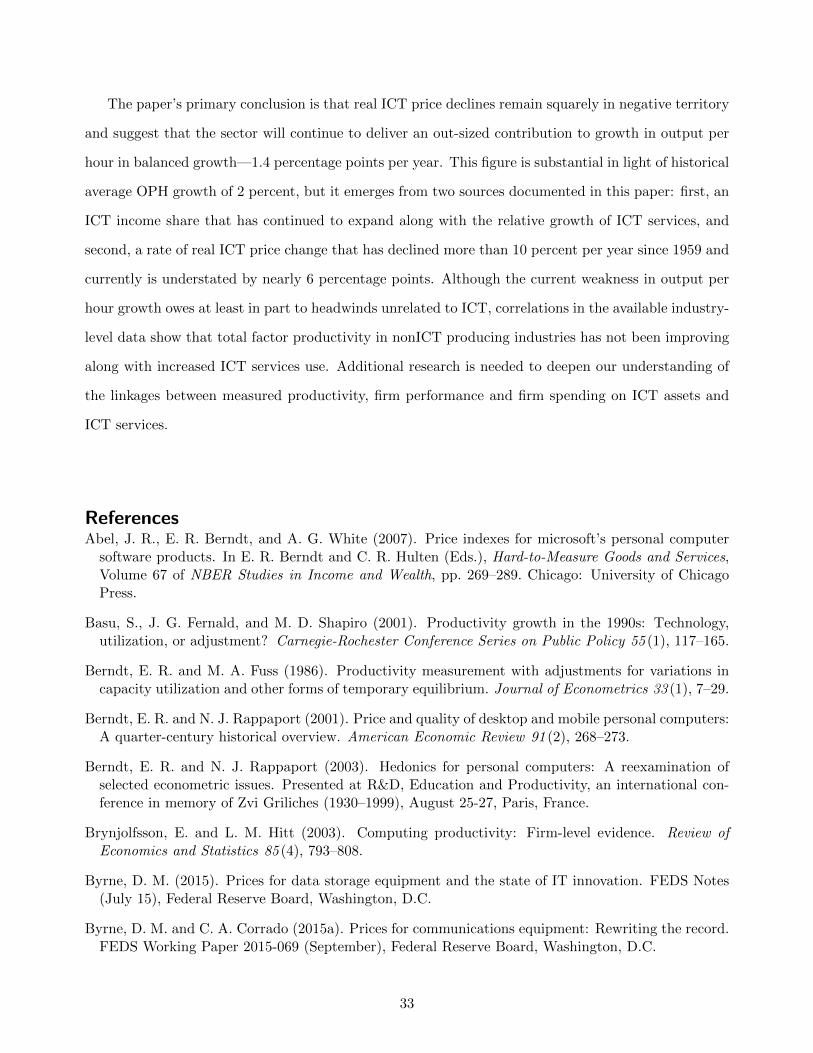
The paper’s primary conclusion is that real ICT price declines remain squarely in negative territory
and suggest that the sector will continue to deliver an out-sized contribution to growth in output per
hour in balanced growth—1.4 percentage points per year. This figure is substantial in light of historical
average OPH growth of 2 percent, but it emerges from two sources documented in this paper: first, an
ICT income share that has continued to expand along with the relative growth of ICT services, and
second, a rate of real ICT price change that has declined more than 10 percent per year since 1959 and
currently is understated by nearly 6 percentage points. Although the current weakness in output per
hour growth owes at least in part to headwinds unrelated to ICT, correlations in the available industry-
level data show that total factor productivity in nonICT producing industries has not been improving
along with increased ICT services use. Additional research is needed to deepen our understanding of
the linkages between measured productivity, firm performance and firm spending on ICT assets and
ICT services.
ReferencesAbel, J. R., E. R. Berndt, and A. G. White (2007). Price indexes for microsoft’s personal computer
software products. In E. R. Berndt and C. R. Hulten (Eds.), Hard-to-Measure Goods and Services,Volume 67 of NBER Studies in Income and Wealth, pp. 269–289. Chicago: University of ChicagoPress.
Basu, S., J. G. Fernald, and M. D. Shapiro (2001). Productivity growth in the 1990s: Technology,utilization, or adjustment? Carnegie-Rochester Conference Series on Public Policy 55 (1), 117–165.
Berndt, E. R. and M. A. Fuss (1986). Productivity measurement with adjustments for variations incapacity utilization and other forms of temporary equilibrium. Journal of Econometrics 33 (1), 7–29.
Berndt, E. R. and N. J. Rappaport (2001). Price and quality of desktop and mobile personal computers:A quarter-century historical overview. American Economic Review 91 (2), 268–273.
Berndt, E. R. and N. J. Rappaport (2003). Hedonics for personal computers: A reexamination ofselected econometric issues. Presented at R&D, Education and Productivity, an international con-ference in memory of Zvi Griliches (1930–1999), August 25-27, Paris, France.
Brynjolfsson, E. and L. M. Hitt (2003). Computing productivity: Firm-level evidence. Review ofEconomics and Statistics 85 (4), 793–808.
Byrne, D. M. (2015). Prices for data storage equipment and the state of IT innovation. FEDS Notes(July 15), Federal Reserve Board, Washington, D.C.
Byrne, D. M. and C. A. Corrado (2015a). Prices for communications equipment: Rewriting the record.FEDS Working Paper 2015-069 (September), Federal Reserve Board, Washington, D.C.
33
Byrne, D. M. and C. A. Corrado (2015b). Recent trends in communications equipment prices. FEDSNotes (September 29), Federal Reserve Board, Washington, D.C.
Byrne, D. M., J. G. Fernald, and M. B. Reinsdorf (2016). Does the United States have a productivityslowdown or a measurement problem? Brookings Papers on Economic Activity . (forthcoming).
Byrne, D. M., S. D. Oliner, and D. E. Sichel (2015). How fast are semiconductor prices falling?Working Paper 21074 (July), NBER, Cambridge, Mass.
Copeland, A. (2013). Seasonality, consumer heterogeneity and price indexes: the case of prepackagedsoftware. Journal of Productivity Analysis 39, 47–59.
Corrado, C. (2011). Communication capital, Metcalfe’s law, and U.S. productivity growth. EconomicsProgram Working Paper 11-01, The Conference Board, Inc., New York. Available at http://
papers.ssrn.com/sol3/papers.cfm?abstract_id=2117784.
Corrado, C., J. Haskel, C. Jona-Lasinio, and M. Iommi (2012). Intangible capital and growth inadvanced economies: Measurement and comparative results. Economics Program Working Paper 12-03, The Conference Board. Available at http://papers.ssrn.com/sol3/papers.cfm?abstract_
id=2114913.
Corrado, C., J. Haskel, C. Jona-Lasinio, and M. Iommi (2013). Innovation and intangible investmentin Europe, Japan, and the United States. Oxford Review of Economic Policy 29 (2), 261–286.
Corrado, C., C. Hulten, and D. Sichel (2005). Measuring capital and technology: An expandedframework. In C. Corrado, J. Haltiwanger, and D. Sichel (Eds.), Measuring Capital in the NewEconomy, Volume 66 of NBER Studies in Income and Wealth, pp. 11–46. Chicago: University ofChicago Press.
Corrado, C., C. Hulten, and D. Sichel (2009). Intangible capital and U.S. economic growth. Review ofIncome and Wealth 55 (3), 661–685.
Corrado, C. and K. Jager (2014). Communication networks, ICT, and productivity growth in Europe.Economics Program Working Paper 14-04, The Conference Board, Inc., New York.
Corrado, C. A. and B. van Ark (2016). The Internet and productivity. In J. M. Bauer and M. Latzer(Eds.), Handbook on the Economics of the Internet, pp. 120–145. Northamption, Mass.: EdwardElgar Publishing, Inc.
Crawford, M. J., J. Lee, J. E. Jankowski, and F. A. Moris (2014). Measuring R&D in the nationaleconomic accounting system. Survey of Current Business 94 (11), 1–15.
Domar, E. D. (1961). On the measurement of technological change. The Economic Journal 71, 709–729.
Gordon, R. J. (1990). The Measurement of Durable Goods Prices. Chicago: University of ChicagoPress.
Gordon, R. J. (2014a). The demise of U.S. economic growth: Restatement, rebuttal, and reflections.Working Paper 19895 (February), NBER, Cambridge, MA.
Gordon, R. J. (2014b). A new method of estimating potential real GDP growth: Implications for thelabor market and the debt/GDP ratio. Working Paper 20423 (August), NBER, Cambridge, MA.
Greenstein, S. (2000). Building and delivering the virtual world: Commercializing services for internetaccess. Journal of Industrial Economics 48 (4), 391–411.
34

Greenstein, S. and F. Nagle (2014). Digital dark matter and the economic contribution of Apache.Research Policy 43, 623–631.
Greenwood, J. and M. Yorukoglu (1997). 1974. Carnegie-Rochester Conference Series on PublicPolicy 46 (June), 49–95.
Grimm, B. T. (1998). Price indexes for selected semiconductors. Survey of Current Business 78 (2),8–24.
Hall, R. E. (2001). The stock market and capital accumulation. American Economic Review 91 (5),1185–1202.
Harhoff, D. and D. Moch (1997). Price indexes for PC database software and the value of codecompatibility. Research Policy 26 (4-5), 509–520.
Hilbert, M. and P. Lopez (2011). The world’s technological capacity to store, communicate, andcompute information. Science 332 (6025), 60–65.
Hulten, C. R. (1978). Growth accounting with intermediate inputs. The Review of Economic Stud-ies 45 (3), 511–518.
Jorgenson, D. W. (1963). Capital theory and investment behavior. American Economic Review 53 (2),247–259.
Jorgenson, D. W. (1966). The embodiment hypothesis. Journal of Political Economy 74 (1), 1–17.
Jorgenson, D. W. (2001). Information technology and the U.S. economy. American Economic Re-view 90 (1), 1–32.
Jorgenson, D. W., M. S. Ho, and K. J. Stiroh (2004). Will the U.S. productivity resurgence contine?Federal Reserve Bank of New York, Current Issues in Economics and Finance 10 (3), 1–7.
Jorgenson, D. W., M. S. Ho, and K. J. Stiroh (2005). Productivity, volume 3: Information technologyand the american growth resurgence. MIT Press Books 3.
Jorgenson, D. W. and K. J. Stiroh (2000). Raising the speed limit: U.S. economic growth in theinformation age. Brookings Papers on Economic Activity (1), 125–211.
Jorgenson, D. W. and K. M. Vu (2010). Potential growth of the world economy. Journal of PolicyModeling 32 (5), 615–631.
Kiley, M. T. (2001). Computers and growth with frictions: Aggregate and disaaggregate evidence.Carnegie-Rochester Conference Series on Public Policy 55 (1), 171–215.
McCallum, J. C. (2002). Price-performance of computer technology. In V. Oklobdzija (Ed.), TheComputer Engineering Handbook, Chapter 4, pp. 4–1 to 4–18. CRC Press.
OECD (2014). Addressing the Tax Challenges of the Digital Economy, OECD/G20 Base Erosion andProfit Shifting Project. Paris: OECD Publishing.
Oliner, S. D. and D. E. Sichel (2000). The resurgence of growth in the late 1990’s: Is informationtechnology the story? Journal of Economic Perspectives 14 (4), 3–22.
Oulton, N. (2012). Long term implications of the ICT revolution: Applying the lessons of growthaccounting and growth theory. Economic Modelling 29 (5), 1722–1736.
35
Parker, R. and B. T. Grimm (2000). Recognition of business and government expenditures for softwareas investment: Methodology and quantitatvie iimpact, 1959–98. Technical report, U.S. Bureau ofEconomic Analysis. Available at http://www.bea.gov/papers/pdf/software.pdf.
Pillai, U. (2011). Technological progress in the microprocessor industry. Survey of Current Busi-ness 91 (2), 13–16.
Pillai, U. (2013). A model of technological progress in the microprocessor industry. The Journal ofIndustrial Economics 61 (4), 877–912.
Stiroh, K. J. (2002). Are ICT spillovers driving the new economy? Review of Income and Wealth 48 (1),33–57.
The Conference Board (2015). The Conference Board Total Economy Database™ May 2015. TheConference Board. Available at http://www.conference-board.org/data/economydatabase/.
36
Appendix
A1 The steady-state solution of the two-sector model
Model. Lower case variables are per hour versions of inputs and outputs introduced in the text,i.e., xji = Xj
i /Hj is the per hour form of variable X where i = T,N denotes type of good or service
where relevant (i.e., ICT or other types), and j = T,N denotes sector of use (ICT-producers or otherproducers). As in the Oulton model, the sector production functions i are Cobb-Douglas and writtenhere in per hour form as :
qN = AN (kTN )α(kNN )
β(sTN )
γ(hN )1−α−β−γ(A1)
and
qT = AT (kTT )α(kNT )
β(sTT )
γ(hT )1−α−β−γ(A2)
The functions for the two sectors are identical except for TFP, whose growth rates µT and µN areexogenous.
The supply-use equations for the open economy version of the model are
Y = C + I +X −M ; Y = YT + YN where(A3)
YT = CT + IT −MC −MI ; YN = CN + IN +XC +XI .
Imports M = MC + MI are imports of ICT goods, and exports X = XC + XI are exports of allother goods, i.e, the economy is an (net) importer of ICT and a (net) exporter of all other types ofoutput. Next, we assume input supplies must equal demands, so that H = HN +HT and Ki =
∑jK
ji ,
j = T,N ; i = T,N . Accumulation equations are given by
KN = IN − δNKN(A4)
KT = IT − δTKT(A5)
Recalling that p = PT /PN , a steady state in this model is when trade is balanced X = pM andwhen the real interest rate r and proportions of total hours allocated to each sector Hi/H (i = T,N)are constant. With sectoral hours shares constant in steady state growth, for sectoral and overalloutput per hour to grow at a constant rate it follows that the services share of ICT production mustalso be constant. This follows from the definitions:
QT = YT + SNT and QN = YN(A6)
where in the steady state, the growth rate QN and YN (and thus qn and yn) are identical by definition.The growth rate of QT is a (constant) share-weighted average of the growth rates of YT and SNT , whichgrow at the same rate, and thus imply qT = yT in steady growth.
Note also that with sectoral hours shares constant in steady state growth, OPH growth in the totaleconomy is a share-weighted average of the growth rates of OPH growth in each of the sectors, i.e.,accounting for “labor reallocation” due to shifts in hours shares is not needed.
37
Growth rate of relative ICT prices (p). Given the model’s assumption that production functions arethe same up to a scalar multiple, it is easy to see that the rate of change in relative ICT prices is givenby
p = µN − µT < 0(A7)
which as stated in the text is proved by total differentiation of the payments equations (4) with respectto time. With µN and µT constant by assumption, so too is p.
Growth rate of output per hour. To obtain the steady state growth rates of labor productivity, firstdifferentiate equation (A1) and (A2) with respect to time, which gives
qN = µN + αkNN + βkNT + γsNT + (1 − α− β − γ)h(A8)
qT = µT + αkTN + βkTT + γsTT + (1 − α− β − γ)h(A9)
where from (A6) we have
qN = yN and qT = yT .(A10)
Consider first the N sector. Profit maximization requires that the real user cost equal the real marginalproduct of capital, which for nonICT and ICT capital are given by
(i+ δN ) = αqN
kNNand (i+ δT − p)p = β
qN
kNT.(A11)
where i is the nominal rate of interest and the real interest rate is the nominal rate minus the growthrate of the N sector price PN , expressed in terms of the relative price p in (A11).
In steady state where the real interest rate is constant and factors are paid their products, thesolutions for sector N are then
q∗N = y
∗N = kN
∗N(A12)
q∗N = y
∗N = kN
∗T + p(A13)
where ∗ denotes a steady state solution (recall p is constant by assumption). Equality of the realmarginal product of ICT capital in T sector production with real user cost implies
(i+ δT − p) = βqT
kTT(A14)
Because the left hand of the (A14) is constant, it follows that qT = kTT from which it follows:
q∗T = y
∗N − p .(A15)
In steady state growth, output per hour in sector T grows faster than output per hour in sector N .
Finally, equality of the real marginal product of ICT intermediate services across the two sectorsimplies that
∂qN
∂sTN= γ
qN
sTN= γ
YN
STN(A16)
must be identical to∂qT
∂sTT= γ
qT
sTT= γ
YT + SNTSTT
(A17)
38
Equation (A16) implies that sTN is equal to yN in steady state growth but from (A15), we know thatqT , of which sNT is a component, grows at a faster rate than yN . It is readily seen that the conditionqT = yT solves this dilemna and implies
sNT = ˙yN − p(A18)
yT = y∗N − p .(A19)
Now substitute equations (A12), (A13), and (A18) into (A8), the expression for growth in output perhour in sector N :
yN = µN + αyN + β(yN − p) + γ(yN − p) + (1 − α− β − γ)h
which after rearranging terms yields
yN =µN − (β + γ)p
(1 − α− β − γ)+ h .(A20)
Define the steady state output share of the T sector as
ω∗T =
pYTYN + pYT
(A21)
in which case the steady state OPH growth rate for the total economy may be written as
y∗
= (1 − ω∗T )y
∗N + ωT y
∗T
= y∗N + ω
∗T (y
∗T − y
∗N ) .(A22)
Substituting (A19) into (A22) yields
y∗
= y∗N − ω
∗T p
and subsitituting (A20) into this expression and simplifying yields our result, an expression for thecontribution of the ICT sector to total OPH growth:
y∗
=µN − (β + γ)p
(1 − α− β − γ)+ h− ω
∗T p
=µN
(1 − α− β − γ)+ h +
(β + γ)(−p)(1 − α− β − γ)
+ ω∗T (−p)︸ ︷︷ ︸
Contribution of ICT to total OPH growth
(A23)
The final term in equation (A23) appears as text equation (7) where β, γ, (1 − α− β − γ), and ωT are
replaced by their empirical counterparts vKT, ζNT , vL, and wT .
Contribution of ICT to growth in TFP The amended model’s solution for aggregate TFP µ alsois different than that implied by the original Oulton model. Under the usual neoclassical growthaccounting assumptions in the presence of intermediates (e.g., Hulten 1978), the growth of aggregateTFP is the sum of the growth of each sector’s TFP growth times its Domar-Hulten weight, which isthe ratio of each sector’s sectoral production (gross output net of own use) to aggregate value added,
39

PiQi/PY . From (2) and (5), these weights are expressed as:
PTQTPY
= wT + ζNT ;
PNQNPY
= 1 − wT
whose sum is greater than one by the relative size of ICT services supplied to nonICT producers.
The growth of aggregate TFP µ is then given by
µ = (wT + ζNT )µT︸ ︷︷ ︸
Contribution of ICT sector
+ (1 − wT )µN(A24)
The contribution of the ICT sector to overall TFP growth is larger than the sector’s share in finaldemand wT to account for the diffusion of the sectorn’s innovation via use of ICT services (intermediateinputs) by other producers in the economy.
A2 Nominal ICT investment deflators
The table below shows detailed components of the nominal national accounts-style price deflators cal-culated for the analysis in this paper. The methods used to construct these deflators are described indetail in a supplemental document available here.
Table A1: Nominal ICT Investment Price Change (annual rate)
1963 to 1987 to 2004 to 1994 to 2004 to 2008 to1987 2004 2015 2004 2008 2015(1) (2) (3) (4) (5) (6)
1. ICT investment -4.9 -10.6 -8.0 -12.4 -8.9 -7.52. Communication equipment .4 -7.3 -8.7 -9.1 -7.4 -9.53. Telecom -.3 -11.7 -12.4 -14.3 -10.1 -13.74. Other equipment .4 -8.3 -9.3 -10.3 -8.1 -10.05. Capitalized services – 1.1 -3.7 -.1 -2.5 -4.36. Computers and peripherals -17.1 -21.2 -17.0 -24.0 -21.8 -14.17. Servers and storage -18.1 -25.2 -25.7 -31.0 -30.6 -22.78. PCs – -27.9 -23.4 -30.3 -30.2 -19.29. Other equipment -9.0 -9.3 -3.3 -8.8 -5.4 -2.010. Capitalized services – -2.0 -2.2 -3.1 -1.5 -2.611. Software -1.0 -4.4 -3.9 -5.5 -3.5 -4.112. Prepackaged -9.8 -9.0 -7.0 -9.6 -6.8 -7.213. Custom and own-account .0 -2.0 -2.2 -3.1 -1.5 -2.6
Memos:14. ICT excluding PCs -4.5 -8.4 -6.5 -9.9 -6.6 -6.415. Computers excluding PCs -16.6 -17.1 -11.6 -19.8 -14.5 -9.9
16. BEA ICT -2.7 -6.4 -2.1 -7.5 -3.3 -1.417. BEA ICT excluding PCs -2.6 -4.5 -1.4 -5.2 -1.9 -1.218. Computers excluding PCs -16.6 -11.0 -3.6 -12.7 -6.6 -1.8
Note: Figures reported as “BEA” are authors’ calculations based on BEA data.
40