ict in education in latin america and the caribbean
TRANSCRIPT

ICT IN EDUCATION IN LATIN AMERICA AND THE CARIBBEAN
A regional analysis of ICT integration and e-readiness

UNESCO
The constitution of the United Nations Educational, Scientific and Cultural Organization (UNESCO) was adopted by 20 countries at the London Conference in November 1945 and entered into effect on 4 November 1946. The Organization currently has 195 Member States and 9 Associate Members.
The main objective of UNESCO is to contribute to peace and security in the world by promoting collaboration among nations through education, science, culture and communication in order to foster universal respect for justice, the rule of law, and the human rights and fundamental freedoms that are affirmed for the peoples of the world, without distinction of race, sex, language or religion, by the Charter of the United Nations.
To fulfil its mandate, UNESCO performs five principal functions: 1) prospective studies on education, science, culture and communication for tomorrow's world; 2) the advancement, transfer and sharing of knowledge through research, training and teaching activities; 3) standard-setting actions for the preparation and adoption of internal instruments and statutory recommendations; 4) expertise through technical co-operation to Member States for their development policies and projects; and 5) the exchange of specialized information.
UNESCO is headquartered in Paris, France.
UNESCO Institute for Statistics
The UNESCO Institute for Statistics (UIS) is the statistical office of UNESCO and is the UN depository for global statistics in the fields of education, science and technology, culture and communication.
The UIS was established in 1999. It was created to improve UNESCO's statistical programme and to develop and deliver the timely, accurate and policy-relevant statistics needed in today’s increasingly complex and rapidly changing social, political and economic environments.
The UIS is based in Montreal, Canada.
Published in 2012 by:
UNESCO Institute for Statistics P.O. Box 6128, Succursale Centre-Ville Montreal, Quebec H3C 3J7 Canada
Tel: (1 514) 343-6880 Email: [email protected] http://www.uis.unesco.org
ISBN 978-92-9189-119-1 Ref: UIS/2012/ICT/TD/07/REV.7
©UNESCO-UIS 2012
The authors are responsible for the choice and presentation of the facts contained in this book and for the opinions expressed therein which are not necessarily those of UNESCO and do not commit the Organization.

- iii -
Table of contents
Page
Introduction ................................................................................................................................... 5
1. Why do we measure ICT in education? ............................................................................... 5
2. Methodology ......................................................................................................................... 6
3. Measuring e-readiness: A framework for quantifying ICT in education ................................ 7
4. ICT integration in national policy and curriculum ................................................................. 7
5. Electricity as a prerequisite for ICT in education ................................................................ 10
6. Integration of older forms of ICT in education: Radio-assisted instruction (RAI) and television-assisted instruction (TAI) ............................................................................ 11
7. Building computer infrastructure for newer forms of ICT-assisted instruction .................... 14
8. Adoption of newer forms of ICT in education: Computer-assisted instruction (CAI) and Internet-assisted instruction (IAI) ....................................................................... 17
9. Role of computer integration and enrolment in programmes offering computer-assisted instruction ......................................................................................................................... 19
10. Gender disparity in enrolment in programmes offering ICT ............................................... 20
11. Building Internet connectivity in schools: Preparing schools for Internet-assisted instruction .............................................................................................. 21
12. Teachers and ICT in education .......................................................................................... 26
13. Conclusions ........................................................................................................................ 29
References .................................................................................................................................. 31
Annex I. Reader’s guide ............................................................................................................ 33
Annex II. Statistical tables .......................................................................................................... 34 Table II.1 Political commitments on ICT in education, ISCED 1, 2 and 3,
2009-2010 ................................................................................................ 34
Table II.2 Curriculum and ICT in education, ISCED 1, 2 and 3, 2009-2010 ............ 35
Table II.3 Primary education, ICT infrastructure in educational
institutions, ISCED 1, 2010 ...................................................................... 36
Table II.4 Secondary education, ICT infrastructure in
educational institutions, ISCED 2 and 3, 2010 ......................................... 38
Table II.5 Computers, ISCED 1, 2 and 3, 2010 ........................................................ 40

- iv -
Table II.6 Enrolment in educational programmes using ICT, ISCED 1, 2010 .......... 41
Table II.7 Enrolment in educational programmes using ICT, ISCED 2 and 3,
2010 ......................................................................................................... 42
Table II.8 Teacher training on ICT and current practice, ISCED 1, 2 and 3, 2010 ... 43
List of boxes Box 1. WSIS targets on education and related indicators ...................................................................... 5 Box 2. eLAC2015 – Goals for education in the Lima Declaration .......................................................... 6
List of tables Table 1. Definition of the ICT in education initiatives in Latin America and the Caribbean ...................... 8 Table 2. Combined primary-and secondary-level teachers and ICT, 2010 ............................................ 27
List of figures Figure 1. Proportion of countries reporting the implementation of formal strategies to
promote/integrate ICT in education ............................................................................................. 9 Figure 2. Proportion of educational institutions with electricity, 2010 ...................................................... 10 Figure 3. Proportion of educational institutions with radio-assisted instruction (RAI), 2010 .................... 12 Figure 4. Proportion of educational institutions with television-assisted instruction (TAI), 2010 ............. 13 Figure 5 Learners-to-computer ratio in primary and secondary education, 2010 ................................... 15 Figure 6. Proportion of educational institutions with a computer laboratory, 2010 .................................. 17 Figure 7. Proportion of educational institutions with computer-assisted instruction (CAI), 2010 ............. 18 Figure 8. Relationship between enrolment in primary programmes offering CAI and access
to computers as measured by the proportion of primary schools with CAI, 2010 .................... 20 Figure 9. Proportion of primary-level pupils enrolled in programmes offering CAI, by gender, 2010 ...... 21 Figure 10. Proportion of educational institutions with Internet connectivity, 2010 ..................................... 22 Figure 11. Proportion of educational institutions by connection type, 2010 ............................................... 24 Figure 12. Proportion of educational institutions with Internet-assisted instruction (IAI), 2010 ................. 25

- 5 -
Introduction
The advent of the knowledge economy and global economic competition, more than ever, results in the need to prioritise educational quality, life-long learning and the provision of equal opportunities for all. Education policymakers widely accept that improved access to information and communication technology (ICT) in education can help individuals to compete in a global economy by creating a skilled work force and facilitating social mobility. Experts also argue that sound ICT policy in education has a multiplier effect throughout the education system, by enhancing learning and providing students with new sets of skills; by reaching students with poor or no access (especially those in rural and remote regions); by facilitating and improving the training of teachers; and by minimising costs associated with the delivery of instruction. This ultimately results in better overall educational achievement and learning outcomes.
1. Why do we measure ICT in education?
For more than a decade now, education policymakers have been formalising all-inclusive ICT policies as part of educational renewal and reform. At the global level, policy for integrating ICT for development was first formulated in the Millennium Development Goals (MDGs) Target 8.F, which states that “In cooperation with the private sector, make available the benefits of new technologies, especially information and communications” (United Nations, 2000; United Nations, 2012). Also, at the global level, the World Summit on the Information Society (WSIS), held in 2003 and 2005, resulted in a clear commitment by governments to foster the achievement of an inclusive information society. To this end, the WSIS Plan of Action identified ten targets, to be achieved by 2015—two of which are related to education. These include Target 2: connecting all primary and secondary schools to ICT, which is a precondition to Target 7: adapting all primary and secondary school curricula to meet the challenges of the information society (Partnership on Measuring ICT for Development, 2011) (see Box 1). Lastly, while ICT are not mentioned explicitly in the Education for All goals, it is argued that they play a pivotal role in achieving these goals, including broadening access, eliminating exclusion, and improving quality.
Box 1. WSIS targets on education and related indicators
Target 2. Connect all secondary schools and primary schools with ICT
1. Proportion of schools with a radio used for educational purposes 2. Proportion of schools with a television used for educational purposes 3. Learners-to-computer ratio 4. Proportion of schools with Internet access, by type of access
Target 7. Adapt all primary and secondary school curricula to meet the challenges of the information society, taking into account national circumstances
1. Proportion of ICT-qualified teachers in schools 2. Proportion of teachers trained to teach subjects using ICT 3. Proportion of schools with computer-assisted instruction (CAI) 4. Proportion of schools with Internet-assisted instruction (IAI)
(Partnership on Measuring ICT for Development, 2011)

- 6 -
Regionally, several governments in Latin America and Caribbean countries have also been defining successive action plans and policy frameworks that focus on the use of ICT for development, in order to compensate for social inequalities. These call upon schools to take a leadership role in broadening access to, training in and usage of new technologies (ECOSOC, 2011). The Plan of Action (eLAC2015) on the Information Society in Latin America and the Caribbean ( ECLAC, 2010) states that ICT are tools for economic development and social inclusion. Moreover, eLAC2015 makes it a priority to incorporate ICT in education and, particularly, to provide universal access and inclusive education. The Plan of Action is driven by four goals related to equality, equity and overall development (ECLAC, 2010) (see Box 2).
Box 2. eLAC2015 – Goals for education in the Lima Declaration
Goal 23: Connect all educational establishments to broadband and increase their computer density, while promoting the use of convergent educational resources such as mobile phones, video games and open interactive digital television. In this connection, foster public policies that support collaborative teaching and research activities carried out over national and regional research and education networks. In particular, promote support for the CLARA network and CARIBnet in managing and obtaining passive infrastructure, thus strengthening the regional network for science, technology, research and innovation.
Goal 24: Ensure that all professors, teachers and management of educational institutions have received basic ICT training, which enables them to incorporate these technologies effectively into the teaching-learning process. Here, it is particularly important to train these professionals in the use of innovative teaching models, maximise opportunities and minimise the risks associated with the use of different digital technologies by children and adolescents.
Goal 25: Encourage the development of interactive applications for education and promote the production of multimedia public content, based on the principles of accessibility, user-friendliness and free availability over the Internet and digital devices, with emphasis on the participation in, and production of, resources by pupils and teachers.
Goal 26: Promote support for the Latin American Network of Educational Portals (RELPE) in the exchange, joint production and generation of shared repositories of multimedia resources, distance training proposals and teaching models with the focus on convergence of media in education and the promotion of cultural diversity.
(ECLAC, 2010)
2. Methodology
One role assigned to the UNESCO Institute for Statistics’ (UIS) is to contribute to benchmarking and monitoring the integration of and access to ICT in education, by establishing internationally comparable and policy-relevant indicators. This is why, in 2010/2011, the UIS conducted a data collection campaign in Latin America and the Caribbean, as part of its regional, demand-driven survey rollout strategy.
The regional survey was successfully completed by 38 countries and territories out of a total of 41 targeted, resulting in a response rate of 93%. The questionnaire collected data in the following areas: a) policy and curriculum, b) ICT integration in schools, c) enrolment in programmes using ICT, and d) teachers and ICT. Before the questionnaire was distributed, countries were consulted on definitions, indicator methodology, and national experiences related to the collection of statistics on ICT in education.

- 7 -
For Latin American countries, national statisticians/ focal points completed, reviewed and validated data from administrative sources (i.e. school census records). For English-speaking Caribbean countries, the UIS recruited consultants to act as enumerators to improve collaboration with the countries’ statistical focal points. For sustainability and cost-efficiency purposes, all data collected were compiled from available national level schools’ census data sources, or were estimated from national inventories from ICT in Education projects, when appropriate. The data cleaning and quality control process included the verification of missing data, values out of range, statistical outliers, inconsistencies, logical errors and other miscellaneous issues.
3. Measuring e-readiness: A framework for quantifying ICT in education
The UIS questionnaire on ICT in education assesses e-readiness (electronic readiness), which is a measure of the degree to which a country is ready, willing or prepared to benefit from ICT in education. This measure is typically used to gauge how ready a country is to partake in electronic activities—in this case schools and the general education system (Dada, 2006).
E-readiness is measured by a number of ICT in education indicators. How useful these are as a basis for comparison and future planning will depend on how well they describe a given situation. These indicators can, however, assist with a country’s ICT advancement and development efforts by identifying areas where additional efforts are needed. For example, minimum levels of infrastructure are needed before ICT-assisted instruction can be implemented. This includes electricity, and in the case of Internet-assisted instruction, a basic Internet connection. Given the usefulness of this approach, the following analysis follows a progressive model in terms of the integration of ICT and the essential infrastructure required for their successful implementation (Dada, 2006).
4. ICT integration in national policy and curriculum
An important element in the sustainable success of initiatives to introduce and use ICT is the existence of a government’s formal commitment (Kozma, 2008). These commitments can take a number of forms: i) a national policy; ii) a national plan; iii) a set of regulatory provisions; and/ or iv) a regulatory institution or body. Table 1 shows that in Latin America and the Caribbean, 31 of 38 countries (82%) have at least one kind of formal definition of their ICT in education initiatives, while 9 (24%) have all formal definitions. These include Anguilla, Bahamas, Barbados, Chile, Ecuador, Guatemala, Saint Vincent and the Grenadines, Uruguay and Venezuela (Bolivarian Republic of). In contrast, Curaçao, Dominica, Montserrat and Suriname do not have any formal definitions or regulatory institutions regarding ICT in education (Statistical Table II.1).
Additionally, 24% of countries declared having a policy of open educational resources (OER). First defined at UNESCO's 2002 Forum on the Impact of Open Courseware for Higher Education in Developing Countries, OERs are digitised materials that are offered freely and openly for educators, students and self-learners to use and reuse for teaching, learning and research (Johnstone, 2005; UNESCO, 2002). OER includes i) learning content (e.g. full courses, learning objects); ii) software tools to support the development, reuse and delivery of content; and iii) implementation resources including intellectual property licenses to publish material in addition to solid design principles and strategies (OECD, 2007). The introduction of national policies on the use of open educational resources in education is relevant to ICT policy, since OER operate only within an ICT-enabled environment.

- 8 -
Table 1. Definition of the ICT in education initiatives in Latin America and the Caribbean
Policy, plan, regulatory provision or body
In place for all levels In place for some levels Not in place
Anguilla* Antigua and Barbuda Argentina Bahamas* Barbados* Belize Bolivia (Plurinational State of) Brazil British Virgin Islands
†
Cayman Islands Chile* Colombia Costa Rica Cuba Dominican Republic Ecuador* El Salvador Grenada Guatemala* Guyana Nicaragua Panama Paraguay Saint Kitts and Nevis Saint Lucia Saint Vincent and the Grenadines* Sint Maarten Trinidad and Tobago Turks and Caicos Islands Uruguay* Venezuela (Bolivarian Republic of)* (31 countries)
Mexico (ISCED 1 & 2) Aruba (ISCED 2 & 3) Jamaica (ISCED 2 & 3) (3 countries)
Curaçao Dominica Montserrat Suriname (4 countries)
Notes: *Countries with all formal definitions for all the educational levels † British Virgin Islands and Dominica both have a draft policy for ICT In Education that has not been officially adopted
Source: UNESCO Institute for Statistics database and Statistical Table II.1.
Figure 1 shows the frequency of each definition for the 31 countries that have some type of formal definition related to initiatives to provide ICT in education. The most common types of formal definition are the existence of national policies (61%) and regulatory institutions (61%), followed by national plans (56%). The existence of a set of regulatory provisions was least common and found in 50% of countries.

- 9 -
Figure 1. Proportion of countries reporting the implementation of formal strategies to promote/integrate ICT in education
Source: UNESCO Institute for Statistics database and Statistical Table 1.
The integration of ICT into primary and secondary curricula can also be regarded as an important step in facilitating their entry into educational institutions and classrooms. Regarding the inclusion of ICT in the curriculum, four out of 38 countries reported that their national curriculum did not include recommendations for ICT-assisted instruction. These included Curaçao, Dominica, Montserrat and Suriname. Among the 34 countries that do include recommendations on ICT-assisted instruction in their curriculum, the data in Statistical Table II.1 show that this does not necessarily cover all subject areas, nor does it cover all levels of education or even grades within a single level. However, in general, the majority of countries include recommendations for integrating ICT-assisted instruction at all levels (i.e. primary, lower secondary and upper secondary). Fifteen countries reported that the curriculum includes recommendations for ICT-assisted instruction at all grades for all subjects in primary, lower secondary and upper secondary education. These include several Caribbean countries, but also Argentina, Brazil, Chile and Paraguay. Some countries only have recommendations for the use of ICT-assisted instruction at secondary level, including Aruba, Jamaica, Saint Lucia and Turks and Caicos for certain subjects. In contrast, El Salvador only has recommendations for using ICT-assisted instruction in primary education. Twenty-four of 38 countries (63%) said that they have specific objectives or courses on basic computer skills (or computing) at primary, lower secondary and upper secondary levels of education. This is important if ICT are to be used effectively in teaching other subjects. In other countries, such as Aruba, Belize, Dominica, Guyana, Saint Lucia and Saint Vincent and the Grenadines, such objectives or courses are included in the secondary level curriculum but not at primary level. This reflects an emphasis placed on using ICT in secondary education (Statistical Table II.2).
61 6156
50
24
0
10
20
30
40
50
60
70
80
90
100
National Policy Regulatoryinstitution or
body
National Plan Set ofregulatoryprovisions
Policy of openeducationalresources
%

- 10 -
5. Electricity as a prerequisite for ICT in education
Over the last few decades, several ICT-assisted instructional approaches have been implemented to support teaching and learning processes, as well as to improve overall education management. These cover a wide range, from the use of radio or television, to computers, Internet and other technologies. Whatever the situation, however, integrating ICT (i.e. radios, televisions and computers) into schools requires electricity (e.g. grid/mains connection, wind, water, solar and fuel-powered generator, etc.) that is regularly and readily available. While this is not always strictly the case for radio, which can be operated using batteries, the use of computers and Internet requires a much more stable energy source. The proportion of all schools with electricity for primary through secondary levels gives a measure of national institutional capacity to host ICT in education and is therefore a core UIS reference indicator. According to Figure 2 electricity is available in almost all primary and secondary schools in Caribbean countries except in the Dominican Republic, where fewer than half of primary and secondary schools (43% and 34%, respectively) are electrically equipped to support the integration of ICT. The vast majority of Caribbean countries can, therefore, fully support ICT integration, which also means that where ICT is lacking, this cannot be attributed to the absence of an electricity supply. In Uruguay, which has been at the forefront of ICT integration in education, 96% of primary and 100% of secondary schools have electricity.
Figure 2. Proportion of educational institutions with electricity, 2010
Notes: Data for Colombia also include lower and upper secondary levels. Data for the Dominican
Republic only reflect public institutions and also include schools from the lower secondary level; data for upper secondary level is reported independently. Data from Guyana only include public institutions. Data for Argentina, Bahamas, Barbados, El Salvador, Montserrat, Suriname Trinidad and Tobago and Uruguay reflect 2009. In Panama, secondary data is missing.
Source: UNESCO Institute for Statistics database and Statistical Tables 3 and 4.

- 11 -
The situation is different in other South and Central American countries where many schools lack a basic electricity supply. According to Figure 2, fewer than 80% of primary schools have electricity in Ecuador, Guyana, Panama and Venezuela. In Nicaragua, only the minority (24%) of primary schools have electricity. However, in countries with less than full access to an electrical supply in their schools, it is the secondary schools that are more likely to have access. For instance in Nicaragua, secondary schools (68%) are 2.8 times more likely than primary schools (24%) to be connected to electricity. (Statistical Tables 3 and 4)
6. Integration of older forms of ICT in education: Radio-assisted instruction (RAI) and television-assisted instruction (TAI)
Radio-assisted instruction (RAI) has been used as an educational tool since the 1920s and television-assisted instruction (TAI) since the 1950s. Now considered to be older forms of ICT-assisted instruction, both have been shown to be effective on a large scale and at a low cost. They both also have an added advantage in rural areas with little or no infrastructure. For instance, where there is no basic and reliable electrical supply, RAI can still be provided with the aid of simple batteries.
Radio-assisted instruction (RAI)
There are different forms of RAI, including one-way radio broadcast education and off-air radio cassettes and compact discs (CDs). Radio broadcast education involves an audio lecture or lesson, with supporting printed material for pupils. Any teacher, not necessarily qualified in the subject matter, can use the radio programme as a main teaching resource. Broadcast programmes follow the traditional model of education and can cover any subject in many different languages, depending on the target audience.
Some of the best documented RAI projects are based on Interactive Radio Instruction (IRI) programmes, which turn a typically one-way technology into a tool for active learning, both inside and outside the classroom. IRI requires pupils to react to questions and exercises through verbal responses to the presenters of a live radio programme, as well as group work and physical and intellectual activities while the programme is on air. For both teacher and pupil, the lesson becomes an immediate hands-on practical guide.
Evaluations of IRI initiatives have indicated that students show progressive improvements in achievement over time and that IRI programmes can also substantially improve educational equity (Bosch, Rhodes and Kariuki, 2002; Trucano, 2010). Current RAI initiatives in the region include, for example, the “I Play and Learn” programme (Juego y Aprendo) in Honduras, and the “Early Childhood IRI Math Program” in Paraguay (EDC, 2012).
The proportion of schools with a radio that can be used for educational purposes (or RAI) is both a UIS ICT for Education (ICT4E) core indicator and one of the indicators to monitor WSIS target 2. It provides a measure of the level of integration of radio-assisted instruction among schools. It does not, however, shed light on the intensity of use by students or teachers, nor on educational quality. Figure 3 shows the proportion of primary and secondary institutions with radio-assisted instruction (RAI), which includes both radio broadcast education and interactive radio instruction using popular frequencies (such as FM, AM, LW and SW).

- 12 -
Figure 3. Proportion of educational institutions with radio-assisted instruction (RAI), 2010
Notes: Data for Bahamas reflects public institutions only. Only partial data are available for Cayman Islands and Dominica.
Source: UNESCO Institute for Statistics database and Statistical Tables 3 and 4.
RAI was the least frequently reported type of ICT used in responding countries, which could reflect a shift in priorities for current ICT initiatives in education. Based on the 18 countries with data, the British Virgin Islands, Cuba, Ecuador and El Salvador do not provide access to RAI in primary or secondary educational institutions. According to Figure 3, however, 14 countries in the Caribbean do report use of a radio for educational purposes at primary and/ or secondary levels to varying degrees. Six countries, including the Bahamas, Barbados, Saint Lucia, Saint Kitts and Nevis, Saint Vincent and the Grenadines, and Trinidad and Tobago reported that RAI is offered in all primary and secondary schools. In contrast, the Dominican Republic provides access to RAI in only about 1% of its primary and secondary educational institutions, through its private sector rural community education and development programme Escuelas radiofónicas.
Figure 3 also shows that some countries prioritise the use of a radio at different educational levels. For instance, 80% of secondary and 39% of primary schools in Dominica use RAI. In contrast, Anguilla and Turks and Caicos Islands reported full access to a radio for educational purposes in all primary institutions (100%) but no provision of RAI at the secondary level (0%). (Statistical Tables 3 and 4)
Television-assisted instruction (TAI)
Television-assisted instruction (TAI) is a more advanced form of ICT that can help pupils understand and learn about abstract concepts through visual imagery and representation, including animation, simulation and dramatisation. TAI can include television broadcasts as well as offline video-assisted technologies (e.g. video cassettes and digital versatile/video discs (DVDs)). While more expensive in terms of implementation and maintenance costs than RAI, TAI is typically less costly than more advanced forms of ICT-assisted instruction.
0 0 1 4
39
69
141
27
8095
0 00
102030405060708090
100A
nti
gua/
Bar
bu
da
Mo
nts
erra
t
Do
min
ican
Rep
.
Cay
man
Isla
nd
s
Do
min
ica
Gre
nad
a
An
guill
a
Bah
amas
Bar
bad
os
Sain
t Lu
cia
St K
itts
/Nev
is
St V
ince
nt/
Gre
nad
.
Trin
idad
/To
bag
o
Turk
s/C
aico
s Is
Primary Secondary%

- 13 -
One of the best known TAI initiatives in Latin America and the Caribbean is Telesecundaria from Mexico, which was launched in 1968 as a means of using television to extend lower secondary school learning to remote and small communities, at a lower cost than establishing conventional secondary schools. The early model included lessons transmitted live through open public channels to television sets placed in remote classrooms, where students listened and took notes in the presence of a teacher. Each hour of class was made up of the television broadcast itself, followed by a discussion with the teacher of what had been seen. More recent versions of the programmes include additional interactivity. The system was inexpensive because public networks donated airtime to the Ministry of Education and because it required fewer teachers than traditional schooling (Hinostroza et al., 2011; UNESCO, 2012).
The proportion of schools with a television used for educational purposes is a both a UIS ICT4E core indicator and an indicator used to monitor WSIS target 2. With a similar definition to that for RAI, with the added feature of video, it provides a measure of the integration of TAI in schools. However, it sheds no light on the intensity of use by students or teachers, nor on educational quality.
Based on 25 countries with data, there are no televisions used for educational purposes in British Virgin Islands and Sint Maarten. According to Figure 4, 22 countries reported some TAI in primary or secondary education. As was the case for the integration of RAI, several countries in the Caribbean reported that TAI is available in all primary and secondary educational institutions. Antigua and Barbuda is an exception to the region as a whole, as only 2% of primary and 5% of secondary education institutions use television for educational purposes. In Costa Rica, Guyana, Nicaragua and Venezuela the integration of TAI in primary and secondary schools is less than 15%, which is not surprising, given that basic electrical services remain a challenge.
Figure 4. Proportion of educational institutions with television-assisted instruction (TAI), 2010
Notes: Data for Bahamas, Barbados, Costa Rica, the Dominican Republic, Guyana and Mexico reflect
public institutions only. Secondary level data from Mexico reflect lower secondary education only. Secondary level data from the Dominican Republic reflect upper secondary education only.
Source: UNESCO Institute for Statistics database and Statistical Tables II.3 and II.4.
0 0 0 0 1 27
42
65 6975
611
33
57
4 514
60
93 95
11
0102030405060708090
100
Nic
arag
ua
Co
sta
Ric
a
Do
min
ican
Rep
.
Me
xico
Gu
yan
a
An
tigu
a/B
arb
ud
a
Ve
nez
uel
a
Do
min
ica
Bra
zil
Cay
man
Isla
nd
s
Gre
nad
a
Turk
s/C
aico
s Is
An
guill
a
Bah
amas
Bar
bad
os
Cu
ba
Jam
aica
Mo
nts
erra
t
St K
itts
/Nev
is
Sain
t Lu
cia
St V
ince
nt/
Gre
nad
.
Trin
idad
/To
bag
o
Primary Secondary%
m
- 14 -
The pattern of prioritising access to ICT-assisted instruction by educational level also emerges in the case of TAI. For example, 65% of primary and 93% of secondary educational institutions in Brazil use a television for educational purposes. Television is used exclusively at the secondary level in Mexico (57% of schools) compared to not at all in primary schools. An exception to this pattern is Turks and Caicos, where only 11% of secondary education institutions have integrated TAI, compared to all primary education institutions (100%).
Of the countries that have integrated TAI in their schools, many have achieved relatively high levels of integration. However, with the recent merging of technologies (i.e. television, computers and the Internet) countries will increasingly be looking at the relative potential and costs of using the Internet as compared to television (Wolff, et al., 2002) (Statistical Tables 3 and 4).
7. Building computer infrastructure for newer forms of ICT-assisted instruction
Older forms of ICT-assisted instruction, including RAI and TAI, are being challenged as well as enriched by computers and the Internet because of their greater potential largely due to the increasingly widespread availability of digital media. However, to ensure that students are able to access newer forms of ICT-assisted instruction, schools need to build up their computer resources.
Computers are defined as programmable electronic devices that can store, retrieve and process data, as well as share information in a highly structured manner. They perform high-speed mathematical or logical operations according to a set of instructions and include the following categories: personal computers (PCs), laptops, tablets, notebooks, e-readers, terminals connected to mainframes, and mini-computers intended for shared use. While start-up and maintenance costs for computers are higher than for RAI and TAI, many argue that there are substantial potential learning and teaching benefits in using computers, particularly given their capacity to perform complex operations and their potential for synchronous two-way communication.
The learners-to-computer ratio (LCR) is a WSIS and UIS core ICT4E indicator that refers to the average number of learners per computer available for pedagogical use. While there is no international target, a high LCR indicates substantially less computer access per learner than a low LCR. Moreover, this indicator measures the national level of computer availability and access in the education system, it does not provide information on the range of LCRs among all schools. For instance, while the LCR may be low in some regions (e.g. urban centres) indicating greater access, it may be much higher in other regions (e.g. rural and remote areas) indicating scarce resources. Finally, while LCR does not provide direct data on quality, it can be considered as a proxy measure of the general quality of ICT-assisted instruction offered in schools, since there is a relationship between the LCR and individual learner time using a computer.
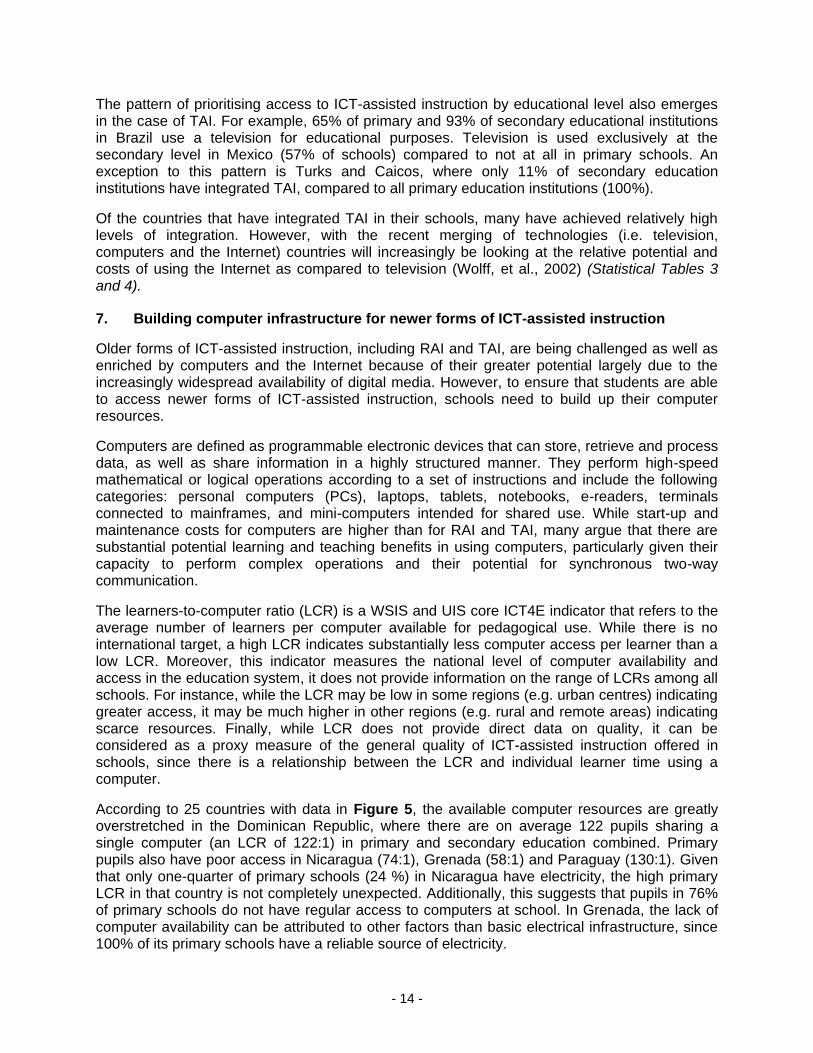
According to 25 countries with data in Figure 5, the available computer resources are greatly overstretched in the Dominican Republic, where there are on average 122 pupils sharing a single computer (an LCR of 122:1) in primary and secondary education combined. Primary pupils also have poor access in Nicaragua (74:1), Grenada (58:1) and Paraguay (130:1). Given that only one-quarter of primary schools (24 %) in Nicaragua have electricity, the high primary LCR in that country is not completely unexpected. Additionally, this suggests that pupils in 76% of primary schools do not have regular access to computers at school. In Grenada, the lack of computer availability can be attributed to other factors than basic electrical infrastructure, since 100% of its primary schools have a reliable source of electricity.
- 15 -
Figure 5. Learners-to-computer ratio in primary and secondary education, 2010
Notes: In Argentina, Barbados, Bolivia (Plurinational State of), Chile, El Salvador, Trinidad and Tobago, and Uruguay, data are for 2009. In Anguilla, secondary education data reflect the public sector only. In the Dominican Republic, Nicaragua, Saint Lucia, and Trinidad and Tobago, primary- and secondary-level data reflect the public sector only. In Uruguay, secondary-level data are missing. In Turks and Caicos, primary-level data include the lower secondary level.
Source: UNESCO Institute for Statistics database and Statistical Tables 5.
In contrast, each child has his or her own computer (1:1) in Uruguay, where it is national policy – through its El Ceibal project – to provide a free laptop computer for every child and teacher. This goal was achieved in 2009 and is closely linked to the One Laptop Per Child project, which manufactures the low-cost XO computer which was specifically designed for children in developing countries. The government of Uruguay is now moving ahead with its plan to equip secondary level students similarly (Martínez, Díaz, & Alonso, 2009).
In most countries, LCRs are lower for secondary education, suggesting that priority is given to building computer infrastructure in secondary schools. In Trinidad and Tobago the secondary level LCR (4:1) is approximately five times lower than the primary LCR (24:1); in Argentina it is five times lower (11:1 versus 50:1) and in Saint Vincent and the Grenadines, three times lower (12:1 versus 38:1) indicating more opportunities to access computers, and overall better quality ICT-assisted instruction. In Cuba there is almost no difference between primary (LCR of 28:1) and secondary levels (27:1), suggesting a more equitable approach to national planning for integrating computers in primary and secondary schools. Nevertheless, despite Cuba’s more equitable approach, there are at least 27 pupils sharing one computer, which means relatively poor access overall and raises questions concerning quality (see Statistical Table II.5).
1 3 4
13 1317 19 19
22 24 2428
3137 38
4650
55 58
74
130
2 30
46
2015
23
13
414
27
1216
12
36
11
2026
84
45
12
55
122
0
20
40
60
80
100
120
140
Uru
guay
Cay
man
Isla
nd
s
Bar
bad
os
Co
lom
bia
An
guill
a
Bri
tish
Vir
gin
Is
Turk
s/ C
aico
s Is
Ch
ile
Sain
t Lu
cia
Pan
ama
Sain
t K
itts
/Nev
is
Trin
idad
/To
bag
o
Do
min
ica
Cu
ba
Co
sta
Ric
a
Ecu
ado
r
Sain
t V
ince
nt/
Gre
nad
.
Bra
zil
Arg
en
tin
a
Bo
livia
El S
alva
do
r
Gre
nad
a
Nic
arag
ua
Do
min
ican
Rep
ub
lic
Par
agu
ay
Primary Secondary Primary and secondary combined
m
- 16 -
Computer laboratories
The installation of computer laboratories in schools was a significant upgrade to where a class might have one desktop computer in the back of the room. More recently, however, given the reality of a multitude of both personal and school-owned devices (including laptops, tablets and mobile devices), education technologists argue that computer laboratories are becoming obsolete and may, in fact, provide a disservice in some situations, since they imply that computing is a separate subject and that the use of ICT ought not to be fully integrated into the general curriculum. Others point to an inadequate budget in most schools for one-to-one programmes and that more computer skills classes should be developed, in addition to integrating technology into the rest of the curriculum (Pedro, 2012; UNESCO, 2011a).
While the promotion of One Laptop per Child programmes has as its aim the achievement of learner-to-computer ratios of 1:1, few countries have been able to attain this. Alternative strategies may potentially improve the availability and management of ICT-assisted instruction in schools. For instance, one alternative is the use of multi-seat computers or networked PCs, where users simultaneously operating from a single CPU and server possess their own individual monitors and keyboards.
As long as ratios of learner-to-devices and the Internet are more than 1:1, computer laboratories may help to fill in this gap by playing an important role in managing and organising how and when children use ICT-assisted instruction. In the past, many have suggested that computer laboratories can facilitate the teachers’ role in structuring learning opportunities more efficiently for a large number of children around computers than having fewer computers in individual classrooms. For this reason, computer laboratories – in addition to classroom-based individualised learning – can effectively support ICT-assisted instruction.
Figure 6 shows results from among the 29 countries that reported data on the availability of computer laboratories in primary and secondary educational institutions. Similar regional and education level patterns emerge. For example, almost all primary and secondary schools in Caribbean countries have computer labs including Barbados, British Virgin Islands, Cuba, Saint Kitts and Nevis, and Sint Maarten. This is also the case for Uruguay.
Computer laboratories are scarce in several Central and South American countries. For example, in Nicaragua, where electricity is lacking in 76% of primary and 32% of secondary schools, only 5% and 33% of schools, respectively have computer laboratories. In the Dominican Republic no schools have a computer lab, which is to be expected, given the lack of computers in general (an LCR of 122:1). The proportion of educational institutions that have computer laboratories is also very low in Paraguay, where only 11% of primary and 22% of secondary institutions have a lab, despite the vast majority of educational institutions being connected to an electricity supply.

- 17 -
Figure 6. Proportion of primary and secondary education institutions with a computer laboratory, 2010
Notes: Data for Barbados, British Virgin Islands, Sint Maarten, and Trinidad and Tobago are for public institutions only. Data for Argentina, Barbados, Chile, El Salvador, Montserrat, Suriname, Trinidad and Tobago and Uruguay are from 2009. In Sint Maarten, only 29% and 8% of primary and secondary schools have computer laboratories; however this can be attributed to the fact that private schools do not have labs whereas all public institutions do.
Source: UNESCO Institute for Statistics database and Statistical Tables 3 and 4.
In the majority of countries, secondary schools are more likely to have a computer lab than primary schools. For example, about two thirds (21 out of 29) of countries reported that more than half of all secondary educational institutions have a lab, compared to only about half of primary schools. In Suriname, almost three times more secondary schools (56%) have computer laboratories compared to primary schools (18%). Similar proportions are found in Costa Rica, where 63% of secondary level educational institutions have a computer lab, compared to 23% of primary schools (see Statistical Tables 3 and 4).
8. Adoption of newer forms of ICT in education: Computer-assisted instruction (CAI) and Internet-assisted instruction (IAI)
The history of computer-assisted instruction (CAI) and Internet-assisted instruction (IAI) is much more recent than for RAI and TAI. However, their evolution and diversification have been exponential and they are increasingly merging with the older ICT to create new platforms for learning and communicating. In the 1970s the approach of CAI was based on programmed learning or “drill and practice” software, whereas both the software and hardware have since evolved, with several devices being specially designed for learning and teaching, such as low cost laptops, interactive whiteboards, tablets, smart phones, etc.
One of the hallmarks of both CAI and IAI is the increased opportunity for interactivity with teachers and other learners than was permitted by older forms of one-way broadcasts delivered by radio or television, and which consequently enhances quality of instruction. On the other hand, because of the increased level of technical sophistication of CAI and IAI, their start-up
05
1118
2330
34 35 36 38 4145
4950 51
68 71 71 73 75
84
33
22
5663
5560
73
83
47
73
54
8
93
0
10
20
30
40
50
60
70
80
90
100
Gre
nad
a
Nic
arag
ua
Par
agu
ay
Suri
nam
e
Co
sta
Ric
a
Arg
en
tin
a
El S
alva
do
r
Bra
zil
Ecu
ado
r
Pan
ama
Turk
s/C
aico
s Is
St V
ince
nt/
Gre
nad
.
Sain
t Lu
cia
Mo
nts
erra
t
Ch
ile
Ve
nez
uel
a
Do
min
ica
Trin
idad
/To
bag
o
Cay
man
Isla
nd
s
An
guill
a
An
tigu
a/B
arb
ud
a
Bar
bad
os
Bri
tish
Vir
gin
Is
Cu
ba
St K
itts
/Nev
is
Sin
t M
aart
en
Uru
guay
Primary Secondary%

- 18 -
and maintenance costs are substantially higher than for the older technologies. Despite this, it is necessary to consider the role that CAI and IAI have in schools, given their potential impact on the behaviour, performance and motivation of both students and teachers, as well as on school management and system-wide changes.
Computer-assisted instruction (CAI)
The proportion of schools with CAI is an indicator used to monitor WSIS target 7, which refers to adapting curricula to meet the challenges of the information society. It does not however shed light on the intensity of use by students or teachers, nor on its quality. According to Figure 7, there are more data available on institutions with CAI than other forms of ICT-assisted instruction, which may be a reflection of current national priorities. Based on 28 countries with primary and secondary level data, the Dominican Republic reported that none of their schools had CAI, which can mostly be attributed to the scarcity of computers in their schools (i.e. high LCRs).
Once again, CAI has been integrated in all primary and secondary education institutions in many Caribbean countries. This is also the case in Uruguay, where national policies played a significant role in ensuring widespread availability of computers as pedagogical tools in all regions of the country. The integration of CAI is less common in Nicaragua, Guyana and Paraguay, where 33% or fewer primary and secondary institutions have this type of ICT-assisted instruction. It is especially scarce at primary level, where it is offered in 15% or fewer of all schools.
Figure 7. Proportion of educational institutions with computer-assisted instruction (CAI), 2010
Notes: Data for Guyana, Costa Rica, Jamaica, Trinidad and Tobago, Barbados and Sint Maarten reflect public institutions only. Primary data for Anguilla reflect public institutions only while secondary data reflect total institutions. In Nicaragua and Guyana, secondary data only reflect lower secondary education. In Mexico and Jamaica, secondary data only reflect upper secondary education.
Source: UNESCO Institute for Statistics database and Statistical Tables 3 and 4.
m6 7
1523
38 4049 50 52 55 57 59
6471 71
77 77 79
99
33
11
28
m
63
78
9084
90 93
67
27
0
10
20
30
40
50
60
70
80
90
100
Jam
aica
Nic
arag
ua
Gu
yan
a
Par
agu
ay
Co
sta
Ric
a
Arg
en
tin
a
Bra
zil
Sain
t Lu
cia
Mo
nts
erra
t
Ecu
ado
r
St V
ince
nt/
Gre
nad
.
Gre
nad
a
El S
alva
do
r
Me
xico
Do
min
ica
Trin
idad
/To
bag
o
Ch
ile
Cay
man
Is
Ve
nez
uel
a
An
guill
a
Aru
ba
Bar
bad
os
Bri
tish
Vir
gin
Is
Cu
ba
St K
itts
/Nev
is
Sin
t M
aart
en
Turk
s/C
aico
s Is
Uru
guay
Primary Secondary%

- 19 -
Several countries in Latin America have prioritised the integration of CAI into secondary education institutions. In Brazil, CAI is available in 78% of secondary institutions, compared to 40% of primary institutions. A similar picture emerges for Jamaica (99% of secondary schools while data for primary and lower secondary education are not available), Ecuador (90% of secondary and 52% of primary schools) and Mexico (90% of secondary and 64% of primary schools).
While the availability of CAI in educational institutions is almost universally greater at the secondary level in Latin America and the Caribbean, there is greater availability of CAI in primary educational institutions in Venezuela and to a lesser extent in Chile. In Venezuela, it can attributed to strong financial investments to provide primary education level children with affordable laptops similar to efforts underway in Uruguay. For example, since 2009, the government has provided almost 2 million Canaima laptops to primary school children to incorporate CAI use in the classroom (Reardon, 2010; Robertson, 2012) (Statistical Tables 3 and 4.)
9. Role of computer integration and enrolment in programmes offering computer-assisted instruction (CAI)
In principle, the greater the integration of computers in schools, the more opportunities there are for students to use them pedagogically. However, while the proportion of educational institutions that offer CAI should be more or less predictive of the proportion of pupils enrolled in programmes offering CAI, this relationship is not completely symmetrical. For example, not all children attending schools with CAI will be enrolled in programmes where CAI is offered, either because of the curriculum or due to inadequacies in the current computer infrastructure. In some schools, this lack of symmetry could also be linked to other factors, including geographic region, the urban-rural divide, and differences in socio-economic status, culture, ethnicity or language.
Figure 8 demonstrates the relationship between the percentage of primary schools with CAI, which is one proxy to measure access to computers, and the percentage of total primary pupils that are enrolled in programmes offering CAI. In the Caribbean countries of Barbados and Cuba, where all primary schools have CAI, data show that enrolment closely reflects the proportion of schools with CAI, since 100% of primary level students are also enrolled in programmes offering CAI. The quality of CAI in Cuba is, however, of concern since the primary LCR is 28:1.
Consistent with this, 49% of primary schools in Saint Lucia have CAI compared to 53% of primary level students enrolled in programmes offering CAI. At the other end of the continuum, enrolment in programmes offering CAI is very low in Nicaragua (17%) and Paraguay (21%) where few primary schools offer CAI (6% in Nicaragua and 15% in Paraguay).
Some countries where schools are spread over vast rural and remote areas, including Argentina and Brazil, show what may be substantial differences between the proportion of schools with CAI and the proportion of primary pupils enrolled in programmes offering CAI. For example, the proportion of primary pupils enrolled in programmes offering CAI is substantially higher (66% in both countries) than the proportion of primary schools offering CAI (38% in Argentina and 40% in Brazil). This reveals that disproportionately higher numbers of students are located within schools that can offer enrolment in CAI programmes, which is more likely in urban and sub-urban areas. Rural and remote schools, in contrast, may not have enough computers to allow enrolment in programmes offering CAI and has historically been shown to occur in several

- 20 -
countries (Afonso, 2007). A substantial disparity between the proportion of schools with CAI and enrolment in such programmes is also notable in Ecuador, where many schools are isolated in mountainous areas. Here, for instance, while slightly more than one-half of primary schools (52%) have CAI, more than three-quarters (78%) of primary school pupils are enrolled in programmes offering CAI. Once again, this provides evidence for a concentration of student enrolment in schools where the infrastructure is more readily available and enrolment in programmes providing CAI is thus more likely (see Statistical Tables 3 and 6).
Figure 8. Relationship between enrolment in primary programmes offering CAI and access to computers as measured by the proportion of primary schools with CAI, 2010
Notes: Data for Anguilla and Barbados reflect public institutions only. Source: UNESCO Institute for Statistics database and Statistical Tables II.3 and II.6.
10. Gender disparity in enrolment in programmes offering ICT
The integration of ICT in education is frequently thought to be a means of promoting more equitable educational outcomes, where technology is viewed as the “great equaliser”. However, the integration of technology might, in fact, exacerbate differences already existing between demographic groups in terms, for example, of socio-economic status, location (e.g. urban versus rural), culture, or ethnicity. This would be especially true if particular groups tend systematically to be excluded from benefiting from the potential offered by ICT. Gender is another characteristic that, in certain circumstances, has been shown to have an influence in determining access to, participation in, retention and completion of education (UIS, 2010). While the integration of ICT in education may help to bridge certain gaps, there has also been substantial analysis of the digital divide, based on the personal characteristic of gender (Gorski, 2005). For instance, many researchers have focused on differences in the manner in which girls and boys use ICT in order to learn and experience the world around them. From this perspective, it is important to assess ICT in education not only at an institutional level, but also at the individual level, through the lens of gender.
Anguilla
Argentina
Barbados
Brazil
Cayman IslandsChile
Cuba
Dominica
Ecuador
El SalvadorGrenada
Nicaragua
Paraguay
Saint Lucia
St Kitts/Nevis
Uruguay
0
10
20
30
40
50
60
70
80
90
100
0 10 20 30 40 50 60 70 80 90 100
Pro
po
rtio
n o
f p
rim
ary
sch
oo
ls w
ith
CA
I
Enrolment in primary programmes offering CAI%
- 21 -
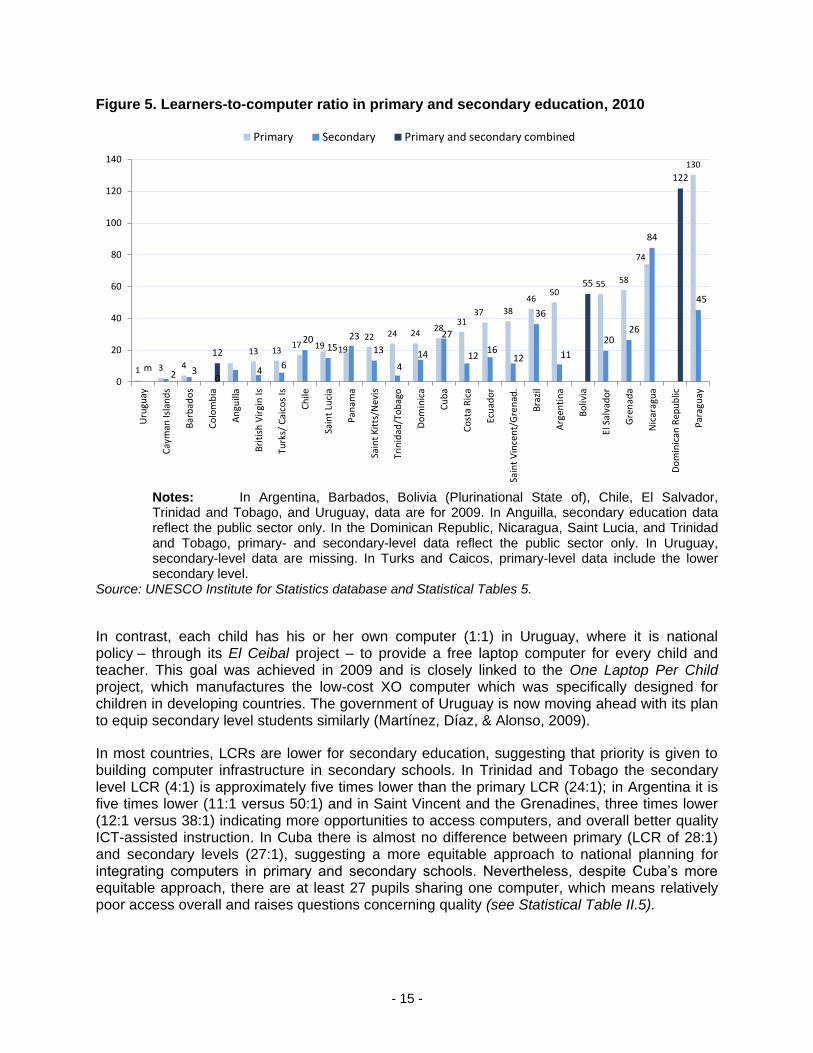
Figure 9 shows sex-disaggregated data on the percentage of total primary level enrolments that are also enrolled in programmes offering CAI. Overall, there is little or no evidence for differences in enrolment between males and females for the vast majority of the twenty-two (22) countries with data. These results, though, say nothing about any potential differences in the intensity of use by girls and boys, nor on how the technology is being used. Enrolment differences based on gender do exist in a few countries where the level of ICT resources is less than universal, usually favouring enrolment of boys. In Grenada 71% of males are enrolled in primary programmes offering CAI, compared to 62% of females, while in Nicaragua the proportions are 21% of males and 13% of females. Saint Lucia, provides an example of a country where primary level females have a slight advantage – 53 % of females are enrolled in programmes with CAI compared to 49% of boys.
Figure 9. Proportion of primary-level pupils enrolled in programmes offering CAI, by sex, 2010
Notes: Data for Anguilla, Barbados, and Trinidad and Tobago reflect public institutions only. Source: UNESCO Institute for Statistics database and Statistical Table II.6.
11. Building Internet connectivity in schools: Preparing schools for Internet-assisted instruction (IAI)
One of the regional goals of eLAC2015 for Latin America and the Caribbean is to connect all public educational institutions to the Internet via broadband connections. Given that connectivity is a prerequisite for the integration of Internet-assisted instruction (IAI), an analysis of basic Internet connectivity is primordial if we are to determine a country’s level of preparedness. The indicator – the proportion of schools with Internet access by type – is another core UIS ICT4E indicator, as well as an indicator used to measure WSIS target 2 to connect all schools with ICT. It essentially measures Internet capacity in educational institutions.

- 22 -
Figure 10 shows the proportion of primary and secondary educational institutions with any type of Internet connection, whereby the Internet is defined as: worldwide interconnected networks that enable users to share information in an interactive format – referred to as hypertext – through multiple wired or wireless devices (personal computers, laptops, PDAs, smartphones, etc.) via broadband and narrowband connections.
Similar patterns emerge revealing an advanced state of ICT development in a number of Caribbean countries where 100% of primary and secondary schools in Aruba, Bahamas, Barbados, British Virgin Islands, Saint Kitts and Nevis, and Saint Lucia have Internet connections. In contrast, relatively fewer educational institutions in a number of South and Central American countries have Internet connections, including Nicaragua, Paraguay and Venezuela, where 20% or fewer of primary and secondary schools are connected. In Suriname, 21% of secondary schools have an Internet connection, compared to no (0%) primary schools. It is interesting to note however that Venezuela has one of the world’s fastest growth rates among Internet and is supported by strong policies implemented at the central government level. Despite this, Venezuela is also considered to have one of the slowest Internet connections globally and is mostly limited to urban centres. To deal with these challenges, Venezuela is constructing 5,796 km of fibre optic cable to improve access to new regions (Robertson, 2012).
Figure 10. Proportion of primary and secondary education institutions with Internet connectivity, 2010
Notes: Data for Anguilla, Bahamas, Barbados and Trinidad and Tobago reflect public educational institutions only. Data for Argentina, Bahamas, Barbados, Chile, El Salvador, Montserrat, Suriname, Trinidad and Tobago, and Uruguay reflect 2009.
Source: UNESCO Institute for Statistics database and Statistical Table II.2.
- 23 -
In general, secondary educational institutions are given priority for the integration of Internet connectivity. Secondary educational institutions are, for example, 3.3 times more likely to have an Internet connection than primary educational institutions in Ecuador, 2.4 times more likely in Turks and Caicos, 2.1 times more likely in El Salvador, and 1.9 times more likely in Brazil. (Statistical Table II.3 and II.4).
While Figure 10 shows the proportion of primary and secondary educational institutions with an Internet connection, data that are disaggregated by type of Internet connection are less frequently available at country level. However, data disaggregated by type of Internet connection type are significant as they shed light on the capacity of schools to provide learners with the ICT resources they need to perform online activities requiring significant bandwidth, such as streaming video, two-way synchronous video communication (i.e. video-conferencing) or using embedded applications that have high capacity requirements. At the same time, this type of data is also useful as it sheds light on the proportion of schools that use narrowband Internet connections, which to a certain degree can limits pupil’s capacity for online learning.
Figure 11 shows the extent of fixed broadband connectivity for 22 countries that provide data disaggregated according to bandwidth. According to the data, several small Caribbean countries with concentrated populations including Barbados, British Virgin Islands, Saint Kitts and Nevis, Saint Lucia and Sint Maarten report that 100% of primary and secondary schools have fixed broadband connections. This is not universal in the region though, as Saint Vincent and the Grenadines and Dominica provide data showing the coexistence of both broadband and other types of Internet connection (e.g. narrow-band connectivity). Of the 55% of all primary schools with Internet in Saint Vincent and the Grenadines, 30% and 25 % have fixed broadband, versus other types of connection (e.g. narrowband). And of the 100 % of all secondary schools with Internet, 54% and 46% have fixed broadband, versus other connection types.
Fixed broadband connectivity presents a challenge for a number of relatively large South American countries, with a substantial urban-rural divide and varying population density. Chile and Argentina provide data showing that both fixed broadband and other types of connectivity typically coexist. In Argentina for example, out of 29% of primary and 50% of secondary institutions that are connected, not many more than half of these schools are connected by fixed broadband (17% and 33% respectively). In Colombia, where 75% of primary and secondary schools are connected to the Internet, a substantial minority of Internet connections in educational institutions are via fixed broadband (9% of all schools). This suggests that the majority of students might be faced, at times, with some limitations regarding their use of the Internet for pedagogical purposes. Uruguay, on the other hand, with its ambitious El Ceibal project, has been able to provide fixed broadband to 95% of primary and 100% of secondary schools, including both urban and rural sub-regions. However, in 2009, the government reported that in 70% of primary schools, only half the XO laptop computers could be online at the same time. Furthermore, two out of five rural schools had no connection, and were required to transport students elsewhere for exams (Economist, 2009).

- 24 -
Figure 11. Proportion of education institutions by connection type, 2010
Notes: Data for Barbados, Sint Maarten and Trinidad and Tobago reflect public institutions only. Data
for Argentina, Barbados, Montserrat and Trinidad and Tobago are from 2009. Data for Colombia reflect combined public primary and secondary level institutions only. Primary data for Costa Rica and Jamaica are missing.
Source: UNESCO Institute for Statistics database and Statistical Tables II.3 and II.4.
The secondary level also has preference regarding the integration of fixed broadband connectivity. For example, while 44% of primary schools in Trinidad and Tobago and 50% in Grenada have fixed broadband connectivity, all secondary level schools (100%) in both countries are connected via fixed broadband. Similarly, Cayman Islands, Dominica and Anguilla also show a preference for integrating fixed broadband connectivity in secondary schools.
Some of the most challenged countries in the region provide evidence of a leapfrogging phenomenon in terms of the integration of Internet connectivity. For example, in Nicaragua approximately 4% of primary schools and 18% of secondary schools have Internet connections, while in El Salvador the figures are 21% and 46%, respectively. However, it is noteworthy that all connections are fixed broadband and there are no data to support the existence of narrowband or other types of Internet connectivity.
Internet-assisted instruction (IAI)
IAI is defined as an interactive learning method in which the Internet is used to deliver instructional material on a computer or through other devices in accordance with learners’ pedagogical needs. IAI is different from CAI in that it provides learners with access to the World Wide Web (WWW) and two-way communication with other Internet users and / or the teacher. However, due to its connectivity requirements, IAI is ultimately more costly than CAI and other forms of ICT-assisted instruction.

- 25 -
The proportion of educational institutions with IAI is an indicator used to monitor WSIS target 7, which refers to adapting curricula to meet the challenges of the information society. Data are available at both primary and secondary levels for 18 countries in the region. In general the proportions of schools with IAI are lower than those with CAI. In most countries this may be attributed to levels of connectivity, while in some countries it could be related to other factors, such as a lack of clear policy or curricular directives regarding the integration of IAI in schools.
According to Figure 12, IAI is universally available (100%) in primary and secondary schools in various Caribbean countries, including Barbados, British Virgin Islands, Cayman Islands and Saint Kitts and Nevis. IAI is also widely available in Uruguay where 95% of primary and 100% of secondary education institutions offer it. In contrast, IAI is not readily available in Turks and Caicos as only 6% of primary and 11% secondary level institutions use IAI compared to the 41% of primary and 100% of secondary institutions that are connected to the Internet, and therefore can support the provision of IAI.
While many countries continue to face challenges in terms of integrating IAI in all schools, this seems to be more acute at the primary level, as several countries demonstrate higher levels of IAI integration in secondary level educational institutions. Secondary schools are at least twice as likely to offer IAI in Argentina, Brazil, Trinidad and Tobago, Saint Lucia and Montserrat than primary schools. In Ecuador the difference is three times (Statistical Tables II.3 and II.4).
Figure 12. Proportion of educational institutions with Internet-assisted instruction (IAI), 2010
Notes: Data for Barbados, and Trinidad and Tobago reflect public educational institutions only. For
Jamaica data reflect ISCED 3 level in public institutions only. For Guyana data reflect ISCED 2 level in public institutions only. For Argentina, Chile, Montserrat, Suriname, Trinidad and Tobago, and Uruguay, data are for 2009.
Source: UNESCO Institute for Statistics database and Statistical Tables II.3 and II.4.
6
15 17
32
46 50 55 55
75 77
95
12 13 11
4536
69
56
84
0102030405060708090
100
Me
xico
Gu
yan
a
Turk
s/C
aico
s Is
Ecu
ado
r
Arg
en
tin
a
Bra
zil
Trin
idad
/To
bag
o
Sain
t Lu
cia
Mo
nts
erra
t
Ch
ile
St V
ince
nt/
Gre
nad
.
An
guill
a
Cay
man
Isla
nd
s
Jam
aica
Uru
guay
Bar
bad
os
Bri
tish
Vir
gin
Is
St K
itts
/Nev
is
Primary Secondary%

- 26 -
12. Teachers and ICT in education
Teachers are frequently considered as the most important external influence on classroom learning and education in general. As such, teachers play an invaluable role in ensuring that ICTs are used effectively by pupils inside and outside of the classroom. Teachers need not only to know how to instruct pupils to use ICT effectively, but they also need to be trained to use ICTs themselves in order to teach various subjects more effectively. How this is achieved varies from one country to another, though, given the widely disparate policies and curricula on how best to integrate ICT and apply them in the classroom, not to mention the differences in teacher training programmes and professional development in general.
WSIS Target 7, which has the goal of adapting all primary and secondary school curricula to meet the challenges of the information society, measures these aspects of teacher training and ICT preparedness using the following two indicators: i) the proportion of ICT-qualified teachers in schools and ii) the proportion of teachers trained to teach subjects using ICT.
The proportion of ICT-qualified teachers in schools indicator measures the availability of teachers trained, according to nationally defined qualification standards, to teach basic computer skills (or computing) in primary and secondary schools. The indicator measures the capacity of teachers within the overall workforce, but does not measure the actual number of teachers teaching or having taught basic computer skills, nor is it a measure of the quality and effectiveness of course delivery. In addition to being a WSIS Target 7 indicator, it is also one of the UIS core indicators on ICT in education.
Table 2 shows combined primary and secondary level data on the proportion of teachers that are ICT-qualified, compared to the actual proportion of teachers who teach basic computer skills. Overall, the proportion of teachers that are ICT-qualified is low – fewer than 10% of all primary and secondary teachers in fourteen out of 27 countries are qualified to teach basic computer skills. In some countries, this is not surprising and may reflect current nationally set targets, including Suriname and Grenada, where the level of integration of ICT is low.
On the other hand, the proportion of ICT-qualified teachers is inadequate in Argentina where 3% of teachers are ICT-qualified compared to the 5% that are currently teaching basic computer skills. It is noteworthy that in Saint Kitts and Nevis, where 100% of primary schools have all four types of ICT (i.e. RAI, TAI, CAI and IAI), a negligible number of teachers are ICT-qualified. This suggests that, although there are ample resources, ICT training is perhaps not adequately codified in teacher training programmes and/or continuing professional development. Meanwhile, at the other end of the continuum, Aruba trains 100% of its teachers to teach basic computer skills, in both primary and secondary education, suggesting a stronger emphasis on teacher training and preparedness.
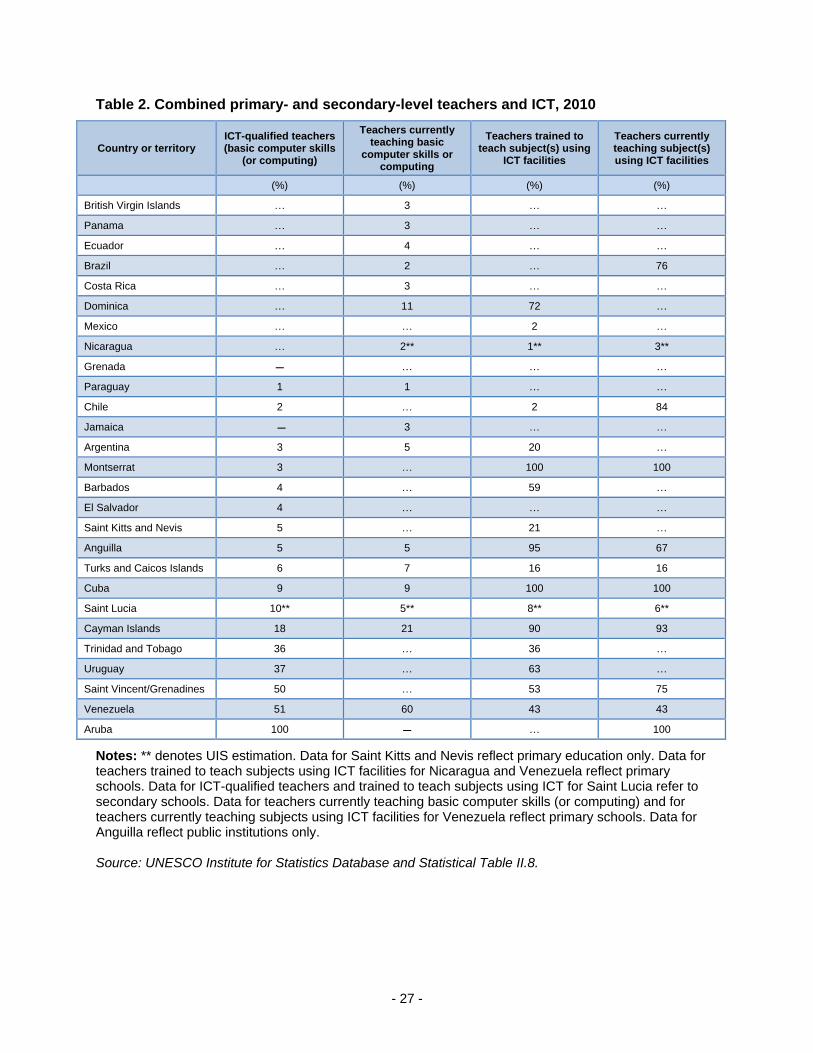
- 27 -
Table 2. Combined primary- and secondary-level teachers and ICT, 2010
Country or territory ICT-qualified teachers (basic computer skills
(or computing)
Teachers currently teaching basic
computer skills or computing
Teachers trained to teach subject(s) using
ICT facilities
Teachers currently teaching subject(s) using ICT facilities
(%) (%) (%) (%)
British Virgin Islands … 3 … …
Panama … 3 … …
Ecuador … 4 … …
Brazil … 2 … 76
Costa Rica … 3 … …
Dominica … 11 72 …
Mexico … … 2 …
Nicaragua … 2** 1** 3**
Grenada – … … …
Paraguay 1 1 … …
Chile 2 … 2 84
Jamaica – 3 … …
Argentina 3 5 20 …
Montserrat 3 … 100 100
Barbados 4 … 59 …
El Salvador 4 … … …
Saint Kitts and Nevis 5 … 21 …
Anguilla 5 5 95 67
Turks and Caicos Islands 6 7 16 16
Cuba 9 9 100 100
Saint Lucia 10** 5** 8** 6**
Cayman Islands 18 21 90 93
Trinidad and Tobago 36 … 36 …
Uruguay 37 … 63 …
Saint Vincent/Grenadines 50 … 53 75
Venezuela 51 60 43 43
Aruba 100 – … 100
Notes: ** denotes UIS estimation. Data for Saint Kitts and Nevis reflect primary education only. Data for teachers trained to teach subjects using ICT facilities for Nicaragua and Venezuela reflect primary schools. Data for ICT-qualified teachers and trained to teach subjects using ICT for Saint Lucia refer to secondary schools. Data for teachers currently teaching basic computer skills (or computing) and for teachers currently teaching subjects using ICT facilities for Venezuela reflect primary schools. Data for Anguilla reflect public institutions only. Source: UNESCO Institute for Statistics Database and Statistical Table II.8.

- 28 -
In Uruguay, one of the aims of its El Ceibal project is to ensure that teachers are trained to teach basic computer skills, so it is not surprising that the proportion of such teachers is relatively high (37%). It is also interesting to note that, in Uruguay, teachers tend to be relatively older than in other countries in Latin America and the Caribbean and are more similar in terms of their age profile to OECD countries – a fact that has resulted in some teachers not readily adapting to the integration of ICT in education (Economist, 2009).
The proportion of teachers trained to teach subjects using ICT measures the availability of teachers trained according to nationally defined qualification standards to teach one or more subjects using ICT to support instruction in primary and secondary schools. Again, this indicator does not measure the number of teachers currently teaching or previously having taught subjects using ICT, nor does it measure the quality and effectiveness of course delivery.
Table 2 also shows combined primary and secondary level data on the proportion of teachers that are trained to teach subjects using ICT, compared to the proportion of teachers actually teaching a subject or subjects using ICT facilities. Seventeen out of 27 countries provided data on the proportion of teachers trained to teach using ICT. This figure is typically higher than those trained to teach basic computing, which suggests that while countries do not specifically train teachers to teach basic computer skills, they more often emphasise training teachers in how to use ICT in their general classroom instruction. In Cuba, 100% of primary and secondary teachers have been trained formally to teach other subjects using ICT. Similar figures are reported by Montserrat (100%) and Cayman Islands (90%). In contrast, formal training how to use ICT in teaching different subjects is lacking in Nicaragua, where only 1% of teachers have been trained (see Statistical Table II.8).

- 29 -
13. Conclusions
The integration of ICT in education and the necessary supporting infrastructure are increasingly being formalised internationally (e.g. the Millennium Development Goals, the World Summit on the Information Society), regionally (e.g. eLAC2015) in Latin America and the Caribbean, as well as at national level. One of the roles of the UNESCO Institute for Statistics (UIS), which is the United Nation’s repository for statistics on education and other areas mandated to UNESCO, is to contribute to benchmarking and monitoring the integration of and access to ICT in education, through the establishment of internationally comparable and policy-relevant indicators. In this particular vein, the UIS collected data in 2010/2011 from 38 countries in Latin America and the Caribbean as part of its regional, demand-driven survey rollout strategy. The questionnaire collected data on ICT in education policy and the curriculum, school level infrastructure, enrolments in programmes offering ICT-assisted instruction, as well as data related to teachers’ training in and use of ICT in education.
This analysis mainly focused on indicators of ICT in education that are included in both the list of UIS core ICT4E indicators and the WSIS targets. The analysis therefore focused on the level of integration of different forms of ICT-assisted instruction, including both older forms of radio- and television-assisted instruction, as well as newer forms, including computer- and Internet-assisted instruction. In addition, this paper also examined the status of the infrastructure needed for their integration—electricity for all forms of ICT-assisted instruction, learner-to-computer ratios and computer labs for computer-assisted instruction, as well as the prevalence of Internet connectivity for Internet-assisted instruction. While it is important to assess institutional capacity in order to develop policy on the use of ICT in education, information on students and teachers themselves adds another important dimension. Statistics on enrolments, on teachers’ training in ICT and the use of ICT use in education are also therefore presented.
While we know that each type of ICT-assisted instruction has its own strengths and weaknesses, several factors ultimately influence which ICT countries choose to emphasise in their national planning, including policies and/ or curricula related to ICT. The proportion of schools that offer ICT will also depend on economic, infrastructural (e.g. availability of electricity, Internet connectivity and type) and other factors, including teachers’ training and preparedness. To some degree, countries will probably increasingly adopt newer forms of ICT, including computer-assisted instruction (CAI) and Internet-assisted instruction (IAI) to keep pace with the evolving information society. Whether or not countries discontinue their use of older forms of ICT, such as radio-assisted instruction (RAI) and television-assisted instruction (TAI) is yet another decision that should be given careful consideration. Undoubtedly a myriad of factors will influence national planning for ICT in education, but it is noteworthy that the landscape is becoming increasingly blurry, given the growing tendency towards the convergence of ICT where computers, especially connected via broadband, can provide an ever-widening array of possibilities for both learning and teaching.
The data consistently show the emergence of particular patterns related to ICT in education in Latin America and the Caribbean. First, Caribbean countries (particularly Anglophone) have much higher integration levels of ICT-assisted instruction and the essential infrastructure, including basic hardware (i.e. computers) and Internet connectivity, than most Latin American countries from South and Central America. This applies both for older forms of radio-assisted instruction and new interactive forms of computer-assisted and Internet-assisted instruction. Moreover, there are a number of countries in Central and South America where connection to electrical grids and building an adequate foundation of computer hardware and connectivity – precursors to various forms of ICT-assisted instruction – is currently a challenge.
- 30 -
Despite the potential benefits of radio-assisted instruction and the evidence of its effectiveness in several contexts (e.g. where there is no electricity grid), there are little data to suggest that it continues to be commonly used across the region, which might reflect shifting priorities. Television-assisted instruction tends to be somewhat more common in the region and the data show that where it has been integrated in educational institutions, it is very nearly universal in many countries, while lacking in others.
Among the newer forms of ICT-assisted instruction, computer-assisted instruction is the most commonly cited and may reflect its current importance in policy-making. There are certainly vast differences between countries whereby many countries have full integration (Caribbean) while others have very low integration levels, particularly in Central and South America. The present study also analysed the learner-to-computer ratio (LCR), in order to gain insight into the capacity to deliver CAI. For instance, the LCR ranges from 1:1 in Uruguay, where there are strong policies regarding the integration of ICT in education, to 122:1 in the Dominican Republic. This information is important, as it also sheds light on the quality of CAI. For example, while Cuba offers CAI in all schools, a LCR of 28:1 means that each student actually has little time to benefit from it.
As has been demonstrated, there are many factors at the root of educational exclusion, but in most countries in Latin America and the Caribbean, gender does not seem to be significant –data suggest that girls are rarely excluded from enrolling in programmes offering CAI in primary education. It is also worth noting that those countries where girls are at a disadvantage in terms of enrolling in programmes offering CAI also tend to be the same countries in which general access is most limited. In other words, participation for both males and females is relatively low, suggesting competition for resources. Internet-assisted instruction is not as common as computer-assisted instruction, which is not surprising, given that Internet connectivity is also less readily available in many countries.
Finally, as a general pattern found among the data, the majority of countries emphasise the integration of ICT-assisted instruction and their related infrastructure in secondary educational institutions, compared to primary level institutions. This will, to a large degree, reflect differences between primary and secondary education in terms of policy and the curriculum. There are exceptions to this pattern, for example where strong policy directives have been implemented, as is the case in Uruguay, where the El Ceibal project has prioritised the equipment of primary schools children with laptops in order to achieve a 1:1 learner-to-computer ratio.
- 31 -
References
Afonso, Carlos (2007). “2007 – Focus on Participation (Brazil)”. Global Information Society Watch.
http://www.giswatch.org/sites/default/files/GISW_Brazil.pdf
Bosch, A., R. Rhodes and S. Kariuki (2002). “Interactive radio instruction: An update from the field” in
W.D. Haddad and A. Draxler (eds.), Technologies for Education: Potentials, Parameters and Prospects,
(pp. 134-143). Paris: UNESCO.
Dada, Danish (2006). “E-readiness for developing countries: Moving the focus from the environment to
the users”. The Electronic Journal on Information Systems in Developing Countries. 27, 6, 1-14.
ECLAC (2010). “Plan of Action for the Information and Knowledge Society in Latin America and the Caribbean (eLAC2015)”. Third Ministerial Confernce on the Information Society in Latin America and the Caribbean. Lima, 21-23 November, 2010.
ECOSOC (2011).” Challenges for education with equity in Latin America and the Caribbean”. Regional
Preparatory Meeting 2011 United Nations Economic and Social Council Annual Ministerial Review
ECOSCO – AMR . Buenos Aires, Argentina, May 12-13, 2011.
EDC (2012). http://idd.edc.org/projects/paraguay-early-childhood-iri-math-program
Economist (2009). “Laptop for all: A pioneering project’s chequered start”. The Economist.
http://www.economist.com/node/14558609
Gorski, P. (2005). “Education equity and the digital divide”. Association for the Advancement of
Computing in Education Journal, 13(1), 3-45.
Hinostroza, J.E., C. Labbé, C. Matamala and M. Brun (2011). The state of e-readiness of Latin America
and the Caribbean primary and secondary schools in the use of ICT for educational purposes. Temuco:
Instituto de Informatica Educativa.
Johnstone, Sally (2005). “Forum on the Impact of Open Courseware for Higher Education in Developing Countries – Final Report”. Education Quarterly. 3, 15-18.
Kozma, R.B. (2008). “Comparative analysis of policies for ICT in education” in J. Voogt and G. Knezek
(eds.), International handbook of information technology in primary and secondary education (Vol. 20, pp.
1083-1096). New York: Springer.
Martínez, A.L., Díaz, D. & Alonso, S. (2009). Primer informe nacional de monitoreo y evaluación de
impacto social del Plan Ceibal, 2009. Montevideo: Área de Monitoreo y Evaluación de Impacto Social del
Plan Ceibal.
OECD (2007). Giving Knowledge for Free: The Emergence of Open Educational Resources. Paris:
Organisation for Economic Co-operation and Development.
Partnership on Measuring ICT for Development (2011). Measuring the WSIS Targets: A Statistical
Framework. Geneva: International Telecommunication Union (ITU).
Reardon, Juan (2010). “Venezuelan Government Begins Distribution of 350,000 Laptop Computers to
School Children”. Venezuelanalysis.com. http://venezuelanalysis.com/news/5792
Robertson, Ewan (2010). “New Study Says Venezuela is a World Leader in Increasing Internet Usage” (+
video). Venezuelanalysis.com. http://venezuelanalysis.com/news/7169
Trucano, M (2010). “Interactive Radio Instruction: A successful permanent pilot project?” Retrieved from
http://blogs.worldbank.org/edutech/iri

- 32 -
United Nations (2000). United Nations Millennium Declaration. United Nations General Assembly,
Resolution A/RES/55/2, 18 September 2000.
United Nations (2012). Millennium Development Goals. http://www.un.org/millenniumgoals/global.shtml
UNESCO (2002). Forum on the Impact of Open Courseware for Higher Education in Developing Countries Final report. Paris, 1-3 July 2002.
UNESCO (2012). http://www.unesco.org/education/educprog/lwf/doc/portfolio/abstract8.htm
UNESCO (2012). “Learning without frontiers”. Telesecundaria, Mexico. Paris. UNESCO.
http://www.unesco.org/education/educprog/lwf/doc/portfolio/abstract8.htm
UNESCO Institute for Statistics (UIS) (2009). Guide to Measuring Information and Communication
Technologies (ICT) in Education. UIS Technical Paper No. 2. Montreal: UIS.
UNESCO Institute for Statistics (UIS) (2010). Global Education Digest 2010: Comparing Education
Statistics Across the World. Montreal: UIS.
Wolff, L., C. de Moura Castro, J.C. Navarro and N. Garcia (2002). “Television for secondary education:
Experience of Mexico and Brazil” in W.D. Haddad and A. Draxler (eds.), Technologies for Education:
Potentials, Parameters and Prospects (pp. 144-152). Paris: UNESCO.
- 33 -
Annex I. Reader’s guide
The following symbols are used throughout the report and the statistical tables:
Symbol Interpretation
… Data missing (or not available)
* Country estimation
** UIS estimation
– Magnitude nil or negligible
. Not applicable
+1 Data refer to 2011
-1 Data refer to 2009
-2 Data refer to 2008
x Included in another category
a Public institutions only
b Private institutions only
c Refers to ISCED 1-2
d Refers to ISCED 1-3
e Refers to ISCED 2 only
f Refers to ISCED 3 only

- 34 -
Annex II. Statistical tables
TABLE II.1. Political commitments on ICT in education | ISCED 1, 2 and 3 | 2009-2010 Observation: √ = Yes x = No
PrimaryLow er
Secondary
Upper
secondaryPrimary
Low er
Secondary
Upper
secondaryPrimary
Low er
Secondary
Upper
secondaryPrimary
Low er
Secondary
Upper
secondary
(1) (2) (3) (4) (5) (6) (7) (8) (9) (10) (11) (12) (13)
Anguilla √ √ √ √ √ √ √ √ √ √ √ √ x
Antigua and Barbuda x x x √ √ √ √ √ √ √ √ √ x
Argentina √ √ √ x √ √ √ √ √ x √ √ x
Aruba x √ √ x √ √ x √ √ x x x √
Bahamas √ √ √ √ √ √ √ √ √ √ √ √ x
Barbados √ √ √ √ √ √ √ √ √ √ √ √ √
Belize √ √ √ √ √ √ x x x x x x x
Boliv ia (Plurinational State of) √ √ √ x x x x x x √ √ √ √
Brazil √ √ √ x x x √ √ √ √ √ √ x
British Virgin Islands x x x x x x x x x √ √ √ x
Cay man Islands √ √ √ √ √ √ x x x x x x x
Chile √ √ √ √ √ √ √ √ √ √ √ √ x
Colombia x x x √ √ √ x x x x x x x
Costa Rica x x x x x x √ √ √ x x x x
Cuba √ √ √ x x x x x x x x x √
Curaçao x x x x x x x x x x x x x
Dominica x x x x x x x x x x x x x
Dominican Republic x x x x x x √ √ √ x x x x
Ecuador √ √ √ √ √ √ √ √ √ √ √ √ √
El Salv ador x x x √ √ √ x x x √ √ √ x
Grenada √ √ √ √ √ √ x x x √ √ √ x
Guatemala √ √ √ √ √ √ √ √ √ √ √ √ x
Guy ana x √ x √ √ √ x x x x x x x
Jamaica x √ √ x √ √ x √ √ x √ √ x
Mex ico √ √ x √ √ x √ √ x √ √ x √
Montserrat x x x x x x x x x x x x x
Nicaragua √ √ √ x x x x x x √ √ √ √
Panama √ √ √ √ √ √ x x x √ √ √ √
Paraguay √ √ √ x x x x x x x x x x
Saint Kitts and Nev is x x x x x x x x x √ √ √ x
Saint Lucia √ √ √ √ √ √ √ √ √ x x x x
Saint Vincent and the Grenadines √ √ √ √ √ √ √ √ √ √ √ √ …
Sint Maarten x x x x x x √ √ √ √ √ √ x
Suriname x x x x x x x x x x x x x
Trinidad and Tobago x √ √ √ √ √ √ √ √ √ √ √ x
Turks and Caicos Islands x x x x x x x x x √ √ √ x
Uruguay √ √ √ √ √ √ √ √ √ √ √ √ x
Venezuela (Boliv arian Republic of) √ √ √ √ √ √ √ √ √ √ √ √ √
Country or Territory
National Policy National Plan Regulatory Provision(s) Regulatory Institution
Strategies to promote integration of ICT in education
National Policy for
the use of Open
Eucational
Resources
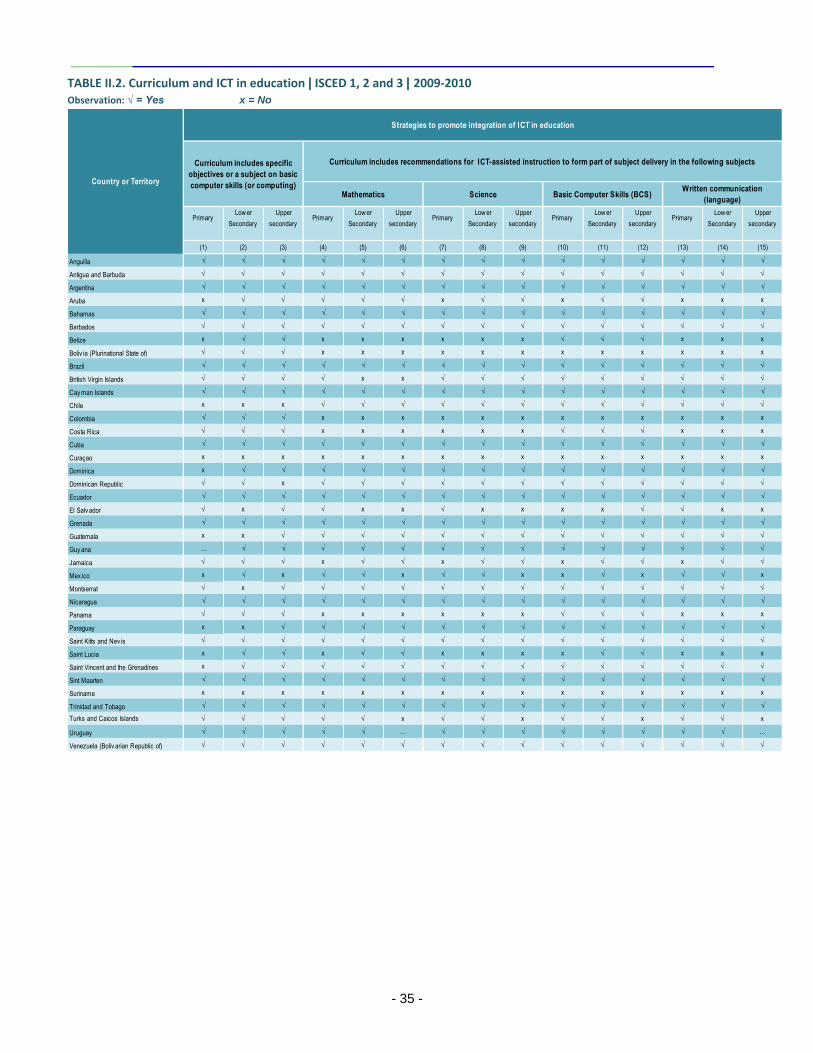
- 35 -
TABLE II.2. Curriculum and ICT in education | ISCED 1, 2 and 3 | 2009-2010 Observation: √ = Yes x = No
PrimaryLow er
Secondary
Upper
secondaryPrimary
Low er
Secondary
Upper
secondaryPrimary
Low er
Secondary
Upper
secondaryPrimary
Low er
Secondary
Upper
secondaryPrimary
Low er
Secondary
Upper
secondary
(1) (2) (3) (4) (5) (6) (7) (8) (9) (10) (11) (12) (13) (14) (15)
Anguilla √ √ √ √ √ √ √ √ √ √ √ √ √ √ √
Antigua and Barbuda √ √ √ √ √ √ √ √ √ √ √ √ √ √ √
Argentina √ √ √ √ √ √ √ √ √ √ √ √ √ √ √
Aruba x √ √ √ √ √ x √ √ x √ √ x x x
Bahamas √ √ √ √ √ √ √ √ √ √ √ √ √ √ √
Barbados √ √ √ √ √ √ √ √ √ √ √ √ √ √ √
Belize x √ √ x x x x x x √ √ √ x x x
Boliv ia (Plurinational State of) √ √ √ x x x x x x x x x x x x
Brazil √ √ √ √ √ √ √ √ √ √ √ √ √ √ √
British Virgin Islands √ √ √ √ x x √ √ √ √ √ √ √ √ √
Cay man Islands √ √ √ √ √ √ √ √ √ √ √ √ √ √ √
Chile x x x √ √ √ √ √ √ √ √ √ √ √ √
Colombia √ √ √ x x x x x x x x x x x x
Costa Rica √ √ √ x x x x x x √ √ √ x x x
Cuba √ √ √ √ √ √ √ √ √ √ √ √ √ √ √
Curaçao x x x x x x x x x x x x x x x
Dominica x √ √ √ √ √ √ √ √ √ √ √ √ √ √
Dominican Republic √ √ x √ √ √ √ √ √ √ √ √ √ √ √
Ecuador √ √ √ √ √ √ √ √ √ √ √ √ √ √ √
El Salv ador √ x √ √ x x √ x x x x √ √ x x
Grenada √ √ √ √ √ √ √ √ √ √ √ √ √ √ √
Guatemala x x √ √ √ √ √ √ √ √ √ √ √ √ √
Guy ana … √ √ √ √ √ √ √ √ √ √ √ √ √ √
Jamaica √ √ √ x √ √ x √ √ x √ √ x √ √
Mex ico x √ x √ √ x √ √ x x √ x √ √ x
Montserrat √ x √ √ √ √ √ √ √ √ √ √ √ √ √
Nicaragua √ √ √ √ √ √ √ √ √ √ √ √ √ √ √
Panama √ √ √ x x x x x x √ √ √ x x x
Paraguay x x √ √ √ √ √ √ √ √ √ √ √ √ √
Saint Kitts and Nev is √ √ √ √ √ √ √ √ √ √ √ √ √ √ √
Saint Lucia x √ √ x √ √ x x x x √ √ x x x
Saint Vincent and the Grenadines x √ √ √ √ √ √ √ √ √ √ √ √ √ √
Sint Maarten √ √ √ √ √ √ √ √ √ √ √ √ √ √ √
Suriname x x x x x x x x x x x x x x x
Trinidad and Tobago √ √ √ √ √ √ √ √ √ √ √ √ √ √ √
Turks and Caicos Islands √ √ √ √ √ x √ √ x √ √ x √ √ x
Uruguay √ √ √ √ √ … √ √ √ √ √ √ √ √ …
Venezuela (Boliv arian Republic of) √ √ √ √ √ √ √ √ √ √ √ √ √ √ √
Curriculum includes specific
objectives or a subject on basic
computer skills (or computing)
Strategies to promote integration of ICT in education
Curriculum includes recommendations for ICT-assisted instruction to form part of subject delivery in the following subjects
Country or Territory
Mathematics Science Basic Computer Skills (BCS) Written communication
(language)

- 36 -
EDUCATIONAL INSTITUTIONS – PRIMARY EDUCATION
TABLE II.3. Primary education | ICT infrastructure in educational institutions | ISCED 1 | 2010
Anguilla 100 100 100 100 100 100 100 100 … 100 75 100 75 100
Antigua and Barbuda 100 100 100 100 - - 2 3 … … 84 100 84 100
Argentina 92-1
91-1
70-1
65-1
… … … … 38-1
32-1
30-1
22-1
21-1
14-1
Aruba 100 100 100 100 … … … … 100 100 … … 100 100
Bahamas 100-1
100-1
100-1
100-1
… 100-1
… 100-1
… … … … … …
Barbados 100-1
100-1
100-1
100-1
100-1
100-1
… 100-1
… 100-1
… 100-1
… 100-1
Belize 84 73 97 75 … … … … … … … … … …
Boliv ia (Plurinational State of) … … … … … … … … … … … … … …
Brazil 90 89 66 61 … … 65 59 40 35 35 31 … …
British Virgin Islands 100 100 100 100 - - - - 100 100 … 100 100 100
Cay man Islands 100 100 100 100 4 - 69 100 77 100 73 92 77 100
Chile … … … … .-1
.-1
.-1
.-1
77-1
92-1
… 46-1
… 37-1
Colombia … 82d
… … … … … … … … … 85d
… 75d
Costa Rica 88 88 69 66 … … … … … 23 23 19 … …
Cuba 100 100 24 24 - - 100 100 100 100 100 100 - -
Curaçao … … … … … … … … … … … … … …
Dominica 100 100 100 100 39 35 42 43 71 82 71 82 71 82
Dominican Republic … 43c
73 25 1b,c
. . . … … … … … …
Ecuador 79 79 36 25 - - . . 52 44 36 25 … …
El Salv ador 95 94 40 19 .-1
.-1
.-1
.-1
59 54 34-1
26-1
--1
--1
Grenada 100 100 100 100 69 59 75 71 … … - - 28 12
Guatemala … … … … … … … … … … … … … …
Guy ana … 78 … 43 … … … 1 … 7 … 7 … 7
Jamaica 100 100 100 100 … … … … … … … … … …
Mex ico … … … … --1
--1
--1
--1
64-1
68-1
… … … …
Montserrat 100 100 100 100 100 - 100 100 50 100 50 50 50 50
Nicaragua 24 19 9 4 … … … - 6 4 5 3 5 3
Panama 71**
69**
32**
26**
… … … … … … 38 34 … …
Paraguay 91*
90*
19*
10*
… … … … 15*
9*
11*
5*
… …
Saint Kitts and Nev is 100 100 100 100 100 100 100 100 100 100 100 100 100 100
Saint Lucia 100 100 100 100 100 100 100 100 49 53 49 53 10 11
Saint Vincent and the Grenadines 100 100 100 100 100 100 100 100 … … 45 41 34 36
Sint Maarten 100 100 100 100 - - - - 100 100 - 100 - 43
Suriname 89*,-1
91*,-1
89*,-1
91*,-1
… … … … … … 18*,-1
18*,-1
… …
Trinidad and Tobago 100-1
100-1
100-1
1001
100 100-1
100-1
100-1
… 71-1
… 71-1
… 71-1
Turks and Caicos Islands 100 100 100 100 100 100 100 100 100 100 41 90 41 90
Uruguay 96-1
95-1
95-1
94-1
… … … … 100*,-1
100*,-1
100*,-1
100*,-1
100*,-1
100-1,*
Venezuela (Boliv arian Republic of) 54 50 31 20 … … 7 5 68 79 68 79 9 8
(%) (%) (%) (%)
Country or Territory
TotalPublicTotalPublicTotal
Educational
institutions with
radio-assisted
instruction (RAI)
Public
(13)(7) (8) (12)(10)(9) (11)
Total
(14)
Public
(6)(1) (2) (3) (4) (5)
Educational
institutions with
electricity
Educational
institutions with a
telephone
communication
facility
Public Total Public Total Public Total
Educational
institutions with
television-
assisted
instruction (TAI)
Educational
institutions with
computer-assisted
instruction (CAI)
Educational
institutions with
computer
laboratories
Educational
institutions with a
Local Area
Network (LAN)
(%) (%) (%)

- 37 -
CONTINUED…
TABLE II.3. Primary education | ICT infrastructure in educational institutions | ISCED 1 | 2010
Anguilla 75 100 75 100 75 100 26 25 … - 25 33
Antigua and Barbuda 84 100 … … … … - … … … 5 3
Argentina 29-1
21-1
17-1
11-1
17-1
11-1
… … … … 1-1
--1
Aruba 100 100 100 100 … … … … … … … …
Bahamas … … … … … … … … … … … …
Barbados … 100-1
… 100-1
… 100-1
… 25-1
100-1
100-1
13-1
12-1
Belize … … … … … … … … … … … …
Boliv ia (Plurinational State of) … … … … … … … … … … … …
Brazil 41 33 33 27 32 25 … … … … … …
British Virgin Islands 100 100 100 100 100 100 … … … … - -
Cay man Islands 77 100 77 100 77 100 31 33 12 - 77 100
Chile 55-1
49-1
44-1
37-1
55-1
49-1
48-1
32-1
. . 18-1
10-1
Colombia … 75d
… 9d
… … … … … … … …
Costa Rica … … … … … … … … … … 5 3
Cuba … … … … … … 45 45 100 100 - -
Curaçao 2 x 2 x … … … … … … … …
Dominica 66 61 37 43 … … 40 39 - - - -
Dominican Republic … … … … … … … … … … … …
Ecuador 18 11 … … 15 9 5 4 15 9 … …
El Salv ador 21 13 21 13 … … … … … … 5-1
3-1
Grenada 50 41 50 41 … … 33 35 - - - -
Guatemala … .. … … … … … … … … … …
Guy ana … 1 … … … … … … … … … …
Jamaica … … … … … … … … … … … …
Mex ico … … … … … … … … --1
--1
… …
Montserrat 50 50 50 50 50 50 20 17 50 50 - -
Nicaragua 4 3 4 3 … … … … … … 1 1
Panama 23 18 … … … … … … … … … …
Paraguay 8*
3*
… … … … … … … … 2*
-*
Saint Kitts and Nev is 100 100 100 100 100 100 25 25 … … 26 25
Saint Lucia 100 100 100 100 46 49 14 15 - - 4 3
Saint Vincent and the Grenadines 55 58 30 31 55 58 … … … … … …
Sint Maarten - 100 - 100 - - … 50 … - … 14
Suriname … … … … … … … … … … … …
Trinidad and Tobago … 44-1
… 44-1
… … … 24-1
100-1
100-1
… …
Turks and Caicos Islands 41 90 41 90 6 .. 25 25 … … 13 30
Uruguay 95*,-1
94*,-1
95*,-1
94*,-1
95*,-1
94*,-1
51*,-1
52*,-1
95*,-1
94*,-1
16*,-1
…
Venezuela (Boliv arian Republic of) 20 21 … … … … … 70 73 86 … …
(%)(%) (%) (%) (%)(%)
Country or Territory
(15) (16)
Educational
institutions with
access to the
Internet
(22)
Total Public
(18)(17)
Educational
institutions with
fixed broadband
Internet access
PublicTotal Total PublicTotal
(25)(19) (24)
Total
Educational
institutions with a
website
Educational
institutions with
open educational
resources
Educational
institutions with
ICT support
services
(26)
PublicPublic
(21) (23)
Educational
institutions with
Internet-assisted
instruction (IAI)
Total Public
(20)

- 38 -
EDUCATIONAL INSTITUTIONS – SECONDARY EDUCATION
TABLE II.4. Secondary education | ICT infrastructure in educational institutions | ISCED 2 and 3 | 2010
Anguilla 100 100 100 100 - - 100 100 100 100 100 100 100 100
Antigua and Barbuda 100 100 100 100 14 27 5 9 … … 100 100 100 100
Argentina 99-1
98-1
86-1
80-1
… … … … 63-1
56-1
55-1
47-1
41-1
31-1
Aruba 100 100 100 100 … … … … 100 100 100 100 100 100
Bahamas 100-1
100-1
100-1
100-1
… 100-1
… 100-1
… … … … … …
Barbados 100-1
100-1
100b,-1
100-1
100-1
100-1
… 100-1
… 100-1
… 100-1
… 100-1
Belize 100 100 83 86 … … … … … … … … … …
Boliv ia (Plurinational State of) … … … … … … … … … … … … … …
Brazil 98 98 87 84 … … 93 91 78 75 73 72 … …
British Virgin Islands 100 100 100 100 - - - - 100 100 100 100 100 100
Cay man Islands 100 100 100 100 27 - 100 100 100 100 … 100 … 100
Chile … … … … .-1
.-1
.-1
.-1
67-1
83-1
54-1
48-1
46-1
38-1
Colombia … 82d
… … … … … … … … … 85d
… 75d
Costa Rica 89 90 95 93 … … … 11 … … 63 57 … …
Cuba 100 100 100 100 - - 100 100 100 100 100 100 100 100
Curaçao … 100 … … … … … … … … … … … …
Dominica 100 100 100 100 80 71*
60 57 93 100 93 100 93 100
Dominican Republic … 34f
64 44 … 1b,f
… 15 … … … … … …
Ecuador 81 82 84 77 - - . . 90 86 83 76 … …
El Salv ador 99 99 71 64 .-1
.-1
.-1
.-1
84 74 60-1
50-1
--1
--1
Grenada 100 100 100 100 95 86 95 100 100 … 100 100 95 86
Guatemala … … … … … … … … … … … … … …
Guy ana … 88 … 82 … … 100f
4f
… 11 … … … …
Jamaica 100 100 100 100 … … … 100f
… 99f
… … … 99f
Mex ico … … … … --1
--1
… 57e,-1
90,e,-1
89e,-1
… … … 12e,-1
Montserrat 100 100 100 100 100 100 100 100 100 100 100 100 100 100
Nicaragua 68 59 41 21 … … … 3 33e
27e
33e
27e
28e
18e
Panama … … … … … … 21**, e
23**, e
… … 47 37 … …
Paraguay 99*
98*
31*
20*
… … … … 28*
19*
22*
13*
… …
Saint Kitts and Nev is 100 100 100 100 100 100 100 100 100 100 100 100 100 100
Saint Lucia 100 100 100 100 100 100 100 100 100 100 100 100 100 100
Saint Vincent and the Grenadines 100 100 100 100 100 100 100 100 100 100 73 63 73 63
Sint Maarten 100 100 100 100 - - - - 100 100 - 100 - 100
Suriname 100-1
100-1
100.-1
100-1
… … … … … … 56*, -1
54*, -1
… …
Trinidad and Tobago 100-1
100-1
100-1
100-1
100-1
100-1
100-1
100-1
… 100-1
… 100-1
… 100-1
Turks and Caicos Islands 100 100 100 100 - - 11 25 100 100 100 100 100 100
Uruguay 100-1
100-1
100-1
100-1
… … … … 100*,-1
100*, -1
100*, -1
100*, -1
100*, -1
100*, -1
Venezuela (Boliv arian Republic of) 60 62 62 41 … … 14 12 27 27 8 9 19 19
(%) (%) (%) (%) (%) (%) (%)
Country or Territory
(10)(9)
PublicTotalPublicTotal Total Public
Educational
institutions with
electricity
Total PublicTotal Public Total PublicTotal Public
(8)(1) (2) (3) (4) (5) (6) (7) (11) (12) (13) (14)
Educational
institutions with a
telephone
communication
facility
Educational
institutions with
radio-assisted
instruction (RAI)
Educational
institutions with
television-
assisted
instruction (TAI)
Educational
institutions with
computer-
assisted
instruction (CAI)
Educational
institutions with
computer
laboratories
Educational
institutions with a
Local Area
Network (LAN)

- 39 -
CONTINUED…
TABLE II.4. Secondary education | ICT infrastructure in educational institutions | ISCED 2 and 3 | 2010
Anguilla 100 100 100 100 100 100 33 33 100 100 100 100
Antigua and Barbuda 100 100 … … … … 71 55 … … 64 100
Argentina 50-1
37-1
33-1
22-1
36-1
27-1
… … … … 2-1
1-1
Aruba 100 100 100 100 … … 6 25 13 50 100 100
Bahamas … … … … … … … … … … … …
Barbados … 100-1
… 100-1
… 100-1
… 25-1
100-1
100-1
65-1
82-1
Belize … … … … … … … … … … … …
Boliv ia (Plurinational State of) … … … … … … … … … … … …
Brazil 76 71 63 59 69 64 … … … … … …
British Virgin Islands 100 100 100 100 100 100 … … … … - -
Cay man Islands … 100 … 100 … 100 36 … 40 - … 100
Chile 56-1
50-1
47-1
39-1
56-1
50-1
61-1
40-1
. . 24-1
12-1
Colombia … 75d
… 9d
… … … … … … … …
Costa Rica 55 48 … … … … … … … … 17 8
Cuba … … … … … … 33 33 100 100 - -
Curaçao … … … … … … … … … … … …
Dominica 93 100 93 100 … … 30 30 - - 13 …
Dominican Republic … … … … … … … … … … … …
Ecuador 60 50 … … 45 35 5 3 45 35 … …
El Salv ador 45 33 45 33 … … … … … … 14-1
9-1
Grenada 100 100 100 100 … … 26 26 - - 24 43
Guatemala … … … … … … … … … … … …
Guy ana … 16e
… 74f
… 13a,e
… … … … … 29
Jamaica … 93f
… 84f
… 84a,f
… … … … … …
Mex ico … 12e,-1
… 12e,-1
… 12e,-1
… 12e,-1
… 12e,-1
… …
Montserrat 100 100 100 100 100 100 25 33 100 100 100e
…
Nicaragua 18e
18e
18e
18e
… … … … … … 9e
6e
Panama 28 23 … … … … … … … … … …
Paraguay 18*
9*
… … … … … … … … 4*
1*
Saint Kitts and Nev is 100 100 100 100 100 100 25 25 … … 45 63
Saint Lucia 100 100 100 100 100 100 23 25 - - 32 35
Saint Vincent and the Grenadines 100 100 46 47 100 100 18 25 … … … …
Sint Maarten - 100 - 100 - - … 50 … - … -
Suriname 91*, -1
91*, -1
… … … … … … … … … …
Trinidad and Tobago … 100-1
… 100-1
… 100-1
… 33-1
100-1
100-1
… …
Turks and Caicos Islands 100 100 100 100 11 … 47 44 … … 22 25
Uruguay 100*, -1
100*, -1
100-1,*
100*, -1
100*, -1
100*, -1
50*, -1
50*, -1
100-1,*
100-1,*
26*, -1
…
Venezuela (Boliv arian Republic of) 15 13 … … … … … … 18 29 … …
(%)
Country or Territory
(%) (%)
Total Public
(24)
Total Public
(17) (18) (19) (20)(16)(15) (23)(21) (22)
Educational
institutions with
ICT support
services
Total
(%) (%) (%)
PublicTotal PublicTotal Public
(26)
Educational
institutions with
access to the
Internet
Educational
institutions with
fixed broadband
Internet access
Educational
institutions with a
website
Educational
institutions with
Internet-assisted
instruction (IAI)
Total Public
(25)
Educational
institutions with
open educational
resources

- 40 -
COMPUTERS
TABLE II.5. Computers | ISCED 1, 2 and 3 | 2010
Anguilla 84 86 87 87 12 10 … 7 10 10 7 7 100 100 100 100
Antigua and Barbuda … … … … … … … … … … … … … … … …
Argentina 81**,-1
83**,-1
81**,-1
84**,-1
50**,-1
68**,-1
11**,-1
14**,-1
33**,-1
42**,-1
9**,-1
10**,-1
67**,-1
45**,-1
79**,-1
67**,-1
Aruba … 100 … 100 … … … … … 12 23 - 100 100 8 …
Bahamas … … … … … … … … … … … … … … … …
Barbados 98-1
98-1
98-1
98-1
4-1
4-1
3-1
3-1
… 4-1
… 3-1
100-1
100-1
100-1
100-1
Belize … … … … … … … … … … … … … … … …
Boliv ia (Plurinational State of) … … … … 55-1
… x (5)-1
… … … … … … … … …
Brazil 71**
73**
70**
72**
46**
53**
36**
42**
30**
34**
32**
37**
63**
85**
94**
61**
British Virgin Islands 77 75 89 91 13 14 4 4 … … … 2 85 77 100 100
Cay man Islands 97 100 97 100 3 3 2 2 2 3 2 2 100 100 100 100
Chile 86**,-1
88**,-1
86**,-1
87**,-1
17**,-1
13**,-1
20**,-1
18**,-1
15**,-1
12**,-1
18**,-1
17**,-1
75**,-1
65**,-1
81**,-1
72**,-1
Colombia … 100d
… x (6) 12d
20d
x (5) x (6) … … … … … 5d
… x (14)
Costa Rica 79 79 82 82 31 42 12 15 … … … … … … … …
Cuba 100 100 100 100 28 28 27 27 28 28 27 27 … … … …
Curaçao … … … … … … … … … … … … … … … …
Dominica 75 71 88 88 24 24 14 10 19 18 6 9 90 85 100 100
Dominican Republic … … … … … 122d
… x (6) … … … … … … … …
Ecuador 85**
88**
82**
81**
37**
54**
16**
21**
29**
40**
15**
20**
… 3**
… 2**
El Salv ador 89**
90**
89**
91**
55**
74**
20**
26**
43**
55**
18**
24**
71**
61**
82**
76**
Grenada 78 80 91 90 58 62 26 19 38 42 26 38 52 40 66 57
Guatemala … … … … … … … … … … … … … … … …
Guy ana 48 48 100a
100 … … … … 2a
2 -a
- … … 4a
4
Jamaica … … … … … … … … … … … … … … … …
Mex ico … … … … … … … … … … … … 42-1
34-1
42e,-1
34e,-1
Montserrat 21 29 71 71 … 29 … 24 70 29 14 14 100 100 100 100
Nicaragua … 100 … 100e
… 74 … 84e
… 9 … 46e
… 100 … 78e
Panama 100 100 100 100 19 21 23 31 10 11 6 7 … … … …
Paraguay 80**
87**
80**
86**
130**
210**
45**
73**
28**
28**
18**
23**
51**
53**
51**
47**
Saint Kitts and Nev is 89 100 93 93 22 19 13 14 22 19 13 14 100 100 100 100
Saint Lucia … 100 … 90 … 19 … 8 … 10 … … … 7 … 100
Saint Vincent and the Grenadines 74 … 86 85 38 … 12 13 … … … … … … … …
Sint Maarten … 100,
… 100*
… … … … … … … … … 100*
… 100*
Suriname … … … … … … … … … … … … 30*,-1
33*,-1
62*, e,-1
68*,e,-1
Trinidad and Tobago … 93-1
100-1
87-1
… 24-1
… 4-1
… 24-1
… 4-1
… 5-1
… 51-1
Turks and Caicos Islands 81 90 89 88 13f
16 6 … 2 2 … - 64 100 76 97
Uruguay 100*,-1
100*,-1
… … 1-1
1-1
… … 1*,-1
1*,-1
… … 100*,-1
100*,-1
… …
Venezuela (Boliv arian Republic of) 88 87 8 4 … … … … 3 3 124 … 18 16 40 32
(%)
(10) (11) (12) (13) (14) (15) (16)
Proportion of all computers
available for pedagogical use
Primary
Total
Proportion of all computers
connected to the Internet
Primary Secondary
Learners to computer ratio (in
schools with CAI)
Primary Secondary
Public Total Public Total Public Total Public
(2) (3) (4) (9)(5) (6) (7) (8)
Country or Territory
Secondary
Learners-to-computer ratio (for
pedagogical purposes)
Primary Secondary
Total Public Total PublicTotal Public Total Public
(%)
(1)

- 41 -
ENROLMENT – PRIMARY EDUCATION
Table II.6. Enrolment in educational programmes using ICT | ISCED 1| 2010
Anguilla 100 100 100 100 100 100 100 100 100 89 90 88 89 90 88 - - -
Antigua and Barbuda … … … … … … … … … … … … … … … … … …
Argentina 99-1
99-1
99-1
… … … … … … 66-1
66-1
66-1
24-1
23-1
24-1
… … …
Aruba … … … … … … … … … ... … … … … … … … …
Bahamas 100-1
100-1
100-1
100a, -1
100a, -1
100a, -1
100a, -1
100a, -1
100a, -1
… … … … … … - - -
Barbados 100-1
100-1
100-1
. . . 100a,-1
100a,-1
100a,-1
100a,-1
100a,-1
100a,-1
100a,-1
100a,-1
100a,-1
100a,-1
100a,-1
100a,-1
Belize 94 94 94 … … … … … … … … … … … … … … …
Boliv ia (Plurinational State of) … … … … … … … … … … … … … … … … … …
Brazil 98 98 98 … … … 86 81 92 66 66 67 58 57 58 … … …
British Virgin Islands 100 100 100 - - - - - - … … … - - - - - -
Cay man Islands 85 85 86 - - - 77 79 76 84 84 84 84 84 84 3 1 5
Chile … … … .-1
.-1
.-1
.-1
.-1
.-1
88-1
88-1
88-1
83-1
82-1
83-1
… … …
Colombia 97a, d
… … … … … … … … … … … … … … … … …
Costa Rica 93 93 93 … … … … … … … … … … … … … … …
Cuba 100 100 100 - - - 100 100 100 100 100 100 … … … 100 100 100
Curaçao 100 100 100 … … … … … … … … … … … … … … …
Dominica 100 100 100 47 48 45 49 43 56 78 76 79 … … … - - -
Dominican Republic 98a, c
95a, c
100a, c
2b,c
2b,c
2b,c
. . . … … … … … … … … …
Ecuador 84 84 84 - - - . . . 78 78 79 34 34 35 34 34 35
El Salv ador 98 98 98 .-1
.-1
.-1
.-1
.-1
.-1
77 77 78 38 37 38 … … …
Grenada 100 100 100 66 66 66 78 82 74 66 71 62 … … … … … …
Guatemala … … … … … … … … … … … … … … … … … …
Guy ana … … … … … … … … … … … … … … … … … …
Jamaica 100a
100a
100a
… … … … … … … … … … … … … … …
Mex ico .. … … --1
--1
--1
--1
--1
--1
27a,-1
… … … … … - - -
Montserrat 100 100 100 - - - 100 100 100 100 100 100 100 100 100 100 100 100
Nicaragua 52 52 52 … … … -a
-a
-a
17 21a
13 1a
1a
1a
… … …
Panama 69 69 70 … … … … … … 56 55 56 … … … … … …
Paraguay 97*
97*
97*
… … … … … … 21*
21*
22*
… … … … … …
Saint Kitts and Nev is 100 100 100 … … … … … … 100 100 100 100 100 100 … … …
Saint Lucia 100 100 100 - - - … … … 51a
49a
53a
51 49 53 … … …
Saint Vincent and the Grenadines 100 100 100 … … … … … … … … … … … … … … …
Sint Maarten … … … … … … … … … … … … … … … … … …
Suriname 100-1
100-1
100-1
.. … … … … … … … … … … … … … …
Trinidad and Tobago 100-1
100-1
100-1
100-1
100-1
100-1
100-1
100-1
100-1
100a,-1
100a,-1
100a,-1
… … … 100-1
100-1
100-1
Turks and Caicos Islands 100 100 100 … … … … … … … … … 15 17 12 - - -
Uruguay 99*,-1
99*,-1
99*,-1
… … … … … … 99*,-1
99*,-1
99*,-1
99*,-1
99*,-1
99*,-1
… … …
Venezuela (Boliv arian Republic of) 63 63 64 … … … 13 12 13 39 38 39 16 15 16 32 32 33
(%) (%) (%) (%) (%)
Country or Territory
(1) (2) (3) (4) (5) (6) (7) (8) (9) (10) (11) (12) (13) (14) (15) (16)
Enrolment in programmes
offering computer-
assisted instruction (CAI)
Enrolment in programmes
offering internet-assisted
instruction (IAI)
Enrolment in programmes
offering open
educational resources
(OER)
MF M FMF M FMF M
(%)
MMFMF M F FMF M FF
(17) (18)
Enrolment in programmes
having access to
electricity
Enrolment in programmes
offering radio-assisted
instruction (RAI)
Enrolment in programmes
offering television-
assisted instruction (TAI)
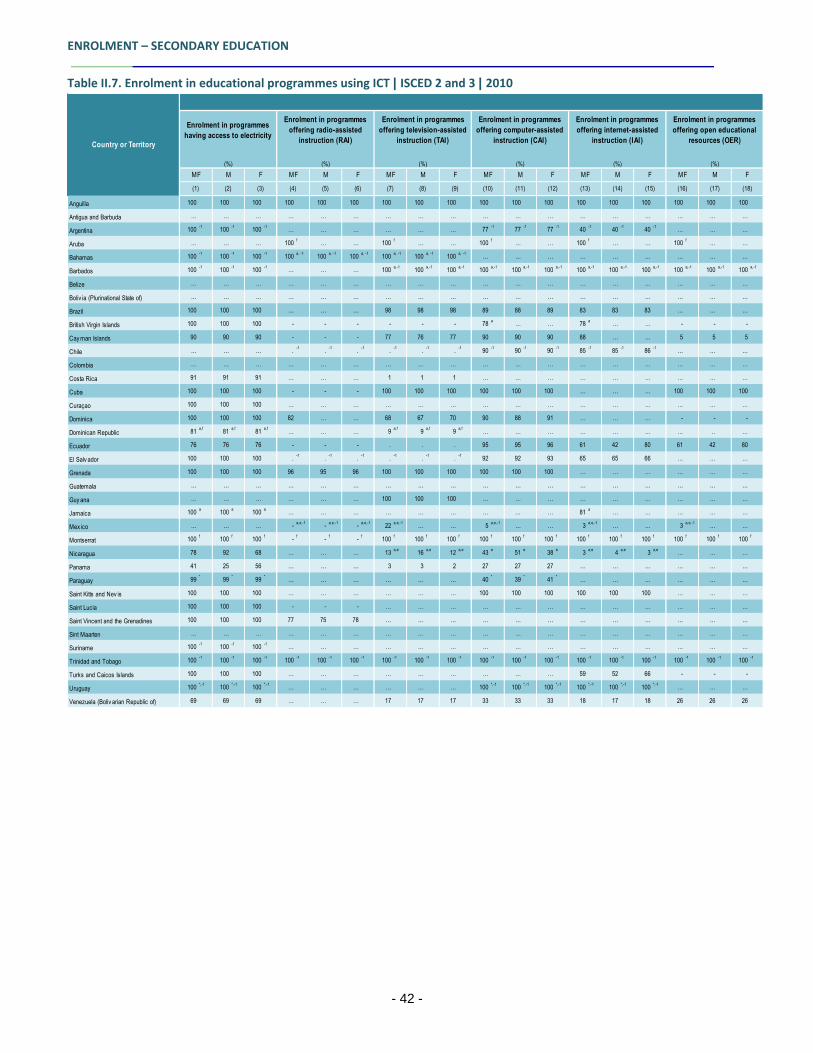
- 42 -
ENROLMENT – SECONDARY EDUCATION
Table II.7. Enrolment in educational programmes using ICT | ISCED 2 and 3 | 2010
Anguilla 100 100 100 100 100 100 100 100 100 100 100 100 100 100 100 100 100 100
Antigua and Barbuda … … … … … … … … … … … … … … … … … …
Argentina 100-1
100-1
100-1
… … … … … … 77-1
77-1
77-1
40-1
40-1
40-1
… … …
Aruba … … … 100f
… … 100f
… … 100f
… … 100f
… … 100f
… …
Bahamas 100-1
100-1
100-1
100a, -1
100a, -1
100a, -1
100a, -1
100a, -1
100a, -1
… … … … … … … … …
Barbados 100-1
100-1
100-1
… … … 100a,-1
100a,-1
100a,-1
100a,-1
100a,-1
100a,-1
100a,-1
100a,-1
100a,-1
100a,-1
100a,-1
100a,-1
Belize … … … … … … … … … … … … … … … … … …
Boliv ia (Plurinational State of) … … … … … … … … … … … … … … … … … …
Brazil 100 100 100 … … … 98 98 98 89 88 89 83 83 83 … … …
British Virgin Islands 100 100 100 - - - - - - 78a
… … 78a
… … - - -
Cay man Islands 90 90 90 - - - 77 76 77 90 90 90 88 … … 5 5 5
Chile … … … .-1
.-1
.-1
.-1
.-1
.-1
90-1
90-1
90-1
85-1
85-1
86-1
… … …
Colombia … … … … … … … … … … … … … … … … … …
Costa Rica 91 91 91 … … … 1 1 1 … … … … … … … … …
Cuba 100 100 100 - - - 100 100 100 100 100 100 … … … 100 100 100
Curaçao 100 100 100 … … … … … … … … … … … … … … …
Dominica 100 100 100 82 … … 68 67 70 90 88 91 … … … - - -
Dominican Republic 81a,f
81a,f
81a,f
… … … 9a,f
9a,f
9a,f
… … … … … … … .. …
Ecuador 76 76 76 - - - . . . 95 95 96 61 42 80 61 42 80
El Salv ador 100 100 100 .-1
.-1
.-1
.-1
.-1
.-1
92 92 93 65 65 66 … … …
Grenada 100 100 100 96 95 96 100 100 100 100 100 100 … … … … … …
Guatemala … … … … … … … … … … … … … … … … … …
Guy ana … … … … … … 100 100 100 … … … … … … … … …
Jamaica 100a
100a
100a
… … … … … … … ... … 81a
… … … … …
Mex ico … … … -a,e,-1
-a,e,-1
-a,e,-1
22a,e,-1
… … 5a,e,-1
… … 3a,e,-1
… … 3a,e,-1
… …
Montserrat 100f
100f
100f
-f
-f
-f
100f
100f
100f
100f
100f
100f
100f
100f
100f
100f
100f
100f
Nicaragua 78 92 68 … … … 13a,e
16a,e
12a,e
43e
51e
38e
3a,e
4a,e
3a,e
… … …
Panama 41 25 56 … … … 3 3 2 27 27 27 … … … … … …
Paraguay 99*
99*
99*
… … … … … … 40*
39*
41*
… … … … … …
Saint Kitts and Nev is 100 100 100 … … … … … … 100 100 100 100 100 100 … … …
Saint Lucia 100 100 100 - - - … … … … … … … … … … … …
Saint Vincent and the Grenadines 100 100 100 77 75 78 … … … … … … … … … … … …
Sint Maarten … … … … … … … … … … … … … … … … … …
Suriname 100-1
100-1
100-1
… … … … … … … … … … … … … … …
Trinidad and Tobago 100-1
100-1
100-1
100-1
100-1
100-1
100-1
100-1
100-1
100-1
100-1
100-1
100-1
100-1
100-1
100-1
100-1
100-1
Turks and Caicos Islands 100 100 100 … … … … … … … … … 59 52 66 - - -
Uruguay 100*,-1
100*,-1
100*,-1
… … … … … … 100*,-1
100*,-1
100*,-1
100*,-1
100*,-1
100*,-1
… … …
Venezuela (Boliv arian Republic of) 69 69 69 … … … 17 17 17 33 33 33 18 17 18 26 26 26
(%)(%) (%) (%) (%) (%)
(18)
F
Enrolment in programmes
offering internet-assisted
instruction (IAI)
Enrolment in programmes
offering open educational
resources (OER)
(1) (2) (3) (4) (5) (6) (7) (8) (9) (10)
M
(11) (12) (13) (14) (15) (16) (17)
F MF M F MF
Country or Territory
Enrolment in programmes
offering computer-assisted
instruction (CAI)
Enrolment in programmes
having access to electricity
Enrolment in programmes
offering radio-assisted
instruction (RAI)
Enrolment in programmes
offering television-assisted
instruction (TAI)
MF M F MF M F MF M F MF M

- 43 -
Anguilla 2 - 2 8a
5a
9a
2a
- 2 8a
5a
9 a
81a 100
a77
a89
a62
a100
a81
a100
a77
a31
a19
a37
a
Antigua and Barbuda … … … … … … … … … … … … … … … … … … … … … … … …
Argentina 2-1
3-1
2-1
4-1
7-1
3-1
2-1
4-1
2-1
7-1
12-1
5-1
21-1
15-1
22.-1
19-1
17-1
19-1
… … … … … …
Aruba … … … 100 … … … … … … … … … … … … … … … … … 100 … …
Bahamas … … … … … … … … … … … … … … … … … … … … … … … …
Barbados 5*,-1
12a,-1
3a,-1
3a,-1
4a,-1
3a,-1
5a,-1
12a,-1
3a,-1
5a,-1
6a,-1
5a,-1
64a,-1
60a,-1
65a,-1
52-1
53-1
52-1
100a,-1
100a,-1
100a,-1
100a,-1
100a,-1
100a,-1
Belize … … … … … … … … … 8 9 7 … … … … … … … … … … … …
Boliv ia (Plurinational State of) … … … … … … … … … … … … … … … … … … … … … … … …
Brazil … … … … … … 3 5 3 1 2 1 … … … … … … 64 60 64 83 84 83
British Virgin Islands … … … … … .. - - - 3a
2a
3a
… … … … … … - - - - - -
Cay man Islands 17 29 16 19 21 18 23 29 22 20 24 18 88 … … 92 93 91 94 … … 92 96 90
Chile 2-1
… … 2-1
… … … … … … … … 2-1
… … 2-1
… … 81-1
… … 86-1
… …
Colombia … … … … … … … … … … … … … … … … … … … … … … … …
Costa Rica … … … … … … 4 5 3 3 3 3 … … … … … … … … … … … …
Cuba 12 12 12 6 6 6 12 12 12 6 6 6 100 100 100 100 100 100 100 100 100 100 100 100
Curaçao … … … … … … … … … … … … … … … … … … … … … … … …
Dominica … … … … … … 14 … … 7 … … 77 … … 68 ... … … … … … … …
Dominican Republic … … … … … … … … … … … … … … … … … … … … … … … …
Ecuador … … … … … … 5 6 5 4 4 4 … … … … … … … … … … … …
El Salv ador 3-1
6-1
2-1
7-1
9-1
4-1
… … … 11f,-1
13f,-1
7f,-1
… … … … … … … … … … … …
Grenada - - - - … - … … … … … … … … … … … … … … … … … …
Guatemala … … … … … … … … … … … … … … … … … … … … … … … …
Guy ana … … … … … … … … … … … … … … … … … … … … … … … …
Jamaica -*,a
… … … … … -a
1a
-a
5a,f
5a,f
4a,f
… … … … … … … … … … … …
Mex ico … … … … … … … … … … … … 2a,-1
… … … … … 28a,-1
… … 1a,-1
… …
Montserrat … … … 3 … … … … … 7 - … … … … 100 … … 100 100 100 100 … …
Nicaragua … … … … … … 1**,a
… … 6**,a
… … 1**,a
… … … … … 2**,a
… … 8**,a
… …
Panama … … … … … … 3a
4a
3a
… … … … … … … … … … … … … … …
Paraguay 1*
1*
1*
2*
2*
1*
1*
1*
-*
1*
2*
1*
… … … … … … … … … … … …
Saint Kitts and Nev is 2 - 2 4 13 4 2 - 2 … … … 24 17 25 19 22 18 … … … … … …
Saint Lucia … … … 10**
… … 1**
… … 7**
… … … … … 5**
… … 1**
… … 12**
… …
Saint Vincent and the Grenadines 55 … … 44 … … … … … 21 … … 43 … … 65 … … 75 … … 76 … …
Sint Maarten … … … … … … … … … … … … … … … … … … … … … … … …
Suriname … … … … … … … … … … … … … … … … … … … … … … … …
Trinidad and Tobago 14a,-1
… … 56a,-1
… … … … … 56a,-1
… … 14a,-1
… … 56a,-1
… … … … … … … …
Turks and Caicos Islands 6 17 5 6 8 3 6 17 5 7 14 3 16 20 15 … 18 15 16 20 15 16 18 15
Uruguay 100*,a,-1
… … 4*,a,-1
… … 100*,a,-1
… … 4*,a,-1
… … 100*,a,-1
… … 44*,a,-1
… … 100*,a,-1
… … 4*,a,-1
… …
Venezuela (Boliv arian Republic of) 15 13 16 80 77 82 60 59 60 … … … 43 43 43 … … … 43 43 43 … … …
SecondaryPrimary
Teachers currently teaching subject(s) using ICT
facilities
(24)(19) (20)
MF M F
(23)
(%)
MF M F MF M
Teachers trained to teach subject(s) using ICT
facilities
Primary Secondary Primary Secondary
ICT-qualified teachers (basic computer skills (or
computing), BCS)
Teachers currently teaching basic computer
skills or computing
(%) (%) (%)
F MF M F MF M F MF M F
(1) (2) (3) (4) (5) (13) (14) (15) (16)(7) (8) (9) (10) (11) (12)
Country or Territory
Primary Secondary
MF M F MF M F
(17) (18) (21) (22)(6)
TEACHING STAFF
Table II.8. Teacher training on ICT and current practice | ISCED 1, 2 and 3 | 2010