ict adoption in developing countries: firm-level evidence from brazil and india simon commander...
TRANSCRIPT

ICT adoption in developing countries: firm-level evidence from Brazil and India
Simon Commander (LBS)
Rupert Harrison (IFS)
1st June 2006

Structure of the talk
New firm-level data from Brazil and India
Summary of results in two areas:
ICT, organisational change and productivity
Constraints on ICT adoption
Conclusions and other work

New firm-level data
500 face-to-face questionnaires in each country, April-May 2005

New firm-level data
500 face-to-face questionnaires in each country, April-May 2005
6 three-digit manufacturing industries, representing 30% of manufacturing employment in Brazil and 20% in India
New firm-level data
500 face-to-face questionnaires in each country, April-May 2005
6 three-digit manufacturing industries, representing 30% of manufacturing employment in Brazil and 20% in India
Sample stratified by region and firm size

New firm-level data
500 face-to-face questionnaires in each country, April-May 2005
6 three-digit manufacturing industries, representing 30% of manufacturing employment in Brazil and 20% in India
Sample stratified by region and firm size
Broad range of detailed information on:
Performance outcomes (employment, sales etc)
ICT adoption and organisational change
Occupation and skill shares of the workforce
Management practices
Reported constraints on ICT adoption

The sample
Brazil India
Median emp. N Median emp. N
Electronic Components 50 76 43 78
Plastic products 80 81 65 126
Soap and detergents 65 77 65 47
Auto components 187 78 120 110
Machine tools 69 81 70 52
Garments 65 99 89 63
Total 70 492 70 476

Summary measure of ICT (1 – 5)
1) ICT is not used at all
“How would you best describe the degree of ICT usage in your firm?”
Summary measure of ICT (1 – 5)
1) ICT is not used at all
2) ICT is used only for some office applications along with accessing the internet, emailing, etc.
“How would you best describe the degree of ICT usage in your firm?”

Summary measure of ICT (1 – 5)
1) ICT is not used at all
2) ICT is used only for some office applications along with accessing the internet, emailing, etc.
3) ICT is used for some advanced applications. Most processes are automated but there is no integration into a central system.
4) Most processes are automated and some of them are integrated into a central system.
5) Almost all processes are automated and integrated into a central system
“How would you best describe the degree of ICT usage in your firm?”

Summary measure of ICT (1 – 5)
0.2
.4.6
1 2 3 4 5 1 2 3 4 5
Brazil India
Fraction
Fraction
Fra
ctio
n
Summary index of ICT adoption
Graphs by c
20032001

Other ICT measures
Brazil India
% of firms who have adopted PCs 98 98
% of firms who have adopted servers 90 63
Number of PCs per employee 0.28 0.22
Number of servers per employee 0.04 0.02
% of non-production workforce using PCs 69.6 53.9
% of prod workforce using ICT-controlled machinery 23.3 15.3
PCs per 1000 people 86 11
ICT expenditure as % of GDP 6.7 3.7

Date of adoption:PCs (both 98%)
0.0
5.1
.15
1975 1980 1985 1990 1995 2000 2005 1975 1980 1985 1990 1995 2000 2005
Brazil India
Density
kdensity v302a
De
nsity
Date of first introduction: PCs
Graphs by c
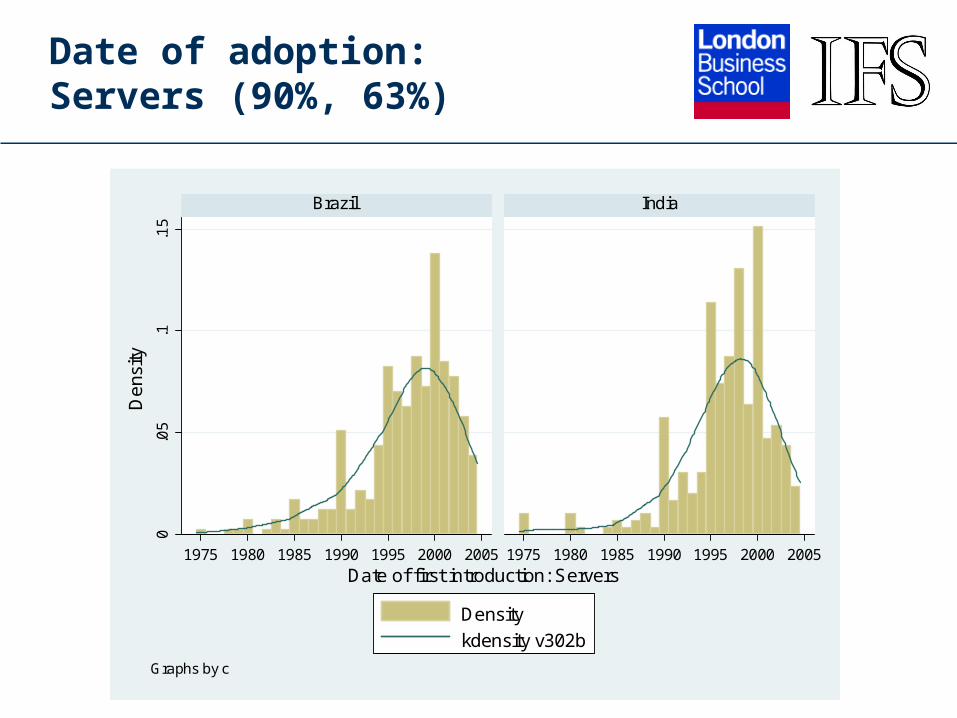
Date of adoption:Servers (90%, 63%)
0.0
5.1
.15
1975 1980 1985 1990 1995 2000 2005 1975 1980 1985 1990 1995 2000 2005
Brazil India
Density
kdensity v302b
De
nsity
Date of first introduction: Servers
Graphs by c
ICT adoption and productivity
Micro literature from developed countries has found very high estimated returns to ICT (Brynjolfsson and Hitt, 2000, 2003; Stiroh, 2002)

ICT adoption and productivity
Micro literature from developed countries has found very high estimated returns to ICT (Brynjolfsson and Hitt, 2000, 2003; Stiroh, 2002)
Possible explanations include: unobserved heterogeneity, unmeasured complementary investments in e.g. human capital, software, workplace organisation
Some evidence that unmeasured complementary organisational changes may help to explain high measured returns to ICT (Bresnahan, Brynjolfsson and Hitt, 2002; Basu, Fernald, Oulton and Srinivasan, 2003)
No micro-econometric evidence in developing countries

ICT adoption and productivity
Dep var: Log sales Brazil India
(1)
Levels
(2)
2 year difference
(3)
Levels
(4)
2 year difference
Log employment 0.392***(0.109)
0.337***(0.066)
Log materials 0.359***(0.062)
0.434***(0.051)
Log fixed capital 0.214**(0.083)
0.188***(0.038)
Log ICT capital 0.173***(0.042)
0.115***(0.034)
Observations 172 312
R-squared 0.84 0.87

ICT adoption and productivity
Dep var: Log sales Brazil India
(1)
Levels
(2)
2 year difference
(3)
Levels
(4)
2 year difference
Log employment 0.392***(0.109)
0.190**(0.096)
0.337***(0.066)
0.180**(0.078)
Log materials 0.359***(0.062)
0.369***(0.124)
0.434***(0.051)
0.343***(0.104)
Log fixed capital 0.214**(0.083)
0.159(0.132)
0.188***(0.038)
0.154(0.099)
Log ICT capital 0.173***(0.042)
0.193***(0.070)
0.115***(0.034)
0.101**(0.039)
Observations 172 130 312 248
R-squared 0.84 0.59 0.87 0.38

ICT adoption and productivity
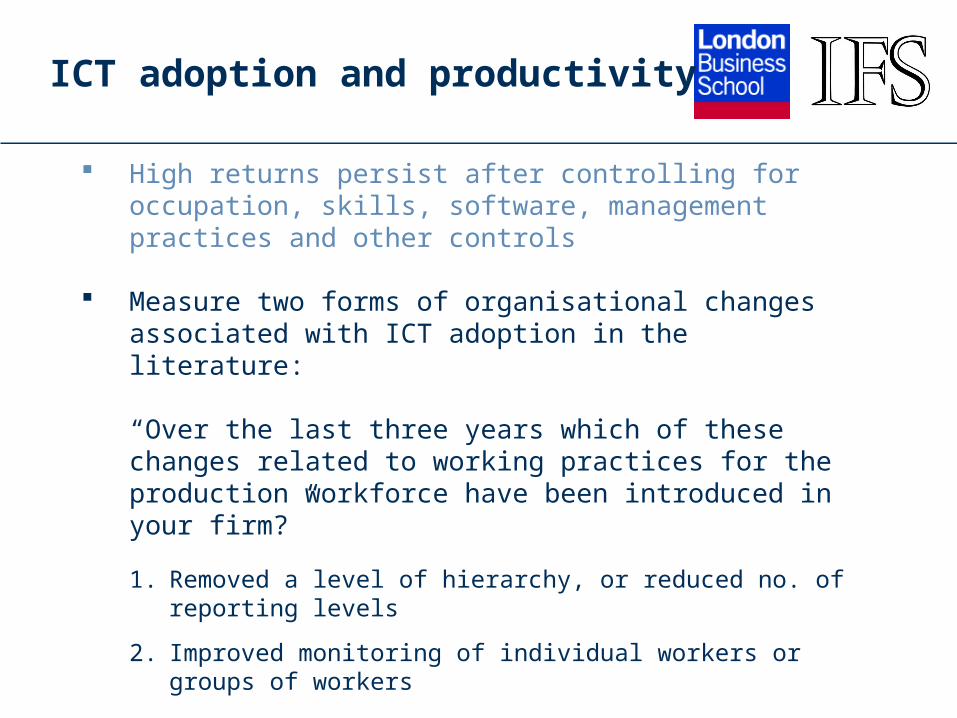
High returns persist after controlling for occupation, skills, software, management practices and other controls
ICT adoption and productivity
High returns persist after controlling for occupation, skills, software, management practices and other controls
Measure two forms of organisational changes associated with ICT adoption in the literature:
“Over the last three years which of these changes related to working practices for the production workforce have been introduced in your firm?”
1. Removed a level of hierarchy, or reduced no. of reporting levels
2. Improved monitoring of individual workers or groups of workers
ICT adoption and productivity
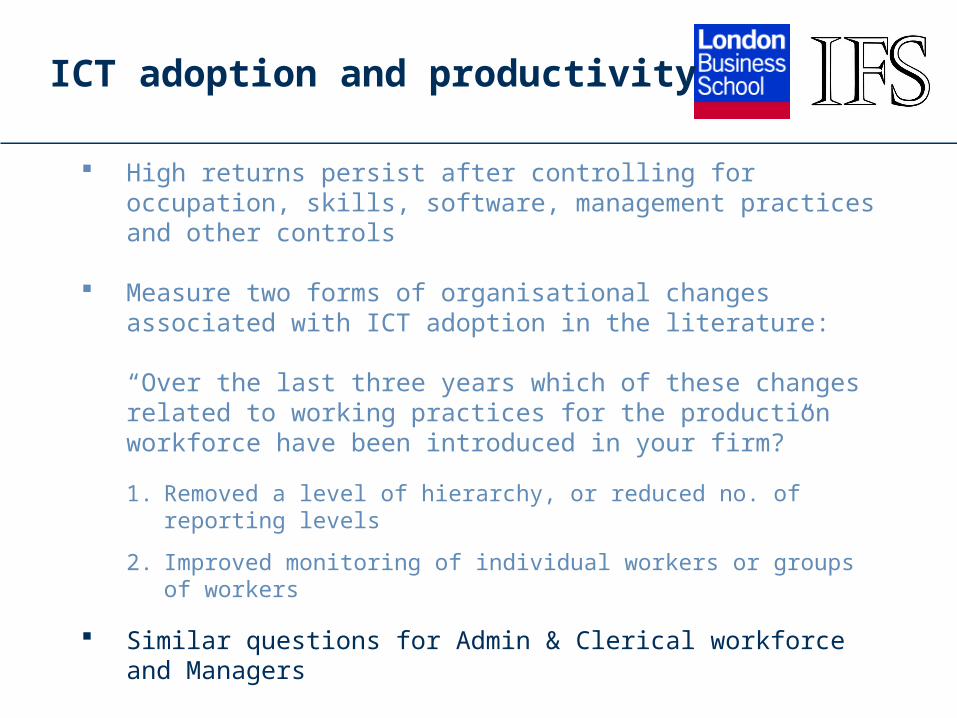
High returns persist after controlling for occupation, skills, software, management practices and other controls
Measure two forms of organisational changes associated with ICT adoption in the literature:
“Over the last three years which of these changes related to working practices for the production workforce have been introduced in your firm?”
1. Removed a level of hierarchy, or reduced no. of reporting levels
2. Improved monitoring of individual workers or groups of workers
Similar questions for Admin & Clerical workforce and Managers

ICT adoption and productivity
No impact of organisational changes in the full sample
ICT adoption and productivity
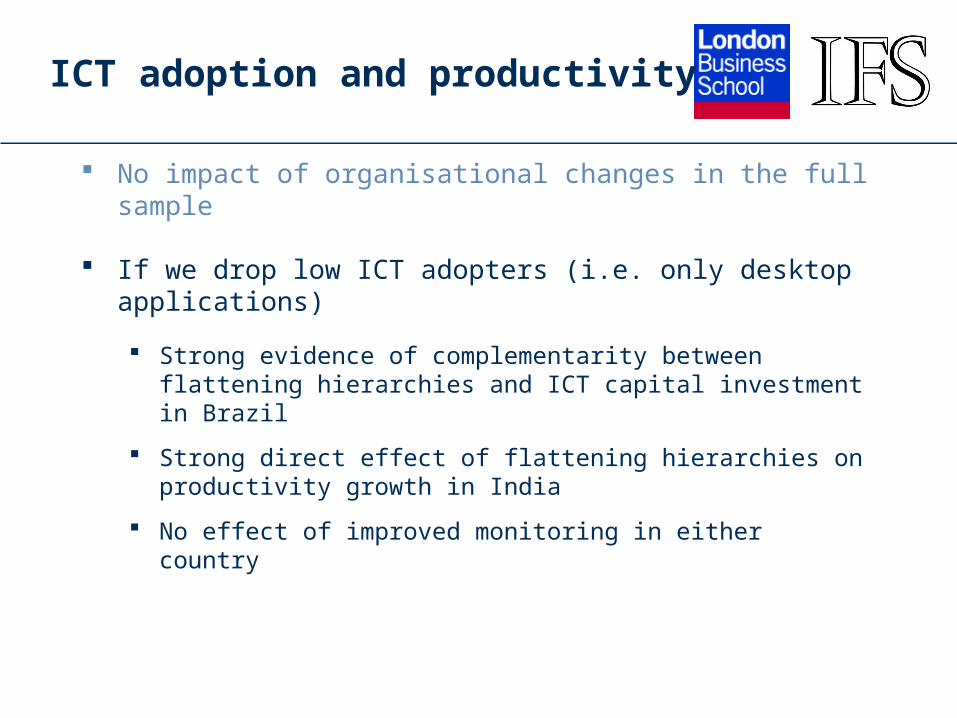
No impact of organisational changes in the full sample
If we drop low ICT adopters (i.e. only desktop applications)
Strong evidence of complementarity between flattening hierarchies and ICT capital investment in Brazil
Strong direct effect of flattening hierarchies on productivity growth in India
No effect of improved monitoring in either country

ICT adoption and productivity
No impact of organisational changes in the full sample
If we drop low ICT adopters (i.e. only desktop applications)
Strong evidence of complementarity between flattening hierarchies and ICT capital investment in Brazil
Strong direct effect of flattening hierarchies on productivity growth in India
No effect of improved monitoring in either country
So there is evidence for complementarities between some types of organisational change and ICT investment…
…but not in the tail of low ICT adopters (c. 30% of the sample in Brazil, 40% in India)

Constraints on ICT adoption
High measured returns to ICT investment
Important policy question: what aspects of policy / economic environment constrain firms from adopting ICT?

Constraints on ICT adoption
High measured returns to ICT investment
Important policy question: what aspects of policy / economic environment constrain firms from adopting ICT?
We use regional variation in infrastructure and other reported constraints to identify effects on ICT adoption and returns to ICT
India: State mean number of days with power-related problems (power cuts or surges)
Both countries: region/state means of other reported constraints on ICT adoption

Constraints on ICT adoption
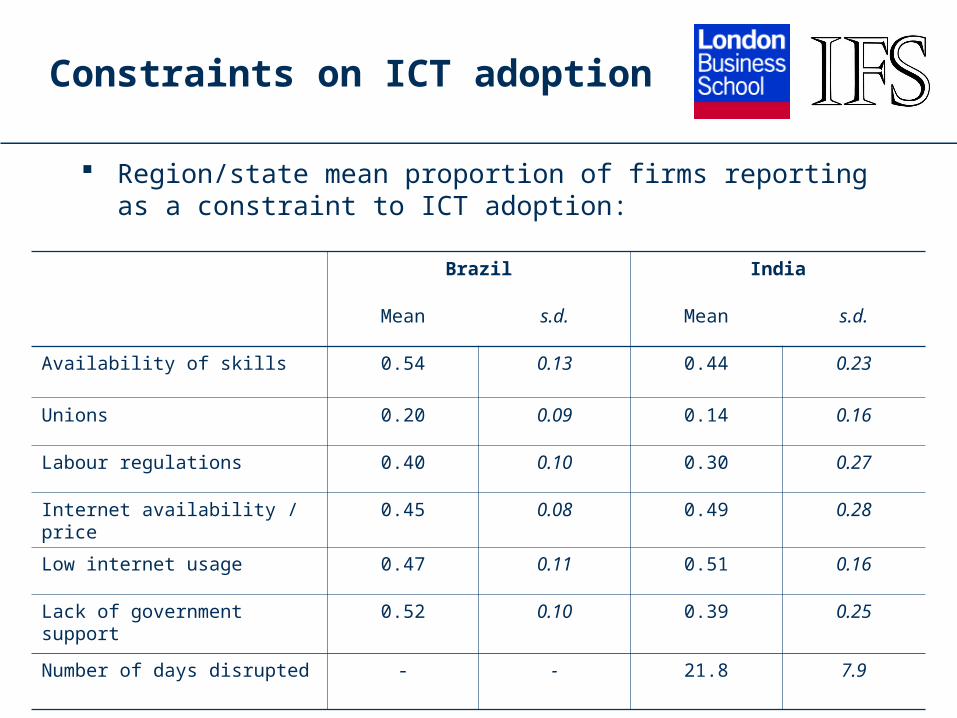
Region/state mean proportion of firms reporting as a constraint to ICT adoption:
Brazil India
Mean s.d. Mean s.d.
Availability of skills 0.54 0.13 0.44 0.23
Unions 0.20 0.09 0.14 0.16
Labour regulations 0.40 0.10 0.30 0.27
Internet availability / price 0.45 0.08 0.49 0.28
Low internet usage 0.47 0.11 0.51 0.16
Lack of government support 0.52 0.10 0.39 0.25
Constraints on ICT adoption
Region/state mean proportion of firms reporting as a constraint to ICT adoption:
Brazil India
Mean s.d. Mean s.d.
Availability of skills 0.54 0.13 0.44 0.23
Unions 0.20 0.09 0.14 0.16
Labour regulations 0.40 0.10 0.30 0.27
Internet availability / price 0.45 0.08 0.49 0.28
Low internet usage 0.47 0.11 0.51 0.16
Lack of government support 0.52 0.10 0.39 0.25
Number of days disrupted - - 21.8 7.9

Constraints on ICT adoption
In India, firms in states with more power disruptions use less ICT and get lower returns from ICT investment

Constraints on ICT adoption
Andhra PradeshAndhra PradeshAndhra PradeshAndhra PradeshAndhra PradeshAndhra PradeshAndhra PradeshAndhra PradeshAndhra PradeshAndhra PradeshAndhra PradeshAndhra PradeshAndhra Pradesh
DelhiDelhiDelhiDelhiDelhiDelhiDelhiDelhiDelhiDelhiDelhiDelhiDelhiDelhiDelhiDelhiDelhiDelhiDelhiDelhiDelhiDelhiDelhiDelhiDelhiDelhiDelhiDelhiDelhiDelhiDelhiDelhiDelhiDelhiDelhiDelhiDelhiDelhiDelhiDelhiDelhiDelhiDelhiDelhiDelhiDelhiDelhiDelhiDelhiGujaratGujaratGujaratGujaratGujaratGujaratGujaratGujaratGujaratGujaratGujarat
HaryanaHaryanaHaryanaHaryana
KarnatakaKarnatakaKarnatakaKarnatakaKarnatakaKarnatakaKarnatakaKarnatakaKarnatakaKarnatakaKarnatakaKarnatakaKarnatakaKarnatakaKarnatakaKarnatakaKarnatakaKarnatakaKarnatakaKarnatakaKarnatakaKarnatakaKarnatakaKarnatakaKarnatakaKarnatakaKarnatakaKarnataka
MaharastraMaharastraMaharastraMaharastraMaharastraMaharastraMaharastraMaharastraMaharastraMaharastraMaharastraMaharastraMaharastraMaharastraMaharastraMaharastraMaharastraMaharastraMaharastraMaharastraMaharastraMaharastraMaharastraMaharastraMaharastraMaharastraMaharastraMaharastraMaharastraMaharastraMaharastraMaharastraMaharastraMaharastraMaharastraMaharastraMaharastraMaharastraMaharastraMaharastraMaharastraMaharastraMaharastraMaharastraMaharastraMaharastraMaharastraMaharastraMaharastraMaharastraMaharastraMaharastraMaharastraMaharastraMaharastraMaharastraMaharastraMaharastraMaharastraMaharastraMaharastraMaharastraMaharastraMaharastraMaharastraMaharastraMaharastraMaharastraMaharastraMaharastraMaharastraMaharastraMaharastraMaharastraMaharastraMaharastraMaharastraMaharastraMaharastraMaharastraMaharastraMaharastraMaharastraMaharastraMaharastraMaharastraMaharastraMaharastraMaharastraMaharastraMaharastraMaharastraMaharastraMaharastraMaharastraMaharastraMaharastraMaharastraMaharastra
Tamil NaduTamil NaduTamil NaduTamil NaduTamil NaduTamil NaduTamil NaduTamil NaduTamil NaduTamil NaduTamil NaduTamil NaduTamil NaduTamil NaduTamil NaduTamil NaduTamil NaduTamil NaduTamil NaduTamil NaduTamil NaduTamil NaduTamil NaduTamil NaduTamil NaduTamil NaduTamil NaduTamil NaduTamil NaduTamil NaduTamil NaduTamil NaduTamil Nadu
UPUPUPUPUPUPUP
West BengalWest BengalWest BengalWest BengalWest BengalWest BengalWest BengalWest BengalWest BengalWest BengalWest BengalWest BengalWest BengalWest BengalWest BengalWest BengalWest BengalWest BengalWest BengalWest BengalWest BengalWest Bengal
-.0
50
.05
.1.1
5.2
Sta
te-s
peci
fic e
last
icity
10 15 20 25 30 35State mean number of days in 2001 with power-related problems
R2 = 0.80
Coefficient (s.e.) = -0.009*** (0.001)

Constraints on ICT adoption
In India, firms in states with more power disruptions use less ICT and get lower returns from ICT investment
And power disruptions are very highly correlated across states with other reported constraints on ICT adoption
Constraints on ICT adoption
In India, firms in states with more power disruptions use less ICT and get lower returns from ICT investment
And power disruptions are very highly correlated across states with other reported constraints on ICT adoption
Suggests that a cluster of ‘poor institutions’ and infrastructure are associated with low ICT adoption and low returns to ICT

Constraints on ICT adoption
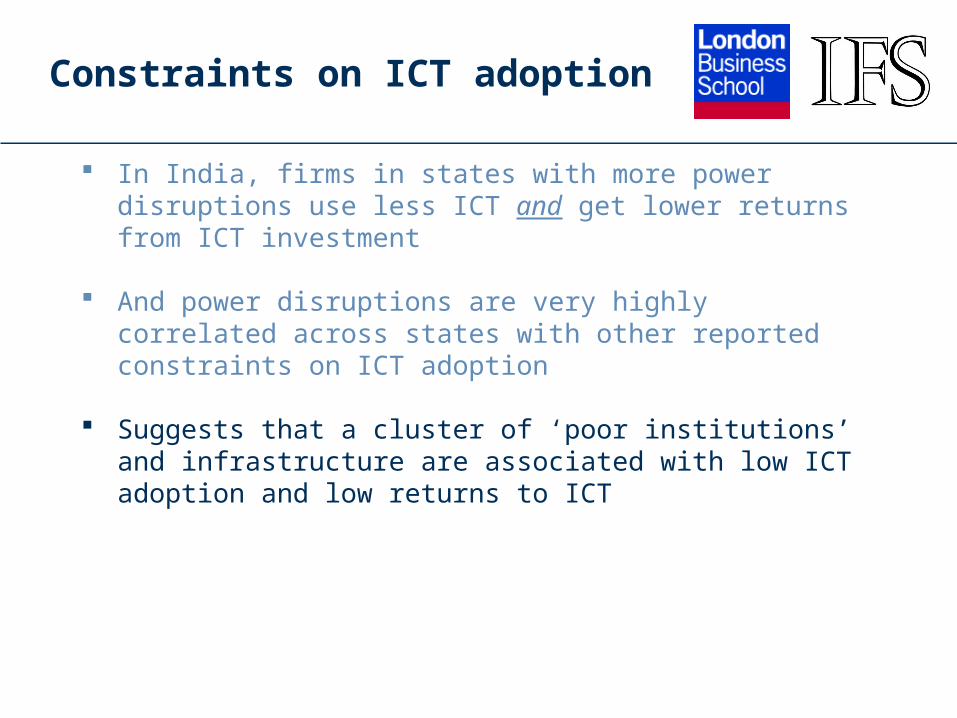
In India, firms in states with more power disruptions use less ICT and get lower returns from ICT investment
And power disruptions are very highly correlated across states with other reported constraints on ICT adoption
Suggests that a cluster of ‘poor institutions’ and infrastructure are associated with low ICT adoption and low returns to ICT
Much less regional variation in Brazil (very concentrated around Sao Paulo and the South) so can’t identify similar effects

Constraints on ICT adoption
In India, firms in states with more power disruptions use less ICT and get lower returns from ICT investment
And power disruptions are very highly correlated across states with other reported constraints on ICT adoption
Suggests that a cluster of ‘poor institutions’ and infrastructure are associated with low ICT adoption and low returns to ICT
Much less regional variation in Brazil (very concentrated around Sao Paulo and the South) so can’t identify similar effects
Interestingly, the least constrained Indian states look similar to Brazil in terms of ICT adoption and returns to ICT investment

Conclusions and other work
Very high estimated returns to ICT at the firm level

Conclusions and other work
Very high estimated returns to ICT at the firm level
Some evidence for effects of complementary organisational changes once drop tail of firms with low levels of ICT

Conclusions and other work
Very high estimated returns to ICT at the firm level
Some evidence for effects of complementary organisational changes once drop tail of firms with low levels of ICT
Poor infrastructure and policy environment are associated with lower ICT adoption and returns to ICT across Indian states
Other work: ICT and the demand for skills (Harrison, 2006)
Strong evidence for skill-bias of ICT adoption in Brazil and India
Larger effect in Brazil than in India
Robust to controlling for endogeneity of ICT adoption
Conclusions and other work
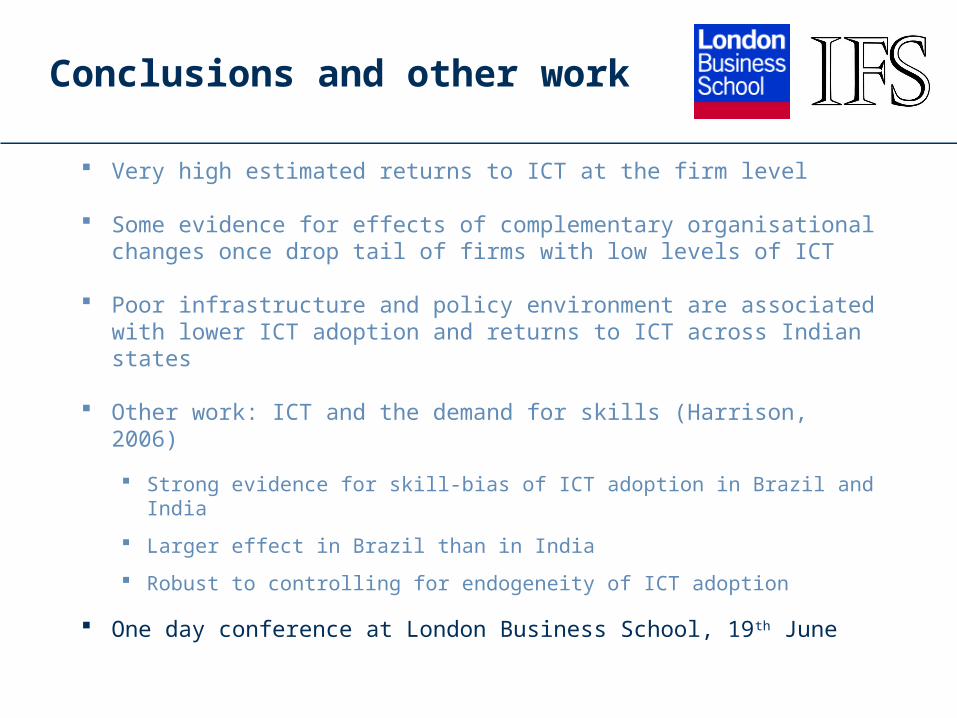
Very high estimated returns to ICT at the firm level
Some evidence for effects of complementary organisational changes once drop tail of firms with low levels of ICT
Poor infrastructure and policy environment are associated with lower ICT adoption and returns to ICT across Indian states
Other work: ICT and the demand for skills (Harrison, 2006)
Strong evidence for skill-bias of ICT adoption in Brazil and India
Larger effect in Brazil than in India
Robust to controlling for endogeneity of ICT adoption
One day conference at London Business School, 19th June