icss- asia ait, thailand november 23-24, 2009 bioenergy potential in asia shinya yokoyama the...
TRANSCRIPT
ICSS- Asia
AIT, ThailandNovember 23-24, 2009
BIOENERGY POTENTIAL IN ASIA
Shinya Yokoyama
The University of Tokyo
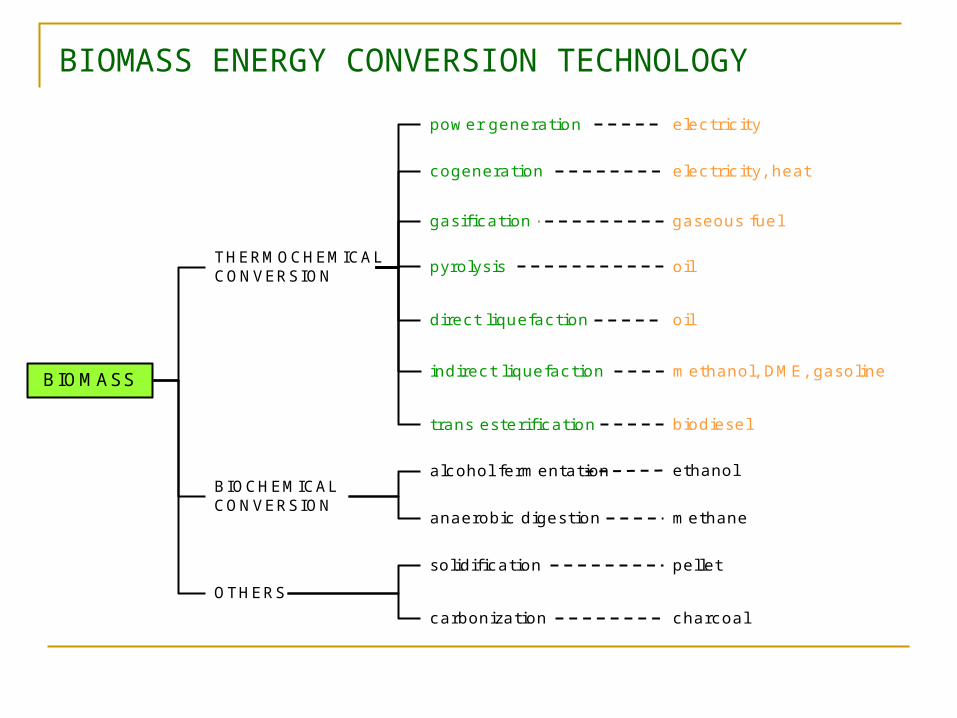
gaseous fuel
BIOMASS
power generation
cogeneration
gasification
direct liquefaction
indirect liquefaction
trans esterification
alcohol fermentation
anaerobic digestion
solidification
carbonization
electric ity
electric ity, heat
oil
methanol, DME, gasoline
biodiesel
ethanol
methane
pellet
charcoal
THERMOCHEMICALCONVERSION
BIOCHEMICALCONVERSION
OTHERS
pyrolysis oil
BIOMASS ENERGY CONVERSION TECHNOLOGY
BIOMASS ENERGY CONVERSION TECHNOLOGY
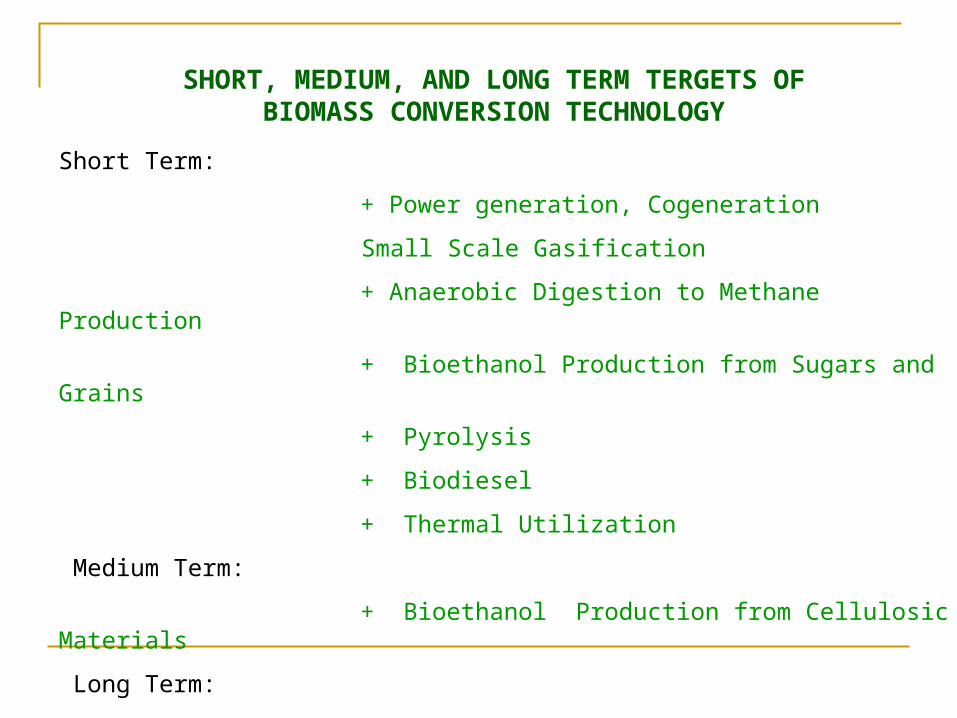
SHORT, MEDIUM, AND LONG TERM TERGETS OF BIOMASS CONVERSION TECHNOLOGY
Short Term:
+ Power generation, Cogeneration
Small Scale Gasification
+ Anaerobic Digestion to Methane Production
+ Bioethanol Production from Sugars and Grains
+ Pyrolysis
+ Biodiesel
+ Thermal Utilization
Medium Term:
+ Bioethanol Production from Cellulosic Materials
Long Term:
+ BTL
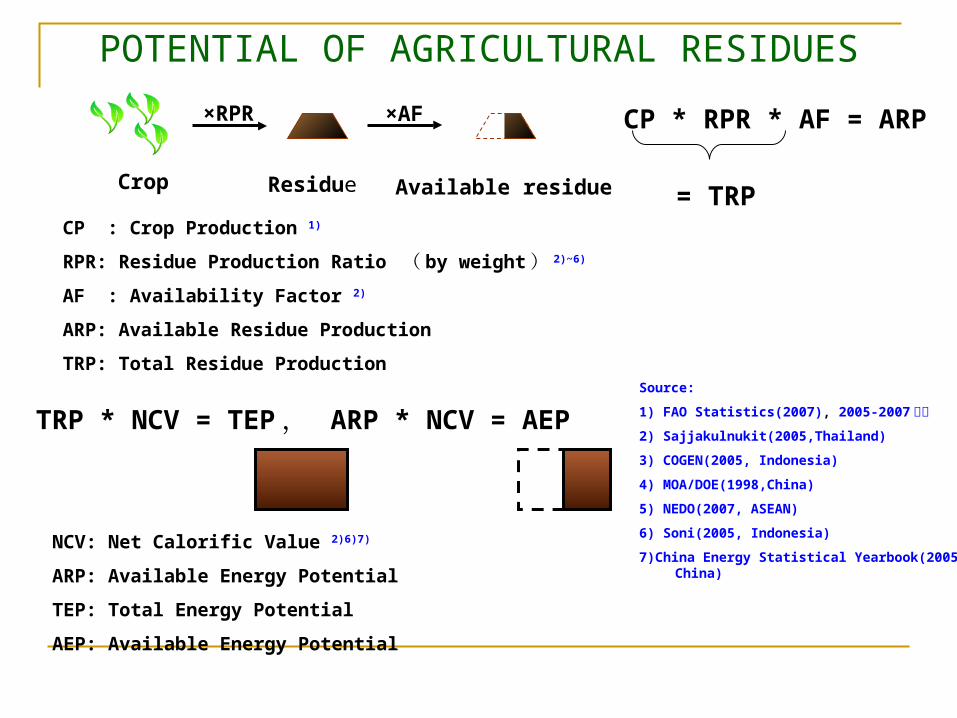
POTENTIAL OF AGRICULTURAL RESIDUES
CP * RPR * AF = ARP
CP : Crop Production 1)
RPR: Residue Production Ratio ( by weight ) 2)~6)
AF : Availability Factor 2)
ARP: Available Residue Production
TRP: Total Residue Production
= TRP
TRP * NCV = TEP , ARP * NCV = AEP
NCV: Net Calorific Value 2)6)7)
ARP: Available Energy Potential
TEP: Total Energy Potential
AEP: Available Energy Potential
Source:
1) FAO Statistics(2007), 2005-2007 平均
2) Sajjakulnukit(2005,Thailand)
3) COGEN(2005, Indonesia)
4) MOA/DOE(1998,China)
5) NEDO(2007, ASEAN)
6) Soni(2005, Indonesia)
7)China Energy Statistical Yearbook(2005. China)
×RPR ×AF
Crop Residue Available residue
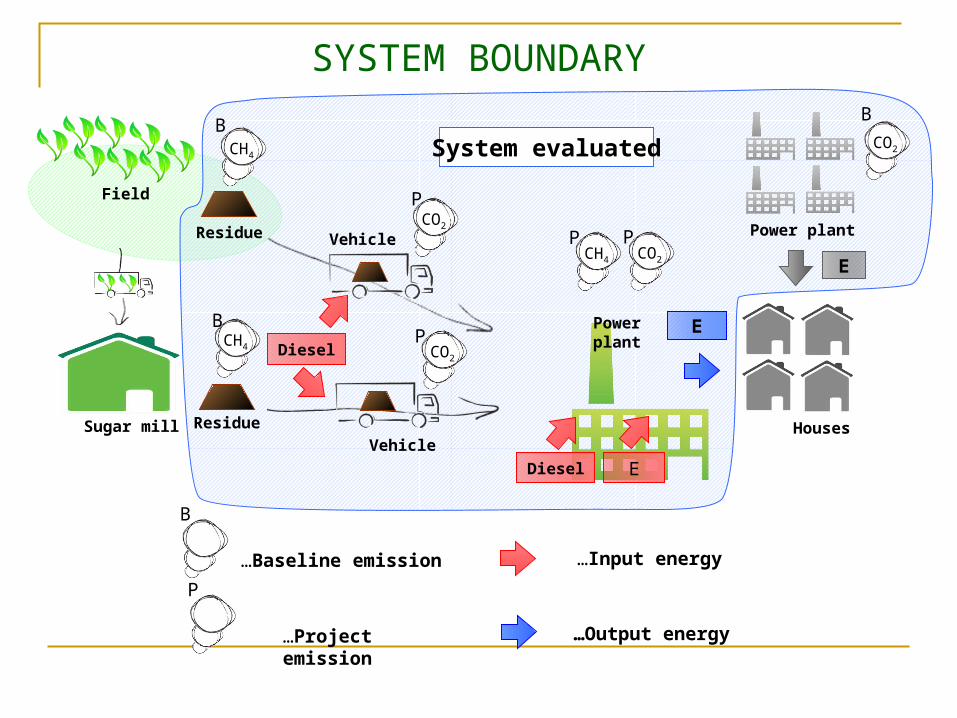
EDiesel
E
ResidueSugar mill
Power plant
VehicleHouses
Power plant
CH4
CO2
CO2
CO2
CH4
E
B
B
P
P P
Diesel
VehicleCO2
PField
Residue
CH4
B
B
…Baseline emission
P
…Project emission
…Input energy
…Output energy
System evaluated
SYSTEM BOUNDARY
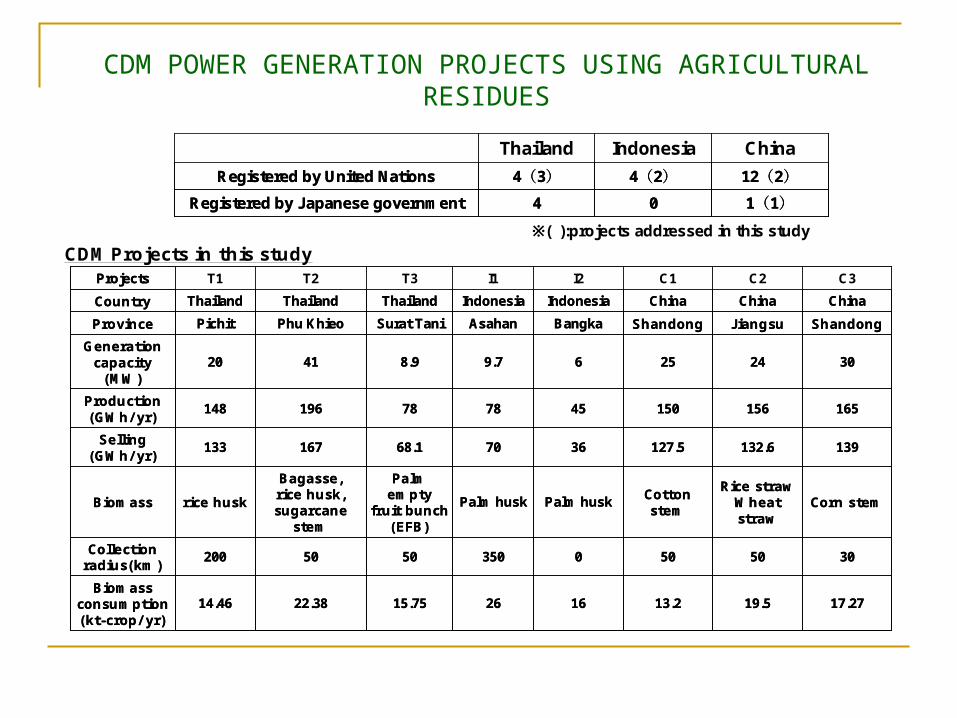
Projects
16
0
Palm husk
36
45
6
Bangka
Indonesia
I2
13.2
50
Cotton stem
127.5
150
25
Shandong
China
C1
19.5
50
Rice straw Wheat straw
132.6
156
24
J iangsu
China
C2
17.27
30
Corn stem
139
165
30
Shandong
China
C3
3505050200Collection radius(km)
15.75
Palm empty
fruit bunch (EFB)
68.1
78
8.9
Surat Tani
Thailand
T3
26
Palm husk
70
78
9.7
Asahan
Indonesia
I1
22.38 14.46 Biomass
consumption (kt-crop/ yr)
Bagasse,rice husk,sugarcane stem
rice huskBiomass
167 133 Selling
(GWh/ yr)
196 148 Production (GWh/ yr)
41 20 Generation capacity (MW)
Phu KhieoPichitProvince
ThailandThailandCountry
T2T1Projects
16
0
Palm husk
36
45
6
Bangka
Indonesia
I2
13.2
50
Cotton stem
127.5
150
25
Shandong
China
C1
19.5
50
Rice straw Wheat straw
132.6
156
24
J iangsu
China
C2
17.27
30
Corn stem
139
165
30
Shandong
China
C3
3505050200Collection radius(km)
15.75
Palm empty
fruit bunch (EFB)
68.1
78
8.9
Surat Tani
Thailand
T3
26
Palm husk
70
78
9.7
Asahan
Indonesia
I1
22.38 14.46 Biomass
consumption (kt-crop/ yr)
Bagasse,rice husk,sugarcane stem
rice huskBiomass
167 133 Selling
(GWh/ yr)
196 148 Production (GWh/ yr)
41 20 Generation capacity (MW)
Phu KhieoPichitProvince
ThailandThailandCountry
T2T1
1(1)04Registered by Japanese government
12(2)4(2)4(3)Registered by United Nations
ChinaIndonesiaThailand
1(1)04Registered by Japanese government
12(2)4(2)4(3)Registered by United Nations
ChinaIndonesiaThailand
CDM Projects in this study※( ):projects addressed in this study
CDM POWER GENERATION PROJECTS USING AGRICULTURAL RESIDUES
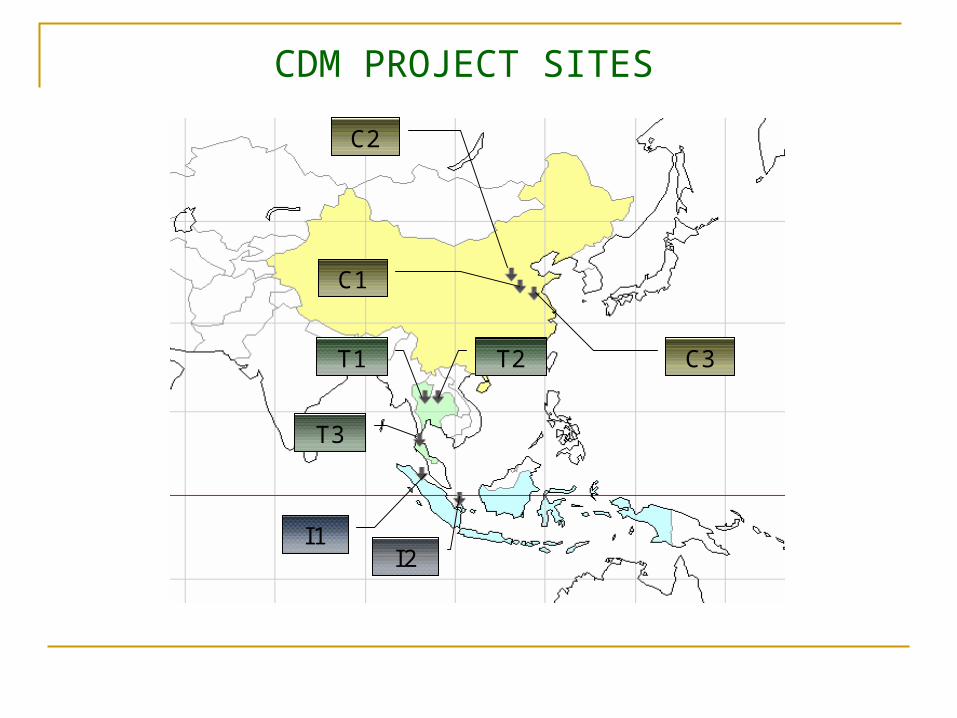
C1
C2
C3T2T1
T3
I2I1
CDM PROJECT SITES
0
200,000,000
400,000,000
600,000,000
800,000,000
1,000,000,000
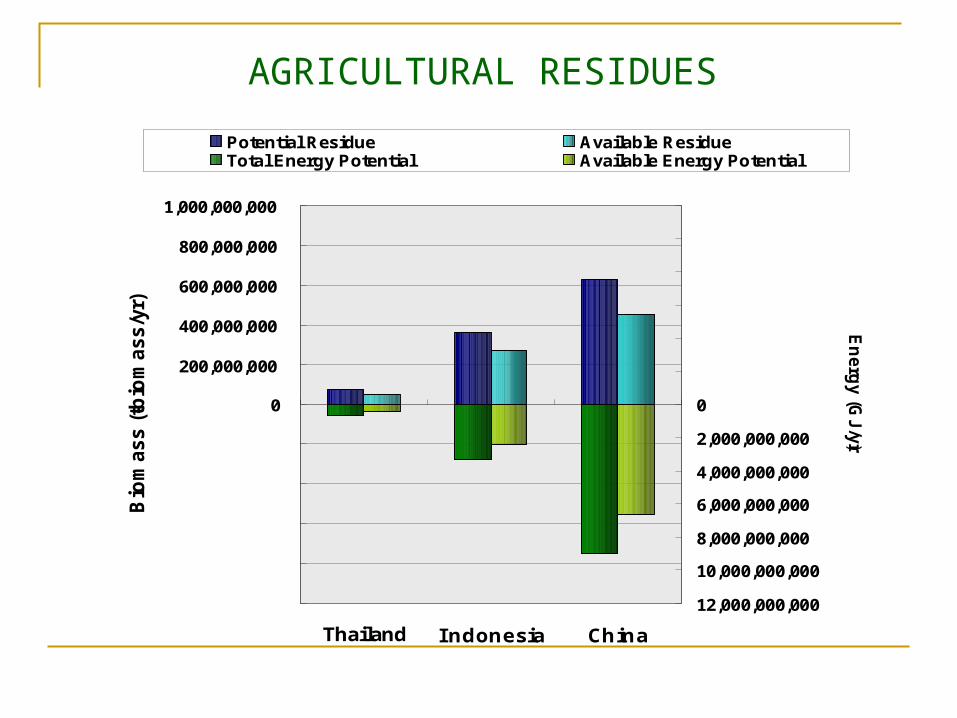
Thailand Indonesia China
Bio
mass (
t-bio
mass/y
r)
0
2,000,000,000
4,000,000,000
6,000,000,000
8,000,000,000
10,000,000,000
12,000,000,000
En
erg
y (G
J/y
r)
Potential Residue Available ResidueTotal Energy Potential Available Energy Potential
AGRICULTURAL RESIDUES
0
500
1000
1500
2000
2500
3000
3500
4000
4500
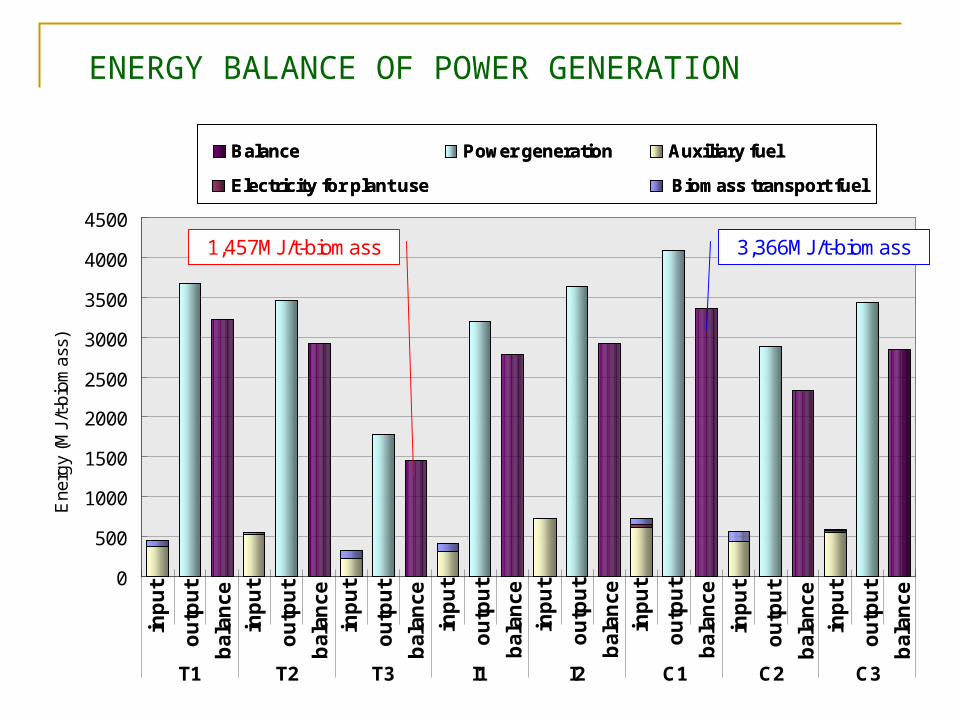
T1 T2 T3 I1 I2 C1 C2 C3
Ene
rgy
(MJ/
t-bi
omas
s)
inp
ut
ou
tpu
t
bal
ance
inp
ut
ou
tpu
t
bal
ance
inp
ut
ou
tpu
t
bal
ance
inp
ut
ou
tpu
t
bal
ance
inp
ut
ou
tpu
t
bal
ance
inp
ut
ou
tpu
t
bal
ance
inp
ut
ou
tpu
t
bal
ance
inp
ut
ou
tpu
t
bal
ance
Balance Power generation Auxiliary fuel
Electricity for plant use Biomass transport fuel
Balance Power generation Auxiliary fuel
Electricity for plant use Biomass transport fuel
3,366MJ/t-biomass1,457MJ/t-biomass
ENERGY BALANCE OF POWER GENERATION
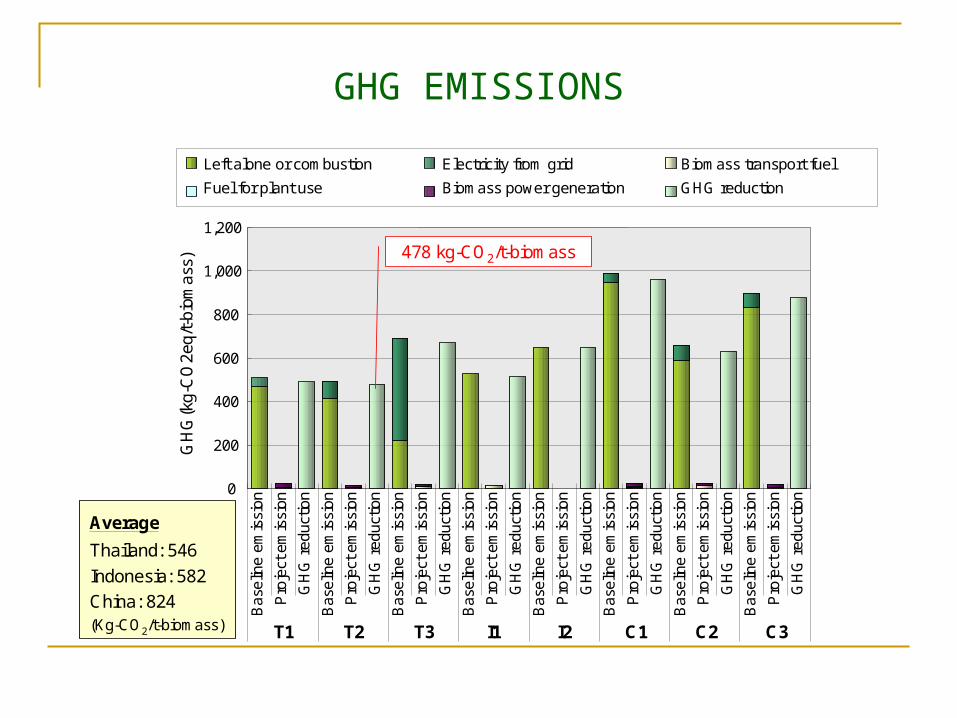
963kg-CO2/t-biomass
Average
Thailand: 546
Indonesia: 582
China: 824(Kg-CO2/t-biomass)
0
200
400
600
800
1,000
1,200
T1 T2 T3 I1 I2 C1 C2 C3
GH
G(k
g-C
O2e
q/t-
biom
ass)
Left alone or combustion Electricity from grid Biomass transport fuel
Fuel for plant use Biomass power generation GHG reduction
Bas
elin
e e
mis
sion
Pro
ject
em
issi
on
GH
G r
educ
tion
Bas
elin
e e
mis
sion
Pro
ject
em
issi
on
GH
G r
educ
tion
Bas
elin
e e
mis
sion
Pro
ject
em
issi
on
GH
G r
educ
tion
Bas
elin
e e
mis
sion
Pro
ject
em
issi
on
GH
G r
educ
tion
Bas
elin
e e
mis
sion
Pro
ject
em
issi
on
GH
G r
educ
tion
Bas
elin
e e
mis
sion
Pro
ject
em
issi
on
GH
G r
educ
tion
Bas
elin
e e
mis
sion
Pro
ject
em
issi
on
GH
G r
educ
tion
Bas
elin
e e
mis
sion
Pro
ject
em
issi
on
GH
G r
educ
tion
478 kg-CO2/t-biomass
GHG EMISSIONSGHG EMISSIONS
0
500
1,000
1,500
2,000
2,500
3,000
発電ポテンシャル 電源構成
Coal Oil Natural gas Biomass Nuclear Hydro Geothermal Coal Oil Natural gas Biomass Nuclear Hydro Geothermal
Potential of power
generation
Power generation
mix
3000
2500
2000
1500
1000
500
0
Ele
ctrici
ty (T
Wh/
yr)
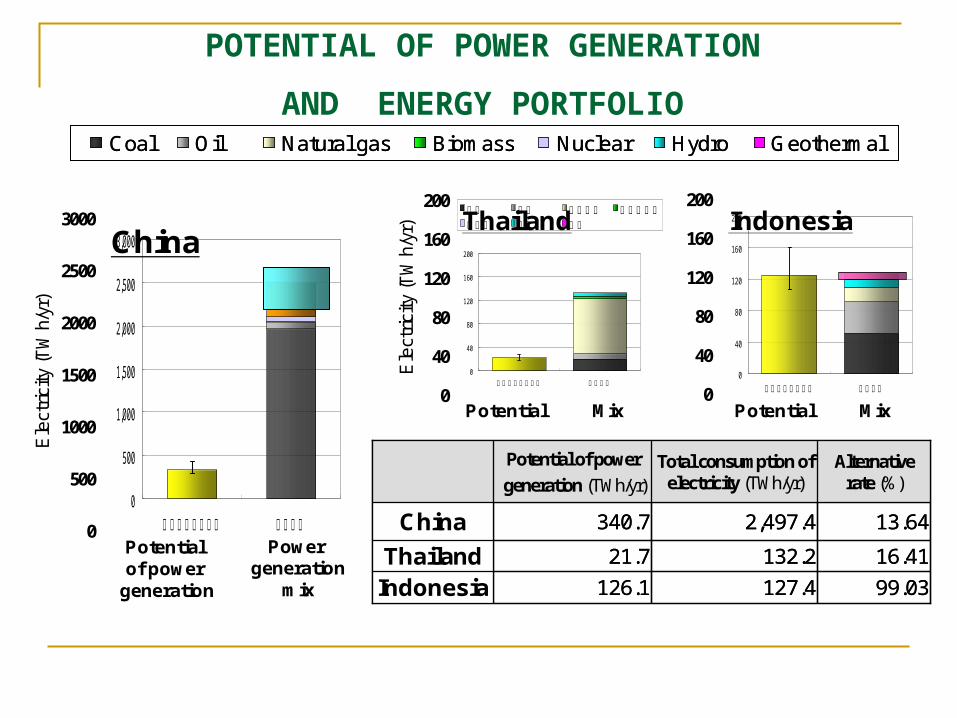
China
16.41132.221.7Thailand99.03127.4126.1Indonesia
13.642,497.4340.7China
Alternative rate (%)
Total consumption of electricity (TWh/yr)
Potential of power
generation (TWh/yr)
16.41132.221.7Thailand99.03127.4126.1Indonesia
13.642,497.4340.7China
Alternative rate (%)
Total consumption of electricity (TWh/yr)
Potential of power
generation (TWh/yr)
0
40
80
120
160
200
発電ポテンシャル 電源構成
石炭 石油 天然ガス バイオマス原子力 水力 地熱
0
40
80
120
160
200
発電ポテンシャル 電源構成
Potential Mix Potential Mix
200
160
120
80
40
0E
lect
rici
ty (T
Wh/
yr) Thailand Indonesia
200
160
120
80
40
0
POTENTIAL OF POWER GENERATION
AND ENERGY PORTFOLIO

GHG REDUCTION POTENTIAL
China Thailand Indonesia
Available Residue(t-biomass/yr)
453,911,854 35,661,136 128,395,507
GHG reduction new biomass residue (t-CO2eq/t-biomass)
0.824 0.546 0.582
GHG reduction(t-CO2eq/yr) 374,158,349 19,470,624 74,669,129
GHG emission(2006, t-CO2eq/yr) 6,018,000,000 245,000,000 280,000,000
GHG reduction potential
6.22% 7.95% 26.67%

RESULTS
China Thailand Indonesia
Resource
Potential of agricultural residue
t-biomass/yr 628,413,419 74,644,339 357,221,307
Availability % 72.00% 64.88% 75.55%
Available residue t-biomass/yr 452,472,300 48,432,741 269,889,984
Available energy potential
GJ/yr 6,788,362,652 318,186,664 1,314,484,952
Power generation
Potential of power generation (average)
GWh/yr 340,651 21,691 126,133
Alternative rate % 13.64% 16.41% 99.03%
GHG reduction
GHG reductiont-CO2eq
/t-biomass0.824 0.546 0.582
GHG reduction potential
t-CO2eq
/t-biomass374,158,349 19,470,624 74,669,129
GHG reduction rate % 6.22% 7.95% 26.67%
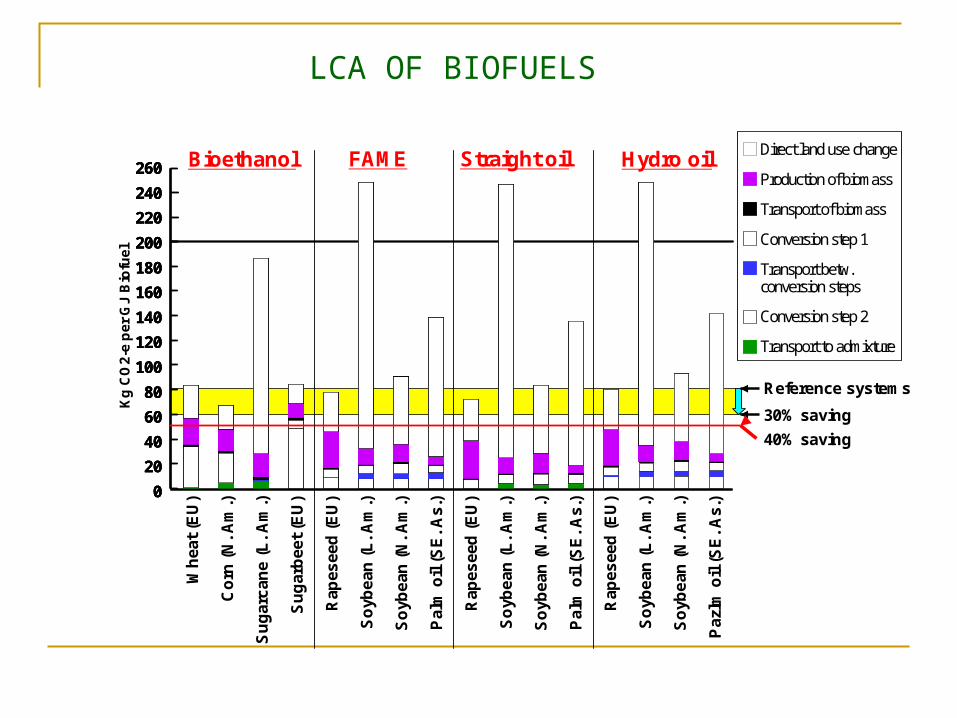
Default Value of GHG Emissions“Sustainability Ordinance”
260
240
220
200
180
160
140
120
100
80
60
40
20
0
260
240
220
200
180
160
140
120
100
80
60
40
20
0
260
240
220
200
180
160
140
120
100
80
60
40
20
0
Wh
eat
(EU
)
Co
rn (
N.
Am
.)
Su
gar
can
e (
L.
Am
.)
Su
gar
bee
t(E
U)
Rap
esee
d (
EU
)
So
ybe
an (
L.
Am
.)
So
ybe
an (
N.
Am
.)
Pal
m o
il (
SE
. A
s.)
Rap
esee
d (
EU
)
So
ybe
an (
L.
Am
.)
So
ybe
an (
N.
Am
.)
Pal
m o
il (
SE
. A
s.)
Rap
esee
d (
EU
)
So
ybe
an (
L.
Am
.)
So
ybe
an (
N.
Am
.)
Paz
lmo
il (
SE
. A
s.)
Kg
CO
2-e
pe
r G
J B
iofu
el
Direct land use change
Production of biomass
Transport of biomass
Conversion step 1
Transport betw. conversion steps
Conversion step 2
Transport to admixture
Reference systems
30% saving
40% saving
Bioethanol FAME Straight oil Hydro oil
LCA OF BIOFUELS
KEY MESSAGE
+ Intimate Contact and Information Exchange to Avoid
Labor, Time, and Expenditure etc.
+ Appropriate Technologies for Energy and Materials
+ Further Study for Sustainability of Biomass Utilization
Including, for Example, Land Use Change, Competition
with Food, Biodiversity etc.
+ Well Designed Regulation for Biomass Utilization
+ International Collaboration