icr values report for 2019-2020 - iso new england · 2019/20 icr values report 1 . iso new england...
TRANSCRIPT

2019/20 ICR Values Report 1
ISO New England Installed Capacity Requirement, Local Sourcing Requirements and Capacity Requirement Values for the System-Wide Capacity Demand Curve for the 2019/20 Capacity Commitment Period
ISO New England Inc. January 2016

2019/20 ICR Values Report 1
ISO New England Installed Capacity Requirement, Local Sourcing Requirements, and Capacity Requirement Values
for the System-Wide Capacity Demand Curve for the 2019/20 Capacity Commitment Period
2019/20 ICR Values Report 2
Section 1: Executive Summary As part of the Forward Capacity Market (FCM), ISO New England Inc. (ISO-NE) conducts a Forward Capacity Auction (FCA) three years in advance of each Capacity Commitment Period (CCP) to meet the region’s resource adequacy needs. The next FCA, to be conducted on February 8, 2016, will attempt to procure capacity (megawatts) commitments of sufficient quantities to meet the Installed Capacity Requirement (ICR) for the 2019/20 CCP. The 2019/20 CCP is the tenth CCP of the FCM (FCA10) and it begins on June 1, 2019 and ends on May 31, 2020.
This report documents the assumptions and simulation results of the 2019/20 CCP ICR, Local Sourcing Requirements (LSR) and Capacity Requirement Values for the System–Wide Capacity Demand Curve calculations – (collectively referred to as the “ICR Values”), all of which are key inputs in FCA10, along with the Hydro-Québec Interconnection Capability Credits (HQICCs), which are also a key input into the calculation of the ICR.
For the 2019/20 CCP, ISO-NE has identified one Capacity Zone which consists of three Load Zones that together have a transmission interface that is import-constrained.1 These three Load Zones, Northeast Massachusetts/Boston (NEMA/Boston), Southeastern Massachusetts (SEMA) and Rhode Island (RI), combined, are modeled as a Capacity Zone called Southeast New England (SENE) in FCA10. 1,2 The Connecticut Load Zone, modeled as a Capacity Zone in previous FCAs, was determined not to be import-constrained for FCA10.1
The Northern New England (NNE) Zone, which was filed as a new potentially export-constrained Capacity Zone boundary for FCA10, was determined not to be export-constrained after conducting the Capacity Zone Trigger Analysis.2,3 Therefore the ICR Values for FCA10 considers one LSR value for SENE and does not consider any Maximum Capacity Limit (MCL) values.
In a filing, dated April 1, 2014, ISO-NE filed Market Rules relating to a System-Wide Capacity Demand Curve (Demand Curve) which was used for the first time in FCA9.4 The Demand Curve has capacity requirement values that are calculated at the cap and foot5 of the curve and are considered and filed as part of the ICR Values for FCA10.
1 The analysis to determine import-constrained Capacity Zones is discussed in this presentation: http://www.iso-ne.com/static-assets/documents/2015/06/fca10_zone_formation.pdf. 2 The FERC filing identifying SENE and NNE as potential new Capacity Zone boundaries is available at: http://www.iso-ne.com/static-assets/documents/2015/04/er15-___-000_identification_of_potential_new_capacity_zone_boundaries.pdf. 3 The analysis showing that NNE was determined not to be export-constrained is discussed in this presentation: http://www.iso-ne.com/static-assets/documents/2015/08/pspc_081415_a3.0_fca10_zone_formation2.pdf. 4 The filing is available at: http://www.iso-ne.com/static-assets/documents/regulatory/ferc/filings/2014/apr/er14_1639_000_demand_curve_chges_4_1_2014.pdf. 5 The design of the Demand Curve is specified in Section III.13.2.2. of the Market Rules which describes the cap as the capacity requirement value at 1-in-5 LOLE, Max[1.6 x Net CONE,CONE] and the foot of the Demand Curve capacity requirement value at 1-in-87 LOLE, $0. See Figure 2 for the FCA10 Demand Curve.
2019/20 ICR Values Report 3
For the first time, ISO-NE is modeling a forecasted amount of Photovoltaic (PV) resources considered to be “behind the meter” that do not have any settlement reporting requirements to ISO-NE and do not already have their energy output incorporated in historical loads. These resources are considered to be in the category called “Behind the Meter not Embedded in Load” (BTMNEL) and for 2019/20 the value netted from the summer peak load forecast, thereby reducing the load forecast, is approximately 370 MW. The PV forecast was developed by the Distributed Generation Forecast Working Group (DGFWG) in conjunction with ISO-NE and was completed in April 2015.6
As shown in Table 1 below, ISO-NE has calculated an ICR of 35,126 MW. This value accounts for tie benefits (emergency energy assistance) assumed obtainable from New Brunswick (Maritimes), New York and Québec of 1,990 MW, in aggregate, but it does not reflect a reduction in capacity requirements relating to HQICCs. The HQICC value of 975 MW per month is applied to reduce the portion of the ICR that is allocated to the Interconnection Rights Holders (IHR). Thus, the net amount of capacity to be purchased within the FCA to meet the ICR, after deducting the HQICC value of 975 MW per month, is 34,151 MW.
The LSR associated with FCA10 for the SENE Capacity Zone is 10,028 MW. As stated previously, there were no export-constrained zones modeled and as such, no MCL values were filed for FCA10.
The capacity requirements at the Demand Curve cap and foot, calculated at a 1 day in 5 years (1-in-5) Loss of Load Expectation (LOLE), and a 1 day in 87 years (1-in-87) LOLE are 33,076 MW and 37,053 MW, respectively.
As in past years, ISO-NE developed the initial ICR recommendation with stakeholder input, which was provided in part through the NEPOOL committee processes through review by NEPOOL’s Power Supply Planning Committee (PSPC) during the course of four meetings, by the NEPOOL Reliability Committee (RC) at its September 15, 2015 meeting and by the NEPOOL Participants Committee (PC) at its October 2, 2015 meeting.7 In addition, the New England States Committee on Electricity (NESCOE) provided feedback on the proposed ICR Values at the relevant NEPOOL committee meetings. Representatives of NESCOE provided feedback at discussions of the ICR Values assumptions at the PSPC and were in attendance for the RC and PC meetings at which the ICR Values for FCA10 were discussed and voted.
After the NEPOOL committee voting process was completed, ISO-NE filed the ICR Values and HQICCs for the 2019/20 FCA with a FERC in a filing dated November 10, 2015.8 The
6 See the final DGFWG PV forecast presentation at: http://www.iso-ne.com/static-assets/documents/2015/05/final_2015_pv_forecast.pdf. 7 All of the load and resource assumptions needed for the General Electric Multi-Area Simulation (“GE MARS”) model used to calculate tie benefits and the ICR Related Values were reviewed by the PSPC, a subcommittee of the NEPOOL Reliability Committee (RC). The NEPOOL Load Forecast Committee (LFC), also a subcommittee of the NEPOOL Reliability Committee, reviews the load forecast assumptions and methodology. 8 The ISO-NE ICR Values filing for FCA10 is located at http://www.iso-ne.com/static-assets/documents/2015/11/icr_values_2019-2020_ccp.pdf.

2019/20 ICR Values Report 4
FERC accepted the ICR Values in an Order dated January 8, 2016 (Docket No. ER16-307-000).9
Table 1 shows the ICR Values for the 2019/20 CCP. The monthly values for the HQICCs are provided in Table 2.
Table 1: Summary of 2019/20 ICR Values (MW)10
Table 2: Monthly HQICCs for the 2019/20 CCP (MW)
9 The FERC Order accepting the ICR Values for FCA10 is available at: http://www.iso-ne.com/static-assets/documents/2016/01/er16-307-000_1-8-16_order_accept_2019-2020_icr_and_related_values.pdf. 10 After reflecting a reduction in capacity requirements relating to the 975 MW of HQICCs that are allocated to the Interconnection Rights Holders (IHR), the net amount of capacity to be procured within the Forward Capacity Auction to meet the ICR is the Net ICR value of 34,151 MW.
New EnglandSoutheast New
England
Peak Load (50/50) 29,861 12,282
Existing Capacity Resources 33,484 11,194
Installed Capacity Requirement 35,126
NET ICR (ICR Minus 975 MW HQICCs) 34,151
1-in-5 LOLE Demand Curve capacity value 33,076
1-in-87 LOLE Demand Curve capacity value 37,053
Local Sourcing Requirement 10,028
2019/20 CCP Month Jun-19 Jul-19 Aug-19 Sep-19 Oct-19 Nov-19 Dec-19 Jan-20 Feb-20 Mar-20 Apr-20 May-20
HQICC Values 975 975 975 975 975 975 975 975 975 975 975 975

2019/20 ICR Values Report 5
Table of Contents
Section 1 : Executive Summary.............................................................................................................................. 2
Section 2 : Introduction ......................................................................................................................................... 9
Section 3 : Summary of ICR Values and Components .......................................................................................... 10
Section 4 : Stakeholder Process ........................................................................................................................... 13
Section 5 : Methodology & Results ..................................................................................................................... 15
5.1 Reliability Planning Model for ICR Values ......................................................................................................... 15
5.2 Installed Capacity Requirement (ICR) Calculation ............................................................................................. 16
5.3 Local Sourcing Requirements (LSR) Calculation ................................................................................................ 18
5.3.1 Local Resource Adequacy (LRA) Requirement ........................................................................................... 18
5.3.2 Transmission Security Analysis (TSA) Calculation ...................................................................................... 21
5.3.3 Determining the Local Sourcing Requirement (LSR) .................................................................................. 23
5.4 Maximum Capacity Limit (MCL) Calculation ..................................................................................................... 23
Section 6 : Load and Resource Assumptions ........................................................................................................ 27
6.1 Load Forecast .................................................................................................................................................... 27
6.1.1 Modeling of the BTMNEL PV Forecast ....................................................................................................... 27
6.1.1 Load Forecast Uncertainty ......................................................................................................................... 28
6.2 Existing Capacity Resources .............................................................................................................................. 29
6.2.1 Generating Resources ................................................................................................................................ 30
6.2.2 Intermittent Power Resources ................................................................................................................... 30
6.2.3 Demand Resources .................................................................................................................................... 31
6.2.4 Import Resources ....................................................................................................................................... 32
6.3 Export Bids ........................................................................................................................................................ 33
6.4 New Capacity Resources ................................................................................................................................... 33
6.5 Resources Used to Calculate Locational Requirements .................................................................................... 33
6.6 Proxy Units ........................................................................................................................................................ 34
Section 7 : Transmission Transfer Capability Assumptions ................................................................................... 36
7.1 Transmission Transfer Capability ...................................................................................................................... 36
7.1.1 External Transmission Transfer Capability ................................................................................................. 36
7.1.2 External Transmission Interface Availability .............................................................................................. 36
7.1.3 Internal Transmission Transfer Capability ................................................................................................. 37
Section 8 : OP4 Load Relief .................................................................................................................................. 38
8.1 Tie Benefits ........................................................................................................................................................ 38
2019/20 ICR Values Report 6
8.1.1 Tie Benefits Calculation Methodology ....................................................................................................... 38
8.2 5% Voltage Reduction ....................................................................................................................................... 43
8.3 Operating Reserve ............................................................................................................................................. 44
8.4 Summary ........................................................................................................................................................... 44
Section 9 : Resource Availability.......................................................................................................................... 45
9.1 Generating Resource Forced Outages ............................................................................................................... 45
9.2 Generating Resource Scheduled Outages ......................................................................................................... 45
9.2.1 Intermittent Power Generating Resource Availability ............................................................................... 46
9.2.2 Demand Resources Availability .................................................................................................................. 47
Section 10 : Difference from 2018/19 FCA ICR Values ......................................................................................... 49
10.1 Change in ICR .................................................................................................................................................. 49
10.2 Change in Locational Requirements ................................................................................................................ 52

2019/20 ICR Values Report 7
List of Tables
Table 1: Summary of 2019/20 ICR Values (MW) ............................................................................................ 4 Table 2: Monthly HQICCs for the 2019/20 CCP (MW) .................................................................................... 4 Table 3: ICR Values and Components for 2019/20 (MW)............................................................................. 10 Table 4: Variables Used to Calculate ICR and Demand Curve Requirements (MW) .................................... 18 Table 5: LRA Requirement Calculation Details (MW) ................................................................................... 21 Table 6: TSA Calculation Details (MW) ......................................................................................................... 23 Table 7: LSR for the 2019/20 CCP (MW) ....................................................................................................... 23 Table 8: Indicative MCL for NNE Calculation Details (MW) .......................................................................... 26 Table 9: Monthly PV Forecast Values Modeled in the ICR Values for 2019/20 (MW) ................................. 28 Table 10: Summer 2019 Peak Load Forecast Distribution (MW) ................................................................. 29 Table 11: Existing Qualified Generating Capacity by Load Zone (MW) ........................................................ 30 Table 12: Existing IPR by Load Zone (MW) ................................................................................................... 31 Table 13: Existing Demand Resources by Load Zone (MW) ......................................................................... 32 Table 14: Existing Import Resources (MW) .................................................................................................. 32 Table 15: Capacity Exports (MW) ................................................................................................................. 33 Table 16: Resources Used in the LSR Calculations (MW) ............................................................................. 34 Table 17: Transmission Transfer Capability of External Interfaces into New England Modeled in the Tie Benefits Study (MW) .................................................................................................................................... 36 Table 18: External Interface Outage Rates (% and Weeks) .......................................................................... 37 Table 19: Internal Transmission Transfer Import Capability Modeled in the LSR Calculation for SENE (MW) ...................................................................................................................................................................... 37 Table 20: Internal Interface N-1 TTC Limits Modeled in the Tie Benefits Study for 2019/20 (MW) ......... 39 Table 21: Capacity Imports by External Interface Used to Adjust Tie Benefits (MW) .................................. 42 Table 22: 2019/20 Tie Benefits (MW)........................................................................................................... 42 Table 23: 2019/20 versus 2018/19 Tie Benefits (MW) ................................................................................. 42 Table 24: OP-4 Action 6 & 8 Modeled (MW) ................................................................................................ 44 Table 25: Summary of Resource and OP4 Assumptions (MW) .................................................................... 44 Table 26: Generating Resource EFORd (%) and Maintenance Weeks by Resource Category ...................... 46 Table 27: Annual System-Wide Generator EFORd Statistics (%) .................................................................. 46 Table 28: Passive Demand Resources – Summer (MW) and Availability (%) ............................................... 47 Table 29: Demand Response Resources Summer (MW) and Availability (%) .............................................. 48 Table 30: Summary of ICR Input Assumptions for 2019/20 vs. 2018/19...................................................... 49 Table 31: Load Forecast Scenarios to Gauge the Effect on ICR .................................................................... 51 Table 32: Comparison of Demand Resources (MW) & Performance (%) for 2019/20 versus 2018/19 ICR Calculations .................................................................................................................................................. 51 Table 35: Summary Table with the Comparison of all ICR Values (MW) ...................................................... 52

2019/20 ICR Values Report 8
List of Figures
Figure 1: Formula for Annual Resulting Reserve Margin (%) ........................................................................ 10 Figure 2: System-Wide Capacity Demand Curve for 2019/20 (FCA10) ........................................................ 12 Figure 3: Formula for ICR Calculation ........................................................................................................... 16 Figure 4: Formula for LRA Calculation .......................................................................................................... 20 Figure 5: Surplus Capacity Adjustment in Rest of New England ................................................................... 20 Figure 6: Formula for TSA Requirements ..................................................................................................... 22 Figure 7: Formula for MCL Calculation ......................................................................................................... 25 Figure 10: Determining the Proxy Unit Size to Use in ICR Models ............................................................... 35 Figure 8: Summarization of the Tie Benefits Calculation Process ................................................................ 39 Figure 9: Formula for Calculating 5% Voltage Reduction Assumption ......................................................... 43
2019/20 ICR Values Report 9
Section 2: Introduction The Installed Capacity Requirement (ICR) is a measure of the installed resources that are projected to be necessary to meet both ISO New England’s (ISO-NE) and the Northeast Power Coordination Council’s (NPCC) reliability standards11, with respect to satisfying the peak load forecast for the New England Balancing Authority area while maintaining required reserve capacity. More specifically, the ICR is the amount of resources (MWs) needed to meet the reliability requirements defined for the New England Balancing Authority area of disconnecting non-interruptible customers (a loss of load expectation or “LOLE”), on average, no more than once every ten years (an LOLE of 0.1 days per year). This criterion takes into account: other possible levels of peak electric loads due to weather variations, the impacts of resource availability, and the potential load relief obtainable through the use of ISO New England Operating Procedure No. 4 – Actions During a Capacity Deficiency (OP-4).12
This report discusses the derivation of the ICR, Local Sourcing Requirements (LSR) and the capacity requirement values for the System-Wide Capacity Demand Curve (“Demand Curve”) (collectively, the “ICR Values”)13, along with the Hydro-Québec Interconnection Capability Credits (HQICCs) for the 2019/20 Capacity Commitment Period (CCP) Forward Capacity Auction (FCA) beginning February 8, 2016. The 2019/20 CCP starts on June 1, 2019 and ends on May 31, 2020.
This report also documents the general process and methodology used for developing the assumptions utilized in calculating the ICR, including assumptions about load, resource capacity ratings and availability, the Photovoltaic (PV) resource forecast, load relief from OP-4, and transmission interface transfer capabilities. Also discussed are the methodology and formulas used for calculating the ICR and the calculation of LSR for import-constrained Load Zones. This includes the Local Resource Adequacy (LRA) Requirements and Transmission Security Analysis (TSA) Requirements that are inputs into the calculation of LSR. Also discussed is the methodology for the calculation of the MCL for export-constrained Capacity Zones (which were not required as part of FCA10). In general, the methodology used for calculating the ICR Values for the 2019/20 FCA remains unchanged from the methodology used for calculating the prior ICR Values for the 2018/19 FCA, with the exception of the addition of the forecast of PV resources considered “behind the meter” and not previously embedded in historical loads. These currently installed and forecasted PV resources are in the category called “Behind the Meter Not Embedded in Load” (BTMNEL). Inclusion of this PV forecast, developed by the Distributed Generation Forecast Working Group (DGFWG), was used for the first time in FCA10.
11 Information on the NPCC Standards is available at: https://www.npcc.org/Standards/default.aspx. 12 ISO-NE OP-4 is located at: http://www.iso-ne.com/static-assets/documents/rules_proceds/operating/isone/op4/op4_rto_final.pdf. 13 For FCA10, no zones were determined to be export-constrained and therefore, no Maximum Capacity Limit (MCL) values were filed as part of FCA10.
2019/20 ICR Values Report 10
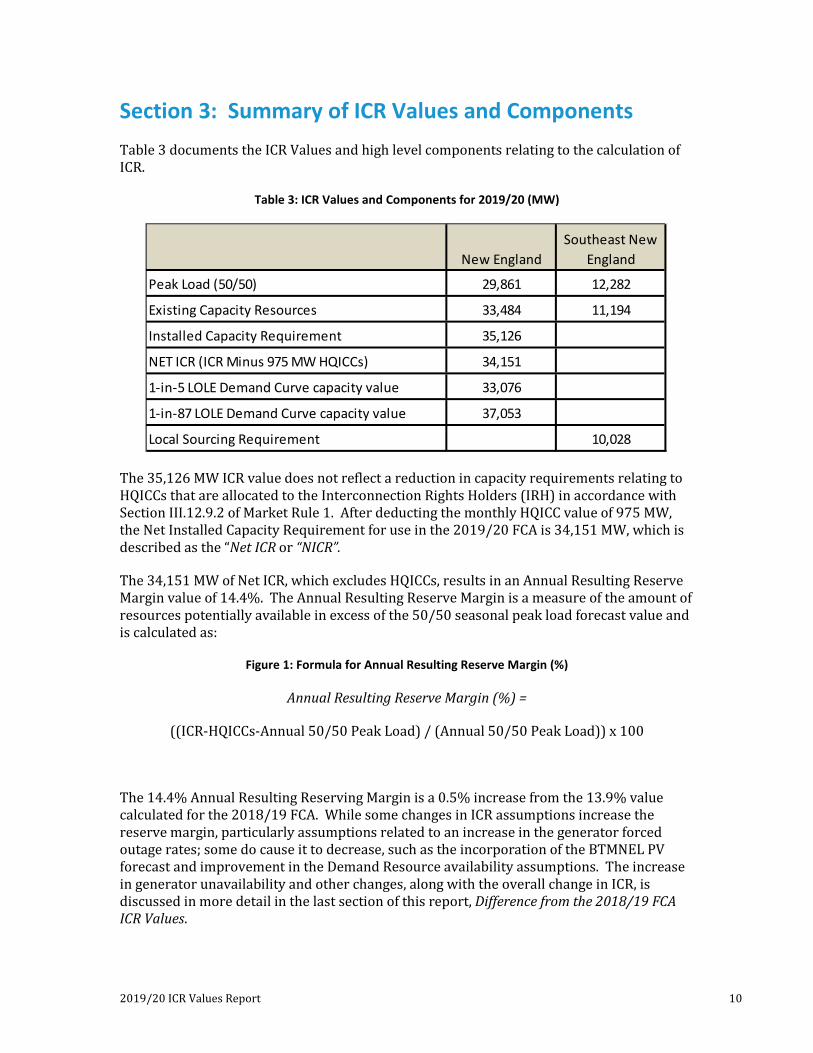
Section 3: Summary of ICR Values and Components Table 3 documents the ICR Values and high level components relating to the calculation of ICR.
Table 3: ICR Values and Components for 2019/20 (MW)
The 35,126 MW ICR value does not reflect a reduction in capacity requirements relating to HQICCs that are allocated to the Interconnection Rights Holders (IRH) in accordance with Section III.12.9.2 of Market Rule 1. After deducting the monthly HQICC value of 975 MW, the Net Installed Capacity Requirement for use in the 2019/20 FCA is 34,151 MW, which is described as the “Net ICR or “NICR”.
The 34,151 MW of Net ICR, which excludes HQICCs, results in an Annual Resulting Reserve Margin value of 14.4%. The Annual Resulting Reserve Margin is a measure of the amount of resources potentially available in excess of the 50/50 seasonal peak load forecast value and is calculated as:
Figure 1: Formula for Annual Resulting Reserve Margin (%)
Annual Resulting Reserve Margin (%) =
((ICR-HQICCs-Annual 50/50 Peak Load) / (Annual 50/50 Peak Load)) x 100
The 14.4% Annual Resulting Reserving Margin is a 0.5% increase from the 13.9% value calculated for the 2018/19 FCA. While some changes in ICR assumptions increase the reserve margin, particularly assumptions related to an increase in the generator forced outage rates; some do cause it to decrease, such as the incorporation of the BTMNEL PV forecast and improvement in the Demand Resource availability assumptions. The increase in generator unavailability and other changes, along with the overall change in ICR, is discussed in more detail in the last section of this report, Difference from the 2018/19 FCA ICR Values.
New EnglandSoutheast New
England
Peak Load (50/50) 29,861 12,282
Existing Capacity Resources 33,484 11,194
Installed Capacity Requirement 35,126
NET ICR (ICR Minus 975 MW HQICCs) 34,151
1-in-5 LOLE Demand Curve capacity value 33,076
1-in-87 LOLE Demand Curve capacity value 37,053
Local Sourcing Requirement 10,028
2019/20 ICR Values Report 11
According to Section III.12.1 of Market Rule 1, the capacity requirement values for the Demand Curve, calculated require that:
“The ISO shall determine, by applying the same modeling assumptions and methodology used in determining the Installed Capacity Requirement, the capacity requirement value for each LOLE probability specified in Section III.13.2.2 for the System-Wide Capacity Demand Curve”
As such, the capacity requirement values at the Demand Curve cap and foot, calculated at 1 day in 5 years (1-in-5) Loss of Load Expectation (LOLE), and at 1 day in 87 years (1-in-87) LOLE are 33,076 MW and 37,053 MW, respectively.
The coordinates of the Demand Curve use a price quantity for the Cost of New Entry (CONE) into the capacity market. This price quantity is determined as max [1.6 times Net CONE, Gross CONE]. Gross CONE for the FCA for the 2019/20 CCP is $14.29/kW-month while Net CONE is $10.81/kW-month.14
Using the coordinates of the cap of the Demand Curve of [Capacity Requirement Value at 1-in-5 LOLE, 1.6 x Net CONE ($17.296)] and the foot of the Demand Curve of [Capacity Requirement Value at 1-in-87 LOLE, $0], the Demand Curve for FCA10 is shown in Figure 2.
14 The parameters, including CONE, for FCA10 was an informational item on the May 5 & 6, 2015 Markets Committee Agenda: http://www.iso-ne.com/static-assets/documents/2015/05/a09b_parameters_for_the_tenth_forward_capacity_auction.pdf. For rules relating to CONE, see Market Rule 1 III.13.2.4.

2019/20 ICR Values Report 12
Figure 2: System-Wide Capacity Demand Curve for 2019/20 (FCA10)
A summary of historical ICR Values for all FCAs, including links to documentation and filings for FCA10 and prior years are available on the ISO-NE website under System Planning > Installed Capacity Requirements > Summary of Historical ICR Values (EXCEL Spreadsheet) and can be directly accessed at this link: http://www.iso-ne.com/static-assets/documents/2015/12/summary_of_icr_values_vii.xlsx.
2019/20 ICR Values Report 13
Section 4: Stakeholder Process As in past years, ISO-NE developed the ICR recommendation with stakeholder input, which was provided in part through the NEPOOL committee process with review by NEPOOL’s Power Supply Planning Committee (PSPC) during the course of four meetings. The PSPC, which is chaired by ISO-NE, is a non-voting, technical subcommittee reporting to the NEPOOL Reliability Committee (RC). Most PSPC members are representatives of NEPOOL Participants. The PSPC assists ISO-NE with the development of resource adequacy based requirements such as the ICR, LSR, MCL and Demand Curve capacity requirements, including the appropriate load and resource assumptions for modeling expected power system conditions.
As part of the stakeholder voting process, the ICR Values was vetted through the RC at its September 15, 2015 meeting and acted on by the NEPOOL Participants Committee (PC) at its October 2, 2015 meeting.15 Representatives of the New England States Committee on Electricity (“NESCOE”) provided feedback on the proposed ICR Values at the relevant NEPOOL PSPC, RC and PC meetings, and were in attendance for the meetings at which the ICR Values for the 2019/20 Forward Capacity Auction were discussed and voted.
At the September 15, 2015 meeting of the RC, a motion to recommend support of the ICR Values passed by a show of hands, with 3 opposed (2 Generation Sector, 1 Supplier Sector) and 9 abstentions (5 Alternative Resource Sector, 2 End User Sector, 2 Supplier Sector). A motion that the RC recommend that the PC support the HQICC values also passed by a show of hands, with 2 opposed (1 Generation Sector, 1 Supplier Sector) and 4 abstentions (2 Generation Sector, 2 Supplier Sector).
At the October 2, 2015 PC meeting, the ICR Values and HQICC values16 were removed as part of the Consent Agenda. As noted in the PC Agenda “Although there was not a lot of controversy over the HQICC and ICR Values at the Reliability Committee or Power Supply Planning Committee, some Participants wanted a discussion of them, particularly regarding: (i)the Cross Sound Cable and its relationship to the HQICC and ICR Values, and (ii) how distributed generation and its assumed performance is factored into the ICR Values.” The vote on ICR Values subsequently failed at the PC with 53.08% in favor.17
15 All of the load and resource assumptions needed for the General Electric Multi-Area Simulation (GE MARS) model used to calculate tie benefits and the ICR Related Values were reviewed by the PSPC, a subcommittee of the NEPOOL RC. The NEPOOL Load Forecast Committee (LFC), also a subcommittee of the NEPOOL RC, reviewed the load forecast assumptions and methodology. 16 The HQICC Values were originally on the Consent Agenda (Item No. 2) but were removed at the request of the Long Island Power Authority. The ICR Values were placed directly on the discussion agenda following Participant requests received prior to the September 18 circulation of the Consent Agenda and initial notice of the October 2 meeting. 17 At the PC, the vote on the FCA10 ICR Values failed to approve the motion with a 53.08% vote in favor (Generation Sector – 0.00%; Transmission Sector – 17.13%; Supplier Sector – 12.23%; Alternative Resources Sector – 4.45%; Publicly Owned Entity Sector – 17.13%; and End User Sector – 2.14%).
2019/20 ICR Values Report 14
ISO-NE filed the ICR Values and HQICCs for the 2019/20 FCA with the FERC on November 4, 2014.18 The FERC accepted the ICR Values in an Order dated January 8, 2016 (Docket No. ER16-307-000).19
18 A copy of the filing is available at: http://www.iso-ne.com/static-assets/documents/2015/11/icr_values_2019-2020_ccp.pdf. 19 The FERC Order accepting the ICR Values for FCA10 is available at http://www.iso-ne.com/static-assets/documents/2016/01/er16-307-000_1-8-16_order_accept_2019-2020_icr_and_related_values.pdf.

2019/20 ICR Values Report 15
Section 5: Methodology & Results 5.1 Reliability Planning Model for ICR Values
The ICR is the minimum level of capacity required to meet the reliability requirements defined for the New England Balancing Authority area. This requirement is documented in Section 2 of ISO New England Planning Procedure No. 3,20 Reliability Standards for the New England Area Bulk Power Supply System, which states:
“Resources will be planned and installed in such a manner that, after due allowance for the factors enumerated below, the probability of disconnecting non-interruptible customers due to resource deficiency, on the average, will be no more than once in ten years. Compliance with this criterion shall be evaluated probabilistically, such that the loss of load expectation (LOLE) of disconnecting non-interruptible customers due to resource deficiencies shall be, on average, no more than 0.1 day per year.”
Included as variables within the reliability model are:
a. The possibility that load forecasts may be exceeded as a result of weather variations.
b. Immature and mature equivalent forced outage rates appropriate for resources of various sizes and types, recognizing partial and full outages.
c. Due allowance for generating unit scheduled outages and deratings.
d. Seasonal adjustments of resource capability.
e. Proper maintenance requirements.
f. Available operating procedures.
g. The reliability benefits of interconnections with systems that are not Governance Participants.
h. Such other factors as may be appropriate from time to time.
The ICR for the 2019/20 CCP was established using the General Electric Multi-Area Reliability Simulation Model (GE MARS). GE MARS is a computer program that uses a sequential Monte Carlo simulation to probabilistically compute the resource adequacy of a bulk electric power system by simulating the random behavior of both loads and resources. For the ICR calculation, the GE MARS model is used as a one-bus model and the New England transmission system is assumed to have no constraints within this simulation. In
20 Available at: http://www.iso-ne.com/static-assets/documents/rules_proceds/isone_plan/pp03/pp3_final.pdf.

2019/20 ICR Values Report 16
other words, all the resources modeled are assumed to be able to deliver their full output to meet forecast load requirements.
To calculate the expected days per year that the bulk electric system would not have adequate resources to meet peak loads and required reserves, the GE MARS Monte Carlo process repeatedly simulates the year using multiple replications and evaluates the impacts of a wide-range of possible random combinations of resource outages.
Chronological system histories are developed by combining randomly generated operating histories of the resources serving the hourly chronological demand. For each hour, the program computes the isolated area margins based on the available capacity and demand within each area. The program collects the statistics for computing the reliability indices and then proceeds to the next hour to perform the same type of calculation. After simulating all of the hours in the year, the program computes the annual indices and tests for convergence. If the simulation has not converged to an acceptable level, it proceeds to another replication of the study year.
5.2 Installed Capacity Requirement (ICR) Calculation
The formula for calculating the New England ICR is:
Figure 3: Formula for ICR Calculation
Where: APk = Annual 50/50 Peak Load Forecast for summer Capacity = Total Capacity (sum of all MWs in the ICR model)
Tie Benefits = Tie Reliability Benefits
OP4 Load Relief = Load relief from ISO-NE OP4 - Actions 6 & 8 and the modeling of the minimum 200 MW Operating Reserve limit
ALCC = Additional Load Carrying Capability (as determined by the % of peak load)
HQICCs = Monthly HQICC value21
The ICR formula is designed such that the results identify the minimum amount of capacity required to meet New England’s resource adequacy criterion of expecting to interrupt non-interruptible load, on average, no more than once every ten years. If the system is more reliable than the resource adequacy criterion (i.e., the system LOLE is less than or equal to 0.1 days per year), additional resources are not required, and the ICR is determined by
21 In the ICR calculation, the HQICCs are treated differently than other resources; they are not adjusted by the ALCC amount.
HQICCs
APkALCC
liefReLoad4OPBenefitsTieCapacityICRtRequiremenCapacityInstalled ++
−−=
1)(

2019/20 ICR Values Report 17
increasing loads (Additional Load Carrying Capability or ALCC) so that New England’s LOLE is exactly at 0.1 days per year. For the 2019/20 CCP, the New England system, using the resources that qualified as Existing Capacity, is less reliable than the resource adequacy criterion requirement. Therefore, additional capacity in the form of proxy units is needed within the model. Proxy units are used if existing capacity resources are insufficient to meet the resource adequacy planning criterion, as provided by Section III.12.7.1 of Market Rule 1. Proxy units are assigned availability characteristics such that when proxy resources are used in place of all the resources assumed to be available to the system, the resulting system LOLE remains unchanged from that calculated using the existing resources. The use of proxy units to meet the system LOLE criterion is intended to neutralize the size and availability impact of unknown resource additions on the ICR.
In 2014 ISO-NE conducted a study to update the size and availability characteristics of the proxy units used ICR calculation.22 In the study, proxy unit characteristics are determined using the average system availability and a series of LOLE calculations. Using these characteristics gives a proxy unit that when added to the model, does not increase or decrease ICR. For more details on the proxy unit characteristics, see the section of this report entitled “Proxy Units.”
To determine the ICR for the 2019/20 CCP, two proxy units were needed in addition to the existing capacity within the ICR model. While no proxy units were required for the 1-in-5 LOLE capacity requirement calculation for the Demand Curve, the 1-in-87 LOLE capacity requirements calculation required nine proxy units.
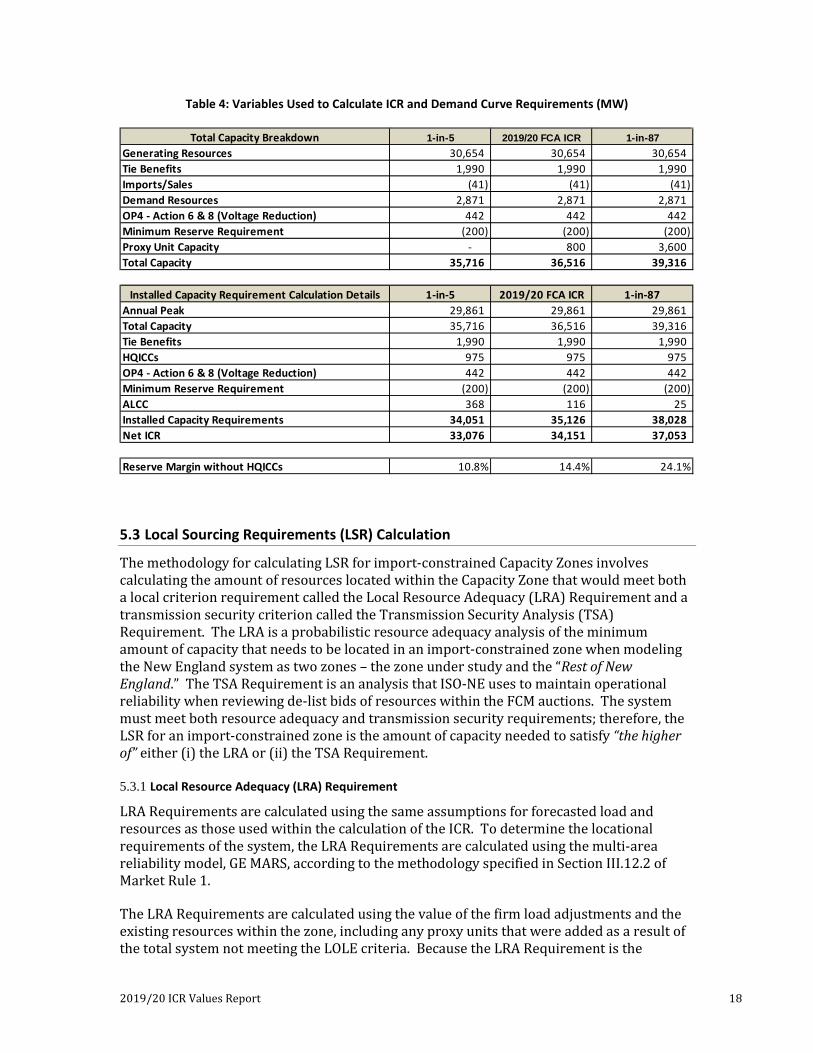
Table 4 shows the details of the variables used to calculate the ICR and the Demand Curve capacity requirement values for the 2019/20 CCP.
22 Study results presented at the May 22, 2014 PSPC Meeting: http://www.iso-ne.com/static-assets/documents/committees/comm_wkgrps/relblty_comm/pwrsuppln_comm/mtrls/2014/may222014/proxy_unit_2014_study.pdf.
2019/20 ICR Values Report 18
Table 4: Variables Used to Calculate ICR and Demand Curve Requirements (MW)
5.3 Local Sourcing Requirements (LSR) Calculation
The methodology for calculating LSR for import-constrained Capacity Zones involves calculating the amount of resources located within the Capacity Zone that would meet both a local criterion requirement called the Local Resource Adequacy (LRA) Requirement and a transmission security criterion called the Transmission Security Analysis (TSA) Requirement. The LRA is a probabilistic resource adequacy analysis of the minimum amount of capacity that needs to be located in an import-constrained zone when modeling the New England system as two zones – the zone under study and the “Rest of New England.” The TSA Requirement is an analysis that ISO-NE uses to maintain operational reliability when reviewing de-list bids of resources within the FCM auctions. The system must meet both resource adequacy and transmission security requirements; therefore, the LSR for an import-constrained zone is the amount of capacity needed to satisfy “the higher of” either (i) the LRA or (ii) the TSA Requirement.
5.3.1 Local Resource Adequacy (LRA) Requirement
LRA Requirements are calculated using the same assumptions for forecasted load and resources as those used within the calculation of the ICR. To determine the locational requirements of the system, the LRA Requirements are calculated using the multi-area reliability model, GE MARS, according to the methodology specified in Section III.12.2 of Market Rule 1.
The LRA Requirements are calculated using the value of the firm load adjustments and the existing resources within the zone, including any proxy units that were added as a result of the total system not meeting the LOLE criteria. Because the LRA Requirement is the
Total Capacity Breakdown 1-in-5 2019/20 FCA ICR 1-in-87Generating Resources 30,654 30,654 30,654 Tie Benefits 1,990 1,990 1,990 Imports/Sales (41) (41) (41) Demand Resources 2,871 2,871 2,871 OP4 - Action 6 & 8 (Voltage Reduction) 442 442 442 Minimum Reserve Requirement (200) (200) (200) Proxy Unit Capacity - 800 3,600 Total Capacity 35,716 36,516 39,316
Installed Capacity Requirement Calculation Details 1-in-5 2019/20 FCA ICR 1-in-87Annual Peak 29,861 29,861 29,861 Total Capacity 35,716 36,516 39,316 Tie Benefits 1,990 1,990 1,990 HQICCs 975 975 975 OP4 - Action 6 & 8 (Voltage Reduction) 442 442 442 Minimum Reserve Requirement (200) (200) (200) ALCC 368 116 25 Installed Capacity Requirements 34,051 35,126 38,028 Net ICR 33,076 34,151 37,053
Reserve Margin without HQICCs 10.8% 14.4% 24.1%
2019/20 ICR Values Report 19
minimum amount of resources that must be located within a zone to meet the system reliability requirements, for a zone with excess capacity, the process to calculate this value involves shifting capacity out of the zone under study until the reliability threshold, or target LOLE, is achieved. Shifting capacity, however, may lead to skewed results, since the load carrying capability of various resources are not homogeneous. For example, one megawatt of capacity from a nuclear power plant does not necessarily have the same load carrying capability as one megawatt of capacity from a wind turbine. Consequently, in order to model the effect of shifting “generic” capacity, firm load is shifted. Specifically, as one megawatt of load is added to an import-constrained zone, a megawatt of load is subtracted from the rest of New England, thus keeping the entire system load constant. The load that was shifted must be subtracted from the total resources (including proxy units) to determine the minimum amount of resources that are required in that zone. Before the shifted load is subtracted, it is first converted to equivalent capacity by using the average resource-unavailability rate within the zone. Thus, the LRA Requirement is calculated as the existing resources in the zone including any proxy units, minus the unavailability-adjusted firm load adjustment.
As this load shift test is being performed over a transmission interface internal to the New England Balancing Authority Area, an allowance for transmission-related LOLE must also be applied. This transmission-related LOLE allowance is 0.005 days per year and is only applied when determining the LRA Requirement of a Capacity Zone. An LOLE of 0.105 days per year is the point at which it becomes clear that the remaining resources within the zone under study are becoming insufficient to satisfy local capacity requirements. Further reduction in local resources would cause the LOLE in New England to rapidly increase above the criterion.
For each import-constrained transmission Capacity Zone, the LRA Requirement is calculated using the following methodology, as outlined in Market Rule 1, Section III.12.2.1:
a) Model the Capacity Zone under study and the Rest of New England area using the GE MARS simulation model, reflecting load and resources (supply & demand-side) electrically connected to them, including external Balancing Authority area support from tie benefits.
b) If the system LOLE is less than 0.1 days/year, firm load is added (or unforced capacity is subtracted) so that the system LOLE equals 0.1 days/year.
c) Model the transmission interface constraint between the Load Zone under study and the Rest of New England.
d) Add proxy units, if required, within the ISO-NE Balancing Authority Area to meet the resource adequacy planning criterion of once in 10 year disconnection of non-interruptible customers. If the system LOLE with proxy units added is less than 0.1 days/year, firm load is added (or unforced capacity is subtracted) so that the system LOLE equals 0.1 days/year. Proxy units are modeled as stated in Section III.12.7.1 of Market Rule 1.
e) Adjust the firm load within the Capacity Zone under study until the LOLE of the ISO-NE Balancing Authority Area reaches 0.105 days per year LOLE. As firm load is
2019/20 ICR Values Report 20
added to (or subtracted from) the Capacity Zone under study, an equal amount of firm load is removed from (or added to) the Rest of New England
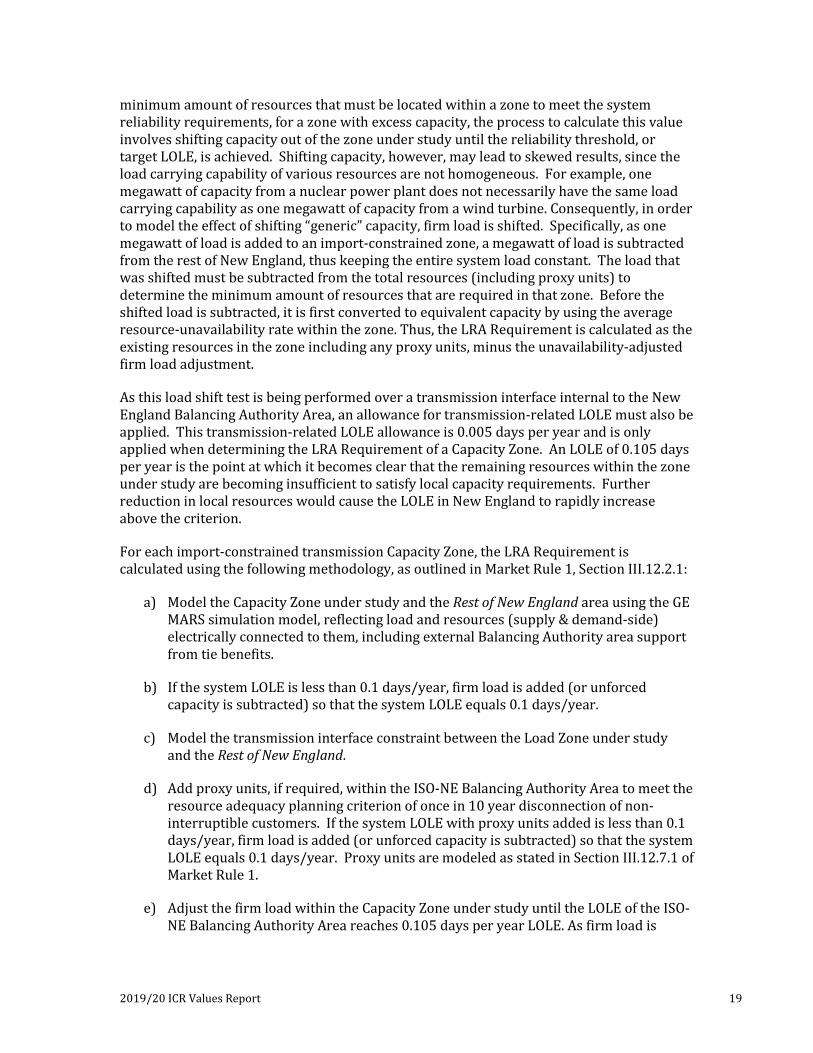
The LRA Requirement is then calculated using the formula:
Figure 4: Formula for LRA Calculation
Where LRAz = Local Resource Adequacy Requirement for Capacity Zone Z. Resourcesz = MW of resources (supply & demand-side) electrically
located within Capacity Zone Z, including import capacity resources on the import-constrained side of the interface, if any and excludes HQICCs.
Proxy Unitsz
= MW of proxy unit additions, if needed, in Capacity Zone Z. Firm Load Adjustmentz
= MW of firm load added within Capacity Zone Z to make the LOLE of the New England Balancing Authority area equal to 0.105 days per year.
FORz
= Capacity weighted average of the forced outage rate modeled for all resources (supply & demand-side) within Capacity Zone Z, including any proxy unit additions to Capacity Zone Z.
In addition, when performing the LRA calculation for the Rest of New England area used in the calculation of local requirements for export-constrained zones, the surplus capacity adjustment used to bring the system to the 0.1 days per year reliability criterion is also included in the calculation as:
Figure 5: Surplus Capacity Adjustment in Rest of New England
Where: Surplus Capacity Adjustmentz = MW of firm load added within Zone Z to make the LOLE of
the New England Balancing Authority area equal to 0.1 days per year
Table 5 shows the details of the LRA Requirement calculation for the SENE Capacity Zone.
−+
−=
Z
ZZZZ FOR
Adjustment Load FirmUnitsProxy ResourcesLRA 1
−
− Z
Z
FORAdjustmentCapacity Surplus
1

2019/20 ICR Values Report 21
Table 5: LRA Requirement Calculation Details (MW)
5.3.2 Transmission Security Analysis (TSA) Calculation
The TSA is a deterministic reliability screen of a transmission import-constrained area and is a security review as defined within Section 3 of ISO New England Planning Procedure No. 3, Reliability Standards for the New England Area Bulk Power Supply System and within Section 5.4 of Northeast Power Coordinating Council’s (NPCC) Regional Reliability Reference Directory #1, Design and Operation of the Bulk Power System.23 The TSA review determines the requirements of the sub-area in order to meet its load through internal generation and import capacity. It is performed via a series of discrete transmission load flow study scenarios. In performing the analysis, static transmission interface transfer limits are established as a reasonable representation of the transmission system’s capability to serve sub-area demand with available existing resources. The results are then presented in the form of a deterministic operable capacity analysis.
In accordance with ISO New England Planning Procedure No. 3 and NPCC’s Regional Reliability Reference Directory #1, the TSA includes evaluations of both: (1) the loss of the most critical transmission element and the most critical generator (Line-Gen), and (2) the loss of the most critical transmission element followed by loss of the next most critical transmission element (Line-Line). These deterministic analyses are currently used each day by ISO-NE System Operations to assess the amount of capacity required to be committed day-ahead within import-constrained Capacity Zones. Further, such deterministic sub-area transmission security analyses have consistently been used for reliability review studies performed to determine whether a resource seeking to retire or de-list would cause a violation of the reliability criteria.
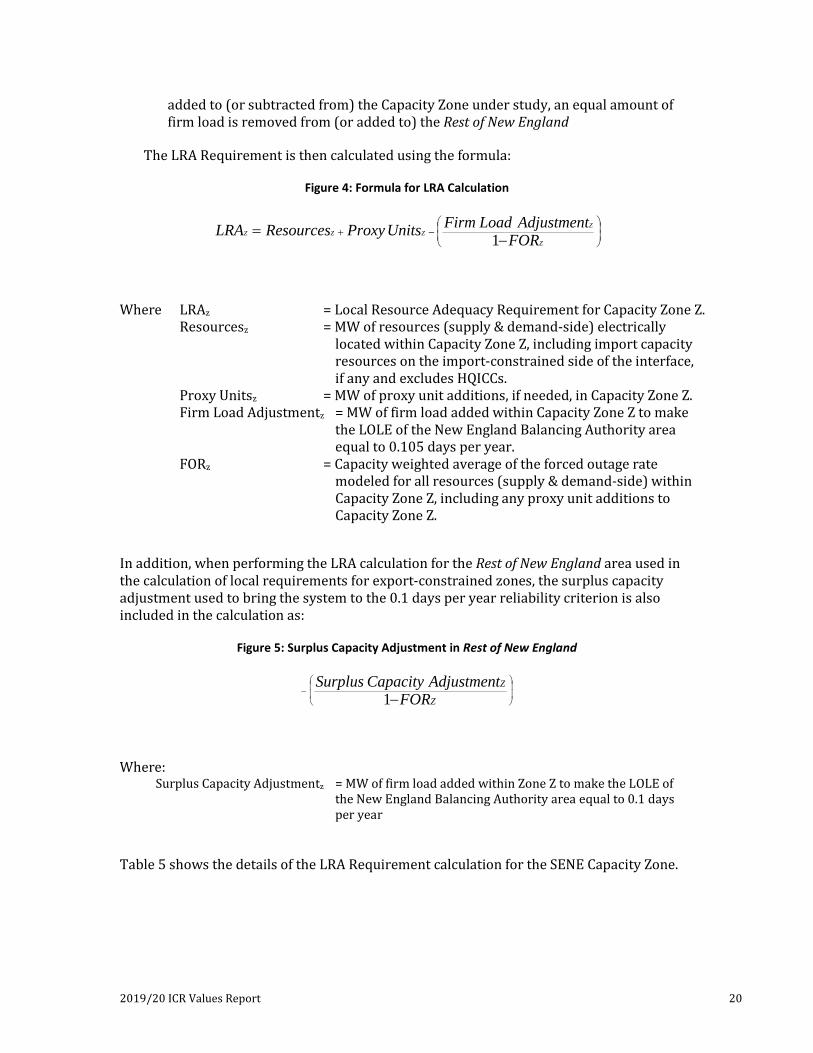
Figure 6 shows the formula used in the calculation of TSA requirements.
23 A copy can be found at https://www.npcc.org/Standards/Directories/Directory_1_TFCP_rev_20151001_GJD.pdf.
Southeast New England Capacity Zone 2019/20 FCA
Resourcesz [1] 11,194
Proxy Unitsz [2] 0
Firm Load Adjustmentz [3] 1,482 FORz [4] 0.079 LRAz [5]=[1]+[2]-([3]/(1-[4])) 9,584
2019/20 ICR Values Report 22
Figure 6: Formula for TSA Requirements
Where:
Need = Load + Loss of Generator (“Line-Gen” scenario), or Load + Loss of Import Capability (going from an N-1 Import Capability to an
N-1-1 Import Capability; “Line-Line” scenario) Import Limit = Assumed transmission import limit Assumed Unavailable
Capacity = Amount of assumed resource unavailability applied by de-rating capacity
Existing Resources = Amount of Existing Capacity Resources within the Zone The system conditions used for the TSA analysis within the FCM are documented in Section 6 of ISO New England Planning Procedure No. 10, Planning Procedure to Support the Forward Capacity Market.24 For the calculation of ICR, LRA and TSA, the bulk of the assumptions are the same. However, due to the deterministic and transmission security-oriented nature of the TSA, some of the assumptions for calculating the TSA requirement differ from the assumptions used in determining the LRA Requirement. The differences are as follows: the assumed loads for the TSA are the 90/10 peak loads for the combined Boston, Southeastern Massachusetts and Rhode Island sub-areas25 for the 2019/20 CCP, whereas for LRA calculations, a distribution of loads for the same sub-areas, covering the range of possible peak loads for that CCP is used. In addition, for the TSA, the forced outage of fast-start (peaking) generation is based on an assumed value of 20% instead of being based on historical five-year average generating unit performance. Finally, the load and capacity relief obtainable from actions of ISO-NE OP4, with the exception of Demand Resources (which are treated as capacity resources), is not assumed within TSA calculations.
Table 6 shows the details of the TSA requirement calculation for the SENE Capacity Zone.
24 Available at: http://www.iso-ne.com/static-assets/documents/rules_proceds/isone_plan/pp10/pp10.pdf. 25 The combined Boston, Southeastern Massachusetts and Rhode Island sub-area load forecast and resources are used as proxies for the load forecast and resources of the NEMA/Boston and SEMA and RI Load Zones which make up the SENE Capacity Zone. This is done because the transmission transfer capability of the interfaces used in the respective LSR calculations are determined based on the 13 sub-area system representations used within ISO-NE’s Regional System Plan (RSP).
(Need – Import Limit)
1 - ( Assumed Unavailable Capacity / Existing Resources)TSA Requirement

2019/20 ICR Values Report 23
Table 6: TSA Calculation Details (MW)
5.3.3 Determining the Local Sourcing Requirement (LSR)
The LSR is determined as the higher of the LRA Requirement or TSA Requirement for the respective Capacity Zone. Table 7 summarizes the LRA and TSA and LSR for the SENE Capacity Zone. As shown, the TSA is the highest requirement and therefore, sets the LSR for SENE.
Table 7: LSR for the 2019/20 CCP (MW)
5.4 Maximum Capacity Limit (MCL) Calculation
For the 2019/20 CCP, no zones were considered to be export-constrained; therefore an MCL was not filed for any Capacity Zones. However, an indicative MCL was calculated for the combined NNE zone as part of the Capacity Zone Trigger Analysis, which determines if a zone is either import or export-constrained and therefore modeled as a Capacity Zone in an FCA. This section of the Report details the calculation of the indicative MCL for the NNE combined zones for the 2019/20 CCP.
To determine the MCL, the New England ICR and the LRA for the Rest of New England need to be identified. Given that the ICR is the total amount of resources that need to be procured
SENE
Sub-area 2015 90/10 Load 13,342
Reserves (Largest unit) 1,413
Sub-area Transmission Security Need 14,755
Existing Resources 11,194
Assumed Unavailable Capacity -1,086
Sub-area N-1 Import Limit 5,700
Sub-area Available Resources 15,808
TSA Requirement (14755-5700)/(1-1086/11194)
= 10,028
Capacity Zone
Transmission Security Analysis
Requirement
Local Resource Adequacy
Requirement
Local Sourcing
Requirement
SENE 10,028 9,584 10,028

2019/20 ICR Values Report 24
within New England, and the LRA requirement for the Rest of New England is the minimum amount of resources required for that area to satisfy its reliability criterion; the difference between the two is the maximum amount of resources that can be purchased within an export-constrained Load Zone.
The indicative MCL for NNE includes qualified capacity resource imports over relevant external interfaces (for a particular CCP) and also reflects the tie benefits assumed available over the these same interfaces. That is, the MCL is reduced to reflect the energy flows required to receive the assumed tie benefits from external Balancing Authority Areas to assist the ISO-NE Balancing Authority Area at a time of a capacity shortage. Allowing more purchases of capacity from resources located outside of New England could preclude the energy flows required to realize tie benefits.
For an export-constrained transmission Capacity Zone, the MCL is calculated using the following method as described in Market Rule 1, Section III.12.2.2:
a) Model the Capacity Zone under study and the Rest of New England area using the GE MARS simulation model, reflecting load and resources (supply & demand-side) electrically connected to them, including external Balancing Authority Area support from tie benefits.
b) If the system LOLE is less than 0.1 days/year, firm load is added (or unforced capacity is subtracted) so that the system LOLE equals 0.1 days/year.
c) Model the transmission interface constraint between the Capacity Zone under study and the Rest of New England area.
d) Add proxy units, if required, within the ISO-NE Balancing Authority Area to meet the resource adequacy planning criterion of once in 10 years of disconnection of non-interruptible customers. If the system LOLE with proxy units added is less than 0.1 days/year, firm load is added (or unforced capacity is subtracted) so that the system LOLE equals 0.1 days/year.
e) Adjust the firm load within the Rest of New England area until the LOLE of the Rest of New England area reaches 0.105 days per year LOLE. As firm load is added to (or subtracted from) the Rest of New England area, an equal amount of firm load is removed from (or added to) the Capacity Zone under study.
The MCL is then calculated using the formula:

2019/20 ICR Values Report 25
Figure 7: Formula for MCL Calculation
Where MCLY = Maximum Capacity Limit for Load Zone Y Net ICR = MW of Net ICR
LRA Rest of New England = MW of Local Resource Adequacy Requirement for the Rest of New England area, which for the purposes of this calculation is treated as an import-constrained region, determined in accordance with Market Rule 1, Section III.12.2.1
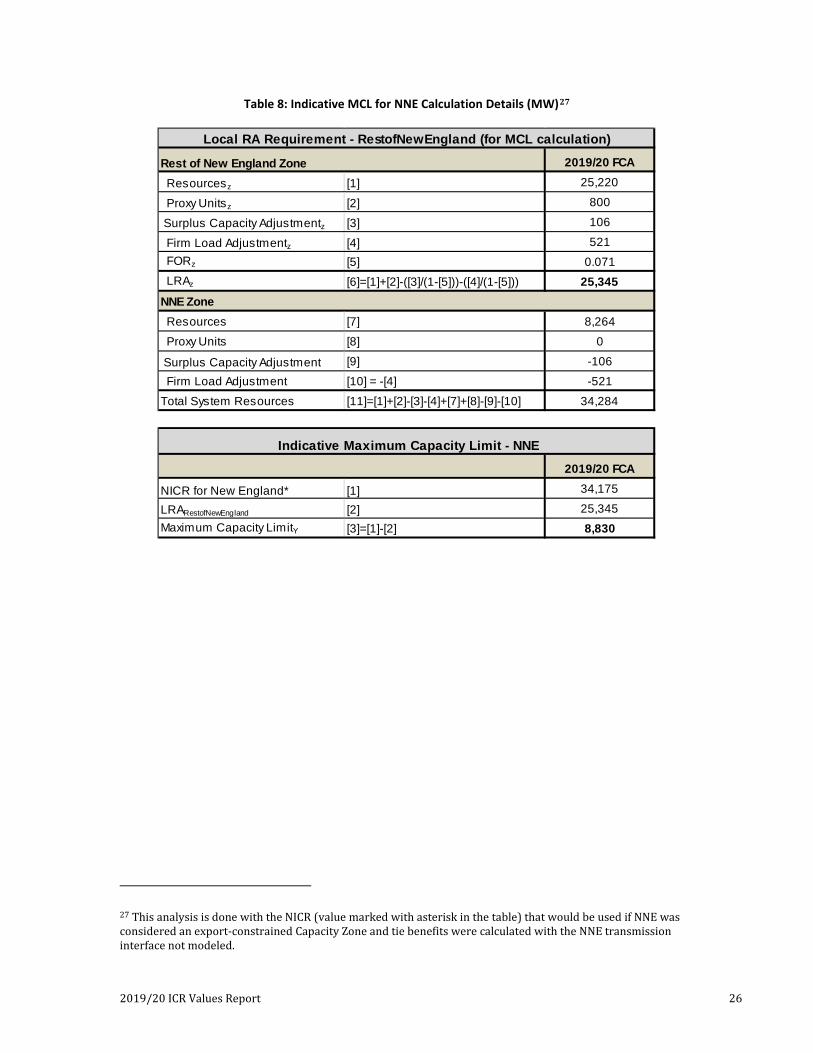
Table 8 shows the details of the indicative MCL for the NNE combined zones for the 2019/20 CCP. This value was not filed with the FERC as part of the ICR Values as NNE was not determined to be a Capacity Zone.26
26 See the analysis on the NNE Capacity Zone determination at: http://www.iso-ne.com/static-assets/documents/2015/08/pspc_081415_a3.0_fca10_zone_formation2.pdf.
England New of RestY LRA - ICR Net MCL =
2019/20 ICR Values Report 26
Table 8: Indicative MCL for NNE Calculation Details (MW)27
27 This analysis is done with the NICR (value marked with asterisk in the table) that would be used if NNE was considered an export-constrained Capacity Zone and tie benefits were calculated with the NNE transmission interface not modeled.
Rest of New England Zone 2019/20 FCA
Resourcesz [1] 25,220
Proxy Unitsz [2] 800
Surplus Capacity Adjustmentz [3] 106
Firm Load Adjustmentz [4] 521 FORz [5] 0.071 LRAz [6]=[1]+[2]-([3]/(1-[5]))-([4]/(1-[5])) 25,345NNE Zone Resources [7] 8,264
Proxy Units [8] 0
Surplus Capacity Adjustment [9] -106
Firm Load Adjustment [10] = -[4] -521
Total System Resources [11]=[1]+[2]-[3]-[4]+[7]+[8]-[9]-[10] 34,284
2019/20 FCA
NICR for New England* [1] 34,175
LRARestofNewEngland [2] 25,345Maximum Capacity LimitY [3]=[1]-[2] 8,830
Local RA Requirement - RestofNewEngland (for MCL calculation)
Indicative Maximum Capacity Limit - NNE

2019/20 ICR Values Report 27
Section 6: Load and Resource Assumptions 6.1 Load Forecast
For each state in New England, ISO-NE develops a forecast distribution of typical daily peak loads for each week of the year based on each week’s historical weather distribution combined with an econometrically estimated monthly model of typical daily peak load. Each weekly distribution of typical daily peak load includes the possible range of daily peaks that could occur over the full range of weather experienced within that week, along with their associated probabilities.
The load forecast models for each of the six New England states were estimated using thirteen years of historical weekday daily peak loads, the weather conditions at the time of the daily peak, a seasonal relationship that captures the change in peak load response to weather over time, and a seasonal relationship that captures the change in peak load response to base energy load (and therefore economic and demographic factors) over time. The weather response relationships are forecast to grow at their historical rates but are adjusted for expected changes in electric appliance saturations. The base load relationships are forecasted to grow at the same rate as the associated energy forecast. The weather is represented by over forty years of historically-based weekly regional weather. The energy forecast for each state is econometrically estimated using forecasts of the real price of electricity and either real income or real gross state product.
For purposes of determining the load forecast, ISO-NE Balancing Authority Area’s load is defined as the sum of the load of each of the six New England states, calculated as described above. For the NEMA/Boston, SEMA and RI Load Zones within the SENE Capacity Zone,28 the forecasted load for NEMA/Boston and SEMA is developed using a load share ratio of the NEMA/Boston and SEMA load to the forecasted load for the entire state of Massachusetts. The load share ratio is based on detailed bus load data from the network model for NEMA/Boston and SEMA, as compared to the entire state of Massachusetts. The forecasted load for the RI portion is the load forecast for the state of Rhode Island.
The overall New England and individual sub-area load forecasts used in the calculation of ICR Values for the 2019/20 CCP are documented within the 2015 Forecast Report of Capacity, Energy, Loads and Transmission (CELT Report).29
6.1.1 Modeling of the BTMNEL PV Forecast
This year, ISO-NE began incorporating an assumed forecast of PV resources that are neither participants in the FCM nor energy only resources. These resources, the BTMNEL resources, have energy output that is not reported to ISO-NE Settlements, nor is the output
28 The combined Boston, Southeastern Massachusetts and Rhode Island sub-area load forecast and resources are used as proxies for the load forecast and resources of the NEMA/Boston and SEMA and RI Load Zones which make up the SENE Capacity Zone. This is done because the transmission transfer capability of the interfaces used in the respective LSR calculations are determined based on the 13 sub-area system representations used within ISO-NE’s Regional System Plan (RSP). 29 Located on ISO-NE’s website at: http://www.iso-ne.com/static-assets/documents/2015/05/2015_celt_report.pdf.

2019/20 ICR Values Report 28
embedded in historical loads which would allow the load reducing effect to be captured. Due to the rapid growth and installation of these BTMNEL recourses, a forecast was developed by the DGFWG that would capture the effects of the recently installed PV resources and future PV resources forecasted to be installed within the forecast horizon in order to accurately forecast the future peak loads that could occur.
Beginning in 2014, ISO-NE produced a PV energy forecast based on 2006 state level data of PV profiles.30 These profiles represent simulated PV production associated with a single year. Since that time continued effort from ISO-NE and the DGFWFG, while incorporating Stakeholder comments, was expended in reviewing and analyzing actual PV performance in support of generating the 2015 PV energy forecast which was released in April 2015 and is included in the 2015 CELT Report.31
For the 2015 PV forecast, ISO-NE is now using state PV profiles from three years of historical data (2012 – 2014) that were developed from production data available from 665 individual PV sites geographically spread throughout New England which total 82 MW in nameplate capacity. These profiles were used as the basis for determining a summer Seasonal Claimed Capability (SCC) of 40% of the nameplate capacity.
Since the 2015 PV forecast represents end-of-year forecast values, a monthly value which represents incremental growth throughout each year was determined using PV growth trends across the region over the past three years. These values were applied to the annual end-of-year PV forecast values over the forecast horizon.
The monthly values of the PV forecast for the 2019/20 CCP shown in Table 9 are modeled as a load modifier in the GE MARS model within the ICR Values calculation. These values are distributed to the RSP sub-areas for the summer reliability hours ending 1400 through 1800. All other hours are considered as zeros. Modeling the PV resources this way effectively reduced the load forecast for each month by the corresponding monthly PV forecast values.
Table 9: Monthly PV Forecast Values Modeled in the ICR Values for 2019/20 (MW)32
6.1.1 Load Forecast Uncertainty
GE MARS models the load forecast using hourly chronological sub-area loads and can include the effects of load forecast uncertainty related to weather by calculating the LOLE for up to ten different load levels and computes a weighted-average value based on the input probabilities. These are the “per unit” multipliers used for computing the loads used to calculate the reliability indices. Each per unit multiplier represents a load level, which is
30 Refer to: http://www.iso-ne.com/static-assets/documents/2014/09/pv_energy_frcst_update_09152014.pdf. 31 The 2015 final PV forecast is available at: http://www.iso-ne.com/static-assets/documents/2015/05/final_2015_pv_forecast.pdf. 32 The values shown include the 8% Transmission and Distribution gross-up given to resources at the load bus to bring them to the generator bus level where New England load is calculated.
Month Jun Jul Aug Sep Oct Nov Dec Jan Feb Mar Apr May2019/20 367.1 369.2 371.4 373.8 0 0 0 0 0 0 0 389.3
2019/20 ICR Values Report 29
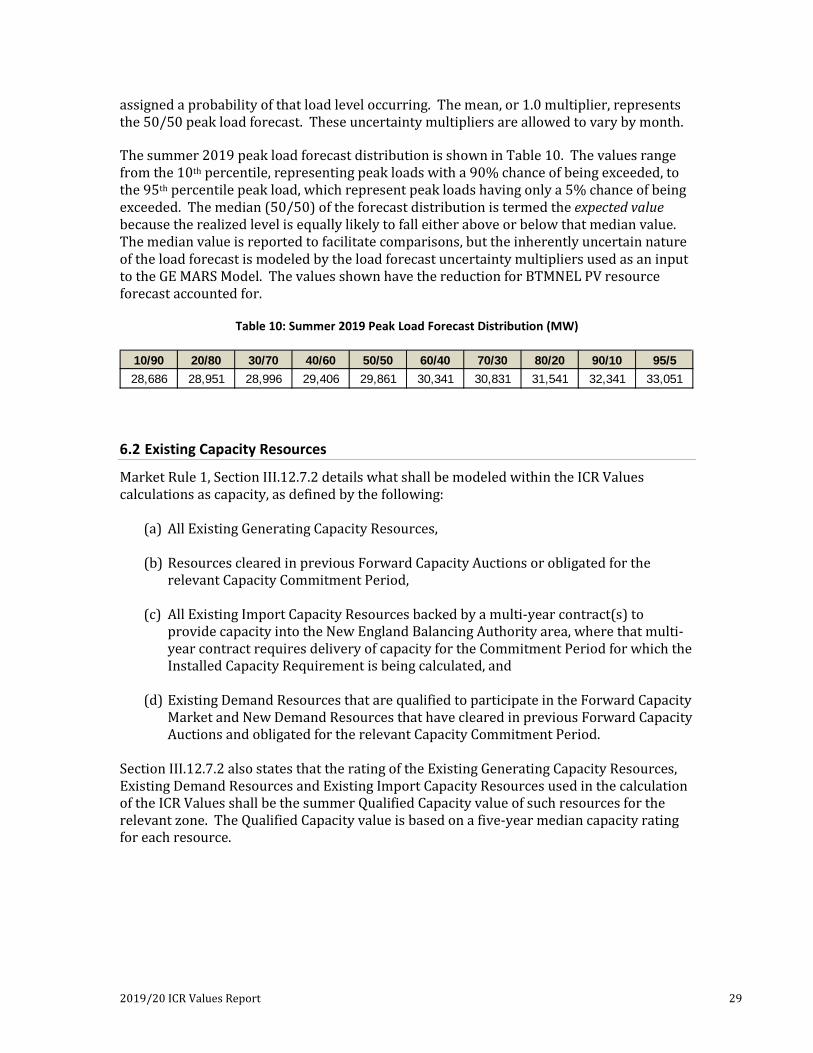
assigned a probability of that load level occurring. The mean, or 1.0 multiplier, represents the 50/50 peak load forecast. These uncertainty multipliers are allowed to vary by month.
The summer 2019 peak load forecast distribution is shown in Table 10. The values range from the 10th percentile, representing peak loads with a 90% chance of being exceeded, to the 95th percentile peak load, which represent peak loads having only a 5% chance of being exceeded. The median (50/50) of the forecast distribution is termed the expected value because the realized level is equally likely to fall either above or below that median value. The median value is reported to facilitate comparisons, but the inherently uncertain nature of the load forecast is modeled by the load forecast uncertainty multipliers used as an input to the GE MARS Model. The values shown have the reduction for BTMNEL PV resource forecast accounted for.
Table 10: Summer 2019 Peak Load Forecast Distribution (MW)
6.2 Existing Capacity Resources
Market Rule 1, Section III.12.7.2 details what shall be modeled within the ICR Values calculations as capacity, as defined by the following:
(a) All Existing Generating Capacity Resources, (b) Resources cleared in previous Forward Capacity Auctions or obligated for the
relevant Capacity Commitment Period, (c) All Existing Import Capacity Resources backed by a multi-year contract(s) to
provide capacity into the New England Balancing Authority area, where that multi-year contract requires delivery of capacity for the Commitment Period for which the Installed Capacity Requirement is being calculated, and
(d) Existing Demand Resources that are qualified to participate in the Forward Capacity
Market and New Demand Resources that have cleared in previous Forward Capacity Auctions and obligated for the relevant Capacity Commitment Period.
Section III.12.7.2 also states that the rating of the Existing Generating Capacity Resources, Existing Demand Resources and Existing Import Capacity Resources used in the calculation of the ICR Values shall be the summer Qualified Capacity value of such resources for the relevant zone. The Qualified Capacity value is based on a five-year median capacity rating for each resource.
10/90 20/80 30/70 40/60 50/50 60/40 70/30 80/20 90/10 95/528,686 28,951 28,996 29,406 29,861 30,341 30,831 31,541 32,341 33,051

2019/20 ICR Values Report 30
Summaries of resources categorized as Existing Capacity within the ICR Values calculations are provided in the sections below.33 It should be noted that with the exception of Intermittent Power Resources (IPR), only summer capacity values are used within the calculation of the ICR Values. For the 2019/20 FCA ICR Values calculations, there were a total of 33,484 MW of capacity resources modeled. These capacity resources are made up of generating, intermittent, demand and import resources along with a reduction in generating capacity to account for exports and de-ratings of import capacity. These resources are described in more detail in Table 11 – Table 16 of this report.34 6.2.1 Generating Resources
Market Rule 1, Section III.13.1.2.2.1.1 states that the summer Qualified Capacity of a Generating Resource is calculated as the median of the most recent five summer Seasonal Claimed Capability (SCC) ratings with only positive, non-zero ratings included within the calculation. Generating resources, by Load Zone, used within the ICR Values calculations were based on Qualified Existing Generating Resources for the 2019/20 CCP at the time of the ICR calculation and are summarized in Table 11.
Table 11: Existing Qualified Generating Capacity by Load Zone (MW)
6.2.2 Intermittent Power Resources
Section III.13.1.2.2.2 of Market Rule 1 discusses the rating methodology of resources considered Intermittent Power Resources (IPR). IPR are defined as wind, solar, run-of-river hydro-electric and other renewable resources that do not have direct control over their net power output. Summer and winter capacities, by Load Zone, of existing IPR used within the ICR Values calculations were those that have Qualified as Existing Generating Resources for the 2019/20 CCP and are shown in Table 12.
33 For detailed data on the Qualified Existing Resources that participate in FCA10 see: http://www.iso-ne.com/static-assets/documents/2015/11/public_info_filing_fca_10.pdf. 34 The resource values shown reflect the terminations of resources that occurred in early June 2015.
Load Zone SummerMAINE 2,863.774 NEW HAMPSHIRE 4,043.605 VERMONT 222.098 CONNECTICUT 9,063.732 RHODE ISLAND 1,867.339 SOUTH EAST MASSACHUSETTS 4,683.952 WEST CENTRAL MASSACHUSETTS 3,732.636 NORTH EAST MASSACHUSETTS & BOSTON 3,227.714
Total New England 29,704.850

2019/20 ICR Values Report 31
Table 12: Existing IPR by Load Zone (MW)
6.2.3 Demand Resources
To participate in the FCA as a Demand Resource, a resource must meet the definitions and requirements of Market Rule 1, Section III.13.1.4.1. Existing Demand Resources are subject to the same qualification process as Existing Generating Capacity Resources.
Market Rule 1, Section III.12.7.2 states that the rating of Demand Resources used within the calculation of the ICR Values shall be the summer Qualified Capacity value. The summer Qualified Capacity of a Demand Resource is rated based on Measurement and Verification analysis performed during the resource Qualification process.
Existing Demand Resources, by Load Zone, used within the ICR Values calculations are for the 2019/20 FCA are shown in Table 12. These values are the Existing Qualified values which also reflect the 8% Transmission and Distribution Gross-up applied to Demand Resources.
Load Zone Summer WinterMAINE 215.902 283.222 NEW HAMPSHIRE 174.092 225.997 VERMONT 109.029 152.218 CONNECTICUT 202.099 212.905 RHODE ISLAND 6.370 7.965 SOUTH EAST MASSACHUSETTS 83.680 81.372 WEST CENTRAL MASSACHUSETTS 85.543 107.113 NORTH EAST MASSACHUSETTS & BOSTON 72.448 73.704
Total New England 949.163 1,144.496

2019/20 ICR Values Report 32
Table 13: Existing Demand Resources by Load Zone (MW)
6.2.4 Import Resources
The Summer Qualified Capacity of an Existing Import Capacity Resource modeled within the ICR calculation follows Market Rule 1, Section III.13.1.3.3, which outlines the Qualification Process for Existing Import Capacity Resources. The rating of imports used within the calculation of the ICR Values is the summer Qualified Capacity value, reduced by any submitted de-list bids reflecting the value of a firm contract(s) or any de-ratings due to Transmission Transfer Capability (TTC) limitations. If the overall amount of Existing Qualified Import Capacity over a transmission interface is greater than the transmission interface limit determined for the most recent Regional System Plan (RSP) report, the capacity of the import(s) being modeled within the ICR calculation is subsequently reduced to a value equal to that of the applicable transmission interface TTC. Table 14 shows the Existing Qualified Import Resources used within the ICR Values calculations for the 2019/20 CCP and the corresponding external transmission interface supplying the import capacity. There were no de-ratings of TTC for the Existing Qualified Import Capacity Resources for 2019/20 CCP. However; there was a 30 MW de-rating of generating capacity to reflect the value of the Vermont Joint Owners (VJO) contract.
Table 14: Existing Import Resources (MW)
Load Zone On-PeakSeasonal
Peak
Real-Time Demand Response
Real-Time Emergency Generators Total
MAINE 164.811 - 149.386 7.482 321.679NEW HAMPSHIRE 101.215 - 12.798 14.022 128.035VERMONT 120.090 - 31.900 4.918 156.908CONNECTICUT 78.815 371.437 77.374 52.941 580.567RHODE ISLAND 197.599 - 60.362 15.720 273.681SOUTH EAST MASSACHUSETTS 292.685 - 51.987 12.722 357.394WEST CENTRAL MASSACHUSETTS 293.340 49.645 58.684 25.098 426.767NORTH EAST MASSACHUSETTS & BOSTON 548.466 - 67.329 10.439 626.234
Total New England 1,797.021 421.082 509.820 143.342 2,871.265
Import Resource Summer External InterfaceVJO - Highgate 6.000 Hydro-Quebec HighgateNYPA - CMR 68.800 New York AC TiesNYPA - VT 14.000 New York AC TiesTotal MW 88.800

2019/20 ICR Values Report 33
6.3 Export Bids
An Export Bid is a Participant bid that may be submitted by certain resources in the FCA to export capacity to an external Balancing Authority area, as described in Section III.13.1.2.3.2.3 of Market Rule 1. Market Rule 1 Section III.12.7.2 paragraph e) states that: “…capacity associated with Export Bids cleared in previous Forward Capacity Auctions and obligated for the relevant Capacity Commitment Period” shall be excluded from the ICR Values calculation. Only one capacity export was modeled within the ICR Values calculation assumptions. This is the 100 MW sale of capacity to the Long Island Power Authority (LIPA) over the Cross-Sound Cable, which is modeled as a reduction in capacity from the unit-specific resource backing the export contract.
Table 15: Capacity Exports (MW)
6.4 New Capacity Resources
Market Rule 1, Section III.12.7.2 describes the capacity resources that were modeled within the ICR calculations as the aggregate amount of Existing Generation Capacity Resources, Existing Import Capacity Resources, and Existing Demand Resources. Resource capacity that qualifies as a New Capacity Resource is not modeled within the ICR calculation. 6.5 Resources Used to Calculate Locational Requirements
The LRA and TSA values, used to determine the LSR for the import-constrained SENE Capacity Zone are calculated with resource locations identified within the ISO-NE’s RSP sub-areas representing Boston, SEMA and RI combined, respectively. These resources are used as proxies for resources located within the Capacity Zone. This is done because the TTC calculated for the interfaces studied in the locational requirements analyses use the ISO-NE RSP sub-areas and are thus calculated for the RSP zones. For Demand Resources, the Existing Qualified Demand Resources for the Capacity Zone is used because the RSP values available would have to be estimated (particularly for the Passive Demand Resources) since actual locations for some of these resources are not currently available.
For the 2019/20 FCA ICR Values, there are no differences between the resources located within the corresponding RSP zones versus the resources located within the SENE Capacity Zone. Table 16 shows the resources modeled in the SENE Capacity Zone along with the New England values.
Export SummerLIPA over Cross-Sound Cable 100.000

2019/20 ICR Values Report 34
Table 16: Resources Used in the LSR Calculations (MW)
6.6 Proxy Units
Section III.12.7.1 of Market Rule 1 discusses the addition of proxy units to the ICR model. Proxy units are required when the available resources are insufficient for the unconstrained New England Balancing Authority area to meet the resource adequacy planning criterion specified in Section III.12.1. In the model, proxy units are used as additional capacity to determine the ICR, LRA, MCL and capacity requirement values for the Demand Curve.
The proxy units used in the ICR model reflect the resource capacity and outage characteristics such that when the proxy units are used in place of all other resources in the New England Balancing Authority Area, the reliability, or LOLE, of the New England Balancing Authority Area does not change. The outage characteristics are the summer capacity weighted average availability of the resources in the New England Balancing Authority area as determined in accordance with Market Rule 1, Section III.12.7.3. The capacity of the proxy unit is determined by adjusting the capacity of the proxy unit until the LOLE of the New England Balancing Authority Area is equal to the LOLE calculated while using the capacity assumptions described in Section III.12.7.2.
In May 2014, ISO-NE conducted a study to revise the proxy unit characteristics with the most recent system conditions in anticipation of requiring the use of proxy units within the FCA10 ICR model.35 At the time of the study, the FCA8 (2017/18 CCP) ICR model was used as it was the most recent available ICR model.
In the study noted above, the results showed that with the average system forced outage rate of 5.47% and four weeks of maintenance for the FCA8 system, the appropriate size of the proxy units is 400 MW. Figure 10 below, shows the point at which the LOLE of the
35 This study was presented to the PSPC on May 22, 2014 and is available at: http://www.iso-ne.com/static-assets/documents/committees/comm_wkgrps/relblty_comm/pwrsuppln_comm/mtrls/2014/may222014/proxy_unit_2014_study.pdf.
Resource Type SENETotal New
EnglandGenerator 9,779.005 29,604.850
Intermittent Generator 157.858 919.119
Import - 88.800
On-Peak DR 1,038.750 1,797.021
Seasonal-Peak DR - 421.082
Real-Time DR 179.678 509.820
Real-Time Emergency Gen DR 38.881 143.342
Total 11,194.172 33,484.034
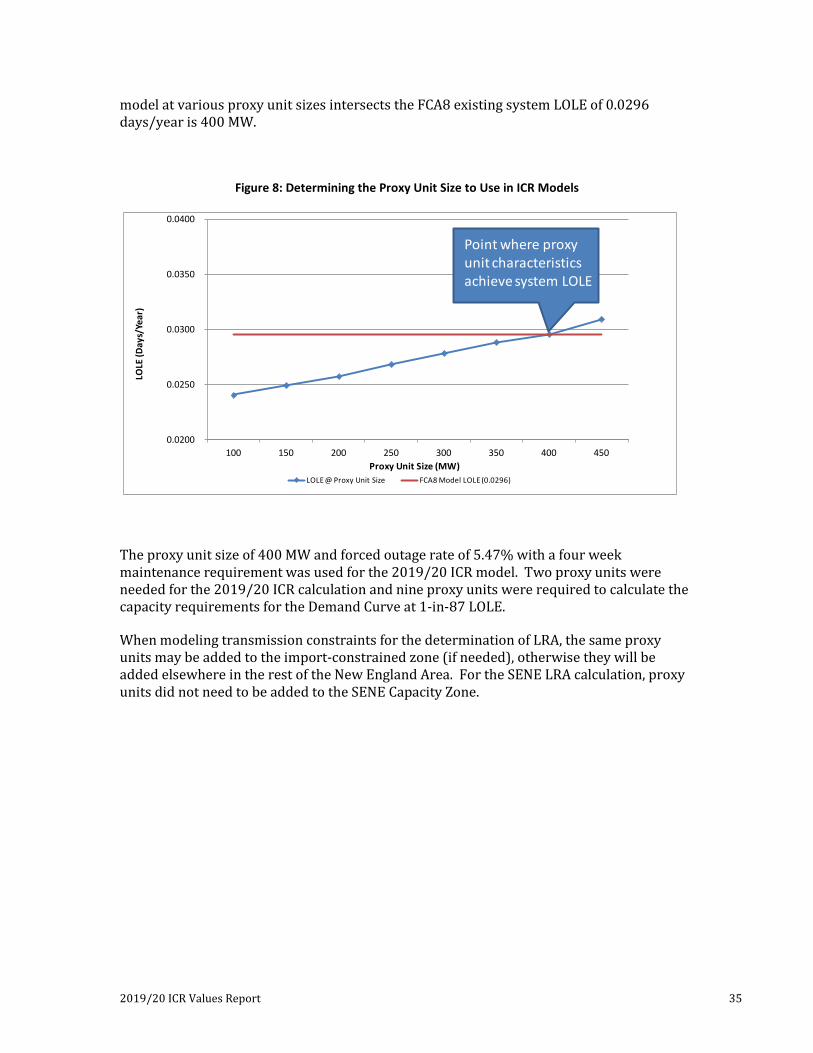
2019/20 ICR Values Report 35
model at various proxy unit sizes intersects the FCA8 existing system LOLE of 0.0296 days/year is 400 MW.
Figure 8: Determining the Proxy Unit Size to Use in ICR Models
The proxy unit size of 400 MW and forced outage rate of 5.47% with a four week maintenance requirement was used for the 2019/20 ICR model. Two proxy units were needed for the 2019/20 ICR calculation and nine proxy units were required to calculate the capacity requirements for the Demand Curve at 1-in-87 LOLE.
When modeling transmission constraints for the determination of LRA, the same proxy units may be added to the import-constrained zone (if needed), otherwise they will be added elsewhere in the rest of the New England Area. For the SENE LRA calculation, proxy units did not need to be added to the SENE Capacity Zone.
0.0200
0.0250
0.0300
0.0350
0.0400
100 150 200 250 300 350 400 450
LOLE
(Day
s/Ye
ar)
Proxy Unit Size (MW)LOLE @ Proxy Unit Size FCA8 Model LOLE (0.0296)
Point where proxy unit characteristics achieve system LOLE

2019/20 ICR Values Report 36
Section 7: Transmission Transfer Capability Assumptions 7.1 Transmission Transfer Capability
Market Rule 1, Section III.12.5 requires that ISO-NE update the transmission interface transfer capability for each internal (within New England) and external (from neighboring Balancing Authority Areas into New England) transmission interface for the 2019/20 CCP, if necessary.36 Although external transmission transfer capability is not used within the ICR calculation, they are used in the determination of tie benefits, including HQICCs, and will also be used within the FCA to limit the purchases of external installed capacity. Internal transmission transfer capability limits are used in the determination of any LSR and MCL values and tie benefit values.
7.1.1 External Transmission Transfer Capability
Table 17 shows the external interface TTC values that were used within the 2019/20 tie benefits study.
Table 17: Transmission Transfer Capability of External Interfaces into New England Modeled in the Tie Benefits Study (MW)37
7.1.2 External Transmission Interface Availability
The forced and scheduled outage rates of the transmission interfaces connecting ISO-NE to its neighboring Balancing Authorities are based on historical data provided by these Balancing Authorities. These values are shown in Table 18 and include the average forced outage rate (%) and maintenance outage rate (in weeks) as used in the models that are
36 For more detailed information on the RSP15 interface TTC analysis see a presentation from the June 17, 2015 Planning Advisory Committee (PAC) meeting (CEII clearance required): https://smd.iso-ne.com/operations-services/ceii/pac/2015/06/a8_rsp15_transfer_capability_assumptions_update.pdf. 37 The transmission interface limits are single-value, summer peak for use in subarea transportation models. The limits may not include possible simultaneous impacts and should not be considered as “firm.” Only accepted certified transmission projects are included when identifying transfer limits. Certified transmission projects were presented to the Reliability Committee at their January 27, 2015, meeting (http://www.iso-ne.com/committees/reliability/reliability-committee). For more information on the transmission interface limits refer to https://smd.iso-ne.com/operations-services/ceii/pac/2015/06/a8_rsp15_transfer_capability_assumptions_update.pdf.
External Interfaces Into New England Summer TTCHydro-Quebec to New England via Phase II 1,400 Hydro-Quebec to New England via Highgate 200 New Brunswick to New England 700 New York to New England via New York AC Ties 1,400 New York to New England via Cross-Sound Cable DC Interface 0

2019/20 ICR Values Report 37
associated with each external transmission interface. These assumptions were developed in 2011 and include data from the five-year period of 2006 through 2010.38
Table 18: External Interface Outage Rates (% and Weeks)
7.1.3 Internal Transmission Transfer Capability
For the 2019/20 FCA, ISO-NE calculated an LRA for the SENE Capacity zone, using the zone under study and Rest of New England methodology. In the LRA analysis, the SENE Capacity Zone is modeled as import-constrained using the N-1 TTC limit for the Southeast New England Import (SENE Import) interface. In addition, the TSA analysis, which uses both the N-1 limit and the N-1-1 limit, was calculated for the SENE Capacity Zone.39
Table 19 shows the N-1 and N-1-1 internal TTC for the SENE Import interface used to calculate LSR for the SENE Capacity Zone. These TTC values are part of an annual study of transmission topology and are documented in the 2015 Regional System Plan (RSP15).
With the exception of the TTC value for the SENE Capacity Zone which is modeled in the LSR calculation, remaining internal interfaces with a calculated TTC are modeled within the tie benefits study (see Table 20: Internal Interface N-1 TTC Limits Modeled in the Tie Benefits Study for 2019/20 (MW) in the tie benefits section of this report for these values).
Table 19: Internal Transmission Transfer Import Capability Modeled in the LSR Calculation for SENE (MW)
38 For more detail on external tie availability assumptions see: http://www.iso-ne.com/static-assets/documents/committees/comm_wkgrps/relblty_comm/pwrsuppln_comm/mtrls/2011/jul152011/external_tie_outage_assumptions.pdf. 39 The term N-1 represents the first contingency and the term N-1-1 represents the second contingency.
External Ties
Forced Outage Rate
(%)Maintenance
(Weeks)Hydro-Quebec Phase II 0.39 2.7Highgate 0.07 1.3New Brunswick Interface 0.08 0.4New York AC Interface 0 0Cross-Sound Cable 0.89 1.5
Capacity Zone N-1 N-1-1
SENE 5,700 4,600

2019/20 ICR Values Report 38
Section 8: OP4 Load Relief The New England resource planning reliability criterion requires that adequate capacity resources be planned and installed such that disconnection of firm load would not occur more often than once in 10 years due to a capacity deficiency, after taking into account the load and capacity relief obtainable from implementing Emergency Operating Procedures (EOP). ISO New England Operating Procedure No. 4 – Action During a Capacity Deficiency (OP4) is the EOP for New England. In other words, load and capacity relief assumed obtainable from implementing certain OP4 actions are direct substitutes for capacity resources in meeting the once in 10 years disconnection of firm load criterion.
Under the FCM, the assumed emergency assistance (i.e. tie benefits) available from neighboring Balancing Authority Areas, load reduction from implementation of 5% voltage reduction,40 and capacity available from the dispatch of Real-Time Demand Resources41 and Real-Time Emergency Generating Demand Resources42 all constitute actions that ISO-NE System Operators can invoke under OP4 to balance real-time system supply with demand (as applicable under both actual or forecast capacity shortage conditions). These actions are used as load and capacity relief assumptions within the development of the ICR Values.
8.1 Tie Benefits
In the event of a capacity shortage in New England, tie benefits reflect the amount of emergency assistance that is assumed will be available to ISO-NE from its neighboring Balancing Authority Areas, without jeopardizing system reliability in either the ISO-NE Balancing Authority Area or its neighboring Balancing Authority Areas. Tie Benefits are an input into the determination of the ICR Values, and in fact, displace the MW amount of resources that need to be purchased internal to New England within the FCA by an almost one to one ratio.
8.1.1 Tie Benefits Calculation Methodology
ISO-NE used the procedures for calculating tie benefits documented in Section III.12.9 of Market Rule 1. The tie benefits calculation methodology includes the calculation of tie benefits at the system-wide level and for each of the directly interconnected neighboring Balancing Authority Areas of Québec, New Brunswick (Maritimes) and New York.
The tie benefits study for the 2019/20 CCP was conducted using the probabilistic GE MARS program to model projected system conditions for that timeframe. The methodology for calculating the total tie benefits, individual Balancing Authority Area tie benefits and the tie benefits assumed for individual interconnections is documented in more detail in Figure 8.
40 Action 6 and 8 of OP4. 41 Action 2 of OP4. 42 Action 6 of OP4.

2019/20 ICR Values Report 39
Figure 9: Summarization of the Tie Benefits Calculation Process43
The New England Control Area is modeled with all internal transmission interfaces not addressed by either an LSR or an MCL Requirement. Table 21 shows the interface TTC limits of all interfaces modeled in the 2019/20 tie benefits study.44
Table 20: Internal Interface N-1 TTC Limits Modeled in the Tie Benefits Study for 2019/20 (MW)
43 A presentation on the 2019/20 Tie Benefits Study was reviewed at the RC on September 15, 2015 which provides more details on the calculation details and study assumptions and is available at http://www.iso-ne.com/static-assets/documents/2015/09/a9_tie_benefits_results.pdf. 44 The Norwalk-Stamford interface value was later revised to “no limit” in the RSP15 report.
• Process 1.0 – Calculate the tie benefits values for all possible interconnection states using isolated New England
system as the reference
• Process 2.0 – Calculate initial total tie benefits for New England from all neighboring Balancing Authority Areas
• Process 3.0– Calculate initial tie benefits for each individual neighboring Balancing Authority Area– Pro-rate tie benefits values of individual Balancing Authority Areas based on the total tie benefits, if
necessary
• Process 4.0– Calculate initial tie benefits for individual interconnection or group of interconnections– Pro-rate tie benefits values of individual interconnection or group of interconnections based on the
individual Balancing Authority Area tie benefits, if necessary
• Process 5.0– Adjust tie benefits of individual interconnection or group of interconnections to account for capacity
imports
• Process 6.0– Calculate the final tie benefits for each individual neighboring Balancing Authority Area
• Process 7.0– Calculate the final total tie benefits for New England
Internal Interfaces Not Addressed by LSR or MCLSummer N-1 TTC
Orrington South Export 1,325 Surowiec South 1,500 Maine-New Hampshire 1,900 North-South 2,675 East-West 3,500 West-East 2,200 Boston Import 5,700 SEMA/RI Export 3,400 SEMA/RI Import 1,280 Connecticut Import 2,950 Norwalk-Stamford 1,650 Southwest Connecticut Import 3,200

2019/20 ICR Values Report 40
8.1.1.1 Total Tie Benefits
Total tie benefits were calculated using the results of a probabilistic analysis that determines LOLE indices for the ISO-NE and neighboring Balancing Authority Areas. The LOLE calculations were first done on an interconnected basis that included all existing connections (tie lines) between ISO-NE’s directly connected neighboring Balancing Authority Areas. This established the minimum amount of capacity that each area needs in order to comply with the NPCC resource adequacy requirements of 0.1 days per year LOLE.
These LOLE calculations were then repeated with ISO-NE isolated from all neighboring Balancing Authority areas. The tie benefits are then quantified by adding firm capacity resources within the isolated ISO-NE Balancing Authority Area, until the LOLE is returned back to 0.1 days per year. The resources which were added to return ISO-NE to a LOLE of 0.1 days per year are called “firm capacity equivalents” and are assumed to be ISO-NE’s total tie benefits.
Based on the methodology described above, a total of 1,990 MW of tie benefits are assumed within the ICR calculations for the 2019/20 CCP.
8.1.1.2 Individual Balancing Authority Area Tie Benefits
For calculating each Balancing Authority Area’s individual tie benefits, all the tie lines associated with the Balancing Authority Area of interest are treated on an aggregate basis. The tie benefits from each Balancing Authority Area are calculated for all possible interconnection states. The simple average of these tie benefits from each of these states will represent the calculated tie benefits from that specific Balancing Authority Area.
If the sum of the Balancing Authority Areas tie benefits is different from the total tie benefits for ISO-NE, then each Balancing Authority Area’s tie benefits are adjusted (up or down) based on the ratio of the individual Balancing Authority Area tie benefits to the total tie benefits.
For the 2019/20 CCP, the individual Balancing Authority area tie benefits were calculated as 1,117 MW for Québec, 519 MW for the Maritimes, and 354 MW for New York.
8.1.1.3 Individual Tie (or Group of Ties) Tie Benefits
The tie benefits methodology calls for tie benefits to be calculated for an individual tie or group of ties to the extent that a discrete and material transfer capability can be identified for it. To calculate tie benefits for each tie or group of ties from the external Balancing Authority Area of interest into ISO-NE, each is treated independently. The tie benefits for each individual tie or group of ties is calculated for all the interconnection states and the simple average of the tie benefits associated with these interconnections states is the resultant tie benefits for each tie or group of ties.
If the sum of the tie benefits from the individual tie or group of ties relative to their Balancing Authority Area’s total tie benefits are different, then the tie benefits of each individual tie or group of ties are adjusted (up or down) based on the ratio of the tie benefits of the individual tie or group of ties to the Balancing Authority Area’s total tie benefits.
2019/20 ICR Values Report 41
For the 2019/20 CCP, individual interconnection tie benefits were determined from Québec over the HQ Phase II facility of 975 MW, 142 MW from Québec over the Highgate facility, 519 MW from the Maritimes over the New Brunswick interface and 354 MW of the New York tie benefits are delivered over the New York AC ties and 0 MW from the Cross-Sound Cable.
8.1.1.4 Hydro-Québec Interconnection Capability Credits (HQICCs)45
Hydro-Québec Interconnection Capability Credits, or HQICCs, are an allocation of the tie benefit over the Hydro-Québec Interconnection to the Interconnection Rights Holders (IHR), which are regional entities that hold certain contractual entitlements (i.e. rights) over this specific transmission interconnection. These rights are monetized as credits in the form of reduced capacity requirements.
The HQICC value is 975 MW, as determined by the tie benefits from Québec over the Phase II facility, and are applicable for every month during the 2019/20 CCP.
8.1.1.5 Adjustments to Tie Benefits
Processes 5.0 of the current tie benefits methodology requires that that individual interconnections or group of interconnections tie benefit values be adjusted, if necessary, to account for the Existing Qualified Import Capacity Resources for 2019/20. If the sum of the tie benefits value and the import capacity is greater than the TTC of the individual interconnection or group of interconnections under study, then the tie benefits value will be reduced.
Process 6.0 of the tie benefits methodology determines the final tie benefits for each neighboring Balancing Authority Area as the sum of the tie benefits from the individual interconnections or groups of interconnections with that Balancing Authority Area, after accounting for any adjustment for capacity imports as determined within Process 5.0.
Final total tie benefits for the New England Balancing Authority Area from all neighboring Balancing Authority Areas is determined within Process 7.0 of the tie benefits methodology as the sum of these neighboring area tie benefits after accounting for any adjustment for capacity imports as determined within Process 6.0.
For the 2019/20 CCP, Table 21 shows the Existing Qualified Import Capacity Resources used to determine if adjustments of tie benefits are necessary as defined within Process 5.0 through Process 7.0 of the tie benefits methodology. For the 2019/20 Tie Benefits Study, no adjustment to tie benefits to account for capacity imports was necessary.
45 The 2019/29 CCP HQICCs values were filed with the Commission in the 2019/20 ICR filing: http://www.iso-ne.com/static-assets/documents/2015/11/icr_values_2019-2020_ccp.pdf.

2019/20 ICR Values Report 42
Table 21: Capacity Imports by External Interface Used to Adjust Tie Benefits (MW)
The results of the Tie Benefits Study for the 2019/20 CCP are summarized in Table 22.
Table 22: 2019/20 Tie Benefits (MW)
8.1.1.6 Comparison of the 2019/20 and 2018/19 CCP’s Tie Benefits
Table 23 gives a comparison of the 2019/20 CCP tie benefits calculated for FCA10 and the 2018/19 CCP tie benefits calculated for FCA9.
Table 23: 2019/20 versus 2018/19 Tie Benefits (MW)
As the comparison of the results show, the total tie benefits for the New England Balancing Authority Area has increased by only 20MW for the 2019/20 CCP versus the 2018/19 CCP. In addition, the distribution of the total tie benefits to the Balancing Authority Areas for the 2019/20 CCP is similar to the values calculated for the 2018/19 CCP tie benefits study. This is because system conditions have not changed enough between the two studies to warrant significant changes in the total and individual tie line tie benefits results.
ImportNew
Brunswick Hydro-Québec
Phase II HighgateNew York AC
TiesNYPA - CMR 68.8NYPA - VT 14VJO - Highgate 6Total 6 82.8
Balancing Authority Area Summer WinterQuébec via Phase II 975 975Québec via Highgate 142 142Maritimes 519 519New York 354 354Total Tie Benefits 1,990 1,990
Balancing Authority Area 2019/20 FCA10 2018/19 FCA9Québec via Phase II 975 953Québec via Highgate 142 148Maritimes 519 523New York 354 346Total Tie Benefits 1,990 1,970

2019/20 ICR Values Report 43
8.2 5% Voltage Reduction
In addition to tie benefits, load reduction from implementation of a 5% voltage reduction is used in the development of the ICR Values. This constitutes an action that ISO-NE System Operators can invoke in real-time under ISO-NE OP4, to balance system supply with demand under actual or expected capacity shortage conditions.
The amount of load relief assumed obtainable from invoking a 5% voltage reduction is based on the performance standard established within ISO New England’s Operating Procedure No. 13, Standards for Voltage Reduction and Load Shedding Capability (“Operating Procedure No. 13” or OP13). ISO-NE Operating Procedure No. 13 requires that…
“…each Market Participant with control over transmission/distribution facilities must have the capability to reduce system load demand at the time a voltage reduction is initiated by at least one and one-half (1.5) percent through implementation of a voltage reduction.”
The calculation of the amount of 5% voltage reduction to be assumed within the ICR Values calculations uses the benchmark 1.5% value of load relief as specified in Appendix A of OP4.46 This benchmark reduction value is set based on the voltage reduction requirements of OP13, rather than the self-reported values submitted by Market Participants with control over transmission/distribution facilities.
For the 2019/20 ICR calculation, the methodology for calculating the amount of 5% voltage reduction assumed within the ICR remains the same as used in the prior year’s ICR calculations. This methodology uses the 90/10 peak load forecast and assumes that all Demand Resources will have already been implemented, and thus, will have reduced the 90/10 load value at the time of peak or OP4 invocation.
Thus the voltage reduction load relief values assumed as offsets against the ICR are calculated as the 1.5% voltage reduction assumption times the 90/10 peak load forecast after accounting for the amount of all Demand Resources (with the exception of limiting the amount of Real-Time Emergency Generation to 600 MW, the maximum amount purchased in the auction to meet the ICR, if necessary), which is assumed to be already implemented and therefore not contributing to the 1.5% reduction in load. Figure 9 shows this formula:
Figure 10: Formula for Calculating 5% Voltage Reduction Assumption
⌈90/10 𝑃𝑃𝑃𝑃𝑃𝑃𝑃𝑃 𝐿𝐿𝐿𝐿𝑃𝑃𝐿𝐿 𝑀𝑀𝑀𝑀 −𝐷𝐷𝑃𝑃𝐷𝐷𝑃𝑃𝐷𝐷𝐿𝐿 𝑅𝑅𝑃𝑃𝑅𝑅𝐿𝐿𝑅𝑅𝑅𝑅𝑅𝑅𝑃𝑃 𝑀𝑀𝑀𝑀⌉ × 1.5%
Table 24 shows the amount of voltage reduction (MW) modeled as ISO-NE OP-4 load relief from Actions 6 & 8 for each of the months of the 2019/20 CCP within the ICR calculations along with the values of 90/10 load forecast and Demand Resources used to calculate them.
46 Appendix A of OP-4is available at: http://www.iso-ne.com/static-assets/documents/rules_proceds/operating/isone/op4/op4a_rto_final.pdf.

2019/20 ICR Values Report 44
Table 24: OP-4 Action 6 & 8 Modeled (MW)
8.3 Operating Reserve
It is assumed that during peak load conditions, under extremely tight capacity situations, ISO-NE System Operations will maintain a minimum level of at least 200 MW of operating reserves for transmission system protection, prior to invoking manual load shedding procedures, if necessary. This pre-load shedding OP-4 situation is modeled as operating reserve within the ICR calculation by withholding this amount of capacity from serving regional peak load.
8.4 Summary
Table 25 summarizes the capacity resources, proxy units and OP4 assumptions used for the calculation of the 2019/20 ICR Values.
Table 25: Summary of Resource and OP4 Assumptions (MW)
90-10 Peak Load Passive DR RTDR RTEG
Action 6 & 8 5%
Voltage Reduction
Jun 2019 - Sep 2019 32,341 2,218 510 143 442
Oct 2019 - May 2020 24,085 2,006 523 133 321
Type of Resource/OP4 2019/20 FCAGenerating Resources 29,734.850 Intermittent Power Resources 919.119 Demand Resources 2,871.265 Import Resources 88.800 Export Delist (100.000) Import Deratings (30.000) OP 4 Voltage Reduction 442.000 Minimum Operating Reserve (200.000) Tie Benefits (with 975 MW of HQICCs) 1,990.000 Proxy Units 800.000
Total MW Modeled in ICR 36,516.034

2019/20 ICR Values Report 45
Section 9: Resource Availability 9.1 Generating Resource Forced Outages
A five-year, historical average of unit-specific forced outage assumptions is determined for each generating unit that qualified as an Existing Generating Capacity Resource, using the most recent available data of monthly Equivalent Forced Outage Rate - Demand (EFORd) values from NERC’s Generating Availability Data System (GADS).47 The NERC GADS data, which is submitted by owners of regional generators to ISO-NE for the months of January 2010 through December 2014, was used to create an EFORd value for each generating unit that submits such data. The NERC Class Average data is used as a substitute for immature units and for units that are not required to submit NERC GADS data.
Table 26 shows the capacity-weighted, average EFORd values resulting from summing the individual generator data by generating resource category, weighted by individual capacity ratings. This is provided for informational purposes only. In the GE MARS model, the calculated EFORd for each generating resource is used as a generator-specific input assumption.
9.2 Generating Resource Scheduled Outages
A weekly representation of a generator’s scheduled (maintenance) outages is another input assumption that goes into the GE MARS model. Included within the scheduled outages are annual maintenance outages and short-term outages, scheduled more than 14 days in advance of their outage date. A single value is then calculated for each generator, based on a five-year historical average. In addition to the EFORd data, Table 26 illustrates the average annual maintenance weeks assumed for each type of unit category, weighted by the summer capability. NERC Class Average data is used to calculate the average maintenance weeks assumption for immature units.
47 For more information on GADS, see the NERC website located at: http://www.nerc.com/pa/RAPA/gads/Pages/default.aspx.
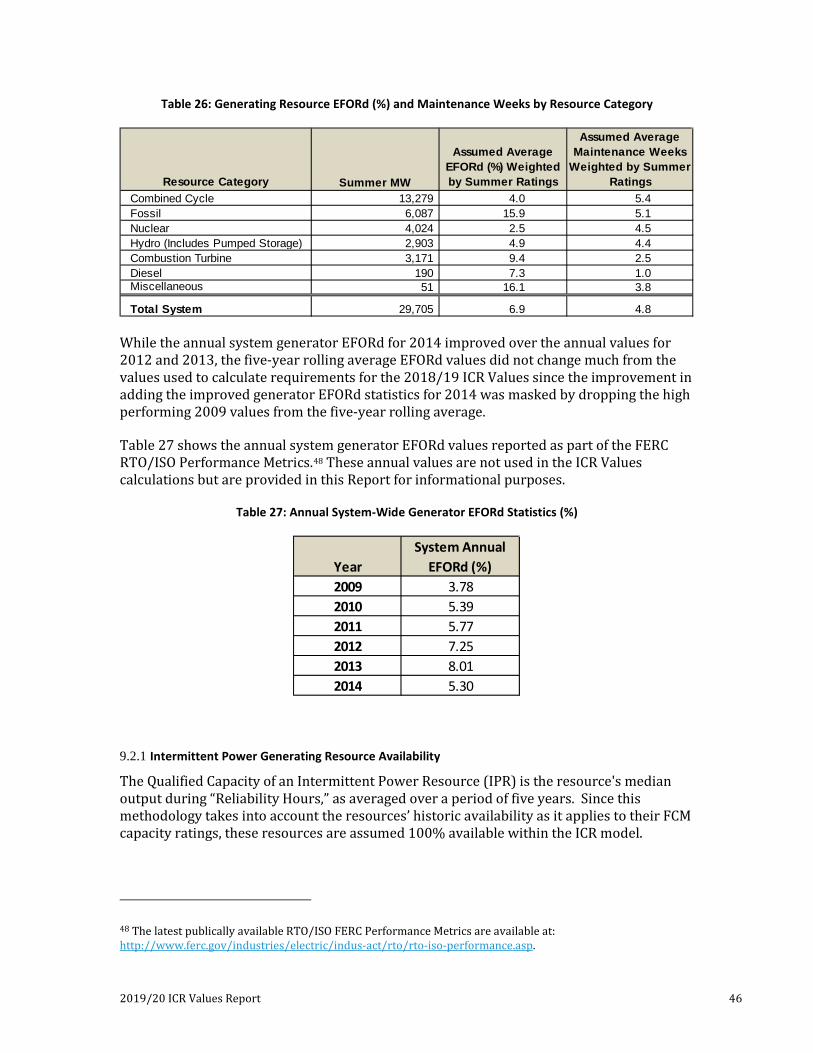
2019/20 ICR Values Report 46
Table 26: Generating Resource EFORd (%) and Maintenance Weeks by Resource Category
While the annual system generator EFORd for 2014 improved over the annual values for 2012 and 2013, the five-year rolling average EFORd values did not change much from the values used to calculate requirements for the 2018/19 ICR Values since the improvement in adding the improved generator EFORd statistics for 2014 was masked by dropping the high performing 2009 values from the five-year rolling average.
Table 27 shows the annual system generator EFORd values reported as part of the FERC RTO/ISO Performance Metrics.48 These annual values are not used in the ICR Values calculations but are provided in this Report for informational purposes.
Table 27: Annual System-Wide Generator EFORd Statistics (%)
9.2.1 Intermittent Power Generating Resource Availability
The Qualified Capacity of an Intermittent Power Resource (IPR) is the resource's median output during “Reliability Hours,” as averaged over a period of five years. Since this methodology takes into account the resources’ historic availability as it applies to their FCM capacity ratings, these resources are assumed 100% available within the ICR model.
48 The latest publically available RTO/ISO FERC Performance Metrics are available at: http://www.ferc.gov/industries/electric/indus-act/rto/rto-iso-performance.asp.
Resource Category Summer MW
Assumed Average EFORd (%) Weighted by Summer Ratings
Assumed Average Maintenance Weeks
Weighted by Summer Ratings
Combined Cycle 13,279 4.0 5.4Fossil 6,087 15.9 5.1Nuclear 4,024 2.5 4.5Hydro (Includes Pumped Storage) 2,903 4.9 4.4Combustion Turbine 3,171 9.4 2.5Diesel 190 7.3 1.0Miscellaneous 51 16.1 3.8
Total System 29,705 6.9 4.8
YearSystem Annual
EFORd (%)2009 3.782010 5.392011 5.772012 7.252013 8.012014 5.30

2019/20 ICR Values Report 47
9.2.2 Demand Resources Availability
9.2.2.1 Passive Demand Resources
Table 28 tabulates the availability assumption of the Passive Demand Resources in the On-Peak and Seasonal Peak categories of Demand Resources. These resources are considered 100% available within the ICR model. These two categories consist of passive resources such as energy efficiency or conservation, which are considered always “in service” and as such, are subsequently assumed to be 100% available. The total average availability for all Passive Demand Resources is, therefore, 100%.
Table 28: Passive Demand Resources – Summer (MW) and Availability (%)
9.2.2.2 Active Demand Resources
The historical performance, from both audits and real time events, of Active Demand Resources (those in the Real-Time Demand Response and Real-Time Emergency Generators categories) are used to create the Active Demand availability assumption for use within the ICR calculation.49
For the calculation of ICR for the 2019/20 CCP, historical Demand Resource performance data for five years, since the first year of the FCM, was used. This historical data consists of both OP4 events with any Active Demand Resource activation and performance audits that occurred during the summer and winter of 2010 through 2014. At the May 28, 2015 PSPC meeting, ISO-NE proposed using an availability assumption for Active Demand Resources based on the summer and winter performance data for the years 2010 through 2014, weighted by the achieved MW capacity of the resources within each Load Zone for each year. After the presentation of this data to the PSCPC and subsequent stakeholder discussions, it was decided to use this proposal within the ICR Values calculations.
49 A detailed discussion of the Demand Resource availability assumption is available here: http://www.iso-ne.com/static-assets/documents/2015/05/2015_DR_availability.pdf.
Load Zone Summer (MW) Availability (%) Summer (MW) Availability (%)MAINE 164.811 100 - - NEW HAMPSHIRE 101.215 100 - - VERMONT 120.090 100 - - CONNECTICUT 78.815 100 371.437 100 RHODE ISLAND 197.599 100 - - SOUTH EAST MASSACHUSETTS 292.685 100 - - WEST CENTRAL MASSACHUSETTS 293.340 100 49.645 100 NORTH EAST MASSACHUSETTS & BOSTON 548.466 100 - -
Total New England 1797.021 100 421.082 100
On-Peak Seasonal Peak

2019/20 ICR Values Report 48
Table 29 shows the performance rates for Active Demand Resources applied to the Demand Resources by Load Zone and type of resource that are qualified as Existing Resources to participate in the 2019/20 FCA. This gives an average Active Demand Resource availability assumption of 89% for both Real-Time Demand Response and Real-Time Emergency Generators. The total average Demand Resource availability assumption for all Demand Resources, both Active and Passive, is 97%. This is an increase in performance of approximately 1% over prior values assumed within the 2018/19 ICR Values calculation, which used historical data from summer and winter 2010 through 2013. In the ICR model, Demand Resources are modeled in blocks consisting of the type of Demand Resource by Load Zone. The overall availability is shown for informational purposes only.
Table 29: Demand Response Resources Summer (MW) and Availability (%)
Load Zone Summer (MW) Availability (%) Summer (MW) Availability (%)MAINE 149.386 99 7.482 92 NEW HAMPSHIRE 12.798 88 14.022 97 VERMONT 31.900 97 4.918 82 CONNECTICUT 77.374 83 52.941 87 RHODE ISLAND 60.362 83 15.720 91 SOUTH EAST MASSACHUSETTS 51.987 78 12.722 83 WEST CENTRAL MASSACHUSETTS 58.684 90 25.098 89 NORTH EAST MASSACHUSETTS & BOSTON 67.329 83 10.439 90
Total New England 509.820 89 143.342 89
RT Demand Response RT Emergency Gen

2019/20 ICR Values Report 49
Section 10: Difference from 2018/19 FCA ICR Values 10.1 Change in ICR
ISO-NE performs an analysis, in an effort to quantify the effects that each input assumption has on the determination of ICR results, which isolates the MW change in ICR with each updated assumption. The procedure begins with the model encompassing the input assumptions associated with the ICR calculated for the 2018/19 CCP and substitutes each assumption individually with the corresponding 2019/20 CCP assumption. The net of these changes within the ICR value, as a result of each individual input assumption change, was then considered as the overall effect of the changed assumption set. Table 30 lists the assumptions for each CCP and their subsequent effect on the resultant ICR value. Note that the sum of the individual assumption effects on ICR do not necessarily sum to the total difference in ICR due to the interplay of the various assumptions within the model when they are modeled concurrently.
Table 30: Summary of ICR Input Assumptions for 2019/20 vs. 2018/19
As shown in Table 30, the small change in overall ICR for the 2019/20 CCP ICR versus the 2018/19 ICR (-16 MW) is the net effect of some assumptions which are increasing and some assumptions which are decreasing ICR. The largest increase in ICR is caused by an increase in generator EFORd. As described in this Report’s section on Resource Availability, the EFORd used in the ICR Values calculation is derived from the most recent five years of GADS data. The 5-year weighted average system-wide generator EFORd calculated for the 2019/20 ICR calculation is approximately 3% higher than the EFORd values calculated for the 2018/19 ICR calculation. This decrease in generating resource availability caused the ICR to increase by 136 MW because more resources are needed to meet the capacity requirements in New England if these resources are less reliable than in previous years. In addition, an increase in EFORd for large generators could also add more risk to the system availability, and the GE MARS model does show an increase in capacity needs to account for this additional risk.
Total
MWWeighted Forced
Outage MWWeighted Forced
OutageGeneration & IPR 30,524 6.7% 29,699 6.5% 136
Demand Resources 2,871 2.5% 3,054 4.0% -42Imports 89 0.0% 89 0.0% -
Load Forecast - Reference -56MW % MW %
OP 4 5% VR 442 1.50% 441 1.50% -
ICR -1635,126 35,142
MW MW29,861 30,005
MW MW
975 MW Quebec (HQICCs) 953 MW Quebec (HQICCs)142 MW Quebec via Highgate 148 MW Quebec via Highgate
1,990 MW 1,970 MW
AssumptionEffect on ICR (MW)2019/20 FCA 2018/19 FCA
Tie Benefits
354 MW New York 346 MW New York
8519 MW Maritimes 523 MW Maritimes

2019/20 ICR Values Report 50
The 20 MW increase in the tie benefits and the 22 MW increase in HQICCs assumed for the 2019/20 CCP versus 2018/19 CCP accounts for an overall increase in ICR of 8 MW. The 8 MW increase reflects a 14 MW decrease in the net installed capacity required due to the increased tie benefits assumption. Also, the increase in HQICCs from 953 MW for 2018/19 to 975 MW for 2019/20 accounts for an increase in ICR of approximately 22 MW since HQICCs, which are treated differently than other resources and are not adjusted by the ALCC value, are added back into the ICR. The 14 MW decrease and 22 MW increase net out to the overall MW increase of 8 MW in ICR resulting from the change in tie benefits assumed.
There are two assumptions that contribute to the overall decrease in ICR. The first is the load forecast. Table 30 compares the change in load forecast used for the 2019/20 and 2018/19 CCPs. For 2019/20, the load forecast would be considered the CELT Reference load forecast which is net of the BTMNEL PV as discussed in the Section 6.1.1 of this Report: Modeling of the BTMNEL PV Forecast. For the 2018/19 ICR calculation, the 2014 CELT load forecast was used and as such, the reflection of BTMNEL PV forecast was not considered and the load forecast used would be equivalent to the “Gross” load forecast from the 2015 CELT which does not reflect the reduction to BTMNEL PV.
When comparing the change in load forecast assumptions shown in Table 30, it must be noted that while the 50/50 load forecast is shown for reference purposes, when calculating the ICR, a full distribution of possible peak loads is modeled along with moments of the distribution: the mean, standard deviation and 3rd cummulant which together form the load forecast uncertainty within the model. Other factors in addition to the load forecast uncertainty also can affect the amount of installed capacity needed to meet the load forecast, particularly the resource size and availabilities modeled. So while the decrease in the 50/50 peak load forecast is 144 MW for the 2019/20 CCP versus the 2018/19 CCP as shown, there is a decrease in the amount of installed capacity required is 56 MW.
This year, for the first time, the BTMNEL PV resources forecasted to be installed by the start of the 2019/20 CCP were modeled as a reduction to the load forecast used to calculate the ICR. For this reason, several scenarios of load forecast assumptions and their effect on the ICR were presented to the PSPC to provide a better understanding of how the PV resource forecast reduced ICR, how the difference between the 2014 and 2015 CELT load forecasts, including the year over year change and changing economic assumptions influenced ICR. Table 31 provides these load forecast scenario comparisons and the effect on ICR. Again it must be noted, that the 50/50 peak load forecast shown for each of the scenarios is meant for informational purposes. In each of the scenarios, the model sees a full distribution of peak loads including load forecast uncertainty multipliers which vary with each CELT load forecast cycle.
These scenarios follow the same methodology as the ICR assumption analysis, that is the model for the 2018/19 FCA ICR is used and then the load forecast assumption is changed and the change in ICR is noted between the two model runs (noted in Table 31 as Model Run 1 and Model Run 2).

2019/20 ICR Values Report 51
Table 31: Load Forecast Scenarios to Gauge the Effect on ICR
In scenario (1), Table 31 shows that ICR increases by 323 MWs when using the Gross load forecast for 2019/20 from the 2015 CELT versus the Gross load forecast used for 2018/19 from the 2014 CELT. This is due to an increase in load growth for 2019/20 over 2018/19 and changes in the load forecasts due to load forecast uncertainty. Scenario (2) shows the difference in ICR of -132 MW for the same year of the different Gross load forecasts which shows that the level of the load forecast has decreased due to changing economic assumptions. Scenario (3) shows that load forecast uncertainty has increased in the 2015 CELT load forecast versus the 2014 CELT load forecast as ICR increased by 154 MW when only the load forecast uncertainty was changed. Scenario (4) shows that ICR decreased by 392 MW for the 2019/20 CCP when using the forecast with BTMNEL PV resources reflected as a reduction to the load versus the Gross load forecast.
The final assumption with that decreases the ICR is the change in Demand Resource type of resource and assumed availability. While the change in assumed availability for active Demand Resources did not vary greatly from the values used for the 2018/19 FCA ICR calculation (an improvement of 1% in the performance of Active Demand Resources), the increase in the amount of passive resources and corresponding decrease in active resources improved the overall Demand Resource availability assumption (calculated as 1 – DR Performance) from 4% to 3% therefore decreasing ICR by 42 MW in 2019/20 versus 2018/19. Table 32 below shows the breakdown by type of Demand Resource and corresponding performance for the 2019/20 versus 2017/18 ICR calculations.
Table 32: Comparison of Demand Resources (MW) & Performance (%) for 2019/20 versus 2018/19 ICR Calculations
Scenario Comparison
Load Forecast
CELT Year Load Year
Correspond-ing 50/50
Peak Load (MW)
Load Forecast
CELT Year Load Year
Correspond-ing 50/50
Peak Load (MW)
Effect on ICR (MW) of Run 1 Versus 2
(1)
Different CELT load forecasts and different years [to flush out year over year load growth and changes in the different load forecasts. This is a Gross versus Gross load forecast comparison.] 2015 2019/20 30,230 2014 2018/19 30,005 323
(2)
Different CELT forecast for the same year [to flush out level changes in the different forecasts. This is a Gross versus Gross load forecast comparison.] 2015 2018/19 29,825 2014 2018/19 30,005 -132
(3)Different CELT Load Forecast Uncertainty (LFU) only [reflects increased standard deviation in 2015 CELT forecast] 2015 (LFU) 2018/19 30,005 2014 (LFU) 2018/19 30,005 154
(4)Same CELT forecast and LFU for 2019/20 with and without reflecting BTMNEL PV [Net versus Gross load forecast] 2015 2019/20 29,861 2015 2019/20 30,230 -392
Model Run 1 Model Run 2
MW % MW %Passive Demand Resources 2,218 100 2,027 100Real-Time Demand Response 510 89 756 88Real-Time Emergency Generators 143 89 270 88Total Demand Resources 2,871 97 3,054 96
2019/20 FCA10 2018/19 FCA9Type of Demand Resource

2019/20 ICR Values Report 52
10.2 Change in Locational Requirements
As discussed in Section 1 of this Report, ISO-NE identified one Capacity Zone, SENE, for the 2019/20 CCP. As this was the first time modeling this Capacity Zone, there are no comparisons available for previous FCAs.
Table 35 summarizes all the available comparisons of ICR Values for the 2019/20 CCP versus the 2018/19 CCP FCAs.
Table 33: Summary Table with the Comparison of all ICR Values (MW)50
50 Existing Capacity Resources value is the amount of Existing capacity at the time of the ICR calculation after taking into account any derates of capacity for exports or transmission transfer capability limits. The values shown do not include proxy unit capacity needed to bring the system to the 0.1 days/year LOLE criteria.
2019/20 FCA
2018/19 FCA
2019/20 FCA
2018/19 FCA
Peak Load (50/50) 29,861 30,005 12,282 -
Existing Capacity Resources 33,484 32,842 11,194 -
Installed Capacity Requirement 35,126 35,142
NET ICR (ICR Minus HQICCs) 34,151 34,189
1-in-5 LOLE Demand Curve capacity value 33,076 33,132
1-in-87 LOLE Demand Curve capacity value 37,053 37,027
Local Resource Adequacy Requirement 9,584 -
Transmission Security Analysis Requirement 10,028 -
Local Sourcing Requirement 10,028 -
New EnglandSoutheast New
England

2019/20 ICR Values Report 53
{End of Report}