icma erc european repo survey june 2015
DESCRIPTION
In June 2015, the European Repo Council (ERC) of the International Capital Market Association (ICMA) conducted the 29th in its series of semi-annual surveys of the repo market in Europe.TRANSCRIPT

Number 29 - Conducted June 2015Published September 2015
International Capital Market Association
European Repo MarketSurvey

2ICMA European Repo Market Survey September 2015
This report has been compiled by Richard Comotto, Senior Visiting Fellow, ICMA Centre at Reading University.
© International Capital Market Association (ICMA), Zurich, 2015. All rights reserved. No part of this publication may be reproduced or transmitted in any form or by any means without permission from ICMA.
This report is intended for general information only and is not intended to be nor should it be relied upon as being legal, financial, investment tax, regulatory, business or other professional advice. Users of this report should seek appropriate independent advice before entering into any kind of specific transaction. While the information contained in this report is taken from sources believed to be reliable, neither ICMA nor the author represents or warrants that it is accurate, suitable or complete and neither ICMA nor the author shall have any liability arising from or relating to the use of this report and its contents.
International Capital Market Association
Dreikönigstrasse 8 CH-8002 Zurich www.icmagroup.org

3ICMA European Repo Market Survey September 2015
Executive Summary
In June 2015, the European Repo Council (ERC) of the International Capital Market Association (ICMA) conducted the 29th in its series of semi-annual surveys of the repo market in Europe.
The latest survey asked a sample of financial institutions in Europe for the value and breakdown of their repo contracts that were still outstanding at close of business on June 10, 2015. Replies were received from 65 offices of 61 financial groups, mainly banks. Returns were also made directly by the principal automatic repo trading systems (ATS) and tri-party repo agents in Europe, as well as by the London-based Wholesale Market Brokers’ Association (WMBA).
Total repo businessThe total value of the repo contracts outstanding on the books of the 65 institutions who participated in the latest survey was EUR 5,612 billion, compared with the EUR 5,500 billion in December 2014. This represents an increase of 2% in the ‘headline’ number since December 2014 but a 2.9% decrease year-on-year. Using a constant sample of banks to eliminate the effect of changes in the survey sample, it is estimated that the market grew over the previous six months by 4.6% but shrank -3.7% year-on-year. The growth in repo activity was not expected. But care needs to be taken when interpreting a single survey, as it is just a snapshot. Moreover, the growth over the first half of the year appears to reflect the expanded repo books of some larger banks, whereas the median change was negative. The banks that increased activity have been able to do so because new regulations that will constrain their balance sheets have yet to be finalised and/or fully implemented.
Trading analysisThe most notable change in business revealed by the latest survey is in the share of directly-negotiated transactions. This has been trending up since 2012, which is presumed to reflect a regulatory-driven shift away from low-margin interbank and commoditized transactions, much of which are electronically traded, towards higher-margin customer and customized business, most of which is directly negotiated. The share of electronic trading also fell back although the outstanding value recovered. The decline in the volume and share of voice-brokers accelerated, and plumbed yet another historic low.
Geographical analysisDomestic repo business continued its long-term decline. Cross-border business surged, driven by an unusual increase in the share of cross-border transactions into and inside the eurozone.
The expansion in cross-border business was largely at the expense of anonymous (ie CCP-cleared) electronic trading. There was also a reduction in the share of anonymous business within electronic trading. This may reflect the introduction of the SIX Repo platform into the survey (transactions on this platform are not cleared by a CCP).
In contrast to CCP-cleared electronic trading, post-trade reporting of direct and voice-brokered trades to CCPs recovered sharply, which meant that the share of all CCP-cleared transactions was virtually unchanged.
Clearing and settlement analysisThe share of tri-party repo fell back to 10.0% from 10.5% and the outstanding value of tri-party repo reported directly by the major tri-party agents in Europe also contracted. The share of directly-reported tri-party repo accounted for by GC financing (mainly through Eurex Repo’s Euro GC Pooling facility) fell back again.
Cash currency analysisThe US dollar increased its share in the survey, but the share of the Japanese yen declined. The latest survey received for the first time directly-reported data from the new SIX Repo platform in Switzerland. This replaced Eurex Repo as the domestic Swiss ATS in May 2014.
Collateral analysisThere was a drop in the share of all government bonds within the pool of EU-originated fixed-income collateral reported in the survey to 77.0% from 81.5%. This change was driven to some extent by an increase in non-government bond and equity collateral. There was a sharp decline in Japanese collateral and increases in the shares of US and ‘other OECD’ collateral.

4ICMA European Repo Market Survey September 2015
Executive Summary
Contract analysisThe share of documented sell/buy-backs increased to 15.0% from 12.9%.
Maturity analysisThe changes in maturities seen in the December 2014 survey had been reversed by June 2015. The share of short-dated transactions recovered. However, the rise in short dates disguised a sharp drop in transactions with only one day remaining to maturity. Business shifted back into the short dates out of terms between one and three months. This reflected the usual seasonal pattern.
Concentration analysisThere was an increase in the concentration of business in the top 10 survey respondents, reflecting the very significant increases in the repo books of a few of the very largest banks.
Product analysisThe share of securities lending conducted on repo desks rose.

5ICMA European Repo Market Survey September 2015
CHAPTER 1: THE SURVEY
On June 10, 2015, the European Repo Council (ERC) of the International Capital Market Association (ICMA) conducted the 29th in its series of semi-annual surveys of the repo market in Europe.
The survey was managed and the results analysed on behalf of ICMA by the author, at the ICMA Centre at Reading University in England, under the guidance of the ERC Steering Committee (“ERC Committee”).
1.1 What the survey askedThe survey asked financial institutions operating in a number of European financial centres for the value of the cash side of repo and reverse repo contracts still outstanding at close of business on Wednesday, June 10, 2015.
The questionnaire also asked these institutions to analyse their business in terms of the currency, the type of counterparty, contract and repo rate, the remaining term to maturity, the method of settlement and the origin of the collateral. In addition, institutions were asked about securities lending and borrowing conducted on their repo desks.
The detailed results of the survey are set out in Appendix C. An extract of the accompanying Guidance Notes is reproduced in Appendix A
Separate returns were made directly by the principal automatic repo trading systems (ATS) and tri-party repo agents in Europe, and an aggregate return was made directly by the London-based Wholesale Market Brokers’ Association (WMBA).
1.2 The response to the surveyThe latest survey was completed by 65 offices of 61 financial groups. This is two fewer respondents than in the December 2014 survey. Two institutions which participated in the previous survey dropped out of the latest and none joined or re-joined.
50 of the participants were headquartered across 13 European countries, as well as in Australia (1), Japan (5) and North America (10). 35 respondents were foreign affiliates, most of which were located in the UK. 48 participants were based across 12 of the 28 member states of the EU (there were no institutions in the survey from Finland, Greece, Sweden or any former Accession State). 43 participants were based across 10 of the 19 countries of the eurozone.
Many institutions provided data for their entire European repo business. Others provided separate returns for one or more (but not necessarily all) of their European offices. A list of the institutions that have participated in the ICMA’s repo surveys is contained in Appendix B.
1.3 The next surveyThe next survey is scheduled to take place at close of business on Wednesday, December 9, 2015.
Any financial institution wishing to participate in the next survey will be able to download copies of the questionnaire and accompanying Guidance Notes from ICMA’s web site. The latest forms will be published shortly before the next survey at the following website: www.icmagroup.org/surveys/repo/participate.
Questions about the survey should be sent by e-mail to [email protected].
Institutions who participate in a survey receive, in confidence, a list of their rankings in the various categories of the survey.

6ICMA European Repo Market Survey September 2015
CHAPTER 2: ANALYSIS OF SURVEY RESULTS
The aggregate results of the latest two surveys and of the surveys in each June in the four previous years (2011-2015) are set out in Appendix C. The full results of all previous surveys can be found at www.icmagroup.org.
Total repo business (Q1)The total value, at close of business on June 10, 2015, of repos and reverse repos outstanding on the books of the 65 institutions which participated in the latest survey was EUR 5,612.2 billion. This is much higher than the crisis trough of EUR 4,633 billion in December 2008 but much lower than the pre-crisis peak of EUR 6,775 billion in June 2007.
Table 2.1 – Total repo business from 2001 to 2015
survey total repo reverse repo
2015 June 5,612 48.0% 52.0%
2014 December 5,500 48.8% 51.2%
2014 June 5,782 48.6% 51.4%
2013 December 5,499 49.2% 50.8%
2013 June 6,076 49.8% 50.2%
2012 December 5,611 49.1% 51.9%
2012 June 5,647 48.7% 51.3%
2011 December 6,204 50.3% 49.7%
2011 June 6,124 50.7% 49.3%
2010 December 5,908 51.0% 49.0%
2010 June 6,979 53.5% 46.5%
2009 December 5,582 50.0% 50.0%
2009 June 4,868 52.2% 47.8%
2008 December 4,633 49.9% 50.1%
2008 June 6,504 48.8% 51.2%
2007 December 6,382 49.4% 50.6%
2007 June 6,775 50.8% 49.2%
2006 December 6,430 50.7% 49.3%
2006 June 6,019 51.7% 48.3%
2005 December 5,883 54.6% 45.4%
2005 June 5,319 52.4% 47.6%
2004 December 5,000 50.1% 49.9%
2004 June 4,561 50.6% 49.4%
2003 December 3,788 51.3% 48.7%
2003 June 4,050 50.0% 50.0%
2002 December 3,377 51.0% 49.0%
2002 June 3,305 50.0% 50.0%
2001 December 2,298 50.4% 49.6%
2001 June 1,863 49.6% 50.4%
It is important to remember that the survey measures the value of outstanding transactions at close of business on the survey date. Measuring the stock of transactions at one date, rather than the flow between two dates, permits deeper analysis but is difficult to reconcile with the flow numbers published by some other sources. As the survey is a ‘snapshot’ of the market, it
7ICMA European Repo Market Survey September 2015
CHAPTER 2: ANALYSIS OF SURVEY RESULTS
can miss peaks and troughs in business between survey dates, especially of very short-term transactions.
In addition, the values measured by the survey are gross figures, which mean that they have not been adjusted for the double counting of the same transactions between pairs of survey participants. However, a study (see the report of the December 2012 survey) suggested that the problem of double-counting was not very significant.
Nor does the survey measure the value of repos transacted with central banks as part of official monetary policy operations. Central bank operations have of course been very substantial since 2008.
The ‘headline’ total of the survey increased by 2.0% since December 2014 but decreased by 2.9% year-on-year. However, in order to gauge the growth of the European repo market (or at least that segment represented by the institutions who have participated in the survey), it is not valid to simply compare the total reported value of repos and reverse repos with the same figures in previous surveys. Some of the changes will represent the entry and exit of institutions into and out of the survey, mergers between banks and the reorganization of repo books within banks. To overcome the problem caused by changes in the sample of survey participants, comparisons are made of the aggregate outstanding contracts reported by a sub-sample of institutions which have participated continuously in several surveys.
Out of the 65 institutions in the present survey, 63 have participated in all of the last three surveys. Overall, the aggregate value of outstanding repos and reverse repos transacted by those 63 institutions grew by 4.6% between the June 2015 and December 2014 surveys, but decreased by 3.7% year-on-year.
The repo books of 35 of the latest sample of 65 institutions contracted, compared to 31 out of 67 repo books in the December 2014 survey. This means that more repo books contracted but those that expanded more than offset those that contracted. This is reflected in the fact that the unweighted mean of the percentage changes in the size of repo books was +2.9% but the median was -0.5%.
The bottom quartile of participants overwhelmingly shrank their repo books. But most of the third quartile expanded, many by a significant percentages. The second quartile was split: the lower half followed the general expansion in the third quartile but the upper half mainly contracted. Most of the top quartile also contracted but there were very significant increases in the repo books of a few of the very largest banks.
The increase in overall outstanding repo activity measured by the survey is unexpected, particularly in view of reports of the cumulative impact of a succession of restrictive regulations, as well as the market repercussions of quantitative easing and anaemic underlying economic and financial conditions. However, caution should be exercised when interpreting a single survey, given that it represents a snapshot of the market and may therefore be coincident with temporary surges or collapses in activity. It also needs to be remembered that changes in individual repo books are highly variable (the largest books can fluctuate by more than 25% over a semester and smaller books by some 100%). And the direction of the survey total and its components can also be swung against otherwise general trends by the activities of the largest participants. Another factor is that some new regulations have yet to be finalized or fully implemented. A lot of the response by banks to date has been anticipatory and therefore discretionary. In particular, the Total Loss Absorbing Capital (TLAC) rules and the Net Stable Funding Ratio (NSFR) still have to be finalized. Anecdotal evidence suggests that, as a result, the pace at which banks in different countries are responding to regulatory changes varies. This may be the case on this occasion.

8ICMA European Repo Market Survey September 2015
CHAPTER 2: ANALYSIS OF SURVEY RESULTS
Trading analysis (Q1.1)Table 2.2 – Trading analysis
June 2015 December 2014 June 2014
share users share users share users
direct 57.5% 65 54.9% 67 53.2% 65
of which tri-party 10.0% 40 10.5% 43 10.2% 44
voice-brokers 11.8% 53 13.6% 53 14.0% 55
ATS 30.6% 52 31.5% 53 32.8% 51
The most notable shift in business revealed by the latest survey is in the share of direct business (ie by telephone and electronic messaging). Direct business has been trending up since 2012 and, over the last six months, jumped. This was despite a fall in the share of tri-party repo (which is largely directly negotiated). In comparison with electronic trading, direct business tends to be longer-term, can be against non-government bond collateral and includes customer business. Open repo and customized transactions also have to be traded directly. And forward-start repo tends to be more suited to direct negotiation. It is argued that banks are migrating towards such higher-margin business because of regulatory pressures which are increasing their costs.
The decline in the volume and share of voice-brokers accelerated, and plumbed yet another historic low.
The share of electronic trading also fell back. However, data provided directly by the principal automatic repo trading systems (ATS) operating in Europe --- BrokerTec, Eurex Repo, MTS and, for the first time, SIX Repo in Switzerland --- showed that the outstanding value of all electronic trading (not just by the institutions in the survey) recovered by 6.7% to EUR 1,042 billion. It needs to be remembered that, when measured in terms of outstanding business rather than turnover, the share of electronic trading will tend to be understated given that it is largely composed of very short-dated transactions (some 83% of outstanding electronic business has a remaining term of just one day), most of which runs off between survey dates.
Table 2.3 – Numbers of participants reporting particular types of business
Jun-15 Dec-14 Jun-14 Dec-13 Jun-13 Dec-12
ATS 52 53 51 52 53 52
anonymous ATS 45 49 44 47 45 44
voice-brokers 53 53 55 52 53 58
tri-party repos 40 43 44 41 37 41
total 65 67 65 67 65 71

9ICMA European Repo Market Survey September 2015
CHAPTER 2: ANALYSIS OF SURVEY RESULTS
Figure 2.1 - Counterparty analysis
Geographical analysis (Q1.1)Table 2.4 – Geographical analysis
June 2015 December 2014 June 2014
share users share users share users
domestic 23.4% 24.6% 25.1%
cross-border to (other) eurozone
21.2% 17.2% 19.1%
cross-border to (other) non-eurozone 34.1% 34.1% 31.7%
anonymous 21.3% 45 24.1% 49 24.1% 44
Domestic repo business continued its long-term decline (from almost 50% of the survey in 2001).
Cross-border business surged. This change was driven, against the long-term trend, by an increase in the share of cross-border transactions into and inside the eurozone rather than cross-border transactions out of and outside the eurozone.1 This would suggest that the expansion in the survey total was driven largely by some eurozone-based banks.
The expansion in cross-border business was largely at the expense of anonymous (ie CCP-cleared) electronic trading. Data reported directly by ATS show that the share of anonymous trading fell back from an historic high of 97.9% of their business in the last survey to 93.4%, a similar level to December 2012. The shift into uncleared electronic trading may reflect the introduction of SIX Repo into the survey (transactions on this platform are not cleared by a CCP).
In contrast to CCP-cleared electronic trading, post-trade reporting of direct and voice-brokered trades to CCPs recovered sharply to 5.9% from 3.3%, which meant that the share of all CCP-cleared transactions, at 27.2%, was virtually unchanged. Given the fall in the share of voice-brokers, most of the increase in transaction reported post trade to a CCP would presumably have been part of the rise in direct trading.
Directly-reported data from voice-brokers, ATS and tri-party agents showed (unusually) a broadly similar pattern in the
1 Note that the survey measures the destination of transactions but not the origin. Therefore, cross-border transactions with (other) counterparties in the eurozone includes eurozone-to-eurozone transactions and noneurozone-to-eurozone transactions. And cross-border transactions with (other) counterparties outside the eurozone includes noneurozone-to-noneurozone transactions and eurozone-to-noneurozone transactions.

10ICMA European Repo Market Survey September 2015
CHAPTER 2: ANALYSIS OF SURVEY RESULTS
geographic composition of business: a relative decline in domestic business and in cross-border business out of and outside the eurozone to the benefit of cross-border business into and inside the eurozone.
In the case of voice-brokers, the share of domestic business fell to 37.0% from 40.9%, while cross-border business out of and outside the eurozone declined to 11.2% from 17.6%. On the other hand, the share of voice-brokered business into and inside the eurozone expanded sharply to 17.6% from 11.2%. Cross-border business between parties both outside the eurozone fell to 11.4% from 17.6%.
Data reported directly by ATS also showed a retreat in domestic electronic trading (to 28.9% from 30.0%). This re-established the previous downward trend. There was also a decline in the share of cross-border business into and out of the eurozone (to 42.4% from 44.9%). The counterpart was an increase in the share of cross-border business within the eurozone (to 25.2% from 23.8%) and outside the eurozone (to 3.4% from 1.4%).
Tri-party repo also shifted out of domestic business (to 38.8% from 41.5%) into cross-border business into and inside the eurozone (to 19.6% from 18.8%) but also (and in contrast to the main survey and electronic and voice-brokered business) into cross-border business out of and outside the eurozone (to 41.7% from 39.7%).
Table 2.5 – Geographical comparisons in June 2015
main survey ATS tri-party WMBA
domestic 23.4% 28.9% 38.8% 37.0%
cross-border 55.3% 71.1% 61.2% 63.0%
anonymous 21.3%
Figure 2.2 - Geographical analysis
Clearing and settlement analysis (Q1.2 and Q1.8)The share of tri-party repo fell back to 10.0% from 10.5%. The outstanding value of tri-party repo reported directly by the major tri-party agents in Europe (ie all tri-party business, not just by the institutions in the survey) also contracted, by 0.8% to EUR 1,376.0 billion. Together with the decline in the share of GC financing, the weakness of tri-party repo and the overall shift from repo to reverse repo would suggest that banks had less need for funding, perhaps as a result, at least in part, of quantitative easing by central banks.
The sample of institutions in the survey remained net borrowers from tri-party counterparties. Net borrowing rose to EUR 323.4 billion. In gross terms, tri-party repo funded 16.4% of repo books and took 4.1% of funds lent through reverse repo.

11ICMA European Repo Market Survey September 2015
CHAPTER 2: ANALYSIS OF SURVEY RESULTS
The share of directly-reported tri-party repo accounted for by GC financing (mainly through Eurex Repo’s Euro GC Pooling facility) fell back again to 13.6% from 15.3% (equivalent to some EUR 188 billion, down from EUR 212 billion). GC financing represented 4.1% of the outstanding business reported by banks (4.2% of repo and 4.0% of reverse repo), down from 5.6% in December 2014. The decline largely reflected a reduction in tri-party repo (ie funding) as opposed to reverse repo.
Figure 2.3 – Evolution of business cleared across CCP
Cash currency analysis (Q1.3 and Q1.4)Table 2.6 – Cash currency analysis
June 2015 December 2014 June 2014
EUR 63.4% 63.6% 65.7%
GBP 11.3% 10.9% 10.5%
USD 16.4% 15.1% 14.5%
DKK, SEK 2.4% 2.9% 2.4%
JPY 5.3% 6.3% 5.4%
CHF 0.1% 0.1% 0.1%
etc 1.1% 1.1% 1.3%
cross-currency 2.6% 2.1% 1.8%
The share of the euro in the survey was steady but fell back in directly-reported electronic trading (to 93.5% from 96.1%) and in tri-party repo (to 75.0% from 76.1%) but jumped in voice-brokered business (to 57.6% from 50.0%).
The US dollar increased its share in the survey, as well as in electronic trading (to 1.4% from 0.4%), tri-party repo (to 19.4% from 18.8%) and voice-brokered business (to 13.2% from 12.8%).

12ICMA European Repo Market Survey September 2015
CHAPTER 2: ANALYSIS OF SURVEY RESULTS
The share of the Japanese yen reversed direction in the latest survey as well as in voice-brokered business (to 2.5% from 4.1%).
The latest survey received, for the first time, directly-reported data from the new SIX Repo platform in Switzerland. This replaced Eurex Repo as the domestic Swiss ATS in May 2014. Probably as a result of the addition of SIX Repo, the total share of directly-reported electronic trading of the Swiss franc jumped to 1.2% from zero. However, the Swiss franc accounts for a very small share of tri-party repo (0.1%), despite the integral role that tri-party collateral management plays in the domestic market.
Figure 2.4 - Currency analysis
Table 2.7 – Currency comparison in June 2015
main survey ATS tri-party WMBA
EUR 63.4% 93.5% 75.0% 57.6%
GBP 11.3% 3.7% 3.2% 23.7%
USD 16.4% 1.4% 19.4% 13.2%
DKK, SEK 2.4% 0.0% 0.4% 0.6%
JPY 5.3% 0.7% 2.5%
CHF 0.1% 1.2% 0.1% 0.0%
etc 1.1% 0.1% 1.1% 2.4%
cross-currency 2.6% 15.0%

13ICMA European Repo Market Survey September 2015
CHAPTER 2: ANALYSIS OF SURVEY RESULTS
Collateral analysis (Q1.9)Table 2.8 – Collateral analysis
June 2015 December 2014 June 2014
Germany 19.4% 19.1% 19.1%
Italy 9.7% 10.5% 10.6%
France 11.3% 10.5% 10.9%
Belgium 3.2% 2.8% 2.9%
Spain 6.4% 6.5% 6.3%
other eurozone 6.2% 6.5% 7.3%
UK 12.1% 11.5% 10.6%
DKK, SEK 2.9% 3.3% 2.8%
international financial institutions
2.1% 2.2% 2.4%
US 4.6% 3.6% 2.6%
former Accession countries
0.4% 0.3% 0.4%
Japan 4.8% 8.6% 4.8%
other OECD 8.4% 6.5% 11.2%
other fixed income 7.8% 8.0% 8.1%
equity 0.7% 0.1% 0.1%
Figure 2.5 - Collateral analysis (main survey)
Another significant change in the latest survey was a drop in the share of all government bonds within the pool of EU-originated fixed-income collateral reported in the survey to 77.0% from 81.5% (EU bonds in total accounted for 71.5% of the survey). This change was driven by declines in the shares of German, Italian and Spanish government securities (to a combined 28.1% from 30.7% of the overall survey) and an increase in non-government bond and equity collateral (to 16.5% from 13.1% of the overall survey). Non-government collateral has to be traded through direct or voice-brokered repo, so this collateral shift may explain some of the rise in direct trading.
14ICMA European Repo Market Survey September 2015
CHAPTER 2: ANALYSIS OF SURVEY RESULTS
There was a sharp decline in Japanese collateral, back to 4.8% from a record 8.6%.
There was another increase in the share of US collateral, to 4.6% from 3.6%, and a sharp recovery in the share of other OECD collateral (which includes Swiss, Australian and Canadian securities) to 8.4% from 6.5%. Equity rose to 0.7% from 0.1% (but remains understated by the survey due to the fact that the survey tends to be completed in fixed-income divisions).
Data reported directly by ATS shows that there was a further shift in electronic trading out of some core eurozone government securities and into Italian and Spanish government securities. Thus, the shares of electronically-traded German and Dutch government securities fell to 21.8% and 3.4%, respectively, from 23.4% and 3.9%. On the other hand, the shares of electronically-traded Italian and Spanish government securities grew to 44.3% and 8.0%, respectively, from 43.1% and 6.7%. Activity in Italian government securities is now a major determinant of the size of electronic trading.
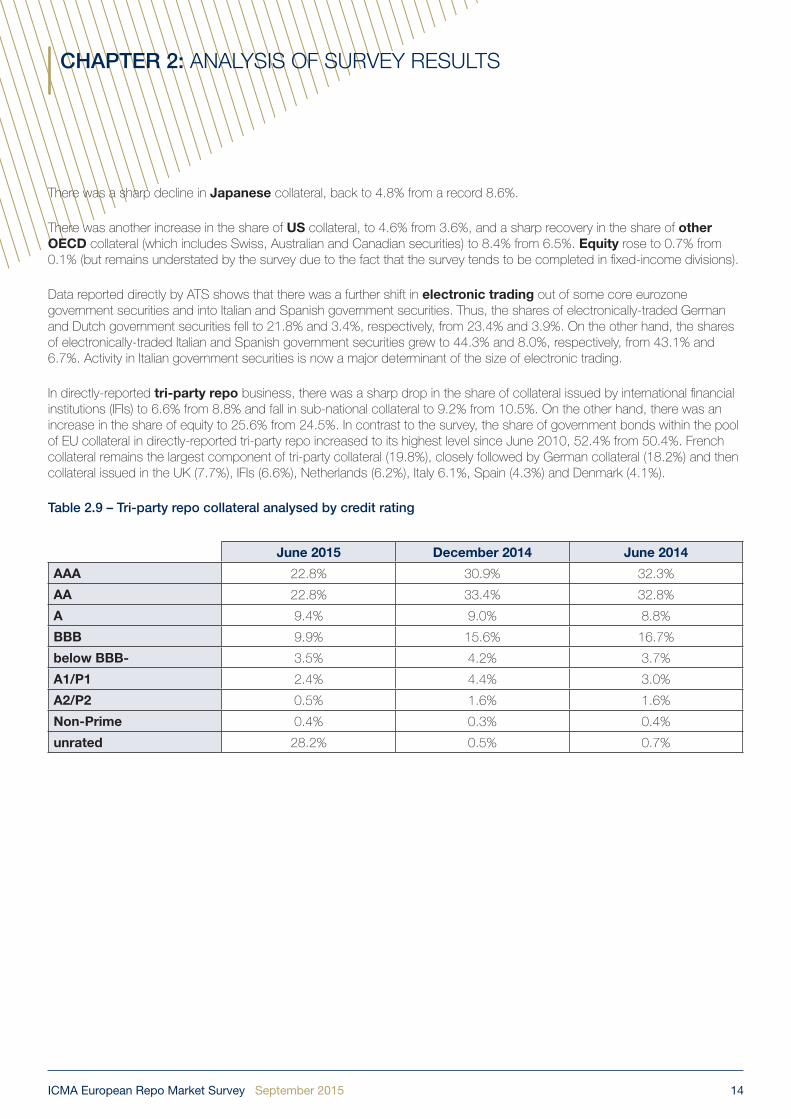
In directly-reported tri-party repo business, there was a sharp drop in the share of collateral issued by international financial institutions (IFIs) to 6.6% from 8.8% and fall in sub-national collateral to 9.2% from 10.5%. On the other hand, there was an increase in the share of equity to 25.6% from 24.5%. In contrast to the survey, the share of government bonds within the pool of EU collateral in directly-reported tri-party repo increased to its highest level since June 2010, 52.4% from 50.4%. French collateral remains the largest component of tri-party collateral (19.8%), closely followed by German collateral (18.2%) and then collateral issued in the UK (7.7%), IFIs (6.6%), Netherlands (6.2%), Italy 6.1%, Spain (4.3%) and Denmark (4.1%).
Table 2.9 – Tri-party repo collateral analysed by credit rating
June 2015 December 2014 June 2014
AAA 22.8% 30.9% 32.3%
AA 22.8% 33.4% 32.8%
A 9.4% 9.0% 8.8%
BBB 9.9% 15.6% 16.7%
below BBB- 3.5% 4.2% 3.7%
A1/P1 2.4% 4.4% 3.0%
A2/P2 0.5% 1.6% 1.6%
Non-Prime 0.4% 0.3% 0.4%
unrated 28.2% 0.5% 0.7%

15ICMA European Repo Market Survey September 2015
CHAPTER 2: ANALYSIS OF SURVEY RESULTS
Figure 2.6 - Collateral analysis (tri-party agents) by credit rating
The dramatic changes in the distribution of ratings across tri-party repo collateral (note the jump in unrated collateral) is a break in the series due to one of the tri-party agents providing ratings data for the first time. Adjusting for this discontinuity, there was a further shift from AAA and AA rated collateral to A and BBB, largely reflecting ratings downgrades.
Table 2.10 – Tri-party repo collateral analysed by type of asset
June 2015 December 2014 June 2014
government securities 40.3% 40.0% 39.2%
public agencies / sub-national governments 9.2% 10.5% 8.2%
supranational agencies 2.0% 2.3% 4.9%
corporate bonds 12.7% 12.9% 14.0%
covered bonds 7.1% 6.9% 8.1%
residential mortgage-backed 1.5% 1.2% 1.4%
commercial mortgage-backed 0.2% 0.2% 0.1%
other asset-backed 0.6% 0.8% 0.9%
CDO, CLN, CLO, etc 0.3% 0.2% 0.3%
convertible bonds 0.1% 0.1% 0.1%
equity 25.6% 24.5% 22.2%
other 0.5% 0.6% 0.7%

16ICMA European Repo Market Survey September 2015
CHAPTER 2: ANALYSIS OF SURVEY RESULTS
Figure 2.7 – Historic collateral analysis (tri-party agents) by credit rating
Figure 2.8 - Collateral analysis (tri-party agents) by type of asset

17ICMA European Repo Market Survey September 2015
CHAPTER 2: ANALYSIS OF SURVEY RESULTS
Figure 2.9 – Historic collateral analysis (tri-party agents) by type of asset
Table 2.11 – Tri-party repo collateral haircuts analysed by type of asset
(weighted average haircuts) June 2015 December 2014 June 2014
government securities 2.5% 2.4% 2.5%
public agencies / sub-national governments 2.3% 2.4% 2.3%
supranational agencies 4.2% 4.2% 2.5%
corporate bonds (financial) 6.6% 6.4% 5.9%
corporate bonds (non-financial) 6.3%
covered bonds 4.3% 4.7% 2.9%
residential mortgage-backed 11.2% 11.8% 10.3%
commercial mortgage-backed 8.1%
other asset-backed 5.9% 8.4% 7.0%
CDO, CLN, CLO, etc 7.0% 8.2% 6.3%
convertible bonds 11.7% 15.2% 17.0%
equity 6.0% 6.2% 6.4%
other 8.4% 7.6% 6.7%
Haircut data remain difficult to interpret given the heterogeneity of securities within each category.

18ICMA European Repo Market Survey September 2015
CHAPTER 2: ANALYSIS OF SURVEY RESULTS
Contract analysis (Q1.5)Figure 2.10 - Contract analysis
Table 2.12 – Contract comparison in June 2015
main survey ATS tri-party
repurchase agreements 84.0% 50.2% 100.0%
documented sell/buy-backs 15.0% 49.8%
undocumented sell/buy-backs
1.0%
The share of documented sell/buy-backs increased to 15.0% from 12.9%. Sell/buy-backs are characteristic of markets like Italy and Spain, and certain types of customer. But as the share of Italian and Spanish collateral decreased, and the survey is not able to measure customer business, it is not clear what has driven this development.
Repo rate analysis (Q1.6)Figure 2.11 - Repo rate analysis

19ICMA European Repo Market Survey September 2015
CHAPTER 2: ANALYSIS OF SURVEY RESULTS
Table 2.13 – Repo rate comparison in June 2015
main survey ATS tri-party
fixed rate 81.9% 87.1% 17.5%
floating rate 11.5% 12.9%
open 6.5% 82.4%
Floating-rate repo increased its share to 11.5% from 9.6%. It is characteristic of the French market. The increase in the use of French collateral to 11.3% from 10.6% may therefore be related but is not the whole explanation.
Maturity analysis (Q1.7)Table 2.14 – Maturity analysis
June 2015 December 2014 June 2014
1 day 20.2% 24.3% 23.9%
2 days to 1 week 20.1% 15.9% 18.3%
1 week to 1 month 19.9% 15.1% 18.1%
>1 month to 3 months 13.0% 19.0% 12.7%
>3 months to 6 months 5.3% 5.9% 4.4%
>6 months to 12 months 3.6% 3.1% 3.8%
>12 months 1.4% 1.5% 1.3%
forward-start 10.0% 9.3% 10.4%
open 6.5% 5.9% 7.2%
20ICMA European Repo Market Survey September 2015
CHAPTER 2: ANALYSIS OF SURVEY RESULTS
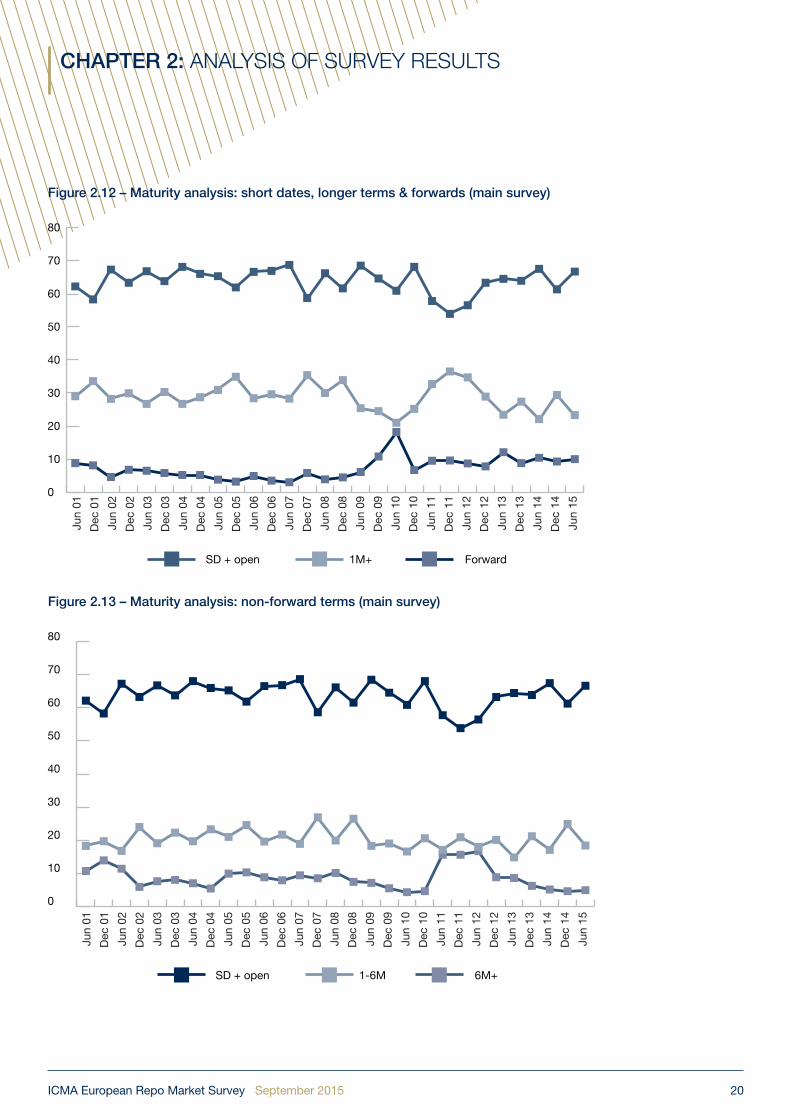
Figure 2.12 – Maturity analysis: short dates, longer terms & forwards (main survey)
Figure 2.13 – Maturity analysis: non-forward terms (main survey)

21ICMA European Repo Market Survey September 2015
CHAPTER 2: ANALYSIS OF SURVEY RESULTS
Figure 2.14 – Maturity analysis: breakdown of short dates plus open (main survey)
The changes in maturities seen in the December 2014 survey had been reversed by June 2015. The share of short-dated transactions recovered to 60.2% from 55.4%. Consequently, the weighted average term to maturity shortened to a range of 25-59 days from 27-63 days, compared with 24-57 days in June 2014 (the lower end of the range assumes that all transactions have the minimum term in each maturity band: the upper end assumes the maximum term). However, the rise in short dates disguised a sharp drop in transactions with only one day remaining to maturity.
Business shifted back into the short dates out of terms between one and three months. This reflected the usual seasonal pattern (a rise in these maturities in December surveys, as banks seek to lock in term funding over the year-end, which is unwound by June).
Both forward-start and open repos were buoyant, although they did not recover to the levels of June 2014.
The pattern of change in the maturity distribution of tri-party repo, as reported directly by tri-party agents, was similar to that in the survey.
Data provided directly by ATS showed that a reversal of the trend growth in electronic trading of the share of transactions with a remaining term of one day. This dropped to 82.8% from a record 87.0%. However, the share of transactions with two days to one week remaining to maturity and, in particular, one to three month increased to 13.0% from 11.3%. Electronic business also shifted into even longer dates (beyond three months), which grew to 1.9% from 0.6%.

22ICMA European Repo Market Survey September 2015
CHAPTER 2: ANALYSIS OF SURVEY RESULTS
Figure 2.15 – Maturity analysis (ATS)
Figure 2.16 – Maturity analysis (tri-party agents)

23ICMA European Repo Market Survey September 2015
CHAPTER 2: ANALYSIS OF SURVEY RESULTS
Figure 2.17 – Maturity analysis (voice-brokers)
Table 12.15 – Maturity comparison in June 2015
main survey ATS tri-party WMBA
open 6.5% 58.8% 1.7%
1 day 20.2% 82.8% 11.2% 1.5%
2 days to 1 week 20.1% 8.9% 4.5% 5.8%
1 week to 1 month 19.9% 4.1% 6.0% 12.0%
>1 month to 3 months 13.0% 2.4% 11.0% 17.2%
>3 months to 6 months 5.3% 1.0% 4.5% 4.3%
>6 months to 12 months 3.6% 0.6% 2.3% 5.1%
>12 months 1.4% 0.1% 1.8% 0.8%
forward-start 10.0% 0.2% 51.5%

24ICMA European Repo Market Survey September 2015
CHAPTER 2: ANALYSIS OF SURVEY RESULTS
Product analysis (Q2)The share of securities lending conducted on repo desks rose to 12.0% from 10.7%.
Figure 2.18 - Product analysis
Concentration analysisTable 2.16 – Concentration analysis
June 2015 December 2014 June 2014
top 10 57.0% 56.0% 57.4%
top 20 79.8% 80.6% 81.0%
top 30 90.9% 91.2% 91.9%
other 9.1% 8.8% 8.1%
Figure 2.19 - Concentration analysis
The increase in the concentration in business in the top 10 respondents reflects the very significant increases in the repo books of a few of the very largest banks.
Although the apparent degree of concentration of repo business appears high, this does not mean that the largest institutions

25ICMA European Repo Market Survey September 2015
CHAPTER 2: ANALYSIS OF SURVEY RESULTS
have commensurate market power. A better measure of market concentration - often used in competition analyses - is the Herfindahl Index.2 This index shows market concentration falling since 2011.
Table 2.17 – Herfindahl Index
index numbers in survey
December 2003 0.045 76
June 2004 0.040 81
December 2004 0.047 76
June 2005 0.043 81
December 2005 0.043 80
June 2006 0.042 79
December 2006 0.050 74
June 2007 0.041 76
December 2007 0.040 68
June 2008 0.044 61
December 2008 0.049 61
June 2009 0.051 61
December 2009 0.065 58
June 2010 0.105 57
December 2010 0.064 57
June 2011 0.074 58
December 2011 0.065 64
June 2012 0.062 62
December 2012 0.054 71
June 2013 0.046 65
December 2013 0.046 67
June 2014 0.046 65
December 2014 0.043 67
June 2015 0.044 65
2 The Herfindahl Index is the sum of the squares of market shares divided by the square of the sum of market shares. The higher the index, the lower the degree of competition. If the index is higher, the more a single institution has a dominant market share and/or the more insignificant the market shares of all the other survey participants. A market in which several institutions have very large market shares can therefore have a relatively low index

26ICMA European Repo Market Survey September 2015
CHAPTER 3: CONCLUSION
The trend in European repo activity is still essentially sideways. The growth measured in the latest survey was unexpected. However, this growth needs to be put into perspective. The increase in the ‘headline’ total was just 2.0% and the year-on-year change remained negative at -2.9% (in terms of a constant sample, the changes were +4.6% and -3.7%). Moreover, these are not significant changes. In addition, the survey needs to be assessed in terms of broader trends, given that it represents a snapshot of the market and may therefore be deflected from trend by temporary surges or collapses in activity. The market growth seen in the first half of 2015 also needs to be judged against the fact that the repo books of most survey respondents contracted again but was more than offset, in large part, by very significant increases in the repo books of a few of the very largest banks.
Nevertheless, it is a valid question to ask why these banks have apparently been able to buck the cumulative impact of restrictive new regulation, possible constraints imposed by quantitative easing and subdued underlying economic and financial conditions. This is especially the case since previous surveys have indicated that larger banks had cut back more than their smaller competitors.
Market participants suggest the reason is that the full impact of new regulation has yet to be felt and a lot of the response by banks to date has been anticipatory and therefore discretionary. Anecdotal evidence suggests that the pace at which banks in different countries are responding to regulatory changes has varied.
But even where banks are expanding their repo books, the survey points to a continuing readjustment in the underlying composition of business, probably in response to new regulation. In particular, directly-negotiated business continues to increase share, while government bond collateral has suffered a relative decline. As proposed in previous reports, these changes may be a sign of banks responding to leverage and liquidity regulations by allocating more of their balance sheets away from commoditized, short-term, electronically-traded, interdealer repos of government bonds, where margins are thinnest and banks are least able to recover increased transactions costs, and towards directly-negotiated, longer-term, sometimes customized transactions with end-users. The growth in open and forward-start repos, and the lengthening of maturities within short dates, are all consistent with such a migration of business. It is also possible that activity driven by the need for high-quality liquid assets (HQLA) to meet the Liquidity Coverage Ratio (LCR) has abated, at least temporarily, as banks have achieved their interim or even final targets.
The potentially negative impact of the shift in business on CCP-cleared business (which is largely also electronic and is limited to government bond collateral) may have been mitigated by banks’ appreciation of the regulatory benefits of multilateral netting and a lower regulatory counterparty risk weight, as well as by the use of post-trade reporting of transactions executed directly or via voice-brokers.

27ICMA European Repo Market Survey September 2015
ABOUT THE AUTHOR
This report was compiled by Richard Comotto, who is a Senior Visiting Fellow at the ICMA Centre at the University of Reading in England, where he is responsible for the FX and money markets module of the Centre’s postgraduate finance programme. He is also Course Director of the ICMA Professional Repo Market Course conducted in Europe and Asia in co-operation with the ACI and AFME/ASIFMA, and of the ICMA-ISLA GMRA-GMSLA Workshop.
The author acts as an independent consultant providing research, advice and training on the international money, securities and derivatives markets to professional market associations, government agencies, regulatory authorities, international financial institutions, banks, brokers and financial information services.
The author has written a number of books and articles on a range of financial topics, including the foreign exchange and money markets, swaps and electronic trading systems. He takes particular interest in the impact of electronic trading systems on the bond and repo markets. Following the financial crisis, he has been advising the ICMA’s European Repo Council on regulatory initiatives and has produced a series of papers: in July 2010, a ‘White paper on the operation of the European repo market, the role of short-selling, the problem of settlement failures and the need for reform of the market infrastructure’; in September 2011, ‘Interconnectivity of central and commercial bank money in the clearing and settlement of the European repo market’; in February 2012, ‘Haircuts and Initial Margins in the Repo Market’; in March 2012, ‘Shadow Banking and Repo’; and in ‘Collateral damage: the impact of the Financial Transaction Tax on the European repo market’ in April 2013.
The author served for ten years at the Bank of England, within its Foreign Exchange Division and on secondment to the International Monetary Fund in Washington DC.

28ICMA European Repo Market Survey September 2015
APPENDIX A: SURVEY GUIDANCE NOTES
The following extract is based on the Guidance notes issued to participants in conjunction with the survey that took place on Wednesday, June 10, 2015
The data required by this survey are: the total value of the repos and reverse repos booked by your repo desk that are still outstanding at close of business on Wednesday, June 10, 2015, and various breakdowns of these amounts.
Branches of your bank in other countries in Europe may be asked to complete separate returns. If your repo transactions are booked at another branch, please forward the survey form to that branch. If branches of your bank in other countries run their own repo books, please copy the survey form to these branches, so that they can also participate in the survey. Please feel free to copy the survey form to other banks, if you discover that they have not received it directly.
Guidance NotesGeneral guidancea) Please fill in as much of the form as possible. For each question that you answer, you will receive back your ranking in
that category.
b) If your institution does not transact a certain type of repo business, please enter ‘N/A’ in the relevant fields. On the other hand, if your institution does that type of business but is not providing the data requested by the survey, please do not enter anything into the relevant field. If your institution does that type of business but has no transactions outstanding, please enter zero into the relevant field.
c) You only need to give figures to the nearest million. However, if you give figures with decimal points, please use full stops as the symbols for the decimal points, not commas. For nil returns, please use zeros, not dashes or text.
d) Please do not re-format the survey form, ie change its lay-out, and do not leave formulae in the cells of the underlying spreadsheet.
e) Include all repurchase agreements (classic repos), sell/buy-backs and similar types of transaction (e.g. pensions livrées). There is a separate question (see question 2) on securities lending and borrowing transactions (including securities lending and borrowing against cash collateral).
f) Exclude repo transactions undertaken with central banks as part of their official money market operations. Other repo transactions with central banks, e.g. as part of their reserve management operations, should be included.
g) Give the value of the cash which is due to be repaid on all repo and reverse repo contracts (not the market value or nominal value of the collateral) that are still outstanding at close of business on Wednesday, June 10, 2015. This means the value of transactions at their repurchase prices.
h) “Outstanding” means repos and reverse repos with a repurchase date, or which will roll over, on or after Thursday, June 11, 2015. You should include all open repos and reverse repos that have been rolled over from Wednesday, June 10, 2015, to a later date and all forward-forward repos and reverse repos that are still outstanding at close on Wednesday, June 10, 2015.
i) Give separate totals for (a) repos plus sell/buy-backs and (b) reverse repos plus buy/sell-backs.
j) The survey seeks to measure the value of repos and reverse repos on a transaction date basis, rather than a purchase date basis. This means that you should include all repo and reverse repo contracts that have been agreed before close of business on Wednesday, June 10, 2015, even if their purchase dates are later.
k) Give gross figures, i.e. do not net opposite transactions with the same counterparty. If this is not possible, please indicate that your figures are net.
l) In the case of equity repo, for synthetic structures, please give the value of the cash payment.

29ICMA European Repo Market Survey September 2015
APPENDIX A: SURVEY GUIDANCE NOTES
Guidance on specific questions in the survey form
1.1 Transactions (1.1.1) direct with counterparties or (1.1.2) through voice-brokers should exclude all repos transacted over an ATS (see below). These should be recorded under (1.1.3).
(1.1.2) Transactions through voice-brokers should be broken down in terms of the location of the counterparties, rather than the location of the voice-brokers.
(1.1.3) “ATSs” are automatic trading systems (e.g. BrokerTec, Eurex Repo and MTS, but not voice-assisted electronic systems such as e-speed and GFInet). Transactions through voice-assisted systems should be included in (1.1.2). Anonymous transactions through an ATS with a central counterparty (e.g. CC&G, LIFFE-Clearnet, MEFF and Eurex Clearing) should be recorded in (1.1.3.4) and (1.1.3.5). GC financing systems in (1.1.3.4) are those ATS that are connected to a CCP and a tri-party repo service. Examples include Eurex Euro GC Pooling and LCH-Clearnet’s €GC Plus basket traded on Brokertec and MTS. They do not include GC basket trading on ATS. This activity may be cleared across a CCP but does not involve a tri-party service, and should be recorded in (1.1.3.5).
1.2 This item includes all the transactions recorded in (1.1.3) plus any transactions executed directly with counterparties and via voice-brokers which are then registered with and cleared through a central counterparty.
1.5 “Repurchase agreements” (also known as “classic repos”) include transactions documented under the Global Master Repurchase Agreement (GMRA) 1995, the Global Master Repurchase Agreement (GMRA) 2000 or the Global Master Repurchase Agreement (GMRA) 2011 without reference to the Buy/Sell-Back Annexes, and transactions documented under other master agreements. “Sell/buy-backs” are therefore taken to include all transactions that are not documented. Repurchase agreements include pensions livrées. Repurchase agreements are characterised by the immediate payment by the buyer to the seller of a manufactured or substitute payment upon receipt by the buyer of a coupon on the collateral held by the buyer. If a coupon is paid on collateral during the term of a sell/buy-back, the buyer does not make an immediate manufactured or substitute payment to the seller, but reinvests the coupon until the repurchase date of the sell/buy-back and deducts the manufactured or substitute payment (plus reinvestment income) from the repurchase price due to be received from the seller. Sell/buy-backs may be quoted in terms of a forward price rather than a repo rate. Where sell/buy-backs are documented (e.g. under the Buy/Sell-Back Annexes to the GMRA 1995, GMRA 2000 or GMRA 2011), periodic adjustments to the relative amounts of collateral or cash - which, for a repurchase agreement, would be performed by margin maintenance transfers or payments - are likely to be made by early termination and adjustment or re-pricing. All open repos are likely to be repurchase agreements.
1.6 Open repos are defined for the purposes of this survey as contracts that have no fixed repurchase date when negotiated but are terminable on demand by either counterparty. This item should be equal to item (1.6.3). Open repos should, in theory, be floating-rate, but in practice are often re-fixed irregularly, so are being treated separately from floating-rate repo (1.6.2).
1.7 This section asks for the remaining term to maturity (not the original term to maturity) of repos to be broken down as follows:
(1.7.1.1) 1 day – this means:
• all contracts transacted prior to Wednesday, June 10, 2015, with a repurchase date on Thursday, June 11, 2015;
• overnight, tom/next, spot/next and corporate/next contracts transacted on Wednesday, June 10, 2015.
(1.7.1.2) 2–7 days – this means:
• all contracts transacted prior to Wednesday, June 10, 2015, with a repurchase date on Friday, June 12, 2015, or any day thereafter up to and including Wednesday, June 17, 2015;
• contracts transacted on Wednesday, June 10, 2015, with an original repurchase date on Friday, June 12, 2015, or any day thereafter up to and including Wednesday, June 17, 2015 (irrespective of the purchase date, which will vary).
30ICMA European Repo Market Survey September 2015
APPENDIX A: SURVEY GUIDANCE NOTES
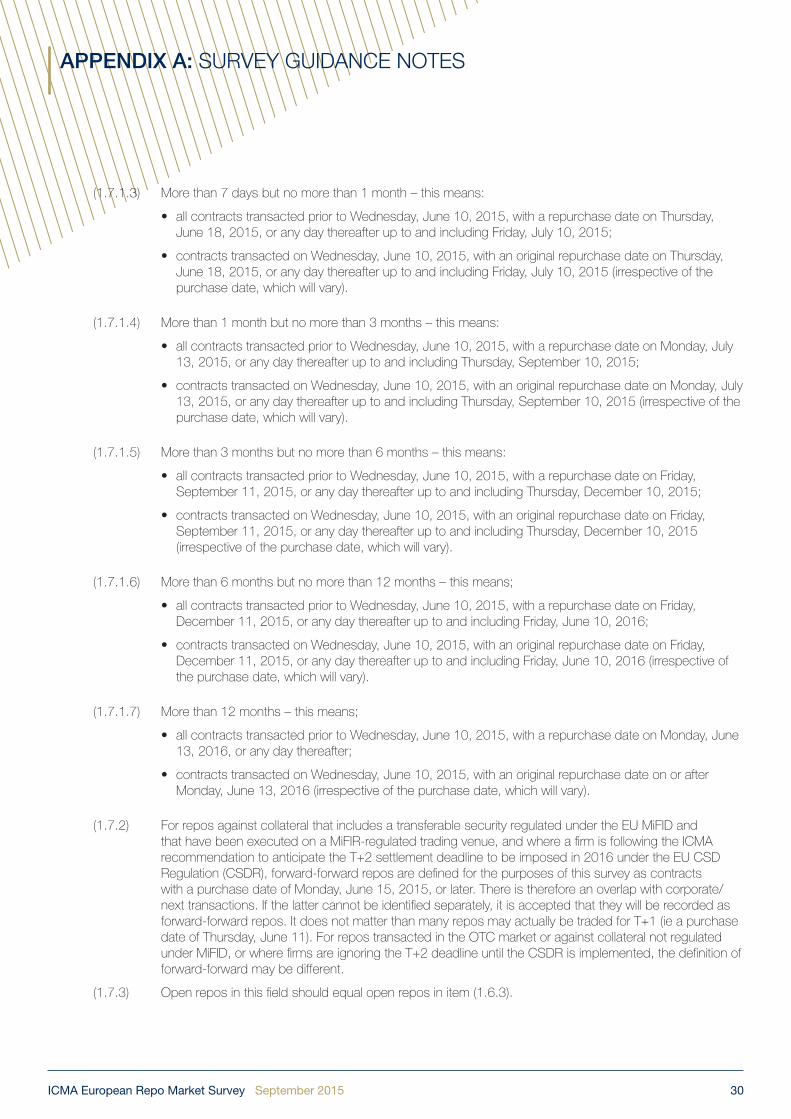
(1.7.1.3) More than 7 days but no more than 1 month – this means:
• all contracts transacted prior to Wednesday, June 10, 2015, with a repurchase date on Thursday, June 18, 2015, or any day thereafter up to and including Friday, July 10, 2015;
• contracts transacted on Wednesday, June 10, 2015, with an original repurchase date on Thursday, June 18, 2015, or any day thereafter up to and including Friday, July 10, 2015 (irrespective of the purchase date, which will vary).
(1.7.1.4) More than 1 month but no more than 3 months – this means:
• all contracts transacted prior to Wednesday, June 10, 2015, with a repurchase date on Monday, July 13, 2015, or any day thereafter up to and including Thursday, September 10, 2015;
• contracts transacted on Wednesday, June 10, 2015, with an original repurchase date on Monday, July 13, 2015, or any day thereafter up to and including Thursday, September 10, 2015 (irrespective of the purchase date, which will vary).
(1.7.1.5) More than 3 months but no more than 6 months – this means:
• all contracts transacted prior to Wednesday, June 10, 2015, with a repurchase date on Friday, September 11, 2015, or any day thereafter up to and including Thursday, December 10, 2015;
• contracts transacted on Wednesday, June 10, 2015, with an original repurchase date on Friday, September 11, 2015, or any day thereafter up to and including Thursday, December 10, 2015 (irrespective of the purchase date, which will vary).
(1.7.1.6) More than 6 months but no more than 12 months – this means;
• all contracts transacted prior to Wednesday, June 10, 2015, with a repurchase date on Friday, December 11, 2015, or any day thereafter up to and including Friday, June 10, 2016;
• contracts transacted on Wednesday, June 10, 2015, with an original repurchase date on Friday, December 11, 2015, or any day thereafter up to and including Friday, June 10, 2016 (irrespective of the purchase date, which will vary).
(1.7.1.7) More than 12 months – this means;
• all contracts transacted prior to Wednesday, June 10, 2015, with a repurchase date on Monday, June 13, 2016, or any day thereafter;
• contracts transacted on Wednesday, June 10, 2015, with an original repurchase date on or after Monday, June 13, 2016 (irrespective of the purchase date, which will vary).
(1.7.2) For repos against collateral that includes a transferable security regulated under the EU MiFID and that have been executed on a MiFIR-regulated trading venue, and where a firm is following the ICMA recommendation to anticipate the T+2 settlement deadline to be imposed in 2016 under the EU CSD Regulation (CSDR), forward-forward repos are defined for the purposes of this survey as contracts with a purchase date of Monday, June 15, 2015, or later. There is therefore an overlap with corporate/next transactions. If the latter cannot be identified separately, it is accepted that they will be recorded as forward-forward repos. It does not matter than many repos may actually be traded for T+1 (ie a purchase date of Thursday, June 11). For repos transacted in the OTC market or against collateral not regulated under MiFID, or where firms are ignoring the T+2 deadline until the CSDR is implemented, the definition of forward-forward may be different.
(1.7.3) Open repos in this field should equal open repos in item (1.6.3).

31ICMA European Repo Market Survey September 2015
APPENDIX A: SURVEY GUIDANCE NOTES
1.8 Please confirm whether the transactions recorded in the various questions in (1.6 and 1.7) include your tri-party repo business. Some institutions do not consolidate their tri-party repo transactions with their direct or voice-brokered business because of delays in receiving reports from tri-party agents or the complexity of their tri-party business.
1.9 Eurobonds should be included as fixed income securities issued “by other issuers” in the countries in which the bonds are issued. This will typically be Luxembourg (1.9.10) and the UK (1.9.15). Equity collateral should be recorded in (1.9.35).
(1.9.28) “Official international financial institutions, including multilateral development banks” include:
African Development Bank (AfDB)
Asian Development Bank (AsDB)
Caribbean Development Bank (CDB)
Central American Bank for Economic Integration (CABEI)
Corporacion Andina de Fomento (CAF)
East African Development Bank (EADB)
European Bank for Reconstruction and Development (EBRD)
European Commission (EC)/European Financial Stability Mechanism (EFSM)
European Financial Stability Facility (EFSF)
European Investment Bank (EIB)
European Stabilisation Mechanism (ESM)
Inter-American Development Bank Group (IADB)
International Fund for Agricultural Development (IFAD)
Islamic Development Bank (IDB)
Nordic Development Fund (NDF)
Nordic Investment Bank (NIB)
OPEC Fund for International Development (OPEC Fund)
West African Development Bank (BOAD)
World Bank Group (IBRD and IFC)
(1.9.29) “US in the form of fixed income securities but settled across Euroclear or Clearstream” means only domestic and Yankee bonds. This includes Reg.144a bonds, but excludes Eurodollar and US dollar global bonds, which should be treated as bonds issued “by other issuers” in the countries in which the bonds were issued. This will typically be Luxembourg (1.9.10) and the UK (1.9.15).
(1.9.31) “Other OECD countries” are Australia, Canada, Chile, Iceland, Israel, Korea, Mexico, New Zealand, Norway, Switzerland, Turkey and the US. In the case of collateral issued in the US, only collateral settled across the domestic US settlement system should be included in (1.9.31). US-originated collateral settled across Euroclear and Clearstream Luxembourg should be recorded in (1.9.29).
(1.9.32) “Other non-OECD European, Middle Eastern & African countries” should exclude any EU countries, specifically, Bulgaria (1.9.16), Cyprus (1.9.17), Latvia (1.9.21), Lithuania (1.9.22), Malta (1.9.23) and Romania (1.9.25).
(1.9.35) “Equity” includes ordinary shares, preference shares and equity-linked debt such as convertible bonds.
2 “Total value of securities loaned and borrowed by your repo desk” includes the lending and borrowing of securities with either cash or securities collateral. Exclude any securities lending and borrowing done by desks other than your repo desk. If your repo desk does not do any securities lending and borrowing, this line will be a nil return.

32ICMA European Repo Market Survey September 2015
APPENDIX A: SURVEY GUIDANCE NOTES
3 “Active” means about once a week or more often.
For further help and informationIf, having read the Guidance Notes, you have any further queries, please e-mail the ICMA Centre at [email protected] or contact one of the following members of the ERC Steering Committee:
German speakers
Eduard Cia HVB +49 89 378 14172 [email protected]
English speakers
Andy Wise Morgan Stanley +44 207 677 9409 [email protected]
French speakers
Godfried de Vidts ICAP +44 20 7000 5803 [email protected]
Italian speakers
Andrea Masciovecchio Intesa San Paolo +39 02 854 09042 [email protected]
This survey is being conducted by the ICMA Centre, University of Reading, UK, at the request of ICMA’s European Repo Council (ERC).

33ICMA European Repo Market Survey September 2015
APPENDIX B: SURVEY PARTICIPANTS
The participants in previous repo surveys are listed below. Company names provided here are as supplied by those involved in producing the survey. Names of ICMA member firms may not, therefore, precisely reflect the manner in which they are published in ICMA’s Members’ Register.
List of respondents Dec 05
Jun 06
Dec 06
Jun 07
Dec 07
Jun 08
Dec 08
Jun 09
Dec 09
Jun 10
Dec 10
Jun 11
Dec 11
Jun 12
Dec 12
Jun 13
Dec 13
Jun 14
Dec 14
Jun 15
ABN Amro Bank x x x x x x x x x x x x x x x x
Allied Irish Banks x x x x x x x x x x x x x x x x x
AXA Bank Europe x x x x x x x x x x x x x x x x
Banc Sabadell x x x x x x x
Banca d'Intermediazione Mobiliare (IMI) x x x x
Banca Monte dei Paschi di Siena x x x x x x x x x x x x x x x x x x x x
Banco BPI x x x x
Banco Nazional del Lavoro x x
Banco Santander x x x x x x x x x x x x x x x x x x x x
Bank Austria (also known as UniCredit Bank Austria)
x x x x x x x x x x
Bank fuer Arbeit und Wirtschaft und Oesterreichische Postsparkasse (Bawag)
x x x x x x x x x x x x x x x x x x x
Bank of America (merged to become Bank of America Merrill Lynch)
x x x
Bank of Ireland x x x x x x x x x x x x x x x x
Bank Przemyslowo-Handlowy SA x x x x x x x x x x
Landesbank Berlin x x x x x x x x x x x x x x x
Banque de Luxembourg x x x x x x x x x x x x x x x x x x x x
Banque et Caisse d'Epargne de l'Etat x x x x x x x x x x x x x x x x x x x x
Barclays Capital x x x x x x x x x x x x x x x x x x x x
Bayerische Landesbank x x x x x x x x x x x x x x x x x x x x
BBVA x x x x x x x x x x x x x x x x x x
BHF-Bank x x x x x x x x x x x x x x x x
BHF-Bank International x x x x x x x x x x x x x x
BNP Paribas x x x x x x x x x x x x x x x x x x x
Bundesrepublik Deutschland Finanzagentur
x x x x x x x x x x x x x x x x x x
Caixa Bank x x x x x x x x
Caixa d'Estalvis de Catalunya x x x x x x x x x x x x x x x
Bankia SA (formerly Caja de Ahorros y Monte de Piedad de Madrid (Caja Madrid))
x x x x x x x x x x x x x x x x x x x x
CA-CIB (formerly Calyon) x x x x x x x x x x x x x x x x x x x x
Capitalia x x
NATIXIS Zweigniederlassung Deutschland x x x x x
Citigroup Global Markets Ltd x x x x x x x x x x x x x x x x x x x x

34ICMA European Repo Market Survey September 2015
APPENDIX B: SURVEY PARTICIPANTS
List of respondents Dec 05
Jun 06
Dec 06
Jun 07
Dec 07
Jun 08
Dec 08
Jun 09
Dec 09
Jun 10
Dec 10
Jun 11
Dec 11
Jun 12
Dec 12
Jun 13
Dec 13
Jun 14
Dec 14
Jun 15
Commerzbank x x x x x x x x x x x x x x x x x x x x
Canadian Imperial Bank of Commerce and Credit (CIBC)
x x x x x x x x x x
Confederación Española de Cajas de Ahorros (CECA)
x x x x x x x x x x x x x x x x x x x x
Credit Suisse Securities (Europe) Ltd x x x x x x x x x x x x x x x x x x x x
Danske Bank x x x x x x x x x x x x x x x x x x
Daiwa Securities SMBC Europe x x x x x x x x x x x x x x x x x x x x
Dekabank Deutsche Girozentrale x x x x x x x
DePfa ACS x x x x x
Deutsche Bank x x x x x x x x x x x x x x x x x x x x
Deutsche Postbank x x x x x x x x x x x x x x x x x x x x
Belfius Bank (formerly Dexia) x x x x x x x x x x x x x x x x x x x x
Dexia BIL x x x x
Dexia Kommunal Bank Deutschland x x x x x x x x x x x x x
Dresdner Bank x x x x x x x
DZ Bank x x x x x x x x x x x x x x x x x x x x
EFG Eurobank Ergasias x x x x x x x x x x x x x x x x x x
Erste Bank der Oesterreichischen Sparkassen
x x x x x x x x x x x x x x x x x x x x
Euroclear Bank x x x x x x x x x x x x x x x x x x x x
Eurohypo x x x
Hypothekenbank Frankfurt International (formerly Eurohypo Europäische Hypothekenbank)
x x x x x x x x x x x x x x x x
Fortis Bank x x x x x x x x x x x x x x x x x x x x
Goldman Sachs x x x x x x x x x x x x x x x x x x x x
Halifax Bank of Scotland x x
HSBC x x x x x x x x x x x x x x x
HSBC France x x x x x x x x x
Bayerische Hypo-und-Vereinsbank x x x x x x x x x x x x x x x x x x x x
ING Bank x x x x x x x x x x x x x x x x x x x
ING Belgium x x x
Intesa SanPaolo x x x x x x x x x x x x x x x x x x x
Jefferies International Ltd x x x x x x x
JP Morgan x x x x x x x x x x x x x x x x x x x x
Jyske Bank x
KBC x x x x x x x x x x x x x x x x
KfW x x x x x x x x x x x x x

35ICMA European Repo Market Survey September 2015
APPENDIX B: SURVEY PARTICIPANTS
List of respondents Dec 05
Jun 06
Dec 06
Jun 07
Dec 07
Jun 08
Dec 08
Jun 09
Dec 09
Jun 10
Dec 10
Jun 11
Dec 11
Jun 12
Dec 12
Jun 13
Dec 13
Jun 14
Dec 14
Jun 15
Kingdom of Belgium Federal Public Service Debt Agency
x x x x x x x x x x x x x x x x x x x x
Landesbank Baden-Württemberg, Stuttgart
x x x x x x x x x x x x x x x x x x x x
Landesbank Hessen-Thüringen -Girozentrale (Helaba)
x x x x x x x x x x x x x x x x x x x
Landesbank Rheinland Pfalz x x x x
Landesbank Sachsen Girozentrale x x x x
Lehman Brothers x x x x x x
Macquarie Bank x x x x x x x x x
Bank of America Merrill Lynch x x x x x x x x x x x x x x x x x x x
Mitsubishi Securities International x x x x x x x x x x x x x x
Mizuho International x x x x x x x x x x x x x x x x x x x
Morgan Stanley x x x x x x x x x x x x x x x x x x x x
National Bank of Greece x x x x x x
Newedge x x x
Nomura International x x x x x x x x x x x x x x x x x x x x
Norddeutsche Landesbank Girozentrale x x x x x x x x x x x x
Nordea Markets x x x x x x x x x x x x x x x x x x x x
Norinchukin Bank x x x x x x x x x x x x x x x x x
Nova Ljubljanska Banka d.d. x x x x x x x x x x x x
Rabobank x x x x x x x x x x x x x x x x x x x x
Royal Bank of Canada x x x x x
Royal Bank of Scotland x x x x x x x x x x x x x x x x x x x
RBI x x x x x x x x x x
Sal. Oppenheim Jr. x
Sampo Bank x x
Société Générale x x x x x x x x x x x x x x x x x x x x
Toronto Dominion Bank x x x x
UBS x x x x x x x x x x x x x x x x x x x x
Ulster Bank x x
UniCredit/Bayerische Hypo-un-Vereinsbank Milano Branch
x x x x x x x x x x x x x x x x x x x x
Westdeutsche Landesbank Girozentrale x x x x x x x x
Zagrabacka Banka x x x
entry 6 5 3 8 3 1 6 7 2 5 3 5 10 5 9 8 4 2 4 0
exit 7 6 8 6 11 8 6 7 5 6 3 4 4 7 0 2 2 4 2 2
80 79 74 76 68 61 61 61 58 57 57 58 64 62 71 65 67 65 67 65

36ICMA European Repo Market Survey September 2015
APPENDIX C: SUMMARY OF SURVEY RESULTS
Jun 11 Jun 12 Jun 13 Jun 14 Dec 14 Jun 15
Q1 What are the total gross values of cash due to be repaid by you and repaid to you on repo transactions maturing after survey date? (figures in EUR billions)
6,124 5,647 6,076 5,782 5,500 5,612
Of the amounts given in response to question (1) above:
1.1 How much was transacted:
direct with counterparties
• in the same country as you 17.1% 14.5% 16.8% 14.4% 14.7% 14.2%
• cross-border in (other) eurozone countries 10.6% 11.6% 12.1% 12.4% 11.3% 13.8%
• cross-border in non-eurozone countries 24.5% 22.5% 23.4% 26.5% 28.9% 29.6%
through voice-brokers
• in the same country as you 11.3% 10.3% 7.4% 6.9% 6.3% 5.1%
• cross-border in (other) eurozone countries 3.9% 3.6% 4.1% 3.5% 3.5% 3.2%
• cross-border in non-eurozone countries 4.3% 4.4% 3.1% 3.6% 3.8% 3.5%
on ATSs with counterparties
• in the same country as you 4.7% 6.7% 6.5% 3.9% 3.7% 4.1%
• cross-border in (other) eurozone countries 3.5% 3.9% 2.6% 3.3% 2.3% 4.2%
• cross border-border in non-eurozone countries
2.7% 3.6% 2.8% 1.6% 1.4% 1.0%
• anonymously across a GC financing system 5.8% 5.6% 4.1%
• anonymously across a central clearing counterparty but not GC financing
17.4% 18.8% 21.1% 18.3% 18.5% 17.2%
total through a central clearing counterparty 30.5% 35.0% 25.9% 32.1% 27.4% 27.2%
1.2 How much of the cash is denominated in:
• EUR 63.5% 57.0% 64.8% 65.7% 63.6% 63.4%
• GBP 10.3% 15.8% 10.6% 10.5% 10.9% 11.3%
• USD 16.2% 19.4% 15.2% 14.5% 15.1% 16.4%
• SEK, DKK 2.0% 2.8% 2.5% 2.4% 2.9% 2.4%
• JPY 6.4% 3.6% 4.9% 5.4% 6.3% 5.3%
• CHF 0.2% 0.3% 0.2% 0.1% 0.1% 0.1%
• other currencies 1.4% 1.2% 1.8% 1.3% 1.1% 1.1%

37ICMA European Repo Market Survey September 2015
APPENDIX C: SUMMARY OF SURVEY RESULTS
Jun 11 Jun 12 Jun 13 Jun 14 Dec 14 Jun 15
1.3 How much is cross-currency? 5.4% 1.5% 3.1% 1.8% 2.1% 2.6%
1.4 How much is:
• classic repo 85.1% 84.0% 87.6% 85.4% 85.0% 84.0%
• documented sell/buy-backs 13.0% 13.3% 10.7% 13.7% 12.9% 15.0%
• undocumented sell/buy-backs 1.9% 2.7% 1.8% 0.9% 2.1% 1.0%
1.5 How much is:
• fixed rate 85.1% 84.0% 87.6% 85.4% 85.0% 84.0%
• floating rate 13.0% 13.3% 10.7% 13.7% 12.9% 15.0%
• open 1.9% 2.7% 1.8% 0.9% 2.1% 1.0%
1.6 How much fixed and floating rate repo is (1.6.1) for value before (survey date) and has a remaining term to maturity of:
• 1 day 16.2% 17.5% 18.2% 20.9% 24.3% 20.2%
• 2-7days 16.2% 15.1% 15.2% 16.8% 15.9% 20.1%
• more than 7 days but no more than 1 month 18.4% 17.3% 23.8% 22.6% 15.1% 19.9%
• more than 1 month but no more than 3 months
12.7% 12.8% 10.7% 11.7% 19.0% 13.0%
• more than 3 months but no more than 6 months
4.4% 5.2% 4.1% 4.1% 5.9% 5.3%
• more than 6 months 6.9% 3.4% 4.5% 3.6% 3.1% 3.6%
• more than 12 months 8.7% 13.3% 4.1% 2.8% 1.5% 1.4%
• forward-forward repos 9.5% 8.7% 12.1% 10.4% 9.3% 10.0%
• open 6.9% 6.6% 7.3% 7.2% 5.9% 6.5%
1.7 How much is tri-party repo: 12.2% 11.5% 9.6% 10.2% 10.5% 9.3%
• for fixed terms to maturity 87.8% 91.6% 94.8% 93.4% 97.4% 99.2%
• on an open basis 11.2% 6.3% 5.2% 6.6% 2.6% 8.2%
1.8 How much is against collateral issued in:
Austria
• by the central government 0.8% 1.1% 1.0% 0.9% 0.9% 0.9%
• by other issuers 0.2% 0.1% 0.1% 0.1% 0.1% 0.1%

38ICMA European Repo Market Survey September 2015
APPENDIX C: SUMMARY OF SURVEY RESULTS
Jun 11 Jun 12 Jun 13 Jun 14 Dec 14 Jun 15
Belgium
• by the central government 2.1% 3.1% 2.7% 2.2% 2.1% 2.2%
• by other issuers 0.2% 0.7% 0.7% 0.7% 0.7% 1.1%
Denmark
• by the central government 0.4% 0.6% 0.5% 0.5% 0.5% 0.5%
• by other issuers 0.6% 0.7% 0.8% 0.8% 1.1% 0.9%
Finland
• by the central government 0.4% 0.5% 0.5% 0.6% 0.5% 0.5%
• by other issuers 0.1% 0.0% 0.0% 0.0% 0.0% 0.1%
France
• by the central government 7.2% 7.3% 10.3% 9.5% 9.3% 9.4%
• by other issuers 2.6% 1.3% 1.4% 1.3% 1.3% 1.9%
Germany
• by the central government 16.6% 14.2% 16.6% 14.2% 15.4% 14.8%
• pfandbrief 1.2% 1.0% 0.7% 0.5% 0.8% 0.6%
• by other issuers 4.6% 5.5% 4.6% 4.4% 3.0% 3.9%
Greece
• by the central government 0.3% 0.1% 0.0% 0.1% 0.1% 0.0%
• by other issuers 0.0% 0.0% 0.0% 0.1% 0.0% 0.0%
Ireland
• by the central government 0.1% 0.1% 0.4% 0.4% 0.4% 0.4%
• by other issuers 0.2% 0.1% 0.7% 0.2% 0.4% 0.5%
Italy
• by the central government 9.2% 7.8% 7.8% 9.9% 9.8% 8.6%
• by other issuers 0.8% 0.5% 0.4% 0.7% 0.6% 1.1%
Luxembourg
• by the central government 0.0% 0.3% 0.1% 0.1% 0.1% 0.1%
• by other issuers 0.4% 0.8% 1.3% 1.5% 1.2% 0.4%
Netherlands
• by the central government 1.5% 2.6% 2.7% 2.1% 1.7% 1.7%
• by other issuers 0.7% 0.9% 0.9% 0.7% 0.6% 0.8%

39ICMA European Repo Market Survey September 2015
APPENDIX C: SUMMARY OF SURVEY RESULTS
Jun 11 Jun 12 Jun 13 Jun 14 Dec 14 Jun 15
Portugal
• by the central government 0.4% 0.1% 0.2% 0.4% 0.4% 0.5%
• by other issuers 1.3% 0.0% 0.0% 0.1% 0.1% 0.1%
Spain
• by the central government 5.4% 4.3% 4.0% 5.2% 5.6% 4.7%
• by other issuers 1.7% 0.7% 0.6% 1.1% 0.9% 1.7%
Sweden
• by the central government 0.9% 0.9% 0.8% 0.7% 0.8% 0.8%
• by other issuers 0.5% 0.7% 0.7% 0.8% 0.8% 0.7%
UK
• by the central government 7.2% 12.8% 10.5% 9.1% 10.0% 9.7%
• by other issuers 3.8% 2.2% 1.5% 1.5% 1.5% 2.4%
• US but settled across EOC/CS 2.4% 3.3% 2.6% 2.6% 3.6% 4.6%
other countries
Bulgaria
• by the central government 0.0% 0.4% 0.0% 0.0% 0.0% 0.1%
• by other issuers 0.0% 0.0% 0.0% 0.0% 0.0% 0.0%
Cyprus
• by the central government 0.0% 0.0% 0.0% 0.0% 0.0% 0.0%
• by other issuers 0.0% 0.0% 0.0% 0.0% 0.0% 0.0%
Czech Republic
• by the central government 0.0% 0.0% 0.0% 0.0% 0.0% 0.0%
• by other issuers 0.0% 0.0% 0.0% 0.0% 0.0% 0.0%
Estonia
• by the central government 0.0% 0.0% 0.0% 0.0% 0.0% 0.0%
• by other issuers 0.0% 0.0% 0.0% 0.0% 0.0% 0.0%
Hungary
• by the central government 0.3% 0.0% 0.1% 0.1% 0.1% 0.0%
• by other issuers 0.0% 0.0% 0.0% 0.0% 0.0% 0.0%
Latvia
• by the central government 0.0% 0.0% 0.0% 0.0% 0.0% 0.0%

40ICMA European Repo Market Survey September 2015
APPENDIX C: SUMMARY OF SURVEY RESULTS
Jun 11 Jun 12 Jun 13 Jun 14 Dec 14 Jun 15
• by other issuers 0.0% 0.0% 0.0% 0.0% 0.0% 0.0%
Lithuania
• by the central government 0.0% 0.0% 0.0% 0.0% 0.0% 0.0%
• by other issuers 0.0% 0.0% 0.0% 0.0% 0.0% 0.0%
Malta
• by the central government 0.0% 0.0% 0.0% 0.0% 0.0% 0.0%
• by other issuers 0.0% 0.0% 0.0% 0.0% 0.0% 0.0%
Poland
• by the central government 0.2% 0.2% 0.2% 0.2% 0.2% 0.1%
• by other issuers 0.0% 0.0% 0.0% 0.0% 0.0% 0.0%
Romania
• by the central government 0.0% 0.0% 0.0% 0.0% 0.0% 0.0%
• by other issuers 0.0% 0.0% 0.0% 0.0% 0.0% 0.0%
Slovak Republic
• by the central government 0.0% 0.0% 0.0% 0.0% 0.0% 0.0%
• by other issuers 0.0% 0.0% 0.0% 0.0% 0.0% 0.0%
Slovenia
• by the central government 0.0% 0.0% 0.0% 0.0% 0.0% 0.0%
• by other issuers 0.0% 0.0% 0.0% 0.0% 0.0% 0.0%
• by official international financial institutions 0.8% 2.2% 2.4% 2.2% 2.1%
Japan 4.2% 2.7% 4.2% 4.8% 8.6% 4.8%
• other OECD 11.9% 11.1% 12.1% 11.2% 6.5% 8.4%
• non-OECD EMEA 0.5% 0.9% 0.6% 0.5% 0.6% 0.6%
• non-OECD Asian & Pacific 0.3% 0.9% 0.3% 0.5% 0.7% 0.7%
• non-OECD Latin America 0.4% 0.4% 0.5% 0.5% 0.6% 0.6%
• equity 0.9% 0.2% 0.3% 0.1% 0.1% 0.7%
collateral of unknown origin or type 6.8% 7.8% 4.3% 2.7% 2.7% 2.5%
collateral in tri-party which cannot be attributed to a country or issuer
4.0% 3.5% 3.5%

41ICMA European Repo Market Survey September 2015
APPENDIX C: SUMMARY OF SURVEY RESULTS
Jun 11 Jun 12 Jun 13 Jun 14 Dec 14 Jun 15
Q2 What is the total value of securities loaned and borrowed by your repo desk: to/from counterparties
in the same country as you 41.3% 42.8% 37.3% 41.6% 38.3% 30.2%
1.1% 1.5% 2.8% 0.5% 0.7% 2.3%
• cross-border in (other) eurozone countries 19.6% 19.9% 20.9% 20.8% 21.7% 32.5%
1.6% 0.3% 0.9% 1.3% 1.1% 2.3%
• cross-border in non-eurozone countries 34.5% 35.1% 36.8% 35.2% 38.0% 27.1%
1.9% 0.4% 1.3% 0.5% 0.3% 5.5%
for which the term to maturity is
• fixed 71.3% 67.5% 50.7% 60.5% 58.6% 65.8%
• open 28.7% 32.5% 49.3% 39.5% 41.4% 34.2%

42ICMA European Repo Market Survey September 2015
APPENDIX D: THE ICMA EUROPEAN REPO COUNCIL
The ICMA European Repo Council (ERC) is the forum where the repo dealer community meets and forges consensus solutions to the practical problems of a rapidly evolving marketplace. The contact and dialogue that takes place at the ERC underpins the strong sense of community and common interest that characterises the professional repo market in Europe.
The ERC was established in December 1999 by the International Capital Market Association (ICMA, which was then called the International Securities Market Association or ISMA) as a body operating under ICMA auspices.
Membership of the ERC is open to any ICMA member who has commenced, or has undertaken to commence, a dedicated repo activity, is willing to abide by the rules applicable to its and has sufficient professional expertise, financial standing and technical resources to meet its obligations as a member.
The ERC meets twice a year (usually in February/March and September) at different financial centres across Europe. The Steering Committee now comprises 19 members elected annually and meets four times a year.
More information about the ERC is available on www.icmagroup.org