icici jan 17 issue sachincontent.icicidirect.com/moneymanagermagazine/january_2018.pdf · repairs...
TRANSCRIPT

72

Shilpa KumarMD & CEO
ICICI Securities Ltd.
At the onset, let me start by wishing
you a Very Happy New Year!
2017 was an eventful year on many
fronts. The year began with
a d j u s t m e n t s r e l a t e d t o
demonetization and ended with
s imi la r e f fo r ts to accus tom
ourselves with the Goods and
Service Tax. Both events are an
important economic landmark. We
look a t 2018 w i th renewed
optimism. We believe it to be the
year of stabilization as various steps
taken by the government may start
bearing fruit in CY18. With potential
government policies in place,
private sector's balance sheet
repairs and mending of banking
sector, private sector investments can accelerate in the year ahead. All
these factors are likely to resurrect India's GDP growth.
Indian nominal GDP growth seems to have bottomed out and is poised
for long term structural growth on account of enduring reforms such as
demonetization, GST, Insolvency and Bankruptcy code (IBC), etc.
Although adjustments to reforms have taken a toll on the nominal GDP
(9.3% in H1FY18) in the short-term, realization of long term advantages
will start mainly from FY19.
GST collections thus far are below our estimate. Lower than expected
GST collections (and thus, lower indirect taxes) would be an overhang
on fiscal deficit financing. GST collections would need to match
comparable indirect tax revenues to ensure zero revenue loss under the
new system. However, complete clarity is yet to emerge on the
implication of initial GST collection from official sources. A possible
ICICIdirect Money Manager January 20181
encouraging aspect to future collections is the implementation of
interstate e-way bill system on goods valued above Rs. 50000 with
effect from February 1, 2018. E-way bill implementation in states under
the previous system (pre-GST) had helped boost tax revenues by
15-20%.
We expect RBI to maintain status quo on benchmark rates for most of
year 2018, though we believe there is still scope of lower lending rates in
the banking system. Lower credit cost in terms of lower provisioning,
re-pricing of deposits at lower rates and structural reforms like lower
cash to GDP ratio, increased digital transactions, increase in merchant
discount rate (MDR) rates expected to cut losses, benchmarking of
lending rates to marginal cost lending rate (MCLR) is likely to provide
scope for further rate transmission.
Government's “Housing for All by 2022” scheme is expected to be a key
catalyst in economic recovery. We believe Housing for All scheme will
revive the economy with 250+ sectors forward and backward linkages.
Beside this, it would result in huge employment generation.
For CY18, we expect that the key driving force for the market would be
earnings recovery, which would be backed by a rise in asset turn
thereby improving the RoCE profile. We remain positive on Equity.
However for personal investments, it is important to follow a strict asset
allocation strategy that is backed by your goals and investment
objectives. It is important that you allocate your capital into both equity
(for growth) and debt (to provide stability). The start of the year is an
opportune time to work on your financial plan and an asset allocation
strategy.
Our message remains the same - 'Keep investing and stay invested for
your l i fe goals. ' Through this magazine and our website
www.icicidirect.com we want to make an earnest attempt to partner
with you in setting and achieving your financial goals. Give us an
opportunity to serve you, walk into any of your Neighborhood Financial
Superstore and talk to us.

As we head into 2018, one of the foremost questions that we would like answered is how will the markets perform and the trend going forward. Will it have the same robustness as last year or get better or are there some surprises in store.
In our New Year edition of ICICIdirect Money Manager, we put together a detail account of investment outlook 2018. Some of the leading experts in the industry put forth their views on last year's financial review, expectations from different asset classes in the upcoming year, key risks in the market today on micro and macro level. All in all, through this edition, we try to answer one common question, “How should you position your investment portfolio for the year 2018?”
While it is important to know the market expectations, the information needs to be used in tandem with our own financial goals and investment objectives. These investment objectives should in turn define the asset allocation. An asset allocation strategy defines how much one need to invest in diverse assets like equity, debt, gold etc. It is a great time to start or review your financial plan and define an appropriate asset allocation strategy.
With a fresh year ahead, set clear, concise financial goals and make a plan to put finances into shape. Give yourself adequate time to list down your priorities. Make investments that fit your risk appetite and that are linked to your goals.
In order to give you more in-depth take on the markets, we bring to you the fundamental, technical and derivatives market outlook 2018 from our internal team of research experts. Our research team also presents the performance review of different categories of mutual funds, along with the outlook for near future. So read on, stay updated and tuned. Do write us your feedback at [email protected] and share your thoughts.
Team ICICIdirect Money Manager wishes you a happy New Year.
Your magazine is now also available on www.magzter.com, a digital newsstand.
ICICIdirect Money Manager January 2018
Editor & Publisher : Abhishake Mathur, CFA
Editorial Board : Sameer Chavan, CWM®, Pankaj Pandey
CMEditorial Team : Nithyakumar VP CFP , Sachin Jain, Research Team
Coordinating Editor : Namrata Lonkar
2

ICICIdirect Money Manager January 2018
MD Desk ...................................................................................................1
Editorial ....................................................................................................2
Contents ...................................................................................................3
News ........................................................................................................4
Stock ideas: Greenply Industries & Gujarat Gas .....................................5
Fundamental Outlook 2018 ........................................................................13
Technical Outlook 2018 .............................................................................24
Derivatives strategy for 2018 .....................................................................30
Flavour of the Month 2017 was an eventful year on many fronts. As we step into a new fiscal,three experts from the industry share their viewpoints on CY17 and expectations from CY18................................................................34
Ask Our PlannerOur financial planner answers personal finance queries to help you build a substantial portfolio more easily...............................................47
Mutual Fund Analysis It's time to remain constructive in balanced funds and maintain stability in the portfolio. Check these top three funds recommended by our research team............................................................................50
This month on iCommunityTake a look at the latest activities on our unique information platform- iCommunity (for January 2018)............................................................59
Equity Model Portfolio................................................................................60
Quiz Time .................................................................................................64
Prime Numbers ........................................................................................65
3

India's oil consumption in 2017 expanded at the slowest pace in four years as a surprise ban on high-value currency notes and a new national sales tax weakened the economy. The nation's consumption of petroleum products rose 2 percent to about 200 million tons, the Oil Ministry's Petroleum Planning and Analysis Cell said Wednesday. That's the slowest since 2013, when demand grew 1.7 percent while global oil prices averaged about $109 a barrel, almost double last year's level. The cash ban and the new tax hit truckers the hardest, affecting demand for diesel as they are the largest consumers of the fuel in India.
Courtesy: Financial Express
India's oil consumption hits a rough patch, demand growth weakest since 2013 as economy slows
'India largest market for freelancers'
India is the largest freelancer market with 10 million people freelancing, according to PayPal.Freelancers in India, on an average, earn about Rs. 19 lakh per year, according to a new survey by global digital payments giant PayPal.“Of the surveyed freelancers, 41% have witnessed very fast growth in through the past 12 months, with 80% of them working with international as well as domestic clients,” the report said.The survey, conducted with 500 Indian freelancers, found that they were below the age of 40 and predominantly men.
Courtesy: The Hindu
ICICIdirect Money Manager January 2018
The December quarter performance of Tata Consultancy Servicec was without surprises or shocks. But investors may feel relieved given the possibility that the country's largest software exporter may show better revenue growth in dollar terms for the current fiscal compared with the previous two.
In addition, a stronger momentum in the digital segment is a bright spot amid subdued trend in banking, financial services and insurance (BFSI) verticals, which contributed over one-third to the total revenue. While the momentum in revenue seems to be reviving, the company is yet to restore the operating margin (EBIT margin) back to its target range of 26-28 per cent.
Courtesy: Economic Times
TCS topline shows signs of revival
Budget bonanza: Govt likely to do away with dividend distribution tax
The finance ministry is likely to do away with the dividend distribution tax (DDT) in the upcoming Union Budget. At present, if a company gives dividend to its shareholders, it has to pay DDT of 20.36 per cent (15 per cent plus surcharge and cess)."It is expected that Budget 2018 may propose a withdrawal of DDT and return to the classic system of dividend taxation, that is, dividend income to be taxed at the hands of the recipient shareholders," said SonuIyer, partner and leader, India region people advisory services, EY.
Courtesy: Business Standard
4

STOCK IDEAS
ICICIdirect Money Manager January 2018
Greenply Industries – MDF division to drive future growth…
Company Background
Incorporated in 1984, Greenply Industries (GIL) is a leading p layer in the o rgan ised plywood and medium density fibreboard (MDF) market. The company has a strong pan-India presence and has a d i s t r ibu to r and s tock i s t strength of 1656 and 841 in the plywood and MDF segments, respectively. This strong brand presence helps it to increase its market penetration in this highly fragmented wood panel industry. In 2014, the company de-merged its decorative b u s i n e s s c o m p r i s i n g laminates and allied products into Greenlam Industries, mainly to focus on its plywood and MDF business.
Over the past two decades, GIL has g rown s ign i f i can t l y resulting in 26% market share in the organised plywood market and 30% market share in the domestic MDF industry. Furthermore, the company's strong brand presence and a well entrenched distribution network have helped GIL to evolve with changing times and cater to rising customer
expectations. Moreover, to support its growth, GIL has b u i l t f o u r p l y w o o d manufacturing facilities across the country with total capacity of 32.4 MSM (million square metre) and an MDF facility with capacity of 1,80,000 CBM. With MDF demand on the rise, the company is undertaking a greenfield expansion to build an MDF facility in Andhra Pradesh w i th an annua l capacity of 3,60,000 CBM. Also, i t is expanding i ts plywood capacity by 40% to 46 MSM.
Investment Rationale
MDF facil ity expected to be commissioned by July, 2018…
GIL is setting up a new MDF facility in Andhra Pradesh with a capacity of 360,000 CBM entailing a capex of | 750 crore (already spent | 530 crore till Q2FY18). Construction is in full swing while the management is aiming to commission the plant three months ahead of schedule in July, 2018. It plans to operate the plant at 60% capacity utilisation in FY19E. The new plant will cater to
5

ICICIdirect Money Manager January 2018
STOCK IDEAS
southern demand (30% of G I L ' s M D F s a l e s ) . T h e company would export the remaining portion. It is aiming at full utilisation by FY22E. With the commissioning of the new MDF plant, we expect, GIL's MDF revenues to grow robustly at 33.5% CAGR to | 1134.6 crore over FY17-20E.
New plywood capacity to be operational by Q3FY19E…
GIL is expanding its plywood capacity due to capacity constraints at its existing units. It is setting up a facility in UP with a manufacturing capacity of 13.5 MSM, which would take its total capacity to 45.9 MSM. It plans to spend ~| 125 crore and wou ld manu fac tu re premium plywood at the plant. The plant is expected to come on stream by Q3FY19E. GIL is also setting up a decorative veneer unit in Gujarat that is a l s o e x p e c t e d t o b e commissioned by Q3FY19E. To e n s u r e r a w m a t e r i a l security, the company has also set up a veneer unit in Gabon. Currently, three production lines are operational while the remaining three would be operational by December, 2017. Reduction in GST rates
from 28% to 18% coupled with the expected implementation of the E-way bill by April 1, 2018 would result in a quicker shift from unorganised to o r g a n i s e d p l a y e r s . C o n s e q u e n t l y , t h e management expects 12-15% revenue CAGR in the plywood division in the next two years. We expect plywood revenues to grow at 12.4% CAGR to | 1658.2 crore in FY18E-20E.
MDF division - future growth engine!!!
We remain positive on GIL as t h e s h a r e o f o r g a n i s e d plywood players (currently 30% of plywood market) is set to expand with GST rate cut, higher brand aspirations and GIL's strong brand presence. GIL's strategy of capex across p r o d u c t s e g m e n t s l i k e plywood, MDF and decorative veneer bode well for the company's future growth. Consequently, we expect topline, bottomline to grow at 19.8%, 19.4% to | 2842.3 c r o r e , | 2 2 9 . 8 c r o r e , respectively, in FY17-20E. We continue to maintain our BUY rating on the stock with a revised target price of | 425 (~22x FY20E EPS).
6
ICICIdirect Money Manager January 2018
STOCK IDEAS
Stock Data
Key Financials
Valuations Summary
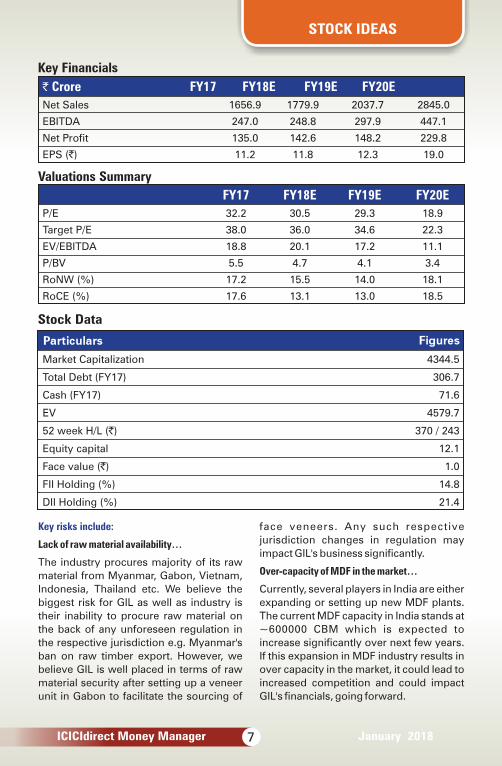
` Crore FY17 FY18E FY19E FY20E
Net Sales 1656.9 1779.9 2037.7 2845.0
EBITDA 247.0 248.8 297.9 447.1
Net Profit 135.0 142.6 148.2 229.8
EPS (`) 11.2 11.8 12.3 19.0
FY17 FY18E FY19E FY20E
P/E 32.2 30.5 29.3 18.9
Target P/E 38.0 36.0 34.6 22.3
EV/EBITDA 18.8 20.1 17.2 11.1
P/BV 5.5 4.7 4.1 3.4
RoNW (%) 17.2 15.5 14.0 18.1
RoCE (%) 17.6 13.1 13.0 18.5
Market Capitalization 4344.5
Total Debt (FY17) 306.7
Cash (FY17) 71.6
EV 4579.7
52 week H/L (`) 370 / 243
Equity capital 12.1
Face value (`) 1.0
FII Holding (%) 14.8
DII Holding (%) 21.4
7
Key risks include:
Lack of raw material availability…
The industry procures majority of its raw
material from Myanmar, Gabon, Vietnam,
Indonesia, Thailand etc. We believe the
biggest risk for GIL as well as industry is
their inability to procure raw material on
the back of any unforeseen regulation in
the respective jurisdiction e.g. Myanmar's
ban on raw timber export. However, we
believe GIL is well placed in terms of raw
material security after setting up a veneer
unit in Gabon to facilitate the sourcing of
face veneers. Any such respective
jurisdiction changes in regulation may
impact GIL's business significantly.
Over-capacity of MDF in the market…
Currently, several players in India are either
expanding or setting up new MDF plants.
The current MDF capacity in India stands at
~600000 CBM which is expected to
increase significantly over next few years.
If this expansion in MDF industry results in
over capacity in the market, it could lead to
increased competition and could impact
GIL's financials, going forward.

ICICIdirect Money Manager January 2018
STOCK IDEAS
ANALYST CERTIFICATION We /I, Deepak Purswani, CFA MBA (Finance), Vaibhav Shah, MBA (Finance); Research Analysts, authors and the names subscribed to this report, hereby certify that all of the views expressed in this research report accurately reflect our views about the subject issuer(s) or securities. We also certify that no part of our compensation was, is, or will be directly or indirectly related to the specific recommendation(s) or view(s) in this report.
Terms & conditions and other disclosures:ICICI Securities Limited (ICICI Securities) is a full-service, integrated investment banking and is, inter alia, engaged in the business of stock brokering and distribution of financial products. ICICI Securities Limited is a Sebi registered Research Analyst with Sebi Registration Number – INH000000990. ICICI Securities is a wholly-owned subsidiary of ICICI Bank which is India's largest private sector bank and has its various subsidiaries engaged in businesses of housing finance, asset management, life insurance, general insurance, venture capital fund management, etc. (“associates”), the details in respect of which are available on www.icicibank.com.
ICICI Securities is one of the leading merchant bankers/ underwriters of securities and participate in virtually all securities trading markets in India. We and our associates might have investment banking and other business relationship with a significant percentage of companies covered by our Investment Research Department. ICICI Securities generally prohibits its analysts, persons reporting to analysts and their relatives from maintaining a financial interest in the securities or derivatives of any companies that the analysts cover.
The information and opinions in this report have been prepared by ICICI Securities and are subject to change without any notice. The report and information contained herein is strictly confidential and meant solely for the selected recipient and may not be altered in any way, transmitted to, copied or distributed, in part or in whole, to any other person or to the media or reproduced in any form, without prior written consent of ICICI Securities. While we would endeavour to update the information herein on a reasonable basis, ICICI Securities is under no obligation to update or keep the information current. Also, there may be regulatory, compliance or other reasons that may prevent ICICI Securities from doing so. Non-rated securities indicate that rating on a particular security has been suspended temporarily and such suspension is in compliance with applicable regulations and/or ICICI Securities policies, in circumstances where ICICI Securities might be acting in an advisory capacity to this company, or in certain other circumstances.
This report is based on information obtained from public sources and sources believed to be reliable, but no independent verification has been made nor is its accuracy or completeness guaranteed. This report and information herein is solely for informational purpose and shall not be used or considered as an offer document or solicitation of offer to buy or sell or subscribe for securities or other financial
instruments. Though disseminated to all the customers simultaneously, not all customers may receive this report at the same time. ICICI Securities will not treat recipients as customers by virtue of their receiving this report. Nothing in this report constitutes investment, legal, accounting and tax advice or a representation that any investment or strategy is suitable or appropriate to your specific circumstances. The securities discussed and opinions expressed in this report may not be suitable for all investors, who must make their own investment decisions, based on their own investment objectives, financial positions and needs of specific recipient. This may not be taken in substitution for the exercise of independent judgment by any recipient. The recipient should independently evaluate the investment risks. The value and return on investment may vary because of changes in interest rates, foreign exchange rates or any other reason. ICICI Securities accepts no liabilities whatsoever for any loss or damage of any kind arising out of the use of this report. Past performance is not necessarily a guide to future performance. Investors are advised to see Risk Disclosure Document to understand the risks associated before investing in the securities markets. Actual results may differ materially from those set forth in projections. Forward-looking statements are not predictions and may be subject to change without notice.
ICICI Securities or its associates might have managed or co-managed public offering of securities for the subject company or might have been mandated by the subject company for any other assignment in the past twelve months.
ICICI Securities or its associates might have received any compensation from the companies mentioned in the report during the period preceding twelve months from the date of this report for services in respect of managing or co-managing public offerings, corporate finance, investment banking or merchant banking, brokerage services or other advisory service in a merger or specific transaction.
ICICI Securities or its associates might have received any compensation for products or services other than investment banking or merchant banking or brokerage services from the companies mentioned in the report in the past twelve months.
ICICI Securities encourages independence in research report preparation and strives to minimize conflict in preparation of research report. ICICI Securities or its associates or its analysts did not receive any compensation or other benefits from the companies mentioned in the report or third party in connection with preparation of the research report. Accordingly, neither ICICI Securities nor Research Analysts and their relatives have any material conflict of interest at the time of publication of this report.
It is confirmed that Deepak Purswani, CFA MBA (Finance), Vaibhav Shah, MBA (Finance); Research Analysts of this report have not received any compensation from the companies mentioned in the report in the preceding twelve months.
Compensation of our Research Analysts is not based on any specific merchant banking, investment banking or brokerage service transactions.
ICICI Securities or its subsidiaries collectively or Research Analysts or their relatives do not own 1% or more of the equity securities of the Company mentioned in the report as of the last day of the month preceding the publication of the research report.
Since associates of ICICI Securities are engaged in various financial service businesses, they might have financial interests or beneficial ownership in various companies including the subject company/companies mentioned in this report.
It is confirmed that Deepak Purswani, CFA MBA (Finance), Vaibhav Shah, MBA (Finance); Research Analysts do not serve as an officer, director or employee of the companies mentioned in the report.
ICICI Securities may have issued other reports that are inconsistent with and reach different conclusion from the information presented in this report.
Neither the Research Analysts nor ICICI Securities have been engaged in market making activity for the companies mentioned in the report.
We submit that no material disciplinary action has been taken on ICICI Securities by any Regulatory Authority impacting Equity Research Analysis activities.
This report is not directed or intended for distribution to, or use by, any person or entity who is a citizen or resident of or located in any locality, state, country or other jurisdiction, where such distribution, publication, availability or use would be contrary to law, regulation or which would subject ICICI Securities and affiliates to any registration or licensing requirement within such jurisdiction. The securities
described herein may or may not be eligible for sale in all jurisdictions or to certain category of investors. Persons in whose possession this document may come are required to inform themselves of and to observe such restriction.
8

ICICIdirect Money Manager January 2018
STOCK IDEAS
Gujarat Gas - Price hike to support healthy margins…
Company Background
Gujarat Gas (GG) is one of the
Ind ia ' s la rgest p layer in
industrial gas segment and city
gas distribution (CGD) with a
dominant presence in Gujarat.
It caters to the gas demand of
~3000 industrial consumers,
~5 lakh CNG vehicles and ~12
lakh households in Gujarat.
Total volumes in FY17 were at
5 . 4 m m s c m d w i t h t h e
industrial and retail segments
contributing ~68% of total
volumes.
Investment Rationale
Profitable growth to continue
on account price hikes...
The company has announced
price hikes for its industrial
customers in the month of
December, which were due for
a considerable period of time.
For industrial units in Morbi,
prices have been hiked by |
2 . 5 / s c m t o | 2 7 . 9 / s c m ,
whereas for other industrial
units, prices have been hiked
by | 2.6/scm to | 29.2/scm. In
the near term, the company
has been witnessing a dip in
gross margins on account of
rise in LNG prices (input costs)
and no price hike for industrial
customers mainly on account
of state elections. However, the
current price hikes will help the
company to restore its healthy
margins in the range of | 7-
7.5/scm. Going ahead, better
gas sourcing arrangements
and relatively stable LNG
prices will enable the company
t o m a i n t a i n i t s
competitiveness.
Volume growth to remain
stable, going ahead
For H1FY18, the company
reported volume growth of
1 5 % Yo Y w i t h a v e r a g e
volumes at 5.9 mmscmd.
External factors like Gujarat
floods and GST transition
phase had some impact on
industrial volumes in the
previous quarter (Q2FY18).
However, we believe volumes
will come back on track in
coming quarters. Currently,
industrial volumes contribute
~70% of Gujarat Gas' total
sales volumes. Going ahead,
the company expects the share
9

ICICIdirect Money Manager January 2018
STOCK IDEAS
to reduce to ~60% over the
long term given the relatively
higher growth of CNG and
domestic PNG segment. In lieu
of the same, the company is
aiming to set up 200 CNG
stations in coming years.
Overall, we believe increase in
both CNG as well as industrial
PNG demand will drive Gujarat
G a s ' v o l u m e g r o w t h
momentum. Vo lumes in
FY18E, FY19E are estimated at
6 mmscmd, 6.8 mmscmd,
respectively.
Rapid expansion in CGD to
puts Gujarat Gas in sweet
spot
With its expanding presence
across several districts in
Gujarat and relatively low gas
prices, Gujarat Gas is set to
benefit, going ahead, from
volume growth in CNG, and
industrial retail segment. We
believe the company's strong
CGD network offers good
demand potential due to lower
C N G , r e s i d e n t i a l P N G
penetration and increased
usage of natural gas for
industrial volumes. We now
value Gujarat Gas at 25x FY19E
EPS of | 40 on the back of
better visibility on earnings
growth. We have a BUY rating
with a target price of | 1000.
Valuations Summary
Key Financials
` Crore FY16 FY17 FY18E FY19E
Net Sales 6105.9 5093.0 5989.3 7155.2
EBITDA 725.2 749.0 930.5 1195.2
Net Profit 178.6 223.1 342.7 550.7
EPS (`) 13.0 16.2 24.9 40.0
FY16 FY17 FY18E FY19E
P/E 71.2 57.0 37.1 20.7
Target P/E 69.4 55.5 36.2 25.0
EV / EBITDA 20.7 20.0 16.1 12.2
P/BV 7.6 6.9 6.8 5.5
RoNW 11.8 13.6 18.3 24.0
RoCE 12.4 12.3 16.0 21.1
10

ICICIdirect Money Manager January 2018
STOCK IDEAS
Stock Data
Key risks include:
Disruption in gas supplies
Gujarat Gas receives more
than 80% of the current gas
supplies from GAIL. Any
n e g a t i v e c h a n g e i n t h e
allocation of gas to GG would
have an impact on the earnings
estimates and valuations of the
company.
Currency Risk
GG's supply contracts for the
purchase of gas are mostly
denominated in US dollars
while the company supplies to
customers in Indian rupees.
Hence, any sharp depreciation
in the Indian rupee will have a
short-term negative impact on
earnings of the company, as it
will be difficult for GG to pass
on the increase in raw material
costs to customers.
Market Capitalization (` crore) 11399.9
Debt (` crore) 2350.9
Cash and Cash Equivalent (` crore) 62.1
EV (` crore) 15010.4
52 Week High / Low (`) 973 / 500
Equity Capital 137.7
Face Value (`) 10.0
11

ICICIdirect Money Manager January 2018
STOCK IDEAS
ANALYST CERTIFICATION We /I, Mayur Matani, MBA and Akshay Gavankar, PGDM) Research Analysts, authors and the names subscribed to this report, hereby certify that all of the views expressed in this research report accurately reflect our views about the subject issuer(s) or securities. We also certify that no part of our compensation was, is, or will be directly or indirectly related to the specific recommendation(s) or view(s) in this report.
Terms & conditions and other disclosures:ICICI Securities Limited (ICICI Securities) is a full-service, integrated investment banking and is, inter alia, engaged in the business of stock brokering and distribution of financial products. ICICI Securities Limited is a Sebi registered Research Analyst with Sebi Registration Number – INH000000990. ICICI Securities is a wholly-owned subsidiary of ICICI Bank which is India's largest private sector bank and has its various subsidiaries engaged in businesses of housing finance, asset management, life insurance, general insurance, venture capital fund management, etc. (“associates”), the details in respect of which are available on www.icicibank.com.
ICICI Securities is one of the leading merchant bankers/ underwriters of securities and participate in virtually all securities trading markets in India. We and our associates might have investment banking and other business relationship with a significant percentage of companies covered by our Investment Research Department. ICICI Securities generally prohibits its analysts, persons reporting to analysts and their relatives from maintaining a financial interest in the securities or derivatives of any companies that the analysts cover.
The information and opinions in this report have been prepared by ICICI Securities and are subject to change without any notice. The report and information contained herein is strictly confidential and meant solely for the selected recipient and may not be altered in any way, transmitted to, copied or distributed, in part or in whole, to any other person or to the media or reproduced in any form, without prior written consent of ICICI Securities. While we would endeavour to update the information herein on a reasonable basis, ICICI Securities is under no obligation to update or keep the information current. Also, there may be regulatory, compliance or other reasons that may prevent ICICI Securities from doing so. Non-rated securities indicate that rating on a particular security has been suspended temporarily and such suspension is in compliance with applicable regulations and/or ICICI Securities policies, in circumstances where ICICI Securities might be acting in an advisory capacity to this company, or in certain other circumstances.
This report is based on information obtained from public sources and sources believed to be reliable, but no independent verification has been made nor is its accuracy or completeness guaranteed. This report and information herein is solely for informational purpose and shall not be used or considered as an offer document or solicitation of offer to buy or sell or subscribe for securities or other financial instruments. Though disseminated to all the customers simultaneously, not all customers may receive this report at the same time. ICICI Securities will not treat recipients as customers by virtue of their receiving this report. Nothing in this report constitutes investment, legal, accounting and tax advice or a representation that any investment or strategy is suitable or appropriate to your specific circumstances. The securities discussed and opinions expressed in this report may not be suitable for all investors, who must make their own investment decisions, based on their own investment objectives, financial positions and needs of specific recipient. This may not be taken in substitution for the exercise of independent judgment by any recipient. The recipient should independently evaluate the investment risks. The value and return on investment may vary because of changes in interest rates, foreign exchange rates or any other reason. ICICI Securities accepts no liabilities whatsoever for any loss or damage of any kind arising out of the use of this report. Past performance is not necessarily a guide to future performance. Investors are advised to see Risk Disclosure Document to understand the risks associated before investing in the securities markets. Actual results may differ materially from those set forth in projections. Forward-looking statements are not predictions and may be subject to change without notice.
ICICI Securities or its associates might have managed or co-managed public offering of securities for the subject company or might have been mandated by the subject company for any other assignment in the past twelve months.
ICICI Securities or its associates might have received any compensation from the companies mentioned in the report during the period preceding twelve months from the date of this report for services in respect of managing or co-managing public offerings, corporate finance, investment banking or merchant banking, brokerage services or other advisory service in a merger or specific transaction.
ICICI Securities or its associates might have received any compensation for products or services other than investment banking or merchant banking or brokerage services from the companies mentioned in the report in the past twelve months.
ICICI Securities encourages independence in research report preparation and strives to minimize conflict in preparation of research report. ICICI Securities or its associates or its analysts did not receive any compensation or other benefits from the companies mentioned in the report or third party in connection with preparation of the research report. Accordingly, neither ICICI Securities nor Research Analysts and their relatives have any material conflict of interest at the time of publication of this report.
It is confirmed that Mayur Matani, MBA and Akshay Gavankar, PGDM Research Analysts of this report have not received any compensation from the companies mentioned in the report in the preceding twelve months.
Compensation of our Research Analysts is not based on any specific merchant banking, investment banking or brokerage service transactions.
ICICI Securities or its subsidiaries collectively or Research Analysts or their relatives do not own 1% or more of the equity securities of the Company mentioned in the report as of the last day of the month preceding the publication of the research report. ,
Since associates of ICICI Securities are engaged in various financial service businesses, they might have financial interests or beneficial ownership in various companies including the subject company/companies mentioned in this report.
It is confirmed that Mayur Matani, MBA and Akshay Gavankar, PGDM. Research Analysts do not serve as an officer, director or employee of the companies mentioned in the report.
ICICI Securities may have issued other reports that are inconsistent with and reach different conclusion from the information presented in this report.
Neither the Research Analysts nor ICICI Securities have been engaged in market making activity for the companies mentioned in the report.
We submit that no material disciplinary action has been taken on ICICI Securities by any Regulatory Authority impacting Equity Research Analysis activities.
This report is not directed or intended for distribution to, or use by, any person or entity who is a citizen or resident of or located in any locality, state, country or other jurisdiction, where such distribution, publication, availability or use would be contrary to law, regulation or which would subject ICICI Securities and affiliates to any registration or licensing requirement within such jurisdiction. The securities described herein may or may not be eligible for sale in all jurisdictions or to certain category of investors. Persons in whose possession this document may come are required to inform themselves of and to observe such restriction.
report and information herein is solely for informational purpose and shall not be used or considered as an offer document or solicitation of offer to buy or sell or subscribe for securities or other financial instruments. Though disseminated to all the customers simultaneously, not all customers may receive this report at the same time. ICICI Securities will not treat recipients as customers by virtue of their receiving this report. Nothing in this report constitutes investment, legal, accounting and tax advice or a representation that any investment or strategy is suitable or appropriate to your specific circumstances. The securities discussed and opinions expressed in this report may not be suitable for all investors, who must make their own investment decisions, based on their own investment objectives, financial positions and needs of specific recipient. This may not be taken in substitution for the exercise of independent judgment by any recipient. The recipient should independently evaluate the investment risks. The value and return on investment may vary because of changes in interest rates, foreign exchange rates or any other reason. ICICI Securities accepts no liabilities whatsoever for any loss or damage of any kind arising out of the use of this report. Past performance is not necessarily a guide to future performance. Investors are advised to see Risk Disclosure Document to understand the risks associated before investing in the securities markets. Actual results may differ materially from those set forth in projections. Forward-looking statements are not predictions and may be subject to change without notice.
ICICI Securities or its associates might have managed or co-managed public offering of securities for the subject company or might have been mandated by the subject company for any other assignment in the past twelve months.
ICICI Securities or its associates might have received any compensation from the companies mentioned in the report during the period preceding twelve months from the date of this report for services in respect of managing or co-managing public offerings, corporate finance, investment banking or merchant banking, brokerage services or other advisory service in a merger or specific transaction.
ICICI Securities or its associates might have received any compensation for products or services other than investment banking or merchant banking or brokerage services from the companies mentioned in the report in the past twelve months.
12

FUNDAMENTAL OUTLOOK2018
ICICIdirect Money Manager January 2018
Investment Outlook 2018
Pankaj Pandey,Head-Research,ICICIdirect
CY 17 was a remarkable year for equities as liquidity across the globe ensured that it was the most favored asset class. Back home in India, the story was no different as Sensex delivered a handsome 29% return, aided further by the falling yields which led to decline in cost of capital and consequent expansion of P/E multiples. Amid all these, the year was also marked by one-offs such as Demonetisation and implementation of GST, which temporarily led to a down tick in corporate earnings and GDP growth.
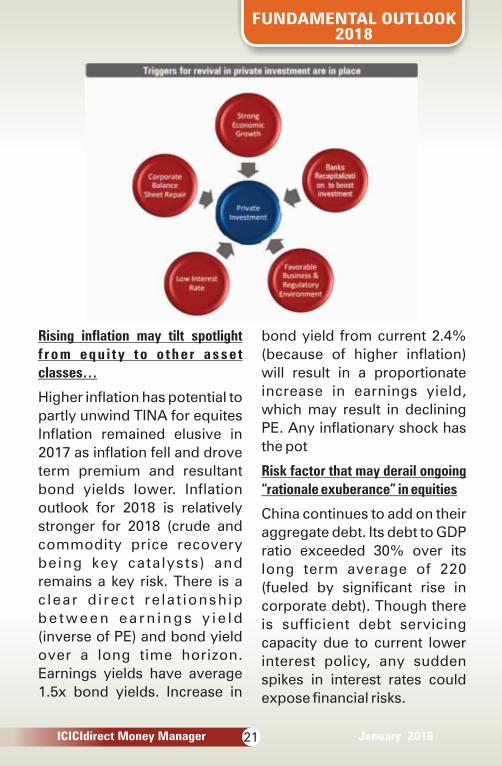
Government to lead capex, its p o l i c i e s t o b r e a k p r i v a t e investment jinx… Based on our bottom up approach, in f ras t ructure investment may jump up to Rs .48 lakh c rore led by housing, roads and railways in
the next five years, which i m p l i e s 1 0 % C A G R i n infrastructure spending in the next five years. Hence, we expect infrastructure spending as percentage of GDP to inch up to 6.0% in the next five years vs. 5.6% in the previous f i ve years . In our v iew, inc reased in f ras t ruc ture spending may inch up GDP growth rate by 80 to 100 bps. Government's “Housing for All b y 2 0 2 2 ” s c h e m e ( t o t a l
Source: ICICIdirect.com Research
13
FUNDAMENTAL OUTLOOK2018
ICICIdirect Money Manager January 2018
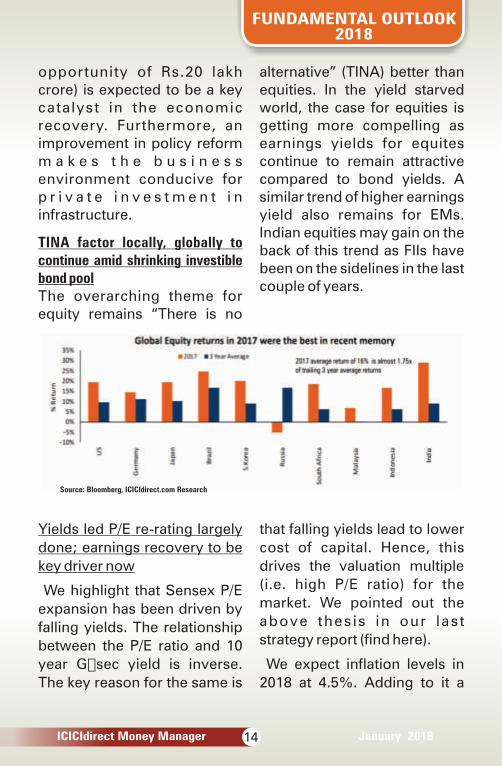
TINA factor locally, globally to continue amid shrinking investible bond poolThe overarching theme for equity remains “There is no
opportunity of Rs.20 lakh crore) is expected to be a key catalyst in the economic recovery. Furthermore, an improvement in policy reform m a k e s t h e b u s i n e s s environment conducive for p r i v a t e i n v e s t m e n t i n infrastructure.
alternative” (TINA) better than equities. In the yield starved world, the case for equities is getting more compelling as earnings yields for equites continue to remain attractive compared to bond yields. A similar trend of higher earnings yield also remains for EMs. Indian equities may gain on the back of this trend as FIIs have been on the sidelines in the last couple of years.
Source: Bloomberg, ICICIdirect.com Research
Yields led P/E re-rating largely
done; earnings recovery to be
key driver now
We highlight that Sensex P/E
expansion has been driven by
falling yields. The relationship
between the P/E ratio and 10
year G�sec yield is inverse.
The key reason for the same is
that falling yields lead to lower
cost of capital. Hence, this
drives the valuation multiple
(i.e. high P/E ratio) for the
market. We pointed out the
above thes is in our last
strategy report (find here).
We expect inflation levels in
2018 at 4.5%. Adding to it a
14

FUNDAMENTAL OUTLOOK2018
ICICIdirect Money Manager January 2018
normalized real interest rate of
175 bps and further 75-100 bps
markup for 10 year G-sec, we
expect the 10 year G-sec yield
to hover close to 7-7.25%
(similar to current levels).
Therefore, we believe much of
the yield based re�rating is
largely done.
However, going ahead, the key
driving force for the market
would be earnings recovery
(earnings CAGR of 17.4% in
FY17-20), which will largely be
the function of improving
c a p a c i t y u t i l i s a t i o n a t
corporate level (currently at
five year low).
Sensex RoCE to expand as utilization levels of India Inc improve
=Ex-financials, Sensex RoCE is expected to expand 220 bps in FY17-20E to 24.7% by FY20E vs. 22.5% in FY17, leading to earnings CAGR of 11% over FY17-20E
=Improvement is envisaged on account of higher sweating of assets and consequent better asset turnovers coupled with operational leverage benefits in terms of improved EBITDA margin profile
15

FUNDAMENTAL OUTLOOK2018
ICICIdirect Money Manager January 2018
For financials; core RoAs are
expected to improve gradually
to 3.3% in FY20E vs. 3.1% in
FY17 primarily tracking a
revival of credit growth.
C o n s e q u e n t l y, B F S I i s
expected to report a robust
33% earnings CAGR over
FY17�20E.
Measuring Nifty fair value:
SoTP methodology intersects
P/E valuation at 11,725
We have tried to evolve 2018
Index target based on bottoms
up approach by using a sum of
the parts (SoTP) evaluation of
individual index constituents
T h e r a t i o n a l e o f s u c h
methodology stems from the
fact that over the period of
time, companies, within the
index, with presence in various
verticals/businesses have
witnessed value unlocking and
in such case the concept of
SoTP captures the value in a
better way than purely P/E
based valuations (especially
for businesses where earnings
are yet to mature). Moreover,
we also note that superior
b u s i n e s s e s , e x h i b i t i n g
consistent RoCEs, within the
index now command higher
valuat ions, whi le certain
businesses within the index
continue to trade at/below
average index multiple .
It should be noted that our
Sensex target implies target
P/E of 18x on average of FY19
and FY20 earnings(i.e. 1x PEG),
which is on the higher end of
historical average P/E of
16�17x commanded by the
market. However, we highlight
that improving RoCE is a better
metric than PE dissonance
during an economic upturn.
16

FUNDAMENTAL OUTLOOK2018
ICICIdirect Money Manager January 2018
GST collections yet to stabilize
GST collections thus far are below our estimate, and we suspect below the revenue neutral rate required. Lower than expected GST collections (and thus, lower indirect taxes) would be an overhang on fiscal deficit financing. In absence of off icial estimates for the targeted col lect ions, we arrived at a revenue neutral figure of GST collections by working backwards from combined FY17 indirect tax revenues of the Central and State governments. GST collections would need to match comparable indirect tax revenues to ensure zero revenue loss under the new system.
Income tax collections boosted
Demonetisation-impacted H2FY17 saw a rise of 16% in direct tax collections YoY. In comparison, H1FY17 (six m o n t h s b e f o r e demonetisation) had recorded a 9% YoY growth over the comparable period. Apart from crackdown on black money, voluntary income declaration s c h e m e s , i n c r e a s e i n
surcharges for higher income slabs (above Rs.50 lakh and Rs.1 crore) and fear of action from authorities seem to have p r o v i d e d a b o o s t t o co l l ec t ions . In te rms o f p e r s o n a l i n c o m e t a x collections, the government managed to rake in Rs.3.5 lakh crore from individual tax payers in FY17, a rise of 21% YoY from FY16 collection of Rs.2.9 lakh crore. The total number of tax returns filed by individual assesses during FY17 was 5.43 crore, up 17.3% YoY. 1.26 crore new taxpayers (i.e. return filers and non-filers making tax payments) were added to the tax base
Corporate tax rates to decline gradually as near term fisc is challenged…
The Finance Minister in his previous Budget 2015 had made clear his intention to cut corpora te taxes to 25% gradually over a period to e n c o u r a g e f o r e i g n investments and jobs. In this direction, the government in the last Budget reduced the tax rate for companies with an annual turnover up to Rs.50 crore to 25% to promote
17

FUNDAMENTAL OUTLOOK2018
ICICIdirect Money Manager January 2018
MSME and encourage firms to migrate to the company format.
However, in the coming Budget, there is little room for the government to reduce corporate tax rates as clarity is yet to emerge on GST revenue collections. With the phasing out of major profit linked deductions like accelerated depreciation, SEZ, area based deductions, etc., and plugging loopholes in the direct tax systems, the government can g r a d u a l l y b r i n g d o w n corporate taxes to the desired levels of 25% over a period of time
We expect the fiscal deficit for FY17�18 at 3.4% of GDP, 20 bps above the targeted fiscal deficit of 3.2%. For FY17�18, disinvestment receipts have been budgeted at Rs.72,500 crore. However, we expect the same at Rs.1,08,000 crore on account of significant stake stales, buybacks in Q4FY18 . We b e l i e v e t h e e x c e s s proceeds from disinvestment of Rs.35,500 crore are likely to provide significant cushion to the government to meet the fiscal target for FY17�18.
Indian nominal GDP growth seems to have bottomed out and is poised for long term structural growth on account of enduring reforms such as d e m o n e t i s a t i o n , G S T, Insolvency and Bankruptcy code (IBC), etc. Although reforms have taken a toll on the nominal GDP (9.3% in H1FY18) in the short�term, realisation of long term advantages will start mainly from FY19. Private consumption (PFCE), the backbone of India's GDP, is expected to continue its steady growth momentum due to an increase in disposable income.
Traction in disposable income & state pay commission to drive consumption…
Agri loan waiver and increase in disposable income are expected to provide support to f o o d & b e v e r a g e s c o n s u m p t i o n a n d b a s i c h o u s i n g n e e d s , w h i c h contribute 45% to PFCE. Also, robust growth in consumption of clothing & footwear (7% of P F C E ) , t r a n s p o r t & communication (18%) among others are expected to lead to i m p r o v e m e n t i n p r i v a t e consumption growth.
18

FUNDAMENTAL OUTLOOK2018
ICICIdirect Money Manager January 2018
Source: RBI, Mospi, Government of India, media articles, ICICIdirect.com Research
After the central government's
implementation of Seventh
Pay Commission, states are
also likely to follow suit by
i n c r e a s i n g e x p e n d i t u r e
towards salaries and pension.
Some of the states have
already announced the budget
for incremental salaries and
wages. Initial figures suggest
the release of incremental
Rs.70,000 crore from some of
major states. This can go up to
R s . 2 l a k h c r o r e w i t h
implementation across all
states. We expect expenditure
of states on salaries and wages
to increase sharply at 19.3% in
FY19E.
Also, HRA dues to the tune of
Rs.30000 crore and Rs.10000
crore for teachers in UGC
funded un ivers i t i es and
colleges, respectively, lined up
for payment between H2FY18
and FY19E is likely to increase
the quantum of GFCE. As
salaries and wages constitutes
65% of the GFCE, hike in the
s a m e w o u l d s t i m u l a t e
consumption over the next
couple of years. Hence, we
expect the GFCE to increase at
12.6% and 14.8% in FY18E and
FY19E, respectively.
Source: RBI, Mospi, Government of India, media articles, ICICIdirect.com Research
19

FUNDAMENTAL OUTLOOK2018
ICICIdirect Money Manager January 2018
Real interest rate within RBI range,
to maintain status quo on Repo rate
RBI has indicated to maintain
real interest rate in the range of
1.25%-2.00%. RBI earlier said
the equilibrium real interest
rate in India was 1.5�2.0% but
it subsequently brought down
the range to 1.25%
We have tried to analyse the
future rate action by RBI with
real rate assumption of 1.75%
and average inflation range for
year 2018 at 4.25% to 4.75%
We expect RBI to maintain
status quo on repo rate at 6.0%
during CY18. While we do not
expect a further rate cut, we
also do not expect a reversal in
the interest rate cycle in the
near future
The recent up move in G-sec
yield with 10 year yield moving
t o 7 . 3 0 % i s m o r e o f a
r e t r a c e m e n t o f b u l l i s h
positioning as investors adjust
from a declining rate cycle to a
prolonged status quo phase in
benchmark rates. Considering
the 10 Year G-Sec yield spread
over repo at 100-125bps, we
expect 10 year G-Sec yield to
trade in the range of 7.0%-
7.25%
Scope for banking system to lower
rates remains…deposit repricing
effect still at play
Whi le we expect RB I to
m a i n t a i n s t a t u s q u o o n
benchmark rates for most of
year 2018, we believe there is
still scope of lower lending
rates in the banking system.
Lower credit cost in terms of
lower provisioning, repricing
of deposits at lower rates and
structural reforms like lower
cash to GDP ratio, increased
digital transactions, increase in
merchant discount rate (MDR)
rates expected to cut losses,
benchmarking of lending rates
to marginal cost lending rate
(MCLR) provide scope for
further rate transmission. We
estimate scope of further
reduction of 40 bps in the
banking system in a gradual
m a n n e r p a r t i c u l a r l y i n
c o r p o r a t e l e n d i n g r a t e .
{assumed 40 bps = 20 bps
from deposits + 15 bps from
provisions + 5 bps from lower
opex}
20
FUNDAMENTAL OUTLOOK2018
ICICIdirect Money Manager January 2018
Rising inflation may tilt spotlight
f rom equ i t y to o the r asse t
classes…
Higher inflation has potential to
partly unwind TINA for equites
Inflation remained elusive in
2017 as inflation fell and drove
term premium and resultant
bond yields lower. Inflation
outlook for 2018 is relatively
stronger for 2018 (crude and
commodity price recovery
being key catalysts) and
remains a key risk. There is a
c lear d i rect re la t ionship
b e t w e e n e a r n i n g s y i e l d
(inverse of PE) and bond yield
over a long time horizon.
Earnings yields have average
1.5x bond yields. Increase in
bond yield from current 2.4%
(because of higher inflation)
will result in a proportionate
increase in earnings yield,
which may result in declining
PE. Any inflationary shock has
the pot
Risk factor that may derail ongoing
“rationale exuberance” in equities
China continues to add on their
aggregate debt. Its debt to GDP
ratio exceeded 30% over its
long term average of 220
(fueled by significant rise in
corporate debt). Though there
is sufficient debt servicing
capacity due to current lower
interest policy, any sudden
spikes in interest rates could
expose financial risks.
21

FUNDAMENTAL OUTLOOK2018
ICICIdirect Money Manager January 2018
Sectoral Outlook:
- We are positive on sectors like
auto (volume driven operating
leverage benefit &increasing
share of premium) , banking
(PSU banks' return potential),
c a p i t a l g o o d s , c e m e n t
(demand fromrural, Individual
House Builder (IHB) segment
and government led infra
p r o j e c t s ) , c o n s u m e r
discretionary (India's shifting
preference towards premium
products and increas ing
penetration of the electrical
goods, asset light model, cash
surplus status of companies),
FMCG (increasing demand
22
FUNDAMENTAL OUTLOOK2018
ICICIdirect Money Manager January 2018
from rural India, structural
r e fo rms ) , i n f r as t ruc tu re
(government's renewed focus
on sector, “Housing for All by
2022”scheme, historic road
building program), logistics
(implementation of the e-way
bill) , media, retail (Incremental
benefit of the shift from
unorganised to organized) and
telecom (data usage adoption
- We are neutral on defensives
l i k e I T ( t r a n s i t i o n o f I T
landscape from traditional to
digital, client IT spending
pattern towards emerging
technologies) , textiles and
apparels, pharma (post GST
r e c o v e r y , n o r m a l i z e d
emerging markets currency
volatility and new product
launches) , power, real estate
(optimist ic on affordable
h o u s i n g s e g m e n t a m i d
government's policy push,
improvement in fundamental
drivers such as sales volumes)
, metals and mining (stable
rea l i za t ions and hea l thy
demand prospects) , oil and
gas (sharp run-up in stock
prices, steady volume led
growth expected)
23

TECHNICAL OUTLOOK 2018
ICICIdirect Money Manager January 2018
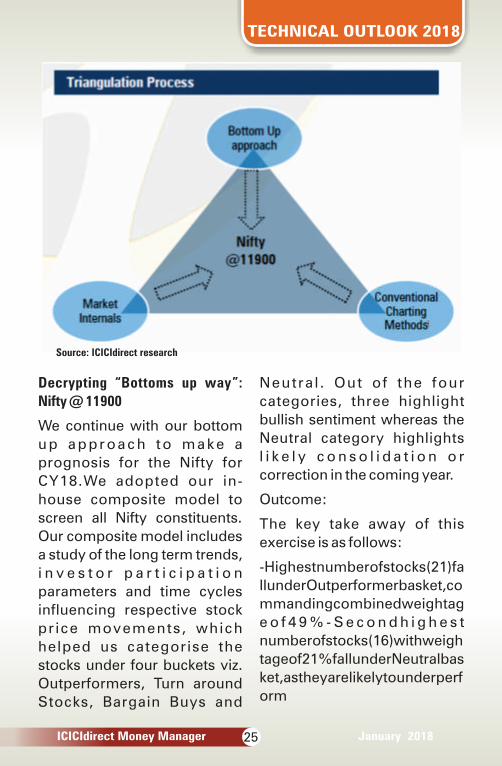
Triangulation reaffirms faith in Bulls
As 2017 draws to an end with>20% gain on domestic indices, a common question that an investor is pondering upon is “Is a significant correction in sight?” or “Are we at a tipping point,which would converge into a mega bull rally for the next couple of years?” Hence, we have centered our“Market Strategy2018” report around the above questions in order to gauge what is in store for equities in CY18.
Dharmesh Shah,Head-Technical analysis, ICICIdirect
WeinitiatedaTriangulationpro
cessinascertainingthewayah
eadformarketsthatpencilsina)
bottomupapproach,b)conve
ntionalchartingmethodsandc
)marketinternals.Alloutcome
sreaffirmthatbullswillprevaili
nCY18whereintheNiftyisexpe
ctedtoreturn14%withapotent
ialtargetof11900overthenext
12-15months.
Apartfromtheabove,wealsod
ecipheredinterestingobserva
tionsthatinclude:
> Mega t rend ana lys is
highlights multifold rallies
over the next few years and
m i n o r c o r r e c t i o n s
accompanied by i t that
should be utilized as an
i n c r e m e n t a l b u y i n g
opportunity
>Dissecting 'unconventional/
unloved' ideas (both large
and mid/small caps) for beta
c a p t u r i n g . I n c a s e o f
unconventional ideas we
have constructed in-house
sectoral indices that have
eventually helped us pick
stocks from those baskets.
F o r u n l o v e d s t o c k s ,
observation of cycles across
a longer time frame and back
testing it have also thrown up
interesting ideas across the
spectrum
Onlydownsiderisktoourprog
nosisiselongatedtimecorrecti
onwithlimitedpricedamageas
wedonotexpecttheNiftytosus
tainbelow9400levels.
24
TECHNICAL OUTLOOK 2018
ICICIdirect Money Manager January 2018
Source: ICICIdirect research
Decrypting “Bottoms up way”:
Nifty @ 11900
We continue with our bottom
up approach to make a
prognosis for the Nifty for
CY18.We adopted our in-
house composite model to
screen all Nifty constituents.
Our composite model includes
a study of the long term trends,
i n v e s t o r p a r t i c i p a t i o n
parameters and time cycles
influencing respective stock
pr ice movements, which
helped us categorise the
stocks under four buckets viz.
Outperformers, Turn around
Stocks, Bargain Buys and
Neutra l . Out of the four
categories, three highlight
bullish sentiment whereas the
Neutral category highlights
l i k e l y c o n s o l i d a t i o n o r
correction in the coming year.
Outcome:
The key take away of this
exercise is as follows:
-Highestnumberofstocks(21)fa
llunderOutperformerbasket,co
mmandingcombinedweightag
e o f 4 9 % - S e c o n d h i g h e s t
numberofstocks(16)withweigh
tageof21%fallunderNeutralbas
ket,astheyarelikelytounderperf
orm
25

TECHNICAL OUTLOOK 2018
ICICIdirect Money Manager January 2018
-Eightindexconstituentswith18
%weightagehaveapproached
price,timewisematurityofcorre
ction&settobeginfreshuptrend
-Fivestockscarryingweightagef
12%arewitnessingastructural
Source: Bloomberg, ICICI Direct.com Research
Mega trends: Are we at a tipping
point?
The Sensex witnessed two
m e g a t r e n d s s i n c e i t s
inception. Between 1979 and
1992,theindexgained40timeso
ver13yearswhi lethe2003-
08rallygainedseventimesinma
g n i t u d e . W h i l e t h e 2 0 0 3 -
08rallywasbornoutofa11yearb
e a r p h a s e ( 1 9 9 2 -
2003),thecurrentbullmarket,w
hichcommencedfrom2013low
s,wasprecededbysixyearsof
underperformance (2008-
14whentheactualbreakoutocc
urred)
Source: Bloomberg, ICICI Direct.com Research
26

TECHNICAL OUTLOOK 2018
ICICIdirect Money Manager January 2018
Technically,wewanttopresenta
casethatinvestorsshouldfocus
onlongtermtrendsandbenefitfr
omthemratherthanworryingab
outshort term a berrations as
e v i d e n t f r o m h i s t o r i c a l
evidence.Anempiricalevidenc
egivesusconfidencethatthecur
rentbullmarketinIndiaisstillina
nearlystageandisl ikely to
extend over then extfourt of
I've years. Therefore, were
commend utilizing any inter
media tecorrections as a
n i n c r e m e n t a l b u y i n g
opportunity.
General Elections: Bulls charge…
The year 2018 being a pre-
election year wil l have a
s i g n i f i c a n t b e a r i n g o n
sentiments in equity markets. It
has been observed tha t
benchmark ind ices have
performed relatively well in
pre-election year. Hence,
historical evidence suggest
that there are unlikely to be
large drawdowns in CY18.
Source: Bloomberg, ICICI Direct.com Research
Gold ($1264): Bullion to extend
its time correction, upsides
capped at $1400...
= Gold prices have gained
almost 10% during CY17 on
the back of weakness in the US
dollar and increased global
geopolitical tensions. Despite
the up move, gold prices
remained in a broad range of
$1400-1050 in the last four
years.
= Going forward, we expect
gold prices to continue the
c u r r e n t c o r r e c t i v e
econsolidation. Prices, after 11
years of stupendous rally from
$252 to $1921, have been in a
27

TECHNICAL OUTLOOK 2018
ICICIdirect Money Manager January 2018
corrective trend in the last six
year while retracing 50% of the
previous rally. We expect
prices to remain in the time
wise consolidation phase
while upsides look capped
around the $1400 region, as it
is the higher band of the last
four years consolidation and
the 38.2% retracement of the
entire decline from 2011 peak
of $1921 to 2015 bottom of
$1046 levels.
Source: Bloomberg, ICICI Direct.com Research
B r e n t ( $ 6 3 . 8 0 ) : T i m e w i s e
consolidation to extend...
=WeexpectBrentcrudepricest
oshifttheirtradingrangehigher
whileconsolidatinginarangego
inginto2018.Theupsidelooksc
appedaround$70levelsasitisth
econfluenceoffollowingtechni
calparameters:
>Price parity with previous
2016 rally from $ 31 to $ 58 as
projected from the 2017 low of
$ 43 projects upside towards $
70 levels
>The previous yearly high of
2015 is placed around $ 70
levels
=Declinesinoilpricesarelikelyt
o b e a n c h o r e d a t ~ $ 5 0 -
52beingthe61.8%retracement
ofpastfivemonthsrally($44-
64)placedat$52andvalueofther
isingtrendlineconnectingyearl
ylowsof2016($27)and2017($4
4)
28

TECHNICAL OUTLOOK 2018
ICICIdirect Money Manager January 2018
=To sum up, Brent prices are
expected to remain in a
broader trading range of $50-
72 amid lack of structural turn
around on long term charts
Source: Bloomberg, ICICI Direct.com Research
US$INR (64.05): Rupee likely to
appreciate to 62…
=Fromayearlyperspective,the
USDINRpairformedabearishen
gulfingcandlethisyear,hintinga
tatemporaryhalttotherupeede
preciationtrajectorythatbeena
majorthemesinceCY11.
=WeexpecttheUSDINRpairto
depreciatein2018andheadtow
ardsthemajorsupportarea
s e e n n e a r t h e 6 2 . 4 0 -
62.00region,whichistheconflu
enceof:i)61.8%Fibonacciexten
sionofdeclinefrom2013 high to
2014lowextendedfrom2016hi
gh,andii)61.8%Fibonacciexten
sionofdeclinefrom68.87to63.9
2extendedfrom65.89.
=Havingsaidthat,wedonotfor
eseethepairsustainingbelow62
-62.00rangenextyear,aspolicy
divergencebetweentheFederal
ReserveandotherG7centralban
ksshouldkeepthedollarsupport
edagainsttheG7basket
=Thepairhasmajorresistancei
nthecomingyeararound66.50l
evelsbeingtheconfluenceofthe
breakdownareaofMarch2017a
ndthe61.8%retracementofthe
2017downmove.
29

DERIVATIVES STRATEGYFOR 2018
ICICIdirect Money Manager January 2018
Rational exuberance to drive Nifty higher for target of 11700…
Amit GuptaHead - Derivatives Research,ICICI Securities
Since the commencement
of rate hike by the US Fed in
2015, equity markets have
constantly outperformed
other key asset classes like
gold and bonds. This has
triggered strong inflows into
equities at the expense of
other key asset classes like
bond and gold. S&P is likely
to clock strong positive
returns in 2018, as the Fed is
expected to deliver two or
three rate hikes in 2018,
which is likely to keep the
underperformance trend of
bonds, gold intact (caveat
being deflation shock).Easy
financial conditions coupled
with subdued volatility and
robust sent iment f rom
corporates, individuals to
cont inue to thrus t US
equities higher.
The decline in standard
dev ia t ion (SD) o f S&P
returns was seen in 2016
when SD declined from 4%
to 3%. In the Nifty, it was
seen in 2017 when SD of
Nifty returns fell from 5% to
3%. We believe 2018 would
be the year in which SD of
Nifty returns could witness a
further decline from 3% to
1.5% following S&P pattern.
Hence, we believe the Nifty
should be able to post near
17% return in the coming
year.
30

DERIVATIVES STRATEGYFOR 2018
ICICIdirect Money Manager January 2018
Source: Bloomberg, ICICIdirect.com Research
June 2018, 9700 Put writing further strengthens view of strong support near these levels
= The action happened not only in 2017 Put strike but also in June 2018 Put strike where premiums were shorted in a n t i c i p a t i o n o f l i m i t e d downsides in the market
= The 9700 Put of June 2018 is still witnessing writing. This also started when the Nifty was near 9700. This strengthens the view that strong support for the market is close to these levels.
While the US Fed has started its unwinding of balance sheet, ECB and BoJ are likely to c o n t i n u e w i t h t h e i r Q E
programme. Together, they will continue to push US$100 billion of QE till June 2018. Even after this, BoJ is likely to continue with its US$60 billion QE run rate. Hence, the central bank liquidity picture is likely to remain positive in 2018. A positive liquidity environment bodes well for risk assets like equities
Equity ETF in US clocked record inflow
ETFs in US have outgrown actively managed MFs. On a consolidated basis, strong inflow is seen in equity ETF. As per the latest data for 2017, equi ty based ETFs have received almost double the record inflows seen in 2016.
31

DERIVATIVES STRATEGYFOR 2018
ICICIdirect Money Manager January 2018
This suggests preference for equity remains
Volatility to remain lower in equities
Cross asset volatility is likely to remain low. In equity markets more specifically, volatility has been moving in sync not only for India and EMs but also the developed markets. With chances of any major risk shock remaining benign, volatility across equity markets is likely to remain low
Bond market f lows taking a breather
At the start of the year, as the reflation trade eased, EM bonds saw strong buying i n t e r e s t i n H 1 o f 2 0 1 7 . However, in H2 of 2017, as growth picked up pace in most Ems, the inflows in bonds tapered off. Additionally, the decidedly hawkish centrals banks of the US & Europe kept yields higher. This reduced the spread between developed markets and EMs. As a result, the alpha from EM bond portfolio has reduced. FIIs are using the equity route for EMs as GDP growth and EPS expansion remains intact for most Ems. Hence, in 2018, EM
equites should continue to see strong inflows even if bond m a r k e t i n f l o w s r e m a i n subdued.
Major currencies have appreciated
At the start of the year, on fears o f “r e f l a t i o n t r a d e ” E M currencies were looking weak. However during the year, as the EM's continued to post robust growth, their currency and forex reserves positions improved. The usual suspect “Current account deficit”, also improved for most key EM's. Hence as we look into 2018, the EM currency basket seems substantially resilient (when compared in the last couple of years). With the commodity recovery story intact in midst of strong macro environment, EM's are set to deliver strong & s y n c h r o n i s e d p r i c e performance in 2018.
Equity corrections have reduced
Since the last few years the steady flows in the equity markets have restricted the equity downsides. Certain m a j o r d o w n s i d e s h a v e become on account of events like US rate hike, Election jitters in Euro.
32

DERIVATIVES STRATEGYFOR 2018
ICICIdirect Money Manager January 2018
Source: Bloomberg, ICICIdirect.com Research
Stocks witnessing accumulation pattern- Quant Picks for 2018
Source: Bloomberg, ICICIdirect.com Research
33

FLAVOUR OF THE MONTH
Investment Outlook 2018
ICICIdirect Money Manager January 2018
2017was a remarkable year for equities on both national and global fronts. While
Sensex delivered 29% returns, gold prices gained almost 10% amongst other
categories that offered positive returns in CY17. Will the good run continue for
2018? We asked a panel of industryexperts for their views on the year ahead and
also a look back on 2017. Let's take a look:
2018 India Equity Market Outlook –
On Your Mark, Get Set, 2019?
2018 will mark the fourth year
of the Modi Government in
office and the penultimate year
before the general elections
scheduled for April-May 2019.
With the Dec 2017 state
election victories for the
BJP/NDA in Gujarat and
Himachal Pradesh, markets
may heave a sigh of relief.
H o w e v e r, t h e q u e s t i o n
remains: Will the government
stick to the path of economic
reforms, or focus on politics
(read populism), before 2019?
We would place our bets on
reforms, and we base this on a
number of factors including –
(i) 19 out of 29 states in India
are now under BJP/NDA rule
potentially making it easier for
the ruling party to bring about
its reforms, (ii) several reforms
are on the anvil including
improvements to the Direct
Tax Code, e-way bill, real-
estate sector, banking sector
among others, (iii) the reform
agenda has been recognized
globally - India has jumped 30
spots in the World Bank's Ease
of Doing Business ranking, (iv)
stellar foreign inflows this year,
both FDI (+US$ 54.7bn till Oct-
end) and FPI (+US$ 8.5bn till
Nov-end), on the back of
reforms.
The Government reforms over
the past couple of years could
Anup Maheshwari,Executive Vice President and CIO- Equities, DSP BlackRock
34

FLAVOUR OF THE MONTH
ICICIdirect Money Manager January 2018
2018 India Equity Market Outlook –
On Your Mark, Get Set, 2019?
2018 will mark the fourth year
of the Modi Government in
office and the penultimate year
before the general elections
scheduled for April-May 2019.
With the Dec 2017 state
election victories for the
BJP/NDA in Gujarat and
Himachal Pradesh, markets
may heave a sigh of relief.
H o w e v e r, t h e q u e s t i o n
remains: Will the government
stick to the path of economic
reforms, or focus on politics
(read populism), before 2019?
We would place our bets on
reforms, and we base this on a
number of factors including –
(i) 19 out of 29 states in India
are now under BJP/NDA rule
potentially making it easier for
the ruling party to bring about
its reforms, (ii) several reforms
are on the anvil including
improvements to the Direct
Tax Code, e-way bill, real-
estate sector, banking sector
among others, (iii) the reform
agenda has been recognized
globally - India has jumped 30
spots in the World Bank's Ease
of Doing Business ranking, (iv)
stellar foreign inflows this year,
both FDI (+US$ 54.7bn till Oct-
end) and FPI (+US$ 8.5bn till
Nov-end), on the back of
reforms.
The Government reforms over
the past couple of years could
broadly be broken into three
main categories: a) Crackdown
on black money b) Financial
inclusion through Aadhaar and
Jan Dhan bank accounts and c)
Direct benefit transfer (DBT) of
subsidies. These are critical
long term structural reforms in
our view, the benefits of which
will be realized over the next
few years. And as we had
anticipated, these caused near
term pain to growth and
earnings.
However, this did not stop
Indian equities from rallying
sharply in 2017 - up ~36% in
USD terms or ~28% in INR
terms. The obvious question
has been on high valuations
and its sustainability. We think
this run up has been a part of
the broader EM rally and that
35

FLAVOUR OF THE MONTH
ICICIdirect Money Manager January 2018
India is not an outlier. Markets
are certainly at a high but
valuations are not. An earnings
catch-up could certainly help
sustain these valuations. We
expect corporate earnings to
see a broad based recovery in
FY19 and FY20. Along with the
positive base effect, a mix of
global cyclicals (metals), autos,
oil marketing companies and
banks may be the key drivers
for this.
After hitting a low of 5.7% in Q1
FY18, GDP growth recovered
to 6.3% in Q2 FY18, and we
expect the upward trend to
continue. With demonetization
behind us, implementation of ththe 7 pay commission along
with the higher government
spending on the rural segment
could help support demand.
This should benefit consumer
facing companies like staples,
consumer durables and other
under-penetrated sub sectors
which will also benefit from
initiatives on “Housing for All”
and “Power for All”.
On the investment front,
private sector capex may
remain subdued as corporates
continue to operate at lower
util izations of ~70%. For
reference, ~80% utilization
was the threshold for new
capex growth last time around.
However, new capex may be
r e p l a c e d b y i n o r g a n i c
acquisition of existing idle
capacities spurred by sales
through the National Company
Law Tribunal (NCLT). The onus
will then likely lie on the
G o v e r n m e n t t o d r i v e
investments. If private capex
does revive however, it is likely
to be swift, given the inherent
efficiencies of the private
sector.
Flows: We expect domestic
flows (led by mutual funds) to
continue to outpace foreign
flows for the fourth year in a
row in 2018, as India is finally
w i t n e s s i n g a s h i f t f r o m
physical to financial savings
which looks more structural.
EMs have seen equity inflows
of ~60 billion in 2017 so far
which is after four years of net
outflows from EMs. Global
p o r t f o l i o m a n a g e r s a r e
36

FLAVOUR OF THE MONTH
ICICIdirect Money Manager January 2018
underweight EM equities,
l e a v i n g m o r e r o o m f o r
additional buying in EMs and
India.
Currency: INR continues to
r e m a i n o n e o f t h e b e s t
performing currencies since
the Taper Tantrum in 2013 and
has also been amongst the
least volatile. We expect this
trend to continue over the next
few years with RBI committed
to keeping the currency stable
and with the improvement in
forex reserves and FDI. On the
global front, while more rate
hikes in 2018 by the US Fed are
highly anticipated, we believe
the disruption to EM equities
a n d c u r r e n c i e s w i l l b e
temporary, if at all, especially if
the rate increases are a
function of growth coming
back in the world's largest
e c o n o m y. T h i s s h o u l d
eventually be positive for
exporting countries like India
and other EMs in general. A
rise in global GDP growth
bodes well for global trade
which has been subdued over
the past few years.
Risks: While the broad outlook
for India may remain positive,
we believe there are certain
risks which investors must
consider. These include: A
shortfall in the yearly GST
collection (will negatively
impact the fiscal deficit), rising
oil prices (leading to higher
current account deficit), rising
inflation (higher oil and food
price base effect) and geo-
pol i t ics (China's growing
influence and strength in the
We have included statements/opinions/recommendations in this document, which contain words, or
phrases such as “will”, “expect”, “should”, “believe” and similar expressions or variations of such
expressions that are “forward looking statements”. Actual results may differ materially from those
suggested by the forward looking statements due to risk or uncertainties associated with our expectations
with respect to, but not limited to, exposure to market risks, general economic and political conditions in
India and other countries globally, which have an impact on our services and/or investments, the monetary
and interest policies of India, inflation, deflation, unanticipated turbulence in interest rates, foreign
exchange rates, equity prices or other rates or prices etc.
37

FLAVOUR OF THE MONTH
ICICIdirect Money Manager January 2018
Harsha Upadhyaya, Chief Investment Officer – Equity,
Kotak Mahindra AMC
2018: Back to basics; Focus on
fundamentals
As we enter the New Year
2018, as is customary, we
spend some time looking back
at the year gone by and also
attempt to gaze into the crystal
ball to understand what 2018
has in store for us. The theme
this 2018 is “back to basics”
with a focus on fundamentals
and disciplined investing. In
this regard the quote from
Benjamin Graham seem very
apt.
“ S u c c e s s f u l i n v e s t i n g
professionals are disciplined
and consistent and they think a
great deal about what they do
and how they do it.” - Benjamin
Graham
2017: The year of reforms
2017 can clearly be termed as
the 'year of reforms'. Reform
measures such as GST (Goods
a n d S e r v i c e s Ta x ) , t h e
Insolvency and Bankruptcy
Code (IBC) and the flagship
schemes like Direct Benefit
Transfer (DBT) were some of
the major initiatives of the year.
2017 started with the economy
grappling with the after effects
of demonetization. This was
f o l l o w e d b y t h e
implementation of GST, which
is by far the biggest tax reform
that the country has seen.
While there has been some
temporary d is rupt ion in
activity on account of GST, we
do believe that supportive
g l o b a l g r o w t h , s t r o n g
c o n s u m p t i o n d e m a n d
(including revival in rural
demand) and improv ing
corporate profitability would
spur growth in 2018.
GST implementat ion has
resulted in two large structural
thematic shifts in India which
are still playing out: (a) shift
from the unorganized to the
organized space and (b) a shift
38

FLAVOUR OF THE MONTH
ICICIdirect Money Manager January 2018
in savings from physical to
financial assets. Favourable
demographics combined with
macro stability and initiatives
to educate investors, as well as
progressive regulations, have
all supported this shift in
savings behaviour.
We also believe that over time
as the GST infrastructure and
r a t e s s t a b i l i s e , b e t t e r
compliance would ensure that
these is an improvement in the
tax- GDP ratio in our country
which would help us move
further along the path of fiscal
consolidation.
Another big development in
2017 were the steps taken to
expedite the banking sector
s t ress reso lu t ion . Large
corporate Non Performing
Loans (NPLs) have been
plaguing the banking sector
resulting in eroding balance
sheet strength. RBI (Reserve
Bank of India) has decided to
re fe r some o f the la rge
corporate delinquent accounts
t o t h e N C LT ( N a t i o n a l
Company Law Tribunal) under
the Insolvency and Bankruptcy
Code in order to find a time
bound resolution to the NPLs.
2018: The year ahead; Focus on
fundamentals and corporate
earnings
One of the key concerns in
2017 was that the up-move in
the markets has not been
supported by strong earnings
growth. While earnings growth
has been muted for the last few
years, we now think that the
trend is about to reverse and
corporate earnings are set for a
recovery and such a recovery
would be one of the main pre-
condit ions to the market
sustaining current valuations.
This earnings recovery would
in our opinion be led by the
macro polices and reforms
a g e n d a , a b o o s t t o
infrastructure spending, export
growth supported by global
growth revival , a robust
consumer demand (including
improvement in rural demand)
and a nascent recovery in
private capex.
When we talk of earnings
recovery, a recovery in overall
capital formation cycle would
be a key factor apart from
39

FLAVOUR OF THE MONTH
ICICIdirect Money Manager January 2018
growth in consumption. While
the key driver for capex in the
economy would continue to be
public spend, the private capex
cycle should also benefit from
three years of low average
lending rates, better corporate
profitability, easier availability
of credit from the banking
system, higher equity raising
from a buoyant market, more
FDI into manufacturing and
infrastructure and a renewed
focus on housing. Public capex
growth is likely to remain
healthy with a focus on roads,
r u r a l d e v e l o p m e n t a n d
affordable housing.
A p a r t f r o m t h e f a c t o r s
mentioned above, the pace of
resolution of NPLs and the
repair of the balance sheets of
corporate private sector banks
and PSU banks would play a
role in the revival of private
sector investments in India. In
this regard, the plan to infuse
Rs 2.11Trn of capital into Public
sector banks through a mix of
recapitalisation bonds, capital
infusion as planned in the
budget and fresh raise from the
market, stands in good stead.
Over time as the resolution of
big ticket NPLs gather pace, the
cycle of low capital and low
growth could be broken,
resulting in a pick-up in credit
growth.
While 2017 was the year of
reforms, in 2018 the focus of
the Government will be on
consolidation and building on
r e f o r m s l i k e G S T, b a n k
r e c a p i t a l i z a t i o n p l a n ,
bankruptcy and insolvency
process and nurturing the
economy back into a higher
growth path in a pre-election
year. In this context we would
a l s o a w a i t t h e
r e c o m m e n d a t i o n o f t h e
Committee on Direct tax
reforms with the focus on
improving tax buoyancy and
compliance
The later part of 2018, will see
many states coming up for
elections (8 state elections are
slated to be held). In our base
case, we build in a fairly stable
political scenario leading up to
the General Elections in 2019.
Against this backdrop we
expect the Nifty to report
40

FLAVOUR OF THE MONTH
ICICIdirect Money Manager January 2018
~15% earnings growth in
F Y 1 9 E . W i t h i m p r o v i n g
corporate earnings, we too
would continue follow our
investment philosophy of
Growth at a Reasonable Price
( G A R P ) w i t h a n a i m o f
investing in companies which
have the potential to report
earnings growth higher than
the market, strong balance
sheet position and stable
management.
We would continue to urge
investors to invest through
mutual funds in a systematic
manner for the medium to long
t e r m k e e p i n g i n m i n d
individual risk profile and
return expectations. Prudent
asset allocation and long term
focus are very critical for all
investors. With recent strong
upmove in the market, it is not
advisable to chase market
momentum.
Key risks
· Sharp and sustained rise in
oil prices is a key risk to the
near term growth story for
India
· S u p p l y o f p a p e r : A n
acceleration in the supply of
paper in a bunched up
manner could impact market
performance
· Lo n g b o n d y i e l d s a r e
unlikely to retrace to lower
l e v e l s i n a h u r r y a n d
therefore any sharp and
sustained spike in bond
yields could impact the cost
of capital.
· Any political instability as a
result of the heavy election
calendar of 2018
Fixed Income Outlook: Policy rates
likely to remain on hold; Inflation
data holds the key
The key focus fo r RB I ' s
monetary policy is to keep
inflation under check and to
ensure that CPI (Consumer
Price Index) inflation remains
close to the medium term
target of ~4%. It is likely that
inflation stays elevated in
H 2 F Y 1 8 o n t h e b a c k o f
hardening food prices and the
pass through impact of the
HRA (House Rent Allowance)
hike post the implementation
of the recommendations of the th7 Pay Commission. We expect
41

FLAVOUR OF THE MONTH
ICICIdirect Money Manager January 2018
CPI inflation to average ~4% in
FY18E (March end inflation
likely to be ~5%) and between
4.7-5% in FY19E.
Given this backdrop, we
expect that policy rates would
be kept on hold for the medium
term as the central bank (RBI)
would monitor domestic CPI
inflation, trends in fiscal deficit
and the outcome of the policy
actions by the US Federal
Reserve.
In terms of liquidity, the stance
of the MPC (Monetary Policy
Committee) remains neutral.
The excess liquidity in the
system which had peaked post
demonetization, has been
coming off with increase in
currency in circulation. The
expectation is that liquidity
would remain marginally in
surplus in FY18 while moving
closer to neutral levels by
Q1FY19. RBI would however
continue to manage liquidity
t h r o u g h t h e L i q u i d i t y
Adjustment Facility (LAF) and
would also use open market
operations (OMOs) if the need
arises.
PVK Mohan, Head – Equity, Principal Pnb
Asset Management Company
CY 2017 – In retrospective
Over the past 12 months in CY 2017, we have witnessed a strong equity market rally with the Nifty 50 Index notching up 28% gains on the expectations of a broad economic revival, expectations of successful resolution of stressed assets and the recapitalization of banks, expected benefits from a GST rollout and a general pick up in earnings growth. The market clearly brushed aside e a r l y c o n c e r n s f r o m demonetization and initial hiccups of the GST rollout in Q2 CY 2017. But at the end of the CY 2017 after a strong market rally, we are now faced with lofty multiples for the equity market which has been supported by strong domestic
42
FLAVOUR OF THE MONTH
ICICIdirect Money Manager January 2018
liquidity from robust MF flows into equity funds. Earnings growth currently remains tepid for the markets as a whole, though street expects earnings to recover after bottoming out in the past quarter.
In CY 2017 YTD, India Equities as reflected by the Nifty 200 Index Returns de l ivered 3 1 . 8 6 % a n d t h e C R I S I L Balanced Fund Aggressive category returns delivered 24.77 %. Further India equities have outperformed Fixed Income and Gold, with the CRISIL Composite Bond Fund Index delivering 5.07% and Gold that delivering 2.86% over the same period (Data Source: www.nseindia.com, www.amf i ind ia .com and Bloomberg; Data as on 19 th
Dec 2017)
On the global front, on the back of a stronger US economy and earnings growth in 2017 and with an expected tax reform by the Trump administration to be rolled out in 2018, we expect US economy and markets to continue to trend strongly. This in turn has resulted in a rebound in oil prices and we now have oil price above USD 63.5 per barrel. This has
impacted the Indian macro picture adversely with current account deficit rising by nearly USD 7.2 Billion (nearly 1.2% of GDP) over Q3 2017. The stronger oil price has also spiked up headline inflation and inflation expectations driving up India Gilts yields (with the 10 years yield at about 7.25% currently) and has dented recent India bond market returns. Further with the current neutral stance maintained by the recent RBI credit policy and caution from rising CPI levels to 4.9% (up from 3.17% in Jan 2017), chances of any rate cuts in the next 6 months would be low. Also, a weaker Dollar and a high positive real rate in India has resulted in a stronger Rupee with the Rupee trading at about Rs. 64-65 / USD, which has impacted the pace of recovery in exports.
Having sa id th is , India 's macroeconomic parameters remain stable with the recent Sovereign rating upgrade by Moody signaling to investors the overall economic stability backed by ongoing reforms in the economy, steady FDI flows, and forex reserves of over USD
43
FLAVOUR OF THE MONTH
ICICIdirect Money Manager January 2018
400 Billion.
Ahead of general elections in 2019, and particularly after the results of the Gujarat elections i t i s e x p e c t e d t h a t t h e government will focus on the rural areas in the budget and in policy formulation. Hopefully, we should not see many instances of farm loan waiver as the union government has clearly said that it would not fund the states for these. Politically, the many state level elections in 2018 will keep news flow active, and the markets choppy, though the markets would look through these if the central government cont inues implement ing reforms.
T h e s e c u l a r l o n g - t e r m expected growth potential of India over the next 5-7 years is on the back of a strong demographic profile, rising urbanization and consumption growth, an efficient corporate s e c t o r a n d c o n t i n u e d e c o n o m i c r e f o r m s a n d development agenda of the government that is expected to give a fillip to infrastructure (roads, railways, ports, and airports), rural development and power. Another very
powerful theme is affordable h o u s i n g a n d s p r e a d o f digitalization under Digital India. These long-term trends are positive for future earnings growth and equity market returns over the next 3-5 years.
Outlook for CY2018
We are cautiously optimistic for the outlook on markets in 2018 on account of a host of global market factors, local macroeconomic situation which is stable with some headwinds on inflation, and a busy political season in the run up to the 2019 Genera l Elections. The Union budget f o r F Y 1 9 w o u l d b e a n important near-term market catalyst for India's equity markets, for overall fiscal situation and the trends in India's Bond markets. While we expect earnings growth and return ratios to recover over the next 4-6 quarters, (we expect earnings growth to be between 17-20% for FY 19), we expect near term equity market returns to be volatile through 2018. We do not see any major themes for 2018, rather the markets should reward bottom up stock selection and active management. India's bond
44

FLAVOUR OF THE MONTH
ICICIdirect Money Manager January 2018
market returns would mainly depend on the RBI policies in the backdrop of rising headline oil price and India CPI trend. We expect money-market bond yields to harden in H1, CY 2018 as l iquidity surplus reduces.
How should MF investors navigate the opportunities and risks in 2018?
Tactical Asset Allocation will be the key to investments in CY2018. Asset Allocation is a trade-off between investment-specific risk and return and is hence an antidote to market volatility. The main goal of asset allocation is to optimally diversify across core asset classes such as Equities, Fixed Income, Bank Deposits, Gold and Real Estate etc. in the context of the investor 's financial goals to minimize overall risk and maximize returns.
Different asset classes perform differently from one another during various regimes and time periods. Equity is a more volatile asset class but has historically delivered superior returns over longer periods and would be suitable for
wealth creation and beating inflation over the long haul. In contrast, debt instruments such as bonds have lower volatility and are suitable for steady income generation. But as these asset classes have low correlations, they can be suitably combined to develop well-diversified portfolios to deliver solid and consistent financial outcomes across time.
In essence, a diversified asset allocation helps investor feel more comfortable with the portfolio, when the market shifts. That's because the diversification enables better risk management: with a mix of different investment options from various asset classes, the impact may not be as much by changes to a single category. Diverse asset allocation also helps ride out market highs and lows and resist the urge to speculate dur ing market swings.
Mutual funds are the ideal vehicles for implementing strategic and tactical asset allocation for realizing financial goals. They offer various solutions to retail investors w h i l e l e v e r a g i n g t h e
45

FLAVOUR OF THE MONTH
ICICIdirect Money Manager January 2018
i nves tment exper t i se o f professionals. Furthermore, Systematic Investment plans (SIPs) in Mutual funds also give investors the opportunity to benef i t f rom rupee - cost averaging and help ride out the ebb and flow of markets and follow a disciplined long-term approach to wealth creation. “Mutual funds SahiHai” is the mantra!
Amongst various types of funds offered by Mutual funds, Dynamic asset allocation funds combines dual benefit of diversification as well as rebalancing, based on levels of m a r k e t v a l u a t i o n s . B y adjusting the equity exposure these funds aim to deliver superior risk adjusted returns a c r o s s m a r k e t r e g i m e s . F u r t h e r t h e s e f u n d s dynamically rebalance the
equity and f ixed income exposures in a tax-efficient manner. Thus, these funds e l i m i n a t e t h e n e e d f o r investors to resort to market-timing and avoid cumbersome rebalancing steps and the associated costs arising from exit loads.
In this regard, well managed Dynamic asset allocation funds may be suitable vehicles for coping with short term market vo la t i l i t y wh i l e o f fe r ing calibrated equity exposure and being optimally positioned to capitalize on India's potential growth opportunities and p o t e n t i a l f u t u r e c a p i t a l appreciation over the longer term. Additionally, Balanced Funds, would also continue to be an attractive investment category in 2018.
The views expressed in the article are personal views of the author and do not necessarily represent the views of ICICI Securities
The views expressed and information herein are independent views and for informative purpose only and under no circumstances should be construed as an opinion or Investment advice. The information contained herein is not intended to be an offer to seek solicitation for purchase or sale of any financial product or instrument. Investment involves risk. It should be understood that any reference to the securities/ sectors in the document is only for illustration purpose. Past performance is not indicative of future performance and investors may not get back the full amount invested. As an investor you are advised to conduct your own verification and consult your own financial and tax advisor before investing. The Sponsor, Trustee, AMC, Mutual Fund, their directors, officers or their employees shall not be liable in any way for any direct, indirect, special, incidental, consequential, punitive or exemplary damages arising out of the information contained herein. Mutual Fund investments are subject to market risks, read all scheme related documents carefully.
46

ASK OUR PLANNER
ICICIdirect Money Manager January 2018
Diversified investments can stabilize your personal finance portfolio
Q. My age is 37 years and I
want to retire at the age of 50. I
want to invest 15 lakh in mutual
funds for the next 10 years. Is this a
good idea or sha l l I invest
somewhere else? I am ready to
take risk. Please suggest what
avenues I should include in my
retirement portfolio.
- P. R. Maheshvari
A. Given that your time horizon
is more than 10 years, you can
consider investing into equity
mutual funds. You can invest
around 30-35% into mid-cap
funds, 40% into diversified
funds & the balance into large-
cap funds. If you are investing
a lumpsum at the current level,
it's better to invest the amount
into liquid or ultra-short term
debt mutual funds and shift the
amount gradually into equity
funds through a Systematic
Transfer Plan (STP).
2. I am looking for a short
term (3 to 5 years) investment, for
pre-closure of my home loan. I can
invest up to Rs. 5000 per month.
Help me with a proper investment
plan.
- Rohini Kalavare
A. If you are looking to invest
for the entire duration of 3-5
years and then withdraw the
amount to pre-close the loan,
you can consider Monthly
Income Plans (MIPs), with
growth option, as they largely
invest into debt and also invest
15-20% into equity, as well.
You can also look at investing
25% of the amount into
balanced mutual funds as well.
However, if you intend to make
part payments every year by
accumulating some funds,
then you can consider ultra-
short term debt funds. Making
part prepayment every year is
better, as it would reduce the
outstanding principal amount
every year, thereby reducing
the interest outgo.
3. I have a joint demat account
with my father. My father is the first
applicant and I'm the second
applicant. Are we both liable to pay
tax on short-term capital gains
earned from the sale of shares?
How taxes on capital gains work?
Please explain
47

ASK OUR PLANNER
ICICIdirect Money Manager January 2018
Long-term capital gains (units
held for 36 months or more):
Such gains would be taxed at
20% with indexation ^ +
Surcharge (if applicable)* +
3% Cess
For resident individuals, tax is
not deducted at source. You
would have to declare the
g a i n s a n d p a y t h e t a x .
However, for non-resident
individuals, the entire tax
amount is deducted at source.
* S u r c h a r g e a t 1 0 % i s
applicable for individuals with
income more than Rs.50 lakh
but less than Rs.1 crore and at
15% for individuals with
income more than Rs.1 crore.
^ Indexation is used to adjust
the purchase price to knock off
that portion of gains attributed
due to inflation.
5. I am a salaried woman and
my company deducts and pays tax
regularly. But, I missed filing my tax
return before July 31, 2017 this
year. Is there any way I can get this
done now? Will I be charged any
penalty?
- Mohana Dikshit
A. If you have missed on the
deadline of filing returns by the
- Mohit Thakker
A. Taxation on capital gain
earned from sale of shares
would fall only on the first
holder of the demat account.
Hence, in your case, your
father would have to declare
the capital gains in his income
tax return and pay tax on the
short-term capital gains on
shares.
4. I am an ICICI Direct customer
and am interested in investing in
debt mutual funds. Can you please
explain to me the tax / TDS
provisions of different Debt MF
schemes like liquid funds, FMPs,
GILT Funds, Debt long / short term,
etc?
- Hiten Vashi
A. For any mutual fund other
than equity-oriented funds, the
capital gains would be taxed as
below:
Short-term capital gains (units
held for less than 36 months):
Such gains would be added to
your income and taxed as per
your income slab. Say for
example, if you are at the
highest slab, then, you would
have to pay 30% + Surcharge
(if applicable)* + 3% Cess
48

ASK OUR PLANNER
ICICIdirect Money Manager January 2018
due date, you can still file a
belated return before the end
of the assessment year i.e.
before March 31, 2018. As of
now, if you have already paid
all your taxes and no further
amount is due, then you would
not be charged any penalty. If
you have any unpaid tax
liability, then filing your return
after due date would result in
levy of penal interest @ 1% per
month from the due date of
filing the return till the actual
date of filing. If you do not file
the return even by March 31,
2018, then you might be
charged a penalty of Rs.5,000/-
(even if there's no tax liability).
From next assessment year i.e.
2018-19 (when you would file
returns of financial year 2017-
18), if you are required to file
returns and you miss the
deadline, then you would be
charged a fee of Rs.5,000 if
returns are filed after the due
date, but before December 31
of the assessment year and
Rs.10,000 if filed beyond that.
However, if your total income
does not exceed Rs.5 lakh, the
fee payable shall be only
Rs.1,000.
It's always advisable to file your
returns within the due date. If
you do not file the returns
within the due date, you will
miss out on the below benefits:
No carry forward of losses: You
will not be able to carry forward
t h e l o s s e s f r o m
business/profession, capital
gains and other sources to the
next year, to set off from the
next year's income.
Loss in interest on refunds: If
you are claiming a refund, the
interest on refund is normally
computed from April 1 of the
assessment year till the date of
granting refund. However, in
case of a belated return,
interest is computed from the
actual date of filing the return,
instead of April 1, till the date of
granting refund.
Do you also have similar queries to ask our experts? Write to us at: [email protected].
49

MUTUAL FUND ANALYSIS
Investing in ELSS funds
ICICIdirect Money Manager January 2018
Equity linked savings schemes (ELSS) are diversified equity mutual fund schemes that are eligible for tax benefits under Section 80C of the Income Tax Act. It is the only fully equity investment option available under Section 80C. ELSS gives aggressive investors an ideal option to utilise tax benefit to invest in equity oriented funds. Effectively, ELSS are multicap mutual funds with similar return profile. The lock-in period of three years is lowest among other investment options available under Section 80C of the Income Tax Act.
Advantages of ELSS
§ Investment in ELSS is eligible for tax benefits under section 80C. Maximum tax savings up to | 46,350 on an investment of | 1.5 lakh in a financial year
§ ELSS invests in equity stocks, which has greater potential for long term capital appreciation. Professional, experienced f und m anager s ano the r positive.
§ Capital gains at the end of the lock-in period are completely tax free
§ The lock-in period of three years curtails panic selling in case of interim volatility in e q u i t y m a r k e t s . H e n c e , investments reap the benefit of long term investing in equities
§ S y s t e m a t i c m o d e o f investment (regular monthly investment) available
ELSS category nature
ELSS funds are the only fully equity-based investment option under Section 80C. As such, the performance potential of ELSS
funds is superior compared to alternatives like National Pension S y s t e m ( N P S ) , E m p l o y e e s Provident Fund (EPF)/Voluntary Provident Fund (VPF), Public Provident Fund (PPF) and tax-saving fixed deposits (FDs). ELSS funds have displayed consistent performance.
H is tor ica l ly, the ELSS fund performance has not deviated directionally from the performance of other equity fund categories. This is because ELSS funds have tended to invest across market caps – large, mid and small, thus keeping performance in line with the general performance of the wider equity markets, as a whole. This lack of market cap bias enables comparison of ELSS fund performance with that of multi-cap funds (also known as diversified equity funds). In recent times, ELSS funds have delivered returns in line with multicap funds.
Under th is background, we recommend the following funds: L&T Tax Advantage Fund, Franklin India Taxshield Fund and Reliance Tax Saver Fund
50

MUTUAL FUND ANALYSIS
ICICIdirect Money Manager January 2018
L&T Tax Advantage Fund
Fund Objective:To generate long-term capital growth from a diversified portfolio of predominantly equity and equity-related securities.
Key Information:
Product Label:
Investors understand that their principal will be at moderately high risk
This product is suitable for investors who are seeking:• Long term capital growth• Investment predominantly in equity and equity related securities
Performance:The fund has been among the top two quartiles performance wise over the last one, three and five year periods (as of December 31). It has managed to outperform the category and the benchmark across these time frames. The margin of outperformance over its benchmark has increased in recent times. It has generated CAGR of 16.6% and 19.6% in the last three years and five years vs. 10.9% and 14.1% r e t u r n s b y b e n c h m a r k , respectively (as of December 31, 2017.
Portfolio:Financial and consumption s t o c k s h a v e l e d t o outperformance of the scheme recently. Additionally, the fund
manager has demonstrated good stock picking ability in the commodities space as well as some turnaround opportunities by identifying gainers quite early
Fund Benchmark
Performance vs. Benchmark
NAV as on December 29, 2017 (`) 57.5
Inception Date February 27, 2006
Fund Manager Soumendra Nath Lahiri
Minimum Investment (`)
Lumpsum 500
SIP 500
Expense Ratio (%) 2.08
Exit Load Nil
Benchmark S&P BSE 200
Last declared Quarterly AAUM(` cr) 2762
42.3
16.6
19.6
15.9
33.3
10.9
14.1
11.5
0
10
20
30
40
50
1 Year 3 Year 5 Year Since Inception
51
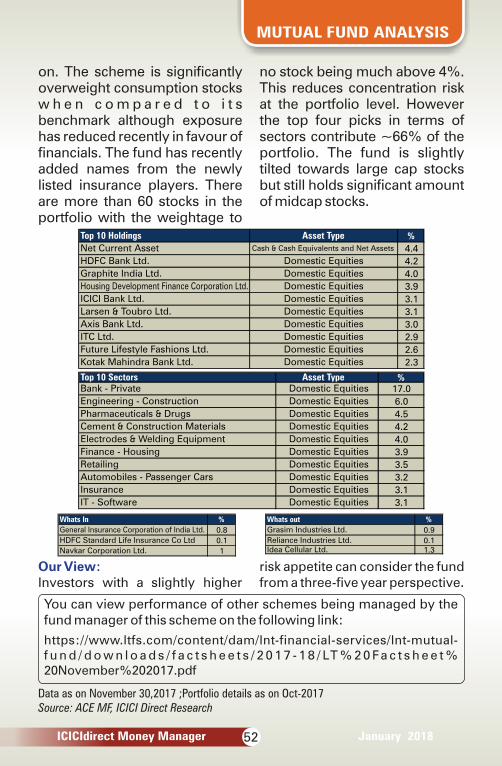
MUTUAL FUND ANALYSIS
ICICIdirect Money Manager January 2018
on. The scheme is significantly overweight consumption stocks w h e n c o m p a r e d t o i t s benchmark although exposure has reduced recently in favour of financials. The fund has recently added names from the newly listed insurance players. There are more than 60 stocks in the portfolio with the weightage to
no stock being much above 4%. This reduces concentration risk at the portfolio level. However the top four picks in terms of sectors contribute ~66% of the portfolio. The fund is slightly tilted towards large cap stocks but still holds significant amount of midcap stocks.
%
4.4
4.2
4.0
3.9
3.1
3.1
3.0
2.9
2.6
2.3
Top 10 Holdings Asset Type
Domestic Equities
ICICI Bank Ltd. Domestic Equities
Larsen & Toubro Ltd. Domestic Equities
Axis Bank Ltd. Domestic Equities
ITC Ltd. Domestic Equities
Future Lifestyle Fashions Ltd. Domestic Equities
Net Current Asset Cash & Cash Equivalents and Net Assets
HDFC Bank Ltd. Domestic Equities
Graphite India Ltd. Domestic Equities
Housing Development Finance Corporation Ltd.
Kotak Mahindra Bank Ltd. Domestic Equities
%17.0
6.0
4.5
4.2
4.0
3.9
3.5
3.2
3.1
3.1
Top 10 Sectors Asset TypeBank - Private Domestic Equities
Engineering - Construction
Domestic Equities
Insurance Domestic Equities
IT - Software Domestic Equities
Finance - Housing Domestic Equities
Retailing Domestic Equities
Automobiles - Passenger Cars Domestic Equities
Domestic Equities
Pharmaceuticals & Drugs Domestic Equities
Cement & Construction Materials Domestic Equities
Electrodes & Welding Equipment
%
0.8
0.1
1Navkar Corporation Ltd.
Whats In
General Insurance Corporation of India Ltd.
HDFC Standard Life Insurance Co Ltd
%
0.9
0.11.3
Whats out
Grasim Industries Ltd.
Reliance Industries Ltd.Idea Cellular Ltd.
52
Our View:Investors with a slightly higher
risk appetite can consider the fund from a three-five year perspective.
You can view performance of other schemes being managed by the fund manager of this scheme on the following link:
https://www.ltfs.com/content/dam/lnt-financial-services/lnt-mutual-f u n d / d o w n l o a d s / f a c t s h e e t s / 2 0 1 7 - 1 8 / LT % 2 0 Fa c t s h e e t % 20November%202017.pdf
Data as on November 30,2017 ;Portfolio details as on Oct-2017Source: ACE MF, ICICI Direct Research

MUTUAL FUND ANALYSIS
ICICIdirect Money Manager January 2018
Franklin India Taxshield Fund
Fund Objective:To provide medium to long term growth of capital along with income tax rebate.
Key Information:
This product is suitable for investors who are seeking*:
• Long term capital appreciation
• An ELSS fund offering tax benefits under Section 80C of the Income Tax Act
Product Label:
Performance:The fund has outperformed its benchmark over most periods, however the performance has suffered over the last year. It has beaten the benchmark Nifty 500 Index by ~0.2% CAGR (three years) and ~3.5% CAGR (f ive years) (as of December 31, 2017).
Fund Benchmark
Performance vs. Benchmark
Investors under-stand that their principal will be at moderately high risk
Portfolio:The portfolio over the last year has reduced exposure to financials, healthcare and technology stocks in favour of energy and utility stocks. In t e r m s o f p o r t f o l i o construction, the fund has a
significant large cap bias, with ~80% of the portfolio invested in such stocks with midcap stocks making up the rest. The proportion of large cap stocks in the portfolio has increased over the last month or so. This has contributed to the recent
NAV as on December 29, 2017 (`) 565.4
Inception Date April 10, 1999
Fund Manager Lakshmikanth Reddy
Minimum Investment (`)
Lumpsum 500
SIP 500
Expense Ratio (%) 2.36
Exit Load Nil
Benchmark NIFTY 500
Last declared Quarterly AAUM(` cr) 3417
29.1
12.1 18.6 243
5.9
11.9
14.9
0
0
10
20
30
40
1 Year 3 Year 5 Year Since Inception
53

MUTUAL FUND ANALYSIS
ICICIdirect Money Manager January 2018
underperformance to some ex ten t , espec ia l l y when compared to peers which are more multicap in nature. Currently there are ~60 stocks
in the portfolio with some of the top picks being fairly concentrated positions. The fund currently has ~9% cash in the portfolio as well.
Our View:Putt ing as ide the recent u n d e r p e r f o r m a n c e , t h e scheme is one of the few ELSS offerings with a long term track record of performance. We
der ive comfort f rom the presence of an experienced and pedigreed fund manager. Investors with a slightly longer term horizon can consider this fund within the ELSS category.
%
7.8
7.7
5.7
4.5
4.0
3.3
3.1
3.0
3.0
2.6
Top 10 Holdings Asset Type
State Bank Of India Domestic Equities
Indian Oil Corporation Ltd. Domestic Equities
HDFC Bank Ltd. Domestic Equities
Call Money Cash & Cash Equivalents and Net Assets
Axis Bank Ltd. Domestic Equities
Mahindra & Mahindra Ltd. Domestic Equities
Kotak Mahindra Bank Ltd. Domestic Equities
Bharti Airtel Ltd. Domestic Equities
Yes Bank Ltd. Domestic Equities
Hindustan Unilever Ltd. Domestic Equities
%25.4
6.0
5.1
4.9
4.0
3.6
3.5
3.3
3.2
3.1
Top 10 Sectors Asset Type
Power Generation/Distribution Domestic Equities
Automobiles - Passenger Cars
Domestic Equities
IT - Software Domestic Equities
Telecommunication - Service Provider Domestic Equities
Bank - Private
Bank - Public Domestic Equities
Automobile Two & Three Wheelers Domestic Equities
Domestic Equities
Refineries Domestic Equities
Household & Personal Products Domestic Equities
Pharmaceuticals & Drugs Domestic Equities
%
4
Whats In
Kotak Mahindra Bank Ltd.
%
0.2
Whats out
Aditya Birla Capital Ltd.
Data as on December 31,2017 ;Portfolio details as on Nov-2017Source: ACE MF, ICICI Direct Research
You can view performance of other schemes being managed by the fund manager of this scheme on the following link:
https://www.franklintempletonindia.com/downloadsServlet?docid=jaytocqq
54
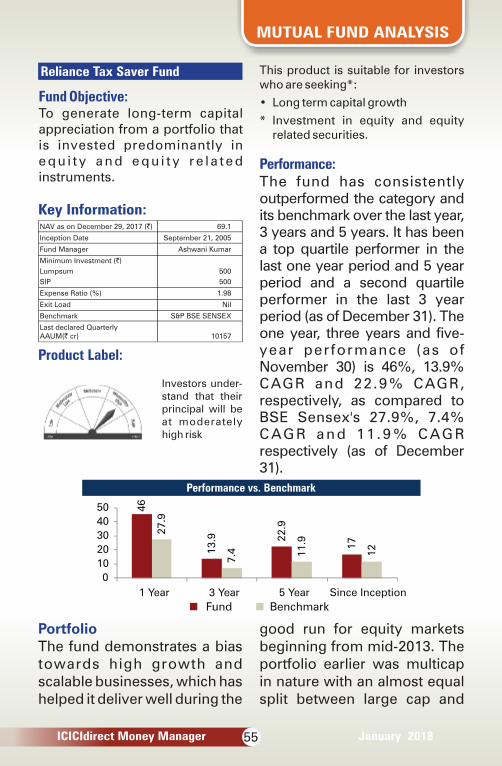
MUTUAL FUND ANALYSIS
ICICIdirect Money Manager January 2018
Reliance Tax Saver Fund
Fund Objective:To generate long-term capital appreciation from a portfolio that is invested predominantly in e q u i t y a n d e q u i t y r e l a t e d instruments.
Key Information:
Product Label:
This product is suitable for investors who are seeking*:
• Long term capital growth
* Investment in equity and equity related securities.
Performance:The fund has consistently outperformed the category and its benchmark over the last year, 3 years and 5 years. It has been a top quartile performer in the last one year period and 5 year period and a second quartile performer in the last 3 year period (as of December 31). The one year, three years and five-year performance (as of November 30) is 46%, 13.9% CAGR and 22.9% CAGR, respectively, as compared to BSE Sensex's 27.9%, 7.4% CAGR and 11 .9% CAGR respectively (as of December 31).
Performance vs. Benchmark
Fund Benchmark
Investors under-stand that their principal will be at moderately high risk
PortfolioThe fund demonstrates a bias towards high growth and scalable businesses, which has helped it deliver well during the
good run for equity markets beginning from mid-2013. The portfolio earlier was multicap in nature with an almost equal split between large cap and
NAV as on December 29, 2017 (`) 69.1
Inception Date September 21, 2005
Fund Manager Ashwani Kumar
Minimum Investment (`)
Lumpsum 500
SIP 500
Expense Ratio (%) 1.98
Exit Load Nil
Benchmark S&P BSE SENSEX
Last declared Quarterly AAUM(` cr) 10157
46
13.9 2
2.9
17
27.9
7.4 1
1.9
12
0
10
20
30
40
50
1 Year 3 Year 5 Year Since Inception
55

MUTUAL FUND ANALYSIS
ICICIdirect Money Manager January 2018
mid cap stocks. However recently it has added some more large cap stocks giving it a slightly greater large cap tilt. W h e n c o m p a r e d t o i t s benchmark, the scheme is underweight on financials and significantly overweight on automobiles. It has exited
some financial stocks over the last month. While some of the top stock picks have fairly healthy allocations, at the overall portfolio level the scheme seeks to mitigate concentration risk with a fairly large number of holdings (60+ currently).
%
7.6
7.1
5.5
5.5
4.8
4.1
3.4
3.2
3.2
3.1
Top 10 Holdings Asset Type
TVS Motor Company Ltd. Domestic Equities
State Bank Of India Domestic Equities
Tata Steel Ltd. Domestic Equities
ICICI Bank Ltd. Domestic Equities
Infosys Ltd. Domestic Equities
Tata Motors Ltd. Domestic Equities
Bharti Airtel Ltd. Domestic Equities
Honeywell Automation India Ltd. Domestic Equities
Bharat Forge Ltd. Domestic Equities
ABB India Ltd. Domestic Equities
%10.9
7.6
7.5
6.1
5.8
5.6
5.5
4.1
4.0
3.5
Top 10 Sectors Asset Type
Electric Equipment Domestic Equities
IT - Software
Automobile Two & Three Wheelers Domestic Equities
Cement & Construction Materials Domestic Equities
Bank - Public Domestic Equities
Automobiles-Trucks/Lcv Domestic Equities
Forgings Domestic Equities
Domestic Equities
Bank - Private Domestic Equities
Auto Ancillary Domestic Equities
Steel & Iron Products Domestic Equities
%
0.2
0.3
0.2Orient Cement Ltd.
Whats In
The New India Assurance Co. Ltd.
HDFC Standard Life Insurance Co Ltd
%
0.9
1.5
Whats out
Bharat Petroleum Corporation Ltd.
Axis Bank Ltd.
56

MUTUAL FUND ANALYSIS
ICICIdirect Money Manager January 2018
Our View:The fund is slightly on the aggressive side with significant midcap holdings. However, the
portfolio is well constructed in terms of sector-level and stock-level diversification.
You can view performance of other schemes being managed by the fund manager of this scheme on the following link: https://www.reliancemutual.com/InvestorServices/FactsheetsDocuments/Fundamentals-December-2017.pdf
Performance of other schemes managed by these fund managers:
2. Franklin India Taxshield Fund
1. L&T Tax Advantage Fund
Note : The schemes may or may not have been managed by the same Fund Manager since its inceptionNote: The concerned Fund Manager manages 5 other schemes of the concerned Mutual Fund
66.96 28.22 --60.87 20.62 21.2162.20 23.77 23.5335.30 6.67 7.0453.21 23.18 28.9748.42 19.40 20.05
35.32 11.96 17.1634.54 11.18 14.0628.27 13.86 18.286.11 8.19 8.65
11.76 5.89 13.656.11 8.19 8.65
Performance of other schemes managed by the fund manager - Soumendra Nath Lahiri
L&T Infrastructure Fund-Reg(G)NIFTY INFRAL&T Midcap Fund-Reg(G)Nifty Free Float Midcap 100
S&P BSE 200L&T India Prudence Fund-Reg(G)
Fund Name 1 Year 3 Years 5 Years
Top 3 Performing Schemes L&T Emerging Businesses Fund-Reg(G)S&P BSE Small-Cap
Crisil Short Term Bond Fund Index
L&T Equity Fund-Reg(G)Bottom 3 Performing Schemes
Crisil Short Term Bond Fund IndexL&T Dynamic Equity Fund-Reg(G)
32.23 12.08 18.3329.95 8.48 12.2430.23 12.54 18.6529.95 8.48 12.2421.75 11.29 16.5029.95 8.48 12.24
13.99 9.35 12.440.03 7.42 7.029.57 8.35 10.440.03 7.42 7.02
Performance of other schemes managed by the fund manager - Lakshmikanth Reddy
Franklin India Taxshield(G)NIFTY 50Franklin India Balanced Fund(G)NIFTY 50
Fund Name 1 Year 3 Years 5 Years
Top 3 Performing Schemes Franklin India Flexi Cap Fund(G)NIFTY 50
Crisil 10 Yr Gilt IndexFranklin India MIP(G)Crisil 10 Yr Gilt Index
Bottom 3 Performing SchemesFranklin India Pension Plan(G)
57

MUTUAL FUND ANALYSIS
ICICIdirect Money Manager January 2018
Data as on December 31,2017 ;Portfolio details as on Nov-2017Source: ACE MF, ICICI Direct Research
Note : The schemes may or may not have been managed by the same Fund Manager since its inceptionNote : The concerned Fund Manager manages 6 other schemes of the concerned Mutual Fund
3. Reliance Tax Saver Fund
Note : The schemes may or may not have been managed by the same Fund Manager since its inceptionNote : The concerned Fund Manager manages 4 other schemes of the concerned Mutual Fund
44.46 20.94 30.1429.95 8.48 12.2440.98 18.14 25.4429.95 8.48 12.2436.69 13.60 18.5029.95 8.48 12.24
32.23 12.08 18.3329.95 8.48 12.2431.81 13.16 18.9029.95 8.48 12.2430.23 12.54 18.6529.95 8.48 12.24
NIFTY 50
Top 3 Performing Schemes Franklin India Smaller Cos Fund(G)NIFTY 50Franklin India Prima Fund(G)NIFTY 50Franklin India Opportunities Fund(G)NIFTY 50
Bottom 3 Performing SchemesFranklin India Flexi Cap Fund(G)
Performance of other schemes managed by the fund manager - R. Janakiraman
Fund Name 1 Year 3 Years
NIFTY 50Franklin India Prima Plus Fund(G)
Franklin India Taxshield(G)NIFTY 50
5 Years
47.87 14.19 22.9532.83 9.85 13.0442.68 13.09 18.1532.83 9.85 13.0439.90 12.92 18.2134.54 11.18 14.06
-- -- --34.54 11.18 14.06
Performance of other schemes managed by the fund manager - Ashwani Kumar
Reliance Vision Fund(G)S&P BSE 100Reliance Top 200 Fund(G)S&P BSE 200
Fund Name 1 Year 3 Years 5 Years
Top 3 Performing Schemes Reliance Tax Saver (ELSS) Fund(G)S&P BSE 100
S&P BSE 200
Bottom 3 Performing SchemesReliance Capital Builder Fund-IV-B(G)
58

ICICIdirect Money Manager January 2018
What is iCommunity?iCommunity is ICICIdirect's interactive platform where one can answer and get answered as well. With extensive range of forums, events & discussions iCommunity serves as an opportunity to learn more about financial world.
This month on iCommunity
DiscussionsFinancial Planning related discussionVisit http://community.icicidirect.com/content /who-will-win-2018-hare-or-tortoiseand let us know which character do you identify the most with? "HARE OR TORTOISE"?
Buzz in the Market
Do you think that India has the potential to grow at 7%+ in 2018?
D e s p i t e i n i t i a l s e t b a c k s f r o m demonetisation and GST, India is estimated to have grown at 6.7% in 2017. It is believed that the country has enormous growth potential compared to other emerging economies with the implementation of comprehensive reforms.
So, do you believe that India has the potential to grow at 7%+ in 2018?
Come and be a part of this discussion with fellow traders and investors on iCommunity. Join the discussion here :http://community.icicidirect. com/service_forum
Q & A ForumSeek answers to your queries regarding investments and market updates for free. Questions like: > What is futures and options in trading world?> What's the process to apply for IPO?> I have 20 shares of XXXX stock. Should I hold or sell?
59

EQUITY MODEL PORTFOLIO
ICICIdirect Money Manager January 2018
Our indicative large-cap equity model portfolio has continued to deliver an impressive return (inclusive of dividends) of 125.72% till date (as on January 11, 2017) since its inception (June 21, 2011) vis-à-vis the benchmark index (S&P BSE Sensex) return of 102.05% during the same period, an outperformance of 23.67. This validates our thesis of selecting companies with sound business fundamentals that forms the core theme of our portfolio. Our midcap portfolio of 16 stocks continues to outperform well, delivering 416.15% (inclusive of dividends) till date (as on December 18, 2017) vis-à-vis the benchmark index (CNX Midcap) return of 181.41%, outperformance of 234.74%. Our consistent outperformance demonstrates our superior stock picking ability as markets aligned to our view of favourable risk reward, good franchisee vs. reward-at-any-risk businesses.
We have always suggested the SIP mode of investment and still find a lot of merit in it as the preferred mode of deployment given the market conditions and volatility associated since the inception of the portfolio. We highlight that the SIP return of our portfolio has consistently outperformed the indices.
Following the same pace and opportunities in the market, our portfolio (large caps) remain overweight on BFSI sector – HDFC Bank (10%), HDFC (9%), Axis Bank (6%) Bajaj Finance (6%) and SBI (6%). Affirming our view on consumption demand, Dabur (5%) and Asian Paints (5%) continue to be part of our large cap portfolio. However, there's an addition of metal sector- Hindustan Zinc (6%) in the revised portfolio.
We remain positive on auto, IT and pharma. We remain overweight to neutral on pure play defensives (IT, FMCG) as secular earnings coupled with sector rotation could lead to consolidation in near term valuations and offer stock specific opportunities.
Among individual names, we continue to recommend TCS in the IT space. A revival in the capex cycle coupled with lower interest rate scenario would benefit the BFSI and construction space (UltraTech, L&T, SBI, Asian Paints).
60

EQUITY MODEL PORTFOLIO
ICICIdirect Money Manager January 2018
Name of the company
Largecap Stocks
Model Portfolio
Largecap(%)
Midcap(%)
Diversified(%)
Auto 16.0 11.2
Tata Motor DVR 4.0 2.8
Maruti 5.0 3.5
EICHER Motors 3.0 2.1
Mahindra & Mahindra (M&M) 4.0 2.8
BFSI 37.0 25.9
HDFC Bank 10.0 7.0
Axis Bank 6.0 4.2
HDFC 9.0 6.3
Bajaj Finance 6.0 4.2
SBI 6.0 4.2
Capital Goods 4.0 2.8
L & T 4.0 2.8
Cement 4.0 2.8
UltraTech Cement 4.0 2.8
FMCG/Consumer 18.0 12.6
Dabur 5.0 3.5
Marico 4.0 2.8
Asian Paints 5.0 3.5
Nestle 4.0 2.8
IT 6.0 4.2
TCS 6.0 4.2
Media 4.0 2.8
Zee Entertainment 4.0 2.8
Metals 6.0 4.2
Hindustan Zinc 6.0 4.2
Oil and Gas 5.0 3.5
GAIL Ltd. 5.0 3.5
Largecap share in diversified 100.0 70.0
61

EQUITY MODEL PORTFOLIO
ICICIdirect Money Manager January 2018
ICICI Securities has received a mandate from Indian Bank'.
Auto 6.0 1.8
Bharat Forge 6.0 1.8
BFSI 20.0 6.0
Bajaj Finserve 8.0 2.4
J&K Bank 6.0 1.8
Indian Bank 6.0 1.8
Capital Goods 6.0 1.8
Bharat Electronics 6.0 1.8
Cement 6.0 1.8
Ramco Cement 6.0 1.8
Consumer 36.0 10.8
Symphony 6.0 1.8
Supreme Ind 6.0 1.8
Kansai Nerolac 6.0 1.8
Pidilite 6.0 1.8
Tata Chemicals 6.0 1.8
Bata 6.0 1.8
Metals 6.0 1.8
Graphite India 6.0 1.8
Infrastructure 8.0 2.4
NBCC 8.0 2.4
Logistics 6.0 1.8
Container Corporation of India 6.0 1.8
Textile 6.0 1.8
Arvind 6.0 1.8
Total 100.0 30.0
Midcap share in diversified 30
TOTAL 100 0 100.0
62

Performance* so far since inception
*Returns (in %) as on Jan 18, 2018
Large-cap Portfolio Benchmark: BSE Sensex; Mid-cap Portfolio
Benchmark: CNX Midcap; Diversified Portfolio Benchmark: Combination
of BSE Sensex and CNX Midcap
Value of 1,00,000 invested via SIP at the end of every month `
Portfolio Benchmark
Investment Value of Investment in Portfolio Value if invested in Benchmark
Start date of SIP: June 30, 2011; *Value as on Jan 18, 2018
EQUITY MODEL PORTFOLIO
ICICIdirect Money Manager January 2018
125.7215384
416.1527575
188.0248492
102.0502482
181.418671122.2404779
0255075
100125150175200225250275300325350375400425450
Large Cap Midcap Diversified
%
80
00
00
0
80
00
00
0
80
00
00
0
12
14
97
55
.71
14
36
60
50
.58
11
00
30
34
.19
14
89
84
96
.6
12
46
71
35
.05
3500000
4500000
5500000
6500000
7500000
8500000
Largecap Midcap Divesified
63

QUIZ TIME
1. GDP growth of India recovered to _______________ in second quarter of Fy18.
2. As per the latest data for 2017, equity based ETFs have received almost ________ the record inflows seen in 2016.
3. ______________ is a trade-off between investment-specific risk and return and is hence an antidote to market volatility.
4. Lower than expected GST collections would be an overhang on_________ financing.
5. Agriculture loan waiver and increase in disposable income are less likely to provide support to food & beverages consumption and basic housing needs. True/False
Note: All the answers are in the stories that have appeared in this edition of ICICIdirect Money Manager. You may send in your answers at: [email protected]. The answers will be published in our next edition. The names of the earliest all correct entries will be published too. So jog your grey cells and be quick to send in your entries.
Correct answers for the December2017 quiz are:
1. ______________ is a key element of establishing a successful financial plan.A. Tax-planning
2. Young investors should prioritize _____________ over provident funds for tax saving.A. Equity
3. Entire amount paid towards insurance premiums cannot be deducted while calculating taxable income.True/ falseA. True
4. __________________ offers investor the liberty to allocate his money across three asset classes based on his risk profile.A. National pension system (NPS)
5. Parents of children pursuing higher studies can claim deduction only on the __________ paid on education loan.A. Interest
Congratulations to the following winner for providing correct answers!
N K Damle
ICICIdirect Money Manager January 201864
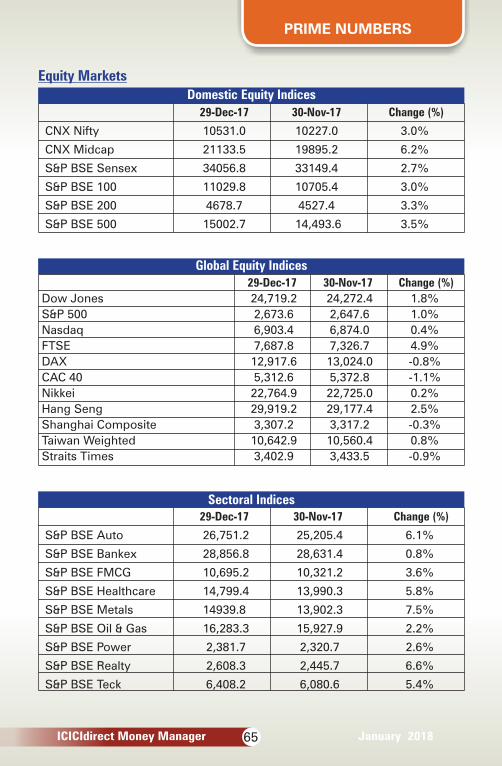
PRIME NUMBERS
Equity Markets
ICICIdirect Money Manager January 2018
Domestic Equity Indices
Global Equity Indices
Sectoral Indices
29-Dec-17 30-Nov-17 Change (%)
CNX Nifty 10531.0 10227.0 3.0%
CNX Midcap 21133.5 19895.2 6.2%
S&P BSE Sensex 34056.8 33149.4 2.7%
S&P BSE 100 11029.8 10705.4 3.0%
S&P BSE 200 4678.7 4527.4 3.3%
S&P BSE 500 15002.7 14,493.6 3.5%
29-Dec-17 30-Nov-17 Change (%)
Dow Jones 24,719.2 24,272.4 1.8%
S&P 500 2,673.6 2,647.6 1.0%
Nasdaq 6,903.4 6,874.0 0.4%
FTSE 7,687.8 7,326.7 4.9%
DAX 12,917.6 13,024.0 -0.8%
CAC 40 5,312.6 5,372.8 -1.1%
Nikkei 22,764.9 22,725.0 0.2%
Hang Seng 29,919.2 29,177.4 2.5%
Shanghai Composite 3,307.2 3,317.2 -0.3%
Taiwan Weighted 10,642.9 10,560.4 0.8%
Straits Times 3,402.9 3,433.5 -0.9%
29-Dec-17 30-Nov-17 Change (%)
S&P BSE Auto 26,751.2 25,205.4 6.1%
S&P BSE Bankex 28,856.8 28,631.4 0.8%
S&P BSE FMCG 10,695.2 10,321.2 3.6%
S&P BSE Healthcare 14,799.4 13,990.3 5.8%
S&P BSE Metals 14939.8 13,902.3 7.5%
S&P BSE Oil & Gas 16,283.3 15,927.9 2.2%
S&P BSE Power 2,381.7 2,320.7 2.6%
S&P BSE Realty 2,608.3 2,445.7 6.6%
S&P BSE Teck 6,408.2 6,080.6 5.4%
65

PRIME NUMBERS
ICICIdirect Money Manager January 2018
Debt Markets
Government Securities (G-Sec) Yields (in %) Dec-17 Nov-17 Change (bps)
Corporate Bond Yields (in %) Dec-17 Nov-17 Change (bps)
Commercial Paper (CP) Rates (in %) Dec-17 Nov-17 Change (bps)
Treasury Bill (T-Bills) Yields (in %) Dec-17 Nov-17 Change (bps)
Volatility Index (VIX)
29-Dec-17 30-Nov-17 Change (%)
VIX 12.67 13.55 0%
10 year 7.32 7.05 27
5 year 7.11 6.90 21
3 year 6.77 6.59 18
1 year 6.28 6.20 8
AAA 10 year 8.19 7.91 28
AAA 5 year 7.65 7.37 28
AAA 3 year 7.58 7.29 29
AAA 1 year 7.37 6.93 44
AA 10 year 8.52 8.34 18
AA 5 year 8.24 8.00 24
AA 3 year 8.06 7.76 30
AA 1 year 7.71 7.37 34
12 Months 7.53 7.19 34
6 Months 7.33 7.00 33
3 Months 7.06 6.80 26
1 Month 6.86 6.58 29
91D TB 6.20 6.12 8
182D TB 6.32 6.22 10
364D TB 6.40 6.27 13
66
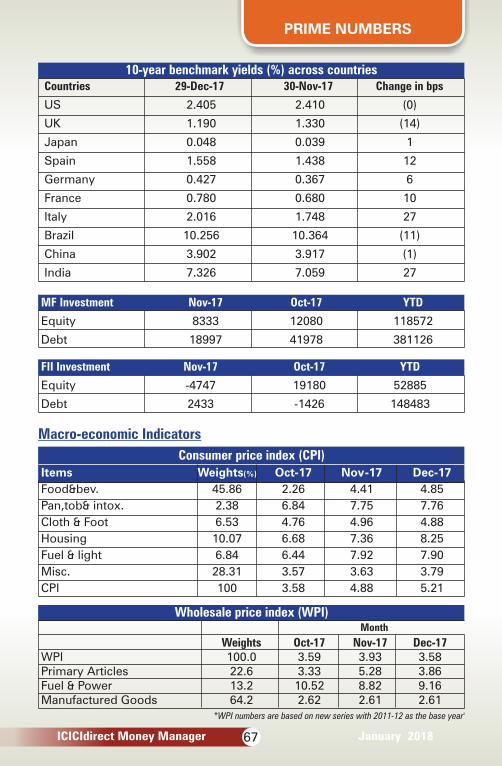
PRIME NUMBERS
10-year benchmark yields (%) across countries
ICICIdirect Money Manager January 2018
Macro-economic Indicators
Consumer price index (CPI)
Wholesale price index (WPI)Month
*WPI numbers are based on new series with 2011-12 as the base year'
Countries 29-Dec-17 30-Nov-17 Change in bps
US 2.405 2.410 (0)
UK 1.190 1.330 (14)
Japan 0.048 0.039 1
Spain 1.558 1.438 12
Germany 0.427 0.367 6
France 0.780 0.680 10
Italy 2.016 1.748 27
Brazil 10.256 10.364 (11)
China 3.902 3.917 (1)
India 7.326 7.059 27
MF Investment Nov-17 Oct-17 YTD
Equity 8333 12080 118572
Debt 18997 41978 381126
FII Investment Nov-17 Oct-17 YTD
Equity -4747 19180 52885
Debt 2433 -1426 148483
Items Weights(%) Oct-17 Nov-17 Dec-17
Food&bev. 45.86 2.26 4.41 4.85
Pan,tob& intox. 2.38 6.84 7.75 7.76
Cloth & Foot 6.53 4.76 4.96 4.88
Housing 10.07 6.68 7.36 8.25
Fuel & light 6.84 6.44 7.92 7.90
Misc. 28.31 3.57 3.63 3.79
CPI 100 3.58 4.88 5.21
Weights Oct-17 Nov-17 Dec-17WPI 100.0 3.59 3.93 3.58Primary Articles 22.6 3.33 5.28 3.86Fuel & Power 13.2 10.52 8.82 9.16Manufactured Goods 64.2 2.62 2.61 2.61
67

PRIME NUMBERS
Commodities
Sources for above data: Bloomberg, Reuters, CRISIL, MOSPI, ICICIdirect.com Research
ICICIdirect Money Manager January 2018
Mutual Funds: Category Average Returns
Equity Funds Returns (in %)Tenure Diversified Funds Mid-cap &
Small-cap Funds
Large-capFunds
ELSS (Tax-
savingfunds)
Returns as on December 29, 2017
Debt Funds Returns (in %)
Returns as on December 29, 2017
Tenure Liquid Funds
Index of industrial production (IIP) Sector-wise growth rate (%)
Currencies and CommoditiesCurrencies
*IIP numbers are based on new series with 2011-12 as the base year'
Debt ST Ultra ST Debt LT
Categories 30-Oct-17 30-Sep-17 30-Aug-17 Weight(%)Mining 7.1 2.2 0.1 14.4Manufacturing -1.0 1.5 3.9 77.6Electricity -0.5 -3.2 2.3 8.0Overall -0.1 1.2 3.2 100.0
29-Dec-17 29-Nov-17 Change (%) StatusUSDINR 63.9 64.3 -0.7% AppreciatedEURINR 76.5 76.1 0.5% DepreciatedGBPINR 86.3 86.2 0.0% DepreciatedAUDINR 49.9 48.8 2.4% DepreciatedCHFINR 65.5 65.3 0.3% DepreciatedJPYINR 0.6 0.6 -1.5% AppreciatedCNYINR 9.8 9.7 1.0% Depreciated
29-Dec-17 29-Nov-17 Change (%)Crude ($/barrel) 66.8 62.8 6.4%Gold ($/ounce) 1,303.1 1,274.9 2.2%
6 months 14.96 19.49 12.16 14.911 year 37.52 48.04 33.26 37.963 year 13.85 19.62 11.21 13.845 year 18.43 25.87 15.27 18.20
6 months 6.20 4.86 5.96 1.95
1 year 6.18 6.07 6.41 4.34
3 year 7.16 7.90 7.71 7.61
68


Printed by jasmine Art Printers Pvt. Ltd., A-737/3, TTC Ind. Area, MIDC, Navi Mumbai - 400 710.