ici pakistan limited company information 3 report of the ...of pakistan pta limited from 1 january...
TRANSCRIPT
1
ICI Pakistan Limited
Company Information 3Report of the Directors 4Auditors' Report to the Members 29Balance Sheet 30Profit and Loss Account 32Cash Flow Statement 33Statement of Changes in Equity 35Notes to the Accounts 36Pattern of Shareholding 60Comparison of Results for 6 years 62Notice of Meeting 64
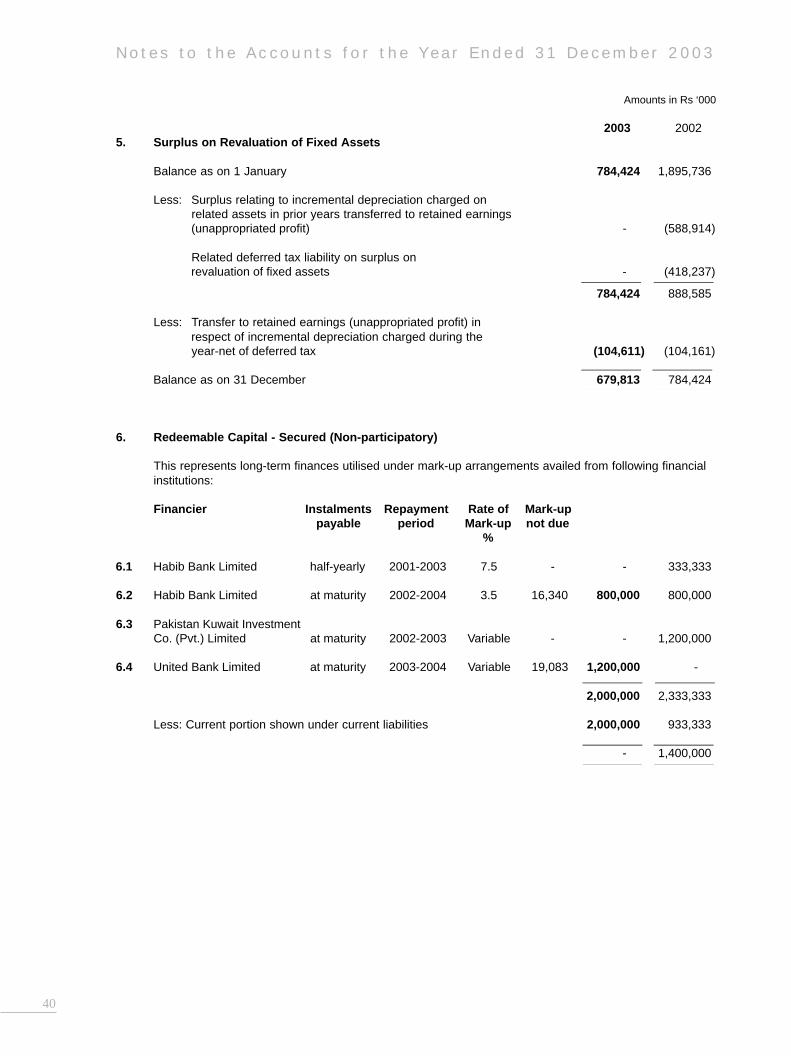
Consolidated AccountsReport of the Directors for ICI Pakistan Group 66Auditors' Report to the Members 67Consolidated Balance Sheet 68Consolidated Profit and Loss Account 70Consolidated Cash Flow Statement 71Consolidated Statement of Changes in Equity 73Consolidated Notes to the Accounts 74
Admission SlipForm of Proxy
3
C om p a n y I n f o rma t io n
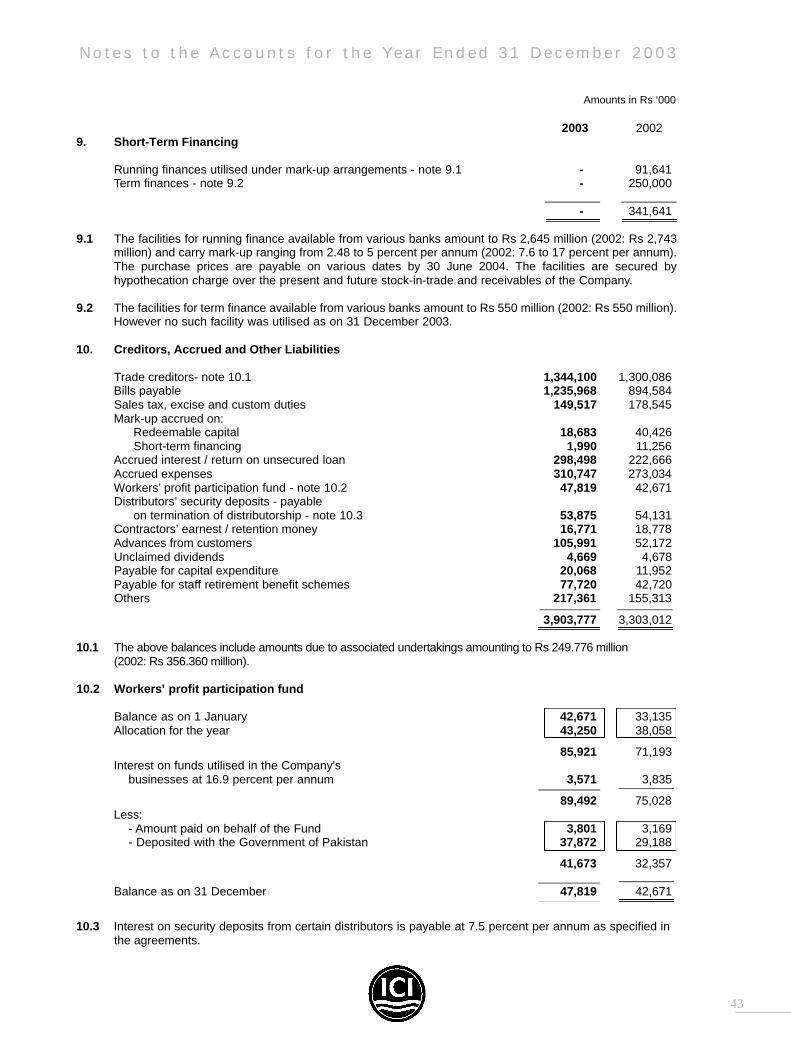
Board of DirectorsM J Jaffer Philip Gillett(Chairman) Steve HamlettJonathan R Stoney Asif Jooma(Chief Executive) Tariq Iqbal KhanMueen Afzal Khursheed MarkerSyed Imran Agha M Nawaz Tiwana
Audit & Remuneration Sub Committees of the Board
Audit Sub Committee Senior Remuneration Sub CommitteeM J Jaffer M Nawaz Tiwana(Chairman) (Chairman)Steve Hamlett Steve HamlettKhursheed Marker Jonathan R Stoney (by invitation)Feroz Rizvi (by invitation)John Way (Group Internal Auditor – by invitation)
Chief Financial OfficerFeroz Rizvi (alternate director) **
Company SecretaryNausheen Ahmad
Executive Management TeamJonathan R Stoney Jehanzeb KhanSyed Imran Agha Pervaiz A KhanNausheen Ahmad Jehangir B NawazMalik M Akram Feroz RizviDr Amir Jafri Muhammad ZahirAsif Jooma
BankersABN◆AMRO NVAskari Commercial Bank LimitedBank Alfalah LimitedCitibank NADeutsche Bank AGFaysal Bank LimitedHabib Bank LimitedMeezan Bank LimitedMuslim Commercial BankNational Bank of PakistanOman International BankPakistan Kuwait Investment Company (Private) LimitedStandard Chartered BankThe Hongkong and Shanghai Banking Corporation LimitedUnion Bank LimitedUnited Bank Limited
AuditorsTaseer Hadi Khalid & Co., Chartered Accountants
Registered OfficeICI House, 5 West Wharf, Karachi-74000Tel: 111-100-200, 2313717-22 Fax: 2311739
* names in alphabetical order** nominated when required
*
*

Mr Jonathan R Stoney was appointed as Chief Executive of the Company w. e . f .25 June 2003 to fill the vacancy created by the sad and untimely demise of MrAzhar A Malik on 11 June 2003. Mr John Stoney has served as Chief Executiveof Pakistan PTA Limited from 1 January 2002 to 25 June 2003, after having spent35 years with the ICI Group mainly working in the UK. Before coming to Pakistan,he was a Business Director of ICI Petrochemicals in North East England.
Mr Waqar A Malik has been seconded to Pakistan PTA Limited and has beenappointed Chief Executive and Director of Pakistan PTA Limited. Consequently,he resigned as a Director of ICI Pakistan Limited w.e.f. 26 June 2003. Mr AsifJooma, Vice President Polyester Business was appointed Director of ICIPakistan Limited w.e.f. 24 July 2003 to fill the casual vacancy created due to MrWaqar A Malik’s re s i g n a t i o n .
Mr Mueen Afzal has been appointed to the Board of the Company w.e.f. 1 May2003 under Section 182 of the Companies Ordinance 1984. He has held seniorpositions in the Government and re t i red as Secre t a ry General Finance &Economic Affairs, Government of Pakistan.
4
R e p o r t o f t h e D i r e c t o r s f o r t h e Y e a r E n d e d 3 1 D e c e m b e r 2 0 0 3
The Directors take pleasure in presenting their Report together with theaudited accounts of the Company for the year ended 31 December 2003.
(top, left to right)
M J Jaff e r C h a i r m a n
Jonathan R Stoney Chief Executive
Mueen Afzal Non-Executive Director
Syed Imran Agha D i r e c t o r
Philip Gillett Non-Executive Director
Steve Hamlett Non-Executive Director
Asif Jooma D i r e c t o r
Tariq Iqbal Khan Non-Executive Director
Khursheed Marker Non-Executive Director
M Nawaz Tiwana Non-Executive Director
Board ofD i r e c t o r s
5
R e p o r t o f t h e D i r e c t o r s f o r t h e Y e a r E n d e d 3 1 D e c e m b e r 2 0 0 3
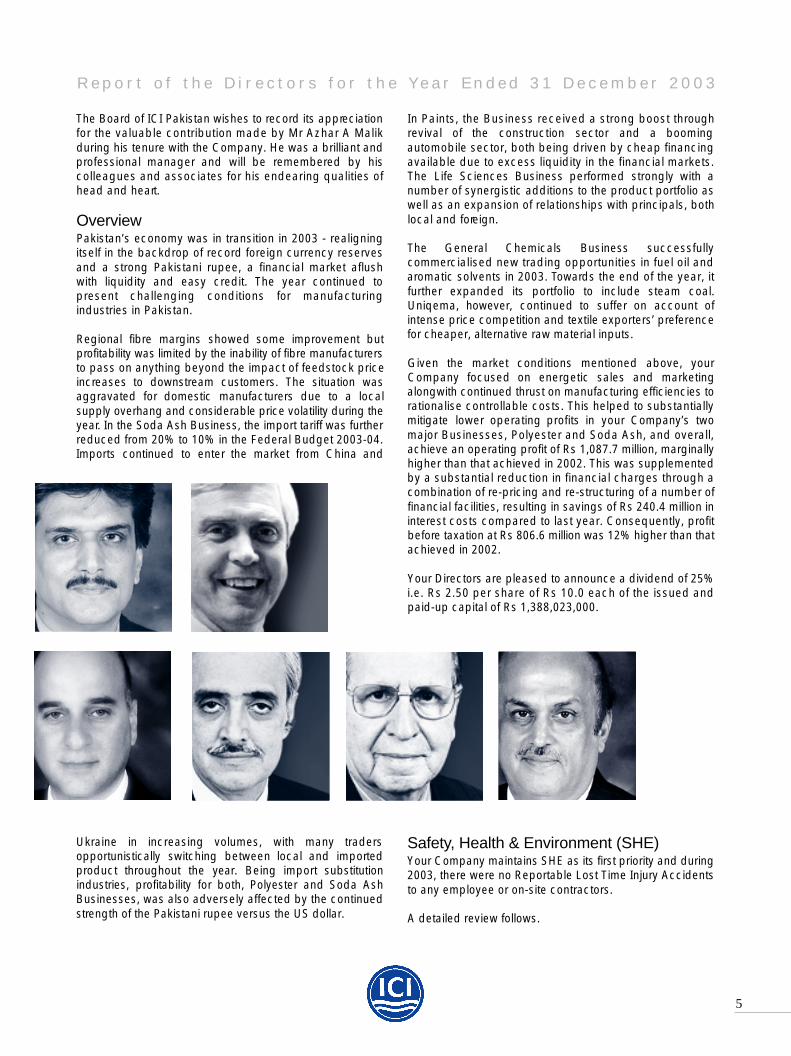
The Board of ICI Pakistan wishes to re c o rd its appre c i a t i o nfor the valuable contribution made by Mr Azhar A Malikduring his tenure with the Company. He was a brilliant andp rofessional manager and will be re m e m b e red by hiscolleagues and associates for his endearing qualities ofhead and heart .
O v e r v i e wPakistan’s economy was in transition in 2003 - realigningitself in the backdrop of record foreign currency reservesand a strong Pakistani rupee, a financial market aflushwith liquidity and easy credit. The year continued top resent challenging conditions for manufacturingindustries in Pakistan.
Regional fibre margins showed some improvement butp rofitability was limited by the inability of fibre manufacture r sto pass on anything beyond the impact of feedstock pricei n c reases to downstream customers. The situation wasaggravated for domestic manufacturers due to a localsupply overhang and considerable price volatility during they e a r. In the Soda Ash Business, the import tariff was furt h e rreduced from 20% to 10% in the Federal Budget 2003-04.I m p o rts continued to enter the market from China and
Ukraine in increasing volumes, with many traderso p p o rtunistically switching between local and import e dp roduct throughout the year. Being import substitutionindustries, profitability for both, Polyester and Soda AshBusinesses, was also adversely affected by the continueds t rength of the Pakistani rupee versus the US dollar.
In Paints, the Business received a strong boost thro u g hrevival of the construction sector and a boomingautomobile sector, both being driven by cheap financingavailable due to excess liquidity in the financial markets.The Life Sciences Business perf o rmed strongly with anumber of synergistic additions to the product portfolio aswell as an expansion of relationships with principals, bothlocal and fore i g n .
The General Chemicals Business successfullyc o m m e rcialised new trading opportunities in fuel oil anda romatic solvents in 2003. To w a rds the end of the year, itf u rther expanded its portfolio to include steam coal.Uniqema, however, continued to suffer on account ofintense price competition and textile exporters’ pre f e re n c efor cheaper, alternative raw material inputs.
Given the market conditions mentioned above, yourCompany focused on energetic sales and marketingalongwith continued thrust on manufacturing efficiencies torationalise controllable costs. This helped to substantiallymitigate lower operating profits in your Company’s twomajor Businesses, Polyester and Soda Ash, and overall,achieve an operating profit of Rs 1,087.7 million, marginallyhigher than that achieved in 2002. This was supplementedby a substantial reduction in financial charges through acombination of re-pricing and re-structuring of a number offinancial facilities, resulting in savings of Rs 240.4 million ini n t e rest costs compared to last year. Consequently, pro f i tb e f o re taxation at Rs 806.6 million was 12% higher than thatachieved in 2002.
Your Directors are pleased to announce a dividend of 25%i.e. Rs 2.50 per share of Rs 10.0 each of the issued andpaid-up capital of Rs 1,388,023,000.
S a f e t y, Health & Environment (SHE)Your Company maintains SHE as its first priority and during2003, there were no Reportable Lost Time Injury Accidentsto any employee or on-site contractors.
A detailed review follows.
6
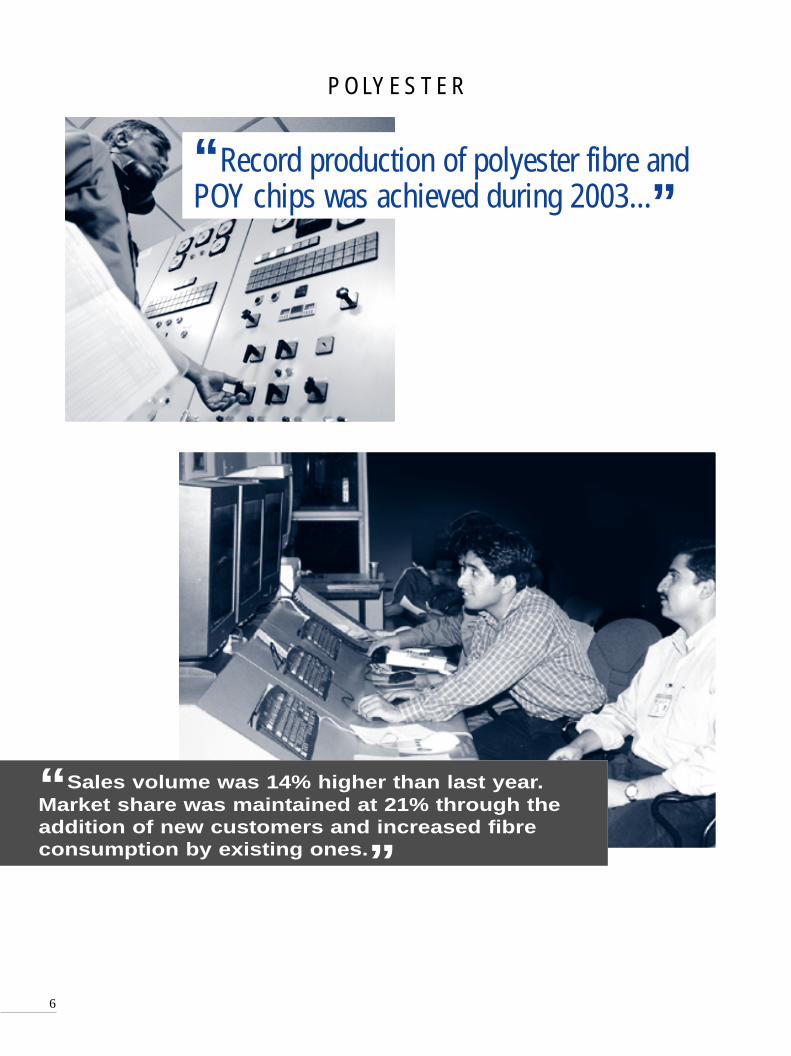
“Record production of polyester fibre andPOY chips was achieved during 2003...”
P O LY E S T E R
“Sales volume was 14% higher than last year.Market share was maintained at 21% through theaddition of new customers and increased fibreconsumption by existing ones.”

7
R e p o r t o f t h e D i r e c t o r s f o r t h e Y e a r E n d e d 3 1 D e c e m b e r 2 0 0 3
The global textile industryexperienced turbulent conditionsduring 2003. The combined effectof the Iraq war and the outbreak ofthe Severe Acute RespiratorySyndrome (SARS) bore heavily ondownstream petrochemicalindustries and overall globalconsumer confidence. However,operating rates, which hadcollapsed, recovered to 90% as theepidemic gradually subsided.Overall, regional PSF demand grewby 6% in 2003, a return to thegrowth trend but still lower than theprevious estimate of 10%. Fibredemand in the domestic marketwas adversely affected, especiallyin the first half of the year, byregional events. Demandrecovered in the second half of theyear through high cotton pricescompared to fibre, but this did nottranslate into better margins due tohigh feedstock prices andaggressive marketing bycompetitors to gain market share.
The re g u l a t o ry enviro n m e n tremained fluid throughout the year.Although the effective pro t e c t i o nlevel was maintained after thebudget, imported PSF wasincluded in the Duty and Ta xRemission on Exports (DTRE)Scheme. The inclusion of import e d
PSF into DTRE, however, did notsignificantly impact domestic fibrem a n u f a c t u rers as export e r sp rocuring domestic fibre wereallowed to claim duty drawback ondeemed import basis. Continuationof this facility is necessary for thesustainability and continuedg rowth of the PSF industry inP a k i s t a n .
In an oversupplied market, yourCompany also adopted a positivemarketing strategy, offering ourcustomers variants on the standardproduct to meet particular needs.Sales volume was 14% higher thanlast year. Market share wasmaintained at 21% through theaddition of new customers andincreased fibre consumption byexisting ones. Exports during 2003were limited to 1,999 tonnes.Despite higher production and thestrong sales, unit margins for theyear were lower than last year as aconsequence of market factors andthe continued strength of thePakistani rupee against the USdollar. Although focus on costreduction was maintained in orderto mitigate the impact of reducedmargins, operating profit for theyear at Rs 24.2 million was wellbelow the Rs 71.5 million achievedin 2002.
Record production of polyester fibre and POY chips was
achieved during 2003, including production from the 44 ktpa
expansion carried out through Fayzan Manufacturing Modaraba.
Q4 2003 Variance* FY 2003 Variance*
Sales Volume – Tonnes 26,252 1% 112,064 14%
Production Volume – Tonnes** 28,490 1% 113,029 16%
Operating Profit – Rs Million 7.2 (88%) 24.2 (66%)
*Compared to the same period last year
**Includes production from Fayzan Manufacturing Modaraba’s Plant
9000
7000
6000
5000
4000
3000
2000
1000
0
Turnover
120
100
80
60
40
20
0
Sales Volume
1998 1999 2000 2001 2002 2003
1998 1999 2000 2001 2002 2003

8
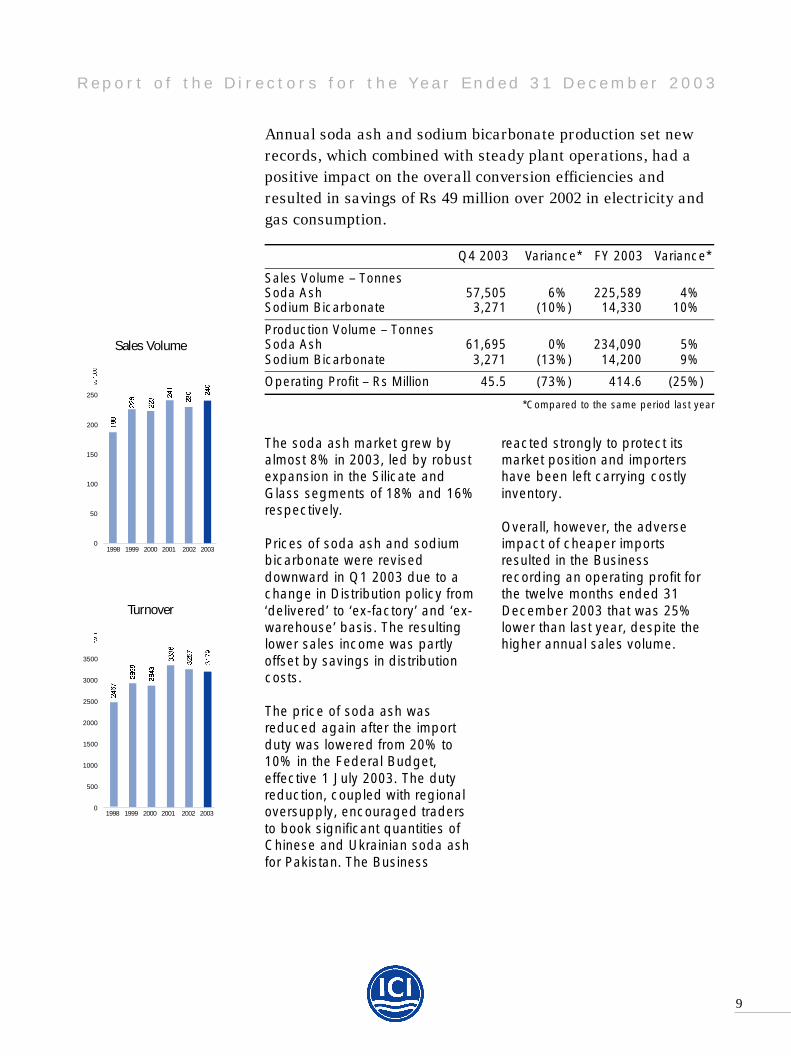
“Annual soda ash and sodiumbicarbonate production setnew records...”
S O D A A S H
“... which combined with steady plant operations, had a positive impact on the overall conversionefficiencies and resulted in savings of Rs 49 millionover 2002 in electricity and gas consumption.”
9
R e p o r t o f t h e D i r e c t o r s f o r t h e Y e a r E n d e d 3 1 D e c e m b e r 2 0 0 3
The soda ash market grew byalmost 8% in 2003, led by robustexpansion in the Silicate andGlass segments of 18% and 16%respectively.
Prices of soda ash and sodiumbicarbonate were reviseddownward in Q1 2003 due to achange in Distribution policy from‘delivered’ to ‘ex-factory’ and ‘ex-warehouse’ basis. The resultinglower sales income was partlyoffset by savings in distributioncosts.
The price of soda ash wasreduced again after the importduty was lowered from 20% to10% in the Federal Budget,effective 1 July 2003. The dutyreduction, coupled with regionaloversupply, encouraged tradersto book significant quantities ofChinese and Ukrainian soda ashfor Pakistan. The Business
reacted strongly to protect itsmarket position and importershave been left carrying costlyinventory.
Overall, however, the adverseimpact of cheaper importsresulted in the Businessrecording an operating profit forthe twelve months ended 31December 2003 that was 25%lower than last year, despite thehigher annual sales volume.
Annual soda ash and sodium bicarbonate production set new
records, which combined with steady plant operations, had a
positive impact on the overall conversion efficiencies and
resulted in savings of Rs 49 million over 2002 in electricity and
gas consumption.
Q4 2003 Variance* FY 2003 Variance*
Sales Volume – TonnesSoda Ash 57,505 6% 225,589 4%Sodium Bicarbonate 3,271 (10%) 14,330 10%
Production Volume – TonnesSoda Ash 61,695 0% 234,090 5%Sodium Bicarbonate 3,271 (13%) 14,200 9%
Operating Profit – Rs Million 45.5 (73%) 414.6 (25%)
*Compared to the same period last year250
200
150
100
50
0
Sales Volume
3500
3000
2500
2000
1500
1000
500
0
Turnover
1998 1999 2000 2001 2002 2003
1998 1999 2000 2001 2002 2003
10
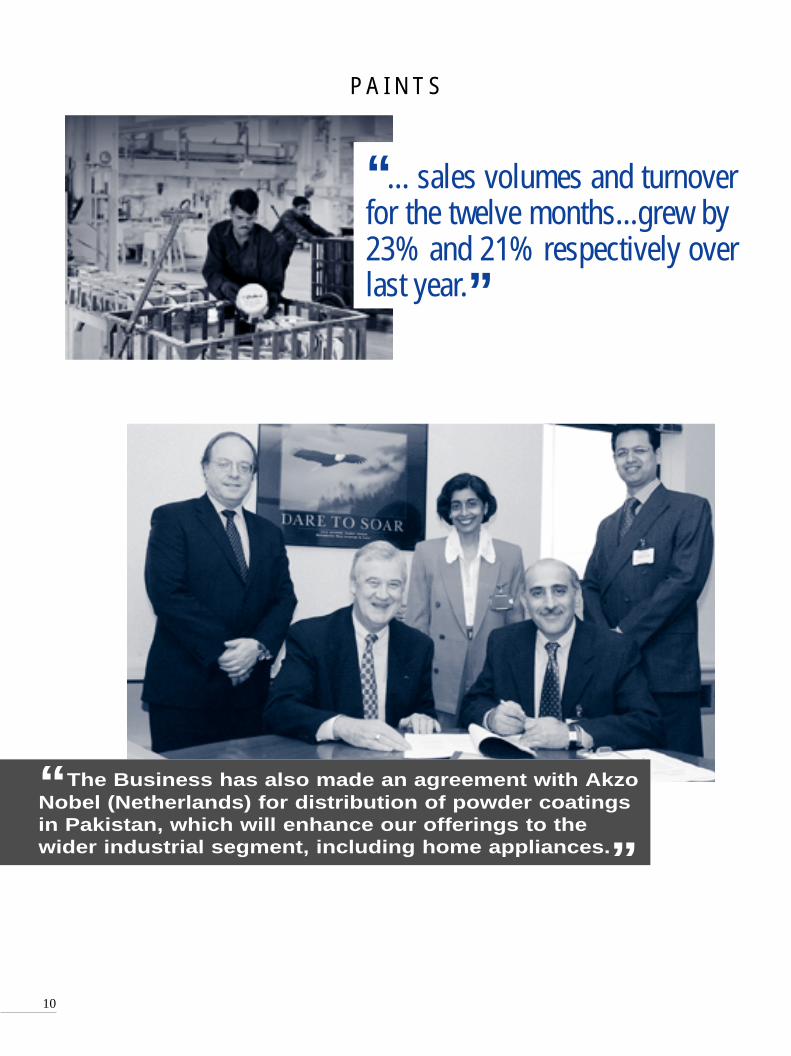
“... sales volumes and turnoverfor the twelve months...grew by23% and 21% respectively overlast year.”
P A I N T S
“The Business has also made an agreement with AkzoNobel (Netherlands) for distribution of powder coatingsin Pakistan, which will enhance our offerings to thewider industrial segment, including home appliances.”

11
R e p o r t o f t h e D i r e c t o r s f o r t h e Y e a r E n d e d 3 1 D e c e m b e r 2 0 0 3
All three segments of the Businessg rew significantly during 2003.G rowth in the Decorative segmentwas driven by the construction sectorand overall improvement in keyeconomic indicators. The Industrialsegment grew strongly with thei n c reasing output of the automobilei n d u s t ry. The Refinish segment also
experienced improvement, support e dby increased customer traffic at Sales,S p a res & Service (SSS) dealerships.As a result, overall sales volumes andt u rnover for the twelve months ending31 December 2003 grew by 23% and21% respectively over last year.
The Decorative segment energeticallypursued dealer promotions and tradeschemes throughout the year in ord e rto gain market share, all the whilemaintaining current prices to supportvolume growth. The Dulux ‘ModelShop’ concept, launched in Q1 2003,was effectively established across thec o u n t ry with the aim of enhancingDulux brand visibility and dealerl o y a l t y. This, together with theenhancement of the dealer network inthe key urban centres and smallertowns, strengthened the segment’sdistribution spread. Exports toAfghanistan re g i s t e red healthy gro w t hover last year.
The automobile sector dominatedsales in the Industrial segment. Newbusiness was achieved with HondaAtlas Motors early in the year and theBusiness continues to emphasise
e ffective customer service tos t rengthen its relationships. TheBusiness worked with Pak SuzukiMotors in commissioning ane l e c t rostatic painting line and alsos t a rted supplying electro s t a t i c -deposition paint to Nissan GandharaMotors. A start was made in supplyingthe emerging Chinese commerc i a l
vehicle segment. The Business hasalso made an agreement with AkzoNobel (Netherlands) for distribution ofpowder coatings in Pakistan, whichwill enhance our offerings to the widerindustrial segment, including homea p p l i a n c e s .
The Refinish segment also witnesseda re c o v e ry in demand, driven byhigher automobile pro d u c t i o n .I m p roved product off-take, togetherwith selective price increases tocompensate for rising raw materialcosts, encouraged dealers to investheavily in stocks. The Businesssuccessfully launched its locallydeveloped bodyshop software ‘CarMax’ for SSS dealerships, facilitatingthem in colour formulation, job costingand inventory management. Aconsignment of Refinish paint wase x p o rted to Afghanistan.
Overall, with higher sales volumes andcontinued vigilance in monitoringc o n t rollable costs, the Businessachieved an operating profit of Rs395.1 million for 2003, which was 33%higher than last year.
The Business continued to promote safety awareness through a
range of activities with active employee participation at all
levels. This effort received recognition by the Business winning
a regional safety award.
Q4 2003 Variance* FY 2003 Variance*
Sales Volume – Kilolitres 5,169 25% 19,234 23%
Production Volume – Kilolitres 5,143 29% 19,838 26%
Operating Profit – Rs Million 68.2 (19%) 395.1 33%
*Compared to the same period last year
20000
18000
16000
14000
12000
10000
8000
6000
4000
2000
01998 1999 2000 2001 2002 2003
Sales Volume
3000
2500
2000
1500
1000
500
0
Turnover
1998 1999 2000 2001 2002 2003
12
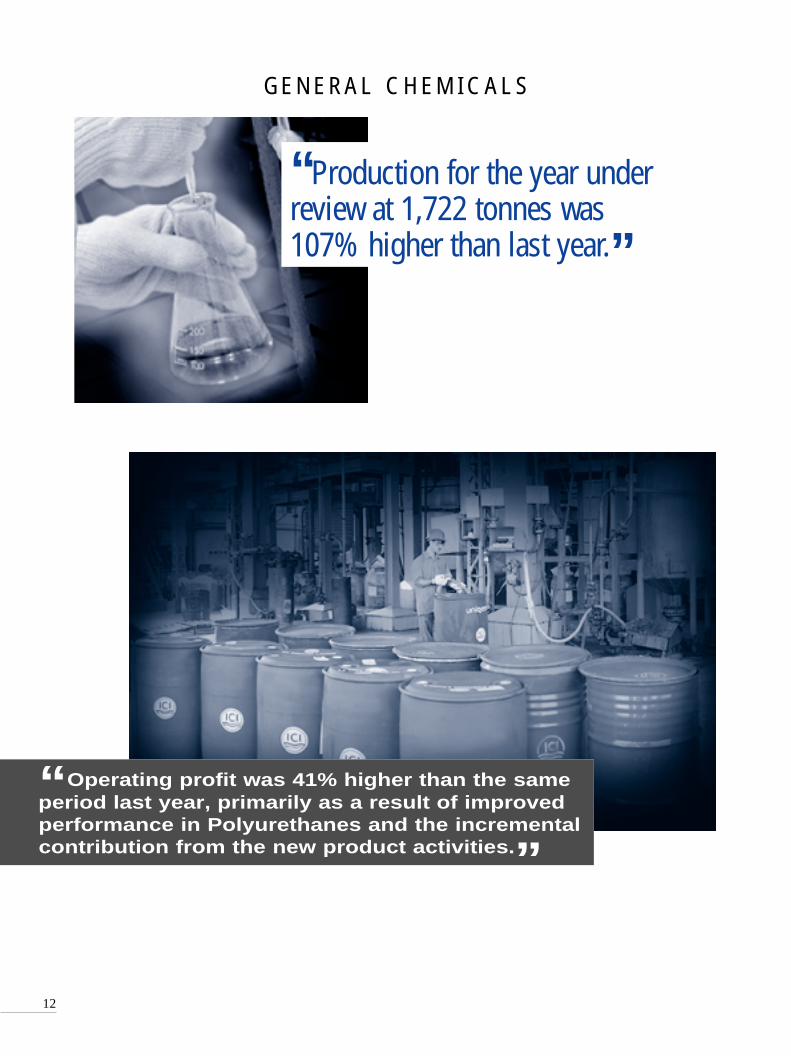
“Production for the year underreview at 1,722 tonnes was107% higher than last year.”
G E N E R A L C H E M I C A L S
“Operating profit was 41% higher than the sameperiod last year, primarily as a result of improvedperformance in Polyurethanes and the incrementalcontribution from the new product activities.”

13
R e p o r t o f t h e D i r e c t o r s f o r t h e Y e a r E n d e d 3 1 D e c e m b e r 2 0 0 3
In Polyurethanes, despite a highlycompetitive market, profitabilityimproved through robustperformance in the transport,appliances and footwear sectors.In the Trading Businesses, thestrong rupee eroded dollar basedindent commissions, but this wasmitigated by introducing newproduct lines and increasing theproportion of ex-stock sales atbetter margins.
The Business had made asuccessful entry into the FurnaceOil market in the last quarter of2002, supplying imported HSFOto industrial companies. However,from mid-2003, the Governmentdisallowed the import of furnaceoil in order to protect localrefineries, since overall demandfor furnace oil had reduced asmore natural gas becameavailable for power generation,and good monsoon rainsincreased the output from hydro-electric generation. As a result,the Business had to limit itsactivity in this segment during H22003. The effect on earnings waspartially mitigated by engaging inimport of steam coal for industrial
customers with two consignmentsbeing received in the last quarter.Overall, with the introduction ofnew trading lines, net salesincome of the Business for thetwelve months to 31 December2003 increased by more than fivetimes compared to last year.Operating profit was 41% higherthan the same period last year,primarily as a result of improvedperformance in Polyurethanesand the incremental contributionfrom the new product activities.
Production for the year under review at 1,722 tonnes was 107%
higher than last year mainly due to higher demand for locally
blended Polyol.
6000
5000
4000
3000
2000
1000
0
Turnover
1998 1999 2000 2001 2002 2003

14
O T H E R S ( L I F E S C I E N C E S & U N I Q E M A )
“... Medical segment, net sales income grew by18% for the year and achieved its highest everin-market sales in December 2003.”
“ The Life Sciences Business closedthe year with strong performancefrom all three segments.”

15
R e p o r t o f t h e D i r e c t o r s f o r t h e Y e a r E n d e d 3 1 D e c e m b e r 2 0 0 3
The Animal Health segment alsoposted a strong Q4 2003 andregistered a 52% growth in netsales income for the year.Products from the Anthelmintics(anti parasitic) range continued tolead growth. The final quarter of2003 was the busiest period forthe Seeds segment, as it coveredthe peak season for sunflowersales. The Segment sold recordsunflower seed volumes,liquidating its stock in theprocess. Overall for the LifeSciences Business, net salesincome for the quarter was 11%higher than last year and also20% higher for the year.
Uniqema faced challengingconditions in both textileauxiliaries and adhesives marketsand gross margin remainedconstrained due to intense pricecompetition. The paints industrycontinued to shift towardsrelatively cheaper PVAs as aresult of higher demand for lowertier products but continuingdemand for Acrylic Emulsion bythe ICI Paints Business resultedin robust sales in this segment.
The Life Sciences Business closed the year with strong
performance from all three segments. In the Medical segment,
net sales income grew by 18% for the year and achieved its
highest ever in-market sales in December 2003.
Turnover
2000
1750
1500
1250
1000
750
500
250
01998 1999 2000 2001 2002 2003
16
R e p o r t o f t h e D i r e c t o r s f o r t h e Y e a r E n d e d 3 1 D e c e m b e r 2 0 0 3
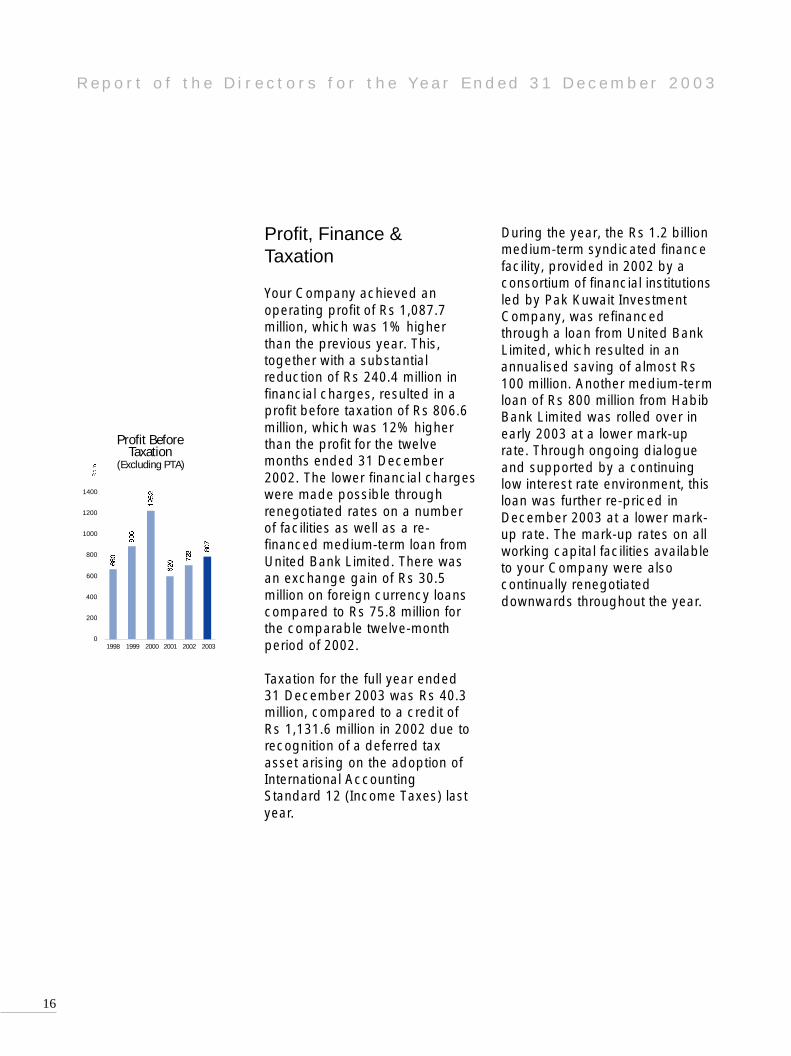
Profit, Finance &Taxation
Your Company achieved anoperating profit of Rs 1,087.7million, which was 1% higherthan the previous year. This,together with a substantialreduction of Rs 240.4 million infinancial charges, resulted in aprofit before taxation of Rs 806.6million, which was 12% higherthan the profit for the twelvemonths ended 31 December2002. The lower financial chargeswere made possible throughrenegotiated rates on a numberof facilities as well as a re-financed medium-term loan fromUnited Bank Limited. There wasan exchange gain of Rs 30.5million on foreign currency loanscompared to Rs 75.8 million forthe comparable twelve-monthperiod of 2002.
Taxation for the full year ended31 December 2003 was Rs 40.3million, compared to a credit ofRs 1,131.6 million in 2002 due torecognition of a deferred taxasset arising on the adoption ofInternational AccountingStandard 12 (Income Taxes) lastyear.
During the year, the Rs 1.2 billionmedium-term syndicated financefacility, provided in 2002 by aconsortium of financial institutionsled by Pak Kuwait InvestmentCompany, was refinancedthrough a loan from United BankLimited, which resulted in anannualised saving of almost Rs100 million. Another medium-termloan of Rs 800 million from HabibBank Limited was rolled over inearly 2003 at a lower mark-uprate. Through ongoing dialogueand supported by a continuinglow interest rate environment, thisloan was further re-priced inDecember 2003 at a lower mark-up rate. The mark-up rates on allworking capital facilities availableto your Company were alsocontinually renegotiateddownwards throughout the year.
Profit BeforeTaxation
(Excluding PTA)
1400
1200
1000
800
600
400
200
01998 1999 2000 2001 2002 2003

17
R e p o r t o f t h e D i r e c t o r s f o r t h e Y e a r E n d e d 3 1 D e c e m b e r 2 0 0 3
Capital Expenditure
The Company spent Rs 459.1million as sustenance capital in2003 to maintain its existing assetsand ensure continued integrity ande ff i c i e n c y. The main thrust hasbeen towards implementing lowcost improvement opportunities toreduce energy consumption andoperating costs. Work has beeninitiated on the expansion of theRefined Sodium Bicarbonate Plant,at Khewra. With a capitalinvestment of around Rs 100million, the extra capacity isexpected to come on-line by Q32 0 0 4 .
Future Outlook
The Polyester Business’sperformance in 2004 will dependupon market dynamics andconsistency in the regulatoryenvironment. Demand for fibre isexpected to continue to grow butsince capacities are beingincreased throughout the region,variations in the trend in finaldemand for textiles can have amarked effect on the supplybalance and hence thecompetitive pressure. WithinPakistan, PSF has now beenincluded in the DTRE Scheme, socontinuity in the provision ofdeemed duty drawback on theusage of domestically producedfibre in exported textiles is
essential for the industry. YourCompany will continue to join inrepresenting fibre manufacturers’interests to the Government toensure the viability and growth ofthe sector.
In Soda Ash, domesticconsumption is expected tocontinue to grow particularly inthe Silicate and Glass segments.However, local manufacturers willremain under pressure fromimported soda ash and theBusiness will need to continuewith a determined sales andmarketing strategy to becompetitive.
In Chemicals, the TradingBusiness anticipates thatrestrictions on import of furnaceoil will continue. The Businesswill, therefore, focus on otherproducts to find opportunities forprofitable growth.
The Government of Pakistan’ssuccess in maintaining a stableto strong rupee and its policy ofgradually reducing import tariffprotection, mean that regionalcompetitive pressure on yourCompany’s major Polyester andSoda Ash Businesses will furtherintensify. The Businessesresponse is to initiateprogrammes for improvedefficiencies and cost savings,which are aimed at assuring ourcompetitiveness.
CapitalExpenditure(Excluding PTA)
1000
800
600
400
200
01998 1999 2000 2001 2002 2003
18
Efforts continued to bring aboutfurther improvement in employeecommitment and motivation. Theresults of the Employee Surveyconducted by an external, USbased agency indicated higherresults in most categories againsta benchmark of comparablemultinationals based in Pakistanas well as global companies.These results were cascaded toall employees in 2003. Actions inareas requiring improvementwere initiated at the Business andCorporate level.
Union-Management relationscontinue to be friendly andindustrial peace prevailed at alllocations during the year underreview. Biennial negotiations withthe respective unions wereamicably concluded at allCompany locations within theapproved remit. The impact ofsettlements has been positive onthe overall environment and hascontributed in reinforcing therelationship between unions,employees and management.
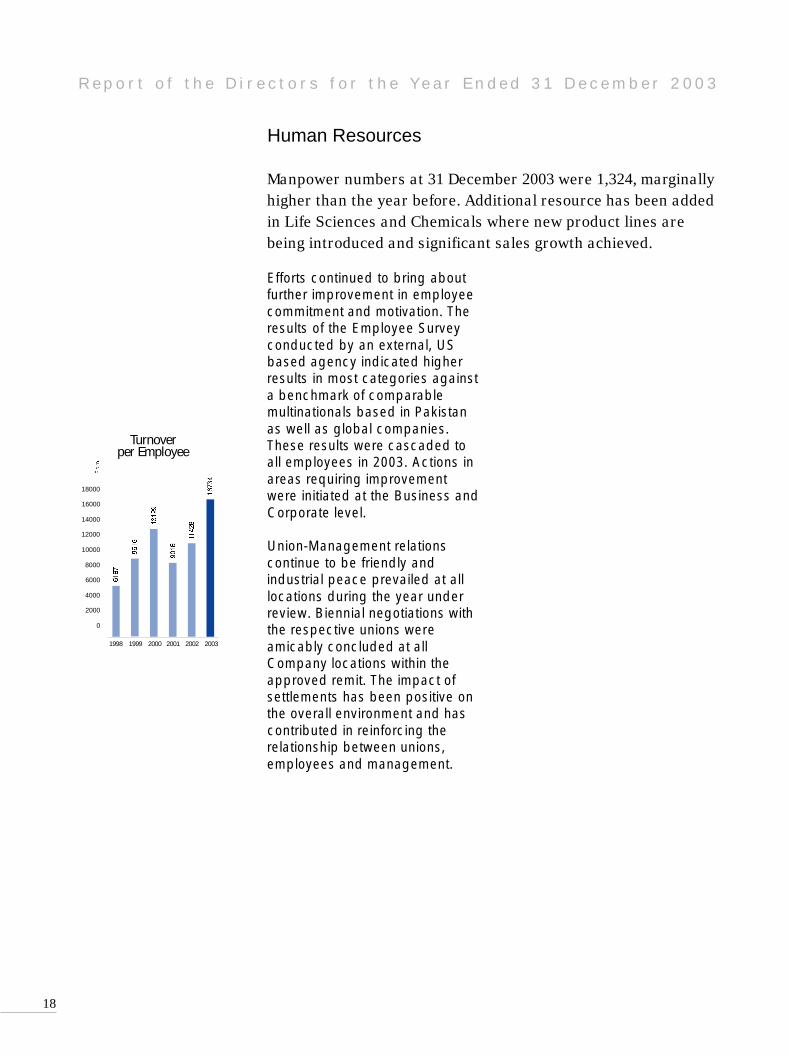
Human Resources
Manpower numbers at 31 December 2003 were 1,324, marg i n a l l y
higher than the year before. Additional resource has been added
in Life Sciences and Chemicals where new product lines are
being introduced and significant sales growth achieved.
Turnoverper Employee
18000
16000
14000
12000
10000
8000
6000
4000
2000
0
1998 1999 2000 2001 2002 2003
R e p o r t o f t h e D i r e c t o r s f o r t h e Y e a r E n d e d 3 1 D e c e m b e r 2 0 0 3

19
R e p o r t o f t h e D i r e c t o r s f o r t h e Y e a r E n d e d 3 1 D e c e m b e r 2 0 0 3
Full compliance with the HealthAssessment and WorkEnvironment monitoringprogrammes resulted in a yearwithout a single reportableOccupational Illness. Onereportable distribution accidentoccurred in 2003 and allmanufacturing sites preventedany environmental loss ofcontainments beyond the ACategory (minor spills).
Your Company’s efforts andachievements in the field ofenvironmental protection wererecognised externally through thefirst-ever award under thePakistan Environmental ReportingAward (PERA) Scheme. Thisinitiative was launched throughthe co-ordinated efforts of WorldWildlife Fund (WWF) and theAssociation of Certified CharteredAccountants (ACCA) with thesupport of the Lahore Chamberof Commerce and Industries.
Safety, Security, Health & Environment (SSHE)
The Company had zero Reportable Injury Accidents (RIAs) in
2003, a performance truly reflective of the ‘RIA Free 2003’
initiative launched by the late Chief Executive at the beginning
of 2003.
SHE Performance 2002 2003
Reportable Injury Accident (RIA) 2 0
Classified Injury Accident (CIA) 3 2
Distribution Incident 0 1
Occupational Illness 1 0
Category B, C & D Environmental Escapes 1 0
0.08
0.06
0.04
0.02
0
Reportable InjuryAccident Rate
1998 1999 2000 2001 2002 2003

20
R e p o r t o f t h e D i r e c t o r s f o r t h e Y e a r E n d e d 3 1 D e c e m b e r 2 0 0 3
The Winnington Hospital, whichcaters for the healthcare needs ofthe Company’s own staff and theKhewra community, has modernday facilities to help all medicalemergencies and additionally hasan operating theatre for minoroperations and surgeries. Withsupport from the LaytonRahmatulla Benevolent Trust(LRBT), ICI Pakistan provides eyecare for the town of Khewra andits vicinity. During 2003, theclinic’s programme treated 7,101out patients with 707 major andminor surgeries and 957refractions.
Over the years, the Company’sbiggest contribution has been theWinnington School at Khewra,which is a high school providingEnglish medium secondary leveleducation to the community. Twothirds of the students in thisschool are from the community. Anew building to house the highschool has just been completedat a cost of over Rs 8 million.
Social Responsibility & Community Work
Your Company’s commitment for the continuous improvement
of communities within which it operates remains a high priority.
As a responsible corporate citizen, ICI Pakistan Limited
through its trust, ICI Pakistan Foundation, provided financial
assistance to various charitable and non-profit organisations
during the year, including healthcare, education and social
welfare organisations and projects that serve under privileged
members of society.

21
R e p o r t o f t h e D i r e c t o r s f o r t h e Y e a r E n d e d 3 1 D e c e m b e r 2 0 0 3
Auditors
The present auditors, Taseer HadiKhalid & Company re t i re and off e rthemselves for reappointment. Assuggested by the Audit Committee,the Board of Directors haverecommended their re a p p o i n t m e n tas Auditors of the Company for theyear ending 31 December 2004, ata fee to be mutually agre e d .
Compliance with the Code ofCorporate Governance
As required under the Code ofCorporate Governance datedMarch 28, 2002 the Directors arepleased to state as follows:
• The financial statements,prepared by the managementof the Company present fairly itsstate of affairs, the results of itsoperations, cash flows andchanges in equity.
• Proper books of account of theCompany have beenmaintained.
• Accounting policies have beenconsistently applied inpreparation of financialstatements and accountingestimates are based onreasonable and prudentjudgement.
• International AccountingStandards, as applicable inPakistan, have been followed inpreparation of financialstatements and any departuretherefrom has been adequatelydisclosed.
• The system of internal controland other such procedures,which are in place, are beingcontinuously reviewed by theInternal Audit department. Theprocess of review will continueand any weakness in controlswill be removed.
• There are no doubts upon theCompany’s ability to continue asa going concern.
• There has been no departurefrom the best practices ofcorporate governance asdetailed in the ListingRegulations.
• Key operating and financialdata for the last 6 years issummarised on Page 62.
• Outstanding taxes and leviesare given in the Notes to theAccounts.
The value of investments made bythe staff retirement funds as pertheir respective audited accountsfor the year ended 31 December2002, is as follows:

R e p o r t o f t h e D i r e c t o r s f o r t h e Y e a r E n d e d 3 1 D e c e m b e r 2 0 0 3
22
Name of Director Number of Board Meetings Attended
1 Mr M J Jaffer 4
2 Mr Jonathan R Stoney* 2
3 Mr Azhar A Malik** 2
4 Mr Mueen Afzal*** 1
5 Mr Syed Imran Agha 4
6 Mr Steve Hamlett 3
7 Mr Asif Jooma**** 2
8 Mr Tariq Iqbal Khan 2
9 Mr Waqar A Malik***** 2
10 Mr Khursheed Marker 3
11 Mr M Nawaz Tiwana 4
12 Mr Philip Gillett 2
13 Mr Feroz Rizvi (CFO) 4
14 Ms Nausheen Ahmad (Company Secretary) 4
*Appointed on the Board w.e.f. 25 June 2003**Expired on 11 June 2003
***Appointed on the Board w.e.f. 1 May 2003**** Appointed on the Board w.e.f. 24 July 2003
*****Resigned w.e.f. 26 June 2003
Leave of absence was granted toDirectors who could not attendsome of the Board meetings.
Statement of Compliance withthe Best Practices on TransferPricing
The Company has fully compliedwith the best practices on Transfer
Pricing as contained in the ListingRegulation No 38 of the KarachiStock Exchange.
Pattern of Shareholding
A statement showing the pattern ofshareholding in the Company andadditional information as at 31December 2003 appears on page60.
During the year 4 (four) meetingsof the Board of Directors wereheld. Attendance by each Director/
CFO/ Company Secretary was asfollows:
Value (Rs ‘000’s)
1 ICI Pakistan Management Staff Provident Fund 319,323
2 ICI Pakistan Management Staff Gratuity Fund 172,338
3 ICI Pakistan Management Staff Pension Fund 620,385
4 ICI Pakistan Non-Management Staff Provident Fund 255,584

23
M J Jaffer Jonathan R StoneyChairman Chief Executive
Dated 27 February 2004
ICI Omicron BV continues to hold75.81% shares, while Institutionshold 15.84%, and individuals andforeign funds hold the balance8.35%.
The highest and lowest marketprices during 2003 were Rs 95.25and Rs 41.05 per sharerespectively.
The Directors, CEO, CFO,Company Secretary and theirspouses and minor children didnot carry out any transaction in theshares of the Company during theyear except for sale of 1,400shares by Mr S Imran Agha andpurchase of 1 share by Mr Asif
Jooma from Mr Waqar A Malik.This is reflected in the pattern ofshareholding. All statutory returnsin this connection were filed.
Group Accounts
The audited accounts of ICI Groupfor the year ended 31 December2003 are attached. The ICIPakistan Group comprisesaccounts of ICI Pakistan Limited,ICI Pakistan PowerGen Limited, awholly owned subsidiary, andproportionate share in the profitand loss of Pakistan PTA Limited,an associate company.

24
This statement is being presented tocomply with the Code of CorporateGovernance contained in the listingregulations of the stock exchanges forthe purpose of establishing aframework of good governance,whereby a listed company is managedin compliance with the best practicesof corporate governance. TheCompany has applied the principlescontained in the Code in the followingmanner:
1. The Company encouragesrepresentation of independent non-executive directors and directorsrepresenting minority interests onits Board of Directors. At presentthe Board includes sevenindependent non-executivedirectors including one directorappointed under Section 182 of theCompanies Ordinance 1984 andanother director nominated by afinancial institution.
2. The directors voluntarily confirmedthat none of them is serving as adirector in more than ten listedcompanies, including ICI PakistanLimited, except for Mr Tariq IqbalKhan who is a nominee of NationalInvestment Trust (NIT) and hasbeen granted a waiver from theapplication of the relevant clause ofthe Code by the Securities andExchange Commission of Pakistan.
3. The Directors have voluntarilydeclared that all the residentdirectors of the Company areregistered taxpayers and none ofthem has defaulted in payment ofany loan to a banking company, aDFI or an NBFI. None of thedirectors is a member of a stockexchange.
4. During the year two casualvacancies occurred in the Board ofDirectors on 11 June 2003 and 26June 2003. Both were filled on 25June 2003 and 24 July 2003
respectively. The Company hasfiled the necessary returns in thisregard.
5. The Board of Directors of theCompany, in its meeting held on 23February 2001, adopted aStatement of Ethics and BusinessPractices under the title of ‘The WayWe Do Things Around Here’, whichhas been regularly circulated withinthe Company since 2001 and is inthe knowledge of the Company’sdirectors and employees.
6. An ‘Employees Satisfaction Survey’has been conducted and actionplans are being implemented underthe supervision of the Board.Pursuant to this, a vision/missionstatement will be developed andcirculated to the employees of theCompany. The Board of Directors inits meeting held on 27 February2003 has approved and adopted acorporate strategy and significantpolicies. The corporate strategy isreviewed by the Board from time totime.
7. All the powers of the Board havebeen duly exercised and decisionson material transactions, includingappointment and determination ofremuneration and terms andconditions of employment of theCEO and other Executive Directors,have been taken by the Board.
8. Four meetings of the Board wereheld during the year and all werepresided by the Chairman. Writtennotices of the Board meetings,along with agenda and workingpapers, were circulated at leastseven days before the meetings.The minutes of the meetings wereappropriately recorded andcirculated in time.
9. Orientation Courses, both in-houseand external, were arranged for theDirectors. They have also beenprovided with copies of the Listing
Statement of Compliance with the Code of CorporateGovernance for the year ended 31 December 2003

25
R e p o r t o f t h e D i r e c t o r s f o r t h e Y e a r E n d e d 3 1 D e c e m b e r 2 0 0 3
Regulations of the Stock Exchange,the Company’s Memorandum andArticles of Association and theCode of Corporate Governanceand they are well conversant withtheir duties and responsibilities.
10. No new appointments of CFO,Company Secretary or Head ofInternal Audit have been madeafter the application of the Code ofCorporate Governance.
11. The Report of the Directors for theyear ended 31 December 2003 hasbeen prepared in compliance withthe requirements of the Code andfully describes the salient mattersrequired to be disclosed.
12. The financial statements of theCompany were duly endorsed bythe CEO and CFO before approvalof the Board.
13. The Directors, CEO and executivesdo not hold any interest in theshares of the Company other thanthat disclosed in the pattern ofshareholding.
14. The Company has complied with allthe corporate and financialreporting requirements of the Code.
15. The Audit Sub Committee of theBoard has been in existence since1992. It comprises three members,all of whom are non-executivedirectors including the chairman ofthe committee. ICI Pakistan alsohas a Remuneration Committeecomprising two non-executiveDirectors, which has also been inoperation since 1997.
16. There have been four AuditCommittee meetings during theyear under review. The Directorshave approved the revised terms ofreference of the Audit Committee inlight of the Code of CorporateGovernance.
17. ICI Pakistan has had an effectiveinternal audit function in placesince the late 1970s.
18. The statutory auditors of theCompany have confirmed that theyhave been given a satisfactoryrating under the quality controlreview programme of the Institute ofChartered Accountants of Pakistan,that they or any of the partners ofthe firm, their spouses and minorchildren do not hold shares of theCompany and that the firm and allits partners are in compliance withInternational Federation ofAccountants (IFAC) guidelines onCode of Ethics as adopted byInstitute of Chartered Accountantsof Pakistan.
19. The statutory auditors or thepersons associated with them havenot been appointed to provideother services except inaccordance with the listingregulations and the auditors haveconfirmed that they have observedIFAC guidelines in this regard.
20. We confirm that all other materialprinciples contained in the Codehave been complied with.
M J Jaffer Jonathan R StoneyChairman Chief Executive
Dated 27 February 2004
26
Review Report to the Memberson Statement of Compliance with Best Practicesof Code of Corporate Governance
We have reviewed the Statement ofCompliance with the best practicescontained in the Code of CorporateGovernance prepared by theBoard of Directors of ICI PakistanLimited (“the Company”) to complywith the listing regulations of therespective Stock Exchanges,where the Company is listed.
The responsibility for compliancewith the Code of CorporateGovernance is that of the Board ofDirectors of the Company. Ourresponsibility is to review, to theextent where such compliance canbe objectively verified, whether theStatement of Compliance reflectsthe status of the Company'scompliance with the provisions ofthe Code of Corporate Governanceand report if it does not. A review islimited primarily to inquiries of theCompany personnel and review ofvarious documents prepared bythe Company to comply with theCode.
As part of our audit of financialstatements we are required toobtain an understanding of theaccounting and internal controlsystems sufficient to plan the auditand develop an effective auditapproach. We have not carried outany special review of the internalcontrol system to enable us toexpress an opinion as to whetherthe Board's statement on internalcontrol covers all controls and theeffectiveness of such internalcontrols.
Based on our review nothing hascome to our attention, whichcauses us to believe that theStatement of Compliance does notappropriately reflect theCompany's compliance, in allmaterial respects, with the bestpractices contained in the Code ofCorporate Governance.
Dated: 27 February 2004 Taseer Hadi Khalid & Co.Chartered Accountants
Karachi

We have audited the annexed balance sheet of ICI Pakistan Limited (“the Company”) as at 31 December 2003and the related profit and loss account, cash flow statement and statement of changes in equity together with thenotes forming part thereof, for the year then ended and we state that we have obtained all the information andexplanations which, to the best of our knowledge and belief, were necessary for the purposes of our audit.
It is the responsibility of the Company’s management to establish and maintain a system of internal control, andprepare and present the above said statements in conformity with the approved accounting standards and therequirements of the Companies Ordinance, 1984. Our responsibility is to express an opinion on these statementsbased on our audit.
We conducted our audit in accordance with the auditing standards as applicable in Pakistan. These standardsrequire that we plan and perform the audit to obtain reasonable assurance about whether the above saidstatements are free of any material misstatement. An audit includes examining, on a test basis, evidencesupporting the amounts and disclosures in the above said statements. An audit also includes assessing theaccounting policies and significant estimates made by management, as well as, evaluating the overall presentationof the above said statements. We believe that our audit provides a reasonable basis for our opinion and, after dueverification, we report that:
a) in our opinion, proper books of account have been kept by the Company as required by the CompaniesOrdinance, 1984;
b) in our opinion:
i) the balance sheet and profit and loss account together with the notes thereon have been drawn upin conformity with the Companies Ordinance, 1984, and are in agreement with the books of accountand are further in accordance with accounting policies consistently applied;
ii) the expenditure incurred during the year was for the purpose of the Company’s business; and
iii) the business conducted, investments made and the expenditure incurred during the year were inaccordance with the objects of the Company;
c) in our opinion and to the best of our information and according to the explanations given to us, the balancesheet, profit and loss account, cash flow statement and statement of changes in equity together with thenotes forming part thereof conform with approved accounting standards as applicable in Pakistan, and, givethe information required by the Companies Ordinance, 1984, in the manner so required and respectivelygive a true and fair view of the state of the Company’s affairs as at 31 December 2003 and of the profit, itscash flows and changes in equity for the year then ended; and
d) in our opinion Zakat deductible at source under the Zakat and Ushr Ordinance, 1980 (XVIII of 1980), wasdeducted by the Company and deposited in the Central Zakat Fund established under section 7 of thatOrdinance.
Date: 27 February 2004 Taseer Hadi Khalid & Co.Karachi Chartered Accountants
29
A u d i t o r s ’ R e p o r t t o t h e M e m b e r s

30
B a l a n c e S h e e t a s a t 3 1 D e c e m b e r 2 0 0 3
Amounts in Rs ‘000
Note 2003 2002
Share Capital and Reserves
Authorised capital1,500,000,000 ordinary shares of Rs 10 each 15,000,000 15,000,000
Issued, subscribed and paid-up capital 3 1,388,023 1,388,023
Capital reserves 4 465,845 465,845
Unappropriated profit 3,260,995 2,737,146
5,114,863 4,591,014
Surplus on Revaluation of Fixed Assets 5 679,813 784,424
Redeemable Capital 6 -–– 1,400,000
Long-Term Loan - Unsecured 7 -–– -––
Deferred Liability 8 74,568 78,895
Current Liabilities and Provisions
Current portions of:
Redeemable capital 6 2,000,000 933,333
Long-term loan 7 2,011,800 2,042,250
Short-term financing 9 -–– 341,641
Creditors, accrued and other liabilities 10 3,903,777 3,303,012
Dividend payable -–– 312,305
Proposed dividend 347,006 -––
8,262,583 6,932,541
Contingencies and Commitments 11
14,131,827 13,786,874

31
B a l a n c e S h e e t a s a t 3 1 D e c e m b e r 2 0 0 3
Amounts in Rs ‘000
Note 2003 2002
Tangible Fixed Assets
Operating assets 12 5,182,095 5,426,965
Capital work-in-progress 13 345,463 315,816
5,527,558 5,742,781
Deferred Tax Asset - net 14 825,888 775,096
Investments 15 2,333,760 2,327,460
Long-Term Loans and Advances 16 114,675 301,154
Long-Term Deposits and Prepayments 17 24,054 21,683
Current Assets
Stores and spares 18 652,196 646,641
Stock-in-trade 19 2,046,297 1,743,822
Trade debts 20 643,473 672,384
Loans and advances 21 80,290 294,494
Trade deposits and short-term prepayments 22 166,193 125,572
Other receivables 23 316,575 311,092
Taxation recoverable 356,840 257,242
Cash and bank balances 24 1,044,028 567,453
5,305,892 4,618,700
14,131,827 13,786,874
The annexed notes 1 to 42 form an integral part of these accounts.
M J Jaffer Jonathan R Stoney Feroz RizviChairman / Director Chief Executive Chief Financial Officer

32
P r o f i t a n d L o s s A c c o u n t f o r t h e Y e a r E n d e d 3 1 D e c e m b e r 2 0 0 3
Amounts in Rs ‘000
Note 2003 2002
Turnover 25 22,156,265 15,073,813Sales tax, commission and discounts 25 (4,028,970) (2,854,876)
Net sales and commission income 18,127,295 12,218,937 Cost of goods sold 26 (15,462,928) (9,891,842)
Gross profit 2,664,367 2,327,095Administration and selling expenses 27 (1,576,686) (1,249,981)
Operating profit 1,087,681 1,077,114
Other income 28 187,243 329,251
1,274,924 1,406,365
Financial charges 29 390,714 631,122Other charges 30 77,658 52,149
(468,372) (683,271)
Profit before taxation 806,552 723,094Taxation 31 40,308 (1,131,638)
Profit after taxation 766,244 1,854,732Unappropriated profit brought forward 2,737,146 501,644
Available for appropriation 3,503,390 2,356,376
TRANSFERS AND APPROPRIATION:
Transfer from surplus on revaluation of fixed assets 5- prior years -–– 588,914- current year - net of tax 104,611 104,161
104,611 693,075
Appropriation:Proposed final dividend @ Rs 2.5 (2002: @ Rs 2.25) per share (347,006) (312,305)
Unappropriated profit carried forward 3,260,995 2,737,146
(Rupees) (Rupees)
Earning per share 32 5.52 13.36
The annexed notes 1 to 42 form an integral part of these accounts.
M J Jaffer Jonathan R Stoney Feroz RizviChairman / Director Chief Executive Chief Financial Officer

33
C a s h F l o w S t a t e m e n t f o r t h e Y e a r E n d e d 3 1 D e c e m b e r 2 0 0 3
Amounts in Rs ‘000
2003 2002
Cash Flows from Operating Activities
Profit before taxation 806,552 723,094
Adjustments for:Depreciation 647,677 630,760(Gain) / loss on disposal of fixed assets (41,145) 659Provision for diminution in the value of fixed assets 21,400 -––Provision for non-management staff gratuity
and pensioners’ medical scheme 11,474 20,135Return on subordinated loans due from Associate
and bank deposits (7,667) (211,386)Interest / mark-up expense 380,349 591,332
1,818,640 1,754,594
Movement in:Working capital 436,816 (39,040)Long-term loans and advances (113,521) 109,282Long-term deposits and prepayments (2,371) (5,612)
Cash generated from operations 2,139,564 1,819,224
Payments for:Non-management staff gratuity and pensioners’
medical scheme (15,801) (7,413)Interest / mark-up (335,526) (758,091)Taxation (190,698) (27,184)
Net cash generated from operating activities 1,597,539 1,026,536
Cash Flows from Investing Activities
Long-term investments (6,300) (1,514,207)Payments for capital expenditure (459,089) (499,951)Proceeds from disposal of fixed assets 54,496 20,798Profit / mark-up received 7,667 460,811Repayment of loan by Associate 300,000 1,500,000
Net cash used in investing activities (103,226) (32,549)

34
C a s h F l o w S t a t e m e n t f o r t h e Y e a r E n d e d 3 1 D e c e m b e r 2 0 0 3
Amounts in Rs ‘000
2003 2002
Cash Flows from Financing Activities
Long-term borrowings less repayments (363,783) (472,604)Short-term borrowings less repayments (250,000) (215,500)Dividend paid (312,314) (277,626)
Net cash used in financing activities (926,097) (965,730)
Net increase in cash and cash equivalents 568,216 28,257
Cash and cash equivalents at 1 January 475,812 447,555
Cash and cash equivalents at 31 December 1,044,028 475,812
Movement in Working Capital
(Increase) / decrease in current assets
Stores and spares (5,555) (99,768)Stock-in-trade (302,475) 271,073Trade debts 28,911 (67,698)Loans and advances 214,204 (221,903)Trade deposits and short-term prepayments (40,621) 64,498Other receivables (5,483) (151,446)
(111,019) (205,244)Increase in current liabilities
Creditors, accrued and other liabilities 547,835 166,204
436,816 (39,040)
Cash and cash equivalents at 31 December comprise of:
Cash and bank balances 1,044,028 567,453
Running finances utilised under mark-up arrangements -–– (91,641)
1,044,028 475,812
The annexed notes 1 to 42 form an integral part of these accounts.
M J Jaffer Jonathan R Stoney Feroz RizviChairman / Director Chief Executive Chief Financial Officer

35
S t a t e m e n t o f C h a n g e s i n E q u i t y f o r t h e Y e a r E n d e d 3 1 D e c e m b e r 2 0 0 3
Amounts in Rs ‘000
Issued, Capital Unappropriated Totalsubscribed reserves profit
and paid-upcapital
Balance as on 1 January 2002 1,388,023 465,845 501,644 2,355,512
Net profit for the year ended 31 December 2002 -__ -__ 1,854,732 1,854,732
Transfer from surplus on revaluation offixed assets:
- prior years -__ -__ 588,914 588,914 - current year - net of tax -__ -__ 104,161 104,161
-__ -__ 693,075 693,075
Final dividend -__ -__ (312,305) (312,305)
Balance as on 31 December 2002 1,388,023 465,845 2,737,146 4,591,014
Net profit for the year ended 31 December 2003 -__ -__ 766,244 766,244
Transfer from surplus on revaluation offixed assets -__ -__ 104,611 104,611
Proposed final dividend -__ -__ (347,006) (347,006)
Balance as on 31 December 2003 1,388,023 465,845 3,260,995 5,114,863
The annexed notes 1 to 42 form an integral part of these accounts.
M J Jaffer Jonathan R Stoney Feroz RizviChairman / Director Chief Executive Chief Financial Officer

36
N o t e s t o t h e A c c o u n t s f o r t h e Y e a r E n d e d 3 1 D e c e m b e r 2 0 0 3
1. Status and Nature of Business
ICI Pakistan Limited (“the Company”) is incorporated in Pakistan and is listed on Karachi, Lahore andIslamabad Stock Exchanges. The Company is engaged in the manufacture of polyester staple fibre, POYchips, soda ash, paints, specialty chemicals, sodium bicarbonate and polyurethanes; marketing of seeds,toll manufactured and imported pharmaceuticals and animal health products; and merchanting of generalchemicals. It also acts as an indenting agent.
2. Summary of Significant Accounting Policies
2.1 Statement of compliance
These accounts have been prepared in accordance with approved accounting standards as applicable inPakistan and the requirements of the Companies Ordinance, 1984. Approved accounting standardscomprise of such International Accounting Standards as notified under the provisions of the CompaniesOrdinance, 1984. Wherever the requirements of the Companies Ordinance, 1984 or directives issued by theSecurities and Exchange Commission of Pakistan differ with the requirements of these standards, therequirements of the Companies Ordinance, 1984 or the requirements of the said directives take precedence.
2.2 Accounting convention
These accounts have been prepared under the historical cost convention, except that certain fixed assetshave been included at revalued amounts, certain exchange elements referred to in notes 2.7 and 2.12 havebeen incorporated in the cost of the relevant assets and certain staff retirement benefits have beenrecognised at values determined by actuary.
2.3 Staff retirement benefits
The Company’s retirement benefit plans comprise of provident funds, pension and gratuity schemes and amedical scheme for pensioners. There are two registered provident funds. These are defined contributionschemes providing lump sum benefits. All other schemes are defined benefit schemes.
The pension and gratuity schemes are salary schemes providing pension and lump sums, respectively.Pension and gratuity schemes for management staff are invested through two approved trust funds. TheCompany contributes to both funds on the basis of actuarial recommendations. The gratuity scheme fornon-management staff and the pensioners’ medical scheme are unfunded.
An actuarial valuation of all defined benefit schemes is conducted at the end of every year. The valuationuses the Projected Unit Credit method. Actuarial (unrecognised) gains and losses are amortised over theexpected average remaining working lives of employees.
2.4 Provisions
A provision is recognised in the balance sheet when the Company has a legal or constructive obligation asa result of a past event, and it is probable that an outflow of economic benefits will be required to settle theobligation.
2.5 Trade and other payables
Trade and other payables are stated at their cost.
2.6 Taxation
Current
Provision for current taxation is based on taxable income at the current rates of taxation after taking intoaccount available tax credits and rebates, if any, or one-half of one percent of turnover, whichever is higher.

37
N o t e s t o t h e A c c o u n t s f o r t h e Y e a r E n d e d 3 1 D e c e m b e r 2 0 0 3
Deferred
Deferred tax is provided using balance sheet liability method, providing for temporary differences betweenthe carrying amounts of assets and liabilities for financial reporting purposes and the amounts used fortaxation purposes. The amount of deferred tax provided is based on the expected manner of realisation orsettlement of the carrying amount of assets and liabilities, using the current rates of taxation.
The Company recognises a deferred tax asset to the extent that it is probable that taxable profits for theforeseeable future will be available against which the asset can be utilised. Deferred tax assets are reducedto the extent that it is no longer probable that the related tax benefit will be realised. Further, the Companyrecognises deferred tax asset / liability on deficit / surplus on revaluation of fixed assets which is adjustedagainst the related deficit / surplus. The deferred tax debit balance not recognised in the accountsamounted to Rs 1,754.252 million (2002: Rs 2,105.346 million).
2.7 Tangible fixed assets and depreciation
Operating assets, except for freehold land, are stated at cost or revalued amounts less accumulateddepreciation and impairment losses. Freehold land is stated at cost or revalued amount and capital work-in-progress is stated at cost. Cost of certain fixed assets comprises historical cost, exchange differencesreferred to in note 2.12, cost of exchange risk cover in respect of foreign currency loans obtained for theacquisition of fixed assets upto the commencement of commercial production and the cost of borrowingsduring construction period in respect of loans taken for specific projects.
Depreciation charge is based on the straight-line method whereby the cost or revalued amount of an assetis written off to profit and loss account over its estimated useful life without taking into account any residualvalue. The cost of leasehold land is amortised in equal instalments over the lease period. The net exchangedifferences relating to an asset at the end of each year are amortised in equal instalments over its remaininguseful life. Depreciation on additions is charged from the month in which the asset is put to use and ondisposals up to the month of disposal.
Incremental depreciation charged for the period on revalued assets is transferred from surplus onrevaluation of fixed assets to retained earnings (unappropriated profit) during the current year.
Maintenance and normal repairs are charged to income as and when incurred; major renewals andimprovements are capitalised and the assets so replaced, if any, are retired.
Gains and losses on disposal of assets are taken to the profit and loss account, and the related surplus onrevaluation of fixed assets is transferred directly to retained earnings (unappropriated profits).
2.8 Investments
Investments in associated company, subsidiary and non-listed equity securities classified as available forsale are stated at cost less provision for impairment.
2.9 Stores and spares
Stores and spares are valued at moving average cost. Items in transit are valued at cost comprising invoicevalues plus other charges incurred thereon.
2.10 Stock-in-trade
Raw and packing materials except for those in-transit are valued at lower of moving average cost and netrealisable value.
Work-in-process is valued at material cost only. Conversion costs are not included as these are notsignificant.

38
N o t e s t o t h e A c c o u n t s f o r t h e Y e a r E n d e d 3 1 D e c e m b e r 2 0 0 3
Finished goods, with the exception of imported general chemicals, are valued at lower of average cost andnet realisable value. Imported general chemicals are valued at lower of cost, as determined on a first-in-first-out basis, and net realisable value. All manufactured finished goods include prime cost and anappropriate portion of production overheads.
Items in-transit are valued at cost comprising invoice values plus other charges incurred thereon.
Net realisable value signifies the estimated selling price in the ordinary course of business less netestimated costs of completion and selling expenses.
2.11 Trade debts and other receivables
Trade debts and other receivables are stated at cost less impairment losses.
2.12 Foreign currency translation
Transactions denominated in foreign currencies are translated to Pak Rupees at the foreign exchange rateruling at the date of transaction. Assets and liabilities in foreign currencies are translated into Pak Rupeesat the foreign exchange rates approximating those prevailing at the balance sheet date.
In respect of foreign currency loans obtained for the acquisition of fixed assets, the cost of exchange riskcover is capitalised in the relevant assets upto the date of commencement of commercial productionwhereas exchange differences on principal amount are included in the cost of the relevant assets over theperiod of these loans.
All other exchange differences are taken to the profit and loss account.
2.13 Transactions with related parties
The Company enters into transactions with related parties on an arm’s length basis. Prices for transactionswith related parties are determined using admissible valuation methods.
2.14 Revenue recognition
■ Sales are recorded on despatch of goods to customers.
■ Commission income is recognised on receipt of credit advice from suppliers.
■ Profit on short-term deposits is accounted for on time-apportioned basis on the principal outstandingand at the rate applicable.
■ Dividend income is recognised when the right to receive payment is established.
2.15 Segment reporting
A segment is a distinguishable component within a Company that is engaged in providing products(business segment), or in providing products within a particular economic environment (geographicalsegment), which is subject to risks and rewards that are different from those of other segments.

39
N o t e s t o t h e A c c o u n t s f o r t h e Y e a r E n d e d 3 1 D e c e m b e r 2 0 0 3
Amounts in Rs ‘000
3. Issued, Subscribed and Paid-up Capital
2003 2002 2003 2002
125,840,190 125,840,190 Ordinary shares of Rs 10 eachfully paid in cash 1,258,402 1,258,402
318,492 318,492 Ordinary shares of Rs 10 each issued asfully paid for consideration other than cash 3,185 3,185
25,227 25,227 Ordinary shares of Rs 10 eachissued as fully paid bonus shares 252 252
12,618,391 12,618,391 Ordinary shares issued pursuant to theScheme as fully paid for considerationof investment in Associate 126,184 126,184
138,802,300 138,802,300 1,388,023 1,388,023
3 . 1 With effect from 1 October 2000 the Pure Terephthalic Acid (PTA) Business of the Company was demergedunder a Scheme of Arrangement (“the Scheme”) dated 12 December 2000 approved by the shareholders andsanctioned by the High Court of Sindh.
3 . 2 ICI Omicron B.V., which is a wholly owned subsidiary of Imperial Chemical Industries PLC, UK, held105,229,125 (2002: 105,229,125) ordinary shares of Rs 10 each at 31 December 2003.
4. Capital Reserves
Share premium 465,259 465,259
Capital receipts 586 586
465,845 465,845
4 . 1 Share premium includes the premium amounting to Rs 0.902 million received on shares issued for theCompany's Polyester Plant installation in 1980 and share premium of Rs 464.357 million representing thed i fference between nominal value of Rs 10 per share of 12,618,391 ordinary shares issued by the Companyand the market value of Rs 590.541 million of the 126,183,909 ordinary shares corresponding to 25% holdingacquired in Pakistan PTA Limited, an associate, at the date of acquisition i.e. 2 November 2001 and thenumber of shares that have been issued were determined in accordance with the Scheme in the ratiobetween market value of the shares of two companies based on the mean of the middle market quotation ofthe Karachi Stock Exchange over the ten trading days between 22 October 2001 to 2 November 2001.
4 . 2 Capital receipts represent the amount received from various ICI PLC group companies overseas for thepurchase of fixed assets. The remitting companies have no claim to their repayments.
40
N o t e s t o t h e A c c o u n t s f o r t h e Y e a r E n d e d 3 1 D e c e m b e r 2 0 0 3
Amounts in Rs ‘000
2003 20025. Surplus on Revaluation of Fixed Assets
Balance as on 1 January 784,424 1,895,736
Less: Surplus relating to incremental depreciation charged onrelated assets in prior years transferred to retained earnings(unappropriated profit) -–– (588,914)
Related deferred tax liability on surplus onrevaluation of fixed assets -–– (418,237)
784,424 888,585
Less: Transfer to retained earnings (unappropriated profit) inrespect of incremental depreciation charged during theyear-net of deferred tax (104,611) (104,161)
Balance as on 31 December 679,813 784,424
6. Redeemable Capital - Secured (Non-participatory)
This represents long-term finances utilised under mark-up arrangements availed from following financialinstitutions:
Financier Instalments Repayment Rate of Mark-uppayable period Mark-up not due
%
6.1 Habib Bank Limited half-yearly 2001-2003 7.5 -–– -–– 333,333
6.2 Habib Bank Limited at maturity 2002-2004 3.5 16,340 800,000 800,000
6.3 Pakistan Kuwait Investment Co. (Pvt.) Limited at maturity 2002-2003 Variable -–– -–– 1,200,000
6.4 United Bank Limited at maturity 2003-2004 Variable 19,083 1,200,000 -––
2,000,000 2,333,333
Less: Current portion shown under current liabilities 2,000,000 933,333
-–– 1,400,000

41
N o t e s t o t h e A c c o u n t s f o r t h e Y e a r E n d e d 3 1 D e c e m b e r 2 0 0 3
Amounts in Rs ‘000
Details of long-term finances utilised under mark-up arrangements are as follows:
6.1 Secured by first pari passu hypothecation charge over plant, machinery, equipment and other movables /fixed assets of the Soda Ash Business. The loan has been fully repaid on 28 April 2003.
6.2 Secured by first pari passu hypothecation charge over plant and machinery of the Polyester Business.
6.3 Secured by first pari passu hypothecation charge over plant, machinery, equipment and other movables /fixed assets of the Soda Ash Business (including Sodium Bicarbonate). The loan carries mark-upcomprising a base rate plus 3.5 percent per annum with a floor of 13 percent per annum and a cap of 15.25percent per annum where the base rate is the SBP discount rate prevailing two days beforecommencement of semi-annual period for which the mark-up is being computed. The loan has been fullyrepaid on 1 April 2003.
6.4 Secured by first pari passu hypothecation charge over plant, machinery, equipment and other movables /fixed assets of the Soda Ash Business (including Sodium Bicarbonate) carrying mark-up which is theaverage of the last three cut-offs of the three months Treasury Bills preceding the quarter for which mark-up was due plus a fixed spread of 1.8 percent.
7. Long-Term Loan - Unsecured
Instalments Repayment Interest 2003 2002payable period rate
Mortar Investments at maturity 2004 6 months 2,011,800 2,042,250 International Ltd - Associated LIBOR pluscompany - USD 35 million a fixed (2002: USD 35 million) spread
of 1.0%
Less: Current portion shown under current liabilities 2,011,800 2,042,250
-–– -––
8. Deferred Liability
Provisions for non-management staff gratuity andpensioners’ medical schemes 74,568 78,895

Amounts in Rs ‘000
8.1 Staff Retirement Benefits
The amounts recognised in the profit and loss account against defined benefit schemes are as follows:
Funded Unfunded
Current service cost 51,583 4,360 Interest cost 78,059 6,852 Expected return on plan assets (68,828) -––Past service cost 26,935 2,226 Recognition of loss 5,445 640
Charge for the year 93,194 14,078
Year 2002 89,198 21,378
Movements in the net liability recognised in the balance sheet are as follows:
Opening balance (42,862) (79,248)Charge for the year (93,194) (14,078)Contributions / payments during the year 72,473 14,780
Closing balance (63,583) (78,546)
The amounts recognised in the balance sheet are as follows:
Fair value of plan assets 910,381 -––Present value of defined benefit obligation (1,179,766) (109,469)
Deficit (269,385) (109,469)Unrecognised net loss 205,802 30,923
Recognised liability (63,583) (78,546)
Year 2002 (42,862) (79,248)
These figures are based on the latest actuarial valuation, as at 31 December 2003. The valuation uses theProjected Unit Credit method. Actuarial gains and losses are amortised over the expected future service ofcurrent members.
The discount rate was taken as 8 percent per annum. Salary inflation was assumed to average 6 percentper annum over the future working lives of current employees. Medical cost trend was assumed to average3 percent per annum in the long-term. Return on plan assets was assumed equal to the discount rate.Actual return on plan assets during 2003 was Rs 85 million (2002: Rs 167 million).
The Company contributed Rs 33.828 million (2002: Rs 31.110 million) to the provident fund during the year.
42
N o t e s t o t h e A c c o u n t s f o r t h e Y e a r E n d e d 3 1 D e c e m b e r 2 0 0 3
43
N o t e s t o t h e A c c o u n t s f o r t h e Y e a r E n d e d 3 1 D e c e m b e r 2 0 0 3
Amounts in Rs ‘000
2003 20029. Short-Term Financing
Running finances utilised under mark-up arrangements - note 9.1 -–– 91,641 Term finances - note 9.2 -–– 250,000
-–– 341,641
9.1 The facilities for running finance available from various banks amount to Rs 2,645 million (2002: Rs 2,743million) and carry mark-up ranging from 2.48 to 5 percent per annum (2002: 7.6 to 17 percent per annum).The purchase prices are payable on various dates by 30 June 2004. The facilities are secured byhypothecation charge over the present and future stock-in-trade and receivables of the Company.
9.2 The facilities for term finance available from various banks amount to Rs 550 million (2002: Rs 550 million).However no such facility was utilised as on 31 December 2003.
10. Creditors, Accrued and Other Liabilities
Trade creditors- note 10.1 1,344,100 1,300,086Bills payable 1,235,968 894,584Sales tax, excise and custom duties 149,517 178,545Mark-up accrued on:
Redeemable capital 18,683 40,426Short-term financing 1,990 11,256
Accrued interest / return on unsecured loan 298,498 222,666Accrued expenses 310,747 273,034Workers’ profit participation fund - note 10.2 47,819 42,671Distributors’ security deposits - payable
on termination of distributorship - note 10.3 53,875 54,131Contractors’ earnest / retention money 16,771 18,778Advances from customers 105,991 52,172Unclaimed dividends 4,669 4,678Payable for capital expenditure 20,068 11,952Payable for staff retirement benefit schemes 77,720 42,720Others 217,361 155,313
3,903,777 3,303,012
1 0 . 1 The above balances include amounts due to associated undertakings amounting to Rs 249.776 million (2002: Rs 356.360 million).
10.2 Workers,
profit participation fund
Balance as on 1 January 42,671 33,135Allocation for the year 43,250 38,058
85,921 71,193Interest on funds utilised in the Company's
businesses at 16.9 percent per annum 3,571 3,835
89,492 75,028Less:
- Amount paid on behalf of the Fund 3,801 3,169- Deposited with the Government of Pakistan 37,872 29,188
41,673 32,357
Balance as on 31 December 47,819 42,671
10.3 Interest on security deposits from certain distributors is payable at 7.5 percent per annum as specified inthe agreements.

44
N o t e s t o t h e A c c o u n t s f o r t h e Y e a r E n d e d 3 1 D e c e m b e r 2 0 0 3
Amounts in Rs ‘000
2003 200211. Contingencies and Commitments
11.1 Claims against the Company not acknowledged as debts are as follows:
Local bodies 60,753 31,228Sales Tax authorities 67,677 67,426Others 50,151 50,151
178,581 148,805
11.2 The income tax authorities have re-assessed the income tax liability of the Company in respect ofassessment year 1998-99 under section 122 of the Income Tax Ordinance 2001 and have raised a demandof Rs 72.138 million. The Company has filed an appeal against this demand with the Income Tax AppellateTribunal and is confident of a favorable decision in this regard.
11.3 Guarantees given to a bank on behalf of ICI Pakistan PowerGen Limited for loan, running finances andother credit facilities amounting to Rs 140 million (2002: Rs 140 million).
11.4 Guarantees issued by the Company in respect of financial and operational obligations of Pakistan PTALimited pursuant to the Scheme amounting to Rs 7,195.412 million (2002 : Rs 12,485.556 million) againstwhich Pakistan PTA Limited has issued counter guarantees to the Company.
11 . 5 Guarantee issued by the Company in respect of Senior Executive amounting to Rs 3.5 million (2002: Rs Nil).
11.6 Commitments in respect of capital expenditure - Rs 3.244 million (2002: Rs 22.342 million).
11.7 Faysal Management Services (Private) Limited has floated Fayzan Manufacturing Modaraba ("theModaraba") which commissioned a spinning and processing plant ("Manufacturing Facility") in April 2002at a capital cost of Rs 1,356 million. The Manufacturing Facility is producing Polyester Staple Fibre frompolymer provided by ICI Pakistan Limited under a Toll Manufacturing Agreement. This agreement is for aperiod of four and half years from the commencement of commercial production and is renewable withmutual consent. At the completion of the agreement term or on its termination, the Company will purchasethe Manufacturing Facility from the Modaraba at a price approximating the fair value of the ManufacturingFacility, provided the Modaraba is able to deliver free and unencumbered title to the Manufacturing Facility.
The Toll Manufacturing Agreement provides for a fee to be paid by the Company to the Modaraba, whichis based on the quantity of polymer processed by the Modaraba and includes a capacity fee of Rs 4.416million (2002: Rs 7.968 million) per month for making the Manufacturing Facility available to the Company.The Company also provides chemicals and other raw materials to the Modaraba at market price.
11.8 Commitments for rentals under operating lease agreements in respect of vehicles and plant and machineryamounting to Rs 107.541 million (2002: Rs 109.183 million) are as follows:
Year Vehicles Plant and machinery Total(Rupees '000)
2004 46,845 1,054 47,8992005 36,026 1,033 37,0592006 17,267 1,033 18,3002007 3,381 902 4,283
103,519 4,022 107,541
Payable not later than one year 47,899
Payable later than one year but not later than five years 59,642
107,541
The above operating lease agreements are renewable for a further period of three years at the discretionof the Company.
11.9 Outstanding forward contracts as at 31 December 2003 entered into by the Company to hedge foreigncurrency transactions maturing within the next twelve months amounted to Rs 441.037 million (2002: Rs231.673 million).

45
N o t e s t o t h e A c c o u n t s f o r t h e Y e a r E n d e d 3 1 D e c e m b e r 2 0 0 3
12.2 The above balances represent the value of operating assets subsequent to revaluation on 1 October 1959and 30 September 2000, which had resulted in a surplus of Rs 14.207 million and Rs 1,569.869 millionrespectively. The incremental values of the assets revalued on 1 October 1959 and 30 September 2000 arebeing depreciated over the remaining useful lives of the assets at the date of revaluation.
12.3 Had there been no revaluation, the net book value of specific classes of operating assets would haveamounted to:
Net Book Value
2003 2002
Freehold land 20,929 20,929Leasehold land 52 57Plant and machinery 3,328,344 3,394,717 Rolling stock and vehicles 16,402 18,079Furniture and equipment 140,395 140,421
3,506,122 3,574,203
12.4 The depreciation charge for the year has been allocated as follows:
Cost of goods sold - note 26 613,126 598,556
Administration and selling expenses - note 27 34,551 32,204
647,677 630,760
Amounts in Rs ‘000
12. Operating Assets
12.1 The following is a statement of operating assets:
Cost and Additions / Cost and Accumulated Charge for the Accumulated Book value Depreciationrevaluation (disposals) revaluation depreciation year / depreciation at 31 rate on original
at 1 at 31 at 1 (accumulated at 31 December cost andJanuary 2003 December 2003 January 2003 depreciation December 2003 2003 revaluation
on disposals)Adjustments* %
Freehold land 49,706 -–– 49,706 -–– -–– -–– 49,706 -
Leasehold land 83,471 -–– 83,471 26,710 10,285 36,995 46,476 2 to 4
Limebeds on freehold land 86,706 18,366 105,072 21,333 4,380 25,713 79,359 3.33 to 7.5
Buildings on freehold land 610,780 62,481 662,565 411,051 37,888 438,777 223,788 5 to 10 (10,696) (10,162)
Buildings on leasehold land 695,857 2,688 690,065 260,470 33,998 292,706 397,359 2.5 to 10 (8,480) (1,762)
Plant and machinery 10,875,954 302,789 11,162,694 6,414,451 512,234 6,934,084 4,228,610 3.33 to 10 (16,049) (14,001)
21,400 *
Railway sidings 297 - 297 297 - 297 -–– 3.33
Rolling stock and vehicles 125,629 3,698 123,804 107,549 3,575 107,402 16,402 10 to 25 (5,523) (3,722)
Furniture and equipment 432,281 47,536 472,758 291,855 45,317 332,363 140,395 10 to 33.33 (7,059) (4,809)
2003 12,960,681 437,558 13,350,432 7,533,716 647,677 8,168,337 5,182,095 (47,807) (34,456)
21,400 *
2002 12,572,160 436,540 12,960,681 6,929,518 630,760 7,533,716 5,426,965 (48,019) (26,562)
*Represents provision for diminution in the value of plant and machinery of Agrochemicals Business.

46
N o t e s t o t h e A c c o u n t s f o r t h e Y e a r E n d e d 3 1 D e c e m b e r 2 0 0 3
Amounts in Rs ‘00012.5 Detail of assets disposed off during the year:
Cost Accumulated Book Sale Particulars of buyers
depreciation value proceeds
Land
Written-off 10,622 10,088 534 - Various
Written down value not exceeding Rs 5,000 each 74 74 -– 2 Various
10,696 10,162 534 2
Building
Sold by tender 8,480 1,762 6,718 40,000 Muslim Commercial Bank Ltd., Karachi
Plant & machinery
Sold by negotiations 3,918 3,918 -–– 1,959 Pakistan State Oil Co. Ltd., Karachi3,566 1,544 2,022 1,732 Pakistan State Oil Co. Ltd., Karachi
94 68 26 39 Rana Mukhtar Ahmed, Lahore
Written-off 4,661 4,661 -–– -–– Various
Written down value not exceeding Rs 5,000 each 3,810 3,810 -–– 2,518 Various
16,049 14,001 2,048 6,248
Rolling stock & vehicles
Sold by tender 167 - 167 648 Faisal Mahmood Butt, Lahore157 - 157 563 Faisal Mahmood, Lahore160 - 160 613 M Iqbal, Lahore156 3 153 566 M Zahid Siddiqui, Lahore167 - 167 593 Raza Ahmed Khan, Lahore443 - 443 506 Raza Ahmed Khan, Lahore
Sold by negotiations 42 3 39 695 Malik M Imtiaz, Lahore167 132 35 595 Mohammad Ahsan, Lahore
93 8 85 700 Quick Filling CNG Station, Lahore
Sold by auction 557 163 394 380 Haji Mohammad Aslam, Multan
Written down value not exceeding Rs 5,000 each 3,414 3,413 1 913 Chaudhry Waseem Manzoor, Lahore
5,523 3,722 1,801 6,772
Furniture and equipment
Sold by negotiations 14 7 7 1 Abdul Khaliq, Khewra15 2 13 11 Abdul Latif Khan, Khewra15 2 13 11 Abrar Ul Haq, Khewra
112 52 60 15 Al-Asad Traders, Lahore11 5 6 5 Bashir Ahmed, Khewra12 5 7 1 Ghazanfar Hussain, Khewra14 2 12 9 Ghulam Rabbani, Khewra47 9 38 5 HM Aslam, Lahore

Amounts in Rs ‘000
Cost Accumulated Book Sale Particulars of buyers
depreciation value proceeds
14 2 12 11 Ikramuddin, Khewra
13 6 7 1 Khalid Mahmood, Khewra
1,764 416 1,348 1,016 Lubna Malik, wife of late CEO, Karachi
30 14 16 15 M Sharif, Lahore
15 7 8 3 M Waqar Khawaja, Khewra
17 4 13 8 Mazhar Hussain, Khewra
14 6 8 1 Misbah Ul Hassan, Khewra
7 1 6 6 Mohammad Akram, Khewra
15 5 10 6 Mohammad Azeem, Khewra
13 8 5 1 Mohammad Bashir, Khewra
7 1 6 6 Mohammad Hanif, Khewra
7 1 6 6 Mohammad Munawar, Khewra
13 4 9 6 Mohammad Riaz, Khewra
14 2 12 10 Mohammad Safdar, Khewra
12 9 3 1 Mussadiq Hussain,Khewra
16 6 10 5 Najeeb Ullah, Khewra
15 9 6 1 Nizam Din, Khewra
14 7 7 3 Raghab Hassan, Khewra
14 2 12 10 Riasat Ali, Khewra
14 2 12 10 Sabir Hussain, Khewra
15 5 10 4 Safdar Hussain, Khewra
14 7 7 3 Shabir Ahmed Malik, Khewra
185 105 80 36 Sohail House Hold Traders, Lahore
14 5 9 6 Syed Ahmed Shah, Khewra
47 38 9 3 United Mobile, Karachi
20 6 14 6 United Mobile, Karachi
32 6 26 8 United Mobile, Karachi
21 6 15 4 United Mobile, Karachi
15 3 12 3 United Mobile, Karachi
15 2 13 10 Zulfiqar Hussain Shah, Khewra
Insurance claim 357 344 13 82 Claim settled by insurer
Written-off 1,173 913 260 - Various
Written down value
not exceeding Rs 5,000 each 2,883 2,773 110 125 Various
7,059 4,809 2,250 1,474
2003 47,807 34,456 13,351 54,496
2002 48,019 26,562 21,457 20,798
47
N o t e s t o t h e A c c o u n t s f o r t h e Y e a r E n d e d 3 1 D e c e m b e r 2 0 0 3

48
N o t e s t o t h e A c c o u n t s f o r t h e Y e a r E n d e d 3 1 D e c e m b e r 2 0 0 3
Amounts in Rs ‘000
2003 200213. Capital Work-in-Progress
Designing, consultancy and engineering fee 41,266 25,201Civil works and buildings 11,540 29,426Plant and machinery 184,011 176,962Miscellaneous equipment 72,683 54,688Advances to suppliers / contractors 35,963 29,539
345,463 315,81614. Deferred Tax Asset - net
Deductible temporary differencesRecognised tax losses 1,674,377 1,784,518
Taxable temporary differencesSurplus on revaluation of fixed assets (317,188) (367,980)Other taxable temporary differences (531,301) (641,442)
825,888 775,096 15. Investments
QuotedAssociated Undertaking
- Pakistan PTA Limited - note 15.1378,551,727 ordinary shares (2002: 378,551,727) of Rs 10 each 2,121,260 2,114,960
Unquoted Subsidiary
- ICI Pakistan PowerGen Limited (wholly owned) - note 15.22,100,000 ordinary shares (2002: 2,100,000) of Rs 100 each 210,000 210,000
OthersEquity security available for sale
- Arabian Sea Country Club Limited 2,500 2,500
2,333,760 2,327,460
15.1 The market value as at 31 December 2003 and breakup value (including surplus on revaluation of fixedassets) of the Company's 25% investment in Pakistan PTA Limited based on its audited accounts for the yearended 31 December 2003 amounts to Rs 5,053.666 million (2002 : Rs 2,668.790 million) and Rs 1,007.453million (2002 : Rs 3,843.940 million) r e s p e c t i v e l y. Further, the increase in the cost of investment representsadditional demerger cost recognised during the year under the Scheme.
15.2 The value of the Company's investment on the basis of net assets of the Subsidiary as disclosed in the auditedaccounts for the year ended 31 December 2003 amounted to Rs 198.388 million (2002: Rs 189.347 million).
16. Long-Term Loans and Advances - Considered Good
Due from Associate - Unsecured- Long-term loan - note 16.1 -–– 300,000- Due from Directors, Executives and Employees - note 16.2 149,476 130,971
149,476 430,971Less: Current portions shown under current assets
- Due from Associate - note 16.1 -–– 100,000- Due from Directors, Executives and Employees - note 16.2 34,801 29,817
34,801 129,817
114,675 301,154
16.1 The loan carried a rate of return of 6.5 percent per annum (2002: 10.5 percent per annum). The loan hasbeen fully repaid by the Associate on 1 April 2003.

49
N o t e s t o t h e A c c o u n t s f o r t h e Y e a r E n d e d 3 1 D e c e m b e r 2 0 0 3
Amounts in Rs ‘000
16.2 Due from Directors and Executives
2003 2002
Motor car House Total Totalbuilding
Due from:- Director -–– -–– -–– -––- Executives 86,795 35,448 122,243 104,703
86,795 35,448 122,243 104,703 Less: Receivable within one year
- Director -–– -–– -–– -––- Executives 12,133 15,891 28,024 22,974
12,133 15,891 28,024 22,974
74,662 19,557 94,219 81,729
Due from Employees 27,233 26,268 Less: Receivable within one year 6,777 6,843
20,456 19,425
114,675 101,154
Outstanding for period:- less than three years 66,048 70,910 - more than three years 48,627 30,244
114,675 101,154
16.3 Loans for purchase of motor cars and house building assistance are repayable between two to ten years.These loans are interest free and granted to the employees of the Company in accordance with their termsof employment.
16.4 The maximum aggregate amount of long-term loans and advances due from the Directors and Executivesat the end of any month during the year was Rs Nil and Rs 123.153 million (2002: Rs 0.098 million and Rs124.514 million) respectively.
17. Long-Term Deposits and Prepayments
Deposits 16,766 16,841Prepayments 7,288 4,842
24,054 21,683
18. Stores and Spares
Stores (include in-transit Rs 4.548 million; 2002: Rs 1.845 million) 39,759 85,516
Spares (include in-transit Rs 3.069 million; 2002: Rs 3.608 million) 575,537 566,945
Consumables 82,189 39,469
697,485 691,930
Less: Provision for slow moving and obsolete items 45,289 45,289
652,196 646,641

50
N o t e s t o t h e A c c o u n t s f o r t h e Y e a r E n d e d 3 1 D e c e m b e r 2 0 0 3
Amounts in Rs ‘000
2003 200219. Stock-in-Trade
Raw and packing materials (include in-transit Rs 140.237 million;2002: Rs 125.120 million) 798,648 746,564
Work-in-process 79,969 126,779
Finished goods (include in-transit Rs 53.615 million; 2002: Rs 94.972 million) 1,200,419 903,969
2,079,036 1,777,312
Less: Provision for slow moving and obsolete stock 32,739 33,490
2,046,297 1,743,822
20. Trade Debts
Considered good - Secured 360,116 405,437 - Unsecured 364,552 338,111
724,668 743,548 Considered doubtful 161,317 104,506
885,985 848,054
Less: Provision for:- Doubtful debts 161,317 104,506- Discounts payable 81,195 71,164
242,512 175,670
643,473 672,384
21. Loans and Advances
Considered good
Loans due from:Executives 28,024 22,974 Employees 6,777 6,843 Associate -–– 100,000
34,801 129,817Advances to:
Executives 2,651 2,745Employees 49 705 Contractors and suppliers 40,834 159,765Others 1,955 1,462
45,489 164,677
80,290 294,494Considered doubtful 9,003 2,404
89,293 296,898Less: Provision for doubtful loans and advances 9,003 2,404
80,290 294,494
21.1 The maximum aggregate amount of advances due from the Directors and Executives at the end of any monthduring the year was Rs Nil and Rs 4.153 million (2002: Rs 0.1 million and Rs 4.752 million) respectively.
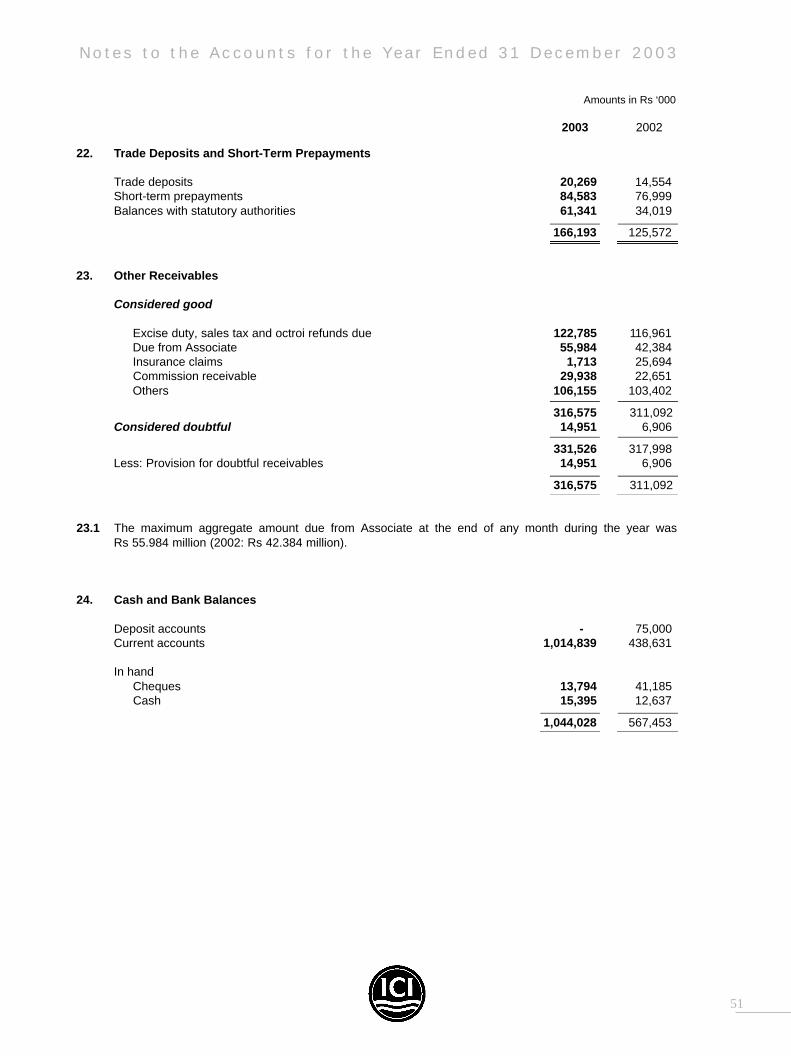
51
N o t e s t o t h e A c c o u n t s f o r t h e Y e a r E n d e d 3 1 D e c e m b e r 2 0 0 3
Amounts in Rs ‘000
2003 2002
22. Trade Deposits and Short-Term Prepayments
Trade deposits 20,269 14,554Short-term prepayments 84,583 76,999Balances with statutory authorities 61,341 34,019
166,193 125,572
23. Other Receivables
Considered good
Excise duty, sales tax and octroi refunds due 122,785 116,961Due from Associate 55,984 42,384Insurance claims 1,713 25,694Commission receivable 29,938 22,651Others 106,155 103,402
316,575 311,092Considered doubtful 14,951 6,906
331,526 317,998Less: Provision for doubtful receivables 14,951 6,906
316,575 311,092
23.1 The maximum aggregate amount due from Associate at the end of any month during the year wasRs 55.984 million (2002: Rs 42.384 million).
24. Cash and Bank Balances
Deposit accounts -–– 75,000Current accounts 1,014,839 438,631
In handCheques 13,794 41,185 Cash 15,395 12,637
1,044,028 567,453

52
N o t e s t o t h e A c c o u n t s f o r t h e Y e a r E n d e d 3 1 D e c e m b e r 2 0 0 3
Amounts in Rs ‘00025. Operating Results
Polyester General Chemicals Soda Ash Paints Others Company Company2003 2002 2003 2002 2003 2002 2003 2002 2003 2002 2003 2002
SalesInter-segment -–– -–– 275,391 216,409 -–– -–– -–– -–– 50,014 50,305 -–– -––Others 8,648,117 6,923,092 5,439,434 760,001 3,179,488 3,256,980 2,988,826 2,478,176 1,851,310 1,614,681 22,107,175 15,032,930
8,648,117 6,923,092 5,714,825 976,410 3,179,488 3,256,980 2,988,826 2,478,176 1,901,324 1,664,986 22,107,175 15,032,930Commission income -–– -–– 49,090 40,883 -–– -–– -–– -–– -–– -–– 49,090 40,883
Turnover 8,648,117 6,923,092 5,763,915 1,017,293 3,179,488 3,256,980 2,988,826 2,478,176 1,901,324 1,664,986 22,156,265 15,073,813
Sales tax 1,437,863 1,121,812 780,589 150,747 534,369 548,086 420,797 354,545 75,238 101,729 3,248,856 2,276,919
Commission and discounts to distributorsand customers 105,823 41,088 20,078 -–– 121,755 104,551 286,841 243,611 245,617 188,707 780,114 577,957
1,543,686 1,162,900 800,667 150,747 656,124 652,637 707,638 598,156 320,855 290,436 4,028,970 2,854,876 Net sales and
commission income 7,104,431 5,760,192 4,963,248 866,546 2,523,364 2,604,343 2,281,188 1,880,020 1,580,469 1,374,550 18,127,295 12,218,937
Cost of goods sold 26 6,881,008 5,530,488 4,453,818 701,758 1,804,645 1,722,415 1,554,118 1,278,862 1,094,744 925,033 15,462,928 9,891,842
Gross profit 223,423 229,704 509,430 164,788 718,719 881,928 727,070 601,158 485,725 449,517 2,664,367 2,327,095
Administration and selling expenses 27 199,235 158,181 388,310 78,894 304,073 327,477 331,991 303,981 353,077 381,448 1,576,686 1,249,981
Operating profit 24,188 71,523 121,120 85,894 414,646 554,451 395,079 297,177 132,648 68,069 1,087,681 1,077,114
25.1 Segment assets 4,492,652 4,377,151 860,972 388,176 3,801,296 3,875,155 743,922 617,420 716,497 1,169,174 10,615,339 10,427,076
25.2 Unallocated assets -–– -–– -–– -–– -–– -–– -–– -–– -–– -–– 3,516,488 3,359,798
14,131,827 13,786,874
25.3 Segment liabilities 1,972,713 1,899,387 467,825 222,725 476,037 665,275 283,748 263,598 456,172 404,793 3,656,495 3,455,778
25.4 Unallocated liabilities -–– -–– -–– -–– -–– -–– -–– -–– -–– -–– 4,680,656 4,955,658
8,337,151 8,411,436
25.5 Non-cash items(excluding depreciation) 3,066 4,937 45 608 6,721 10,399 1,115 1,696 21,927 2,495 32,874 20,135
25.6 Capital expenditure 204,183 104,254 6,863 6,931 181,841 263,706 45,772 36,173 28,546 38,451 467,205 449,515
25.7 Inter-segment salesInter-segment sales have been eliminated from the total.
25.8 Inter-segment pricingTransactions among the business segments are recorded at arm's length prices using admissible valuation methods.
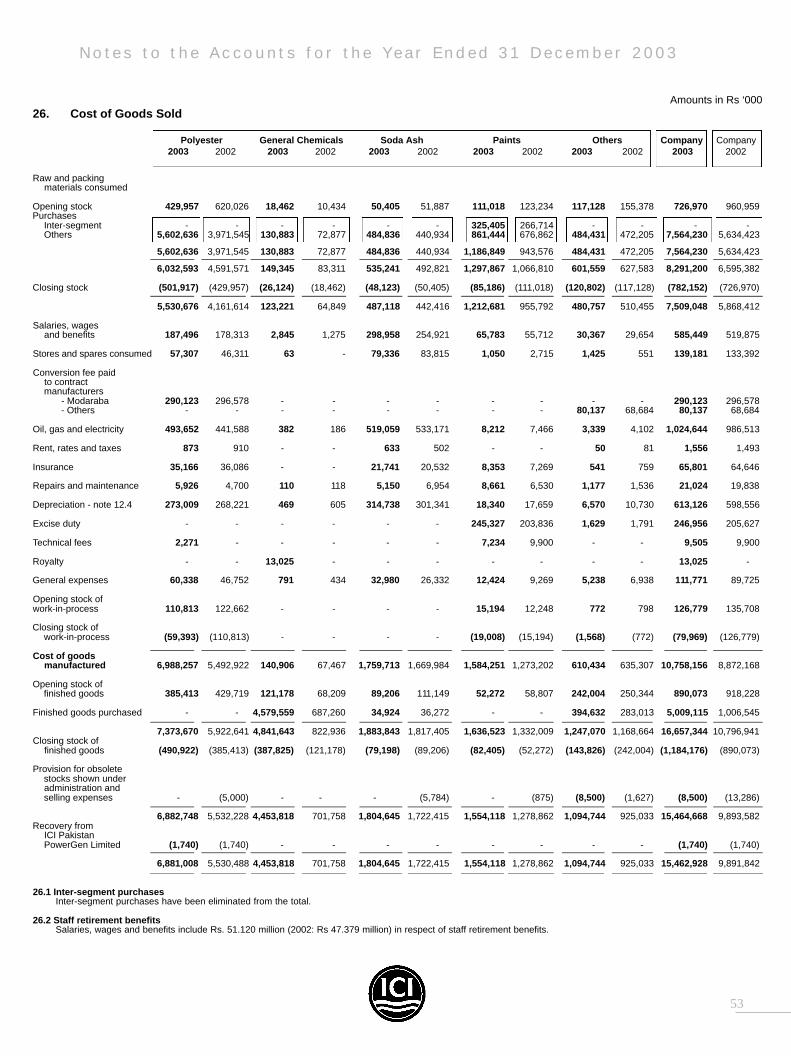
53
N o t e s t o t h e A c c o u n t s f o r t h e Y e a r E n d e d 3 1 D e c e m b e r 2 0 0 3
Amounts in Rs ‘00026. Cost of Goods Sold
Polyester General Chemicals Soda Ash Paints Others Company Company2003 2002 2003 2002 2003 2002 2003 2002 2003 2002 2003 2002
Raw and packingmaterials consumed
Opening stock 429,957 620,026 18,462 10,434 50,405 51,887 111,018 123,234 117,128 155,378 726,970 960,959 Purchases
Inter-segment -–– -–– -–– -–– -–– -–– 325,405 266,714 -–– -–– -–– -––Others 5,602,636 3,971,545 130,883 72,877 484,836 440,934 861,444 676,862 484,431 472,205 7,564,230 5,634,423
5,602,636 3,971,545 130,883 72,877 484,836 440,934 1,186,849 943,576 484,431 472,205 7,564,230 5,634,423
6,032,593 4,591,571 149,345 83,311 535,241 492,821 1,297,867 1,066,810 601,559 627,583 8,291,200 6,595,382
Closing stock (501,917) (429,957) (26,124) (18,462) (48,123) (50,405) (85,186) (111,018) (120,802) (117,128) (782,152) (726,970)
5,530,676 4,161,614 123,221 64,849 487,118 442,416 1,212,681 955,792 480,757 510,455 7,509,048 5,868,412
Salaries, wages and benefits 187,496 178,313 2,845 1,275 298,958 254,921 65,783 55,712 30,367 29,654 585,449 519,875
Stores and spares consumed 57,307 46,311 63 - 79,336 83,815 1,050 2,715 1,425 551 139,181 133,392
Conversion fee paid to contractmanufacturers
- Modaraba 290,123 296,578 -–– -–– -–– -–– -–– -–– -–– -–– 290,123 296,578 - Others -–– -–– -–– -–– -–– -–– -–– -–– 80,137 68,684 80,137 68,684
Oil, gas and electricity 493,652 441,588 382 186 519,059 533,171 8,212 7,466 3,339 4,102 1,024,644 986,513
Rent, rates and taxes 873 910 -–– -–– 633 502 -–– -–– 50 81 1,556 1,493
Insurance 35,166 36,086 -–– -–– 21,741 20,532 8,353 7,269 541 759 65,801 64,646
Repairs and maintenance 5,926 4,700 110 118 5,150 6,954 8,661 6,530 1,177 1,536 21,024 19,838
Depreciation - note 12.4 273,009 268,221 469 605 314,738 301,341 18,340 17,659 6,570 10,730 613,126 598,556
Excise duty -–– -–– -–– -–– -–– -–– 245,327 203,836 1,629 1,791 246,956 205,627
Technical fees 2,271 -–– -–– -–– -–– -–– 7,234 9,900 -–– -–– 9,505 9,900
Royalty -–– -–– 13,025 -–– -–– -–– -–– -–– -–– -–– 13,025 -––
General expenses 60,338 46,752 791 434 32,980 26,332 12,424 9,269 5,238 6,938 111,771 89,725
Opening stock ofwork-in-process 110,813 122,662 -–– -–– -–– -–– 15,194 12,248 772 798 126,779 135,708
Closing stock ofwork-in-process (59,393) (110,813) -–– -–– -–– -–– (19,008) (15,194) (1,568) (772) (79,969) (126,779)
Cost of goods manufactured 6,988,257 5,492,922 140,906 67,467 1,759,713 1,669,984 1,584,251 1,273,202 610,434 635,307 10,758,156 8,872,168
Opening stock offinished goods 385,413 429,719 121,178 68,209 89,206 111,149 52,272 58,807 242,004 250,344 890,073 918,228
Finished goods purchased -–– -–– 4,579,559 687,260 34,924 36,272 -–– -–– 394,632 283,013 5,009,115 1,006,545
7,373,670 5,922,641 4,841,643 822,936 1,883,843 1,817,405 1,636,523 1,332,009 1,247,070 1,168,664 16,657,344 10,796,941 Closing stock of
finished goods (490,922) (385,413) (387,825) (121,178) (79,198) (89,206) (82,405) (52,272) (143,826) (242,004) (1,184,176) (890,073)
Provision for obsolete stocks shown under administration andselling expenses -–– – (5,000) -–– -–– –– -–– –– (5,784) -–– (875) (8,500) (1,627) (8,500) (13,286)
6,882,748 5,532,228 4,453,818 701,758 1,804,645 1,722,415 1,554,118 1,278,862 1,094,744 925,033 15,464,668 9,893,582 Recovery from
ICI PakistanPowerGen Limited (1,740) (1,740) -–– -–– -–– -–– -–– -–– -–– -–– (1,740) (1,740)
6,881,008 5,530,488 4,453,818 701,758 1,804,645 1,722,415 1,554,118 1,278,862 1,094,744 925,033 15,462,928 9,891,842
26.1 Inter-segment purchasesInter-segment purchases have been eliminated from the total.
26.2 Staff retirement benefitsSalaries, wages and benefits include Rs. 51.120 million (2002: Rs 47.379 million) in respect of staff retirement benefits.
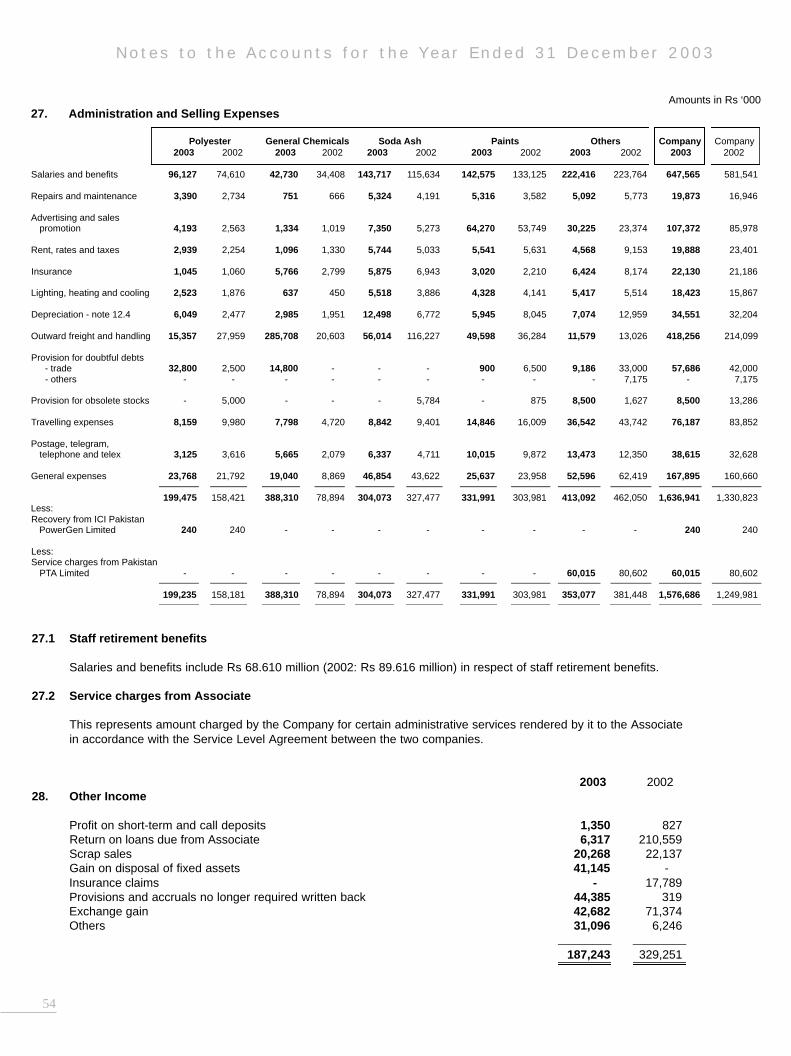
54
N o t e s t o t h e A c c o u n t s f o r t h e Y e a r E n d e d 3 1 D e c e m b e r 2 0 0 3
27.1 Staff retirement benefits
Salaries and benefits include Rs 68.610 million (2002: Rs 89.616 million) in respect of staff retirement benefits.
27.2 Service charges from Associate
This represents amount charged by the Company for certain administrative services rendered by it to the Associatein accordance with the Service Level Agreement between the two companies.
2003 200228. Other Income
Profit on short-term and call deposits 1,350 827Return on loans due from Associate 6,317 210,559Scrap sales 20,268 22,137Gain on disposal of fixed assets 41,145 -––Insurance claims -–– 17,789Provisions and accruals no longer required written back 44,385 319Exchange gain 42,682 71,374Others 31,096 6,246
187,243 329,251
Amounts in Rs ‘00027. Administration and Selling Expenses
Polyester General Chemicals Soda Ash Paints Others Company Company2003 2002 2003 2002 2003 2002 2003 2002 2003 2002 2003 2002
Salaries and benefits 96,127 74,610 42,730 34,408 143,717 115,634 142,575 133,125 222,416 223,764 647,565 581,541
Repairs and maintenance 3,390 2,734 751 666 5,324 4,191 5,316 3,582 5,092 5,773 19,873 16,946
Advertising and sales promotion 4,193 2,563 1,334 1,019 7,350 5,273 64,270 53,749 30,225 23,374 107,372 85,978
Rent, rates and taxes 2,939 2,254 1,096 1,330 5,744 5,033 5,541 5,631 4,568 9,153 19,888 23,401
Insurance 1,045 1,060 5,766 2,799 5,875 6,943 3,020 2,210 6,424 8,174 22,130 21,186
Lighting, heating and cooling 2,523 1,876 637 450 5,518 3,886 4,328 4,141 5,417 5,514 18,423 15,867
Depreciation - note 12.4 6,049 2,477 2,985 1,951 12,498 6,772 5,945 8,045 7,074 12,959 34,551 32,204
Outward freight and handling 15,357 27,959 285,708 20,603 56,014 116,227 49,598 36,284 11,579 13,026 418,256 214,099
Provision for doubtful debts- trade 32,800 2,500 14,800 -–– -–– -–– 900 6,500 9,186 33,000 57,686 42,000 - others -–– -–– -–– -–– -–– -–– -–– -–– - 7,175 -–– 7,175
Provision for obsolete stocks -–– 5,000 -–– -–– -–– 5,784 -–– 875 8,500 1,627 8,500 13,286
Travelling expenses 8,159 9,980 7,798 4,720 8,842 9,401 14,846 16,009 36,542 43,742 76,187 83,852
Postage, telegram,telephone and telex 3,125 3,616 5,665 2,079 6,337 4,711 10,015 9,872 13,473 12,350 38,615 32,628
General expenses 23,768 21,792 19,040 8,869 46,854 43,622 25,637 23,958 52,596 62,419 167,895 160,660
199,475 158,421 388,310 78,894 304,073 327,477 331,991 303,981 413,092 462,050 1,636,941 1,330,823 Less:Recovery from ICI Pakistan
PowerGen Limited 240 240 -–– -–– -–– -–– -–– -–– -–– -–– 240 240
Less:Service charges from Pakistan
PTA Limited -–– -–– -–– -–– -–– -–– -–– -–– 60,015 80,602 60,015 80,602
199,235 158,181 388,310 78,894 304,073 327,477 331,991 303,981 353,077 381,448 1,576,686 1,249,981
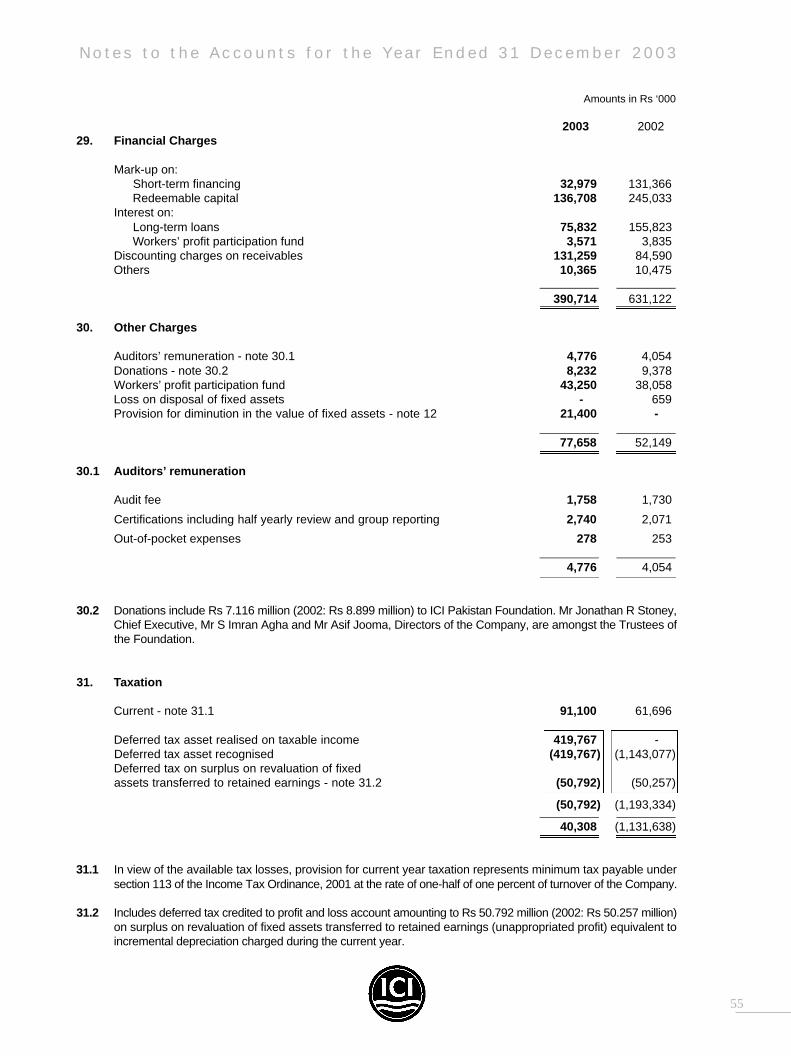
55
N o t e s t o t h e A c c o u n t s f o r t h e Y e a r E n d e d 3 1 D e c e m b e r 2 0 0 3
Amounts in Rs ‘000
2003 200229. Financial Charges
Mark-up on:Short-term financing 32,979 131,366Redeemable capital 136,708 245,033
Interest on:Long-term loans 75,832 155,823Workers’ profit participation fund 3,571 3,835
Discounting charges on receivables 131,259 84,590Others 10,365 10,475
390,714 631,122
30. Other Charges
Auditors’ remuneration - note 30.1 4,776 4,054Donations - note 30.2 8,232 9,378Workers’ profit participation fund 43,250 38,058Loss on disposal of fixed assets -–– 659Provision for diminution in the value of fixed assets - note 12 21,400 -––
77,658 52,149
30.1 Auditors’ remuneration
Audit fee 1,758 1,730
Certifications including half yearly review and group reporting 2,740 2,071
Out-of-pocket expenses 278 253
4,776 4,054
3 0 . 2 Donations include Rs 7.116 million (2002: Rs 8.899 million) to ICI Pakistan Foundation. Mr Jonathan R Stoney,Chief Executive, Mr S Imran Agha and Mr Asif Jooma, Directors of the Company, are amongst the Trustees ofthe Foundation.
31. Taxation
Current - note 31.1 91,100 61,696
Deferred tax asset realised on taxable income 419,767 -––Deferred tax asset recognised (419,767) (1,143,077)Deferred tax on surplus on revaluation of fixed assets transferred to retained earnings - note 31.2 (50,792) (50,257)
(50,792) (1,193,334)
40,308 (1,131,638)
3 1 . 1 In view of the available tax losses, provision for current year taxation represents minimum tax payable undersection 113 of the Income Tax Ordinance, 2001 at the rate of one-half of one percent of turnover of the Company.
3 1 . 2 Includes deferred tax credited to profit and loss account amounting to Rs 50.792 million (2002: Rs 50.257 million)on surplus on revaluation of fixed assets transferred to retained earnings (unappropriated profit) equivalent toincremental depreciation charged during the current year.

56
N o t e s t o t h e A c c o u n t s f o r t h e Y e a r E n d e d 3 1 D e c e m b e r 2 0 0 3
Amounts in Rs ‘000
2003 2002
32. Earning per Share - Basic and Diluted
Profit after taxation for the year 766,244 1,854,732
Number of shares
Average number of ordinary shares in issue during the year 138,802,300138,802,300 138,802,300
(Rupees)
Earning per share 5.52 13.36
33. Remuneration of Directors and Executives
The aggregate amounts charged in the accounts for the remuneration, including all benefits, to theChairman, Chief Executive, Directors and Executives of the Company were as follows:
Chairman Chief Executive Directors Executives Total
2003 2002 2003 2002 2003 2002 2003 2002 2003 2002
Managerial remuneration 1,169 -–– 7,485 7,281 10,195 8,411 407,264 297,523 426,113 313,215
Retirement benefits -–– -–– 992 2,249 2,592 2,907 95,316 94,577 98,900 99,733
Group insurance -–– -–– 17 27 35 107 3,432 4,207 3,484 4,341
Rent and house maintenance -–– 349 4,869 5,514 1,144 1,070 115,284 95,059 121,297 101,992
Utilities -–– 285 799 750 677 1,180 44,919 46,769 46,395 48,984
Medical expenses -–– 55 103 168 96 137 18,722 17,378 18,921 17,738
Leave passage -–– -–– 58 228 29 68 391 561 478 857
1,169 689 14,323 16,217 14,768 13,880 685,328 556,074 715,588 586,860
Number of persons 1 1 1 1 3 4 699 548 704 554
33.1 The Directors and certain Executives are provided with free use of Company cars in accordance with theirentitlement. The Chief Executive is provided with Company owned and maintained furnishedaccommodation and free use of Company car.
33.2 Aggregate amount charged in the accounts for fee to four Directors was Rs 3.103 million (2002: threeDirectors Rs 1.217 million).

57
N o t e s t o t h e A c c o u n t s f o r t h e Y e a r E n d e d 3 1 D e c e m b e r 2 0 0 3
Amounts in Rs ‘000
34. Transactions with Related Parties
The related parties comprise parent company (ICI Omicron B.V.), related group companies, local associatedc o m p a n y, directors of the Company, companies where directors also hold directorship, key employees and staffretirement funds. Details of transactions with related parties, other than those which have been specificallydisclosed elsewhere in these accounts are as follows:
2003 2002
Purchase of goods, material and services 5,083,501 3,925,432
Sale of goods and materials 145,604 70
Investment in Associate -–– 1,514,207
Loans from group companies - net 39,150 1,566,750
Interest on loans from group companies 64,455 138,198
Provision of services and other receipts 61,995 86,110
Receipt of interest / return on loans to Associate 6,317 459,983
Repayment of loan by Associate 300,000 1,500,000
Donation 7,116 8,899
Payment of dividend 236,766 210,458
Contribution to staff retirement benefit plan 106,070 96,347
The above transactions have been entered into on the basis of comparable uncontrolled price methodand cost plus method.
35. Plant Capacity and Annual Production
- in metric tonnes except Paints which is in thousands of litres:
2003 2002
Annual Production Annual ProductionName Plate Name Plate
Capacity Capacity
Polyester 56,000 67,841 56,000 67,499
Soda Ash - note 35.2 225,000 234,070 225,000 223,730
Paints -–– 19,938 - –– 15,798
Chemicals -–– 7,070 - –– 5,979
Sodium Bicarbonate 10,000 14,200 10,000 13,049
35.1 The capacity of Paints, and Chemicals is indeterminable because these are multi-product plants involvingvarying processes of manufacture.
35.2 Soda Ash was produced as per market demand.
36. Fair Value of Financial Assets and Liabilities
The carrying amounts of the financial assets and liabilities approximate their fair values.

58
N o t e s t o t h e A c c o u n t s f o r t h e Y e a r E n d e d 3 1 D e c e m b e r 2 0 0 3
Amounts in Rs ‘00037. Interest / Mark-up Rate Risk Management
Interest / mark-up rate risk arises from the possibility that changes in interest / mark-up rates will affect thevalue of financial instruments. In respect of income earning financial assets and interest / mark-up bearingfinancial liabilities, the following table indicate their effective interest / mark-up rates at the balance sheetdate and the periods in which they will re-price or mature:
Interest / mark-up bearing
Effective Maturity Maturity Maturity Non-interest Total Mark-up upto one one to five after five /mark-up
rates year years years bearing%
Financial Assets
Long-term loans - -–– -–– -–– 149,476 149,476
Long-term deposits - -–– -–– -–– 16,766 16,766
Trade debts - -–– -–– -–– 643,473 643,473
Trade deposits - -–– -–– -–– 20,269 20,269
Other receivables - -–– -–– -–– 316,575 316,575
Cash and bank balances - -–– -–– -–– 1,044,028 1,044,028
- -–– -–– -–– 2,190,587 2,190,587
Financial Liabilities
Redeemable capital - note 6 Variable 2,000,000 -–– -–– -–– 2,000,000
Long-term loan 6 months 2,011,800 -–– -–– -–– 2,011,800 LIBOR
plus a fixed spread of 1.0
Short-term financing - -–– -–– -–– -–– -––Creditors, accrued and
other liabilities 7.5 & 16.9 101,694 -–– -–– 3,802,083 3,903,777
Proposed dividend - -–– -–– -–– 347,006 347,006
4,113,494 -–– -–– 4,149,089 8,262,583
Net financial assets / (liabilities) 2003 (4,113,494) -–– -–– (1,958,502) (6,071,996)
Net financial assets / (liabilities) 2002 (3,142,224) (1,200,000) -–– (1,977,022) (6,319,246)

59
N o t e s t o t h e A c c o u n t s f o r t h e Y e a r E n d e d 3 1 D e c e m b e r 2 0 0 3
Amounts in Rs ‘00038. Credit and Concentration of Credit Risk
Credit risk represents the accounting loss that would be recognised at the reporting date if counter-partiesfailed completely to perform as contracted. The Company does not have significant exposure to any individualc u s t o m e r. To reduce exposure to credit risk the Company has developed a formal approval process wherebycredit limits are applied to its customers. The management also continuously monitors the credit exposuretowards the customers and makes provision against those balances considered doubtful of recovery.
The sector wise analysis of receivables, comprising trade debts, deposits, advances to suppliers, loansexcluding loans to associates and other receivables is given below:
2003 2002 Public Sector- Government 205,403 160,286 - Armed forces 1,660 -––- Communication 416 502 - Oil and gas 4,614 2,830 - Health 605 85 - Others 19,121 27,278
231,819 190,981 Private Sector- Institutional 11,504 11,875 - Trade 643,473 672,384 - Bank 1,283 -––- Others 309,326 503,864
965,586 1,188,123
1,197,405 1,379,104
39. Foreign Exchange Risk Management
Foreign currency risk arises mainly where receivables and payables exist due to transactions entered intoforeign currencies. The Company is exposed to foreign currency risk on sales, purchases and borrowingsthat are entered in a currency other than Pak Rupees. The Company uses forward foreign exchangecontracts to hedge its foreign currency risk, when considered appropriate.
40. Number of Employees
Number of employees at 31 December 1,324 1,319
41. Date of Authorisation
These financial statements were authorised for issue in the Board of Directors meeting held on 27 February2004.
42. General
Figures have been rounded off to the nearest thousand rupees.
M J Jaffer Jonathan R Stoney Feroz RizviChairman / Director Chief Executive Chief Financial Officer

No. of Shareholders Categories No. of Shares
7153 From 1 To 100 275,363 6383 From 101 To 500 1,484,618 1643 From 501 To 1,000 1,171,224 1766 From 1,001 To 5,000 3,612,779 242 From 5,001 To 10,000 1,722,997 85 From 10,001 To 15,000 1,063,853 39 From 15,001 To 20,000 710,779 17 From 20,001 To 25,000 384,678 15 From 25,001 To 30,000 415,371
7 From 30,001 To 35,000 227,579 7 From 35,001 To 40,000 258,086 5 From 40,001 To 45,000 214,636 4 From 45,001 To 50,000 200,000 2 From 50,001 To 55,000 104,895 2 From 55,001 To 60,000 115,000 1 From 60,001 To 65,000 64,728 2 From 70,001 To 75,000 148,443 5 From 75,001 To 80,000 391,630 5 From 80,001 To 85,000 408,052 2 From 85,001 To 90,000 171,600 2 From 90,001 To 95,000 184,950 4 From 95,001 To 100,000 400,000 4 From 100,001 To 105,000 410,408 1 From 105,001 To 110,000 105,100 1 From 110,001 To 115,000 112,200 2 From 135,001 To 140,000 274,000 2 From 145,001 To 150,000 297,110 1 From 160,001 To 165,000 161,100 2 From 170,001 To 175,000 350,000 1 From 175,001 To 180,000 179,873 2 From 195,001 To 200,000 400,000 1 From 210,001 To 215,000 211,850 2 From 245,001 To 250,000 497,600 2 From 265,001 To 270,000 531,400 1 From 300,001 To 305,000 304,200 1 From 370,001 To 375,000 373,112 1 From 395,001 To 400,000 400,000 1 From 495,001 To 500,000 500,000 1 From 540,001 To 545,000 545,000 1 From 565,001 To 570,000 569,443 1 From 620,001 To 625,000 621,626 1 From 735,001 To 740,000 737,384 1 From 795,001 To 800,000 800,000 1 From 860,001 To 865,000 864,276 1 From 890,001 To 895,000 891,422 1 From 935,001 To 940,000 939,300 1 From 945,001 To 950,000 947,300 1 From 1,045,001 To 1,050,000 1,050,000 1 From 1,225,001 To 1,230,000 1,228,900 1 From 1,580,001 To 1,585,000 1,580,610 1 From 1,705,001 To 1,710,000 1,708,700 1 From 2,245,001 To 2,250,000 2,250,000 1 From 105,225,000 To 105,230,000 105,229,125
17431 138,802,300
60
P A T T E R N O F S H A R E H O L D I N G A S A T 3 1 D E C E M B E R 2 0 0 3
Categories of Shareholders Number Shares Held PercentageINDIVIDUALS 12,427 5,100,072 3.67 INVESTMENTCOMPANIES 32 21,615 0.02 INSURANCE COMPANIES 14 1,446,661 1.04 JOINTSTOCK COMPANIES 40 189,805 0.14 ASSOCIATED COMPANIES (a) 1 105,229,125 75.81 FINANCIALINSTITUTIONS 19 55,791 0.04 MODARABACOMPANIES 6 726 0.00 OTHERS 18 206,927 0.15 FOREIGN FUNDS 3 4,037 0.00 CENTRALDEPOSITORY COMPANY(b) 4,871 26,547,541 19.13
17,431 138,802,300 100.00

61
P A T T E R N O F S H A R E H O L D I N G A S A T 3 1 D E C E M B E R 2 0 0 3
ADDITIONAL INFORMATION
Shareholder's Category Number of Number of Shareholders Shares Held
Associated Companies (name wise details)
ICI Omicron B.V. 1 105,229,125Pakistan PTA Limited NILICI Pakistan PowerGen Limited NIL
NIT & ICP (name wise details)
Investment Corporation of Pakistan (ICP) 1 638,485National Bank of Pakistan, Trustee Department (NIT) 1 912,423
Directors, CEO and their spouse and minor children (name wise details)
M J Jaffer 1 21,325S Imran Agha 1 1Asif Jooma 1 238Khursheed Marker 1 1M Nawaz Tiwana 1 1Mrs Khatoon M. Jaffer W/o Mr. M J Jaffer 1 15,989Mr Akbar Jaffer S/o Mr. M J Jaffer 1 15,081
Executives 107 32,625
Public sector companies & corporation
Banks, Development Finance InstitutionsNon-Banking Finance Institutions, Insurance Companies,Modarabas & Mutual Funds 144 12,520,864
Shareholders holding 10% or more voting interest (name wise details)
ICI Omicron B.V. 1 105,229,125
Common Directors' shareholdings in Associated Companies
Pakistan PTA Limited
Steve Hamlett 1 1Jonathan R Stoney 1 1
ICI Pakistan PowerGen Limited
S Imran Agha 1 1Asif Jooma 1 1Jonathan R Stoney 1 1
(a) Represents the 75.81% shareholding of the ICI Omicron, B.V. a subsidiary of ICI PLC, UK(b) CATEGORIES OF ACCOUNT HOLDERS AND SUB ACCOUNTHOLDERS AS PER CENTRALDEPOSITORY REGISTER
CHARITABLE TRUSTS 3 12,922 0.01FINANCIALINSTITUTIONS 45 11,451,259 8.25INDIVIDUALS 4,655 6,491,324 4.68INSURANCE COMPANIES 10 612,592 0.44INVESTMENT COMPANIES 7 149,625 0.11JOINTSTOCK COMPANIES 120 6,466,721 4.66LEASING COMPANIES 5 49,190 0.04MODARABAMANAGEMENTCOMPANIES 7 248,491 0.18MODARABAS 3 80,975 0.06OTHERS 16 984,442 0.71
4,871 26,547,541 19.13

62
C o m p a r i s o n o f R e s u l t s f o r S i x Y e a r s
1998 1999
Continued Discontinued Company Continued Discontinued
Net Assets
Net AssetsOperating Assets 28,038,754 Capital Work-in-Progress 174,621
Tangible Fixed Assets 28,213,375 Long-term Investments 212,500
Current Assets 5,662,482 Less current Liabilities 7,394,721
Working capital (1,732,239)Other net assets/(liabilities) (4,736,268)
Total Net Assets 21,957,368
Financed byOrdinary Share Capital 7,886,494 Reserves (609,017)Surplus on Revaluationof Fixed Assets 1,772,424
Shareholders' Equity 9,049,901 Long-term & Deferred Liabilities 12,907,467
Total Funds Invested 21,957,368
Turnover & Profits/(Loss)Turnover 9,400,408 2,645,408 11,061,937 10,613,556 7,286,833 Net sales & commission income 8,094,930 2,168,896 9,232,758 8,808,378 6,176,482 Gross profit 1,829,200 (1,769,352) 59,848 2,092,961 (1,600,082)Operating Profit/(Loss) 887,619 (1,867,659) (980,040) 1,112,341 (1,845,171)
Profit/(Loss) before Taxation 680,092 (3,149,236) (2,469,144) 906,121 (4,642,356)Taxation (140,309) 465,163 324,854 (50,000) (24,000)Profit/(Loss) after Taxation 539,783 (2,684,073) (2,144,290) 856,121 (4,666,356)Dividend -–– -–– -–– -–– -––Transfer from surplus on revaluationof fixed assets to P&L account -–– -–– -–– -–– -––Profit/(Loss) after Taxation,dividend & General reserves 539,783 (2,684,073) (2,144,290) 856,121 (4,666,356)
Earnings & Dividendsper Rs 10 share(Loss) / earnings before Tax,excluding extraordinary items (3.13)Dividends -––
Investors RatioGross profit to sales 22.60 (81.58) 0.65 23.76 (25.91)Debtor turnover ratio (days) - sales 24 Stock turnover ratio (days) - COGS 69 Fixed assets turnover - sales 32.72 Market Value per share 12.10 Price Earning ratio (4.45)Return on capital employed - % (23.69)Debt : Equity ratio 67:33 Current ratio 0.77 Interest cover - times -––(Loss) / earning after tax per share (2.72)Dividend cover - times -––
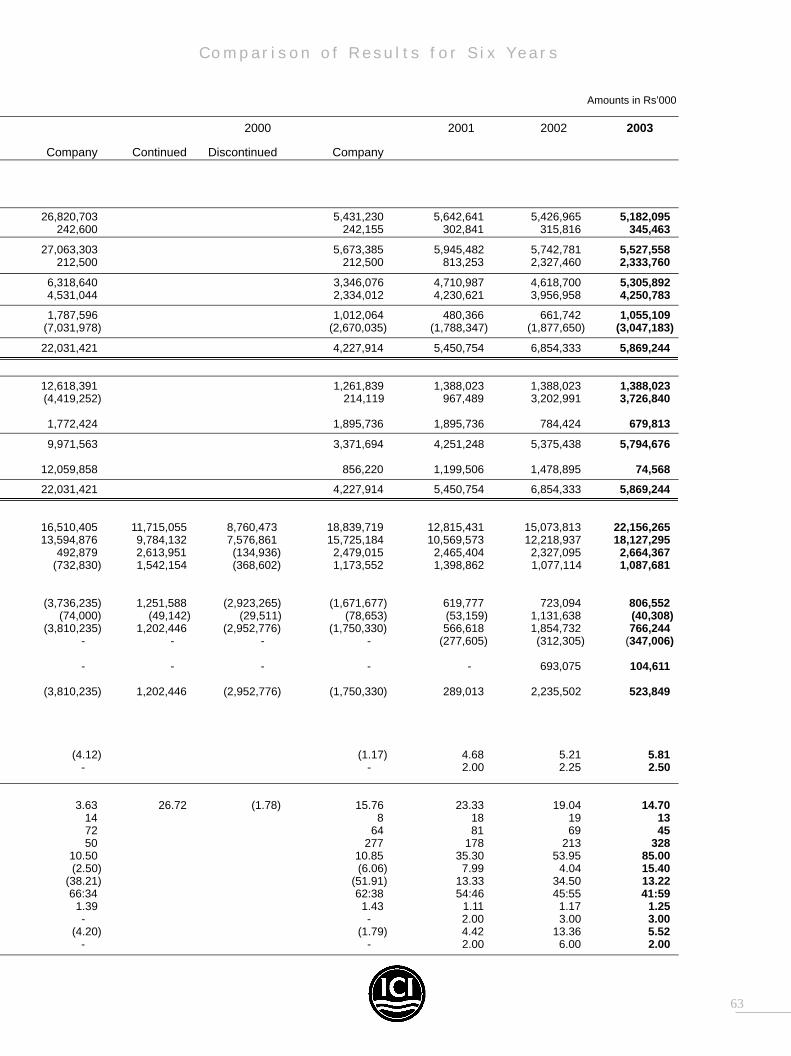
63
C o m p a r i s o n o f R e s u l t s f o r S i x Y e a r s
Amounts in Rs’000
2000 2001 2002 2003
Company Continued Discontinued Company
26,820,703 5,431,230 5,642,641 5,426,965 5,182,095242,600 242,155 302,841 315,816 345,463
27,063,303 5,673,385 5,945,482 5,742,781 5,527,558212,500 212,500 813,253 2,327,460 2,333,760
6,318,640 3,346,076 4,710,987 4,618,700 5,305,8924,531,044 2,334,012 4,230,621 3,956,958 4,250,783
1,787,596 1,012,064 480,366 661,742 1,055,109(7,031,978) (2,670,035) (1,788,347) (1,877,650) (3,047,183)
22,031,421 4,227,914 5,450,754 6,854,333 5,869,244
12,618,391 1,261,839 1,388,023 1,388,023 1,388,023(4,419,252) 214,119 967,489 3,202,991 3,726,840
1,772,424 1,895,736 1,895,736 784,424 679,813
9,971,563 3,371,694 4,251,248 5,375,438 5,794,676
12,059,858 856,220 1,199,506 1,478,895 74,568
22,031,421 4,227,914 5,450,754 6,854,333 5,869,244
16,510,405 11,715,055 8,760,473 18,839,719 12,815,431 15,073,813 22,156,26513,594,876 9,784,132 7,576,861 15,725,184 10,569,573 12,218,937 18,127,295
492,879 2,613,951 (134,936) 2,479,015 2,465,404 2,327,095 2,664,367(732,830) 1,542,154 (368,602) 1,173,552 1,398,862 1,077,114 1,087,681
(3,736,235) 1,251,588 (2,923,265) (1,671,677) 619,777 723,094 806,552(74,000) (49,142) (29,511) (78,653) (53,159) 1,131,638 (40,308)
(3,810,235) 1,202,446 (2,952,776) (1,750,330) 566,618 1,854,732 766,244-–– -–– -–– -–– (277,605) (312,305) (347,006)
-–– -–– -–– -–– -–– 693,075 104,611
(3,810,235) 1,202,446 (2,952,776) (1,750,330) 289,013 2,235,502 523,849
(4.12) (1.17) 4.68 5.21 5.81-–– -–– 2.00 2.25 2.50
3.63 26.72 (1.78) 15.76 23.33 19.04 14.7014 8 18 19 1372 64 81 69 4550 277 178 213 328
10.50 10.85 35.30 53.95 85.00(2.50) (6.06) 7.99 4.04 15.40
(38.21) (51.91) 13.33 34.50 13.2266:34 62:38 54:46 45:55 41:59
1.39 1.43 1.11 1.17 1.25-–– -–– 2.00 3.00 3.00
(4.20) (1.79) 4.42 13.36 5.52-–– -–– 2.00 6.00 2.00
64
N o t i c e o f M e e t i n g
Notice is hereby given that the Fifty-second Annual General Meeting of ICI PA K I S TAN LIMITED will be held onT h u r s d a y, 22 April 2004 at 10.00 a.m. at the Registered Office of the Company, ICI House, 5 West Wharf, Karachi74000, to transact the following business:
1 . To receive and consider the accounts of the Company for the year ended December 31, 2003, the report of theAuditors thereon and the report of the Directors.
2 . To declare a cash dividend @ 25% i.e., Rs. 2.5 per ordinary share of Rs. 10 each for the year ended December31, 2003 as recommended by the Directors, payable to the Members whose names appear in the Register ofMembers as at 14 April 2004.
3 . To appoint the Auditors of the Company and to fix their remuneration.
By the Order of the Board
Nausheen Ahmad27 February, 2004 Company SecretaryKarachi
Notes:
1 . Share Transfer Books of the Company will remain closedfrom 14 April 2004 to 22 April 2004 (both days inclusive).
2 . Entitlement to dividend and to attend the Fifty-second A n n u a lGeneral Meeting as a Member will be according to theMembers Register as at 14 April 2004.
3 . All Members are entitled to attend and vote at the Meeting.
4 . A Member entitled to attend and vote at the Meeting isentitled to appoint a proxy to attend, speak and vote forh i m / h e r. Aproxy must be a Member of the Company.
5 . An instrument of proxy applicable for the Meeting (in whichyou can direct the proxy how you wish him to vote) is beingprovided with the notice sent to Members. Further copies ofthe instrument of proxy may be obtained from the RegisteredO ffice of the Company during normal office hours.
6 . An instrument of proxy and the power of attorney or otherauthority (if any) under which it is signed, or a notariallycertified copy of such power or authority, must, to be valid, bedeposited at the Registered Office of the Company not lessthan 48 hours before the time of the Meeting.
7 . Members are requested to notify immediately changes, ifa n y, in their registered address.
8 . CDC Account Holders will further have to follow the undermentioned guidelines as laid down in Circular 1 datedJanuary 26, 2000 issued by the Securities and ExchangeCommission of Pakistan.
A . For Attending the Meeting:
( i ) In case of individuals, the account holder or sub-accountholder and/or the person whose securities are in groupaccount and their registration details are uploaded as per theRegulations, shall authenticate his identity by showing hisoriginal National Identity Card (NIC) or original passport atthe time of attending the Meeting.
( i i ) In case of corporate entity, the Board of Directors’resolution/power of attorney with specimen signature of thenominee shall be produced (unless it has been providedearlier) at the time of the Meeting.
B . For Appointing Proxies:
( i ) In case of individuals, the account holder or sub-accountholder and/or the person whose securities are in groupaccount and their registration details are uploaded as per theRegulations, shall submit the proxy form as per the abover e q u i r e m e n t .
( i i ) The proxy form shall be witnessed by two persons whosenames, addresses and NIC numbers shall be mentioned onthe form.
( i i i ) Attested copies of NIC or the passport of the beneficialowners and the proxy shall be furnished with the proxy form.
( i v ) The proxy shall produce his original NIC or original passportat the time of the Meeting.
(v) In case of corporate entity, the Board of Directors’resolution/power of attorney with specimen signature shallbe submitted (unless it has been provided earlier) along withproxy form to the Company.

Report of the Directors for the Year Ended 31 December 2003 for ICI Pakistan Group
The audited accounts of ICI PakistanGroup for the year ended 31December 2003 are attached. The ICIPakistan Group comprises accounts ofICI Pakistan Limited, ICI PakistanPowerGen Limited, a wholly ownedsubsidiary, and proportionate share inthe profit and loss of Pakistan PTALimited (PPTA), an associate company.
The Directors Report, giving acommentary on the performance of ICIPakistan Limited for the twelve monthsended 31 December 2003 has beenpresented separately.
Mr Jonathan R Stoney was appointedas Director and Chairman of ICIPakistan PowerGen Limited w.e.f. 25June 2003 to fill the vacancy createdby the sad and untimely demise of MrAzhar A Malik on 11 June 2003. Mr AsifJooma was appointed as ChiefExecutive of the Company w.e.f. 27June 2003 in place of Mr Waqar AMalik who was seconded to PakistanPTA Limited as its Chief Executive.
The Board places on record thevaluable service rendered by Mr AzharA Malik during his tenure with theCompany and offers its deepestcondolences to the bereaved family.May his soul rest in peace.
Power generation for ICI PakistanPowerGen Limited for the year underreview was 12% higher compared to
the corresponding period last year.Turnover was 16% higher for the full-year compared to last year as a resultof higher off take by the fibre plantalong with improved electricity rates.This, together with improvedconversion efficiencies and a highersale volume resulted in an operatingprofit for the twelve months ended 31December 2003 of Rs 17.6 millioncompared to a nominal operating lossin 2002. Financial charges were alsosubstantially lower during the year, andconsequently, the Company achieveda profit before taxation of Rs 9.0 millioncompared to a loss before tax of Rs20.2 million last year.
PPTA, in which ICI Pakistan Limitedhas a 25% shareholding, incurred aloss before tax of Rs 5,820.0 million forthe twelve months ended 31 December2003 compared to a loss of Rs 2,467.2million for the corresponding periodlast year. This loss includes a deficit onrevaluation of PPTA’s assets, part ofwhich was charged to the profit andloss account and a write-off of theunamortised discount on the issue ofrights shares. Accordingly, 25% of theloss amounting to Rs 1,455.0 million(2002: Rs 616.8 million) has beenconsolidated into the Group accountsof ICI Pakistan Limited using the equitymethod of accounting. The abovewrite-offs are non-cash charges andwill have no impact on PPTA’scashflows.
M J Jaffer Jonathan R StoneyChairman Chief Executive
Dated 27 February 2004
66
Aud i to rs ’ Repor t to the Members
67
We have audited the annexed consolidated financial statements comprising consolidated balance sheet of ICIPakistan Limited (“the Holding Company”) and ICI Pakistan PowerGen Limited (“the Subsidiary”) as at 31December 2003 and the related consolidated profit and loss account, consolidated cash flow statement andconsolidated statement of changes in equity together with the notes forming part thereof, for the year then ended.We have also expressed separate opinions on the accounts of the Holding Company and the Subsidiary.
These financial statements are the responsibility of the Holding Company’s management. Our responsibility is toexpress an opinion on these financial statements based on our audit.
We conducted our audit in accordance with the auditing standards as applicable in Pakistan. These standardsrequire that we plan and perform the audit to obtain reasonable assurance about whether the above saidstatements are free of any material misstatement. An audit includes examining, on a test basis, evidencesupporting the amounts and disclosures in the above said statements. An audit also includes assessing theaccounting policies and significant estimates made by management, as well as, evaluating the overall presentationof the above said statements. We believe that our audit provides a reasonable basis for our opinion.
In our opinion, the consolidated financial statements examined by us present fairly the financial position of theHolding Company and its Subsidiary as at 31 December 2003, and the results of their operations, their cash flowsand changes in equity for the year then ended in accordance with approved accounting standards as applicablein Pakistan.
Date: 27 February 2004 Taseer Hadi Khalid & Co.Karachi Chartered Accountants
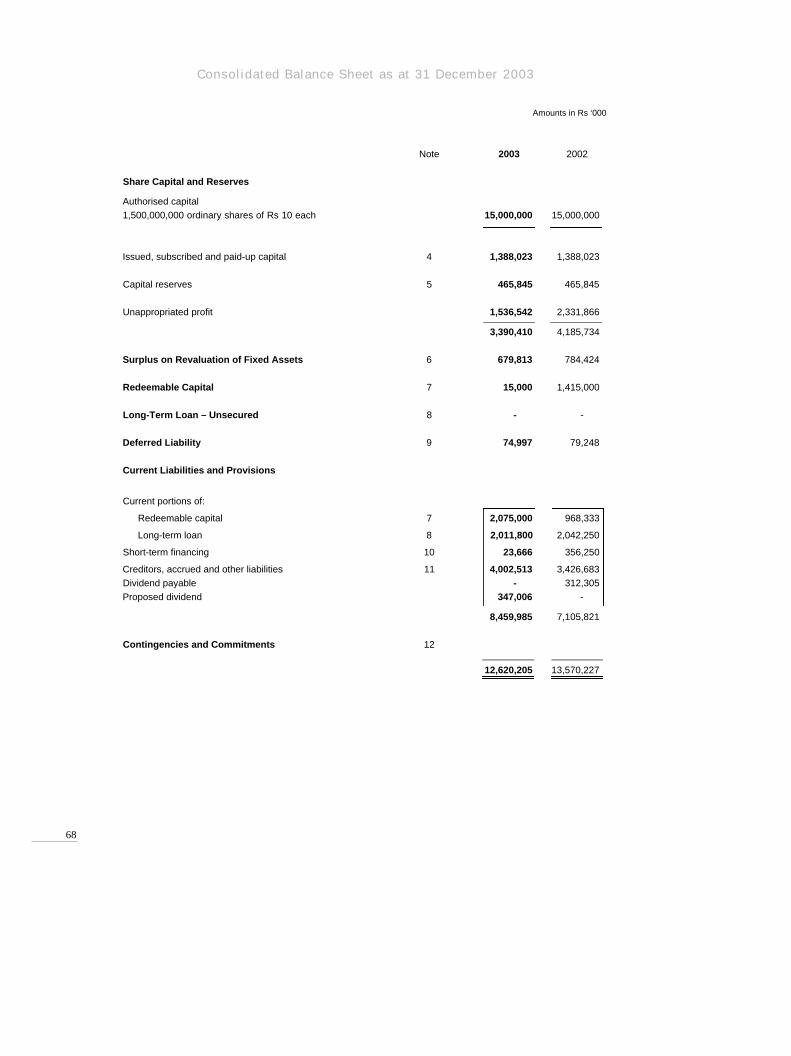
Conso l ida ted Ba lance Shee t as a t 31 December 2003
68
Amounts in Rs ‘000
Note 2003 2002
Share Capital and Reserves
Authorised capital1,500,000,000 ordinary shares of Rs 10 each 15,000,000 15,000,000
Issued, subscribed and paid-up capital 4 1,388,023 1,388,023
Capital reserves 5 465,845 465,845
Unappropriated profit 1,536,542 2,331,866
3,390,410 4,185,734
Surplus on Revaluation of Fixed Assets 6 679,813 784,424
Redeemable Capital 7 15,000 1,415,000
Long-Term Loan – Unsecured 8 -––– -–––
Deferred Liability 9 74,997 79,248
Current Liabilities and Provisions
Current portions of:
Redeemable capital 7 2,075,000 968,333
Long-term loan 8 2,011,800 2,042,250
Short-term financing 10 23,666 356,250
Creditors, accrued and other liabilities 11 4,002,513 3,426,683 Dividend payable -––– 312,305Proposed dividend 347,006 -–––
8,459,985 7,105,821
Contingencies and Commitments 12
12,620,205 13,570,227
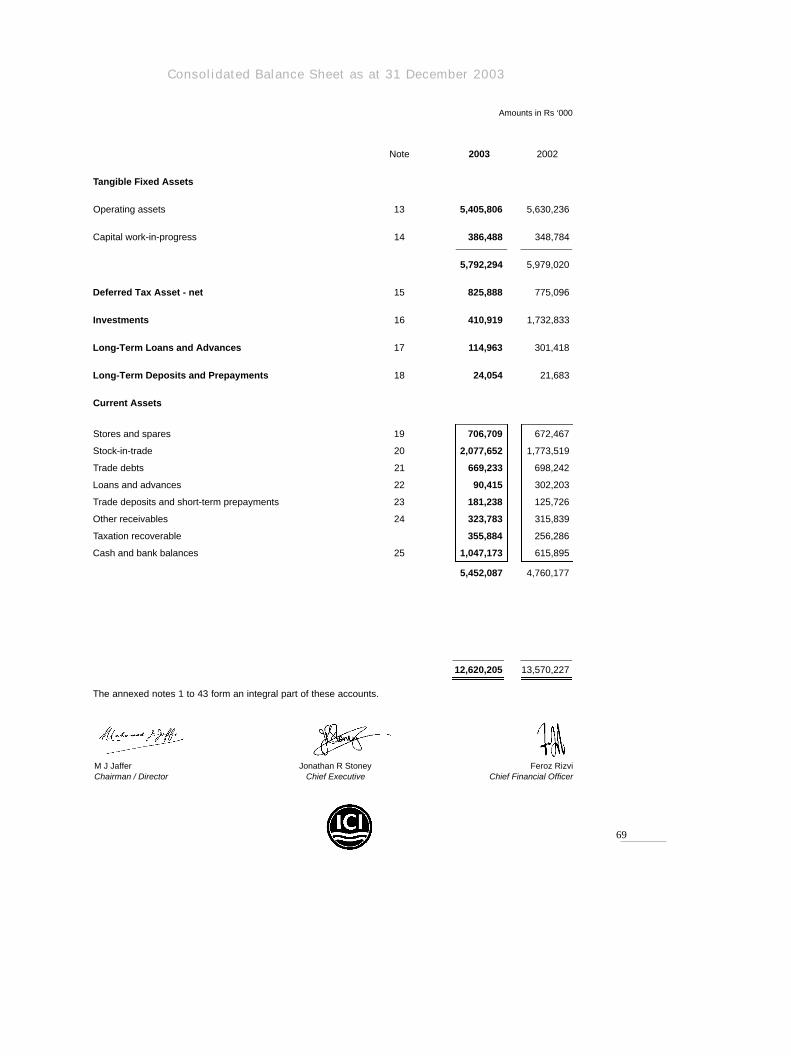
Conso l ida ted Ba lance Shee t as a t 31 December 2003
69
Amounts in Rs ‘000
Note 2003 2002
Tangible Fixed Assets
Operating assets 13 5,405,806 5,630,236
Capital work-in-progress 14 386,488 348,784
5,792,294 5,979,020
Deferred Tax Asset - net 15 825,888 775,096
Investments 16 410,919 1,732,833
Long-Term Loans and Advances 17 114,963 301,418
Long-Term Deposits and Prepayments 18 24,054 21,683
Current Assets
Stores and spares 19 706,709 672,467
Stock-in-trade 20 2,077,652 1,773,519
Trade debts 21 669,233 698,242
Loans and advances 22 90,415 302,203
Trade deposits and short-term prepayments 23 181,238 125,726
Other receivables 24 323,783 315,839
Taxation recoverable 355,884 256,286
Cash and bank balances 25 1,047,173 615,895
5,452,087 4,760,177
12,620,205 13,570,227
The annexed notes 1 to 43 form an integral part of these accounts.
M J Jaffer Jonathan R Stoney Feroz RizviChairman / Director Chief Executive Chief Financial Officer
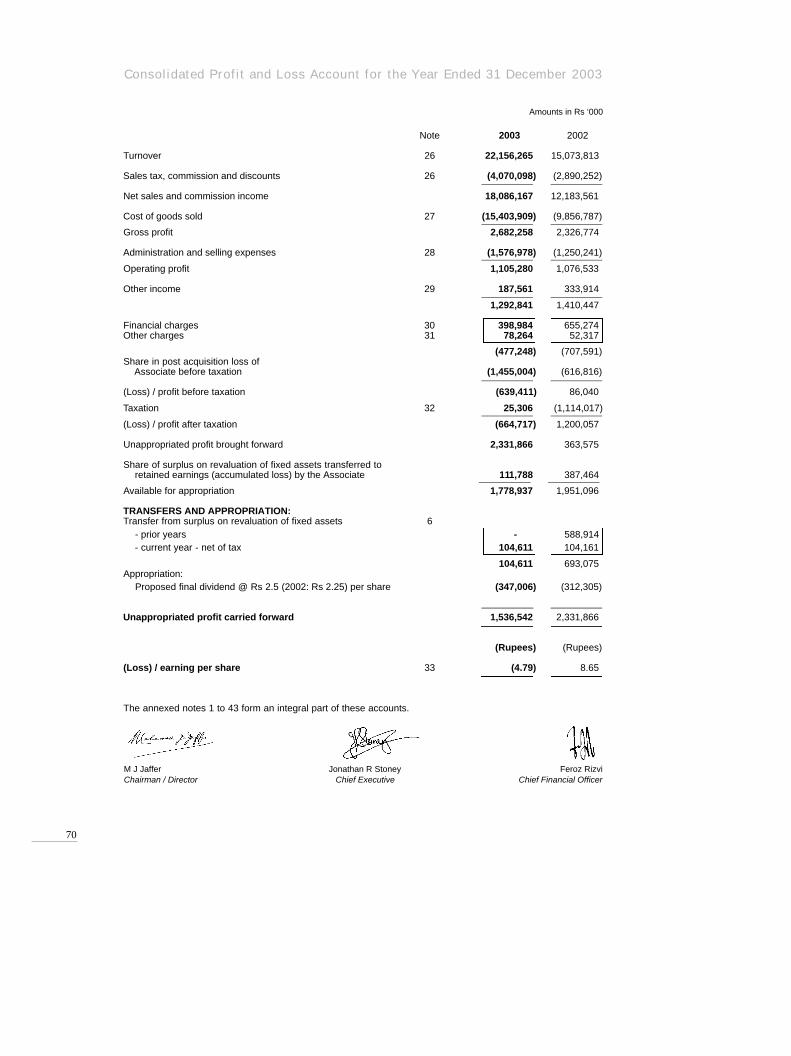
Consol idated Prof i t and Loss Account for the Year Ended 31 December 2003
70
Amounts in Rs ‘000
Note 2003 2002
Turnover 26 22,156,265 15,073,813
Sales tax, commission and discounts 26 (4,070,098) (2,890,252)
Net sales and commission income 18,086,167 12,183,561
Cost of goods sold 27 (15,403,909) (9,856,787)
Gross profit 2,682,258 2,326,774
Administration and selling expenses 28 (1,576,978) (1,250,241)
Operating profit 1,105,280 1,076,533
Other income 29 187,561 333,914
1,292,841 1,410,447
Financial charges 30 398,984 655,274Other charges 31 78,264 52,317
(477,248) (707,591)Share in post acquisition loss of
Associate before taxation (1,455,004) (616,816)
(Loss) / profit before taxation (639,411) 86,040
Taxation 32 25,306 (1,114,017)
(Loss) / profit after taxation (664,717) 1,200,057
Unappropriated profit brought forward 2,331,866 363,575
Share of surplus on revaluation of fixed assets transferred toretained earnings (accumulated loss) by the Associate 111,788 387,464
Available for appropriation 1,778,937 1,951,096
TRANSFERS AND APPROPRIATION:Transfer from surplus on revaluation of fixed assets 6
- prior years -––– 588,914- current year - net of tax 104,611 104,161
104,611 693,075Appropriation:
Proposed final dividend @ Rs 2.5 (2002: Rs 2.25) per share (347,006) (312,305)
Unappropriated profit carried forward 1,536,542 2,331,866
(Rupees) (Rupees)
(Loss) / earning per share 33 (4.79) 8.65
The annexed notes 1 to 43 form an integral part of these accounts.
M J Jaffer Jonathan R Stoney Feroz RizviChairman / Director Chief Executive Chief Financial Officer
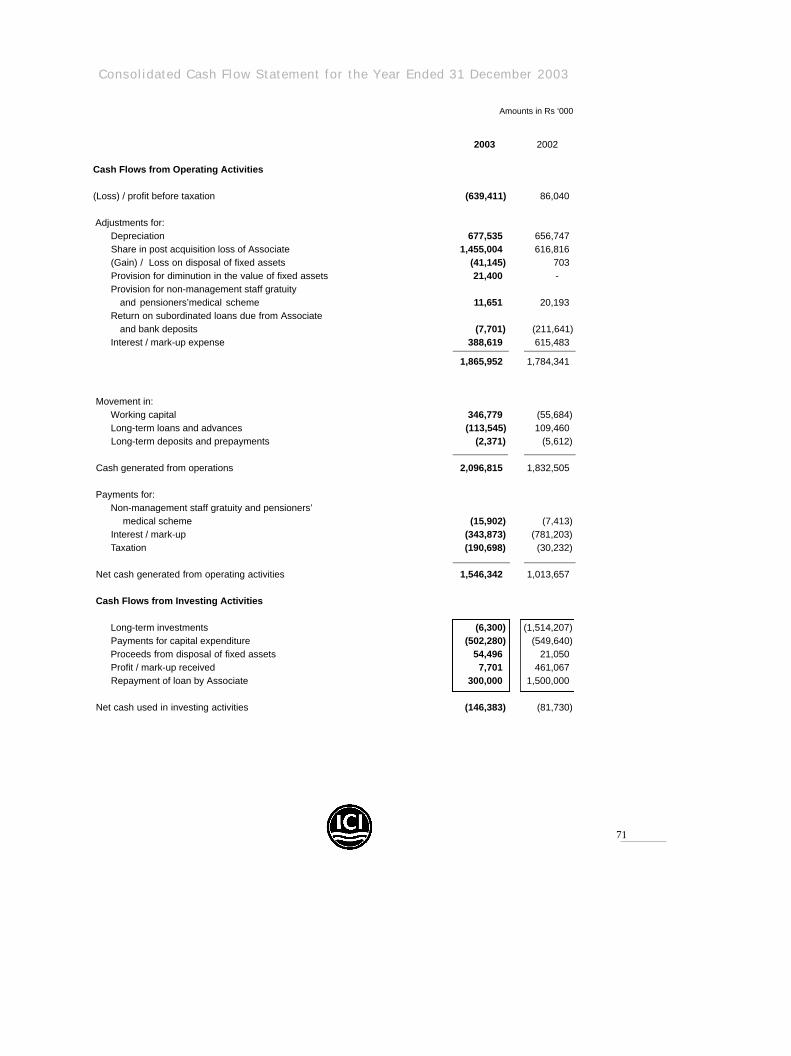
Conso l ida ted Cash F low S ta tement fo r the Year Ended 31 December 2003
71
Amounts in Rs ‘000
2003 2002
Cash Flows from Operating Activities
(Loss) / profit before taxation (639,411) 86,040
Adjustments for:Depreciation 677,535 656,747Share in post acquisition loss of Associate 1,455,004 616,816(Gain) / Loss on disposal of fixed assets (41,145) 703Provision for diminution in the value of fixed assets 21,400 -––Provision for non-management staff gratuity
and pensioners’medical scheme 11,651 20,193Return on subordinated loans due from Associate
and bank deposits (7,701) (211,641)Interest / mark-up expense 388,619 615,483
1,865,952 1,784,341
Movement in:Working capital 346,779 (55,684)Long-term loans and advances (113,545) 109,460Long-term deposits and prepayments (2,371) (5,612)
Cash generated from operations 2,096,815 1,832,505
Payments for:Non-management staff gratuity and pensioners’
medical scheme (15,902) (7,413)Interest / mark-up (343,873) (781,203)Taxation (190,698) (30,232)
Net cash generated from operating activities 1,546,342 1,013,657
Cash Flows from Investing Activities
Long-term investments (6,300) (1,514,207)Payments for capital expenditure (502,280) (549,640)Proceeds from disposal of fixed assets 54,496 21,050Profit / mark-up received 7,701 461,067Repayment of loan by Associate 300,000 1,500,000
Net cash used in investing activities (146,383) (81,730)
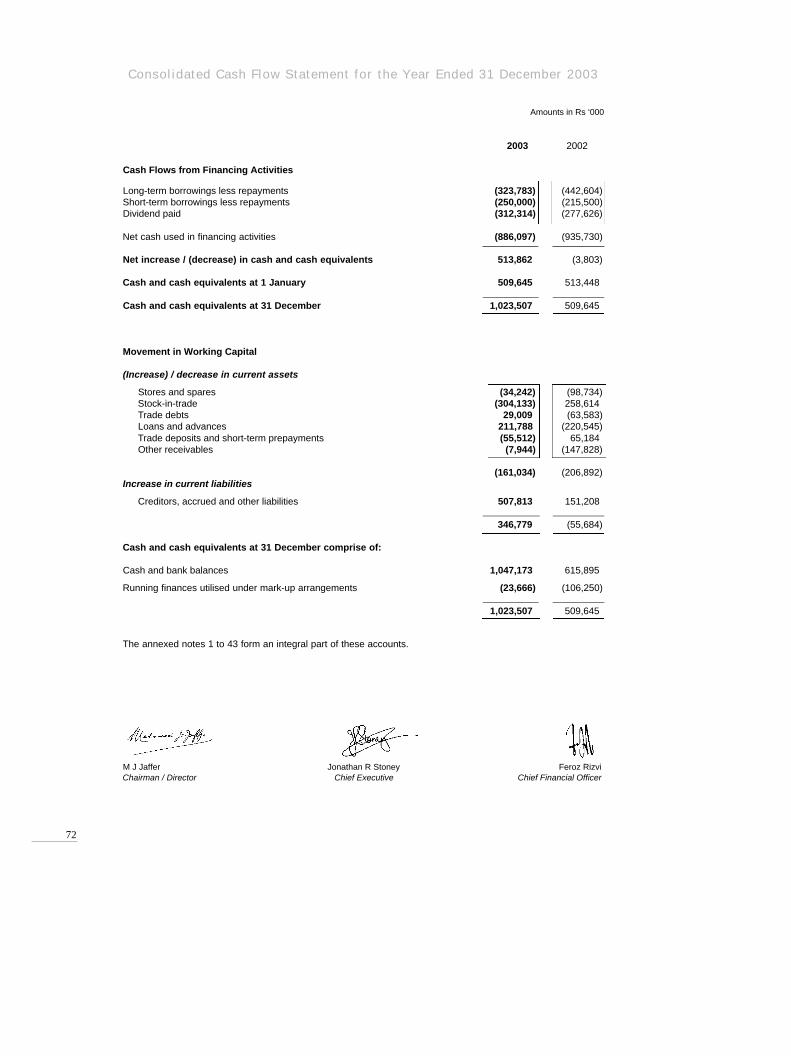
Conso l ida ted Cash F low S ta tement fo r the Year Ended 31 December 2003
72
Amounts in Rs ‘000
2003 2002
Cash Flows from Financing Activities
Long-term borrowings less repayments (323,783) (442,604)Short-term borrowings less repayments (250,000) (215,500)Dividend paid (312,314) (277,626)
Net cash used in financing activities (886,097) (935,730)
Net increase / (decrease) in cash and cash equivalents 513,862 (3,803)
Cash and cash equivalents at 1 January 509,645 513,448
Cash and cash equivalents at 31 December 1,023,507 509,645
Movement in Working Capital
(Increase) / decrease in current assets
Stores and spares (34,242) (98,734)Stock-in-trade (304,133) 258,614Trade debts 29,009 (63,583)Loans and advances 211,788 (220,545)Trade deposits and short-term prepayments (55,512) 65,184Other receivables (7,944) (147,828)
(161,034) (206,892)Increase in current liabilities
Creditors, accrued and other liabilities 507,813 151,208
346,779 (55,684)
Cash and cash equivalents at 31 December comprise of:
Cash and bank balances 1,047,173 615,895
Running finances utilised under mark-up arrangements (23,666) (106,250)
1,023,507 509,645
The annexed notes 1 to 43 form an integral part of these accounts.
M J Jaffer Jonathan R Stoney Feroz RizviChairman / Director Chief Executive Chief Financial Officer

Consolidated Statement of Changes in Equity for the Year Ended 31 December 2003
73
Amounts in Rs ‘000
Issued, Capital Unappropriated Totalsubscribed reserves profit
and paid-upcapital
Balance as on 1 January 2002 1,388,023 465,845 363,575 2,217,443
Net profit for the year ended 31 December 2002 -–– -–– 1,200,057 1,200,057
Share of surplus on revaluation of fixed assets transferred to retained earnings (accumulated loss) by the Associate -–– -–– 387,464 387,464
Transfer from surplus on revaluation offixed assets:
- prior years -–– -–– 588,914 588,914 - current year - net of tax -–– -–– 104,161 104,161
-–– -–– 693,075 693,075
Final dividend -–– -–– (312,305) (312,305)
Balance as on 31 December 2002 1,388,023 465,845 2,331,866 4,185,734
Net loss for the year ended 31 December 2003 -–– -–– (664,717) (664,717)
Share of surplus on revaluation of fixed assets transferred to retained earnings (accumulated loss) by the Associate -–– -–– 111,788 111,788
Transfer from surplus on revaluation offixed assets -–– -–– 104,611 104,611
Proposed final dividend -–– -–– (347,006) (347,006)
Balance as on 31 December 2003 1,388,023 465,845 1,536,542 3,390,410
The annexed notes 1 to 43 form an integral part of these accounts.
M J Jaffer Jonathan R Stoney Feroz RizviChairman / Director Chief Executive Chief Financial Officer

Notes to the Conso l ida ted Accoun ts fo r the Year Ended 31 December 2003
74
1 . Status and Nature of Business
The Group consists of:
■ ICI Pakistan Limited; and
■ ICI Pakistan PowerGen Limited.
ICI Pakistan Limited (“the Company”) is incorporated in Pakistan and is listed on Karachi, Lahore andIslamabad Stock Exchanges.
ICI Pakistan PowerGen Limited (“the Subsidiary”) is incorporated in Pakistan as an unlisted public companyand is a wholly owned subsidiary company of ICI Pakistan Limited.
The Company is engaged in the manufacture of polyester staple fibre, POYchips, soda ash, paints, specialtychemicals, sodium bicarbonate and polyurethanes; marketing of seeds, toll manufactured and importedpharmaceuticals and animal health products; and merchanting of general chemicals. It also acts as anindenting agent.
The Subsidiary is engaged in generating, selling and supplying electricity to the Company.
2 . Basis of Presentation
The consolidated financial statements include the accounts of ICI Pakistan Limited and ICI PakistanPowerGen Limited. The accounts of the Subsidiary have been consolidated on a line-by-line basis.
All inter company balances and transactions have been eliminated.
3 . Summary of Significant Accounting Policies
3 . 1 Statement of compliance
These accounts have been prepared in accordance with approved accounting standards as applicable inPakistan and the requirements of the Companies Ordinance, 1984. Approved accounting standards compriseof such International Accounting Standards as notified under the provisions of the Companies Ordinance,1984. Wherever the requirements of the Companies Ordinance, 1984 or directives issued by the Securitiesand Exchange Commission of Pakistan differ with the requirements of these standards, the requirements ofthe Companies Ordinance, 1984 or the requirements of the said directives take precedence.
3 . 2 Accounting convention
These accounts have been prepared under the historical cost convention, except that certain fixed assetshave been included at revalued amounts and certain exchange elements referred to in notes 3.7 and 3.12have been incorporated in the cost of the relevant assets and certain staff retirement benefits have beenrecognised at values determined by actuary.
3 . 3 Staff retirement benefits
The Company’s retirement benefit plans comprise of provident funds, pension and gratuity schemes and amedical scheme for pensioners. The Subsidiary participates in staff retirement benefit plans operated by theC o m p a n y. There are two registered provident funds. These are defined contribution schemes providing lumpsum benefits. All other schemes are defined benefit schemes.
The pension and gratuity schemes are salary schemes providing pension and lump sums, respectively.Pension and gratuity schemes for management staff are invested through two approved trust funds. T h eGroup contributes to both funds on the basis of actuarial recommendations. The gratuity scheme for non-management staff and the pensioners’medical scheme are unfunded.
An actuarial valuation of all defined benefit schemes is conducted at the end of every year. The valuation usesthe Projected Unit Credit method. Actuarial (unrecognised) gains and losses are amortised over the expectedaverage remaining working lives of employees.
3 . 4 P r o v i s i o n s
Aprovision is recognised in the balance sheet when the Group has a legal or constructive obligation as a resultof a past event, and it is probable that an outflow of economic benefits will be required to settle the obligation.
Notes to the Conso l ida ted Accoun ts fo r the Year Ended 31 December 2003
75
3 . 5 Trade and other payables
Trade and other payables are stated at their cost.
3 . 6 Taxation
Current
Provision for current taxation for the Company is based on taxable income at the current rates of taxation after takinginto account available tax credits and rebates, if any, or one-half of one percent of turnover, whichever is higher.
The profits and gains derived by the Subsidiary from power generation are exempt from tax under clause 132 ofPart I of the Second Schedule to the Income Tax Ordinance, 2001 and by virtue of clause 15 of Part IV of the SecondSchedule of the said Ordinance are also not liable to a minimum tax at the rate of one-half of one percent of turnoverunder section 113 of the above Ordinance.
D e f e r r e d
Deferred tax is provided using balance sheet liability method, providing for temporary differences betweenthe carrying amounts of assets and liabilities for financial reporting purposes and the amounts used fortaxation purposes. The amount of deferred tax provided is based on the expected manner of realisation orsettlement of the carrying amount of assets and liabilities, using the current rates of taxation.
The Company recognises a deferred tax asset to the extent that it is probable that taxable profits for theforeseeable future will be available against which the asset can be utilised. Deferred tax assets are reducedto the extent that it is no longer probable that the related tax benefit will be realised. Further, the Companyrecognises deferred tax asset / liability on deficit / surplus on revaluation of fixed assets which is adjustedagainst the related deficit / surplus. The deferred tax debit balance not recognised in the accountsamounted to Rs 1,754.252 million (2002: Rs 2,105.346 million).
3.7 Tangible fixed assets and depreciation
Operating assets, except for freehold land, are stated at cost or revalued amounts less accumulateddepreciation and impairment losses. Freehold land is stated at cost or revalued amount and capital work-in-progress is stated at cost. Cost of certain fixed assets comprises historical cost, exchange differences referredto in note 3.12, cost of exchange risk cover in respect of foreign currency loans obtained for the acquisition offixed assets upto the commencement of commercial production and the cost of borrowings during constructionperiod in respect of loans taken for specific projects.
Depreciation charge is based on the straight-line method whereby the cost or revalued amount of an asset iswritten off to profit and loss account over its estimated useful life without taking into account any residual value.The cost of leasehold land is amortised in equal instalments over the lease period. The net exchanged i fferences relating to an asset at the end of each year are amortised in equal instalments over its remaininguseful life. Depreciation on additions is charged from the month in which the asset is put to use and ondisposals up to the month of disposal.
Incremental depreciation charged for the period on revalued assets is transferred from surplus on revaluationof fixed assets to retained earnings (unappropriated profit) during the current year.
Maintenance and normal repairs are charged to income as and when incurred; major renewals andimprovements are capitalised and the assets so replaced, if any, are retired.
Gains and losses on disposal of assets are taken to the profit and loss account, except that the related surpluson revaluation of fixed assets is transferred directly to retained earnings (unappropriated profit).
3 . 8 I n v e s t m e n t s
Investments in associates
Investment in associates is accounted for under the equity method of accounting.
Investments in other companies
Investments in non-listed equity securities classified as available for sale are stated at cost less provision fori m p a i r m e n t .
Notes to the Conso l ida ted Accoun ts fo r the Year Ended 31 December 2003
76
3 . 9 Stores and spares
Stores and spares are valued at moving average cost. Items in-transit are valued at cost comprising invoicevalues plus other charges incurred thereon.
3 . 1 0 S t o c k - i n - t r a d e
Raw and packing materials except for those in-transit are valued at lower of moving average cost and netrealisable value.
Work-in-process is valued at material cost only. Conversion costs are not included as these are not significant.
Finished goods, with the exception of imported general chemicals, are valued at lower of average cost andnet realisable value. Imported general chemicals are valued at lower of cost, as determined on a first-in-first-out basis, and net realisable value. All manufactured finished goods include prime cost and an appropriateportion of production overheads.
Items in-transit are valued at cost comprising invoice values plus other charges incurred thereon.
Net realisable value signifies the estimated selling price in the ordinary course of business less net estimatedcosts of completion and selling expenses.
3 . 11 Trade debts and other receivables
Trade debts and other receivables are stated at cost less impairment losses.
3 . 1 2 Foreign currency translation
Transactions denominated in foreign currencies are translated to Pak Rupees at the foreign exchange rateruling at the date of transaction. Assets and liabilities in foreign currencies are translated into Pak Rupees atthe foreign exchange rates approximating those prevailing at the balance sheet date.
In respect of foreign currency loans obtained for the acquisition of fixed assets, the cost of exchange risk coveris capitalised in the relevant assets upto the date of commencement of commercial production whereasexchange differences on principal amount are included in the cost of the relevant assets over the period ofthese loans.
All other exchange differences are taken to the profit and loss account.
3 . 1 3 Transactions with related parties
The Group enters into transactions with related parties on an arm’s length basis. Prices for transactions withrelated parties are determined using admissible valuation methods.
3 . 1 4 Revenue recognition
■ Sales are recorded on despatch of goods to customers.
■ Revenue from power generation is recognised on transmission of electricity to consumers.
■ Commission income is recognised on receipt of credit advice from suppliers.
■ Profit on short-term deposits is accounted for on time-apportioned basis on the principal outstanding andat the rate applicable.
■ Dividend income is recognised when the right to receive payment is established.
3 . 1 5 Segment reporting
A segment is a distinguishable component within a Group that is engaged in providing products (businesssegment), or in providing products within a particular economic environment (geographical segment), whichis subject to risks and rewards that are different from those of other segments.
Notes to the Conso l ida ted Accoun ts fo r the Year Ended 31 December 2003
77
Amounts in Rs ‘000
4. Issued, Subscribed and Paid-up Capital
2003 2002 2003 2002
125,840,190 125,840,190 Ordinary shares of Rs 10 eachfully paid in cash 1,258,402 1,258,402
318,492 318,492 Ordinary shares of Rs 10 each issued asfully paid for consideration other than cash 3,185 3,185
25,227 25,227 Ordinary shares of Rs 10 eachissued as fully paid bonus shares 252 252
12,618,391 12,618,391 Ordinary shares issued pursuant to theScheme as fully paid for considerationof investment in Associate 126,184 126,184
138,802,300 138,802,300 1,388,023 1,388,023
4 . 1 With effect from 1 October 2000 the Pure Terephthalic Acid (PTA) Business of the Company was demergedunder a Scheme of Arrangement ("the Scheme") dated 12 December 2000 approved by the shareholders andsanctioned by the High Court of Sindh.
4 . 2 ICI Omicron B.V., which is a wholly owned subsidiary of Imperial Chemical Industries PLC, UK, held105,229,125 (2002: 105,229,125) ordinary shares of Rs 10 each at 31 December 2003.
5. Capital Reserves
Share premium 465,259 465,259
Capital receipts 586 586
465,845 465,845
5 . 1 Share premium includes the premium amounting to Rs 0.902 million received on shares issued for theCompany's Polyester Plant installation in 1980 and share premium of Rs 464.357 million representing thed i fference between nominal value of Rs 10 per share of 12,618,391 ordinary shares issued by the Companyand the market value of Rs 590.541 million of the 126,183,909 ordinary shares corresponding to 25% holdingacquired in Pakistan PTA Limited, an associate, at the date of acquisition i.e. 2 November 2001 and thenumber of shares that have been issued were determined in accordance with the Scheme in the ratio betweenmarket value of the shares of two companies based on the mean of the middle market quotation of the KarachiStock Exchange over the ten trading days between 22 October 2001 to 2 November 2001.
5 . 2 Capital receipts represent the amount received from various ICI PLC group companies overseas for thepurchase of fixed assets. The remitting companies have no claim to their repayments.
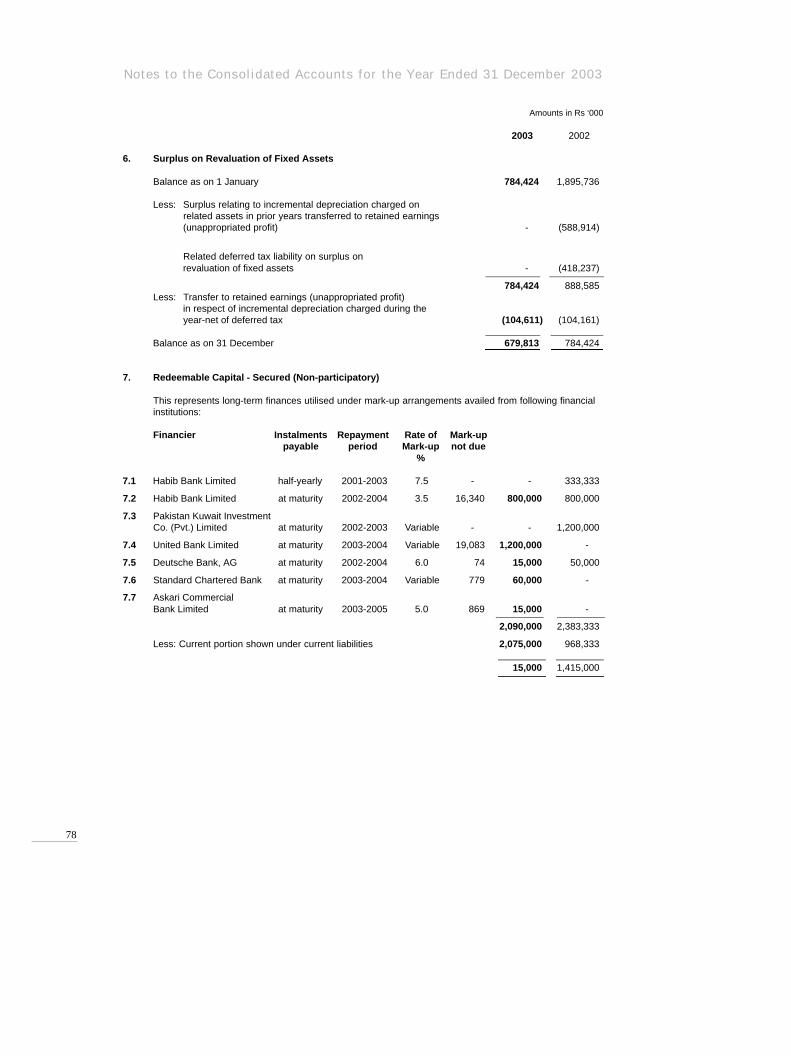
Notes to the Conso l ida ted Accoun ts fo r the Year Ended 31 December 2003
78
Amounts in Rs ‘000
2003 2002
6. Surplus on Revaluation of Fixed Assets
Balance as on 1 January 784,424 1,895,736
Less: Surplus relating to incremental depreciation charged onrelated assets in prior years transferred to retained earnings(unappropriated profit) -–– (588,914)
Related deferred tax liability on surplus onrevaluation of fixed assets -–– (418,237)
784,424 888,585Less: Transfer to retained earnings (unappropriated profit)
in respect of incremental depreciation charged during theyear-net of deferred tax (104,611)) (104,161)
Balance as on 31 December 679,813 784,424
7. Redeemable Capital - Secured (Non-participatory)
This represents long-term finances utilised under mark-up arrangements availed from following financialinstitutions:
Financier Instalments Repayment Rate of Mark-uppayable period Mark-up not due
%
7.1 Habib Bank Limited half-yearly 2001-2003 7.5 -–– -–– 333,333
7.2 Habib Bank Limited at maturity 2002-2004 3.5 16,340 800,000 800,000
7.3 Pakistan Kuwait Investment Co. (Pvt.) Limited at maturity 2002-2003 Variable -–– -–– 1,200,000
7.4 United Bank Limited at maturity 2003-2004 Variable 19,083 1,200,000 -––
7.5 Deutsche Bank, AG at maturity 2002-2004 6.0 74 15,000 50,000
7.6 Standard Chartered Bank at maturity 2003-2004 Variable 779 60,000 -––
7.7 Askari Commercial Bank Limited at maturity 2003-2005 5.0 869 15,000 -––
2,090,000 2,383,333
Less: Current portion shown under current liabilities 2,075,000 968,333
15,000 1,415,000

Notes to the Conso l ida ted Accoun ts fo r the Year Ended 31 December 2003
79
Amounts in Rs ‘000
Details of long-term finances utilised under mark-up arrangements are as follows:
7.1 Secured by first pari passu hypothecation charge over plant, machinery, equipment and other movables /fixed assets of the Soda Ash Business. The loan has been fully repaid on 28 April 2003.
7.2 Secured by first pari passu hypothecation charge over plant and machinery of the Polyester Business.
7.3 Secured by first pari passu hypothecation charge over plant, machinery, equipment and other movables /fixed assets of the Soda Ash Business (including Sodium Bicarbonate). The loan carries mark-upcomprising a base rate plus 3.5 percent per annum with a floor of 13 percent per annum and a cap of 15.25percent per annum where the base rate is the SBP discount rate prevailing two days beforecommencement of semi-annual period for which the mark-up is being computed. The loan has been fullyrepaid on 1 April 2003.
7.4 Secured by first pari passu hypothecation charge over plant, machinery, equipment and other movables /fixed assets of the Soda Ash Business (including Sodium Bicarbonate) carrying mark-up which is theaverage of the last three cut-offs of the three months Treasury Bills preceding the quarter for which mark-up was due plus a fixed spread of 1.8 percent.
7.5 Secured by first pari passu floating charge on the present and future stock-in-trade and book debts of theSubsidiary.
7.6 Secured by first pari passu floating charge on the present and future stock-in-trade and book debts of theSubsidiary carrying mark-up which is the average of last three cut-offs of the three months Treasury Billspreceding the quarter for which mark-up was due plus a fixed spread of 2.5 percent.
7.7 Secured by first pari passu floating charge on the present and future stock-in-trade and book debts of theSubsidiary.
8. Long-Term Loan - Unsecured
Instalments Repayment Interest 2003 2002payable period rate
Mortar Investments at maturity 2004 6 months 2,011,800 2,042,250International Ltd - Associated LIBOR pluscompany - USD 35 million a fixed (2002: USD 35 million) spread
of 1.0 %
Less: Current portion shown under current liabilities 2,011,800 2,042,250
-–– -–––9. Deferred Liability
Provisions for non-management staff gratuity andpensioners’medical schemes 74,997 79,248

Notes to the Conso l ida ted Accoun ts fo r the Year Ended 31 December 2003
80
Amounts in Rs ‘000–9.1 Staff Retirement Benefits
The amounts recognised in the profit and loss account against defined benefit schemes are as follows:
Funded Unfunded
Current service cost 51,583 4,360Interest cost 78,059 6,852Expected return on plan assets (68,828) -––Past service cost 26,935 2,226Recognition of loss 5,445 640
Charge for the year 93,194 14,078
Year 2002 89,198 21,378
Movements in the net liability recognised in the balance sheet are as follows:
Opening balance (42,862) (79,248)Charge for the year (93,194) (14,078)Contributions / payments during the year 72,473 14,780
Closing balance (63,583) (78,546)
The amounts recognised in the balance sheet are as follows:
Fair value of plan assets 910,381 -––Present value of defined benefit obligation (1,179,766) (109,469)
Deficit (269,385) (109,469)Unrecognised net loss 205,802 30,923
Recognised liability (63,583) (78,546)
Year 2002 (42,862) (79,248)
These figures are based on the latest actuarial valuation, as at 31 December 2003. The valuation uses theProjected Unit Credit method. Actuarial gains and losses are amortised over the expected future service ofcurrent members.
The discount rate was taken as 8 percent per annum. Salary inflation was assumed to average 6 percentper annum over the future working lives of current employees. Medical cost trend was assumed to average3 percent per annum in the long-term. Return on plan assets was assumed equal to the discount rate.Actual return on plan assets during 2003 was Rs 85 million (2002: Rs 167 million).
The Group contributed Rs 34.079 million (2002: Rs 31.4 million) to the provident fund during the year.
2003 200210. Short-Term Financing
Running finances utilised under mark-up arrangements - note 10.1 23,666 106,250Term finances - note 10.2 -–– 250,000
23,666 356,250

Notes to the Conso l ida ted Accoun ts fo r the Year Ended 31 December 2003
81
Amounts in Rs ‘000
10.1 The facilities for running finance available from various banks amount to Rs 2,750 million (2002: Rs 2,883million) and carry mark-up ranging from 2.48 to 5.5 percent per annum (2002: 7.6 to 17 percent per annum).The purchase prices are payable on various dates by 31 December 2004. The facilities are secured byhypothecation and floating charge over the present and the future stock-in-trade and receivables of theCompany and Subsidiary respectively.
10.2 The facilities for term finance available from various banks amount to Rs 550 million (2002: Rs 550 million).However no such facility was utilised as on 31 December 2003.
2003 200211. Creditors, Accrued and Other Liabilities
Trade creditors - note 11.1 1,408,207 1,406,998Bills payable 1,235,968 894,584Sales tax, excise and custom duties 155,000 181,853Mark-up accrued on:
Redeemable capital 19,679 41,499Short-term financing 1,990 11,256
Accrued interest / return on unsecured loan 298,498 222,666Accrued expenses 314,265 275,260Workers' profit participation fund - note 11.2 48,295 42,671Distributors' security deposits - payable
on termination of distributorship - note 11.3 53,875 54,131Contractors' earnest / retention money 16,771 18,778Advances from customers 105,991 52,172Unclaimed dividends 4,669 4,678Payable for capital expenditure 35,455 12,175Payable for staff retirement benefit schemes 77,720 42,862Others 226,130 165,100
4,002,513 3,426,683
11 . 1 The above balances include amounts due to associated undertakings amounting to Rs 249.776 million (2002: Rs 356.360 million).
11.2 Workers,
profit participation fund
Balance as on 1 January 42,671 33,135 Allocation for the year 43,726 38,058
86,397 71,193Interest on funds utilised in the Company’s
businesses at 16.9 percent per annum 3,571 3,835
89,968 75,028Less:
- Amount paid to and on behalf of the Fund 3,801 3,169- Deposited with the Government of Pakistan 37,872 29,188
41,673 32,357
Balance as on 31 December 48,295 42,671
11.3 Interest on security deposits from certain distributors is payable at 7.5 percent per annum as specified inthe agreements.

Notes to the Conso l ida ted Accoun ts fo r the Year Ended 31 December 2003
82
Amounts in Rs ‘000
2003 200212. Contingencies and Commitments
12.1 Claims against the Group not acknowledged as debts are as follows:
Local bodies 60,753 31,228Sales Tax authorities 67,677 67,426Others 50,151 50,151
178,581 148,805
12.2 The income tax authorities have re-assessed the income tax liability of the Company in respect ofassessment year 1998-99 under section 122 of the Income Tax Ordinance 2001 and have raised a demandof Rs 72.138 million. The Company has filed an appeal against this demand with the Income Tax AppellateTribunal and is confident of a favorable decision in this regard.
12.3 Guarantees given to a bank on behalf of the Subsidiary for loan, running finances and other credit facilitiesamounting to Rs 140 million (2002: Rs 140 million).
12.4 Guarantees issued by the Company in respect of financial and operational obligations of Pakistan PTALimited pursuant to the Scheme amounting to Rs 7,195.412 million (2002 : Rs 12,485.556 million) againstwhich Pakistan PTA Limited has issued counter guarantees to the Company.
12.5 Guarantee issued by the Company in respect of Senior Executive amounting to Rs 3.5 million (2002: Rs Nil).
12.6 Commitments in respect of capital expenditure - Rs 3.244 million (2002: Rs 22.342 million).
12.7 Faysal Management Services (Private) Limited has floated Fayzan Manufacturing Modaraba ("theModaraba") which has commissioned a spinning and processing plant ("Manufacturing Facility") in April2002 at a capital cost of Rs 1,356 million. The Manufacturing Facility is producing Polyester Staple Fibrefrom polymer provided by ICI Pakistan Limited under a Toll Manufacturing Agreement. This agreement isfor a period of four and half years from the commencement of commercial production and is renewable withmutual consent. At the completion of the agreement term or on its termination the Company will purchasethe Manufacturing Facility from the Modaraba at a price approximating the fair value of the ManufacturingFacility, provided the Modaraba is able to deliver free and unencumbered title to the Manufacturing Facility.
The Toll Manufacturing Agreement provides for a fee to be paid by the Company to the Modaraba, whichis based on the quantity of polymer processed by the Modaraba and includes a capacity fee of Rs 4.416million (2002: Rs 7.968 million) per month for making the Manufacturing Facility available to the Company.The Company also provides chemicals and other raw materials to the Modaraba at market price.

Notes to the Conso l ida ted Accoun ts fo r the Year Ended 31 December 2003
83
Amounts in Rs ‘000
12.8 Commitments for rentals under operating lease agreements in respect of vehicles and plant and machineryamounting to Rs 107.541 million (2002: Rs 109.183 million) are as follows:
Year Vehicles Plant and machinery Total(Rupees '000)
2004 46,845 1,054 47,8992005 36,026 1,033 37,0592006 17,267 1,033 18,3002007 3,381 902 4,283
103,519 4,022 107,541
Payable not later than one year 47,899
Payable later than one year but not later than five years 59,642
107,541
The above operating lease agreements are renewable for a further period of three years at the discretionof the Company.
12.9 Outstanding forward contracts as at 31 December 2003 entered into by the Company to hedge foreigncurrency transactions maturing within the next twelve months amounted to Rs 441.037 million (2002: Rs231.673 million).
13. Operating Assets
13.1 The following is a statement of operating assets:
Cost and Additions / Cost and Accumulated Charge for the Accumulated Book value Depreciationrevaluation (disposals) revaluation depreciation year / depreciation at 31 rate on original
at 1 at 31 at 1 (accumulated at 31 December cost andJanuary 2003 December 2003 January 2003 depreciation December 2003 2003 revaluation
on disposals) %Adjustments*
Freehold land 49,706 - 49,706 - - - 49,706 -
Leasehold land 83,471 - 83,471 26,710 10,285 36,995 46,476 2 to 4
Limebeds on freehold land 86,706 18,366 105,072 21,333 4,380 25,713 79,359 3.33 to 7.5
Buildings on freehold land 610,780 62,481 662,565 411,051 37,888 438,777 223,788 5 to 10 (10,696) (10,162)
Buildings on leasehold land 720,973 3,016 715,509 281,576 35,498 315,312 400,197 2.5 to 10 (8,480) (1,762)
Plant and machinery 11,282,151 352,759 11,618,861 6,621,606 540,550 7,169,555 4,449,306 3.33 to 10 (16,049) (14,001)
21,400 *
Railway sidings 297 - 297 297 -–– 297 -–– 3.33
Rolling stock and vehicles 125,629 3,698 123,804 107,549 3,575 107,402 16,402 10 to 25 (5,523) (3,722)
Furniture and equipment 432,957 47,536 473,434 292,312 45,359 332,862 140,572 10 to 33.33 (7,059) (4,809)
2003 13,392,670 487,856 13,832,719 7,762,434 677,535 8,426,913 5,405,806 (47,807) (34,456)
21,400 *
2002 12,983,935 457,119 13,392,670 7,132,318 656,747 7,762,434 5,630,236 (48,384) (26,631)
* Represents provision for diminution in the value of plant and machinery of Agrochemicals Business.

Notes to the Conso l ida ted Accoun ts fo r the Year Ended 31 December 2003
84
Amounts in Rs ‘000
13.2 The above balances represent the value of operating assets subsequent to revaluation on 1 October 1959and 30 September 2000, which had resulted in a surplus of Rs 14.207 million and Rs 1,569.869 millionrespectively. The incremental values of the assets revalued on 1 October 1959 and 30 September 2000 arebeing depreciated over the remaining useful lives of the assets at the date of revaluation.
13.3 Had there been no revaluation, the net book value of specific classes of operating assets would haveamounted to:
2003 2002
Freehold land 20,929 20,929Leasehold land 52 57Plant and machinery 3,549,040 3,593,759Rolling stock and vehicles 16,402 18,079Furniture and equipment 140,572 140,641
3,726,995 3,773,465
13.4 The depreciation charge for the year has been allocated as follows:
Cost of goods sold - note 27 642,984 624,543
Administration and selling expenses - note 28 34,551 32,204
677,535 656,747
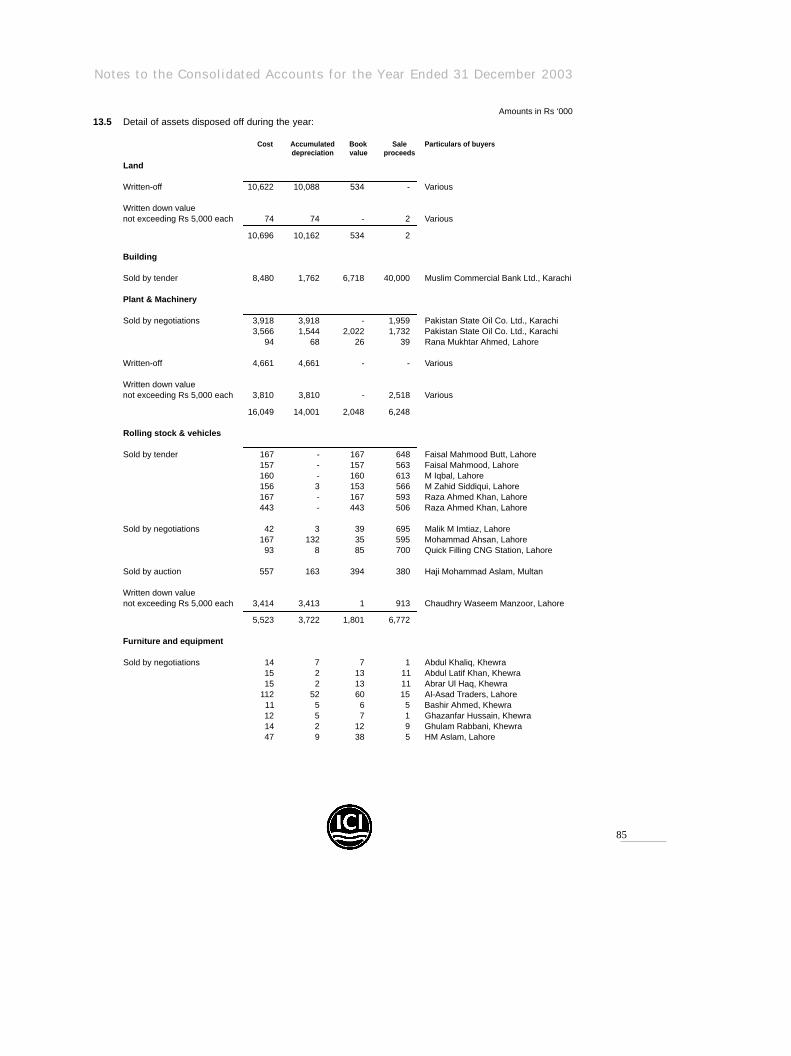
Notes to the Conso l ida ted Accoun ts fo r the Year Ended 31 December 2003
85
Amounts in Rs ‘00013.5 Detail of assets disposed off during the year:
Cost Accumulated Book Sale Particulars of buyersdepreciation value proceeds
Land
Written-off 10,622 10,088 534 - Various
Written down value not exceeding Rs 5,000 each 74 74 - 2 Various
10,696 10,162 534 2
Building
Sold by tender 8,480 1,762 6,718 40,000 Muslim Commercial Bank Ltd., Karachi
Plant & Machinery
Sold by negotiations 3,918 3,918 - 1,959 Pakistan State Oil Co. Ltd., Karachi3,566 1,544 2,022 1,732 Pakistan State Oil Co. Ltd., Karachi
94 68 26 39 Rana Mukhtar Ahmed, Lahore
Written-off 4,661 4,661 - - Various
Written down value not exceeding Rs 5,000 each 3,810 3,810 - 2,518 Various
16,049 14,001 2,048 6,248
Rolling stock & vehicles
Sold by tender 167 - 167 648 Faisal Mahmood Butt, Lahore157 - 157 563 Faisal Mahmood, Lahore160 - 160 613 M Iqbal, Lahore156 3 153 566 M Zahid Siddiqui, Lahore167 - 167 593 Raza Ahmed Khan, Lahore443 - 443 506 Raza Ahmed Khan, Lahore
Sold by negotiations 42 3 39 695 Malik M Imtiaz, Lahore167 132 35 595 Mohammad Ahsan, Lahore93 8 85 700 Quick Filling CNG Station, Lahore
Sold by auction 557 163 394 380 Haji Mohammad Aslam, Multan
Written down value not exceeding Rs 5,000 each 3,414 3,413 1 913 Chaudhry Waseem Manzoor, Lahore
5,523 3,722 1,801 6,772
Furniture and equipment
Sold by negotiations 14 7 7 1 Abdul Khaliq, Khewra15 2 13 11 Abdul Latif Khan, Khewra15 2 13 11 Abrar Ul Haq, Khewra
112 52 60 15 Al-Asad Traders, Lahore11 5 6 5 Bashir Ahmed, Khewra12 5 7 1 Ghazanfar Hussain, Khewra14 2 12 9 Ghulam Rabbani, Khewra47 9 38 5 HM Aslam, Lahore
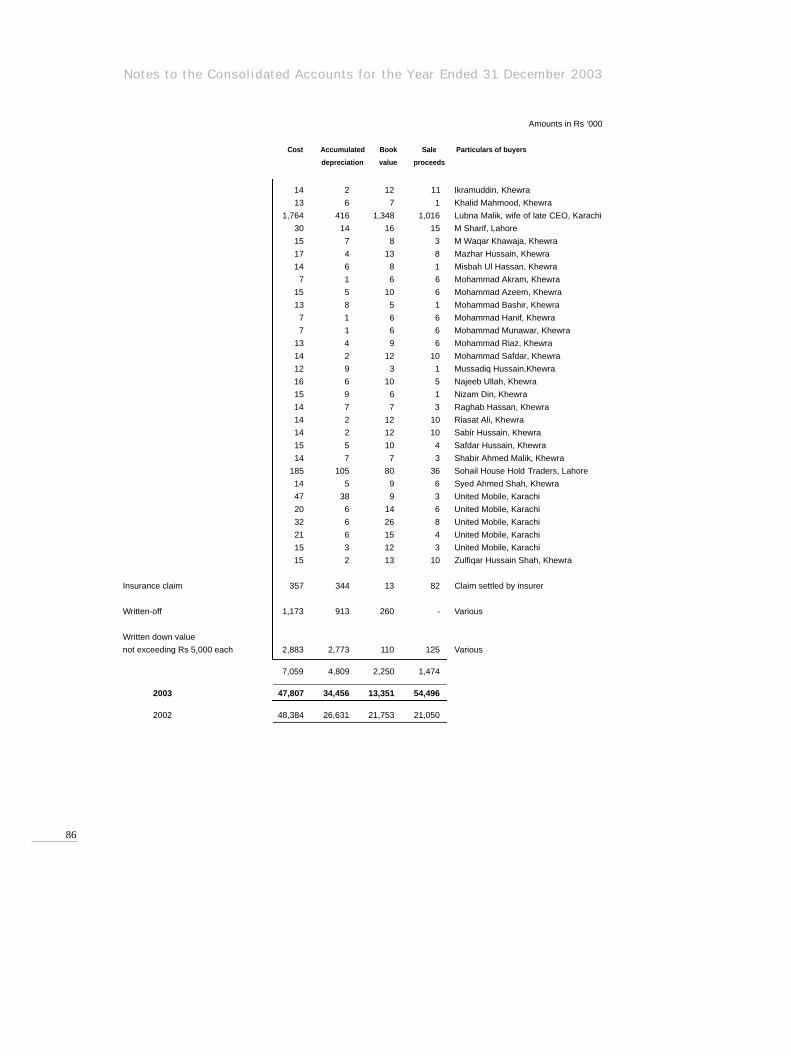
Notes to the Conso l ida ted Accoun ts fo r the Year Ended 31 December 2003
Amounts in Rs ‘000
Cost Accumulated Book Sale Particulars of buyers
depreciation value proceeds
14 2 12 11 Ikramuddin, Khewra
13 6 7 1 Khalid Mahmood, Khewra
1,764 416 1,348 1,016 Lubna Malik, wife of late CEO, Karachi
30 14 16 15 M Sharif, Lahore
15 7 8 3 M Waqar Khawaja, Khewra
17 4 13 8 Mazhar Hussain, Khewra
14 6 8 1 Misbah Ul Hassan, Khewra
7 1 6 6 Mohammad Akram, Khewra
15 5 10 6 Mohammad Azeem, Khewra
13 8 5 1 Mohammad Bashir, Khewra
7 1 6 6 Mohammad Hanif, Khewra
7 1 6 6 Mohammad Munawar, Khewra
13 4 9 6 Mohammad Riaz, Khewra
14 2 12 10 Mohammad Safdar, Khewra
12 9 3 1 Mussadiq Hussain,Khewra
16 6 10 5 Najeeb Ullah, Khewra
15 9 6 1 Nizam Din, Khewra
14 7 7 3 Raghab Hassan, Khewra
14 2 12 10 Riasat Ali, Khewra
14 2 12 10 Sabir Hussain, Khewra
15 5 10 4 Safdar Hussain, Khewra
14 7 7 3 Shabir Ahmed Malik, Khewra
185 105 80 36 Sohail House Hold Traders, Lahore
14 5 9 6 Syed Ahmed Shah, Khewra
47 38 9 3 United Mobile, Karachi
20 6 14 6 United Mobile, Karachi
32 6 26 8 United Mobile, Karachi
21 6 15 4 United Mobile, Karachi
15 3 12 3 United Mobile, Karachi
15 2 13 10 Zulfiqar Hussain Shah, Khewra
Insurance claim 357 344 13 82 Claim settled by insurer
Written-off 1,173 913 260 - Various
Written down value
not exceeding Rs 5,000 each 2,883 2,773 110 125 Various
7,059 4,809 2,250 1,474
2003 47,807 34,456 13,351 54,496
2002 48,384 26,631 21,753 21,050
86
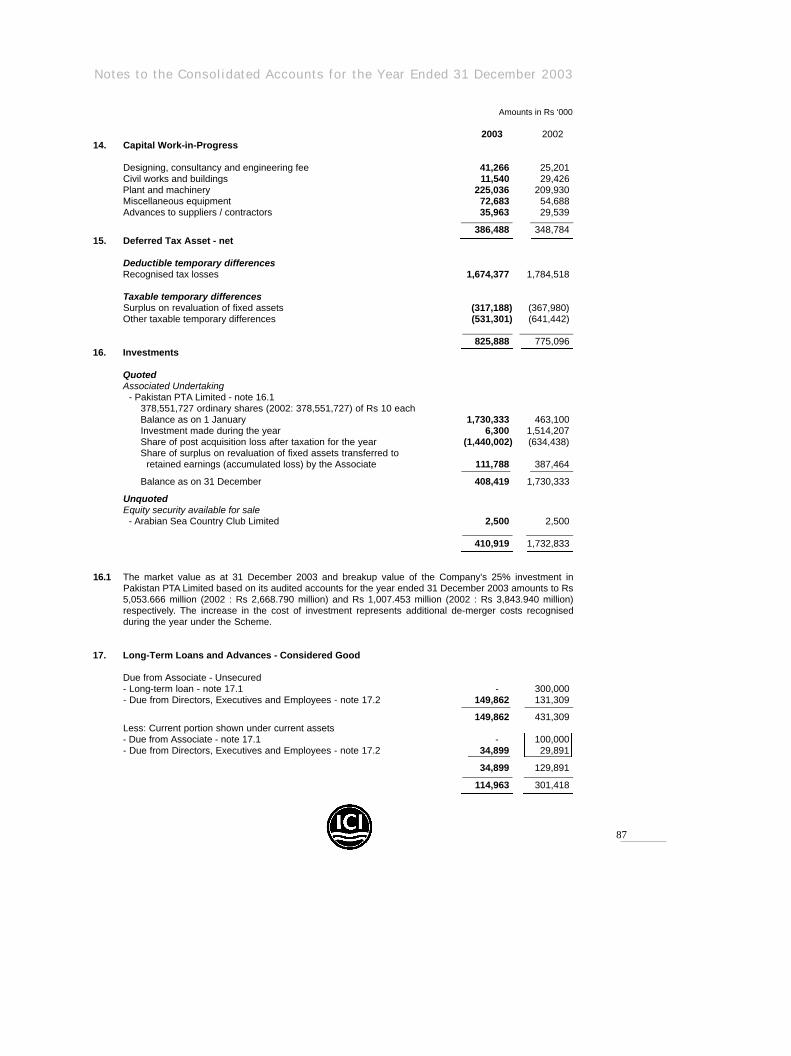
Notes to the Conso l ida ted Accoun ts fo r the Year Ended 31 December 2003
87
Amounts in Rs ‘000
2003 200214. Capital Work-in-Progress
Designing, consultancy and engineering fee 41,266 25,201Civil works and buildings 11,540 29,426Plant and machinery 225,036 209,930Miscellaneous equipment 72,683 54,688Advances to suppliers / contractors 35,963 29,539
386,488 348,78415. Deferred Tax Asset - net
Deductible temporary differencesRecognised tax losses 1,674,377 1,784,518
Taxable temporary differencesSurplus on revaluation of fixed assets (317,188) (367,980)Other taxable temporary differences (531,301) (641,442)
825,888 775,096 16. Investments
QuotedAssociated Undertaking
- Pakistan PTA Limited - note 16.1 378,551,727 ordinary shares (2002: 378,551,727) of Rs 10 eachBalance as on 1 January 1,730,333 463,100 Investment made during the year 6,300 1,514,207 Share of post acquisition loss after taxation for the year (1,440,002) (634,438)Share of surplus on revaluation of fixed assets transferred to
retained earnings (accumulated loss) by the Associate 111,788 387,464
Balance as on 31 December 408,419 1,730,333
UnquotedEquity security available for sale
- Arabian Sea Country Club Limited 2,500 2,500
410,919 1,732,833
1 6 . 1 The market value as at 31 December 2003 and breakup value of the Company's 25% investment inPakistan PTA Limited based on its audited accounts for the year ended 31 December 2003 amounts to Rs5,053.666 million (2002 : Rs 2,668.790 million) and Rs 1,007.453 million (2002 : Rs 3,843.940 million)respectively. The increase in the cost of investment represents additional de-merger costs recognisedduring the year under the Scheme.
17. Long-Term Loans and Advances - Considered Good
Due from Associate - Unsecured- Long-term loan - note 17.1 -–– 300,000 - Due from Directors, Executives and Employees - note 17.2 149,862 131,309
149,862 431,309 Less: Current portion shown under current assets- Due from Associate - note 17.1 -–– 100,000 - Due from Directors, Executives and Employees - note 17.2 34,899 29,891
34,899 129,891
114,963 301,418
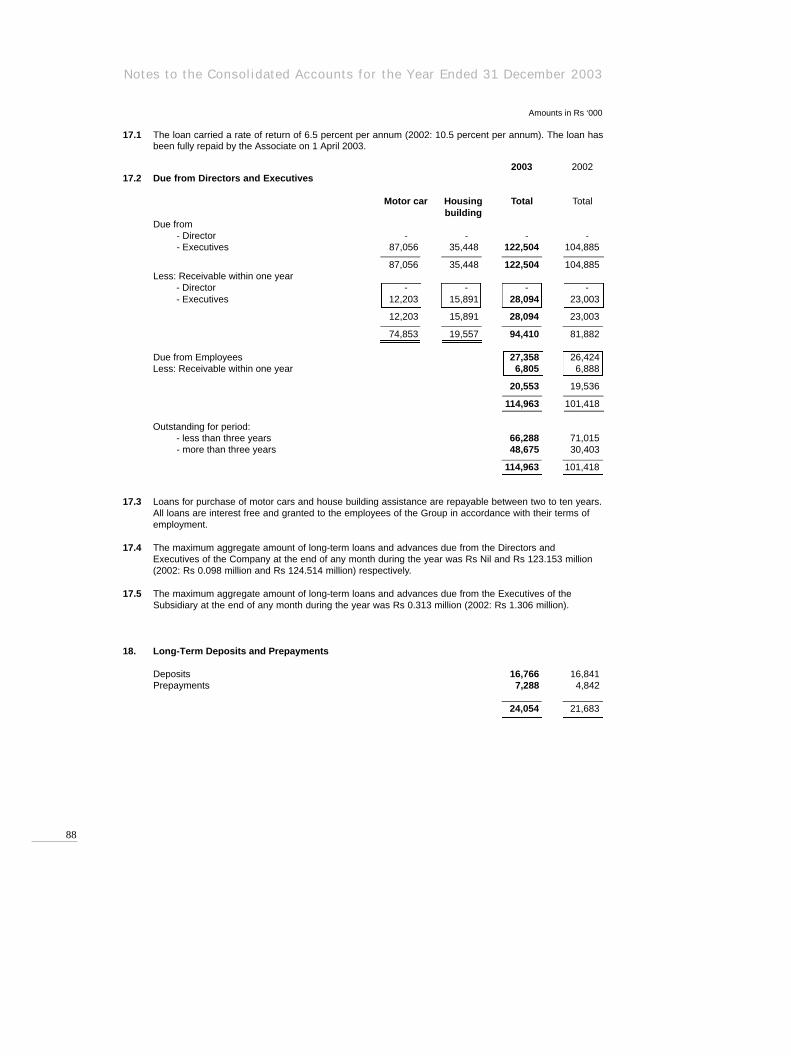
Notes to the Conso l ida ted Accoun ts fo r the Year Ended 31 December 2003
88
Amounts in Rs ‘000
17.1 The loan carried a rate of return of 6.5 percent per annum (2002: 10.5 percent per annum). The loan hasbeen fully repaid by the Associate on 1 April 2003.
2003 200217.2 Due from Directors and Executives
Motor car Housing Total Totalbuilding
Due from - Director -–– -–– -–– -––- Executives 87,056 35,448 122,504 104,885
87,056 35,448 122,504 104,885 Less: Receivable within one year
- Director -–– -–– -–– -––- Executives 12,203 15,891 28,094 23,003
12,203 15,891 28,094 23,003
74,853 19,557 94,410 81,882
Due from Employees 27,358 26,424 Less: Receivable within one year 6,805 6,888
20,553 19,536
114,963 101,418
Outstanding for period:- less than three years 66,288 71,015 - more than three years 48,675 30,403
114,963 101,418
17.3 Loans for purchase of motor cars and house building assistance are repayable between two to ten years.All loans are interest free and granted to the employees of the Group in accordance with their terms ofemployment.
17.4 The maximum aggregate amount of long-term loans and advances due from the Directors andExecutives of the Company at the end of any month during the year was Rs Nil and Rs 123.153 million(2002: Rs 0.098 million and Rs 124.514 million) respectively.
17.5 The maximum aggregate amount of long-term loans and advances due from the Executives of theSubsidiary at the end of any month during the year was Rs 0.313 million (2002: Rs 1.306 million).
18. Long-Term Deposits and Prepayments
Deposits 16,766 16,841Prepayments 7,288 4,842
24,054 21,683

Notes to the Conso l ida ted Accoun ts fo r the Year Ended 31 December 2003
89
Amounts in Rs ‘000
2003 200219. Stores and Spares
Stores (include in-transit Rs 4.548 million; 2002: Rs 1.845 million) 43,355 88,656
Spares (include in-transit Rs 3.069 million; 2002: Rs 3.608 million) 629,154 592,331
Consumables 82,189 39,469
754,698 720,456
Less: Provision for slow moving and obsolete items 47,989 47,989
706,709 672,46720. Stock-in-Trade
Raw and packing materials (include in-transit Rs 140.237 million; 830,003 776,2612002: Rs 130.835 million)
Work-in-process 79,969 126,779
Finished goods (include in-transit Rs 53.615 million; 1,200,419 903,9692002: Rs 94.972 million)
2,110,391 1,807,009
Less: Provision for slow moving and obsolete stock 32,739 33,490
2,077,652 1,773,51921. Trade Debts
Considered good- Secured 385,876 431,210- Unsecured 364,552 338,196
750,428 769,406Considered doubtful 161,317 104,506
911,745 873,912
Less: Provision for- doubtful debts 161,317 104,506- discounts payable 81,195 71,164
242,512 175,670
669,233 698,24222. Loans and Advances
Considered good
Loans due from:Executives 28,094 23,003Employees 6,805 6,888Associate -–– 100,000
34,899 129,891Advances to:
Executives 2,651 2,745Employees 60 705Contractors and suppliers 50,850 167,371Others 1,955 1,491
55,516 172,312
90,415 302,203Considered doubtful 9,003 2,404
99,418 304,607Less: Provision for doubtful loans and advances 9,003 2,404
90,415 302,203
Notes to the Conso l ida ted Accoun ts fo r the Year Ended 31 December 2003
90
Amounts in Rs ‘000
22.1 The maximum aggregate amount of advances due from the Directors and Executives of the Company atthe end of any month during the year was Rs Nil and Rs 4.153 million (2002: Rs 0.1 million and Rs 4.752million) respectively.
2003 2002
23. Trade Deposits and Short-Term Prepayments
Trade deposits 34,103 14,554Short-term prepayments 84,597 77,153Balances with statutory authorities 61,341 34,019Others 1,197 -––
181,238 125,726
24. Other Receivables
Considered good
Excise duty, sales tax and octroi refunds due 128,540 120,369Due from Associate 55,984 42,384Insurance claims 1,713 25,694Commission receivable 29,938 22,651Others 107,608 104,741
323,783 315,839Considered doubtful 14,951 6,906
338,734 322,745Less: Provision for doubtful receivables 14,951 6,906
323,783 315,839
24.1 The maximum aggregate amount due from Associate at the end of any month during the year was Rs55.984 million (2002: Rs 42.384 million).
25. Cash and Bank Balances
Deposit accounts -–– 75,000Current accounts 1,017,984 487,073In hand
cheques 13,794 41,185cash 15,395 12,637
1,047,173 615,895
Notes to the Conso l ida ted Accoun ts fo r the Year Ended 31 December 2003
91
Amounts in Rs ‘00026. Operating Results
Polyester General Chemicals Soda Ash Paints Others Group Group2003 2002 2003 2002 2003 2002 2003 2002 2003 2002 2003 2002
SalesInter-segment -–– -–– 275,391 216,409 -–– -–– -–– -–– 364,721 321,479 -–– -––Others 8,648,117 6,923,092 5,439,434 760,001 3,179,488 3,256,980 2,988,826 2,478,176 1,851,310 1,614,681 22,107,175 15,032,930
8,648,117 6,923,092 5,714,825 976,410 3,179,488 3,256,980 2,988,826 2,478,176 2,216,031 1,936,160 22,107,175 15,032,930 Commission income -–– -–– 49,090 40,883 -–– -–– -–– -–– -–– -–– 49,090 40,883
Turnover 8,648,117 6,923,092 5,763,915 1,017,293 3,179,488 3,256,980 2,988,826 2,478,176 2,216,031 1,936,160 22,156,265 15,073,813
Sales tax 1,437,863 1,121,812 780,589 150,747 534,369 548,086 420,797 354,545 116,366 137,105 3,289,984 2,312,295
Commission and discounts to distributorsand customers 105,823 41,088 20,078 -–– 121,755 104,551 286,841 243,611 245,617 188,707 780,114 577,957
1,543,686 1,162,900 800,667 150,747 656,124 652,637 707,638 598,156 361,983 325,812 4,070,098 2,890,252Net sales and
commission income 7,104,431 5,760,192 4,963,248 866,546 2,523,364 2,604,343 2,281,188 1,880,020 1,854,048 1,610,348 18,086,167 12,183,561
Cost of goods sold 27 6,881,008 5,530,488 4,453,818 701,758 1,804,645 1,722,415 1,554,118 1,278,862 1,350,432 1,161,152 15,403,909 9,856,787
Gross profit 223,423 229,704 509,430 164,788 718,719 881,928 727,070 601,158 503,616 449,196 2,682,258 2,326,774
Administration and selling expenses 28 199,235 158,181 388,310 78,894 304,073 327,477 331,991 303,981 353,369 381,708 1,576,978 1,250,241
Operating profit 24,188 71,523 121,120 85,894 414,646 554,451 395,079 297,177 150,247 67,488 1,105,280 1,076,533
26.1 Segment assets 4,492,652 4,377,151 860,972 388,176 3,801,296 3,875,155 743,922 617,420 1,128,672 1,548,110 11,027,514 10,806,012
26.2 Unallocated assets -–– -–– -–– -–– -–– -–– -–– -–– -–– -–– 1,592,691 2,764,215
12,620,205 13,570,227
26.3 Segment liabilities 1,972,713 1,899,387 467,825 222,725 476,037 665,275 283,748 263,598 578,007 542,353 3,778,330 3,593,338
26.4 Unallocated liabilities -–– -–– -–– -–– -–– -–– -–– -–– -–– -–– 4,771,652 5,006,731
8,549,982 8,600,069
26.5 Non-cash items(excludingdepreciation) 3,066 4,937 45 608 6,721 10,399 1,115 1,696 22,104 2,553 33,051 20,193
26.6 Capital expenditure 204,183 104,254 6,863 6,931 181,841 263,706 45,772 36,173 86,901 88,363 525,560 499,427
26.7 Inter-segment salesInter-segment sales have been eliminated from the total.
26.8 Inter-segment pricingTransactions among the business segments are recorded at arm’s length prices using admissible valuation methods.

Notes to the Conso l ida ted Accoun ts fo r the Year Ended 31 December 2003
92
Amounts in Rs ‘00027. Cost of Goods Sold
Polyester General Chemicals Soda Ash Paints Others Group Group2003 2002 2003 2002 2003 2002 2003 2002 2003 2002 2003 2002
Raw and packingmaterials consumed
Opening stock 429,957 620,026 18,462 10,434 50,405 51,887 111,018 123,234 146,740 172,616 756,582 978,197
PurchasesInter-segment -–– -–– -–– -–– -–– -–– 325,405 266,714 -–– -–– -–– -––Others 5,602,636 3,971,545 130,883 72,877 484,836 440,933 861,444 676,862 683,841 665,911 7,763,640 5,828,128
5,602,636 3,971,545 130,883 72,877 484,836 440,933 1,186,849 943,576 683,841 665,911 7,763,640 5,828,128
6,032,593 4,591,571 149,345 83,311 535,241 492,820 1,297,867 1,066,810 830,581 838,527 8,520,222 6,806,325
Closing stock (501,917) (429,957) (26,124) (18,462) (48,123) (50,405) (85,186) (111,018) (152,157) (146,740) (813,507) (756,582)
5,530,676 4,161,614 123,221 64,849 487,118 442,415 1,212,681 955,792 678,424 691,787 7,706,715 6,049,743
Salaries, wages and benefits 187,496 178,313 2,845 1,275 298,958 254,921 65,783 55,712 37,931 36,831 593,013 527,052
Stores and spares consumed 57,307 46,311 63 -–– 79,336 83,815 1,050 2,715 14,220 14,577 151,976 147,418
Conversion fee paid to contractmanufacturers
- Modaraba 290,123 296,578 -–– -–– -–– -–– -–– -–– -–– -–– 290,123 296,578 - Others -–– -–– -–– -–– -–– -–– -–– -–– 80,137 68,684 80,137 68,684
Oil, gas and electricity 493,652 441,588 382 186 519,059 533,171 8,212 7,466 3,339 4,102 709,937 715,339
Rent, rates and taxes 873 910 -–– -–– 633 502 - - 1,125 777 2,631 2,189
Insurance 35,166 36,086 -–– -–– 21,741 20,532 8,353 7,269 2,293 2,371 67,553 66,258
Repairs and maintenance 5,926 4,700 110 118 5,150 6,954 8,661 6,530 1,297 1,656 21,144 19,958
Depreciation - note 13.4 273,009 268,221 469 605 314,738 301,341 18,340 17,659 36,428 36,717 642,984 624,543
Excise duty -–– -–– -–– -–– -–– -–– 245,327 203,836 4,394 4,708 249,721 208,544
Technical fees 2,271 -–– -–– -–– -–– -–– 7,234 9,900 -–– -–– 9,505 9,900
Royalty -–– -–– 13,025 -–– -–– -–– -–– -–– -–– -–– 13,025 -––
General expenses 58,598 45,012 791 434 32,980 26,333 12,424 9,269 7,330 9,190 112,123 90,238
Opening stock ofwork-in-process 110,813 122,662 -–– -–– -–– -–– 15,194 12,248 772 798 126,779 135,708
Closing stock ofwork-in-process (59,393) (110,813) -–– -–– -–– -–– (19,008) (15,194) (1,568) (772) (79,969) (126,779)
Cost of goods manufactured 6,986,517 5,491,182 140,906 67,467 1,759,713 1,669,984 1,584,251 1,273,202 866,122 871,426 10,697,397 8,835,373
Opening stock offinished goods 385,413 429,719 121,178 68,209 89,206 111,149 52,272 58,807 242,004 250,344 890,073 918,228
Finished goods purchased -–– -–– 4,579,559 687,260 34,924 36,272 -–– -–– 394,632 283,013 5,009,115 1,006,545
7,371,930 5,920,901 4,841,643 822,936 1,883,843 1,817,405 1,636,523 1,332,009 1,502,758 1,404,783 16,596,585 10,760,146 Closing stock of
finished goods (490,922) (385,413) (387,825) (121,178) (79,198) (89,206) (82,405) (52,272) (143,826) (242,004) (1,184,176) (890,073)
Provision for obsolete stocks shown under administration andselling expenses -–– (5,000) -–– -–– -–– (5,784) -–– (875) (8,500) (1,627) (8,500) (13,286)
6,881,008 5,530,488 4,453,818 701,758 1,804,645 1,722,415 1,554,118 1,278,862 1,350,432 1,161,152 15,403,909 9,856,787
27.1 Inter-segment purchasesInter-segment purchases have been eliminated from the total.
27.2 Oil, gas and electricity includes inter-segment purchases of Rs 314.707 million (2002: 271.174 million) which have been eliminated from the total.
27.3 Staff retirement benefitsSalaries, wages and benefits include Rs 52.160 million (2002: 48.012 million) in respect of staff retirement benefits.
Notes to the Conso l ida ted Accoun ts fo r the Year Ended 31 December 2003
93
28.1 Staff retirement benefits
Salaries and benefits include Rs 68.610 million (2002: Rs 89.616 million) in respect of staff retirement benefits.
2 8 . 2 Service charges from A s s o c i a t e
This represents amount charged by the Company for certain administrative services rendered by it to the A s s o c i a t ein accordance with the Service Level Agreement, between the two companies.
2003 200229. Other Income
Profit on short-term and call deposits 1,384 1,082 Return on loans due from Associate 6,317 210,559 Scrap sales 20,552 23,545 Gain on disposal of fixed assets 41,145 -––Insurance claims -–– 17,789 Provisions and accruals no longer required written back 44,385 319 Technical fee from Modaraba -–– 3,000 Exchange gain 42,682 71,374 Others 31,096 6,246
187,561 333,914
Amounts in Rs ‘00028. Administration and Selling Expenses
Polyester General Chemicals Soda Ash Paints Others Group Group2003 2002 2003 2002 2003 2002 2003 2002 2003 2002 2003 2002
Salaries and benefits 96,127 74,610 42,730 34,408 143,717 115,634 142,575 133,125 222,416 223,764 647,565 581,541
Repairs and maintenance 3,390 2,734 751 666 5,324 4,191 5,316 3,582 5,092 5,773 19,873 16,946
Advertising and sales promotion 4,193 2,563 1,334 1,019 7,350 5,273 64,270 53,749 30,225 23,374 107,372 85,978
Rent, rates and taxes 2,939 2,254 1,096 1,330 5,744 5,033 5,541 5,631 4,568 9,153 19,888 23,401
Insurance 1,045 1,060 5,766 2,799 5,875 6,943 3,020 2,210 6,424 8,174 22,130 21,186
Lighting, heating and cooling 2,523 1,876 637 450 5,518 3,886 4,328 4,141 5,417 5,514 18,423 15,867
Depreciation - note 13.4 6,049 2,477 2,985 1,951 12,498 6,772 5,945 8,045 7,074 12,959 34,551 32,204
Outward freight and handling 15,357 27,959 285,708 20,603 56,014 116,227 49,598 36,284 11,579 13,026 418,256 214,099
Provision for doubtful debts- trade 32,800 2,500 14,800 -–– -–– -–– 900 6,500 9,186 33,000 57,686 42,000 - others -–– -–– -–– -–– -–– -–– -–– -– -–– 7,175 -–– 7,175
Provision for obsolete stock -–– 5,000 -–– -–– -–– 5,784 -–– 875 8,500 1,627 8,500 13,286
Travelling expenses 8,159 9,980 7,798 4,720 8,842 9,401 14,846 16,009 36,542 43,742 76,187 83,852
Postage, telegram,telephone and telex 3,125 3,616 5,665 2,079 6,337 4,711 10,015 9,872 13,473 12,350 38,615 32,628
General expenses 23,528 21,552 19,040 8,869 46,854 43,622 25,637 23,958 52,888 62,679 167,947 160,680
199,235 158,181 388,310 78,894 304,073 327,477 331,991 303,981 413,384 462,310 1,636,993 1,330,843 Less:Service charges from
Pakistan PTA Limited -–– -–– -–– -–– -–– -–– -–– -–– 60,015 80,602 60,015 80,602
199,235 158,181 388,310 78,894 304,073 327,477 331,991 303,981 353,369 381,708 1,576,978 1,250,241
Notes to the Conso l ida ted Accoun ts fo r the Year Ended 31 December 2003
94
Amounts in Rs ‘000
2003 200230. Financial Charges
Mark-up on:Short-term financing 33,687 134,169Redeemable capital 140,219 248,884
Interest on:Long-term loans 75,832 155,823Workers’profit participation fund 3,571 3,835
Discounting charges on receivables 135,310 102,087Others 10,365 10,476
398,984 655,27431. Other Charges
Auditors’remuneration - note 31.1 4,906 4,179Donations - note 31.2 8,232 9,377Workers’profit participation fund 43,726 38,058Loss on disposal of fixed assets -–– 703Provision for diminution in the value of fixed assets - note 13 21,400 -––
78,264 52,317
31.1 Auditors’remuneration
Audit fee 1,888 1,855Certifications including half yearly review and group reporting 2,740 2,071Out-of-pocket expenses 278 253
4,906 4,179
3 1 . 2 Donations include Rs 7.116 million (2002: Rs 8.899 million) to ICI Pakistan Foundation. Mr JonathanR Stoney, Chief Executive, Mr S Imran Agha and Mr Asif Jooma, Directors of the Company, are amongst theTrustees of the Foundation.
32. Taxation
Current - note 32.1 76,098 79,317
Deferred tax asset realised on taxable income 419,767 -––Deferred tax asset recognised (419,767) (1,143,077)Deferred tax on surplus on revaluation of fixed
assets transferred to retained earnings - note 32.2 (50,792) (50,257)
(50,792) (1,193,334)
25,306 (1,114,017)
3 2 . 1 In view of the available tax losses, provision for current year taxation represents minimum tax payable under section113 of the Income Tax Ordinance, 2001 at the rate of one-half of one percent of turnover.
3 2 . 2 Includes deferred tax credited to profit and loss account amounting to Rs 50.792 million (2002: Rs 50.257 m i l l i o n )on surplus on revaluation of fixed assets transferred to retained earnings (unappropriated profit) equivalent toincremental depreciation charged during the current year.

Notes to the Conso l ida ted Accoun ts fo r the Year Ended 31 December 2003
95
Amounts in Rs ‘000
2003 2002
33. (Loss) / earning per Share - Basic and Diluted
(Loss) / profit after taxation for the year (664,717) 1,200,057
Number of shares
Average number of ordinary shares in issue during the year 138,802,300 138,802,300
(Rupees)
(Loss) / earning per share (4.79) 8.65
34. Remuneration of Directors and Executives
The aggregate amounts charged in the accounts for the remuneration, including all benefits, to theChairman, Chief Executive, Directors and Executives of the Company were as follows:
Chairman Chief Executive Directors Executives Total
2003 2002 2003 2002 2003 2002 2003 2002 2003 2002
Managerial remuneration 1,169 -– 7,485 7,281 10,195 8,411 407,264 297,523 426,113 313,215
Retirement benefits -–– -– 992 2,249 2,592 2,907 95,316 94,577 98,900 99,733
Group insurance -–– -– 17 27 35 107 3,432 4,207 3,484 4,341
Rent and house maintenance -–– 349 4,869 5,514 1,144 1,070 115,284 95,059 121,297 101,992
Utilities -–– 285 799 750 677 1,180 44,919 46,769 46,395 48,984
Medical expenses -–– 55 103 168 96 137 18,722 17,378 18,921 17,738
Leave passage -–– -– 58 228 29 68 391 561 478 857
1,169 689 14,323 16,217 14,768 13,880 685,328 556,074 715,588 586,860
Number of persons 1 1 1 1 3 4 699 548 704 554
34.1 The Directors and certain Executives are provided with free use of Company cars in accordance with theirentitlement. The Chief Executive is provided with Company owned and maintained furnishedaccommodation and free use of Company car.
34.2 Aggregate amount charged in the accounts for fee to four Directors was Rs 3.103 million (2002: threeDirectors Rs 1.217 million).
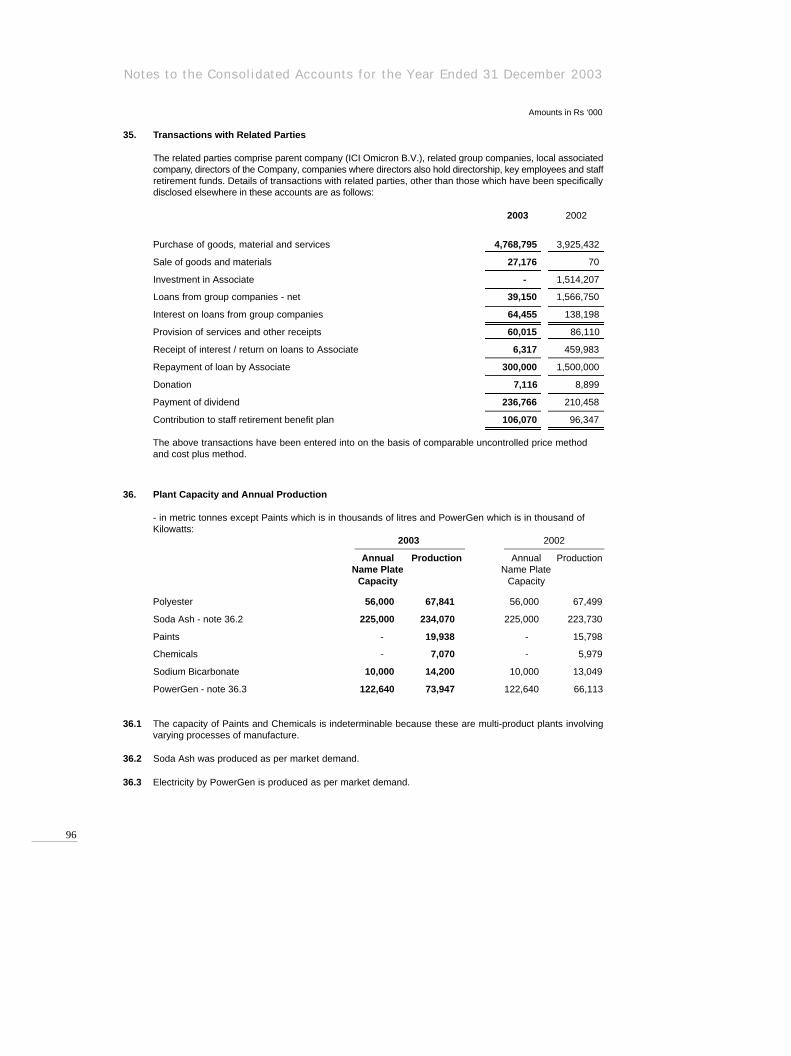
Notes to the Conso l ida ted Accoun ts fo r the Year Ended 31 December 2003
96
Amounts in Rs ‘000
35. Transactions with Related Parties
The related parties comprise parent company (ICI Omicron B.V.), related group companies, local associatedc o m p a n y, directors of the Company, companies where directors also hold directorship, key employees and staffretirement funds. Details of transactions with related parties, other than those which have been specificallydisclosed elsewhere in these accounts are as follows:
2003 2002
Purchase of goods, material and services 4,768,795 3,925,432
Sale of goods and materials 27,176 70
Investment in Associate -–– 1,514,207
Loans from group companies - net 39,150 1,566,750
Interest on loans from group companies 64,455 138,198
Provision of services and other receipts 60,015 86,110
Receipt of interest / return on loans to Associate 6,317 459,983
Repayment of loan by Associate 300,000 1,500,000
Donation 7,116 8,899
Payment of dividend 236,766 210,458
Contribution to staff retirement benefit plan 106,070 96,347
The above transactions have been entered into on the basis of comparable uncontrolled price methodand cost plus method.
36. Plant Capacity and Annual Production
- in metric tonnes except Paints which is in thousands of litres and PowerGen which is in thousand ofKilowatts:
2003 2002
Annual Production Annual ProductionName Plate Name Plate
Capacity Capacity
Polyester 56,000 67,841 56,000 67,499
Soda Ash - note 36.2 225,000 234,070 225,000 223,730
Paints -–– 19,938 -–– 15,798
Chemicals -–– 7,070 -–– 5,979
Sodium Bicarbonate 10,000 14,200 10,000 13,049
PowerGen - note 36.3 122,640 73,947 122,640 66,113
36.1 The capacity of Paints and Chemicals is indeterminable because these are multi-product plants involvingvarying processes of manufacture.
36.2 Soda Ash was produced as per market demand.
36.3 Electricity by PowerGen is produced as per market demand.

Notes to the Conso l ida ted Accoun ts fo r the Year Ended 31 December 2003
97
Amounts in Rs ‘000
37. Fair Value of Financial Assets and Liabilities
The carrying amounts of all financial assets and liabilities approximate their fair values.
38. Interest / Mark-up Rate Risk Management
Interest / mark-up rate risk arises from the possibility that changes in interest / mark-up rates will affect thevalue of financial instruments. In respect of income earning financial assets and interest / mark-up bearingfinancial liabilities, the following table indicate their effective interest / mark-up rates at the balance sheetdate and the periods in which they will re-price or mature:
Interest / mark-up bearing
Effective Maturity Maturity Maturity Non-interest TotalMark-up upto one one to five after five /mark-up
rates year years years bearing %
Financial Assets
Long-term loans - -–– -–– -–– 149,862 149,862
Long-term deposits - -–– -–– -–– 16,766 16,766
Trade debts - -–– -–– -–– 669,233 669,233
Trade deposits - -–– -–– -–– 34,103 34,103
Other receivables - -–– -–– -–– 323,783 323,783
Cash and bank balances - -–– -–– -–– 1,047,173 1,047,173
-–– -–– -–– 2,240,920 2,240,920
Financial Liabilities
Redeemable capital Variable 2,075,000 15,000 -–– -–– 2,090,000
Long-term loans 6 months 2,011,800 -–– -–– -–– 2,011,800 LIBOR plus
a fixed spreadof 1.0
Short-term financing 7.6 - 17 23,666 -–– -–– -–– 23,666
Creditors, accrued andother liabilities 7.5 & 16.9 102,170 -–– -–– 3,900,343 4,002,513
Proposed dividend - -–– -–– -–– 347,006 347,006
4,212,636 15,000 -–– 4,247,349 8,474,985
Net financial assets / (liabilities) 2003 (4,212,636) (15,000) -–– (2,006,429) (6,234,065)
Net financial assets / (liabilities) 2002 (3,191,833) (1,215,000) -–– (2,021,308) (6,428,141)

Notes to the Conso l ida ted Accoun ts fo r the Year Ended 31 December 2003
98
Amounts in Rs ‘00039. Credit and Concentration of Credit Risk
Credit risk represents the accounting loss that would be recognised at the reporting date if counter-partiesfailed completely to perform as contracted. The Group does not have significant exposure to any individualcustomer.To reduce exposure to credit risk the Group has developed a formal approval process wherebycredit limits are applied to its customers. The management also continuously monitors the credit exposuretowards the customers and makes provision against those balances considered doubtful of recovery.
The sector wise analysis of receivables, comprising trade debts, deposits, advances to suppliers, loansexcluding loans to associates and other receivables is given below:
2003 2002Public Sector- Government 205,403 160,286 - Armed forces 1,660 -––- Communication 416 502 - Oil and gas 4,614 2,830 - Health 605 85 - Others 19,121 27,278
231,819 190,981 Private Sector- Institutional 11,505 11,875 -Trade 669,233 698,242 - Bank 1,283 -––- Others 341,977 516,738
1,023,998 1,226,855
1,255,817 1,417,83640. Foreign Exchange Risk Management
Foreign currency risk arises mainly where receivables and payables exist due to transactions entered intoforeign currencies. The Company is exposed to foreign currency risk on sales, purchases and borrowingsthat are entered in a currency other than Pak Rupees. The Company uses forward foreign exchangecontracts to hedge its foreign currency risk, when considered appropriate.
41. Number of Employees
Number of employees at 31 December 1,338 1,333
42. Date of Authorisation
These financial statements were authorised for issue in the Board of Directors meeting held on 27 February2004.
43. General
Figures have been rounded off to the nearest thousand rupees.
M J Jaffer Jonathan R Stoney Feroz RizviChairman / Director Chief Executive Chief Financial Officer