ice cream structure and its practical implications for
TRANSCRIPT
Ice Cream Structure and its Practical Implications for Product Performance
and Clean Label Formulations
Prof. H. Douglas Goff
University of Guelph

Outline
• Formulations and Ingredients
• Structure–Colloidal structure and properties
–Aqueous structure and properties
• Clean labelling implications
• Questions/Discussion…….

Ice Cream Mix Composition and Functionality
(Milk) Fat (4 - 8) - >10 - 16%Structure; texture
Milk solids-not-fat 9 - 12%Protein functionality (fat and air
interfaces, water phase); Lactose
functionality (solute)
Sweeteners 14 - 16%Freezing point depression
Stabilizers 0 - 0.25%Aqueous phase structuring
Emulsifiers 0 - 0.25%Colloidal phase structuring
Water 60 - 64%
Formulations
• Variations in composition,
ingredients
• Price Spectrum (overrun)
• “Health-conscious”
➢ Lowfat, Light, No
Sugar Added, etc.
• Clean Label

ice
air
3-D fat network
Ice Cream Mix(x10,000)
Ice Cream (x1000)
partially-crystalline fat emulsion
mixed membrane of protein and emulsifier
casein micelles
solution of dissolved solutes
freeze-concentrated unfrozen phase

C=ice crystalA=air bubbleF=fat globuleS=serum (unfrozen) phase
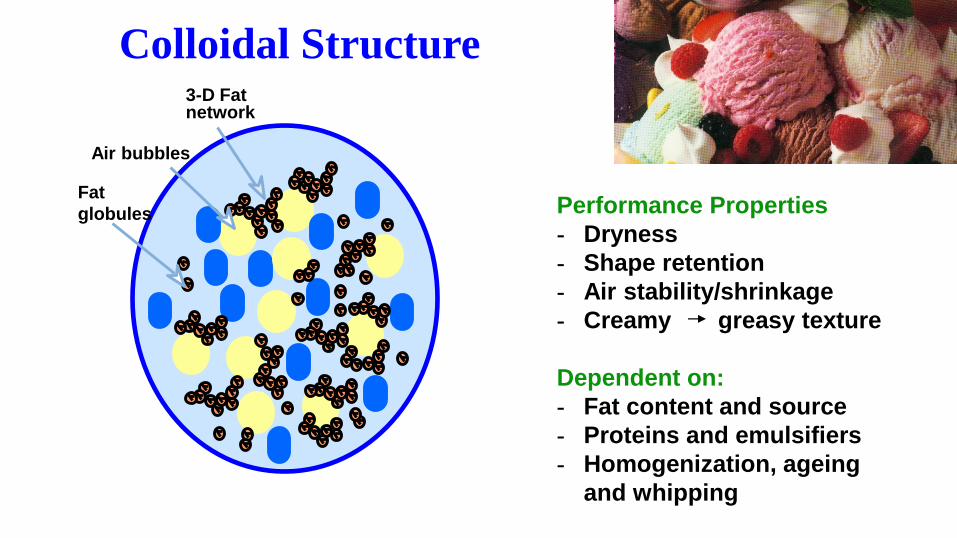
Air bubbles
3-D Fat network
Colloidal Structure
Fat
globules Performance Properties
- Dryness
- Shape retention
- Air stability/shrinkage
- Creamy greasy texture
Dependent on:
- Fat content and source
- Proteins and emulsifiers
- Homogenization, ageing
and whipping


Homogenization: creates small stable fat globulesAgeing: crystallization of some fat

Partial coalescence of droplets containing semi-crystalline fat
Droplet with
mixed
protein/small
molecule
interface
Interface is
weakened
Cooling
Droplets with partly
crystalline fat
Whipping
Network of partly
crystalline droplets

Courtesy M. Kalab

Aerated emulsions: fat globules and clusters
accumulate at air interfaces
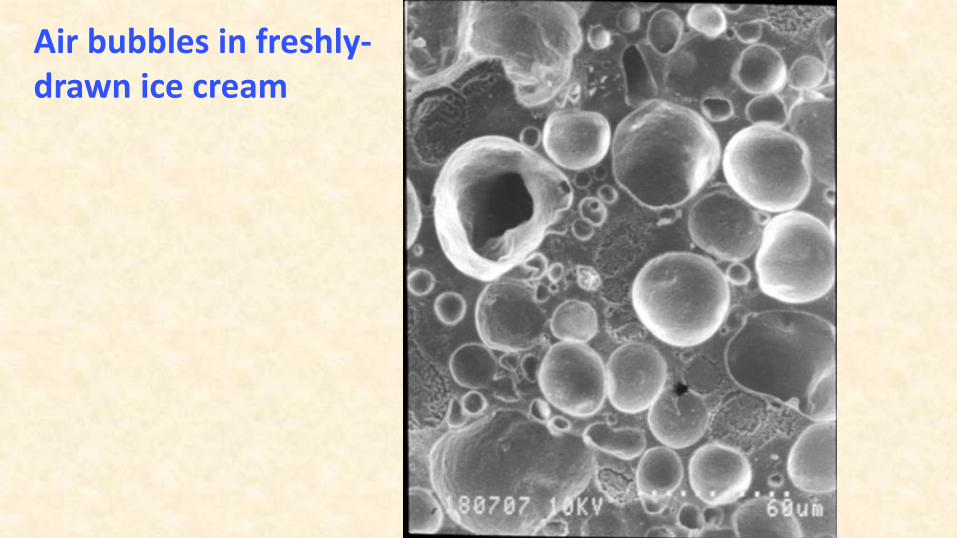
Air bubbles in freshly-drawn ice cream


Partially-coalesced fat globule networks in ice cream
Air bubble
Fat
Air bubble
Fat
1 µm

Emulsifiers: Protein displacement at homogenization and during ageing
Fat globules stabilized by proteins after homogenization

Homogenized Fat Globules and the Role of Emulsifiers
No emulsifier, adsorbed casein With polysorbate 80
1 µm

No emulsifier before ageing With emulsifier before ageing
Courtesy W. Buchheim
Homogenized Fat Globules and the Role of Emulsifiers and Ageing

No emulsifier 4 hrs. of ageing With emulsifier 4 hrs. of ageing
Courtesy W. Buchheim
Homogenized Fat Globules and the Role of Emulsifiers and Ageing

+
With “thin” fat interface (emulsifiers) and partially crystalline fat (cold ageing)
Shear
+Shear
With “thick” fat interface (proteins) and partially crystalline fat

1 - start 1- 100 minutes
2 - start 2 - 100 minutes
3 - start 3 - 100 minutes
No emulsifier
0.15% mdg
+ 0.02% ps 80
0.15% mdg
+ 0.06% ps 80

0
5
10
15
20
25
30
35
40
45
1 2 3 4 24Melt
ed
after 6
0 m
in. %
Ageing Time (hours)
Melting Resistance as Function of Ageing Time

Non-dairy fat Frozen Desserts
Modified milk ingredients, sugar, milk ingredients, glucose, coconut oil, mono- and diglycerides, propylene glycol monostearate, cellulose gum, carob bean gum, carrageenan, artificial flavour, colour.
MODIFIED MILK INGREDIENTS, SUGAR, WATER, GLUCOSE, COCONUT OIL, NATURAL VANILLA FLAVOUR, MONO AND DIGLYCERIDES, VEGETABLE GUMS (GUAR, CAROB BEAN), CARRAGEENAN, NATURAL COLOUR.

+ =
Liquid oil : Coalescence
Shear
+ =
Solid fat : Stability
Shear


50 100 %
Solid Fat Content (%) at 4°C
Fa
t Stru
ctu
ring
Ice
Cre
am
Me
ltin
g r
ate
Guttierez, Sung and Goff, 2009
60-70%

Courtesy R. Hartel

Courtesy R. Hartel


Shrinkage
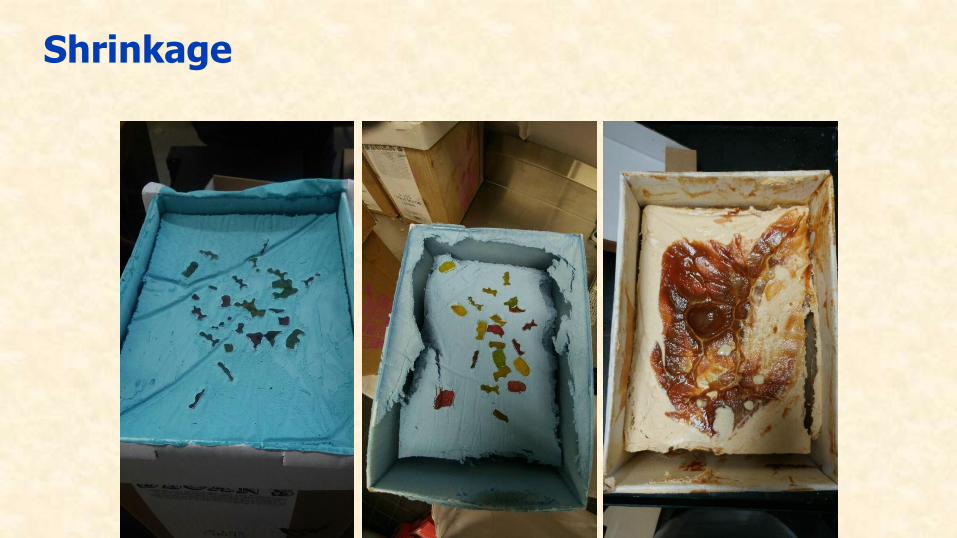
Shrinkage

Prevention:
-Protein functionality
-Lower overrun
-Low temperature storage
Amador, Hartel and Rankin, 2017
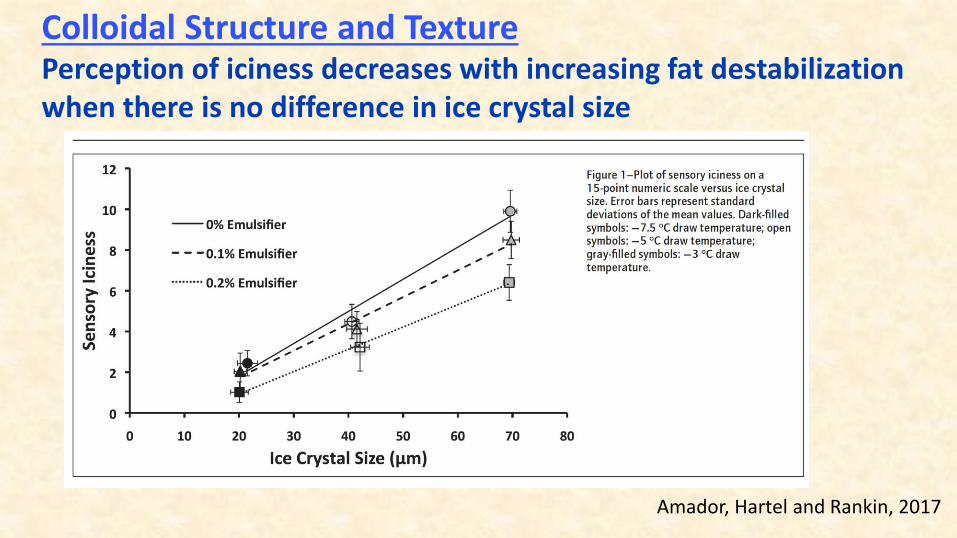
Colloidal Structure and TexturePerception of iciness decreases with increasing fat destabilization when there is no difference in ice crystal size

Amador, Hartel and Rankin, 2017

Amador, Hartel and Rankin, 2017
But, perception of greasiness can also increase with increasing fat destabilization
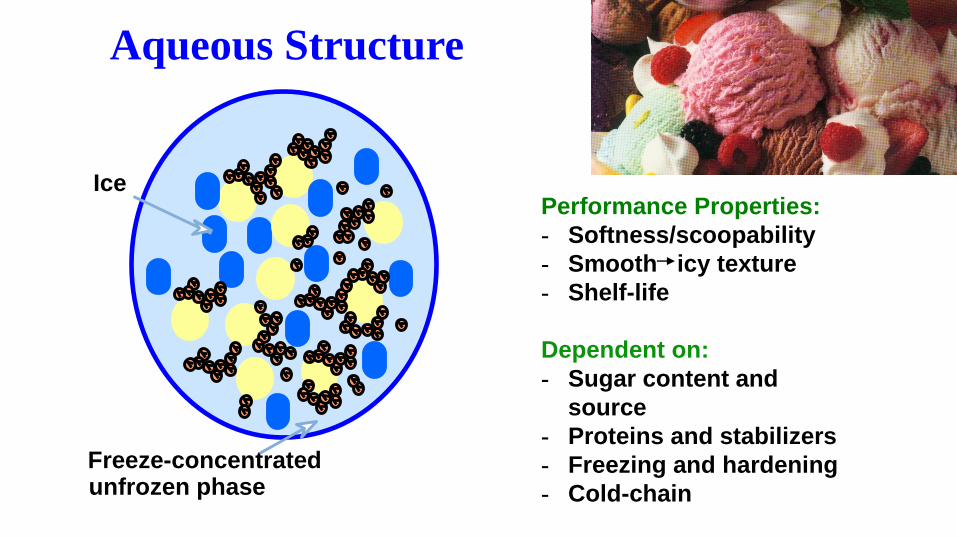
Ice
Freeze-concentrated unfrozen phase
Aqueous Structure
Performance Properties:
- Softness/scoopability
- Smooth icy texture
- Shelf-life
Dependent on:
- Sugar content and
source
- Proteins and stabilizers
- Freezing and hardening
- Cold-chain

60µm
Ice crystals in freshly
hardened ice creamFreeze-concentrated Unfrozen phase
• Solution of sugars, salts and soluble proteins
• Dispersion of casein micelles and stabilizers
• Expands and shrinks with temperature
• Can undergo glass transition at low temperature

Casein micelles in the unfrozen phase of ice cream
Ice Crystal
Air bubble
Fat

Food Freezing: conversion of water to ice
• Nucleation/seeding/growth - controls initial ice crystal size distribution (fast freezing and hardening)
– Small crystals: smooth texture
• Solute freeze-concentration - controls ice
phase volume
• Glass transition of the unfrozen phase
– Low temperature, long term stability
• Ice Recrystallization and Heat shock
– minimize water redistributionstabilizers
Sugars,
lactose
and salts
Freezing and
hardening
equipment
Pe
rce
nt
of
ice
cry
sta
ls l
ess
tha
n s
ize
on
th
e x
-ax
is
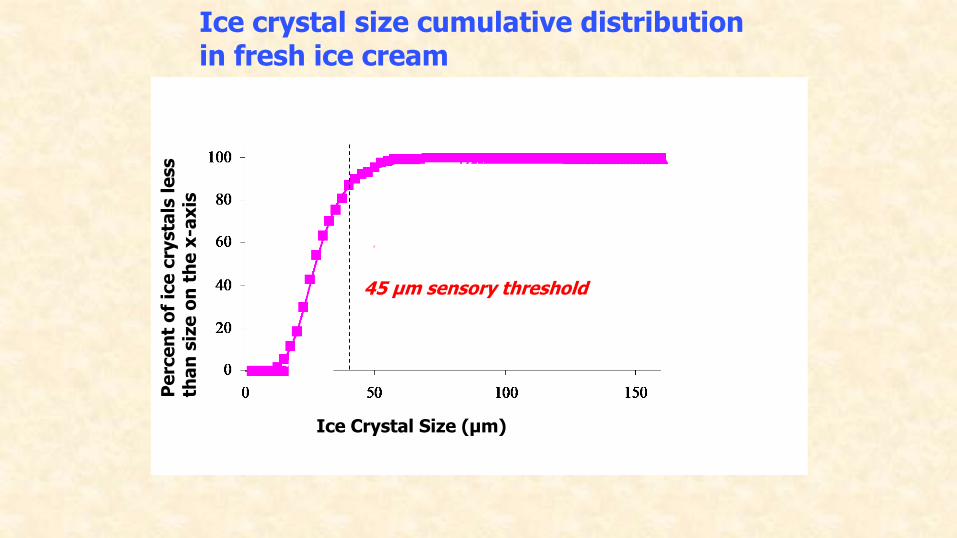
Ice Crystal Size (µm)
45 µm sensory threshold
Ice crystal size cumulative distribution in fresh ice cream
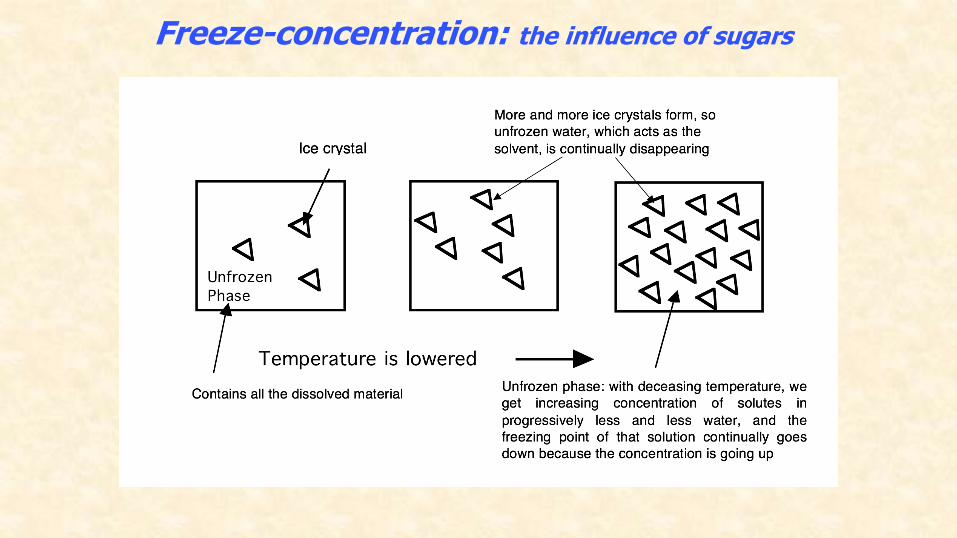
Freeze-concentration: the influence of sugars
Tem
pera
ture
0°C
Percentage of Water Frozen
20 40 60 80
-4
-8
-12
-16
-20
-24
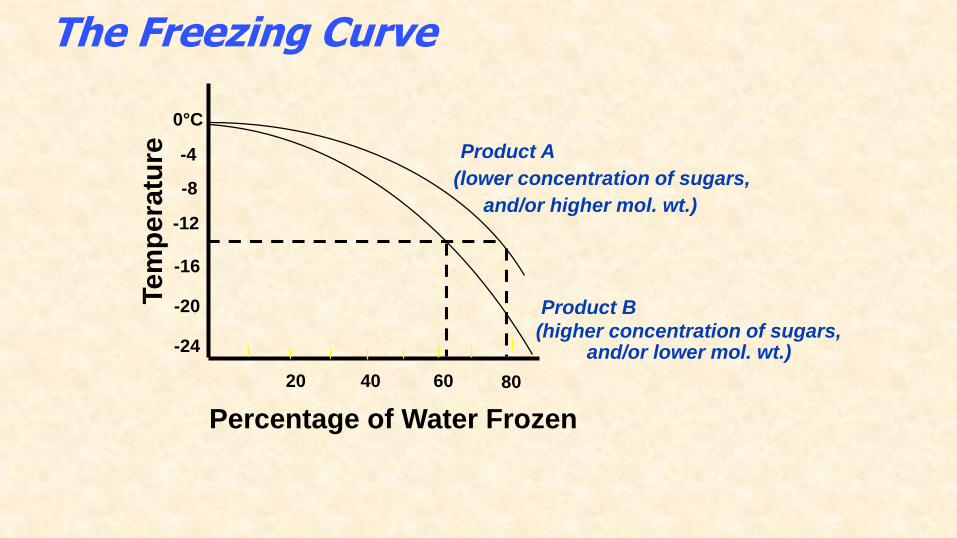
Product A
(lower concentration of sugars,
and/or higher mol. wt.)
Product B
(higher concentration of sugars,and/or lower mol. wt.)
The Freezing Curve

Recrystallization
Heat shock

Ice cream: the effects of heat shock
RecrystallizationAccretion
Caldwell and Goff, 1992
100 µm 100 µm
20 µmBefore After

Pe
rce
nt
of
ice
cry
sta
ls l
ess
tha
n s
ize
on
th
e x
-ax
is
Ice Crystal Size (µm)
Ice crystal size cumulative distribution in fresh and stored ice cream
-10°C/12 hrs; -20°C, 12 hrs
45 µm sensory threshold
Te
mp
era
ture
0°C
Percentage of Water Frozen
20 40 60 80
-4
-8
-12
-16
-20
-24
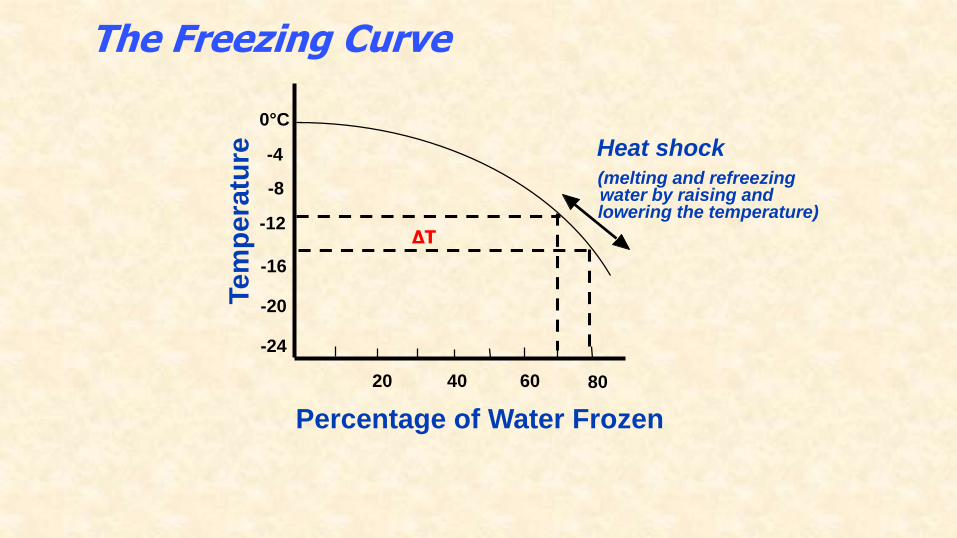
Heat shock(melting and refreezing water by raising and lowering the temperature)
The Freezing Curve
∆T
Te
mp
era
ture
0°C
Percentage of Water Frozen
20 40 60 80
-4
-8
-12
-16
-20
-24
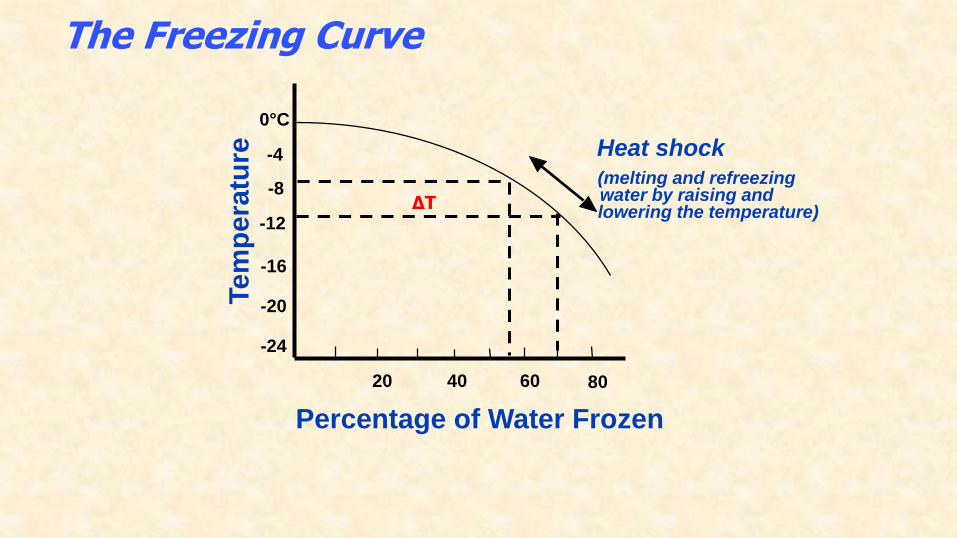
Heat shock(melting and refreezing water by raising and lowering the temperature)
The Freezing Curve
∆T

Russell et al., J. Food Eng., 39: 179-191 (1999).

Hagiwara and Hartel, 1996
Recrystallization rate depends on storage temperature, freeze-concentration and stabilizers!

806040200
0
2
4
6
8
10
12
14
16
Stabilized mix
Unstabilized Mix
Percent Water Removed
Ap
pare
nt
Vis
co
sit
y (
Pa
. s)
-12°-10°-8°-6°-4°-3° -7°-5°
Viscosity enhancement during freeze-concentration
Goff et al., J. Texture Studies, 26:517, 1995
Dilute solution
behaviour
Entanglemen
t and
concentrated
solution
behaviour
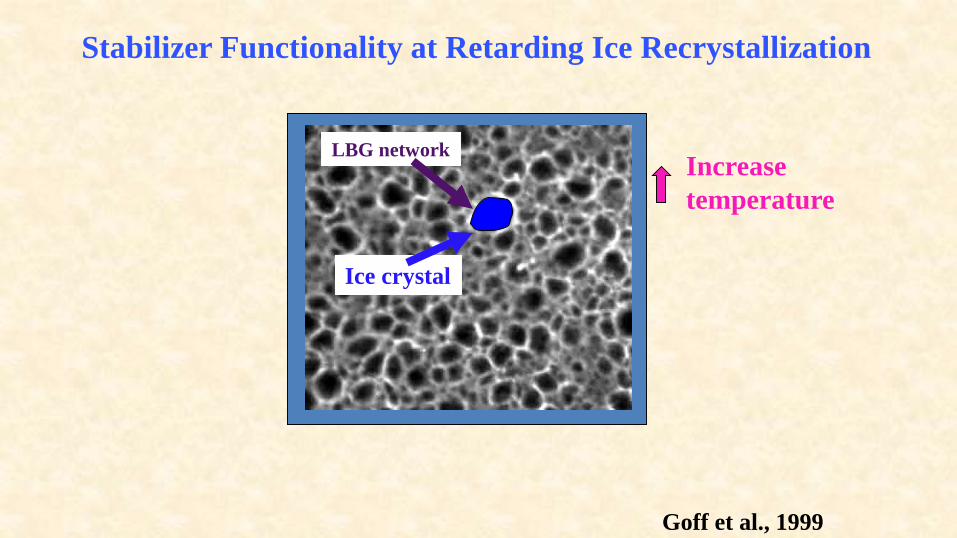
Increase
temperature
Ice crystal
LBG network
Goff et al., 1999
Stabilizer Functionality at Retarding Ice Recrystallization

Increase
temperature
Melted water
remains in close
proximity to the ice
crystal
LBG network
Ice crystal
Goff et al., 1999
Stabilizer Functionality at Retarding Ice Recrystallization

Increase
temperature
Ice crystal is not
completely melted.
Ice crystal
LBG network
Goff et al., 1999
Stabilizer Functionality at Retarding Ice Recrystallization

Ice crystal
Decrease
temperature
Water refreezes onto
crystal existing
within its pore rather
than migrating to the
surface of a larger
crystal elsewhere
LBG network
Goff et al., 1999
Stabilizer Functionality at Retarding Ice Recrystallization

Ice crystal
Decrease
temperature
Preservation of ice
crystal size
LBG network
Goff et al., 1999
Stabilizer Functionality at Retarding Ice Recrystallization

Ice Cream Shelf-Life
Ice
Cry
sta
l S
ize
Time (days)
45 µm
Low, constant temperature storage
Increasing rates of recrystallization
Large starting size
Sensory threshold
Critical shelf-life
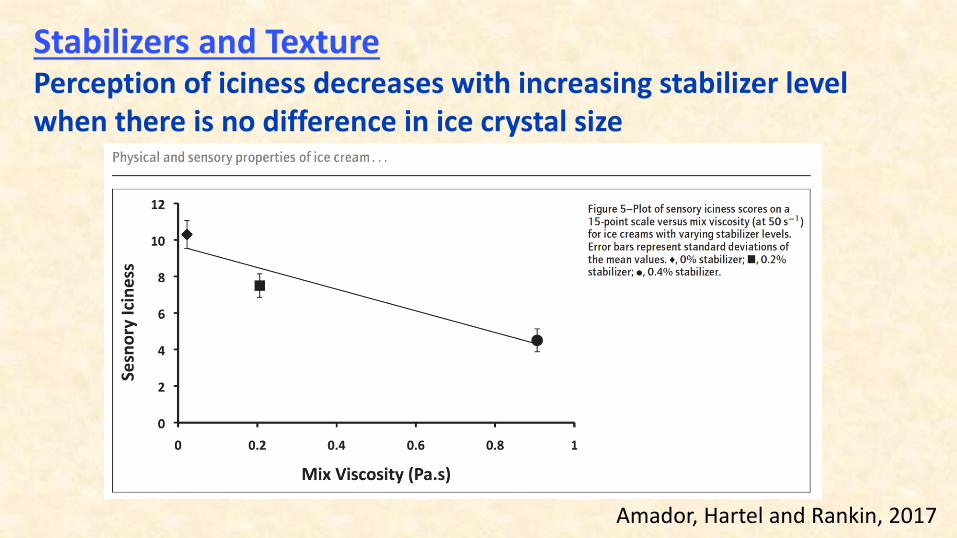
Amador, Hartel and Rankin, 2017
Stabilizers and TexturePerception of iciness decreases with increasing stabilizer level when there is no difference in ice crystal size

Dairy Foods, Sept., 2017
“Clean label refers to foods that are devoid of artificial flavors, colors and sweeteners, and synthetic additives.
Clean labels conveys notions of quality, trust and transparency to consumers.”
(A. Elizabeth Sloan, Food Technology)
Clean Label
Clean Label
• What does it mean for ice cream?
• Ingredients and ingredient functionalities :
– Traditional (fresh) sources of milk ingredients
– No hydrogenated fats
– No corn-derived sweeteners (GMO or HFCS), hydrogenated polyols or non-natural high-potency sweeteners
– Natural Stabilizers
– Natural Emulsifiers, e.g. eggs
– Natural Flavors and Colors

INGREDIENTS: Milk, Buttermilk, Sugar, Whey, Corn Syrup, Cream, Contains 2% or less of Mono & Diglycerides, Carob Bean Gum, Guar Gum, Natural and Artificial Flavors, Polysorbate 80, Carrageenan, Annatto for Color, Vitamin A Palmitate.
INGREDIENTS: Milk, Cream, Sugar, Buttermilk, Whey, Corn Syrup, Mono- And Diglycerides, Guar Gum, Sodium Phosphate, Cellulose Gum, Sodium Citrate, Polysorbate 80, Carrageenan, Natural Flavor, Annatto (For Color).
Random Vanilla ice cream labels from the US:

Cream, skim milk, sugar, egg yolks, vanilla extract.
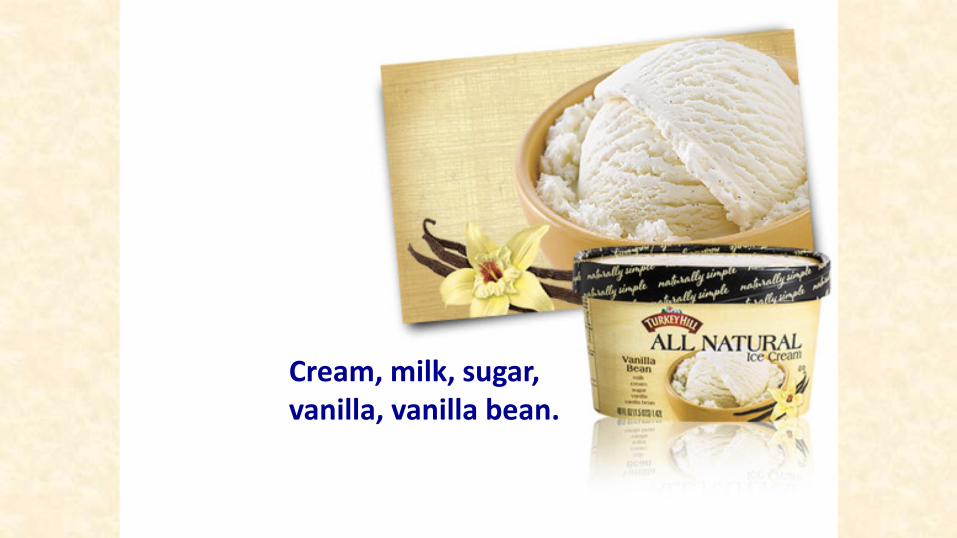
Cream, milk, sugar, vanilla, vanilla bean.

Milk, cream, sugar, tara gum, vanilla beans, natural flavor, natural vanilla flavor.
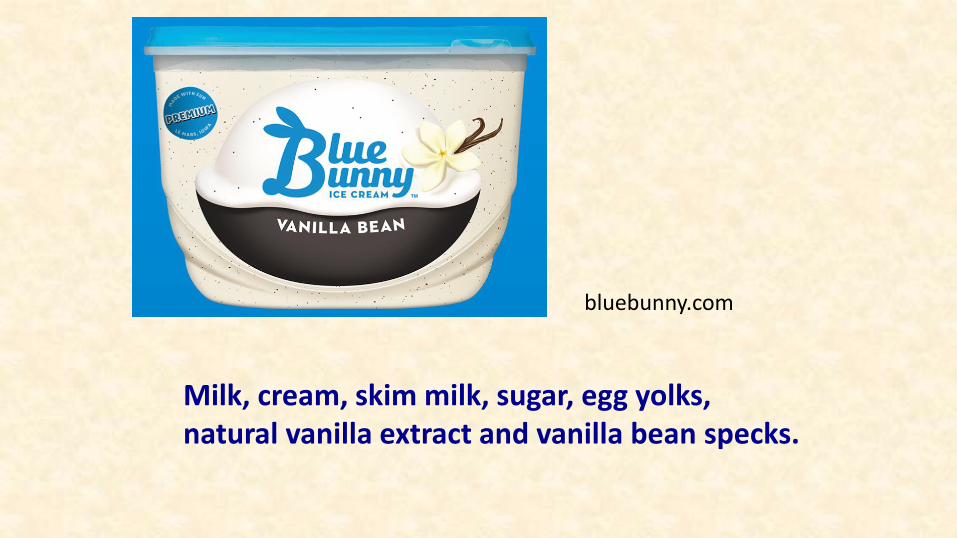
Milk, cream, skim milk, sugar, egg yolks, natural vanilla extract and vanilla bean specks.
bluebunny.com

Clean labelling and structure-enhancing strategies
Fat-structuring/Replacement of Emulsifiers• Egg yolk• Protein functionality – heat and shear-induced aggregation, high
pressure processing• Buttermilk powder, milk phospholipids (?)• Optimal ageing• Higher shear during whipping (faster dasher speed, solid dasher),
lower draw temperature
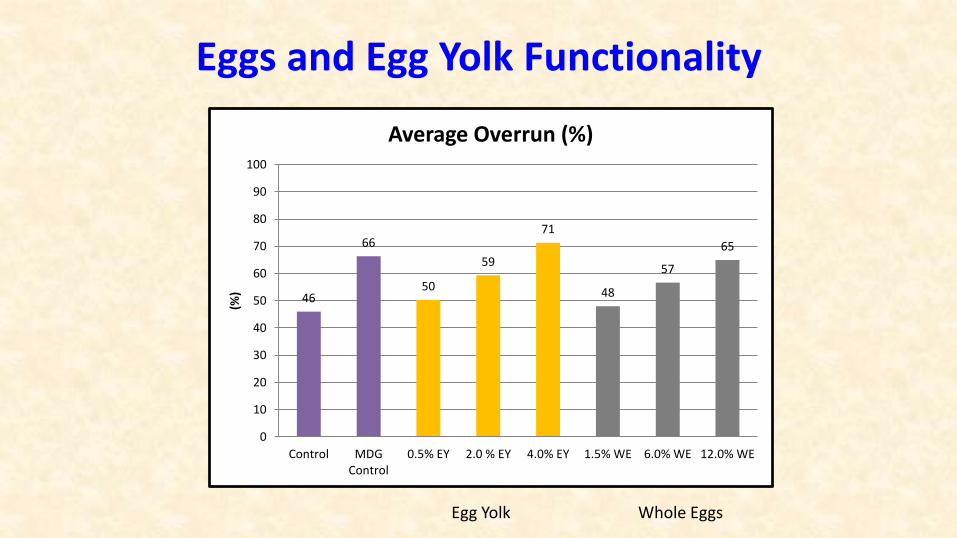
Eggs and Egg Yolk Functionality
46
66
50
59
71
48
57
65
0
10
20
30
40
50
60
70
80
90
100
Control MDGControl
0.5% EY 2.0 % EY 4.0% EY 1.5% WE 6.0% WE 12.0% WE
(%)
Average Overrun (%)
Egg Yolk Whole Eggs
1.5
8.8
2.7
5.6
10.0
0.0
6.16.5
0.0
2.0
4.0
6.0
8.0
10.0
12.0
Control MDGcontrol
0.5% EY 2.0 % EY 4.0 % EY 1.5 % WE 6.0 % WE 12.0 % WE
Fat Agglomeration Index (%)
Egg Yolk Whole Eggs
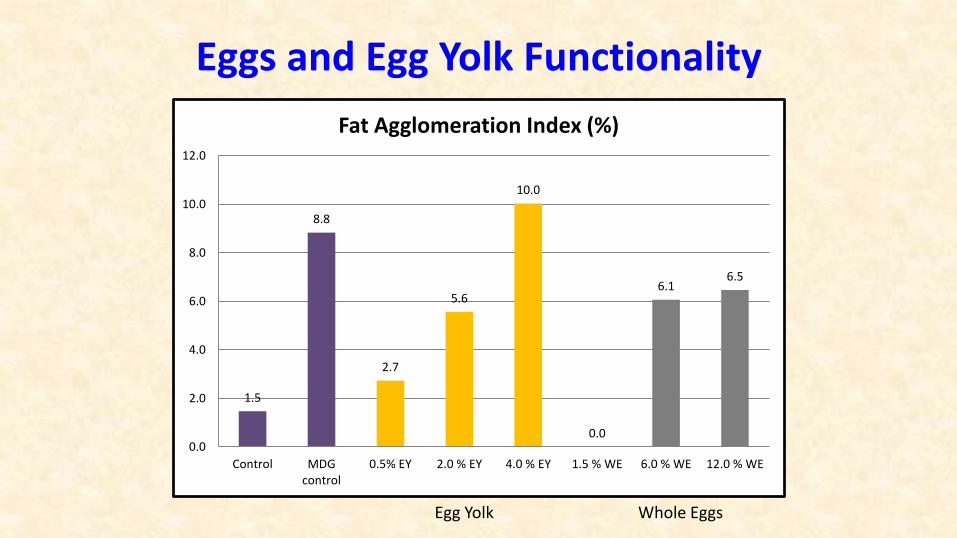
Eggs and Egg Yolk Functionality


Replacement of native whey proteins by a mixture of aggregated proteins and casein promoted a smaller air bubble size, a higher attachment of fat globules to the air bubble, and more aggregation of fat globules, despite a higher total adsorbed protein content.

Clean labelling and structure-enhancing strategies
Aqueous structure / Replacement of Non-natural Stabilizers• Single source natural (organic) guar or locust bean gum• Protein functionality• Low draw temperature, faster hardening• Minimize heat shock, tight control of cold chain


Tetra Pak® Continuous Freezer LT –low temperature second stage ice cream freezers
The “CREAM” Freezer
Low Temperature Extrusion

Clean labelling and structure-enhancing strategies
Aqueous Structure / Replacement of Sweeteners• Natural (organic)• Optimize sweetness and freezing point depression• Starch hydrolysate (glucose solids) functionality – milk proteins?

Conclusions
• The study of ice cream structure has allowed a much greater understanding of ingredient functionality and product performance.
• New formulations focusing on arising health concerns or clean labelling require structure-enhancing technologies; opportunities for new developments.