ibm operations analytics - log analysis: installation ... · providing feedback w e appr eciate...
TRANSCRIPT

IBM Operations Analytics - Log AnalysisVersion 1.3.2
Installation, Configuration, andAdministration Guide
IBM


IBM Operations Analytics - Log AnalysisVersion 1.3.2
Installation, Configuration, andAdministration Guide
IBM

NoteBefore using this information and the product it supports, read the information in “Notices” on page 489.
Edition notice
This edition applies to IBM Operations Analytics - Log Analysis and to all subsequent releases and modificationsuntil otherwise indicated in new editions.
References in content to IBM products, software, programs, services or associated technologies do not imply thatthey will be available in all countries in which IBM operates. Content, including any plans contained in content,may change at any time at IBM's sole discretion, based on market opportunities or other factors, and is notintended to be a commitment to future content, including product or feature availability, in any way. Statementsregarding IBM's future direction or intent are subject to change or withdrawal without notice and represent goalsand objectives only. Please refer to the developerWorks terms of use for more information.
© Copyright IBM Corporation 2015.US Government Users Restricted Rights – Use, duplication or disclosure restricted by GSA ADP Schedule Contractwith IBM Corp.

Contents
About this publication . . . . . . . . 1Audience . . . . . . . . . . . . . . . 1Publications . . . . . . . . . . . . . . 1
Accessing terminology online . . . . . . . . 1Accessibility . . . . . . . . . . . . . . 1Tivoli technical training. . . . . . . . . . . 1Providing feedback . . . . . . . . . . . . 2Conventions used in this publication . . . . . . 2
Typeface conventions . . . . . . . . . . 2
Installing . . . . . . . . . . . . . . 3Downloading Log Analysis . . . . . . . . . 3Prerequisites . . . . . . . . . . . . . . 3
IBM Prerequisite Scanner . . . . . . . . . 4Create a non-root user . . . . . . . . . . 4Recommended library installers . . . . . . . 5Verifying the operating system version . . . . 5Verifying the 64-bit library requirement . . . . 5Disabling Security-Enhanced Linux (SELinux) . . 5Verifying KornShell library . . . . . . . . 6Verifying the Python version . . . . . . . . 6Install python-simplejson package for Python . . 7Installing unzip utility . . . . . . . . . . 7Verifying the host server IP address and names. . 7Number of open files and virtual memory limits . 8Verifying the IP address and host nameconfigurations . . . . . . . . . . . . . 9Time server . . . . . . . . . . . . . 10
Installing . . . . . . . . . . . . . . . 10Installing with the IBM Installation Manager UI 10Installing with the IBM Installation Managercommand-line interface . . . . . . . . . 12Silently installing Log Analysis . . . . . . . 14Installing and configuring the IBM TivoliMonitoring Log File Agent . . . . . . . . 18
Installing on Linux on System z and Linux onSystem x based servers . . . . . . . . . . 18Verifying the version information . . . . . . . 20Removing IBM Operations Analytics - Log Analysis 20
Removing IBM Operations Analytics - LogAnalysis . . . . . . . . . . . . . . 20Using the console to remove IBM OperationsAnalytics - Log Analysis . . . . . . . . . 21Silently removing IBM Operations Analytics -Log Analysis . . . . . . . . . . . . . 22
Installing reference . . . . . . . . . . . . 23Configuration properties file. . . . . . . . 23Default ports . . . . . . . . . . . . . 24install.sh command . . . . . . . . . . . 25backup_restore.sh script . . . . . . . . . 26
Upgrading, backing up, and migratingdata . . . . . . . . . . . . . . . . 27Backup and migration limitations . . . . . . . 28Backing up data . . . . . . . . . . . . . 29
Restoring data . . . . . . . . . . . . . 30Updating remote logstash installations . . . . . 30
Configuring. . . . . . . . . . . . . 33Postinstallation configuration . . . . . . . . 33
Configuring the time zone for indexing . . . . 33Users and roles . . . . . . . . . . . . 34Security considerations . . . . . . . . . 41System . . . . . . . . . . . . . . . 56
Deploying content packs . . . . . . . . . . 78Deploying the Health and Performance contentpack . . . . . . . . . . . . . . . . 78Using rsyslog and syslog-ng with logstash andIBM Operations Analytics - Log Analysis . . . 81
Managing Insight Packs . . . . . . . . . . 83Supported versions for Insight Packs . . . . . 84Downloading an Insight Pack . . . . . . . 86Installing Insight Packs . . . . . . . . . 86Upgrading an Insight Pack . . . . . . . . 86Cloning source types for Insight Packs . . . . 87Out of the box Insight Packs. . . . . . . . 87Additional Insight Packs . . . . . . . . 150Custom Insight Packs . . . . . . . . . 194
Configuring alerts . . . . . . . . . . . . 194Configuring alerts in the Manage Alerts UI . . 196Configuring alerts for SNMP and EIF events 202Configuring email alert actions . . . . . . 207Example email alert . . . . . . . . . . 209
Configuring auditing . . . . . . . . . . . 209Audit parameters . . . . . . . . . . . 209Viewing the audit file . . . . . . . . . 210
Configuring Expert Advice Custom SearchDashboard . . . . . . . . . . . . . . 210
Customizing the default Expert Advice customCustom Search Dashboard . . . . . . . . 210Configuring a custom Expert Advice app . . . 212
Configuring launch in context . . . . . . . . 216Search UI launch-in-context . . . . . . . 216Custom Search Dashboard launch-in-context 216
Configuring the DSV toolkit . . . . . . . . 217What's new . . . . . . . . . . . . . 217Create an Insight Pack using the DSV toolkit 218Specifying properties for a log file type. . . . 218Generate a properties file . . . . . . . . 222Generate an Insight Pack . . . . . . . . 224Troubleshooting . . . . . . . . . . . 225Supported formats . . . . . . . . . . 225DSV formats . . . . . . . . . . . . 226
Configuring aliases . . . . . . . . . . . 227Configuring an alias . . . . . . . . . . 227
Configuration reference . . . . . . . . . . 228ldapRegistryHelper.properties . . . . . . 228ldapRegistryHelper.sh command . . . . . 229unity command . . . . . . . . . . . 230Configuration file parameters . . . . . . . 230
© Copyright IBM Corp. 2015 iii

eifutil.sh command . . . . . . . . . 232lfautil.sh command . . . . . . . . . 233Data Collector properties . . . . . . . . 233unity_securityUtility.sh command . . . . 234eif.conf file . . . . . . . . . . . . . 234unity.conf file . . . . . . . . . . . . 236install.sh command . . . . . . . . . . 237ssh_config.properties . . . . . . . . . . 238Audit parameters . . . . . . . . . . . 238Version utility . . . . . . . . . . . . 238Supported time zone names . . . . . . . 245
Loading and streaming data . . . . . . . . 258Configuring data streaming . . . . . . . 260Loading batches of data . . . . . . . . . 292Changing the default password for the DataCollector and EIF Receiver . . . . . . . . 300Installing logstash . . . . . . . . . . . 301
Loading and streaming data . . . . . 315Configuring data streaming . . . . . . . . 317
IBM Tivoli Monitoring Log File Agentconfiguration scenarios . . . . . . . . . 317Configuring the EIF Receiver . . . . . . . 335Configuring scalable data streaming frommultiple, remote sources. . . . . . . . . 339
Loading batches of data . . . . . . . . . . 349Generic Receiver . . . . . . . . . . . 349Batch loading historic log data with the DataCollector client . . . . . . . . . . . . 352Configuring the Data Collector client to ingestdata from remote hosts . . . . . . . . . 353Data Collector properties . . . . . . . . 354Loading batches of historic data with the IBMTivoli Monitoring Log File Agent . . . . . . 355Extending storage space available to ApacheSolr . . . . . . . . . . . . . . . 355Changing the default boundary for creatingApache Solr collections . . . . . . . . . 356
Changing the default password for the DataCollector and EIF Receiver . . . . . . . . . 356
Changing the default EIF Receiver or DataCollector password . . . . . . . . . . 356unity_securityUtility.sh command . . . . 357
Installing logstash . . . . . . . . . . . . 358Dependencies . . . . . . . . . . . . 359Installing logstash on a remote node . . . . 359logstash configuration . . . . . . . . . 361logstash operations . . . . . . . . . . 367logstash best practices . . . . . . . . . 368References . . . . . . . . . . . . . 368Known issues . . . . . . . . . . . . 368
Administrating . . . . . . . . . . . 371Getting started with Log Analysis . . . . . . 371
Logging in to IBM Operations Analytics - LogAnalysis . . . . . . . . . . . . . . 371Installing sample files . . . . . . . . . 372Enabling the GUI search history . . . . . . 372Defining a default search . . . . . . . . 373
Creating and updating the data model . . . . . 373
Data Sources workspace . . . . . . . . . 373Data Types workspace . . . . . . . . . 375
Administrative tasks . . . . . . . . . . . 389Configuring automatic refreshes for newdashboards . . . . . . . . . . . . . 389Configuring automatic refreshes for existingdashboards . . . . . . . . . . . . . 390Editing groups in the service topology JSON file 390Configuring the timeout for the Log Analysisserver . . . . . . . . . . . . . . . 392Adding or removing IBM Tivoli Monitoring LogFile Agent from an existing installation . . . . 392Managing the Hadoop service on datanodes . . 393Sharing a Hadoop cluster across multiple IBMOperations Analytics - Log Analysis instances . 394
Administrating data ingestion statistics . . . . . 394Server Statistics workspace . . . . . . . . 394export_statistics command . . . . . . . 394Configuring non-billable data sources . . . . 397
Deleting data . . . . . . . . . . . . . 398Deletion tool . . . . . . . . . . . . 400
Administering reference . . . . . . . . . . 400export_statistics command . . . . . . . 400delete.properties . . . . . . . . . . . 403
API guide . . . . . . . . . . . . . . 404Search REST API overview . . . . . . . . 404Search query API . . . . . . . . . . . 414Using the REST API to administer the LogAnalysis data model . . . . . . . . . . 416REST API for asynchronous searches . . . . 426
Loading and streaming data . . . . . 433Configuring data streaming . . . . . . . . 435
IBM Tivoli Monitoring Log File Agentconfiguration scenarios . . . . . . . . . 435Configuring the EIF Receiver . . . . . . . 453Configuring scalable data streaming frommultiple, remote sources. . . . . . . . . 457
Loading batches of data . . . . . . . . . . 467Generic Receiver . . . . . . . . . . . 467Batch loading historic log data with the DataCollector client . . . . . . . . . . . . 470Configuring the Data Collector client to ingestdata from remote hosts . . . . . . . . . 471Data Collector properties . . . . . . . . 472Loading batches of historic data with the IBMTivoli Monitoring Log File Agent . . . . . . 473Extending storage space available to ApacheSolr . . . . . . . . . . . . . . . 473Changing the default boundary for creatingApache Solr collections . . . . . . . . . 474
Changing the default password for the DataCollector and EIF Receiver . . . . . . . . . 474
Changing the default EIF Receiver or DataCollector password . . . . . . . . . . 474unity_securityUtility.sh command . . . . 475
Installing logstash . . . . . . . . . . . . 476Dependencies . . . . . . . . . . . . 477Installing logstash on a remote node . . . . 477logstash configuration . . . . . . . . . 479logstash operations . . . . . . . . . . 485
iv IBM Operations Analytics - Log Analysis: Installation, Configuration, and Administration Guide

logstash best practices . . . . . . . . . 486References . . . . . . . . . . . . . 486Known issues . . . . . . . . . . . . 486
Notices . . . . . . . . . . . . . . 489Trademarks . . . . . . . . . . . . . . 491
Terms and conditions for product documentation 491IBM Online Privacy Statement. . . . . . . . 492492Trademarks . . . . . . . . . . . . . . 492
Contents v

vi IBM Operations Analytics - Log Analysis: Installation, Configuration, and Administration Guide

About this publication
This guide contains information about how to use IBM® Operations Analytics - LogAnalysis.
AudienceThis publication is for users of the IBM Operations Analytics - Log Analysisproduct.
PublicationsThis section provides information about the IBM Operations Analytics - LogAnalysis publications. It describes how to access and order publications.
Accessing terminology onlineThe IBM Terminology Web site consolidates the terminology from IBM productlibraries in one convenient location. You can access the Terminology Web site at thefollowing Web address:
http://www.ibm.com/software/globalization/terminology.
AccessibilityAccessibility features help users with a physical disability, such as restrictedmobility or limited vision, to use software products successfully. In this release, theIBM Operations Analytics - Log Analysis user interface does not meet allaccessibility requirements.
Accessibility features
This information center, and its related publications, are accessibility-enabled. Tomeet this requirement the user documentation in this information center isprovided in HTML and PDF format and descriptive text is provided for alldocumentation images.
Related accessibility information
You can view the publications for IBM Operations Analytics - Log Analysis inAdobe Portable Document Format (PDF) using the Adobe Reader.
IBM and accessibility
For more information about the commitment that IBM has to accessibility, see theIBM Human Ability and Accessibility Center. The IBM Human Ability andAccessibility Center is at the following web address: http://www.ibm.com/able(opens in a new browser window or tab)
Tivoli technical trainingFor Tivoli® technical training information, refer to the following IBM TivoliEducation Web site at http://www.ibm.com/software/tivoli/education.
© Copyright IBM Corp. 2015 1

Providing feedbackWe appreciate your comments and ask you to submit your feedback to the IBMOperations Analytics - Log Analysis community.
Conventions used in this publicationThis publication uses several conventions for special terms and actions, operatingsystem-dependent commands and paths, and margin graphics.
Typeface conventionsThis publication uses the following typeface conventions:
Bold
v Lowercase commands and mixed case commands that are otherwisedifficult to distinguish from surrounding text
v Interface controls (check boxes, push buttons, radio buttons, spinbuttons, fields, folders, icons, list boxes, items inside list boxes,multicolumn lists, containers, menu choices, menu names, tabs, propertysheets), labels (such as Tip:, and Operating system considerations:)
v Keywords and parameters in text
Italic
v Citations (examples: titles of publications, diskettes, and CDsv Words defined in text (example: a nonswitched line is called a
point-to-point line)v Emphasis of words and letters (words as words example: "Use the word
that to introduce a restrictive clause."; letters as letters example: "TheLUN address must start with the letter L.")
v New terms in text (except in a definition list): a view is a frame in aworkspace that contains data.
v Variables and values you must provide: ... where myname represents....
Monospace
v Examples and code examplesv File names, programming keywords, and other elements that are difficult
to distinguish from surrounding textv Message text and prompts addressed to the userv Text that the user must typev Values for arguments or command options
2 IBM Operations Analytics - Log Analysis: Installation, Configuration, and Administration Guide

Installing
This section outlines the procedure that you must follow to install IBM OperationsAnalytics - Log Analysis. Details of prerequisites, the installation procedure, andadditional post-installation tasks are outlined in this section.
Note: You cannot install IBM Operations Analytics - Log Analysis on a NetworkFile System (NFS) based, shared resource.
Note:
If you want to install IBM Operations Analytics - Log Analysis on a system wherethe locale is not set to English United States, you need to set the locale of thecommand shell to export LANG=en_US.UTF-8 before you run any IBM OperationsAnalytics - Log Analysis scripts. For example, when you install IBM OperationsAnalytics - Log Analysis you need to run the following command to change thelocale before you run the unity.sh script:export LANG=en_US.UTF-8
Downloading Log AnalysisRead this document to get an overview of how to download Log Analysis fromPassport Advantage.1. Plan your installation. For more information, see About IBM Operations
Analytics - Log Analysis2. Review the prerequisites, including the hardware and software requirements.
For more information, see “Prerequisites.”3. Go to Passport Advantage at https://www.ibm.com/developerworks/
servicemanagement/ioa/log/downloads.html.4. Choose the type of installation.
IBM Operations Analytics - Log Analysis for Linux on System x86_64 or Linuxon System z®. For more information, see “Installing on Linux on System z andLinux on System x based servers” on page 18.To install IBM Operations Analytics - Log Analysis on Linux on System x86_64,download the IBM Operations Analytics - Log Analysis Linux 64 bit(CN6WVEN) package.To install IBM Operations Analytics - Log Analysis on Linux on System z,download the IBM Operations Analytics - Log Analysis Linux on System z 64bit (CN6WWEN) package.For more information about how to install the product, see “Installing.”
5. Complete the post-installation configuration. For more information, see“Postinstallation configuration” on page 33.
6. After you install IBM Operations Analytics - Log Analysis, you can configure itto meet your needs. For more information, see “Configuring” on page 33.
PrerequisitesBefore you install IBM Operations Analytics - Log Analysis, ensure that the systemmeets the hardware and software requirements and complete the prerequisitetasks.
© Copyright IBM Corp. 2015 3

IBM Prerequisite ScannerIBM Prerequisite Scanner is a prerequisite checking tool that analyzes systemenvironments before you install or upgrade IBM Operations Analytics - LogAnalysis.
The IBM Prerequisite Scanner compressed file is packaged with IBM OperationsAnalytics - Log Analysis.
Run the IBM Prerequisite Scanner as part of your installation planning before youinstall IBM Operations Analytics - Log Analysis.
Installing the IBM Prerequisite Scanner1. To install the IBM Prerequisite Scanner, select one of the following options:v Locate the IBM Prerequisite Scanner compressed file in the IBM Operations
Analytics - Log Analysis package.v Download the most recent scanner version for your operating system from
IBM Fix Central: http://www-933.ibm.com/support/fixcentral/swg/selectFixes?parent=ibm~Tivoli&product=ibm/Tivoli/Prerequisite+Scanner&release=All&platform=All&function=all
2. Extract the contents of the IBM Prerequisite Scanner compressed file to apreferred location as specified by ips_root on each target system that youintend to install IBM Operations Analytics - Log Analysis.
Note: You must have write permissions to the root directory in which youextract the contents of the compressed file.
Running the IBM Prerequisite Scanner1. Open the command window.2. Change the ips_root directory to the directory where the scanner is expanded.3. Set the value for the relevant environment variable to True. For example:
export ENV_NAME=True
4. Run the IBM Prerequisite Scanner script file, prereq_checker. For example:prereq_checker.sh "ILA 01320000" detail outputDir=<output_directory>
5. Check the output results of the scanner and resolve any failed checks.
For more information about the IBM Prerequisite Scanner, see the IBM PrerequisiteScanner wiki page: https://www.ibm.com/developerworks/community/wikis/home?lang=en#!/wiki/Tivoli%20Documentation%20Central/page/IBM%20Prerequisite%20Scanner
Create a non-root userYou must use a non-root user to install IBM Operations Analytics - Log Analysis.
Procedure
If you do not have a non-root user defined on your system, you must create one.To create this user, log in as a root user and run the command:useradd -m -d /home/<username> <username>
where -m creates a home directory for your user if one does not exist, -d is thepath to the home directory, and <username> is the user name that you want tocreate.
4 IBM Operations Analytics - Log Analysis: Installation, Configuration, and Administration Guide

Ensure that you have the necessary access rights so that you can add files to thelocation where you want to install IBM Operations Analytics - Log Analysis.
Recommended library installersThe following libraries are recommended for use with IBM Operations Analytics -Log Analysis.
The YUM (Yellow dog update, modified) package manager is recommended forinstalling the required libraries on Red Hat Enterprise Linux (RHEL).
The YaST (Yet another Setup Tool) tool is recommended for installing the requiredlibraries on SUSE Linux Enterprise Server (SLES).
Verifying the operating system versionIBM Operations Analytics - Log Analysis requires Red Hat Enterprise (RHEL) forLinux version 5, 6, or 7 or SUSE Linux Enterprise Server (SLES) version 11.
Procedurev To verify that the correct version of RHEL, is installed, log in as a root user and
enter the following command:cat /etc/redhat-release
Note: Red Hat Enterprise (RHEL) versions 5, 6, 7, and 7.1 are supported. If yourversion is not supported, you must upgrade to one of the supported versions.
v To verify that the correct version of SLES, is installed, log in as a root user andenter the following command:cat /etc/SuSE-release
If the version is not 11, you need to upgrade to that version.
Verifying the 64-bit library requirementFor Red Hat Enterprise Linux, IBM Operations Analytics - Log Analysis requiresthe 64-bit compat-libstdc++ library:
Procedure1. To determine if the required libraries are installed, run the command:
sudo /usr/bin/yum --noplugins list installed "libstdc++"
If this command indicates that the required libraries are installed, no additionalaction is required. For example:libstdc++.x86_64
2. If the required libraries are not installed, search the Red Hat Networkrepository to list the libraries that are available for your operating system:sudo /usr/bin/yum --noplugins search libstdc++
3. To install the required libraries, run this command:sudo /usr/bin/yum --noplugins install libstdc++.x86_64
Disabling Security-Enhanced Linux (SELinux)If SELinux is in enforcing mode, an exception occurs during the installation of IBMOperations Analytics - Log Analysis. Ensure that the SELinux policy is set to apermissive or disabled state. To disable the SELinux:
Installing 5

Procedure1. Log in as a root user.2. Edit the config file that is in the /etc/selinux/ directory.3. Change the SELINUXTYPE value to a permissive or disabled state. The possible
values are:
permissiveSELinux prints warnings instead of enforcing them.
disabledSELinux is fully disabled.
For example, to disable the kernel, change the value to disabled:SELINUX=disabled
4. Save your changes.5. Restart the operating system.
Verifying KornShell libraryVerify that the KornShell library is part of your operating system.
Procedure1. To verify that KornShell is part of your operating system, enter one of the
following commands:usr/bin/ksh
or/bin/ksh
2. If these commands do not work, enter the following command to confirm thatKornShell is installed:rpm -qa | grep kshksh-20100202-1.el5
3. If KornShell is not installed, download it and use the following command toinstall it:rpm -ivh ksh-<version>.rpm
where <version> is the version that you downloaded.
Verifying the Python versionPython Version 2.4.3 and 2.6.6 to 2.6.8 are supported by IBM Operations Analytics -Log Analysis.
If you did not use an rpm package to install Python, the IBM Operations Analytics- Log Analysis installer might not recognize it and a warning message might bedisplayed. This warning can be ignored and the installation continues.
To verify that you are using the correct version of Python, enter the followingcommand:rpm -qa | grep "^python-2"
If successful, the command returns the version of Python. For example:python-2.4.3-27.el5
If you are not using the correct version of Python, download and install it.
6 IBM Operations Analytics - Log Analysis: Installation, Configuration, and Administration Guide

Install python-simplejson package for PythonIBM Operations Analytics - Log Analysis requires Python Version 2.4.3 includingthe python-simplejson rpm or Python Version 2.6.6 to 2.6.8. If you use PythonVersion 2.4.3, you must also install the simple JSON rpm, python-simplejson.Python Version 2.6.6 to 2.6.8 include the required rpm.
Procedure1. Download the python-simplejson package from http://pkgs.org/centos-5-rhel-
5/centos-rhel-x86_64/python-simplejson-2.0.9-8.el5.x86_64.rpm/download/.2. Log in to the IBM Operations Analytics - Log Analysis server as a root user.3. Change directory to the folder that contains the package.4. Run the following command:
rpm -i python-simplejson-2.0.9-8.el5.x86_64.rpm
Installing unzip utilityYou must install the unzip utility on any servers where you install IBM OperationsAnalytics - Log Analysis or remote Indexing Engine.
Procedurev To install the utility on Red Hat Enterprise Linux (RHEL), log in as a root user
and run the following command:yum install unzip
v To install the utility on SUSE Enterprise Linux Server (SELS), log in as a rootuser and run the following command:zypper install unzip
Verifying the host server IP address and namesBefore you install IBM Operations Analytics - Log Analysis, you must ensure thatthe details for each host server are maintained correctly in the etc/hosts directoryon the target system.
About this task
If you do not complete this task, you may encounter issues when you log in or runa Custom Search Dashboard. For more information, see Cannot run Custom SearchDashboards after IP address change in the Troubleshooting Guide.
Procedurev For a server that uses a static IP address, define the static IP address and the
required values in the following format:IP LONG-HOSTNAME SHORT-HOSTNAME
For example:9.124.111.162 scaserver1.example.com scaserver1
v For a Dynamic Host Configuration Protocol (DHCP) server that uses a loop backIP address, define the loop back IP address and the required values in thefollowing format:LOOPBACK-IP LONG-HOSTNAME SHORT-HOSTNAME
For example:127.0.0.1 ibmscala.example.com ibmscala
Installing 7

Number of open files and virtual memory limitsUpdate your open files and virtual memory limits to match the recommendedvalues.
The recommended value of the ulimit -n setting, which governs number of openfiles that are allowed for a process, is 4096.
The recommended value of the ulimit -v setting, which governs the virtualmemory limit for a process, is unlimited.
For more information, see the Performance and Tuning Guide at:https://www.ibm.com/developerworks/community/wikis/home?lang=en#!/wiki/IBMLogAnalyticsBeta/page/PerformanceandTuningGuide
Changing the default number of open files limitThe recommended ulimit -n setting, which governs the number of open files thatare allowed for a process, is 4096 on each of the servers where a Indexing Enginenode is installed. To modify the number of files open limit, complete the followingsteps:
Procedure1. Log in to the server where a Indexing Engine node is installed using the
Indexing Engineuser id for that server.2. Run the following command in a terminal window:
ulimit -n
If the returned value is less than 4096, proceed to step 3. If the returned valueis more than 4096, proceed to step 7.
3. Log in to the server as the root user.4. Open the /etc/security/limits.conf file.5. Modify or add the following lines:
<user-id> hard nofile 4096<user-id> soft nofile 4096
where <user-id> is the user id used to install the Indexing Engine on theserver.To modify the value for all users on this server, modify or add the followinglines:* hard nofile 4096* soft nofile 4096
6. Save your changes.7. Repeat for each Indexing Engine instance.
What to do next
To ensure that the changes are updated, restart IBM Operations Analytics - LogAnalysis.
Changing the virtual memory limitThe recommended ulimit -v setting, which limits the virtual memory forprocesses, is unlimited on each of the servers where a Indexing Engine node isinstalled. To modify the limit, complete the following steps:
8 IBM Operations Analytics - Log Analysis: Installation, Configuration, and Administration Guide

Procedure1. Log in to the server where a Indexing Engine node is installed using the
Indexing Engine user id for that server.2. Run the following command in a terminal window:
ulimit -v
If the returned value is not unlimited, proceed to step 3. If the returned valueis unlimited, proceed to step 7.
3. Log in to the server as the root user.4. Open the /etc/security/limits.conf file.5. Modify or add the following lines:
<user-id> hard as unlimited<user-id> soft as unlimited
where <user-id> is the user id used to install the Indexing Engine on theserver.To modify the value for all users on this server, modify or add the followinglines:* hard as unlimited* soft as unlimited
6. Save your changes.7. Repeat for each Indexing Engine instance.
What to do next
To ensure that the changes are updated, restart IBM Operations Analytics - LogAnalysis.
Verifying the IP address and host name configurationsYou need to verify that the IP address and host name settings are configuredcorrectly.
Procedure1. To verify that the host name is configured correctly, enter the following
command:hostname
If it is configured correctly, the command returns the host name. For example:example
2. To verify that the host name uses the fully qualified host name, enter thefollowing command:hostname -f
If successful, the command returns the fully qualified host name. For example:example.ibm.com
3. To confirm that the IP address is configured correctly, ping the host name:ping example
If successful, the IP address is returned.
Installing 9

Time serverTo ensure that some of the features of IBM Operations Analytics - Log Analysiswork correctly, you need to set up a time keeping server.
Some features of IBM Operations Analytics - Log Analysis use relative time such asdays, weeks, or months. This time is calculated from the time on the server onwhich IBM Operations Analytics - Log Analysis is installed. To ensure that thesefeatures generate correct results, you must ensure that the time on the IBMOperations Analytics - Log Analysis server is correct. You can use a time server tosynchronize the time on the IBM Operations Analytics - Log Analysis server withthe correct time. You must do this before you install IBM Operations Analytics -Log Analysis.
InstallingBefore you use the command-line interface, the Installation Manager UI, or a silentinstallation to install IBM Operations Analytics - Log Analysis, read theprerequisites.
Log Analysis includes IBM Installation Manager Version 1.8.2. You can use thisversion to install Log Analysis immediately. You can also use an existing version ofIBM Installation Manager to install Log Analysis. For more information, see theproduct documentation at http://www-01.ibm.com/support/knowledgecenter/SSDV2W/im_family_welcome.html.
Prerequisitesv Ensure that you complete all the prerequisites. For more information, see
Prerequisite tasks.v Ensure that your user has the access rights that are required to add files to the
location where you want to install IBM Operations Analytics - Log Analysis.v If you previously installed IBM Tivoli Monitoring Log File Agent 6.3 or lower,
the installation fails. To solve this problem, stop the existing IBM TivoliMonitoring Log File Agent installation or rename the folder that was createdwhen it was installed. For detailed information, see the topic about theinstallation failure if IBM Tivoli Monitoring Log File Agent was installed in theTroubleshooting IBM Operations Analytics - Log Analysis guide.
v Before you install IBM Operations Analytics - Log Analysis, you must ensurethat the details for each host server are maintained correctly in the /etc/hostsdirectory on the target system. Failure to complete this task can result in Oautherrors when you run a Custom Search Dashboard. For more information, see“Verifying the IP address and host name configurations” on page 9.
v Ensure that IBM Installation Manager is not configured to search the servicerepositories. If the server is not connected to the internet, this setting can causethe installation to fail or stall.
v For more information about IBM Installation Manager, see the IBM KnowledgeCenter at https://www-01.ibm.com/support/knowledgecenter/SSDV2W/im_family_welcome.html.
Installing with the IBM Installation Manager UIYou must complete the following steps to install Log Analysis using the IBMInstallation Manager User Interface (UI).
10 IBM Operations Analytics - Log Analysis: Installation, Configuration, and Administration Guide

Before you beginv Ensure that the Search service repositories during installation and updates
check box is not selected. If you do select this check box and the server is notconnected to the internet, the installation can stall or fail.
About this task
When you run the installation script, Log Analysis and IBM Installation Managerare installed. IBM Installation Manager Version 1.8.2 is installed when you installLog Analysis. Where necessary, Log Analysis upgrades the currently installedversion of IBM Installation Manager.
Note: The installation path accepts ASCII characters only. Other characters, such asnative language characters are not supported.
Procedure1. Copy and extract the installation archive to a location on your server.2. From the directory to which you extracted the installation files, run the
command:./install.sh
Note: Add a -c parameter to start the installation in console only mode. Formore information, see “Installing with the IBM Installation Managercommand-line interface” on page 12.
Note: To install Log Analysis on a remote server using GUI mode, ensure thatvirtual desktop software is installed on the server that you want to install LogAnalysis on.
3. The Install Packages screen is displayed.4. To install Log Analysis in the default directory, click Next. To install Log
Analysis to a different location, click Browse, select an alternative location,and click Next.
5. To continue, accept the license agreement, and click Next.6. To accept the default IBM Tivoli Monitoring Log File Agent, Indexing Engine,
and Log Analysis options, click Next.
Note: If you cannot install the IBM Tivoli Monitoring Log File Agent or thecheck box is grayed out, you are either missing some of the prerequisites orthe IBM Tivoli Monitoring Log File Agent is already installed on the sameserver. You need to complete one of the following actions:v Check that you have meet all the required prerequisites.v If you do not want to use the existing IBM Tivoli Monitoring Log File
Agent, you can stop the install and remove it.v If you want to use the IBM Tivoli Monitoring Log File Agent to load data
into Log Analysis, you can continue with the installation, after youcomplete it, you need to configure the IBM Tivoli Monitoring Log FileAgent.
7. The default ports that are used by Log Analysis are displayed. Accept thedefault option if these ports are not in use by any other application or changethem if necessary. Click Next.
8. If you want to install a local Indexing Engine instance, ensure that the ApacheSolr check box is selected. The check box is selected by default. If you want touse a local Indexing Engine installation, you must install it now. You cannot
Installing 11

install it after the Indexing Engine is installed. However, you can installinstances of Indexing Engines on remote servers after the installation iscompleted. To enable search and indexing, you must install at least oneIndexing Engine instance locally or remotely.
9. Review the summary information that is provided for the installation andclick Install.
10. To complete the installation click Finish.
What to do next
Download a license for IBM Operations Analytics - Log Analysis from PassportAdvantage® at http://www-01.ibm.com/software/lotus/passportadvantage/ andcomplete the steps that are outlined in the readme file.
To verify that the installation is complete, log in to Log Analysis.
To install Indexing Engines on remote servers, you can create them after you installLog Analysis.
If you do not verify the server details as described in the Prerequisites topic, thefollowing error message is displayed when you try to run a Custom SearchDashboard:Failed to launch. Could not retrieve OAuth access token.
To correct this error, you must ensure that the server details are correct and startthe installation again. For more information, see Could not retrieve Oauth access tokenin the Troubleshooting section.Related concepts:“Prerequisites” on page 3Before you install IBM Operations Analytics - Log Analysis, ensure that the systemmeets the hardware and software requirements and complete the prerequisitetasks.“Installing and configuring the IBM Tivoli Monitoring Log File Agent” on page 18When you install IBM Operations Analytics - Log Analysis, you can also choose toinstall the IBM Tivoli Monitoring Log File Agent that is delivered with the product.
“Logging in to IBM Operations Analytics - Log Analysis” on page 371This topic outlines how to log in to IBM Operations Analytics - Log Analysis andhow to change the default username and password.Related tasks:“Installing Apache Solr on remote machines” on page 69After you install IBM Operations Analytics - Log Analysis, you can use the ApacheSolr remote installer to install Apache Solr on a remote machine.
Installing with the IBM Installation Manager command-lineinterface
You can use the IBM Installation Manager command-line interface. to install LogAnalysis.
Before you beginv Do not enter Control -C to cancel the installation because this setting can cause
the installer to behave inconsistently. Instead, to cancel the installation, enter cwhen prompted.
12 IBM Operations Analytics - Log Analysis: Installation, Configuration, and Administration Guide

About this task
When you run the installation script, Log Analysis and IBM Installation Managerare installed. IBM Installation Manager Version 1.8.2 is installed when you installLog Analysis. Where necessary, Log Analysis upgrades the currently installedversion of IBM Installation Manager.
Note: The installation path accepts ASCII characters only. Other characters, such asnative language characters are not supported.
Procedure1. Copy and extract the installation archive to a location on your server.2. To install Log Analysis:
a. From the directory location of the extracted installation files, run thecommand:./install.sh -c
b. Select the default IBM Log File Agent, Indexing Engine, and Log Analysispackages.
Note: If you cannot install the IBM Tivoli Monitoring Log File Agent or thecheck box is grayed out, you are either missing some of the prerequisites orthe IBM Tivoli Monitoring Log File Agent is already installed on the sameserver. You need to complete one of the following actions:v Check that you have meet all the required prerequisites.v If you do not want to use the existing IBM Tivoli Monitoring Log File
Agent, you can stop the install and remove it.v If you want to use the IBM Tivoli Monitoring Log File Agent to load data
into Log Analysis, you can continue with the installation, after youcomplete it, you need to configure the IBM Tivoli Monitoring Log FileAgent.
c. Accept the license agreement.d. If required, change the installation location. Otherwise, accept the default
location.e. Choose the Log Analysis feature and, if required, the IBM Tivoli Monitoring
Log File Agent feature.f. If necessary, change the default port numbers. Otherwise, accept the default
ports.g. To install a local Indexing Engine instance, ensure that Apache Solr is
selected. Apache Solr is selected by default. To use a local Indexing Engineinstallation, you must install it now. You cannot install it after the IBMOperations Analytics - Log Analysis is installed. However, you can installIndexing Engine instances on remote machines after the installation iscompleted. To enable search and indexing, you must install at least oneIndexing Engine instance locally or remotely.
h. If you want to generate an installation response file for future silentinstallations, select Generate an Installation Response File.
i. When the installation is complete, select Finish.3. To check the details of the installation, choose View Installed Packages.
Installing 13

What to do next
Download a license for IBM Operations Analytics - Log Analysis from PassportAdvantage at http://www-01.ibm.com/software/lotus/passportadvantage/ andcomplete the steps that are outlined in the readme file.
To verify that the installation is complete, log in to Log Analysis.
To install Indexing Engines on remote servers, you can create them after you installLog Analysis.
If you do not verify the server details as described in the Prerequisites topic, thefollowing error message is displayed when you try to run a Custom SearchDashboard:Failed to launch. Could not retrieve OAuth access token.
To correct this error, you must ensure that the server details are correct and startthe installation again. For more information, see Could not retrieve Oauth access tokenin the Troubleshooting section.Related concepts:“Prerequisites” on page 3Before you install IBM Operations Analytics - Log Analysis, ensure that the systemmeets the hardware and software requirements and complete the prerequisitetasks.“Installing and configuring the IBM Tivoli Monitoring Log File Agent” on page 18When you install IBM Operations Analytics - Log Analysis, you can also choose toinstall the IBM Tivoli Monitoring Log File Agent that is delivered with the product.
“Logging in to IBM Operations Analytics - Log Analysis” on page 371This topic outlines how to log in to IBM Operations Analytics - Log Analysis andhow to change the default username and password.Related tasks:“Installing Apache Solr on remote machines” on page 69After you install IBM Operations Analytics - Log Analysis, you can use the ApacheSolr remote installer to install Apache Solr on a remote machine.
Silently installing Log AnalysisYou can install Log Analysis silently by using the sample response file that isprovided with the product. This automates the installation procedure.
Before you beginv Download and extract the Log Analysis installation archive. The archive contains
the product files and a sample response file, sample_smcl_silent_install.xml,that is required for silent installation.
Note: A silent installation can fail if the IBM Installation Manager repositorychanged since the last installation or uninstall. This problem can occur even whenyou update the response file with the correct repository location. If you areinstalling from a new repository, remove or close any old repository connections.
Note: If you cannot install the IBM Tivoli Monitoring Log File Agent or the checkbox is grayed out, you are either missing some of the prerequisites or the IBMTivoli Monitoring Log File Agent is already installed on the same server. You needto complete one of the following actions:
14 IBM Operations Analytics - Log Analysis: Installation, Configuration, and Administration Guide

v Check that you have meet all the required prerequisites.v If you do not want to use the existing IBM Tivoli Monitoring Log File Agent,
you can stop the install and remove it.v If you want to use the IBM Tivoli Monitoring Log File Agent to load data into
Log Analysis, you can continue with the installation, after you complete it, youneed to configure the IBM Tivoli Monitoring Log File Agent.
About this task
When you run the installation script, Log Analysis and IBM Installation Managerare installed. IBM Installation Manager Version 1.8.2 is installed when you installLog Analysis. Where necessary, Log Analysis upgrades the currently installedversion of IBM Installation Manager.
Note: The installation path accepts ASCII characters only. Other characters, such asnative language characters are not supported.
Silently installing Log Analysis involves modifying the sample response file andthen calling IBM Installation Manager from the command line or from a script toinstall the product. IBM Installation Manager obtains the installation settings fromthe response file.
Procedure
To silently install Log Analysis:1. Copy the sample response file to a suitable local directory (for example, your
home directory). Use a suitable name for the local response file, for example:smcl_silent_install.xml
2. Modify the response file to suit your environment:a. Locate the line and edit this line to reflect your home directory:
<preference name=’com.ibm.cic.common.core.preferences.eclipseCache’value=’/home/MYUSERID/IBM/IBMIMShared’/>
where /home/MYUSERID is the location of your home directory.b. Locate and edit these lines to specify the directory where you extracted the
installation image:<repository location=’/home/MYUSERID/IMAGEDIRECTORY/im.linux.x86’/><repository location=’/home/MYUSERID/IMAGEDIRECTORY’/>
where /home/MYUSERID is your home directory and IMAGEDIRECTORY is thename of the directory to which you extracted the installation package.
Note: The paths that are given assume that you extracted the installationpackage to your home directory.
c. Locate and edit these lines to reflect your home directory:<profile id=’IBM Installation Manager’ installLocation=’/home/MYUSERID/IBM/InstallationManager/eclipse’ kind=’self’><data key=’eclipseLocation’ value=’/home/MYSERUSERID/IBM/InstallationManager/eclipse’/>
and<profile id=’IBM Log Analytics’installLocation=’/home/MYUSERID/IBM/LogAnalysis’>
and
Installing 15

<data key=’eclipseLocation’ value=’/home/MYUSERID/IBM/LogAnalysis’/>
where /home/MYUSERID is the location of your home directory.d. Optional: If necessary, change the following default port numbers:
Note: Default port numbers are used by Log Analysis, only modify thevalues if necessary.<!-- Application WebConsole Port --><data key=’user.unity.port.number,com.ibm.tivoli.scloganalytics’value=’9988’/><!-- Application WebConsole Secure Port --><data key=’user.unity.secureport.number,com.ibm.tivoli.scloganalytics’value=’9987’/><!-- Database Server Port --><data key=’user.database.port.number,com.ibm.tivoli.scloganalytics’value=’1627’/><!-- Data Collection Server Port --><data key=’user.eif.port.number,com.ibm.tivoli.scloganalytics’value=’5529’/><!-- ZooKeeper Port --><data key=’user.zookeeper.port.number,com.ibm.tivoli.scloganalytics’value=’12181’/><!-- Apache Solr Search Port --><data key=’user.searchengine.port.number,com.ibm.tivoli.scloganalytics’value=’9983’/><!-- Apache Solr Stop Port --><data key=’user.searchengineQS.port.number,com.ibm.tivoli.scloganalytics’value=’7205’/>
e. Save your changes.3. Optional: To exclude IBM Tivoli Monitoring Log File Agent from the
installation, remove the LOG_FILE_AGENT parameter from the offering idelement.For example, change the following default entry:<offering id=’com.ibm.tivoli.scloganalytics’profile=’IBM Log Analytics’features=’IBM Log Analytics,LOG_FILE_AGENT’installFixes=’none’/>
to:<offering id=’com.ibm.tivoli.scloganalytics’profile=’IBM Log Analytics’features=’IBM Log Analytics’installFixes=’none’/>
4. Optional: To exclude Indexing Engine, remove the Data Explorer Applicationparameter from the offering id element.For example, change the following default entry:<offering id=’com.ibm.tivoli.scloganalytics’profile=’IBM Log Analytics’features=’IBM Log Analytics,LOG_FILE_AGENT,
Data Explorer Application’installFixes=’none’/>
to:<offering id=’com.ibm.tivoli.scloganalytics’profile=’IBM Log Analytics’features=’IBM Log Analytics, LOG_FILE_AGENT,’installFixes=’none’/>
5. If you already have IBM Installation Manager installed, use this command tostart the silent installation:
16 IBM Operations Analytics - Log Analysis: Installation, Configuration, and Administration Guide

~/IBM/InstallationManager/eclipse/tools/imcl -s -input<HOME_DIR>/smcl_silent_install.xml -sVP -acceptLicense
Where <HOME_DIR> is the directory where you stored the response file.If you do not have IBM Installation Manager installed, use the install.shcommand to install both IBM Installation Manager and Log Analysis. From thedirectory to which you extracted the installation archive, run the command:./install.sh -s <HOME_DIR>/smcl_silent_install.xml
where <HOME_DIR> is your home directory. This command silently installsLog Analysis and IBM Installation Manager Version 1.8.2, if no other version ofIBM Installation Manager is installed.
Results
The progress of the installation is displayed in an IBM Installation Managerconsole. To install without displaying the console, leave out the -sVP option (whichshows Verbose Progress).
What to do next
Download a license for IBM Operations Analytics - Log Analysis from PassportAdvantage at http://www-01.ibm.com/software/lotus/passportadvantage/ andcomplete the steps that are outlined in the readme file.
To verify that the installation is complete, log in to Log Analysis.
To install Indexing Engines on remote servers, you can create them after you installLog Analysis.
If you do not verify the server details as described in the Prerequisites topic, thefollowing error message is displayed when you try to run a Custom SearchDashboard:Failed to launch. Could not retrieve OAuth access token.
To correct this error, you must ensure that the server details are correct and startthe installation again. For more information, see Could not retrieve Oauth access tokenin the Troubleshooting section.Related concepts:“Prerequisites” on page 3Before you install IBM Operations Analytics - Log Analysis, ensure that the systemmeets the hardware and software requirements and complete the prerequisitetasks.“Installing and configuring the IBM Tivoli Monitoring Log File Agent” on page 18When you install IBM Operations Analytics - Log Analysis, you can also choose toinstall the IBM Tivoli Monitoring Log File Agent that is delivered with the product.
“Logging in to IBM Operations Analytics - Log Analysis” on page 371This topic outlines how to log in to IBM Operations Analytics - Log Analysis andhow to change the default username and password.Related tasks:“Installing Apache Solr on remote machines” on page 69After you install IBM Operations Analytics - Log Analysis, you can use the ApacheSolr remote installer to install Apache Solr on a remote machine.
Installing 17

Installing and configuring the IBM Tivoli Monitoring Log FileAgent
When you install IBM Operations Analytics - Log Analysis, you can also choose toinstall the IBM Tivoli Monitoring Log File Agent that is delivered with the product.
After you install the IBM Tivoli Monitoring Log File Agent during the LogAnalysis installation, you need to configure it. This type of IBM Tivoli MonitoringLog File Agent is referred to as an internal IBM Tivoli Monitoring Log File Agent.
If you chose not to install the IBM Tivoli Monitoring Log File Agent during theLog Analysis installation because you want to use an existing IBM TivoliMonitoring Log File Agent to load data into Log Analysis, you need to configureyour IBM Tivoli Monitoring Log File Agent to work with Log Analysis. This typeof IBM Tivoli Monitoring Log File Agent is referred to as an external IBM TivoliMonitoring Log File Agent.Related concepts:“IBM Tivoli Monitoring Log File Agent configuration scenarios” on page 261You can use the internal IBM Tivoli Monitoring Log File Agent that is installedwith IBM Operations Analytics - Log Analysis or you can use an external IBMTivoli Monitoring Log File Agent to stream data from local or remote servers.
Installing on Linux on System z and Linux on System x based serversBefore you can install IBM Operations Analytics - Log Analysis on a Linux onSystem z or Linux on System x based operating system, read and complete theprerequisites.
Hardware requirements
Linux on System z runs on System z based hardware. Linux on System x runs onIntel or AMD-based hardware. Both types of hardware are supported but there aresome minor differences in the software requirements.
Note: If you install IBM Operations Analytics - Log Analysis on Intel orAMD-based hardware, you must install IBM Operations Analytics - Log Analysiscomponents like the Indexing Engine server on Intel or AMD-based hardware. Youcannot install IBM Operations Analytics - Log Analysis components on Linux onSystem z based hardware. Likewise, if you install IBM Operations Analytics - LogAnalysis on Linux on System z based hardware, you must install IBM OperationsAnalytics - Log Analysis components like the Indexing Engine server on System zbased hardware.
For more information about the hardware requirements, see Hardware andsoftware requirements.
Prerequisites
For more information about the prerequisite tasks that you must complete, see“Prerequisites” on page 3.
Supported operating systems for cross-platform data ingestion
You can choose one of the following methods for loading data into IBM OperationsAnalytics - Log Analysis:
18 IBM Operations Analytics - Log Analysis: Installation, Configuration, and Administration Guide

1. Using the internal IBM Tivoli Monitoring Log File Agent that is bundled withIBM Operations Analytics - Log Analysis to stream data.
2. Using an external IBM Tivoli Monitoring Log File Agent which you installseparately to stream data.
3. Using the z/OS® Log Forwarder that is bundled with the z/OS Insight Packs.4. Using the data collector client or FTP to load a batch of data.
Each of these scenarios offers varying cross-platform support as outlined in thefollowing table:
Table 1. Supported operating systems for data loading scenarios
Data loading scenario Supported operating systems
1 See the Supported Operating Systems sectionin “Loading and streaming data” on page258
2 See the Requirements for the monitoring agenttopic documentation for your version of IBMTivoli Monitoring at:https://www.ibm.com/developerworks/community/wikis/home?lang=en#!/wiki/Tivoli%20Documentation%20Central/page/Tivoli%20Monitoring
3 See the System requirements for the z/OS LogForwarder topic in the productdocumentation that is linked in the InsightPacks section
4 See the Supported Operating Systems sectionin “Loading and streaming data” on page258
Note:
The remote installer that you use to install instances of the IBM Tivoli MonitoringLog File Agent and the Tivoli Event Integration Facility does not support crossoperating system integration. You must use the remote installers to install remoteinstances on servers that use the same operating system. For example, if you installIBM Operations Analytics - Log Analysis on Linux on System z, you must installthe remote instances on Linux on System z. In this example, you cannot installremote instances on Linux on System x.
Insight Packs for z/OS
Domain insights for z/OS subsystems are available separately. You can installz/OS Insight Packs on both Linux on System z and Linux on System x basedservers. For more information, see Documentation for IBM Operations Analyticsfor z Systems.
Linux on System z logstash support
logstash 1.5.3 is bundled with the IBM Operations Analytics - Log Analysis Linuxon System z 64-bit installation package. However, logstash is not supported onLinux on System z. You can only use logstash to facilitate log aggregation on Linuxx86 based hardware.
Installing 19

Cross-platform installation of logstash is not supported. For example, you cannotinstall logstash remotely from a Linux on System z server to anotherLinux onSystem z or Linux on System x based server.
Installing on non-English-language systems
If you want to install IBM Operations Analytics - Log Analysis on a system wherethe locale is not set to English United States, you need to set the locale of thecommand shell to export LANG=en_US.UTF-8 before you run any IBM OperationsAnalytics - Log Analysis scripts. For example, when you install IBM OperationsAnalytics - Log Analysis you need to run the following command to change thelocale before you run the unity.sh script:export LANG=en_US.UTF-8
Tuning the operating system
To tune the Linux operating system, ensure that the following resourceconfiguration settings are made:
Number of concurrent files: 4096Use the ulimit -n command to change this setting to 4096.
Virtual memory: UnlimitedUse the ulimit -v command to change this setting to unlimited.
Verifying the version informationTo display the version information for your installation, run theunity_VersionInfoUtility.sh utility.
Procedure
Run the following command:<HOME>/IBM/LogAnalysis/utilities/unity_VersionInfoUtility.sh
Results
The version information is displayed along with some other useful informationabout your install.
Removing IBM Operations Analytics - Log AnalysisYou can use the command-line, the IBM Installation Manager UI or a silentremoval process to remove IBM Operations Analytics - Log Analysis.
Removing IBM Operations Analytics - Log AnalysisThis topic outlines the steps that you must complete to remove IBM OperationsAnalytics - Log Analysis.
About this task
This procedure outlines how to remove IBM Operations Analytics - Log Analysisand IBM Installation Manager from your environment. Both of these componentsare installed when you install IBM Operations Analytics - Log Analysis. Tocomplete the uninstallation, remove IBM Operations Analytics - Log Analysis andthen, if required, complete the procedure to remove IBM Installation Manager.
20 IBM Operations Analytics - Log Analysis: Installation, Configuration, and Administration Guide

Note: If you have remote installations of Indexing Engines, you must remove thesebefore you remove IBM Operations Analytics - Log Analysis. For more informationabout removing Apache Solr Indexing Engines, see “Removing Apache Solrinstances” on page 71
Procedure1. To remove IBM Operations Analytics - Log Analysis:
a. Navigate to the <HOME>/IBM/InstallationManager/eclipse/launcherdirectory and execute the command:./launcher
Note: If you are accessing the installation environment remotely, ensure thatyour virtual desktop software is configured to allow you to view thegraphical user interface for the IBM Installation Manager.
b. Click Next.c. Select the IBM Operations Analytics - Log Analysis package and click Next.d. Click Uninstall. Allow the removal to proceed and when complete, click
Finish.2. (Optional) To remove IBM Installation Manager:
a. From the <HOME>/var/ibm/InstallationManager/uninstall directory, executethe command:./uninstall
where <HOME> is the directory to which you have installed IBMOperations Analytics - Log Analysis
b. Complete the uninstallation steps and click Finish.
Using the console to remove IBM Operations Analytics - LogAnalysis
This topic outlines the steps that you must complete to remove IBM OperationsAnalytics - Log Analysis using the console.
About this task
This procedure outlines how to remove IBM Operations Analytics - Log Analysisand IBM Installation Manager from your environment using the console. Both ofthese components are installed when you install IBM Operations Analytics - LogAnalysis. To complete the uninstallation, remove IBM Operations Analytics - LogAnalysis and then, if required, complete the procedure to remove IBM InstallationManager.
Note: If you have remote installations of Indexing Engines, you must remove thesebefore you remove IBM Operations Analytics - Log Analysis. For more informationabout removing Apache SolrIndexing Engines, see “Removing Apache Solrinstances” on page 71.
Procedure1. To remove IBM Operations Analytics - Log Analysis:
a. Navigate to the <HOME>/InstallationManager/eclipse/tools directory andexecute the command:./imcl -c
b. Enter5 and press Enter.
Installing 21

c. Enter 1 to select the IBM Operations Analytics - Log Analysis packagegroup and press N to proceed.
d. Enter 1 to select the IBM Operations Analytics - Log Analysis package, pressEnter.
e. Enter N to proceed.f. Enter U to start the uninstallation.g. After the uninstallation has completed, enter F to complete the
uninstallation.h. Enter X to close the IBM Installation Manager.
2. (Optional) To remove IBM Installation Manager:a. From the <USER_HOME>/var/ibm/InstallationManager/uninstall directory,
execute the command:./uninstallc
b. The uninstallation proceeds and completes.
Silently removing IBM Operations Analytics - Log AnalysisYou can remove IBM Operations Analytics - Log Analysis silently by using thesample response file that is provided with the product.
Before you begin
You require the sample response file <HOME>/IBM/LogAnalysis/work_files/removal/sample_silent_loganalytics_removal.xml.
Note: A silent removal can fail if the IBM Installation Manager repository changedsince the last installation or removal. This problem can occur even when youupdate the response file with the correct repository location. If the repositorychanged, remove or close the old repository connections before you remove theproduct.
Note: If you have remote installations of Apache Solr, remove them before youremove IBM Operations Analytics - Log Analysis. For more information about howto do this, see “Removing Apache Solr instances” on page 71.
About this task
Silently removing IBM Operations Analytics - Log Analysis involves modifying thesample response file and then calling IBM Installation Manager from the commandline or from a script to remove the product. IBM Installation Manager obtains therequired settings from the response file.
Procedure
To silent removal the product:1. Copy the sample response file to a suitable local directory (for example, your
home directory). Use a suitable name for the local response file, for example:smcl_removal.xml
2. Modify the response file to suit your environment:a. Specify the IBM Installation Manager repository location for your
environment. For example: repository location=’/home/smcl/smcl_build/’
22 IBM Operations Analytics - Log Analysis: Installation, Configuration, and Administration Guide

b. If you changed the default IBM Operations Analytics - Log Analysis portnumbers during or after installation, update the following entries with thenew port numbers:<!-- IBM Log Analytics WebConsole Port Number --><data key=’user.unity.port.number,com.ibm.tivoli.scloganalytics’value=’9988’/>
<!-- IBM Log Analytics WebConsole Secure Port Number --><data key=’user.unity.secureport.number,com.ibm.tivoli.scloganalytics’value=’9987’/>
<!-- IBM Log Analytics Database Port Number --><data key=’user.database.port.number,com.ibm.tivoli.scloganalytics’value=’1627’/>
<!-- IBM Log Analytics DataCollection (EIF) Server Port Number --><data key=’user.eif.port.number,com.ibm.tivoli.scloganalytics’value=’5529’/>
<!-- IBM Log Analytics Search Engine WebConsole Server Port Number --><data key=’user.searchengine.port.number,com.ibm.tivoli.scloganalytics’value=’9989’/>
<!-- IBM Log Analytics Distributed Application Management ServerPort Number --><data key=’user.zookeeper.port.number,com.ibm.tivoli.scloganalytics’value=’12181’/>
c. Save your changes.3. Use the following command to removal the product:
~/IBM/InstallationManager/eclipse/tools/imcl -s -input<HOME_DIR>/smcl_removal.xml -sVP -acceptLicense
Where <HOME_DIR> is the directory where you stored the response file.
Results
The progress of the removal is displayed in an IBM Installation Manager console.To run the removal script displaying the console, omit the -sVP option (whichshows Verbose Progress).
Installing referenceRead the information about the scripts and properties that you can configure whenyou install Log Analysis.
Configuration properties fileAfter you complete the installation, to modify the configuration properties edit theunitysetup.properties file.
Modify only the properties that are listed in the table.
Note: You cannot change any of the other parameters in the file. These parametersare identified as such in the file. If you do change one of these parameters, IBMOperations Analytics - Log Analysis may not work correctly or at all.
Installing 23

Table 2. unitysetup.properties parameters
Parameter Description
MAX_SEARCH_RESULTS=1000 The maximum number of search results thatcan be returned by the search query.
MAX_DATA_FACETS_IN_CHART=1000 The maximum number of facets or datapoints that can be included in returnedsearch results.
#SEARCH_QUERY_FOR_DEFAULT_SEARCH=* Uncomment this parameter to enable thedefault search.
MAX_WORK_QUEUE_SIZE=100000 Determines the maximum size of the queueof documents that are being held forannotation and indexing.
NUM_DOCUMENT_PROCESSOR_THREADS=30 Determines the thread pool that is used toselect, annotate, and index a document.
batchsize=500000 Determines the maximum number of recordsthat can be loaded by the Generic Receiverin single batch.
UNITY_APP_TIME_OUT=180 Determines the default time-out value inseconds for the apps. The default value is180 seconds.
ENABLE_SOLR_FACET_CACHE=false To enable the facet cache for wildcardsearches, set this parameter to true. Use thissetting if you run wildcard searches on datathat is older than 1 day. When it is enabled,the facets are counted before they areindexed by Log Analysis.
MAX_NON_INCREMENTAL_WINDOWS Determines the number of asynchronousqueries that can be run simultaneously for apercentile facet request query. The defaultvalue is 2.
COLLECTION_ASYNC_WINDOW Determines the size of the asynchronouscollection window. The default value is 1day, 1d. Do not change this value unless youare certain that your installation can ensurethat the performance of Log Analysis is notadversely affected.
Default portsIBM Operations Analytics Log Analysis uses a number of default ports during theinstallation process.
Default ports
Table 3. The default ports for IBM Operations Analytics Log Analysis are as follows:
Ports Default Value Description
Application WebConsole Port 9988 Use this port for unsecuredhttp communication with theweb application of IBMOperations Analytics LogAnalysis.
24 IBM Operations Analytics - Log Analysis: Installation, Configuration, and Administration Guide

Table 3. The default ports for IBM Operations Analytics Log Analysis are asfollows: (continued)
Ports Default Value Description
Application WebConsoleSecure Port
9987 Use this port for secured httpcommunication with the webapplication of IBMOperations Analytics LogAnalysis.
Database Server Port 1627 This port is used by IBMOperations Analytics LogAnalysis for its internaldatabase.
Data Collection Server Port 5529 This port is used by IBMOperations AnalyticsLogAnalysis to collect data.
ZooKeeper Port Number 12181 This port is used byZooKeeper service of IBMOperations AnalyticsLogAnalysis to manage itsApache Solr nodes
Apache Solr Search Port 8983 This port is used by theApache Solr server to listenfor search queries.
Apache Solr Stop Port 7205 This port is used by IBMOperations AnalyticsLogAnalysis to stop the ApacheSolr server.
Note: The default ports listed in Table 1 apply to local IBM OperationsAnalyticsLog Analysis installations. Remote IBM Operations AnalyticsLog Analysisinstallations may require different port numbers.
install.sh commandUse the install.sh command to install IBM Operations Analytics - Log Analysis.
The install.sh command is in the <HOME>/IBM/LogAnalysis/remote_install_tool/ directory on the local installation of IBM Operations Analytics- Log Analysis.
install.sh command parameters
To install IBM Operations Analytics - Log Analysis with IBM Installation Manager,run the command:./install.sh
This command installs IBM Operations Analytics - Log Analysis and installs orupgrades, IBM Installation Manager if no other version is installed. For moreinformation, see “Installing with the IBM Installation Manager UI” on page 10.
To install IBM Operations Analytics - Log Analysis with the console, run thecommand:./install.sh -c
Installing 25

This command installs IBM Operations Analytics - Log Analysis and installs orupgrades IBM Installation Manager, if no other version of IBM InstallationManager is installed. For more information, see “Installing with the IBMInstallation Manager command-line interface” on page 12.
To silently install IBM Operations Analytics - Log Analysis, run the command:./install.sh -s <HOME_DIR>/smcl_silent_install.xml
where <HOME_DIR> is your home directory. This command silently installs IBMOperations Analytics - Log Analysis and installs or upgrades IBM InstallationManager Version 1.8.2. For more information, see “Silently installing Log Analysis”on page 14.
To install the Tivoli Event Integration Facility Receiver or the IBM TivoliMonitoring Log File Agent on a remote server, run the remote_deploy.sh script.For more information, see “Installing Apache Solr on remote machines” on page69.
backup_restore.sh scriptTo back up or restore data, use the backup_restore.sh script.
Syntaxbackup_restore.sh <backup_directory> -backup| -restore
where <backup_directory> is the path for the directory that you create to store thebacked up files.
Parameters
<backup_directory>The path for directory that you create to store the backed up files
backup Backs up the current data to the backup directory.
restoreRestores the data stored in the backup directory.
26 IBM Operations Analytics - Log Analysis: Installation, Configuration, and Administration Guide

Upgrading, backing up, and migrating data
You use the same script to back up, restore, and migrate your data during anupgrade.
Before you beginv Read about the limitations that apply to this procedure. For more information,
see “Backup and migration limitations” on page 28v If you do not configure a key-based Secure Shell (SSH) authentication as part of
the installation, you are prompted for the password during the restoration. Formore information about setting up SSH, see Setting up Secure Shell to usekey-based authentication..
About this task
These items are backed up and migrated by this procedure:v Saved searches, tags, and Data Sourcesv Data Types including Source Types, Rule Sets, File Sets, and Collections.v Topology configuration filesv Usage statisticsv LDAP configuration filesv Custom Search Dashboardsv Insight Packsv Log File Agent (LFA) configuration filesv License configuration filesv All chart specifications, including custom chart specifications
In addition to these files, a number of files that are not required for a newinstallation are also backed up and maintained for reference purposes. These filesinclude:v Log files that are generated by IBM Operations Analytics - Log Analysisv Log files that were uploaded in batch mode
Data other than the types of listed previously are not backed up or restored. Anycustomization that is made outside the files that are listed here must be migratedmanually. For example, user information and changes to passwords for defaultusers are not migrated to the target server.
LDAP information for one LDAP server is migrated automatically. If you havemore than one DAP server, you must migrate and configure the information fromthe other LDAP server manually. The migrated information is stored in theldapRegistry.xml file.
Procedure
To back up and restore data in IBM Operations Analytics - Log Analysis 1.3.2:1. Back up your data. For more information, see Backing up data.2. Restore your data. For more information, see Restoring data.
To migrate data from IBM Operations Analytics - Log Analysis 1.3.1 to 1.3.2:
© Copyright IBM Corp. 2015 27

1. Back up your data in 1.3.1.2. Move the backed up, compressed files to the <Backup_dir> on the 1.3.2 server.3. Restore the data on the 1.3.2 server.
What to do next
You must update any existing logstash plugins for IBM Operations Analytics - LogAnalysis 1.3.1 after you migrate to IBM Operations Analytics - Log Analysis 1.3.2to ensure that logstash installations function correctly. For more information aboutupdating the logstash, see Updating the logstash plugin after migration in theUpgrading, backing up, and migrating data section.
If you use the Generic Annotation Insight Pack, run the following command toupgrade the Insight Pack:<HOME>/IBM/LogAnalysis/utilities/pkg_mgmt.sh -upgrade$<HOME>/IBM/LogAnalysis/unity_content/GA/GAInsightPack_v1.1.1.3.zip -f
If you migrate data to a new target server, you must complete the following stepsto update the data source with the relevant information for the server:1. Log in to IBM Operations Analytics - Log Analysis and open the Data sources
workspace.2. Identify the data sources that use Local file as the location in their
configuration. For each of these data sources, open the data source andcomplete the steps in the wizard without changing any data. This actionupdates the data sources with the relevant information for the new server.
3. Identify the data sources that use Custom as the location in their configuration.For each of these data sources, open the data source and complete the steps inthe wizard, updating the host name to match the new one.
Related tasks:“Setting up Secure Shell to use key-based authentication” on page 72Secure Shell (SSH) is a cryptographic network protocol for secure datacommunication between different computers. You set up key-based authenticationbetween the IBM Operations Analytics - Log Analysis servers and the remotecomputers to which it connects.“Backing up data” on page 29To back up data, complete the procedure.“Restoring data” on page 30To restore backed up data, complete the following procedure.“Updating remote logstash installations” on page 30After you migrate to IBM Operations Analytics - Log Analysis 1.3.2 , you mustupdate any remote installations of logstash that you created with IBM OperationsAnalytics - Log Analysis 1.3.1.
Backup and migration limitationsBefore you back up, restore or migrate data between the same or different versions,read the limitations.
The following restrictions apply:v To restore backed up data from Indexing Engines, you must set up at least the
same number of Indexing Engines in the target system as existed previously inthe source system.
28 IBM Operations Analytics - Log Analysis: Installation, Configuration, and Administration Guide

v During data restoration, backed up data is not merged with existing data on theserver. Backed up data must be restored on a target system immediately afterIBM Operations Analytics - Log Analysis is installed.
v Restoring backed up data must not be completed more than once on a targetserver. If errors occur restoring backed up data, you must attempt the restorationafter you remove and install IBM Operations Analytics - Log Analysis.
v Only data that is contained in the IBM Operations Analytics - Log Analysisdefault directories is backed up and restored. Any customization andmodifications that are completed outside these directories are not backed up orrestored.
v If you create a Custom Search Dashboard that points to the Derby database and,which has an encrypted user ID and password, you must update the applicationto reflect changes to the encryption of the Derby database user ID and passwordwhen you migrate to a new version. The Custom Search Dashboard cannot rununtil the application is edited to reflect the encryption that is used by theupdated installer.
v When you restore a system that was extended with extra Insight Packs (forexample, Insight Packs created with DSV toolkit), the log files and data sourcedirectories are not restored. To resolve this issue, you must manually add thesedirectories, using the appropriate LFA configuration file as a reference.
v To migrate IBM Operations Analytics - Log Analysis 1.3.0, or earlier versions, toIBM Operations Analytics - Log Analysis 1.3.2, you must first migrate to IBMOperations Analytics - Log Analysis 1.3.1
Backing up dataTo back up data, complete the procedure.
Procedure1. To stop IBM Operations Analytics - Log Analysis, use the unity.sh script that is
in the <HOME>/IBM/LogAnalysis/utilities directory:./unity.sh -stop
2. Create a backup directory where you will store the backup files. Do not createthis directory in the same directory in which IBM Operations Analytics - LogAnalysis is installed. This directory is called the backup directory or<backup_dir> in this procedure.
3. From the <HOME>/IBM/LogAnalysis/utilities/migration directory, run thefollowing command:./backup_restore.sh <backup_dir> backup
where <backup_dir> is the directory that you created in step 2. The backupdirectory that you specify must be empty.The backup command creates a set of archive files in the backup directory.
Results
When you run the backup command, IBM Operations Analytics - Log Analysiscreates a zipped file that contains the archived data.
The zipped files have the word restore in the file name and are numberedsequentially. For example, LogAnalytics_30Jul2014_Restore_001.zip. These are thefiles that you can use later to restore the data.
Upgrading, backing up, and migrating data 29

The command also generates reference files. These files are stored in a separatearchive file. The file name contains the words BackupOnly, for exampleLogAnalytics_30Jul2014_BackupOnly_001.zip. You do not need to restore these.
Restoring dataTo restore backed up data, complete the following procedure.
Procedure1. To stop IBM Operations Analytics - Log Analysis, use the unity.sh script that is
in the <HOME>/IBM/LogAnalysis/utilities directory:unity.sh -stop
2. From the <HOME>/IBM/LogAnalysis/utilities/migration directory, run thecommand:./backup_restore.sh <Backup_dir> restore
where <Backup_dir> is the path to the directory containing your backed upfiles.If you migrate Indexing Engine data, you must create the same number ofIndexing Engines in the target system. If you specified a password when youcreated the nodes, you are prompted for the password.
3. If LDAP is configured on your source IBM Operations Analytics - Log Analysisserver, you are prompted for the LDAP bind password during the restorationof your data on the target server.
4. If you have configured IBM Operations Analytics - Log Analysis to stream datafrom the same server on which it has been installed, and have migrated IBMOperations Analytics - Log Analysis to a new target server, review and updatethe host name setting in your data sources to reflect the host name of the targetserver.
5. To start IBM Operations Analytics - Log Analysis, use the unity.sh script thatis in the <HOME>/IBM/LogAnalysis/utilities directory:unity.sh -start
What to do next
Verify that the data migration and restoration has been successful. Confirm that allartifacts and data have been restored before you delete the back up archive.Progress information and errors recorded during back up and restore are stored inthe <HOME>/IBM/LogAnalysis/utilities/migration/logs directory.
Updating remote logstash installationsAfter you migrate to IBM Operations Analytics - Log Analysis 1.3.2, you mustupdate any remote installations of logstash that you created with IBM OperationsAnalytics - Log Analysis 1.3.1.
Procedure
To update unity-analytics-framework.jar for IBM Operations Analytics - LogAnalysis 1.3.1, complete the following steps:1. Copy the unity-analytics-framework.jar from the <HOME>/IBM/LogAnalysis/
remote_install_tool/lib on the IBM Operations Analytics - Log Analysis 1.3.2server to the <install-dir>/Logstash/logstash-1.4.2/logstash-scala/logstash/outputs folder on the remote machine.
30 IBM Operations Analytics - Log Analysis: Installation, Configuration, and Administration Guide

Where <install-dir> is the directory where logstash is installed on the remotemachine.
2. To import the client.crt file from <HOME>/IBM/LogAnalysis/wlp/usr/servers/Unity/resources/security on the IBM Operations Analytics - Log Analysis1.3.2. server to <JAVA_HOME> on the remote machine, use the followingcommand.<JAVA_HOME>/jre/bin/keytool -import -file <path> -keystore <JAVA_HOME>/jre/lib/security/ cacerts -storepass changeit
Wherev <JAVA_HOME> is the directory where Java is installed on the remote
machine, <logstash_install_dir>/LogAnalysis/ibm-java/v <path> is the client.crt location.
Upgrading, backing up, and migrating data 31

32 IBM Operations Analytics - Log Analysis: Installation, Configuration, and Administration Guide

Configuring
You can configure IBM Operations Analytics - Log Analysis through the userinterface and command-line interfaces. You can also administer and manageapplication security and single sign-on. This section outlines how to configure IBMOperations Analytics - Log Analysis.
Postinstallation configurationAfter you install IBM Operations Analytics - Log Analysis, you must complete therequired postinstallation tasks.
The postinstallation configuration includes the following tasks:v Installing the sample data. This is optional.v Creating users and assigning roles
After you complete the postinstallation configuration, you can scale yourinstallation. For more information, see “Configuring scalable data streaming frommultiple, remote sources” on page 69.
If you want to install Indexing Engines on remote servers, you can create themafter IBM Operations Analytics - Log Analysis is installed. For more information,see “Installing Apache Solr on remote machines” on page 69.
If you do not install a local instance of an Indexing Engine, you must install andIndexing Engine on one of the remotely connected servers. If you do not install atleast one Indexing Engine instance either locally or on a remote server, the searchand indexing features do not work.
Configuring the time zone for indexingYou can change the default time zone that is used by Log Analysis for to createindex fields when data is loaded.
If you want to change the time zone that is used to create index fields when datais loaded, you need to edit the unitysetup.properties file before you load anydata. You cannot change the default time zone after you load data. If you do, thisaction causes errors in the log file records. For more information, see Changing theindex time zone.
You can also change the time zone that is used for specific search results at anytime. If you want to view a specific set of search results in a particular time zone,you can change the time zone in the Search workspace. You can also set a defaultsearch time zone.
For more information, see Changing the search time zone topic in the Using guide.Related tasks:“Changing the index time zone” on page 34Log Analysis uses Coordinated Universal Time (UTC) as the default time zone forindexing during data loading. To change the default time zone, complete thisprocedure.
© Copyright IBM Corp. 2015 33

Changing the index time zoneLog Analysis uses Coordinated Universal Time (UTC) as the default time zone forindexing during data loading. To change the default time zone, complete thisprocedure.
About this task
You must change this setting after you install IBM Operations Analytics - LogAnalysis but before you load any data, including the sample data that is providedon the Getting Started page.
Note: You cannot change this time zone value after you load data. IBM OperationsAnalytics - Log Analysis cannot resolve the different time stamps and this conflictcauses errors in the search that cannot be resolved. After you change the timezoneand load data, do not change the timezone again.
IBM Operations Analytics - Log Analysis supports the Java timezone classification.For a list of supported timezone names, see Supported time zone names.
Procedure1. Install Log Analysis. Do not load or install any data.2. To stop Log Analysis, enter the following command:
<HOME>/IBM/LogAnalysis/utilities/unity.sh -stop
3. To change the default timezone value, edit the UNITY_TIME_ZONE parameter inthe <HOME>/IBM/LogAnalysis/wlp/usr/servers/Unity/apps/Unity.war/WEB-INF/unitysetup.properties file. For example, to change to Central European Time(CET), edit the parameter as follows:UNITY_TIME_ZONE=Europe/Paris
4. Save your changes.5. To restart Log Analysis, enter the following command:
<HOME>/IBM/LogAnalysis/utilities/unity.sh -restart
What to do next
After you change the default time zone and load data, do not change it again. Ifyou want to change the time zone for searches, you can change it on the Search UI.
For more information, see Changing the time zone for searches topic in the Usingguide.Related reference:“Supported time zone names” on page 245IBM Operations Analytics - Log Analysis uses Coordinated Universal Time as thedefault timezone.
Users and rolesYou can create and modify users and roles in the IBM Operations Analytics - LogAnalysis UI to assign role-based access control to individual users.
You can use the IBM Operations Analytics - Log Analysis UI to create and modifyusers and user roles to provide individual accounts and roles to users. Thisrole-based access control enables the administrator to assign individual access anddoes not support user or object groups.
34 IBM Operations Analytics - Log Analysis: Installation, Configuration, and Administration Guide

IBM Operations Analytics - Log Analysis includes the following default users androles.
unityuserThis default user is assigned the default unityusers role. All users areassigned to the unityusers role by default.
unityadminThis default user is assigned the default unityadmins role. This user hasaccess to all data in IBM Operations Analytics - Log Analysis. No explicitpermission needs to be set for this user.
You can use the default users and roles as outlined in Table 1, or create new usersand roles. For more information about creating users and roles, see Create andmodify users and Create and modify roles in the Postinstallation configuration section ofthe Configuring IBM Operations Analytics - Log Analysis guide.
Table 4. Default users and roles
Default user Default role
unityuser unityusers
unityadmin unityadmins, unityusers
Users with the unityuser role can access the search workspace. Users with theunityadmin role can access the search and administration workspaces.
By default, all users are assigned the unityuser role.
The unityadmin user has access to all data. Only one unityadmin user with theunityadmins role is supported in IBM Operations Analytics - Log Analysis.
Note: To create or modify users or roles, you must have access to theadministration workspace.
Creating a userYou can use the IBM Operations Analytics - Log Analysis UI to create a user.
Before you begin
To create new user accounts, you must have administrative access.
Procedure
To create a new user account, complete the following steps.1. Open the IBM Operations Analytics - Log Analysis UI and click Administrative
settings.
2. Select the Users tab.
3. Click the add icon
to open a new Add user pane.4. Complete the new user details in the Add user pane.
5. To add a role to the user, click the add icon
in the Add user pane. Selectthe required role and click OK.
6. To save the new user, click OK.
Configuring 35

Adding or deleting user roles:
You can add or delete user roles in the IBM Operations Analytics - Log Analysis UIto create a user.
About this task
Adding and deleting user roles in the IBM Operations Analytics - Log Analysis UIenables management of the individual profiles of distinct users.
Procedure
To add or delete user roles, complete the following steps.1. Open the IBM Operations Analytics - Log Analysis UI and click Administrative
settings.
2. Select the Users tab.3. Select the user that you want to edit.
4. Click the edit icon . This opens a new Edit <username> pane.
5. To add a user role to the selected user, click the add icon
in the Edit<username> pane.
6. To delete a user role from the selected user, click the delete icon
in the Edit<username> pane.
7. Select the required role and click OK
8. To save your changes, click OK.
Editing a userYou can use the IBM Operations Analytics - Log Analysis UI to edit a user.
Before you begin
To edit user accounts, you must have administrative access.
Procedure
To edit a user account, complete the following steps.1. Open the IBM Operations Analytics - Log Analysis UI and click Administrative
settings.
2. Select the Users tab.
3. Click the edit icon . This opens a new Edit <username> pane.4. Edit the user details in the Edit <username> pane.5. To save your changes, click OK.
Changing a user passwordUsers passwords are changed by using the IBM Operations Analytics - LogAnalysis UI.
Users can choose to change their own passwords or the unityadmin user canchange the password of an existing user.
36 IBM Operations Analytics - Log Analysis: Installation, Configuration, and Administration Guide

Changing your password:
You can use the IBM Operations Analytics - Log Analysis UI to change yourpassword.
Procedure
To edit your password, complete the following steps.1. Open the IBM Operations Analytics - Log Analysis UI.2. On the Getting Started page, expand the username.3. Select Change Password.4. Complete the fields Edit Password pane.5. Click OK.
Changing a user password:
You can use the IBM Operations Analytics - Log Analysis UI to change thepassword of an existing user.
Before you begin
To change the password of an existing user, you must have administrative access.
Procedure
1. To edit a user password, complete the following steps.a. Open the IBM Operations Analytics - Log Analysis UI and click
Administrative settings.
b. Select the Users tab.
c. Click the edit icon . This opens a new Edit <username> pane.d. Change the users password details in the Edit <username> pane.a. To save your changes, click OK.
2. If you want to change the unityadmin password, you must update theencrypted password in the following files to match the updated password.a. To generate the encrypted password, use the unity_securityUtility.sh
utility in the <HOME>/IBM/LogAnalysis/utilities directory. For example:unity_securityUtility.sh encode password
v <HOME>/IBM/LogAnalysis/utilities/datacollector-client/javaDatacollector.properties. For example:#The password to use to access the unity rest servicepassword={aes}EF712133E0677FEBB30624BA5EE62BC2
v <HOME>/IBM/LogAnalysis/remote_install_tool/config/rest-api.properties. For example:ibm.scala.rest.password={aes}EF712133E0677FEBB30624BA5EE62BC2
v <HOME>/IBM/LogAnalysis/UnityEIFReceiver/config/unity.conf. Forexample:unity.data.collector.password={aes}EF712133E0677FEBB30624BA5EE62BC2
v <HOME>/IBM/LogAnalysis/utilities/pkg_mgmt.sh. For example:PASSWD={aes}EF712133E0677FEBB30624BA5EE62BC2
Configuring 37

b. If you change the password that is used by the unityuser, you must updatethe password parameter in the <HOME>/IBM/LogAnalysis/solr_install_tool/scripts/register_solr_instance.sh script.password={aes}7A0B2401A8E29F37CD768CB78E205CAD
Deleting a userYou can use the IBM Operations Analytics - Log Analysis UI to delete a user.
Before you begin
To delete user accounts, you must have administrative access.
Note: If a user is deleted while they are logged in to IBM Operations Analytics -Log Analysis, their session continues until they log out. The user is not logged outautomatically when they are deleted.
Procedure
To delete a user account, complete the following steps.1. Open the IBM Operations Analytics - Log Analysis UI and click Administrative
settings.
2. Select the Users tab.3. Select the user that you want to delete.
4. Click the delete icon .5. A message opens asking you to confirm that you want to delete the selected
users, click OK.
Creating a roleYou can use the IBM Operations Analytics - Log Analysis UI to create anapplication role.
Before you begin
To create new application roles, you must have administrative access.
Procedure
To create a new role, complete the following steps.1. Open the IBM Operations Analytics - Log Analysis UI and click Administrative
Settings.
2. Select the Roles tab.
3. Click the add icon .4. Complete the new role details in the Add Role pane.5. To save the new role, click OK.
Editing a roleYou can use the IBM Operations Analytics - Log Analysis UI to edit role profiles.
Before you begin
To edit role profiles, you must have administrative access.
38 IBM Operations Analytics - Log Analysis: Installation, Configuration, and Administration Guide

Procedure
To edit role profiles, complete the following steps.1. Open the IBM Operations Analytics - Log Analysis UI and click Administrative
Settings.
2. Select the Roles tab.
3. Select the role that you want to edit, and click the edit icon .4. Modify the fields in the Edit <username> pane.5. To save the changes to the role, click OK.
Adding users to rolesYou can use the IBM Operations Analytics - Log Analysis UI to add users to newor existing role.
Before you begin
To add a user to a new or existing role, you must have administrative access.
Procedure
To add a user to a new or existing role, complete the following steps.1. Open the IBM Operations Analytics - Log Analysis UI and click Administrative
Settings.
2. Select the Roles tab.3. Select the role that you want to add users to:
v To add a user to a new role, click the add icon .
v To add a user to an existing role, select the role and click the edit icon .4. Select the Assign Users to Role tab in the Add Role or Edit <username> pane.
5. Click the add icon .6. Select the users that you want to add to the role from the list, and click OK.
To clear a selected user, hold down the Ctrl or Command key, and click theuser row.
7. To save the changes to the user, click OK.
Deleting a user from a roleYou can use the IBM Operations Analytics - Log Analysis UI to delete a user froma role.
Before you begin
To delete a user from a role, you must have administrative access.
Procedure
To delete a user from a role, complete the following steps.1. Open the IBM Operations Analytics - Log Analysis UI and click Administrative
Settings.
2. Select the Roles tab.
Configuring 39

3. Select the role that you want to edit, and click the edit icon .4. Select the Assign Users to Role tab in the Edit <username> pane.
5. Select the users that you want to delete, and click the delete icon .6. To save the changes to the role, click OK.
Adding permissions to rolesYou can use the IBM Operations Analytics - Log Analysis UI to add permissions tonew or existing roles.
Before you begin
To add permissions to a new or existing role, you must have administrative access.
The default permission is none. Users with the default permissions do not haveaccess to the data.
Note: If you run a saved search, or create a dashboard or Custom SearchDashboard that includes a list of data sources, the search or dashboard is renderedwith data from data sources for which you have permission.
Procedure
To add permissions to a new or existing role, complete the following steps.1. Open the IBM Operations Analytics - Log Analysis UI and click Administrative
Settings.
2. Select the Roles tab.3. Select the role that you want to add permissions to:
v To add permissions to a new role, click the add icon .v To add permissions to an existing role, select the role and click the edit icon
.4. Select the Assign Permissions to Role tab in the Add Role or Edit <username>
pane.
5. Click the add icon .6. Select the permissions that you want to add to the role from the list, and click
OK.
Note: IBM Operations Analytics - Log Analysis only supports read permissionsfor datasource objects. Users with read permissions can run ingestion anddeletion operations.To clear a selected permission, hold down the Ctrl or Command key, and clickthe permission row.
7. To save the changes to the role, click OK.
Deleting permissions from rolesYou can use the IBM Operations Analytics - Log Analysis UI to delete permissionsfrom roles.
40 IBM Operations Analytics - Log Analysis: Installation, Configuration, and Administration Guide

Before you begin
To delete permissions from roles, you must have administrative access.
Note: If you run a saved search, or create a dashboard or Custom SearchDashboard that includes a list of data sources, the search or dashboard is renderedwith data from data sources for which you have permission.
Procedure1. Open the IBM Operations Analytics - Log Analysis UI and click Administrative
Settings.
2. Select the Roles tab.3. Select the role from which you want to delete permissions, and click the edit
icon .4. Select the Assign Permissions to Role tab in the Edit <username> pane.
5. Select the permissions that you want to delete, and click the delete icon .6. To save the changes to the role, click OK.
Security considerationsA number of files in the IBM Operations Analytics - Log Analysis environmentcontain encoded or encrypted passwords. Access to these files must be controlledeither through controlling access to the file system or through access rights or filepermissions. This can be achieved by limiting the groups and users that haveaccess to these files. The files that contain this information are:v <HOME>/IBM/LogAnalysis/UnityEIFReceiver/config/unity.conf
v <HOME>/IBM/LogAnalysis/wlp/usr/servers/Unity/ldapRegistry.xml
v <HOME>/IBM/LogAnalysis/wlp/usr/servers/Unity/unityUserRegistry.xml
v <HOME>/IBM/LogAnalysis/wlp/usr/servers/Unity/keystore/unity.ks
v <HOME>/IBM/LogAnalysis/wlp/usr/servers/Unity/keystore/unity_statistics.ks
v <HOME>/IBM/LogAnalysis/wlp/usr/servers/Unity/apps/Unity.war/WEB-INF/unitysetup.properties
v <HOME>/IBM/LogAnalysis/eif_remote_install_tool/config/rest-api.properties
v <HOME>/IBM/LogAnalysis/solr_install_tool/scripts/register_solr_instance
v <HOME>/IBM/LogAnalysis/utilities/pkg_mgmt.sh
LDAP configurationYou can implement an LDAP user registry in place of the database-managedcustom user registry that is provided in IBM Operations Analytics - Log Analysis.
IBM Operations Analytics - Log Analysis uses database-managed custom userregistry as the default setting for user authentication. This setting is configured inthe server.xml file in the <HOME>/IBM/LogAnalysis/wlp/usr/servers/Unitydirectory.
You can modify the user registry XML file yourself or you can use theldapRegistryHelper.sh command that is in the <HOME>/IBM/LogAnalysis/utilitiesdirectory to generate an XML file that you can use to enable basic authentication.
Configuring 41

Before you beginv Configure LDAP immediately after IBM Operations Analytics - Log Analysis is
installed.v When LDAP is configured, you cannot revert to database-managed custom user
registry.v The IBM Operations Analytics - Log Analysis administrator, or unityadmin user,
must be present in the LDAP repository.v After the unityadmin user logs in to IBM Operations Analytics - Log Analysis for
the first time, they must register other LDAP users with IBM OperationsAnalytics - Log Analysis by adding users from the UI.
v LDAP must be registered by the unityadmin user to use the IBM OperationsAnalytics - Log Analysis functions.
v If your LDAP environment is configured to interact with other security software,Log Analysis might have to interact with this software to completeauthentication. You must consider any user ID or password restrictions that thisother security software imposes. For example, if one of the other LDAPapplications requires an 8-character password, the password that you specify inLog Analysis must meet that requirement.
Using the ldapRegistryHelper.sh command
You can use the ldapRegistryHelper.sh command to generate theldapRegistry.xml file. This file is in the <HOME>/IBM/LogAnalysis/wlp/usr/servers/Unity directory. It contains the minimum properties that are required to enable abasic connection to an LDAP directory server. You can use the file to enable a basicLDAP authentication or as an example to guide you setting up your own LDAP.
You can use one of the following options to configure LDAP authentication:v To set up LDAP authentication with an IBM Tivoli Directory Server or Microsoft
Active Directory server, use the ldapRegistryHelper.sh command to generatethe ldapRegistry.xml file. Use this file to enable a basic connection to an LDAPdirectory server. See “Configuring LDAP authentication with IBM TivoliDirectory Server or Microsoft Active Directory” on page 43
v To set up LDAP authentication with a Tivoli Directory Server (TDS) or MicrosoftActive Directory (AD) server, you must create your own XML file or modify theldapRegistry.xml file to enable a basic connection to an LDAP directory server.See “Manually configuring LDAP authentication” on page 47.
Manually enabling LDAP authentication
Use the ldapRegistryHelper.sh command to generate the ldapRegistry.xml file.
Modify the ldapRegistry.xml file in the <HOME>/IBM/LogAnalysis/wlp/usr/servers/Unity directory manually.
To disable database-managed custom user registry, comment out the following linein the server.xml file:<!--Include the basic registry predefined with default users and groups --><include optional=’true’ location="${server.config.dir}/unityUserRegistry.xml"/> -->
To enable LDAP authentication, remove the comment from the following line:<!--Include the LDAP registry --><include optional=’true’ location="${server.config.dir}/ldapRegistry.xml"/> -->
42 IBM Operations Analytics - Log Analysis: Installation, Configuration, and Administration Guide

where ldapRegistry.xml is the file that contains the properties that are required toconnect to the LDAP server.
User group names
The valid IBM Operations Analytics - Log Analysis user group names for LDAPare UnityAdmins and UnityUsers. These group names are mapped to security rolesin the unityConfig.xml file that is in the <HOME>/IBM/LogAnalysis/wlp/usr/servers/Unity directory.
To use other LDAP groups, update the unityConfig.xml file to map the groups tosecurity roles in IBM Operations Analytics - Log Analysis.
Compatible LDAP directories
IBM Operations Analytics - Log Analysis supports Tivoli Directory Server (TDS)and Microsoft Active Directory (AD) LDAP servers.
Configuring LDAP authentication with IBM Tivoli Directory Server or MicrosoftActive Directory:
You can use the ldapRegistryHelper.sh command to help you to create and enablean IBM Tivoli Directory Server or Microsoft Active Directory server for IBMOperations Analytics - Log Analysis user authentication.
Before you begin
v The unityadmin user must be a member of the UnityAdmins group in the LDAPregistry. Other users must be members of the UnityUsers group.
v To use other LDAP groups, update the unityConfig.xml file to map the groupsto security roles in IBM Operations Analytics - Log Analysis.
About this task
Only one LDAP server can be configured by using the utility.
Procedure
1. To stop the IBM Operations Analytics - Log Analysis server, use the followingcommand:./ unity.sh -stop
2. To specify the LDAP server details, edit the ldapRegistryHelper.propertiesfile that is in the <HOME>/IBM/LogAnalysis/utilities/ directory. For moreinformation about the ldapRegistryHelper properties, see the“ldapRegistryHelper.properties” on page 45 topic in the Configuration guide.
3. Navigate to the <HOME>/IBM/LogAnalysis/utilities directory and run thefollowing command:./ldapRegistryHelper.sh config
4. Run the following command:./ldapRegistryHelper.sh enable
5. If the UnityAdmins or UnityUsers groups are not in your LDAP server, you canmap other groups in the LDAP registry to security roles in IBM OperationsAnalytics - Log Analysis. To map groups to security roles, edit the<HOME>/IBM/LogAnalysis/wlp/usr/servers/Unity/unityConfig.xml file. Forexample:
Configuring 43

<security-role name="UnityUser"><group name="UnityUsers" /><group name="UnityAdmins" /><group name="TestLANonAdmin"/><group name="TestLAAdmin"/>
</security-role><security-role name="UnityAdmin">
<group name="UnityAdmins" /><group name="TestLAAdmin"/>
</security-role>
6. To start the IBM Operations Analytics - Log Analysis server, use the followingcommand:<HOME>/IBM/LogAnalysis/utilities/unity.sh -start
7. To add LDAP users to IBM Operations Analytics - Log Analysis, log in asunityadmin.
Note: You can delete the LDAP user registered with IBM Operations Analytics- Log Analysis but you cannot edit or delete the actual LDAP users.
8. To add roles and permissions to LDAP users, open the IBM OperationsAnalytics - Log Analysis UI and click Administrative Settings. For moreinformation about adding roles and permissions, see the Adding users to rolesand Adding permissions to roles topics in the Users and roles section of theConfiguring guide.
9. Users who are deleted from the LDAP registry must be removed from IBMOperations Analytics - Log Analysis by the unityadmin user to prevent storageof obsolete information in the IBM Operations Analytics - Log Analysis Derbydatabase.
Results
Basic LDAP authentication between IBM Operations Analytics - Log Analysis andthe IBM Tivoli Directory Server or the Microsoft Active Directory server is enabled.
What to do next
After you configure LDAP, you must update the password in the configurationfiles. For more information, see “Updating passwords in the configuration files” onpage 50.
Configuring multiple LDAP servers:
Procedure
1. To stop the IBM Operations Analytics - Log Analysis server, use the followingcommand:./ unity.sh -stop
2. To specify the LDAP server details, edit the ldapRegistryHelper.propertiesfile that is in the <HOME>/IBM/LogAnalysis/utilities/ directory. For moreinformation about the ldapRegistryHelper properties, see the“ldapRegistryHelper.properties” on page 45 topic in the Configuration guide.
3. Navigate to the <HOME>/IBM/LogAnalysis/utilities directory. Use theldapRegistryHelper.sh command to generate the ldapRegistry.xml file andrun the following command to generate the <HOME>/IBM/LogAnalysis/wlp/usr/servers/Unity/ldapRegistry.xml file:./ldapRegistryHelper.sh config
Back up the ldapRegistry.xml file and repeat this step for each LDAP server.
44 IBM Operations Analytics - Log Analysis: Installation, Configuration, and Administration Guide

4. To ensure that the servers are distinct, edit the realm and id properties in theldapRegistryHelper.properties file that is in the <HOME>/IBM/LogAnalysis/utilities/ directory. For more information about the ldapRegistryHelperproperties, see the “ldapRegistryHelper.properties” topic in the Configurationguide.
5. To map groups in your LDAP servers to security roles in IBM OperationsAnalytics - Log Analysis, edit the <HOME>/IBM/LogAnalysis/wlp/usr/servers/Unity/unityConfig.xml. For example:<server>
<application type="war" id="Unity" name="Unity"location="${server.config.dir}/apps/Unity.war">
<application-bnd><security-role name="UnityUser"
<group name="UnityUsers" /><group name="UnityAdmins" /><group name="TestLANonAdmin"/<group name="TestLAAdmin"/
</security-role><security-role name="UnityAdmin">
<group name="UnityAdmins" />/security-role>
/application-bnd>/application>oauth-roles>authenticated>
<group name="UnityUsers"/><group name="TestLANonAdmin"/><group name="TestLAAdmin"/>
/authenticated>/oauth-roles>
</server>
6. To start the IBM Operations Analytics - Log Analysis server, use the followingcommand:<HOME>/IBM/LogAnalysis/utilities/unity.sh -start
7. Log in as the unityadmin user and add the LDAP users to IBM OperationsAnalytics - Log Analysis.
Note: You can delete the LDAP user registered with IBM Operations Analytics- Log Analysis but you cannot edit or delete the actual LDAP users.
8. To add roles and permissions to LDAP users, open the IBM OperationsAnalytics - Log Analysis UI and click Administrative Settings. For moreinformation about adding roles and permissions, see the Adding users to rolesand Adding permissions to roles topics in the Users and roles section of theConfiguring guide.
9. Users who are deleted from the LDAP registry must be removed from IBMOperations Analytics - Log Analysis by the unityadmin user to prevent storageof obsolete information in the IBM Operations Analytics - Log Analysis Derbydatabase.
ldapRegistryHelper.properties:
You can edit the ldapRegistryHelper.properties to specify LDAP server details.
The following properties are required and define the connection information forthe target LDAP server.
Configuring 45

Table 5. LDAP server connection information properties
Property Description
ldap_hostname_property= The LDAP hostname.
ldap_port_property= The LDAP port.
ldap_baseDN_property= The LDAP baseDN. For example, "dc=com"for TDS users, and"CN=Users,DC=sflab,DC=local"for AD users.
The following properties are optional and define the connection information for thetarget LDAP server. Where applicable, default settings are assigned.
The bindPassword value for AD users is encrypted in theldapRegistryHelper_config.xml.
Table 6. Optional LDAP server connection information properties
Property Description
ldap_bindDN_property= The LDAP bindDN. For example,"CN=Administrator,CN=Users,DC=sflab,DC=local" for AD users.
ldap_bindPassword_property= The LDAP bind password.
ldap_realm_property= The LDAP realm. The default value isLdapRegistryRealm.
ldap_id_property= The LDAP ID. The default value isLdapRegistryId.
ldap_ignoreCase_property= The LDAP ignore case. The default value istrue.
ldapRegistryHelper.sh command:
You can use the ldapRegistryHelper.sh command to enable a basic connection foruser authentication in IBM Operations Analytics - Log Analysis.
For more information about how to use the command to set up LDAPauthentication with IBM Tivoli Directory Server or Microsoft Active Directory, see“Configuring LDAP authentication with IBM Tivoli Directory Server or MicrosoftActive Directory” on page 43.
Supported integrations
This command currently supports connections to the IBM Tivoli Directory Serverand Microsoft Active Directory.
Prerequisites
Before you use this command, you must update theldapRegistryHelper.properties file in the <HOME>/IBM/LogAnalysis/utilities/directory with the connection and configuration information for the target LDAPserver.
46 IBM Operations Analytics - Log Analysis: Installation, Configuration, and Administration Guide

Syntax
The ldapRegistryHelper.sh command is in the <HOME>/IBM/LogAnalysis/utilitiesdirectory and it has the following syntax:ldapRegistryHelper.sh config | enable
Note:
To run the script, the JAVA_HOME variable must be set correctly for IBM OperationsAnalytics - Log Analysis. If the script fails, run the following command to set theJAVA_HOME variable:JAVA_HOME=$<HOME>/IBM-java
Parameters
The ldapRegistryHelper.sh command has the following parameters:
config Use the config parameter to create an XML file that is calledldapRegistry.xml in the <HOME>/IBM/LogAnalysis/wlp/usr/servers/Unitydirectory. This file uses the connection and configuration information thatis defined in the ldapRegistryHelper.properties file.
enable
Use the enable parameter to enable LDAP authentication that uses theinformation that is specified in the ldapRegistry.xml file. This parameteralso disables the reference to the database-managed custom user registry.
Manually configuring LDAP authentication:
If you want to manually configure LDAP authentication, you can manuallyconfigure the settings in your own XML file or you can modify theldapRegistry.xml that is output by the ldapRegistryHelper.sh command to meetyour requirements.
About this task
The following procedure describes the steps that are automated by theldapRegistryHelper.sh command. Read this procedure to help you understand thenecessary steps for configuring LDAP authentication. For more information, seeConfiguring an LDAP user registry with the Liberty profile.
Procedure
1. Manually create an LDAP configuration file that is named ldapRegistry.xmland save it in the <HOME>/IBM/LogAnalysis/wlp/usr/servers/Unity directoryor modify the ldapRegistry.xml that is output by the ldapRegistryHelper.shcommand.
2. Update the ldapRegistry.xml with the appropriate configuration information:v For IBM Tivoli Directory Server, add the text:
<ldapRegistry id="IBMDirectoryServerLDAP" realm="SampleLdapIDSRealm"host="host.domain.com" port="389" ignoreCase="true"baseDN="o=domain,c=us"bindDN="cn=root"bindPassword="password"ldapType="IBM Tivoli Directory Server"><idsFilters
userFilter="(&(uid=%v)(objectclass=ePerson))"groupFilter="(&(cn=%v)(|(objectclass=groupOfNames)
Configuring 47

(objectclass=groupOfUniqueNames)(objectclass=groupOfURLs)))"userIdMap="*:uid"groupIdMap="*:cn"groupMemberIdMap="ibm-allGroups:member;ibm-allGroups:
uniqueMember;groupOfNames:member;groupOfUniqueNames:uniqueMember" /></ldapRegistry>
v For Microsoft Active Directory, add the text:<ldapRegistry id="ActiveDirectoryLDAP" realm="SampleLdapADRealm"
host="host.domain.com" port="389" ignoreCase="true"baseDN="cn=users,dc=domain,dc=com"bindDN="cn=myuser,cn=users,dc=domain,dc=com"bindPassword="password"ldapType="Microsoft Active Directory" />
3. Update these attributes to reflect your LDAP server configuration:v ID
v realm
v host
v port
v baseDN
v bindDN
4. AD users must run the securityUtility command that is in the<HOME>/IBM/LogAnalysis/bin directory to encode the bindPassword password.This step is optional for TDS users as they do not require the bindPasswordpassword.After you run the command, copy the encrypted value that is output by thecommand to the bindPassword property.For more information about this command, see “unity_securityUtility.shcommand” on page 234
5. (Optional) If your implementation uses a Microsoft Active Directory LDAPthat uses different object classes to define users and groups, update theuserFilter and groupFilter attributes as required.
6. (Optional) If your implementation uses Microsoft Active Directory, update theuser and group mapping attributes as required for your LDAP environment.
7. Open the server.xml file in the <HOME>/IBM/LogAnalysis/wlp/usr/servers/Unity directory and add these lines:a. Only one type of user registry can be configured for authentication,
therefore you must disable the database-managed custom user registry toenable LDAP. Comment out the following lines in the server.xml file thatreference the database-managed custom user registry:<!-- Include the basic registry predefined with default usersand groups --><!-- <include optional="true" location="${server.config.dir}/unityUserRegistry.xml"/>-->
If you do not remove this reference, an error message is displayed.b. Add an include tag to replace the reference to the custom user registry
with a reference to the ldapRegistry.xml file. For example:<!-- Include the LDAP registry for user and groups -->
<include optional="true" location="${server.config.dir}/ldapRegistry.xml"/>
8. If the UnityAdmins or UnityUsers groups are not in your LDAP server, you canmap other groups in the LDAP registry to security roles in IBM Operations
48 IBM Operations Analytics - Log Analysis: Installation, Configuration, and Administration Guide

Analytics - Log Analysis. To map groups to security roles, edit the<HOME>/IBM/LogAnalysis/wlp/usr/servers/Unity/unityConfig.xml file. Forexample:<security-role name="UnityUser">
<group name="UnityUsers" /><group name="UnityAdmins" /><group name="TestLANonAdmin"/><group name="TestLAAdmin"/>
</security-role><security-role name="UnityAdmin">
<group name="UnityAdmins" /><group name="TestLAAdmin"/>
</security-role>
9. To start the IBM Operations Analytics - Log Analysis server, use the followingcommand:<HOME>/IBM/LogAnalysis/utilities/unity.sh -start
10. To add LDAP users to IBM Operations Analytics - Log Analysis, log in asunityadmin.
Note: You can delete the LDAP user registered with IBM Operations Analytics- Log Analysis but you cannot edit or delete the actual LDAP users.
11. To add roles and permissions to LDAP users, open the IBM OperationsAnalytics - Log Analysis UI and click Administrative Settings. For moreinformation about adding roles and permissions, see the Adding users to rolesand Adding permissions to roles topics in the Users and roles section of theConfiguring guide.
12. Users who are deleted from the LDAP registry must be removed from IBMOperations Analytics - Log Analysis by the unityadmin user to prevent storageof obsolete information in the IBM Operations Analytics - Log Analysis Derbydatabase.
What to do next
After you configure LDAP user registry, you must update the unityadminpassword in the IBM Operations Analytics - Log Analysis configuration files. Formore information, see “Updating passwords in the configuration files” on page 50.
Adding custom groups to the OAuth security role:
To fully enable LDAP authentication, you need to add the OAuth security role tothe LDAP server.
Procedure
1. Open the <HOME>/IBM/LogAnalysis/wlp/usr/servers/Unity/UnityConfig.xmlfile.
2. Add the following code:<oauth-roles>
<authenticated><group name="UnityUsers"/><group name="<Group_name1>/>"<group name="<Group_name2>/>"
</authenticated></oauth-roles>
where <Group_name> are the names of any custom groups that you use. TheUnityUsers role is added by default.
Configuring 49

3. Save your changes.4. To start the IBM Operations Analytics - Log Analysis server, use the following
command:<HOME>/IBM/LogAnalysis/utilities/unity.sh -start
Updating passwords in the configuration files:
In most cases, after you create or change a user or password in your LightweightDirectory Access Protocol (LDAP) application, you do not need to update thepasswords in IBM Operations Analytics - Log Analysis. However, if the new orchanged password is specified in the IBM Operations Analytics - Log Analysisconfiguration files, you must update the files with the new or changedinformation.
Procedure
1. To stop the IBM Operations Analytics - Log Analysis server, use the unity.shscript that is in the <HOME>/IBM/LogAnalysis/utilities:./ unity.sh -stop
2. Optional: If you do update or add a password, you can encrypt the password.To encrypt it, run the unity_securityUtility.sh script that is in the<HOME>/IBM/LogAnalysis/utilities directory. For more information, see“unity_securityUtility.sh command” on page 234.
3. If you change the password that is used by the unityadmin, you must updatethe encrypted password in the following files to match the updated password.To generate the encrypted password use the unity_securityUtility.sh utilityin the <HOME>/IBM/LogAnalysis/utilities directory. For example:unity_securityUtility.sh encode password
v <HOME>/IBM/LogAnalysis/utilities/datacollector-client/javaDatacollector.properties. For example:#The password to use to access the unity rest servicepassword={aes}EF712133E0677FEBB30624BA5EE62BC2
v <HOME>/IBM/LogAnalysis/remote_install_tool/config/rest-api.properties.For example:ibm.scala.rest.password={aes}EF712133E0677FEBB30624BA5EE62BC2
v <HOME>/IBM/LogAnalysis/UnityEIFReceiver/config/unity.conf. For example:unity.data.collector.password={aes}EF712133E0677FEBB30624BA5EE62BC2
v <HOME>/IBM/LogAnalysis/solr_install_tool/scripts/register_solr_instance.sh. For example:PASSWD={aes}EF712133E0677FEBB30624BA5EE62BC2
4. If you change the password that is used by the unityadmin, you must updatethe password parameter in the <HOME>/IBM/LogAnalysis/utilities/pkg_mgmt.shscript.password={aes}7A0B2401A8E29F37CD768CB78E205CAD
5. To start the IBM Operations Analytics - Log Analysis server, use the unity.shscript that is in the <HOME>/IBM/LogAnalysis/utilities directory:./ unity.sh -start
Configuring Secure Sockets Layer (SSL)To ensure that you can communicate in a secure way, you can configure SSL.
50 IBM Operations Analytics - Log Analysis: Installation, Configuration, and Administration Guide

Configuring CA certificates for SSL:
Use this example to help you to deploy your certificate authority (CA) certificatesas part of your implementation of SSL.
Assumptions and prerequisites
This example assumes that you purchased a CA certificate from a third-partyvendor. It is intended to help you with your configuration. The exact steps candiffer depending on your installation and configuration.
If you deployed a keystore certificate, you need the old keystore file, the<HOME>/IBM/LogAnalysis/wlp/usr/servers/Unity/resources/security/key.js file.
Deploying the certificate
To deploy this certificate, you complete the following steps:
1. Generate the key
The first step is not required for all installations. Log Analysis generates akey when it is installed. However, some CAs require a specific value, forexample for -dname.
To generate the key, run the following command:./keytool -genkey -keystore ~/IBM/LogAnalysis/wlp/usr/servers/Unity/resources/security/key.jks-storepass loganalytics -keypass loganalytics -validity 365-dname "CN=abc12345678.in.example.com, OU=IT, O=EXAMPLE LTD,L=Bangalore,S=Karnataka, C=IN" -alias default -keyalg RSA-sigalg SHA1withRSA –keysize 2048-ext san=dns:localhost.localdomain,dns:abc12345678,dns:abc12345678.example.com,dns:localhost,ip:1.234.56.78
The keystore file for Log Analysis is <HOME>/IBM/LogAnalysis//wlp/usr/servers/Unity/resources/security/key.jks.
The value for the -dname parameter is the domain that your server isidentified with. The details that are specified here are used to identify theserver. For example, this parameter is specified as follows in this example:-dname "CN=abc12345678.in.example.com, OU=IT, O=EXAMPLE LTD,L=Bangalore,S=Karnataka, C=IN"
where CN is the common name. OU is the organizational unit. O is theorganization. L is the location. S is the state or province. C is the country.
2. Refresh the client runtimes with the new certificateAfter you generate the keystore in the first step, a default self-signedcertificate is generated with an alias called default. You need to export thiscertificate to a file. After this step is done, you can import the file into the<HOME>/IBM/LogAnalysis/ibm-java folder that is part of the folders that arecreated by Log Analysis when it is installed. Completing this step ensuresthat all the components of Log Analysis use the same certificate.
This step is required because you are generating a new keystore and thischange requires you to refresh the public certificates for the clients.
To export the certificate into a file, run the following command:
Configuring 51

./keytool -exportcert -keystore ~/IBM/LogAnalysis/wlp/usr/servers/Unity/resources/security/key.jks-alias default -file client.crt keystore
password - loganalytics
To import this certificate into the Java runtime environment keystore, enterthe following command:./keytool -import -keystore ~/IBM/LogAnalysis/ibm-java/jre/lib/security/cacerts -alias default -file client.crt
keystore password - changeit
2. Generate the Certificate Signing request (CSR) and send for signing
To generate the CSR, run the following command:./keytool -keystore ~/IBM/LogAnalysis/wlp/usr/servers/Unity/resources/security/key.jks -certreq -alias default-keyalg rsa -file csr-req.txt
Send the CSR that you generated to your CA for signing. The CA sendsyou three files, a root file, an intermediate certificate, and a primarycertificate.
3. Import the root fileTo import the root file, enter the following command:./keytool -import -trustcacerts -keystore ~/IBM/LogAnalysis/wlp/usr/servers/Unity/resources/security/key.jks -alias theCARoot -file root.cer.txt
Enter keystore password:Certificate already exists in system-wide CA keystore under aliasverisignclass3g5ca
Do you still want to add it to your own keystore? [no]: yesCertificate was added to keystore
4. Import the intermediate certificateTo import the intermediate certificate, run the following command:[yogesh@scm91135985 bin]$ ./keytool -import -trustcacerts -keystore~/IBM/LogAnalysis/wlp/usr/servers/Unity/resources/security/key.jks-alias theIntermediate-file intermediate.cer.txt
Enter keystore password:Certificate was added to keystore
5. Import the primary certificateTo import the primary certificate, run the following command:[yogesh@scm91135985 bin]$ ./keytool -import -trustcacerts -keystore~/IBM/LogAnalysis/wlp/usr/servers/Unity/resources/security/key.jks-alias default-file scm91135985.in.ibm.com.crt.txt
Enter keystore password:Certificate reply was installed in keystore
Configure Transport Layer Security (TLS)To ensure that you can communicate in a secure way, you can configure TLS.
Configuring Transport Layer Security (TLS):
Configure the Secure Sockets Layer (SSL) configuration to use the TLS 1.2 protocol.
52 IBM Operations Analytics - Log Analysis: Installation, Configuration, and Administration Guide

About this task
The Liberty profile supports a flexible SSL configuration that allows for multipleSSL settings, including SSL configuration to use the TLS 1.2 protocol.
Procedure
1. To stop Log Analysis, enter the following command:<HOME>/IBM/LogAnalysis/utilities/unity.sh -stop
2. Open the <HOME>/IBM/LogAnalysis/wlp/usr/servers/Unity/server.xml file.3. To configure your SSL configuration to use the TLS 1.2 protocol, edit the ssl id
and sslProtocol line as follows.ssl id=“defaultSSLConfig” sslProtocol=“TLSv1.2”
4. To restart Log Analysis, enter the following command.<HOME>/IBM/LogAnalysis/utilities/unity.sh -restart
For more information about configuring SSL and TLS, and for scenarioexamples, see Configuring SSL for Liberty.
Configuring single sign-on (SSO) with the Tivoli Integrated PortalYou can configure SSO authentication between the Tivoli Integrated Portal andIBM Operations Analytics - Log Analysis.
Before you beginv The Tivoli Integrated Portal server and the IBM Operations Analytics - Log
Analysis server must use the same LDAP server for authentication.v The Tivoli Integrated Portal server must use a Lightweight Directory Access
Protocol (LDAP) server for authentication.v You must configure SSO for the Tivoli Integrated Portal. To configure SSO:
1. Log in to the Tivoli Integrated Portal server2. In the Security area, click Global security.3. In the Authentication area, click Single-sign on (SSO).4. Ensure that the Enabled check box is selected.5. The domain value that you must have to complete step 4 is displayed in the
Domain name field. If this field is blank, enter the domain name and clickApply.
Procedure1. To export the Lightweight Third-Party Authentication (LTPA) keys file from the
Tivoli Integrated Portal, complete the following steps:a. Log on to the Tivoli Integrated Portal as an administrator.b. In the Security area, click Global security.c. In the Authentication area, click LTPA.d. In the Cross-cell single sign on area, enter a password for the keys file in
the Password field. Confirm the password.e. Create a blank plain text file to use as the keys file. Note the directory that
you store the file in.f. Enter the location where the keys file that you created in the previous step is
stored in the Fully qualified key file name field. The value must point tothe properties file that contains the keys that you want to export. Forexample, for a Windows operating system, enter C:\keys.properties. For aUnix-based operating system, enter <tip_home_dir>/profiles/TIPProfile.
Configuring 53

g. Click Export keys.2. Add the Tivoli Integrated Portal LDAP realm to the IBM Operations Analytics -
Log Analysis LDAP configuration. Ensure that the LDAP realm that is specifiedhere is the same as the one used by Tivoli Integrated Portal. To specify therealm, edit the ldap_realm_property property in theldapRegistryHelper.properties file:ldap_realm_property=<LdapRegistryRealm>
where <LdapRegistryRealm> is the realm that is used by the Tivoli IntegratedPortal. To find this value:a. Log on to the Tivoli Integrated Portal.b. In the Security area, click Global security.c. In the User account repository area, click Configure.d. The LDAP realm value is displayed in the Realm name field. You specify
this same value in the ldapRegistryHelper.properties file.3. To add the updated realm to the LDAP configuration for IBM Operations
Analytics - Log Analysis and to enable LDAP authentication, run theldapRegistryHelper.sh script. For more information, see“ldapRegistryHelper.sh command” on page 46.
4. Configure LTPA on the Liberty Profile for the WebSphere® Application Server:a. Copy the LTPA keys file that you exported from the Tivoli Integrated Portal
server in step 1 to the <HOME>/IBM/LogAnalysis/wlp/usr/servers/Unity/resources/security directory on the IBM Operations Analytics - LogAnalysis server. The folder contains a default keys file. Do not change thisfile. Use a different name for your own key file.
b. Go to the <HOME>/IBM/LogAnalysis/wlp/usr/servers/Unity directory.c. To add the SSO tag to the IBM Operations Analytics - Log Analysis server,
add the following line to the server.xml file before the final server tag:<webAppSecurity ssoDomainNames="<SSO_domain>" />
where <SSO_domain> is the SSO domain, for example example.com. Thisvalue must match the SSO domain that is used by the Tivoli IntegratedPortal server. Specify the same value as the one that is entered in theDomain name field on the Tivoli Integrated Portal UI.
d. To add the LTPA tag to the IBM Operations Analytics - Log Analysis server,add the following line to the server.xml file before the final server tag:<ltpa keysFileName="${server.output.dir}/resources/security/<ltpa_key_file>"keysPassword="<keysPassword>" expiration="120" />
v where <ltpa_key_file> is the LTPA key file, for exampleexample_ltpa.keys.
v <keysPassword> is the LTPA password that you entered in step 1 whenyou created the LTPA key file on the Tivoli Integrated Portal server.
(Optional) You can use the unity_securityUtility command that is in the<HOME>/IBM/LogAnalysis/wlp/bin/ directory to generate an encryptedpassword. After you generate the encrypted password, enter it as the valuefor the keysPassword parameter.
5. Restart the IBM Operations Analytics - Log Analysis server and verify that theSSO connection between the two servers is working.
54 IBM Operations Analytics - Log Analysis: Installation, Configuration, and Administration Guide

Results
To verify that the SSO connection is correctly set up, log in to the Tivoli IntegratedPortal server. Open a new tab page in the browser and log in to IBM OperationsAnalytics - Log Analysis. If you are not prompted for the user name andpassword, the SSO connection is set up correctly. If you are prompted for the logindetails, the SSO connection is not configured correctly.
Configuring single sign-on (SSO) with Jazz for ServiceManagementIf you want to integrate data from IBM Operations Analytics - Log Analysis withthe Dashboard Application Services Hub component of Jazz for ServiceManagement, you need to configure SSO between IBM Operations Analytics - LogAnalysis and Jazz for Service Management.
Before you beginv Jazz for Service Management server must use a Lightweight Directory Access
Protocol (LDAP) server for authentication.v Jazz for Service Management server and the IBM Operations Analytics - Log
Analysis server must use the same LDAP server for authentication.v You must configure SSO for the Jazz for Service Management server. For more
information, see the Configuring SSO on the application server topic in the Jazzfor Service Management Knowledge Center at http://www-01.ibm.com/support/knowledgecenter/SSEKCU/welcome?lang=en.
Procedure1. Export the Lightweight Third-Party Authentication (LTPA) keys file from the
Jazz for Service Management server. For more information, see the ExportingLTPA keys topic in the Jazz for Service Management Knowledge Center athttp://www-01.ibm.com/support/knowledgecenter/SSEKCU/welcome?lang=en.
2. Add the Jazz for Service Management LDAP realm to the IBM OperationsAnalytics - Log Analysis LDAP configuration. Ensure that the LDAP realm thatis specified here is the same as the one used by Jazz for Service Management.To specify the realm, edit the ldap_realm_property property in theldapRegistryHelper.properties file:ldap_realm_property=<LdapRegistryRealm>
where <LdapRegistryRealm> is the realm that is used by Jazz for ServiceManagement.
3. To add the updated realm to the LDAP configuration for IBM OperationsAnalytics - Log Analysis and to enable LDAP authentication, run theldapRegistryHelper.sh script. For more information, see“ldapRegistryHelper.sh command” on page 46.
4. Configure LTPA on the Liberty Profile for the WebSphere Application Server:a. Copy the LTPA keys file that you exported from the Jazz for Service
Management server in step 1 to the <HOME>/IBM/LogAnalysis/wlp/usr/servers/Unity/resources/security directory on the IBM OperationsAnalytics - Log Analysis server. The folder contains a default keys file. Donot change this file. Use a different name for your own key file.
b. Go to the <HOME>/IBM/LogAnalysis/wlp/usr/servers/Unity directory.c. To add the SSO tag to the IBM Operations Analytics - Log Analysis server,
add the following line to the server.xml file before the final server tag:
Configuring 55

<webAppSecurity ssoDomainNames="<SSO_domain>" />
where <SSO_domain> is the SSO domain, for example example.com. Thisvalue must match the SSO domain that is used by the Jazz for ServiceManagement server. Specify the same value as the one that is entered in theDomain name field on the Jazz for Service Management UI.
d. To add the LTPA tag to the IBM Operations Analytics - Log Analysis server,add the following line to the server.xml file before the final server tag:<ltpa keysFileName="${server.output.dir}/resources/security/<ltpa_key_file>"keysPassword="<keysPassword>" expiration="120" />
v where <ltpa_key_file> is the LTPA key file, for exampleexample_ltpa.keys.
v <keysPassword> is the LTPA password that you entered in step 1 whenyou created the LTPA key file on the Tivoli Integrated Portal server.
(Optional) You can use the unity_securityUtility command that is in the<HOME>/IBM/LogAnalysis/wlp/bin/ directory to generate an encryptedpassword. After you generate the encrypted password, enter it as the valuefor the keysPassword parameter.
5. Restart the IBM Operations Analytics - Log Analysis server and verify that theSSO connection between the two servers is working.
Results
To verify that the SSO connection is correctly set up, log in to the Jazz for ServiceManagement server. Open a new tab page in the browser and log in to IBMOperations Analytics - Log Analysis. If you are not prompted for the user nameand password, the SSO connection is set up correctly. If you are prompted for thelogin details, the SSO connection is not configured correctly.
SystemBefore you can use Log Analysis, you need to configure the system.
Configuring the data archiveTo optimize performance, configure the length of time that IBM OperationsAnalytics - Log Analysis stores data in the archive.
About this task
You must configure the archive period before you load any data.
To facilitate query performance, IBM Operations Analytics - Log Analysis uses datatiers to prioritize the retrieval of the most recent information.
IBM Operations Analytics - Log Analysis divides data into two tiers, the currenttier and the archive tier. Data is held in the current tier for the specified period.After this time elapses and more data is loaded, it is moved to the archive tier.Data that is stored in the current tier is stored in memory. Therefore, the queriescan access this data more quickly than data in the archive tier.
You use the HOT_TIER_PERIOD parameter to specify the number of days that data isheld in the current tier. For example, if the HOT_TIER_PERIOD parameter is set to 2,data is held in the current tier for two days until the next ingestion of data.
56 IBM Operations Analytics - Log Analysis: Installation, Configuration, and Administration Guide

The length of the time period that you specify for the HOT_TIER_PERIOD parameteraffects the amount of memory that IBM Operations Analytics - Log Analysis uses.The longer the period, the greater the memory used.
Procedure1. To stop the IBM Operations Analytics - Log Analysis server, use the following
command:<HOME>/IBM/LogAnalysis/utilities/unity.sh -stop
2. Open the unitysetup.properties file that is in the <HOME>/IBM/LogAnalysis/wlp/usr/servers/Unity/apps/Unity.war/WEB-INF directory.
3. To specify the number of days that data is stored in the current tier, change thevalue for the HOT_TIER_PERIOD parameter. The default value is 2:HOT_TIER_PERIOD=2
4. Save the file.5. To start the IBM Operations Analytics - Log Analysis server, use the following
command:<HOME>/IBM/LogAnalysis/utilities/unity.sh -start
Results
Data is held in the current tier until the next data ingestion for the specifiedperiod.
Configuring Hadoop for long term data storage
Before you can use Hadoop for long term data storage, you must configure theintegration with IBM Operations Analytics - Log Analysis.
Why should I use Hadoop?
Hadoop offers a more efficient method for long term data storage that you can useto store long term data from annotated log files. The integration with IBMOperations Analytics - Log Analysis is facilitated by a service that is bundled withIBM Operations Analytics - Log Analysis 1.3.1 and ensures that you can continueto search this data without need to store the data in the main database.
Hadoop integrations
There are two Hadoop integration options available to IBM Operations Analytics -Log Analysis users.
IBM InfoSphere® BigInsights® HadoopIBM InfoSphere BigInsights delivers a rich set of advanced analyticscapabilities that allows enterprises to analyze massive volumes ofstructured and unstructured data in its native format. For moreinformation, see the IBM InfoSphere BigInsights documentation athttp://www-01.ibm.com/support/knowledgecenter/SSPT3X/SSPT3X_welcome.html
Cloudera HadoopCloudera provides a scalable, flexible, integrated platform that makes iteasy to manage rapidly increasing volumes and varieties of data in your
Configuring 57

enterprise. For more information, see the Cloudera documentation athttp://www.cloudera.com/content/cloudera/en/documentation/core/latest/topics/introduction.html
Architecture
IBM Operations Analytics - Log Analysis stores the log data on to the Hadoopcluster and allows users to search data that is stored in Hadoop. IBM OperationsAnalytics - Log Analysis, with the help of the IBM Operations Analytics - LogAnalysis service that is installed on each datanode, writes the data to the Hadoopcluster. The data is written in the avro object container file format. For moreinformation about object container files, see http://avro.apache.org/docs/1.7.4/spec.html#Object+Container+Files. Data is then written to each datanode where theservice is installed. You can use IBM Operations Analytics - Log Analysis to searchthis data.
You can also run IBM Operations Analytics - Log Analysis searches on the datastored on the Hadoop cluster.
The following graphic displays an overview of the service architecture:
58 IBM Operations Analytics - Log Analysis: Installation, Configuration, and Administration Guide

Prerequisite tasks:
To enable the Hadoop tier in IBM Operations Analytics - Log Analysis, completethe prerequisite tasks.
Complete these tasks before you configure the Hadoop tier.
Hadoop cluster
Ensure that a IBM InfoSphere BigInsights Hadoop or Cloudera Hadoop is installedin your environment, and that the IBM Operations Analytics - Log AnalysisHadoop tier was tested with IBM InfoSphere BigInsights Hadoop 3.0.0.1 orCloudera Hadoop 5.3.0.
IBM Operations Analytics - Log Analysis
Ensure that IBM Operations Analytics - Log Analysis is installed.
Datanode username configuration
1. Create a user for each datanode on the Hadoop cluster.2. Ensure that the username for each datanode is the same as the IBM Operations
Analytics - Log Analysis username on the IBM Operations Analytics - LogAnalysis server.
Enable the Hadoop tier:
Before you can use Hadoop for long-term data storage, you must enable theHadoop tier.
Integrating the Hadoop client:
Before you can enable the Hadoop tier, you must prepare the Hadoop client.
Procedure
1. Create a folder that is called hadoop-jars on the IBM Operations Analytics -Log Analysis server.
2. Copy the Hadoop client from the Hadoop cluster. Choose one of the followingoptions for your chosen Hadoop integration for IBM Operations Analytics - LogAnalysis.v IBM InfoSphere BigInsights Hadoop
a. Open the IBM InfoSphere BigInsights administration webpage. Forexample, http://<BI_Cluster_Manager_Host>:8080
b. Click Download client library and development software.c. To download the client package, select Job Submission API package.d. Download and extract the client package.e. Copy the jar and xml files from the client package to the hadoop-jars
folder created in step 1.
Note: If IBM Operations Analytics - Log Analysis is installed on Linux onSystem z based operating system with IBM InfoSphere BigInsights 3.0.0 onx-86, you must replace the hadoop-core.jar with the hadoop-core-2.2.0-mr1.jar. The hadoop-core.jar was copied from the IBM InfoSphereBigInsights Hadoop cluster. The hadoop-core-2.2.0-mr1.jar is supplied with
Configuring 59

IBM Operations Analytics - Log Analysis, and located here:<HOME>/IBM/LogAnalysis/utilities/hadoop/BigInsights_3.0.0
v Cloudera Hadoopa. Navigate to the Cloudera parcels folder on the Cloudera Hadoop cluster.
For example: /opt/cloudera/parcels/CDH-5.3.0-1.cdh5.3.0.p0.30/lib/hadoop/client
b. Copy the jar files from the Cloudera parcels folder to the hadoop-jarsfolder created in step 1. For information about obtaining jar files, see theCloudera documentation: http://www.cloudera.com/content/cloudera/en/documentation/core/latest/topics/cdh_vd_hadoop_api_dependencies.html
c. Open the cluster managers webpage. For example, http://<CDH_Cluster_Manager_Host>:7180/cmf/home.
d. Download the Client Configuration Files for YARN services. For moreinformation about downloading the client configuration files, see theCloudera documentation: http://www.cloudera.com/content/cloudera/en/documentation/core/latest/topics/cm_mc_client_config.html
e. Extract and copy the xml files to the hadoop-jars folder created in step 1.
Setting up the Hadoop tier:
Before you can enable the Hadoop tier, you must set up the Hadoop tier.
Procedure
1. Create a folder that is called LA_HADOOP_TIER on the Hadoop Distributed FileSystem (HDFS). For example, to use the command-line utility to create the folder,run the following command:hadoop fs -mkdir /<la-hadoop-tier>
This folder is exclusively used by the IBM Operations Analytics - Log AnalysisHadoop tier.
2. Create the following folders in the LA_HADOOP_TIER folder.
LA_HADOOP_TIERThis folder is used to ingest the data.
LA_HADOOP_TIER/jarsThis folder is used to store the jar files required by the map-reduce job.
LA_HADOOP_TIER/outputThis folder is used as temporary storage during a IBM OperationsAnalytics - Log Analysis search query execution over the Hadoop tier.
For example, to use the command-line utility to create these folders, enter thefollowing commands in the command-line:hadoop fs -mkdir /la-hadoop-tier/datahadoop fs -mkdir /la-hadoop-tier/jarshadoop fs -mkdir /la-hadoop-tier/output
3. Change the ownership of these folders to the LA use. For example, to use thecommand-line utility to change the ownership of the folders created in step 2 tothe LA user, enter the following command:./hadoop fs -chown -R LA:LA /la-hadoop-tier
4. Verify the creation and ownership of these folders. For example, to use thecommand-line utility to verify folder details, enter the following commands:hadoop fs -ls /hadoop fs -ls /la-hadoop-tier
60 IBM Operations Analytics - Log Analysis: Installation, Configuration, and Administration Guide
5. Copy and extract the search.zip from <HOME>/IBM/LogAnalysis/utilities/hadoop to a temporary folder on the Hadoop cluster. For example:/tmp/la-search-jars
6. Upload the jars from the temporary folder to HDFS. For example, to use thecommand-line utility to load the files from the temporary folder to HDFS, enterthe following command:hadoop fs -copyFromLocal /tmp/la-search-jars/*.jar /la-hadoop-tier/jars
7. To ensure that the LA user can launch a MapReduce job to the Hadoop cluster,log in as the LA user and launch a test map-reduce job.For more information about how to launch a map-reduce test on the ClouderaHadoop, see Running a MapReduce Job in the Cloudera documentation:http://www.cloudera.com/content/cloudera/en/documentation/core/latest/topics/cm_ig_testing_the_install.html
Installing the IBM Operations Analytics - Log Analysis service:
The IBM Operations Analytics - Log Analysis Hadoop tier requires a IBMOperations Analytics - Log Analysis service on each datanode server in theHadoop cluster.
About this task
The IBM Operations Analytics - Log Analysis server pushes the log data to theIBM Operations Analytics - Log Analysis service. The data is then written to theHDFS.
Procedure
To install the IBM Operations Analytics - Log Analysis service, complete thefollowing steps.1. Log in as the LA user to one of the datanodes in the Hadoop cluster.2. Create a folder that is called LA_SERVICE_HOME. For example,
<HOME>/IBM/LogAnalysis/LA_SERVICE_HOME
3. Copy and extract the service.zip from <HOME>/IBM/LogAnalysis/utilities/hadoop to the LA_SERVICE_HOME folder.
4. Copy the LA_HADOOP_TIER/jars folder to the LA_SERVICE_HOME/lib folder.5. Review, and modify if required, the values for the environment variables in
LA_SERVICE_HOME/bin/env.sh.6. Copy the LA_SERVICE_HOME folder to all datanodes in the Hadoop cluster.
Setting up IBM Operations Analytics - Log Analysis for the Hadoop tier:
Before you can enable the Hadoop tier, you must set up IBM Operations Analytics- Log Analysis for the Hadoop tier.
Procedure
1. Stop the IBM Operations Analytics - Log Analysis server. For example, to usethe command-line utility to stop the IBM Operations Analytics - Log Analysisserver, enter the following command:./ unity.sh -stop
2. Open the unitysetup.properties in the <HOME>/IBM/LogAnalysis/wlp/usr/servers/Unity/apps/Unity.war/WEB-INF directory. Change the followingproperties:
Configuring 61

v HADOOP_TIER_HDFS_BASE_DIR
Specify the value of <LA_HADOOP_TIER> on HDFS.v INDEX_IMPLEMENTATION=INDEXING_ENGINE
Add Hadoop to the INDEX_IMPLEMENTATION property. For example, changeINDEX_IMPLEMENTATION=INDEXING_ENGINE toINDEX_IMPLEMENTATION=INDEXING_ENGINE, HADOOP
Update default HADOOP_TIER.properties if different from your environment.Ignore the HADOOP_TIER_JOB_TRACKER_URI property.
3. Copy the hadoop-jars folder to the <HOME>/IBM/LogAnalysis/wlp/usr/servers/Unity/apps/Unity.war/WEB-INF/lib directory
4. Start the IBM Operations Analytics - Log Analysis server. For example, to usethe command-line utility to start the IBM Operations Analytics - Log Analysisserver, enter the following command:./ unity.sh -start
Testing the IBM Operations Analytics - Log Analysis Hadoop tier:
To ensure that the IBM Operations Analytics - Log AnalysisHadoop tier is correctlyset up and configured you can run some basic tests.
Procedure
1. Ingest log data to the IBM Operations Analytics - Log Analysis server.a. You can install sample data on the IBM Operations Analytics - Log Analysis
UI, https://<LA_server>:9987/Unity. To ensure that log data is correctlyingested, you can also ingest logs from the Insight Pack that will be used inthe set up.
b. Ingestion results in writing the log data in avro files on the HDFS in the<LA_HADOOP_TIER>/data folder in the form <UnityCollection_Timestamp>/<DATA_SOURCE_NAME>/<DAY_BASED_ON_TIMESTAMP_IN_LOG_RECORDS>/<counter>.avro.
2. Perform searches on the Hadoop tier through the IBM Operations Analytics -Log Analysis web UI, https://<LA_server>:9987/Unity.a. Prepend the search query in the UI with [_hq]. For example, [_hq]*b. The search on the Hadoop tier is run via a map reduce job on the Hadoop
cluster.c. Prepend the same search query in the UI with [_sq], for example, [_sq]*,
and perform the query on an Indexing Engine.d. Compare the search results.
3. To identify errors, open the following files:v UnityApplication.log on the IBM Operations Analytics - Log Analysis
server.v <HOME>/IBM/LogAnalysis/logs/hadooptier.log on the IBM Operations
Analytics - Log Analysis server.v <LA_SERVICE_HOME>/logs on the IBM Operations Analytics - Log Analysis
services server.
Managing the Hadoop service on datanodes:
After you configure the Hadoop service, you can use the server.sh script tomanage the service.
62 IBM Operations Analytics - Log Analysis: Installation, Configuration, and Administration Guide

Procedure
You can choose to manage the service on an individual datanode or manage all ofthe service instances together.v To manage the service on an individual datanode, use the LA user that you
created when you configured the service to log in to a Hadoop datanode server.1. Run the <LA_SERVICE_HOME>/bin/server.sh script with one of the following
parameters:
Start Starts the service on the Hadoop datanode server.
Stop Stops the service on the Hadoop datanode server.
Status Retrieves the status for the Hadoop datanode server.v To manage all of the instances, select one datanode to act as a
LA_Service_Controller_Node. This will manage the service on all of thedatanodes.1. (Optional) Create password-less SSH for the LA user from this datanode to all
of the datanodes, including this datanode, in the Hadoop cluster.2. Use the LA user to login to the LA_Service_Controller_Node datanode.3. Run the <LA_SERVICE_HOME>/bin/server.sh script with one of the following
parameters:
clusterStartStarts the service on each Hadoop datanode server.
clusterStopStops the service on each Hadoop datanode server.
clusterStatusRetrieves the status for each Hadoop datanode server.
If you do not configure password-less SSH connections during the configuration,you are prompted for the password for each datanode server.
Sharing a Hadoop cluster across multiple IBM Operations Analytics - LogAnalysis instances:
Procedure
1. To share a Hadoop cluster across multiple IBM Operations Analytics - LogAnalysis instances, you must integrate the Hadoop service for each IBMOperations Analytics - Log Analysis instance.For more information, see the Integrating the Hadoop service topic inConfiguration guide.a. You must use a different value for each of the following folders:
<LA_HADOOP_TIER> on the HDFS datanode<LA_SERVICE_HOME> in the LA home directory
Alternatively to repeating the steps for each IBM Operations Analytics - LogAnalysis instance, you can create a copy of the resultant folders from a IBMOperations Analytics - Log Analysis instance of the same version.
2. Modify the PORT and PROCESS_ID values in the <LA_SERVICE_HOME>/bin/env.sh file
Configuring 63

GlobalizationSome of the text in IBM Operations Analytics - Log Analysis is only available inEnglish. Some of these texts can be globalized but others cannot. Read thefollowing information to get an overview of what you can and cannot manuallyglobalize.
Limitations
The following data cannot be globalized:
Log file dataLog file data is always displayed in the language that it is used in theoriginal log files. This text is displayed in the Search UI.
Installation directory and filesThe directory where IBM Operations Analytics - Log Analysis is installedand the files that are created during the installation are only available inEnglish.
IBM Operations Analytics - Log Analysis log filesThe log files that are generated by IBM Operations Analytics - LogAnalysis and the associated applications such as IBM Tivoli MonitoringLog File Agent, Indexing Engines, and the WebSphere Application Serverare only available in English.
Artifacts that are created in the Admin UI Artifacts such as Source Types, Collections, Data Sources, File Sets, andRule Sets are only available in English. If a user creates one of these objectsin another language, the artifacts are only available in that language.
Sample log filesThe log files that are used by the sample scenarios are only available inEnglish.
Insight PacksOnly the following Insight Packs are available in languages other thanEnglish by default. If you want to localize other content, you need toconfigure this manually. The index configurations that are used by theseInsight Packs are only available in English and are not globalized.v DB2InsightPack_v1.1.0.2v WASInsightPack_v1.1.0.3v JavacoreInsightPack_v1.1.0.3v GenericAnnotationInsightPack_v1.1.1.2v SyslogInsightPack_v1.1.0.3v WebAccessLogInsightPack_v1.1.0.2
IBM Operations Analytics - Log Analysis scriptsScripts such as unity.sh, eifutil.sh, and ldapRegistryHelper.sh are onlyavailable in English and cannot be globalized. This limitation encompassesShell, Python, and Ruby scripts.
Time and date formatsThe time and date format can only be changed for the entire IBMOperations Analytics - Log Analysis installation.
64 IBM Operations Analytics - Log Analysis: Installation, Configuration, and Administration Guide
Globalizing Custom Search Dashboard:
Complete this procedure to globalize Custom Search Dashboard to ensure thatmessages, errors and exceptions, and the Custom Search Dashboard generatedoutput is globalized.
About this task
To enable globalization of the Custom Search Dashboard generated output, theIBM Operations Analytics - Log Analysis framework passes the locale that is usedby your application.
For information about the limitations of the globalization process, see“Globalization” on page 64.
To globalize your Custom Search Dashboard, complete the following steps:
Procedure
1. Open the script that the Custom Search Dashboard is based on. In most cases,this script is the <custom_search_dashboard_name>.app file that is stored in therelevant Insight Pack folder, for example <HOME>/IBM/LogAnalysis/unity_content/WindowsOSEventsInsightPack_<version>/unity_apps/apps. TheCustom Search Dashboard can be based on other languages, such as Pythonand Java.
2. To extract the locale information that is passed from IBM Operations Analytics -Log Analysis to your Custom Search Dashboard, you must add a JSONcompatible code to your Custom Search Dashboard script. For example:{"parameters":[{}],"_fwParameters":[{"name": "locale","value": "<locale>","type": "String"}]}
The following example is in the Python language and it shows how you canextract the locale information that is passed to the Insight Pack or CustomSearch Dashboard from IBM Operations Analytics - Log Analysis:if len(sys.argv) > 1:
filename = str(sys.argv[1])fk = open(filename,"r")data = json.load(fk)locale = data["_fwParameters"][0]["value"]
In this example, the locale is sent to the script from IBM Operations Analytics -Log Analysis in the following format:{
"parameters":[{}
],"_fwParameters":[
{"name": "locale","value": "<locale>",
Configuring 65

"type": "String"}
]}
where <locale> is the locale that you want to use. For example, "value":"en_US".
3. Save and start the application to see the globalized Custom Search Dashboard.
Results
The extracted locale globalizes messages, errors and exceptions, and the CustomSearch Dashboard generated output.
Globalizing dashboards, chart labels, and index configuration fields:
Complete this procedure to globalize index configuration fields, dashboards, andchart labels.
About this task
Dashboard, charts and index configuration fields are globalized by using aresource bundle. The resource bundle is based on the Java resource bundlemechanism and Insight Pack developer needs to create the resource bundle insupported languages. There is one resource bundle for the Insight Pack thatcontains keys for all the artifacts.
The following Insight Packs are available in languages other than English bydefault:v DB2InsightPack_v1.1.0.2v WASInsightPack_v1.1.0.3v JavacoreInsightPack_v1.1.0.3v WindowsOSEventsInsightPack_v1.1.0.3v GenericAnnotationInsightPack_v1.1.1.2v SyslogInsightPack_v1.1.0.3v WebAccessLogInsightPack_v1.1.0.2
All other Insight Packs are only available in English. If you want to globalize theseobjects and the associated content into another language, you must configure thelocale and create a resource bundle.
To globalize your dashboards, charts, and index configuration fields complete thefollowing steps:
Procedure
1. Create a folder that is named i18n in the directory where your Insight Pack isstored.
2. Create a resource bundle file in the i18n folder. The Insight Pack name that youuse in the resource bundle file must match the Insight Pack exactly.<Insight_Pack_Name>_locale.properties
where <Insight_Pack_Name> is the exact name of the Insight Pack that you wantto globalize.
66 IBM Operations Analytics - Log Analysis: Installation, Configuration, and Administration Guide

3. Specify the keys for each artifact that you want to globalize. Keys are values ofthe fields to be translated for globalization. For example, the value of the"name" field for your Custom Search Dashboard or dashboard in the .app file.If you do not specify a value in the resource bundle file, the existing name isused by default. Keys that are not specified in the resource bundle aredisplayed in English. The resource bundle supports three different types ofspecification:
Global keyskey=value
Global key applies to all artifacts in the Insight Pack.
Global artifact keysartifact_type.key=value
Global artifact key applies to all artifacts under a specific artifact type.
Specific artifact keysartifact_type.artifact_name.key=value
Specific artifact keys override the general key.
The following artifact_types are supported:v sourcetypev customapp
The artifact name is the name that you created, for exampleWASSystemOut.
You can specify globalized text for each of the following artifacts:
Index configurationTo globalize the field names in the index configuration, specify the fieldnames and the localized text in the resource bundle:sourcetype.<Source_Type_name>.<Index_Configuration_Field> = Localized_text
For example:sourcetype.WASSystemOut.severity = severity_translatedsourcetype.WASSystemErr.message = message_translatedsourcetype.WASTrace.msgclassifier = msgclassifier_translated
Custom Search Dashboard nameTo specify a globalized version of a Custom Search Dashboard name,you must specify the name that is used in the Custom SearchDashboard specification file in the resource bundle. For example, thename in the Custom Search Dashboard specification file is:"name":"Error Analysis"
You specify the following information in the resource bundle:customapp.<custom_app_name>.Error\ Analysis = Log Severity Trend
Log Severity Trend is displayed as the application name on the UI.
Tags in the Search DashboardWhen you create a Custom Search Dashboard, it is displayed in theSearch Dashboards pane in the Search UI. The Custom SearchDashboard is grouped under a directory. The name of this directory isglobalized by using tags. To globalize this tag name, you need tospecify the tag in the resource bundle as:customapp.tag.<Insight_Pack_Name> = SEVERITY ANALYSIS
Configuring 67

where <Insight_Pack_Name> is the name of the Insight Pack.
For example:customapp.tag.NewAppPack_v1.1.0.0 = SEVERITY ANALYSIS
The tag name SEVERITY ANALYSIS is displayed on the UI.
Chart titlesThe chart titles are specified as follows in the chart specification:spec: “title”: "Event Diagnostics"
To globalize the title, add it to the resource bundle:customapp.<custom_app_name>.Event\ Diagnostics = Error while ingesting data
Labels for chart axisThe labels that are used to identify chart axis are specified by the labelparameter in the chart specifications. For example:"parameters": [{"type": "Axis", "name": "xaxis", "label":"xlabel"},{"type": "Axis", "name": "yaxis", "datatype":"number","label":"ylabel"},],
The new axis labels from chart specification should be used in yourCustom Search Dashboard specification."charts": [{ "title": "Event Diagnostics", “labels":{"xlabel":"timestamp", "ylabel":"Counter"},]
To globalize the label names, specify the globalized text in the resourcebundle in the following format:customapp.<custom_app_name>.<Label_name> = <Localized_name>
where <Label_name> is the name that is specified in the chartspecifications. <Localized_name> is the name that you want to displayon the UI. For example:customapp.<custom_app_name>.Counter = Counter_t
Counter_t is the axis name that is displayed on the UI.4. Package the Insight Pack as the next version and use pkg_mngt.sh utility to
update the Insight Packs.
Enabling facet cache for wildcard searchesIf you use the wildcard search term (*) to search data that is older than 1 day, youcan configure Log Analysis to count facets before they are indexed for search. Thissetting can help optimize this type of search.
Procedure1. Open the <HOME>/IBM/LogAnalysis/wlp/usr/servers/Unity/apps/Unity.war/
WEB-INF/unitysetup.properties file.2. Change the ENABLE_SOLR_FACET_CACHE=false parameter to true.3. Save the file.4. To restart Log Analysis, enter the following command:
./<HOME>/IBM/LogAnalysis/utilities/unity.sh -restart
68 IBM Operations Analytics - Log Analysis: Installation, Configuration, and Administration Guide

Configuring scalable data streaming from multiple, remotesourcesTo facilitate dynamic data streaming that is scalable across multiple remote sources,you must configure IBM Operations Analytics - Log Analysis after you install it.
To enable data collection from remote hosts, you must complete the followingsteps:1. Install Apache Solr on the remote machine.2. Set up Secure Shell (SSH) communication.3. Configure SSH to work with the remote installer utility.4. Use the remote installer utility to install instances of the Event Integration
Facility (EIF) or the IBM Tivoli Monitoring Log File Agent (LFA) on remotemachines.
5. Configure the EIF so that it is compatible with the remote instances that yourcreate. If you use the LFA, you do not have to configure the local installation.However, you do have to manually configure the sub nodes.
You can also maintain and administer these connections after you set them up.
As an alternative to streaming data, You can batch load data. For moreinformation, see “Loading and streaming data” on page 258.
Installing Apache Solr on remote machines:
After you install IBM Operations Analytics - Log Analysis, you can use the ApacheSolr remote installer to install Apache Solr on a remote machine.
About this task
If no local instances of Apache Solr exist, then you need to install the instances onthe remote machine as soon as you install IBM Operations Analytics - LogAnalysis. If there is a local instance of Apache Solr, you can install the remoteinstances whenever you want.
You must use a non-root user to run the script.
You cannot use the installer to install Apache Solr on a local machine.
You cannot use the installer to install multiple Apache Solr nodes on a singleremote machine.
Ensure that the Apache Solr ports are open and free from any firewall restrictionson the remote machine.
To install Apache Solr on multiple remote machines, run the script separately foreach remote machine. You cannot use the installer to install instances of ApacheSolr simultaneously or in parallel.
Procedure
1. Change the directory to <HOME>/IBM/LogAnalysis/solr_install_tool. Forexample:cd <HOME>/IBM/LogAnalysis/solr_install_tool
2. To run the remote_deploy.sh script, enter the following command:./remote_deploy_solr.sh -install
Configuring 69

3. The script prompts you for the following information:
Remote Hostname in FQDN formatEnter the Fully Qualified Domain Name (FQDN) of the remote host.
UsernameEnter the user name.
PasswordEnter the password if password-less SSH authentication is disabled. Ifpassword-less SSH is enabled between the IBM Operations Analytics -Log Analysis server and the remote host, the script reads the valuesthat are specified in the ssh_config.properties file in the<HOME>/IBM/LogAnalysis/utilities/config directory. For moreinformation, see the Setting up Secure Shell to use key-based authenticationtopic in the IBM Operations Analytics - Log Analysis informationcenter.
SSH PortEnter the remote machine port that is used for SSH. To use the defaultvalue of 22, press enter.
Top-level Installation DirectoryTo use the default value, which is <HOME>, press enter. Alternatively, youcan enter the path to the directory where you want to install the DE.
Apache Solr Search PortTo use the default value, 9989, press enter. To use another port, enterthe port number for another valid port. Do not enter a port that isbeing used for something else.
Apache Solr Query Service PortTo use the default value, 7205, press enter. To use another port, enterthe port number for another valid port. Do not enter a port that isbeing used for something else.
4. To start the installation, press enter. In most cases, the installation takes about 5minutes to complete.
Results
The results of the installation are output in the log file in the <HOME>/IBM/LogAnalysis/solr_install_tool/logs/ManageSolrnodes.log file.
To view the status for the instances of Apache Solr that are installed remotemachines, run the unity.sh -status command.
Example
Here is an example script output:Remote Hostname in FQDN format:12345.example.comusername:unitypassword:*********SSH port: [22]Top-level Installation Directory: [/home/unity]Solr Search Port: [9989]Solr Query Service Port: [7205]
Script is ready for remote installation of Solr:Review the following inputs ....-----------------------------------------------------------------------------Remote Host Name: 12345.example.com
70 IBM Operations Analytics - Log Analysis: Installation, Configuration, and Administration Guide

Remote User Name: unityRemote SSH Port: 22Top-level remote installation directory: /home/unitySolr v9.0 - remote installation directory:/home/unity/IBM/LogAnalysisSolr - remote ports: 9989, 7205------------------------------------------------------------------------[’q’ - Abort][’Enter’ - Install]
Sat Nov 16 03:08:38 CST 2013 Starting remote installation of Solr, this will take couple of minutes to complete ....Sat Nov 16 03:08:38 CST 2013 Waiting for remote installation to complete ....Sat Nov 16 03:11:47 CST 2013 Successfully installed SolrSolr on remote host:12345.example.com ....
Removing Apache Solr instances:
Before you remove an installation of IBM Operations Analytics - Log Analysis, youmust remove Apache Solr.
About this task
Note: Do not remove Apache Solr if IBM Operations Analytics - Log Analysis isstill being used. IBM Operations Analytics - Log Analysis does not functionproperly when any instances of Apache Solr are removed. For this reason, onlyremove Apache Solr when you are about to uninstall IBM Operations Analytics -Log Analysis.
If you installed Apache Solr locally and remotely, remove the local instance first,then remove the remotely installed instances.
This process uses Installation Manager to remove Apache Solr instances. You canalso do so silently. To run the silent removal, run following imcl -c command,enter 3 to modify the installation, and remove the instance.
Procedure
1. Change the directory to <HOME>/IBM/LogAnalysis/solr_install_tool. Forexample:cd <HOME>/IBM/LogAnalysis/solr_install_tool
2. To run the remote_deploy.sh uninstall script, enter the following command:./remote_deploy.sh -uninstall
3. The script prompts you for the following information:
Remote Hostname in FQDN formatEnter the Fully Qualified Domain Name (FQDN) of the remote host.
UsernameEnter the user name.
PasswordEnter the password if password less SSH authentication is disabled. Ifpassword less SSH is enabled between the IBM Operations Analytics -Log Analysis server and the remote host, the script reads the valuesthat are specified in the ssh_config.properties file in the<UNITY_HOME>/utilities/config directory. For more information, seethe Setting up Secure Shell to use key-based authentication topic in the IBMOperations Analytics - Log Analysis information center.
Configuring 71

SSH PortEnter the remote machine port that is used for SSH. To use the defaultvalue of 22, press enter.
Top-level Installation DirectoryTo use the default value, which is <HOME>/IBM/LogAnalysis, press enter.Alternatively, you can enter the path to the directory where ApacheSolr is installed.
4. To start the removal, press enter. You can view the logs in the<HOME>/IBM/LogAnalysis/solr_install_tool/logs directory.
Results
When all the remote nodes are removed, you can safely uninstall IBM OperationsAnalytics - Log Analysis.
Setting up Secure Shell to use key-based authentication:
Secure Shell (SSH) is a cryptographic network protocol for secure datacommunication between different computers. You set up key-based authenticationbetween the IBM Operations Analytics - Log Analysis servers and the remotecomputers to which it connects.
About this task
Benefits of using key-based authentication:v Data is transferred across a secure channel.v The administrator is no longer concerned about the password changes for the
remote servers.v The passphrase is independent of the individual server password policy.v One passphrase is used for multiple servers. Only the public key file must be
copied to the client server.
For more information you can view the man pages for ssh-keygen by running thiscommand:man ssh-keygen
Procedure
1. To generate public and private keys, enter the following command:ssh-keygen -t rsa
or either of the following commands:ssh-keygen(This command generates the same results as ssh-keygen -t rsa.)
ssh-keygen -t dsa(If you specify dsa, the generated keys include _dsa in their file names.)
The following example shows what a valid output might look like:
72 IBM Operations Analytics - Log Analysis: Installation, Configuration, and Administration Guide
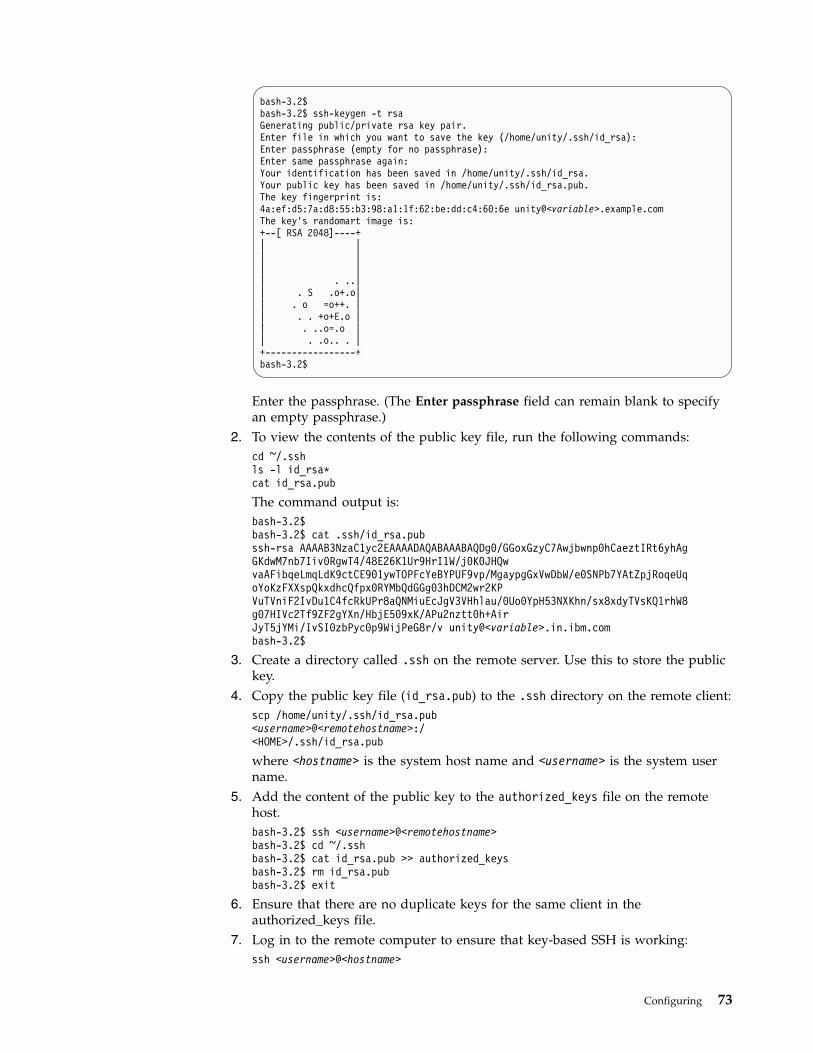
bash-3.2$bash-3.2$ ssh-keygen -t rsaGenerating public/private rsa key pair.Enter file in which you want to save the key (/home/unity/.ssh/id_rsa):Enter passphrase (empty for no passphrase):Enter same passphrase again:Your identification has been saved in /home/unity/.ssh/id_rsa.Your public key has been saved in /home/unity/.ssh/id_rsa.pub.The key fingerprint is:4a:ef:d5:7a:d8:55:b3:98:a1:1f:62:be:dd:c4:60:6e unity@<variable>.example.comThe key’s randomart image is:+--[ RSA 2048]----+| || || || . ..|| . S .o+.o|| . o =o++. || . . +o+E.o || . ..o=.o || . .o.. . |+-----------------+bash-3.2$
Enter the passphrase. (The Enter passphrase field can remain blank to specifyan empty passphrase.)
2. To view the contents of the public key file, run the following commands:cd ~/.sshls -l id_rsa*cat id_rsa.pub
The command output is:bash-3.2$bash-3.2$ cat .ssh/id_rsa.pubssh-rsa AAAAB3NzaC1yc2EAAAADAQABAAABAQDg0/GGoxGzyC7Awjbwnp0hCaeztIRt6yhAgGKdwM7nb7Iiv0RgwT4/48E26K1Ur9HrI1W/j0K0JHQwvaAFibqeLmqLdK9ctCE901ywTOPFcYeBYPUF9vp/MgaypgGxVwDbW/e0SNPb7YAtZpjRoqeUqoYoKzFXXspQkxdhcQfpx0RYMbQdGGg03hDCM2wr2KPVuTVniF2IvDu1C4fcRkUPr8aQNMiuEcJgV3VHhlau/0Uo0YpH53NXKhn/sx8xdyTVsKQ1rhW8g07HIVc2Tf9ZF2gYXn/HbjE509xK/APu2nztt0h+AirJyT5jYMi/IvSI0zbPyc0p9WijPeG8r/v unity@<variable>.in.ibm.combash-3.2$
3. Create a directory called .ssh on the remote server. Use this to store the publickey.
4. Copy the public key file (id_rsa.pub) to the .ssh directory on the remote client:scp /home/unity/.ssh/id_rsa.pub<username>@<remotehostname>:/<HOME>/.ssh/id_rsa.pub
where <hostname> is the system host name and <username> is the system username.
5. Add the content of the public key to the authorized_keys file on the remotehost.bash-3.2$ ssh <username>@<remotehostname>bash-3.2$ cd ~/.sshbash-3.2$ cat id_rsa.pub >> authorized_keysbash-3.2$ rm id_rsa.pubbash-3.2$ exit
6. Ensure that there are no duplicate keys for the same client in theauthorized_keys file.
7. Log in to the remote computer to ensure that key-based SSH is working:ssh <username>@<hostname>
Configuring 73

Enter the passphrase, if prompted.
bash-3.2$ bash-3.2$ ssh <username>@<remotehostname>Enter passphrase for key ’/home/unity/.ssh/id_rsa’:Last unsuccessful login: Mon Jul 15 14:22:37 2013 on ssh from <variable>.example.comLast login: Mon Jul 15 14:26:54 2013 on ssh from <variable>.example.com$
Configuration of key-based authentication is complete.
Results
The steps may not work because different versions of SSH are supported by theoperating systems that are used by the remote servers. For more information abouthow to solve this issue, see the Secure Shell (SSH) configuration does not work topicin the Troubleshooting IBM Operations Analytics - Log Analysis guide.
Configuring secure shell (SSH) communication for multiple remote hosts:
Before you can use the remote installer utility, you must configure the SSH for theremote hosts.
Before you begin
Before you configure SSH for multiple remote hosts, you must configure SSHbetween IBM Operations Analytics - Log Analysis and the remote hosts. For moreinformation, see the Setting up Secure Shell to use key-based authentication topic in theInformation Center.
About this task
By default, the SSH properties file, ssh-config.properties file, is in the<HOME>/IBM/LogAnalysis/remote_install_tool/config directory. If you save the fileto another location, the utility requests that the user enters values for the remotehost, user, and password. In this case, the utility does not use the values specifiedin the file.
If you save the ssh-config.properties file in the <HOME>/IBM/LogAnalysis/remote_install_tool/config directory, the eif_remote_install_tool utility usesthe properties specified in the file.
The SSH communication can be based on a password or public key. If youimplement both options, the public key configurations are used by default.
To set up password based SSH, you specify a value for the password and commentout the private key file. The remote installer utility uses the specified password forSSH authentication when it connects to the remote host.
To set up private key file based authentication, you specify the private key filepath and do not specify a value for the password. The utility uses the file to createa password-less SSH connection.
If you specify values for both the password and the private key file path, theutility uses the file to create a password-less SSH connection.
74 IBM Operations Analytics - Log Analysis: Installation, Configuration, and Administration Guide

If you do not specify a value for the password or the private key file path, IBMOperations Analytics - Log Analysis cannot create a connection and insteadgenerates an error message in the log:
ERROR:example.unity.remote.SshConfigException:
Property file config/ssh-config.properties must contain at least one of:PASSWORD, PATH_OF_PASSWORD_LESS_SSH_KEY
Correct SSH configuration OR reconfigure and retryInstallation Aborted....!
Procedure
1. Navigate to the <HOME>/IBM/LogAnalysis/remote_install_tool/config directoryand open the ssh-config.properties file.
2. Specify values for the following properties for each remote host:v Remote hostv Remote user IDv Portv Connection timeout in milliseconds. The default is 6000.
For example:REMOTE_HOST=<REMOTE_HOST>PORT=<PORT>TIME_OUT=60000USER=<REMOTE_USER>
3. For password-based authentication, you also need to specify the password inthe configuration file. For example:PASSWORD=password1
4. For public key based authentication, specify the path to the directory thatcontains the private key file. For example:PATH_OF_PASSWORD_LESS_SSH_KEY=/home/pass/.ssh/id_rsa
5. If your installation of SSH requires a passphrase, specify the passphrase. Forexample:PASSPHRASE_OF_PASSWORD_LESS_SSH_KEY=passphrase1
Configuring data collection for scalability on multiple remote nodes:
To facilitate scalable data collection on multiple remote nodes, use the install.shcommand to install the Tivoli Event Integration Facility Receiver or the IBM TivoliMonitoring Log File Agent on a remote server.
Before you begin
Before you run the command, you must configure secure shell (SSH)communication between the local installation of IBM Operations Analytics - LogAnalysis and the remote host. For more information about how to do so, see“Configuring secure shell (SSH) communication for multiple remote hosts” onpage 74.
About this task
The install.sh command is in the <HOME>/IBM/LogAnalysis/remote_install_tool/directory on the local installation of IBM Operations Analytics - Log Analysis.
You can use the remote installer in the following scenarios:
Configuring 75

v If you have a high rate of data ingestion on multiple data sources. For example,if you have 100 or more events per second and 20 or more data sources.
v If you require improved throughput performance on the remote server.v If the hardware resources on the remote server are restrained.v If you want to optimize performance according to the conditions described on
the Performance developer works page here: https://www.ibm.com/developerworks/community/wikis/home?lang=en#!/wiki/IBM Log AnalyticsBeta/page/Performance and tuning
You can use the command to deploy up to 20 instances of the Tivoli EventIntegration Facility Receiver or a single instance of the IBM Tivoli Monitoring LogFile Agent on a remote node. The command deploys and configures IBM Java™ 1.8.The command also configures the deployed Tivoli Event Integration FacilityReceiver instance to communicate with the IBM Operations Analytics - LogAnalysis Data Collector interface.
However, this command does not configure the IBM Tivoli Monitoring Log FileAgent subnode. You must configure this setting manually. Both the remote andlocal instance of the IBM Tivoli Monitoring Log File Agent can monitor remotedata sources. For more information about configuring IBM Tivoli Monitoring LogFile Agent, see “Configuring a remote LFA to stream data” on page 267.
To ensure that the remote instances of the Tivoli Event Integration Facility workwith the local Data Collector interface, you must create the remotelydeployedTivoli Event Integration Facility or IBM Tivoli Monitoring Log File Agentinstances as part of the same installation. This is because the encryptionconfiguration and signature generation is done during the main installation. If youinstall IBM Operations Analytics - Log Analysis after you set up the remote nodes,you must install the remote Tivoli Event Integration Facility or IBM TivoliMonitoring Log File Agent instances again. However, you can remove remoteinstances of the Tivoli Event Integration Facility or IBM Tivoli Monitoring Log FileAgent without installing IBM Operations Analytics - Log Analysis again.
Note: If you use the script to install the remote instance on a server that uses theSUSE Linux Enterprise Server 11 operating system, the script fails. To resolve thisissue, see the Cannot install remote EIF instance on SUSE topic in the TroubleshootingIBM Operations Analytics - Log Analysis guide.
Note:
The remote installer that you use to install instances of the IBM Tivoli MonitoringLog File Agent and the Tivoli Event Integration Facility does not support crossoperating system integration. You must use the remote installers to install remoteinstances on servers that use the same operating system. For example, if you installIBM Operations Analytics - Log Analysis on Linux on System z, you must installthe remote instances on Linux on System z. In this example, you cannot installremote instances on Linux on System x.
Procedure
1. Navigate to the <HOME>/IBM/LogAnalysis/remote_install_tool/ directory andrun the install.sh command. You are prompted for a series of inputs.
2. Enter the remote installation directory. This value must be the location wherethe deployed artifacts are installed on the remote host.
76 IBM Operations Analytics - Log Analysis: Installation, Configuration, and Administration Guide
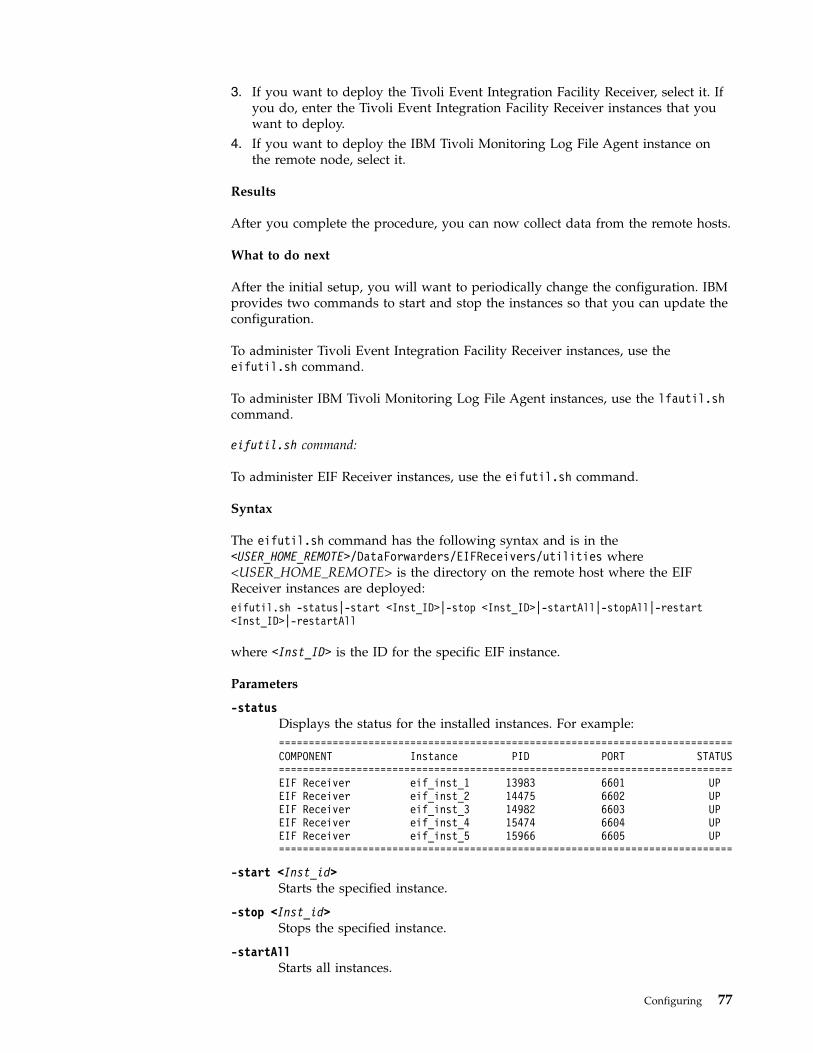
3. If you want to deploy the Tivoli Event Integration Facility Receiver, select it. Ifyou do, enter the Tivoli Event Integration Facility Receiver instances that youwant to deploy.
4. If you want to deploy the IBM Tivoli Monitoring Log File Agent instance onthe remote node, select it.
Results
After you complete the procedure, you can now collect data from the remote hosts.
What to do next
After the initial setup, you will want to periodically change the configuration. IBMprovides two commands to start and stop the instances so that you can update theconfiguration.
To administer Tivoli Event Integration Facility Receiver instances, use theeifutil.sh command.
To administer IBM Tivoli Monitoring Log File Agent instances, use the lfautil.shcommand.
eifutil.sh command:
To administer EIF Receiver instances, use the eifutil.sh command.
Syntax
The eifutil.sh command has the following syntax and is in the<USER_HOME_REMOTE>/DataForwarders/EIFReceivers/utilities where<USER_HOME_REMOTE> is the directory on the remote host where the EIFReceiver instances are deployed:eifutil.sh -status|-start <Inst_ID>|-stop <Inst_ID>|-startAll|-stopAll|-restart<Inst_ID>|-restartAll
where <Inst_ID> is the ID for the specific EIF instance.
Parameters
-statusDisplays the status for the installed instances. For example:============================================================================COMPONENT Instance PID PORT STATUS============================================================================EIF Receiver eif_inst_1 13983 6601 UPEIF Receiver eif_inst_2 14475 6602 UPEIF Receiver eif_inst_3 14982 6603 UPEIF Receiver eif_inst_4 15474 6604 UPEIF Receiver eif_inst_5 15966 6605 UP============================================================================
-start <Inst_id>Starts the specified instance.
-stop <Inst_id>Stops the specified instance.
-startAllStarts all instances.
Configuring 77

-stopAllStops all instances.
-restart<Inst_id>Restarts the specified instance.
-restartAllRestarts all the instances.
lfautil.sh command:
To administer IBM Tivoli Monitoring Log File Agent (LFA) instances, use thelfautil.sh command.
Syntax
The lfautil.sh command has the following syntax and is in the<USER_HOME_REMOTE>/utilities/ directory on the remote host where<USER_HOME_REMOTE> is the directory on the remote host where the LFAinstances are deployed:lfautil.sh -start|-stop|-status|-restart
Parameters
-start Starts all the LFA instances on the remote host.
-stop Stops all the LFA instances on the remote host.
-statusDisplays the status for the LFA instances on the remote host. For example:==========================================COMPONENT PID STATUS==========================================Log File Agent 23995 UP==========================================
-restartRestarts the LFA instances on the remote host.
Deploying content packsUse these content packs to achieve specific business goals using IBM OperationsAnalytics - Log Analysis features.
Each content pack contains the instructions to plan and implement a solution in abusiness context.
The content pack includes links to resources such as configuration and propertyfiles that are configured for each scenario and documentation to guide you throughthe process. You can use these scenarios to configure IBM Operations Analytics -Log Analysis to quickly achieve specific business goals and to explore thecapabilities of the solution.
Deploying the Health and Performance content packUse the Health and Performance content pack to monitor your IBM OperationsAnalytics - Log Analysis logs with the solution itself.
78 IBM Operations Analytics - Log Analysis: Installation, Configuration, and Administration Guide

Before you begin
Download the content pack, which includes a number of customized propertiesand configuration files at:
https://github.com/IBM-ITOAdev/SCALA-Health-and-Performance-Content-Pack
The content pack contains:
Sample logstash configuration fileThe content pack includes a sample logstash configuration file calledscala-health-performance-logstash.conf. You can use it to parse andannotate the following log files in 1.3.0.
Table 7. Log files that are supported by scala-health-performance-logstash.conf
Type Log file name
SCALA-GR GenericReceiver.log
SCALA-UA UnityApplication.log
SCALA-EIFR UnityEIFReceiver.log
SCALA-SOLR solr.log
SCALA-MANAGE-SOLR-NODES ManageSolrnodes.log
SCALA-ZOOKEEPER zookeeper.out
GROK pattern file for logstashThe content pack includes a GROK pattern file for logstash calledSCALAPATTERNS.
Custom DSV properties filesThe content pack includes a number of customized properties files tocreate CSV source types in IBM Operations Analytics - Log Analysis. Thefollowing files are included:v genericReceiver.props
v genericReceiverStats.props
v unityApplication.prop
v ua-stats.props
v unityEIFReceiver.props
v eifr-stats.props
v solr.props
v solrManageNodes.props
v zookeeper.props
Sample dashboard applicationNot available yet.
About this task
After you implement this content pack, you can use logstash to parse log filesgenerated by IBM Operations Analytics - Log Analysis and stream them intocustomized DSV content packs so that you can search and visualize theinformation in the solution. You can use this content pack to help you to use IBMOperations Analytics - Log Analysis to monitor itself. Within IBM, suchdeployments are referred to as 'Manage Our Stuff with Our Own Stuff (MOSWOS)'deployments.
Configuring 79

Procedure1. Decide how you want to load the IBM Operations Analytics - Log Analysis
log file into logstash.You can either use an application, such as rsyslog, syslog-ng, the logstashforwarder or the logstash input file, to stream to data or you can load a batchof historical data.For more information about how to use logstash or load a batch of data, see“Loading and streaming data” on page 258.
2. Review the scala-health-performance-logstash.conf sample configurationfile. You can use this file as the configuration file in your implementation oflogstash or you can copy and paste the sections that your require to yourexisting logstash configuration file. The sample file contains a number of notesto help you determine the filters, inputs, and outputs that you want to use.
3. Review the filters that are used in your configuration file. Keep the filters thatyou need for the log source types that you want to monitor and ensure thatthe default settings make sense for your implementation. You may not want tokeep all the filters, depending on your needs.
4. Save the SCALAPATTERNS GROK pattern file to the /patterns directory inlogstash.If you use logstash 1.4.2, you do not need to take any further action.
5. Review the output section of your configuration file to ensure that it iscompatible with your current logstash implementation. The output that isspecified in the scala-health-performance-logstash.conf file works onlywith the logstash integration toolkit in IBM Operations Analytics - LogAnalysis 1.3.0.
6. Decide the logs that you want to monitor and copy the DSV properties filesthat you require to the <HOME>/IBM/LogAnalysis/DSVToolkit_v1.1.0.4directory.
7. Update the DSV properties files. Add the correct value for the scalaHomevariable in each file.
8. Optional: If you want, you can also optimize the indexing in the DSVproperties files. For example, if you want to disable the use of keywords orfacets for the processID field, add filterable=false to set the filter flag tofalse.
9. To deploy the DSV properties files, log in to IBM Operations Analytics - LogAnalysis, navigate to the <HOME>/IBM/LogAnalysis/DSVToolkit_v1.1.0.4directory and run the following command:python dsvGen.py <FILENAME>.props -d -f -u <username> -p <password>
where <FILENAME>.props is the name of the properties file that you want todeploy. <username> and <password> are the IBM Operations Analytics - LogAnalysis user name and password. For example, unityadmin.
10. Create a data source for each log source type that you want to deploy. Inother words, you must create one data source for every DSV properties filethat you copied in step 6. Ensure that the host name and path values that youspecify in the data source match the values that you defined in the logstashconfiguration file.For more information about creating data sources, see Data source creation.
11. Start logstash.For more information about starting logstash, see logstash operations.
80 IBM Operations Analytics - Log Analysis: Installation, Configuration, and Administration Guide

12. To verify that the log files have been loaded into IBM Operations Analytics -Log Analysis correctly, open the Search UI and search for the logs or monitorthe stdout messages that are generated by logstash.
Results
After you deploy the content pack, depending on your configuration, you can findthe IBM Operations Analytics - Log Analysis logs in the Search UI or in the stdoutmessages that are generated by logstash.Related concepts:“Loading batches of data” on page 292In addition to streaming data directly, you can also load batches of historic data fortest or other purposes.“Data Source creation” on page 373You create data sources to ingest data from a specific source.Related tasks:“logstash operations” on page 311You can use the logstash-util script to start, stop, restart, or provide the status oflogstash.
Using rsyslog and syslog-ng with logstash and IBMOperations Analytics - Log Analysis
Use rsyslog and syslog-ng with logstash to stream logs in to IBM OperationsAnalytics - Log Analysis using a custom DSV content pack or the Syslog InsightPack.
Before you begin
Download the content pack, which includes a number of customized propertiesand configuration files at: https://github.com/IBM-ITOAdev/Using-Rsyslog-and-Syslog-NG-with-Logstash-and-SCALA
The content pack contains:
Sample logstash configuration fileThe content pack includes a sample logstash configuration file calledsyslog-logstash-scala.conf.
logstash GROK pattern file for rsyslog and syslog-ng messagesThe content pack includes a sample GROK pattern file for rsyslog andsyslog-ng messages called SYSLOGSCALA.
A custom DSV Content Pack properties fileThe content pack contains a customized properties file that is calledsyslog.props.
An example rsyslog.conf fileThe content pack contains an example rsyslog.conf file that is calledrsyslog.conf.
An example syslog-ng.conf fileThe content pack contains an example syslog-ng.conf file that is calledsyslog-ng.conf.
Configuring 81

About this task
Procedure1. Determine how you want to use the inputs, filters, and outputs of the sample
logstash configuration file. You can use the sample that is provided or copythe parts that you require into your main logstash configuration file.
2. Update the TCP inputs as required. Ensure that the port numbers are updatedto the port numbers you use. The sample logstash configuration file providesfour options, you do not need to use all four.
3. Review the filters that are used in your configuration file. Keep the filters thatyou need for the log source types that you want to monitor and ensure thatthe default settings make sense for your implementation. You may not want tokeep all the filters, depending on your needs.
4. Save the SYSLOGSCALA GROK pattern file to the /patterns directory inlogstash.If you use logstash 1.4.2, you do not need to take any further action.
5. Review the output section of your configuration file to ensure that it iscompatible with your current logstash implementation. The output that isspecified in the syslog-logstash-scala.conf file works only with the logstashintegration toolkit in IBM Operations Analytics - Log Analysis 1.3.0.
6. Decide the logs that you want to monitor and copy the DSV properties filesthat you require to the <HOME>/IBM/LogAnalysis/DSVToolkit_v1.1.0.4directory.
7. Update the DSV properties files. Add the correct value for the scalaHomevariable in each file.
8. Optional: If you want, you can also optimize the indexing in the DSVproperties files. For example, if you want to disable the use of keywords orfacets for the processID field, add filterable=false to set the filter flag tofalse.
9. To deploy the DSV properties files, log in to IBM Operations Analytics - LogAnalysis, navigate to the <HOME>/IBM/LogAnalysis/DSVToolkit_v1.1.0.4directory and run the following command:python dsvGen.py .props -d -f -u <username> -p <password>
where <username> and <password> are the IBM Operations Analytics - LogAnalysis user name and password. For example, unityadmin.
10. Create a IBM Operations Analytics - Log Analysis data source that uses thenew DSV content pack source type syslogDSV for the rsyslog and syslog-ngflows. Ensure that the host name and path values that you specify in the datasource match the values that you defined in the logstash configuration file.For more information about creating data sources, see Data source creation.
11. Create a IBM Operations Analytics - Log Analysis data source that uses thedefault IBM Operations Analytics - Log Analysis Syslog Insight Pack sourceSyslog for the rsyslog and syslog-ng flows. Ensure that the host name andpath values that you specify in the data source match the values that youdefined in the logstash configuration file.
12. Start logstash.For more information about starting logstash, see logstash Operations.
13. To verify that the log files were loaded into IBM Operations Analytics - LogAnalysis correctly, open the Search UI and search for the logs or monitor thestdout messages that are generated by logstash.
Related concepts:
82 IBM Operations Analytics - Log Analysis: Installation, Configuration, and Administration Guide

“Data Source creation” on page 373You create data sources to ingest data from a specific source.Related tasks:“logstash operations” on page 311You can use the logstash-util script to start, stop, restart, or provide the status oflogstash.
Managing Insight PacksUse Insight Packs to help you to annotate and index specific log file records.
Before you can use any of the Insight Packs , you must install and configure theInsight Packs. You can:v Create your own custom Insight Packs.v Use the Insight Packs that are available out of the box.v Download additional Insight Packs.
The Insight Pack defines:v The type of data that is to be consumed.v How data is annotated. The data is annotated to highlight relevant information.v How the annotated data is indexed. The indexing process allows you to
manipulate search results for better problem determination and diagnostics.v How to render the data in a chart.
Out of the box Insight Packs
The following Insight Packs are now installed with the product:
WASInsightPackThe WebSphere Application Server Insight Pack includes support foringesting and performing metadata searches against WebSphereApplication Server V7 and V8 log files. Updates to WAS indexconfiguration will improve indexing performance. The fieldlogsourceHostname has been changed to datasourceHostname.
WASAppInsightPackThe Websphere Application Server (WAS) Applications Insight Packprovides troubleshooting dashboards for WebSphere Application ServerLogs. A new authentication mechanism eliminates the need to specifyuserid and password in the application script. The field logsourceHostnamehas been changed to datasourceHostname.
DB2InsightPackThe DB2 Insight Pack includes support for ingesting and performingmetadata searches against DB2 version 9.7 and 10.1 db2diag.log files. Thefield logsourceHostname has been changed to datasourceHostname.
DB2AppInsightPackThe DB2 Applications Insight Pack provides troubleshooting dashboardsfor DB2 Logs. A new authentication mechanism eliminates the need tospecify userid and password in the application script. The fieldlogsourceHostname has been changed to datasourceHostname.
Syslog Insight PackThe Syslog Insight Pack includes support for ingesting and performing
Configuring 83

metadata searches against syslog data logging. The fieldlogsourceHostname has been changed to datasourceHostname.
WebAccessLogInsightPackThe Web Access Logs Insight Pack provides the capability to ingest andperform metadata searches against Web Access Logs such as Apache IHS,JBoss, Apache Tomcat. The pack now includes a Web Health CheckDashboard example that provides summaries of key metrics.
WindowsOSEventsInsightPackYou can use the Windows OS Event Insight pack and the IBM TivoliMonitoring Log File Agent to load and search Windows OS events. Newsupport for data collection using logstash provides an alternative to theIBM Tivoli Monitoring Log File Agent.
JavacoreInsightPackThe Java Core Insight Pack provides the capability to ingest and searchmetadata that originates in Java Core files in IBM Operations Analytics -Log Analysis. The field logsourceHostname has been changed todatasourceHostname.
GAInsightPackThe Generic Annotation Insight Pack is not specific to any particular logdata type. It can be used to analyze log files for which a log-specificInsight Pack is not available
Additional Insight Packs
The following Insight Packs are available for download:
IBM MB Insight PackUse this Insight Pack to search IBM Message Broker and IBM IntegrationBus log files.
IBM MQ Insight PackUse this Insight Pack to search IBM MQ log files.
Ticket Analytics Insight PackUse this Insight Pack to search the log files generated by one of the threeticketing solutions.
IBM PureApp Insight PackUse this Insight Pack to search log files generated by IBM PureApp.
IBM Business Process Manager Insight PackUse this Insight Pack to search log files generated by IBM Business ProcessManager.
IBM DataPower Insight PackUse this Insight Pack to search log files generated by IBM DataPowerapplications.
Related concepts:“Custom Insight Packs” on page 194You can use custom Insight Packs to implement customized indexing andannotating.
Supported versions for Insight PacksRead the tables to understand the versions that are supported for Insight Packs.
84 IBM Operations Analytics - Log Analysis: Installation, Configuration, and Administration Guide

Out of the box Insight Packs
Table 8. Supported versions for out of the box Insight Packs
Insight Pack Supported versions
DB2 Insight Pack DB2® versions 9.7 and 10.1
Generic Annotation Insight Pack Not applicable. This Insight Pack is designto process generic log files of all types.
Javacore Insight Pack IBM Java Runtime Engine versions 6.0 and7.0
Syslog Insight Pack rsyslog version 3 is included as the defaultsyslog tool for RHEL 5.2, and this is theminimum version supported by IBMOperations Analytics - Log Analysis. IBMOperations Analytics - Log Analysissupports rsyslog version 3, 5, 6 and 7. IBMOperations Analytics - Log Analysissupports the rsyslog list format, which isrecommended by rsyslog, for version 7 andhigher of rsyslog.
Web Access Logs Insight Pack By using the LogFormat directive or patternto create a delimiter-separated value (DSV)access log file, the Web Access Log InsightPack can annotate and index access logs foringestion, annotation, and indexing into IBMOperations Analytics - Log Analysis. TheWeb Access Logs Insight Pack supports thefollowing web servers (and any otherswhich enable the LogFormat specificationrequired by this insight pack):
v Apache/IBM HTTP Server 8.5.5.0
v Apache Tomcat 7.0.42, 6.0.37
v JBoss v7
WebSphere Application Server Insight Pack WebSphere Application Server versions 7and 8.
Windows OS Events Insight Pack This Insight Pack supports the sameversions of Windows that are supported bythe IBM Tivoli Monitoring Log File Agent.
Additional Insight Packs
Table 9. Supported versions for additional Insight Packs
Insight Pack Supported versions
IBM MB Insight Pack The IBM MB Insight Pack supports thefollowing IBM Integration Bus and IBMWebSphere Message broker versions. IBMIntegration Bus was known as IBMWebSphere Message broker until version 8.0.
v IBM WebSphere Message broker 8.0
v IBM Integration Bus 9.0
v IBM Integration Bus 10.0
Configuring 85

Table 9. Supported versions for additional Insight Packs (continued)
Insight Pack Supported versions
IBM MQ Insight Pack v IBM MQ 8.0
v MQ Series 7.5
v MQ Series 7.1
v MQ Series 7.0.1
Ticket Analytics Insight Pack All versions of supported ticket analyticsInsight Packs.
IBM PureApp Insight Pack PureApplication System W2500 2.1.0
IBM Business Process Manager Insight Pack IBM Business Process Manager versions 7.5,7.5.1, 8.0, 8.0.1, 8.5, 8.5.5, and 8.5.6
IBM DataPower Insight Pack IBM DataPower version 7
Downloading an Insight PackYou can download extra Insight Packs and upgrade existing Insight Packs.
To view the available Insight Packs, go to Resources for Log Analysis.
If you did not use the Insight Pack previously, you can install it. If you installed anolder version of the Insight Pack, you can upgrade it.Related tasks:“Upgrading an Insight Pack”You can upgrade an Insight Pack that you have previously installed. This topicoutlines how to upgrade an existing Insight Pack.“Installing Insight Packs”Before you can use an Insight Pack, you need to install it.
Installing Insight PacksBefore you can use an Insight Pack, you need to install it.
About this task
This task is a generic summary of the process for installing Insight Packs. Thesteps can vary for specific Insight Packs. For more information, see thedocumentation for the Insight Pack.
Procedure1. Upload the Insight Pack archive file, InsightPack_<version>.zip, to the system
where IBM Operations Analytics - Log Analysis is installed.2. Install the Insight Pack with the pkg_mgmt.sh command:
<HOME>/IBM/LogAnalysis/utilities/pkg_mgmt.sh -install<path>/InsightPack_<version>.zip
Where <path> is the path where you saved the Insight Pack.
Upgrading an Insight PackYou can upgrade an Insight Pack that you have previously installed. This topicoutlines how to upgrade an existing Insight Pack.
86 IBM Operations Analytics - Log Analysis: Installation, Configuration, and Administration Guide

About this task
If the Insight Pack that you want to upgrade is not installed, you can choose tocomplete a full installation of the Insight Pack. In addition to upgrading existingartifacts and installing any artifacts added to the Insight Pack, this commandremoves unused artifacts that have been excluded from the upgraded Insight Pack.
Upgrade an Insight Pack by completing these steps:
Procedure1. Download the Insight Pack archive and copy it to the <HOME>/IBM/LogAnalysis/
unity_content directory on your IBM Operations Analytics - Log Analysissystem.
2. Execute the command:<HOME>/IBM/LogAnalysis/utilities/pkg_mgmt.sh -upgrade insight_pack.zip-U username -P password -f
where insight_pack is the path to the Insight Pack that you want to upgrade.These additional parameters are also defined:
-U (Optional) The username for a user with administrative access rights.This parameter is not necessary if you have not changed the defaultunityadmin password.
-P (Optional) The password for the username that you have specified. Thisparameter is not necessary if you have not changed the defaultunityadmin password.
-f (Optional) This parameter can also be used to install the Insight Pack, ifit is not already installed.
3. (Optional) If the Insight Pack is not installed and you have not specified the -fparameter, a message is displayed indicating that the Insight Pack is notinstalled. If you want to proceed, enter Y.
Cloning source types for Insight PacksTo help you to create your own source types and indexing configurations, you canclone them from an existing Insight Pack.
For more information about how to do so, see the Cloning source types and indexconfigurations topic in the Installation and Administration guide.
Out of the box Insight PacksSome Insight Packs are available as part of the product. You can install and usethese Insight Packs to help you to get started.
The following Insight Packs are now installed with the product:
WASInsightPackThe WebSphere Application Server Insight Pack includes support foringesting and performing metadata searches against WebSphereApplication Server V7 and V8 log files. Updates to WAS indexconfiguration will improve indexing performance. The fieldlogsourceHostname has been changed to datasourceHostname.
WASAppInsightPackThe Websphere Application Server (WAS) Applications Insight Packprovides troubleshooting dashboards for WebSphere Application Server
Configuring 87

Logs. A new authentication mechanism eliminates the need to specifyuserid and password in the application script. The field logsourceHostnamehas been changed to datasourceHostname.
DB2InsightPackThe DB2 Insight Pack includes support for ingesting and performingmetadata searches against DB2 version 9.7 and 10.1 db2diag.log files. Thefield logsourceHostname has been changed to datasourceHostname.
DB2AppInsightPackThe DB2 Applications Insight Pack provides troubleshooting dashboardsfor DB2 Logs. A new authentication mechanism eliminates the need tospecify userid and password in the application script. The fieldlogsourceHostname has been changed to datasourceHostname.
Syslog Insight PackThe Syslog Insight Pack includes support for ingesting and performingmetadata searches against syslog data logging. The fieldlogsourceHostname has been changed to datasourceHostname.
WebAccessLogInsightPackThe Web Access Logs Insight Pack provides the capability to ingest andperform metadata searches against Web Access Logs such as Apache IHS,JBoss, Apache Tomcat. The pack now includes a Web Health CheckDashboard example that provides summaries of key metrics.
WindowsOSEventsInsightPackYou can use the Windows OS Event Insight pack and the IBM TivoliMonitoring Log File Agent to load and search Windows OS events. Newsupport for data collection using logstash provides an alternative to theIBM Tivoli Monitoring Log File Agent.
JavacoreInsightPackThe Java Core Insight Pack provides the capability to ingest and searchmetadata that originates in Java Core files in IBM Operations Analytics -Log Analysis. The field logsourceHostname has been changed todatasourceHostname.
GAInsightPackThe Generic Annotation Insight Pack is not specific to any particular logdata type. It can be used to analyze log files for which a log-specificInsight Pack is not available
DB2 Insight PackA DB2 Insight Pack is provided with IBM Operations Analytics - Log Analysis.
The Insight Pack includes support for ingesting and performing metadata searchesagainst the DB2 version 9.7 and 10.1 db2diag.log files.
This document describes the version of the DB2 Insight Pack that is installed whenyou install IBM Operations Analytics - Log Analysis. An updated version of theDB2 Insight Pack may have been published after this version of IBM OperationsAnalytics - Log Analysis. To download the latest versions of this Insight Pack andupdated documentation, see http://www.ibm.com/developerworks/servicemanagement/downloads.html.
88 IBM Operations Analytics - Log Analysis: Installation, Configuration, and Administration Guide

Best practices for db2diag files
DB2 creates multiple db2diag.log files based on the database configuration. Followthese best practices to handle multiple db2diag logs for the rotating and multipledatabase partition scenarios.
Scenario 1: Database spread across partitions and membersIf the database is spread across multiple partitions and members, then adb2diag file is created in multiple directories according to the DIAGPATHvalue. It can be difficult to interpret the DIAGPATH and db2nodes.cfg to findall the log files for each member and host. The best practicerecommendation is to use the db2diag tool, which consolidates all the logrecords in to a single file.
For databases spread among multiple partitions and members, consolidatethe records from all db2diag log files on all your database partitions, runthe following command:db2diag -global -output filename.log
Where filename.log is the name of the consolidated log file, such asdb2diag_myglobalrecords.log.
Scenario 2: Rotating log filesIf DB2 is configured for rotating log files, the files are named dynamicallyas db2diag.<number>.log. The best practice is to change the default logagent configuration files to recognize the rotating logs.
If you choose to consolidate the rotating logs with the db2diag tool, followthe DB2 data loading best practice about loading the consolidated file.
Using the Data Collector client to load the consolidated rotating logs canimprove data ingestion performance. However, you must filter the logsbased on timestamps to avoid ingesting duplicate logs each time youconsolidate the logs.
Optional: Filtering db2diag log file records can reduce the time required to locatethe records needed when troubleshooting problems. If the db2diag tool is used tofilter records, only those records included in the filter result will be annotated bythe IBM Operations Analytics tools - all other records are excluded. The db2diagtool includes other options for filtering and formatting the log records.
If you choose to consolidate the rotating logs with the db2diag tool, use the DataCollector as described in the DB2 data loading best practice about loading theconsolidated file. More information about the db2diag utility can be found at theDB2Information Center here:
For version 10.1:
http://www-01.ibm.com/support/knowledgecenter/SSEPGG_10.1.0/com.ibm.db2.luw.admin.trb.doc/doc/c0020701.html
For version 9.7:
http://www-01.ibm.com/support/knowledgecenter/SSEPGG_9.7.0/com.ibm.db2.luw.admin.trb.doc/doc/c0020701.html
Note: To find the locations of the individual logs, use the DB2 command:GET DATABASE MANAGER CONFIGURATION
Configuring 89

On UNIX systems, The DIAGPATH parameter shows the diagnostic data directorypath that contains the log files. The default directory is:INSTHOME/sqllib/db2dump,
where INSTHOME is the home directory of the DB2 instance.
On Windows systems, the default path depends on the operating system. To findthe default path on Windows, use the command:DB2SET DB2INSTPROF
Configuration artifacts
The Insight Pack supports the DB2 timestamp format YYYY-MM-DD-hh.mm.ss Z. Youcan customize artifacts in the index configuration file.
Note: Data sources are not predefined. A user with administrator privileges mustdefine at least one DB2 data source before the application can be used.
The following table lists the configuration artifacts that are provided with theInsight Pack for each log file.
Table 10. Insight Pack configuration artifacts
Artifact Name for the db2diag.log
Splitter rule set DB2Diag-Split
Annotator rule set DB2Diag-Annotate
Source type DB2Diag
Collection DB2Diag-Collection1
Log File Agent configuration
The supported log files share IBM Tivoli Monitoring Log File Agent (LFA)configuration files. The following LFA configuration files are in the<HOME>/IBM-LFA-6.30/config/lo directory:v DB2InsightPack-lfadb2.conf: Configuration file for the DB2 log file agent.v DB2InsightPack-lfadb2.fmt: Matches records for the db2diag log files.
Splitting and annotation AQL modules
Splitting and annotation are handled by the following Annotation Query Language(AQL) modules.
Table 11. Insight Pack AQL modules
AQL Module Description
common Common code module that is used acrossmultiple log files (for example, to recognizetimestamp formats).
commonDB2 Common annotations module that is usedacross splitter and annotator modules.
annotatorDB2Diag Annotator module for db2diag log files.
splitterDB2Diag Splitter module for db2diag log files.
90 IBM Operations Analytics - Log Analysis: Installation, Configuration, and Administration Guide

Log file formats:
The basic formats of the DB2 log files are described here as a reference for users.
The basic format of db2diag.log file is:timestamp recordId LEVEL: level(source)PID : pid TID : tid PROC : procNameINSTANCE: instance NODE : node DB : databaseAPPHDL : appHandle APPID: appIDAUTHID : authIDEDUID : eduID EDUNAME: engine dispatchable unit nameFUNCTION: prodName, compName, funcName, probe: probeNumMESSAGE : messageID msgTextCALLED : prodName, compName, funcName OSERR: errorName (errno)RETCODE : type=retCode errorDescARG #N : typeTitle, typeName, size bytes... argument ...DATA #N : typeTitle, typeName, size bytes... data ...
Only these fields are present in all log records.timestamptimezonerecordIDlevelpidtidFUNCTION
For more information about DB2 log file formats, see the following topic on theDB2 information centers:
The format for DB2 10.1 log files is documented in:
http://www-01.ibm.com/support/knowledgecenter/SSEPGG_10.1.0/com.ibm.db2.luw.admin.trb.doc/doc/c0020815.html
The format for DB2 v9.7 log files is documented in:
http://www-01.ibm.com/support/knowledgecenter/SSEPGG_9.7.0/com.ibm.db2.luw.admin.trb.doc/doc/c0020815.html
Log file splitters:
The splitters provided with the Insight Pack are described here as a reference forusers.
DB2diaglog splitter
The db2diaglog splitter uses timestamps to define the beginning and end of eachlog record.
Log file annotations:
The annotations that are defined by the log file index configurations are describedhere.
The following table lists the index configuration files that are included in theInsight Pack.
Configuring 91

Table 12. Index configuration files
Log file Index configuration file
db2diag.log Included in the sourcetypes.json file
The following sections describe the fields that are defined in the indexconfiguration file. These fields, or annotations, are displayed in the IBM OperationsAnalytics - Log Analysis Search workspace, and can be used to filter or search thelog records. Fields are extracted from the fields of a log record or collected frommetadata around the log file. Each table gives the names of the fields (these namescorrespond to fields in the IBM Operations Analytics - Log Analysis Searchworkspace), descriptions of how the related annotations are made, and the indexconfiguration attributes assigned to the fields.
Log record annotations
The following table lists the index configuration fields that relate to log recordannotations. Each field corresponds to part of a db2diag log record. The fields arelisted in the order in which they appear in a log record.
Table 13. Log record index configuration fields
Field Description Attributes
timestamp The timestamp of the log record, which is located atthe beginning of a line.
dataType = DATEretrievable = trueretrieveByDefault = truesortable = truefilterable = truesearchable = true
recordID The record identifier of the log record that follows thetimestamp. The recordID of the log files specifies thefile offset at which the current message is beinglogged (for example, 27204 and the message length(for example, 655) for the platform where the log wascreated.
dataType = TEXTretrievable = trueretrieveByDefault = truesortable = falsefilterable = falsesearchable = true
diagnosticLevel A diagnostic level of the log record that follows thelabel LEVEL:. It is the diagnostic level that is associatedwith an error message. For example, Info, Warning,Error, Severe, or Event." Not all log records have adiagnostic level.
dataType = TEXTretrievable = trueretrieveByDefault = truesortable = falsefilterable = truesearchable = true
processID The process identifier in the log record that follows thePID: label. For example, 1988.
dataType = TEXTretrievable = trueretrieveByDefault = truesortable = falsefilterable = falsesearchable = true
threadID The thread identifier (TID) for the process in the logrecord that follows the TID: label. For example, 1988
dataType = TEXTretrievable = trueretrieveByDefault = truesortable = falsefilterable = falsesearchable = true
processName The name of the process in the log record that followsthe PROC:label. For example, db2iCacheFunction.exe
dataType = TEXTretrievable = trueretrieveByDefault = truesortable = falsefilterable = falsesearchable = true
92 IBM Operations Analytics - Log Analysis: Installation, Configuration, and Administration Guide

Table 13. Log record index configuration fields (continued)
Field Description Attributes
instance The DB2 instance that generated the message in thelog record that follows the INSTANCE:label. Forexample, DB2.
dataType = TEXTretrievable = trueretrieveByDefault = truesortable = falsefilterable = falsesearchable = true
node The node identifier that generated the message for amulti-partition system. Otherwise it is 000. It followsthe NODE:label. For example, 001.
dataType = TEXTretrievable = trueretrieveByDefault = truesortable = truefilterable = falsesearchable = true
databaseName If present, the database name in the log record, thatfollows the DB:label. For example, DB2.
dataType = TEXTretrievable = trueretrieveByDefault = truesortable = truefilterable = truesearchable = true
applicationHandle If present, the application handle in the log record,that follows the APPHDL: label. For example, 0-2772.
dataType = TEXTretrievable = trueretrieveByDefault = truesortable = falsefilterable = falsesearchable = true
applicationID If present, the application identifier in the log record,that follows the APPID: label. For example,*LOCAL.DB2.130226175838.
dataType = TEXTretrievable = trueretrieveByDefault = truesortable = falsefilterable = falsesearchable = true
authorizationID If present the authorization user identifier in the logrecord, that follows the AUTHID: label. For example,adminuser1.
dataType = TEXTretrievable = trueretrieveByDefault = truesortable = falsefilterable = falsesearchable = true
eduID The engine dispatchable unit identifier in the logrecord that follows the EDUID: label. For example,2004.
dataType = TEXTretrievable = trueretrieveByDefault = truesortable = falsefilterable = falsesearchable = true
eduName The name of the engine dispatchable unit in the logrecord that follows the EDUNAME: label. For example,db2agent (instance).
dataType = TEXTretrievable = trueretrieveByDefault = truesortable = falsefilterable = falsesearchable = true
functionProductName The product name that wrote the log record. It followsthe FUNCTION: label, which also includes thecomponent name, function name, and function probepoint. For example, DB2.
dataType = TEXTretrievable = trueretrieveByDefault = truesortable = falsefilterable = falsesearchable = true
Configuring 93
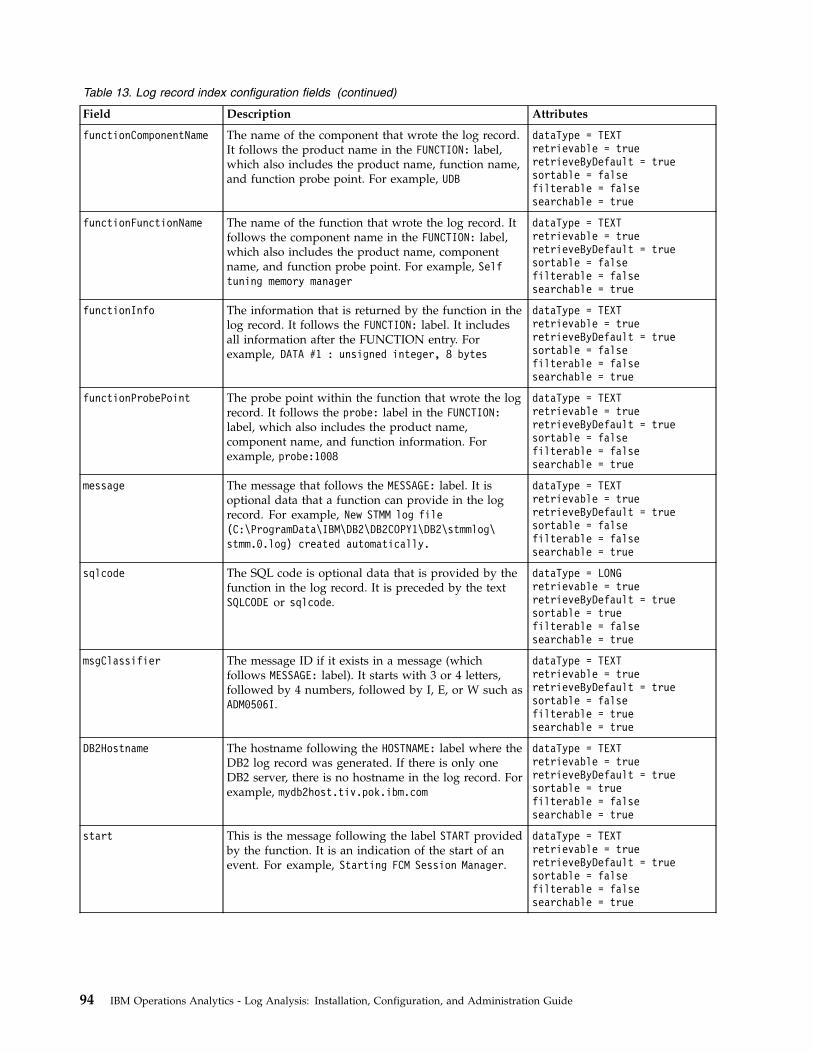
Table 13. Log record index configuration fields (continued)
Field Description Attributes
functionComponentName The name of the component that wrote the log record.It follows the product name in the FUNCTION: label,which also includes the product name, function name,and function probe point. For example, UDB
dataType = TEXTretrievable = trueretrieveByDefault = truesortable = falsefilterable = falsesearchable = true
functionFunctionName The name of the function that wrote the log record. Itfollows the component name in the FUNCTION: label,which also includes the product name, componentname, and function probe point. For example, Selftuning memory manager
dataType = TEXTretrievable = trueretrieveByDefault = truesortable = falsefilterable = falsesearchable = true
functionInfo The information that is returned by the function in thelog record. It follows the FUNCTION: label. It includesall information after the FUNCTION entry. Forexample, DATA #1 : unsigned integer, 8 bytes
dataType = TEXTretrievable = trueretrieveByDefault = truesortable = falsefilterable = falsesearchable = true
functionProbePoint The probe point within the function that wrote the logrecord. It follows the probe: label in the FUNCTION:label, which also includes the product name,component name, and function information. Forexample, probe:1008
dataType = TEXTretrievable = trueretrieveByDefault = truesortable = falsefilterable = falsesearchable = true
message The message that follows the MESSAGE: label. It isoptional data that a function can provide in the logrecord. For example, New STMM log file(C:\ProgramData\IBM\DB2\DB2COPY1\DB2\stmmlog\stmm.0.log) created automatically.
dataType = TEXTretrievable = trueretrieveByDefault = truesortable = falsefilterable = falsesearchable = true
sqlcode The SQL code is optional data that is provided by thefunction in the log record. It is preceded by the textSQLCODE or sqlcode.
dataType = LONGretrievable = trueretrieveByDefault = truesortable = truefilterable = falsesearchable = true
msgClassifier The message ID if it exists in a message (whichfollows MESSAGE: label). It starts with 3 or 4 letters,followed by 4 numbers, followed by I, E, or W such asADM0506I.
dataType = TEXTretrievable = trueretrieveByDefault = truesortable = falsefilterable = truesearchable = true
DB2Hostname The hostname following the HOSTNAME: label where theDB2 log record was generated. If there is only oneDB2 server, there is no hostname in the log record. Forexample, mydb2host.tiv.pok.ibm.com
dataType = TEXTretrievable = trueretrieveByDefault = truesortable = truefilterable = falsesearchable = true
start This is the message following the label START providedby the function. It is an indication of the start of anevent. For example, Starting FCM Session Manager.
dataType = TEXTretrievable = trueretrieveByDefault = truesortable = falsefilterable = falsesearchable = true
94 IBM Operations Analytics - Log Analysis: Installation, Configuration, and Administration Guide

Table 13. Log record index configuration fields (continued)
Field Description Attributes
stop This is the message follows the label STOP provided bythe function. It is an indication of the end of an event.For example, DATABASE: DTW : DEACTIVATED: NO.
dataType = TEXTretrievable = trueretrieveByDefault = truesortable = falsefilterable = falsesearchable = true
Metadata annotations
The following table lists the index configuration fields that relate to metadataannotations.
Table 14. Metadata index configuration fields
Field Description Annotation attributes
application The application name populated by the servicetopology data source field.
dataType: TEXTretrievable: trueretrieveByDefault: truesortable: falsefilterable: falsesearchable: true
hostname The host name populated by the service topology datasource field.
dataType: TEXTretrievable: trueretrieveByDefault: truesortable: truefilterable: truesearchable: true
logRecord The entire log record output by the splitter. dataType: TEXTretrievable: trueretrieveByDefault: truesortable: falsefilterable: falsesearchable: true
datasourceHostname The host name specified in the data source. dataType: TEXTretrievable: trueretrieveByDefault: truesortable: falsefilterable: truesearchable: true
middleware The middleware name populated by the servicetopology data source field.
dataType: TEXTretrievable: trueretrieveByDefault: truesortable: falsefilterable: falsesearchable: true
service The service name populated by the service topologydata source field.
dataType: TEXTretrievable: trueretrieveByDefault: truesortable: falsefilterable: falsesearchable: true
Configuring 95

Searching DB2 log files for a return code example:
You can search the log files for keywords. Search results are displayed in a timelineand a table format. You can use the search function to find fields that are notindexed.
Before you begin
To search a log file, you must first define a data source as the db2diag.log file.
This example shows how to search for RETCODE. For more information about otherkeywords you can search for in the FUNCTION information, see the DB2informationcenter for your version here:
For version 10.1:http://www-01.ibm.com/support/knowledgecenter/SSEPGG_10.1.0/com.ibm.db2.luw.admin.trb.doc/doc/c0020815.html
For version 9.7:http://www-01.ibm.com/support/knowledgecenter/SSEPGG_9.7.0/com.ibm.db2.luw.admin.trb.doc/doc/c0020815.html
Procedure
1. From the Search workspace, click Add Search to create a tab that contains yoursearch criteria.
2. Optional: To limit the extent of the search to specific data sources and anydescendant data sources, select a leaf node from the data source tree.
3. In the Time Filter pane, click the Time Filter list and select the time period forwhich you want to search. Select Custom to specify a start time and date, andan end time and date for your search.
4. In the Search field, type the return code string that you want to search for inthe log files.For example, to search for return codes related to missing files include thestring FILE_DOESNT_EXIST. The full return code for this example is:RETCODE : ECF=0x9000001A=-1879048166=ECF_FILE_DOESNT_EXIST
To search for strings that related to missing files, type FILE_DOESNT_EXIST in theSearch field.
5. Click Search.For more information about searching logs, see the section Searching log files inthe IBM Operations Analytics - Log Analysis Knowledge Center
Results
A graph that shows the distribution of matching events in the log is displayed.
DB2 data loading best practice:
Best practice recommendation for DB2 Insight Pack data loading.
There are different data loading recommendations depending on whether you usedthe rotating or consolidated DB2 db2diag.log files and how many servers youneed to monitor. To set up the data loading, you need to consider:
DB2 configurationIs DB2 configured to produce a single log file for a single server, rotatinglog files for a single server, or multiple logs for multiple servers?
96 IBM Operations Analytics - Log Analysis: Installation, Configuration, and Administration Guide

You can use the use the db2diag tool that is included with DB2 to mergeand consolidate the log files. More information about the db2diag utilitycan be found in the DB2 documentation at:
For version 10.1:
http://www-01.ibm.com/support/knowledgecenter/SSEPGG_10.1.0/com.ibm.db2.luw.admin.trb.doc/doc/c0020701.html
For version 9.7:
http://www-01.ibm.com/support/knowledgecenter/SSEPGG_9.7.0/com.ibm.db2.luw.admin.trb.doc/doc/c0020701.html
Data loadingDetermine if you want to use the IBM Tivoli Monitoring Log File Agent(LFA) installed on the remote DB2 server to push data or to use the LFAinstalled on the local IBM Operations Analytics - Log Analysis server topull data. In some scenarios, you must use the Data Collector client asdescribed in scenario 3.
Logfile agent configurationUse the logfile agent configuration files to specify the log files you want tomonitor. The DB2InsightPack-lfadb2.conf and DB2InsightPack-lfadb2.fmtfiles are located in the directory:
<HOME>/IBM-LFA-6.30/config/lo
The log file scenarios here describe the specific settings for these files.
Scenario 1 - Individual log file on one DB2 Server
For a single log file on one DB2 server follow these best practices.
DB2 ConfigurationDB2 is configured for a single log file (non-rotating), db2diag.log on oneserver
Data Loading Method The recommended method for loading data is to use the LFA installed onthe remote DB2 server to push data or to use the LFA installed on the localIBM Operations Analytics server to pull data.
Logfile Agent Configuration - DB2InsightPack-lfadb2.conf fileIn the DB2InsightPack-lfadb2.conf file, specify the following parametersto monitor the log files.LogSources=<db2 log directory to monitor>/db2diag.log#FileComparisonMode
The FileComparisonMode parameter should be commented out since it onlyapplies when using wildcards in a LogSources parameter
Logfile Agent Configuration - DB2InsightPack-lfadb2.fmt fileUse the default DB2InsightPack-lfadb2.fmt file.// Matches records for any Log file://
REGEX AllRecords(.*)hostname LABEL-file FILENAME
Configuring 97

RemoteHost DEFAULTlogpath PRINTF("%s",file)text $1END
Scenario 2 - log file rotation on one DB2 server
For rotated log files on a single DB2 server follow these best practices.
DB2 configurationDB2 is configured for rotating log files using the DIAGSIZE configurationoption. The db2diag.log files are named dynamically as db2diag.<n>.log.
Data Loading Method
The recommended method for loading data is to use the IBM TivoliMonitoring Log File Agent (LFA) installed on the remote DB2 server topush data or to use the LFA installed on the local IBM OperationsAnalytics - Log Analysis server to pull data.
Logfile Agent Configuration - DB2InsightPack-lfadb2.conf fileIn the DB2InsightPack-lfadb2.conf file, specify the following parametersto monitor the rotating log files:LogSources=<db2 log directory to monitor>/db2diag.*.logFileComparisonMode=CompareByAllMatches
Logfile Agent Configuration - DB2InsightPack-lfadb2.fmt fileUse the following DB2InsightPack-lfadb2.fmt file to specify a fixed log filename. Otherwise you must define multiple logsources in the IBMOperations Analytics - Log Analysis Administrative Settings page becausethe rotating log file name changes. The fmt file allows a fixed file name inthe logpath.// Matches records for any Log file://
REGEX AllRecords(.*)hostname LABEL-file db2diag.logRemoteHost DEFAULTlogpath PRINTF("%s",file)text $1END
Scenario 3 - Consolidating log files from multiple DB2 servers
If you consolidate log files from multiple DB2 servers follow these best practices.
DB2 ConfigurationIf the database is spread across multiple partitions and members, then adb2diag.log file is created in multiple directories according to the DIAGPATHvalue. It can be difficult to interpret the DIAGPATH and db2nodes.cfg to findall the log files for each member and host. The best practicerecommendation is to use the db2diag tool, which will bring theinformation from all the members together to create a consolidateddb2diag.log. The db2diag utility allows you to filter based on timestampand this should be done to include only new log entries in theconsolidated logs. Information on this filter can be found here:
For version 9.7:
98 IBM Operations Analytics - Log Analysis: Installation, Configuration, and Administration Guide

http://www-01.ibm.com/support/knowledgecenter/SSEPGG_9.7.0/com.ibm.db2.luw.admin.cmd.doc/doc/r0011728.html
For version 10.1
http://www-01.ibm.com/support/knowledgecenter/SSEPGG_10.1.0/com.ibm.db2.luw.admin.cmd.doc/doc/r0011728.html
Data Loading Method The recommended method for loading data is to use the Data Collectorclient. Remove the previous consolidated db2diag.log file before creatingor copying a new version into the directory from which you load data.
Generic Annotation Insight PackA Generic Annotation Insight Pack is installed when you install IBM OperationsAnalytics - Log Analysis. This Insight Pack is not specific to any particular log datatype. It can be used to analyze log files for which a log-specificInsight Pack is notavailable.
The Insight Pack facilitates data ingestion and metadata searches of logs fileswhere a date and time stamp can be identified within the log records.
This document describes the version of the Generic Annotation Insight Pack that isinstalled when you install IBM Operations Analytics - Log Analysis. An updatedversion of the Generic Annotation Insight Pack may have been published after thisversion of IBM Operations Analytics - Log Analysis. To download the latestversions of this Insight Pack as well as updated documentation, seehttp://www.ibm.com/developerworks/servicemanagement/downloads.html
Generic Annotation installation:
Instructions on how to install the Generic Annotation Insight Pack.
Procedure
1. Upload the Generic Annotation Insight Pack archive file,GenericAnnotationInsightPack_<version>.zip, to the system where IBMOperations Analytics - Log Analysis is installed.Where <version> is the version of the Generic Annotation Insight Pack.
2. Install the Generic Annotation Insight Pack with the pkg_mgmt.sh command:<HOME>/IBM/LogAnalysis/utilities/pkg_mgmt.sh -install <path>/GenericAnnotationInsightPack_<version>.zip
Where <path> is the path where you saved the Generic Annotation InsightPack.
3. Deploy the log file agent with the following command:<HOME>/IBM/LogAnalysis/utilities/pkg_mgmt.sh -deploylfa <path>/GenericAnnotationInsightPack_<version>.zip
Related tasks:Importing an Insight PackImport an existing Insight Pack into the Eclipse workspace.
Configuration artifacts:
You must create at least one data source.
Data sources are not defined by default. Create at least one data source before thelogs can be ingested.
Configuring 99

The following table lists the configuration artifacts that are provided with theInsight Pack for each log file.
Table 15. Configuration Artifacts
Insight Pack Configuration artifact
Splitter Rule Set dateTime-Split
Splitter Rule Set timeOnly-Split
Annotator Rule Set Generic-Annotate
Source Type Generic
Collection Generic-Col1
The following table lists the configuration artifacts that are provided with theInsight Pack for each log file. The Insight Pack supports a variety of timestampformats. See the section “Timestamp formats” on page 104 for a complete list ofthe available formats.
Table 16. Configuration Artifacts. Table 2 lists the configuration artifacts that are provided with the Insight Pack.
Splitter rule set Annotator rule set Source type Collection
Generic-dateTime-Split Generic-Annotate Generic Generic-Collection1
Generic-timeOnly-Split
NormalizedMonthFirst-Split Generic-NormalizedMonthFirst
Normalized-MonthFirst
NormalizedDayFirst-Split Generic-NormalizedDayFirst
Normalized-DayFirst
NormalizedYearFirst-Split Generic-NormalizedYearFirst
Normalized-YearFirst
Log file formats:
The Generic Annotation Insight Pack annotates all log files irrespective of theirformat.
Log File Agent configuration
The supported log files share IBM Tivoli Monitoring Log File Agent (LFA)configuration files. The following LFA configuration files are in theLog_Analytics_install_dir/IBM-LFA-6.30/config/lo directory:
Log file splitter:
The Generic Annotation Insight Pack contains Rule Sets that can be used to splitincoming log files.
These are:v Generic-dateTime-Split (default)v Generic-timeOnly-Split
Each Rule Set splits a log based on each line having either a time stamp or a dateand time stamp.
100 IBM Operations Analytics - Log Analysis: Installation, Configuration, and Administration Guide

The Generic-dateTime-split splitter splits log records using the date and timestamp of the log file. If the log file does not have year format that the splitter caninterpret in the log records, the splitter adds a year value based on the IBMOperations Analytics - Log Analysis server system time. The Index Configurationmust be updated to reflect this action.
The Generic-timeOnly-split splitter splits log records using only the time stampin the log record. Where the log file does not have a date in the log records thatcan be interpreted by splitter, the current date value set for the IBM OperationsAnalytics - Log Analysis serveris used. The format MM/dd/yyyy is inserted beforethe format of the time. The Index Configuration must be updated to reflect thisaction.
The splitters provided with the Insight Pack are described here as a reference forusers.
DateTime splitterThe dateTime splitter recognizes all supported timestamp formats. Thetimestamp must have a date and a time. If the year is missing from thedate, the current year will be appended to the front of the timestamp. Youmust modify the index configuration with the proper timestamp format forthe splitter to function properly.
TimeOnly splitterThe timeOnly splitter recognizes all supported time formats. Thetimestamp must have a time and must not have a date. The splitter willappend the current date to the front of the timestamp in the formatMM/dd/yyyy. You must modify the index configuration with the propertimestamp format for the splitter to function properly.
NormalizedMonthFirst splitterThe splitter assumes a purely numeric date (for example, 07/08/09) is inthe format MM/dd/yy. The timestamp must have a time, and may havean optional date. The date may have an optional year. If the date or year ismissing, the current date or year is substituted. The NormalizedMonthFirstsplitter outputs the timestamp in a normalized format. As a result, theindex configuration does not need to be modified with the timestampformat.
NormalizedDayFirst splitterThe splitter assumes a purely numeric date (for example, 07/08/09) is inthe format dd/MM/yy. The timestamp must have a time, and may havean optional date. The date may have an optional year. If the date or year ismissing, the current date or year is substituted. The NormalizedDayFirstsplitter outputs the timestamp in a normalized format. As a result, theindex configuration does not need to be modified with the timestampformat.
NormalizedYearFirst splitterThe splitter assumes a purely numeric date (for example, 07/08/09) is inthe format yy/MM/dd. The timestamp must have a time, and may havean optional date. The date may have an optional year. If the date or year ismissing, the current date or year is substituted. The NormalizedYearFirstsplitter splitter outputs the timestamp in a normalized format. As a result,the index configuration does not need to be modified with the timestampformat.
Configuring 101

Log file annotations:
The Generic annotator allows you to search and analyze log files for which aspecific annotator is not available. There are two types of annotations created bythe Generic annotator. Those are Concepts and Key-Value pairs. This sectionoutlines the purpose, scope, and use of the IBM Operations Analytics - LogAnalysis Generic annotator.
Included concept tokens
A concept is a piece of text that represents a real world entity such as an IPaddress or a hostname. These concepts are useful for searches as they provideinformation that can assist you in diagnosing issues. The Generic annotatorincludes support for these annotation tokens:
HostnameNames given to devices that connect to a network and that are referencedin the log record.
IP AddressNumeric labels given to devices that are connected to a network and thatare referenced in the log record
Severity LevelThe indicator of the severity of an event in a log record. The Genericannotator provides annotation for these severity levels:v SUCCESSv TRACEv DEBUGv INFOv WARNv ERRORv FATALv OFFv CRITICALv CRITICAL_ERRORv SEVEREv IGNOREv WARNINGv CONFIGv FINEv FINERv FINESTv ALL
URL Web addresses listed in the log record.
IdentifierPatterns intended to capture names of constants that might repeat withinthe log record and that signify the occurrence of some event. For example,ECH_PING_FAIL_BCKP. The Generic annotator assumes that an identifier is asequence of alphanumeric characters in capitals that may be separated byunderscores.
102 IBM Operations Analytics - Log Analysis: Installation, Configuration, and Administration Guide

Excluded concept tokens
The Generic annotator assumes that these tokens are noise and they are ignored:
Date and timeFor the purposes of analysis date and time are not useful.
NumberThe Generic annotator ignores both whole and decimal numbers.
Hexadecimal numbersThe Generic annotator ignores hexadecimal numbers such as 7AB87F.
Stop wordsA list of stop words have been defined for the Generic annotator. This is toallow the Generic annotator to ignore common words that might appearfrequently, but offer no value in an analysis of the log records.
Key-value pairs
A Key-value annotation extracts data from a log record if it is in the format <key>= <value>. For example, ERROR-CODE = 4499. These Key-value pairs can be used tolist the values for each key. These limitations apply to Key-value pair annotations:
Colon separatorKey-value pairs that are separated by a colon are excluded. For example,Label: ECH_PING_FAIL_BCKP.
Hyphen prefixKey-value pairs where the value begin with a hyphen are excluded. Forexample, ERRORCODE = -4499.
Numbers with commasKey-value pairs where the value includes a comma are excluded. Forexample, ERRORCODE = 4,499.
Forward and backward slash charactersKey-value pairs where the value contains a forward or backward slash areexcluded. For example, path = /opt/IBM/.
QuotesKey-value pairs where the value is contained within quotation marks. Forexample, language = “English”.
Delimiter charactersSome limitations exist where the value in a Key-value pair contains adelimiter. However, these depend on the whether the value contains atoken that can be annotated based on the list of included tokens. Forexample, Time = Thu Nov 22 06:28:48 EST 2012 is delimited by a spaceafter Thuand therefore the Key-value pair is assumed to be Key = Time,Value = Thu. However, a Date and Time annotator can annotate the fullvalue to give a value of Key = Time, Value = Thu Nov 22 06:28:48 EST2012.
Key-value pairs
A Key-value annotation extracts data from a log record if it is in the format<key>=<value>. For example, ERROR-CODE = 4499. These Key-value pairs areused to list the values for each key in the Discovered Patterns section of the SearchUI.
Configuring 103

There are two categories of KVP annotations. The first is Key-value pairs that areseparated by an equal sign (=). The second category is those separated by a colon(:). Each category has a different set of rules to determine what is a validannotation.
Key-value pairs separated by an equal sign, '='v Both the key and value must be one tokenv The key can contain upper and lower case letters, dashes (-), underscores (_),
and periods (.)v The key must begin with a letterv The value can contain upper and lower case letters, numbers, dashes (-),
underscores (_), periods (.), at signs (@), and colons (:)v The value can be surround by matching brackets [ ], parentheses ( ),
angle-brackets < >, single quotes ' ', or double quotes “ “v The value must being with a letter or a number, and may have an optional dash
(-) at the beginningv A single whitespace character may be on one or both sides of the equal signv The single token rule for the value is disregarded when a concept is found for
the value. For example, if a multi token date is identified as the value, the wholedate, not just the first token, will be annotated.
v Users may add custom regular expressions to the dictionary located atLog_Analytics_install_dir/unity_content/GA/GAInsightPack_<version>/extractors/ruleset/GA_common/dicts/userSpecifiedStrings.dict. Matches tothese regular expressions will be used when checking if the value is part of alarger concept.
Key-value pairs separated by a colon, ':'v Both the key and value must be between 1 and 3 tokensv The tokens can contain any character except whitespace or colons.v Tokens must be separated by spaces or tabsv The colon may have one or more spaces or tabs to the left and must have at
least one space or tab to the right. There may be more than one space or tab toright of the colon
v The entire string must be on a line by itself
Timestamp formats:
IBM Operations Analytics - Log Analysis is capable of annotating many commonlyused timestamp formats. This appendix lists the supported timestamp formats.
Timestamp annotations, also called date-time annotations, are constructed fromtwo base formats: a date format and a time format. Date-time annotation works asfollows:1. An annotator identifies date patterns in a text and annotates them with date
annotations.2. Another annotator identifies time patterns in the text and annotates them with
time annotations.3. The timestamp annotator then identifies and annotates specific patterns in
which date and time annotations occur contiguously in the text.
104 IBM Operations Analytics - Log Analysis: Installation, Configuration, and Administration Guide

Date annotation formats:
The date annotation formats are specified in the Date_BI.aql file.
View: DateOutput
File name: Date_BI.aql
The following date annotation formats are available.
Table 17. Date annotation formats
Formatname Pattern Examples
D1 A date interval, where:
v the month is a supported month format
v the month can precede or follow the interval
v the year is optional
v commas (,) are optional
9 - 12 December2012
December 9 – 12,2012
9 - 12 december
DEC 9 - 12
D2 A date that contains the suffixes th, st, nd, or rd, and where:
v the word “of” is optional
v the year is optional
v commas (,) are optional
v the month is a supported month format
v the month can precede or follow the day
3rd December2012
4th DEC
Dec, 1st
2nd of December
D3 A date that contains the day of the week, and where:
v the word “the” is optional
v the suffixes th, st, nd, and rd are optional
v the year is optional
v commas (,) are optional
v the month is a supported month format
v the month can precede or follow the day
Sunday, the 3rd ofDecember, 2012
Wed, 1st DEC
D4 A date that contains forward-slash characters (/), in theformat Day/Month/Year, and where:
v the month is a supported month format
v the month follows the day
v the year has four digits
v the suffixes th, st, nd, and rd are optional
3/December/2012
1st/Dec/2012
D5 A date in the format Year-Month-Day or Year.Month.Day,where:
v the year has four digits
v the month has two digits
v the day has two digits
Because this pattern comprises only digits, leading zeros (0)might be required.
2012-01-30
2012.12.03
Configuring 105

Table 17. Date annotation formats (continued)
Formatname Pattern Examples
D6 A date in the format Day-Month-Year or Day/Month/Year,where:
v the year can have two or four digits
v the month and the day do not require leading zeros (0),even if they are single digits
30-1-12
3/12/2012
D7 A date in the format Month-Day-Year or Month/Day/Year,where:
v the year can have two or four digits
v the month and the day do not require leading zeros (0),even if they are single digits
1-30-12
12/3/2012
Time annotation formats:
The time annotation formats are specified in the Time_BI.aql file.
View: TimeOutput
File name: Time_BI.aql
The following time annotation formats are available.
Table 18. Time annotation formats
Formatname Pattern Examples
T1 A time in the format Hour:Minute, where:
v the hour need not be padded with leading zeros (0) if it is asingle digit
v seconds and milliseconds are optional
v the minute is two digits
v the second, if present, is two digits and preceded by a colon(:)
v the millisecond, if present, is three digits and preceded by acolon (:) or a period (.)
2:05
20:30
02:05
23:11:59
23:11:59:120
23:11:59.120
T2 A time in T1 format, plus the year, where the year is fourdigits.
2:05 2012
23:11:59.120 2012
106 IBM Operations Analytics - Log Analysis: Installation, Configuration, and Administration Guide

Table 18. Time annotation formats (continued)
Formatname Pattern Examples
T3 A time in the format Hour:Minute:Seconds, where:
v milliseconds are optional
v the time zone is optional
v the minute is two digits
v the second is two digits and preceded by a colon (:)
v the millisecond, if present, is three digits and preceded by acolon (:) or a period (.)
v the time zone, if present, is:
– preceded by a plus (+) or minus (-) sign
– has no space preceding the plus (+) or minus (-) sign
– has the format Hour:Minute, where both the hour andminute are two digits
– contains no intervening spaces
3:11:59+05:30
2:05:59.120-01:05
T4 A time in T1 format, plus a 12-hr clock designation. 2:05 PM
11:11:59 a.m.
T5 A time in T1 format, plus a supported time zone format. 2:05 IST
11:11:59 PST
T6 A time in T1, T4, or T5 format, plus the time zone and year,where:
v the time zone is optional
v the year is optional
v the time zone, if present:
– is in digits
– is preceded by a plus (+) or minus (-) sign
– contains an optional colon (:) between the hour and theminute
v the year, if present, is four digits
11:11:59 a.m.+05:30
11:11:59 PST-0030 2012
Date-time annotation formats:
The date-time (timestamp) annotation formats are specified in theDateTime-consolidation_BI.aql file.
View: DateTimeOutput
File name: DateTime-consolidation_BI.aql
The following date-time annotation formats are available.
Configuring 107

Table 19. Date-time annotation formats
Formatname Pattern Examples
DT1 A timestamp in the format DT, where:
v D is the D1, D2, D3, D4, D5, D6, or D7 dateformat
v T is the T1, T2, T3, T4, T5, or T6 time format
Sunday, the 3rd of December,2012 23:11:59.120 IST
3/12/2012 2:11:59+05:30
6/10/12 2:48:28:381 MDT
Thu Nov 22 06:28:48 EST 2012
DT2 A timestamp in the format D4:T3. 3/December/2012:2:00:00.000
1st/Dec/2012:23:11:59+05:30
DT3 A timestamp in the formatD4:Hour:Minute:Seconds Z, where Z is an RFC822-four-digit time zone format that conformswith the Java SimpleDateFormat class.
3/December/2012:02:00:00-0030
1st/Dec/2012:23:11:59 +0530
For more information about the SimpleDateFormat class, see:
http://docs.oracle.com/javase/1.4.2/docs/api/java/text/SimpleDateFormat.html#rfc822timezone.
Other formats
The view DateTimeOutput also supports timestamp formats in these ISO dateformats:v yyyy-MM-ddTHH:mm:ss.SSSZ. For example, 2013-02-27T13:57:21.836+0000v yyyy.MM.ddTHH:mm:ss.SSSZ. For example, 2013.02.27T13:57:21.836+0000
Variations of these formats are also supported:v yyyy/MM/dd-HH:mm:ss.SSSZ. For example, 2013/02/27-13:57:21.123+0000v yyyy/MM/dd-HH:mm:ss.SSS. For example, 2013/02/27-13:57:21.123v yyyy-MM-dd-HH:mm:ss. For example, 2013-02-27-13:57:21
Date-time stamps with no year value
Some applications write logs with no year in the date/time stamp. For example,the UNIX messages log, such as shown here:Apr 24 09:41:16 bluewashmachine symcfgd: subscriber 2 has left -- closed0 remaining handles
Apr 24 09:41:20 bluewashmachine rtvscand: New virus definition file loaded.Version: 150423c.
Apr 24 09:41:38 bluewashmachine kernel: type=1400 audit(1366792898.697:52164):avc: denied{ module_request } for pid=18827 comm="smtpd" kmod="net-pf-10"scontext=system_u:system_r:postfix_smtpd_t:s0tcontext=system_u:system_r:kernel_t:s0 tclass=system
Apr 24 09:41:38 bluewashmachine kernel: type=1400 audit(1366792898.822:52165):avc: denied{ module_request } for pid=18833 comm="proxymap" kmod="net-pf-10"scontext=system_u:system_r:postfix_master_t:s0tcontext=system_u:system_r:kernel_t:s0 tclass=system
108 IBM Operations Analytics - Log Analysis: Installation, Configuration, and Administration Guide

In this case, the Generic-dateTime-Split splitter identifies the string Apr 2409:38:58 as a valid date-time stamp. To meet the required date formats of IBMOperations Analytics, a valid year must be associated with the date-time string.The generic-dateTime-split splitter address this problem by placing a yyyy valueat the beginning of the identified date-time stamp format. As a result, thetimestamp now reads 2013 Apr 24 09:38:58.
You must update the timestamp format for files this type in the indexConfig. Forexample, if you want IBM Operations Analytics to ingest log records with thetimestamp format MMM dd HH:mm:ss, the dateFormat must be specified as shownhere."timestamp": {
"searchable": true,"filterable": true,"retrievable": true,"dataType": "DATE","tokenizer": "literal","sortable": true,"source": {
"dateFormats": ["yyyy MMM dd HH:mm:ss"
],"paths": [
"metadata.timestamp"],"combine": "FIRST"
},"retrieveByDefault": true
},
The supported date formats without a year are:v Apr 16 (MMM dd)v 16 Apr (dd MMM)v 16 April (dd MMM)v April 16 (MMM dd)
Year end scenario: The generic-dateTime-split splitter applies the current year toany timestamp that is ingested where no year can be discerned from the logrecord. The exception is when the log record is ingested where current system timeof the IBM Operations Analytics server identifies the month as January, but theincoming date/timestamp is December. In such situations, the year value that isapplied is the current year minus 1.
Logs with no date
Some data sources that are ingested by IBM Operations Analytics do not support adate within the timestamp. For example, some lines of a log display thecharacteristic shown here in bold:00:11:35.103 INFO [main] - Server accepting connections on rmi://9.11.222.333:1099/
09:34:33.071 INFO [main] - Server accepting connections on tcp://9.11.222.333:3035/
To ingest such a data source, IBM Operations Analytics provides a splitter rule setGeneric-timeOnly-Split, which you can use along with the Generic-Annotator toingest such a log. The splitter prepends a date to the identified time from eachrecord of the log.
Configuring 109

You must update the timestamp format for files of this type in the indexConfig.For example, in order for IBM Operations Analytics to ingest a log with recordswith timestamp such as 09:34:33.071, the dateFormat must be specified as here."timestamp": {
"searchable": true,"filterable": true,"retrievable": true,"dataType": "DATE","tokenizer": "literal","sortable": true,"source": {
"dateFormats": ["MM/dd/yyyy HH:mm:ss.SSS"
],"paths": [
"metadata.timestamp"],"combine": "FIRST"
},"retrieveByDefault": true
},
Only the date portion of the dateFormat is fixed. The time portion must reflect theformat found in the incoming logSource.
The Generic annotator Insight Pack defines the Annotation Query Language (AQL)that supports log files with no date in the timeOnly splitter. The timeOnly splitter isdefined in the file:GAInsightPack_<version>/extractors/ruleset/timeOnlySplitter
Supported weekday formats:
The supported weekday formats are specified in the wkday.dict dictionary file.
Dictionary file: dicts/wkday.dict
The following long and short forms of the days of the week are supported. Bothlower and upper cases, and upper case for first character, are supported.
Table 20. Supported weekday formats
Long form Short form
monday mon
tuesday tue
tues
wednesday wed
thursday thu
thur
thurs
friday fri
saturday sat
sunday sun
110 IBM Operations Analytics - Log Analysis: Installation, Configuration, and Administration Guide

Supported month formats:
The supported month formats are specified in the month.dict dictionary file.
Dictionary file: dicts/month.dict
The following long and short forms of the months of the year are supported. Bothlower and upper cases, and upper case for first character, are supported.
Table 21. Supported month formats
Long form Short form
january jan
february feb
march mar
april apr
may No short form.
june jun
july jul
august aug
september sept
sep
october oct
november nov
december dec
Supported time zone formats:
The supported time zone formats are specified in the timeZone.dict dictionary file.
Dictionary file: dicts/timeZone.dict
The following 12-hour clock formats, in both lower and upper case, are supported:v a.m.v p.m.v AMv PM
The following page on SMC lists the supported time zone formats: What are thesupported time zones?
Note: If a supplied timezone is not supported, the system behaviour is to defaultto reading the system timezone and normalizing to that.
Javacore Insight PackThe Javacore Insight Pack provides the capability to ingest and perform metadatasearches against javacore files in IBM Operations Analytics - Log Analysis.
Configuring 111
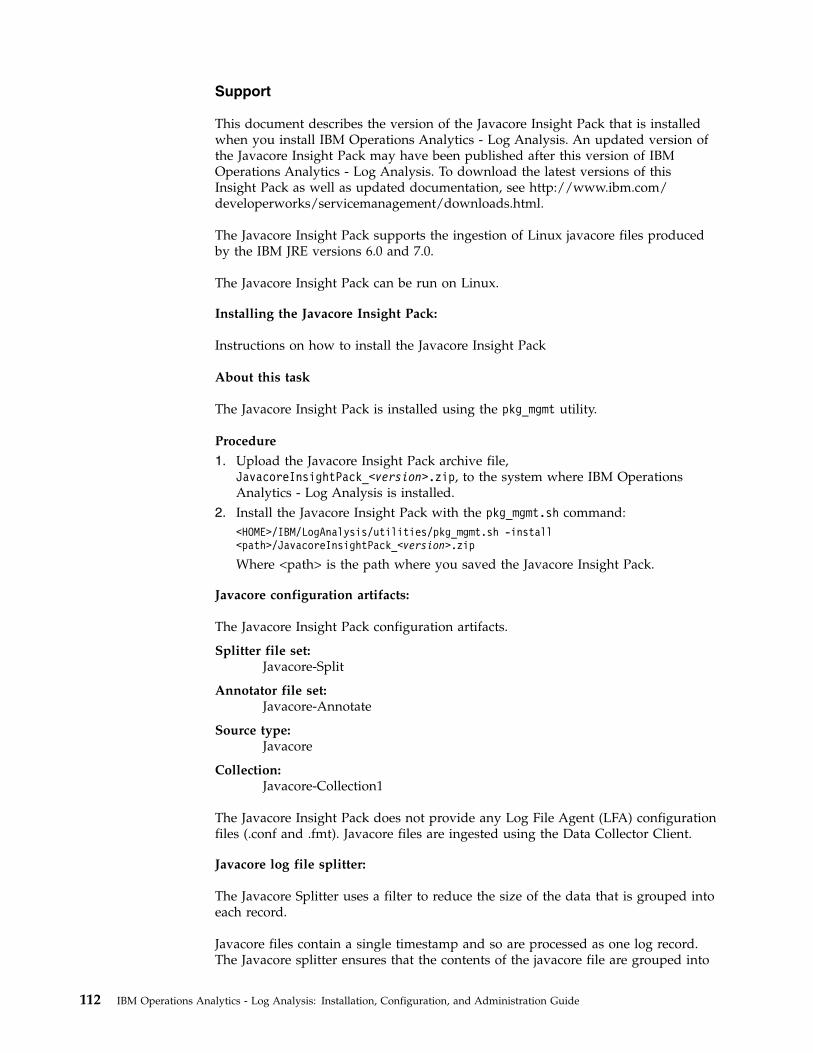
Support
This document describes the version of the Javacore Insight Pack that is installedwhen you install IBM Operations Analytics - Log Analysis. An updated version ofthe Javacore Insight Pack may have been published after this version of IBMOperations Analytics - Log Analysis. To download the latest versions of thisInsight Pack as well as updated documentation, see http://www.ibm.com/developerworks/servicemanagement/downloads.html.
The Javacore Insight Pack supports the ingestion of Linux javacore files producedby the IBM JRE versions 6.0 and 7.0.
The Javacore Insight Pack can be run on Linux.
Installing the Javacore Insight Pack:
Instructions on how to install the Javacore Insight Pack
About this task
The Javacore Insight Pack is installed using the pkg_mgmt utility.
Procedure
1. Upload the Javacore Insight Pack archive file,JavacoreInsightPack_<version>.zip, to the system where IBM OperationsAnalytics - Log Analysis is installed.
2. Install the Javacore Insight Pack with the pkg_mgmt.sh command:<HOME>/IBM/LogAnalysis/utilities/pkg_mgmt.sh -install<path>/JavacoreInsightPack_<version>.zip
Where <path> is the path where you saved the Javacore Insight Pack.
Javacore configuration artifacts:
The Javacore Insight Pack configuration artifacts.
Splitter file set:Javacore-Split
Annotator file set: Javacore-Annotate
Source type: Javacore
Collection: Javacore-Collection1
The Javacore Insight Pack does not provide any Log File Agent (LFA) configurationfiles (.conf and .fmt). Javacore files are ingested using the Data Collector Client.
Javacore log file splitter:
The Javacore Splitter uses a filter to reduce the size of the data that is grouped intoeach record.
Javacore files contain a single timestamp and so are processed as one log record.The Javacore splitter ensures that the contents of the javacore file are grouped into
112 IBM Operations Analytics - Log Analysis: Installation, Configuration, and Administration Guide

a single log record. Javacore files contain a lot of information on the state of theJVM at the time of the javacore dump. As a result javacore files can be large insize. However, not all of this data needs to be indexed and annotated. The JavacoreSplitter uses a filter to reduce the size of this data. The following entries in ajavacore file are filtered by the splitter:v 1TISIGINFO
v 1TIDATETIME
v 1TIFILENAME
v 2XHOSLEVEL
v 3XHCPUARCH
v 3XHNUMCPUS
v 1CIJAVAVERSION
v 1CIVMVERSION
v 1CIJITVERSION
v 1CIGCVERSION
v 1CIRUNNINGAS
v 1CICMDLINE
v 1CIJAVAHOMEDIR
The entire thread stack trace is also filtered. All other data is blocked by the filter.
Turning off the filter
The filter can be configured to be on or off. It is on by default. To turn off the filter,follow these steps:1. Create a file called javacore_insightpack.config2. Add the following key/value to the file: splitter.filter.on=false3. Save the file and copy it to your home directory on the IBM Operations
Analytics - Log Analysis system
Note: Turning off the filter will pass the entire javacore file contents into IBMOperations Analytics - Log Analysis. This will affect the performance of searcheson the IBM Operations Analytics - Log Analysis Search workspace as the entirejavacore file contents will be contained in the logRecord annotation.
Javacore log annotations:
The fields that are defined in the index configuration file, or annotations, aredisplayed in the IBM Operations Analytics - Log Analysis Search workspace, andcan be used to filter or search the log records.
Fields are extracted from the fields of a log record or collected from metadataaround the log file.
Table 22. Log record annotations
Field Attributes
timestamp dataType = TEXTretrievable = trueretrieveByDefault = truesortable = truefilterable = truesearchable = true
Configuring 113

Table 22. Log record annotations (continued)
Field Attributes
SignalInfo dataType = TEXTretrievable = trueretrieveByDefault = truesortable = falsefilterable = truesearchable = true
FileName dataType = TEXTretrievable = trueretrieveByDefault = truesortable = falsefilterable = truesearchable = true
OSLevel dataType = TEXTretrievable = trueretrieveByDefault = truesortable = falsefilterable = truesearchable = true
CPUArchitecture dataType = TEXTretrievable = trueretrieveByDefault = truesortable = falsefilterable = truesearchable = true
NumCPUs dataType = TEXTretrievable = trueretrieveByDefault = truesortable = falsefilterable = falsesearchable = true
JavaVersion dataType = TEXTretrievable = trueretrieveByDefault = truesortable = falsefilterable = truesearchable = true
VMVersion dataType = TEXTretrievable = trueretrieveByDefault = truesortable = falsefilterable = truesearchable = true
JITVersion dataType = TEXTretrievable = trueretrieveByDefault = truesortable = falsefilterable = truesearchable = true
GCVersion dataType = TEXTretrievable = trueretrieveByDefault = truesortable = falsefilterable = truesearchable = true
114 IBM Operations Analytics - Log Analysis: Installation, Configuration, and Administration Guide

Table 22. Log record annotations (continued)
Field Attributes
RunningAs dataType = TEXTretrievable = trueretrieveByDefault = truesortable = falsefilterable = truesearchable = true
CommandLineArgs dataType = TEXTretrievable = trueretrieveByDefault = truesortable = falsefilterable = truesearchable = true
JavaHomeDir dataType = TEXTretrievable = trueretrieveByDefault = truesortable = falsefilterable = truesearchable = true
NumThreadsRunning dataType = TEXTretrievable = trueretrieveByDefault = truesortable = falsefilterable = falsesearchable = true
NumThreadsSuspended dataType = TEXTretrievable = trueretrieveByDefault = truesortable = falsefilterable = falsesearchable = true
NumThreadsBlocked dataType = TEXTretrievable = trueretrieveByDefault = truesortable = falsefilterable = falsesearchable = true
NumThreadsParked dataType = TEXTretrievable = trueretrieveByDefault = truesortable = falsefilterable = falsesearchable = true
NumThreadsConditionWaiting dataType = TEXTretrievable = trueretrieveByDefault = truesortable = falsefilterable = falsesearchable = true
CurrentThreadStacktrace dataType = TEXTretrievable = trueretrieveByDefault = truesortable = falsefilterable = falsesearchable = true
Configuring 115
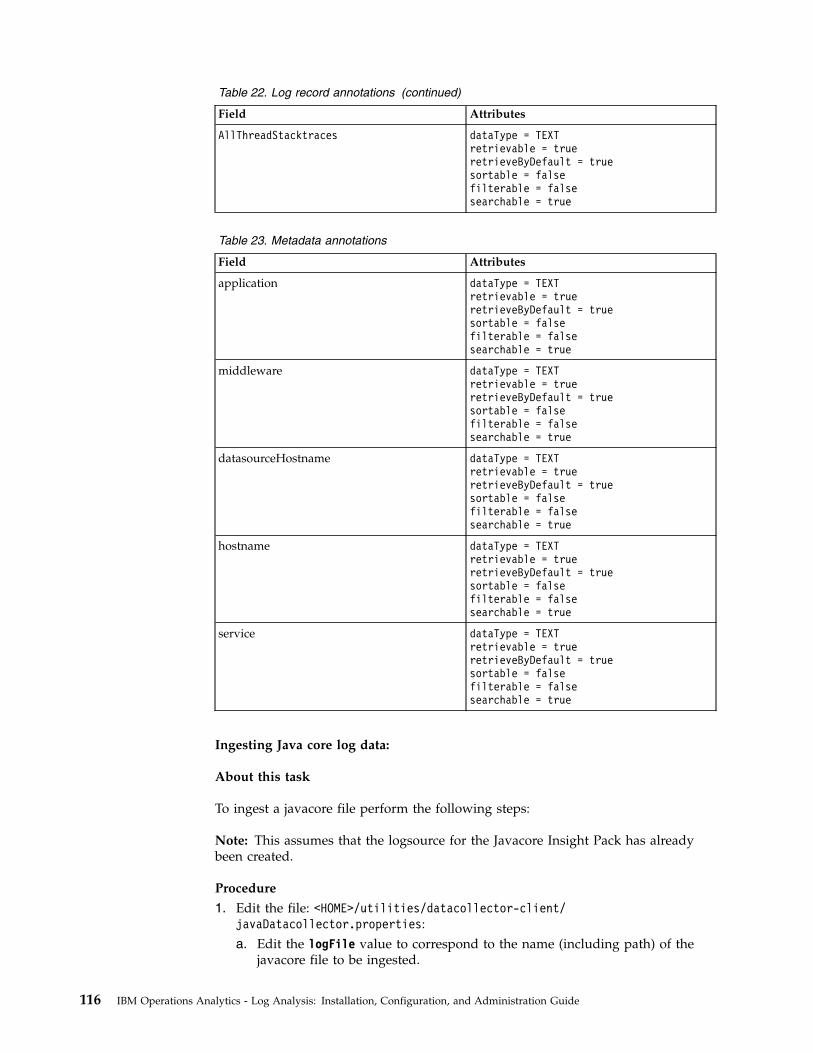
Table 22. Log record annotations (continued)
Field Attributes
AllThreadStacktraces dataType = TEXTretrievable = trueretrieveByDefault = truesortable = falsefilterable = falsesearchable = true
Table 23. Metadata annotations
Field Attributes
application dataType = TEXTretrievable = trueretrieveByDefault = truesortable = falsefilterable = falsesearchable = true
middleware dataType = TEXTretrievable = trueretrieveByDefault = truesortable = falsefilterable = falsesearchable = true
datasourceHostname dataType = TEXTretrievable = trueretrieveByDefault = truesortable = falsefilterable = falsesearchable = true
hostname dataType = TEXTretrievable = trueretrieveByDefault = truesortable = falsefilterable = falsesearchable = true
service dataType = TEXTretrievable = trueretrieveByDefault = truesortable = falsefilterable = falsesearchable = true
Ingesting Java core log data:
About this task
To ingest a javacore file perform the following steps:
Note: This assumes that the logsource for the Javacore Insight Pack has alreadybeen created.
Procedure
1. Edit the file: <HOME>/utilities/datacollector-client/javaDatacollector.properties:a. Edit the logFile value to correspond to the name (including path) of the
javacore file to be ingested.
116 IBM Operations Analytics - Log Analysis: Installation, Configuration, and Administration Guide

b. Edit the logpath value to be the same as the Javacore Logsource log pathvalue.
2. Run the following command: <HOME>/ibm-java/bin/java -jardatacollector-client.jar
Syslog Insight PackThe Syslog Insight Pack extends IBM Operations Analytics - Log Analysisfunctionality so it can ingest and perform metadata searches against syslog datalogging.
This document describes the version of the Syslog Insight Pack that is installedwhen you install IBM Operations Analytics - Log Analysis. An updated version ofthe Syslog Insight Pack may have been published after this version of IBMOperations Analytics - Log Analysis. To download the latest versions of thisInsight Pack as well as updated documentation, see http://www.ibm.com/developerworks/servicemanagement/downloads.html.
The formatted log includes specific property values in a name/value pair format toaid data ingestion.
Syslog is a standard for recording events to track system activity and to diagnoseproblems. It separates the software that generates messages from the system thatstores them and the software that reports and analyzes them. Implementations areavailable for many operating systems. Specific configuration permits the directionof messages to various devices (console), files (/var/log/) or remote syslog servers.rsyslog is an open source software utility used on UNIX and Unix-like computersystems for forwarding log messages in an IP network. It implements the basicsyslog protocol.
Supported versions
The Syslog Insight Pack can be installed with IBM Operations Analytics - LogAnalysis (SCALA) 1.1.0.0 and higher.
rsyslog version 3 is included as the default syslog tool for RHEL 5.2, and this is theminimum version supported by IBM Operations Analytics - Log Analysis. IBMOperations Analytics - Log Analysis supports rsyslog version 3, 5, 6 and 7. IBMOperations Analytics - Log Analysis supports the rsyslog list format, which isrecommended by rsyslog, for version 7 and higher of rsyslog.
Syslog installation:
Instructions on how to install the Syslog Insight Pack.
Procedure
1. Create a directory called <HOME>/IBM/LogAnalysis//unity_content/Syslog onthe system where IBM Operations Analytics - Log Analysis is installed andupload the Syslog Insight Pack archive file, SyslogInsightPack_<version>.zip,to that directory.
2. Install the Syslog Insight Pack with the pkg_mgmt.sh command:<HOME>/IBM/LogAnalysis/utilities/pkg_mgmt.sh -install <path>/SysLogInsightPack_<version>.zip
Where <path> is the path where you saved the Syslog Insight Pack.3. Deploy the log file agent with the following command:
Configuring 117

<HOME>/IBM/LogAnalysis/utilities/pkg_mgmt.sh -deploylfa <path>/SysLogInsightPack_<version>.zip
Where <path> is the path where you saved the Syslog Insight Pack.Related tasks:Installing an Insight PackYou can download an Insight Pack to extend the capabilities of IBM OperationsAnalytics - Log Analysis from Service Management Connect. This topic outlineshow to install an Insight Pack.
Syslog configuration:
Configuration of the Insight Pack are described here as a reference for users.
rsyslog requirements
Before ingesting rsyslog log files, both rsyslog and IBM Operations Analytics - LogAnalysis must be configured to ensure that rsyslog log files are output in a formatthat can be processed by IBM Operations Analytics - Log Analysis Syslog InsightPack.
Add the scalaLogFormat template to rsyslog:v For rsyslog 7 and higher, which support the list format:
1. Open the /etc/rsyslog.conf for edit.2. Add the following template:
template(name="scalaLogFormat" type="list") {property(name="timestamp" dateFormat="rfc3339")constant(value=" host=")property(name="hostname")constant(value=", relayHost=")property(name="fromhost")constant(value=", tag=")property(name="syslogtag")constant(value=", programName=")property(name="programname")constant(value=", procid=")property(name="procid")constant(value=", facility=")property(name="syslogfacility-text")constant(value=", sev=")property(name="syslogseverity-text")constant(value=", appName=")property(name="app-name")constant(value=", msg=")property(name="msg" )constant(value="\n")
}
The generated log record is formatted as2013-07-15T21:30:37.997295-04:00 host=co052065, relayHost=co052065,tag=rhnsd[12171]:, programName=rhnsd, procid=12171, facility=daemon,sev=debug, appName=rhnsd, msg= running program /usr/sbin/rhn_check
3. Associate the scalaLogFormat template with the log files to be ingested byIBM Operations Analytics - Log Analysis. It will log all log entries to<filename> in addition to any other associations in the configuration file. Forexample:*.* /var/log/<filename>.log;scalaLogFormat
4. Restart the rsyslog daemon.
118 IBM Operations Analytics - Log Analysis: Installation, Configuration, and Administration Guide

Refer to the rsyslog documentation http://rsyslog.com/doc for moreinformation.
5. Ensure that the output file created for IBM Operations Analytics - LogAnalysis can be read by your IBM Operations Analytics - Log Analysis user,and write that file directly to the monitored logsource directories.For example:*.* <HOME>/logsources/SyslogInsightPackSCALA.log;scalaLogFormat
v For versions of rsyslog older than version 7:1. Open the /etc/rsyslog.conf for edit.2. Add the following template (legacy format):
$template scalaLogFormat,"%TIMESTAMP:::date-rfc3339% host=%HOSTNAME%,relayHost=%FROMHOST%, tag=%syslogtag%, programName=%programname%,procid=%PROCID%, facility=%syslogfacility-text%, sev=%syslogseverity-text%,appName=%APP-NAME%, msg=%msg%\n"
The generated log record is formatted as2013-07-15T21:30:37.997295-04:00 host=co052065, relayHost=co052065,tag=rhnsd[12171]:, programName=rhnsd, procid=12171, facility=daemon,sev=debug, appName=rhnsd, msg= running program /usr/sbin/rhn_check
3. Associate the scalaLogFormat template with the log files to be ingested byIBM Operations Analytics - Log Analysis. It will log all log entries to<filename> in addition to any other associations in the configuration file. Forexample:*.* /var/log/<filename>.log;scalaLogFormat
4. Restart the rsyslog daemon.Refer to the rsyslog documentation http://rsyslog.com/doc for moreinformation.
5. Ensure that the output file created for IBM Operations Analytics - LogAnalysis can be read by your IBM Operations Analytics - Log Analysis user,and write that file directly to the monitored logsource directories.For example:*.* <HOME>/logsources/SyslogInsightPack SCALA.log;scalaLogFormat
For more information about rsyslog configuration files, see: http://www.rsyslog.com/doc/rsyslog_conf.html
Configuration artifacts
The following table lists the configuration artifacts that are provided with theInsight Pack for each log file.
Table 24. Insight Pack configuration artifacts
Artifact Name for the syslog log
Splitter rule set Syslog-Split
Annotator rule set Syslog-Annotate
Source type Syslog
Collection Syslog-Collection1
Note: Data sources are not predefined. A user with administrator privileges mustdefine at least one syslog data source type and collection before the application canbe used.
Configuring 119

Log File Agent configuration
The supported log files share IBM Tivoli Monitoring Log File Agent (LFA)configuration files. The following LFA configuration files are in the<HOME>/IBM-LFA-6.30/config/lo directory (where <HOME> is the install locationof IBM Operations Analytics - Log Analysis):v SyslogInsightPack-lfasyslog.conf: Configuration file for the syslog log file
agent.v SyslogInsightPack-lfasyslog.fmt: Matches records for the syslog log files.
Splitting and annotation AQL modules
Splitting and annotation are handled by the following Annotation Query Language(AQL) modules.
Table 25. Insight Pack AQL modules
AQL Module Description
common Common code module that is used across multipleinsight packs (for example, to recognize timestampformats).
dateTimeSplitter newlineSplitter Splitter modules for syslog log files.
annotatorSyslog Annotator module for syslog log files.
Log file splitters:
The splitters provided with the Insight Pack are described here as a reference forusers.
The Insight Pack supports the ISO 8061 timestamp, yyyy-mm-ddTHH:mm:ss.SSSSSSX where X is the GMT offset. Each log record begins with anISO-formatted timestamp and is split across timestamp boundaries. An example ofthe ISO-formatted timestamp generated by rsyslog is:2013-06-26T12:21:29.471400-04:00
The IBM Operations Analytics - Log Analysis index function is limited tomilliseconds in the date format. The Syslog Insight Pack will annotate thetimestamp and round up the microseconds. The sample ISO-formatted timestampwill be indexed with the following format for the index configuration:yyyy-mm-ddTHH:mm:ss.SSSX
and rendered in the IBM Operations Analytics - Log Analysis search UI as:06/26/2013 16:21:29.471-04:00
Log file annotations:
The annotations that are defined by the log file index configurations are describedhere.
The index configuration file is included in the Insight Pack in thesourcetypes.json file (found at <path>/SyslogInsightPack_<version>/metadata),where <path> is the path where you saved the Syslog Insight Pack.
120 IBM Operations Analytics - Log Analysis: Installation, Configuration, and Administration Guide

You can customize the artifacts in the index configuration file by creating anothersource type and modifying a copy of the Syslog index configuration.
The following sections describe the fields that are defined in the indexconfiguration file. These fields, or annotations, are displayed in the IBM OperationsAnalytics - Log Analysis Search workspace, and can be used to filter or search thelog records. Fields are extracted from the fields of a log record or collected frommetadata around the log file. Each table gives the names of the fields (these namescorrespond to fields in the IBM Operations Analytics - Log Analysis Searchworkspace), descriptions of how the related annotations are made, and the indexconfiguration attributes assigned to the fields.
Log record annotations
The following table lists the index configuration fields that relate to log recordannotations. Each field corresponds to part of a syslog log record.
Table 26. Log record index configuration fields
Field Description Attributes
syslogHostname The hostname from the message. dataType = TEXTretrievable = trueretrieveByDefault = truesortable = truefilterable = truesearchable = true
syslogRelayHostname The hostname of the system the message was receivedfrom (in a relay chain, this is the system immediatelyin front, and not necessarily the original sender).
dataType = TEXTretrievable = trueretrieveByDefault = truesortable = truefilterable = truesearchable = true
tag The TAG from the message. dataType = TEXTretrievable = trueretrieveByDefault = truesortable = truefilterable = falsesearchable = true
programName The static part of the tag as defined by BSD syslogd.For example, when TAG is "named[12345]",programName is "named".
dataType = TEXTretrievable = trueretrieveByDefault = truesortable = truefilterable = truesearchable = true
processID The contents of the PROCID field. dataType = TEXTretrievable = trueretrieveByDefault = truesortable = falsefilterable = truesearchable = true
facility The facility from the message. dataType = TEXTretrievable = trueretrieveByDefault = truesortable = truefilterable = truesearchable = true
Configuring 121

Table 26. Log record index configuration fields (continued)
Field Description Attributes
severity The severity from the message (in text form). dataType = TEXTretrievable = trueretrieveByDefault = truesortable = truefilterable = truesearchable = true
syslogAppName The APP-NAME from the message. dataType = TEXTretrievable = trueretrieveByDefault = truesortable = truefilterable = truesearchable = true
message The MSG (the message) in the log record. dataType = TEXTretrievable = trueretrieveByDefault = truesortable = falsefilterable = falsesearchable = true
Metadata annotations
The following table lists the index configuration fields that relate to metadataannotations.
Table 27. Metadata annotation index configuration fields
Field Description Annotation attributes
datasourceHostname The host name that is specified in the data source. dataType: TEXTretrievable: trueretrieveByDefault: truesortable: falsefilterable: truesearchable: true
timestamp The timestamp from the log record. dataType = DATEretrievable = trueretrieveByDefault = truesortable = truefilterable = truesearchable = true
application The application name that is populated by the servicetopology data source field.
dataType: TEXTretrievable: trueretrieveByDefault: truesortable: falsefilterable: falsesearchable: true
middleware The middleware name that is populated by the servicetopology data source field.
dataType: TEXTretrievable: trueretrieveByDefault: truesortable: falsefilterable: falsesearchable: true
hostname The host name that is populated by the servicetopology data source field.
dataType: TEXTretrievable: trueretrieveByDefault: truesortable: truefilterable: truesearchable: true
122 IBM Operations Analytics - Log Analysis: Installation, Configuration, and Administration Guide

Table 27. Metadata annotation index configuration fields (continued)
Field Description Annotation attributes
service The service name that is populated by the servicetopology data source field.
dataType: TEXTretrievable: trueretrieveByDefault: truesortable: falsefilterable: falsesearchable: true
logRecord The entire log record output by the splitter. dataType: TEXTretrievable: trueretrieveByDefault: truesortable: falsefilterable: falsesearchable: true
Log file considerations:
This section covers log rotation and the streaming of logs to a centralized server.
Log rotation
Linux provides logrotate to configure rotation. The global options are specified in/etc/logrotate.conf. Options for specific files (which can over ride the globaloptions) are in /etc/logrotate.d for each log file.
Note: For more information on the logrotate command, look up the UNIXcommand documentation online.
When the logs are rotated, the log file is renamed with a .1 extension (assumingthe dateext option is not included) and truncated to zero length. The rotationconfiguration also determines how often old logs are archived, that is, old *.n areremoved or archived. The log locations are defined in /etc/rsyslog.conf (which isby default /var/log).
The recommended method for loading data is to use the IBM Tivoli MonitoringLog File Agent (LFA) installed on the remote system where rsyslogd is executingto push data, or use LFA installed where IBM Operations Analytics - Log Analysisis installed to pull data. Create .conf and .fmt files specific to each log file, thedestination of which is specified in /etc/rsyslog.conf. The data source definitionshould specify <filename>.1. This ensures all log records are processed. However,they will only be sent when the rotation occurs. The user can configure rotation tooccur more frequently to minimize the time lag from the current log. Alternatively,the user can monitor the <filename>. When you monitor <filename>, there is awindow where log entries will not be forwarded if log entries are rotated beforeLFA has polled the data. If the user has configured daily or hourly rotation, theycan monitor the *.1 file name to avoid a window where log entries are notforwarded.
The best practice is to rotate the logs frequently so <filename>.1 has recent data forIBM Operations Analytics - Log Analysis to ingest. The default log rotation isweekly. You can change the rotation for syslog in /etc/logrotate.d/syslog. Tochange it to daily, add the daily option in /etc/logrotate.d/syslog configurationfile. If the logs are large, you can rotate them based on a size with the size option.
Configuring 123

The following two sections describe configuration changes to SyslogInsightPack-lfasyslog.conf and SyslogInsightPack-lfasyslog.fmt only when dealing withrotating log files.
Logfile Agent Configuration - SyslogInsightPack-lfasyslog.conf
The following parameters should be specified to monitor the rotating files:LogSources=<syslog directory to monitor>/<logfilename>.*FileComparisonMode=CompareByAllMatches
Logfile Agent Configuration - SyslogInsightPack-lfasyslog.fmt
Use the following specification to avoid defining multiple data sources because ofthe file name changes when the log rotates. This allows a fixed file name in the logpath specification.// Matches records for any Log file://
REGEX AllRecords(.*)hostname LABEL-file <logfilename>.logRemoteHost DEFAULTlogpath PRINTF("%s",file)text $1END
Centralized logging
If you are streaming logs to a central server, the best practice is to stream to oneconsolidated log for ingestion by IBM Operations Analytics - Log Analysis. Thesame best practices are applicable to the consolidated file as for the logs in thenon-server scenario. The logs should be rotated frequently so <filename>.1 hasrecent data, and the Log File Agent should be used to pull or push the data to theIBM Operations Analytics - Log Analysis server.
To configure rsyslog to stream logs to a central server (for example, 192.168.1.1), dothe following:1. Add the following to each client (or edge systems) /etc/rsyslog.conf file to
stream to the central server:$ModLoad imuxsock
$ModLoad imklog
# Provides UDP forwarding. The IP is the server’s IP address*.* @192.168.1.1:514# Provides TCP forwarding. But the current server runs on UDP# *.* @@192.168.1.1:514
2. On the central server (for example, with IP address 192.168.1.1) add thefollowing to rsyslog.conf:$ModLoad imuxsock
# provides kernel logging support (previously done by rklogd)$ModLoad imklog
# Select the syslog reception of UDP or TCP. For TCP, load imtcp byuncommenting $ModLoad imtcp.#$ModLoad imudp#$ModLoad imtcp
124 IBM Operations Analytics - Log Analysis: Installation, Configuration, and Administration Guide

# Select the syslog reception port. For TCP, uncomment InputServerRun 514#$UDPServerRun 514#$InputTCPServerRun 514# This FILENAME template generates the log filename dynamically.# You can replace the specification with variables applicable to# your site.# The scalaLogFormat template formats the message required# for ingestion by SCALA.$template FILENAME,"/var/log/scala-syslog.log"$template scalaLogFormat,"%TIMESTAMP:::date-rfc3339% host=%HOSTNAME%,relayHost=%FROMHOST%, tag=%syslogtag%, programName=%programname%,
procid=%P ROCID%, facility=%syslogfacility-text%,sev=%syslogseverity-text%, appName=%APP-NAM E%, msg=%msg%\n"
# Log all messages to the dynamically formed file.*.* ?FILENAME;scalaLogFormat
3. Decide whether you are going to use either the UDP or TCP configuration andcomment out the other. For example, to use TCP update the code section asfollows:# Select the syslog reception of UDP or TCP. For TCP, load imtcp# by uncommenting $ModLoad imtcp.#$ModLoad imudp$ModLoad imtcp
# Select the syslog reception port. For TCP, uncomment# InputServerRun 514#$UDPServerRun 514$InputTCPServerRun 514
Web Access Logs Insight PackThe Web Access Logs Insight Pack provides the capability to ingest and performmetadata searches against Web Access Logs (Apache IHS, JBoss, Apache Tomcat) inIBM Operations Analytics - Log Analysis.
This document describes the version of the Web Access Logs Insight Pack that isinstalled when you install IBM Operations Analytics - Log Analysis. An updatedversion of the Web Access Logs Insight Pack may have been published after thisversion of IBM Operations Analytics - Log Analysis. To download the latestversions of this Insight Pack as well as updated documentation, seehttp://www.ibm.com/developerworks/servicemanagement/downloads.html.
The Web Access Log Insight Pack ingests records in the web server access log.Server access logs record information about all requests handled by a web server.This can include information about the IP address of the client making the request,userid of the person making the request (determined by the HTTP authentication),timestamp when the request was received, the request line, etc. The access log ishighly configurable, and the LogFormat or pattern is used to define the contentsand format of the access log.
Note: The access log is different from the web server log, server.log.
By using the LogFormat directive or pattern to create a delimiter-separated value(DSV) access log file, the Web Access Log Insight Pack can annotate and indexaccess logs for ingestion, annotation, and indexing into IBM Operations Analytics -Log Analysis. The Web Access Logs Insight Pack supports the following webservers (and any others which enable the LogFormat specification required by thisinsight pack):v Apache/IBM HTTP Server 8.5.5.0
Configuring 125

v Apache Tomcat 7.0.42, 6.0.37v JBoss v7
The Web Access Logs Insight Pack can be installed with IBM Operations Analytics- Log Analysis 1.1.0.2 and higher.
Installing the Web Access Logs Insight Pack:
Instructions on how to install the Web Access Logs Insight Pack
Before you begin
The prerequisites of the Web Access Logs Insight Pack are:v IBM Operations Analytics - Log Analysis v1.1.0.2v DSV Toolkit v1.1.0.1 or higher
Note: The DSV is only needed if you are generating a new insight pack tosupport other access log formats.
About this task
The Web Access Logs Insight Pack is installed using the pkg_mgmt utility.
Procedure
1. Upload the Web Access Logs Insight Pack archive file,WebAccessLogInsightPack_<version>.zip, to the system where IBM OperationsAnalytics - Log Analysis is installed.
2. Install the Web Access Logs Insight Pack uisng the pkg_mgmt.sh command:<HOME>/IBM/LogAnalysis/utilities/pkg_mgmt.sh -install<path>/WebAccessLogInsightPack_<version>.zip
Where <path> is the path where you saved the Web Access Logs Insight Pack.3. (Optional) If you are using the Log File Agent to load the data into IBM
Operations Analytics - Log Analysis, deploy the log file agent configurationfiles with the following command:<HOME>/IBM/LogAnalysis/utilities/pkg_mgmt.sh -deploylfa<path>/WebAccessLogInsightPack_<version>.zip
Where <path> is the path where you saved the Web Access Logs Insight Pack.
Configuring the Web Access Logs Insight Pack:
Instructions on how to configure the Web Access Logs Insight Pack.
Procedure
1. In the IBM Operations Analytics - Log Analysis Administrative Settingsworkspace, create a new log source for the log file to be monitored. The sourcetype should be WebAccessLog.
2. On the web server, customize the access log format to a delimiter-separatedvalue output (DSV) that can be consumed by the Web Access Log Insight Packand IBM Operations Analytics - Log Analysis. The syntax to customize the logformat is different for each web server, but the generated log will be the same.Following is the log format directive for the supported web servers:
For Apache/IHS
126 IBM Operations Analytics - Log Analysis: Installation, Configuration, and Administration Guide

a. Edit <ServerRoot>/conf/httpd.conf file, where <ServerRoot> is theroot installation path.1) Add the following log format directive:
LogFormat "Apache/IHS,%h,%l,%u,%t,%m,\"%r\",%>s,%b,%D,\"%{Referer}i\",\"%{User-Agent}i\"" scalaAccessLog
2) Update the access log directory specification to use theLogFormat directive:CustomLog logs/access_log scalaAccessLog
3) Comment out the following line by prefixing it with #:CustomLog logs/access_log common
b. Restart the web server.c. The generated access files are at <ServerRoot>/logs.
For JBoss
a. Edit the file <JBOSS_HOME>/jboss-eap-6.1/standalone/configuration/standalone.xml
b. Find the XML element subsystemxmlns="urn:jboss:domain:web:1.4" and add the following<access_log> element:<subsystem xmlns="urn:jboss:domain:web:1.4"default-virtual-server="default-host" native="false><connector name="http" protocol="HTTP/1.1" scheme="http"socket-binding="http"/><virtual-server name="default-host" enable-welcome-root="true"><alias name="localhost"/><alias name="example.com"/><access-log prefix="access-log." pattern="JBoss,%h,%l,%u,%t,%m," %r",%s,%b,%D,"%{Referer}i","%{User-Agent}i""><directory path="." relative-to="jboss.server.log.dir"/>
</access-log></virtual-server>
</subsystem>
c. Restart the JBoss App Serverd. Look for the access log file in <JBOSS_HOME>/standalone/log
Where <JBOSS_HOME> is the directory where you installed JBoss
For Apache Tomcat
a. Edit the file <tomcat-dir>/conf/server.xml where <tomcat-dir> isthe installation root and add the following log format:<Valve className="org.apache.catalina.valves.AccessLogValve"directory="logs"prefix="localhost_access_log." suffix=".txt"pattern="Tomcat,%h,%l,%u,%t,%m,"%r",%s,%b,%D,"%{Referer}i","%{User-Agent}i""/>
b. Restart the web server using the scripts in <tomcat-dir>/binc. The log files are written on <tomcat-dir>/logs/
localhost_access_log.<date>.txt
3. (Optional) Configure the Log File Agent to monitor rotated logs. This step isonly required if your web server is configured to rotate log files and you areusing the Log File Agent to ingest the log files.
Configuring 127

Note: Access logs are rotated by default for Apache Tomcat and JBoss. AccessLogs are not rotated by default for Apache/IHS. For instructions on how toconfigure log rotation for Apache/IHS, see “Web Access Logs Best Practices” onpage 135.Each web server has different syntax on how to specify rotation and thegenerated filename. By default, a rotated log has a timestamp or a number inthe filename. Specify the log filename pattern in the WebAccessLogInsightPack-lfadsv.conf file that is applicable to your web server.a. In WebAccessLogInsightPack-lfadsv.conf, update LogSources to monitor all
the files in the directory:LogSources=<web server log directory to monitor>/<access_log_filename_without_timestamp>*FileComparisonMode=CompareByAllMatches
b. Update WebAccessLogInsightPack-lfadsv.fmt to specify a fixed filename soyou can use the same fixed name in the path of the IBM OperationsAnalytics - Log Analysis logsource configuration. You only need to defineone logsource with this path, and LFA will monitor all the files in thedirectory because you specified wildcard file naming in theWebAccessLogInsightPack-lfadsv.conf specification.// Matches records for any Log file:// REGEX AllRecords(.*) hostname LABEL-file web_server_access.logRemoteHost DEFAULT logpath PRINTF("%s",file)text $1END
LFA will monitor all the log records in the directory (as specified by theLogSources value). This ensures no data will be lost as logs are rotated.However, LFA is allocating resources to monitor each file. This results inunnecessary resources since the rotated logs will not be updated again. It is abest practice to periodically archive old logs so LFA can release resourcesmonitoring static files. For Unix, you can use tools like logrotate and cron toschedule archiving of old logs.
4. If you want to collect logs from multiple web servers, or want to ingest anarchive of rotated logs, the recommended method for loading data is to use theData Collector client.
Web Access Logs splitter rules:
Splitting describes how IBM Operations Analytics - Log Analysis separatesphysical log file records into logical records using a logical boundary such as timestamp or a new line.
The Web Access Log Insight Pack will split log records on new line boundaries.
Web Access Logs annotation rules:
After the log records are split, the logical records are sent to the annotation engine.The engine uses rules to extract important pieces of information that are sent to theindexing engine.
According to the required configuration, the format of a web access log file is:<webServerType>,<clientIP>,<ident>,<auth>,<timestamp>,<verb>,"<request>",<response>,<bytes>,<responseTime>,"<referrer>","<agent>"
128 IBM Operations Analytics - Log Analysis: Installation, Configuration, and Administration Guide

For example:Apache/IHS,119.63.193.107,-,-,[22/Jul/2013:18:12:37 +0200],GET,"GET / HTTP/1.1",200,3759,324,"-","Baiduspider+(+http://www.baidu.jp/spider/)"
Where the following formatting applies:
Table 28. Web Access Logs formatting
Field Format String Description
webServerType Apache/IHS, JBoss, Tomcat Web server that generatedthis log
clientIP %h Remote hostname or IPaddress
ident %l Remote logname
auth %u Remote user if the requestwas authenticated
timestamp %t Time the request wasreceived, in the common logformat [dd/MMM/yyyy:HH:mm:ss Z]
verb %m Request method (GET, POST,etc)
request %r First line of request (methodand request URI)
response %s
%>s (Apache/IHS)
HTTP status code of theresponse
bytes %b Bytes sent (excluding HTTPheader), or "-" if 0
responseTime %D Time taken to processrequest in millis (Tomcat,JBoss) or microseconds(Apache/IHS)
referrer %{Referer}i Referrer on the request
agent %{User-Agent}i User agent on the request
If you have a mixed web server environment, and you are tracking theresponseTime (perhaps in a Custom Search Dashboard), you may need tonormalize the data. The webServerType can be used to know if the responseTime isin millisecond or microsecond.
Log File Agent configuration:
You can use the IBM Tivoli Log File Agent to load data into the IBM OperationsAnalytics - Log Analysis.
The following Log File Agent configuration files will be installed in<HOME>/IBM-LFA-6.23/config/lo directory when pkg_mgmt is run with the-deploylfa option.v WebAccessLogInsightPack-lfadsv.conf - Configuration for the web access log
file agent.v WebAccessLogInsightPack-lfadsv.fmt - Matches records for the web access log
files.
Configuring 129

Web Access Logs index configuration:
To control how IBM Operations Analytics - Log Analysis indexes records from alog file, you can create indexing settings for your content Insight Pack.
The fields that are defined in the index configuration file, or annotations, aredisplayed in the IBM Operations Analytics - Log Analysis Search workspace, andcan be used to filter or search the log records.
Fields are extracted from the fields of a log record or collected from metadataaround the log file.
Table 29. Log index configuration
Field Description Attributes
datasourceHostname hostname from the logsourcedefinition
dataType = TEXTretrievable = trueretrieveByDefault = truesortable = falsefilterable = truesearchable = truesource = metadata
logRecord complete log record text dataType = TEXTretrievable = trueretrieveByDefault = truesortable = falsefilterable = falsesearchable = truesource = annotate
webServerType type of web server (Apache, JBoss,Tomcat)
dataType = TEXTretrievable = trueretrieveByDefault = truesortable = truefilterable = truesearchable = truesource = annotate
clientIP remote hostname or IP address dataType = TEXTretrievable = trueretrieveByDefault = truesortable = falsefilterable = truesearchable = truesource = annotate
ident remote logname dataType = TEXTretrievable = trueretrieveByDefault = truesortable = truefilterable = truesearchable = truesource = annotate
auth remote user if the request wasauthenticated
dataType = TEXTretrievable = trueretrieveByDefault = truesortable = truefilterable = truesearchable = truesource = annotate
130 IBM Operations Analytics - Log Analysis: Installation, Configuration, and Administration Guide

Table 29. Log index configuration (continued)
Field Description Attributes
timestamp Time the request was received. Thedate format is:
dd/MMM/yyyy:HH:mm:ss Z
dataType = DATEretrievable = trueretrieveByDefault = truesortable = truefilterable = truesearchable = truesource = annotate
verb request method (GET, POST, etc) dataType = TEXTretrievable = trueretrieveByDefault = truesortable = truefilterable = truesearchable = truesource = annotate
request first line of request (method andrequest URI)
dataType = TEXTretrievable = trueretrieveByDefault = truesortable = truefilterable = falsesearchable = truesource = annotate
response HTTP status code of the response dataType = TEXTretrievable = trueretrieveByDefault = truesortable = truefilterable = truesearchable = truesource = annotate
bytes bytes sent (excluding HTTP header) dataType = LONGretrievable = trueretrieveByDefault = truesortable = truefilterable = falsesearchable = truesource = annotate
responseTime time taken to process request inmilliseonds (Tomcat, JBoss) ormicroseconds (Apache)
dataType = LONGretrievable = trueretrieveByDefault = truesortable = truefilterable = truesearchable = truesource = annotate
referrer referrer on the request dataType = TEXTretrievable = trueretrieveByDefault = truesortable = truefilterable = falsesearchable = truesource = annotate
agent user agent on the request dataType = TEXTretrievable = trueretrieveByDefault = truesortable = truefilterable = falsesearchable = truesource = annotate
Configuring 131

Web Access Logs configuration artifacts:
The Web Access Logs Insight Pack configuration artifacts.
The following artifacts are created when the Insight Pack is installed:
WebAccessLog-SplitSplitter rule set.
WebAccessLog-AnnotateAnnotator rule set
WebAccessLogSource type
WebAccessLog-Collection1Collection
Generating an alternate Web Access Log Insight Pack:
Some customers may not be able to change the log format. In this situation youmay need to create an insight pack that recognizes your log format, and whichreuses the files provided by the Web Access Log Insight Pack.
About this task
The following steps describe how the user creates an Insight Pack re-using the filesprovided by the Web Access Log Insight Pack to recognize their log format. Thisassumes you have knowledge of the DSV toolkit (see the readme in the DSVtoolkit docs directory for more information). Use the latest DSV Toolkit (at leastversion 1.1.0.1) available.
Procedure
1. Make a copy of the WebAccessLogModDSV.properties file, and update the copiedfile to contain the log fields and delimiter in your log. The file is found in<HOME>/IBM/LogAnalysis/unity_content/WebAccessLog/WebAccessLogInsightPack_v1.1.0.0/dsv
2. In the WebAccessLogModDSV.properties file, change the aqlModulename which isalso used to generate the Insight Pack name. For example, changeaqlModulename to WebAccessLogMod.
3. Copy the DSV toolkit, DSVToolkit_v1.1.0.1.zip, to <HOME>/IBM/LogAnalysis/unity_content and unzip it.
4. Invoke the python script to generate a new DSV Insight Pack using theupdated DSV property file:python dsvGen.py<HOME>/IBM/LogAnalysis/unity_content/WebAccessLog/WebAccessLogInsightPack_v1.1.0.0/dsv/WebAccessLogModDSV.properties -d
5. Edit the generated annotation module to change the byte annotation to be thesame as found in the Web Access Log annotation:<HOME>/IBM/LogAnalysis/unity_content/WebAccessLog/WebAccessLogInsightPack_v1.1.0.0/dsv/extractors/ruleset/WebAccessLog/annotations.aql
Replace:create view bytesFinal as
select stripQuotes(D.bytes) as bytesfrom DelimiterSplit D;
with the following:
132 IBM Operations Analytics - Log Analysis: Installation, Configuration, and Administration Guide

/*--------------------------------------------------------------------*//* Tweak the AQL to annotate only bytes that appear as numeric digits *//* Igore bytes that are written to the log as "-" */
create view bytesBasic asselect stripQuotes(D.bytes) as bytesfrom DelimiterSplit D;
create view bytesConsolidated asextract regex /(\d+)/on D.bytesreturn
group 0 as matchand group 1 as bytes
from bytesBasic D;
create view bytesFinal asselect GetText(D.bytes) as bytesfrom bytesConsolidated D;
/*--------------------------------------------------------------------*/
6. To restart IBM Operations Analytics - Log Analysis run the following commandfrom the <HOME>/IBM/LogAnalysis/utilities directory:<HOME>/IBM/LogAnalysis/utilities/unity.sh -restart
Note: Space is not a valid delimiter for the DSV Toolkit. If you use space as adelimiter, you have to update the generated annotator and splitter to recognizeit.
Web Health Check Custom Search Dashboard:
The Web Health Check Custom Search Dashboard visualizes data from the webaccess logs.
The Web Health Check Custom Search Dashboard contains the following charts:
Total Web RequestsPlots the number of web requests from the last day in a line chart.
Response TimePlots the response times from the last day in a point chart.
Abnormal Response CodePlots all non-200 response codes over the last day in a bubble chart.
Worst Client Response TimesPlots the maximum response times of each client IP (which is not 127.0.0.1)over the last day in a bubble chart.
Response Time SLA Violations (>100)
Plots the number of web requests where the response time is > 100 overthe last day in a point chart. The query can be configured by the user tomatch the his SLA rules.
Note: For Apache IHS web servers, the response time is given inmicroseconds. For Apache Tomcat and JBoss web servers, the responsetimes are in milliseconds.
These charts also support drill down. You can double-click on any datapoint in the chart to open a Search workspace that is scoped to the logrecords that make up that data point.
Configuring 133

Configuring the Web Health Check Custom Search Dashboard:
The available options for customizing the Web Health Check Custom SearchDashboard
About this task
By default, the Web Health Check Custom Search Dashboard displays data for therelative time interval Last Day. The time filter can be changed by editing the ChartSettings, and specifying the Time Filter in the Query tab.
Create a new Web Health Check Custom Search Dashboard by copying the WebHealth Check.appExmpl in the <HOME>/AppFramework/Apps/WebAccessLogInsightPack_v1.1.0.2 directory.
Rename the copied file as follows: <newname>.app.
To customize the new Custom Search Dashboard, complete following steps:
Procedure
1. The log source used by the Web Health Check Custom Search Dashboard iscalled accessLog. Change the logsources parameter for each chart that youwant to change.For example:"logsources":[
{"type":"logSource","name":"/accessLog"}],
2. The relative time interval for each chart defaults to the last day. Change thetimefilters parameter for each chart to specify a new default relative timeinterval. The granularity can be specified as second, minute, hour, day, week,month, or year.For example:"filter":{
"timefilters": {"granularity" : "day","lastnum" : 1,"type": "relative"}},
3. The Response Time SLA Violations charts defaults to responseTime >100.Change the query parameter to define a different SLA violation rule.For example:{
"name":"ResponseTimeSLAViolations","type":"FacetedSearchQuery","start": 0,"results": 0,"value":{"filter":{"timefilters": {"granularity" : "day","lastnum" : 1,"type": "relative"}},
134 IBM Operations Analytics - Log Analysis: Installation, Configuration, and Administration Guide

"logsources":[{"type":"logSource","name":"/accessLog"}],"query":"responseTime: > 100","outputTimeZone":"UTC","getAttributes":["timestamp","responseTime"],"sortKey": ["-timestamp"],"facets":{"timestamp":{"date_histogram":{"field":"timestamp","interval":"hour","outputDateFormat":"yyyy-MM-dd’T’HH:mm:ssZ","outputTimeZone":"UTC"}}}}
}
4. After you edit the Custom Search Dashboard file, refresh the Custom SearchDashboards pane in the Search UI in order to pick up the changes.
Web Access Logs Best Practices:
Best practices for integrating your web access logs with IBM Operations Analytics -Log Analysis
Note: Access logs are rotated by default for Apache Tomcat and JBoss. Access Logsare not rotated by default for Apache/IHS.
Configuring log rotation for Apache IHS
The best practice is to configure the web server so that its access logs are rotatedand then monitor all rotated access logs.
rotatelogs is a simple program for use in conjunction with Apache's piped logfilefeature. It supports rotation based on a time interval or file size (in seconds). Thefilenames are <logfile>.nnnn or <logfile>.<time> dependent on the rotatelogsspecification. For more information on rotating lots, see http://httpd.apache.org/docs/2.0/programs/rotatelogs.html.
Some users do not use the rotatelogs option because it is configured as a pipe anduses resources (that is, runs as a separate process). Another option users consider isthe Unix logrotate tool. The filenames generated are access.log, access.log.1,access.log.2, and so on.
Example
An example of how to configure log rotation for Apache IHS:1. Update the httpd.conf file:
a. Add the following lines to the httpd.conf file:
Configuring 135

CustomLog "/root/IBM/HTTPServer/bin/rotatelogs/root/IBM/HTTPServer/logs/access_log.%Y-%m-%d-%H_%M_%S 86400" scalaAccessLog
b. Replace /root/IBM/HTTPServer with whatever you are using as HTTPServerhome variable
2. Update the log file agent configuration file:a. Add the following line to the WebAccessLogInsightPack-lfadsv.conf file:
LogSources=<log directory>/access_log*
b. If more than one file matches the pattern, add the lineFileComparisonMode=CompareByAllMatches so you will monitor all the files.
3. Update the WebAccessLogInsightPack-lfadsv.conf file with the following code:// Matches records for any Log file://
REGEX AllRecords(.*)hostname LABEL-file ihs-access-logRemoteHost DEFAULTlogpath PRINTF("%s",file)text $1END
Web Access Logs Insight Pack References:
Important references for your Web Access Logs Insight Pack.
JBoss AS v7 documentation: https://docs.jboss.org/author/display/AS71/Documentation
Tomcat documentation:http://tomcat.apache.org/
Apache/IHS documentation: http://www-01.ibm.com/support/knowledgecenter/SSAW57_8.0.0/com.ibm.websphere.ihs.doc/info/ihs/ihs/welcome_ihs.html
Note: This documentation describes IBM HTTP Server in context of theWebSphere Application Server.
WebSphere Application Server Insight PackA WebSphere Application Server Insight Pack is provided with IBM OperationsAnalytics - Log Analysis.
The Insight Pack includes support for ingesting and performing metadata searchesagainst the following WebSphere Application Server V7 and V8 log files:v SystemOut.log
v SystemErr.log
v trace.log
This document describes the version of the WebSphere Application Server InsightPack that is installed when you install IBM Operations Analytics - Log Analysis.An updated version of the WebSphere Application Server Insight Pack may havebeen published after this version of IBM Operations Analytics - Log Analysis. Todownload the latest versions of this Insight Pack as well as updateddocumentation, see http://www.ibm.com/developerworks/servicemanagement/downloads.html.
136 IBM Operations Analytics - Log Analysis: Installation, Configuration, and Administration Guide

Configuration artifacts
The Insight Pack supports the WebSphere Application Server timestamp formatMM/dd/yy HH:mm:ss:SSS Z.
The timestamp format can be changed in the Data Sources workspace.1. Open an existing WebSphere Application Server source type, then click View
Index Configuration.2. Select all of the text and copy it to the clipboard.3. Create a new source type, and click Edit Index Configuration.4. Paste the original index configuration into the editor, then modify the
dateFormats field of the timestamp entry.5. Fill in the remaining source type fields and click OK. Next, create a new
collection that uses the source type you just created.
Note: Data sources are not predefined. A user with administrator privileges mustdefine at least one WebSphere Application Server data source before theapplication can be used.
The following table lists the configuration artifacts that are provided with theInsight Pack for each log file.
Table 30. Insight Pack configuration artifacts
SystemOut.log SystemErr.log trace.log
Splitter WASJavaSplitter WASSystemErr-Split WASTrace-Split
Annotator WASJavaAnnotator WASSystemErr-Annotate WASTrace-Annotate
Source type WASSystemOut WASSystemErr WASTrace
Collection WASSystemOut-Collection1 WASSystemErr-Collection1 WASTrace-Collection1
Note: The Splitter and Annotator for SystemOut.log use Java. The Splitters andAnnotators for SystemErr.log and trace.log use the Annotation Query Language(AQL).
Log File Agent configuration
The supported log files share IBM Tivoli Monitoring Log File Agent (LFA)configuration files. The following LFA configuration files are in theLog_Analytics_install_dir/IBM-LFA-6.30/config/lo directory:v WASInsightPack-lfawas.conf: Configuration file for the WAS log file agent.v WASInsightPack-lfawas.fmt: Matches records for the WAS log files.
Splitting and annotation AQL modules
Splitting and annotation are handled by the following Annotation Query Language(AQL) modules.
Table 31. Insight Pack AQL modules
AQL Module Description
common Common code module that is used acrossmost WebSphere Application Server log files(for example, to recognize timestampformats).
Configuring 137
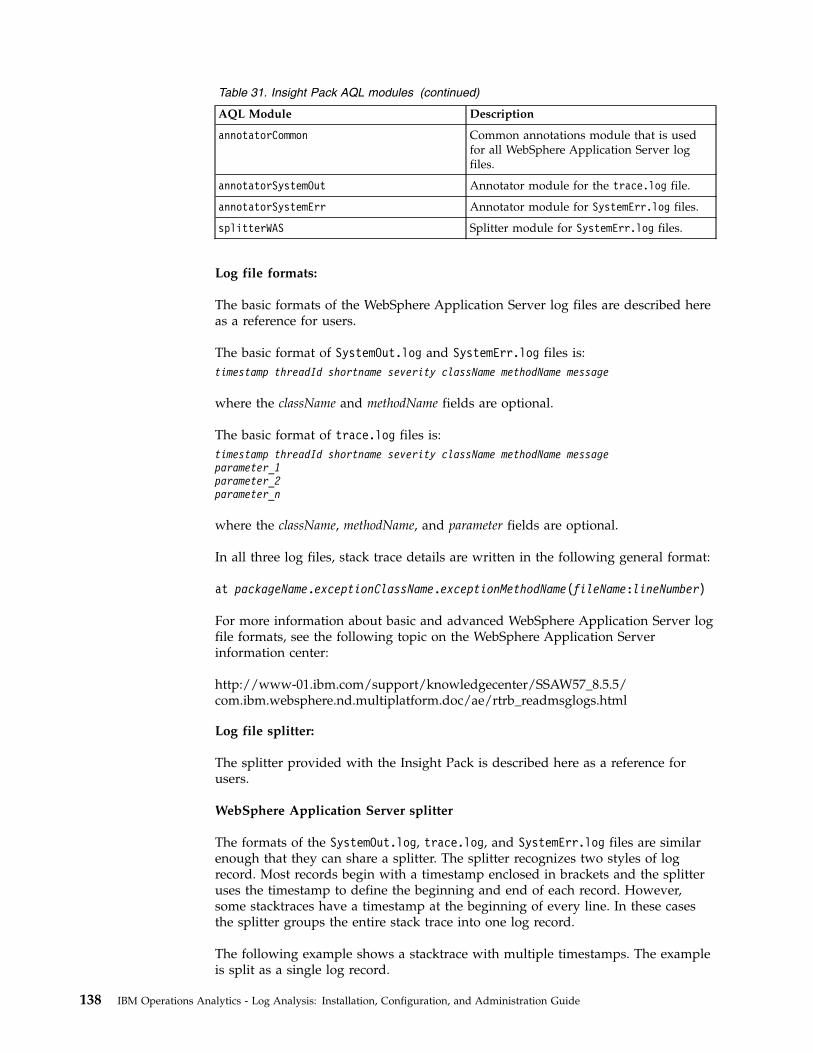
Table 31. Insight Pack AQL modules (continued)
AQL Module Description
annotatorCommon Common annotations module that is usedfor all WebSphere Application Server logfiles.
annotatorSystemOut Annotator module for the trace.log file.
annotatorSystemErr Annotator module for SystemErr.log files.
splitterWAS Splitter module for SystemErr.log files.
Log file formats:
The basic formats of the WebSphere Application Server log files are described hereas a reference for users.
The basic format of SystemOut.log and SystemErr.log files is:timestamp threadId shortname severity className methodName message
where the className and methodName fields are optional.
The basic format of trace.log files is:timestamp threadId shortname severity className methodName messageparameter_1parameter_2parameter_n
where the className, methodName, and parameter fields are optional.
In all three log files, stack trace details are written in the following general format:
at packageName.exceptionClassName.exceptionMethodName(fileName:lineNumber)
For more information about basic and advanced WebSphere Application Server logfile formats, see the following topic on the WebSphere Application Serverinformation center:
http://www-01.ibm.com/support/knowledgecenter/SSAW57_8.5.5/com.ibm.websphere.nd.multiplatform.doc/ae/rtrb_readmsglogs.html
Log file splitter:
The splitter provided with the Insight Pack is described here as a reference forusers.
WebSphere Application Server splitter
The formats of the SystemOut.log, trace.log, and SystemErr.log files are similarenough that they can share a splitter. The splitter recognizes two styles of logrecord. Most records begin with a timestamp enclosed in brackets and the splitteruses the timestamp to define the beginning and end of each record. However,some stacktraces have a timestamp at the beginning of every line. In these casesthe splitter groups the entire stack trace into one log record.
The following example shows a stacktrace with multiple timestamps. The exampleis split as a single log record.
138 IBM Operations Analytics - Log Analysis: Installation, Configuration, and Administration Guide

[1/2/13 12:26:12:166 EST] 0000005d SystemErr R java.lang.NullPointerException[1/2/13 12:26:12:166 EST] 0000005d SystemErr R at com.ibm.blah init[1/2/13 12:26:12:166 EST] 0000005d SystemErr R at com.ibm.blah abcdefg
Log file annotations:
The annotations that are defined by the log file index configurations are describedhere.
The following sections describe the fields that are defined in the indexconfiguration file. These fields, or annotations, are displayed in the IBM OperationsAnalytics - Log Analysis Search workspace, and can be used to filter or search thelog records. Fields are extracted from the fields of a log record or collected frommetadata around the log file. Each table gives the names of the fields (these namescorrespond to fields in the IBM Operations Analytics - Log Analysis Searchworkspace), descriptions of how the related annotations are made, and the indexconfiguration attributes assigned to the fields.
Log record annotations
The following table lists the index configuration fields that relate to log recordannotations. Each field corresponds to part of a SystemOut, SystemErr, or trace logrecord. The fields are listed in the order in which they appear in a log record.
Table 32. Log record index configuration fields
Field Description Attributes
timestamp The timestamp of the log record, which is located atthe beginning of a line and delimited by brackets([...]).
dataType: DATEretrievable: trueretrieveByDefault: truesortable: truefilterable: truesearchable: true
threadID An eight-character alphanumeric (0-9, A-F) threadidentifier, which is enclosed by single white spacecharacters, that follow a timestamp.
dataType: TEXTretrievable: trueretrieveByDefault: truesortable: falsefilterable: falsesearchable: true
shortname A sequence of characters that represents a short name,which is enclosed by single white space characters,that follow a thread identifier.
dataType: TEXTretrievable: trueretrieveByDefault: falsesortable: falsefilterable: falsesearchable: false
severity A single-character event type code or severity code (A,C, D, E, F, I, O, R, W, Z, <, >, 1, 2, 3), enclosedby single white space characters, that follow a shortname.
dataType: TEXTretrievable: trueretrieveByDefault: truesortable: truefilterable: truesearchable: true
className If present, a sequence of characters that represents afully qualified class name (for example,com.ibm.ws.webcontainer.servlet.ServletWrapper)that follows a severity or the string “class=”.
dataType: TEXTretrievable: trueretrieveByDefault: truesortable: falsefilterable: truesearchable: true
Configuring 139

Table 32. Log record index configuration fields (continued)
Field Description Attributes
methodName If present, a sequence of characters that represents amethod name, which is enclosed by single white spacecharacters, that follow a class name or the string“method=”.
dataType: TEXTretrievable: trueretrieveByDefault: truesortable: falsefilterable: falsesearchable: false
msgclassifier If present, a defined sequence of characters that endswith a colon (:) and that represents a messageidentifier (for example, WSVR0605W).
dataType: TEXTretrievable: trueretrieveByDefault: truesortable: falsefilterable: truesearchable: true
message If present, the text of the system, error, or tracemessage. This field is annotated only if amsgclassifier field is present.
dataType: TEXTretrievable: trueretrieveByDefault: truesortable: falsefilterable: falsesearchable: true
javaException If present, the Java exception names that fit thefollowing pattern:
*.*Exception
dataType: TEXTretrievable: trueretrieveByDefault: truesortable: falsefilterable: truesearchable: true
Stack trace annotations
The following table lists the index configuration fields that relate to log recordstack trace annotations.
Table 33. Stack trace index configuration fields
Field Description Attributes
exceptionClassName The class name in the top stack trace entry. dataType: TEXTretrievable: trueretrieveByDefault: truesortable: falsefilterable: truesearchable: true
exceptionMethodName The method name in the top stack trace entry. dataType: TEXTretrievable: trueretrieveByDefault: truesortable: falsefilterable: falsesearchable: true
fileName The file name in the top stack trace entry. dataType: TEXTretrievable: trueretrieveByDefault: truesortable: falsefilterable: falsesearchable: true
lineNumber The line number in the top stack trace entry. dataType: TEXTretrievable: trueretrieveByDefault: truesortable: falsefilterable: falsesearchable: true
140 IBM Operations Analytics - Log Analysis: Installation, Configuration, and Administration Guide

Table 33. Stack trace index configuration fields (continued)
Field Description Attributes
packageName The package name in the top stack trace entry. dataType: TEXTretrievable: trueretrieveByDefault: truesortable: falsefilterable: falsesearchable: true
Metadata annotations
The following table lists the index configuration fields that relate to metadataannotations.
Table 34. Metadata index configuration fields
Field Description Annotation attributes
application The application name populated by the servicetopology data source field.
dataType: TEXTretrievable: trueretrieveByDefault: truesortable: falsefilterable: falsesearchable: true
hostname The host name populated by the service topology datasource field.
dataType: TEXTretrievable: trueretrieveByDefault: truesortable: truefilterable: truesearchable: true
logRecord The entire log record output by the splitter. dataType: TEXTretrievable: trueretrieveByDefault: truesortable: falsefilterable: falsesearchable: true
datasourceHostname The host name specified in the data source. dataType: TEXTretrievable: trueretrieveByDefault: truesortable: falsefilterable: truesearchable: true
middleware The middleware name populated by the servicetopology data source field.
dataType: TEXTretrievable: trueretrieveByDefault: truesortable: falsefilterable: falsesearchable: true
service The service name populated by the service topologydata source field.
dataType: TEXTretrievable: trueretrieveByDefault: truesortable: falsefilterable: falsesearchable: true
WebSphere Application Server data loading best practice:
There are different data loading recommendations based on how WebSphereApplication Server logging is configured.
Configuring 141

To set up the data loading, you need to consider:
WebSphere Application Server configurationIs WebSphere Application Server configured to produce rolling logs orsingle logs?
Data loadingDetermine if you want to use the IBM Tivoli Monitoring Log File Agent(LFA) installed on the remote WebSphere Application Server to push dataor to use the LFA installed on the local IBM Operations Analytics - LogAnalysis server to pull data. In some scenarios, you must use the DataCollector as described in scenario 2.
Logfile agent configurationIf you choose to use the LFA, use the logfile agent configuration files tospecify the log files you want to monitor. The WASInsightpack-lfawas.confand WASInsightPack-lfawas.fmt files are located in the directory:
<HOME>/IBM-LFA-6.30/config/lo
The log file scenarios here describe the specific settings for these files.
Scenario 1 - Log file rotation on one WebSphere Application Server server
WebSphere Application Server configurationWebSphere Application Server is configured for rolling log files. Forexample, records are written to SystemErr.log. When it reaches a definedlog file size it is renamed to SystemErr_13.05.10_05.22.05.log and a newSystemErr.log is created for more data. A similar flow occurs forSystemOut.log and trace.log.
Data Loading Method
The recommended method for loading data is to use the IBM TivoliMonitoring Log File Agent (LFA) installed on the remote WebSphereApplication Server server to push data or to use the LFA installed on thelocal IBM Operations Analytics - Log Analysis server to pull data. Createindividual .conf and .fmt files that are specific to each log file. TheLogSources definition will specify the name of the renamed file. Thisapproach should insure that all log records are processed (no loss of logrecords) but with the trade off that the log records forwarded to IBMOperations Analytics will be sent only once the rollover occurs. The logforwarding will be one log file behind real-time resulting in some time lagfor search results. The amount of time is dependent on the environment,that is, what the defined log size is for rollover and how frequently thisoccurs based on logging volumes.
Loading logs using the LFA is a CPU bound process. If your system doesnot meet the minimum requirements you will need to increase theMaxEventQueueDepth. On some systems, altering this value may produce anoticeable impact on performance. This will buffer additional LFA eventswhile they are waiting to be processed. The required value forMaxEventQueueDepth may vary depending on the size of the rolled log andthe number/speed of your CPU's. If you choose not to increase this value,then older events may be replaced on the event queue by newer eventsand not sent to the IBM Operations Analytics server.
To minimize the chance of data loss due to CPU bottlenecks, and to reducethe latency between when a log record is written to the file and when it is
142 IBM Operations Analytics - Log Analysis: Installation, Configuration, and Administration Guide

loaded, we recommend that the maximum size of a WebSphere ApplicationServer log be small enough so that you system does not fall behind whileprocessing the logs.
An alternative method is to always monitor the current log file (forexample, SystemErr.log) and not the renamed log file. This would result inlog records being forwarded immediately by the LFA. The trade off is thatthis configuration may result in log entries not being forwarded if thoselog entries were written during the LFA polling interval (sleep time) and arollover occurs. In this case the LFA would start processing the new logfile.
Logfile Agent Configuration - lfawas.conf fileYou must create additional .conf files for each log type that you monitor.For example, if want to monitor the SystemOut.log and trace.log, thenyou need a .conf file for each log file.
Specify the following parameters to monitor the rotating SystemErr.logfiles:LogSources=<was log directory to monitor>/SystemErr_*.logFileComparisonMode=CompareByAllMatches
Logfile Agent Configuration - lfawas.fmt fileYou must create additional .fmt files for each log type that you monitor.For example, if want to monitor the SystemOut.log and trace.log, thenyou need a .fmt file for each log file.
Use the following .fmt file to specify a fixed SystemErr.log name andavoid the need to define multiple logsources because of the rolling log filename changes. This allows a fixed file name in the logpath.// Matches records for any Log file://
REGEX AllRecords(.*)hostname LABEL-file SystemErr.logRemoteHost DEFAULTlogpath PRINTF("%s",file)text $1END
The same pattern can be used to define the .conf and .fmt files for theother logs:<was log directory to monitor>/SystemOut_*.log OR<was log directory to monitor>/trace_*.log</p>
Scenario 2 - Collecting Log Files from multiple WAS Servers
WebSphere Application Server ConfigurationWebSphere Application Server is configured for single log files(non-rolling) on multiple servers and the server logs are collected for dataloading on the IBM Operations Analytics - Log Analysis server.
Data Loading Method The recommended method for loading data is to use the Data Collectorclient. Remove the previous log files before creating or copying newversions into the directory from which you will load data. The order ofprocessing logs in this manner is important to handle any split records.When using the Data Collector client you need to set the flushflag so that
Configuring 143

split records can be merged. This is set in thejavaDatacollector.properties file located in the <HOME>/utilities/datacollector-client/ directory.
Windows OS Events Insight PackThe Windows OS Event Insight pack allows users of IBM Operations Analytics -Log Analysis, in conjunction with the Tivoli Log File Agent or logstash, to gatherand process Windows OS Events.
This document describes the version of the Windows OS Events Insight Pack thatis installed when you install IBM Operations Analytics - Log Analysis. An updatedversion of the Windows OS Events Insight Pack may have been published afterthis version of IBM Operations Analytics - Log Analysis. To download the latestversions of this Insight Pack as well as updated documentation, seehttp://www.ibm.com/developerworks/servicemanagement/downloads.html.
Two separate data gathering mechanisms are supported, the Tivoli Log File Agentand logstash.
The IBM Operations Analytics - Log Analysis Windows OS Events Insight Pack isbuilt using the IBM Operations Analytics - Log Analysis DSV Toolkit.
For Windows events gathered by the Tivoli Log File Agent (LFA) and logstash thedata is configured into a comma separated format, and indexed and annotated foranalysis.
The LFA is an agent that provides a configurable log file monitoring capabilityusing regular expressions. The LFA uses the WINEVENTLOGS configuration (.conf) fileoption to monitor events from the Windows event log. The agent monitors acomma-separated list of event logs as shown in the following example:WINEVENTLOGS=System,Security,Application
logstash has a supported input module named eventlog, http://logstash.net/docs/1.2.2/inputs/eventlog, which pulls events from the Windows Events Logs.The events are then forwarded using the output module available in the logstashIntegration Toolkit to the IBM Operations Analytics - Log Analysis EIF Receiver.
Installing the Windows OS Events Insight Pack:
If you are using IBM Operations Analytics - Log Analysis 1.2 or later, the WindowsOS Events Insight Pack is installed by default, and therefore does not need to beinstalled separately.
About this task
The Windows OS Events Insight Pack is installed using the pkg_mgmt utility.
Procedure
1. Upload the Windows OS Events Insight Pack archive file,WindowsOSEventsInsightPack_<version>.zip, to the system where IBMOperations Analytics - Log Analysis is installed.
2. Install the Windows OS Events Insight Pack with the pkg_mgmt.sh command:<HOME>/IBM/LogAnalysis/utilities/pkg_mgmt.sh -install<path>/WindowsOSEventsInsightPack_<version>.zip
144 IBM Operations Analytics - Log Analysis: Installation, Configuration, and Administration Guide

Where <path> is the path where you saved the Windows OS Events InsightPack.
Uninstalling the Windows OS Events Insight Pack:
Instructions on how to uninstall the Windows OS Events Insight Pack.
About this task
The Windows OS Events Insight Pack is installed and uninstalled using thepkg_mgmt utility.
Procedure
1. Use the pkg_mgmt.sh command to determine the location of the insight pack:<HOME>/IBM/LogAnalysis/utilities/pkg_mgmt.sh
2. Uninstall the Windows OS Events Insight Pack with the pkg_mgmt.sh command:<HOME>/IBM/LogAnalysis/utilities/pkg_mgmt.sh -uninstall<path>/WindowsOSEventsInsightPack_<version>
Where <path> is the path listed by the command in step 1 showing the locationof Windows OS Events Insight Pack.
Performance considerations:
Ensure that you consider these limitations when using the Windows OS EventsInsight Pack:
Files with long log records require adjustments to the Java stack size so that theycan be ingested. This adjustment is made by adding or updating the line-Xss<stacksize> in the jvm.options file located in the <HOME>/wlp/usr/servers/Unity directory. <stacksize> is the desired stack size. By default, lines ofapproximately 1000 characters are supported. To support lines up to 10,000characters, the stack size must be set to 6144 kb. To support lines up to 9,000characters, the stack size must be set to 5120 kb. An example line is:-Xss6144k
If you add or update the value of this parameter within the jvm.options file, youmust restart the IBM Operations Analytics - Log Analysis system. For moreinformation on how to restart IBM Operations Analytics - Log Analysis, see theunity command topic in the documentation.
Integrating the Windows OS Events Insight Pack with the Log File Agent:
Configuring a Log File Agent instance on Windows allows Windows OS events tobe forwarded to IBM Operations Analytics - Log Analysis.
Before you begin
Ensure that the Tivoli Log File Agent (LFA) is installed on the Windows server thatis being monitored. For more information on installing the Tivoli LFA, see the"Tivoli Log File Agent User's Guide" in the IBM Tivoli Monitoring KnowledgeCenter.
Ensure that the Windows Server can communicate with the IBM OperationsAnalytics - Log Analysis server. Communication is directed to the EIF receiver port
Configuring 145

on the IBM Operations Analytics - Log Analysis server (default 5529). Ensure thatany firewall restrictions are lifted.
About this task
The steps in this task outline how to use the LFA to gather and push Windows OSevents to IBM Operations Analytics - Log Analysis server. The LFA can beconfigured to send Windows OS Events to the EIF Receiver that is deployed withIBM Operations Analytics - Log Analysis. For more details on configuring the EIFReceiver on IBM Operations Analytics - Log Analysis, see section "Configuring theEIF Receiver" in the IBM Operations Analytics - Log Analysis Knowledge Center.
Procedure
1. On the IBM Operations Analytics - Log Analysis server, copy the LFA .confand .fmt files to the target Windows Server.The .conf and .fmt files are in the directory that Windows OS Events InsightPack is installed in.The location of the Windows OS Events Insight Pack can be determined byusing the pkg_mgmt.sh command:<HOME>/IBM/LogAnalysis/utilities/pkg_mgmt.sh -list
2. On the target Windows Server place, both files in a directory accessible to theinstallation of the Tivoli LFA.
3. Edit the lfaWinEvt.conf file.a. Update the ServerLocation to the host name or IP address of the IBM
Operations Analytics - Log Analysis serverb. Update the ServerPort to the configured value on the IBM Operations
Analytics - Log Analysis server.The default port is 5529.# Our EIF receiver host and port.# Only needed when sending events directly to OMNIbus or TEC via EIF.# That is configured through either the Manage Tivoli Enterprise Monitoring# Services GUI or the# "itmcmd config -A lo" command.ServerLocation=unityserver.ibm.comServerPort=5529
For more information on configuring the EIF Receiver on IBM OperationsAnalytics - Log Analysis, see section "Configuring the EIF Receiver" in theIBM Operations Analytics - Log Analysis Knowledge Center.
The lfaWinEvt.fmt file formats the Windows OS events that are read by theTivoli LFA into a CSV format for ingestion by the Windows OS Events InsightPack.
4. The only value within this .fmt file you are recommended to edit is logpath.This string must match that of the configured data source on the IBMOperations Analytics - Log Analysis server.By default, the value of the host name is the value that is returned by executingthe DOS command hostname from the command line. This string must be usedas the host name value when configuring the data source on the IBMOperations Analytics - Log Analysis server.
5. Launch the Manage Tivoli Enterprise Monitoring service application on theWindows Server.
6. Select the Tivoli Log File Agent template and select Actions > Configure usingdefaults.
7. Enter a unique instance name when prompted.
146 IBM Operations Analytics - Log Analysis: Installation, Configuration, and Administration Guide

Note: There is a limit on the length of the instance names. The internalidentification of an LFA instance by ITM libraries restricts the length to 32 charsin total.
8. In the Log File Adapter Configuration tab, enter the location of the .conf and.fmt files, and set the Send ITM Event option to No.The LFA instance will now be configured and can be started from the ManageTivoli Enterprise Monitoring service.Once started, it is possible to troubleshoot the LFA instance by:a. Select and right-click the LFA instance in the Manage Tivoli Enterprise
Monitoring service dialog.b. Click Advanced > View Trace File.The $UNITY_HOME/logs/UnityEifReceiver.log file on IBM Operations Analytics- Log Analysis server can now be used to observe events being received fromthe LFA by IBM Operations Analytics - Log Analysis.For more information on logging the UnityEifReceiver, see section "Enablingconsole logging and changing the log level for the EIF receiver" in the IBMOperations Analytics - Log Analysis Knowledge Center.
Note: When configuring the LFA, ensure that the No TEMS option is selected.For more details on configuring this option, see the known issue "Log FileAgent fails to post events" in the IBM Operations Analytics - Log AnalysisKnowledge Center.
Integrating the Windows OS Events Insight Pack with logstash:
Configuring logstash on Windows allows Windows OS events to be forwarded toIBM Operations Analytics - Log Analysis.
Before you begin
Ensure that the logstash Integration Toolkit is deployed on the Windows Serverbeing monitored. For more details on configuring logstash, see the Installinglogstash topic.
Ensure that the Windows Server can communicate with the IBM OperationsAnalytics - Log Analysis server. Communication is directed to the EIF receiver porton the IBM Operations Analytics - Log Analysis server (default 5529). Ensure thatany firewall restrictions are lifted.
About this task
The steps in this task outline how to configure logstash to send Windows OSEvents to the EIF Receiver that is deployed with IBM Operations Analytics - LogAnalysis. For more details on configuring the EIF Receiver on IBM OperationsAnalytics - Log Analysis, see the Configuring the EIF Receiver topic.
Procedure
1. On the target Windows Server, stop logstash .2. Make a backup of the <logstash Location>\lstoolkit\logstash\config\
logstash-scala.conf file.3. On the IBM Operations Analytics - Log Analysis server, copy the
logstash-scala.conf file to the target Windows Server.
Configuring 147

The logstash-scala.conf file is in the directory that Windows OS EventsInsight Pack is installed in.The location of the Windows OS Events Insight Pack can be determined byusing the pkg_mgmt.sh command:<HOME>/IBM/LogAnalysis/utilities/pkg_mgmt.sh -list
4. On the Windows Server, place the logstash-scala.conf file in the location<logstash Location>\lstoolkit\logstash\config. This overwrites the existingversion.
5. On the Windows server, ensure that logstash eif output module is configured tosend data to the IBM Operations Analytics - Log Analysis server.
6. On the Windows server check that the values of the output module in the newlogstash-scala.conf file match that of the backed up copy. This check isneeded if you specify a non-standard location for the eif output module.
7. On the target Windows Server start logstash.Related concepts:“Installing logstash” on page 301Installing logstash on a remote node extends IBM Operations Analytics - LogAnalysis functions so it can ingest and perform metadata searches against log datathat is acquired by logstash.Related tasks:“Configuring the EIF Receiver” on page 279How to configure remote or local installations of the Tivoli Event IntegrationFacility (EIF) receiver to work with IBM Operations Analytics - Log Analysis.“logstash operations” on page 311You can use the logstash-util script to start, stop, restart, or provide the status oflogstash.
Windows OS event format generated by the Tivoli Log File Agent:
Windows OS events are formatted by the Tivoli Log File Agent into a csv format.
The value of the log source's logpath must match that specified for the logpath inthe .fmt file deployed on the LFA on the Windows server.
The Windows OS Events Insight pack has been built using the IBM OperationsAnalytics - Log Analysis DSV toolkit. Events are formatted by the Tivoli Log FileAgent into a csv format with the following columns.
Table 35. Log file format
Number Column Name Description
1 EventCategory Describes the sussystem ofevent, for example,EventLog:Application orEventLog:Security
2 Timetsamp Time of event
3 Level Information, Warning, Erroretc
4 User If a user name is associatedwith the event
5 EventSource Source of event
6 Keywords Events may have keywordsassociated upon generation.
148 IBM Operations Analytics - Log Analysis: Installation, Configuration, and Administration Guide

Table 35. Log file format (continued)
Number Column Name Description
7 EventID Event ID
8 Description Text description of event
Windows OS event format generated by logstash:
The basic format of the Windows Event Log generated by logstash is describedhere as a reference for users.
The Windows OS Events Insight pack has been built using the IBM OperationsAnalytics - Log Analysis DSV toolkit. Events are formatted by logstash into a csvformat with the following columns.
Table 36. Log file format
Number Column Name Description
1 EventLog Describes the subsystem ofevent, for exampleApplication or Security
2 Timetsamp Time of event
3 Level Information, Warning, Erroretc
4 User If a user name is associatedwith the event
5 EventSource Source of event
6 EventID Event ID
7 Description Text description of event
8 Hostname Hostname of the Windowsmachine
9 EventRecordNumber Unique event ID
10 Category Numeric category
Windows OS Events Insight Pack App:
A single sample app is provided with the Windows OS Events Insight Pack. Thisapp queries the data gathered by the application and generates four charts.
The four charts generated by the application are:v Event Level counts per hour over the past 24 hoursv Event Log counts per hour over the past 24 hoursv Event Source Counts per hour over the past 24 hoursv Event Level per Event Source over the past 24 hours
By default, the app will query a logsource named WindowsOSEventsLFA.
If you want to run the chart on another logsource based on theWindowsOSEventsLFA source type:1. Open the file: <HOME>/AppFramework/Apps/
WindowsOSEventsInsightPack_<version>/WindowsEvents.app.
Configuring 149

2. Update the value of the logsource name from WindowsOSEventsLFA to whateverlogsource name is required.
Note: All configured logsource names can be seen on the IBM OperationsAnalytics - Log Analysis Administrative settings UI under the Log Sources tab.
Limiting the flow of events to the Windows OS Event Log Insight Pack:
An optional set of steps the purpose of which is to limit the events flowing to theWindows OS Event Log Insight Pack.
About this task
Windows OS generates a large number Information level logs that users may notwish to track. The .fmt file can be edited to limit what is monitored.
Procedure
1. On the Windows server edit the fmt file (See steps above for configuring thetivoli LFA) as follows. For more information about how to configure the IBMTivoli Monitoring Log File Agent, see “Integrating the Windows OS EventsInsight Pack with the Log File Agent” on page 145.Update the .fmt file from:// Matches records for any Log file and converst to csv format://REGEX AllRecords^([A-Z][a-z]{2} [0-9]{1,2} [0-9]{1,2}:[0-9]{2}:[0-9]{2} [0-9]{4})[0-9] (\S+) (\S+) (\S+) (\S+) ([0-9]+) (.*)hostname LABEL-file FILENAMERemoteHost DEFAULTlogpath "WindowsOSEventsLFA"text PRINTF("%s,%s,%s,%s,%s,%s,%s,%s",file,$2,$3,$4,$5,$6,$7,$8)END
To:// Matches records for any Log file and converst to csv format://REGEX AllRecords^([A-Z][a-z]{2} [0-9]{1,2} [0-9]{1,2}:[0-9]{2}:[0-9]{2} [0-9]{4})[0-9] (Warning|Error|Critical) (\S+) (\S+) (\S+) ([0-9]+) (.*)hostname LABEL-file FILENAMERemoteHost DEFAULTlogpath "WindowsOSEventsLFA"text PRINTF("%s,%s,%s,%s,%s,%s,%s,%s",file,$2,$3,$4,$5,$6,$7,$8)END
This will limit the events being sent to IBM Operations Analytics - LogAnalysis to those of type Warning or Error or Critical. No 'Information' eventswill be sent to IBM Operations Analytics - Log Analysis.
2. Restart the LFA instance using the Manage Tivoli Enterprise Monitoringservice application
Additional Insight PacksYou can download more Insight Packs to further extend Log Analysis.
To view the available Insight Packs, go to Resources for Log Analysis.
150 IBM Operations Analytics - Log Analysis: Installation, Configuration, and Administration Guide

If you did not use the Insight Pack previously, you can install it. If you installed anolder version of the Insight Pack, you can upgrade it.
The following Insight Packs are available for download:
IBM MB Insight PackUse this Insight Pack to search IBM Message Broker and IBM IntegrationBus log files.
IBM MQ Insight PackUse this Insight Pack to search IBM MQ log files.
Ticket Analytics Insight PackUse this Insight Pack to search the log files generated by one of the threeticketing solutions.
IBM PureApp Insight PackUse this Insight Pack to search log files generated by IBM PureApp.
IBM Business Process Manager Insight PackUse this Insight Pack to search log files generated by IBM Business ProcessManager.
IBM DataPower Insight PackUse this Insight Pack to search log files generated by IBM DataPowerapplications.
Related tasks:“Upgrading an Insight Pack” on page 86You can upgrade an Insight Pack that you have previously installed. This topicoutlines how to upgrade an existing Insight Pack.“Installing Insight Packs” on page 86Before you can use an Insight Pack, you need to install it.
IBM MB Insight PackThe IBM MB Insight Pack facilitates data ingestion and metadata searches of IBMMessage Broker and IBM Integration Bus log files in IBM Operations Analytics -Log Analysis to enable faster problem identification.
The IBM MB Insight Pack supports searching and indexing of the following:v console logs
– UNIX/Linux: /var/mqsi/components/broker_name/execution_group_uuid\console.txt
– Windows: workpath\components\broker_name\execution_group_uuid\console.txt
where workpath is the Message Broker defined working directory.The console.txt log file includes information about the Broker ID, messagesfrom the Message Broker, log record, timestamps, Universally Unique ID forIBM Integration Bus objects, and Java exceptions.
v Syslog
– UNIX/Linux: The syslog is the local error log. The configuration of yourUNIX/Linux system determines where the syslog messages are sent.
v UserTrace Logs
– UNIX/Linux: /var/mqsi/common/log– - Windows: The default location without a specified integration node work
path is C:\ProgramData\IBM\MQSI\Common\log.
Configuring 151

If the path is set with the -w parameter of the mqsicreatebroker command thelocation is workpath/log.
The file names reflect the component and subcomponent for which the trace isactive.For more information about UserTrace logs, see http://www-01.ibm.com/support/knowledgecenter/SSMKHH_10.0.0/com.ibm.etools.mft.doc/ag66260_.htm
The IBM MB Insight Pack can be installed with IBM Operations Analytics - LogAnalysis 1.3.0.0 or higher.
Supported IBM Integration Bus versions
The IBM MB Insight Pack supports the following IBM Integration Bus and IBMWebSphere Message broker versions. IBM Integration Bus was known as IBMWebSphere Message broker until version 8.0.v IBM WebSphere Message broker 8.0v IBM Integration Bus 9.0v IBM Integration Bus 10.0
Installing the IBM MB Insight Pack:
To ingest data and perform searches of the Message Broker log files in IBMOperations Analytics - Log Analysis, you must install the IBM MB Insight Pack.
Before you begin
You must install IBM Operations Analytics - Log Analysis 1.3.0.0 or higher.
About this task
The IBM MB Insight Pack is installed by using the pkg_mgmt utility.
Procedure
1. Upload the IBM MB Insight Pack archive file,MessageBrokerInsightPack_<version>.zip, to the system where IBM OperationsAnalytics - Log Analysis is installed.
2. Install the IBM MB Insight Pack by using the pkg_mgmt.sh command:<HOME>/IBM/LogAnalysis/utilities/pkg_mgmt.sh -install<path>/MessageBrokerInsightPack_<version>.zip
Where <path> is the path where you saved the IBM MB Insight Pack.3. (Optional) If you are using the Log File Agent to load the data into IBM
Operations Analytics - Log Analysis, deploy the log file agent configurationfiles with the following command:<HOME>/IBM/LogAnalysis/utilities/pkg_mgmt.sh -deploylfa<path>/MessageBrokerInsightPack_<version>.zip
Where <path> is the path where you saved the IBM MB Insight Pack.
IBM MB Insight Pack configuration artifacts:
During IBM MB Insight Pack installation, a number of artifacts are created.
The following artifacts are created when the IBM MB Insight Pack is installed:
152 IBM Operations Analytics - Log Analysis: Installation, Configuration, and Administration Guide

v MessageBroker console log Insight Pack
– MsgBrokerSplitter : Splitter file set.– MsgBrokerAnnotator : Annotator file set.
v MessageBroker syslog Insight Pack
– MsgBrokerSyslog_Splitter : Splitter file set.– MsgBrokerSyslog_Annotator : Annotator file set.– MB Dash.app : Dashboard app file
v MessageBroker User Trace log Insight Pack
– MsgBrokerUserTrace_Splitter : Splitter file set.– MsgBrokerUserTrace_Annotator : Annotator file set.– IIB User Trace Dashboard.app : Dashboard app file
Configuring the IBM MB Insight Pack:
To index and search the IBM Message Broker logs files, you must configure theIBM MB Insight Pack.
Procedure
1. The default timestamp format that is supported by the Insight Pack for MessageBroker console log is yyyy-MM-dd HH:mm:ss.SSS. If the console log timestampformat is different, you must create a new source type. To create a new sourcetype, complete the following steps:a. In the Administrative settings, open the Data Types tab.b. Select Create New Source Type.c. Enter a name for the new source type.d. Select Enable Splitter>Fileset. In the Fileset field, select MsgBrokerSplitter
e. Select Enable Annotator>Fileset. In the Fileset field, selectMsgBrokerAnnotator.
f. Copy the indexconfig from the Message Broker console log source type andselect Edit Index Configuration in the new source type. Paste theindexconfig in to the input box.
g. Modify the timestamp parameter. For example:"timestamp": {
"dataType": "DATE","retrievable": true,"retrieveByDefault": true,"sortable": true,"filterable": true,"searchable": true,"source": {
"paths": ["metadata.timestamp"
],"dateFormats": ["yyyy-MM-dd HH:mm:ss.SSS"
]}
},
h. Click OK to complete and save the new source type.2. The default timestamp format that is supported by the Insight Pack for Message
Broker syslog is MMM dd HH:mm:ss yyyy. If the syslog timestamp format is
Configuring 153

different, you must create a new source type. If the year is not included in thesyslog, the IBM MB Insight Pack appends it. To create a new source type,complete the following steps:a. In the Administrative settings, open the Data Types tab.b. Select Create New Source Type.c. Enter a name for the new source type.d. Select Enable Splitter>Fileset. In the Fileset field, select
MsgBrokerSyslog_Splitter
e. Select Enable Annotator>Fileset. In the Fileset field, selectMsgBrokerSyslog_Annotator.
f. Copy the indexconfig from the Message Broker syslog source type andselect Edit Index Configuration in the new source type. Paste theindexconfig in to the input box.
g. Modify the timestamp parameter. For example:"timestamp": {
"dataType": "DATE","retrievable": true,"retrieveByDefault": true,"sortable": true,"filterable": true,"searchable": true,"source": {
"paths": ["metadata.timestamp"
],"dateFormats": ["MMM dd HH:mm:ss yyyy"
]}
},
h. Click OK to complete and save the new source type.3. The default timestamp format that is supported by the Insight Pack for Message
Broker UserTrace log is yyyy-MM-dd HH:mm:ss.S. If the UserTrace logtimestamp format is different, you must create a new source type. To create anew source type, complete the following steps:a. In the Administrative settings, open the Data Types tab.b. Select Create New Source Type.c. Enter a name for the new source type.d. Select Enable Splitter>Fileset. In the Fileset field, select
MsgBrokerUserTrace_Splitter
e. Select Enable Annotator>Fileset. In the Fileset field, selectMsgBrokerUserTrace_Annotator.
f. Copy the indexconfig from the Message Broker UserTrace log source typeand select Edit Index Configuration in the new source type. Paste theindexconfig in to the input box.
g. Modify the timestamp parameter. For example:"timestamp": {
"dataType": "DATE","retrievable": true,"retrieveByDefault": true,"sortable": true,"filterable": true,"searchable": true,"source": {
"paths": ["metadata.timestamp"
154 IBM Operations Analytics - Log Analysis: Installation, Configuration, and Administration Guide

],"dateFormats": ["yyyy-MM-dd HH:mm:ss.S"
]}
},
h. Click OK to complete and save the new source type.4. To index console.txt logs, complete the following steps:
a. Navigate to the IBM Operations Analytics - Log Analysis settingsworkspace.
b. Create a log source for the log file to be monitored. The source type mustbe Message Broker console log or the source type that is created in step 1.
5. To index syslog, complete the following steps:a. Navigate to the IBM Operations Analytics - Log Analysis settings
workspace.b. Create a log source for the log file to be monitored. The source type must
be Message Broker Syslog or the source type that is created in step 2.6. To index UserTrace logs, complete the following steps:
a. Navigate to the IBM Operations Analytics - Log Analysis settingsworkspace.
b. Create a log source for the log file to be monitored. The source type mustbe Message Broker UserTrace log or the source type that is created in step 3.
Log File Agent configuration:
You can use the IBM Tivoli Log File Agent to load data into the IBM OperationsAnalytics - Log Analysis.
The following Log File Agent configuration files will be installed in<HOME>/IBM-LFA-6.23/config/lo directory when pkg_mgmt is run with the-deploylfa option.v WebAccessLogInsightPack-lfadsv.conf - Configuration for the web access log
file agent.v WebAccessLogInsightPack-lfadsv.fmt - Matches records for the web access log
files.
IBM MB Insight Pack Log splitter rules:
Splitting describes how IBM Operations Analytics - Log Analysis separatesphysical log file records in to logical records by using a logical boundary such astime stamp or a new line.
The IBM MB Insight Pack splits log records on new line boundaries. In thefollowing syslog example each line is considered a new log record.Mar 22 14:23:48 ldp3147 IIB[14903]: [ID 702911 user.info] IBM Integration Bus v9002(EAIESB1PRD1BK.EG_COP_RIM_GATEWAY) [Thread 25] (Msg 1/1) BIP2154I:Execution group finished with Configuration message.Mar 22 14:23:49 ldp3147 IIB[14692]: [ID 702911 user.info] IBM Integration Bus v9002(EAIESB2PRD1BK.EG_COP_OMD_SVCS1) [Thread 25] (Msg 1/1) BIP3132I:The HTTP Listener has started listening on port ’7811’ for ’http’ connections.
For console logs, the IBM MB Insight Pack groups log records with multiple lines.For example, the following log record has multiple lines that belong to theexception in the first line. Therefore, the logs are grouped as one with a commontime stamp that corresponds to the first record.
Configuring 155

2014-12-10 22:04:48.557 18 java.lang.NullPointerException2014-12-10 22:04:48.557 18 at au.net.api.integration.iib.common.Config.<clinit>(Config.java:26)2014-12-10 22:04:48.557 18 at java.lang.J9VMInternals.initializeImpl(Native Method)2014-12-10 22:04:48.573 18 at java.lang.J9VMInternals.initialize(J9VMInternals.java:237)
For user trace logs, the IBM MB Insight Pack splits log records based on thetimestamp. Each timestamp found by the IBM MB Insight Pack, that matches theUserTrace log timestamp format is considered a new log record, with the followinglog lines grouped until the next matching timestamp is detected. For example, thefollowing log records match the UserTrace log timestamp format and have multiplelog lines.2015-02-26 10:29:11.533585 3856 UserTrace BIP3484E: ’’TRAS0018I:The trace state has changed.The new trace state is *=info.’’An embedded component has written the diagnostic message included here.Refer to the appropriate message in the embedded component’s documentation.
2015-02-26 10:29:11.806647 3856 UserTrace BIP4040I: The Execution Group’’Exec_Group’’ has processed a configuration message successfully.
A configuration message has been processed successfully. Any configuration changeshave been made and stored persistently.
No user action required.
IBM MB Insight Pack Log annotation rules:
After the log records are split, the logical records are sent to the annotation engine.The engine uses rules to extract important pieces of information that are sent to theindexing engine.
IBM MB Insight Pack console log annotator
The IBM MB Insight Pack annotates the console log records based on the followingfields:v timestampv messagev UUIDv broker_namev thread_idv logRecord
IBM MB Insight Pack syslog annotator
The IBM MB Insight Pack annotates the syslog records based on the followingfields:v timestampv SystemNamev Productv Processv severityv versionv Brokerv ExecutionGroupv ThreadIDv MessageGroup
156 IBM Operations Analytics - Log Analysis: Installation, Configuration, and Administration Guide

v MessageIDv MessageTextv logRecord
IBM MB Insight Pack UserTrace log annotator
The IBM MB Insight Pack annotates the UserTrace log records based on thefollowing fields:v timestampv SystemNamev Productv severityv versionv ExecutionGroupv ThreadIDv MessageIDv MessageTextv Nodev logRecord
IBM MB Insight Pack index configuration:
To control how IBM Operations Analytics - Log Analysis indexes records from alog file, you can create indexing settings for your content Insight Pack.
The fields that are defined in the index configuration file, or annotations, aredisplayed in the IBM Operations Analytics - Log Analysis search workspace, andcan be used to filter or search the log records.
Fields are extracted from the fields of a log record or collected from metadataaround the log file.
Table 37. Log index configuration for console logs
Field Description Attributes
timestamp The time that execution group wrotethe stderr/stdout logs. The format is:
yyyy-MM-dd HH:mm:ss.SSS
dataType = DATEretrievable = trueretrieveByDefault = truesortable = truefilterable = truesearchable = truesource = metadata
message The message that is written by theexecution group to the logs.
dataType = TEXTretrievable = trueretrieveByDefault = truesortable = falsefilterable = falsesearchable = truesource = annotations
Configuring 157

Table 37. Log index configuration for console logs (continued)
Field Description Attributes
UUID The Universally Unique ID of theexecution group.
dataType = TEXTretrievable = trueretrieveByDefault = truesortable = falsefilterable = truesearchable = truesource = annotations
broker_name The broker name of the parentprocess.
dataType = TEXTretrievable = trueretrieveByDefault = truesortable = truefilterable = truesearchable = truesource = annotations
thread_id The ID of the thread that initiated theprocess.
dataType = TEXTretrievable = trueretrieveByDefault = truesortable = falsefilterable = truesearchable = truesource = annotations
logRecord The entire log record. dataType = TEXTretrievable = trueretrieveByDefault = truesortable = falsefilterable = falsesearchable = truesource = metadata
Table 38. Log index configuration for message broker syslog
Field Description Attributes
timestamp The time that the IBM MB InsightPack generated the log record. Theformat is:
MMM dd HH:mm:ss yyyy
dataType = DATEretrievable = trueretrieveByDefault = truesortable = truefilterable = truesearchable = truesource = metadata
SystemName The name of the system where theIBM Message Broker is installed andcreates the log files.
dataType = TEXTretrievable = trueretrieveByDefault = truesortable = truefilterable = truesearchable = truesource = annotations
Product The product that generated the logrecord.
dataType = TEXTretrievable = trueretrieveByDefault = truesortable = truefilterable = falsesearchable = truesource = annotations
158 IBM Operations Analytics - Log Analysis: Installation, Configuration, and Administration Guide

Table 38. Log index configuration for message broker syslog (continued)
Field Description Attributes
Process The process ID dataType = TEXTretrievable = trueretrieveByDefault = truesortable = truefilterable = falsesearchable = truesource = annotations
version The IBM Integration Bus version. Forexample, IBM Integration Bus v9002
dataType = TEXTretrievable = trueretrieveByDefault = truesortable = falsefilterable = falsesearchable = truesource = annotations
Broker The broker name. dataType = TEXTretrievable = trueretrieveByDefault = truesortable = truefilterable = truesearchable = truesource = annotations
ExecutionGroup The execution group name. dataType = TEXTretrievable = trueretrieveByDefault = truesortable = truefilterable = truesearchable = truesource = annotations
ThreadID ID of the thread that initiated theprocess.
dataType = TEXTretrievable = trueretrieveByDefault = truesortable = truefilterable = truesearchable = truesource = annotations
MessageGroup The message group of the log record.For example, Msg 1/3, Msg 2/3.
dataType = TEXTretrievable = trueretrieveByDefault = truesortable = truefilterable = falsesearchable = truesource = annotations
MessageID The ID of the message that is sent inthe log record. For example,BIP31321, BIP2060W.
dataType = TEXTretrievable = trueretrieveByDefault = truesortable = truefilterable = truesearchable = truesource = annotations
severity The severity of the event that causedthe message. It is extracted from thelast digit of the msgID. The severitylevels are:
v Info
v Warning
v Error
v Severe
dataType = TEXTretrievable = trueretrieveByDefault = truesortable = truefilterable = truesearchable = truesource = annotations
Configuring 159

Table 38. Log index configuration for message broker syslog (continued)
Field Description Attributes
MessageText The message that is written by theexecution group to the logs.
dataType = TEXTretrievable = trueretrieveByDefault = truesortable = falsefilterable = falsesearchable = truesource = annotations
logRecord The entire log record dataType = TEXTretrievable = trueretrieveByDefault = truesortable = falsefilterable = falsesearchable = truesource = annotations
Table 39. Log index configuration for message broker UserTrace logs
Field Description Attributes
timestamp The time that the IBM MB InsightPack generated the log record. Theformat is:
yyyy-MM-dd HH:mm:ss.S
dataType = DATEretrievable = trueretrieveByDefault = truesortable = truefilterable = truesearchable = truesource = metadata
SystemName The name of the system where thelog file resides.
dataType = TEXTretrievable = trueretrieveByDefault = truesortable = truefilterable = truesearchable = truesource = metadata
Product The product that generated the logrecord.
dataType = TEXTretrievable = trueretrieveByDefault = truesortable = truefilterable = falsesearchable = truesource = annotations
version The IBM MB Insight Pack version.For example, IBM Integration Busv9002
dataType = TEXTretrievable = trueretrieveByDefault = truesortable = falsefilterable = falsesearchable = truesource = annotations
ExecutionGroup The execution group name. dataType = TEXTretrievable = trueretrieveByDefault = truesortable = truefilterable = truesearchable = truesource = annotations
160 IBM Operations Analytics - Log Analysis: Installation, Configuration, and Administration Guide

Table 39. Log index configuration for message broker UserTrace logs (continued)
Field Description Attributes
ThreadID ID of the thread that initiated theprocess.
dataType = TEXTretrievable = trueretrieveByDefault = truesortable = truefilterable = truesearchable = truesource = annotations
MessageID The ID of the message that is sent inthe log record. For example,BIP31321, BIP2060W.
dataType = TEXTretrievable = trueretrieveByDefault = truesortable = truefilterable = truesearchable = truesource = annotations
severity The severity of the event that causedthe message. It is extracted from thelast digit of the msgID. The severitylevels are:
v Info
v Warning
v Error
v Severe
dataType = TEXTretrievable = trueretrieveByDefault = truesortable = truefilterable = truesearchable = truesource = annotations
MessageText The message that is written by theexecution group to the logs.
dataType = TEXTretrievable = trueretrieveByDefault = truesortable = falsefilterable = falsesearchable = truesource = annotations
Node The node entity that performed acertain task. The node field may alsocontain the Message Flowinformation.
dataType = TEXTretrievable = trueretrieveByDefault = truesortable = falsefilterable = falsesearchable = truesource = annotations
logRecord The entire log record dataType = TEXTretrievable = trueretrieveByDefault = truesortable = truefilterable = truesearchable = truesource = annotations
IBM MB Insight Pack dashboard:
You can use the IBM MB Insight Pack dashboard example app to visualize datafrom Message Broker logs.
Use the IBM MB Insight Pack dashboard to find Message Broker-related problemsin the shortest time and drilldown into the problem to identify the root cause.
The IBM MB Insight Pack dashboard app for syslog contains the following charts:
BIP2001I:Brk start, BIP2228E: Brk AbendDisplays broker start and end events.
Configuring 161

BIP2208I: EG start, BIP2204I: EG StopDisplays execution group start and end events.
HTTP Listener StartDisplays HTTP listener events.
Error, Warning and Info messagesDisplays the distribution of error, warning, and information logs over time.
The IBM MB Insight Pack dashboard app for UserTrace log contains the followingcharts:
Error Displays the error count over time. Counting is based on 1 minuteintervals.
Which ErrorsDisplays the number of occurrences of each MessageID corresponding toan error message, in 1 minute intervals.
Message Flow and Node ErrorDisplays the Nodes and message flows that caused the error messages.
Configuring the IBM MB Insight Pack dashboard:
To use the IBM MB Insight Pack dashboard, you must configure the IBM MBInsight Pack dashboard app.
Procedure
To configure the IBM MB Insight Pack dashboard app, complete the followingsteps1. Copy the MB Dash.app or IIB User Trace Dashboard.app in the
<HOME>/IBM/LogAnalysis/AppFramework/Apps/MessageBrokerInsightPack_<version> directory. Save the copied MB Dash.appor IIB User Trace Dashboard.app with a new, unique name. For example,MBDashboard1.app.
2. The dashboard name must be unique. To change the dashboard name, modifythe name parameter in the MBDashboard1.app.
3. The default log source that is used by the IBM MB Insight Pack dashboard appfor syslog is MBSyslog, and for UserTrace is MBUserTrace. You must change thelog source for each chart. To change the log source, modify the logsourcesparameter. For example,"logsources": [
{"name": "\/MBSyslog","type": "logSource"
}],
4. To change the time interval for each chart, modify the filters parameter. Forexample,"filter": {
"range": {"timestamp": {
"to": "27\/05\/2015 11:22:46.191 +0530, 11:22 AM","dateFormat": "dd\/MM\/yyyy HH:mm:ss.SSS Z","from": "27\/05\/2014 11:22:46.191 +0530, 11:22 AM"
}}
}
162 IBM Operations Analytics - Log Analysis: Installation, Configuration, and Administration Guide
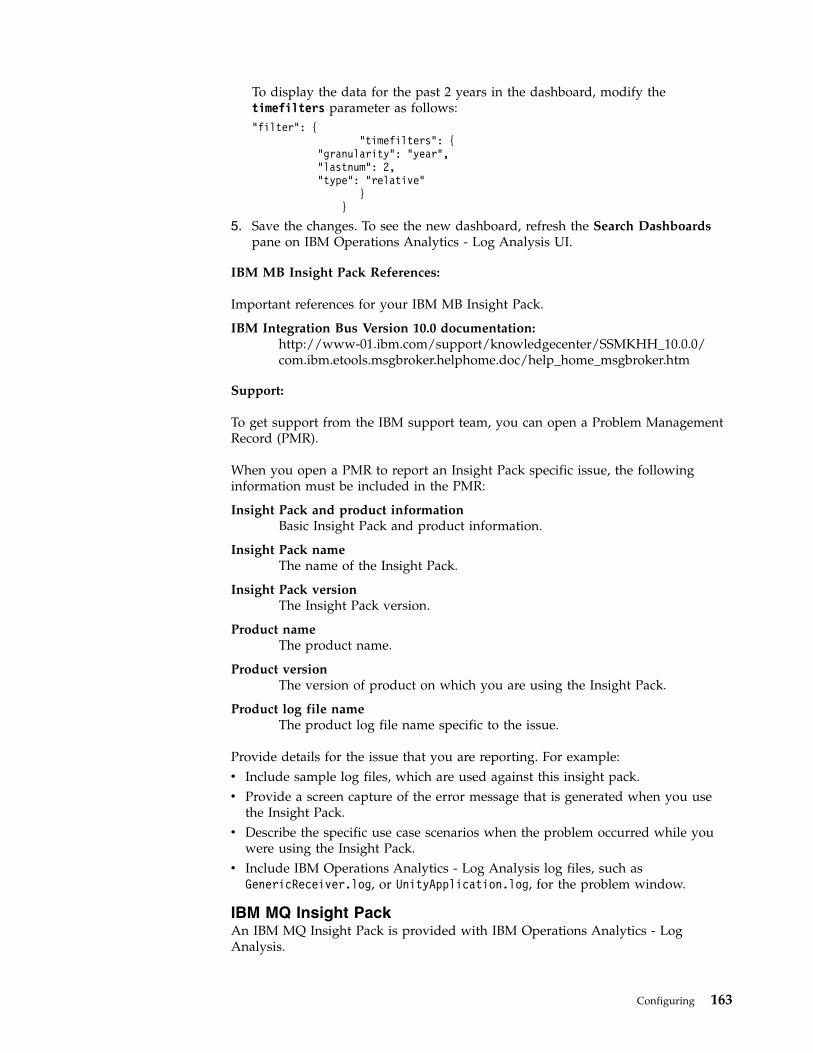
To display the data for the past 2 years in the dashboard, modify thetimefilters parameter as follows:"filter": {
"timefilters": {"granularity": "year","lastnum": 2,"type": "relative"
}}
5. Save the changes. To see the new dashboard, refresh the Search Dashboardspane on IBM Operations Analytics - Log Analysis UI.
IBM MB Insight Pack References:
Important references for your IBM MB Insight Pack.
IBM Integration Bus Version 10.0 documentation: http://www-01.ibm.com/support/knowledgecenter/SSMKHH_10.0.0/com.ibm.etools.msgbroker.helphome.doc/help_home_msgbroker.htm
Support:
To get support from the IBM support team, you can open a Problem ManagementRecord (PMR).
When you open a PMR to report an Insight Pack specific issue, the followinginformation must be included in the PMR:
Insight Pack and product informationBasic Insight Pack and product information.
Insight Pack nameThe name of the Insight Pack.
Insight Pack versionThe Insight Pack version.
Product nameThe product name.
Product versionThe version of product on which you are using the Insight Pack.
Product log file nameThe product log file name specific to the issue.
Provide details for the issue that you are reporting. For example:v Include sample log files, which are used against this insight pack.v Provide a screen capture of the error message that is generated when you use
the Insight Pack.v Describe the specific use case scenarios when the problem occurred while you
were using the Insight Pack.v Include IBM Operations Analytics - Log Analysis log files, such as
GenericReceiver.log, or UnityApplication.log, for the problem window.
IBM MQ Insight PackAn IBM MQ Insight Pack is provided with IBM Operations Analytics - LogAnalysis.
Configuring 163

The IBM MQ Insight Pack provides the capability to index and search against IBMMQ logs files in IBM Operations Analytics - Log Analysis to enable faster problemidentification in MQ-related problems.
The IBM MQ Insight Pack supports logs from the following:v IBM MQ 8.0v MQ Series 7.5v MQ Series 7.1v MQ Series 7.0.1
The IBM MQ Insight Pack supports searching and indexing of the following:
AMQERR logs generated per Queue ManagerUNIX: At /var/mqm/qmgrs/<queueManagername>/errors
Windows: At c:\Program Files\IBM\WebSphere MQ\qmgrs\<queueManagername>\errors
AMQERR.log that is common for all queue managers.UNIX: At /var/mqm/errors
Windows: At c:\Program Files\IBM\WebSphere MQ\qmgrs\errors
The error log files, named AMQERR01.LOG, AMQERR02.LOG, and AMQERR03.LOG, containinformation that is logged by queue managers that can be used for problemdebugging.
MQ FFST files generated by Queue ManagerUNIX: At /var/mqm/errors
Windows: At c:\ProgramData\IBM\MQ\errors
The MQ FFST files are named AMQnnnnn.mm.FDC where nnnn is the ID of the processreporting the error, and mm is the sequence number.
Note: The c:\ProgramData directory is hidden by default. To change the directory,enter %PROGRAMDATA% in the Windows Explorer location bar to browse it, orconfigure Windows Explorer to show hidden files and directories.
MQ Trace files generated by Queue ManagerUNIX: At /var/mqm/trace
Windows: At %MQ_DATA_PATH%\trace
Note: Trace files must be generated manually and converted to text format.For more information, see http://www-01.ibm.com/support/docview.wss?uid=swg21174924#Network
Installing the IBM MQ Insight Pack:
To index and search IBM MQ logs, you must install the IBM MQ Insight Pack.
About this task
The IBM MQ Insight Pack is installed by using the pkg_mgmt utility that is shippedwith IBM Operations Analytics - Log Analysis.
164 IBM Operations Analytics - Log Analysis: Installation, Configuration, and Administration Guide

Procedure
1. Upload the IBM MQ Insight Pack archive file, IBMMQInsightPack_<version>.zipto the system where IBM Operations Analytics - Log Analysis is installed.
2. Install IBM MQ Insight Pack by using the pkg_mgmt.sh command:<HOME>/IBM/LogAnalysis/utilities/pkg_mgmt.sh -install<path>/IBMMQInsightPack_<version>.zip
Where:<HOME> is the directory where IBM Operations Analytics - Log Analysis isinstalled.<path> is the path where you saved the IBMMQInsightPack_<version>.zip.
3. (Optional) If you are using the Log File Agent to load the data into IBMOperations Analytics - Log Analysis, deploy the log file agent configurationfiles with the following command:<HOME>/IBM/LogAnalysis/utilities/pkg_mgmt.sh -deploylfa<path>/IBMMQInsightPack_<version>.zip
Where:<HOME> is the directory where IBM Operations Analytics - Log Analysis isinstalled.<path> is the path where you saved the IBMMQInsightPack_<version>.zip.
IBM MQ Insight Pack configuration artifacts:
The IBM MQ Insight Pack created artifacts when it is installed.
The following artifacts are created when the IBM MQ Insight Pack is installed:
WMQAMQERRSplitter, WMQFDCSplitter, WMQTRCSplitterSplitter file set.
WMQAMQERRAnnoator, WMQFDCAnnoator, WMQTRCAnnotatorAnnotator file set
WMQ_AMQERR, WMQ_FDC, WMQ_TRCSource type
WMQAMQERR_C1, WMQFDC_C1, WMQTRC_C1Collection
Configuring the IBM MQ Insight Pack:
To index and search IBM MQ logs, you must configure the IBM MQ Insight Pack.
Procedure
1. (Optional) To modify the default timestamp format for AMQERR files:a. The default timestamp format supported by the source type installed with
the IBM MQ Insight Pack is MM/dd/yyyy HH:mm:ss. If the timestamp formatin the AMQERR file is different, create a new source type by copying andmodifying the contents of the WMQ_AMQERR source type. To change thetimestamp format, edit the dateFormats parameter. For example:"timestamp": {
"dataType": "DATE","retrievable": true,"retrieveByDefault": true,"sortable": true,"filterable": true,"searchable": true,
Configuring 165
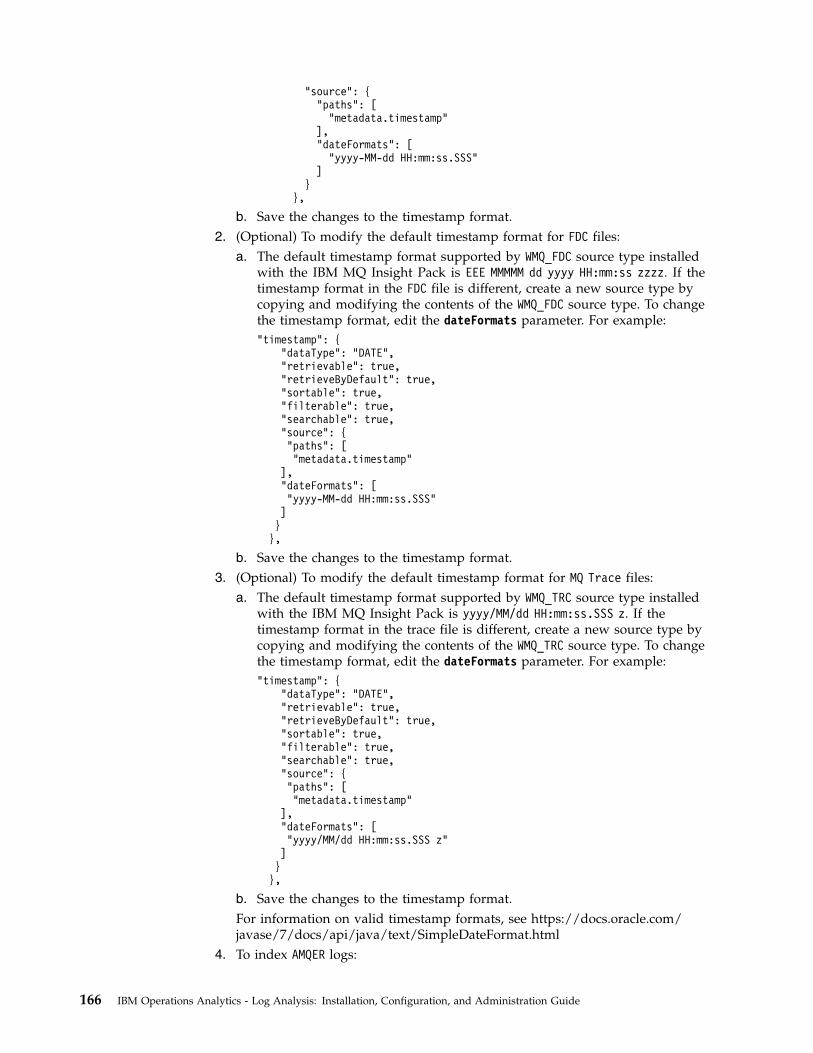
"source": {"paths": ["metadata.timestamp"
],"dateFormats": ["yyyy-MM-dd HH:mm:ss.SSS"
]}
},
b. Save the changes to the timestamp format.2. (Optional) To modify the default timestamp format for FDC files:
a. The default timestamp format supported by WMQ_FDC source type installedwith the IBM MQ Insight Pack is EEE MMMMM dd yyyy HH:mm:ss zzzz. If thetimestamp format in the FDC file is different, create a new source type bycopying and modifying the contents of the WMQ_FDC source type. To changethe timestamp format, edit the dateFormats parameter. For example:"timestamp": {
"dataType": "DATE","retrievable": true,"retrieveByDefault": true,"sortable": true,"filterable": true,"searchable": true,"source": {"paths": ["metadata.timestamp"
],"dateFormats": ["yyyy-MM-dd HH:mm:ss.SSS"]}},
b. Save the changes to the timestamp format.3. (Optional) To modify the default timestamp format for MQ Trace files:
a. The default timestamp format supported by WMQ_TRC source type installedwith the IBM MQ Insight Pack is yyyy/MM/dd HH:mm:ss.SSS z. If thetimestamp format in the trace file is different, create a new source type bycopying and modifying the contents of the WMQ_TRC source type. To changethe timestamp format, edit the dateFormats parameter. For example:"timestamp": {
"dataType": "DATE","retrievable": true,"retrieveByDefault": true,"sortable": true,"filterable": true,"searchable": true,"source": {"paths": ["metadata.timestamp"
],"dateFormats": ["yyyy/MM/dd HH:mm:ss.SSS z"]}},
b. Save the changes to the timestamp format.For information on valid timestamp formats, see https://docs.oracle.com/javase/7/docs/api/java/text/SimpleDateFormat.html
4. To index AMQER logs:
166 IBM Operations Analytics - Log Analysis: Installation, Configuration, and Administration Guide

a. Navigate to the IBM Operations Analytics - Log Analysis settingsworkspace.
b. Create a log source for the log file to be monitored. The source type mustbe WMQ_AMQERR or the source type that is created in step 1a, if different.
5. To index FDC files:a. Navigate to the IBM Operations Analytics - Log Analysis settings
workspace.b. Create a log source for the log file to be monitored. The source type must
be WMQ_FDC or the source type that is created in step 2a, if different.6. To index MQ Trace files:
a. Navigate to the IBM Operations Analytics - Log Analysis settingsworkspace.
b. Create a log source for the log file to be monitored. The source type mustbe WMQ_TRC or the source type that is created in step 3a, if different.
7. (Optional) To configure the IBM Tivoli Monitoring Log File Agent to stream MQAMQERR logs to the IBM Operations Analytics - Log Analysis server, see theConfiguring IBM Tivoli Monitoring Log File Agents topic in the IBM TivoliMonitoring Log File Agent configuration scenarios section of Loading and streamingdata in the Configuring IBM Operations Analytics - Log Analysis guide.
IBM MQ Insight Pack splitter rules:
Splitting describes how IBM Operations Analytics - Log Analysis separatesphysical log file records in to logical records by using a logical boundary such astime stamp or a new line.
The IBM MQ Insight Pack splits log records on timestamps. For example, in thefollowing log record the critical utility task manager has started the LOGGER-IO task.This task was run once. The ACTION is None.4/2/2015 12:52:16 - Process(8456.3) User(user1) Program(amqzmuc0.exe)
Host(HOST1) Installation(Installation5)VRMF(7.1.0.0) QMgr(QM_71)
AMQ5051: The queue manager task ’LOGGER-IO’ has started.EXPLANATION:The critical utility task manager has started the LOGGER-IO task. This task has now started 1 times.ACTION:None.
The IBM MQ Insight Pack splits FDC records on based on the timestamp.
The IBM MQ Insight Pack splits trace records on new lines. Every new line in atrace file is a new record
IBM MQ Insight Pack Annotation rules and index configuration:
After the log records are split, the logical records are sent to the annotation engine.The engine uses rules to extract important pieces of information that are sent to theindexing engine.
The IBM MQ Insight Pack annotates the log records based on the following fields:
Configuring 167
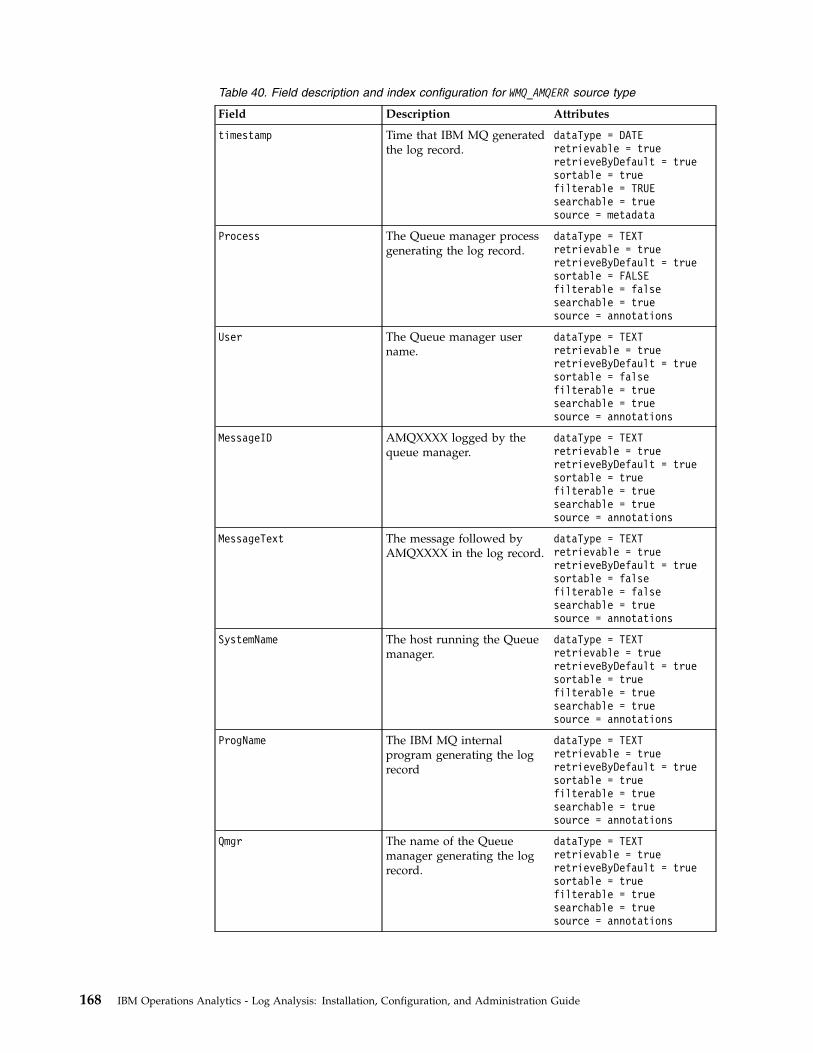
Table 40. Field description and index configuration for WMQ_AMQERR source type
Field Description Attributes
timestamp Time that IBM MQ generatedthe log record.
dataType = DATEretrievable = trueretrieveByDefault = truesortable = truefilterable = TRUEsearchable = truesource = metadata
Process The Queue manager processgenerating the log record.
dataType = TEXTretrievable = trueretrieveByDefault = truesortable = FALSEfilterable = falsesearchable = truesource = annotations
User The Queue manager username.
dataType = TEXTretrievable = trueretrieveByDefault = truesortable = falsefilterable = truesearchable = truesource = annotations
MessageID AMQXXXX logged by thequeue manager.
dataType = TEXTretrievable = trueretrieveByDefault = truesortable = truefilterable = truesearchable = truesource = annotations
MessageText The message followed byAMQXXXX in the log record.
dataType = TEXTretrievable = trueretrieveByDefault = truesortable = falsefilterable = falsesearchable = truesource = annotations
SystemName The host running the Queuemanager.
dataType = TEXTretrievable = trueretrieveByDefault = truesortable = truefilterable = truesearchable = truesource = annotations
ProgName The IBM MQ internalprogram generating the logrecord
dataType = TEXTretrievable = trueretrieveByDefault = truesortable = truefilterable = truesearchable = truesource = annotations
Qmgr The name of the Queuemanager generating the logrecord.
dataType = TEXTretrievable = trueretrieveByDefault = truesortable = truefilterable = truesearchable = truesource = annotations
168 IBM Operations Analytics - Log Analysis: Installation, Configuration, and Administration Guide

Table 40. Field description and index configuration for WMQ_AMQERR source type (continued)
Field Description Attributes
VRMF The IBM MQ version dataType = TEXTretrievable = trueretrieveByDefault = truesortable = falsefilterable = falsesearchable = truesource = annotations
logRecord Entire log record dataType = TEXTretrievable = trueretrieveByDefault = truesortable = falsefilterable = falsesearchable = truesource = metadata
Table 41. Field description and index configuration for WMQ_AMQERR source type
Field Description Attributes
timestamp The time in FDC.
Format: EEE MMMMM ddyyyy HH:mm:ss zzzz
dataType = DATEretrievable = trueretrieveByDefault = truesortable = truefilterable = TRUEsearchable = truesource = metadata
logRecord Entire log record. dataType = TEXTretrievable = trueretrieveByDefault = truesortable = falsefilterable = falsesearchable = truesource = metadata
SystemName The host running the Queuemanager.
dataType = TEXTretrievable = trueretrieveByDefault = truesortable = truefilterable = truesearchable = truesource = annotations
VRMF The IBM MQ version. dataType = TEXTretrievable = trueretrieveByDefault = truesortable = falsefilterable = falsesearchable = truesource = annotations
ProbeID The probe ID of the FDC. dataType = TEXTretrievable = trueretrieveByDefault = truesortable = truefilterable = truesearchable = truesource = annotations
Configuring 169

Table 41. Field description and index configuration for WMQ_AMQERR source type (continued)
Field Description Attributes
ApplicantName The name of the applicationgenerating FDC.
dataType = TEXTretrievable = trueretrieveByDefault = truesortable = falsefilterable = falsesearchable = truesource = annotations
Component The IBM MQ componentgenerating FDC.
dataType = TEXTretrievable = trueretrieveByDefault = truesortable = truefilterable = truesearchable = truesource = annotations
SCCS Source Code Control System. dataType = TEXTretrievable = trueretrieveByDefault = truesortable = falsefilterable = falsesearchable = truesource = annotations
LineNumber The source code line number. dataType = TEXTretrievable = trueretrieveByDefault = truesortable = falsefilterable = falsesearchable = truesource = annotations
BuildLevel The IBM MQ build level. dataType = TEXTretrievable = trueretrieveByDefault = truesortable = falsefilterable = falsesearchable = truesource = annotations
User The Queue manager username.
dataType = TEXTretrievable = trueretrieveByDefault = truesortable = falsefilterable = truesearchable = truesource = annotations
ProcessName The process name generatingFDC.
dataType = TEXTretrievable = trueretrieveByDefault = truesortable = falsefilterable = falsesearchable = truesource = annotations
Process The process ID generatingFDC.
dataType = TEXTretrievable = trueretrieveByDefault = truesortable = falsefilterable = falsesearchable = truesource = annotations
170 IBM Operations Analytics - Log Analysis: Installation, Configuration, and Administration Guide

Table 41. Field description and index configuration for WMQ_AMQERR source type (continued)
Field Description Attributes
Thread The IBM MQ threadgenerating FDC.
dataType = TEXTretrievable = trueretrieveByDefault = truesortable = falsefilterable = falsesearchable = truesource = annotations
Qmgr The name of the Queuemanager generating the logrecord.
dataType = TEXTretrievable = trueretrieveByDefault = truesortable = truefilterable = truesearchable = truesource = annotations
MajorErrorCode The major error codereported in FDC.
dataType = TEXTretrievable = trueretrieveByDefault = truesortable = falsefilterable = falsesearchable = truesource = annotations
Operating System The operating systemrunning Qmgr.
dataType = TEXTretrievable = trueretrieveByDefault = truesortable = falsefilterable = falsesearchable = truesource = annotations
MessageID AMQXXXX logged by thequeue manager.
dataType = TEXTretrievable = trueretrieveByDefault = truesortable = truefilterable = truesearchable = truesource = annotations
MessageText The message followed byAMQXXXX in the log record.
dataType = TEXTretrievable = trueretrieveByDefault = truesortable = falsefilterable = falsesearchable = truesource = annotations
Comment1 The comment from FDC. dataType = TEXTretrievable = trueretrieveByDefault = truesortable = falsefilterable = falsesearchable = truesource = annotations
Comment2 The comment from FDC. dataType = TEXTretrievable = trueretrieveByDefault = truesortable = falsefilterable = falsesearchable = truesource = annotations
Configuring 171
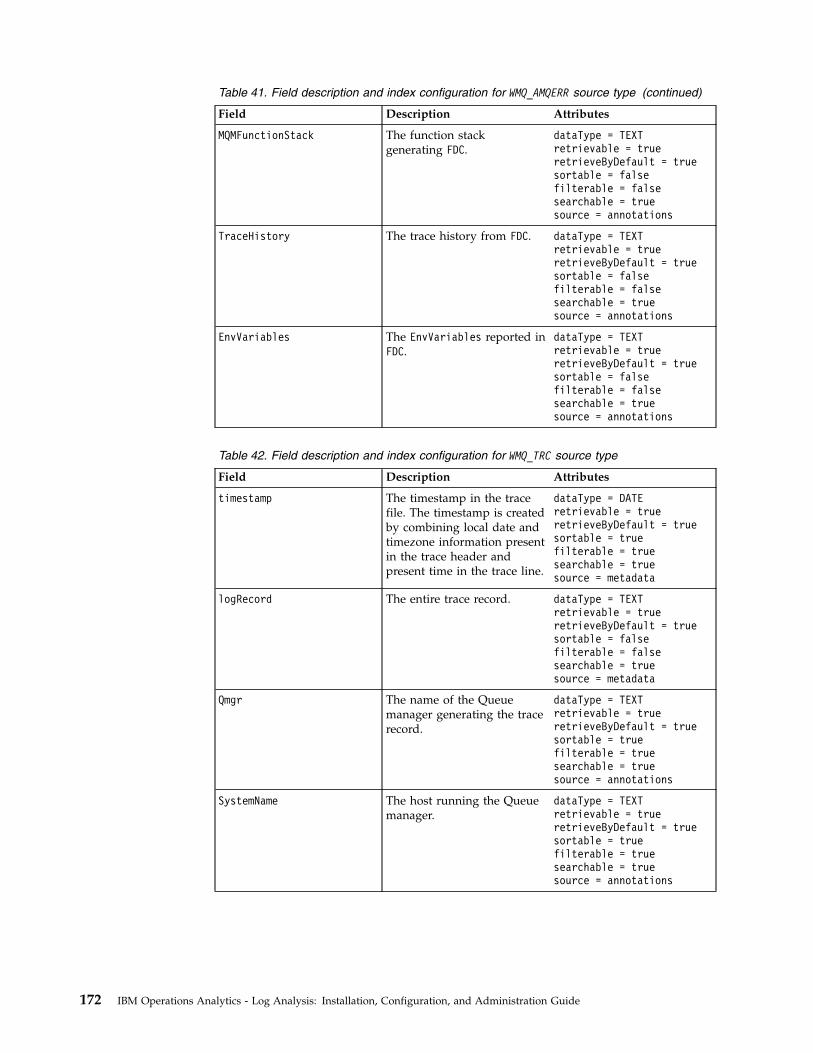
Table 41. Field description and index configuration for WMQ_AMQERR source type (continued)
Field Description Attributes
MQMFunctionStack The function stackgenerating FDC.
dataType = TEXTretrievable = trueretrieveByDefault = truesortable = falsefilterable = falsesearchable = truesource = annotations
TraceHistory The trace history from FDC. dataType = TEXTretrievable = trueretrieveByDefault = truesortable = falsefilterable = falsesearchable = truesource = annotations
EnvVariables The EnvVariables reported inFDC.
dataType = TEXTretrievable = trueretrieveByDefault = truesortable = falsefilterable = falsesearchable = truesource = annotations
Table 42. Field description and index configuration for WMQ_TRC source type
Field Description Attributes
timestamp The timestamp in the tracefile. The timestamp is createdby combining local date andtimezone information presentin the trace header andpresent time in the trace line.
dataType = DATEretrievable = trueretrieveByDefault = truesortable = truefilterable = truesearchable = truesource = metadata
logRecord The entire trace record. dataType = TEXTretrievable = trueretrieveByDefault = truesortable = falsefilterable = falsesearchable = truesource = metadata
Qmgr The name of the Queuemanager generating the tracerecord.
dataType = TEXTretrievable = trueretrieveByDefault = truesortable = truefilterable = truesearchable = truesource = annotations
SystemName The host running the Queuemanager.
dataType = TEXTretrievable = trueretrieveByDefault = truesortable = truefilterable = truesearchable = truesource = annotations
172 IBM Operations Analytics - Log Analysis: Installation, Configuration, and Administration Guide

Table 42. Field description and index configuration for WMQ_TRC source type (continued)
Field Description Attributes
VRMF The IBM MQ version. dataType = TEXTretrievable = trueretrieveByDefault = truesortable = falsefilterable = falsesearchable = truesource = annotations
Counter The counter present in eachtrace line.
dataType = TEXTretrievable = trueretrieveByDefault = truesortable = falsefilterable = falsesearchable = truesource = annotations
ProcessName The process name generatingthe trace file.
dataType = TEXTretrievable = trueretrieveByDefault = truesortable = falsefilterable = falsesearchable = truesource = annotations
Process The process ID generatingthe trace file.
dataType = TEXTretrievable = trueretrieveByDefault = truesortable = falsefilterable = falsesearchable = truesource = annotations
Thread The IBM MQ threadgenerating trace.
dataType = TEXTretrievable = trueretrieveByDefault = truesortable = falsefilterable = falsesearchable = truesource = annotations
MessageText The message in the trace file. dataType = TEXTretrievable = trueretrieveByDefault = truesortable = falsefilterable = falsesearchable = truesource = annotations
FunctionName IBM MQ function. dataType = TEXTretrievable = trueretrieveByDefault = truesortable = falsefilterable = truesearchable = truesource = annotations
RC Return code from thefunction.
dataType = TEXTretrievable = trueretrieveByDefault = truesortable = falsefilterable = truesearchable = truesource = annotations
Configuring 173

Table 42. Field description and index configuration for WMQ_TRC source type (continued)
Field Description Attributes
Depth Depth of function call. dataType = LONGretrievable = trueretrieveByDefault = truesortable = falsefilterable = falsesearchable = truesource = annotations
Indent Indent present in the traceline.
dataType = TEXTretrievable = trueretrieveByDefault = truesortable = falsefilterable = falsesearchable = truesource = annotations
IBM MQ Insight Pack dashboard:
You can use the IBM MQ Insight Pack dashboard example app to visualize datafrom MQ logs.
Use the IBM MQ Insight Pack dashboard to find MQ-related problems in theshortest time, and drill down into the problem to identify the root cause.
The IBM MQ Insight Pack app contains the following charts:
Which are top MessageIDsPlots a pie chart of MessageIDs from the selected log records.
Which MessageID occurred the most and when?Plots a bar graph that shows how MessageIDs are distributed over aselected time frame.
Which Qmgr logged these MessageIDs?Plots a bubble chart that shows which Qmgr logged most of the MessageIDs.
Which MQ program logged these MessageIDs?Plots a bar graph that shows which MQ program logged the MessageIDs.
MQ Trace dashboard:
You can use the MQ Trace dashboard to find the root cause of problems using MQTrace data.
Use the MQ Trace dashboard to use MQ Trace data to drill down into the problemto identify the root cause.
The MQ Trace dashboard.app contains the following charts:
Not OK ReturnCodeDistribution of Not OK codes returned in the trace file.
FunctionName, ReturnCodeBar graph displaying the functions that return the Not OK return codes.
timestamp,ReturnCodePlots a bubble chart that displays the Not OK return codes over time.
174 IBM Operations Analytics - Log Analysis: Installation, Configuration, and Administration Guide

Qmgr, FunctionName, ReturnCodeA treemap that displays how many Not OK return codes are generated bywhich queue manager and FunctionName.
Configuring the IBM MQ Insight Pack dashboard app:
To use the IBM MQ Insight Pack dashboard, you must configure the IBM MQInsight Pack dashboard app.
Procedure
To configure and customize the IBM MQ Insight Pack dashboard app, complete thefollowing steps.1. Copy the MQDash.app or MQ Trace Dashboard.app from the <HOME>/IBM/
LogAnalysis/AppFramework/Apps/IBMMQInsightPack_<version> directory to anew directory. For example MQDashboard1.app.
2. The dashboard name must be unique. To change the dashboard name, modifythe name parameter in the MQDashboard1.app.
3. The default log source that is used by the IBM MQ Insight Pack dashboard appis MQ_80. You must change the log source for each chart. To change the logsource, modify the logsources parameter. For example:"logsources":[{"type":"logSource","name":"\/MQ_80.log"}],
4. The default time interval is the last year, and the last number is 1 or 2. Tochange the time interval for each chart, modify the timefilters parameter. Forexample:"filter": {
"timefilters": {"granularity": "year","lastnum": 2,"type": "relative"
}},
The granularity can be specified as second, minute, hour, day, week, month, oryear.
5. Save the changes. Refresh the Search Dashboards panel on IBM OperationsAnalytics - Log Analysis UI to see the new dashboard.
IBM MQ Insight Pack References:
Important references for your IBM MQ Insight Pack.
IBM WebSphere MQ library: http://www-01.ibm.com/software/integration/wmq/library/
Support:
To get support from the IBM support team, you can open a Problem ManagementRecord (PMR).
When you open a PMR to report an Insight Pack specific issue, the followinginformation must be included in the PMR:
Configuring 175

Insight Pack and product informationBasic Insight Pack and product information.
Insight Pack nameThe name of the Insight Pack.
Insight Pack versionThe Insight Pack version.
Product nameThe product name.
Product versionThe version of product on which you are using the Insight Pack.
Product log file nameThe product log file name specific to the issue.
Provide details for the issue that you are reporting. For example:v Include sample log files, which are used against this insight pack.v Provide a screen capture of the error message that is generated when you use
the Insight Pack.v Describe the specific use case scenarios when the problem occurred while you
were using the Insight Pack.v Include IBM Operations Analytics - Log Analysis log files, such as
GenericReceiver.log, or UnityApplication.log, for the problem window.
Ticket Analytics Insight PackThe Ticket Analytics Insight Pack are provided with IBM Operations Analytics -Log Analysis.
The Ticket Analytics Insight Pack provide IBM Operations Analytics - Log Analysisusers who implemented a ticketing with solutions to search and analyze tickets.
There are three Ticket Analytics Insight Pack for the three ticketing solutions. TheInsight Packs and solutions are as follows:v TicketAnalyticsForControlDesk_InsightPack_<version>
v TicketAnalyticsForRemedy_InsightPack_<version>
v TicketAnalyticsForServiceNow_InsightPack_<version>
The Insight Packs include the logstash based adapter. The adapter retrieves thetickets that are then ingested in to the IBM Operations Analytics - Log Analysisserver where each ticket is split and annotated. During ingestion, the tickets areanalyzed and assigned a classification. The classification of tickets ensures thatanalytical insights are enabled.
The Ticket Analytics Insight Pack install sample dashboards that can be used tovisualize insights.
Installing the Ticket Analytics Insight Pack:
To search and analyze tickets with a ticketing solution, you must install the TicketAnalytics Insight Pack.
176 IBM Operations Analytics - Log Analysis: Installation, Configuration, and Administration Guide

Before you begin
You must install the Insight Pack and logstash based adapter for your ticketingsolution. The Insight Packs and solutions are as follows.v TicketAnalyticsForControlDesk_InsightPack_<version>
v TicketAnalyticsForRemedy_InsightPack_<version>
v TicketAnalyticsForServiceNow_InsightPack_<version>
Where <version> is the version number of the Insight Pack.
Procedure
1. Upload the appropriate TicketAnalyticsInsightPacks.zip file to the systemwhere IBM Operations Analytics - Log Analysis is installed.
2. Create a temporary folder. For example, <HOME>/IBM/LogAnalysis/ticket_install
3. Copy and extract the TicketAnalyticsInsightPacks.zip to the temporaryfolder. The TicketAnalytics folder that contains the installation files andlogstash ticket adapter compressed file is created.
4. Edit the Ticket Analytics installation script to make it executable. For example,to use the command line to edit the script, run the following command:chmod +x icd_<insight_pack>_install.sh
Where <insight_pack> is the name of the Service Desk Extensions Insight Pack.5. Make copies of the following files:v <HOME>/IBM/LogAnalysis/wlp/usr/servers/Unity/server.xmlv <HOME>/IBM/LogAnalysis/wlp/usr/servers/Unity/unityConfig.xml
6. To install a Service Desk Extensions Insight Pack, run the following script:./icd_<insight_pack>_install.sh -install -home <HOME>-U <LAadmin_user> -P <LAadmin_user_password>
Wherev <insight_pack> is the name of the Service Desk Extensions Insight Pack.v <HOME> is the home directory.v <LAadmin_user> is the admin user name.v <LAadmin_user_password> is the admin user password.
Note: The IBM Operations Analytics - Log Analysis server restarts once duringthe installation.
Results
The selected Service Desk Extensions Insight Pack, including the Ticket Dashboardapplications is installed.
Example
Use the following commands to modify a Service Desk Extensions Insight Pack.
-installTo install a Service Desk Extensions Insight Pack. For example,/icd_addon_install.sh -install -home <HOME> -U<LAadmin_user> -P <LAadmin_user_password>
-uninstallTo uninstall a Service Desk Extensions Insight Pack. For example,
Configuring 177

/icd_addon_install.sh -uninstall -home <HOME> -U<LAadmin_user> -P <LAadmin_user_password>
-list To list the installed Ticket Analytics Insight Pack. For example,/icd_addon_install.sh -list -home <HOME> -U<LAadmin_user> -P <LAadmin_user_password>
Uninstalling a Ticket Analytics Insight Pack:
You can uninstall a Ticket Analytics Insight Pack.
Before you begin
You must manually delete all of the data from the created data sources beforeuninstalling a Service Desk Extensions Insight Pack.
About this task
You can uninstall the following Service Desk Extensions Insight Pack:v TicketAnalyticsForControlDesk_InsightPack_<version>
v TicketAnalyticsForRemedy_InsightPack_<version>
v TicketAnalyticsForServiceNow_InsightPack_<version>
Procedure
To uninstall a Service Desk Extensions Insight Pack, run the following script:./icd_addon_install.sh -uninstall -home <HOME>-U <LAadmin_user> -P <LAadmin_user_password>
wherev icd_addon is the name of the Ticket AnalyticsInsight Pack.v <HOME> is the home directory.v <LAadmin_user> is the admin user name.v <LAadmin_user_password> is the admin user password.
Setting up the logstash adapter for ticketing:
You must install the logstash based adapter for your ticketing solution.
About this task
The logstash adapter included with the Service Desk Extensions Insight Pack forIBM Control Desk is connected to an IBM Control Desk instance. The logstashadapters included with Service Desk Extensions Insight Pack for Remedy andService Desk Extensions Insight Pack for ServiceNow are file-based. The file-basedadapters require each ticket instance to be separated by a line, and within eachrecord the ticket column data is separated by a comma delimiter.
Procedure
1. Copy and extract the LogstashTicketAdapters.zip to <HOME>/IBM/LogAnalysis to create a <plugin_home> folder.
2. To import the IBM Operations Analytics - Log Analysis client certificate to theJVM, complete the following steps:
178 IBM Operations Analytics - Log Analysis: Installation, Configuration, and Administration Guide

a. Copy the client.crt file from <HOME>/IBM/LogAnalysis/wlp/usr/servers/Unity/resources/security on the IBM Operations Analytics - LogAnalysis server.
b. Run the following command:keytool -import -file <path> -keystore <JAVA_HOME>/jre/lib/security/cacerts -storepass changeit
where <path> is the location of the client.crt, and <JAVA_HOME> is theJAVA location.
3. To edit the logstash plug-in, complete the following steps:The logstash plug-in is in the <plugin_home> folder. For example, the IBMControl Desk ticket adapter, sccd_adapter_logstash.conf, is at<plugin_home>/logstash/configs/sccd_adapter_logstash.conf
a. Input section: Edit the input path for Service Desk Extensions Insight Packfor Remedy or ServiceNow to point to the ticket source.
b. Output section: Edit the following output path configuration parameters forthe IBM Operations Analytics - Log Analysis server where the tickets areingested:
Table 43. Service Desk Extensions Insight Pack configuration parameters
Parameter Description
scala_url The URL of the IBM Operations Analytics -Log Analysis server where the ticket data isingested.
scala_user The IBM Operations Analytics - LogAnalysis server user name.
scala_password The IBM Operations Analytics - LogAnalysis server password.
disk_cache_path The disk cache location on the IBMOperations Analytics - Log Analysis server.
4. If you are using IBM Control Desk, edit the following parameters in the<plugin_home>/logstash/configs/SCCDConfig.properties file:
Table 44. Service Desk Extensions Insight Pack IBM Control Desk properties
Parameter Description
HOSTNAME The IBM Control Desk host name.
PORT The IBM Control Desk server http port.
USERNAME The IBM Control Desk user name.
PASSWORD The IBM Control Desk user's password.
TIME_BETWEEN_FETCH The time between fetching 2 consecutivetickets.
DATE_FORMAT The date format for the ticket date attributes.
IS_SSL The security protocol setting. The defaultsetting is 0. Set to 1 if the IBM Control Deskconnection uses HTTPS.
PROTOCOL The security protocol. You can use SSL orTLS.
5. Edit the <JAVA_HOME> variable in the start script to point to your JVM. The startscript is in the <plugin_home> folder.
Configuring 179

6. Edit the start script to make it executable. For example, to use the commandline to edit the script, run the following command:chmod +x startlCDTicketAdapter
7. To start the logstash adapter, run the start script.
Service Desk Extensions Insight Pack data format:
The Ticket Analytics Insight Pack require data to be saved or converted in to aspecific format.
Data format
The Ticket Analytics Insight Pack require data in the CSV format. Individual recordsmust be separated by a line, and within each record the ticket column data mustbe separated by a comma delimiter.
The logstash adapter for IBM Control Desk converts the data that it fetches fromthe configured IBM Control Desk instance in to the required format.
The logstash adapters for Remedy and ServiceNow read data from a file. They donot convert data. Therefore, the data must be in the required format.
Data can be sent in batches. The first line of each batch must contain the columnnames.
Supported columns
A set of columns is defined as a JSON file in the Service Desk Extensions InsightPack configuration folder, which is located at <HOME>/IBM/LogAnalysis/wlp/usr/servers/Unity/tickets/config. The followingJSON files, specific to each ServiceDesk Extensions Insight Pack are in the configuration folder:v SCCDAnnotationMap.json – For IBM Control Desk Columnsv RemedyAnnotationMap.json – For Remedyv Columns ServiceNowAnnotationMap.json – For ServiceNow Columns
The JSON files contain an entry for each column in the following format:Column_Name : Internal Column Name where the Column_Name is the name of theingested column, and the Internal Column Name is the internal name that isdefined in the index configuration.
Service Desk Extensions Insight Pack configuration properties:
After you complete the required Service Desk Extensions Insight Pack installationto modify the configuration properties edit the ticketanalytics.properties file.
The ticketanalytics.properties file is at <HOME>/IBM/LogAnalysis/wlp/usr/servers/Unity/tickets/config.
Modify only the properties in the table.
180 IBM Operations Analytics - Log Analysis: Installation, Configuration, and Administration Guide

Table 45. Service Desk Extensions Insight Pack configuration properties
Parameter Description
FIRST_LINE_COLUMNS Defines the data type. If this property is settoyes, the first line in the ticket data batch isdefined as Column data. If this property isset to no, the data in the batch is consideredticket data. The default columns that aredefined in the JSON files are considered inorder.
SERVICENOW_TIMEFORMATS Defines the default input time formats thatare expected in the ticket data. You canspecify one or more different formats. Whenyou are parsing a date type, the formats aretried in the order they are defined.
REMEDY_TIMEFORMATS Defines the default input time formats thatare expected in the ticket data. You canspecify one or more different formats. Whenyou are parsing a date type, the formats aretried in the order they are defined.
SCCD_TIMEFORMATS Defines the default input time formats thatare expected in the ticket data. You canspecify one or more different formats. Whenyou are parsing a date type, the formats aretried in the order they are defined.
Service Desk Extensions Insight Pack dashboards:
There are three dashboards for each ticket type that is packaged with the TicketAnalytics Insight Pack.
The dashboards in table 1 are included with the Ticket Analytics Insight Pack foreach of the ticket types, IBM Control Desk, Remedy, and ServiceNow. Users cancreate more charts and dashboards based on ingested ticket data.
Table 46. Dashboard descriptions
Dashboard Description
Problem Origin The charts on this dashboard illustrate theclassification categories and ticket attributesthat relate to the origin of a problem.
Problem Resolution The charts on this dashboard illustrate theclassification categories and ticket attributesthat relate to the resolution of a problem.
Problem Trends The charts on this dashboard illustrate howproblems related to tickets trend historically.
IBM PureApp Insight PackAn IBM PureApp Insight Pack is provided with IBM Operations Analytics - LogAnalysis.
The IBM PureApp Insight Pack provides the capability to index and search againstIBM PureApp logs files in IBM Operations Analytics - Log Analysis to enablefaster problem identification in jobs and services-related problems.
The IBM PureApp Insight Pack supports logs from the following.
Configuring 181

v PureApplication System W2500 2.1.0
The IBM PureApp Insight Pack supports searching and indexing of the following.v Job status logs that are generated for all System Initiated and User Initiated jobs.
At var\log\purescale\ipas.async\x.Where x is the job group.
v Service status logsAt var\log\purescale\ipas.tsaserver\x.Where x is the service.
Installing the IBM PureApp Insight Pack:
To index and search IBM PureApp logs, you must install the IBM PureApp InsightPack.
About this task
The IBM PureApp Insight Pack is installed by using the pkg_mgmt utility that isshipped with IBM Operations Analytics - Log Analysis.
Procedure
1. Upload the IBM PureApp Insight Pack archive file,IBMPureAppLogInsightPack__<version>.zip to the system where IBMOperations Analytics - Log Analysis is installed.
2. Install IBM PureApp Insight Pack by using the pkg_mgmt.sh command:<HOME>/IBM/LogAnalysis/utilities/pkg_mgmt.sh -install<path>/IBMPureAppLogInsightPack_<version>.zip
Where:<HOME> is the directory where IBM Operations Analytics - Log Analysis isinstalled.<path> is the path where you saved theIBMPureAppLogInsightPack_<version>.zip.
3. (Optional) If you are using the Log File Agent to load the data into IBMOperations Analytics - Log Analysis, deploy the log file agent configurationfiles with the following command:<HOME>/IBM/LogAnalysis/utilities/pkg_mgmt.sh -deploylfa<path>/IBMPureAppLogInsightPack_<version>.zip
Where:<HOME> is the directory where IBM Operations Analytics - Log Analysis isinstalled.<path> is the path where you saved theIBMPureAppLogInsightPack_<version>.zip.
IBM PureApp Insight Pack configuration artifacts:
The IBM PureApp Insight Pack created artifacts when it is installed.
The following artifacts are created when the IBM PureApp Insight Pack isinstalled:
PureAppJobStatusSplitterSplitter file set for Job Status.
182 IBM Operations Analytics - Log Analysis: Installation, Configuration, and Administration Guide

PureAppServiceStatusSplitterSplitter file set for Service Status.
PureAppJobStatusAnnotatorAnnotator file set for Job Status.
PureAppServiceStatusAnnotatorAnnotator file set for Service Status.
PureAppJobStatusLog_STSource type for Job Status.
PureAppServiceStatusLog_STSource type for Service Status.
PureAppJobStatusLog_C1Collection for Job Status.
PureAppServiceStatusLog_C1Collection for Service Status.
Configuring the IBM PureApp Insight Pack:
To index and search IBM PureApp logs, you must configure the IBM PureAppInsight Pack.
Procedure
1. (Optional) To modify the default timestamp format:a. The default timestamp format supported by the source type installed with
the IBM PureApp Insight Pack is MM-dd-yy HH:mm:ss. If the timestampformat in the IBM PureApp log file is different, create a new source type bycopying and modifying the contents of the PureAppJobStatusLog_ST andPureAppServiceStatusLog_ST source type. To change the timestamp format,edit the dateFormats parameter. For example:"timestamp": {
"dataType": "DATE","retrievable": true,"retrieveByDefault": true,"sortable": true,"filterable": true,"searchable": true,"source": {
"paths": ["metadata.timestamp"
],"dateFormats": ["yyyy-MM-dd HH:mm:ss.SSS"
]}
},
b. Save the changes to the timestamp format.For information on valid timestamp formats, see https://docs.oracle.com/javase/7/docs/api/java/text/SimpleDateFormat.html
2. To index IBM PureApp Job Status logs:a. Navigate to the IBM Operations Analytics - Log Analysis settings
workspace.b. Create a log source for the log file to be monitored. The source type must
be PureAppJobStatusLog_ST or the source type that is created in step 1a, ifdifferent.
Configuring 183

3. To index IBM PureApp Service Status logs:a. Navigate to the IBM Operations Analytics - Log Analysis settings
workspace.b. Create a log source for the log file to be monitored. The source type must
be PureAppServiceStatusLog_ST or the source type that is created in step 1a,if different.
4. (Optional) To configure the IBM Tivoli Monitoring Log File Agent to stream IBMPureApp logs to the IBM Operations Analytics - Log Analysis server, see theConfiguring IBM Tivoli Monitoring Log File Agents topic in the IBM TivoliMonitoring Log File Agent configuration scenarios section of Loading and streamingdata in the Configuring IBM Operations Analytics - Log Analysis guide.
IBM PureApp Insight Pack splitter rules:
Splitting describes how IBM Operations Analytics - Log Analysis separatesphysical log file records in to logical records by using a logical boundary such astime stamp or a new line.
The IBM PureApp Insight Pack splits log records on timestamps. For example, inthe following log record the common.query_common_stats job started executing.pooljvm.1436926306560.1178 [07-15-15 03:26:11] 29231 common.query_common_stats |EXECUTING --COMMON STATS STARTED--
IBM PureApp Insight Pack Annotation rules:
After the log records are split, the logical records are sent to the annotation engine.The engine uses rules to extract important pieces of information that are sent to theindexing engine.
The IBM PureApp Job Status Insight Pack annotates the log records based on thefollowing fields:
Table 47. Field and description for IBM PureApp log records.
Field Description
timestamp Time that IBM PureApp generated the logrecord.
ThreadID ThreadID of the job that is running.
ThreadName Name of the Thread that is running.
JobStatus Status of the job.
JobGroup JobGroup
JobType The type of job. for example, system or user.
JobName The name of the job.
ClassName The name of the class.
HostName The host on which IBM PureApp is running.
Details Details of the message that is logged.
The IBM PureApp Service Status Insight Pack annotates the log records based onthe following fields:
184 IBM Operations Analytics - Log Analysis: Installation, Configuration, and Administration Guide

Table 48. Field and description for IBM PureApp log records.
Field Description
Timestamp Time that IBM PureApp generated the logrecord.
ThreadID ThreadID of the job that is running.
ClassName The name of the class.
HostName The host on which IBM PureApp is running.
Details Details of the message that is logged.
ServiceName The name of the service.
ServiceStatus The status of the service.
IBM PureApp Insight Pack dashboard:
You can use the IBM PureApp Insight Pack dashboard example app to visualizedata from IBM PureApp logs.
Use the IBM PureApp Insight Pack dashboard to find jobs and services that wereblocked, failed, stopped, or completed..
The IBM PureApp Job Status Insight Pack app contains the following charts:
Failed jobsPlots a pie that displays the jobs that failed.
Failed jobs trendPlots a histogram that displays the trend of failed jobs over time.
The IBM PureApp Service Status Insight Pack app contains the following charts:
Stopped ServicesPlots a pie that displays the services that stopped.
Stopped service trendPlots a histogram that displays the trend of stopped services over time.
Configuring the IBM PureApp Insight Pack dashboard app:
To use the IBM PureApp Insight Pack dashboard, you must configure the IBMPureApp Insight Pack dashboard app.
Procedure
To configure and customize the IBM PureApp Insight Pack dashboard app,complete the following steps.1. Copy the PureAppJobStatus.app and PureAppServiceStatus.app from the
<HOME>/IBM/LogAnalysis/AppFramework/Apps/PureAppLogInsightPack_<version>directory to a new directory.
2. The dashboard name must be unique. To change the dashboard name, modifythe name parameter.
3. The default log sources that are used by the IBM PureApp Insight Packdashboard app are PureAppJobStatus and PureAppServiceStatus. You mustchange the log source for each chart. To change the log source, modify thelogsources parameter. For example:
Configuring 185

"logsources":[{
"name":"\/PureAppJobStatus""type":"logSource",
}],
4. The default time interval is the last year, and the last number is 1. To changethe time interval for each chart, modify the timefilters parameter. Forexample:"filter": {
"timefilters": {"granularity": "year","lastnum": 1,"type": "relative"
}},
The granularity can be specified as second, minute, hour, day, week, month, oryear.
5. Save the changes. Refresh the Search Dashboards panel on IBM OperationsAnalytics - Log Analysis UI to see the new dashboard.
IBM PureApp Insight Pack References:
Important references for your IBM PureApp Insight Pack.
IBM PureApp documentationhttp://www-01.ibm.com/support/knowledgecenter/SSCR9A_2.1.0/pv_welcome.html?lang=en
Support:
To get support from the IBM support team, you can open a Problem ManagementRecord (PMR).
When you open a PMR to report an Insight Pack specific issue, the followinginformation must be included in the PMR:
Insight Pack and product informationBasic Insight Pack and product information.
Insight Pack nameThe name of the Insight Pack.
Insight Pack versionThe Insight Pack version.
Product nameThe product name.
Product versionThe version of product on which you are using the Insight Pack.
Product log file nameThe product log file name specific to the issue.
Provide details for the issue that you are reporting. For example:v Include sample log files, which are used against this insight pack.v Provide a screen capture of the error message that is generated when you use
the Insight Pack.
186 IBM Operations Analytics - Log Analysis: Installation, Configuration, and Administration Guide

v Describe the specific use case scenarios when the problem occurred while youwere using the Insight Pack.
v Include IBM Operations Analytics - Log Analysis log files, such asGenericReceiver.log, or UnityApplication.log, for the problem window.
IBM Business Process Manager Insight PackUse the IBM Business Process Manager Insight Pack to help you to index andsearch log files that are generated by IBM Business Process Manager.
The Insight Pack supports versions 7.5, 7.5.1, 8.0, 8.0.1, 8.5, 8.5.5, and 8.5.6 of IBMBusiness Process Manager.
You can use it to search and index SystemOut.log log files. You can use theinformation stored in these log files to help you to debug errors in IBM BusinessProcess Manager.Related information:
Tech note for IBM Business Process Manager 8.5
Installing the IBM Business Process Manager Insight Pack:
Before you can use the IBM Business Process Manager Insight Pack, you need toinstall it.
Before you begin
Before you can install this Insight Pack, you need to install the WebSphereApplication Server Insight Pack.
Procedure
1. Save the IBM Business Process Manager Insight Pack archive file,IBMBPMInsightPack_<version>.zip on the server where Log Analysis isinstalled. Extract the file.
2. To install the Insight Pack, run the pkg_mgmt.sh utility:<HOME>/IBM/LogAnalysis/utilities/pkg_mgmt.sh -install<archive_file_path>/IBMBPMInsightPack_<version>.zip
where <archive_file_path> is the directory where you extracted the file to in step1.
What to do next
After you install the Insight Pack, you need to configure it.
Configuring the IBM Business Process Manager Insight Pack:
Before you can index and search log files with the IBM Business Process ManagerInsight Pack, you need to create a data source to monitor the log files. You can alsoconfigure data streaming and configure the time and date formation if you want.
Procedure
1. Create a data source. You need to create a data source with the WASSystemOutsource type.
2. Optional: If you want to stream log data, you need to configure the IBM TivoliMonitoring Log File Agent to stream the data. This step is optional.
Configuring 187

3. Optional: If the time and date format that is used by IBM Business ProcessManager is not the same as the format that is used by the WebSphereApplication Server Insight Pack, you can create a source type and data sourceto correct the difference. To create the source type and data source, completethe following steps to correct this:a. Create a source type. Enter the following properties:
Table 49.
Field or check box User input or action
Name IBMBPM_SysOut
Enable splitter check box Selected
File Set radio button Selected
File Set field WASJavaAnnotator
Enable annotator check box Selected
File Set radio button Selected
Rule Set field WASJavaAnnotator
b. To edit the index configuration, click Edit Index Configuration, Copy theindex configuration from the WASSystemOut source type. Change thetimestamp format to match the one that is in the log files generated by IBMBusiness Process Manager. For example:“timestamp” {“dataType”:“DATE”“retrievable”:true,“dataType”:“Date”“sortable”:“true”“filterable”:“true”“searchable”:“true”“source”:{
“paths”:[“metadata:timestamp”
],“datefromats”:[
“DD/mm/yy HH:mm:SSS Z”]
}
c. Click OK to save the source type.d. Create a data source to monitor the log files that are associated with the
IBMBPM_SysOut source type.Related concepts:“Data Source creation” on page 373You create data sources to ingest data from a specific source.“IBM Tivoli Monitoring Log File Agent configuration scenarios” on page 261You can use the internal IBM Tivoli Monitoring Log File Agent that is installedwith IBM Operations Analytics - Log Analysis or you can use an external IBMTivoli Monitoring Log File Agent to stream data from local or remote servers.“Source Types” on page 376A Source Type defines how data of a particular type is processed by IBMOperations Analytics - Log Analysis. This determines how data is indexed, split,and annotated.
188 IBM Operations Analytics - Log Analysis: Installation, Configuration, and Administration Guide

IBM Business Process Manager Insight Pack dashboard:
Use the dashboard that is included with the IBM Business Process Manager InsightPack to display information based on the logs that are generated by IBM BusinessProcess Manager.
Use this dashboard to identify errors in IBM Business Process Manager. You canalso drill down to find more information about the root causes of issues.
Before you can use the dashboard, you need to configure it.
The dashboard contains the following charts. You can use these charts to monitordata from multiple Java virtual machines.
Infinite loop suspectedDisplays the number of detected and suspected infinite loops.
Error trendDisplay the number of errors that occur.
Hung threadsDisplays the number of hung threads that occur.
Out of memory exceptionsDisplays the number of out of memory exceptions that occur.
Configuring the IBM Business Process Manager Insight Pack dashboard:
After you install the IBM Business Process Manager Insight Pack dashboard, youcan add more log sources or change the default time filter to ensure that thedashboard displays the relevant information for your deployment.
About this task
After you install the Insight Pack, the BPM Error dashboard is available. Thedashboard uses the sample log source, sample__SystemOut_BPM.log, that is alsocreated when you install the Insight Pack. You can add more log sources or changethis log source
The default time interval is last year and the 1 is the default last number.
Procedure
1. To add a log source, edit the BPM_Error.app file. For example, to add a logsource that is called BPM_example.log, add the following code:“logsources”: [
{“name”: “\/sample__SystemOut_BPM.log”,“type”: “logSource”“name”: “\/BPM_example.log”,“type”: “logSource”
}],
2. To change the default time filter, edit the BPM_Error.app file. For example, thefollowing code implements the default time filter:“filter”: {
“timefilters”: {“granularity”: “year”,
Configuring 189

“lastnum”: 1,“type”: “relative”
}},
The granularity can be based on seconds, minutes, hours, days, weeks, months,or a year.To change the time filter to monitor data for the last month, use the followingcode:“filter”: {
“timefilters”: {“granularity”: “month”,“lastnum”: 1,“type”: “relative”
}},
3. Save the BPM_Error.app file.4. To view the updated dashboard, open the Search Dashboards list and click the
Refresh icon.
Uninstalling the IBM Business Process Manager Insight Pack:
To uninstall the IBM Business Process Manager Insight Pack and remove the logsamples, run the following commands.
Procedure
1. To remove the sample log source, run the following command :<HOME>/IBM/LogAnalysis/utilities/pkg_mgmt.sh-uninstall_logsample /IBMBPMInsightPack_<version>
2. To uninstall the Insight Pack, run the following command:<HOME>/IBM/LogAnalysis/utilities/pkg_mgmt.sh-uninstall IBMBPMInsightPack_<version>
Support:
To get support from the IBM support team, you can open a Problem ManagementRecord (PMR).
When you open a PMR to report an Insight Pack specific issue, the followinginformation must be included in the PMR:
Insight Pack and product informationBasic Insight Pack and product information.
Insight Pack nameThe name of the Insight Pack.
Insight Pack versionThe Insight Pack version.
Product nameThe product name.
Product versionThe version of product on which you are using the Insight Pack.
Product log file nameThe product log file name specific to the issue.
190 IBM Operations Analytics - Log Analysis: Installation, Configuration, and Administration Guide

Provide details for the issue that you are reporting. For example:v Include sample log files, which are used against this insight pack.v Provide a screen capture of the error message that is generated when you use
the Insight Pack.v Describe the specific use case scenarios when the problem occurred while you
were using the Insight Pack.v Include IBM Operations Analytics - Log Analysis log files, such as
GenericReceiver.log, or UnityApplication.log, for the problem window.
IBM DataPower Insight PackUse the IBM DataPower Insight Pack to help you to find transaction bottlenecksand issues that are generated in IBM DataPower servers in close to real time.
The IBM DataPower administrator can use this Insight Pack to analyze transactionsand monitor the health of IBM DataPower.
You can use this Insight Pack to analyze two types of log messages:
Default log messagesYou can analyze the default log files from all versions of IBM DataPower.This information can help you to complete the following tasks:v Track message level trends for INFO, DEBUG, and ERROR.v Identify the objects that are generating log messages.v Identify the distribution of log records by Log_Category.v Retrieve all the log records for a transaction.
Extended latency messages log messagesYou can analyze the extended latency messages log messages fromIBMDataPower version 7. This information can help you to complete thefollowing tasks:v Find bottlenecks and analyze issues that are related to transactions.v Estimate the total time that is taken to complete a transaction.v Display the trend of the total time that is taken for all transactions.v Display the distribution of the completion time for each service in a
transaction.v Find slowest service in a transaction.
The IBM DataPower Insight Pack contains two search dashboards to help you tovisualize the information.
IBM DataPower support
For generic log files, all versions of IBM DataPower are supported.
For the extended latency message log files, only IBM DataPower version 7 issupported.
Installing and configuring the IBM DataPower Insight Pack:
About this task
If you want to monitor the extended latency message logs, you need to configurethe extended latency logs in IBM DataPower so that the Target Type is File and theLog Format is CSV.
Configuring 191

Procedure
1. Download and install the IBM DataPower Insight Pack.2. Create two data sources. You need to create one for the generic log messages
and one for the extended message latency log messages, called default_log_dsand extlatency_log_ds. You can use the configuration artifacts that areprovided to help you to do this. The configuration artifacts consist of splitters,annotators, source types, and collections that you can use for these datasources. For more information, see Configuration Artifacts.
3. Change the value that is used for <HOME> in the datapower_app.sh file to matchyour installation. The script is stored in the folder where you installed theInsight Pack, for example <HOME>/IBM/LogAnalysis/AppFramework/Apps/DataPower_<version>. Where <version> is the Insight Pack version number. Forexample, you need to change the following to match your installation:# set home variablesUNITY_HOME=/home/unity/IBM/LogAnalysis
4. Configure data loading. For more information, see the Loading and streamingdata section in the Installation and Administration guide.You can use the following methods to load data:
Batch You can copy a batch of the log messages to the machine where LogAnalysis is installed and load the batch into Log Analysis.
logstashYou can deploy logstash directly on the IBM DataPower appliance.
IBM Tivoli Monitoring Log File AgentYou can install the IBM Tivoli Monitoring Log File Agent on the IBMDataPower appliance monitoring local file or you can use the IBMTivoli Monitoring Log File Agent that is installed on the Log Analysisserver to remotely monitor the log message that is generated by thelocal file.
5. Test your data loading configuration.
What to do next
After you install the IBM DataPower Insight Pack, you can run the custom searchdashboards to view the results.Related concepts:“Downloading an Insight Pack” on page 86You can download extra Insight Packs and upgrade existing Insight Packs.“Configuration artifacts” on page 193Use the configuration artifacts provided to help you to configure the IBMDataPower Insight Pack.“Installing logstash” on page 301Installing logstash on a remote node extends IBM Operations Analytics - LogAnalysis functions so it can ingest and perform metadata searches against log datathat is acquired by logstash.“IBM Tivoli Monitoring Log File Agent configuration scenarios” on page 261You can use the internal IBM Tivoli Monitoring Log File Agent that is installedwith IBM Operations Analytics - Log Analysis or you can use an external IBMTivoli Monitoring Log File Agent to stream data from local or remote servers.“Loading batches of data” on page 292In addition to streaming data directly, you can also load batches of historic data fortest or other purposes.
192 IBM Operations Analytics - Log Analysis: Installation, Configuration, and Administration Guide

Related tasks:“Installing Insight Packs” on page 86Before you can use an Insight Pack, you need to install it.
Configuration artifacts:
Use the configuration artifacts provided to help you to configure the IBMDataPower Insight Pack.
The table below summarizes the configuration artifacts.
Table 50. IBM DataPower Insight Pack configuration artifacts
Configuration artifact type Artifact for default log filesArtifact for ExtendedLatency Message logs
File format Plain text (.txt) Common Separated Variables(CSV)
Splitter NewLineSplitter ExtLatencySplitter
Annotator DefaultLogAnnotator ExtLatencyAnnotator
Source Type DataPower_DefaultLog DataPower_ExtLatency
Collection DefaultLog_Collection1 ExtLatency_Collection1
Search dashboards for IBM DataPower Insight Pack:
You can use the search dashboards that are included with the IBM DataPowerInsight Pack to visualize data that is processed by the Insight Pack.
The IBM DataPower Insight Pack contains two dashboards:
Analysis of default logUse this dashboard to display charts that are related to the default log files.
Analysis of transactionUse this dashboard to display charts that are related to the extendedmemory log files.
Configuring the time filter
Both dashboards are configured by default to filter search results for 1 day. Tochange this setting, edit the filter values in the default.app or the extdlatemcy.appfiles. For example:“filter”: {
“timefilters”: {“granularity”: “day”,“lastnum”: 1,“type”: “relative”
}}
Changing the default data sources
The default data source names that are used by the dashboards are default_log_dsand extlatency_log_ds. If you use another data source name or want to changethe default, edit the logsources property in the default.app or theextdlatemcy.app files. For example:
Configuring 193

“logsources”: [{
“name”: “/extlatency_log_ds”,“type”: “logSource”
}]
Custom Insight PacksYou can use custom Insight Packs to implement customized indexing andannotating.
The process for creating custom Insight Packs is described in the Extension Guideand it is intended for advanced users.
For more information, see the Extending guide.Related concepts:ExtendingThis section describes how to extend the features of IBM Operations Analytics -Log Analysis using the guidance and tools provided.
Configuring alerts
You can use the alert management features of Log Analysis to monitor real-timedata ingestion and trigger events based on specified conditions.
Use the alert management feature to help you to complete the following tasks:v Generate alerts in real time as data is streamed into Log Analysis.v Specify conditions and trigger actions such as sending an email notification,
running a custom script, or logging an alert. You can also specify custom actions.v Detect user specified conditions when the data is streamed into Log Analysis
and trigger custom actions when the conditions are met.v Index the generated alerts for reporting.
Use the Log Analysis user interface (UI) to create, edit, and delete alerts, alertactions, and conditions.
Conditions
To create an alert, you need to define the conditions that trigger the alert action.The types of conditions are summarized in the table:
Table 51. Conditions
Condition Description
Keyword match Use this condition to trigger an alert when akeyword is found in all or only in thespecified data sources. You can enter akeyword or you can enter a search query.
194 IBM Operations Analytics - Log Analysis: Installation, Configuration, and Administration Guide

Table 51. Conditions (continued)
Condition Description
Keyword match based on threshold Use this condition to trigger an alert when aspecified number of keywords or searchresults occur in all or specified data sourcesduring a specified time period. Enter thekeyword or search query, specify thenumber of occurrences that are required totrigger the alert in the time period that youspecify in seconds, minutes, or hours.
Keyword match with de-duplicates Use condition to trigger an alert when akeyword or search query occurs in all or thespecified data sources during the specifiedtime period. If a condition is met, a singlealert is sent. Log Analysis does not sendmultiple, duplicate actions.
Co-Occurence Match Use this condition to trigger an alert when 2or more keywords or query search resultsoccur during the same specified time period.
Anomaly Detection Use this condition to trigger an alert when achange is detected in a specified field in adata source.
Anomaly Detection based on threshold Use this condition to trigger an alert when aspecified value occurs a specified number oftimes in the time period.
Actions
If a condition is met, IBM Operations Analytics - Log Analysis triggers an action.Built-in actions are described in the following table:
Table 52. Alert actions
Action Description
Index Use this action to index any alerts in the_alerts data source. This does not requireany configuration. The _alerts data sourcecontains 3 indexed fields:
conditionNameThe name of the condition.
conditionsDatasourceThe name of the data source whichmet the condition.
timestampThe time that the condition wasmet.
Configuring 195

Table 52. Alert actions (continued)
Action Description
Send Email Use this action to send an email. You canselect a template or enter the sender,receiver, subject prefix and body textmanually. If you want to send the mail tomultiple recipients, you need to separateeach address with a comma.
Before you can use the email action, youneed to configure the <HOME>/wlp/usr/servers/Unity/apps/Unity.war/configs/AlertActionEmailConfig.json file.
Write to Log Use this action to record triggered alerts in aspecific log file. You can select a recentlyviewed log file or you can enter the log pathfile manually. The triggered alerts areupdated every 10 seconds.
Script Use this action to run a script when acondition is met. You can select a recentlyviewed script or you can enter the detailsmanually. You enter the directory where thescript is stored, the directory where thescript is run, and any command lineparameters that need to be passed to thescript when it is run.
SNMP Trap Use this action to send SNMP trap events.You need to specify the following values:
SNMP ServerEnter the host name of the SNMPserver.
SNMP PortEnter the port that is used by theSNMP server.
SNMP VersionDisplays the supported version ofSNMP. This field is read only.Verion 2c is the only supportedversion.
SNMP community stringEnter the community string for theSNMP receiver. The default value is“public”.
SNMP Transport ProtocolSpecify a transport protocol. UDPand TCP are the supportedtransport protocols.
EIF Event Use this action to trigger an EIF event. Youneed to specify the EIF server and port.
Configuring alerts in the Manage Alerts UIUse the Manage Alerts user interface (UI) to create, edit, and delete alerts, alertactions, and conditions.
196 IBM Operations Analytics - Log Analysis: Installation, Configuration, and Administration Guide
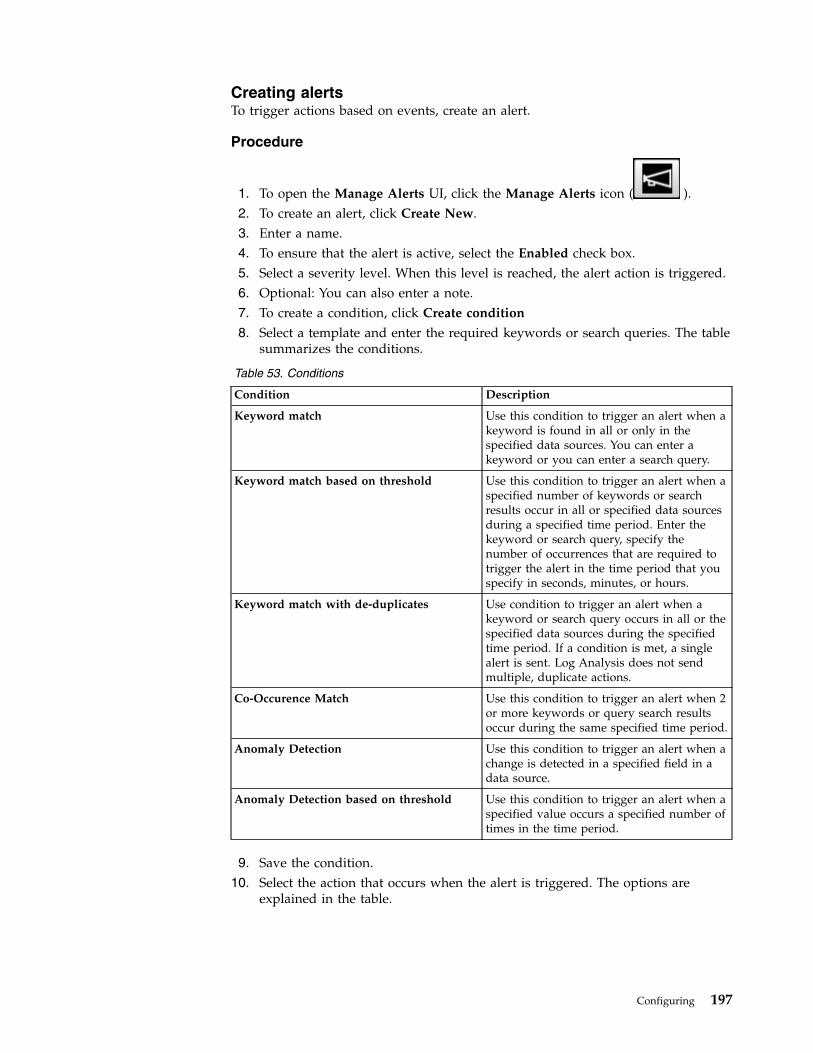
Creating alertsTo trigger actions based on events, create an alert.
Procedure
1. To open the Manage Alerts UI, click the Manage Alerts icon ( ).2. To create an alert, click Create New.3. Enter a name.4. To ensure that the alert is active, select the Enabled check box.5. Select a severity level. When this level is reached, the alert action is triggered.6. Optional: You can also enter a note.7. To create a condition, click Create condition
8. Select a template and enter the required keywords or search queries. The tablesummarizes the conditions.
Table 53. Conditions
Condition Description
Keyword match Use this condition to trigger an alert when akeyword is found in all or only in thespecified data sources. You can enter akeyword or you can enter a search query.
Keyword match based on threshold Use this condition to trigger an alert when aspecified number of keywords or searchresults occur in all or specified data sourcesduring a specified time period. Enter thekeyword or search query, specify thenumber of occurrences that are required totrigger the alert in the time period that youspecify in seconds, minutes, or hours.
Keyword match with de-duplicates Use condition to trigger an alert when akeyword or search query occurs in all or thespecified data sources during the specifiedtime period. If a condition is met, a singlealert is sent. Log Analysis does not sendmultiple, duplicate actions.
Co-Occurence Match Use this condition to trigger an alert when 2or more keywords or query search resultsoccur during the same specified time period.
Anomaly Detection Use this condition to trigger an alert when achange is detected in a specified field in adata source.
Anomaly Detection based on threshold Use this condition to trigger an alert when aspecified value occurs a specified number oftimes in the time period.
9. Save the condition.10. Select the action that occurs when the alert is triggered. The options are
explained in the table.
Configuring 197

Table 54. Alert actions
Action Description
Index Use this action to index any alerts in the_alerts data source. This does not requireany configuration. The _alerts data sourcecontains 3 indexed fields:
conditionNameThe name of the condition.
conditionsDatasourceThe name of the data source whichmet the condition.
timestampThe time that the condition wasmet.
Send Email Use this action to send an email. You canselect a template or enter the sender,receiver, subject prefix and body textmanually. If you want to send the mail tomultiple recipients, you need to separateeach address with a comma.
Before you can use the email action, youneed to configure the <HOME>/wlp/usr/servers/Unity/apps/Unity.war/configs/AlertActionEmailConfig.json file.
Write to Log Use this action to record triggered alerts in aspecific log file. You can select a recentlyviewed log file or you can enter the log pathfile manually. The triggered alerts areupdated every 10 seconds.
Script Use this action to run a script when acondition is met. You can select a recentlyviewed script or you can enter the detailsmanually. You enter the directory where thescript is stored, the directory where thescript is run, and any command lineparameters that need to be passed to thescript when it is run.
198 IBM Operations Analytics - Log Analysis: Installation, Configuration, and Administration Guide

Table 54. Alert actions (continued)
Action Description
SNMP Trap Use this action to send SNMP trap events.You need to specify the following values:
SNMP ServerEnter the host name of the SNMPserver.
SNMP PortEnter the port that is used by theSNMP server.
SNMP VersionDisplays the supported version ofSNMP. This field is read only.Verion 2c is the only supportedversion.
SNMP community stringEnter the community string for theSNMP receiver. The default value is“public”.
SNMP Transport ProtocolSpecify a transport protocol. UDPand TCP are the supportedtransport protocols.
EIF Event Use this action to trigger an EIF event. Youneed to specify the EIF server and port.
11. Click Create.
Manage Alerts UIUse the Manage Alerts user interface (UI) to create, edit, and delete alerts,conditions, and alert actions.
Buttons, fields, and check boxes
Table 55. Buttons, fields and check boxes on the Manage Alerts UI
Button, field or check box Description
Create New Create an alert.
Edit Edit an existing alert.
Delete Delete an existing alert.
Search box Search for an existing alert.
Refresh icon Refresh the results table to include any newalerts.
Columns
Table 56. Columns on the Manager Alerts UI
Column Description
Selection check box Use this check box to select an alert forediting.
Status Indicates whether the alert is active orinactive.
Configuring 199

Table 56. Columns on the Manager Alerts UI (continued)
Column Description
Alert Name The name of the alert.
Severity The level of severity.
Author The person who created the alert actiontemplate.
Condition Template The condition template that is used by thealert.
Actions The actions that are triggered by the alert.
Alerts editor
Table 57. Fields and check box on the Alerts editor
Fields and check box Description
Alert Name Enter a name for the alert.
Last Modified The time and date when the alert was lastmodified. This field is read only.
Enabled check box To deactivate the alert, clear this check box.
Severity Select the severity level of the alert.
Author The user who created the alert. This field isread only.
Notes Enter any notes that you want to add.
Conditions editor
Table 58. Conditions
Condition Description
Keyword match Use this condition to trigger an alert when akeyword is found in all or only in thespecified data sources. You can enter akeyword or you can enter a search query.
Keyword match based on threshold Use this condition to trigger an alert when aspecified number of keywords or searchresults occur in all or specified data sourcesduring a specified time period. Enter thekeyword or search query, specify thenumber of occurrences that are required totrigger the alert in the time period that youspecify in seconds, minutes, or hours.
Keyword match with de-duplicates Use condition to trigger an alert when akeyword or search query occurs in all or thespecified data sources during the specifiedtime period. If a condition is met, a singlealert is sent. Log Analysis does not sendmultiple, duplicate actions.
Co-Occurence Match Use this condition to trigger an alert when 2or more keywords or query search resultsoccur during the same specified time period.
200 IBM Operations Analytics - Log Analysis: Installation, Configuration, and Administration Guide

Table 58. Conditions (continued)
Condition Description
Anomaly Detection Use this condition to trigger an alert when achange is detected in a specified field in adata source.
Anomaly Detection based on threshold Use this condition to trigger an alert when aspecified value occurs a specified number oftimes in the time period.
Alert actions editor
Table 59. Alert actions
Action Description
Index Use this action to index any alerts in the_alerts data source. This does not requireany configuration. The _alerts data sourcecontains 3 indexed fields:
conditionNameThe name of the condition.
conditionsDatasourceThe name of the data source whichmet the condition.
timestampThe time that the condition wasmet.
Send Email Use this action to send an email. You canselect a template or enter the sender,receiver, subject prefix and body textmanually. If you want to send the mail tomultiple recipients, you need to separateeach address with a comma.
Before you can use the email action, youneed to configure the <HOME>/wlp/usr/servers/Unity/apps/Unity.war/configs/AlertActionEmailConfig.json file.
Write to Log Use this action to record triggered alerts in aspecific log file. You can select a recentlyviewed log file or you can enter the log pathfile manually. The triggered alerts areupdated every 10 seconds.
Script Use this action to run a script when acondition is met. You can select a recentlyviewed script or you can enter the detailsmanually. You enter the directory where thescript is stored, the directory where thescript is run, and any command lineparameters that need to be passed to thescript when it is run.
Configuring 201

Table 59. Alert actions (continued)
Action Description
SNMP Trap Use this action to send SNMP trap events.You need to specify the following values:
SNMP ServerEnter the host name of the SNMPserver.
SNMP PortEnter the port that is used by theSNMP server.
SNMP VersionDisplays the supported version ofSNMP. This field is read only.Verion 2c is the only supportedversion.
SNMP community stringEnter the community string for theSNMP receiver. The default value is“public”.
SNMP Transport ProtocolSpecify a transport protocol. UDPand TCP are the supportedtransport protocols.
EIF Event Use this action to trigger an EIF event. Youneed to specify the EIF server and port.
Configuring alerts for SNMP and EIF eventsYou can configure Log Analysis to send alerts as EIF events or SNMP traps to IBMTivoli Netcool/OMNIbus.
Supported versions
You need to install IBM Tivoli Netcool/OMNIbus 8.1. Log Analysis does notinclude IBM Tivoli Netcool/OMNIbus or any of its components. You need toinstall IBM Tivoli Netcool/OMNIbus independently.
For SNMP traps, version 2 c is supported.
Prerequisites
Before you can configure this feature, you need to install IBM TivoliNetcool/OMNIbus 8.1 on a server that the Log Analysis can connect to.
Before you start the configuration, you need to copy these three files to IBM TivoliNetcool/OMNIbus:v tivoli_eif_la.rules
v mttrapd_la.rules
v ioa-la.mib
Configuring IBM Tivoli Netcool/OMNIbusYou must configure IBM Tivoli Netcool/OMNIbus so that it can receive the EIFevents or SNMP traps that Log Analysis sends it.
202 IBM Operations Analytics - Log Analysis: Installation, Configuration, and Administration Guide

Procedure1. Log in to IBM Tivoli Netcool/OMNIbus and select either EIF Events or SNMP
Traps for the protocol.2. If you want to use EIF Events, complete the following steps:
a. Install the IBM Tivoli Netcool/OMNIbus EIF Probe. For more information,see IBM Tivoli Netcool/OMNIbus Probe for Tivoli EIF.
b. Copy the tivoli_eif_la.rules file to the IBM Tivoli Netcool/OMNIbusserver.
c. Configure the EIF Probe to send and receive EIF events from Log Analysis.The location for default probe rules and properties files in an OMNIbusinstallation is <OMNIBUS_HOME>/probes, in a platform specific sub directory.For example, for an x86 Linux installation, the location is<OMNIBUS_HOME>/probes/linux2x86:1) Copy the default EIF props file, tivoli_eif.props, from the platform
specific directory to a Log Analysis properties file, for exampletivoli_eif_la.props.
2) Remove the comments and specify values for the following properties:
RulesFileSpecify the directory where you copied the rules file in step 2.b.
PortNumberSpecify the port that the EIF probe will use to listen to LogAnalysis. This information is required to facilitate the alertactions in Log Analysis.
MessageLevelThis is optional. Set this property to debug' to log additionaldebugging information.
MessageLogThis is optional. You can specify a log file for the EIF probe. Thedefault is <OMNIBUS_HOME>/log/tivoli_eif.log.
3) To start the EIF Probe, enter the following command:<OMNIBUS_HOME>/probes/nco_p_tivoli_eif -propsfile <path>/tivoli_eif_la.props
3. If you want to use SNMP Traps, complete the following steps:a. Install the IBM Tivoli Netcool/OMNIbus SNMP Probe. For more
information, see IBM Tivoli Netcool/OMNIbus SNMP Probe.b. Copy the mttrapd_la.rules file to the IBM Tivoli Netcool/OMNIbus server.c. Configure the SNMP Probe to send and receive SNMP Traps from Log
Analysis. The location for default probe rules and properties files in anOMNIbus installation is <OMNIBUS_HOME>/probes, in a platform specific subdirectory. For example, for an x86 Linux installation, the location is<OMNIBUS_HOME>/probes/linux2x86:1) Copy the default EIF props file, mttrapd.props, from the platform
specific directory to a Log Analysis properties file, for examplemttrapd_la.props.
2) Remove the comments and specify values for the following properties:
RulesFileSpecify the directory where you copied the rules file in step 3.b.
Configuring 203

PortNumberSpecify the port that the SNMP Probe will use to listen to LogAnalysis. This information is required to facilitate the alertactions in Log Analysis.
ProtocolSpecify the protocol that the SNMP Probe uses. You can specifyUDP or TCP. The default value is UDP.
MessageLevelThis is optional. Set this property to debug' to log additionaldebugging information.
MessageLogThis is optional. You can specify a log file for the SNMP Probe.The default is <OMNIBUS_HOME>/log/mttrapd.log.
3) To start the SNMP Probe, enter the following command:<OMNIBUS_HOME>/probes/nco_p_mttrapd -propsfile <path>/mttrapd_la.props
What to do next
After you complete the configuration in IBM Tivoli Netcool/OMNIbus, you needto configure the alerts.
Configuring alerts for EIF Events and SNMP TrapsBefore you can trigger alerts for EIF Events and SNMP Traps, you need to createthe alert actions in Log Analysis,
About this task
You must install your chosen Probe and complete the required configuration inIBM Tivoli Netcool/OMNIbus before you create the alerts.
Procedure1. Open the Manage Alerts UI and create an alert for EIF Events or SNMP Traps.2. If you are using EIF Events, you need to specify the host name of the IBM
Tivoli Netcool/OMNIbus server and the port number used by the EIF Probe.3. If you are using SNMP Traps, you need to specify the following values:v Host name of the IBM Tivoli Netcool/OMNIbus server,v SNMP Probe port numberv SNMP community string. The default is “public”v Transport protocol. The default is “udp”
Related tasks:“Creating alerts” on page 197To trigger actions based on events, create an alert.
EIF Event structureThe EIF Event contains structured information that is sent to IBM TivoliNetcool/OMNIbus.
The EIF Event is structured as follows:"source": "IBM_Operational_Analytics_Log_Analysis"
"origin": // hostname/ip-address of IBM Operations Analytics - Log Analysis server
204 IBM Operations Analytics - Log Analysis: Installation, Configuration, and Administration Guide

"event": "IOA_LA_<alert-type>_Alert"
"alertName": // name of the alert
"alertType": "KEYWORD_MATCH"/"KEYWORD_MATCH_THRESHOLD"/"KEYWORD_MATCH_DEDUP""ANOMALY_MATCH"/"ANOMALY_MATCH_THRESHOLD"/"CO_OCCURRENCE"
"description": // description of the alert
"datasources": // list of associated datasources as a JSON array
"timestamp": // epoch (long) timestamp for the alert
"severity": 1/2/3/4 (critical/error/warning/info)
The EIF Event also contains specific fields for different alert types in the alertTypeparameter:
KEYWORD_MATCH"searchQuery": // query that triggered the alert"alertLogRecord": // log record that triggered the alert
KEYWORD_MATCH_THRESHOLD"windowStartTimestamp": // epoch (long) timestamp of the first log record that matched
// the seqrch query"threshold": // the number of log records that matched the search query"windowDuration": // duration of the alert window in seconds, minutes or hours e.g. 3s/7m/2h
KEYWORD_MATCH_DEDUP"windowDuration": //duration of the de-duplication window in seconds, minutes or hours e.g. 3s/7m/2h
ANOMALY_MATCH"fieldName": // name of the field for which a new value was observed"fieldValue": // new field value that was observed"alertLogRecord": // log record containing the new field value
ANOMALY_MATCH_THRESHOLD"windowStartTimestamp": // epoch (long) timestamp of the first log record that contained
// a new field value"threshold": // the number of new field value that were observed"windowDuration": // duration of the alert window in seconds, minutes or hours e.g. 3s/7m/2h
CO_OCCURRENCE"windowStartTimestamp": // epoch (long) timestamp of the first detected event"windowDuration": // duration of the alert window in seconds, minutes or hours e.g. 3s/7m/2h
For example, this EIF Event is sent for KEYWORD_MATCH alert type and a severity 2warning:event: IOA_LA_KEYWORD_MATCH_Alert
source: IBM_Operational_Analytics_Log_AnalysisalertName: ’was-severity-error/was1/0’alertType: ’KEYWORD_MATCH’description: ’WAS error condition’severity: 2datasources: ’["was1"]’alertLogRecord=’[09/1/15 13:27:23:964 GMT+05:30] 00000010 TraceResponse E DSRA1120E: Applicationdid not explicitly close all handles to this Connection. Connection cannot be pooled.’;timestamp=1441094243964origin=’<ioala-server-fqdn>/<ioala-server-ip-address>’searchQuery: ’severity:E’
SNMP Trap structureThe SNMP Trap contains structured information that is sent to IBM TivoliNetcool/OMNIbus.
Configuring 205

Log Analysis traps are assigned the 1.3.6.1.4.1.2.6.258 OID. All the SNMP traps thatare sent from Log Analysis specifies an OID that this OID as a prefix. Everyvariable that is sent in a trap contains this OID as the prefix for the variable name.
The structure of the SNMP Trap is:"1.3.6.1.6.3.1.1.4.1.0": // Alert OID
// "1.3.6.1.4.1.2.6.258.0.1" (KEYWORD_MATCH)// "1.3.6.1.4.1.2.6.258.0.2" (KEYWORD_MATCH_THRESHOLD)// "1.3.6.1.4.1.2.6.258.0.3" (KEYWORD_MATCH_DEDUP)// "1.3.6.1.4.1.2.6.258.0.4" (ANOMALY_MATCH)// "1.3.6.1.4.1.2.6.258.0.5" (ANOMALY_MATCH_THRESHOLD)// "1.3.6.1.4.1.2.6.258.0.6" (CO_OCCURRENCE)
"1.3.6.1.4.1.2.6.258.1.1": // name of the alert"1.3.6.1.4.1.2.6.258.1.2": // description of the alert"1.3.6.1.4.1.2.6.258.1.3": 1/2/3/4 // alert severity (critical/error/warning/info)"1.3.6.1.4.1.2.6.258.1.4": // list of associated datasources as a JSON array"1.3.6.1.4.1.2.6.258.1.5": // epoch (long) timestamp for the alert
The SNMP Trap also contains specific fields for each alert type:KEYWORD_MATCH"1.3.6.1.4.1.2.6.258.1.6": // log record that triggered the alert"1.3.6.1.4.1.2.6.258.1.8": // query that triggered the alert
KEYWORD_MATCH_THRESHOLD"1.3.6.1.4.1.2.6.258.1.11": // duration of the alert window in seconds, minutes or hours e.g. 3s/7m/2h"1.3.6.1.4.1.2.6.258.1.12": // the number of log records that matched the search query"1.3.6.1.4.1.2.6.258.1.13": // epoch (long) timestamp of the first log record that matched
// the seqrch query
KEYWORD_MATCH_DEDUP"1.3.6.1.4.1.2.6.258.1.11": //duration of the de-duplication window in seconds, minutes or hours e.g. 3s/7m/2h
ANOMALY_MATCH"1.3.6.1.4.1.2.6.258.1.6": // log record containing the new field value"1.3.6.1.4.1.2.6.258.1.9": // Name of the field for which a new value was observed"1.3.6.1.4.1.2.6.258.1.10": // New field value that was observed
ANOMALY_MATCH_THRESHOLD"1.3.6.1.4.1.2.6.258.1.11": // duration of the alert window in seconds, minutes or hours e.g. 3s/7m/2h"1.3.6.1.4.1.2.6.258.1.12": // the number of new field value that were observed"1.3.6.1.4.1.2.6.258.1.13": // epoch (long) timestamp of the first log record that contained
// a new field value
CO_OCCURRENCE"1.3.6.1.4.1.2.6.258.1.11": // duration of the alert window in seconds, minutes or hours e.g. 3s/7m/2h"1.3.6.1.4.1.2.6.258.1.13": // epoch (long) timestamp of the first detected event
For example, the following SNMP event is sent for a KEYWORD_MATCH alert with aseverity 2 error:
1.3.6.1.6.3.1.1.4.1.0: 1.3.6.1.4.1.2.6.258.0.11.3.6.1.4.1.2.6.258.1.1: was-severity-error/was1/01.3.6.1.4.1.2.6.258.1.2: WAS error condition1.3.6.1.4.1.2.6.258.1.3 = 21.3.6.1.4.1.2.6.258.1.4 = [was1]1.3.6.1.4.1.2.6.258.1.5 = 14410942439641.3.6.1.4.1.2.6.258.1.6 = [09/1/15 13:27:23:964 GMT+05:30] 00000010 TraceResponse E DSRA1120E: Applicationdid not explicitly close all handles to this Connection. Connection cannot be pooled.1.3.6.1.4.1.2.6.258.1.8 = severity:E
SNMP MIBThe complete MIB definition for alerts that are generated by Log Analysis arestored in the ioa-la.mib file.
206 IBM Operations Analytics - Log Analysis: Installation, Configuration, and Administration Guide

The Log Analysis MIB module, ioaLaMIB, uses the 1.3.6.1.4.1.2.6.258 OID in theMIB hierarchy.
All the alert notifications and corresponding information from Log Analysis usesthe 1.3.6.1.4.1.2.6.258 OID as a prefix.
The Log Analysis MIB contains six notification types, one for each alert type that isdefined in Log Analysis. The notification types are:
ioaLaKeywordMatchAlert (OID 1.3.6.1.4.1.2.6.258.0.1)This notification is generated when a keyword match occurs on a logrecord.
ioaLaKeywordMatchThresholdAlert (OID 1.3.6.1.4.1.2.6.258.0.2)This notification is generated when a keyword match occurs on log recordsmultiple times within a specified duration.
ioaLaKeywordMatchDedupAlert (OID 1.3.6.1.4.1.2.6.258.0.3)This notification is generated the first time a keyword match occurs on alog record within a specific time window. Subsequent matches within thewindow are ignored.
ioaLaAnomalyMatchAlert (OID 1.3.6.1.4.1.2.6.258.0.4)This notification is generated when a new field value is seen for adatasource within a specific time period.
ioaLaAnomalyMatchThresholdAlert (OID 1.3.6.1.4.1.2.6.258.0.5)This notification is generated when multiple new field values are seen for adatasource within a specific time period.
ioaLaCoOccurrenceAlert (OID 1.3.6.1.4.1.2.6.258.0.6)This notification is generated when multiple conditions are seen across oneor more datacources within a specific time window.
Associated with each of these notification types, is a set of objects that providedetailed information about the notification. Some occur in all notifications, whileothers are specific to a notification type.
The objects in a Log Analysis notification are:- ioaLaAlertName (OID 1.3.6.1.4.1.2.6.258.1.1)- ioaLaAlertDescription (OID 1.3.6.1.4.1.2.6.258.1.2)- ioaLaAlertSeverity (OID 1.3.6.1.4.1.2.6.258.1.3)- ioaLaAlertDatasources (OID 1.3.6.1.4.1.2.6.258.1.4)- ioaLaAlertTimestamp (OID 1.3.6.1.4.1.2.6.258.1.5)- ioaLaAlertLogRecord (OID 1.3.6.1.4.1.2.6.258.1.6)- ioaLaAlertLogRecordAnnotations (OID 1.3.6.1.4.1.2.6.258.1.7)- ioaLaAlertSearchQuery (OID 1.3.6.1.4.1.2.6.258.1.8)- ioaLaAlertFieldName (OID 1.3.6.1.4.1.2.6.258.1.9)- ioaLaAlertFieldValue (OID 1.3.6.1.4.1.2.6.258.1.10)- ioaLaAlertWindowDuration (OID 1.3.6.1.4.1.2.6.258.1.11)- ioaLaAlertThreshold (OID 1.3.6.1.4.1.2.6.258.1.12)- ioaLaAlertWindowStartTimestamp (OID 1.3.6.1.4.1.2.6.258.1.13)
Configuring email alert actionsBefore you can use the email alert action, you need to specify the Simple MailTransfer Protocol (SMTP) server host name in Log Analysis.
About this task
The email alert action feature is compatible with normal and secure SMTP servers.
Configuring 207

Procedure1. Open the <HOME>/IBM/LogAnalysis/wlp/usr/servers/Unity/apps/Unity.war/
configs/AlertActionEmailConfig.json file.2. Specify the email properties. These properties are outlined in the following
table.
Table 60. Email configuration properties
Property name Description Value
secure Decide whether you want touse secure SMTP or not.
Boolean
smtpMailServer Specify the SMTP server'shost name.
String
mailServerUser User name that is used forauthentication with the mailserver.
String
mailServerPassword Password for the user that isused for authentication withthe mail server.
String
footer Text that is added to the endof each email,
String
cc Email addresses that arecopied on each email.Recipients can view theseaddresses in the final mail.
String
bcc Email addresses that arecopied on each email.Recipients cannot view theseaddresses in the final mail.
String
attachLogRecordAnnotations Decide whether to attach thelog file record that triggeredthe alert.
Boolean
If you want to use encrypted passwords, you can use theunity_securityUtility.sh script to generate an encrypted password.
3. Save the file.
Example
Here is an example configuration:{“smtpMailServer”:“mail-server-host-name”,“secure”:true,“mailServerUser” : “[email protected]”,“mailServerPassword” : “encrypted_pwd”}
Related concepts:“unity_securityUtility.sh command” on page 234You can use the unity_securityUtility.sh command to change the password thatthe Data Collector and EIF Receiver use to connect to IBM Operations Analytics -Log Analysis.
208 IBM Operations Analytics - Log Analysis: Installation, Configuration, and Administration Guide

Example email alertThe email here is an example of one sent by the email alert action feature. Thesender, receiver, subject prefix and body text that are specified in the alert actionconfiguration.Dear User,Alert condition d1-severity was triggered at time 2015-01-09T16:45:00.000Z for thedatasource(s) d1.
The following log record caused the alert condition to trigger:[01/9/15 11:45:00:000 -0500]00000010 TraceResponse E DSRA1120E: Application2 did not explicitly close all handles tothis connection. Connection cannot be pooled.
*** This is a system generated e-mail, please do not reply to this e-mail ***
Configuring auditingYou can use the auditing features of IBM Operations Analytics - Log Analysis totrack activities to provide fact analysis and actively monitor user activities.
The IBM Operations Analytics - Log Analysis auditing feature is installed andenabled by default.
The audit data is stored in the audit.log file in the <HOME>/IBM/LogAnalysis/logs directory, and in the Indexing Engine index.
IBM Operations Analytics - Log Analysis
supports auditing of the following processes:v Access (login/logout)v Authorization (user/role/permission management)v Ingestionv Searchv Alerts
Audit parametersThe auditing feature is enabled by default. The administrator can modify thedefault parameters after installation if required.
The unitysetup.properties file is in the <HOME>/IBM/LogAnalysis/wlp/usr/servers/Unity/apps/Unity.war/WEB-INF folder. The administrator can edit valuesfor the parameters in table 1, if required.
Table 61. Audit unitysetup.properties
Parameters Value
AUDIT_ACTIONS= Specifies where the audit data is stored. Thedefault value is LOG,INDEX. These values arethe only supported values and are enabledby default.
AUDIT_INTERVAL= Defines how frequently the audit data iswritten. The default value is 120000milliseconds.
Configuring 209

The audit data is written in JSON format to the <HOME>/IBM/LogAnalysis/logs/audit.log file. The audit file is a rolling file, supporting up to 20, 50-MB files bydefault.
The default file properties are in the log4j.properties file in <HOME>/IBM/LogAnalysis/wlp/usr/servers/Unity/apps/Unity.war/WEB-INF/classes/ directory.
Note: If you change any of the audit parameters, you must save your changes andrestart IBM Operations Analytics - Log Analysis.
Viewing the audit fileThe audit file is a rolling file that can be accessed and searched at any time in theaudit.log file or searched on the Indexing Engine console.
About this task
The audit feature of IBM Operations Analytics - Log Analysis is enabled bydefault, and records audit data at specified intervals. For information about themodifying the default parameters, see the Audit parameters topic in the ConfiguringAuditing section of the Configuration guide.
Procedure
To view the audit data, open the audit.log file in the <HOME>/IBM/LogAnalysis/logs directory.The audit data is written in JSON format to the <HOME>/IBM/LogAnalysis/logs/audit.log file.
Configuring Expert Advice Custom Search DashboardYou can use the Expert Advice Custom Search Dashboard to search a knowledgesource for terms that occur in log entries.
You can use the default version of the Expert Advice Custom Search Dashboard.This version searches the IBM Support portal for the terms that are contained inselected columns. You can customize this version of the Expert Advice CustomSearch Dashboard to suit your needs. See “Customizing the default Expert Advicecustom Custom Search Dashboard.”
You can also implement your own version of the Expert Advice Custom SearchDashboard. You can also customize this version so that it searches a knowledgebase other than the IBM support portal.
For more information, see “Configuring a custom Expert Advice app” on page 212.
Customizing the default Expert Advice custom Custom SearchDashboard
You can use the default implementation of the Expert Advice Custom SearchDashboard to search the IBM Support portal for the terms that are contained inselected columns. You can also configure the Expert Advice Custom SearchDashboard settings to suits your needs.
The Expert Advice Custom Search Dashboard that is used to provide expert adviceis in the <HOME>/AppFramework/Apps/ directory where <HOME> is the directory in
210 IBM Operations Analytics - Log Analysis: Installation, Configuration, and Administration Guide

which IBM Operations Analytics - Log Analysis is installed. The Expert AdviceCustom Search Dashboard is named IBMSupportPortal-ExpertAdvice.app.
Displaying more results
By default, the 10 most relevant results are displayed. To change this value, openthe Expert Advice Custom Search Dashboard file and edit the number of displayeditems. This setting is determined by the value parameter. To edit this parameter,open the Expert Advice Custom Search Dashboard file and edit the valueparameter:{"name": "__MAX_RESULTS","value" : "10","type" : "String"},
Note: Increasing this value might affect the performance of the Expert AdviceCustom Search Dashboard as the additional data must be collected before it can bedisplayed.
Increasing the number of search terms
You can configure the number of unique terms that can be accepted for a search.By default, the number of unique terms is set to 7. To edit this parameter, open theExpert Advice Custom Search Dashboard file and edit the value parameter:{"name": "__TERM_LIMIT","value" : "7","type" : "String"},
Enhancing search strings
To ensure that a search return results, the Expert Advice Custom Search Dashboardremoves content from the search term that is unlikely to return results. Forexample, a log message that contains the search string unable to access jarfile/myMachine/foo/bar/foobar.jar is not likely to return a specific match as theserver path is likely to be specific to a user. To ensure better search results, theExpert Advice Custom Search Dashboard abbreviates this to unable to accessjarfile.
The Expert Advice Custom Search Dashboard uses a set of criteria to amend thesearch string. The following values that are removed:v URLv File namev File pathv IP addressv Numberv Punctuation
These values are specified as regular expression patterns in JavaScript ObjectNotation (JSON) format in the GeneralizerPatterns_1.0.json file. This file is thedictionary of pattern definitions. To add more patterns or to edit the existingpatterns, edit this file.
Configuring 211

The set of patterns that are applied to the input data are specified in the ExpertAdvice Custom Search Dashboard file. To apply the new pattern definitions thatyou created in the GeneralizerPatterns_1.0.json file, or to remove some of thepatterns that are being applied, edit:{"name": "__DEFAULT_GENERALIZATION","value" : ["URL", "FILENAME","FILEPATH", "IP", "NUMBER", "PUNCTUATION" ],"type" : "StringArray"},
The order in which the patterns are specified in the __DEFAULT_GENERALIZATIONparameter is the order in which they are applied to the data. Ensure that the orderis correct. For example, IP must be matched before the NUMBER value. Otherwise,the IP pattern is not matched.
Debugging
The Expert Advice Custom Search Dashboard generates a number of debugmessages that provide information about the execution flow and Expert AdviceCustom Search Dashboard status. These messages are not displayed by default. Toenable displaying these messages, set the following parameter to true:{"name": "__DEBUG","value" : "false","type" : "String"},
The Expert Advice Custom Search Dashboard supports two levels of debugging.Level 1 displays only the most important messages and Level 2 displays allmessages. To set this level, edit the value parameter in this section of the file:{"name": "__LOGLEVEL","value" : "2","type" : "String"}
Configuring a custom Expert Advice appTo implement a custom version of the Expert Advice app that uses a knowledgesource other than the IBM support portal, you must create a new searcher.
Procedure1. Create a search wrapper code for your customized knowledge source. The
wrapper code must contain implementations of the Searcher, SearchPage, andHit interfaces. For details about each interface, see “Searcher interface” on page213, “SearchPage interface” on page 214, and “Hit interface” on page 214.
2. Save the search wrapper code as a Java Archive file.3. Specify the path to this Java Archive file in the __SEARCH_CONNECTOR_JAR
parameter in the Expert Advice app file. For example:{"name": "__SEARCH_CONNECTOR_JAR","value" : "ExampleConnector.jar","type" : "String"},
4. The search wrapper code must implement a searcher interface. Specify the classthat implements the interface in __SEARCH_CONNECTOR_CLASS parameter in theExpert Advice app file. For example:
212 IBM Operations Analytics - Log Analysis: Installation, Configuration, and Administration Guide

{"name": "__SEARCH_CONNECTOR_CLASS","value" : "com.foo.bar.connector.example.ExampleSearcher","type" : "String"},
For more information about the Searcher interface, see “Searcher interface.”5. If you want to pass arguments to the search wrapper code, specify the
arguments in the __SEARCH_CONNECTOR_ARGS parameter in the Expert Advice appfile. For example:{"name": "__SEARCH_CONNECTOR_ARGS","value" : ["foo", "bar"],"type" : "String"},
6. If your search wrapper requires more Java Archive files, you must add thepaths for these files to the Java class path in the ExpertAdvice.sh file.
Searcher interfaceThe Searcher interface is the main interface that the search wrapper mustimplement.
The basic function of the wrapper as implemented by the Searcher interface can besummarized as follows:1. Accepts a query.2. Run the query against the specified knowledge source.3. Return the query results.
The interface is defined as follows:package com.ibm.tivoli.unity.loganalytics.knowledgeSource;public interface Searcher {
public void init(String[] args) throws Exception;public SearchPage issue(String query) throws Exception;public SearchPage issue(QueryLevel<String> query) throws Exception;
}
Methods
The interface contains the following methods:
init(String[] args)
Expert advice dynamically loads the Java Archive file that is specified inthe app file. It then creates an instance of the class that implements theSearcher interface that is also specified in the app file. You must ensurethat an empty constructor exists for this class. After the Expert Advice appcreates an instance of the class, it calls the init() method of that instancealong with the arguments that are specified in the app file. You can use theinit() method to specify any initialization that requires externalarguments.
issue(String query)
Use this method to run a simple query against the knowledge source.Billing error is an example of a simple input query. The output object mustbe a class that implements the SearchPage interface. For more informationabout the SearchPage interface, see “SearchPage interface” on page 214
issue(QueryLevel<String> query)
Configuring 213

Use this method to run a structured query against the knowledge source.The QueryLevel structured query object encapsulates the query levels ororder. The output object must be a class that implements the SearchPageinterface.
SearchPage interfaceThe SearchPage interface represents the set of ordered results that are returned bythe query from the knowledge source.
This interface is defined as:package com.ibm.tivoli.unity.loganalytics.knowledgeSource;public interface SearchPage {
public String getUserQuery();public String getProcessingTime();public long getTotalResults();public long getStartIndex();public long getNumResults();public List<Hit> getHits();
}
Methods
This interface has the following methods:
getProcessingTime()
The processing time as reported by the search system. This method is notparsed into any numeric format and is for display purposes only.
getTotalResults()
The total number of available results as reported by the search system. It isonly for display purposes.
getStartIndex()
The start index value for the first result in the search page. For example, ifthe query returns 100 results and the wrapper reads 10 pages at a time, themethod returns a value of 0 and the page contains results 0 to 9. The nextsearch page, the method returns a value of 10 and the page contains results10 to 19.
getNumResults()
The number of results that are available for the search page.
getHits()
The ranked list of results for the search page. Each result entry must be aclass that implements the Hit interface. For more information about the Hitinterface, see “Hit interface.”
Hit interfaceThe Hit interface represents a single result object.
This interface is defined as:package com.foo.bar.example.loganalytics.knowledgeSource;
public interface Hit {public int getOrdinalNum();
214 IBM Operations Analytics - Log Analysis: Installation, Configuration, and Administration Guide

public String getTitle();public String getUrl();public String getSummary();
}
Methods
This interface contains the following methods:
getOrdinalNumber()The ordinal number of this result that is used on the parent search page.
getTitle()The title of the result page. The title is used as the anchor text when resultsare displayed on the Expert Advice search results page.
getUrl()The URL of the result page. The url is used to generate the links that aredisplayed on the Expert Advice search results page.
Additional classesWhen it interacts with the Expert Advice code, the wrapper code can refer to twoclasses, QueryLevel and ItemSet.
QueryLevel
The app generates a series of queries that are based on the set of columns that theuser specifies. The precision of the queries varies and the queries are ordered toreflect the precision of the results. The order is such that a query at a higher-levelyields more accurate results that a lower-level query. The QueryLevel class capturesthe ordering of the queries. Some queries can yield results with the same level ofprecision without yielding the same results. The QueryLevel class can contain morethan one query for this reason.
This class is defined as:package foo.bar.example.loganalytics.artifacts;public class QueryLevel<T> extends ArrayList<ItemSet<T>>
Each ItemSet object that is contained in a QueryLevel object represents a group ofterms that must all occur on the same page. You must use an AND query for theseterms.
If there is more than one ItemSet object in a QueryLevel object, you must use anOR query to separate the individual AND queries. For example:(ItemSet_1_Term_1 AND ItemSet_1_Term_2) OR (ItemSet_2_Term_1 AND ItemSet_2_Term_2)
The syntax that specifies the AND and OR logic is specific to the knowledgesource and is handled by the wrapper code.
ItemSet
The ItemSet class represents a single group of terms that must all occur in thesame results page. You must use an AND query for this class.
This class is defined as:package foo.bar.example.loganalytics.partialorder;public class ItemSet<T> extends HashSet<T>
Configuring 215

Configuring launch in contextYou can launch IBM Operations Analytics - Log Analysis in context from within anapproved IBM product with the Search UI or Custom Search Dashboard.
Search UI launch-in-contextYou can use the Search UI to launch IBM Operations Analytics - Log Analysis incontext from within other products.
To start IBM Operations Analytics - Log Analysis in context using the Search UI,you must specify a URL in the following format:https://<hostname>:<port>/Unity/SearchUI?queryString=<q>&timefilter=<t>&dataSources=<ds>
where:
hostnameThe host name that corresponds to the data source.
port The port that is used for communication with the IBM OperationsAnalytics - Log Analysis web application.
q The value of the search string with a valid velocity query syntax.
t A JSON format file filter to specify absolute or relative time.
For example, absolute time filters include "startTime": "24/206/201305:30:00" and "endTime": "25/06/2013 05:30:00". Relative time filtersinclude "granularity": "Day" and "lastnum": "7".
ds A JSON file format to specify single or group data sources to be queried.
In this example, the user uses the Search UI to launch IBM Operations Analytics -Log Analysis.https://0.000.00.00:1111/Unity/SearchUI?queryString=severity:=="Critical"&timefilter={“type”:“relative”,“lastnum”:“7”,“granularity”: “Day”}&dataSources=[{ "type": "datasource", "name": <omnibusEvents>}]
Custom Search Dashboard launch-in-contextYou can launch IBM Operations Analytics - Log Analysis Custom SearchDashboards in context from within other products.
To start IBM Operations Analytics - Log Analysisin context, use the following URL:https://<ip_address>:<port>:/Unity/CustomAppsUI?name=<name>&appParameters=<params>
where:
url The URL format that you specify must be in the format:https://<ip_address>:<port>:/Unity/CustomAppsUI?name=<name>&appParameters=<params>
ip_addressThe IP address of the server on which IBM Operations Analytics - LogAnalysis is installed.
port The port that is used for communication with the IBM OperationsAnalytics - Log Analysis web application.
name Specify the name of the application file. This is the name of the .app filethat displays in the Custom Search Dashboards pane in the Searchworkspace.
216 IBM Operations Analytics - Log Analysis: Installation, Configuration, and Administration Guide

params(Optional) Specify a Custom Search Dashboard parameter JSON.
In this example, the user launches the Day Trader App Custom Search Dashboard incontext without a custom app parameter.https://0.000.00.00:1111/Unity/CustomAppsUI?name=Day%20Trader&20App
Configuring the DSV toolkitThe DSV toolkit is used to create Insight Packs that allow you to load DelimiterSeparated Value (DSV) data into IBM Operations Analytics - Log Analysis. TheDSV toolkit contains python scripts that take input from a properties file thatdescribes a DSV log type and produces as output an installable Insight Pack.
IBM Operations Analytics - Log Analysis provides a semi-structured data analyticssolution. Use IBM Operations Analytics - Log Analysis to identify problems andpropose solutions by searching and indexing large volumes of unstructured datafrom a variety of sources. IBM Operations Analytics - Log Analysis allows you toreduce problem diagnosis and resolution time and more effectively manage yourinfrastructure and applications.
Before you can perform a search on log or other data, you must first load the datainto IBM Operations Analytics - Log Analysis. An Insight Pack is a set of artifactspackaged together to allow IBM Operations Analytics - Log Analysis to ingest thedata that is loaded. An Insight Pack contains a complete set of artifacts required toprocess a data source. You can install, uninstall, or upgrade an Insight Pack as astand-alone package.
Each Insight Pack defines:v The type of log data that is to be consumed.v How data is annotated. The data is annotated to highlight relevant information.v How the annotated data is indexed. The indexing process allows you to
manipulate search results for better problem determination and diagnostics.v Optionally, how to render data in an app chart or visualization.
What's newThe DSV toolkit was updated to improve ingestion performance and updateproperty files.v This DSVToolkit provides improved ingestion performance, with the ability to
ingest large DSV records. The adjustment to the Java stack size for files withlong log records is no longer required.
v Users can continue to use Insight Packs that were generated by older versions ofthe DSVToolkit. The improved performance of the updated DSVToolkit does notapply to these Insight Packs.
v The aqlModuleName property was renamed as moduleName. Generated propertyfiles that contain the aqlModuleName property continue to function correctly but awarning message, indicating that the aqlModuleName property is deprecated, isdisplayed.
v Use the newly added quoteChar property to specify the quotation character thatyou want to use to enclose fields that contain delimiters and line-breaks.
Note: If the quoteChar property is not specified, the double quotation mark (") isadded by default during processing.
Configuring 217

Property files that were created before the quoteChar property was added workas before as the double quotation mark was implicit in previous DSVToolkitversions.
v The totalColumns property is no longer required.
Create an Insight Pack using the DSV toolkitThis topic outlines how to install the DSV toolkit and use it to create an InsightPack. If you are using IBM Operations Analytics - Log Analysis 1.2 or later, theDSV Toolkit is installed by default, and therefore does not need to be installedseparately.
Before you begin
Copy the DSVToolkit_v1.1.0.4.zip from <HOME>/SmartCloudAnalyticsLogAnalysisContent/tooling to the <HOME>/unity_contentdirectory and extract the files. The files are extracted to the <HOME>/unity_content/DSVToolkit_v1.1.0.4 directory. Ensure that you, and any additional users thatrequire the DSV toolkit, have write permissions to the DSVToolkit_v1.1.0.4directory.
Procedure1. Run the primeProps.py script to create a new properties file, or to update an
existing properties file.2. Edit the properties file to meet the requirements of your DSV log file format.
For information about the requirements of each section of the properties file,see the Specifying properties for a log file type section of this document.
3. Run the devGen.py script to generate, and where required deploy, your InsightPack.
Specifying properties for a log file typeThis topic outlines the properties that describe the contents of your DSV file. Eachtype of DSV file that you wish to ingest requires a properties file.
The properties file must conform to a specific format. For example, section headersmust be enclosed in brackets and each section is made up of items that must be inthe format key: value or key=value.
Note: When specifying items in a key: value format, a space is required after thecolon (:).
For more information, see http://docs.python.org/2/library/configparser.html
SCALA_serverSpecify the details for your IBM Operations Analytics - Log Analysis server in theSCALA_server section.
The following parameter must be defined:
scalaHomeSpecify the path to the home directory of the IBM Operations Analytics -Log Analysis server.
DSV_fileThe DSV file section specifies parameters that apply to the entire log file and theentire Insight Pack.
218 IBM Operations Analytics - Log Analysis: Installation, Configuration, and Administration Guide

DSV file parameters
delimiterSpecify the column separator that is used in the DSV log.
versionSpecify the version number of the Insight Pack. The version must be a fourdigit number with a period separating each number. For example, 1.2.3.4.
moduleNameSpecify the name of the Insight Pack and the underlying IOL-LA artifacts.The module name must:v Start with a letter or an underscore (_). The letters can be upper or
lowercase.v Subsequent characters can be upper or lowercase letters, underscores, or
digits (0-9).
quoteCharSpecify the quotation mark character that is used to enclose fields thatcontain delimiters and line-breaks.
Updates to the DSV file parametersv The aqlModuleName property was renamed as moduleName. Generated property
files that contain the aqlModuleName property continue to function correctly but awarning message, indicating that the aqlModuleName property is deprecated, isdisplayed.
v Use the newly added quoteChar property to specify the quotation character thatyou want to use to enclose fields that contain delimiters and line-breaks.
v The totalColumns property is no longer required.
field*_indexConfigDefine values for index configuration in the field*_indexConfig section.
You can create a section in your properties file for each column of your DSV logfile type. For each column that you want to add to the properties file, replace the *in field*_indexConfig with the column number in your DSV log file. For example,field3_indexConfig corresponds to column 3 of the DSV log file. Add fields asrequired. For more information, see the Index Configuration topics in theAdministering IBM Operations Analytics - Log Analysis section of the InformationCenter.
name Specify the name of the field in the index configuration. The field name isdisplayed in the Search workspace.
dataTypeSpecify the type of data contained in the log column. The valid values areTEXT, DATE, LONG, or DOUBLE.
dateFormatThis field is required if you have specified DATE as the dataType value.Specify the format of the timestamp used by the DSV log file. This formatmust conform with the Java 7 SimpleDateFormat class specification.
retrievable(Optional) Specify the value for the retrievable field in the indexconfiguration. The default value is TRUE.
Configuring 219

retrieveByDefault(Optional) Specify the value for the retrieveByDefault field in the indexconfiguration. The default value is TRUE.
sortable(Optional) Specify the value for the sortable field in the indexconfiguration. The default value is FALSE. For the timestamp field, thisvalue must be set to TRUE.
filterable(Optional) Specify the value for the filterable field in the indexconfiguration. The default value is FALSE. For the timestamp field, thisvalue must be set to TRUE.
searchable(Optional) Specify the value for the searchable field in the indexconfiguration. The default value is TRUE.
path_* (Optional) Specify the additional paths that are added to the list of paths inthe index configuration. Replace the asterisk (*) with an integer. Start at 1and increment by 1 for each additional path. One path is generateddynamically and placed at the end of the list.
A path is a JSON path that points to the data that is displayed in theSearch workspace. The path must have the form:path_1: annotations.aqlModuleName_viewName.fieldName
where the dynamically generated paths are created using the followingsubstitutions:
aqlModuleNameThe aqlModuleName in the properties file.
viewNameThe name item in an indexConfig section with the word Finalappended to it.
fieldNameThe name in the indexConfig section. For an example of fieldName,see the Excluding and combining columns topic.
combineThis field is required if a path is specified. Specify the method used tomerge the contents of multiple paths. The valid values are FIRST and ALL.The default value is FIRST. When the combine value is set to FIRST, pathsthat you have defined are checked before the dynamically generated path.
Defining a timestamp section:
The properties file must contain a section that corresponds with the timestamp ofthe log record. The name item must be timestamp, the dataType must be DATE, adateFormat must be specified, and sortable, filterable, and searchable must allbe set to true.
For an example of a correctly completed timestamp section, see the Exampleproperties file topic. For more information about supported date formats, see theSupported formats section.
field0_indexConfigDefine the index configuration for the whole log record.
220 IBM Operations Analytics - Log Analysis: Installation, Configuration, and Administration Guide

The name, dataType, path, and combine values are shown in the Example propertiesfile topic. These values must appear unchanged in every properties file. The fieldnumber in the section name must be 0.
Example properties file with edited index configuration fieldsThis is a sample properties file. All of the required values have been specified.[SCALA_server]scalaHome: $HOME/IBM/LogAnalysis
[DSV_file]delimiter: ,aqlModuleName: csv3Columnversion: 1.0.0.0totalColumns: 3
[field0_indexConfig]name: logRecorddataType: TEXTretrievable: trueretrieveByDefault: truesortable: falsefilterable: falsesearchable: truepath_1: content.textcombine: FIRST
[field1_indexConfig]name: timestampretrievable: trueretrieveByDefault: truesortable: truefilterable: truesearchable: truedataType: DATEdateFormat: yyyy-MM-dd’T’HH:mm:ss.SSSX
[field2_indexConfig]name: severityretrievable: trueretrieveByDefault: truesortable: falsefilterable: truesearchable: truedataType: TEXT
[field3_indexConfig]name: messageretrievable: trueretrieveByDefault: truesortable: falsefilterable: falsesearchable: truedataType: TEXT
This properties file creates an Index configuration that processes log records similarto this example:2013-04-25T12:30:49.456-02:00, Warning,Heap utilization patterns indicate that you may have a memory leak
Excluding and combining columnsThis topic outlines how you can configure your properties file to exclude andcombine columns from your DSV log file when it is displayed in IBM OperationsAnalytics - Log Analysis.
Configuring 221

Excluding columns
If you do not want to display a column that is included in a DSV log file, do notspecify that column when you add indexConfig sections to the properties file. Forexample, if you do not want to display columns 2, 3, and 4 of a 5 column log file,only specify the field1_indexConfig and field5_indexConfig property sections.
Combining columns
You can combine multiple columns from the DSV log file into one column in theSearch workspace by specifying multiple paths in one indexConfig section. Thesection with multiple paths must be the one with the highest column number toensure that the correct annotation is applied to the DSV log file. Fields that arepart of the combined column, but are otherwise unimportant, can have alltrue/false index configuration fields set to false to ensure that data that is notrequired is not indexed.
The sample properties file combines the 2nd and 4th columns of the DSV log fileinto one column when it is displayed in the IBM Operations Analytics - LogAnalysis Search workspace.[field2_indexConfig]name: shortMessagedataType: TEXTretrievable: falseretrieveByDefault: falsesortable: falsefilterable: falsesearchable: false
[field4_indexConfig]name: longMessagedataType: TEXTretrievable: trueretrieveByDefault: truesortable: falsefilterable: falsesearchable: truepath_1: shortMessagecombine: ALL
Generate a properties fileUse the primeProps.py to generate a template properties file. Default values areadded where appropriate. Update the template properties file before running thedsvGen script.
Syntaxpython primeProps.py pathToProps numNewSections [options]
Parameters
These parameters are defined for this script:
pathToPropsThe path to the properties file that you want to create.
222 IBM Operations Analytics - Log Analysis: Installation, Configuration, and Administration Guide
numNewSectionsSpecify the number of indexConfig sections that you want to add to theproperties file. Each indexConfig section corresponds to a column in yourDSV file.
Options
These additional options are defined for this script:
-o Overwrites the existing properties file. The default value for this propertyis false.
-h Displays the help screen for this script.
-f Add this option and specify the path to a DSV file containing a header.The header is parsed and the name item for each generated section usesthe header name instead of a default name.
After running this command, open and review the properties file to ensure that thename of each section complies with the requirements of AQL and the DSVspecifications. For example, the timestamp must be lower case and the namecannot contain spaces.
Example primeProps.py output
This example displays the output generated by the primeProps.py script. It showsa template with default values for the DSV_file, SCALA_server, andfield0_indexConfig sections The command python primeProps.pydsvProperties.properties 1 results in this output:[SCALA_server]scalaHome: $HOME/IBM/LogAnalysis
[DSV_file]delimiter: ,aqlModuleName: dsv1Columnversion: 1.0.0.0
[field0_indexConfig]name: logRecorddataType: TEXTretrievable: trueretrieveByDefault: truesortable: falsefilterable: falsesearchable: truepath_1: content.textcombine: FIRST
[field1_indexConfig]name: field1dataType: TEXTretrievable: trueretrieveByDefault: truesortable: falsefilterable: falsesearchable: true
Next steps
To ensure that the properties file contains sufficient detail to generate an InsightPack, complete these steps:
Configuring 223

v Verify the default username and password.v Verify the default delimiter.v Verify that the indexConfig section of the properties file contains a field named
timestamp. You must edit the relevant field name.v Edit a section so that the name is timestamp, the dataType is set to DATE, the
dateFormat value is appropriate, and that the sortable and filterable values areset to TRUE.
v Verify the default scalaHome location.
Generate an Insight PackUse the dsvGen.py script to generate and, where required deploy, an Insight Pack.You can also use the pkg_mgmt.sh command to install the Insight Pack. After theInsight Pack has been generated you can use the Log Analysis Insight Pack Toolingto make any additional changes that you require.
Syntax
The syntax required to run the dsvGen.py script is:python dsvGen.py pathToProps [options]
Parameters
These parameters are defined for this script:
pathToPropsThe path to the properties file that you want to use to generate yourInsight Pack.
Options
These additional options are defined for this script:
-o Overwrites the existing Insight Pack archive file. The default value for thisproperty is false.
-h Displays the help screen for this script.
-d Deploy the Insight Pack using the pkg_mgmt.sh command. The install anddeploylfa options are used. The default value for this property is false.
If you specify both the -d and -o options, any Insight Pack of the samename is removed, using the pkg_mgmt.sh uninstall option, before the newInsight Pack is installed.
-f Applies the -f option to the pkg_mgmt.sh command. This eliminates alluser prompts. The -d option must be used when using -f.
-l Creates a Log Source for the generated Insight Pack. The Log Sourcehostname corresponds to the short hostname of the current server, and theLog Source log path points to a default file in the <HOME>/logsources/directory. The -d, -u, and -p options must be used when you use the -loption, even if the default unityadmin credentials exist.
-u Specify a username to pass to pkg_mgmt.sh. The default unityadmincredentials will be used if nothing is supplied.
-p Specify a password to pass to pkg_mgmt.sh. The default unityadmincredentials will be used if nothing is supplied.
224 IBM Operations Analytics - Log Analysis: Installation, Configuration, and Administration Guide

Example
Executing this command results in the output described:python dsvGen.py dsv5.properties -o -d
In this example:v The aqlModuleName item is set to dsv5Column.v In the DSVToolkit_v1.1.0.4/build directory, the
dsv5ColumnInsightPack_v1.0.0.0 directory is deleted.v In the DSVToolkit_v1.1.0.4/dist directory, the archive
dsv5ColumnInsightPack_v1.0.0.0.zip is deleted.v The Insight Pack archive is created in the DSVToolkit_v1.1.0.4/dist directory
and is named dsv5ColumnInsightPack_v1.0.0.0.zip.v The Insight Pack archive is copied to the <HOME>/unity_content/DSV directory.v The pkg_mgmt.sh command removes the old Insight Pack, if it exists, and
re-installs it using the new archive.
TroubleshootingThere are several commonly encountered problems when using the DSV Toolkit.This is a description of the symptoms encountered and suggested solutions forresolving the problems.
The number of successfully ingested records is 0
Problem:The number of successfully ingested records is 0, and there are no errors.
Resolution:The number of columns in the DSV file does not match the numberspecified in the properties file. Verify that the properties file is correct andthat none of the records in the DSV file have an abnormal number offields.
The dsvGen.py script is displaying an error
Problem:The dsvGen.py script is displaying an error like “The timestamp field mustbe sortable and filterable” or “A field of type DATE was specified, but nodateFormat item was provided”.
Resolution:The timestamp field you define has a specific set of requirements. See the“Defining a timestamp section” on page 220 for the detailed requirement.
Supported formatsThis section outlines the formats that are supported for DSV log files.
Timestamp formatsThe timestamp format from the DSV log file is based on the timestamp formatssupported by the Java 7 SimpleDateFormat class. Any date format not supported bythe SimpleDateFormat class cannot be processed from a DSV log file.
If a time-only timestamp is contained in the log, SimpleDateFormat assigns adefault date of Jan 1, 1970 to the timestamp. Any double quotes that surround a
Configuring 225

timestamp are removed. Other characters must be included as literals in thedateFormat item. For example, a timestamp surrounded by brackets must bespecified in the format:dateFormat ’[’yyyy-MM-dd HH:mm:ss’]’
For more information on valid timestamp formats for SimpleDateFormat, seehttp://docs.oracle.com/javase/7/docs/api/java/text/SimpleDateFormat.html.
Delimiter formatsThe follow delimiters are supported:v comma (,)v colon (:)v semicolon (;)v pipe (|)v dash (-)v slash (/)v backslash (\)v tab (\t)v tilde (~)
Quotation charactersThe follow quotation characters are supported:v Double quotation mark (")v Single quotation mark (')
Note: If the quoteChar property is not specified, the double quotation mark (") isadded by default during processing.
Property files that were created before the quoteChar property was added work asbefore as the double quotation mark was implicit in previous DSVToolkit versions.
DSV formatsThe Insight Packs generated by the DSV toolkit support DSV log file types thatmeet these requirements. In each case, a comma is used as a delimiter:v Each log record is on a separate line. A line break is used to delimit the log
records. CRLF denotes a line break. For example:aaa,bbb,ccc CRLFzzz,yyy,xxx CRLF
v The last record in the file might, or might not, end with a line break. Forexample:aaa,bbb,ccc CRLFzzz,yyy,xxx
v A header line might be present as first line of the file. This header line has sameformat as all standard record lines and contains names that correspond to thefields in the file. The header line also contains the same number of fields as therecords in the rest of the file. For example:field_name,field_name,field_name CRLFaaa,bbb,ccc CRLFzzz,yyy,xxx CRLF
v Within the header and each record, there might be one or more fields that areseparated by delimiters. Each line contains the same number of fields. Spaces are
226 IBM Operations Analytics - Log Analysis: Installation, Configuration, and Administration Guide

considered as part of a field and are ignored. The last field in the record mustnot be followed by a delimiter. For example:
aaa,bbb,ccc
v Each field might or might not be enclosed in quotation characters. If fields arenot enclosed in quotation characters, quotation characters might not appearinside the fields. The following examples show fields that are enclosed by singleand double quotation characters:
"aaa","bbb","ccc" CRLF’zzz’,’yyy’,’xxx’
v Fields containing quotation characters, delimiters, and line breaks must beenclosed in quotation characters. The following examples show fields that areenclosed by single and double quotation characters:"aaa","b,bb","ccc" CRLF’zzz’,’y,yy’,’xxx’
v If quotation characters are used to enclose fields, a quotation character thatappears inside a field must be escaped by preceding it with another quotationcharacter. The following examples show single and double quotation characters:
"aaa","b""bb","ccc"’zzz’,’y’’yy’,’xxx’
Configuring aliasesYou can use the IBM Operations Analytics - Log Analysis alias feature to specifyan alias.
The IBM Operations Analytics - Log Analysis alias feature is installed and enabledby default.
The alias data is stored in the aliasSource.json file in the <HOME>/IBM/LogAnalysis/wlp/usr/servers/Unity/apps/Unity.war/WEB-INF directory.
Configuring an aliasYou can use the IBM Operations Analytics - Log Analysis alias feature to specifyan alias, consisting of an alternative name.
About this task
Aliases are displayed in the IBM Operations Analytics - Log Analysis UI.
Procedure1. Open the aliasSource.json file in the <HOME>/IBM/LogAnalysis/wlp/usr/
servers/Unity/apps/Unity.war/WEB-INF directory.2. To apply an alias to a fieldname, edit the fieldname parameters in the
aliasSource.json file. The following example shows the parameters to applyan alias to a hostname:{
"aliasKeyValueArray": [{
"sourceType": "WASSystemOut","fields": [
{"fieldName": "hostname","alias_field": "severity_alias","translations": {
"E": "Error",
Configuring 227

"W": "Warning","O": "Overflow","I": "Info"
}}
]}
]}
Where:v sourceType specifies the source type for which the alias is created.v fieldName specifies the field name of the source type.v alias_field specifies the alias name of the field.v translations contains the field values and aliases.
What to do next
Verify that the aliases are correctly configured in the IBM Operations Analytics -Log Analysis UI.
Errors that are recorded during configuration are stored in theUnityApplication.log file in the <HOME>/IBM/LogAnalysis/logs directory.
Configuration referenceRead reference information about the scripts and properties, which you canconfigure after you install Log Analysis.
ldapRegistryHelper.propertiesYou can edit the ldapRegistryHelper.properties to specify LDAP server details.
The following properties are required and define the connection information forthe target LDAP server.
Table 62. LDAP server connection information properties
Property Description
ldap_hostname_property= The LDAP hostname.
ldap_port_property= The LDAP port.
ldap_baseDN_property= The LDAP baseDN. For example, "dc=com"for TDS users, and"CN=Users,DC=sflab,DC=local"for AD users.
The following properties are optional and define the connection information for thetarget LDAP server. Where applicable, default settings are assigned.
The bindPassword value for AD users is encrypted in theldapRegistryHelper_config.xml.
Table 63. Optional LDAP server connection information properties
Property Description
ldap_bindDN_property= The LDAP bindDN. For example,"CN=Administrator,CN=Users,DC=sflab,DC=local" for AD users.
228 IBM Operations Analytics - Log Analysis: Installation, Configuration, and Administration Guide

Table 63. Optional LDAP server connection information properties (continued)
Property Description
ldap_bindPassword_property= The LDAP bind password.
ldap_realm_property= The LDAP realm. The default value isLdapRegistryRealm.
ldap_id_property= The LDAP ID. The default value isLdapRegistryId.
ldap_ignoreCase_property= The LDAP ignore case. The default value istrue.
ldapRegistryHelper.sh commandYou can use the ldapRegistryHelper.sh command to enable a basic connection foruser authentication in IBM Operations Analytics - Log Analysis.
For more information about how to use the command to set up LDAPauthentication with IBM Tivoli Directory Server or Microsoft Active Directory, see“Configuring LDAP authentication with IBM Tivoli Directory Server or MicrosoftActive Directory” on page 43.
Supported integrations
This command currently supports connections to the IBM Tivoli Directory Serverand Microsoft Active Directory.
Prerequisites
Before you use this command, you must update theldapRegistryHelper.properties file in the <HOME>/IBM/LogAnalysis/utilities/directory with the connection and configuration information for the target LDAPserver.
Syntax
The ldapRegistryHelper.sh command is in the <HOME>/IBM/LogAnalysis/utilitiesdirectory and it has the following syntax:ldapRegistryHelper.sh config | enable
Note:
To run the script, the JAVA_HOME variable must be set correctly for IBM OperationsAnalytics - Log Analysis. If the script fails, run the following command to set theJAVA_HOME variable:JAVA_HOME=$<HOME>/IBM-java
Parameters
The ldapRegistryHelper.sh command has the following parameters:
config Use the config parameter to create an XML file that is calledldapRegistry.xml in the <HOME>/IBM/LogAnalysis/wlp/usr/servers/Unitydirectory. This file uses the connection and configuration information thatis defined in the ldapRegistryHelper.properties file.
enable
Configuring 229
Use the enable parameter to enable LDAP authentication that uses theinformation that is specified in the ldapRegistry.xml file. This parameteralso disables the reference to the database-managed custom user registry.
unity commandUse the unity command to start, stop, and restart IBM Operations Analytics - LogAnalysis. Also use this command to display the status of processes and to displayversion information for IBM Operations Analytics - Log Analysis.
Syntax
The unity command is located in the <HOME>/IBM/LogAnalysis/utilitiesdirectory and has the following syntax:unity.sh -start | -stop | -version | -restart | -status
Parameters
The parameters for this command are:
- start Use this parameter to start IBM Operations Analytics - Log Analysis andassociated services.
-stop Use this parameter to stop IBM Operations Analytics - Log Analysis andassociated services.
-versionUse this parameter to determine the currently installed version of IBMOperations Analytics - Log Analysis.
-restartUse this parameter to restart IBM Operations Analytics - Log Analysis andother associated services.
-status Use this parameter to display a list of IBM Operations Analytics - LogAnalysis processes, including the Indexing Engine nodes, and their status.
Configuration file parametersThe IBM Tivoli Monitoring Log File Agent uses the information that is specified inthe configuration file to process log file information.
Table 1 explains that parameters that you can modify in this file.
Table 64. Parameter summary
Parameter Description
DataSources Specify the data source that you want tomonitor. If you are specifying multiple datasources, they must be comma-separated andwithout spaces. When you configure aremote directory in the LFA conf file, thedirectory you specify must not contain anysubdirectories.
230 IBM Operations Analytics - Log Analysis: Installation, Configuration, and Administration Guide

Table 64. Parameter summary (continued)
Parameter Description
SshAuthType You must set this value to either PASSWORD orPUBLICKEY.
If you set this value to PASSWORD, IBMOperations Analytics - Log Analysis uses thevalue that is entered for SshPassword as thepassword for Secure Shell (SSH)authentication with all remote systems.
If you set this value to PUBLICKEY, IBMOperations Analytics - Log Analysis uses thevalue that is entered for SshPassword as passphrase that controls access to the private keyfile.
SshHostList You use the SshHostList value to specify thehosts where the remotely monitored log filesare generated. IBM Operations Analytics -Log Analysis monitors all the log files thatare specified in the LogSources orRegexLogSources statements in each remotesystem.
If you specify the local machine as a valuefor this parameter, the LFA monitors the filesdirectly on the local system. If you specifythat the localhost SSH is not used to accessthe files on the system, IBM OperationsAnalytics - Log Analysis reads the filesdirectly.
SshPassword If the value of the SshAuthType parameter isPASSWORD, enter the account password for theuser that is specified in the SshUseridparameter as the value for the SshPasswordparameter.
If the value of the SshAuthType parameter isPUBLICKEY, enter the pass phrase thatdecrypts the private key that is specified inthe SshPrivKeyfile parameter.
SshPort You specify the TCP port that is used forSSH connections. If you do not enteranything, this value is defaulted to 22.
SshPrivKeyfile If the value of the SshAuthType parameter isset to PUBLICKEY, enter the directory path tothe file that contains the private key of theuser that is specified in the SshUseridparameter as the value for this parameter.
If the value of the SshAuthType parameter isnot set to PUBLICKEY, this value is notrequired.
Configuring 231

Table 64. Parameter summary (continued)
Parameter Description
SshPubKeyfile If the value of the SshAuthType parameter isset to PUBLICKEY, enter the directory path tothe file that contains the public key of theuser that is specified in the SshUseridparameter as the value for this parameter.
If the value of the SshAuthType parameter isnot set to PUBLICKEY, this value is notrequired.
SshUserid Enter the user name from the remote systemthat the agent uses for SSH authentication.
eifutil.sh commandTo administer EIF Receiver instances, use the eifutil.sh command.
Syntax
The eifutil.sh command has the following syntax and is in the<USER_HOME_REMOTE>/DataForwarders/EIFReceivers/utilities where<USER_HOME_REMOTE> is the directory on the remote host where the EIFReceiver instances are deployed:eifutil.sh -status|-start <Inst_ID>|-stop <Inst_ID>|-startAll|-stopAll|-restart<Inst_ID>|-restartAll
where <Inst_ID> is the ID for the specific EIF instance.
Parameters
-statusDisplays the status for the installed instances. For example:============================================================================COMPONENT Instance PID PORT STATUS============================================================================EIF Receiver eif_inst_1 13983 6601 UPEIF Receiver eif_inst_2 14475 6602 UPEIF Receiver eif_inst_3 14982 6603 UPEIF Receiver eif_inst_4 15474 6604 UPEIF Receiver eif_inst_5 15966 6605 UP============================================================================
-start <Inst_id>Starts the specified instance.
-stop <Inst_id>Stops the specified instance.
-startAllStarts all instances.
-stopAllStops all instances.
-restart<Inst_id>Restarts the specified instance.
-restartAllRestarts all the instances.
232 IBM Operations Analytics - Log Analysis: Installation, Configuration, and Administration Guide

lfautil.sh commandTo administer IBM Tivoli Monitoring Log File Agent (LFA) instances, use thelfautil.sh command.
Syntax
The lfautil.sh command has the following syntax and is in the<USER_HOME_REMOTE>/utilities/ directory on the remote host where<USER_HOME_REMOTE> is the directory on the remote host where the LFAinstances are deployed:lfautil.sh -start|-stop|-status|-restart
Parameters
-start Starts all the LFA instances on the remote host.
-stop Stops all the LFA instances on the remote host.
-statusDisplays the status for the LFA instances on the remote host. For example:==========================================COMPONENT PID STATUS==========================================Log File Agent 23995 UP==========================================
-restartRestarts the LFA instances on the remote host.
Data Collector propertiesBefore you can use the data collector to stream data or load a batch of historicdata, edit the javaDatacollector.props file.
The javaDatacollector.props file is in the <HOME>/IBM/LogAnalysis/utilitiesdatacollector-client folder.
The logFile, hostname, logpath, and keystore parameters are required.
The userid, password, and keystore parameters are automatically populated withthe default values that are created during the installation. If you want, you canchange these but you do not need to.
Table 65. Data Collector properties
Parameter Value
logFile The full path of the file you want to load.
servletURL The URL of the Data Collector service.
userid The user ID for the Data Collector service.
password The password for the Data Collector service.
datasource The datasource that you want to use to loaddata.
timestamp The time stamp to use if a time stamp is notfound in the log file.
batchsize The number of BYTES of logs sent in onebatch. The default value is 500,000.
keystore The full path to the keystore file.
Configuring 233

Table 65. Data Collector properties (continued)
Parameter Value
inputType The valid input type is LOGS.
flush flag If the default true is set, the client sends aflush signal to the Generic Receiver for thelast batch of the file. If set to false no flushsignal is sent when the end-of-file isreached.
unity_securityUtility.sh commandYou can use the unity_securityUtility.sh command to change the password thatthe Data Collector and EIF Receiver use to connect to IBM Operations Analytics -Log Analysis.
Syntax
The unity_securityUtility.sh command is in the <HOME>/IBM/LogAnalysis/utilities directory and it has the following syntax:unity_securityUtility.sh encode [textToEncode] [unity.ks]
Parameters
The unity_securityUtility.sh command has the following parameters:
encode
The encode action returns an AES encrypted version of the text that youenter as the text to encrypt.
[textToEncode]Use the [textToEncode] parameter to enter the password that you want toencrypt. If you do not specify a password for this parameter, IBMOperations Analytics - Log Analysis prompts you for one.
[unity.ks]
The unity.ks file is the default keystore that is generated automaticallyduring installation. It controls how the password is encrypted anddecrypted.
The unity.ks file is used to encrypt and decrypt passwords for thefollowing features:v Java data collector client in the <HOME>/IBM/LogAnalysis/utilities/
datacollector-client/javaDatacollector.properties file.v EIF Receiver in the <HOME>/IBM/LogAnalysis/utilities/
UnityEIFReceiver/config/unity.conf file.
For an example of how to use this command, see “Changing the default EIFReceiver or Data Collector password” on page 300.
eif.conf fileThe file eif.conf is a configuration file for the TEC Adapter used by thescala_custom_eif plugin to send log records as events to the IBM OperationsAnalytics - Log Analysis EIF Receiver.
234 IBM Operations Analytics - Log Analysis: Installation, Configuration, and Administration Guide

The file eif.conf is found in the logstash/outputs directory relative to where thelogstash Integration Toolkit was installed on the logstash server. The logstashIntegration Toolkit installation configures eif.conf during installation with theserver location, server port, cache file location, and the log file. You can modifyany other properties to customize your installation. You must restart the logstashagent in order effect changes to this configuration file.
Note: Please refer to the comments in the eif.conf file for the latest details on theavailable parameters and their descriptions.
eif.conf file parameters
BufEvtMaxSize=<kilobytes>Specifies the maximum size, in kilobytes, of the adapter cache file. Thedefault value is 64. The cache file stores events on disk when theBufferEvents keyword is set to YES. The minimum size for the file is 8 KB.File sizes specified below this level are ignored, and 8 KB is used. There isno upper limit for the file size.
Note: If the cache file already exists, you must delete the file for parameterchanges to take effect.
The BufEvtMaxSize parameter is optional.
BufEvtPath=<pathname>Specifies the full path name of the adapter cache file. This is a requiredparameter when the BufferEvents value is set to YES.
BufferEvents=YES | MEMORY_ONLY | NO Specifies how event buffering is enabled.v YES - Stores events in the file specified by the BufEvtPath keyword.v MEMORY_ONLY - Buffers events in memory.v NO - Does not store or buffer events.
The value is not case-sensitive. The default value is YES. This parameter isoptional.
ConnectionMode=connection_oriented | connection_less Specifies the connection mode to use to connect to the IBM OperationsAnalytics - Log Analysis EIF Receiver. The default value is connection_less.v connection_oriented - A connection is established at adapter
initialization and is maintained for all events sent. A new connection isestablished only if the initial connection is lost. The connection isdiscarded when the adapter is stopped. This option can be abbreviatedto co or CO.
v connection_less - A new connection is established and discarded foreach event or group of events that is sent.
This parameter is optional.
LogFileName=<pathname>Specifies the full path name of the log file for the adapter.
LogLevel=<level>Specifies whether the Java API generates log messages or not. By default,no messages are generated. Specify ALL to generate messages. If youspecify any other value or no value, the API does not generate messages.This parameter is optional.
ServerLocation=<host>
Configuring 235

Specifies the name of the host where the IBM Operations Analytics - LogAnalysis EIF Receiver resides.
ServerPort=number Specifies the port number on which the IBM OperationsAnalytics - Log Analysis EIF Receiver listens for events.
FQDomain=YES | NO | <fully.qualified.domain.suffix>Specifies the fqhostname slot.v YES - The adapter will attempt to determine the fully qualified hostname
and if successful will fill in the fqhostname slot in the event.v NO - The fqhostname slot will be set to a null string.v <fully.qualified.domain.suffix> - The adapter will append this value
to the hostname in order to set the fqhostname slot.
unity.conf fileThe unity.conf is a configuration file for the IBM Operations Analytics - LogAnalysis EIF Receiver.
The unity.conf file is found in the <HOME>/IBM/LogAnalysis/UnityEIFReceiver/config/ directory.
unity.conf file parameters
Table 66. unity.conf parameters
Parameter Description
unity.data.collector.ip=host name The host name of the server on which IBMOperations Analytics - Log Analysis isinstalled
unity.data.collector.port=9987 The port that is specified during installation.The default value is 9987.
unity.data.collector.protocol=https The communication protocol. The defaultvalue is https.
unity.data.collector.uri=/Unity/DataCollector
The uri used in the REST invocation.
unity.data.collector.userid=unityadmin The user ID of the user assigned theUnityUser role. The default user ID isunityAdmin.
unity.data.collector.password={aes}<Unique_string_of_alphanumeric_characters>
The password that is associated with theUnityAdmin role. The default value is{aes}<Unique_string_of_alphanumeric_characters>.
unity.data.collector.keystore=/home/unity/IBM/LogAnalysis/wlp/usr/server/Unity/keystore/unity.ks
The full path to the keystore file.
unity.data.collector.eif.consumer.num.events=1000000
The common queue for all of the EIF events.The default value is 1000000.
unity.data.collector.event.service.num.events=80000
Each datasource has 1 service queue. Eventsare buffered in this queue and placed inbatches. The batches are passed to the posterqueue. The default value is 80000.
unity.data.collector.event.poster.num.events=500
Each datasource has 1 poster queue. Batchesare selected and posted to the IBMOperations Analytics - Log Analysis serverfrom this queue. The default value is 500.
236 IBM Operations Analytics - Log Analysis: Installation, Configuration, and Administration Guide

Table 66. unity.conf parameters (continued)
Parameter Description
unity.data.collector.gc.interval=2 Determine the EIF Receiver memory cleanupinterval in minutes. The default value is 2.
logsource.buffer.wait.timeout=10 Determine the buffer timeout in seconds.The default value is 10.
logsource.max.buffer.size=450000 Determine the buffer size in Bytes. Thedefault value is 450000.
install.sh commandUse the install.sh command to install IBM Operations Analytics - Log Analysisor configure data collection for scalability on multiple remote nodes.Tivoli EventIntegration Facility Receiver or the IBM Tivoli Monitoring Log File Agent on aremote server.
The install.sh command is in the <HOME>/IBM/LogAnalysis/remote_install_tool/ directory on the local installation of IBM Operations Analytics- Log Analysis.
install.sh command parameters
To install IBM Operations Analytics - Log Analysis with IBM Installation Manager,run the command:./install.sh
This command installs IBM Operations Analytics - Log Analysis and installs orupgrades, IBM Installation Manager if no other version is installed. For moreinformation, see “Installing with the IBM Installation Manager UI” on page 10.
To install IBM Operations Analytics - Log Analysis with the console, run thecommand:./install.sh -c
This command installs IBM Operations Analytics - Log Analysis and installs orupgrades IBM Installation Manager, if no other version of IBM InstallationManager is installed. For more information, see “Installing with the IBMInstallation Manager command-line interface” on page 12.
To silently install IBM Operations Analytics - Log Analysis, run the command:./install.sh -s <HOME_DIR>/smcl_silent_install.xml
where <HOME_DIR> is your home directory. This command silently installs IBMOperations Analytics - Log Analysis and installs or upgrades IBM InstallationManager Version 1.8.2. For more information, see “Silently installing Log Analysis”on page 14.
To install the Tivoli Event Integration Facility Receiver or the IBM TivoliMonitoring Log File Agent on a remote server, run the command:./install.sh
For more information, see “Configuring data collection for scalability on multipleremote nodes” on page 75.
Configuring 237

ssh_config.propertiesBefore you can use the remote installer utility, you must configure the Secure Shell(SSH) for the remote hosts.
The ssh_config.properties file is in the <HOME>/IBM/LogAnalysis/remote_install_tool/config directory.
Table 67. ssh_config parameters
Parameter Value
REMOTE_HOST= REMOTE_HOST
POST= POST
TIME_OUT= 60000
USER= REMOTE_USER
PASSWORD= password1
USE_PASSWORD_LESS_SSH= true
PATH_OF_PASSWORD_LESS_SSH_KEY= /home/pass/.ssh/id_rsa
PASSPHRASE_OF_PASSWORD_LESS_SSH_KEY= passphrase1
Audit parametersThe auditing feature is enabled by default. The administrator can modify thedefault parameters after installation if required.
The unitysetup.properties file is in the <HOME>/IBM/LogAnalysis/wlp/usr/servers/Unity/apps/Unity.war/WEB-INF folder. The administrator can edit valuesfor the parameters in table 1, if required.
Table 68. Audit unitysetup.properties
Parameters Value
AUDIT_ACTIONS= Specifies where the audit data is stored. Thedefault value is LOG,INDEX. These values arethe only supported values and are enabledby default.
AUDIT_INTERVAL= Defines how frequently the audit data iswritten. The default value is 120000milliseconds.
The audit data is written in JSON format to the <HOME>/IBM/LogAnalysis/logs/audit.log file. The audit file is a rolling file, supporting up to 20, 50-MB files bydefault.
The default file properties are in the log4j.properties file in <HOME>/IBM/LogAnalysis/wlp/usr/servers/Unity/apps/Unity.war/WEB-INF/classes/ directory.
Note: If you change any of the audit parameters, you must save your changes andrestart IBM Operations Analytics - Log Analysis.
Version utilityUse the unity_VersionInfoUtility.sh script to check the version information foryour installation of Log Analysis.
238 IBM Operations Analytics - Log Analysis: Installation, Configuration, and Administration Guide

Syntax
The unity_VersionInfoUtility.sh script is in the <HOME>/IBM/LogAnalysis/utilities folder. To run it, enter the following command:<HOME>/IBM/LogAnalysis/utilities/unity_VersionInfoUtility.sh
Version information
The command returns version information. For example:=====================================================================================UNITY Version Utility=====================================================================================Gathered: Tue Jul 28 07:00:54 EDT 2015
Java: 1.8.0 [IBM Corporation]/home/unityadmin/IBM/LogAnalysis/ibm-java/jre
Java VM: IBM J9 VM [j9jit28]
Platform: Linux2.6.32-279.el6.x86_64amd64
UNITY_HOME: /home/unityadmin/IBM/LogAnalysis
Machine: nc9118042236.in.ibm.com [9.118.42.236]
=====================================================================================Environment=====================================================================================_ = /home/unityadmin/IBM/LogAnalysis/ibm-java/jre/bin/javaCVS_RSH = sshG_BROKEN_FILENAMES = 1HISTCONTROL = ignoredupsHISTSIZE = 1000HOME = /home/unityadminHOSTNAME = nc9118042236IBM_JAVA_COMMAND_LINE = /home/unityadmin/IBM/LogAnalysis/ibm-java/jre/bin/java -Dcom.ibm.tivoli.unity.LFA_DIR=/home/unityadmin/IBM/LogAnalysis/IBM-LFA-6.30 -Dcom.ibm.tivoli.unity.UNITY_HOME=/home/unityadmin/IBM/LogAnalysis -Dcom.ibm.tivoli.unity.DERBY_INSTALL_DIR=/home/unityadmin/IBM/LogAnalysis/database -classpath /home/unityadmin/IBM/LogAnalysis/utilities/lib/verutil.jar:/home/unityadmin/IBM/LogAnalysis/wlp/usr/servers/Unity/apps/Unity.war/WEB-INF/lib/log4j-1.2.16.jar:/home/unityadmin/IBM/LogAnalysis/wlp/usr/servers/Unity/apps/Unity.war/WEB-INF/classes com.ibm.tivoli.unity.tools.VersionUtilJAVA_HOME = /home/unityadmin/IBM/LogAnalysis/ibm-javaLANG = en_US.UTF-8LESSOPEN = |/usr/bin/lesspipe.sh %sLOADEDMODULES =LOGNAME = unityadminLS_COLORS = rs=0:di=01;34:ln=01;36:mh=00:pi=40;33:so=01;35:do=01;35:bd=40;33;01:cd=40;33;01:or=40;31;01:mi=01;05;37;41:su=37;41:sg=30;43:ca=30;41:tw=30;42:ow=34;42:st=37;44:ex=01;32:*.tar=01;31:*.tgz=01;31:*.arj=01;31:*.taz=01;31:*.lzh=01;31:*.lzma=01;31:*.tlz=01;31:*.txz=01;31:*.zip=01;31:*.z=01;31:*.Z=01;31:*.dz=01;31:*.gz=01;31:*.lz=01;31:*.xz=01;31:*.bz2=01;31:*.tbz=01;31:*.tbz2=01;31:*.bz=01;31:*.tz=01;31:*.deb=01;31:*.rpm=01;31:*.jar=01;31:*.rar=01;31:*.ace=01;31:*.zoo=01;31:*.cpio=01;31:*.7z=01;31:*.rz=01;31:*.jpg=01;35:*.jpeg=01;35:*.gif=01;35:*.bmp=01;35:*.pbm=01;35:*.pgm=01;35:*.ppm=01;35:*.tga=01;35:*.xbm=01;35:*.xpm=01;35:*.tif=01;35:*.tiff=01;35:*.png=01;35:*.svg=01;35:*.svgz=01;35:*.mng=01;35:*.pcx=01;35:*.mov=01;35:*.mpg=01;35:*.mpeg=01;35:*.m2v=01;35:*.mkv=01;35:*.ogm=01;35:*.mp4=01;35:*.m4v=01;35:*.mp4v=01;35:*.vob=01;35:*.qt=01;35:*.nuv=01;35:*.wmv=01;35:*.asf=01;35:*.rm=01;35:*.rmvb=01;35:*.flc=01;35:*.avi=01;35:*.fli=01;35:*.flv=01;35:*.gl=01;35:*.dl=01;35:*.xcf=01;35:*.xwd=01;35:*.yuv=01;35:
Configuring 239
*.cgm=01;35:*.emf=01;35:*.axv=01;35:*.anx=01;35:*.ogv=01;35:*.ogx=01;35:*.aac=01;36:*.au=01;36:*.flac=01;36:*.mid=01;36:*.midi=01;36:*.mka=01;36:*.mp3=01;36:*.mpc=01;36:*.ogg=01;36:*.ra=01;36:*.wav=01;36:*.axa=01;36:*.oga=01;36:*.spx=01;36:*.xspf=01;36:MAIL = /var/spool/mail/unityadminmodule = () { eval `/usr/bin/modulecmd bash $*`}MODULEPATH = /usr/share/Modules/modulefiles:/etc/modulefilesMODULESHOME = /usr/share/ModulesPATH = /usr/lib64/qt-3.3/bin:/usr/local/bin:/bin:/usr/bin:/usr/local/sbin:/usr/sbin:/sbin:/home/unityadmin/binPWD = /home/unityadmin/IBM/LogAnalysis/utilitiesQTDIR = /usr/lib64/qt-3.3QTINC = /usr/lib64/qt-3.3/includeQTLIB = /usr/lib64/qt-3.3/libSHELL = /bin/bashSHLVL = 2SSH_ASKPASS = /usr/libexec/openssh/gnome-ssh-askpassSSH_CLIENT = 9.162.129.94 49216 22SSH_CONNECTION = 9.162.129.94 49216 9.118.42.236 22SSH_TTY = /dev/pts/0TERM = xtermUSER = unityadmin
=====================================================================================UNITY Installed Component Version=====================================================================================IBM Operations Analytics - Log Analysis_1_3_2_0_201507240538 ENTRY EDITION
Product License InformationTrial Download. No License.
=====================================================================================Websphere Version Information=====================================================================================Product name: WebSphere Application ServerProduct version: 8.5.5.6Product edition: LIBERTY_CORE
=====================================================================================Derby Version Information=====================================================================================------------------ Java Information ------------------Java Version: 1.8.0Java Vendor: IBM CorporationJava home: /home/unityadmin/IBM/LogAnalysis/ibm-java/jreJava classpath: /home/unityadmin/IBM/LogAnalysis/database/db_derby_bin/lib/derby.jar:/home/unityadmin/IBM/LogAnalysis/database/db_derby_bin/lib/derbynet.jar:/home/unityadmin/IBM/LogAnalysis/database/db_derby_bin/lib/derbytools.jar:/home/unityadmin/IBM/LogAnalysis/database/db_derby_bin/lib/derbyclient.jarOS name: LinuxOS architecture: amd64OS version: 2.6.32-279.el6.x86_64Java user name: unityadminJava user home: /home/unityadminJava user dir: /home/unityadmin/IBM/LogAnalysis/utilitiesjava.specification.name: Java Platform API Specificationjava.specification.version: 1.8java.runtime.version: pxa6480sr1-20150417_01 (SR1)java.fullversion: JRE 1.8.0 IBM J9 2.8 Linux amd64-64 Compressed References20150410_243669 (JIT enabled, AOT enabled)J9VM - R28_Java8_SR1_20150410_1531_B243669JIT - tr.r14.java_20150402_88976.03GC - R28_Java8_SR1_20150410_1531_B243669_CMPRSSJ9CL - 20150410_243669--------- Derby Information --------
240 IBM Operations Analytics - Log Analysis: Installation, Configuration, and Administration Guide

[/home/unityadmin/IBM/LogAnalysis/database/db_derby_bin/lib/derby.jar] 10.10.2.1 - (1643489)[/home/unityadmin/IBM/LogAnalysis/database/db_derby_bin/lib/derbytools.jar] 10.10.2.1 - (1643489)[/home/unityadmin/IBM/LogAnalysis/database/db_derby_bin/lib/derbynet.jar] 10.10.2.1 - (1643489)[/home/unityadmin/IBM/LogAnalysis/database/db_derby_bin/lib/derbyclient.jar] 10.10.2.1 - (1643489)----------------------------------------------------------------------- Locale Information -----------------Current Locale : [English/United States [en_US]]Found support for locale: [cs]
version: 10.10.2.1 - (1643489)Found support for locale: [de_DE]
version: 10.10.2.1 - (1643489)Found support for locale: [es]
version: 10.10.2.1 - (1643489)Found support for locale: [fr]
version: 10.10.2.1 - (1643489)Found support for locale: [hu]
version: 10.10.2.1 - (1643489)Found support for locale: [it]
version: 10.10.2.1 - (1643489)Found support for locale: [ja_JP]
version: 10.10.2.1 - (1643489)Found support for locale: [ko_KR]
version: 10.10.2.1 - (1643489)Found support for locale: [pl]
version: 10.10.2.1 - (1643489)Found support for locale: [pt_BR]
version: 10.10.2.1 - (1643489)Found support for locale: [ru]
version: 10.10.2.1 - (1643489)Found support for locale: [zh_CN]
version: 10.10.2.1 - (1643489)Found support for locale: [zh_TW]
version: 10.10.2.1 - (1643489)------------------------------------------------------------------------------------------------------------
=====================================================================================ITM Version Information=====================================================================================--> Version information command is not available:
/home/unityadmin/IBM/LogAnalysis/IBM-LFA-6.30/bin/cinfo.
=====================================================================================Insight Pack Information=====================================================================================Buildfile: /home/unityadmin/IBM/LogAnalysis/utilities/pkg_mgmt.xml
initializeCustomTasks:
main:[packagemanager] 07/28/15 07:01:07:776 EDT [main] INFO- PrerequisitesManager : CTGLC0044I : Runningprerequisite checks...[packagemanager] 07/28/15 07:01:07:790 EDT [main] INFO- PrerequisitesManager : CTGLC0045I : Prerequisitechecks passed[packagemanager] 07/28/15 07:01:07:792 EDT [main] INFO- ContentPackManager : CTGLC0030I : Listing installedinsight packs started...[packagemanager] 07/28/15 07:01:07:860 EDT [main] INFO- ContentPackManager :[packagemanager] GAInsightPack_v1.1.1.3- /home/unityadmin/IBM/LogAnalysis/unity_content
Configuring 241

[packagemanager] DB2AppInsightPack_v1.1.0.3- /home/unityadmin/IBM/LogAnalysis/unity_content[packagemanager] DB2InsightPack_v1.1.0.2- /home/unityadmin/IBM/LogAnalysis/unity_content[packagemanager] WindowsOSEventsInsightPack_v1.1.0.3- /home/unityadmin/IBM/LogAnalysis/unity_content[packagemanager] Sample_weblogInsightpack_v1.0.0.0- /home/unityadmin/IBM/LogAnalysis/unity_content[packagemanager] WASInsightPack_v1.1.0.3- /home/unityadmin/IBM/LogAnalysis/unity_content[packagemanager] JavacoreInsightPack_v1.1.0.3- /home/unityadmin/IBM/LogAnalysis/unity_content[packagemanager] SyslogInsightPack_v1.1.0.3- /home/unityadmin/IBM/LogAnalysis/unity_content[packagemanager] WASAppInsightPack_v1.1.0.3- /home/unityadmin/IBM/LogAnalysis/unity_content[packagemanager] WebAccessLogInsightPack_v1.1.0.2- /home/unityadmin/IBM/LogAnalysis/unity_content[packagemanager] Sample_EventInsightpack_v1.0.0.0- /home/unityadmin/IBM/LogAnalysis/unity_content[packagemanager] Sample_AppTransInsightpack_v1.0.0.0- /home/unityadmin/IBM/LogAnalysis/unity_content[packagemanager] 07/28/15 07:01:07:872 EDT [main] INFO- ContentPackManager : CTGLC0031I : Listing completedsuccessfully
BUILD SUCCESSFULTotal time: 4 seconds
=====================================================================================UNITY Jar Version Information=====================================================================================UnityAqlUDF.jar
Build ID: 201507230424Version: 1.1.0.0Path: /home/unityadmin/IBM/LogAnalysis/unity_content/
DB2InsightPack_v1.1.0.2/extractors/ruleset/common/lib
UnityAqlUDF.jarBuild ID: 201507230424Version: 1.1.0.0Path: /home/unityadmin/IBM/LogAnalysis/unity_content/
GAInsightPack_v1.1.1.3/extractors/ruleset/common/lib
UnityAqlUDF.jarBuild ID: 201306070311Version: 1.1.0.0Path: /home/unityadmin/IBM/LogAnalysis/unity_content/
Sample_weblogInsightpack_v1.0.0.0/extractors/ruleset/common/lib
UnityAqlUDF.jarBuild ID: 201507230424Version: 1.1.0.0Path: /home/unityadmin/IBM/LogAnalysis/unity_content/
SyslogInsightPack_v1.1.0.3/extractors/ruleset/common/lib
UnityAqlUDF.jarBuild ID: 201507230424Version: 1.1.0.0Path: /home/unityadmin/IBM/LogAnalysis/unity_content/
WASInsightPack_v1.1.0.3/extractors/ruleset/common/lib
UnityAqlUDFDB2.jarBuild ID: 201507230424Version: 1.1.0.0Path: /home/unityadmin/IBM/LogAnalysis/unity_content/
DB2InsightPack_v1.1.0.2/extractors/ruleset/commonDB2/lib
242 IBM Operations Analytics - Log Analysis: Installation, Configuration, and Administration Guide

UnityAqlUDFDate.jarBuild ID: 201507230424Version: 1.1.0.0Path: /home/unityadmin/IBM/LogAnalysis/unity_content/
GAInsightPack_v1.1.1.3/extractors/ruleset/dateTimeSplitter/lib
UnityAqlUDFDate.jarBuild ID: 201507230424Version: 1.1.0.0Path: /home/unityadmin/IBM/LogAnalysis/unity_content/
GAInsightPack_v1.1.1.3/extractors/ruleset/normalizedAmericanDateTimeSplitter/lib
UnityAqlUDFDate.jarBuild ID: 201507230424Version: 1.1.0.0Path: /home/unityadmin/IBM/LogAnalysis/unity_content/
GAInsightPack_v1.1.1.3/extractors/ruleset/normalizedEuropeanDateTimeSplitter/lib
UnityAqlUDFDate.jarBuild ID: 201507230424Version: 1.1.0.0Path: /home/unityadmin/IBM/LogAnalysis/unity_content/
GAInsightPack_v1.1.1.3/extractors/ruleset/normalizedYearFirstDateTimeSplitter/lib
UnityAqlUDFDate.jarBuild ID: 201507230424Version: 1.1.0.0Path: /home/unityadmin/IBM/LogAnalysis/unity_content/
GAInsightPack_v1.1.1.3/extractors/ruleset/timeOnlySplitter/lib
UnityAqlUDFDate.jarBuild ID: 201306070311Version: 1.1.0.0Path: /home/unityadmin/IBM/LogAnalysis/unity_content/
Sample_weblogInsightpack_v1.0.0.0/extractors/ruleset/dateTimeSplitter/lib
UnityAqlUDFPatternMatcher.jarBuild ID: 201507230424Version: 1.1.0.0Path: /home/unityadmin/IBM/LogAnalysis/unity_content/
DB2InsightPack_v1.1.0.2/extractors/ruleset/common/lib
UnityAqlUDFPatternMatcher.jarBuild ID: 201507230424Version: 1.1.0.0Path: /home/unityadmin/IBM/LogAnalysis/unity_content/
GAInsightPack_v1.1.1.3/extractors/ruleset/common/lib
UnityAqlUDFPatternMatcher.jarBuild ID: 201306070311Version: 1.1.0.0Path: /home/unityadmin/IBM/LogAnalysis/unity_content/
Sample_weblogInsightpack_v1.0.0.0/extractors/ruleset/common/lib
UnityAqlUDFPatternMatcher.jarBuild ID: 201507230424Version: 1.1.0.0Path: /home/unityadmin/IBM/LogAnalysis/unity_content/
SyslogInsightPack_v1.1.0.3/extractors/ruleset/common/lib
UnityAqlUDFPatternMatcher.jarBuild ID: 201507230424
Configuring 243

Version: 1.1.0.0Path: /home/unityadmin/IBM/LogAnalysis/unity_content/
WASInsightPack_v1.1.0.3/extractors/ruleset/common/lib
UnityAqlUDFSyslogDate.jarBuild ID: 201507230424Version: 1.1.0.0Path: /home/unityadmin/IBM/LogAnalysis/unity_content/
SyslogInsightPack_v1.1.0.3/extractors/ruleset/dateTimeSplitter/lib
UnityEIFReceiver.jarBuild ID: 201507240538Version: 1.3.2.0Path: /home/unityadmin/IBM/LogAnalysis/UnityEIFReceiver/jars
datacollector-client.jarBuild ID: 201507240538Version: 1.3.2.0Path: /home/unityadmin/IBM/LogAnalysis/utilities/
datacollector-client
db2-content.jarBuild ID: 201507240538Version: 1.3.2.0Path: /home/unityadmin/IBM/LogAnalysis/DataCollector/
annotators/jars
db2-content.jarBuild ID: 201507240538Version: 1.3.2.0Path: /home/unityadmin/IBM/LogAnalysis/work_files/
Configurations/UnityContent/annotator/java
logAAqlUDFs.jarBuild ID: 201507230424Version: 1.1.0.0Path: /home/unityadmin/IBM/LogAnalysis/unity_content/
DB2InsightPack_v1.1.0.2/extractors/ruleset/common/lib
logAAqlUDFs.jarBuild ID: 201507230424Version: 1.1.0.0Path: /home/unityadmin/IBM/LogAnalysis/unity_content/
GAInsightPack_v1.1.1.3/extractors/ruleset/common/lib
logAAqlUDFs.jarBuild ID: 201306070311Version: 1.1.0.0Path: /home/unityadmin/IBM/LogAnalysis/unity_content/
Sample_weblogInsightpack_v1.0.0.0/extractors/ruleset/common/lib
logAAqlUDFs.jarBuild ID: 201507230424Version: 1.1.0.0Path: /home/unityadmin/IBM/LogAnalysis/unity_content/
SyslogInsightPack_v1.1.0.3/extractors/ruleset/common/lib
logAAqlUDFs.jarBuild ID: 201507230424Version: 1.1.0.0Path: /home/unityadmin/IBM/LogAnalysis/unity_content/
WASInsightPack_v1.1.0.3/extractors/ruleset/common/lib
unity-analytics-framework.jarBuild ID: 201507240538Version: 1.3.2.0Path: /home/unityadmin/IBM/LogAnalysis/UnityEIFReceiver/jars
244 IBM Operations Analytics - Log Analysis: Installation, Configuration, and Administration Guide
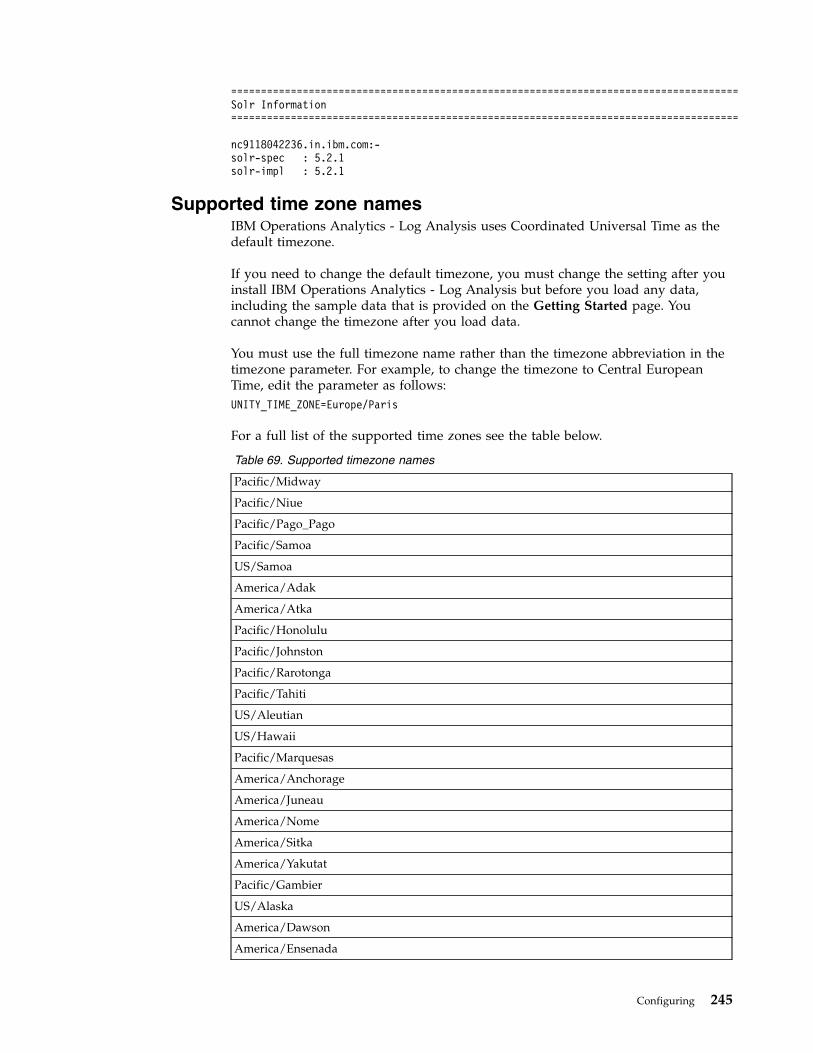
=====================================================================================Solr Information=====================================================================================
nc9118042236.in.ibm.com:-solr-spec : 5.2.1solr-impl : 5.2.1
Supported time zone namesIBM Operations Analytics - Log Analysis uses Coordinated Universal Time as thedefault timezone.
If you need to change the default timezone, you must change the setting after youinstall IBM Operations Analytics - Log Analysis but before you load any data,including the sample data that is provided on the Getting Started page. Youcannot change the timezone after you load data.
You must use the full timezone name rather than the timezone abbreviation in thetimezone parameter. For example, to change the timezone to Central EuropeanTime, edit the parameter as follows:UNITY_TIME_ZONE=Europe/Paris
For a full list of the supported time zones see the table below.
Table 69. Supported timezone names
Pacific/Midway
Pacific/Niue
Pacific/Pago_Pago
Pacific/Samoa
US/Samoa
America/Adak
America/Atka
Pacific/Honolulu
Pacific/Johnston
Pacific/Rarotonga
Pacific/Tahiti
US/Aleutian
US/Hawaii
Pacific/Marquesas
America/Anchorage
America/Juneau
America/Nome
America/Sitka
America/Yakutat
Pacific/Gambier
US/Alaska
America/Dawson
America/Ensenada
Configuring 245

Table 69. Supported timezone names (continued)
America/Los_Angeles
America/Metlakatla
America/Santa_Isabel
America/Tijuana
America/Vancouver
America/Whitehorse
Canada/Pacific
Canada/Yukon
Mexico/BajaNorte
Pacific/Pitcairn
US/Pacific
US/Pacific-New
America/Boise
America/Cambridge_Bay
America/Chihuahua
America/Creston
America/Dawson_Creek
America/Denver
America/Edmonton
America/Hermosillo
America/Inuvik
America/Mazatlan
America/Ojinaga
America/Phoenix
America/Shiprock
America/Yellowknife
Canada/Mountain
Mexico/BajaSur
Navajo
US/Arizona
US/Mountain
America/Bahia_Banderas
America/Belize
America/Cancun
America/Chicago
America/Costa_Rica
America/El_Salvador
America/Guatemala
America/Indiana/Knox
America/Indiana/Tell_City
America/Knox_IN
246 IBM Operations Analytics - Log Analysis: Installation, Configuration, and Administration Guide

Table 69. Supported timezone names (continued)
America/Managua
America/Matamoros
America/Menominee
America/Merida
America/Mexico_City
America/Monterrey
America/North_Dakota/Beulah
America/North_Dakota/Center
America/North_Dakota/New_Salem
America/Rainy_River
America/Rankin_Inlet
America/Regina
America/Resolute
America/Swift_Current
America/Tegucigalpa
America/Winnipeg
Canada/Central
Canada/East-Saskatchewan
Canada/Saskatchewan
Chile/EasterIsland
Mexico/General
Pacific/Easter
Pacific/Galapagos
US/Central
US/Indiana-Starke
America/Atikokan
America/Bogota
America/Cayman
America/Coral_Harbour
America/Detroit
America/Eirunepe
America/Fort_Wayne
America/Grand_Turk
America/Guayaquil
America/Havana
America/Indiana/Indianapolis
America/Indiana/Marengo
America/Indiana/Petersburg
America/Indiana/Vevay
America/Indiana/Vincennes
America/Indiana/Winamac
Configuring 247

Table 69. Supported timezone names (continued)
America/Indianapolis
America/Iqaluit
America/Jamaica
America/Kentucky/Louisville
America/Kentucky/Monticello
America/Lima
America/Louisville
America/Montreal
America/Nassau
America/New_York
America/Nipigon
America/Panama
America/Pangnirtung
America/Port-au-Prince
America/Porto_Acre
America/Rio_Branco
America/Thunder_Bay
America/Toronto
Brazil/Acre
Canada/Eastern
Cuba
Jamaica
US/East-Indiana
US/Eastern
US/Michigan
America/Caracas
America/Anguilla
America/Antigua
America/Aruba
America/Asuncion
America/Barbados
America/Blanc-Sablon
America/Boa_Vista
America/Campo_Grande
America/Cuiaba
America/Curacao
America/Dominica
America/Glace_Bay
America/Goose_Bay
America/Grenada
America/Guadeloupe
248 IBM Operations Analytics - Log Analysis: Installation, Configuration, and Administration Guide

Table 69. Supported timezone names (continued)
America/Guyana
America/Halifax
America/Kralendijk
America/La_Paz
America/Lower_Princes
America/Manaus
America/Marigot
America/Martinique
America/Moncton
America/Montserrat
America/Port_of_Spain
America/Porto_Velho
America/Puerto_Rico
America/Santiago
America/Santo_Domingo
America/St_Barthelemy
America/St_Kitts
America/St_Lucia
America/St_Thomas
America/St_Vincent
America/Thule
America/Tortola
America/Virgin
Antarctica/Palmer
Atlantic/Bermuda
Brazil/West
Canada/Atlantic
Chile/Continental
America/St_Johns
Canada/Newfoundland
America/Araguaina
America/Argentina/Buenos_Aires
America/Argentina/Catamarca
America/Argentina/ComodRivadavia
America/Argentina/Cordoba
America/Argentina/Jujuy
America/Argentina/La_Rioja
America/Argentina/Mendoza
America/Argentina/Rio_Gallegos
America/Argentina/Salta
America/Argentina/San_Juan
Configuring 249

Table 69. Supported timezone names (continued)
America/Argentina/San_Luis
America/Argentina/Tucuman
America/Argentina/Ushuaia
America/Bahia
America/Belem
America/Buenos_Aires
America/Catamarca
America/Cayenne
America/Cordoba
America/Fortaleza
America/Godthab
America/Jujuy
America/Maceio
America/Mendoza
America/Miquelon
America/Montevideo
America/Paramaribo
America/Recife
America/Rosario
America/Santarem
America/Sao_Paulo
Antarctica/Rothera
Atlantic/Stanley
Brazil/East
America/Noronha
Atlantic/South_Georgia
Brazil/DeNoronha
America/Scoresbysund
Atlantic/Azores
Atlantic/Cape_Verde
Africa/Abidjan
Africa/Accra
Africa/Bamako
Africa/Banjul
Africa/Bissau
Africa/Casablanca
Africa/Conakry
Africa/Dakar
Africa/El_Aaiun
Africa/Freetown
Africa/Lome
250 IBM Operations Analytics - Log Analysis: Installation, Configuration, and Administration Guide

Table 69. Supported timezone names (continued)
Africa/Monrovia
Africa/Nouakchott
Africa/Ouagadougou
Africa/Sao_Tome
Africa/Timbuktu
America/Danmarkshavn
Antarctica/Troll
Atlantic/Canary
Atlantic/Faeroe
Atlantic/Faroe
Atlantic/Madeira
Atlantic/Reykjavik
Atlantic/St_Helena
Eire
Europe/Belfast
Europe/Dublin
Europe/Guernsey
Europe/Isle_of_Man
Europe/Jersey
Europe/Lisbon
Europe/London
GB
GB-Eire
Greenwich
Iceland
Portugal
Universal
Zulu
Africa/Algiers
Africa/Bangui
Africa/Brazzaville
Africa/Ceuta
Africa/Douala
Africa/Kinshasa
Africa/Lagos
Africa/Libreville
Africa/Luanda
Africa/Malabo
Africa/Ndjamena
Africa/Niamey
Africa/Porto-Novo
Configuring 251

Table 69. Supported timezone names (continued)
Africa/Tunis
Africa/Windhoek
Arctic/Longyearbyen
Atlantic/Jan_Mayen
Europe/Amsterdam
Europe/Andorra
Europe/Belgrade
Europe/Berlin
Europe/Bratislava
Europe/Brussels
Europe/Budapest
Europe/Busingen
Europe/Copenhagen
Europe/Gibraltar
Europe/Ljubljana
Europe/Luxembourg
Europe/Madrid
Europe/Malta
Europe/Monaco
Europe/Oslo
Europe/Paris
Europe/Podgorica
Europe/Prague
Europe/Rome
Europe/San_Marino
Europe/Sarajevo
Europe/Skopje
Europe/Stockholm
Europe/Tirane
Europe/Vaduz
Europe/Vatican
Europe/Vienna
Europe/Warsaw
Europe/Zagreb
Europe/Zurich
Poland
Africa/Blantyre
Africa/Bujumbura
Africa/Cairo
Africa/Gaborone
Africa/Harare
252 IBM Operations Analytics - Log Analysis: Installation, Configuration, and Administration Guide

Table 69. Supported timezone names (continued)
Africa/Johannesburg
Africa/Kigali
Africa/Lubumbashi
Africa/Lusaka
Africa/Maputo
Africa/Maseru
Africa/Mbabane
Africa/Tripoli
Asia/Amman
Asia/Beirut
Asia/Damascus
Asia/Gaza
Asia/Hebron
Asia/Istanbul
Asia/Jerusalem
Asia/Nicosia
Asia/Tel_Aviv
Egypt
Europe/Athens
Europe/Bucharest
Europe/Chisinau
Europe/Helsinki
Europe/Istanbul
Europe/Kiev
Europe/Mariehamn
Europe/Nicosia
Europe/Riga
Europe/Sofia
Europe/Tallinn
Europe/Tiraspol
Europe/Uzhgorod
Europe/Vilnius
Europe/Zaporozhye
Israel
Libya
Turkey
Africa/Addis_Ababa
Africa/Asmara
Africa/Asmera
Africa/Dar_es_Salaam
Africa/Djibouti
Configuring 253

Table 69. Supported timezone names (continued)
Africa/Juba
Africa/Kampala
Africa/Khartoum
Africa/Mogadishu
Africa/Nairobi
Antarctica/Syowa
Asia/Aden
Asia/Baghdad
Asia/Bahrain
Asia/Kuwait
Asia/Qatar
Asia/Riyadh
Europe/Kaliningrad
Europe/Minsk
Indian/Antananarivo
Indian/Comoro
Indian/Mayotte
Asia/Riyadh87
Asia/Riyadh88
Asia/Riyadh89
Mideast/Riyadh87
Mideast/Riyadh88
Mideast/Riyadh89
Asia/Tehran
Iran
Asia/Baku
Asia/Dubai
Asia/Muscat
Asia/Tbilisi
Asia/Yerevan
Europe/Moscow
Europe/Samara
Europe/Simferopol
Europe/Volgograd
Indian/Mahe
Indian/Mauritius
Indian/Reunion
Asia/Kabul
Antarctica/Mawson
Asia/Aqtau
Asia/Aqtobe
254 IBM Operations Analytics - Log Analysis: Installation, Configuration, and Administration Guide

Table 69. Supported timezone names (continued)
Asia/Ashgabat
Asia/Ashkhabad
Asia/Dushanbe
Asia/Karachi
Asia/Oral
Asia/Samarkand
Asia/Tashkent
Indian/Kerguelen
Indian/Maldives
Asia/Calcutta
Asia/Colombo
Asia/Kolkata
Asia/Kathmandu
Asia/Katmandu
Antarctica/Vostok
Asia/Almaty
Asia/Bishkek
Asia/Dacca
Asia/Dhaka
Asia/Qyzylorda
Asia/Thimbu
Asia/Thimphu
Asia/Yekaterinburg
Indian/Chagos
Asia/Rangoon
Indian/Cocos
Antarctica/Davis
Asia/Bangkok
Asia/Ho_Chi_Minh
Asia/Hovd
Asia/Jakarta
Asia/Novokuznetsk
Asia/Novosibirsk
Asia/Omsk
Asia/Phnom_Penh
Asia/Pontianak
Asia/Saigon
Asia/Vientiane
Indian/Christmas
Antarctica/Casey
Asia/Brunei
Configuring 255

Table 69. Supported timezone names (continued)
Asia/Choibalsan
Asia/Chongqing
Asia/Chungking
Asia/Harbin
Asia/Hong_Kong
Asia/Kashgar
Asia/Krasnoyarsk
Asia/Kuala_Lumpur
Asia/Kuching
Asia/Macao
Asia/Macau
Asia/Makassar
Asia/Manila
Asia/Shanghai
Asia/Singapore
Asia/Taipei
Asia/Ujung_Pandang
Asia/Ulaanbaatar
Asia/Ulan_Bator
Asia/Urumqi
Australia/Perth
Australia/West
Hongkong
Singapore
Australia/Eucla
Asia/Dili
Asia/Irkutsk
Asia/Jayapura
Asia/Pyongyang
Asia/Seoul
Asia/Tokyo
Japan
Pacific/Palau
Australia/Adelaide
Australia/Broken_Hill
Australia/Darwin
Australia/North
Australia/South
Australia/Yancowinna
Antarctica/DumontDUrville
Asia/Khandyga
256 IBM Operations Analytics - Log Analysis: Installation, Configuration, and Administration Guide

Table 69. Supported timezone names (continued)
Asia/Yakutsk
Australia/ACT
Australia/Brisbane
Australia/Canberra
Australia/Currie
Australia/Hobart
Australia/Lindeman
Australia/Melbourne
Australia/NSW
Australia/Queensland
Australia/Sydney
Australia/Tasmania
Australia/Victoria
Pacific/Chuuk
Pacific/Guam
Pacific/Port_Moresby
Pacific/Saipan
Pacific/Truk
Pacific/Yap
Australia/LHI
Australia/Lord_Howe
Antarctica/Macquarie
Asia/Sakhalin
Asia/Ust-Nera
Asia/Vladivostok
Pacific/Efate
Pacific/Guadalcanal
Pacific/Kosrae
Pacific/Noumea
Pacific/Pohnpei
Pacific/Ponape
Pacific/Norfolk
Antarctica/McMurdo
Antarctica/South_Pole
Asia/Anadyr
Asia/Kamchatka
Asia/Magadan
Kwajalein
Pacific/Auckland
Pacific/Fiji
Pacific/Funafuti
Configuring 257

Table 69. Supported timezone names (continued)
Pacific/Kwajalein
Pacific/Majuro
Pacific/Nauru
Pacific/Tarawa
Pacific/Wake
Pacific/Wallis
NZ-CHAT
Pacific/Chatham
Pacific/Apia
Pacific/Enderbury
Pacific/Fakaofo
Pacific/Tongatapu
Pacific/Kiritimati
Loading and streaming dataBefore you can perform a search on log or other data, you must first load the datainto IBM Operations Analytics - Log Analysis. When the file is loaded the data isindexed and is then available to be searched.
There are two main scenarios for loading data:v Batch loading historic data. For example, you may want to ingest historic log
data in a single batch for analysis or for testing.v Streaming data from a monitored application. You may want to load data that is
streamed from a local or remote server.
You can load or stream data from local or remote servers. However, each tool isdesigned for a particular scenario. This is explained in the Intended uses of dataloading components table. IBM Operations Analytics - Log Analysis is installed withan internal version of the IBM Tivoli Monitoring Log File Agent. However, IBMOperations Analytics - Log Analysis can also load data from a separate installationof the IBM Tivoli Monitoring Log File Agent, known as an external IBM TivoliMonitoring Log File Agent.
Table 70. Intended uses of data loading components
Load batch of historic data Stream data
Component Local Remote Local Remote
Data Collectorclient
Yes Yes No No
Internal IBMTivoliMonitoring LogFile Agent
Yes Yes Yes Yes
External IBMTivoliMonitoring LogFile Agent
Yes Yes Yes Yes
logstash Yes Yes Yes Yes
258 IBM Operations Analytics - Log Analysis: Installation, Configuration, and Administration Guide

Table 70. Intended uses of data loading components (continued)
Load batch of historic data Stream data
Generic Receiver Yes Yes No No
Note: You must create a Data Source before you configure data loading. Forinformation about creating a Data Source, see the Data source creation topic.You can load log data into IBM Operations Analytics - Log Analysis using anumber of different methods:
Data Collector clientUse the Data Collector client to ingest data in batch mode. This is theeasiest method if you want to ingest a large log file for historic analysis ifyou want to test your IBM Operations Analytics - Log Analysisconfiguration before attempting the more complex IBM Tivoli MonitoringLog File Agent configuration. The Data Collector client is not designed foringesting data from remote sources. If you want to ingest a batch ofhistorical data from a remote source, use the IBM Tivoli Monitoring LogFile Agent.
For a video that demonstrates how to batch upload a WebSphereApplication Server or DB2 file using the Data Collector client, see ITOAvideos. For information about batch uploading alternative log file typessuch as Oracle alert logs, see Batch uploading Oracle Alert logs.
IBM Tivoli Monitoring Log File AgentUse the IBM Tivoli Monitoring Log File Agent for scenarios where youwant to stream log data from your production environment or to streamdata from a remote server.
For a video that demonstrates how to upload a WebSphere ApplicationServer or DB2 file using the IBM Tivoli Monitoring Log File Agent, seeITOA videos.
logstashlogstash can be used as a method to collect and load data into IBMOperations Analytics - Log Analysis.
Generic ReceiverUse the Generic Receiver to load data from the REST interface into IBMOperations Analytics - Log Analysis.
You cannot use IBM Operations Analytics - Log Analysis to index log records thatcontain non-ASCII characters. If your log records contain non-ASCII characters, therecords are not added when you use the IBM Tivoli Monitoring Log File Agent orthe Data Collector client. When you use the Data Collector client errors that relateto non-ASCII characters are added to the Generic Receiver log.
Example scenarios
The following table outlines a number of example scenarios to help illustrate howyou use the different components for different scenarios.
Table 71. Example data loading scenarios
Example Component
I want to load a batch of historic log data totest the environment.
Data Collector client
Configuring 259

Table 71. Example data loading scenarios (continued)
Example Component
I want to monitor an application on aremote server.
IBM Tivoli Monitoring Log File Agent
I want to use logstash to monitor log files ona remote server.
logstash
I want to load a batch of historic log data inthe JSON format.
Generic Receiver
Supported operating systems
The supported operating systems that you can install IBM Operations Analytics -Log Analysis are listed in the Installing Guide. In addition to these, you also needto know what operating systems are supported by the data streaming and loadingscenarios. For example, if you want to use the internal to stream data from aremote source, you need to know the supported operating systems.
Table 72. Supported operating systems for data loading
Scenario FeatureSupported operatingsystems
Use the Data Collector toload a batch of historic data
Data Collector v Red Hat Enterprise LinuxServer Edition Version 5 orVersion 6 (64 bit)
v SUSE Linux EnterpriseServer 11 (64 bit)
Use the internal IBM TivoliMonitoring Log File Agent tostream data
Internal IBM TivoliMonitoring Log File Agent
See the Requirements for themonitoring agent topic in thedocumentation for yourversion of IBM TivoliMonitoring at:TivoliMonitoring documentation
Use an external IBM TivoliMonitoring Log File Agent tostream data
External IBM TivoliMonitoring Log File Agent
See the Requirements for themonitoring agent topic in thedocumentation for IBMTivoli Monitoring 6.2.3.1at:Tivoli Monitoringdocumentation
Related concepts:“Data Source creation” on page 373You create data sources to ingest data from a specific source.“Installing logstash” on page 301Installing logstash on a remote node extends IBM Operations Analytics - LogAnalysis functions so it can ingest and perform metadata searches against log datathat is acquired by logstash.
Configuring data streamingBefore you can stream data, you must configure the tools that you use to send thedata to IBM Operations Analytics - Log Analysis.
260 IBM Operations Analytics - Log Analysis: Installation, Configuration, and Administration Guide

IBM Tivoli Monitoring Log File Agent configuration scenariosYou can use the internal IBM Tivoli Monitoring Log File Agent that is installedwith IBM Operations Analytics - Log Analysis or you can use an external IBMTivoli Monitoring Log File Agent to stream data from local or remote servers.
You can also use the IBM Tivoli Monitoring Log File Agent to upload a batch ofhistoric data. For more information, see “Loading batches of historic data with theIBM Tivoli Monitoring Log File Agent” on page 298.
You can integrate the IBM Tivoli Monitoring Log File Agent with IBM OperationsAnalytics - Log Analysis in two ways.
You can use it with the version of the IBM Tivoli Monitoring Log File Agent that isinstalled with IBM Operations Analytics - Log Analysis. This is known as theinternal IBM Tivoli Monitoring Log File Agent.
You can also use it with an IBM Tivoli Monitoring Log File Agent that has beeninstalled separately as part of another installation.
You can use local and remote versions of both types of IBM Tivoli Monitoring LogFile Agent.
The following graphic illustrates these possibilities:
The following possible scenarios are illustrated in the graphic:
1. Internal IBM Tivoli Monitoring Log File Agent on a local serverIn this scenario, you use the version of the IBM Tivoli Monitoring Log FileAgent that is installed with IBM Operations Analytics - Log Analysis toload data from the local installation of IBM Tivoli Monitoring to IBMOperations Analytics - Log Analysis.
2. External IBM Tivoli Monitoring Log File Agent on a local serverIn this scenario, you use a version of the IBM Tivoli Monitoring Log File
Configuring 261

Agent that was not installed with IBM Operations Analytics - Log Analysisbut that is installed on the same server as IBM Operations Analytics - LogAnalysis.
3. External IBM Tivoli Monitoring Log File Agent on a remote serverIn this scenario, you use an installation of an external IBM TivoliMonitoring Log File Agent to push data to IBM Tivoli Monitoring Log FileAgent. To facilitate this integration, you modify the properties of the IBMTivoli Monitoring Log File Agent.
4. Remote instance of the internal IBM Tivoli Monitoring Log File AgentIn this scenario, you use a the remote installer tool to install a remoteinstance of the internal IBM Tivoli Monitoring Log File Agent.
The following table summarizes the different configurations required for thescenarios.
Table 73. Configuration for data streaming scenarios
Data streamingscenario
IBM TivoliMonitoring Log FileAgent type Log file location
Required parametersin .conf file
1 Internal and local Local Datasources
2 Internal and remote.You use the remoteinstaller to create theremote instance.
Remote Datasources,ServerLocation,ServerPort,BufEvtMaxSize.
3 Local and external Local Datasources
4 Remote and external Remote Datasources,SshAuthType,SshHostList,SshPassword, SshPort,SshPrivKeyfile,SshPubKeyfile,SshUserid.
Specifying the configuration and format files:
Before you use an internal or external LFA, you may want to modify theconfiguration and format files.
About this task
For more information about how configuration and format files are used, see “LFAconfiguration and format files” on page 263.
For more information about the required parameters in the configuration file, see“Configuration file parameters” on page 230.
Procedure
1. Open the configuration file that you want to use.2. Define the required parameters in the configuration file. The required
parameters are different depending on the data loading scenario.v To stream data from a local server, specify the data sources in the
DataSources parameter.
262 IBM Operations Analytics - Log Analysis: Installation, Configuration, and Administration Guide

v To push data from a remote directory, you must specify values for theDatasources, ServerLocation, ServerPort, and BufEvtMaxSize parameter.
v To use an external IBM Tivoli Monitoring Log File Agent that is not installedas part of IBM Operations Analytics - Log Analysis, you must specify valuesfor the Datasources, SshAuthType, SshHostList, SshPassword, SshPort,SshPrivKeyfile, SshPubKeyfile, and SshUserid parameters.
3. Define the format file as required.4. (Optional) If you want to monitor log files type where the log files rotate
resulting in multiple log files, update the .fmt file for each rotating log type toallow for the appropriate name change. Open the .fmt file, and edit the line:-file FILENAME
to reflect the file name rotation. For example, for SystemOut log files where anumber is appended to the file name for each additional log, the FILENAME mustread:-file SystemOut*.log
5. Save your changes.
Example
For example:===============SshHostList=host1,host2,host3SshUserid=loguserSshAuthType=PASSWORDSshPassword=<password>
=====================SshHostList=host1,host2,host3SshUserid=loguserSshAuthType=PUBLICKEYSshPrivKeyfile = <SshUserid_Private_Key_File_Path>(Or)SshPubKeyfile = <SshUserid_Private_Key_File_Path>
======================
where <password> is the password that you want to use.
<SshUserid_Private_Key_File_Path> is the full path for the file that contains theprivate key of the user that is specified in the SshUserid user. For example, if yousave the password to a file called password.txt in the <HOME>/utilities directory,the full path is as follows:SshPrivKeyfile = <HOME>/utilities/password.txt
LFA configuration and format files:
If you use an internal or external LFA, you can edit the configuration and propertyfiles to suit your specific installation.
The LFA configuration for a particular data source is defined in the following files:v A <name>.conf file that contains the properties that are used by the LFA for
processing the log files.v A <name>.fmt file that contains an expression and format that is used by the
agent to identify matching log file records and to identify the properties toinclude in the Event Integration Format (EIF) record. The EIF is sent from the
Configuring 263

agent to the receiving server. The receiving server is the server where the LogAnalysis server is installed. The <name>.fmt file uses a regular expression todetermine matching records in the log file and to send each matching record tothe LFA server in an EIF event.
If you want to use the LFA to send your log files to the LFA server, you mustcustomize the regular expression and define your own stanza in the <name>.fmtfile to capture the log records that are to be sent. The event record format mustinclude the host name, file name, log path, and text message. The LFA server usesthese values to process the logs. For more information about the IBM Tivoli 6.3 LogFile Agent and the configuration files and properties, see Tivoli Log File AgentUser's Guide.
The file names must be identical for both files. For example,WASContentPack_v1.1.0-lfawas.conf and WASContentPack_v1.1.0-lfawas.fmt.
After you modify the configuration files as required, you use the LFA to load thedata into LFA. For a general description of how to do this, see “Loading a batch oflog files with the LFA” on page 274
If you use an external instance of the LFA to load data into the Log Analysisserver, you must install the configuration files into the agent. This configurationensures that the agent knows where the log files for a data source are located, howto process the records in the log file, and the server to which records are sent.
LFA configuration file examples
The following example shows the files that are installed as part of the WebSphereInsight Pack that is included as standard with Log Analysis.
The WASContentPack_v1.1.0-lfawas.conf file contains many properties, includingthe following examples:# Files to monitor. The single file /tmp/regextest.log, or any file like/tmp/foo-1.log or /tmp/foo-a.log.
LogSources=/home/unityadm/IBM/LogAnalysis/logsources/WASInsightPack/*
# Our EIF receiver host and port.ServerLocation=<EIF Receiver host name>ServerPort=5529
The WASContentPack_v1.1.0-lfawas.fmt file contains the following regularexpression that matches any record within a monitored log file. In this example,the regular expression matches all the log records in the file and to the OperationsAnalytics server as an EIF event. The EIF event contains the host name where theagent is running, the file name of the log file, the log file path of the log file, andthe log file record itself.// Matches records for any Log file:
//
REGEX AllRecords(.*)hostname LABEL-file FILENAMElogpath PRINTF("%s",file)text $1END
264 IBM Operations Analytics - Log Analysis: Installation, Configuration, and Administration Guide

Configuration file parameters:
The IBM Tivoli Monitoring Log File Agent uses the information that is specified inthe configuration file to process log file information.
Table 1 explains that parameters that you can modify in this file.
Table 74. Parameter summary
Parameter Description
DataSources Specify the data source that you want tomonitor. If you are specifying multiple datasources, they must be comma-separated andwithout spaces. When you configure aremote directory in the LFA conf file, thedirectory you specify must not contain anysubdirectories.
SshAuthType You must set this value to either PASSWORD orPUBLICKEY.
If you set this value to PASSWORD, IBMOperations Analytics - Log Analysis uses thevalue that is entered for SshPassword as thepassword for Secure Shell (SSH)authentication with all remote systems.
If you set this value to PUBLICKEY, IBMOperations Analytics - Log Analysis uses thevalue that is entered for SshPassword as passphrase that controls access to the private keyfile.
SshHostList You use the SshHostList value to specify thehosts where the remotely monitored log filesare generated. IBM Operations Analytics -Log Analysis monitors all the log files thatare specified in the LogSources orRegexLogSources statements in each remotesystem.
If you specify the local machine as a valuefor this parameter, the LFA monitors the filesdirectly on the local system. If you specifythat the localhost SSH is not used to accessthe files on the system, IBM OperationsAnalytics - Log Analysis reads the filesdirectly.
SshPassword If the value of the SshAuthType parameter isPASSWORD, enter the account password for theuser that is specified in the SshUseridparameter as the value for the SshPasswordparameter.
If the value of the SshAuthType parameter isPUBLICKEY, enter the pass phrase thatdecrypts the private key that is specified inthe SshPrivKeyfile parameter.
SshPort You specify the TCP port that is used forSSH connections. If you do not enteranything, this value is defaulted to 22.
Configuring 265

Table 74. Parameter summary (continued)
Parameter Description
SshPrivKeyfile If the value of the SshAuthType parameter isset to PUBLICKEY, enter the directory path tothe file that contains the private key of theuser that is specified in the SshUseridparameter as the value for this parameter.
If the value of the SshAuthType parameter isnot set to PUBLICKEY, this value is notrequired.
SshPubKeyfile If the value of the SshAuthType parameter isset to PUBLICKEY, enter the directory path tothe file that contains the public key of theuser that is specified in the SshUseridparameter as the value for this parameter.
If the value of the SshAuthType parameter isnot set to PUBLICKEY, this value is notrequired.
SshUserid Enter the user name from the remote systemthat the agent uses for SSH authentication.
Configuring and deploying LFAs in the command line:
You can use the command line to configure and deploy LFAs.
Before you begin
Before you can configure and deploy an LFA. You need to create the configurationand format files.
For more information about how configuration and format files are used, see “LFAconfiguration and format files” on page 263.
For more information about the required parameters in the configuration file, see“Configuration file parameters” on page 230.
About this task
CAUTION:
You cannot use non-ASCII characters in the installation path. The installationpath cannot exceed 80 characters.
For more information, about this and about how to configure the monitoring agentin step 3 see:
Configuring the monitoring agent
Procedure
1. To configure the LFA, run the command:./itmcmd config -A pc
266 IBM Operations Analytics - Log Analysis: Installation, Configuration, and Administration Guide

where pc is the product code for your agent. For example: ./itmcmd config –Alo.
2. You are prompted to supply the following information:
Enter instance name (default is: ):Enter the instance name. For example, rhelagent.
Conf file (default is: ):Enter the configuration file path. For example, /unity/IBM/ITM/config/lo/.
Format File (default is: ):Enter the format file path. For example, /unity/IBM/ITM/config/lo/.
Note: All fields must be completed. Blank fields can cause the LFA to fail.3. Where prompted, provide the monitoring agent configuration information.4. To start the LFA, run the command
./itmcmd agent -o instance name start lo
Configuring a remote LFA to stream data:
If you use a LFA that is installed on a remote server to stream data to IBMOperations Analytics - Log Analysis, you must update the configuration andformat files for the LFA.
Before you begin
You must create a custom data source before you configure data loading. Forinformation about creating a data source, see “Data Source creation” on page 373.
About this task
You can use the configuration files in the <HOME>/IBM-LFA-6.30/config/lo directoryas a basis for the configuration files on your remote server. However, you mustensure that the configuration files that you create:v contain a line separator between each property that you define in the .conf file.v use the .conf file extension and that the format file uses the .fmt extension.
To enable the LFA configuration, complete the following procedure:
Procedure
1. Specify a value or values for the DataSources property. If you have multiplelocations, you can list the locations and use a comma as a separator. Ensurethat you do not leave any spaces. For example, you specify the followingvalues to represent two data sources:DataSources=/opt/IBM/WAS1/logs/SystemOut.log,/opt/IBM/WAS2/logs/SystemOut.log
When you create a data source for a remote server, you must enter the correctversion of the host name for that server. To find the correct host name, run thefollowing command on the remote server:uname -a
Enter the name that is returned by this command in the host name parameterfor the data source.
2. Specify the server location for the EIF receiver server. For example, for a serverthat is at 111.222.333.444, specify the following value:
Configuring 267

ServerLocation=111.222.333.444
3. Specify the port that the EIF receiver uses. For example:ServerPort=5529
4. Specify the BufEvtPath for the LFA. The cached events are stored in this file.For example:BufEvtPath=/opt/IBM/LogAnalysis/logs/lfa-WASInsightPack.cache
5. Specify the maximum buffer size for the LFA. This parameter is the maximumsize that the cache is allowed to be. If the cache is full, events are dropped andperformance can decline. The value that you enter here is in kilobytes. Forexample:BufEvtMaxSize=102400
6. (Optional) If you want to monitor log files type where the log files rotateresulting in multiple log files, update the .fmt file for each rotating log type toallow for the appropriate name change. Open the .fmt file, and edit the line:-file FILENAME
to reflect the file name rotation. For example, for SystemOut log files where anumber is appended to the file name for each additional log, the FILENAME mustread:-file SystemOut*.log
7. Save your changes.
What to do next
Allow time for the log data to be loaded and then search for a value that iscontained in your log file to validate that the configuration is correct.
Configuring LFA subnodes:
Create an LFA subnode to group an explicit set of configurations that the LFA usesto identify and process a log event.
About this task
The subnode consists of a format (.fmt) file and a configuration (.conf) file. Asingle instance of the LFA can have multiple subnodes. Each subnode behaves likea single thread that is running in the same instance of the LFA.
You can create subnodes for the following use cases:
Improve performance by making generic format settings more specificTo improve overall performance, you can create specific configurations toreplace more generic ones. For example, you can specify the same regularexpression (REGEX) in a generic .fmt file to parse both WebSphereApplication Server (WAS) and DB2 log files. However, as the content of thelog files differs, this operation can become inefficient. To improveperformance, replace the single .fmt files with two new files that containtwo specific REGEXs for WAS and DB2 in two new subnodes.
Improve performance by making generic configuration settings more specificSimilarly, you can improve performance by replacing genericconfigurations with more specific ones. For example, you can specify thesame rollover behavior in a generic .conf to process both WAS and DB2log files. However, as the rollover behavior in the log files differs, this
268 IBM Operations Analytics - Log Analysis: Installation, Configuration, and Administration Guide

configuration results in some of the logs not being processed correctly andis inefficient. To improve performance, replace the single .conf with twonew files in two new subnodes.
Improve performance for many data sourcesIf you use many data sources to monitor the log events, you can createsubnodes to spread the workload.
Remote monitoring with IBM Tivoli Monitoring Log File Agent 6.3With IBM Tivoli Monitoring Log File Agent 6.3, you can modify the .conffile to monitor logs from multiple remote sources. However, the usercredentials might not be the same for the remote servers. You can maintainonly one set of user credentials in the LFA configuration file. In this case,you create multiple subnodes with different user credentials in each. Youcan use this feature to monitor multiple remote sources from a single LFAnode with multiple subnodes.
There is also a limitation on the naming of subnodes. For more information, see“Character limits for subnode names” on page 270.
Procedure
1. Go to the directory where the LFA is installed. For example, if you are usingthe internal LFA that is delivered with Log Analysis, the directory is<HOME>/IBM/LogAnalysis/IBM-LFA-6.30/config/lo.
2. To open LFA configuration window, run the following command:bin/CandleManage
3. Right-click the Tivoli Log File Agent service and click Configure.4. Click the instance that you want to configure and click OK. The Configure
Tivoli Log File Agent window is displayed.5. On the Log File Adapter Configuration tab, ensure that the Conf file and
Format File fields are blank.6. Click the Log File Adapter Global Settings tab and note the directory that is
specified in the Configuration file autodiscovery directory. This path is thedirectory where you save the subnode configuration files. Click OK.
7. In the subsequent window, you can ignore the other changes and click Save tosave your changes.
8. Enter the root user password when prompted to implement your changes.9. Copy the subnode configuration files to the directory that you noted in step 6.
The LFA automatically detects the changes. You do not need to restart the LFAinstance.
Results
The procedure describes how to configure subnodes in the LFA UI. You can alsouse the command line. To use the command line to configure the subnodes:1. Go to the directory where the LFA is installed.2. Run the following command:
itmcmd config -A lo
3. Complete the required steps.4. Specify the configuration file autodiscovery directory.5. Complete the configuration.6. Save the subnode configuration file to the directory that you specified in step 4.
Configuring 269

Character limits for subnode names:
When you name a subnode, ensure that you are aware of the character andnaming limitations.
32 character limitation
The LFA uses msn to name and identify the subnode. IBM Tivoli Monitoring limitsthe length of this name to 32 characters. The limit includes the identifier, the dash,and the semi-colon. This leaves 28 new characters for the host name, subnode andconfiguration file name.
The subnode name is specified in the following format:LO:<Hostname>_<Subnode>-<Conffilename>
where LO is an identifier that is assigned to all subnodes. <Hostname> is the hostname of the machine where the subnode is installed. <Subnode> is the name of thesubnode.<Conffilename> is the name of the subnode configuration file.
For example:LO:nc1234567890_WASInsightPack-lfawas
However, IBM Tivoli Monitoring limits the length of this name to 32 characters.The example name is 35 characters long. The limit includes the identifier, the dash,and the semi-colon, leaving 28 characters for the host name, subnode andconfiguration file name. To work around this limitation, IBM Tivoli Monitoringrenames the subnode as:LO:nc1234567890_WASInsightPack-l
This name is 32 characters long. The host name uses 12 characters. The subnodeuses 14 characters.
This limitation can cause an issue if you use similar names for the configurationfiles. For example, after you name the first subnode, you create another subnodecalled:LO:nc1234567890_WASInsightPack-lfawas2
IBM Tivoli Monitoring renames this subnode as:LO:nc1234567890_WASInsightPack-l
As you can see, due to the truncation, both subnodes now have the same name,meaning that the LFA will not detect the new configuration.
Increasing the limit
The host name is used for integrations with Tivoli Endpoint Manager, where ithelps you to identify subnodes. However, this is not required for Log Analysis.You remove the host name from the default naming convention so that you canuse all 28 characters for the configuration file name.
To change the host name setting:1. Stop the LFA.2. Open the <HOME>/IBM/LogAnalysis/IBM-LFA-6.30/config/lo/
lo_default_workload_instance.conf file.
270 IBM Operations Analytics - Log Analysis: Installation, Configuration, and Administration Guide
3. Change the default value for the following property from Y (Yes) to N (No):CDP_DP_USE_HOSTNAME_IN_SUBNODE_MSN=’N’
4. Save the updated file.5. Restart the LFA.
After you change this configuration setting, the subnode name no longer includesthe host name. For example, the subnodes in the previous example are now namedLO:WASInsightPack-lfawas and LO:WASInsightPack-lfawas2.
Considerations when using the LFA:
Before you use the LFA, read this topic to help you to understand some importantconsiderations and limitations.
Log file size
If your log files are likely to exceed 50 MB, increase the size of the LFA cache: Inthe appropriate configuration file, set BufEvtMaxSize=102400. For WAS log files,update <HOME>/IBM/LogAnalysis/IBM-LFA-6.30/config/lo/WASInsightPack-lfawas.conf. For DB2 log files, update <HOME>/IBM/LogAnalysis/IBM-LFA-6.30/config/lo/DB2InsightPack-lfadb2.conf.
You must delete the appropriate existing cache file. For WAS log files, delete<HOME>/IBM/LogAnalysis/logs/lfa-WASInsightPack.cache and for DB2 log files,delete <HOME>/IBM/LogAnalysis/logs/lfa-DB2InsightPack.cache
For very large log files, update the cache size of the EIF receiver. In the<HOME>/IBM/LogAnalysis/UnityEIFReceiver/config/eif.conf file, increase thevalue of the BufEvtMaxSize property.
For WAS, update <HOME>/IBM-LFA-6.30/config/lo/WASInsightPack-lfawas.conffile. DB2 update <HOME>/IBM-LFA-6.30/config/lo/DB2InsightPack-lfadb2.conf file.
If you make any changes to the configuration, you must restart the service for thechanges to take effect. To restart the service, from the <HOME>/IBM/LogAnalysis/utilities directory, run the following commands:v unity.sh -stop
v unity.sh -start
Maximum log line length
The LFA monitors each log file line. The default maximum line length that can beprocessed by the LFA is 4096 bytes. This is equivalent to 4096 ASCII characters.This limitation is related to the log line and not the log record. If a log recordconsists of multiple log lines, such as in the case of a stack trace, the limit appliesto each line. This is a limitation of the LFA and does not apply if you use analternative data collection mechanism.
Performance implications of using the LFA
Loading logs using the LFA is a CPU bound process. If your system does not meetthe minimum requirements you will need to increase the MaxEventQueueDepth. Onsome systems, altering this value may produce a noticeable impact onperformance. This will buffer additional LFA events while they are waiting to beprocessed. The required value for MaxEventQueueDepth may vary depending on the
Configuring 271

size of the rolled log and the number/speed of your CPU's. If you choose not toincrease this value, then older events may be replaced on the event queue bynewer events and not sent to the Log Analysis server.
To minimize the chance of data loss due to CPU bottlenecks, and to reduce thelatency between when a log record is written to the file and when it is loaded, werecommend that the maximum size of a log be small enough so that you systemdoes not fall behind while processing the logs.
Common LFA configuration conflicts:
When you create a remote LFA node and a custom data source and both use thesame log path, you can create a conflict.
When you create a custom data source and use it monitor a directory on a remoteLFA subnode and you later create another data source, like a remote data source,that monitors the same directory, you can create a conflict in the LFA configuration.These conflicts may cause errors in the Log Analysis log files and reduce theperformance of Log Analysis.
The following example is provided to help you to understand this situation.
To avoid these conflicts, you need to avoid monitoring the same directory withdifferent data sources. If you want to monitor two files in the same directory,include the file name in the Log Path field when you create the data source.
Example
For example, you are an administrator and you want to monitor files from an LFAthat is installed on a remote server as described in the Knowledge Centerdocumentation. See “Configuring a remote LFA to stream data” on page 267. Inthis case, the LFA is not part of the Log Analysis product.
First, you must create a custom data source called Customdatasource to load datafrom remote instance of the LFA. In the Data Source creation wizard, you specifythe host name and the following log path:/opt/WAS/WAS_logs/myLogFile.log
Next, you need to create the configuration and format files for the LFA sub nodes.You create two files, lfa1.conf and lfa1.fmt. In the lfa1.conf file, you specify thefollowing data source:Datasources=/WAS/WAS_logs/some_dir/*
Logs that are subsequently generated or appended are ingested by the Datasource1data source.
After some time, you create another data source to load data from the same remoteserver. The new log file is called newLogFile.log and it is located in the samedirectory as the file that you created the Customdatasource data source for. Youcreate a remote data source called Remotedatasource and specify the log path as:/opt/WAS/WAS_logs/newLogFile.log
Finally, you push the log files into Log Analysis.
However, after you push the log file, you notice some strange behaviour in the LogAnalysis log files. The GenericReceiver.log log file shows that the data is being
272 IBM Operations Analytics - Log Analysis: Installation, Configuration, and Administration Guide

ingested for /opt/WAS/WAS_logs/newLogFile.log. However, it also says that the/opt/WAS/WAS_logs/newLogFile.log log file is not a valid data source.
This occurs because the same log file is being monitored by both data sources. As aresult, it is monitored by two different LFA sub nodes and in two different streams.The data is loaded but this can waste resources and decrease the overallperformance.
To avoid this situation, you must be aware of any possible conflicts especiallywhen you create a custom data source that monitors a directory rather than a file.
Regular expression support for the LFA:
The LFA supports specific implementations of regular expressions.
Single-line unstructured data
If you want to use the DSV toolkit to extract and export the data in thecomma-separated value (CSV) format for use with the DSV toolkit, you can use aregular expression to extract and export the data.
For example, consider the following log file record:10453072 23460 E5D27197E653C548BDA744E8B407845B AOBEAI1 /EAI I H R SACP9002BPUSRSYS/612 23460 - XGNEA108:662:000042:06:E036977:WWS00003:7000:16:1:REV=NProc Time=000.03
You can configure Log Analysis to use a regular expression to extract and exportthe data in the comma-separated value (CSV) format. For example, here is anexample of a regular expression that is defined in the .fmt file:REGEX EAILOG⌂([0-9]*)(.*)SACP9002(.*):([0-9]*):([0-9]*):([0-9]*):([a-zA-Z0-9]*):([a-zA-Z0-9]*):([a-zA-Z0-9]*):(.*)Proc Time=([0-9]*.[0-9]*)timestamp $1 CustomSlot1discard $2SACP9002 $3bankID $4 CustomSlot3branchID $5 CustomSlot4discard3 $6tellerSID $7 CustomSlot5workstationID $8 CustomSlot6transactionTypeID $9 CustomSlot7discard4 $10responseTime $11 CustomSlot8msg PRINTF("%s,%s,%s,%s,%s,%s,%s",timestamp,bankID,branchID,tellerSID,workstationID,transactionTypeID,responseTime)END
Manipulating date time information for the Generic Annotation Insight Pack
If you use the Generic Annotation Insight Pack or the date time rule set from theGeneric Annotation Insight Pack in a custom Insight Pack, you can use somelimited regular expressions that you can use to parse time and date information.
The second delimiter, which is a colon (:), is not supported. The regular expressionreplaces the second delimiter with a period (.), which is supported. For example,to change a date from 15/12/2014 12:12:12:088 GMT to 15/12/2014 12:12:12.088GMT, you can add the following regular expression to the .fmt file:
Configuring 273

// Matches records for any Log file:// Log Analytics Data Source chas_access.log
REGEX nongr([0-9][0-9])/([0-9][0-9])/([0-9][0-9]) ([0-9][0-9]):([0-9][0-9]):([0-9][0-9]):([0-9][0-9][0-9]) ([A-Z][A-Z][A-Z])(.*Batch Status for.*)month $1day $2year $3hour $4minute $5second $6ms $7zone $8message $9hostname example.com-file /opt/la/IBM/LogAnalysis/logs/GenericReceiver.logRemoteHost ""logpath PRINTF("%s",file)text PRINTF("%s/%s/%s %s:%s:%s.%s %s %s", month, day, year, hour, minute,second, ms, zone, message)END
Loading a batch of log files with the LFA:
Use this example to help you to understand how to use the LFA to load log abatch of files.
Before you begin
Consider the size of the log files that you want to load. If a log file is in the regionof 50 MB, or more, in size, increase the size of the log file agent cache. In theappropriate configuration file, set BufEvtMaxSize=102400. For WAS log files, update<HOME>/IBM/LogAnalysis/IBM-LFA-6.30/config/lo/WASInsightPack-lfawas.conf.For DB2 log files, update <HOME>/IBM/LogAnalysis/IBM-LFA-6.30/config/lo/DB2InsightPack-lfadb2.conf.
You must delete the appropriate existing cache file. For WAS log files, delete<HOME>/IBM/LogAnalysis/logs/lfa-WASInsightPack.cache and for DB2 log files,delete <HOME>/IBM/LogAnalysis/logs/lfa-DB2InsightPack.cache
For very large log files, update the cache size of the EIF receiver. In the<HOME>/IBM/LogAnalysis/UnityEIFReceiver/config/eif.conf file, increase thevalue of the BufEvtMaxSize property.
Lines in a log that are longer than 4096 characters are, by default, ignored by theLFA. To force it to read lines longer than 4096 characters, add theEventMaxSize=<length_of_longest_line> property to the .conf file that will beused while loading the log.
For WAS update $UNITY_HOME/IBM-LFA-6.30/config/lo/WASInsightPack-lfawas.conf file. DB2 update $UNITY_HOME/IBM-LFA-6.30/config/lo/DB2InsightPack-lfadb2.conf file.
If you make any changes to the configuration, you must restart the service for thechanges to take effect. To restart the service, from the <HOME>/IBM/LogAnalysis/utilities directory, run the following commands:v <HOME>/IBM/LogAnalysis/utilities/unity.sh -stop
274 IBM Operations Analytics - Log Analysis: Installation, Configuration, and Administration Guide
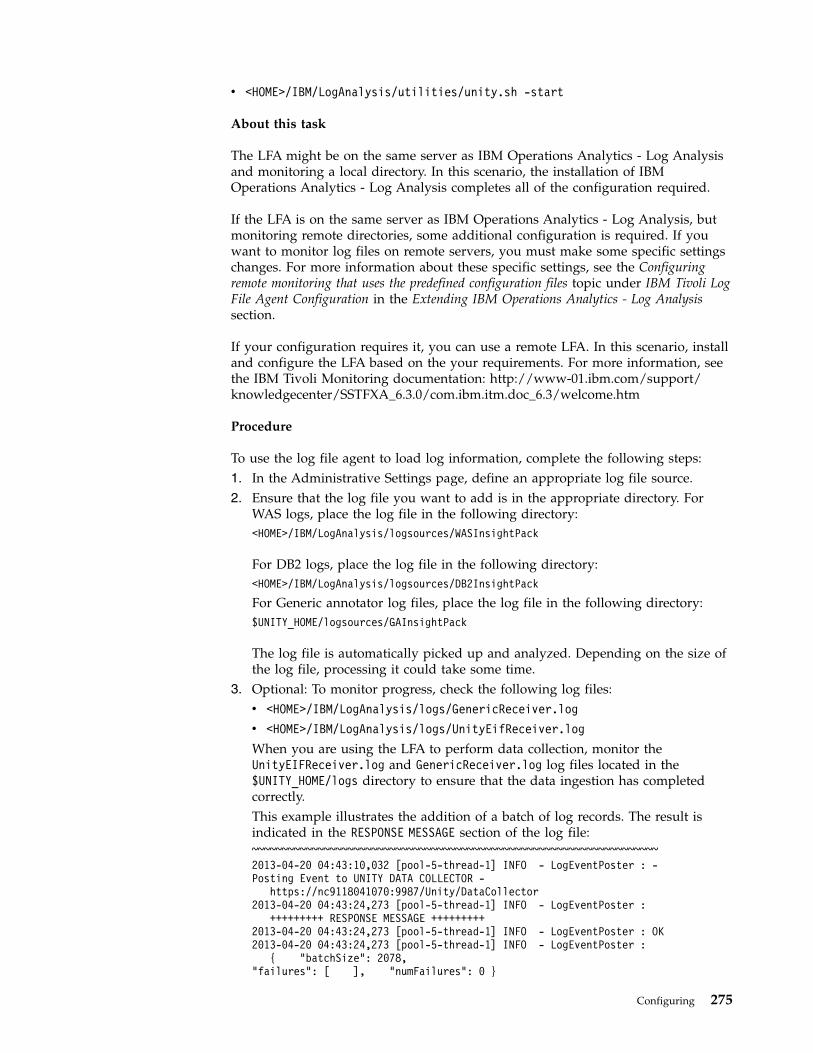
v <HOME>/IBM/LogAnalysis/utilities/unity.sh -start
About this task
The LFA might be on the same server as IBM Operations Analytics - Log Analysisand monitoring a local directory. In this scenario, the installation of IBMOperations Analytics - Log Analysis completes all of the configuration required.
If the LFA is on the same server as IBM Operations Analytics - Log Analysis, butmonitoring remote directories, some additional configuration is required. If youwant to monitor log files on remote servers, you must make some specific settingschanges. For more information about these specific settings, see the Configuringremote monitoring that uses the predefined configuration files topic under IBM Tivoli LogFile Agent Configuration in the Extending IBM Operations Analytics - Log Analysissection.
If your configuration requires it, you can use a remote LFA. In this scenario, installand configure the LFA based on the your requirements. For more information, seethe IBM Tivoli Monitoring documentation: http://www-01.ibm.com/support/knowledgecenter/SSTFXA_6.3.0/com.ibm.itm.doc_6.3/welcome.htm
Procedure
To use the log file agent to load log information, complete the following steps:1. In the Administrative Settings page, define an appropriate log file source.2. Ensure that the log file you want to add is in the appropriate directory. For
WAS logs, place the log file in the following directory:<HOME>/IBM/LogAnalysis/logsources/WASInsightPack
For DB2 logs, place the log file in the following directory:<HOME>/IBM/LogAnalysis/logsources/DB2InsightPack
For Generic annotator log files, place the log file in the following directory:$UNITY_HOME/logsources/GAInsightPack
The log file is automatically picked up and analyzed. Depending on the size ofthe log file, processing it could take some time.
3. Optional: To monitor progress, check the following log files:v <HOME>/IBM/LogAnalysis/logs/GenericReceiver.log
v <HOME>/IBM/LogAnalysis/logs/UnityEifReceiver.log
When you are using the LFA to perform data collection, monitor theUnityEIFReceiver.log and GenericReceiver.log log files located in the$UNITY_HOME/logs directory to ensure that the data ingestion has completedcorrectly.This example illustrates the addition of a batch of log records. The result isindicated in the RESPONSE MESSAGE section of the log file:~~~~~~~~~~~~~~~~~~~~~~~~~~~~~~~~~~~~~~~~~~~~~~~~~~~~~~~~~~~~~~~~~~~~2013-04-20 04:43:10,032 [pool-5-thread-1] INFO - LogEventPoster : -Posting Event to UNITY DATA COLLECTOR -
https://nc9118041070:9987/Unity/DataCollector2013-04-20 04:43:24,273 [pool-5-thread-1] INFO - LogEventPoster :
+++++++++ RESPONSE MESSAGE +++++++++2013-04-20 04:43:24,273 [pool-5-thread-1] INFO - LogEventPoster : OK2013-04-20 04:43:24,273 [pool-5-thread-1] INFO - LogEventPoster :
{ "batchSize": 2078,"failures": [ ], "numFailures": 0 }
Configuring 275

2013-04-20 04:43:24,273 [pool-5-thread-1] INFO - LogEventPoster :++++++++++++++++++++++++++++++++++++
2013-04-2 04:43:24,273 [pool-5-thread-1] INFO - LogEventPoster :EIF event delivery to Generic Receiver -- SUCCESS
~~~~~~~~~~~~~~~~~~~~~~~~~~~~~~~~~~~~~~~~~~~~~~~~~~~~~~~~~~~~~~~~~~~~~
In this log, the number of log records processed is indicated in the line:{ "batchSize": 2078, "failures": [ ], "numFailures": 0 }
2078 log records were successfully ingested. The numFailures value indicatesthe number of failures in the ingestion of the log records. For example, a valueof 5 for the numFailures value indicates that 5 log records were not ingested.When data collection has completed, if the EIF Receiver buffer is partiallyfilled, any remaining log records are posted to the Generic Receiver. This isrecorded in the log as a TIMEOUT FLUSH event. These events are added to the logfile at the end of the session of data collection:~~~~~~~~~~~~~~~~~~~~~~~~~~~~~~~~~~~~~~~~~~~~~~~~~~~~~~~~~~~~~~~~~~~~~~
2013-04-20 04:54:26,341 [pool-4-thread-1] INFO - LogEventService :TIMEOUT FLUSH for logsource:nc9118041070::/home/example/LogAnalytics/logsources/
WASInsightPack/TipTrace5.log2013-04-20 04:54:26,359 [pool-5-thread-1] INFO - LogEventPoster : ---Posting Event to UNITY DATA COLLECTOR -
https://nc9118041070:9987/Unity/DataCollector2013-04-20 04:54:38,581 [pool-5-thread-1] INFO - LogEventPoster :
+++++++++ RESPONSE MESSAGE +++++++++2013-04-20 04:54:38,582 [pool-5-thread-1] INFO - LogEventPoster : OK2013-04-20 04:54:38,582 [pool-5-thread-1] INFO - LogEventPoster :
{ "batchSize": 1714,"failures": [ ], "numFailures": 0 }2013-04-20 04:54:38,582 [pool-5-thread-1] INFO - LogEventPoster :
++++++++++++++++++++++++++++++++++++2013-04-20 04:54:38,582 [pool-5-thread-1] INFO - LogEventPoster :
EIF event delivery to Generic Receiver -- SUCCESS2013-04-20 04:54:38,583 [pool-4-thread-1] INFO - LogEventService :
POST RESULT:{"failures":[],"batchSize":1714,"numFailures":0}
~~~~~~~~~~~~~~~~~~~~~~~~~~~~~~~~~~~~~~~~~~~~~~~~~~~~~~~~~~~~~~~~~~~~~~~~
To calculate the number of events that have been processed, calculate the sumof all of the batchSize values. To calculate the number of events ingested,calculate the sum of all of the batchSize values and deduct the total sum ofnumFailure values.If the ingestion fails, an error message is recorded in the UnityEIFReceiver.log:2013-05-16 02:16:11,184 [pool-7-thread-1] INFO - LogEventPoster :
+++++++++ RESPONSE MESSAGE +++++++++2013-05-16 02:16:11,184 [pool-7-thread-1] INFO - LogEventPoster : Not Found2013-05-16 02:16:11,184 [pool-7-thread-1] INFO - LogEventPoster :
{"BATCH_STATUS":"NONE","RESPONSE_MESSAGE":"CTGLA0401E : Missing log source ","RESPONSE_CODE":404}2013-05-16 02:16:11,184 [pool-7-thread-1] INFO - LogEventPoster :
++++++++++++++++++++++++++++++++++++2013-05-16 02:16:11,184 [pool-7-thread-1] INFO - LogEventPoster :
FAILURE - ResponseCode:404 ResponseMessage:Not Found
Additional HTTP response codes are as follows:
413 Request Entity Too Large: Displayed if a batch size is greater than theGeneric Receiver default value set in the $UNITY_HOME/wlp/usr/servers/Unity/apps/Unity.war/WEB-INF/unitysetup.properties.
276 IBM Operations Analytics - Log Analysis: Installation, Configuration, and Administration Guide

500 Internal Server Error: Displayed when there is any issue withIBMOperations Analytics - Log Analysis such as a database error or anyother runtime error.
404 Not Found: Displayed when a Log Source is not found for a hostnameand log path combination in the request.
409 Conflict: Displayed if the data batch is posted for a Log Source that isan inactive state or if there is a conflict between the data posted andthe data expected by the server. For example, the inputType field in therequest JSON does not match the inputType field in the Collection forthe requested hostname and log path combination.
200 OK: Displayed when the request is processed by the server. The statusof the processed batch of records is returned with the total number ofrecords ingested, how many failed records are present and whichfailed.
400 Bad Request: Displayed when the request JSON does not contain therequired fields expected by the Generic Receiver or where the JSON isnot properly formed.
Results
After the task completes, the log file is indexed and can be searched using theSearch field on the IBM Operations Analytics - Log Analysis Dashboard.
Troubleshooting data loading:
When you are using the IBM Tivoli Monitoring Log File Agent to perform datacollection, monitor the UnityEIFReceiver.log and GenericReceiver.log log fileslocated in the <HOME>/logs directory to ensure that the data ingestion hascompleted correctly.
This example illustrates the addition of a batch of log records. The result isindicated in the RESPONSE MESSAGE section of the log file:~~~~~~~~~~~~~~~~~~~~~~~~~~~~~~~~~~~~~~~~~~~~~~~~~~~~~~~~~~~~~~~~~~~~~~~~~~~~~~~~~2013-04-20 04:43:10,032 [pool-5-thread-1] INFO - LogEventPoster : -----------Posting Event to UNITY DATA COLLECTOR -
https://nc9118041070:9987/Unity/DataCollector2013-04-20 04:43:24,273 [pool-5-thread-1] INFO - LogEventPoster :
+++++++++ RESPONSE MESSAGE +++++++++2013-04-20 04:43:24,273 [pool-5-thread-1] INFO - LogEventPoster : OK2013-04-20 04:43:24,273 [pool-5-thread-1] INFO - LogEventPoster :
{ "batchSize": 2078,"failures": [ ], "numFailures": 0 }2013-04-20 04:43:24,273 [pool-5-thread-1] INFO - LogEventPoster :
++++++++++++++++++++++++++++++++++++2013-04-2 04:43:24,273 [pool-5-thread-1] INFO - LogEventPoster :
EIF event delivery to Generic Receiver -- SUCCESS~~~~~~~~~~~~~~~~~~~~~~~~~~~~~~~~~~~~~~~~~~~~~~~~~~~~~~~~~~~~~~~~~~~~~~~~~~~~~~~~~
In this log, the number of log records processed is indicated in the line:{ "batchSize": 2078, "failures": [ ], "numFailures": 0 }
2078 log records were successfully ingested. The numFailures value indicates thenumber of failures in the ingestion of the log records. For example, a value of 5 forthe numFailures value indicates that 5 log records were not ingested.
Configuring 277
When data collection has completed, if the EIF Receiver buffer is partially filled,any remaining log records are posted to the Generic Receiver. This is recorded inthe log as a TIMEOUT FLUSH event. These events are added to the log file at the endof the session of data collection:~~~~~~~~~~~~~~~~~~~~~~~~~~~~~~~~~~~~~~~~~~~~~~~~~~~~~~~~~~~~~~~~~~~~~~~~~~~~~~~~~
2013-04-20 04:54:26,341 [pool-4-thread-1] INFO - LogEventService :TIMEOUT FLUSH for datasource:nc9118041070::/home/yogesh/IBM/LogAnalysis/logsources/WASInsightPack/TipTrace5.log
2013-04-20 04:54:26,359 [pool-5-thread-1] INFO - LogEventPoster : -----------Posting Event to UNITY DATA COLLECTOR -
https://nc9118041070:9987/Unity/DataCollector2013-04-20 04:54:38,581 [pool-5-thread-1] INFO - LogEventPoster :
+++++++++ RESPONSE MESSAGE +++++++++2013-04-20 04:54:38,582 [pool-5-thread-1] INFO - LogEventPoster : OK2013-04-20 04:54:38,582 [pool-5-thread-1] INFO - LogEventPoster :
{ "batchSize": 1714,"failures": [ ], "numFailures": 0 }2013-04-20 04:54:38,582 [pool-5-thread-1] INFO - LogEventPoster :
++++++++++++++++++++++++++++++++++++2013-04-20 04:54:38,582 [pool-5-thread-1] INFO - LogEventPoster :
EIF event delivery to Generic Receiver -- SUCCESS2013-04-20 04:54:38,583 [pool-4-thread-1] INFO - LogEventService :
POST RESULT:{"failures":[],"batchSize":1714,"numFailures":0}
~~~~~~~~~~~~~~~~~~~~~~~~~~~~~~~~~~~~~~~~~~~~~~~~~~~~~~~~~~~~~~~~~~~~~~~~~~~~~~~~~
To calculate the number of events that have been processed, calculate the sum ofall of the batchSize values. To calculate the number of events ingested, calculatethe sum of all of the batchSize values and deduct the total sum of numFailurevalues.
If the ingestion fails, an error message is recorded in the UnityEIFReceiver.log:2013-05-16 02:16:11,184 [pool-7-thread-1] INFO - LogEventPoster :
+++++++++ RESPONSE MESSAGE +++++++++2013-05-16 02:16:11,184 [pool-7-thread-1] INFO - LogEventPoster : Not Found2013-05-16 02:16:11,184 [pool-7-thread-1] INFO - LogEventPoster :
{"BATCH_STATUS":"NONE","RESPONSE_MESSAGE":"CTGLA0401E : Missing data source ","RESPONSE_CODE":404}2013-05-16 02:16:11,184 [pool-7-thread-1] INFO - LogEventPoster :
++++++++++++++++++++++++++++++++++++2013-05-16 02:16:11,184 [pool-7-thread-1] INFO - LogEventPoster :
FAILURE - ResponseCode:404 ResponseMessage:Not Found
Additional HTTP response codes are as follows:
413 Request Entity Too Large: Displayed if a batch size is greater than theGeneric Receiver default value set in the $UNITY_HOME/wlp/usr/servers/Unity/apps/Unity.war/WEB-INF/unitysetup.properties.
500 Internal Server Error: Displayed when there is any issue withIBMOperations Analytics - Log Analysis such as a database error or any otherruntime error.
404 Not Found: Displayed when a data source is not found for a hostname andlog path combination in the request.
409 Conflict: Displayed if the data batch is posted for a data source that is aninactive state or if there is a conflict between the data posted and the dataexpected by the server. For example, the inputType field in the requestJSON does not match the inputType field in the Collection for therequested hostname and log path combination.
278 IBM Operations Analytics - Log Analysis: Installation, Configuration, and Administration Guide

200 OK: Displayed when the request is processed by the server. The status ofthe processed batch of records is returned with the total number of recordsingested, how many failed records are present and which failed.
400 Bad Request: Displayed when the request JSON does not contain therequired fields expected by the Generic Receiver or where the JSON is notproperly formed.
Configuring the EIF ReceiverHow to configure remote or local installations of the Tivoli Event IntegrationFacility (EIF) receiver to work with IBM Operations Analytics - Log Analysis.
About this task
The following steps are the same for remote and local installations of the EIFunless stated otherwise.
Configuring receiver buffer size and timeout:
When collecting data using the IBM Tivoli Monitoring Log File Agent (LFA) andTivoli Event Integration Facility (EIF) Adapter flow, you might need to change therate at which events are flushed to the generic receiver for indexing. Incomingevents are buffered at the EIF receiver side.
About this task
To improve overall IBM Operations Analytics - Log Analysis performance, you canconfigure the buffer size and timeout period to match the rate of incoming events.When the event rate increases, increase the buffer size and decrease the timeoutperiod. When the event rate decreases, decrease the buffer size and keep thetimeout interval at the default value or increase it, depending on the event rate.
The following steps are the same for remote and local installations of the EIFunless stated otherwise.
Procedure
To change the buffer size and timeout parameters:1. Stop IBM Operations Analytics - Log Analysis:v If you use a local installation of the EIF, use the following command to stop
IBM Operations Analytics - Log Analysis:<HOME>/IBM/LogAnalysis/utilities/unity.sh -stop
v If you use a remote installation of the EIF, use the eifutil.sh -stopcommand to stop the instances. For more information, see “eifutil.shcommand” on page 77.
2. Open the configuration file for editing:v If you use a local installation of the EIF, open the unity.conf file in the
<HOME>/IBM/LogAnalysis/UnityEIFReceiver/config/ directory.v If you use a remote installation of the EIF, the unity.conf file is in the
<remote_deployment_location>/LogAnalysis/DataForwarders/EIFReceivers/<eif_inst_#>/config/unity.conf directory. Where<remote_deployment_location> is the directory on the remote machine whereyou deployed the EIF instance. <eif_inst_#> is the folder used for the specificremote EIF instance.
Configuring 279

3. Change the Timeout and Buffer Size parameters to suit your operatingenvironment:#Timeout in Secondslogsource.buffer.wait.timeout=10#Buffer Size in Byteslogsource.max.buffer.size=250000
4. Save your changes.5. Start IBM Operations Analytics - Log Analysis:v If you use a local installation of the EIF, use the following command to start
IBM Operations Analytics - Log Analysis:<HOME>/IBM/LogAnalysis/utilities/unity.sh -start
v If you use a remote installation of the EIF, use the eifutil.sh -startcommand to start the instances. For more information, see “eifutil.shcommand” on page 77.
Results
With higher buffer sizes, notice that it takes a longer time to fill the buffer withevents and for batches to be posted to the receiver.
Configuring the EIF receiver user account:
The Tivoli Event Integration Facility (EIF) receiver uses the default unityuser useraccount to access the generic receiver. You can change the user account or thedefault user password in the unity.conf configuration file.
About this task
The following steps are the same for remote and local installations of the EIFunless stated otherwise.
Procedure
To change the default EIF user or password:1. Stop IBM Operations Analytics - Log Analysis:v If you use a local installation of the EIF, use the following command to stop
IBM Operations Analytics - Log Analysis:<HOME>/IBM/LogAnalysis/utilities/unity.sh -stop
v If you use a remote installation of the EIF, use the eifutil.sh -stopcommand to stop the instances. For more information, see “eifutil.shcommand” on page 77.
2. Open the configuration file for editing:v If you use a local installation of the EIF, open the unity.conf file in the
<HOME>/IBM/LogAnalysis/UnityEIFReceiver/config/ directory.v If you use a remote installation of the EIF, the unity.conf file is in the
<remote_deployment_location>/LogAnalysis/DataForwarders/EIFReceivers/<eif_inst_#>/config/unity.conf directory. Where<remote_deployment_location> is the directory on the remote machine whereyou deployed the EIF instance. <eif_inst_#> is the folder that is used for thespecific remote EIF instance.
3. Change the following userid and password parameters to suit your operatingenvironment:
280 IBM Operations Analytics - Log Analysis: Installation, Configuration, and Administration Guide

unity.data.collector.userid=unityuser
unity.data.collector.password=password
To encrypt the password, use the unity_securityUtility.sh command. Formore information, see “Changing the default password for the Data Collectorand EIF Receiver” on page 300.
4. Save your changes.5. Restart IBM Operations Analytics - Log Analysis:v If you use a local installation of the EIF, use the following command to
restart IBM Operations Analytics - Log Analysis:<HOME>/IBM/LogAnalysis/utilities/unity.sh -restart
v If you use a remote installation of the EIF, use the eifutil.sh -restartcommand to restart the instances. For more information, see “eifutil.shcommand” on page 77.
Results
The EIF receiver uses the new credentials to access the generic receiver.
Configuring the number of events in the EIF Receiver:
You can configure the number of events that the EIF Receiver stores for eachinternal queue. If you intend to ingest a large quantity of data and at a high rate,configure these values to larger values. However, increasing this value alsoincreases the memory requirements for EIF Receiver.
About this task
Ensure that you have sufficient memory to support the number of events in thequeue.
The following steps are the same for remote and local installations of the EIFunless stated otherwise.
Procedure
To change this setting:1. Stop IBM Operations Analytics - Log Analysis:v If you use a local installation of the EIF, use the following command to stop
IBM Operations Analytics - Log Analysis:<HOME>/IBM/LogAnalysis/utilities/unity.sh -stop
v If you use a remote installation of the EIF, use the eifutil.sh -stopcommand to stop the instances. For more information, see “eifutil.shcommand” on page 77.
2. Open the configuration file for editing:v If you use a local installation of the EIF, open the unity.conf file in the
<HOME>/IBM/LogAnalysis/UnityEIFReceiver/config/ directory.v If you use a remote installation of the EIF, the unity.conf file is in the
<remote_deployment_location>/LogAnalysis/DataForwarders/EIFReceivers/<eif_inst_#>/config/unity.conf directory. Where<remote_deployment_location> is the directory on the remote machine whereyou deployed the EIF instance. <eif_inst_#> is the folder used for the specificremote EIF instance.
Configuring 281

3. Locate these lines and change the value to reflect your requirements:unity.data.collector.eif.consumer.num.events=1000000unity.data.collector.event.manager.num.events=20000
The following settings are applicable per data source:unity.data.collector.event.service.num.events=20000unity.data.collector.event.poster.num.events=500
4. Save your changes.5. Start IBM Operations Analytics - Log Analysis:v If you use a local installation of the EIF, use the following command to start
IBM Operations Analytics - Log Analysis:<HOME>/IBM/LogAnalysis/utilities/unity.sh -start
v If you use a remote installation of the EIF, use the eifutil.sh -startcommand to stop the instances. For more information, see “eifutil.shcommand” on page 77.
Configuring the EIF Receiver memory clean up interval:
IBM Operations Analytics - Log Analysis ensures that the memory used for datacollection with the Log File Agent using a property in the <HOME>/IBM/LogAnalysis/UnityEIFReceiver/config/unity.conf file. The EIF Receiver uses thisvalue to manage the memory usage. The configuration cycle is set to a value inminutes with a default value of 2 minutes.
About this task
The following steps are the same for remote and local installations of the EIFunless stated otherwise.
Procedure
To configure this property:1. Stop IBM Operations Analytics - Log Analysis:v If you use a local installation of the EIF, use the following command to stop
IBM Operations Analytics - Log Analysis:<HOME>/IBM/LogAnalysis/utilities/unity.sh -stop
v If you use a remote installation of the EIF, use the eifutil.sh -stopcommand to stop the instances. For more information, see “eifutil.shcommand” on page 77.
2. Open the configuration file for editing:v If you use a local installation of the EIF, open the unity.conf file in the
<HOME>/IBM/LogAnalysis/UnityEIFReceiver/config/ directory.v If you use a remote installation of the EIF, the unity.conf file is in the
<remote_deployment_location>/LogAnalysis/DataForwarders/EIFReceivers/<eif_inst_#>/config/unity.conf directory. Where<remote_deployment_location> is the directory on the remote machine whereyou deployed the EIF instance. <eif_inst_#> is the folder that is used for thespecific remote EIF instance.
3. Change the parameters to suit your operating environment:#gc interval is in minutesunity.data.collector.gc.interval=2
4. Save your changes.5. Start IBM Operations Analytics - Log Analysis:
282 IBM Operations Analytics - Log Analysis: Installation, Configuration, and Administration Guide
v If you use a local installation of the EIF, use the following command to startIBM Operations Analytics - Log Analysis:<HOME>/IBM/LogAnalysis/utilities/unity.sh -start
v If you use a remote installation of the EIF, use the eifutil.sh -startcommand to start the instances. For more information, see “eifutil.shcommand” on page 77.
Configuring scalable data streaming from multiple, remotesourcesTo facilitate dynamic data streaming that is scalable across multiple remote sources,you must configure IBM Operations Analytics - Log Analysis after you install it.
To enable data collection from remote hosts, you must complete the followingsteps:1. Install Apache Solr on the remote machine.2. Set up Secure Shell (SSH) communication.3. Configure SSH to work with the remote installer utility.4. Use the remote installer utility to install instances of the Event Integration
Facility (EIF) or the IBM Tivoli Monitoring Log File Agent (LFA) on remotemachines.
5. Configure the EIF so that it is compatible with the remote instances that yourcreate. If you use the LFA, you do not have to configure the local installation.However, you do have to manually configure the sub nodes.
You can also maintain and administer these connections after you set them up.
As an alternative to streaming data, You can batch load data. For moreinformation, see “Loading and streaming data” on page 258.
Installing Apache Solr on remote machines:
After you install IBM Operations Analytics - Log Analysis, you can use the ApacheSolr remote installer to install Apache Solr on a remote machine.
About this task
If no local instances of Apache Solr exist, then you need to install the instances onthe remote machine as soon as you install IBM Operations Analytics - LogAnalysis. If there is a local instance of Apache Solr, you can install the remoteinstances whenever you want.
You must use a non-root user to run the script.
You cannot use the installer to install Apache Solr on a local machine.
You cannot use the installer to install multiple Apache Solr nodes on a singleremote machine.
Ensure that the Apache Solr ports are open and free from any firewall restrictionson the remote machine.
To install Apache Solr on multiple remote machines, run the script separately foreach remote machine. You cannot use the installer to install instances of ApacheSolr simultaneously or in parallel.
Configuring 283

Procedure
1. Change the directory to <HOME>/IBM/LogAnalysis/solr_install_tool. Forexample:cd <HOME>/IBM/LogAnalysis/solr_install_tool
2. To run the remote_deploy.sh script, enter the following command:./remote_deploy_solr.sh -install
3. The script prompts you for the following information:
Remote Hostname in FQDN formatEnter the Fully Qualified Domain Name (FQDN) of the remote host.
UsernameEnter the user name.
PasswordEnter the password if password-less SSH authentication is disabled. Ifpassword-less SSH is enabled between the IBM Operations Analytics -Log Analysis server and the remote host, the script reads the valuesthat are specified in the ssh_config.properties file in the<HOME>/IBM/LogAnalysis/utilities/config directory. For moreinformation, see the Setting up Secure Shell to use key-based authenticationtopic in the IBM Operations Analytics - Log Analysis informationcenter.
SSH PortEnter the remote machine port that is used for SSH. To use the defaultvalue of 22, press enter.
Top-level Installation DirectoryTo use the default value, which is <HOME>, press enter. Alternatively, youcan enter the path to the directory where you want to install the DE.
Apache Solr Search PortTo use the default value, 9989, press enter. To use another port, enterthe port number for another valid port. Do not enter a port that isbeing used for something else.
Apache Solr Query Service PortTo use the default value, 7205, press enter. To use another port, enterthe port number for another valid port. Do not enter a port that isbeing used for something else.
4. To start the installation, press enter. In most cases, the installation takes about 5minutes to complete.
Results
The results of the installation are output in the log file in the <HOME>/IBM/LogAnalysis/solr_install_tool/logs/ManageSolrnodes.log file.
To view the status for the instances of Apache Solr that are installed remotemachines, run the unity.sh -status command.
Example
Here is an example script output:Remote Hostname in FQDN format:12345.example.comusername:unitypassword:*********
284 IBM Operations Analytics - Log Analysis: Installation, Configuration, and Administration Guide

SSH port: [22]Top-level Installation Directory: [/home/unity]Solr Search Port: [9989]Solr Query Service Port: [7205]
Script is ready for remote installation of Solr:Review the following inputs ....-----------------------------------------------------------------------------Remote Host Name: 12345.example.comRemote User Name: unityRemote SSH Port: 22Top-level remote installation directory: /home/unitySolr v9.0 - remote installation directory:/home/unity/IBM/LogAnalysisSolr - remote ports: 9989, 7205------------------------------------------------------------------------[’q’ - Abort][’Enter’ - Install]
Sat Nov 16 03:08:38 CST 2013 Starting remote installation of Solr, this will take couple of minutes to complete ....Sat Nov 16 03:08:38 CST 2013 Waiting for remote installation to complete ....Sat Nov 16 03:11:47 CST 2013 Successfully installed SolrSolr on remote host:12345.example.com ....
Removing Apache Solr instances:
Before you remove an installation of IBM Operations Analytics - Log Analysis, youmust remove Apache Solr.
About this task
Note: Do not remove Apache Solr if IBM Operations Analytics - Log Analysis isstill being used. IBM Operations Analytics - Log Analysis does not functionproperly when any instances of Apache Solr are removed. For this reason, onlyremove Apache Solr when you are about to uninstall IBM Operations Analytics -Log Analysis.
If you installed Apache Solr locally and remotely, remove the local instance first,then remove the remotely installed instances.
This process uses Installation Manager to remove Apache Solr instances. You canalso do so silently. To run the silent removal, run following imcl -c command,enter 3 to modify the installation, and remove the instance.
Procedure
1. Change the directory to <HOME>/IBM/LogAnalysis/solr_install_tool. Forexample:cd <HOME>/IBM/LogAnalysis/solr_install_tool
2. To run the remote_deploy.sh uninstall script, enter the following command:./remote_deploy.sh -uninstall
3. The script prompts you for the following information:
Remote Hostname in FQDN formatEnter the Fully Qualified Domain Name (FQDN) of the remote host.
UsernameEnter the user name.
PasswordEnter the password if password less SSH authentication is disabled. If
Configuring 285

password less SSH is enabled between the IBM Operations Analytics -Log Analysis server and the remote host, the script reads the valuesthat are specified in the ssh_config.properties file in the<UNITY_HOME>/utilities/config directory. For more information, seethe Setting up Secure Shell to use key-based authentication topic in the IBMOperations Analytics - Log Analysis information center.
SSH PortEnter the remote machine port that is used for SSH. To use the defaultvalue of 22, press enter.
Top-level Installation DirectoryTo use the default value, which is <HOME>/IBM/LogAnalysis, press enter.Alternatively, you can enter the path to the directory where ApacheSolr is installed.
4. To start the removal, press enter. You can view the logs in the<HOME>/IBM/LogAnalysis/solr_install_tool/logs directory.
Results
When all the remote nodes are removed, you can safely uninstall IBM OperationsAnalytics - Log Analysis.
Setting up Secure Shell to use key-based authentication:
Secure Shell (SSH) is a cryptographic network protocol for secure datacommunication between different computers. You set up key-based authenticationbetween the IBM Operations Analytics - Log Analysis servers and the remotecomputers to which it connects.
About this task
Benefits of using key-based authentication:v Data is transferred across a secure channel.v The administrator is no longer concerned about the password changes for the
remote servers.v The passphrase is independent of the individual server password policy.v One passphrase is used for multiple servers. Only the public key file must be
copied to the client server.
For more information you can view the man pages for ssh-keygen by running thiscommand:man ssh-keygen
Procedure
1. To generate public and private keys, enter the following command:ssh-keygen -t rsa
or either of the following commands:ssh-keygen(This command generates the same results as ssh-keygen -t rsa.)
ssh-keygen -t dsa(If you specify dsa, the generated keys include _dsa in their file names.)
The following example shows what a valid output might look like:
286 IBM Operations Analytics - Log Analysis: Installation, Configuration, and Administration Guide

bash-3.2$bash-3.2$ ssh-keygen -t rsaGenerating public/private rsa key pair.Enter file in which you want to save the key (/home/unity/.ssh/id_rsa):Enter passphrase (empty for no passphrase):Enter same passphrase again:Your identification has been saved in /home/unity/.ssh/id_rsa.Your public key has been saved in /home/unity/.ssh/id_rsa.pub.The key fingerprint is:4a:ef:d5:7a:d8:55:b3:98:a1:1f:62:be:dd:c4:60:6e unity@<variable>.example.comThe key’s randomart image is:+--[ RSA 2048]----+| || || || . ..|| . S .o+.o|| . o =o++. || . . +o+E.o || . ..o=.o || . .o.. . |+-----------------+bash-3.2$
Enter the passphrase. (The Enter passphrase field can remain blank to specifyan empty passphrase.)
2. To view the contents of the public key file, run the following commands:cd ~/.sshls -l id_rsa*cat id_rsa.pub
The command output is:bash-3.2$bash-3.2$ cat .ssh/id_rsa.pubssh-rsa AAAAB3NzaC1yc2EAAAADAQABAAABAQDg0/GGoxGzyC7Awjbwnp0hCaeztIRt6yhAgGKdwM7nb7Iiv0RgwT4/48E26K1Ur9HrI1W/j0K0JHQwvaAFibqeLmqLdK9ctCE901ywTOPFcYeBYPUF9vp/MgaypgGxVwDbW/e0SNPb7YAtZpjRoqeUqoYoKzFXXspQkxdhcQfpx0RYMbQdGGg03hDCM2wr2KPVuTVniF2IvDu1C4fcRkUPr8aQNMiuEcJgV3VHhlau/0Uo0YpH53NXKhn/sx8xdyTVsKQ1rhW8g07HIVc2Tf9ZF2gYXn/HbjE509xK/APu2nztt0h+AirJyT5jYMi/IvSI0zbPyc0p9WijPeG8r/v unity@<variable>.in.ibm.combash-3.2$
3. Create a directory called .ssh on the remote server. Use this to store the publickey.
4. Copy the public key file (id_rsa.pub) to the .ssh directory on the remote client:scp /home/unity/.ssh/id_rsa.pub<username>@<remotehostname>:/<HOME>/.ssh/id_rsa.pub
where <hostname> is the system host name and <username> is the system username.
5. Add the content of the public key to the authorized_keys file on the remotehost.bash-3.2$ ssh <username>@<remotehostname>bash-3.2$ cd ~/.sshbash-3.2$ cat id_rsa.pub >> authorized_keysbash-3.2$ rm id_rsa.pubbash-3.2$ exit
6. Ensure that there are no duplicate keys for the same client in theauthorized_keys file.
7. Log in to the remote computer to ensure that key-based SSH is working:ssh <username>@<hostname>
Configuring 287

Enter the passphrase, if prompted.
bash-3.2$ bash-3.2$ ssh <username>@<remotehostname>Enter passphrase for key ’/home/unity/.ssh/id_rsa’:Last unsuccessful login: Mon Jul 15 14:22:37 2013 on ssh from <variable>.example.comLast login: Mon Jul 15 14:26:54 2013 on ssh from <variable>.example.com$
Configuration of key-based authentication is complete.
Results
The steps may not work because different versions of SSH are supported by theoperating systems that are used by the remote servers. For more information abouthow to solve this issue, see the Secure Shell (SSH) configuration does not work topicin the Troubleshooting IBM Operations Analytics - Log Analysis guide.
Configuring secure shell (SSH) communication for multiple remote hosts:
Before you can use the remote installer utility, you must configure the SSH for theremote hosts.
Before you begin
Before you configure SSH for multiple remote hosts, you must configure SSHbetween IBM Operations Analytics - Log Analysis and the remote hosts. For moreinformation, see the Setting up Secure Shell to use key-based authentication topic in theInformation Center.
About this task
By default, the SSH properties file, ssh-config.properties file, is in the<HOME>/IBM/LogAnalysis/remote_install_tool/config directory. If you save the fileto another location, the utility requests that the user enters values for the remotehost, user, and password. In this case, the utility does not use the values specifiedin the file.
If you save the ssh-config.properties file in the <HOME>/IBM/LogAnalysis/remote_install_tool/config directory, the eif_remote_install_tool utility usesthe properties specified in the file.
The SSH communication can be based on a password or public key. If youimplement both options, the public key configurations are used by default.
To set up password based SSH, you specify a value for the password and commentout the private key file. The remote installer utility uses the specified password forSSH authentication when it connects to the remote host.
To set up private key file based authentication, you specify the private key filepath and do not specify a value for the password. The utility uses the file to createa password-less SSH connection.
If you specify values for both the password and the private key file path, theutility uses the file to create a password-less SSH connection.
288 IBM Operations Analytics - Log Analysis: Installation, Configuration, and Administration Guide

If you do not specify a value for the password or the private key file path, IBMOperations Analytics - Log Analysis cannot create a connection and insteadgenerates an error message in the log:
ERROR:example.unity.remote.SshConfigException:
Property file config/ssh-config.properties must contain at least one of:PASSWORD, PATH_OF_PASSWORD_LESS_SSH_KEY
Correct SSH configuration OR reconfigure and retryInstallation Aborted....!
Procedure
1. Navigate to the <HOME>/IBM/LogAnalysis/remote_install_tool/config directoryand open the ssh-config.properties file.
2. Specify values for the following properties for each remote host:v Remote hostv Remote user IDv Portv Connection timeout in milliseconds. The default is 6000.
For example:REMOTE_HOST=<REMOTE_HOST>PORT=<PORT>TIME_OUT=60000USER=<REMOTE_USER>
3. For password-based authentication, you also need to specify the password inthe configuration file. For example:PASSWORD=password1
4. For public key based authentication, specify the path to the directory thatcontains the private key file. For example:PATH_OF_PASSWORD_LESS_SSH_KEY=/home/pass/.ssh/id_rsa
5. If your installation of SSH requires a passphrase, specify the passphrase. Forexample:PASSPHRASE_OF_PASSWORD_LESS_SSH_KEY=passphrase1
Configuring data collection for scalability on multiple remote nodes:
To facilitate scalable data collection on multiple remote nodes, use the install.shcommand to install the Tivoli Event Integration Facility Receiver or the IBM TivoliMonitoring Log File Agent on a remote server.
Before you begin
Before you run the command, you must configure secure shell (SSH)communication between the local installation of IBM Operations Analytics - LogAnalysis and the remote host. For more information about how to do so, see“Configuring secure shell (SSH) communication for multiple remote hosts” onpage 74.
About this task
The install.sh command is in the <HOME>/IBM/LogAnalysis/remote_install_tool/directory on the local installation of IBM Operations Analytics - Log Analysis.
You can use the remote installer in the following scenarios:
Configuring 289

v If you have a high rate of data ingestion on multiple data sources. For example,if you have 100 or more events per second and 20 or more data sources.
v If you require improved throughput performance on the remote server.v If the hardware resources on the remote server are restrained.v If you want to optimize performance according to the conditions described on
the Performance developer works page here: https://www.ibm.com/developerworks/community/wikis/home?lang=en#!/wiki/IBM Log AnalyticsBeta/page/Performance and tuning
You can use the command to deploy up to 20 instances of the Tivoli EventIntegration Facility Receiver or a single instance of the IBM Tivoli Monitoring LogFile Agent on a remote node. The command deploys and configures IBM Java 1.8.The command also configures the deployed Tivoli Event Integration FacilityReceiver instance to communicate with the IBM Operations Analytics - LogAnalysis Data Collector interface.
However, this command does not configure the IBM Tivoli Monitoring Log FileAgent subnode. You must configure this setting manually. Both the remote andlocal instance of the IBM Tivoli Monitoring Log File Agent can monitor remotedata sources. For more information about configuring IBM Tivoli Monitoring LogFile Agent, see “Configuring a remote LFA to stream data” on page 267.
To ensure that the remote instances of the Tivoli Event Integration Facility workwith the local Data Collector interface, you must create the remotelydeployedTivoli Event Integration Facility or IBM Tivoli Monitoring Log File Agentinstances as part of the same installation. This is because the encryptionconfiguration and signature generation is done during the main installation. If youinstall IBM Operations Analytics - Log Analysis after you set up the remote nodes,you must install the remote Tivoli Event Integration Facility or IBM TivoliMonitoring Log File Agent instances again. However, you can remove remoteinstances of the Tivoli Event Integration Facility or IBM Tivoli Monitoring Log FileAgent without installing IBM Operations Analytics - Log Analysis again.
Note: If you use the script to install the remote instance on a server that uses theSUSE Linux Enterprise Server 11 operating system, the script fails. To resolve thisissue, see the Cannot install remote EIF instance on SUSE topic in the TroubleshootingIBM Operations Analytics - Log Analysis guide.
Note:
The remote installer that you use to install instances of the IBM Tivoli MonitoringLog File Agent and the Tivoli Event Integration Facility does not support crossoperating system integration. You must use the remote installers to install remoteinstances on servers that use the same operating system. For example, if you installIBM Operations Analytics - Log Analysis on Linux on System z, you must installthe remote instances on Linux on System z. In this example, you cannot installremote instances on Linux on System x.
Procedure
1. Navigate to the <HOME>/IBM/LogAnalysis/remote_install_tool/ directory andrun the install.sh command. You are prompted for a series of inputs.
2. Enter the remote installation directory. This value must be the location wherethe deployed artifacts are installed on the remote host.
290 IBM Operations Analytics - Log Analysis: Installation, Configuration, and Administration Guide

3. If you want to deploy the Tivoli Event Integration Facility Receiver, select it. Ifyou do, enter the Tivoli Event Integration Facility Receiver instances that youwant to deploy.
4. If you want to deploy the IBM Tivoli Monitoring Log File Agent instance onthe remote node, select it.
Results
After you complete the procedure, you can now collect data from the remote hosts.
What to do next
After the initial setup, you will want to periodically change the configuration. IBMprovides two commands to start and stop the instances so that you can update theconfiguration.
To administer Tivoli Event Integration Facility Receiver instances, use theeifutil.sh command.
To administer IBM Tivoli Monitoring Log File Agent instances, use the lfautil.shcommand.
eifutil.sh command:
To administer EIF Receiver instances, use the eifutil.sh command.
Syntax
The eifutil.sh command has the following syntax and is in the<USER_HOME_REMOTE>/DataForwarders/EIFReceivers/utilities where<USER_HOME_REMOTE> is the directory on the remote host where the EIFReceiver instances are deployed:eifutil.sh -status|-start <Inst_ID>|-stop <Inst_ID>|-startAll|-stopAll|-restart<Inst_ID>|-restartAll
where <Inst_ID> is the ID for the specific EIF instance.
Parameters
-statusDisplays the status for the installed instances. For example:============================================================================COMPONENT Instance PID PORT STATUS============================================================================EIF Receiver eif_inst_1 13983 6601 UPEIF Receiver eif_inst_2 14475 6602 UPEIF Receiver eif_inst_3 14982 6603 UPEIF Receiver eif_inst_4 15474 6604 UPEIF Receiver eif_inst_5 15966 6605 UP============================================================================
-start <Inst_id>Starts the specified instance.
-stop <Inst_id>Stops the specified instance.
-startAllStarts all instances.
Configuring 291

-stopAllStops all instances.
-restart<Inst_id>Restarts the specified instance.
-restartAllRestarts all the instances.
lfautil.sh command:
To administer IBM Tivoli Monitoring Log File Agent (LFA) instances, use thelfautil.sh command.
Syntax
The lfautil.sh command has the following syntax and is in the<USER_HOME_REMOTE>/utilities/ directory on the remote host where<USER_HOME_REMOTE> is the directory on the remote host where the LFAinstances are deployed:lfautil.sh -start|-stop|-status|-restart
Parameters
-start Starts all the LFA instances on the remote host.
-stop Stops all the LFA instances on the remote host.
-statusDisplays the status for the LFA instances on the remote host. For example:==========================================COMPONENT PID STATUS==========================================Log File Agent 23995 UP==========================================
-restartRestarts the LFA instances on the remote host.
Loading batches of dataIn addition to streaming data directly, you can also load batches of historic data fortest or other purposes.
Generic ReceiverThe Generic Receiver is a component of IBM Operations Analytics - Log Analysisthat supports the REST interface for loading data into IBM Operations Analytics -Log Analysis. The REST API uses JSON (JavaScript Object Notation) as an inputand returns JSON as an output after the incoming logs are processed. If an erroroccurs, the API returns an error code and a message.
Processing a batch
Invoking the Generic Receiver API initiates the processing of a batch that iscontained in the Input JSON. Buffer a set of log records to create a batch and senddata in batches to IBM Operations Analytics - Log Analysis. The batches must besent in the order in which logs are generated for a specific data source. The size ofeach batch must be less than the batch size (500000 bytes) supported by IBMOperations Analytics - Log Analysis. At the minimum, you can send data for asingle log record in a batch. The Generic Receiver processes a batch by:
292 IBM Operations Analytics - Log Analysis: Installation, Configuration, and Administration Guide

v Splitting the batch into multiple log records by using the Splitter that wasspecified during the creation of the SourceType from the Admin UIcorresponding to the data source
v Annotates every log record that is found by the Splitter by using the Annotatorthat is specified during the creation of the SourceType from the Admin UIcorresponding to the data source
v Indexing the annotated log record in the back-end search engine
As special cases, split and annotated steps are skipped if the Splitter or Annotatoris specified as null in the SourceType. Even if there is no data to split, you need tosend an empty string in the text field of the Input JSON.
Batching of data at the client might lead to an incomplete log record at the end ofthe batch. This incomplete log record gets buffered in IBM Operations Analytics -Log Analysis and stitched with the remaining data in the subsequent batch to forma complete log record. This stitching assumes that you are maintaining the logrecord order of the data that is sent to IBM Operations Analytics - Log Analysis. Ifthe order is not maintained, then logs are not correctly split into log records.
Input JSON
The basic structure of an Input JSON file is:{"hostname": , (String)"logpath":" , (String)"batchsize": , (String)"inputType": // Optional (String) "LOGS";"flush": // Optional (boolean)"payload": // (JSONObject){"name1":"value1", // Optional......"nameN":"valueN" , // Optionaltext : "log record 1 log record 2 ..." (String)}}
The following parameters in the Input JSON are mandatory:hostname
The host name that corresponds to the data source for which you want toingest data.
logpathThe log path that corresponds to the data source for which you want toingest data.
batchsizeThe number of BYTES of logs that are sent in one batch to IBM OperationsAnalytics - Log Analysis (less than 500,000).
inputType The type of input data: LOGS.
flush flagA flag that indicates to the Generic Receiver whether the last record in thebatch is a complete log record. Typically, this flag would be set to true inthe last batch upon reaching the end of file.
payload.txtThis text contains the actual log records to be split, annotated, and indexedinto IBM Operations Analytics - Log Analysis. The text portion is split intolog records by the Splitter, annotated by the Annotator, and then indexed.
Configuring 293

If you do not have any log records, but want to index only structured(name-value pairs) data, you can specify this mandatory field as an emptystring.
More metadata (optional) to be indexed with every log record of the batch can bespecified as name-value pairs in the input JSON or the payload within the inputJSON. This metadata is applicable at the batch level. For posting distinct metadatafor each log record, send 1 log record at a time in the batch.
Post the input JSON to the following URL:http://<UNITY_HOST_NAME>:<UNITY_PORT>/Unity/DataCollector
where <UNITY_HOST_NAME> is the machine on which you installed IBM OperationsAnalytics - Log Analysis and <UNITY_PORT> is the port on which it is running. Thedefault port is 9988. The client (Java or Script) sending data into IBM OperationsAnalytics - Log Analysis needs to authenticate by using the form-based mechanismthat is implemented in IBM Operations Analytics - Log Analysis before the DataCollector API is invoked. Refer to the authentication and security design documentfor details.
Output JSON
The output that is sent by the Generic Receiver after indexing logs contains thecount and detailed information on the failure cases in a JSON Array. The detailsinclude the actual logRecord, specific error message, and any exception. The basicstructure of an Output JSON file is:{"batchSize" : , // (int)"numFailures" : , // (int)"failures" : // (JSONArray)
[{"logRecord" : , // (JSONObject)"errorMessage": , // (String)"exception" : , // (JSONArray)},...{
}]}
Serviceability
As you send data into IBM Operations Analytics - Log Analysis, you mightencounter errors that occur before the incoming batch gets processed or errors thatoccur during processing of batch and indexing log records.
If errors occur before the incoming batch gets processed, the Generic receiverreturns an error code and message. To correct the problem, process the error code,make any required changes, and resend the data.
Possible causes for error code 400 (HttpServletResponse.SC_BAD_REQUEST)include:v Invalid input JSON
294 IBM Operations Analytics - Log Analysis: Installation, Configuration, and Administration Guide

v Input batch size is greater than what is supported (500000 bytes)v No data source is configured from the Admin UI for the host name and log path
combination that is sent in the input JSONv The input type (LOGS) specified in the batch does not match the value that is
specified in the logsource that is configured from the Admin UI
Possible causes for error code 500(HttpServletResponse.SC_INTERNAL_SERVER_ERROR) include:v An exception that is encountered in any of the steps of the ingestion pipeline
(for example, during splitting of a batch).v An internal IBM Operations Analytics - Log Analysis database-related error.v Any other exception in IBM Operations Analytics - Log Analysis.
If errors occur during processing of batch and indexing log records, the outputJSON provides details of indexing failure. To correct the problem, process the errorcode, make any required changes, and resend only the affected log records.Sending the same log record twice to IBM Operations Analytics - Log Analysisresults in duplicate records in the back-end index and duplicate records in thesearch results.
Batch loading historic log data with the Data Collector clientUse the Data Collector client to ingest data in batch mode. Use this method toreview historic log data. This is the easiest method if you want to ingest large logfiles for historic analysis.
Before you begin
If you want to use the Data Collector client to load data from remote sources, youmust configure the data collector on the remote host before you can configure thelocal data collector as described here. For more information, see “Configuring theData Collector client to ingest data from remote hosts” on page 297.
About this task
If you want to load a log file that does not include time stamp information, ensurethat the values for timestamp and timestampFormat are configured injavaDatacollector.properties. IBM Operations Analytics - Log Analysis cannotindex log files without a time stamp, but if no time stamp information is found ina log file, the value that is configured in javaDatacollector.properties is used.
Procedure
To use the Data Collector client to load log file information, complete the followingsteps:1. In the Administrative Settings page, define an appropriate log file source.2. At the command line, navigate to the <HOME>/utilities/datacollector-client
directory.3. Update the configuration file that is used by the Data Collector client,
javaDatacollector.properties. Set the following properties, as appropriate:
logFileThe full path of the file you want to ingest.
servletURLThe URL of the Data Collector service.
userid The user ID for the Data Collector service.
Configuring 295
passwordThe password for the Data Collector service.
datasourceThe datasource that you want to use to load data.
timestampThe time stamp to use if a time stamp is not found in the log file.
batchsizeThe number of BYTES of logs that are sent in one batch. The defaultvalue is 500,000.
keystoreThe full path to the keystore file.
inputType The valid input types are: LOGS, CONFIGFILES, SUPPORTDOCS. The defaultvalue is LOGS.
flush flagIf the default true is set, the client sends a flush signal to the GenericReceiver for the last batch of the file. If set to false, no flush signal issent when the end of file is reached.
The following sample javaDatacollector.properties file displays theconfiguration for loading the SystemOut.log log file.#Full path of the file you want to read and upload to UnitylogFile = SystemOut.log#The URL of the REST service. Update the host/port information if requiredservletURL = https://hostname:9987/Unity/DataCollector#The user ID to use to access the unity rest serviceuserid=unityuser#The password to use to access the unity rest servicepassword=passworddatasource=Systemout#Time stamp to use if your content can not find a time stamp in log record.The same time stamp would be used for all recordstimestamp = 01/16/2013 17:27:23:964 GMT+05:30#The number of BYTES of logs sent in one batch to Unitybatchsize = 500000#The full path to the keystore filekeystore = /home/unity/IBM/LogAnalysisTest/wlp/usr/servers/Unity/keystore/unity.ks#input data type - LOGS, CONFIGFILES, SUPPORTDOCSinputType = LOGS#flush flag:#true : (default) if the client should send a flush signal to the GenericReceiver for the last batch of this file
#false : if no flush signal to be sent upon reaching eod-of-fileflushflag = true#Other properties (name/value pairs, e.g. middleware = WAS) that you wantto add to all json records
#These properties need to be appropriately added to the index configuration
4. Ensure that the Data Collector client JAR file, datacollector-client.jar, hasexecute permissions.
5. Use the following command to run the Data Collector client with the correctinputs:<HOME>/ibm-java/bin/java-jar datacollector-client.jar
296 IBM Operations Analytics - Log Analysis: Installation, Configuration, and Administration Guide

Results
After the task completes, the log file is indexed and can be searched in the Searchworkspace.
Configuring the Data Collector client to ingest data from remotehostsIf you want to use the Data Collector client to collect data from a remote serverand return it to the local machine, you must configure the data collector on theremote host.
Before you begin
You must use the instance of IBM Java Runtime Engine (JRE) 1.8 that is installedby the remote installer. Before you configure the data collector, you must use theremote installer to install at least one instance of IBM Tivoli Monitoring Log FileAgent or the EIF Receiver on a remote machine. For more information, see theConfiguring data collection for scalability on multiple remote nodes topic in theInstallation Guide.
About this task
To configure the Data Collector on the remote host, copy the data collector clientfiles from your local version of the data collector files to the remote host.
Procedure1. Copy the <HOME>/utilities/datacollector-client directory and all the files
that are contained in it from the local installation of IBM Operations Analytics -Log Analysis to the remote machine.
2. Add the location of the log and keystore files to thejavaDatacollector.properties file in the directory that you copied the datacollector to in the previous step. The keystore file is named unity.ks and it isavailable in the <Remote_install_dir>/LogAnalysis/store/ directory on theremote machine. Where <Remote_install_dir> is the directory where youinstalled the remote instance as described in the Prerequisites section here.
Results
After you complete the configuration, you must complete the Data Collectorconfiguration. For more information about how to do this, see “Batch loadinghistoric log data with the Data Collector client” on page 295. You must ensure thatthe remote installation uses the IBM Java Runtime Engine (JRE) 1.8 that is installedby the remote installer. IBM Java Runtime Engine (JRE) 1.8 is stored in the<Remote_install_dir>/LogAnalysis/ibm-java/ directory.
Data Collector propertiesBefore you can use the data collector to stream data or load a batch of historicdata, edit the javaDatacollector.props file.
The javaDatacollector.props file is in the <HOME>/IBM/LogAnalysis/utilitiesdatacollector-client folder.
The logFile, hostname, logpath, and keystore parameters are required.
Configuring 297

The userid, password, and keystore parameters are automatically populated withthe default values that are created during the installation. If you want, you canchange these but you do not need to.
Table 75. Data Collector properties
Parameter Value
logFile The full path of the file you want to load.
servletURL The URL of the Data Collector service.
userid The user ID for the Data Collector service.
password The password for the Data Collector service.
datasource The datasource that you want to use to loaddata.
timestamp The time stamp to use if a time stamp is notfound in the log file.
batchsize The number of BYTES of logs sent in onebatch. The default value is 500,000.
keystore The full path to the keystore file.
inputType The valid input type is LOGS.
flush flag If the default true is set, the client sends aflush signal to the Generic Receiver for thelast batch of the file. If set to false no flushsignal is sent when the end-of-file isreached.
Loading batches of historic data with the IBM Tivoli MonitoringLog File AgentYou can use the IBM Tivoli Monitoring Log File Agent to load batches of historicdata for testing and other purposes.
Procedure1. Copy the log files that you want to load to a temporary directory on the IBM
Operations Analytics - Log Analysis server. For example, to upload a batch oflog files from an installation of WebSphere Application Server, you copy theSampleSystemOut.log file to the /tmp/logs/ directory.
2. Create a custom data source.3. Copy the log file to the directory that you specified in the logpath parameter
when you created the data source.
Extending storage space available to Apache SolrYou can add more Apache Solr storage directories outside the initial IBMOperations Analytics - Log Analysis Apache Solr installation location if the disk onwhich Apache Solr was installed reached maximum capacity.
Before you begin
Ensure that the Apache Solr storage directories are present on all Apache Solrservers and are writable.
About this task
Switching to a new Apache Solr directory is not instantaneous. Therefore, it is tomonitor the disk usage of your Apache Solr directory to ensure that extra
298 IBM Operations Analytics - Log Analysis: Installation, Configuration, and Administration Guide

directories are added before the current storage directory reaches maximumcapacity.
Procedure
To enable the storage extension capability, complete the following steps.1. Stop IBM Operations Analytics - Log Analysis with the following command.
<HOME>/IBM/LogAnalysis/utilities/unity.sh -stop
2. Open the unitysetup.properties file in the <HOME>/IBM/LogAnalysis/wlp/usr/servers/Unity/apps/Unity.war/WEB-INF directory.
3. Add the following property to the directoryENABLE_STORAGE_RELOCATION=true
4. Create the following properties file<HOME>/solrConfigs/storageConfig.properties
For example,/home/unity/IBM/LogAnalysis/solrConfigs/storageConfig.properties
5. Open the storageConfig.properties file and add the following property to thefile.SOLR_STORAGE_DIR=storage-path-on-solr-nodes
For example,SOLR_STORAGE_DIR=/opt/scala/ext_storage
6. Restart IBM Operations Analytics - Log Analysis with the following command.<HOME>/IBM/LogAnalysis/utilities/unity.sh -restart
Results
The new IBM Operations Analytics - Log Analysis configuration file enables thespecification of custom data storage locations. The new locations are written towhen IBM Operations Analytics - Log Analysis crosses the default boundary of 1day.
Changing the default boundary for creating Apache SolrcollectionsYou can change the default boundary that is associated with extending ApacheSolr storage space depending on your business needs.
Procedure1. Open the <HOME>/IBM/LogAnalysis/wlp/usr/servers/Unity/apps/Unity.war/
WEB-INF/unitysetup.properties file.2. Locate and modify the value of the COLLECTION_ASYNC_WINDOW property from the
default value of 1d (1 day).
Note: The minimum property size is 6h.The boundary size can be specified in minutes (m), hours (h), or days (d).
3. Restart IBM Operations Analytics - Log Analysis with the following command.<HOME>/IBM/LogAnalysis/utilities/unity.sh -restart
Configuring 299

Changing the default password for the Data Collector and EIFReceiver
If you want, you can change the default password that the Data Collector and EIFReceiver use to connect to IBM Operations Analytics. This is optional.
Changing the default EIF Receiver or Data Collector passwordYou can change the default password that the Data Collector and EIF Receiver useto connect to IBM Operations Analytics - Log Analysis.
About this task
After you install IBM Operations Analytics - Log Analysis, the EIF Receiver andthe Data Collector are configured to use the default user name and password toconnect to IBM Operations Analytics - Log Analysis. The encrypted passwords aredefined in the following files:v Data Collector client is named <HOME>/IBM/LogAnalysis/utilities/
datacollector-client/javaDatacollector.properties.v EIF Receiver is named<HOME>/IBM/LogAnalysis/UnityEIFReceiver/config/
unity.conf.
IBM Operations Analytics - Log Analysis uses the Advanced Encryption Standard(AES) to encrypt and decrypt passwords for your installation, in the followingformat:password={aes}<Unique_string_of_alphanumeric_characters>
For example, the javaDatacollector.properties file uses the unityuser user ID toaccess the Data Collector server. In this example, IBM Operations Analytics - LogAnalysis uses the Advanced Encryption Standard (AES) to generate the followingpassword:{aes}7DB629EC03AABEC6C4484F160FB23EE8
The encrypted password is replicated to the configuration files for the DataCollector and the EIF Receiver.
Procedure1. To change the default password, use the unity_securityUtility.sh command.
For more information about this command, see “unity_securityUtility.shcommand” on page 234.
2. Update the configuration files for the Data Collector or the EIF Receiver.3. Optional: If you want to change the password on remote instances of the EIF
Receiver, complete the previous steps and copy the unity.conf file from the<HOME>/IBM/LogAnalysis/UnityEIFReceiver/config/ directory on the localmachine to the <remote_deployment_location>/LogAnalysis/DataForwarders/EIFReceivers/<eif_inst_#>/config/unity.conf directory on the remotemachine. Where <remote_deployment_location> is the directory on the remotemachine where you deployed the EIF instance. <eif_inst_#> is the folder that isused for the specific remote EIF instance.
Example
For example, you want to change the default password for the default user that theData Collector and EIF Receiver use to connect to IBM Operations Analytics - LogAnalysis to myNewPassword. Complete the following steps:
300 IBM Operations Analytics - Log Analysis: Installation, Configuration, and Administration Guide

1. Go to the IBM/LogAnalysis/utilities directory.2. Run the unity_securityUtility.sh command as follows:
[utilities]$ ./unity_securityUtility.sh encode myNewPasswordUsing keystore file unity.ks<HOME>/IBM/LogAnalysis/utilities/../wlp/usr/servers/Unity/
keystore/unity.ks{aes}E6FF5235A9787013DD2725D302F7D08
3. Copy the AES encrypted password to the relevant configuration files, forexample copy it to the Data Collector file. You must copy the complete,encrypted string from the command output, including the {aes} prefix. Forexample:{aes}E6FF5235A9787013DD2725D302F7D088
unity_securityUtility.sh commandYou can use the unity_securityUtility.sh command to change the password thatthe Data Collector and EIF Receiver use to connect to IBM Operations Analytics -Log Analysis.
Syntax
The unity_securityUtility.sh command is in the <HOME>/IBM/LogAnalysis/utilities directory and it has the following syntax:unity_securityUtility.sh encode [textToEncode] [unity.ks]
Parameters
The unity_securityUtility.sh command has the following parameters:
encode
The encode action returns an AES encrypted version of the text that youenter as the text to encrypt.
[textToEncode]Use the [textToEncode] parameter to enter the password that you want toencrypt. If you do not specify a password for this parameter, IBMOperations Analytics - Log Analysis prompts you for one.
[unity.ks]
The unity.ks file is the default keystore that is generated automaticallyduring installation. It controls how the password is encrypted anddecrypted.
The unity.ks file is used to encrypt and decrypt passwords for thefollowing features:v Java data collector client in the <HOME>/IBM/LogAnalysis/utilities/
datacollector-client/javaDatacollector.properties file.v EIF Receiver in the <HOME>/IBM/LogAnalysis/utilities/
UnityEIFReceiver/config/unity.conf file.
For an example of how to use this command, see “Changing the default EIFReceiver or Data Collector password” on page 300.
Installing logstashInstalling logstash on a remote node extends IBM Operations Analytics - LogAnalysis functions so it can ingest and perform metadata searches against log datathat is acquired by logstash.
Configuring 301

logstash 1.5.3 is bundled and installed with IBM Operations Analytics - LogAnalysis. You can install logstash on a local host but to improve systemperformance, install logstash on a remote node.
This document describes the version of logstash that is installed when you installIBM Operations Analytics - Log Analysis.
logstash is an open source tool for managing events and logs. It can be used tocollect logs, parse them, and send them to another tool such as IBM OperationsAnalytics - Log Analysis to store them for later use.
The logstash agent is an event pipeline that consists of three parts:1. Inputs2. Filters3. Outputs
Inputs generate events. Filters modify events. Outputs send the event somewhere.For example, events can be sent to storage for future display or search, or to theIBM Operations Analytics - Log Analysis framework. Events can have a type,which is used to trigger certain filters. Tags can be used to specify an order forevent processing as well as event routing to specific filters and outputs.
logstash can be used as a "pre-processor" to analyze sources and provide asemi-structured or structured feed to IBM Operations Analytics - Log Analysis forthe purposes of searching and potential usage within custom analytics applications.
Note: To install logstash on a local node, use the remote installation feature andset the SSH configuration REMOTE_HOST value to localhost or IP Address/hostnameof the node. For more information about installing logstash on a remote node, see“Installing logstash on a remote node” on page 303.
For more information on logstash events, see the section the life of an event inlogstash at https://www.elastic.co/guide/en/logstash/current/index.html.
DependenciesSupported versions of logstash and its dependencies.
Supported logstash version
The supported version of logstash is 1.5.3.
Java version requirement
Open JDK 1.7.0_51 or higher.
DSV Toolkit requirement
DSV Toolkit v1.1.0.4 or higher for generating IBM Operations Analytics - LogAnalysis Insight Packs. The Insight Packs are used to index log records that havebeen annotated using logstash. You only require the DSV toolkit if you want to uselogstash to perform ingestion, splitting, annotating or for when the data being readby logstash is in DSV format. For more information on this user scenario, see“Configuring logstash for rapid annotation and pre-indexing processing” on page307.
302 IBM Operations Analytics - Log Analysis: Installation, Configuration, and Administration Guide

Generic Annotation Insight Pack
Generic Annotation v1.1.0, or v1.1.1 (refresh 1) is recommended for the normalizedtimestamp splitter function, which recognizes a variety of timestamps.
Installing logstash on a remote nodeYou can install logstash on a remote node to improve system performance.
Before you begin
Ensure that the SSH user has the correct permissions for installation. For moreinformation about SSH configuration, see “Secure Shell (ssh) configuration forremote logstash” on page 304 in the Loading and streaming data guide.
About this task
logstash is processor and system resource intensive. logstash can be installed onthe local host but to improve system performance, install logstash on a remotenode.
Procedure1. To install logstash, run the following command:
<HOME>/IBM/LogAnalysis/remote_install_tool/install.sh
2. The installation script installs logstash, and provides options to install the EIFreceivers and log file Agent. To select each option, including logstash, select yor Y.
3. Provide the path to the installation location on the remote host.
Results
logstash is installed in the <install-dir>/Logstash/logstash-1.5.3/ directory. Toconfirm the installation, logon to the remote node as the configured SSH user andgo to the installation location.
Note: To install logstash on a local node, use the remote installation feature andset the SSH configuration REMOTE_HOST value to localhost or IP Address/hostnameof the node.
Example
The following are example deployments:
logstash example:<install-dir>/Logstash/logstash-1.5.3/
Output plug-in configuration path:<install-dir>/Logstash/logstash-1.5.3/logstash-scala/logstash/config/logstash-scala.conf
Output plug-in jar directory<install-dir>/Logstash/logstash-1.5.3/logstash-scala/logstash/outputs
Configuring 303

Secure Shell (ssh) configuration for remote logstash:
Before you can use the remote installer utility, you must configure the SSH for theremote hosts.
The ssh_config.properties file is in the <HOME>/IBM/LogAnalysis/remote_install_tool/config directory. Configure the parameter values as outlined inTable 1.
The SSH communication can be based on a password or public key. If youimplement both options, the public key configurations are used by default.
To set up password-based SSH, you specify a value for the password and commentout the private key file. The remote installer utility uses the specified password forSSH authentication when it connects to the remote host.
To set up private key file-based authentication, you specify the private key filepath and do not specify a value for the password. The utility uses the file to createa password-less SSH connection.
To set up command-line authentication, rename the ssh-config properties file ormove the properties file to a new location. By default the configurations areselected from the properties file. If the file is unavailable, the user is prompted forcommand-line input.
Table 76. ssh_config parameters
Parameter Value
REMOTE_HOST= <REMOTE SERVER IP/FQ HOSTNAME>
PORT= <SSH PORT>
THE DEFAULT VALUE IS 22
USER= <SSH_USER>
PASSWORD= <SSH PASSWORD>
logstash configurationlogstash can be configured as a log file agent to ingest logs from a number ofdifferent sources.
About this task
There are two established use cases for using logstash with IBM OperationsAnalytics - Log Analysis, these are:v Configuring logstash as an alternative to ITM LFAv Configuring logstash for rapid annotation and pre-indexing processing
Both use cases are described in this section.
Configuring logstash as an alternative to ITM LFA:
logstash can be used as a log file agent to ingest logs from a number of differentsources. It can also support integration with numerous alternative log file agentssuch as Lumberjack, Minuswell, Beaver, and Syslog.
304 IBM Operations Analytics - Log Analysis: Installation, Configuration, and Administration Guide

About this task
Log records are written to the IBM Operations Analytics - Log Analysis that thensends the message to the IBM Operations Analytics - Log Analysis server forannotating and indexing.
Procedure
1. Update the logstash sample configuration file with your configurationinformation, <logstash-install_dir>/LogStash/logstash-1.5.3/logstash-scala/logstash/config/logstash-scala.conf. Where <logstash-install_dir> ispath to where logstash is installed using the IBM Operations Analytics - LogAnalysis remote deploy toola. Define the input and filter in the logstash configuration file.
For example:input {file {type => "http"path => ["/tmp/myhttp.log"]}}filter{
mutate{replace => ["host","<hostname>"]replace => ["path","/tmp/apache.log"]
}}
Note: For Windows, the logstash file plug-in requires a drive letterspecification for the path, for example:path => ["c:/tmp/myhttp.log"]
b. Modify the logstash configuration file to add the scala output plug-in.The scala output plug-in buffers and sends the logstash event to the IBMOperations Analytics - Log Analysis server by using the Log Analysis serveringestion REST API. The logstash configuration file can contain one or morescala output plug-ins. The output plug-ins can be configured to write todifferent Log Analysis servers or to the same Log Analysis server with adifferent set of configurations.Every event that is sent to the scala output plug-in must contain at leastthe host and path fields. The values of these fields are used by the scalaoutput plug-in to determine the target data source for the event. Any eventthat does not contain either of these fields is dropped by the output plug-in.The following are the default parameters, with sample values, for the IBMOperations Analytics - Log Analysis scala output plug-in:output {scala {
scala_url => "https://<la_server>:<port>/Unity/DataCollector"scala_user => "<LA_user>"scala_password => "<LA_Password>"scala_keystore_path => ""batch_size => 500000idle_flush_time => 5sequential_flush => truenum_concurrent_writers => 20use_structured_api => falsedisk_cache_path => "<install-dir>/Logstash/cache-dir"scala_fields =>
{
Configuring 305

"host1@path1,host2@path2"=> "event_field11,event_field12,...,event_field1N"
"host3@path3"=> "event_field21,event_field22,...,event_field2N"
}date_format_string => "yyyy-MM-dd’T’HH:mm:ssX"log_file => "<install-dir>/Logstash/logs/scala_logstash.log"log_level => "info"}
Where:v scala_url is the REST endpoint for the Log Analysis ingestion REST API.v scala_user is the Log Analysis user name.v scala_password is the Log Analysis user password.v scala_keystore_path is blank.v batch_size is the maximum number of bytes that can be buffered for a
data source before transmitting to the Log Analysis server. The default is500000 bytes.
Note: Significantly decreasing the batch size impacts on throughput.Increasing the batch size requires more heap memory.
v idle_flush_time is the maximum time between successive datatransmissions for a data source.
v sequential_flush defines whether batches for each data source are sentsequentially. It is set to true to send the batches sequentially.
Note: Sequential sending is required when the input contains multi-linerecords that are combined in an Insight Pack in the Log Analysis server.
v num_concurrent_writers is the number of threads that concurrentlytransmit batches of data to the Log Analysis server.
v use_structured_api determines whether data is transmitted to the LogAnalysis server in the JSON format. It is set to true to transmit data in theJSON format.
Note: The target Log Analysis data source must be associated with asource type that uses the Log Analysis structured API.
v disk_cache_path is the path on the file system that temporarily buffersdata. The scala output plug-in writes data to this path beforetransmission. The available disk space under the path must be largeenough to store bursts of input data that is not immediately handled bythe Log Analysis server.
v scala_fields is the map that specifies the names of fields that must beretrieved from the incoming logstash event and transmitted to the LogAnalysis server. The keys for the map are a comma-separated list of hostand path names that correspond to a Log Analysis data source.The scala plug-in extracts the host and path fields from each eventbefore consulting the scala_fields map for a host and path combinationentry. If there is an entry with field names, the scala plug-in extracts thecorresponding field values from the event. The values are transmitted tothe Log Analysis server. If the host and path entries are not in thescala_fields map, the scala plug-in extracts the contents of the messagefield from the event and transmits it to the Log Analysis server.
306 IBM Operations Analytics - Log Analysis: Installation, Configuration, and Administration Guide

v date_format_string is the string value that all fields are transformed tobefore transmission to the Log Analysis server. The scala plug-in uses thedate_format_string parameter to convert date values to the appropriatestring value.
v log_file is the file that is used for logging information from the scalaoutput plug-in.
v log_level is the level of logging information. The supported levels arefatal, error, warn, info, and debug.
2. Create a custom data source. For more information, see data source creation inthe Administering section.Ensure that the Hostname and File Path match the host and path that isspecified in the filter mutate section of logstash configuration file,logstash-scala.conf.Ensure that the Type matches the type of log file that is being ingested and isdefined in the filter mutate section, for example DB2Diag.For example, if you specified /tmp/myhttp.log as an input file, then create acustom data source with path set to /tmp/myhttp.log.
What to do next
Start logstash.Related tasks:“logstash operations” on page 311You can use the logstash-util script to start, stop, restart, or provide the status oflogstash.
Configuring logstash for rapid annotation and pre-indexing processing:
logstash can be used to split log records and do basic annotation. For log types notcurrently supported by IBM Operations Analytics - Log Analysis, this is analternative approach to writing AQL to annotate log files.
About this task
logstash includes a broad list of filtering, manipulation, and processing capabilities,for example, the grok filter can be used to parse text into structured data. You canuse it to match text without the need to master regular expressions. There areapproximately 120 grok patterns that are shipped by default, though you can addmore. It also includes patterns for known log file formats, such as Apache'scombined access log format.
In this scenario, you use the grok filter with logstash used as the splitter orannotator of the log file. The scala output plugin sends a single log record to theIBM Operations Analytics - Log Analysis EIF Receiver, with the annotations in adelimiter separated value (DSV) format. Then, using the DSV Toolkit, the usermust create and install an insight pack that matches the DSV format so that IBMOperations Analytics - Log Analysis can index the annotations.
Procedure
1. To configure your logstash installation, specify the required values in the<logstash_install>/Logstash/logstash-1.5.3/logstash-scala/logstash/config/logstash-scala.conf file.a. Define the input in the logstash configuration file.
Configuring 307

For example:input {file {type => "apache"path => ["/tmp/logs/myapache.log"]}}
Note: For Windows, the logstash file plugin requires a drive letterspecification for the path, for example:path => ["C:/tmp/logs/myapache.log"]
b. Add a filter or filters to the logstash configuration file to identify thepattern of the log file format. This also creates the annotations. To triggerthe filter, the type must match the input type.For example:filter {
if [type] == "http" {grok {
match => ["message", "%{IP:client} %{WORD:method}%{URIPATHPARAM:request} %{NUMBER:bytes} %{NUMBER:duration}"]}}mutate{
replace => ["host","<hostname>"]replace => ["path","/tmp/apache.log"]
}}
In this example, the fields client, method, request, bytes, and duration areannotated by the pattern. However, only the fields client, method, andrequest are sent to IBM Operations Analytics - Log Analysis. Thus, those arethe only three annotations that can be included in the index configuration.The output module sends the event text in DSV format as:“client”, “method”, “request”
The user can also use one of the many predefined grok log format patternssuch as:filter {
if [type] == "apache" {grok {
match => ["message", "%{COMBINEDAPACHELOG}"]}}mutate{
replace => ["host","<hostname>"]replace => ["path","/tmp/apache.log"]
}}
c. In the output section of the configuration file, for {COMBINEDAPACHELOG}specify the scala_fieldsas follows:
scala_fields =>{
"<host>@<path>" => "clientip,ident,auth,timestamp,verb,request,httpversion,rawrequest,response,bytes,referrer,agent"
}
Where <host> and <path> are the values that are defined in the mutatesection of the grok filter.
308 IBM Operations Analytics - Log Analysis: Installation, Configuration, and Administration Guide

2. Create an IBM Operations Analytics - Log Analysis DSV-generated Insight Packin order to index the annotated data in IBM Operations Analytics - LogAnalysis.You can use the ApacheDSV.properties file to create an Apache-based InsightPacks.For more information about theApacheDSV.properties file, seeApacheDSV.properties in the Reference section of the Extending guide.Edit this properties file to configure information about your IBM OperationsAnalytics - Log Analysis server:[SCALA_server]username: unityadminpassword: unityadminscalaHome: $HOME/IBM/LogAnalysis
Use the dsvGen.py script that is provided with the DSV Toolkit to generate anddeploy the Apache Insight Pack:python dsvGen.py <path>/ApacheDSV.properties -d
3. Create a custom data source. For more information, see data source creation inthe Administering section.Ensure that the Hostname and File Path match the host and path that isspecified in the filter mutate section of logstash configuration file,logstash-scala.conf.Ensure that the Type matches the type of log file that is being ingested and isdefined in the filter mutate section, for example DB2Diag.For example, if you specified /tmp/myhttp.log as an input file, then create acustom data source with path set to /tmp/myhttp.log.
What to do next
Start logstash. For more information on starting logstash, see logstash operations.Related tasks:“logstash operations” on page 311You can use the logstash-util script to start, stop, restart, or provide the status oflogstash.Related reference:ApacheDSV.propertiesYou can use this property file with the DSV tooling to generate an Insight Packassociated with the COMBINEDAPACHELOG grok pattern.
Example - Annotating Combined Apache log files:
Using logstash to annotate Apache log files.
Procedure
1. To configure your logstash installation, specify the required values in the<logstash_install>/Logstash/logstash-1.5.3/logstash-scala/logstash/config/logstash-scala.conf file.a. In the input section, specify the Apache log file to be monitored.
input {file {type => "apache"path => ["/tmp/apache.log"]}}
Configuring 309
b. Add the logstash grok filter with the predefined COMBINEDAPACHELOG patternto annotate the Apache log files.For example:filter {if [type] == "apache" {grok {
match => ["message", "%{COMBINEDAPACHELOG}"]}}mutate{
replace => ["host","<hostname>"]replace => ["path","/tmp/apache.log"]
}}
The COMBINEDAPACHELOG pattern is defined as:COMBINEDAPACHELOG %{IPORHOST:clientip} %{USER:ident} %{USER:auth}\[%{HTTPDATE:timestamp}\] "(?:%{WORD:verb} %{NOTSPACE:request}(?: HTTP/%{NUMBER:httpversion})?|%{DATA:rawrequest})" %{NUMBER:response}(?:%{NUMBER:bytes}|-) %{QS:referrer} %{QS:agent}
For more information about Apache log files, see http://httpd.apache.org/docs/2.4/logs.html.The logstash event contains annotations for clientip, ident, auth,timestamp, verb, request, httpversion, rawrequest, response, bytes,referrer, and agent.
c. Change the <hostname> and path value to the <hostname> of the logstashserver and path to the log file. For examplemutate{replace => ["host","<hostname>"]replace => ["path","/tmp/apache.log"]}
d. In the output section of the configuration file, specify the IBM OperationsAnalytics - Log Analysis output plug-in. The scala_fields in the outputplug-in must be defined as follows:
scala_fields =>{
"<host>@<path>" => "clientip,ident,auth,timestamp,verb,request,httpversion,rawrequest,response,bytes,referrer,agent"
}
Where <host> and <path> are the values defined in the mutate section of thegrok filter.
2. The ApacheDSV.properties file can be used with the DSV Toolkit to create anApache Insight Pack. For more information about the ApacheDSV.propertiesfile, see ApacheDSV.properties in the Reference section of the Extending guide. Editthis properties file to configure information about your IBM OperationsAnalytics - Log Analysis server:[SCALA_server]username: unityadminpassword: unityadminscalaHome: $HOME/IBM/LogAnalysis
3. Use the dsvGen.py script that is provided with the DSV Toolkit to generate anddeploy the Apache Insight Pack:python dsvGen.py <path>/ApacheDSV.properties -d
4. In the IBM Operations Analytics - Log Analysis Administrative Settings UI,create a data source, which has the Apache source type that is created by theDSV toolkit in step 3, in your logstash configuration file.
310 IBM Operations Analytics - Log Analysis: Installation, Configuration, and Administration Guide

5. To start logstash with the configuration file, and start loading Apache log files,run the following command:<logstash_install>/utilities/logstash-util.sh start
Related reference:ApacheDSV.propertiesYou can use this property file with the DSV tooling to generate an Insight Packassociated with the COMBINEDAPACHELOG grok pattern.
logstash operationsYou can use the logstash-util script to start, stop, restart, or provide the status oflogstash.
About this task
You can use the logstash-util script for logstash process lifecycle management.
Procedure1. To start, stop, restart, or provide the status of logstash, run the following
command:<install-dir>/utilities/logstash-util.sh start| stop| restart| status
where <install-dir> is the name of the logstash installation location.2. To confirm that logstash is running, run the logstash-util script and use the
status option. The status option also displays the logstash process identifier.
logstash best practicesBest practices for logstash based on information from their user community.
For performance reasons it is recommend that logstash be installed on a differentserver than IBM Operations Analytics - Log Analysis. logstash is processor,memory, and disk intensive if the annotation and indexing functions are utilized.
Users who have memory constraints do not use logstash as a forwarding agent.They do not install logstash on the end client servers. They use other applicationssuch as rsyslog to forward logs to a central server with logstash. Seehttps://support.shotgunsoftware.com/entries/23163863-Installing-logstash-Central-Server for an example configuration.
Users with logstash at the end client who are concerned about performance haveused applications such as Redis to forward logs to a central server with logstash.See the following for configuration of Redis http://www.linux-magazine.com/Online/Features/Consolidating-Logs-with-logstash .
To fine tune logstash, especially the startup time, users can tweak Java's minimumand maximum heap size with the -Xms and -Xmx flags. The -Xms parameter is theinitial Java memory heap size when the JVM is started, and the -Xmx parameter isthe maximum heap size.
ReferencesLinks for more information on the logstash application.
logstash website: http://logstash.net
Configuring 311

Getting Started with logstash Guide:https://www.elastic.co/guide/en/logstash/current/getting-started-with-logstash.html
logstash Download: http://logstash.net (Click download button)
The logstash Book:http://www.logstashbook.com/
IBM Operations Analytics - Log Analysis wiki: http://www.ibm.com/developerworks/servicemanagement/ioa/log/downloads.html
IBM Operations Analytics - Log Analysis wiki: Logstash Toolkit Resources: https://www.ibm.com/developerworks/community/wikis/home?lang=en#!/wiki/IBM%20Log%20Analytics%20Beta/page/Logstash%20Toolkit%20Resources
Known issuesKnown issues when using logstash with IBM Operations Analytics - Log Analysis.
There are a number of known issues and their workarounds described in thissection. To get the latest information on any issues or workarounds, please consultthe IBM Operations Analytics - Log Analysis wiki:https://www.ibm.com/developerworks/community/wikis/home?lang=en#!/wiki/IBM%20Log%20Analytics%20Beta/page/Welcome
Could not load FFI Provider:
Starting logstash fails with the Ruby exception “Could not load FFI Provider”.
SymptomsThe Ruby exception “Could not load FFI Provider”.
CausesThe most common cause of this error is that /tmp is mounted with the noexec flag.
Resolving the problemYou can resolve this either by:v Making /tmp mounted without the noexec flagv Edit the startlogstash-scala script and amend the start command as follows:
LSCMD="$MYJAVA -jar -Djava.io.tmpdir=</some/tmp/dir> $LSJAR agent--pluginpath $PLUGPATH -f $CONF"
Where </some/tmp/dir> is a temporary directory.
Duplication of log records on the SCALA server:
On occasion, when the logstash agent is re-started, and the log file beingmonitored is updated (for example, via a streaming log), logstash will ingest theentire file again rather than restarting from where it stopped monitoring.
SymptomsThe problem results in a duplication of log records on the SCALA server.
Causes
312 IBM Operations Analytics - Log Analysis: Installation, Configuration, and Administration Guide

Several problems have been reported on the logstash forum (https://logstash.jira.com/secure/Dashboard.jspa) that its sincedb pointer (which tracks thelast monitored position in the log file) sometimes is not updated correctly. Inaddition, using control-C to terminate the logstash agent does not always killlogstash. The result is a "phantom" logstash agent that is still monitoring log files.This can also result in duplicate log records.
Resolving the problem
1. A workaround to avoid duplicate log records after restarting logstash is to setthe sincedb_path parameter in the file plugin to /dev/null, thereby tellinglogstash to ignore tracking the last-monitored file position, and always startmonitoring from the end of the file. However, this will result in logstashignoring any updates to the log file while the logstash agent is down. Forexample, in logstash-scala.conf, update:input {
file {type => "apache"path => ["/tmp/logs/myapache.log"]sincedb_path => "/dev/null"
}}
Before re-starting logstash after making these configuration changes, you mayalso want to clean up any sincedb databases that were already created. Bydefault, the sincedb database is stored in the directory $HOME, and havefilenames starting with ".sincedb_".
2. When terminating the logstash agent using control-C, verify that the logstashjava process was actually terminated. You can use the following command tosee if logstash is still running:
ps -ef | grep logstash
Logs do not appear in the Search UI:
Log records are ingested by logstash, but do not appear in the IBM OperationsAnalytics - Log Analysis Search UI.
SymptomsLog records are ingested by logstash, but do not appear in the IBM OperationsAnalytics - Log Analysis Search UI.
CausesLog records ingested by logstash are forwarded to the IBM Operations Analytics -Log Analysis server for splitting and annotating, and indexing. If the IBMOperations Analytics - Log Analysis server goes down during this process, it ispossible to lose some log records.
Configuring 313

314 IBM Operations Analytics - Log Analysis: Installation, Configuration, and Administration Guide

Loading and streaming data
Before you can perform a search on log or other data, you must first load the datainto IBM Operations Analytics - Log Analysis. When the file is loaded the data isindexed and is then available to be searched.
There are two main scenarios for loading data:v Batch loading historic data. For example, you may want to ingest historic log
data in a single batch for analysis or for testing.v Streaming data from a monitored application. You may want to load data that is
streamed from a local or remote server.
You can load or stream data from local or remote servers. However, each tool isdesigned for a particular scenario. This is explained in the Intended uses of dataloading components table. IBM Operations Analytics - Log Analysis is installed withan internal version of the IBM Tivoli Monitoring Log File Agent. However, IBMOperations Analytics - Log Analysis can also load data from a separate installationof the IBM Tivoli Monitoring Log File Agent, known as an external IBM TivoliMonitoring Log File Agent.
Table 77. Intended uses of data loading components
Load batch of historic data Stream data
Component Local Remote Local Remote
Data Collectorclient
Yes Yes No No
Internal IBMTivoliMonitoring LogFile Agent
Yes Yes Yes Yes
External IBMTivoliMonitoring LogFile Agent
Yes Yes Yes Yes
logstash Yes Yes Yes Yes
Generic Receiver Yes Yes No No
Note: You must create a Data Source before you configure data loading. Forinformation about creating a Data Source, see the Data source creation topic.You can load log data into IBM Operations Analytics - Log Analysis using anumber of different methods:
Data Collector clientUse the Data Collector client to ingest data in batch mode. This is theeasiest method if you want to ingest a large log file for historic analysis ifyou want to test your IBM Operations Analytics - Log Analysisconfiguration before attempting the more complex IBM Tivoli MonitoringLog File Agent configuration. The Data Collector client is not designed foringesting data from remote sources. If you want to ingest a batch ofhistorical data from a remote source, use the IBM Tivoli Monitoring LogFile Agent.
© Copyright IBM Corp. 2015 315

For a video that demonstrates how to batch upload a WebSphereApplication Server or DB2 file using the Data Collector client, see ITOAvideos. For information about batch uploading alternative log file typessuch as Oracle alert logs, see Batch uploading Oracle Alert logs.
IBM Tivoli Monitoring Log File AgentUse the IBM Tivoli Monitoring Log File Agent for scenarios where youwant to stream log data from your production environment or to streamdata from a remote server.
For a video that demonstrates how to upload a WebSphere ApplicationServer or DB2 file using the IBM Tivoli Monitoring Log File Agent, seeITOA videos.
logstashlogstash can be used as a method to collect and load data into IBMOperations Analytics - Log Analysis.
Generic ReceiverUse the Generic Receiver to load data from the REST interface into IBMOperations Analytics - Log Analysis.
You cannot use IBM Operations Analytics - Log Analysis to index log records thatcontain non-ASCII characters. If your log records contain non-ASCII characters, therecords are not added when you use the IBM Tivoli Monitoring Log File Agent orthe Data Collector client. When you use the Data Collector client errors that relateto non-ASCII characters are added to the Generic Receiver log.
Example scenarios
The following table outlines a number of example scenarios to help illustrate howyou use the different components for different scenarios.
Table 78. Example data loading scenarios
Example Component
I want to load a batch of historic log data totest the environment.
Data Collector client
I want to monitor an application on aremote server.
IBM Tivoli Monitoring Log File Agent
I want to use logstash to monitor log files ona remote server.
logstash
I want to load a batch of historic log data inthe JSON format.
Generic Receiver
Supported operating systems
The supported operating systems that you can install IBM Operations Analytics -Log Analysis are listed in the Installing Guide. In addition to these, you also needto know what operating systems are supported by the data streaming and loadingscenarios. For example, if you want to use the internal to stream data from aremote source, you need to know the supported operating systems.
316 IBM Operations Analytics - Log Analysis: Installation, Configuration, and Administration Guide

Table 79. Supported operating systems for data loading
Scenario FeatureSupported operatingsystems
Use the Data Collector toload a batch of historic data
Data Collector v Red Hat Enterprise LinuxServer Edition Version 5 orVersion 6 (64 bit)
v SUSE Linux EnterpriseServer 11 (64 bit)
Use the internal IBM TivoliMonitoring Log File Agent tostream data
Internal IBM TivoliMonitoring Log File Agent
See the Requirements for themonitoring agent topic in thedocumentation for yourversion of IBM TivoliMonitoring at:TivoliMonitoring documentation
Use an external IBM TivoliMonitoring Log File Agent tostream data
External IBM TivoliMonitoring Log File Agent
See the Requirements for themonitoring agent topic in thedocumentation for IBMTivoli Monitoring 6.2.3.1at:Tivoli Monitoringdocumentation
Related concepts:“Data Source creation” on page 373You create data sources to ingest data from a specific source.“Installing logstash” on page 301Installing logstash on a remote node extends IBM Operations Analytics - LogAnalysis functions so it can ingest and perform metadata searches against log datathat is acquired by logstash.
Configuring data streamingBefore you can stream data, you must configure the tools that you use to send thedata to IBM Operations Analytics - Log Analysis.
IBM Tivoli Monitoring Log File Agent configuration scenariosYou can use the internal IBM Tivoli Monitoring Log File Agent that is installedwith IBM Operations Analytics - Log Analysis or you can use an external IBMTivoli Monitoring Log File Agent to stream data from local or remote servers.
You can also use the IBM Tivoli Monitoring Log File Agent to upload a batch ofhistoric data. For more information, see “Loading batches of historic data with theIBM Tivoli Monitoring Log File Agent” on page 298.
You can integrate the IBM Tivoli Monitoring Log File Agent with IBM OperationsAnalytics - Log Analysis in two ways.
You can use it with the version of the IBM Tivoli Monitoring Log File Agent that isinstalled with IBM Operations Analytics - Log Analysis. This is known as theinternal IBM Tivoli Monitoring Log File Agent.
You can also use it with an IBM Tivoli Monitoring Log File Agent that has beeninstalled separately as part of another installation.
Loading and streaming data 317

You can use local and remote versions of both types of IBM Tivoli Monitoring LogFile Agent.
The following graphic illustrates these possibilities:
The following possible scenarios are illustrated in the graphic:
1. Internal IBM Tivoli Monitoring Log File Agent on a local serverIn this scenario, you use the version of the IBM Tivoli Monitoring Log FileAgent that is installed with IBM Operations Analytics - Log Analysis toload data from the local installation of IBM Tivoli Monitoring to IBMOperations Analytics - Log Analysis.
2. External IBM Tivoli Monitoring Log File Agent on a local serverIn this scenario, you use a version of the IBM Tivoli Monitoring Log FileAgent that was not installed with IBM Operations Analytics - Log Analysisbut that is installed on the same server as IBM Operations Analytics - LogAnalysis.
3. External IBM Tivoli Monitoring Log File Agent on a remote serverIn this scenario, you use an installation of an external IBM TivoliMonitoring Log File Agent to push data to IBM Tivoli Monitoring Log FileAgent. To facilitate this integration, you modify the properties of the IBMTivoli Monitoring Log File Agent.
4. Remote instance of the internal IBM Tivoli Monitoring Log File AgentIn this scenario, you use a the remote installer tool to install a remoteinstance of the internal IBM Tivoli Monitoring Log File Agent.
The following table summarizes the different configurations required for thescenarios.
318 IBM Operations Analytics - Log Analysis: Installation, Configuration, and Administration Guide

Table 80. Configuration for data streaming scenarios
Data streamingscenario
IBM TivoliMonitoring Log FileAgent type Log file location
Required parametersin .conf file
1 Internal and local Local Datasources
2 Internal and remote.You use the remoteinstaller to create theremote instance.
Remote Datasources,ServerLocation,ServerPort,BufEvtMaxSize.
3 Local and external Local Datasources
4 Remote and external Remote Datasources,SshAuthType,SshHostList,SshPassword, SshPort,SshPrivKeyfile,SshPubKeyfile,SshUserid.
Specifying the configuration and format filesBefore you use an internal or external LFA, you may want to modify theconfiguration and format files.
About this task
For more information about how configuration and format files are used, see “LFAconfiguration and format files” on page 263.
For more information about the required parameters in the configuration file, see“Configuration file parameters” on page 230.
Procedure1. Open the configuration file that you want to use.2. Define the required parameters in the configuration file. The required
parameters are different depending on the data loading scenario.v To stream data from a local server, specify the data sources in the
DataSources parameter.v To push data from a remote directory, you must specify values for the
Datasources, ServerLocation, ServerPort, and BufEvtMaxSize parameter.v To use an external IBM Tivoli Monitoring Log File Agent that is not installed
as part of IBM Operations Analytics - Log Analysis, you must specify valuesfor the Datasources, SshAuthType, SshHostList, SshPassword, SshPort,SshPrivKeyfile, SshPubKeyfile, and SshUserid parameters.
3. Define the format file as required.4. (Optional) If you want to monitor log files type where the log files rotate
resulting in multiple log files, update the .fmt file for each rotating log type toallow for the appropriate name change. Open the .fmt file, and edit the line:-file FILENAME
to reflect the file name rotation. For example, for SystemOut log files where anumber is appended to the file name for each additional log, the FILENAME mustread:-file SystemOut*.log
Loading and streaming data 319

5. Save your changes.
Example
For example:===============SshHostList=host1,host2,host3SshUserid=loguserSshAuthType=PASSWORDSshPassword=<password>
=====================SshHostList=host1,host2,host3SshUserid=loguserSshAuthType=PUBLICKEYSshPrivKeyfile = <SshUserid_Private_Key_File_Path>(Or)SshPubKeyfile = <SshUserid_Private_Key_File_Path>
======================
where <password> is the password that you want to use.
<SshUserid_Private_Key_File_Path> is the full path for the file that contains theprivate key of the user that is specified in the SshUserid user. For example, if yousave the password to a file called password.txt in the <HOME>/utilities directory,the full path is as follows:SshPrivKeyfile = <HOME>/utilities/password.txt
LFA configuration and format files:
If you use an internal or external LFA, you can edit the configuration and propertyfiles to suit your specific installation.
The LFA configuration for a particular data source is defined in the following files:v A <name>.conf file that contains the properties that are used by the LFA for
processing the log files.v A <name>.fmt file that contains an expression and format that is used by the
agent to identify matching log file records and to identify the properties toinclude in the Event Integration Format (EIF) record. The EIF is sent from theagent to the receiving server. The receiving server is the server where the LogAnalysis server is installed. The <name>.fmt file uses a regular expression todetermine matching records in the log file and to send each matching record tothe LFA server in an EIF event.
If you want to use the LFA to send your log files to the LFA server, you mustcustomize the regular expression and define your own stanza in the <name>.fmtfile to capture the log records that are to be sent. The event record format mustinclude the host name, file name, log path, and text message. The LFA server usesthese values to process the logs. For more information about the IBM Tivoli 6.3 LogFile Agent and the configuration files and properties, see Tivoli Log File AgentUser's Guide.
The file names must be identical for both files. For example,WASContentPack_v1.1.0-lfawas.conf and WASContentPack_v1.1.0-lfawas.fmt.
320 IBM Operations Analytics - Log Analysis: Installation, Configuration, and Administration Guide

After you modify the configuration files as required, you use the LFA to load thedata into LFA. For a general description of how to do this, see “Loading a batch oflog files with the LFA” on page 274
If you use an external instance of the LFA to load data into the Log Analysisserver, you must install the configuration files into the agent. This configurationensures that the agent knows where the log files for a data source are located, howto process the records in the log file, and the server to which records are sent.
LFA configuration file examples
The following example shows the files that are installed as part of the WebSphereInsight Pack that is included as standard with Log Analysis.
The WASContentPack_v1.1.0-lfawas.conf file contains many properties, includingthe following examples:# Files to monitor. The single file /tmp/regextest.log, or any file like/tmp/foo-1.log or /tmp/foo-a.log.
LogSources=/home/unityadm/IBM/LogAnalysis/logsources/WASInsightPack/*
# Our EIF receiver host and port.ServerLocation=<EIF Receiver host name>ServerPort=5529
The WASContentPack_v1.1.0-lfawas.fmt file contains the following regularexpression that matches any record within a monitored log file. In this example,the regular expression matches all the log records in the file and to the OperationsAnalytics server as an EIF event. The EIF event contains the host name where theagent is running, the file name of the log file, the log file path of the log file, andthe log file record itself.// Matches records for any Log file:
//
REGEX AllRecords(.*)hostname LABEL-file FILENAMElogpath PRINTF("%s",file)text $1END
Configuration file parameters:
The IBM Tivoli Monitoring Log File Agent uses the information that is specified inthe configuration file to process log file information.
Table 1 explains that parameters that you can modify in this file.
Table 81. Parameter summary
Parameter Description
DataSources Specify the data source that you want tomonitor. If you are specifying multiple datasources, they must be comma-separated andwithout spaces. When you configure aremote directory in the LFA conf file, thedirectory you specify must not contain anysubdirectories.
Loading and streaming data 321

Table 81. Parameter summary (continued)
Parameter Description
SshAuthType You must set this value to either PASSWORD orPUBLICKEY.
If you set this value to PASSWORD, IBMOperations Analytics - Log Analysis uses thevalue that is entered for SshPassword as thepassword for Secure Shell (SSH)authentication with all remote systems.
If you set this value to PUBLICKEY, IBMOperations Analytics - Log Analysis uses thevalue that is entered for SshPassword as passphrase that controls access to the private keyfile.
SshHostList You use the SshHostList value to specify thehosts where the remotely monitored log filesare generated. IBM Operations Analytics -Log Analysis monitors all the log files thatare specified in the LogSources orRegexLogSources statements in each remotesystem.
If you specify the local machine as a valuefor this parameter, the LFA monitors the filesdirectly on the local system. If you specifythat the localhost SSH is not used to accessthe files on the system, IBM OperationsAnalytics - Log Analysis reads the filesdirectly.
SshPassword If the value of the SshAuthType parameter isPASSWORD, enter the account password for theuser that is specified in the SshUseridparameter as the value for the SshPasswordparameter.
If the value of the SshAuthType parameter isPUBLICKEY, enter the pass phrase thatdecrypts the private key that is specified inthe SshPrivKeyfile parameter.
SshPort You specify the TCP port that is used forSSH connections. If you do not enteranything, this value is defaulted to 22.
SshPrivKeyfile If the value of the SshAuthType parameter isset to PUBLICKEY, enter the directory path tothe file that contains the private key of theuser that is specified in the SshUseridparameter as the value for this parameter.
If the value of the SshAuthType parameter isnot set to PUBLICKEY, this value is notrequired.
322 IBM Operations Analytics - Log Analysis: Installation, Configuration, and Administration Guide

Table 81. Parameter summary (continued)
Parameter Description
SshPubKeyfile If the value of the SshAuthType parameter isset to PUBLICKEY, enter the directory path tothe file that contains the public key of theuser that is specified in the SshUseridparameter as the value for this parameter.
If the value of the SshAuthType parameter isnot set to PUBLICKEY, this value is notrequired.
SshUserid Enter the user name from the remote systemthat the agent uses for SSH authentication.
Configuring and deploying LFAs in the command lineYou can use the command line to configure and deploy LFAs.
Before you begin
Before you can configure and deploy an LFA. You need to create the configurationand format files.
For more information about how configuration and format files are used, see “LFAconfiguration and format files” on page 263.
For more information about the required parameters in the configuration file, see“Configuration file parameters” on page 230.
About this task
CAUTION:
You cannot use non-ASCII characters in the installation path. The installationpath cannot exceed 80 characters.
For more information, about this and about how to configure the monitoring agentin step 3 see:
Configuring the monitoring agent
Procedure1. To configure the LFA, run the command:
./itmcmd config -A pc
where pc is the product code for your agent. For example: ./itmcmd config –Alo.
2. You are prompted to supply the following information:
Enter instance name (default is: ):Enter the instance name. For example, rhelagent.
Conf file (default is: ):Enter the configuration file path. For example, /unity/IBM/ITM/config/lo/.
Loading and streaming data 323

Format File (default is: ):Enter the format file path. For example, /unity/IBM/ITM/config/lo/.
Note: All fields must be completed. Blank fields can cause the LFA to fail.3. Where prompted, provide the monitoring agent configuration information.4. To start the LFA, run the command
./itmcmd agent -o instance name start lo
Configuring a remote LFA to stream dataIf you use a LFA that is installed on a remote server to stream data to IBMOperations Analytics - Log Analysis, you must update the configuration andformat files for the LFA.
Before you begin
You must create a custom data source before you configure data loading. Forinformation about creating a data source, see “Data Source creation” on page 373.
About this task
You can use the configuration files in the <HOME>/IBM-LFA-6.30/config/lo directoryas a basis for the configuration files on your remote server. However, you mustensure that the configuration files that you create:v contain a line separator between each property that you define in the .conf file.v use the .conf file extension and that the format file uses the .fmt extension.
To enable the LFA configuration, complete the following procedure:
Procedure1. Specify a value or values for the DataSources property. If you have multiple
locations, you can list the locations and use a comma as a separator. Ensurethat you do not leave any spaces. For example, you specify the followingvalues to represent two data sources:DataSources=/opt/IBM/WAS1/logs/SystemOut.log,/opt/IBM/WAS2/logs/SystemOut.log
When you create a data source for a remote server, you must enter the correctversion of the host name for that server. To find the correct host name, run thefollowing command on the remote server:uname -a
Enter the name that is returned by this command in the host name parameterfor the data source.
2. Specify the server location for the EIF receiver server. For example, for a serverthat is at 111.222.333.444, specify the following value:ServerLocation=111.222.333.444
3. Specify the port that the EIF receiver uses. For example:ServerPort=5529
4. Specify the BufEvtPath for the LFA. The cached events are stored in this file.For example:BufEvtPath=/opt/IBM/LogAnalysis/logs/lfa-WASInsightPack.cache
5. Specify the maximum buffer size for the LFA. This parameter is the maximumsize that the cache is allowed to be. If the cache is full, events are dropped andperformance can decline. The value that you enter here is in kilobytes. Forexample:
324 IBM Operations Analytics - Log Analysis: Installation, Configuration, and Administration Guide

BufEvtMaxSize=102400
6. (Optional) If you want to monitor log files type where the log files rotateresulting in multiple log files, update the .fmt file for each rotating log type toallow for the appropriate name change. Open the .fmt file, and edit the line:-file FILENAME
to reflect the file name rotation. For example, for SystemOut log files where anumber is appended to the file name for each additional log, the FILENAME mustread:-file SystemOut*.log
7. Save your changes.
What to do next
Allow time for the log data to be loaded and then search for a value that iscontained in your log file to validate that the configuration is correct.
Configuring LFA subnodesCreate an LFA subnode to group an explicit set of configurations that the LFA usesto identify and process a log event.
About this task
The subnode consists of a format (.fmt) file and a configuration (.conf) file. Asingle instance of the LFA can have multiple subnodes. Each subnode behaves likea single thread that is running in the same instance of the LFA.
You can create subnodes for the following use cases:
Improve performance by making generic format settings more specificTo improve overall performance, you can create specific configurations toreplace more generic ones. For example, you can specify the same regularexpression (REGEX) in a generic .fmt file to parse both WebSphereApplication Server (WAS) and DB2 log files. However, as the content of thelog files differs, this operation can become inefficient. To improveperformance, replace the single .fmt files with two new files that containtwo specific REGEXs for WAS and DB2 in two new subnodes.
Improve performance by making generic configuration settings more specificSimilarly, you can improve performance by replacing genericconfigurations with more specific ones. For example, you can specify thesame rollover behavior in a generic .conf to process both WAS and DB2log files. However, as the rollover behavior in the log files differs, thisconfiguration results in some of the logs not being processed correctly andis inefficient. To improve performance, replace the single .conf with twonew files in two new subnodes.
Improve performance for many data sourcesIf you use many data sources to monitor the log events, you can createsubnodes to spread the workload.
Remote monitoring with IBM Tivoli Monitoring Log File Agent 6.3With IBM Tivoli Monitoring Log File Agent 6.3, you can modify the .conffile to monitor logs from multiple remote sources. However, the usercredentials might not be the same for the remote servers. You can maintainonly one set of user credentials in the LFA configuration file. In this case,
Loading and streaming data 325

you create multiple subnodes with different user credentials in each. Youcan use this feature to monitor multiple remote sources from a single LFAnode with multiple subnodes.
There is also a limitation on the naming of subnodes. For more information, see“Character limits for subnode names” on page 270.
Procedure1. Go to the directory where the LFA is installed. For example, if you are using
the internal LFA that is delivered with Log Analysis, the directory is<HOME>/IBM/LogAnalysis/IBM-LFA-6.30/config/lo.
2. To open LFA configuration window, run the following command:bin/CandleManage
3. Right-click the Tivoli Log File Agent service and click Configure.4. Click the instance that you want to configure and click OK. The Configure
Tivoli Log File Agent window is displayed.5. On the Log File Adapter Configuration tab, ensure that the Conf file and
Format File fields are blank.6. Click the Log File Adapter Global Settings tab and note the directory that is
specified in the Configuration file autodiscovery directory. This path is thedirectory where you save the subnode configuration files. Click OK.
7. In the subsequent window, you can ignore the other changes and click Save tosave your changes.
8. Enter the root user password when prompted to implement your changes.9. Copy the subnode configuration files to the directory that you noted in step 6.
The LFA automatically detects the changes. You do not need to restart the LFAinstance.
Results
The procedure describes how to configure subnodes in the LFA UI. You can alsouse the command line. To use the command line to configure the subnodes:1. Go to the directory where the LFA is installed.2. Run the following command:
itmcmd config -A lo
3. Complete the required steps.4. Specify the configuration file autodiscovery directory.5. Complete the configuration.6. Save the subnode configuration file to the directory that you specified in step 4.
Character limits for subnode names:
When you name a subnode, ensure that you are aware of the character andnaming limitations.
32 character limitation
The LFA uses msn to name and identify the subnode. IBM Tivoli Monitoring limitsthe length of this name to 32 characters. The limit includes the identifier, the dash,and the semi-colon. This leaves 28 new characters for the host name, subnode andconfiguration file name.
326 IBM Operations Analytics - Log Analysis: Installation, Configuration, and Administration Guide

The subnode name is specified in the following format:LO:<Hostname>_<Subnode>-<Conffilename>
where LO is an identifier that is assigned to all subnodes. <Hostname> is the hostname of the machine where the subnode is installed. <Subnode> is the name of thesubnode.<Conffilename> is the name of the subnode configuration file.
For example:LO:nc1234567890_WASInsightPack-lfawas
However, IBM Tivoli Monitoring limits the length of this name to 32 characters.The example name is 35 characters long. The limit includes the identifier, the dash,and the semi-colon, leaving 28 characters for the host name, subnode andconfiguration file name. To work around this limitation, IBM Tivoli Monitoringrenames the subnode as:LO:nc1234567890_WASInsightPack-l
This name is 32 characters long. The host name uses 12 characters. The subnodeuses 14 characters.
This limitation can cause an issue if you use similar names for the configurationfiles. For example, after you name the first subnode, you create another subnodecalled:LO:nc1234567890_WASInsightPack-lfawas2
IBM Tivoli Monitoring renames this subnode as:LO:nc1234567890_WASInsightPack-l
As you can see, due to the truncation, both subnodes now have the same name,meaning that the LFA will not detect the new configuration.
Increasing the limit
The host name is used for integrations with Tivoli Endpoint Manager, where ithelps you to identify subnodes. However, this is not required for Log Analysis.You remove the host name from the default naming convention so that you canuse all 28 characters for the configuration file name.
To change the host name setting:1. Stop the LFA.2. Open the <HOME>/IBM/LogAnalysis/IBM-LFA-6.30/config/lo/
lo_default_workload_instance.conf file.3. Change the default value for the following property from Y (Yes) to N (No):
CDP_DP_USE_HOSTNAME_IN_SUBNODE_MSN=’N’
4. Save the updated file.5. Restart the LFA.
After you change this configuration setting, the subnode name no longer includesthe host name. For example, the subnodes in the previous example are now namedLO:WASInsightPack-lfawas and LO:WASInsightPack-lfawas2.
Considerations when using the LFABefore you use the LFA, read this topic to help you to understand some importantconsiderations and limitations.
Loading and streaming data 327

Log file size
If your log files are likely to exceed 50 MB, increase the size of the LFA cache: Inthe appropriate configuration file, set BufEvtMaxSize=102400. For WAS log files,update <HOME>/IBM/LogAnalysis/IBM-LFA-6.30/config/lo/WASInsightPack-lfawas.conf. For DB2 log files, update <HOME>/IBM/LogAnalysis/IBM-LFA-6.30/config/lo/DB2InsightPack-lfadb2.conf.
You must delete the appropriate existing cache file. For WAS log files, delete<HOME>/IBM/LogAnalysis/logs/lfa-WASInsightPack.cache and for DB2 log files,delete <HOME>/IBM/LogAnalysis/logs/lfa-DB2InsightPack.cache
For very large log files, update the cache size of the EIF receiver. In the<HOME>/IBM/LogAnalysis/UnityEIFReceiver/config/eif.conf file, increase thevalue of the BufEvtMaxSize property.
For WAS, update <HOME>/IBM-LFA-6.30/config/lo/WASInsightPack-lfawas.conffile. DB2 update <HOME>/IBM-LFA-6.30/config/lo/DB2InsightPack-lfadb2.conf file.
If you make any changes to the configuration, you must restart the service for thechanges to take effect. To restart the service, from the <HOME>/IBM/LogAnalysis/utilities directory, run the following commands:v unity.sh -stop
v unity.sh -start
Maximum log line length
The LFA monitors each log file line. The default maximum line length that can beprocessed by the LFA is 4096 bytes. This is equivalent to 4096 ASCII characters.This limitation is related to the log line and not the log record. If a log recordconsists of multiple log lines, such as in the case of a stack trace, the limit appliesto each line. This is a limitation of the LFA and does not apply if you use analternative data collection mechanism.
Performance implications of using the LFA
Loading logs using the LFA is a CPU bound process. If your system does not meetthe minimum requirements you will need to increase the MaxEventQueueDepth. Onsome systems, altering this value may produce a noticeable impact onperformance. This will buffer additional LFA events while they are waiting to beprocessed. The required value for MaxEventQueueDepth may vary depending on thesize of the rolled log and the number/speed of your CPU's. If you choose not toincrease this value, then older events may be replaced on the event queue bynewer events and not sent to the Log Analysis server.
To minimize the chance of data loss due to CPU bottlenecks, and to reduce thelatency between when a log record is written to the file and when it is loaded, werecommend that the maximum size of a log be small enough so that you systemdoes not fall behind while processing the logs.
Common LFA configuration conflictsWhen you create a remote LFA node and a custom data source and both use thesame log path, you can create a conflict.
When you create a custom data source and use it monitor a directory on a remoteLFA subnode and you later create another data source, like a remote data source,
328 IBM Operations Analytics - Log Analysis: Installation, Configuration, and Administration Guide
that monitors the same directory, you can create a conflict in the LFA configuration.These conflicts may cause errors in the Log Analysis log files and reduce theperformance of Log Analysis.
The following example is provided to help you to understand this situation.
To avoid these conflicts, you need to avoid monitoring the same directory withdifferent data sources. If you want to monitor two files in the same directory,include the file name in the Log Path field when you create the data source.
Example
For example, you are an administrator and you want to monitor files from an LFAthat is installed on a remote server as described in the Knowledge Centerdocumentation. See “Configuring a remote LFA to stream data” on page 267. Inthis case, the LFA is not part of the Log Analysis product.
First, you must create a custom data source called Customdatasource to load datafrom remote instance of the LFA. In the Data Source creation wizard, you specifythe host name and the following log path:/opt/WAS/WAS_logs/myLogFile.log
Next, you need to create the configuration and format files for the LFA sub nodes.You create two files, lfa1.conf and lfa1.fmt. In the lfa1.conf file, you specify thefollowing data source:Datasources=/WAS/WAS_logs/some_dir/*
Logs that are subsequently generated or appended are ingested by the Datasource1data source.
After some time, you create another data source to load data from the same remoteserver. The new log file is called newLogFile.log and it is located in the samedirectory as the file that you created the Customdatasource data source for. Youcreate a remote data source called Remotedatasource and specify the log path as:/opt/WAS/WAS_logs/newLogFile.log
Finally, you push the log files into Log Analysis.
However, after you push the log file, you notice some strange behaviour in the LogAnalysis log files. The GenericReceiver.log log file shows that the data is beingingested for /opt/WAS/WAS_logs/newLogFile.log. However, it also says that the/opt/WAS/WAS_logs/newLogFile.log log file is not a valid data source.
This occurs because the same log file is being monitored by both data sources. As aresult, it is monitored by two different LFA sub nodes and in two different streams.The data is loaded but this can waste resources and decrease the overallperformance.
To avoid this situation, you must be aware of any possible conflicts especiallywhen you create a custom data source that monitors a directory rather than a file.
Regular expression support for the LFAThe LFA supports specific implementations of regular expressions.
Loading and streaming data 329

Single-line unstructured data
If you want to use the DSV toolkit to extract and export the data in thecomma-separated value (CSV) format for use with the DSV toolkit, you can use aregular expression to extract and export the data.
For example, consider the following log file record:10453072 23460 E5D27197E653C548BDA744E8B407845B AOBEAI1 /EAI I H R SACP9002BPUSRSYS/612 23460 - XGNEA108:662:000042:06:E036977:WWS00003:7000:16:1:REV=NProc Time=000.03
You can configure Log Analysis to use a regular expression to extract and exportthe data in the comma-separated value (CSV) format. For example, here is anexample of a regular expression that is defined in the .fmt file:REGEX EAILOG⌂([0-9]*)(.*)SACP9002(.*):([0-9]*):([0-9]*):([0-9]*):([a-zA-Z0-9]*):([a-zA-Z0-9]*):([a-zA-Z0-9]*):(.*)Proc Time=([0-9]*.[0-9]*)timestamp $1 CustomSlot1discard $2SACP9002 $3bankID $4 CustomSlot3branchID $5 CustomSlot4discard3 $6tellerSID $7 CustomSlot5workstationID $8 CustomSlot6transactionTypeID $9 CustomSlot7discard4 $10responseTime $11 CustomSlot8msg PRINTF("%s,%s,%s,%s,%s,%s,%s",timestamp,bankID,branchID,tellerSID,workstationID,transactionTypeID,responseTime)END
Manipulating date time information for the Generic Annotation InsightPack
If you use the Generic Annotation Insight Pack or the date time rule set from theGeneric Annotation Insight Pack in a custom Insight Pack, you can use somelimited regular expressions that you can use to parse time and date information.
The second delimiter, which is a colon (:), is not supported. The regular expressionreplaces the second delimiter with a period (.), which is supported. For example,to change a date from 15/12/2014 12:12:12:088 GMT to 15/12/2014 12:12:12.088GMT, you can add the following regular expression to the .fmt file:// Matches records for any Log file:// Log Analytics Data Source chas_access.log
REGEX nongr([0-9][0-9])/([0-9][0-9])/([0-9][0-9]) ([0-9][0-9]):([0-9][0-9]):([0-9][0-9]):([0-9][0-9][0-9]) ([A-Z][A-Z][A-Z])(.*Batch Status for.*)month $1day $2year $3hour $4minute $5second $6ms $7zone $8message $9hostname example.com
330 IBM Operations Analytics - Log Analysis: Installation, Configuration, and Administration Guide

-file /opt/la/IBM/LogAnalysis/logs/GenericReceiver.logRemoteHost ""logpath PRINTF("%s",file)text PRINTF("%s/%s/%s %s:%s:%s.%s %s %s", month, day, year, hour, minute,second, ms, zone, message)END
Loading a batch of log files with the LFAUse this example to help you to understand how to use the LFA to load log abatch of files.
Before you begin
Consider the size of the log files that you want to load. If a log file is in the regionof 50 MB, or more, in size, increase the size of the log file agent cache. In theappropriate configuration file, set BufEvtMaxSize=102400. For WAS log files, update<HOME>/IBM/LogAnalysis/IBM-LFA-6.30/config/lo/WASInsightPack-lfawas.conf.For DB2 log files, update <HOME>/IBM/LogAnalysis/IBM-LFA-6.30/config/lo/DB2InsightPack-lfadb2.conf.
You must delete the appropriate existing cache file. For WAS log files, delete<HOME>/IBM/LogAnalysis/logs/lfa-WASInsightPack.cache and for DB2 log files,delete <HOME>/IBM/LogAnalysis/logs/lfa-DB2InsightPack.cache
For very large log files, update the cache size of the EIF receiver. In the<HOME>/IBM/LogAnalysis/UnityEIFReceiver/config/eif.conf file, increase thevalue of the BufEvtMaxSize property.
Lines in a log that are longer than 4096 characters are, by default, ignored by theLFA. To force it to read lines longer than 4096 characters, add theEventMaxSize=<length_of_longest_line> property to the .conf file that will beused while loading the log.
For WAS update $UNITY_HOME/IBM-LFA-6.30/config/lo/WASInsightPack-lfawas.conf file. DB2 update $UNITY_HOME/IBM-LFA-6.30/config/lo/DB2InsightPack-lfadb2.conf file.
If you make any changes to the configuration, you must restart the service for thechanges to take effect. To restart the service, from the <HOME>/IBM/LogAnalysis/utilities directory, run the following commands:v <HOME>/IBM/LogAnalysis/utilities/unity.sh -stop
v <HOME>/IBM/LogAnalysis/utilities/unity.sh -start
About this task
The LFA might be on the same server as IBM Operations Analytics - Log Analysisand monitoring a local directory. In this scenario, the installation of IBMOperations Analytics - Log Analysis completes all of the configuration required.
If the LFA is on the same server as IBM Operations Analytics - Log Analysis, butmonitoring remote directories, some additional configuration is required. If youwant to monitor log files on remote servers, you must make some specific settingschanges. For more information about these specific settings, see the Configuringremote monitoring that uses the predefined configuration files topic under IBM Tivoli LogFile Agent Configuration in the Extending IBM Operations Analytics - Log Analysissection.
Loading and streaming data 331

If your configuration requires it, you can use a remote LFA. In this scenario, installand configure the LFA based on the your requirements. For more information, seethe IBM Tivoli Monitoring documentation: http://www-01.ibm.com/support/knowledgecenter/SSTFXA_6.3.0/com.ibm.itm.doc_6.3/welcome.htm
Procedure
To use the log file agent to load log information, complete the following steps:1. In the Administrative Settings page, define an appropriate log file source.2. Ensure that the log file you want to add is in the appropriate directory. For
WAS logs, place the log file in the following directory:<HOME>/IBM/LogAnalysis/logsources/WASInsightPack
For DB2 logs, place the log file in the following directory:<HOME>/IBM/LogAnalysis/logsources/DB2InsightPack
For Generic annotator log files, place the log file in the following directory:$UNITY_HOME/logsources/GAInsightPack
The log file is automatically picked up and analyzed. Depending on the size ofthe log file, processing it could take some time.
3. Optional: To monitor progress, check the following log files:v <HOME>/IBM/LogAnalysis/logs/GenericReceiver.log
v <HOME>/IBM/LogAnalysis/logs/UnityEifReceiver.log
When you are using the LFA to perform data collection, monitor theUnityEIFReceiver.log and GenericReceiver.log log files located in the$UNITY_HOME/logs directory to ensure that the data ingestion has completedcorrectly.This example illustrates the addition of a batch of log records. The result isindicated in the RESPONSE MESSAGE section of the log file:~~~~~~~~~~~~~~~~~~~~~~~~~~~~~~~~~~~~~~~~~~~~~~~~~~~~~~~~~~~~~~~~~~~~2013-04-20 04:43:10,032 [pool-5-thread-1] INFO - LogEventPoster : -Posting Event to UNITY DATA COLLECTOR -
https://nc9118041070:9987/Unity/DataCollector2013-04-20 04:43:24,273 [pool-5-thread-1] INFO - LogEventPoster :
+++++++++ RESPONSE MESSAGE +++++++++2013-04-20 04:43:24,273 [pool-5-thread-1] INFO - LogEventPoster : OK2013-04-20 04:43:24,273 [pool-5-thread-1] INFO - LogEventPoster :
{ "batchSize": 2078,"failures": [ ], "numFailures": 0 }2013-04-20 04:43:24,273 [pool-5-thread-1] INFO - LogEventPoster :
++++++++++++++++++++++++++++++++++++2013-04-2 04:43:24,273 [pool-5-thread-1] INFO - LogEventPoster :
EIF event delivery to Generic Receiver -- SUCCESS~~~~~~~~~~~~~~~~~~~~~~~~~~~~~~~~~~~~~~~~~~~~~~~~~~~~~~~~~~~~~~~~~~~~~
In this log, the number of log records processed is indicated in the line:{ "batchSize": 2078, "failures": [ ], "numFailures": 0 }
2078 log records were successfully ingested. The numFailures value indicatesthe number of failures in the ingestion of the log records. For example, a valueof 5 for the numFailures value indicates that 5 log records were not ingested.When data collection has completed, if the EIF Receiver buffer is partiallyfilled, any remaining log records are posted to the Generic Receiver. This isrecorded in the log as a TIMEOUT FLUSH event. These events are added to the logfile at the end of the session of data collection:
332 IBM Operations Analytics - Log Analysis: Installation, Configuration, and Administration Guide

~~~~~~~~~~~~~~~~~~~~~~~~~~~~~~~~~~~~~~~~~~~~~~~~~~~~~~~~~~~~~~~~~~~~~~
2013-04-20 04:54:26,341 [pool-4-thread-1] INFO - LogEventService :TIMEOUT FLUSH for logsource:nc9118041070::/home/example/LogAnalytics/logsources/
WASInsightPack/TipTrace5.log2013-04-20 04:54:26,359 [pool-5-thread-1] INFO - LogEventPoster : ---Posting Event to UNITY DATA COLLECTOR -
https://nc9118041070:9987/Unity/DataCollector2013-04-20 04:54:38,581 [pool-5-thread-1] INFO - LogEventPoster :
+++++++++ RESPONSE MESSAGE +++++++++2013-04-20 04:54:38,582 [pool-5-thread-1] INFO - LogEventPoster : OK2013-04-20 04:54:38,582 [pool-5-thread-1] INFO - LogEventPoster :
{ "batchSize": 1714,"failures": [ ], "numFailures": 0 }2013-04-20 04:54:38,582 [pool-5-thread-1] INFO - LogEventPoster :
++++++++++++++++++++++++++++++++++++2013-04-20 04:54:38,582 [pool-5-thread-1] INFO - LogEventPoster :
EIF event delivery to Generic Receiver -- SUCCESS2013-04-20 04:54:38,583 [pool-4-thread-1] INFO - LogEventService :
POST RESULT:{"failures":[],"batchSize":1714,"numFailures":0}
~~~~~~~~~~~~~~~~~~~~~~~~~~~~~~~~~~~~~~~~~~~~~~~~~~~~~~~~~~~~~~~~~~~~~~~~
To calculate the number of events that have been processed, calculate the sumof all of the batchSize values. To calculate the number of events ingested,calculate the sum of all of the batchSize values and deduct the total sum ofnumFailure values.If the ingestion fails, an error message is recorded in the UnityEIFReceiver.log:2013-05-16 02:16:11,184 [pool-7-thread-1] INFO - LogEventPoster :
+++++++++ RESPONSE MESSAGE +++++++++2013-05-16 02:16:11,184 [pool-7-thread-1] INFO - LogEventPoster : Not Found2013-05-16 02:16:11,184 [pool-7-thread-1] INFO - LogEventPoster :
{"BATCH_STATUS":"NONE","RESPONSE_MESSAGE":"CTGLA0401E : Missing log source ","RESPONSE_CODE":404}2013-05-16 02:16:11,184 [pool-7-thread-1] INFO - LogEventPoster :
++++++++++++++++++++++++++++++++++++2013-05-16 02:16:11,184 [pool-7-thread-1] INFO - LogEventPoster :
FAILURE - ResponseCode:404 ResponseMessage:Not Found
Additional HTTP response codes are as follows:
413 Request Entity Too Large: Displayed if a batch size is greater than theGeneric Receiver default value set in the $UNITY_HOME/wlp/usr/servers/Unity/apps/Unity.war/WEB-INF/unitysetup.properties.
500 Internal Server Error: Displayed when there is any issue withIBMOperations Analytics - Log Analysis such as a database error or anyother runtime error.
404 Not Found: Displayed when a Log Source is not found for a hostnameand log path combination in the request.
409 Conflict: Displayed if the data batch is posted for a Log Source that isan inactive state or if there is a conflict between the data posted andthe data expected by the server. For example, the inputType field in therequest JSON does not match the inputType field in the Collection forthe requested hostname and log path combination.
200 OK: Displayed when the request is processed by the server. The statusof the processed batch of records is returned with the total number ofrecords ingested, how many failed records are present and whichfailed.
Loading and streaming data 333

400 Bad Request: Displayed when the request JSON does not contain therequired fields expected by the Generic Receiver or where the JSON isnot properly formed.
Results
After the task completes, the log file is indexed and can be searched using theSearch field on the IBM Operations Analytics - Log Analysis Dashboard.
Troubleshooting data loadingWhen you are using the IBM Tivoli Monitoring Log File Agent to perform datacollection, monitor the UnityEIFReceiver.log and GenericReceiver.log log fileslocated in the <HOME>/logs directory to ensure that the data ingestion hascompleted correctly.
This example illustrates the addition of a batch of log records. The result isindicated in the RESPONSE MESSAGE section of the log file:~~~~~~~~~~~~~~~~~~~~~~~~~~~~~~~~~~~~~~~~~~~~~~~~~~~~~~~~~~~~~~~~~~~~~~~~~~~~~~~~~2013-04-20 04:43:10,032 [pool-5-thread-1] INFO - LogEventPoster : -----------Posting Event to UNITY DATA COLLECTOR -
https://nc9118041070:9987/Unity/DataCollector2013-04-20 04:43:24,273 [pool-5-thread-1] INFO - LogEventPoster :
+++++++++ RESPONSE MESSAGE +++++++++2013-04-20 04:43:24,273 [pool-5-thread-1] INFO - LogEventPoster : OK2013-04-20 04:43:24,273 [pool-5-thread-1] INFO - LogEventPoster :
{ "batchSize": 2078,"failures": [ ], "numFailures": 0 }2013-04-20 04:43:24,273 [pool-5-thread-1] INFO - LogEventPoster :
++++++++++++++++++++++++++++++++++++2013-04-2 04:43:24,273 [pool-5-thread-1] INFO - LogEventPoster :
EIF event delivery to Generic Receiver -- SUCCESS~~~~~~~~~~~~~~~~~~~~~~~~~~~~~~~~~~~~~~~~~~~~~~~~~~~~~~~~~~~~~~~~~~~~~~~~~~~~~~~~~
In this log, the number of log records processed is indicated in the line:{ "batchSize": 2078, "failures": [ ], "numFailures": 0 }
2078 log records were successfully ingested. The numFailures value indicates thenumber of failures in the ingestion of the log records. For example, a value of 5 forthe numFailures value indicates that 5 log records were not ingested.
When data collection has completed, if the EIF Receiver buffer is partially filled,any remaining log records are posted to the Generic Receiver. This is recorded inthe log as a TIMEOUT FLUSH event. These events are added to the log file at the endof the session of data collection:~~~~~~~~~~~~~~~~~~~~~~~~~~~~~~~~~~~~~~~~~~~~~~~~~~~~~~~~~~~~~~~~~~~~~~~~~~~~~~~~~
2013-04-20 04:54:26,341 [pool-4-thread-1] INFO - LogEventService :TIMEOUT FLUSH for datasource:nc9118041070::/home/yogesh/IBM/LogAnalysis/logsources/WASInsightPack/TipTrace5.log
2013-04-20 04:54:26,359 [pool-5-thread-1] INFO - LogEventPoster : -----------Posting Event to UNITY DATA COLLECTOR -
https://nc9118041070:9987/Unity/DataCollector2013-04-20 04:54:38,581 [pool-5-thread-1] INFO - LogEventPoster :
+++++++++ RESPONSE MESSAGE +++++++++2013-04-20 04:54:38,582 [pool-5-thread-1] INFO - LogEventPoster : OK2013-04-20 04:54:38,582 [pool-5-thread-1] INFO - LogEventPoster :
{ "batchSize": 1714,"failures": [ ], "numFailures": 0 }2013-04-20 04:54:38,582 [pool-5-thread-1] INFO - LogEventPoster :
++++++++++++++++++++++++++++++++++++2013-04-20 04:54:38,582 [pool-5-thread-1] INFO - LogEventPoster :
334 IBM Operations Analytics - Log Analysis: Installation, Configuration, and Administration Guide

EIF event delivery to Generic Receiver -- SUCCESS2013-04-20 04:54:38,583 [pool-4-thread-1] INFO - LogEventService :
POST RESULT:{"failures":[],"batchSize":1714,"numFailures":0}
~~~~~~~~~~~~~~~~~~~~~~~~~~~~~~~~~~~~~~~~~~~~~~~~~~~~~~~~~~~~~~~~~~~~~~~~~~~~~~~~~
To calculate the number of events that have been processed, calculate the sum ofall of the batchSize values. To calculate the number of events ingested, calculatethe sum of all of the batchSize values and deduct the total sum of numFailurevalues.
If the ingestion fails, an error message is recorded in the UnityEIFReceiver.log:2013-05-16 02:16:11,184 [pool-7-thread-1] INFO - LogEventPoster :
+++++++++ RESPONSE MESSAGE +++++++++2013-05-16 02:16:11,184 [pool-7-thread-1] INFO - LogEventPoster : Not Found2013-05-16 02:16:11,184 [pool-7-thread-1] INFO - LogEventPoster :
{"BATCH_STATUS":"NONE","RESPONSE_MESSAGE":"CTGLA0401E : Missing data source ","RESPONSE_CODE":404}2013-05-16 02:16:11,184 [pool-7-thread-1] INFO - LogEventPoster :
++++++++++++++++++++++++++++++++++++2013-05-16 02:16:11,184 [pool-7-thread-1] INFO - LogEventPoster :
FAILURE - ResponseCode:404 ResponseMessage:Not Found
Additional HTTP response codes are as follows:
413 Request Entity Too Large: Displayed if a batch size is greater than theGeneric Receiver default value set in the $UNITY_HOME/wlp/usr/servers/Unity/apps/Unity.war/WEB-INF/unitysetup.properties.
500 Internal Server Error: Displayed when there is any issue withIBMOperations Analytics - Log Analysis such as a database error or any otherruntime error.
404 Not Found: Displayed when a data source is not found for a hostname andlog path combination in the request.
409 Conflict: Displayed if the data batch is posted for a data source that is aninactive state or if there is a conflict between the data posted and the dataexpected by the server. For example, the inputType field in the requestJSON does not match the inputType field in the Collection for therequested hostname and log path combination.
200 OK: Displayed when the request is processed by the server. The status ofthe processed batch of records is returned with the total number of recordsingested, how many failed records are present and which failed.
400 Bad Request: Displayed when the request JSON does not contain therequired fields expected by the Generic Receiver or where the JSON is notproperly formed.
Configuring the EIF ReceiverHow to configure remote or local installations of the Tivoli Event IntegrationFacility (EIF) receiver to work with IBM Operations Analytics - Log Analysis.
About this task
The following steps are the same for remote and local installations of the EIFunless stated otherwise.
Loading and streaming data 335

Configuring receiver buffer size and timeoutWhen collecting data using the IBM Tivoli Monitoring Log File Agent (LFA) andTivoli Event Integration Facility (EIF) Adapter flow, you might need to change therate at which events are flushed to the generic receiver for indexing. Incomingevents are buffered at the EIF receiver side.
About this task
To improve overall IBM Operations Analytics - Log Analysis performance, you canconfigure the buffer size and timeout period to match the rate of incoming events.When the event rate increases, increase the buffer size and decrease the timeoutperiod. When the event rate decreases, decrease the buffer size and keep thetimeout interval at the default value or increase it, depending on the event rate.
The following steps are the same for remote and local installations of the EIFunless stated otherwise.
Procedure
To change the buffer size and timeout parameters:1. Stop IBM Operations Analytics - Log Analysis:v If you use a local installation of the EIF, use the following command to stop
IBM Operations Analytics - Log Analysis:<HOME>/IBM/LogAnalysis/utilities/unity.sh -stop
v If you use a remote installation of the EIF, use the eifutil.sh -stopcommand to stop the instances. For more information, see “eifutil.shcommand” on page 77.
2. Open the configuration file for editing:v If you use a local installation of the EIF, open the unity.conf file in the
<HOME>/IBM/LogAnalysis/UnityEIFReceiver/config/ directory.v If you use a remote installation of the EIF, the unity.conf file is in the
<remote_deployment_location>/LogAnalysis/DataForwarders/EIFReceivers/<eif_inst_#>/config/unity.conf directory. Where<remote_deployment_location> is the directory on the remote machine whereyou deployed the EIF instance. <eif_inst_#> is the folder used for the specificremote EIF instance.
3. Change the Timeout and Buffer Size parameters to suit your operatingenvironment:#Timeout in Secondslogsource.buffer.wait.timeout=10#Buffer Size in Byteslogsource.max.buffer.size=250000
4. Save your changes.5. Start IBM Operations Analytics - Log Analysis:v If you use a local installation of the EIF, use the following command to start
IBM Operations Analytics - Log Analysis:<HOME>/IBM/LogAnalysis/utilities/unity.sh -start
v If you use a remote installation of the EIF, use the eifutil.sh -startcommand to start the instances. For more information, see “eifutil.shcommand” on page 77.
336 IBM Operations Analytics - Log Analysis: Installation, Configuration, and Administration Guide

Results
With higher buffer sizes, notice that it takes a longer time to fill the buffer withevents and for batches to be posted to the receiver.
Configuring the EIF receiver user accountThe Tivoli Event Integration Facility (EIF) receiver uses the default unityuser useraccount to access the generic receiver. You can change the user account or thedefault user password in the unity.conf configuration file.
About this task
The following steps are the same for remote and local installations of the EIFunless stated otherwise.
Procedure
To change the default EIF user or password:1. Stop IBM Operations Analytics - Log Analysis:v If you use a local installation of the EIF, use the following command to stop
IBM Operations Analytics - Log Analysis:<HOME>/IBM/LogAnalysis/utilities/unity.sh -stop
v If you use a remote installation of the EIF, use the eifutil.sh -stopcommand to stop the instances. For more information, see “eifutil.shcommand” on page 77.
2. Open the configuration file for editing:v If you use a local installation of the EIF, open the unity.conf file in the
<HOME>/IBM/LogAnalysis/UnityEIFReceiver/config/ directory.v If you use a remote installation of the EIF, the unity.conf file is in the
<remote_deployment_location>/LogAnalysis/DataForwarders/EIFReceivers/<eif_inst_#>/config/unity.conf directory. Where<remote_deployment_location> is the directory on the remote machine whereyou deployed the EIF instance. <eif_inst_#> is the folder that is used for thespecific remote EIF instance.
3. Change the following userid and password parameters to suit your operatingenvironment:unity.data.collector.userid=unityuser
unity.data.collector.password=password
To encrypt the password, use the unity_securityUtility.sh command. Formore information, see “Changing the default password for the Data Collectorand EIF Receiver” on page 300.
4. Save your changes.5. Restart IBM Operations Analytics - Log Analysis:v If you use a local installation of the EIF, use the following command to
restart IBM Operations Analytics - Log Analysis:<HOME>/IBM/LogAnalysis/utilities/unity.sh -restart
v If you use a remote installation of the EIF, use the eifutil.sh -restartcommand to restart the instances. For more information, see “eifutil.shcommand” on page 77.
Loading and streaming data 337

Results
The EIF receiver uses the new credentials to access the generic receiver.
Configuring the number of events in the EIF ReceiverYou can configure the number of events that the EIF Receiver stores for eachinternal queue. If you intend to ingest a large quantity of data and at a high rate,configure these values to larger values. However, increasing this value alsoincreases the memory requirements for EIF Receiver.
About this task
Ensure that you have sufficient memory to support the number of events in thequeue.
The following steps are the same for remote and local installations of the EIFunless stated otherwise.
Procedure
To change this setting:1. Stop IBM Operations Analytics - Log Analysis:v If you use a local installation of the EIF, use the following command to stop
IBM Operations Analytics - Log Analysis:<HOME>/IBM/LogAnalysis/utilities/unity.sh -stop
v If you use a remote installation of the EIF, use the eifutil.sh -stopcommand to stop the instances. For more information, see “eifutil.shcommand” on page 77.
2. Open the configuration file for editing:v If you use a local installation of the EIF, open the unity.conf file in the
<HOME>/IBM/LogAnalysis/UnityEIFReceiver/config/ directory.v If you use a remote installation of the EIF, the unity.conf file is in the
<remote_deployment_location>/LogAnalysis/DataForwarders/EIFReceivers/<eif_inst_#>/config/unity.conf directory. Where<remote_deployment_location> is the directory on the remote machine whereyou deployed the EIF instance. <eif_inst_#> is the folder used for the specificremote EIF instance.
3. Locate these lines and change the value to reflect your requirements:unity.data.collector.eif.consumer.num.events=1000000unity.data.collector.event.manager.num.events=20000
The following settings are applicable per data source:unity.data.collector.event.service.num.events=20000unity.data.collector.event.poster.num.events=500
4. Save your changes.5. Start IBM Operations Analytics - Log Analysis:v If you use a local installation of the EIF, use the following command to start
IBM Operations Analytics - Log Analysis:<HOME>/IBM/LogAnalysis/utilities/unity.sh -start
v If you use a remote installation of the EIF, use the eifutil.sh -startcommand to stop the instances. For more information, see “eifutil.shcommand” on page 77.
338 IBM Operations Analytics - Log Analysis: Installation, Configuration, and Administration Guide

Configuring the EIF Receiver memory clean up intervalIBM Operations Analytics - Log Analysis ensures that the memory used for datacollection with the Log File Agent using a property in the <HOME>/IBM/LogAnalysis/UnityEIFReceiver/config/unity.conf file. The EIF Receiver uses thisvalue to manage the memory usage. The configuration cycle is set to a value inminutes with a default value of 2 minutes.
About this task
The following steps are the same for remote and local installations of the EIFunless stated otherwise.
Procedure
To configure this property:1. Stop IBM Operations Analytics - Log Analysis:v If you use a local installation of the EIF, use the following command to stop
IBM Operations Analytics - Log Analysis:<HOME>/IBM/LogAnalysis/utilities/unity.sh -stop
v If you use a remote installation of the EIF, use the eifutil.sh -stopcommand to stop the instances. For more information, see “eifutil.shcommand” on page 77.
2. Open the configuration file for editing:v If you use a local installation of the EIF, open the unity.conf file in the
<HOME>/IBM/LogAnalysis/UnityEIFReceiver/config/ directory.v If you use a remote installation of the EIF, the unity.conf file is in the
<remote_deployment_location>/LogAnalysis/DataForwarders/EIFReceivers/<eif_inst_#>/config/unity.conf directory. Where<remote_deployment_location> is the directory on the remote machine whereyou deployed the EIF instance. <eif_inst_#> is the folder that is used for thespecific remote EIF instance.
3. Change the parameters to suit your operating environment:#gc interval is in minutesunity.data.collector.gc.interval=2
4. Save your changes.5. Start IBM Operations Analytics - Log Analysis:v If you use a local installation of the EIF, use the following command to start
IBM Operations Analytics - Log Analysis:<HOME>/IBM/LogAnalysis/utilities/unity.sh -start
v If you use a remote installation of the EIF, use the eifutil.sh -startcommand to start the instances. For more information, see “eifutil.shcommand” on page 77.
Configuring scalable data streaming from multiple, remotesources
To facilitate dynamic data streaming that is scalable across multiple remote sources,you must configure IBM Operations Analytics - Log Analysis after you install it.
To enable data collection from remote hosts, you must complete the followingsteps:1. Install Apache Solr on the remote machine.
Loading and streaming data 339

2. Set up Secure Shell (SSH) communication.3. Configure SSH to work with the remote installer utility.4. Use the remote installer utility to install instances of the Event Integration
Facility (EIF) or the IBM Tivoli Monitoring Log File Agent (LFA) on remotemachines.
5. Configure the EIF so that it is compatible with the remote instances that yourcreate. If you use the LFA, you do not have to configure the local installation.However, you do have to manually configure the sub nodes.
You can also maintain and administer these connections after you set them up.
As an alternative to streaming data, You can batch load data. For moreinformation, see “Loading and streaming data” on page 258.
Installing Apache Solr on remote machinesAfter you install IBM Operations Analytics - Log Analysis, you can use the ApacheSolr remote installer to install Apache Solr on a remote machine.
About this task
If no local instances of Apache Solr exist, then you need to install the instances onthe remote machine as soon as you install IBM Operations Analytics - LogAnalysis. If there is a local instance of Apache Solr, you can install the remoteinstances whenever you want.
You must use a non-root user to run the script.
You cannot use the installer to install Apache Solr on a local machine.
You cannot use the installer to install multiple Apache Solr nodes on a singleremote machine.
Ensure that the Apache Solr ports are open and free from any firewall restrictionson the remote machine.
To install Apache Solr on multiple remote machines, run the script separately foreach remote machine. You cannot use the installer to install instances of ApacheSolr simultaneously or in parallel.
Procedure1. Change the directory to <HOME>/IBM/LogAnalysis/solr_install_tool. For
example:cd <HOME>/IBM/LogAnalysis/solr_install_tool
2. To run the remote_deploy.sh script, enter the following command:./remote_deploy_solr.sh -install
3. The script prompts you for the following information:
Remote Hostname in FQDN formatEnter the Fully Qualified Domain Name (FQDN) of the remote host.
UsernameEnter the user name.
PasswordEnter the password if password-less SSH authentication is disabled. Ifpassword-less SSH is enabled between the IBM Operations Analytics -
340 IBM Operations Analytics - Log Analysis: Installation, Configuration, and Administration Guide
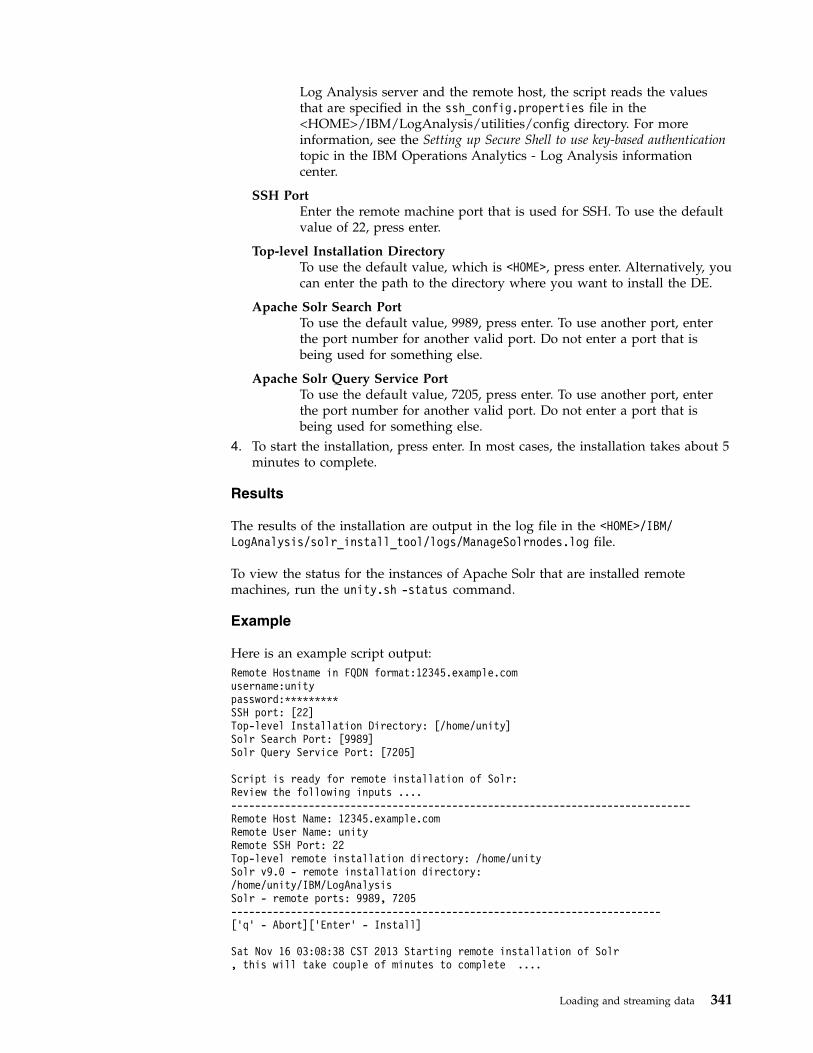
Log Analysis server and the remote host, the script reads the valuesthat are specified in the ssh_config.properties file in the<HOME>/IBM/LogAnalysis/utilities/config directory. For moreinformation, see the Setting up Secure Shell to use key-based authenticationtopic in the IBM Operations Analytics - Log Analysis informationcenter.
SSH PortEnter the remote machine port that is used for SSH. To use the defaultvalue of 22, press enter.
Top-level Installation DirectoryTo use the default value, which is <HOME>, press enter. Alternatively, youcan enter the path to the directory where you want to install the DE.
Apache Solr Search PortTo use the default value, 9989, press enter. To use another port, enterthe port number for another valid port. Do not enter a port that isbeing used for something else.
Apache Solr Query Service PortTo use the default value, 7205, press enter. To use another port, enterthe port number for another valid port. Do not enter a port that isbeing used for something else.
4. To start the installation, press enter. In most cases, the installation takes about 5minutes to complete.
Results
The results of the installation are output in the log file in the <HOME>/IBM/LogAnalysis/solr_install_tool/logs/ManageSolrnodes.log file.
To view the status for the instances of Apache Solr that are installed remotemachines, run the unity.sh -status command.
Example
Here is an example script output:Remote Hostname in FQDN format:12345.example.comusername:unitypassword:*********SSH port: [22]Top-level Installation Directory: [/home/unity]Solr Search Port: [9989]Solr Query Service Port: [7205]
Script is ready for remote installation of Solr:Review the following inputs ....-----------------------------------------------------------------------------Remote Host Name: 12345.example.comRemote User Name: unityRemote SSH Port: 22Top-level remote installation directory: /home/unitySolr v9.0 - remote installation directory:/home/unity/IBM/LogAnalysisSolr - remote ports: 9989, 7205------------------------------------------------------------------------[’q’ - Abort][’Enter’ - Install]
Sat Nov 16 03:08:38 CST 2013 Starting remote installation of Solr, this will take couple of minutes to complete ....
Loading and streaming data 341

Sat Nov 16 03:08:38 CST 2013 Waiting for remote installation to complete ....Sat Nov 16 03:11:47 CST 2013 Successfully installed SolrSolr on remote host:12345.example.com ....
Removing Apache Solr instances:
Before you remove an installation of IBM Operations Analytics - Log Analysis, youmust remove Apache Solr.
About this task
Note: Do not remove Apache Solr if IBM Operations Analytics - Log Analysis isstill being used. IBM Operations Analytics - Log Analysis does not functionproperly when any instances of Apache Solr are removed. For this reason, onlyremove Apache Solr when you are about to uninstall IBM Operations Analytics -Log Analysis.
If you installed Apache Solr locally and remotely, remove the local instance first,then remove the remotely installed instances.
This process uses Installation Manager to remove Apache Solr instances. You canalso do so silently. To run the silent removal, run following imcl -c command,enter 3 to modify the installation, and remove the instance.
Procedure
1. Change the directory to <HOME>/IBM/LogAnalysis/solr_install_tool. Forexample:cd <HOME>/IBM/LogAnalysis/solr_install_tool
2. To run the remote_deploy.sh uninstall script, enter the following command:./remote_deploy.sh -uninstall
3. The script prompts you for the following information:
Remote Hostname in FQDN formatEnter the Fully Qualified Domain Name (FQDN) of the remote host.
UsernameEnter the user name.
PasswordEnter the password if password less SSH authentication is disabled. Ifpassword less SSH is enabled between the IBM Operations Analytics -Log Analysis server and the remote host, the script reads the valuesthat are specified in the ssh_config.properties file in the<UNITY_HOME>/utilities/config directory. For more information, seethe Setting up Secure Shell to use key-based authentication topic in the IBMOperations Analytics - Log Analysis information center.
SSH PortEnter the remote machine port that is used for SSH. To use the defaultvalue of 22, press enter.
Top-level Installation DirectoryTo use the default value, which is <HOME>/IBM/LogAnalysis, press enter.Alternatively, you can enter the path to the directory where ApacheSolr is installed.
4. To start the removal, press enter. You can view the logs in the<HOME>/IBM/LogAnalysis/solr_install_tool/logs directory.
342 IBM Operations Analytics - Log Analysis: Installation, Configuration, and Administration Guide

Results
When all the remote nodes are removed, you can safely uninstall IBM OperationsAnalytics - Log Analysis.
Setting up Secure Shell to use key-based authenticationSecure Shell (SSH) is a cryptographic network protocol for secure datacommunication between different computers. You set up key-based authenticationbetween the IBM Operations Analytics - Log Analysis servers and the remotecomputers to which it connects.
About this task
Benefits of using key-based authentication:v Data is transferred across a secure channel.v The administrator is no longer concerned about the password changes for the
remote servers.v The passphrase is independent of the individual server password policy.v One passphrase is used for multiple servers. Only the public key file must be
copied to the client server.
For more information you can view the man pages for ssh-keygen by running thiscommand:man ssh-keygen
Procedure1. To generate public and private keys, enter the following command:
ssh-keygen -t rsa
or either of the following commands:ssh-keygen(This command generates the same results as ssh-keygen -t rsa.)
ssh-keygen -t dsa(If you specify dsa, the generated keys include _dsa in their file names.)
The following example shows what a valid output might look like:
bash-3.2$bash-3.2$ ssh-keygen -t rsaGenerating public/private rsa key pair.Enter file in which you want to save the key (/home/unity/.ssh/id_rsa):Enter passphrase (empty for no passphrase):Enter same passphrase again:Your identification has been saved in /home/unity/.ssh/id_rsa.Your public key has been saved in /home/unity/.ssh/id_rsa.pub.The key fingerprint is:4a:ef:d5:7a:d8:55:b3:98:a1:1f:62:be:dd:c4:60:6e unity@<variable>.example.comThe key’s randomart image is:+--[ RSA 2048]----+| || || || . ..|| . S .o+.o|| . o =o++. || . . +o+E.o || . ..o=.o || . .o.. . |+-----------------+bash-3.2$
Loading and streaming data 343

Enter the passphrase. (The Enter passphrase field can remain blank to specifyan empty passphrase.)
2. To view the contents of the public key file, run the following commands:cd ~/.sshls -l id_rsa*cat id_rsa.pub
The command output is:bash-3.2$bash-3.2$ cat .ssh/id_rsa.pubssh-rsa AAAAB3NzaC1yc2EAAAADAQABAAABAQDg0/GGoxGzyC7Awjbwnp0hCaeztIRt6yhAgGKdwM7nb7Iiv0RgwT4/48E26K1Ur9HrI1W/j0K0JHQwvaAFibqeLmqLdK9ctCE901ywTOPFcYeBYPUF9vp/MgaypgGxVwDbW/e0SNPb7YAtZpjRoqeUqoYoKzFXXspQkxdhcQfpx0RYMbQdGGg03hDCM2wr2KPVuTVniF2IvDu1C4fcRkUPr8aQNMiuEcJgV3VHhlau/0Uo0YpH53NXKhn/sx8xdyTVsKQ1rhW8g07HIVc2Tf9ZF2gYXn/HbjE509xK/APu2nztt0h+AirJyT5jYMi/IvSI0zbPyc0p9WijPeG8r/v unity@<variable>.in.ibm.combash-3.2$
3. Create a directory called .ssh on the remote server. Use this to store the publickey.
4. Copy the public key file (id_rsa.pub) to the .ssh directory on the remote client:scp /home/unity/.ssh/id_rsa.pub<username>@<remotehostname>:/<HOME>/.ssh/id_rsa.pub
where <hostname> is the system host name and <username> is the system username.
5. Add the content of the public key to the authorized_keys file on the remotehost.bash-3.2$ ssh <username>@<remotehostname>bash-3.2$ cd ~/.sshbash-3.2$ cat id_rsa.pub >> authorized_keysbash-3.2$ rm id_rsa.pubbash-3.2$ exit
6. Ensure that there are no duplicate keys for the same client in theauthorized_keys file.
7. Log in to the remote computer to ensure that key-based SSH is working:ssh <username>@<hostname>
Enter the passphrase, if prompted.
bash-3.2$ bash-3.2$ ssh <username>@<remotehostname>Enter passphrase for key ’/home/unity/.ssh/id_rsa’:Last unsuccessful login: Mon Jul 15 14:22:37 2013 on ssh from <variable>.example.comLast login: Mon Jul 15 14:26:54 2013 on ssh from <variable>.example.com$
Configuration of key-based authentication is complete.
Results
The steps may not work because different versions of SSH are supported by theoperating systems that are used by the remote servers. For more information abouthow to solve this issue, see the Secure Shell (SSH) configuration does not work topicin the Troubleshooting IBM Operations Analytics - Log Analysis guide.
Configuring secure shell (SSH) communication for multiple remote hosts:
Before you can use the remote installer utility, you must configure the SSH for theremote hosts.
344 IBM Operations Analytics - Log Analysis: Installation, Configuration, and Administration Guide

Before you begin
Before you configure SSH for multiple remote hosts, you must configure SSHbetween IBM Operations Analytics - Log Analysis and the remote hosts. For moreinformation, see the Setting up Secure Shell to use key-based authentication topic in theInformation Center.
About this task
By default, the SSH properties file, ssh-config.properties file, is in the<HOME>/IBM/LogAnalysis/remote_install_tool/config directory. If you save the fileto another location, the utility requests that the user enters values for the remotehost, user, and password. In this case, the utility does not use the values specifiedin the file.
If you save the ssh-config.properties file in the <HOME>/IBM/LogAnalysis/remote_install_tool/config directory, the eif_remote_install_tool utility usesthe properties specified in the file.
The SSH communication can be based on a password or public key. If youimplement both options, the public key configurations are used by default.
To set up password based SSH, you specify a value for the password and commentout the private key file. The remote installer utility uses the specified password forSSH authentication when it connects to the remote host.
To set up private key file based authentication, you specify the private key filepath and do not specify a value for the password. The utility uses the file to createa password-less SSH connection.
If you specify values for both the password and the private key file path, theutility uses the file to create a password-less SSH connection.
If you do not specify a value for the password or the private key file path, IBMOperations Analytics - Log Analysis cannot create a connection and insteadgenerates an error message in the log:
ERROR:example.unity.remote.SshConfigException:
Property file config/ssh-config.properties must contain at least one of:PASSWORD, PATH_OF_PASSWORD_LESS_SSH_KEY
Correct SSH configuration OR reconfigure and retryInstallation Aborted....!
Procedure
1. Navigate to the <HOME>/IBM/LogAnalysis/remote_install_tool/config directoryand open the ssh-config.properties file.
2. Specify values for the following properties for each remote host:v Remote hostv Remote user IDv Portv Connection timeout in milliseconds. The default is 6000.
For example:
Loading and streaming data 345

REMOTE_HOST=<REMOTE_HOST>PORT=<PORT>TIME_OUT=60000USER=<REMOTE_USER>
3. For password-based authentication, you also need to specify the password inthe configuration file. For example:PASSWORD=password1
4. For public key based authentication, specify the path to the directory thatcontains the private key file. For example:PATH_OF_PASSWORD_LESS_SSH_KEY=/home/pass/.ssh/id_rsa
5. If your installation of SSH requires a passphrase, specify the passphrase. Forexample:PASSPHRASE_OF_PASSWORD_LESS_SSH_KEY=passphrase1
Configuring data collection for scalability on multiple remotenodesTo facilitate scalable data collection on multiple remote nodes, use the install.shcommand to install the Tivoli Event Integration Facility Receiver or the IBM TivoliMonitoring Log File Agent on a remote server.
Before you begin
Before you run the command, you must configure secure shell (SSH)communication between the local installation of IBM Operations Analytics - LogAnalysis and the remote host. For more information about how to do so, see“Configuring secure shell (SSH) communication for multiple remote hosts” onpage 74.
About this task
The install.sh command is in the <HOME>/IBM/LogAnalysis/remote_install_tool/directory on the local installation of IBM Operations Analytics - Log Analysis.
You can use the remote installer in the following scenarios:v If you have a high rate of data ingestion on multiple data sources. For example,
if you have 100 or more events per second and 20 or more data sources.v If you require improved throughput performance on the remote server.v If the hardware resources on the remote server are restrained.v If you want to optimize performance according to the conditions described on
the Performance developer works page here: https://www.ibm.com/developerworks/community/wikis/home?lang=en#!/wiki/IBM Log AnalyticsBeta/page/Performance and tuning
You can use the command to deploy up to 20 instances of the Tivoli EventIntegration Facility Receiver or a single instance of the IBM Tivoli Monitoring LogFile Agent on a remote node. The command deploys and configures IBM Java 1.8.The command also configures the deployed Tivoli Event Integration FacilityReceiver instance to communicate with the IBM Operations Analytics - LogAnalysis Data Collector interface.
However, this command does not configure the IBM Tivoli Monitoring Log FileAgent subnode. You must configure this setting manually. Both the remote andlocal instance of the IBM Tivoli Monitoring Log File Agent can monitor remote
346 IBM Operations Analytics - Log Analysis: Installation, Configuration, and Administration Guide

data sources. For more information about configuring IBM Tivoli Monitoring LogFile Agent, see “Configuring a remote LFA to stream data” on page 267.
To ensure that the remote instances of the Tivoli Event Integration Facility workwith the local Data Collector interface, you must create the remotelydeployedTivoli Event Integration Facility or IBM Tivoli Monitoring Log File Agentinstances as part of the same installation. This is because the encryptionconfiguration and signature generation is done during the main installation. If youinstall IBM Operations Analytics - Log Analysis after you set up the remote nodes,you must install the remote Tivoli Event Integration Facility or IBM TivoliMonitoring Log File Agent instances again. However, you can remove remoteinstances of the Tivoli Event Integration Facility or IBM Tivoli Monitoring Log FileAgent without installing IBM Operations Analytics - Log Analysis again.
Note: If you use the script to install the remote instance on a server that uses theSUSE Linux Enterprise Server 11 operating system, the script fails. To resolve thisissue, see the Cannot install remote EIF instance on SUSE topic in the TroubleshootingIBM Operations Analytics - Log Analysis guide.
Note:
The remote installer that you use to install instances of the IBM Tivoli MonitoringLog File Agent and the Tivoli Event Integration Facility does not support crossoperating system integration. You must use the remote installers to install remoteinstances on servers that use the same operating system. For example, if you installIBM Operations Analytics - Log Analysis on Linux on System z, you must installthe remote instances on Linux on System z. In this example, you cannot installremote instances on Linux on System x.
Procedure1. Navigate to the <HOME>/IBM/LogAnalysis/remote_install_tool/ directory and
run the install.sh command. You are prompted for a series of inputs.2. Enter the remote installation directory. This value must be the location where
the deployed artifacts are installed on the remote host.3. If you want to deploy the Tivoli Event Integration Facility Receiver, select it. If
you do, enter the Tivoli Event Integration Facility Receiver instances that youwant to deploy.
4. If you want to deploy the IBM Tivoli Monitoring Log File Agent instance onthe remote node, select it.
Results
After you complete the procedure, you can now collect data from the remote hosts.
What to do next
After the initial setup, you will want to periodically change the configuration. IBMprovides two commands to start and stop the instances so that you can update theconfiguration.
To administer Tivoli Event Integration Facility Receiver instances, use theeifutil.sh command.
To administer IBM Tivoli Monitoring Log File Agent instances, use the lfautil.shcommand.
Loading and streaming data 347

eifutil.sh command:
To administer EIF Receiver instances, use the eifutil.sh command.
Syntax
The eifutil.sh command has the following syntax and is in the<USER_HOME_REMOTE>/DataForwarders/EIFReceivers/utilities where<USER_HOME_REMOTE> is the directory on the remote host where the EIFReceiver instances are deployed:eifutil.sh -status|-start <Inst_ID>|-stop <Inst_ID>|-startAll|-stopAll|-restart<Inst_ID>|-restartAll
where <Inst_ID> is the ID for the specific EIF instance.
Parameters
-statusDisplays the status for the installed instances. For example:============================================================================COMPONENT Instance PID PORT STATUS============================================================================EIF Receiver eif_inst_1 13983 6601 UPEIF Receiver eif_inst_2 14475 6602 UPEIF Receiver eif_inst_3 14982 6603 UPEIF Receiver eif_inst_4 15474 6604 UPEIF Receiver eif_inst_5 15966 6605 UP============================================================================
-start <Inst_id>Starts the specified instance.
-stop <Inst_id>Stops the specified instance.
-startAllStarts all instances.
-stopAllStops all instances.
-restart<Inst_id>Restarts the specified instance.
-restartAllRestarts all the instances.
lfautil.sh command:
To administer IBM Tivoli Monitoring Log File Agent (LFA) instances, use thelfautil.sh command.
Syntax
The lfautil.sh command has the following syntax and is in the<USER_HOME_REMOTE>/utilities/ directory on the remote host where<USER_HOME_REMOTE> is the directory on the remote host where the LFAinstances are deployed:lfautil.sh -start|-stop|-status|-restart
348 IBM Operations Analytics - Log Analysis: Installation, Configuration, and Administration Guide

Parameters
-start Starts all the LFA instances on the remote host.
-stop Stops all the LFA instances on the remote host.
-statusDisplays the status for the LFA instances on the remote host. For example:==========================================COMPONENT PID STATUS==========================================Log File Agent 23995 UP==========================================
-restartRestarts the LFA instances on the remote host.
Loading batches of dataIn addition to streaming data directly, you can also load batches of historic data fortest or other purposes.
Generic ReceiverThe Generic Receiver is a component of IBM Operations Analytics - Log Analysisthat supports the REST interface for loading data into IBM Operations Analytics -Log Analysis. The REST API uses JSON (JavaScript Object Notation) as an inputand returns JSON as an output after the incoming logs are processed. If an erroroccurs, the API returns an error code and a message.
Processing a batch
Invoking the Generic Receiver API initiates the processing of a batch that iscontained in the Input JSON. Buffer a set of log records to create a batch and senddata in batches to IBM Operations Analytics - Log Analysis. The batches must besent in the order in which logs are generated for a specific data source. The size ofeach batch must be less than the batch size (500000 bytes) supported by IBMOperations Analytics - Log Analysis. At the minimum, you can send data for asingle log record in a batch. The Generic Receiver processes a batch by:v Splitting the batch into multiple log records by using the Splitter that was
specified during the creation of the SourceType from the Admin UIcorresponding to the data source
v Annotates every log record that is found by the Splitter by using the Annotatorthat is specified during the creation of the SourceType from the Admin UIcorresponding to the data source
v Indexing the annotated log record in the back-end search engine
As special cases, split and annotated steps are skipped if the Splitter or Annotatoris specified as null in the SourceType. Even if there is no data to split, you need tosend an empty string in the text field of the Input JSON.
Batching of data at the client might lead to an incomplete log record at the end ofthe batch. This incomplete log record gets buffered in IBM Operations Analytics -Log Analysis and stitched with the remaining data in the subsequent batch to forma complete log record. This stitching assumes that you are maintaining the logrecord order of the data that is sent to IBM Operations Analytics - Log Analysis. Ifthe order is not maintained, then logs are not correctly split into log records.
Loading and streaming data 349

Input JSON
The basic structure of an Input JSON file is:{"hostname": , (String)"logpath":" , (String)"batchsize": , (String)"inputType": // Optional (String) "LOGS";"flush": // Optional (boolean)"payload": // (JSONObject){"name1":"value1", // Optional......"nameN":"valueN" , // Optionaltext : "log record 1 log record 2 ..." (String)}}
The following parameters in the Input JSON are mandatory:hostname
The host name that corresponds to the data source for which you want toingest data.
logpathThe log path that corresponds to the data source for which you want toingest data.
batchsizeThe number of BYTES of logs that are sent in one batch to IBM OperationsAnalytics - Log Analysis (less than 500,000).
inputType The type of input data: LOGS.
flush flagA flag that indicates to the Generic Receiver whether the last record in thebatch is a complete log record. Typically, this flag would be set to true inthe last batch upon reaching the end of file.
payload.txtThis text contains the actual log records to be split, annotated, and indexedinto IBM Operations Analytics - Log Analysis. The text portion is split intolog records by the Splitter, annotated by the Annotator, and then indexed.If you do not have any log records, but want to index only structured(name-value pairs) data, you can specify this mandatory field as an emptystring.
More metadata (optional) to be indexed with every log record of the batch can bespecified as name-value pairs in the input JSON or the payload within the inputJSON. This metadata is applicable at the batch level. For posting distinct metadatafor each log record, send 1 log record at a time in the batch.
Post the input JSON to the following URL:http://<UNITY_HOST_NAME>:<UNITY_PORT>/Unity/DataCollector
where <UNITY_HOST_NAME> is the machine on which you installed IBM OperationsAnalytics - Log Analysis and <UNITY_PORT> is the port on which it is running. Thedefault port is 9988. The client (Java or Script) sending data into IBM OperationsAnalytics - Log Analysis needs to authenticate by using the form-based mechanismthat is implemented in IBM Operations Analytics - Log Analysis before the DataCollector API is invoked. Refer to the authentication and security design documentfor details.
350 IBM Operations Analytics - Log Analysis: Installation, Configuration, and Administration Guide

Output JSON
The output that is sent by the Generic Receiver after indexing logs contains thecount and detailed information on the failure cases in a JSON Array. The detailsinclude the actual logRecord, specific error message, and any exception. The basicstructure of an Output JSON file is:{"batchSize" : , // (int)"numFailures" : , // (int)"failures" : // (JSONArray)
[{"logRecord" : , // (JSONObject)"errorMessage": , // (String)"exception" : , // (JSONArray)},...{
}]}
Serviceability
As you send data into IBM Operations Analytics - Log Analysis, you mightencounter errors that occur before the incoming batch gets processed or errors thatoccur during processing of batch and indexing log records.
If errors occur before the incoming batch gets processed, the Generic receiverreturns an error code and message. To correct the problem, process the error code,make any required changes, and resend the data.
Possible causes for error code 400 (HttpServletResponse.SC_BAD_REQUEST)include:v Invalid input JSONv Input batch size is greater than what is supported (500000 bytes)v No data source is configured from the Admin UI for the host name and log path
combination that is sent in the input JSONv The input type (LOGS) specified in the batch does not match the value that is
specified in the logsource that is configured from the Admin UI
Possible causes for error code 500(HttpServletResponse.SC_INTERNAL_SERVER_ERROR) include:v An exception that is encountered in any of the steps of the ingestion pipeline
(for example, during splitting of a batch).v An internal IBM Operations Analytics - Log Analysis database-related error.v Any other exception in IBM Operations Analytics - Log Analysis.
If errors occur during processing of batch and indexing log records, the outputJSON provides details of indexing failure. To correct the problem, process the errorcode, make any required changes, and resend only the affected log records.Sending the same log record twice to IBM Operations Analytics - Log Analysisresults in duplicate records in the back-end index and duplicate records in thesearch results.
Loading and streaming data 351

Batch loading historic log data with the Data Collector clientUse the Data Collector client to ingest data in batch mode. Use this method toreview historic log data. This is the easiest method if you want to ingest large logfiles for historic analysis.
Before you begin
If you want to use the Data Collector client to load data from remote sources, youmust configure the data collector on the remote host before you can configure thelocal data collector as described here. For more information, see “Configuring theData Collector client to ingest data from remote hosts” on page 297.
About this task
If you want to load a log file that does not include time stamp information, ensurethat the values for timestamp and timestampFormat are configured injavaDatacollector.properties. IBM Operations Analytics - Log Analysis cannotindex log files without a time stamp, but if no time stamp information is found ina log file, the value that is configured in javaDatacollector.properties is used.
Procedure
To use the Data Collector client to load log file information, complete the followingsteps:1. In the Administrative Settings page, define an appropriate log file source.2. At the command line, navigate to the <HOME>/utilities/datacollector-client
directory.3. Update the configuration file that is used by the Data Collector client,
javaDatacollector.properties. Set the following properties, as appropriate:
logFileThe full path of the file you want to ingest.
servletURLThe URL of the Data Collector service.
userid The user ID for the Data Collector service.
passwordThe password for the Data Collector service.
datasourceThe datasource that you want to use to load data.
timestampThe time stamp to use if a time stamp is not found in the log file.
batchsizeThe number of BYTES of logs that are sent in one batch. The defaultvalue is 500,000.
keystoreThe full path to the keystore file.
inputType The valid input types are: LOGS, CONFIGFILES, SUPPORTDOCS. The defaultvalue is LOGS.
flush flagIf the default true is set, the client sends a flush signal to the Generic
352 IBM Operations Analytics - Log Analysis: Installation, Configuration, and Administration Guide

Receiver for the last batch of the file. If set to false, no flush signal issent when the end of file is reached.
The following sample javaDatacollector.properties file displays theconfiguration for loading the SystemOut.log log file.#Full path of the file you want to read and upload to UnitylogFile = SystemOut.log#The URL of the REST service. Update the host/port information if requiredservletURL = https://hostname:9987/Unity/DataCollector#The user ID to use to access the unity rest serviceuserid=unityuser#The password to use to access the unity rest servicepassword=passworddatasource=Systemout#Time stamp to use if your content can not find a time stamp in log record.The same time stamp would be used for all recordstimestamp = 01/16/2013 17:27:23:964 GMT+05:30#The number of BYTES of logs sent in one batch to Unitybatchsize = 500000#The full path to the keystore filekeystore = /home/unity/IBM/LogAnalysisTest/wlp/usr/servers/Unity/keystore/unity.ks#input data type - LOGS, CONFIGFILES, SUPPORTDOCSinputType = LOGS#flush flag:#true : (default) if the client should send a flush signal to the GenericReceiver for the last batch of this file
#false : if no flush signal to be sent upon reaching eod-of-fileflushflag = true#Other properties (name/value pairs, e.g. middleware = WAS) that you wantto add to all json records
#These properties need to be appropriately added to the index configuration
4. Ensure that the Data Collector client JAR file, datacollector-client.jar, hasexecute permissions.
5. Use the following command to run the Data Collector client with the correctinputs:<HOME>/ibm-java/bin/java-jar datacollector-client.jar
Results
After the task completes, the log file is indexed and can be searched in the Searchworkspace.
Configuring the Data Collector client to ingest data fromremote hosts
If you want to use the Data Collector client to collect data from a remote serverand return it to the local machine, you must configure the data collector on theremote host.
Before you begin
You must use the instance of IBM Java Runtime Engine (JRE) 1.8 that is installedby the remote installer. Before you configure the data collector, you must use theremote installer to install at least one instance of IBM Tivoli Monitoring Log FileAgent or the EIF Receiver on a remote machine. For more information, see theConfiguring data collection for scalability on multiple remote nodes topic in theInstallation Guide.
Loading and streaming data 353

About this task
To configure the Data Collector on the remote host, copy the data collector clientfiles from your local version of the data collector files to the remote host.
Procedure1. Copy the <HOME>/utilities/datacollector-client directory and all the files
that are contained in it from the local installation of IBM Operations Analytics -Log Analysis to the remote machine.
2. Add the location of the log and keystore files to thejavaDatacollector.properties file in the directory that you copied the datacollector to in the previous step. The keystore file is named unity.ks and it isavailable in the <Remote_install_dir>/LogAnalysis/store/ directory on theremote machine. Where <Remote_install_dir> is the directory where youinstalled the remote instance as described in the Prerequisites section here.
Results
After you complete the configuration, you must complete the Data Collectorconfiguration. For more information about how to do this, see “Batch loadinghistoric log data with the Data Collector client” on page 295. You must ensure thatthe remote installation uses the IBM Java Runtime Engine (JRE) 1.8 that is installedby the remote installer. IBM Java Runtime Engine (JRE) 1.8 is stored in the<Remote_install_dir>/LogAnalysis/ibm-java/ directory.
Data Collector propertiesBefore you can use the data collector to stream data or load a batch of historicdata, edit the javaDatacollector.props file.
The javaDatacollector.props file is in the <HOME>/IBM/LogAnalysis/utilitiesdatacollector-client folder.
The logFile, hostname, logpath, and keystore parameters are required.
The userid, password, and keystore parameters are automatically populated withthe default values that are created during the installation. If you want, you canchange these but you do not need to.
Table 82. Data Collector properties
Parameter Value
logFile The full path of the file you want to load.
servletURL The URL of the Data Collector service.
userid The user ID for the Data Collector service.
password The password for the Data Collector service.
datasource The datasource that you want to use to loaddata.
timestamp The time stamp to use if a time stamp is notfound in the log file.
batchsize The number of BYTES of logs sent in onebatch. The default value is 500,000.
keystore The full path to the keystore file.
inputType The valid input type is LOGS.
354 IBM Operations Analytics - Log Analysis: Installation, Configuration, and Administration Guide

Table 82. Data Collector properties (continued)
Parameter Value
flush flag If the default true is set, the client sends aflush signal to the Generic Receiver for thelast batch of the file. If set to false no flushsignal is sent when the end-of-file isreached.
Loading batches of historic data with the IBM TivoliMonitoring Log File Agent
You can use the IBM Tivoli Monitoring Log File Agent to load batches of historicdata for testing and other purposes.
Procedure1. Copy the log files that you want to load to a temporary directory on the IBM
Operations Analytics - Log Analysis server. For example, to upload a batch oflog files from an installation of WebSphere Application Server, you copy theSampleSystemOut.log file to the /tmp/logs/ directory.
2. Create a custom data source.3. Copy the log file to the directory that you specified in the logpath parameter
when you created the data source.
Extending storage space available to Apache SolrYou can add more Apache Solr storage directories outside the initial IBMOperations Analytics - Log Analysis Apache Solr installation location if the disk onwhich Apache Solr was installed reached maximum capacity.
Before you begin
Ensure that the Apache Solr storage directories are present on all Apache Solrservers and are writable.
About this task
Switching to a new Apache Solr directory is not instantaneous. Therefore, it is tomonitor the disk usage of your Apache Solr directory to ensure that extradirectories are added before the current storage directory reaches maximumcapacity.
Procedure
To enable the storage extension capability, complete the following steps.1. Stop IBM Operations Analytics - Log Analysis with the following command.
<HOME>/IBM/LogAnalysis/utilities/unity.sh -stop
2. Open the unitysetup.properties file in the <HOME>/IBM/LogAnalysis/wlp/usr/servers/Unity/apps/Unity.war/WEB-INF directory.
3. Add the following property to the directoryENABLE_STORAGE_RELOCATION=true
4. Create the following properties file<HOME>/solrConfigs/storageConfig.properties
Loading and streaming data 355

For example,/home/unity/IBM/LogAnalysis/solrConfigs/storageConfig.properties
5. Open the storageConfig.properties file and add the following property to thefile.SOLR_STORAGE_DIR=storage-path-on-solr-nodes
For example,SOLR_STORAGE_DIR=/opt/scala/ext_storage
6. Restart IBM Operations Analytics - Log Analysis with the following command.<HOME>/IBM/LogAnalysis/utilities/unity.sh -restart
Results
The new IBM Operations Analytics - Log Analysis configuration file enables thespecification of custom data storage locations. The new locations are written towhen IBM Operations Analytics - Log Analysis crosses the default boundary of 1day.
Changing the default boundary for creating Apache Solrcollections
You can change the default boundary that is associated with extending ApacheSolr storage space depending on your business needs.
Procedure1. Open the <HOME>/IBM/LogAnalysis/wlp/usr/servers/Unity/apps/Unity.war/
WEB-INF/unitysetup.properties file.2. Locate and modify the value of the COLLECTION_ASYNC_WINDOW property from the
default value of 1d (1 day).
Note: The minimum property size is 6h.The boundary size can be specified in minutes (m), hours (h), or days (d).
3. Restart IBM Operations Analytics - Log Analysis with the following command.<HOME>/IBM/LogAnalysis/utilities/unity.sh -restart
Changing the default password for the Data Collector and EIF ReceiverIf you want, you can change the default password that the Data Collector and EIFReceiver use to connect to IBM Operations Analytics. This is optional.
Changing the default EIF Receiver or Data Collector passwordYou can change the default password that the Data Collector and EIF Receiver useto connect to IBM Operations Analytics - Log Analysis.
About this task
After you install IBM Operations Analytics - Log Analysis, the EIF Receiver andthe Data Collector are configured to use the default user name and password toconnect to IBM Operations Analytics - Log Analysis. The encrypted passwords aredefined in the following files:v Data Collector client is named <HOME>/IBM/LogAnalysis/utilities/
datacollector-client/javaDatacollector.properties.
356 IBM Operations Analytics - Log Analysis: Installation, Configuration, and Administration Guide

v EIF Receiver is named<HOME>/IBM/LogAnalysis/UnityEIFReceiver/config/unity.conf.
IBM Operations Analytics - Log Analysis uses the Advanced Encryption Standard(AES) to encrypt and decrypt passwords for your installation, in the followingformat:password={aes}<Unique_string_of_alphanumeric_characters>
For example, the javaDatacollector.properties file uses the unityuser user ID toaccess the Data Collector server. In this example, IBM Operations Analytics - LogAnalysis uses the Advanced Encryption Standard (AES) to generate the followingpassword:{aes}7DB629EC03AABEC6C4484F160FB23EE8
The encrypted password is replicated to the configuration files for the DataCollector and the EIF Receiver.
Procedure1. To change the default password, use the unity_securityUtility.sh command.
For more information about this command, see “unity_securityUtility.shcommand” on page 234.
2. Update the configuration files for the Data Collector or the EIF Receiver.3. Optional: If you want to change the password on remote instances of the EIF
Receiver, complete the previous steps and copy the unity.conf file from the<HOME>/IBM/LogAnalysis/UnityEIFReceiver/config/ directory on the localmachine to the <remote_deployment_location>/LogAnalysis/DataForwarders/EIFReceivers/<eif_inst_#>/config/unity.conf directory on the remotemachine. Where <remote_deployment_location> is the directory on the remotemachine where you deployed the EIF instance. <eif_inst_#> is the folder that isused for the specific remote EIF instance.
Example
For example, you want to change the default password for the default user that theData Collector and EIF Receiver use to connect to IBM Operations Analytics - LogAnalysis to myNewPassword. Complete the following steps:1. Go to the IBM/LogAnalysis/utilities directory.2. Run the unity_securityUtility.sh command as follows:
[utilities]$ ./unity_securityUtility.sh encode myNewPasswordUsing keystore file unity.ks<HOME>/IBM/LogAnalysis/utilities/../wlp/usr/servers/Unity/
keystore/unity.ks{aes}E6FF5235A9787013DD2725D302F7D08
3. Copy the AES encrypted password to the relevant configuration files, forexample copy it to the Data Collector file. You must copy the complete,encrypted string from the command output, including the {aes} prefix. Forexample:{aes}E6FF5235A9787013DD2725D302F7D088
unity_securityUtility.sh commandYou can use the unity_securityUtility.sh command to change the password thatthe Data Collector and EIF Receiver use to connect to IBM Operations Analytics -Log Analysis.
Loading and streaming data 357

Syntax
The unity_securityUtility.sh command is in the <HOME>/IBM/LogAnalysis/utilities directory and it has the following syntax:unity_securityUtility.sh encode [textToEncode] [unity.ks]
Parameters
The unity_securityUtility.sh command has the following parameters:
encode
The encode action returns an AES encrypted version of the text that youenter as the text to encrypt.
[textToEncode]Use the [textToEncode] parameter to enter the password that you want toencrypt. If you do not specify a password for this parameter, IBMOperations Analytics - Log Analysis prompts you for one.
[unity.ks]
The unity.ks file is the default keystore that is generated automaticallyduring installation. It controls how the password is encrypted anddecrypted.
The unity.ks file is used to encrypt and decrypt passwords for thefollowing features:v Java data collector client in the <HOME>/IBM/LogAnalysis/utilities/
datacollector-client/javaDatacollector.properties file.v EIF Receiver in the <HOME>/IBM/LogAnalysis/utilities/
UnityEIFReceiver/config/unity.conf file.
For an example of how to use this command, see “Changing the default EIFReceiver or Data Collector password” on page 300.
Installing logstashInstalling logstash on a remote node extends IBM Operations Analytics - LogAnalysis functions so it can ingest and perform metadata searches against log datathat is acquired by logstash.
logstash 1.5.3 is bundled and installed with IBM Operations Analytics - LogAnalysis. You can install logstash on a local host but to improve systemperformance, install logstash on a remote node.
This document describes the version of logstash that is installed when you installIBM Operations Analytics - Log Analysis.
logstash is an open source tool for managing events and logs. It can be used tocollect logs, parse them, and send them to another tool such as IBM OperationsAnalytics - Log Analysis to store them for later use.
The logstash agent is an event pipeline that consists of three parts:1. Inputs2. Filters3. Outputs
358 IBM Operations Analytics - Log Analysis: Installation, Configuration, and Administration Guide

Inputs generate events. Filters modify events. Outputs send the event somewhere.For example, events can be sent to storage for future display or search, or to theIBM Operations Analytics - Log Analysis framework. Events can have a type,which is used to trigger certain filters. Tags can be used to specify an order forevent processing as well as event routing to specific filters and outputs.
logstash can be used as a "pre-processor" to analyze sources and provide asemi-structured or structured feed to IBM Operations Analytics - Log Analysis forthe purposes of searching and potential usage within custom analytics applications.
Note: To install logstash on a local node, use the remote installation feature andset the SSH configuration REMOTE_HOST value to localhost or IP Address/hostnameof the node. For more information about installing logstash on a remote node, see“Installing logstash on a remote node” on page 303.
For more information on logstash events, see the section the life of an event inlogstash at https://www.elastic.co/guide/en/logstash/current/index.html.
DependenciesSupported versions of logstash and its dependencies.
Supported logstash version
The supported version of logstash is 1.5.3.
Java version requirement
Open JDK 1.7.0_51 or higher.
DSV Toolkit requirement
DSV Toolkit v1.1.0.4 or higher for generating IBM Operations Analytics - LogAnalysis Insight Packs. The Insight Packs are used to index log records that havebeen annotated using logstash. You only require the DSV toolkit if you want to uselogstash to perform ingestion, splitting, annotating or for when the data being readby logstash is in DSV format. For more information on this user scenario, see“Configuring logstash for rapid annotation and pre-indexing processing” on page307.
Generic Annotation Insight Pack
Generic Annotation v1.1.0, or v1.1.1 (refresh 1) is recommended for the normalizedtimestamp splitter function, which recognizes a variety of timestamps.
Installing logstash on a remote nodeYou can install logstash on a remote node to improve system performance.
Before you begin
Ensure that the SSH user has the correct permissions for installation. For moreinformation about SSH configuration, see “Secure Shell (ssh) configuration forremote logstash” on page 304 in the Loading and streaming data guide.
Loading and streaming data 359

About this task
logstash is processor and system resource intensive. logstash can be installed onthe local host but to improve system performance, install logstash on a remotenode.
Procedure1. To install logstash, run the following command:
<HOME>/IBM/LogAnalysis/remote_install_tool/install.sh
2. The installation script installs logstash, and provides options to install the EIFreceivers and log file Agent. To select each option, including logstash, select yor Y.
3. Provide the path to the installation location on the remote host.
Results
logstash is installed in the <install-dir>/Logstash/logstash-1.5.3/ directory. Toconfirm the installation, logon to the remote node as the configured SSH user andgo to the installation location.
Note: To install logstash on a local node, use the remote installation feature andset the SSH configuration REMOTE_HOST value to localhost or IP Address/hostnameof the node.
Example
The following are example deployments:
logstash example:<install-dir>/Logstash/logstash-1.5.3/
Output plug-in configuration path:<install-dir>/Logstash/logstash-1.5.3/logstash-scala/logstash/config/logstash-scala.conf
Output plug-in jar directory<install-dir>/Logstash/logstash-1.5.3/logstash-scala/logstash/outputs
Secure Shell (ssh) configuration for remote logstashBefore you can use the remote installer utility, you must configure the SSH for theremote hosts.
The ssh_config.properties file is in the <HOME>/IBM/LogAnalysis/remote_install_tool/config directory. Configure the parameter values as outlined inTable 1.
The SSH communication can be based on a password or public key. If youimplement both options, the public key configurations are used by default.
To set up password-based SSH, you specify a value for the password and commentout the private key file. The remote installer utility uses the specified password forSSH authentication when it connects to the remote host.
360 IBM Operations Analytics - Log Analysis: Installation, Configuration, and Administration Guide

To set up private key file-based authentication, you specify the private key filepath and do not specify a value for the password. The utility uses the file to createa password-less SSH connection.
To set up command-line authentication, rename the ssh-config properties file ormove the properties file to a new location. By default the configurations areselected from the properties file. If the file is unavailable, the user is prompted forcommand-line input.
Table 83. ssh_config parameters
Parameter Value
REMOTE_HOST= <REMOTE SERVER IP/FQ HOSTNAME>
PORT= <SSH PORT>
THE DEFAULT VALUE IS 22
USER= <SSH_USER>
PASSWORD= <SSH PASSWORD>
logstash configurationlogstash can be configured as a log file agent to ingest logs from a number ofdifferent sources.
About this task
There are two established use cases for using logstash with IBM OperationsAnalytics - Log Analysis, these are:v Configuring logstash as an alternative to ITM LFAv Configuring logstash for rapid annotation and pre-indexing processing
Both use cases are described in this section.
Configuring logstash as an alternative to ITM LFAlogstash can be used as a log file agent to ingest logs from a number of differentsources. It can also support integration with numerous alternative log file agentssuch as Lumberjack, Minuswell, Beaver, and Syslog.
About this task
Log records are written to the IBM Operations Analytics - Log Analysis that thensends the message to the IBM Operations Analytics - Log Analysis server forannotating and indexing.
Procedure1. Update the logstash sample configuration file with your configuration
information, <logstash-install_dir>/LogStash/logstash-1.5.3/logstash-scala/logstash/config/logstash-scala.conf. Where <logstash-install_dir> ispath to where logstash is installed using the IBM Operations Analytics - LogAnalysis remote deploy toola. Define the input and filter in the logstash configuration file.
For example:input {file {type => "http"
Loading and streaming data 361

path => ["/tmp/myhttp.log"]}}filter{
mutate{replace => ["host","<hostname>"]replace => ["path","/tmp/apache.log"]
}}
Note: For Windows, the logstash file plug-in requires a drive letterspecification for the path, for example:path => ["c:/tmp/myhttp.log"]
b. Modify the logstash configuration file to add the scala output plug-in.The scala output plug-in buffers and sends the logstash event to the IBMOperations Analytics - Log Analysis server by using the Log Analysis serveringestion REST API. The logstash configuration file can contain one or morescala output plug-ins. The output plug-ins can be configured to write todifferent Log Analysis servers or to the same Log Analysis server with adifferent set of configurations.Every event that is sent to the scala output plug-in must contain at leastthe host and path fields. The values of these fields are used by the scalaoutput plug-in to determine the target data source for the event. Any eventthat does not contain either of these fields is dropped by the output plug-in.The following are the default parameters, with sample values, for the IBMOperations Analytics - Log Analysis scala output plug-in:output {scala {scala_url => "https://<la_server>:<port>/Unity/DataCollector"scala_user => "<LA_user>"scala_password => "<LA_Password>"scala_keystore_path => ""batch_size => 500000idle_flush_time => 5sequential_flush => truenum_concurrent_writers => 20use_structured_api => falsedisk_cache_path => "<install-dir>/Logstash/cache-dir"scala_fields =>
{"host1@path1,host2@path2"
=> "event_field11,event_field12,...,event_field1N""host3@path3"
=> "event_field21,event_field22,...,event_field2N"}
date_format_string => "yyyy-MM-dd’T’HH:mm:ssX"log_file => "<install-dir>/Logstash/logs/scala_logstash.log"log_level => "info"}
Where:v scala_url is the REST endpoint for the Log Analysis ingestion REST API.v scala_user is the Log Analysis user name.v scala_password is the Log Analysis user password.v scala_keystore_path is blank.v batch_size is the maximum number of bytes that can be buffered for a
data source before transmitting to the Log Analysis server. The default is500000 bytes.
362 IBM Operations Analytics - Log Analysis: Installation, Configuration, and Administration Guide

Note: Significantly decreasing the batch size impacts on throughput.Increasing the batch size requires more heap memory.
v idle_flush_time is the maximum time between successive datatransmissions for a data source.
v sequential_flush defines whether batches for each data source are sentsequentially. It is set to true to send the batches sequentially.
Note: Sequential sending is required when the input contains multi-linerecords that are combined in an Insight Pack in the Log Analysis server.
v num_concurrent_writers is the number of threads that concurrentlytransmit batches of data to the Log Analysis server.
v use_structured_api determines whether data is transmitted to the LogAnalysis server in the JSON format. It is set to true to transmit data in theJSON format.
Note: The target Log Analysis data source must be associated with asource type that uses the Log Analysis structured API.
v disk_cache_path is the path on the file system that temporarily buffersdata. The scala output plug-in writes data to this path beforetransmission. The available disk space under the path must be largeenough to store bursts of input data that is not immediately handled bythe Log Analysis server.
v scala_fields is the map that specifies the names of fields that must beretrieved from the incoming logstash event and transmitted to the LogAnalysis server. The keys for the map are a comma-separated list of hostand path names that correspond to a Log Analysis data source.The scala plug-in extracts the host and path fields from each eventbefore consulting the scala_fields map for a host and path combinationentry. If there is an entry with field names, the scala plug-in extracts thecorresponding field values from the event. The values are transmitted tothe Log Analysis server. If the host and path entries are not in thescala_fields map, the scala plug-in extracts the contents of the messagefield from the event and transmits it to the Log Analysis server.
v date_format_string is the string value that all fields are transformed tobefore transmission to the Log Analysis server. The scala plug-in uses thedate_format_string parameter to convert date values to the appropriatestring value.
v log_file is the file that is used for logging information from the scalaoutput plug-in.
v log_level is the level of logging information. The supported levels arefatal, error, warn, info, and debug.
2. Create a custom data source. For more information, see data source creation inthe Administering section.Ensure that the Hostname and File Path match the host and path that isspecified in the filter mutate section of logstash configuration file,logstash-scala.conf.Ensure that the Type matches the type of log file that is being ingested and isdefined in the filter mutate section, for example DB2Diag.For example, if you specified /tmp/myhttp.log as an input file, then create acustom data source with path set to /tmp/myhttp.log.
Loading and streaming data 363
What to do next
Start logstash.Related tasks:“logstash operations” on page 311You can use the logstash-util script to start, stop, restart, or provide the status oflogstash.
Configuring logstash for rapid annotation and pre-indexingprocessinglogstash can be used to split log records and do basic annotation. For log types notcurrently supported by IBM Operations Analytics - Log Analysis, this is analternative approach to writing AQL to annotate log files.
About this task
logstash includes a broad list of filtering, manipulation, and processing capabilities,for example, the grok filter can be used to parse text into structured data. You canuse it to match text without the need to master regular expressions. There areapproximately 120 grok patterns that are shipped by default, though you can addmore. It also includes patterns for known log file formats, such as Apache'scombined access log format.
In this scenario, you use the grok filter with logstash used as the splitter orannotator of the log file. The scala output plugin sends a single log record to theIBM Operations Analytics - Log Analysis EIF Receiver, with the annotations in adelimiter separated value (DSV) format. Then, using the DSV Toolkit, the usermust create and install an insight pack that matches the DSV format so that IBMOperations Analytics - Log Analysis can index the annotations.
Procedure1. To configure your logstash installation, specify the required values in the
<logstash_install>/Logstash/logstash-1.5.3/logstash-scala/logstash/config/logstash-scala.conf file.a. Define the input in the logstash configuration file.
For example:input {file {type => "apache"path => ["/tmp/logs/myapache.log"]}}
Note: For Windows, the logstash file plugin requires a drive letterspecification for the path, for example:path => ["C:/tmp/logs/myapache.log"]
b. Add a filter or filters to the logstash configuration file to identify thepattern of the log file format. This also creates the annotations. To triggerthe filter, the type must match the input type.For example:filter {
if [type] == "http" {grok {
match => ["message", "%{IP:client} %{WORD:method}%{URIPATHPARAM:request} %{NUMBER:bytes} %{NUMBER:duration}"]
364 IBM Operations Analytics - Log Analysis: Installation, Configuration, and Administration Guide

}}mutate{
replace => ["host","<hostname>"]replace => ["path","/tmp/apache.log"]
}}
In this example, the fields client, method, request, bytes, and duration areannotated by the pattern. However, only the fields client, method, andrequest are sent to IBM Operations Analytics - Log Analysis. Thus, those arethe only three annotations that can be included in the index configuration.The output module sends the event text in DSV format as:“client”, “method”, “request”
The user can also use one of the many predefined grok log format patternssuch as:filter {
if [type] == "apache" {grok {
match => ["message", "%{COMBINEDAPACHELOG}"]}}mutate{
replace => ["host","<hostname>"]replace => ["path","/tmp/apache.log"]
}}
c. In the output section of the configuration file, for {COMBINEDAPACHELOG}specify the scala_fieldsas follows:
scala_fields =>{
"<host>@<path>" => "clientip,ident,auth,timestamp,verb,request,httpversion,rawrequest,response,bytes,referrer,agent"
}
Where <host> and <path> are the values that are defined in the mutatesection of the grok filter.
2. Create an IBM Operations Analytics - Log Analysis DSV-generated Insight Packin order to index the annotated data in IBM Operations Analytics - LogAnalysis.You can use the ApacheDSV.properties file to create an Apache-based InsightPacks.For more information about theApacheDSV.properties file, seeApacheDSV.properties in the Reference section of the Extending guide.Edit this properties file to configure information about your IBM OperationsAnalytics - Log Analysis server:[SCALA_server]username: unityadminpassword: unityadminscalaHome: $HOME/IBM/LogAnalysis
Use the dsvGen.py script that is provided with the DSV Toolkit to generate anddeploy the Apache Insight Pack:python dsvGen.py <path>/ApacheDSV.properties -d
3. Create a custom data source. For more information, see data source creation inthe Administering section.Ensure that the Hostname and File Path match the host and path that isspecified in the filter mutate section of logstash configuration file,logstash-scala.conf.
Loading and streaming data 365
Ensure that the Type matches the type of log file that is being ingested and isdefined in the filter mutate section, for example DB2Diag.For example, if you specified /tmp/myhttp.log as an input file, then create acustom data source with path set to /tmp/myhttp.log.
What to do next
Start logstash. For more information on starting logstash, see logstash operations.Related tasks:“logstash operations” on page 311You can use the logstash-util script to start, stop, restart, or provide the status oflogstash.Related reference:ApacheDSV.propertiesYou can use this property file with the DSV tooling to generate an Insight Packassociated with the COMBINEDAPACHELOG grok pattern.
Example - Annotating Combined Apache log files:
Using logstash to annotate Apache log files.
Procedure
1. To configure your logstash installation, specify the required values in the<logstash_install>/Logstash/logstash-1.5.3/logstash-scala/logstash/config/logstash-scala.conf file.a. In the input section, specify the Apache log file to be monitored.
input {file {type => "apache"path => ["/tmp/apache.log"]}}
b. Add the logstash grok filter with the predefined COMBINEDAPACHELOG patternto annotate the Apache log files.For example:filter {if [type] == "apache" {grok {
match => ["message", "%{COMBINEDAPACHELOG}"]}}mutate{
replace => ["host","<hostname>"]replace => ["path","/tmp/apache.log"]
}}
The COMBINEDAPACHELOG pattern is defined as:COMBINEDAPACHELOG %{IPORHOST:clientip} %{USER:ident} %{USER:auth}\[%{HTTPDATE:timestamp}\] "(?:%{WORD:verb} %{NOTSPACE:request}(?: HTTP/%{NUMBER:httpversion})?|%{DATA:rawrequest})" %{NUMBER:response}(?:%{NUMBER:bytes}|-) %{QS:referrer} %{QS:agent}
For more information about Apache log files, see http://httpd.apache.org/docs/2.4/logs.html.The logstash event contains annotations for clientip, ident, auth,timestamp, verb, request, httpversion, rawrequest, response, bytes,referrer, and agent.
366 IBM Operations Analytics - Log Analysis: Installation, Configuration, and Administration Guide

c. Change the <hostname> and path value to the <hostname> of the logstashserver and path to the log file. For examplemutate{replace => ["host","<hostname>"]replace => ["path","/tmp/apache.log"]}
d. In the output section of the configuration file, specify the IBM OperationsAnalytics - Log Analysis output plug-in. The scala_fields in the outputplug-in must be defined as follows:
scala_fields =>{
"<host>@<path>" => "clientip,ident,auth,timestamp,verb,request,httpversion,rawrequest,response,bytes,referrer,agent"
}
Where <host> and <path> are the values defined in the mutate section of thegrok filter.
2. The ApacheDSV.properties file can be used with the DSV Toolkit to create anApache Insight Pack. For more information about the ApacheDSV.propertiesfile, see ApacheDSV.properties in the Reference section of the Extending guide. Editthis properties file to configure information about your IBM OperationsAnalytics - Log Analysis server:[SCALA_server]username: unityadminpassword: unityadminscalaHome: $HOME/IBM/LogAnalysis
3. Use the dsvGen.py script that is provided with the DSV Toolkit to generate anddeploy the Apache Insight Pack:python dsvGen.py <path>/ApacheDSV.properties -d
4. In the IBM Operations Analytics - Log Analysis Administrative Settings UI,create a data source, which has the Apache source type that is created by theDSV toolkit in step 3, in your logstash configuration file.
5. To start logstash with the configuration file, and start loading Apache log files,run the following command:<logstash_install>/utilities/logstash-util.sh start
Related reference:ApacheDSV.propertiesYou can use this property file with the DSV tooling to generate an Insight Packassociated with the COMBINEDAPACHELOG grok pattern.
logstash operationsYou can use the logstash-util script to start, stop, restart, or provide the status oflogstash.
About this task
You can use the logstash-util script for logstash process lifecycle management.
Procedure1. To start, stop, restart, or provide the status of logstash, run the following
command:<install-dir>/utilities/logstash-util.sh start| stop| restart| status
where <install-dir> is the name of the logstash installation location.
Loading and streaming data 367

2. To confirm that logstash is running, run the logstash-util script and use thestatus option. The status option also displays the logstash process identifier.
logstash best practicesBest practices for logstash based on information from their user community.
For performance reasons it is recommend that logstash be installed on a differentserver than IBM Operations Analytics - Log Analysis. logstash is processor,memory, and disk intensive if the annotation and indexing functions are utilized.
Users who have memory constraints do not use logstash as a forwarding agent.They do not install logstash on the end client servers. They use other applicationssuch as rsyslog to forward logs to a central server with logstash. Seehttps://support.shotgunsoftware.com/entries/23163863-Installing-logstash-Central-Server for an example configuration.
Users with logstash at the end client who are concerned about performance haveused applications such as Redis to forward logs to a central server with logstash.See the following for configuration of Redis http://www.linux-magazine.com/Online/Features/Consolidating-Logs-with-logstash .
To fine tune logstash, especially the startup time, users can tweak Java's minimumand maximum heap size with the -Xms and -Xmx flags. The -Xms parameter is theinitial Java memory heap size when the JVM is started, and the -Xmx parameter isthe maximum heap size.
ReferencesLinks for more information on the logstash application.
logstash website: http://logstash.net
Getting Started with logstash Guide:https://www.elastic.co/guide/en/logstash/current/getting-started-with-logstash.html
logstash Download: http://logstash.net (Click download button)
The logstash Book:http://www.logstashbook.com/
IBM Operations Analytics - Log Analysis wiki: http://www.ibm.com/developerworks/servicemanagement/ioa/log/downloads.html
IBM Operations Analytics - Log Analysis wiki: Logstash Toolkit Resources: https://www.ibm.com/developerworks/community/wikis/home?lang=en#!/wiki/IBM%20Log%20Analytics%20Beta/page/Logstash%20Toolkit%20Resources
Known issuesKnown issues when using logstash with IBM Operations Analytics - Log Analysis.
There are a number of known issues and their workarounds described in thissection. To get the latest information on any issues or workarounds, please consult
368 IBM Operations Analytics - Log Analysis: Installation, Configuration, and Administration Guide
the IBM Operations Analytics - Log Analysis wiki:https://www.ibm.com/developerworks/community/wikis/home?lang=en#!/wiki/IBM%20Log%20Analytics%20Beta/page/Welcome
Could not load FFI ProviderStarting logstash fails with the Ruby exception “Could not load FFI Provider”.
SymptomsThe Ruby exception “Could not load FFI Provider”.
CausesThe most common cause of this error is that /tmp is mounted with the noexec flag.
Resolving the problemYou can resolve this either by:v Making /tmp mounted without the noexec flagv Edit the startlogstash-scala script and amend the start command as follows:
LSCMD="$MYJAVA -jar -Djava.io.tmpdir=</some/tmp/dir> $LSJAR agent--pluginpath $PLUGPATH -f $CONF"
Where </some/tmp/dir> is a temporary directory.
Duplication of log records on the SCALA serverOn occasion, when the logstash agent is re-started, and the log file beingmonitored is updated (for example, via a streaming log), logstash will ingest theentire file again rather than restarting from where it stopped monitoring.
SymptomsThe problem results in a duplication of log records on the SCALA server.
CausesSeveral problems have been reported on the logstash forum (https://logstash.jira.com/secure/Dashboard.jspa) that its sincedb pointer (which tracks thelast monitored position in the log file) sometimes is not updated correctly. Inaddition, using control-C to terminate the logstash agent does not always killlogstash. The result is a "phantom" logstash agent that is still monitoring log files.This can also result in duplicate log records.
Resolving the problem1. A workaround to avoid duplicate log records after restarting logstash is to set
the sincedb_path parameter in the file plugin to /dev/null, thereby tellinglogstash to ignore tracking the last-monitored file position, and always startmonitoring from the end of the file. However, this will result in logstashignoring any updates to the log file while the logstash agent is down. Forexample, in logstash-scala.conf, update:input {
file {type => "apache"path => ["/tmp/logs/myapache.log"]sincedb_path => "/dev/null"
}}
Before re-starting logstash after making these configuration changes, you mayalso want to clean up any sincedb databases that were already created. Bydefault, the sincedb database is stored in the directory $HOME, and havefilenames starting with ".sincedb_".
Loading and streaming data 369

2. When terminating the logstash agent using control-C, verify that the logstashjava process was actually terminated. You can use the following command tosee if logstash is still running:
ps -ef | grep logstash
Logs do not appear in the Search UILog records are ingested by logstash, but do not appear in the IBM OperationsAnalytics - Log Analysis Search UI.
SymptomsLog records are ingested by logstash, but do not appear in the IBM OperationsAnalytics - Log Analysis Search UI.
CausesLog records ingested by logstash are forwarded to the IBM Operations Analytics -Log Analysis server for splitting and annotating, and indexing. If the IBMOperations Analytics - Log Analysis server goes down during this process, it ispossible to lose some log records.
370 IBM Operations Analytics - Log Analysis: Installation, Configuration, and Administration Guide

Administrating
Read this section to understand how to use Log Analysis to administrate the datamodel and other aspects of Log Analysis.
Getting started with Log AnalysisComplete these tasks to help you to get started with Log Analysis.
Logging in to IBM Operations Analytics - Log AnalysisThis topic outlines how to log in to IBM Operations Analytics - Log Analysis andhow to change the default username and password.
By default, the unityuser user is assigned the UnityUser role. Log in as this user toaccess the Search workspace. The UnityAdmin role allows you to access the Searchworkspace and also the administrative workspaces. This role is assigned to theunityadmin user. The default passwords for each of these users is the same as theusername.
You can change the default passwords for each of these users by changing thevalue in the basic user registry. For more information, see the Creating roles, groups,and users in the file-based user registry section of the documentation.
To log in to the IBM Operations Analytics - Log Analysis administrativeworkspaces:1. In a web browser, type the address: http://ip_address:9988/Unity/Admin. If
you use SSL communication, the address is https://ip_address:9987/Unity.2. When prompted, type the username and password for a user with
administrator access permissions and click Go.
To log in to the IBM Operations Analytics - Log Analysis Search workspace:1. In a web browser, type the address: http://ip_address:9988/Unity. If you use
SSL communication, the address is https://ip_address:9987/Unity.2. When prompted, type the username and password for a user with
administrator or user access permissions and click Go.
Note: If the 9988 or 9987 port is blocked by a firewall, IBM Operations Analytics -Log Analysis might not display. Check the firewall status and unblock the portwhere necessary.
Note: If you are running IBM Operations Analytics - Log Analysis over a slownetwork, a warning might be displayed indicating that a script is unresponsivescript. To proceed, click Continue.
To log in to IBM Operations Analytics - Log Analysis on a Dynamic HostConfiguration Protocol (DCHP) server, use the Fully Qualified Domain Name(FQDN) or the host name to log in. You cannot use the IP address as you wouldfor non-DHCP servers. For more information, see the Cannot display Custom SearchDashboards on Dynamic Host Configuration Protocol (DHCP) server topic in theTroubleshooting IBM Operations Analytics - Log Analysis guide.
© Copyright IBM Corp. 2015 371

Installing sample filesThis topic outlines how to load sample artifacts and data so that you can getstarted using IBM Operations Analytics - Log Analysis quickly and to allow you tounderstand how you can apply IBM Operations Analytics - Log Analysis to yourown environment.
About this task
When you load the sample data, sample IBM Operations Analytics - Log Analysisartifacts, sample data, and sample Custom Search Dashboards are loaded. Inaddition, a number of sample Custom Search Dashboards are loaded:v sample-Web-App: This Custom Search Dashboard displays a sample dashboard
of a typical web application built using web servers, an application server, and adatabase.
v sample-WAS-Troubleshooting: This Custom Search Dashboard displays asample dashboard for WebSphere Application Server SystemOut logs frommultiple servers.
v sample-events-hotspots: This Custom Search Dashboard displays a sample eventanalysis dashboard built for sample IBM Tivoli Netcool/OMNIbus events.
Note: If you enable Lightweight Directory Access Protocol (LDAP) authenticationand you want to load the sample data, you must create a user called unityadminthat is assigned to a group called unityadmin. If you do not, you cannot load thesample data.
Procedure1. Log into the Search workspace: https://<ipaddress>:<port>/Unity where <port>
is the port specified during installation for use by the web console. The defaultvalue is 9987. The default administrative username and password areunityadmin and unityadmin respectively.
2. On the Getting Started page, click Install Sample Data > Start Now. Thesample data loads.
Enabling the GUI search historyYou can enable history for the search on the IBM Operations Analytics - LogAnalysis UI.
About this task
IBM Operations Analytics - Log Analysis uses a cookie that is saved in thetemporary directory of the browser to remember the last 10 terms that are enteredin the search field.
To view the last 10 search results, select the search list. To add a term to the list ofsearches, enter the term in the search field and click Search.
The cookie that saves the search terms expires every 30 days by default.
Procedure
To enable search history for the IBM Operations Analytics - Log Analysis UI, youmust ensure that your browser settings are configured to save cookies.To clear your search history, delete the saved cookies for your browser.
372 IBM Operations Analytics - Log Analysis: Installation, Configuration, and Administration Guide

Defining a default searchIf you want to define a default initial search that is displayed when you log intothe Search workspace, complete the steps in this topic.
About this task
You can define the search query. However, any additional parameters such as theData Source or Time filter cannot be defined for your default search. To defineyour search:
Procedure1. Open the unitysetup.properties file located in the <HOME>/IBM/LogAnalysis/
wlp/usr/servers/Unity/apps/Unity.war/WEB-INF directory.2. Locate and, if necessary, remove the comment notation from the line:
SEARCH_QUERY_FOR_DEFAULT_SEARCH=*
3. Add the text that you want to define as your default query: For example:SEARCH_QUERY_FOR_DEFAULT_SEARCH=TUNE9001W
4. Save the file.5. Use the following command to restart IBM Operations Analytics - Log
Analysis:<HOME>/IBM/LogAnalysis/utilities/unity.sh -restart
Results
If there are search results in the last 15 minutes for the specified query, the resultsof the query are displayed. If you have defined a value for the search and noresults are found, a message is displayed indicating that no matches were found.
Creating and updating the data modelBefore you load data into Log Analysis, you must create the data sources, sourcetypes, index configuration, and physical source IDs required to model your dataingestion, indexing, annotation, and grouping of data.
You also need to add and delete objects from you model.
Data Sources workspaceThe Data Sources workspace allows you to define your data sources. Thisinformation is used to process the content of the log file and facilitate search byconverting the file contents into a structured format.
Data Source creationYou create data sources to ingest data from a specific source.
Before you can search a log file, you must use the data source creation wizard tocreate a data source. To start the wizard, open the Admin UI, click Add > DataSources. The wizard contains text to help you to complete the task.
You can create three types of data source. Select one of the following types:v To stream data from a file that is stored locally on the IBM Operations Analytics
- Log Analysis server, create a local data source. The IBM Tivoli Monitoring LogFile Agent on the same server is automatically configured to retrieve local data.
Administrating 373
v To stream data from a file that is stored on a remote server, create a remote datasource. Enter a host name, user name, and password. The IBM Tivoli MonitoringLog File Agent on the same server is automatically configured to pull data froma remote server.
Note: If the remote server uses the Windows operating system, this settingrequires that the ssh daemon is configured on the remote server.
v To stream data from a file that is stored on a remote IBM Operations Analytics -Log Analysis server where data delivery is manually configured, or where dataingestion is configured for logstash or the Data Collector client, create a customdata source. Enter a host name. There is no automatic configuration orverification.
If you select local or remote as the location, IBM Operations Analytics - LogAnalysis creates a new collection automatically. If you select custom as thelocation, you can choose to associate it with an existing collection or you can createa new collection.
The log file specified for the File path field is automatically ingested into IBMOperations Analytics - Log Analysis for data sources with Local file or Remote fileconfiguration options.
If you want to ingest rolling files, click the Rolling file pattern check box andenter the rolling file pattern. For example, for a WebSphere Application Server logfile the base line file is SystemOut.log. The rolling file pattern is SystemOut_*.log.If you use this setting, the data latency depends on how frequently the files arerolled in the source application.
To complete the process, enter a name for the data source.
You can also edit an existing data source.
Database ConnectionsA Database Connection uniquely identifies a source of structured data in IBMOperations Analytics - Log Analysis.
You can associate semi-structured data, such as a log, with structured data, such asthe transaction status in the application database. To make this association, youmust define a Database Connection, which specifies the details required by IBMOperations Analytics - Log Analysis to access the database. After you have defineda Database Connection, you can use it when you configure any Application thatyou require.
Adding a Database Connection:
This topic outlines the steps that you must follow to configure an events databaseas a Database Connection.
Procedure
To add a Database Connection:1. In the Data Sources workspace, click Add > Database Connections. The Add
Database Connections tab is displayed2. You are prompted to supply the following information:
Name The name of the Database Connection.
374 IBM Operations Analytics - Log Analysis: Installation, Configuration, and Administration Guide

Schema NameThe name of the table containing the event, for example, MISC.
JDBC URLThe IP address and path for the events database, for example,jdbc:derby://ip_address:1627//opt/unity/database/UnityDB.
JDBC DriverThe JDBC driver, typically org.apache.derby.jdbc.ClientDriver.
UsernameType the username for the Database Connection.
PasswordType the password for the Database Connection.
3. Click OK. A new entry is displayed in the Database Connections list.
Editing a Database Connection:
You can edit the details of an existing Database Connection.
Procedure
To edit a Database Connection:1. In the Data Sources workspace, expand the Database Connections list.2. Select the Database Connection that you want to edit and click Edit. The
Database Connection is opened in a new tab.3. Edit the data source as required.4. To save the changes, click OK.
Deleting a Database Connection:
You can delete an existing Database Connection.
Procedure
To delete a Database Connection:1. In the Data Sources workspace, expand the Database Connections list.2. Select the Database Connection that you want to delete and click Delete.3. Click OK
Data Types workspaceThe Data Types workspace allows you to configure the type of log information thatis consumed.
CollectionsCollections allow you to group together log data from different data sources thathave the same source type. For example, you might want to assign all the datasources for a WebSphere Application Server cluster into a single Collection so thatyou can search them as a group. This section outlines how to manage yourCollections.
Adding a Collection:
This topic outlines the steps you must follow to add a Collection to IBMOperations Analytics - Log Analysis.
Administrating 375

Procedure
To add a Collection:1. In the Data Types workspace, click Add > Collection. The Add Collection tab
is displayed2. Enter the details for the collection that you want to add:
Name Provide a unique name for the Collection.
Source TypeFrom the list, select the type of log file data that you want theCollection to contain.
3. Click OK. A message is displayed requesting that you confirm that you want tocreate the Collection and indicating that you cannot edit the Source Typeproperty after the Collection is saved. If you are satisfied that you have addedthe correct values to these properties, click OK.
Editing a Collection:
After a Collection has been created, you cannot edit the properties associated withthe Collection. Use the Edit button to review the existing properties for aCollection.
Procedure
To view a collection:1. In the Data Types workspace, expand the Collections list.2. Select the Collection that you want to view and click Edit. The Collection is
opened in a new tab.3. To close the Collection, click Close.
Deleting a Collection:
You can delete an existing Collection.
Procedure
To delete a Collection:1. In the Data Types workspace, expand the Collections list.2. Select the Collection that you want to delete and click Delete. A message is
displayed listing the data sources that are associated with the Collection. Thesedata sources are deleted when the Collection is deleted. All data associatedwith the Collection is deleted when the Collection is deleted.
3. Click Delete.
Source TypesA Source Type defines how data of a particular type is processed by IBMOperations Analytics - Log Analysis. This determines how data is indexed, split,and annotated.
Index configuration:
You can use the index configuration of a Source Type to provide importantinformation about how data of that Source Type is indexed in IBM OperationsAnalytics - Log Analysis.
376 IBM Operations Analytics - Log Analysis: Installation, Configuration, and Administration Guide

Index configuration is specified using JSON configuration notation. When creatinga source type, you can specify a file containing JSON configuration notation, oryou can enter the configuration directly to the Index Config field.
To index data appropriately, different types of data require different indexconfiguration.
Editing an index configuration:
Use Edit Index Configuration editor to edit an index configuration. You can addnew fields and change the order of existing fields.
Procedure
1. Open the Admin UI workspace, click on a source type and click IndexConfiguration.
2. To edit the order of an existing field, click on the field and click Edit FieldOrder. When you are finished, click Save Field Order.
3. To add a new field, click Add New Field.4. You can also specify the data type for each field. To change the data type, click
on the Data type column and click the data type. The following data types areavailable:
Table 84. Edit Index Configuration UI data types
Data type Use
TEXT Use this type if the field contains text.
DOUBLE Use this type if the field is a double.
LONG Use this type if the field contains a longstring.
DATE Use this type if the field contains a date.
5. You can also specify that date and time format that you want to use. To changethe format, click on the Data type column and click Date. The top ten mostfrequently used date formats are displayed.If you enter a custom time format, the time format is validated against the JavaSimple Date format. If you enter an invalid format, an error message isdisplayed.
6. To configure the indexing settings for the specified index configuration, clickthe relevant check box to configure the option. For example, to make the searchresults filterable, click the Filterable check box. The following options areavailable:
Table 85. Edit Index Configuration UI check boxes
Check box Use
Retrievable Specify whether you want the index data tobe retrieved by Log Analysis.
Retrieve by default Specify that you want Log Analysis toretrieve all available data by default.
Sortable Specify whether you want the Log Analysisusers to be able to sort search results.
Filterable Specify whether you want the Log Analysisusers to be able to filter search results.
Administrating 377

Table 85. Edit Index Configuration UI check boxes (continued)
Check box Use
Searchable Specify whether you want the Log Analysisusers to be able to search results.
Combine Specify whether Log Analysis combines onlythe first or all index entries.
Paths Specify the path that is associated with thespecified field.
7. To save your changes, click Apply.Related concepts:“Edit Index Configuration UI”Use the Edit Index Configuration to create and edit index configurations.
Edit Index Configuration UI:
Use the Edit Index Configuration to create and edit index configurations.
The following table summarizes the buttons that are available as part of the EditIndex Configuration UI:
Table 86. Edit Index Configuration UI buttons
Icon Name Use
Add New Field Use this button to create anew field in the indexconfiguration.
Edit Field Order Use this button to edit theorder of a field in the indexconfiguration.
Show Advanced Columns Click this button to displaythe Combine and Pathcolumns
Delete selected field Click a field and click thisbutton to delete the field.You cannot delete thetimestamp field.
The following table summarizes the data types that are available as part of the EditIndex Configuration UI:
Table 87. Edit Index Configuration UI data types
Data type Use
TEXT Use this type if the field contains text.
DOUBLE Use this type if the field is a double.
LONG Use this type if the field contains a longstring.
DATE Use this type if the field contains a date.
The following table summarizes the check boxes that are available as part of theEdit Index Configuration UI:
378 IBM Operations Analytics - Log Analysis: Installation, Configuration, and Administration Guide

Table 88. Edit Index Configuration UI check boxes
Check box Use
Retrievable Specify whether you want the index data tobe retrieved by Log Analysis.
Retrieve by default Specify that you want Log Analysis toretrieve all available data by default.
Sortable Specify whether you want the Log Analysisusers to be able to sort search results.
Filterable Specify whether you want the Log Analysisusers to be able to filter search results.
Searchable Specify whether you want the Log Analysisusers to be able to search results.
Combine Specify whether Log Analysis combines onlythe first or all index entries.
Paths Specify the path that is associated with thespecified field.
Cloning source types and indexing configurations:
If you want to modify an index configuration without losing the originalconfiguration, you can clone the source type and edit the cloned indexconfiguration
Procedure
1. Open the Admin UI workspace, click the source type that you want to cloneand click Edit Index Configuration.
2. To copy the source type, click the Clone icon. The copied source type isdisplayed.
3. To edit the copied source type and index configuration, click Edit IndexConfiguration.
4. Save your changes.Related tasks:“Editing an index configuration” on page 377Use Edit Index Configuration editor to edit an index configuration. You can addnew fields and change the order of existing fields.
Index configuration example: PMI data:
This sample JSON index configuration can be used to index PMI data:{ "indexConfigMeta":{
"name": "PMIConfig","description": "IndexMappingforPMIdata","version": "0.1","lastModified": "9/10/2012"},"fields": {"hostname": {"dataType": "TEXT","retrievable": true,"retrieveByDefault": false,"sortable": true,"filterable": true,"searchable": true,"tokenizer": "literal",
Administrating 379

"source": {"paths": ["metadata.hostname"]}},"sourceip": {"dataType": "TEXT","retrievable": true,"retrieveByDefault": true,"sortable": true,"filterable": true,"searchable": true,"tokenizer": "literal","source": {"paths": ["metadata.sourceip"]}},"logpath": {"dataType": "TEXT","retrievable": true,"retrieveByDefault": false,"sortable": false,"filterable": false,"searchable": false,"tokenizer": "literal","source": {"paths": ["metadata.logpath"]}},"logsource": {"dataType": "TEXT","retrievable": true,"retrieveByDefault": false,"sortable": true,"filterable": true,"searchable": true,"tokenizer": "literal","source": {"paths": ["metadata.logsource"]}},"timeformat": {"dataType": "TEXT","retrievable": true,"retrieveByDefault": false,"sortable": true,"filterable": true,"searchable": true,"tokenizer": "literal","source": {"paths": ["metadata.timeformat"]}},"description": {"dataType": "TEXT","retrievable": true,"retrieveByDefault": false,"sortable": false,"filterable": false,"searchable": false,"tokenizer": "literal","source": {"paths": ["metadata.description"]}},"PoolSize": {"dataType": "TEXT","retrievable": true,
380 IBM Operations Analytics - Log Analysis: Installation, Configuration, and Administration Guide

"retrieveByDefault": true,"sortable": true,"filterable": true,"searchable": true,"tokenizer": "literal","source": {"paths": ["metadata.poolsize"]}},"FreePoolSize": {"dataType": "TEXT","retrievable": true,"retrieveByDefault": true,"sortable": true,"filterable": true,"searchable": true,"tokenizer": "literal","source": {"paths": ["metadata.FreePoolSize"]}},"WaitingThreadCount": {"dataType": "TEXT","retrievable": true,"retrieveByDefault": true,"sortable": true,"filterable": true,"searchable": true,"tokenizer": "literal","source": {"paths": ["metadata.WaitingThreadCount"]}},"PercentUsed": {"dataType": "TEXT","retrievable": true,"retrieveByDefault": true,"sortable": true,"filterable": true,"searchable": true,"tokenizer": "literal","source": {"paths": ["metadata.PercentUsed"]}},"UseTime": {"dataType": "TEXT","retrievable": true,"retrieveByDefault": true,"sortable": true,"filterable": true,"searchable": true,"tokenizer": "literal","source": {"paths": ["metadata.UseTime"]}},"WaitTime": {"dataType": "TEXT","retrievable": true,"retrieveByDefault": true,"sortable": true,"filterable": false,"searchable": false,"tokenizer": "literal","source": {"paths": ["metadata.WaitTime"]
Administrating 381
}},"HeapSize": {"dataType": "TEXT","retrievable": true,"retrieveByDefault": true,"sortable": true,"filterable": false,"searchable": false,"tokenizer": "literal","source": {"paths": ["metadata.HeapSize"]}},"UsedMemory": {"dataType": "TEXT","retrievable": true,"retrieveByDefault": true,"sortable": true,"filterable": false,"searchable": false,"tokenizer": "literal","source": {"paths": ["metadata.UsedMemory"]}},"UpTime": {"dataType": "TEXT","retrievable": true,"retrieveByDefault": true,"sortable": true,"filterable": false,"searchable": false,"tokenizer": "literal","source": {"paths": ["metadata.UpTime"]}},"ProcessCpuUsage": {"dataType": "TEXT","retrievable": true,"retrieveByDefault": true,"sortable": true,"filterable": true,"searchable": true,"tokenizer": "literal","source": {"paths": ["metadata.ProcessCpuUsage"]}},"CPUUsageSinceLastMeasurement": {"dataType": "TEXT","retrievable": true,"retrieveByDefault": true,"sortable": true,"filterable": true,"searchable": true,"tokenizer": "literal","source": {"paths": ["metadata.CPUUsageSinceLastMeasurement"]}},"webcontainerthreads": {"dataType": "TEXT","retrievable": true,"retrieveByDefault": true,"sortable": true,
382 IBM Operations Analytics - Log Analysis: Installation, Configuration, and Administration Guide

"filterable": true,"searchable": true,"tokenizer": "literal","source": {"paths": ["metadata.webcontainerthreads"]}},"timestamp": {"dataType": "DATE","retrievable": true,"retrieveByDefault": true,"sortable": true,"filterable": true,"searchable": true,"tokenizer": "literal","source": {"paths": ["metadata.timestamp"],"dateFormats": ["dd/MM/yyyy HH:mm:ss.SSS"]}}}}
Index configuration example: Expert advice data:
This sample JSON index configuration can be used to index expert advice data:{ "sourceTypeClass": 0,"name": "Test","splitRuleSet": null,"extractRuleSet": null,"indexConfigMeta": {"name": "Test","description": "Testing UVI Integration","version": "0.1","lastModified": "17/08/2012"},"fields": {"hostname": {"dataType": "TEXT","retrievable": true,"retrieveByDefault": true,"sortable": true,"filterable": true,"searchable": true,"tokenizer": "literal","source": {"paths": ["metadata.hostname"]}},"timestamp": {"dataType": "DATE","dateFormat": "dd/MM/yyyy HH:mm:ss.SSS","retrievable": true,"retrieveByDefault": true,"sortable": true,"filterable": true,"searchable": true,"tokenizer": "literal","source": {"paths": ["metadata.timestamp"],"dateFormats": ["dd/MM/yyyy HH:mm:ss.SSS"],"combine": "FIRST"}},"logpath": {"dataType": "TEXT",
Administrating 383

"retrievable": true,"retrieveByDefault": false,"sortable": false,"filterable": false,"searchable": false,"tokenizer": "literal","source": {"paths": ["metadata.logpath"]}},"regex_class": {"dataType": "TEXT","retrievable": true,"retrieveByDefault": false,"sortable": false,"filterable": false,"searchable": false,"tokenizer": "literal","source": {"paths": ["metadata.regex_class"]}},"Hostname": {"dataType": "TEXT","retrievable": true,"retrieveByDefault": true,"sortable": true,"filterable": true,"searchable": true,"tokenizer": "literal","source": {"paths": ["metadata.Hostname"]}},"service": {"dataType": "TEXT","retrievable": true,"retrieveByDefault": true,"sortable": true,"filterable": true,"searchable": true,"tokenizer": "literal","source": {"paths": ["metadata.Service"]}},"logsource": {"dataType": "TEXT","retrievable": true,"retrieveByDefault": true,"sortable": true,"filterable": true,"searchable": true,"tokenizer": "literal","source": {"paths": ["metadata.logsource"]}},"logRecord": {"dataType": "TEXT","retrievable": true,"retrieveByDefault": true,"sortable": true,"filterable": true,"searchable": true,"tokenizer": "literal","source": {
384 IBM Operations Analytics - Log Analysis: Installation, Configuration, and Administration Guide

"paths": ["metadata.text"]}},"className": {"dataType": "TEXT","retrievable": true,"retrieveByDefault": false,"sortable": false,"filterable": true,"searchable": false,"tokenizer": "literal","source": {"paths": ["annotations.ClassnameWSOutput.text"]}}
}}
Log annotator:
You can use annotations to extract and identify pieces of information fromunstructured text, for example, IP address, host name, and time stamp. Doing thisallows you to search for specific types of information, rather than being limited toa simple text search of the log files.
You can search annotated information more efficiently. For example, you can searchannotated information for log entries where the severity is E. If this informationhad not been annotated, you could perform only a simple text search for instancesof the letter E, which might return irrelevant matches.
To identify annotations in a log file or configuration file, use rules specified inAnnotation Query Language (AQL). Annotation can be configured for each datasource type.
These annotator types are available:
DefaultWhen using the default annotator type, you must specify a rule forsplitting the text into different fields and a rule for extracting values fromthe identified fields.
Java When using the Java annotator type, annotations are made to data sourcesof this type based on the annotator Java class you specify. TheCustomAnnotatorImpl.class class in annotator.jar is provided for thispurpose.
Script When using the Script annotator type, annotations are made to datasources of this type based on the annotator script you specify. TheDefaultPythonAnnotator.py script is provided for this purpose.
None No annotations are made to data sources of this Source Type.
The Java and Script annotator types are provided as customization options for thedefault annotator type.
Adding a Source Type:
This topic outlines the steps that you must complete to add a Source Type to IBMOperations Analytics - Log Analysis.
Administrating 385

Procedure
To add a Source Type:1. In the Data Types workspace, click Add > Source Type. The Add Source Type
tab is displayed2. Provide values for each of the required fields to create an appropriate Source
Type to meet your requirements:
Name Provide a unique name for the source type.
Input typeProvide the type of data that is processed.
Enable splitter:Click to enable this option and select the Rule Set or File Set that isused to split the log records in the log files processed:
Rule Set: Choose from the options that are provided or add a Rule Setbefore selecting it.
File Set: Select the File Set option if you want to use a set of customrules.
Enable annotatorClick to enable this option and select the Rule Set or File Set that isused to annotate the log records in the log files processed:
Rule Set: Choose from the options that are provided or add anadditional Rule Set before selecting it.
File Set: Select the File Set option if you want to use a set of customrules.
Deliver data on annotator execution failure: Select this option if youwant records that fail during annotation to be added.
Index ConfigClick Edit Index Configuration and specify the index configurationthat is used to determine how annotated data is indexed.
Add physical source IDIf you want to view statistics for physical sources of data on the DataIngestion dashboard in the Analytics Console, you need to specify aPhysical Data Source ID. For more information, see the Physical DataSource IDs topic in the Analytics Console section of the IBM OperationsAnalytics - Log Analysis documentation.
3. Click OK. A message is displayed requesting that you confirm that you want tocreate the Source Type and indicating that you cannot edit some propertiesafter the Source Type is saved. If you are satisfied that you have added thecorrect values to these properties, click OK.
Editing a Source Type:
After a Source Type has been created, you cannot edit the properties associatedwith the Source Type. Use the Edit button to review the existing properties for aSource Type.
Procedure
To edit a Source Type:1. In the Data Types workspace, expand the Source Types list.
386 IBM Operations Analytics - Log Analysis: Installation, Configuration, and Administration Guide

2. Select the Source Type that you want to view and click Edit. The Source Type isopened in a new tab.
3. To close the Source Type, click Close.
Deleting a Source Type:
You can delete an existing Source Type. However, a Source Type can only bedeleted if it is not referenced by a Collection. Artifacts must be deleted in a specificorder. The Collection must be deleted first, then the Source Type, and finally anyRule Set or File Set associated with the Source Type.
Procedure
To delete a Source Type:1. In the Data Types workspace, expand the Source Types list.2. Select the Source Type that you want to delete and click Delete.3. Click OK.
Rule SetA Rule Set is a file containing rules specified in Annotation Query Language(AQL). There are two available types of Rule Set:
Split Used to split unstructured or semi-structured data into different fields.
AnnotateUsed to annotate the fields already identified in a file containingunstructured or semi-structured data.
Adding a Rule Set:
This topic outlines the steps that you must complete to create a Rule Set.
Procedure
To add a Rule Set:1. In the Data Types workspace, click Add > Rule Set. The Add Rule Set tab is
displayed2. Enter the required information in each of the fields. Place your cursor on each
of the fields for information about the requirements of that field.3. Enter the following details for the Rule Set that you want to add:
Name Provide a unique name for the rule set.
Type Specify the type of rule set you want to create. The types available areSplit and Annotate.
Rule File DirectorySpecify the list of paths to the module source directories.
4. Click OK. A message is displayed requesting that you confirm that you want tocreate the Rule Set and indicating the properties that cannot be changed afterthe Rule Set is saved. If you are satisfied that you have added the correctvalues to these properties, click OK.
Editing a Rule Set:
After a Rule Set has been created, you cannot edit the name or type propertiesassociated with the Rule Set.
Administrating 387

About this task
You cannot edit the Name or Type associated with the Rule Set. Use the Editbutton to review the existing properties for a Rule Set.
Procedure
To view the properties of a Rule Set:1. In the Data Types workspace, expand the Rule Sets list.2. Select the Rule Set that you want to view and click Edit. The Rule Set is
opened in a new tab.3. To close the Rule Set, click Close.
Deleting a Rule Set:
You can delete an existing Rule Set. However, a Rule Set can only be deleted if it isnot referenced by a Source Type. Artifacts must be deleted in a specific order.Delete the Collection first, next delete the Source Type, and finally delete any RuleSet or File Set.
Procedure
To delete a Rule Set:1. In the Data Types workspace, expand the Rule Sets list.2. Select the Rule Set that you want to delete and click Delete.3. Click OK.
File SetsA File Set allows you to define a set of custom rules that are used to split orannotate a type of log data.
Adding a File Set:
This topic outlines the steps that you must complete to add a File Set.
Procedure
To add a File Set:1. In the Data Types workspace, click Add > File Sets. The Add File Set tab is
displayed2. Enter the required information in each of the fields. Place your cursor on each
of the fields for information about the requirements of that field.3. Click OK. A message is displayed requesting that you confirm that you want to
create the File Set and indicating the properties that cannot be changed afterthe File Set is saved. If you are satisfied that you have added the correct valuesto these properties, click OK.
Editing a File Set:
After a File Set has been created, you cannot edit the properties associated with theFile Set.
388 IBM Operations Analytics - Log Analysis: Installation, Configuration, and Administration Guide

About this task
You cannot edit the properties associated with an existing File Set. Use the Editbutton to review the existing properties for a File Set.
Procedure
To view the properties of a File Set:1. In the Data Types workspace, expand the File Sets list.2. Select the File Set that you want to view and click Edit. The File Set is opened
in a new tab.3. To close the File Set, click Close.
Deleting a File Set:
You can delete an existing File Set. However, a File Set can only be deleted if it isnot referenced by a Source Type. Artifacts must be deleted in a specific order.Delete the Collection first, next delete the Source Type, and finally delete any RuleSet or File Set.
Procedure
To delete a File Set:1. In the Data Types workspace, expand the File Sets list.2. Select the File Set that you want to delete and click Delete.3. Click OK.
Administrative tasksYou can change the refresh rate for dashboards, modify the service topology fileand configure the time settings as part of the administrative tasks which may needto complete from time to time.
Configuring automatic refreshes for new dashboardsYou can use the auto-refresh feature to regularly refresh a dashboard at scheduledintervals.
About this task
You can configure automatic refreshes only for a dashboard if all the charts in thedashboard use a relative time filter.
The default maximum number of charts that can be refreshed simultaneouslyacross all dashboards is 20. For example, you can refresh 10 dashboardssimultaneously if each dashboard has two charts. To edit the maximum number ofcharts that can be refreshed simultaneously, edit the MAX_AUTO_REFRESH_CHARTS=<20>property at the following location: <UNITY_HOME>/wlp/usr/servers/Unity/apps/Unity.war/WEB-INF/unitysetup.properties, where <20> is the number of chartsthat can be refreshed simultaneously.
Auto-refresh supports intervals of 0, 1, 5, 15, 30, and 60 minutes.
Procedure1. Open the dashboard.
Administrating 389

2. To set the auto-refresh interval, click Actions, then Auto-Refresh and select theinterval that you want to specify. For example, to refresh the dashboard every 5minutes, click 5 minutes.
Results
The dashboard and the associated charts are automatically refreshed with the mostcurrent data at the specified interval.
A check mark beside the specified interval indicates that an auto-refresh intervalwas already specified.
Configuring automatic refreshes for existing dashboardsYou can use the auto-refresh feature to regularly refresh an existing dashboard atscheduled intervals.
About this task
You can configure automatic refreshes only for a dashboard if all the charts in thedashboard use a relative time filter.
The default maximum number of charts that can be refreshed simultaneouslyacross all dashboards is 20. For example, you can refresh 10 dashboardssimultaneously if each dashboard has two charts. To edit the maximum number ofcharts that can be refreshed simultaneously, edit the MAX_AUTO_REFRESH_CHARTS=<20>property at the following location: <UNITY_HOME>/wlp/usr/servers/Unity/apps/Unity.war/WEB-INF/unitysetup.properties, where <20> is the number of chartsthat can be refreshed simultaneously.
Auto-refresh supports intervals of 0, 1, 5, 15, 30, and 60 minutes.
Procedure
Using a JSON editor, open and edit the original file with the following properties:
autoRefreshInterval:1where <1> is the auto-refresh interval.
searchType: relativewhere <relative> is the time filter.
Results
The dashboard and the associated charts are automatically refreshed with the mostcurrent data at the specified interval.
A check mark beside the specified interval indicates that an auto-refresh intervalwas already specified.
Editing groups in the service topology JSON fileIf your services are provided using a web application that is deployed across arange of servers such as web servers, application servers, and database servers,you might want to define the scope and structure of your application or service. Torepresent your application or service hierarchy, you can create a group or edit thedefault groups in the IBM Operations Analytics - Log Analysis service topologyJSON file.
390 IBM Operations Analytics - Log Analysis: Installation, Configuration, and Administration Guide

About this task
After you create a service topology, you can then associate your data source withthe appropriate node in the service topology. The hierarchy of data sources,reflecting your service topology, is shown in the Data Sources lists in the DataSources workspace and the Search workspace. When you select a data source tonarrow your search criteria, that data source, and any data sources in the servicetopology tree are searched.
To create a service topology that meets your requirements, edit the existing defaultservice topology JSON file. The JSON file has structure with each node in theservice topology defined by a type, a name, and a value. Data sources can only beassigned to hostname nodes.
A sample of the JSON file is displayed:[{"type": "Service","name": "Day Trader","value":[{"type": "Application","name": "Trading Application","value":[{"type": "Middleware","name": "WAS","value":[{"type": "Hostname","name": "nc9118041001",},{"type": "Hostname","name": "nc9118041002",},{"type": "Hostname","name": "nc9118041003","value": []},{"type": "Hostname","name": "nc9118041005","value": []}]
},{
To edit the JSON file:
Procedure1. Create a backup copy of the unityServiceTopology.json file that is located in
the <HOME>/IBM/LogAnalysis/wlp/usr/servers/Unity/apps/Unity.war/com/ibm/tivoli/loganalytics/framework directory and copy it to a secure location.
2. Using a JSON editor, open and edit the original file to reflect your servicetopology.
Administrating 391

3. Save the file.4. To ensure that your updates are reflected on the Admin UI, clear the browser
cache before you log in.
Results
After you have defined the service topology JSON file, you can then add it whenyou configure a data source. If you assign a data source to a node in the servicetopology, the assignment is maintained regardless of any updates you make toservice topology. Changes to the service topology JSON are not reflected in datasources that have been made before the update.
Configuring the timeout for the Log Analysis serverYou can extend the timeout value for the Log Analysis server beyond the defaultof 120 minutes. For example, if you want to use Log Analysis as a monitoringconsole you can extend the timeout value.
About this task
To change the default value, modify the server.xml file that is used by the LogAnalysis server.
Procedure1. To stop the Log Analysis, enter the following command:
<HOME>/IBM/LogAnalysis/utilities/unity.sh -stop
2. Open the <HOME>/IBM/LogAnalysis/wlp/usr/servers/Unity/server.xml file3. Add the following line to the file. The time is measured in minutes. For
example, to set the time out value to 8 hours, add the following line after theend of the last logical tag:<ltpa>
<ltpa expiration="480"/></ltpa>
For example, you can insert it after the httpEndpoint tag.4. Save the file.5. To start the Log Analysis again, enter the following command:
<HOME>/IBM/LogAnalysis/utilities/unity.sh -start
Results
The timeout value is changed.
Note: The session can time out in less time than is specified in the server.xml file.This issue can occur for a number of reasons outside of Log Analysis. For example,it can occur if the browser's timeout value is less than the value specified in theserver.xml file.
Adding or removing IBM Tivoli Monitoring Log File Agent froman existing installation
After you install IBM Operations Analytics - Log Analysis, you can add or removethe IBM Tivoli Monitoring Log File Agent from an existing installation.
392 IBM Operations Analytics - Log Analysis: Installation, Configuration, and Administration Guide

Before you begin
IBM Operations Analytics - Log Analysis is installed.
Procedure1. Navigate to the <user_home>/IBM/InstallationManager/eclipse/ directory and
run the command:./launcher
Note: If you are accessing the installation environment remotely, ensure thatyour virtual desktop software is configured to allow you to view the graphicaluser interface for the IBM Installation Manager.
2. Click Modify and add or remove the IBM Tivoli Monitoring Log File Agent.
Managing the Hadoop service on datanodesAfter you configure the Hadoop service, you can use the server.sh script tomanage the service.
Procedure
You can choose to manage the service on an individual datanode or manage all ofthe service instances together.v To manage the service on an individual datanode, use the LA user that you
created when you configured the service to log in to a Hadoop datanode server.1. Run the <LA_SERVICE_HOME>/bin/server.sh script with one of the following
parameters:
Start Starts the service on the Hadoop datanode server.
Stop Stops the service on the Hadoop datanode server.
Status Retrieves the status for the Hadoop datanode server.v To manage all of the instances, select one datanode to act as a
LA_Service_Controller_Node. This will manage the service on all of thedatanodes.1. (Optional) Create password-less SSH for the LA user from this datanode to all
of the datanodes, including this datanode, in the Hadoop cluster.2. Use the LA user to login to the LA_Service_Controller_Node datanode.3. Run the <LA_SERVICE_HOME>/bin/server.sh script with one of the following
parameters:
clusterStartStarts the service on each Hadoop datanode server.
clusterStopStops the service on each Hadoop datanode server.
clusterStatusRetrieves the status for each Hadoop datanode server.
If you do not configure password-less SSH connections during the configuration,you are prompted for the password for each datanode server.
Administrating 393

Sharing a Hadoop cluster across multiple IBM OperationsAnalytics - Log Analysis instances
Procedure1. To share a Hadoop cluster across multiple IBM Operations Analytics - Log
Analysis instances, you must integrate the Hadoop service for each IBMOperations Analytics - Log Analysis instance.For more information, see the Integrating the Hadoop service topic inConfiguration guide.a. You must use a different value for each of the following folders:
<LA_HADOOP_TIER> on the HDFS datanode<LA_SERVICE_HOME> in the LA home directory
Alternatively to repeating the steps for each IBM Operations Analytics - LogAnalysis instance, you can create a copy of the resultant folders from a IBMOperations Analytics - Log Analysis instance of the same version.
2. Modify the PORT and PROCESS_ID values in the <LA_SERVICE_HOME>/bin/env.sh file
Administrating data ingestion statisticsYou can export your data ingestion statistics. You can also configure non-billabledata sources.
Server Statistics workspaceUse the Server Statistics workspace to display the rolling 30 day average and thepeak average for data ingestion.
To calculate the 30 day rolling average, IBM Operations Analytics - Log Analysismeasures the amount of data that is ingested over the previous 30 days, includingthe current day and divides by 30. Data that is ingested on the day of the upgradeis counted as part of the average.
The workspace displays details in the following fields:
30 day ingestion averageDisplays the rolling 30 day average for the current day.
Peak 30 day ingestion averageDisplays the highest rolling 30 day average.
Date of peak 30 day ingestion averageDisplays the date when the peak day occurred.
The Daily ingestion and Rolling 30 Day Average graph displays the dailyingestion total and the rolling 30 day average for the specified date range. Thegraph is automatically updated when you enter a date.
If you want to refresh the chart without changing the date, click the Refreshbutton.
export_statistics commandUse the export_statistics command in the <HOME>/IBM/LogAnalysis/utilitiesdirectory to export statistics data to a table or comma-separated values (CSV) fileline.
394 IBM Operations Analytics - Log Analysis: Installation, Configuration, and Administration Guide

Syntax
This command has the syntax:export_statistics <base_uri> [-u -p]| -f | -o | -t | -s | - h
where <base_uri> is the location of the IBM Operations Analytics - Log Analysisfor which you want to export data. If you do not specify a value for the<base_uri> parameter, the $UNITY_BASE_URI environmental variable is used.
Parameters
These parameters are also available:
-u The user name for a user with administrative privileges. The format forthis parameter is --u=username. Where username is a user withadministrative privileges. If you do not specify a value for the -uparameter, the $UNITY_USER environmental variable is used.
-p The password for the user that you specified. The format for thisparameter is --p=password. Where password is the password for the username that you specified. If you do not specify a value for the -p parameter,the $UNITY_PASS environmental variable is used.
-f The format in which you want to export the data. The format for thisparameter is --f format. Where format is table or CSV. The default valueis Table.
-o Outputs the statistics to a file. The format for this parameter is --o path.Where path is the file name and path for the export file. The default valueis stdout.
-t Specifies the type of data that you want to export. The format for thisparameter is --t type. Where type is summary, daily, or thirtydayavg. Theresults are presented in table format with each column having a name. Forexample, Data Source. The default value is daily.
-s Use this parameter to separate records when outputting to a CSV file. Theformat for this parameter is --s separator. Where separator is theseparator that you want to use in the CSV file. The default value is acomma (,).
-h (Optional) Displays help for this command. The <base_uri> parameter isnot required for this parameter.
Note: A discrepancy might occur between the file size of the file that is ingestedand the value that is returned by the export_statistics command. The valuereturned is less than or equal to the file size of the ingested file. This differenceoccurs because incomplete records in the log file are discarded by the Splitterreducing the file size.
The command outputs different information, depending on the type parameter thatyou specify, summary, daily, or thirtydayavg. The column headings for daily dataare:
Data SourceThe Data Source with which the ingested data is associated.
CollectionThe Collection with which the Data Source containing the data isassociated.
Administrating 395

Date The date on which the data was ingested.
Ingested BytesThe volume of data, in bytes, that has been ingested.
BillableThe volume of data that is used for billing purposes.
Log PathThe path to the data source.
HostnameThe host name that indicates the source of the log file.
The column headings for the 30 day, rolling average are as follows:
Current Thirty Day Rolling AvgThe current 30 day, rolling average.
Thirty Day Rolling Avg High-Water MarkShows the average peak amount of data that is used over the last 30 days.
Date of Thirty Day Rolling Avg High-Water MarkShows the date when the amount of data ingested peaked.
The column headings for the 30 day average are as follows:
Date Shows the date for each average.
Thirty Day AverageShows the average amount of data that is used over 30 days.
Example
This example downloads the daily data source statistics from http://unityserver.example.com:9988/Unity using the user name unityadmin and thepassword secretpassword. The statistics are output to a CSV file:~/Desktop/LogStats.csv.export_statistics http://unityserver.example.com:9988/Unity--username=unityadmin --password=secretpassword --f csv --o ~/Desktop/LogStats.csv
To export the daily statistics, use the following command:./export_statistics -u <user_name> -p <password> -t daily
The command outputs the following information:Data Source|Collection |Date |Ingested Bytes|Billable|Log Path |------------+--------------+--------------+------------------+------------+--------localtest | localtest |2013-11-14|22640 |True |/alogtest/SystemOut.loglocaltest | localtest |2013-11-13|396200 |True |/alogtest/SystemOut.log----------------------------------------------------------------------------------|| Hostname |-----------+---------------| <hostname1>.example.com| <hostname2>..example.com
To export a summary, enter the following command:./export_statistics -u <user_name> -p <password> -t daily
This command outputs the following information:
396 IBM Operations Analytics - Log Analysis: Installation, Configuration, and Administration Guide

Current Thirty Day Rolling Avg| Thirty Day Rolling Avg High-Water Mark|----------------------------------+-----------------------------------
13961 | 13961 |----------------------------------------------------------------------|Date of Thirty Day Rolling Avg High-Water Mark--------+--------------------------------------|2013-11-14 00:00:00 -0500
To export the 30 day average data, enter the following command:./export_statistics -u <user_name> -p <password> -t thirtydayavg
This command outputs the following information:Date | Thirty Day Average
--------------+--------------------2013-11-14 | 139612013-11-13 | 13206
Configuring non-billable data sourcesAs part of the interim fix, Netcool Operations Insight customers are entitled toload Netcool Operations Insight and any other Cloud and Smarter Infrastructureproduct logs into IBM Operations Analytics - Log Analysis at no extra cost. Fornon-Cloud and Smarter Infrastructure logs, customers are entitled to load up to 2Gigabyte (GB) average data per day of the 30 day rolling period for free.
About this task
To comply with billable data requirements, you need to segregate Cloud andSmarter Infrastructure and non-Cloud and Smarter Infrastructure data. Tosegregate this data, you must create separate data sources for billable (non-Cloudand Smarter Infrastructure) and non-billable (Cloud and Smarter Infrastructure)data.
For example, if you use IBM Operations Analytics - Log Analysis to load data fromNetcool Operations Insight product logs and also from UNIX Operating System(OS) logs, you must create two separate data sources, one data source for theNetcool Operations Insight logs and one data source for the UNIX OS logs.
Procedure1. Create a file that is called seed.txt in the <HOME>/IBM/LogAnalysis/wlp/usr/
servers/Unity directory.Use the first line to specify the free ingestion limit in Megabytes (MBs). Thefree ingestion limit is up to 2GB average data per day of the 30 day rollingperiod. Read your license agreement to understand the free data ingestion limitfor Cloud and Smarter Infrastructure and non-Cloud and Smarter Infrastructurelogs. Use the next lines to specify the paths or directories where your Cloudand Smarter Infrastructure related applications are installed. The log files formost Cloud and Smarter Infrastructure products are stored in the installationdirectories. These locations must match the log path that is defined when thedata source is created. In some Cloud and Smarter Infrastructure integrations, adata source can have an arbitrary string for a log path. In these cases, thestrings in the seed.txt file must match the string that is specified in the datasource.The following sample shows a seed.txt file. Lines that start with a hashtag (#)are commented out and are ignored.
Administrating 397

#FREE INGESTION LIMIT (MB)2048#Data Source locations to be ignored by statistics tracker/home/LAuser1/LogAnalysis/logs/home/LAuser1/my/log/path
2. To restart IBM Operations Analytics - Log Analysis, enter the followingcommand:<HOME>/IBM/LogAnalysis/utilities/unity.sh -restart
3. Create a data source for the non-billable data.If the log path that you specify when you create the data source matches any ofthe file paths that you specified in the seed.txt file, IBM Operations Analytics -Log Analysis does not count the data from these data sources in the billingstatistics.For more information about how to create a data source, see “Data Sourcecreation” on page 373.
Results
The free data ingestion limit of 2GBs average data for the 30 day rolling period isdisplayed as a horizontal red line on the Server Statistics UI.
Deleting dataTo remove data from IBM Operations Analytics - Log Analysis, use the deletiontool.
About this task
When you delete data with this tool, a log file that is called DeleteApplication.logis created and stored in the <HOME>/logs directory.
The tool has one limitation. Do not run this utility for use case 1 when dataingestion is in progress for the specified data source. For example, if you areloading data into a data source, do not delete data from the same data source untilingestion is complete.
The tool is configured to run use case 1 by default.
For more information about the delete.properties parameters and values, see“delete.properties” on page 403.
Procedure1. Open the <HOME>/IBM/LogAnalysis/utilities/deleteUtility/
delete.properties file.2. Locate the lines and specify the use case that you want to run:
[useCase]useCaseNumber = <usecase>
where <usecase> is one of these use cases.
useCase_1Delete all of the data from a single data source or delete a specificsubset of data from the specified data source. If you run this use case,locate this variable in the delete.properties file and specify anappropriate value:
398 IBM Operations Analytics - Log Analysis: Installation, Configuration, and Administration Guide

v dataSourceName: Specify the name of the data source for which youwant to delete data.
v query: Enter a query to delete a specific subset of data. For example,if you enter severity:E, all the log records in the data source thatcontain this severity status are deleted. You must use the IndexingEngine query syntax to specify the query.
useCase_2Delete all of the data from a single Collection or delete a specific subsetof data for the specified collection. If you run this use case, locate thisvariable in the delete.properties file and specify an appropriate value:v collectionName: Specify the name of the Collection for which you
want to delete data.v query: Enter a query to delete a specific subset of data. For example,
if you enter severity:E OR severity:W, all the log records in thecollection that contain either or both of these severity statuses aredeleted. You must use the Indexing Engine query syntax to specifythe query.
useCase_3
Use this use case to delete data from all the IBM Operations Analytics -Log Analysis collections for a time period that you specify. You mustspecify a start and end time in the same time zone as the time specifiedin the unitysetup.properties file.
Note:
The utility deletes data for whole multiples of the time window valuethat occur during the specified time only. The time window value isdefined in unitysetup.properties file. For example, if the time windowvalue is one day and you enter the following start and end times, theutility deletes three complete days worth of data from all IBMOperations Analytics - Log Analysis collections.startTime = <11/21/2013 14:00:00>endTime = <11/25/2013 09:00:00>
The deleted days are 22, 23, and 24 November. Data from 14:00 to 00:00on 21 November is not deleted nor is data from 00:00 to 09:00 on 25November.
Note:
If you specify an endTime that is in the future, IBM OperationsAnalytics - Log Analysis displays a message that warns you that thiscan delete data from the current, active collection. Data is only removedfrom the current collection if the future date exceeds the value for thecollection window. For example, if the collection window value is oneday and the endTime is specified as 23:00:00 on the same day as theutility is run, data is not deleted from the active collection. However, ifthe collection window value is one day and the endTime is specified as00:30:00 on the day after the current day, data is deleted from theactive collection.
useCase_4Use this use case to delete data that is stored for longer than thespecified retention period at regular intervals. The retention period is
Administrating 399

specified by the retentionPeriod=1d parameter in thedelete.properties file. The time is measured in days and one day isthe default value. You must specify the retention period as a multipleof one day.
3. Save the delete.properties file.4. Run the tool in stand-alone mode:v To run the utility in stand-alone mode, run the command:
<Path to Python> deleteUtility.py <password>
where <Path to Python> is the location to which python is installed and the<password> and the associated user name are defined in thedelete.properties file.
v To run the utility in cron mode:a. Update the <HOME>/IBM/LogAnalysis/utilities/deleteUtility/
callDeleteUtility.sh file. Ensure that the password specified here iscorrect.
b. Enter the following command to run the utility:sh ./createCron.sh
c. After the script runs, an entry is created in the cron file. To view thedelete cron job that you created, enter the following command:crontab -l
Deletion toolTo delete data from IBM Operations Analytics - Log Analysis, use the deletion tool.
The tool is available in the <HOME>/utilites/deleteUtility directory.
Use the tool to:v Delete all of the data from a single data source or delete a specific subset of data
from the specified data source.v Delete all of the data from a single Collection or delete a specific subset of data
from the specified Collection.v Delete data from all the IBM Operations Analytics - Log Analysis collections for
a time period that you specify.v Delete data that is older than the specified retention period at regular intervals.
The tool is configured to run use case 1 by default. If you do not change thedefault value for the retention period, the default value of 24 hours is used.
Administering referenceRead to get reference information about the utilities and tools that you can usewhen you are administering Log Analysis.
export_statistics commandUse the export_statistics command in the <HOME>/IBM/LogAnalysis/utilitiesdirectory to export statistics data to a table or comma-separated values (CSV) fileline.
400 IBM Operations Analytics - Log Analysis: Installation, Configuration, and Administration Guide

Syntax
This command has the syntax:export_statistics <base_uri> [-u -p]| -f | -o | -t | -s | - h
where <base_uri> is the location of the IBM Operations Analytics - Log Analysisfor which you want to export data. If you do not specify a value for the<base_uri> parameter, the $UNITY_BASE_URI environmental variable is used.
Parameters
These parameters are also available:
-u The user name for a user with administrative privileges. The format forthis parameter is --u=username. Where username is a user withadministrative privileges. If you do not specify a value for the -uparameter, the $UNITY_USER environmental variable is used.
-p The password for the user that you specified. The format for thisparameter is --p=password. Where password is the password for the username that you specified. If you do not specify a value for the -p parameter,the $UNITY_PASS environmental variable is used.
-f The format in which you want to export the data. The format for thisparameter is --f format. Where format is table or CSV. The default valueis Table.
-o Outputs the statistics to a file. The format for this parameter is --o path.Where path is the file name and path for the export file. The default valueis stdout.
-t Specifies the type of data that you want to export. The format for thisparameter is --t type. Where type is summary, daily, or thirtydayavg. Theresults are presented in table format with each column named. Forexample, Data Source. The default value is daily.
-s Use this parameter to separate records when outputting to a CSV file. Theformat for this parameter is --s separator. Where separator is theseparator that you want to use in the CSV file. The default value is acomma (,).
-h (Optional) Displays help for this command. The <base_uri> parameter isnot required for this parameter.
Note: A discrepancy might occur between the file size of the file that is ingestedand the value that is returned by the export_statistics command. The valuereturned is less than or equal to the file size of the ingested file. This differenceoccurs because incomplete records in the log file are discarded by the Splitterreducing the file size.
The command outputs different information, depending on the type parameter thatyou specify, summary, daily, or thirtydayavg. The column headings for daily dataare:
Data SourceThe Data Source with which the ingested data is associated.
CollectionThe Collection with which the Data Source containing the data isassociated.
Administrating 401

Date The date on which the data was ingested.
Ingested BytesThe volume of data that is ingested, in bytes.
BillableThe volume of data that is used for billing purposes.
Log PathThe path to the data source.
HostnameThe host name that indicates the source of the log file.
The column headings for the 30 day rolling average are as follows:
Current Thirty Day Rolling AvgThe current 30 day, rolling average.
Thirty Day Rolling Avg High-Water MarkShows the average peak amount of data that is used over the last 30 days.
Date of Thirty Day Rolling Avg High-Water MarkShows the date when the amount of data ingested peaked.
The column headings for the 30 day average are as follows:
Date Shows the date for each average.
Thirty Day AverageShows the average amount of data that is used over 30 days.
Example
This example downloads the daily data source statistics from http://unityserver.example.com:9988/Unity using the user name unityadmin and thepassword secretpassword. The statistics are output to a CSV file:~/Desktop/LogStats.csv.export_statistics http://unityserver.example.com:9988/Unity--username=unityadmin --password=secretpassword --f csv --o ~/Desktop/LogStats.csv
To export the daily statistics, use the following command:./export_statistics -u <user_name> -p <password> -t daily
The command outputs the following information:Data Source|Collection |Date |Ingested Bytes|Billable|Log Path |------------+--------------+--------------+------------------+------------+--------localtest | localtest |2013-11-14|22640 |True |/alogtest/SystemOut.loglocaltest | localtest |2013-11-13|396200 |True |/alogtest/SystemOut.log----------------------------------------------------------------------------------|| Hostname |-----------+---------------| <hostname1>.example.com| <hostname2>..example.com
To export a summary, enter the following command:./export_statistics -u <user_name> -p <password> -t daily
This command outputs the following information:
402 IBM Operations Analytics - Log Analysis: Installation, Configuration, and Administration Guide

Current Thirty Day Rolling Avg| Thirty Day Rolling Avg High-Water Mark|----------------------------------+-----------------------------------
13961 | 13961 |----------------------------------------------------------------------|Date of Thirty Day Rolling Avg High-Water Mark--------+--------------------------------------|2013-11-14 00:00:00 -0500
To export the 30 day average data, enter the following command:./export_statistics -u <user_name> -p <password> -t thirtydayavg
This command outputs the following information:Date | Thirty Day Average
--------------+--------------------2013-11-14 | 139612013-11-13 | 13206
delete.propertiesTo remove data from IBM Operations Analytics - Log Analysis, use the deletiontool.
The delete.properties file is in the <HOME>/IBM/LogAnalysis/utilities/deleteUtility directory.
The deleteUtility supports three use cases. The use cases require generalinformation, and information specific to each use case.
The hostName, port, userName, and delayDuration parameters are required.
The query parameter is optional and can only be used with use cases 1 and 2.
Table 89. General parameters
Parameter Value
useCase The use case number that you want to run.
hostName The host name that corresponds to the datasource defined.
port The https port. The default port is 9987.
userName The user name for a user withadministrative access rights.
delayDuration The delay interval (in milliseconds) betweentwo consecutive rest (post) calls.
query If you want to delete a specific type of datain a specified data source or collection, usethis parameter to specify a query in theIndexing Engine syntax. For example,entering Severity:E deletes all the logrecords for the specified severity.
Use Case 1dataSourceName: Specify the name of the data source for which you wantto delete data.
query: Enter a query to delete a specific type of data. For exampleseverity:E
Administrating 403

Use Case 2collectionName: Specify the name of the Collection for which you want todelete data.
query: Enter a query to delete a specific type of data. For exampleseverity:E or severity:W
Use Case 3startTime = <11/21/2013 14:00:00>endTime = <11/25/2013 09:00:00>
API guideUse this guide to help you to integrate Log Analysis with other applications.
Search REST API overviewThe Search REST interface can be used to execute search queries. Search can beexecuted through a HTTP POST request on https:<host>:<port>;/Unity /Search.
The Search REST interface is the primary search method that is used to executesearch queries.
Searching over data sources
The input search request and the response back from USR are both modeled asJSON objects. In the following section, the structure of these input and outputJSON objects are described.
JSON Format for Search RequestThe input JSON for a search request is a single JSON object.
The input JSON object has the structure:{
“logSources”: [“logsource1”, “logsource2”, ....],“query”: “the search query string entered by the user”,“filter”: //filter query (see section 4.1 below)“queryLang”: “the language of the search query”,“start”: 0,“results”: 10,“getAttributes”: [“attribute1”, “attribute2”, .....],“sortKey”: [“key1”, “key2”, ......],“facets”: {
“facet1D1”: // facet request (see section 4.2 below)“facetID2”: // facet request (see section 4.2 below)
......}“advanced”: {
“rankingHint”: “a query expression that provides a ranking hintfor Gumshoe”,“explain”: false,
“interpretations”: true,“catchallOnly”: false,“rules”: {
“allRules”: true,“categoryRules”: true,“rewriteRules”: true,“ignoreCategories”: [“cat1”, “cat2”, ....]
}
404 IBM Operations Analytics - Log Analysis: Installation, Configuration, and Administration Guide

“grouping”: [“groupingType1”, “groupingType2”, ..],“highlighting”: true,
}}
1,000 or more results and Custom Search Dashboard: When a query in a CustomSearch Dashboard returns more than 1000 records, you get only 1000 results back.The search result returned includes a field totalResults which shows total numberof matching results. Another field numResults gives the number of recordsreturned. You can check these values in the Custom Search Dashboard script andhandle the results accordingly.
The following table lists the semantics of the remaining attributes
Table 90. Search request input parameters
Name Description Default Value Comments
logsources logsources against which thesearch request must beperformed
Required A list of logsources. This should be aJSON array. Each entry can be alogsource name or tag name. If a tagname is specified , all logsources underthe tag will be included in the search
"logsources": [{"type":"tag","name":"/ipo"},{"type":"logSource","name":"/DayTraderLogSource"} ]
query Search query Required Typically, the value of this parameter iswhatever is entered by the end-user ina search box. However, any valid querystring as per the Velocity query syntax(excluding range queries) is permitted.
filter Application filter No filter Valid JSON object as described insection 4.1. This parameter is intendedfor applications to pass in filters inaddition to the user search query.Conceptually, the overall queryprocessed by USR is “query ANDfilter”. The separation into two parts isto allow for additional querymanipulation of the “query” part whenwe implement advanced searchcapabilities.
start Offset of the first result toreturn (Integer)
0 If specified value is negative, the valuewill be defaulted to 0; if the specifiedvalue is greater than the number ofresults, no results will be returned.
results Number of results desired(Integer)
10 Min value is 1 (values <= 0 default to1); maximum value is 1000.
Administrating 405

Table 90. Search request input parameters (continued)
Name Description Default Value Comments
getAttributes Attributes to be returned foreach result entry
Not required When this parameter is not specified inthe request, the engine will return onlythe set of attributes marked asretrievebyDefault in the indexingconfigurations associated with thelogsources in question.
If this parameter is specified and is anon-empty array, then the attributeslisted in the array are fetched.
Finally, if the parameter is specified butis an empty array, then ALL retrievableattributes across all logsources will bereturned for each result entry.
sortKey One or more fields on whichto sort the result
Relevance order A valid value for this parameter is acomma-separated list of field names,with each field name prefixed by “+” or“-“. Each field name appearing in thelist must have been declared to be a“sortable” field at index build time. Thefirst field in the list is treated as theprimary sort key, the second field (ifpresent) as the secondary sort key, andso on. The “+” (resp. “-“) prefix is aninstruction to sort the correspondingfield values in ascending (resp.descending) order.
For queries involving multiplelogsources, sort keys must exist in alllogsources involved in the query, andsort keys must have the same typeacross logsources.
outputTimeZone Time zone in which DATEfield results should beformatted
Collection time zone(for single logsourcequeries andmulti-logsourcequeries wherelogsources haveidentical time zones).
Server time zone (formulti-logsourcequeries wherelogsources havedifferent time zones)
outputDateFormat SimpleDateFormat string thatspecifies how DATE fieldresults should be formatted
UNITY_DATE_
DISPLAY_FORMAT
Read fromunitysetup.properties
406 IBM Operations Analytics - Log Analysis: Installation, Configuration, and Administration Guide

Filter queryA filter query is a Boolean query specified as a nested JSON record. In its simplestform a Boolean query consists of a basic query. A basic query can be a term query,wildcard query, phrase query or range query. Basic queries can also be combinedusing arbitrarily nested conjunctions (AND queries), disjunctions (OR queries) andnegations (NOT queries) to form complex Boolean queries.
4.1.1 Basic filter queries
Term query
A term query is specifies a field name and a term. It matches alldocuments for which the field contains the term. A term query is specifiedas follows:{ “term”:{“myField”: “termValue”}}
Wildcard query
A wildcard query specifies a field name and a wildcard expression. Itmatches all documents for which the field matches the wildcardexpression. A wildcard query is specified as follows:{ “wildcard”:{“myField”: “wildcardExpression”}}
Phrase query
A phrase query specifies a field name and a phrase. It matches alldocuments for which the field contains the phrase. A phrase query isspecified as follows:{ “phrase”:{“myField”: “phraseValue”}}
Range query
A range query specifies a field name along with a lower bound (inclusive)and an upper bound (exclusive) for the field value. A range query isapplicable only to numeric and date fields. For date fields, an additionaldate format must be provided. A range query is specified as follows:{“range”:
{“myField”:{ “from”: “lower-bound”, // value will be included in the search
“to”: “upper-bound”, // value will be excluded in the search“dateFormat”: “date-format” // only for date fields
}}
}
4.1.2 Complex filter queries
Complex filter queries can be constructed by combining one or more queries usingAND, OR or NOT queries.
AND query
An AND query consists of two or more sub-queries. Sub-queries can beeither a basic query or another complex query. A document satisfies anAND query only if it satisfies all of its sub-queries. An AND query isspecified as follows:
Administrating 407

{“and”:[{“query1”: ...},{“query2”: ...},...{“queryN”: ...}]
}
OR query
An OR query consists of two or more sub-queries. Sub-queries can beeither a basic query or another complex query. A document satisfies an ORquery if it satisfies at least one of its sub-queries. An OR query is specifiedas follows:{“or”:[
{“query1”: ...},{“query2”: ...},...{“queryN”: ...}]
}
NOT query
A NOT query consists of a single sub-query. The sub-query can be either abasic query or a complex query. A document satisfies a NOT query if itdoes not satisfy the contained sub-query. A NOT query is specified asfollows:{“not”: {“query”: ....}}
Facet requestsDifferent types of facet requests are supported by USR, along with the JSON formatused to specify each type of facet request.
Each facet request is specified as a JSON key-value pair with the key being thefacetID and the value being a JSON record. The type of facet being computeddetermines the structure of this JSON record. The supported facet types and theircorresponding JSON request format are described here.
Term Facets"myTermFacet": {
"terms": {"field": "myField","size": N
}}
Facet counting is performed on the field myField and the top-N mostfrequent facet values (for some positive integer N) is returned.
The next two facets (histogram and statistical) apply only to numericfields. In other words, the field on which these facets are being computedmust have been configured with a dataType=LONG or dataType=DOUBLE inthe indexing specification associated with the IBM Operations Analyticscollection(s) over which the facet request is being processed.
Histogram Facets"myHistoFacet": {
"histogram": {"field": "myField","interval": 100
}}
408 IBM Operations Analytics - Log Analysis: Installation, Configuration, and Administration Guide

Performs facet counting with buckets determined based on the intervalvalue.
Statistical Facets"myStatFacet": {
"statistical": {"field": "myField","stats": ["min", "max", "sum", "avg", "count", "missing",
"sumOfSquares", "stddev", “percentile”]}
}
Performs simple aggregate statistics on a facet field. The "stats" attributespecifies which of these statistics should be computed for the given facetrequest.v If you are using the Entry Edition, you can use the sum, min,
max, avg, and count functions.v If you use the Standard Edition, you can use the missing,
sumOfSquares, stddev, and percentile functions.
Percentile operations allow you to run queries for a defined percentile. Youcan also run the operation for multiple percentiles. For example, to querythe maximum and minimum results for the 50th, 95th, and 99thpercentiles, you enter "stats": ["min", "max", "percentile,50,95,99"].The facet response is:
{"min": 10,"max", 1000,"percentile":{
"50": 100,"95": 200,"99": 225
}}
Date Histogram Facets"myDateHistoFacet": {"date_histogram": {"field": "myField","interval": "day","outputDateFormat": "yyyy-MM-dd’T’ HH:mm:ssZ"
}}
A version of the histogram facet specialized for date fields. The value ofthe interval attribute can be one of the string constants year, month, week,day, hour, or minute. The value of the outputDateFormatis any valid dateformat string as per the Java SimpleDateFormat class. This format string isused to represent the histogram boundaries in the response JSON comingout of USR.
For single collection data histogram facets, boundaries are based on thecollection time zone (either from the index configuration, or fromunitysetup.properties if missing in the index configuration). Formulti-collection facets, boundaries are based on collection time zone if thetime zone of all collections is identical. For multi-collection facets wherecollection time zones differ, boundaries are based on the server time zone.
Administrating 409

Note: The results returned from the date histogram facet are not sorted. Ifyou are plotting the resulting time intervals in a chart, you need to sort theJSON returned by the date histogram facet. For example, in python, if yoursearch request is the following:request = {
"start": 0,"results": 1,"filter": {
"range": {"timestamp":{"from":"01/01/2013 00:00:00.000 EST","to":"01/01/2014 00:00:00.000 EST","dateFormat":"MM/dd/yyyy HH:mm:ss.SSS Z"
}}
},"logsources": [{"type": "logSource", "name": "MyTest" }],"query": "*","sortKey":["-timestamp"],"getAttributes":["timestamp","perfMsgId"],"facets":{
"dateFacet":{"date_histogram":{
"field":"timestamp","interval":"hour","outputDateFormat":"MM-dd HH:mm","nested_facet":{
"dlFacet":{"terms":{
"field":"perfMsgId","size":20
}}
}}
}}
}
First, retrieve the dateFacet from the JSON returned by the http requestand then call the dateSort() function .
response = connection.post(’/Search’, json.dumps(request),content_type=’application/json; charset=UTF-8’);
content = get_response_content(response)
#convert the response data to JSONdata = json.loads(content)
if ’facetResults’ in data:
# get the facet resultsfacetResults = data[’facetResults’]
if ’dateFacet’ in facetResults:# get the dateFacet rowsdateFacet = facetResults[’dateFacet’]
# the results of the dateFacet are not sorted,# so call dateSort()dateSort(dateFacet)
where dateSort() is defined as follows:
410 IBM Operations Analytics - Log Analysis: Installation, Configuration, and Administration Guide

#------------------------------------------------------# dateSort()#------------------------------------------------------def dateSort(dateFacet):
# This function parses the UTC label found in the dateFacet in# the format "mm-hh-DDD-yyyy UTC"# and returns an array in the form [yyyy, DD, hh, mm]def parseDate(dateLabel):
aDate = map(int, dateLabel.split(" ")[0].split("-"))aDate.reverse()return aDate
# call an in-place List sort, using an anonymous function# lambda as the sort functiondateFacet.sort(lambda facet1, facet2: cmp(parseDate(facet1[’label’]),parseDate(facet2[’label’])))
return dateFacet
Nested Facets
A facet request can be nested inside another facet request, by specifying anested_facet key. You can nest facets to any number of levels.
The following is a valid nested facet query, with a termsfacet query nestedinside a date_histogram facet query:"facets":
{"dateFacet":{"date_histogram":{
"field": "timestamp","interval":"hour","outputDateFormat":"MM-dd HH:mm","nested_facet":{"severityFacet":{
"terms":{"field":"severity",
"size":10}
}}
}}
},
Percentile statistical functionsYou can use the statistical function to return values for specified percentiles.
You can use the Search REST API or the user interface to create percentilestatistical functions.
For example, to query the maximum and minimum results for the 50th, 95th, and99th percentiles with the Search REST API, you enter "stats": ["min", "max","percentile,50,95,99"]. The facet response is:
{"min": 10,"max", 1000,"percentile":{
"50": 100,"95": 200,"99": 225
}}
Administrating 411

Percentile queries are not calculated incrementally, unlike the other queries that areused in Log Analysis. This fact means that the query needs to run over the entiretime range before it can return any results.Log Analysis limits the number ofasynchronous windows that can run simultaneously for this function. Thisproperty is set in the MAX_NON_INCREMENTAL_WINDOWS property intheunitysetup.properties. The default value is 2.
For example, if you specify a percentile query based on a time range from August1 2015 to August 10 2015 and MAX_NON_INCREMENTAL_WINDOWS=5 andCOLLECTION_ASYNC_WINDOW=1d, only the most recent 5 days of data that is returnedby the query are considered for percentile evaluation.
JSON Format for Search ResponseThe search results from USR are also packaged as a single JSON object .
The JSON object has the structure:{
"searchRequest": // copy of the entire input JSON object thatgenerated this response"totalResults": // integer value representing total number ofresults for the query"numResults": // number of top-level results sent back withinthis JSON ("top-level"
// because a grouped/clustered result is counted as 1"executionInfo": {
"processingTime":// time (in ms) measured from the receipt of the search
// request by USR to point when USR begins to construct the result"interpretations": // for advanced search post"rules": // for advanced search post
}"searchResults": [
// Array of JSON objects one per top-level result entry.// The size of this array will be the value of the "numResults"
attribute]
"facetResults": {"facetID1": { // Object with facet information for facetID1 }"facetID2": { // Object with facet information for facetID2 }
......}
}
Each element of the "searchResults" array will have the following structure:{"resultIndex": // a number that denotes the position of this result in the
// overall result set for this query"attributes": {
"field1": "value1","field2": "value2",....// one key-value pair for each field of the result entry;
the set of fields// will be determined by the semantics of the getAttributes
parameter
The JSON structure for the facet results depends on the specific type of facetrequest.
412 IBM Operations Analytics - Log Analysis: Installation, Configuration, and Administration Guide

Term Facets"facetID": {
"total": // total number of distinct terms in the fieldused for generating this facet
"counts": [{ "term": "term1", "count": 10},{ "term": "term2", "count": 5},...
]}
Histogram Facets"facetID": [
{ "low": 50, "high": 150, "count": 10},{ "low": 150, "high": 250, "count": 25},...
]
Statistical Facets"facetID": {
"max": // max value"min": //min value"sum": // sum value"avg": // avg value"count": // count value"missing": // missing values"sumOfSquares": // sumOfSquares value"stddev": // stddev value
}
In general, all three aggregates do not have to be present. Only theaggregates listed in the "stats" attribute of the corresponding facet requestwill be included.
Date histogram Facets
Identical to the output of the histogram facets, except that the "low" and"high" attributes will be represented according to the format stringspecified in the input date histogram facet request. For example, the outputmay be something that looks like the following:"facetID": [
{ "low": "2012-01-01 10:00:00", "high":"2012-01-01 11:00:00,"count": 10},
{ "low": "2012-01-01 11:00:00", "high":"2012-01-02 12:00:00","count": 10"label": "9-22-188-2012 UTC" },
...]
Nested Facets
If the outermost facet is a term facet, the response will be as follows:"total": // total number of distinct terms in the field used forgenerating this facet
"counts": [{ "term": "term1", "count": 10, "nested_facet":{nested facet result...}},{ "term": "term2", "count": 5, "nested_facet":{ nested facet result...}}]
...]
Administrating 413

Search query APIThe /query API works like the /Search API, with the exception of the structure ofthe response JSON. This API returns the data in tabular format instead ofhierarchical format.
Search Request
Search request structure is the same as the /Search API.
The only extra field is name, which is an optional field. The name is used as the IDof the data set in the results. If the name is not specified,searchResults
is used as the ID.{"name":"AllErrors","start": 0,"results": 10,"filter": { },"logsources": [ ... ],"query": "*","getAttributes": [ ... ],"facets": { "facetId1" :{...}, ...}}
Other search parameters, such as search filters, facets, nested facets,logsources, query, getAttributes, start, and results are described in section 4.
Search Results
The search results are in a tabular format, which can be ingested by Custom SearchDashboards. The key ‘data’ in results points to an array of data sets. Each data sethas ID, fields, and rows.
Results include one data set for search results and one for each facet that isspecified in the request.
Search results data set uses the ‘name’ specified in the request as the ID. If notspecified searchResults is used as ID.
Facet results use the facet ID used in the request as the ID for the data set. In caseof term, histogram and date-histogram facets, ‘count’ is added to the fields alongwith the specified fields.
For statistical facets (max, min, sum, avg, count, missing, sumOfSquares, andstddev), field ID is generated by combining field name and the function name. Forexample, for ‘min’ it is fieldname-min where fieldname is the field included in thestatistical facet. Similarly, for max it is fieldname-max.{"data": [{"id": "AllErrors","fields": [{"label": "fieldLabel1", "type": "TEXT", "id": "fieldId1" },{ "label": "fieldLabe2", "type": "LONG", "id": "fieldId2"}],"rows": [{
414 IBM Operations Analytics - Log Analysis: Installation, Configuration, and Administration Guide

"fieldId1": "value1","fieldId2": "value2"} ]},{"id": "facetId1","rows": [{"fieldId1": "value1","fieldId2": "value2","count": “value3”},{"fieldId1": "value1","fieldId2": "value2","count": “value3”}],"fields": [{ "label": "fieldLabel1", "type": "LONG", "id": "fieldId1" },{ "label": "fieldLabel2", "type": "LONG", "id": "fieldId2"},{ "label": "Count", "type": "LONG", "id": "count" } ]}]}
Search request and results
This example shows a search request and response with sample data.
Search request{"start": 0,"results": 100,"name":"AllErrors","logsources": [{"type": "tag","name": "*"}],"query": "*","facets": {"termFacet01": {"terms": {"field": "msgclassifier","size": 419
}}}
}
Search results{"data": [{"fields": [{"label": "msgclassifier","type": "TEXT","id": "msgclassifier"},{"label": "className","type": "TEXT","id": "className"},
Administrating 415

{"label": "logsource","type": "TEXT","id": "logsource"}],"rows": [{"msgclassifier": "SRVE0250I","className": "com.ibm.ws.wswebcontainer.VirtualHost","logsource": "WASLogSource"},{"msgclassifier": "SECJ0136I","className": "com.ibm.ws.wswebcontainer.VirtualHost","logsource": "WASLogSource"}],"id": "AllErrors"},{"rows": [{"msgclassifier": "SRVE0242I","count": 132},{"msgclassifier": "CWPKI0003I","count": 3}],"fields": [{"label": "msgclassifier","type": "TEXT","id": "msgclassifier"},{"label": "count","type": "LONG","id": "count"}],"id": "termFacet01"
}]}
Using the REST API to administer the Log Analysis datamodel
You can use HTTP methods and the REST API to load, create, update, and deleteLog Analysis artifacts and batches of artifacts.
To load, create, update, and delete a batch of artifacts such as rule sets, file sets,source types, collections, and log sources, use a GET, POST, PUT, or DELETEmethod and the following URL:https://<server>:<port>/Unity/<Artifact>
where <server> is the machine that IBM Operations Analytics - Log Analysis isinstalled on. <port> is the port that you want to use for REST API requests on thesame machine. <Artifact> is the name of the artifact that you want to process, forexample rule sets.
416 IBM Operations Analytics - Log Analysis: Installation, Configuration, and Administration Guide

To load, create, update and delete a specific artifact, use a GET, POST, PUT, orDELETE method and the following URL:https://<server>:<port>/Unity/<Artifact>?id=<ruleset_id>
Read the following documentation to get more information about specific inputparameters and returned values.
Rule setsYou can use various HTTP methods to load, create, update, and delete rule sets.
Load (GET method)
To return all the rule sets, use a GET method and the following URL:https://<server>:<port>/Unity/RuleSets
To return a specific rule set, use a GET method and the following URL:https://<server>:<port>/Unity/RuleSets?id=<ruleset_id>
where <ruleset_id> is the ID of the rule set that you want to retrieve.
The operation returns the following values from the requested rule sets in thesimple JSON format:
Table 91. Returned value for rule sets
Returned value Description
rulesFileDirectoy Full path to the file that contains the rulesthat govern how the splitting and annotatingis done.
The rules must be written in the AnnotatedQuery Language (AQL) format.
type This parameter can have a value of 1 or 0.
0 means that the rule set is used forsplitting. 1 means that the rule set is usedfor annotation.
name The name of the rule set.
id The rule set identifier.
The operation returns the following value for a single rule set:{
"rulesFileDirectory": "/home/....;", (- AQL Path)"type": 1, (- 0 for Split 1 for Annotate)"name": "windowsOSEventsLS-Annotate","id": 3
}
Create (POST method)
To create a rule set, use a POST method and the following URL:https://<server>:<port>/Unity/RuleSets?
To specify the values for the rule set, define them in the HTTP message body inthe JSON format. The input values are listed in the table.
Administrating 417

Table 92. Input values for POST method
Input parameter Description
rulesFileDirectoy Enter the AQL path.
type This parameter can have a value of 1 or 0.
0 means that the rule set is used forsplitting. 1 means that the rule set is usedfor annotation.
name The name of the rule set.
The specification for the new rule set is defined in the input JSON. For example:{
"name": "Test","type": 0, (- 0 for Split 1 for Annotate)"rulesFileDirectory": "/home/....;" (- AQL Path)
}
Update (PUT method)
To update a rule set, use a PUT method and the following URL:https://<server>:<port>/Unity/RuleSets
To specify the values for the rule set, define them in the HTTP message body inthe JSON format. The input values are the same as those values listed in table 2.
The input JSON is the same as that which is used for the POST method.
Delete (DELETE method)
To delete a rule set, use a DELETE method and the following URL:https://<server>:<port>/Unity/RuleSets
File setsYou can use various HTTP methods to load, create, update, and delete file sets.
Return file sets (GET method)
To return all the file sets, use a GET method and the following URL:https://<server>:<port>/Unity/FileSets
To return a specific file set, use a GET method and the following request:https://<server>:<port>/Unity/FileSets?id=<fileset_id>
where <fileset_id> is the ID of the file set that you want to retrieve.
The operation returns the following values from the requested file sets in thesimple JSON format:
Table 93. Returned values for file sets
Returned value Description
className The name of the Java class that is used bythe file set.
418 IBM Operations Analytics - Log Analysis: Installation, Configuration, and Administration Guide

Table 93. Returned values for file sets (continued)
Returned value Description
fileType This parameter value can be either 0 or 1. 0means that the file set is Java-based. 1indicates that the file set is Python-based.
fileName The name of the file that contains the codethat does the splitting or annotating.
type This parameter value can be either 0 or 1. 0means that the file is used to split log files. 1indicates that the file set is used to annotatelog files.
name The name of the file set.
id The file set identifier.
For example, the operation returns the following values in the JSON format for afile set:{
"className": "com.ibm.tivoli..annotator.JavacoreAnnotator","fileType": 0, (- 0 for Java 1 for Script)"fileName": "JavacoreExtractor_v1.1.0.1.jar","type": 1, (- 0 for Split 1 for Annotate)"name": "Javacore-Annotate","id": 2
}
Create (POST method)
To create a file set, use a POST method and the following URL:https://<server>:<port>/Unity/FileSets
You define the parameter values in the JSON format in the HTTP message body.For example:{
"name": "Test","type": 0, (- 0 for Split 1 for Annotate)"fileType": 0, (- 0 Java 1 for Script)"fileName": "db2-content.jar", (- Jar file name"className": "TestClass" (- Java Class name)
}
The input values are the same as the ones that are specified in table 1 except forid. This value is generated when the file set is created.
Update (PUT method)
To update a file set, use a PUT method and the following URL:https://<server>:<port>/Unity/FileSets
You define the parameter values in the JSON format in the HTTP message body.The input values are the same as the ones that are specified in table 1 except forid. This value is generated when the file set is created.
Administrating 419

Delete (DELETE method)
To delete a file set, use a DELETE method and the following URL:https://<server>:<port>/Unity/FileSets?id=<fileset_id>
where <fileset_id> is the ID of the file set that you want to delete.
Source typesYou can use various HTTP methods to load, create, update, and delete sourcetypes.
Load (GET method)
To load a source type, use a GET method and the following URL:https://<server>:<port>/Unity/SourceTypes
To load a single source type, use a GET method and the following URL:https://<server>:<port>/Unity/SourceTypes?id=<sourcetype_id>
where <sourcetype_id> is the identifier of the source type that you want to load.
The possible input values are described in the table:
Table 94. GET method parameters
Parameter Description
indexingConfig Enter the valid index configuration for theJSON file.
inputType Specify the type of file that is loaded. 0,denoting log file, is the only possible value.
splitter:fileSet Specify the file set that the splitter uses tosplit log files.
splitter:ruleSet Specify the rule set that the splitter uses tosplit log files.
splitter:type Specify the type of splitter that is used. 0means that the file is used for splitting logfiles. 1 means that the file is used forannotating log files.
name Specify the name of the source type that youwant to create.
id Specify the identifier of the source type thatyou want to load.
annotator:fileSet Specify the file set that the annotator uses toannotate log files.
annotator:ruleSet Specify the rule set that the annotator usesto annotate log files.
annotator:type Specify the type of annotator that is used. 0means that the file is used for splitting logfiles. 1 means that the file is used forannotating log files.
annotator:postOnFailure Specify whether you want to annotator topost results if the annotation process fails.The default value is false.
420 IBM Operations Analytics - Log Analysis: Installation, Configuration, and Administration Guide

You define the parameter values in the JSON format in the HTTP message body.For example:{
"indexingConfig": {}, - Valid index configuration JSON"inputType": 0, - 0 for log file"splitter": {
"fileSet": <fileset_id>,"ruleSet": <ruleset_id>,"type": 1 - 0 for Split 1 for Annotate
},"name": "Javacore","id": <id>,"annotator": {
"fileSet": <fileset_id>,"ruleSet": <ruleset_id>,"type": 1, - 0 for Split 1 for Annotate"postOnFailure": false
}}
Create (POST method)
To create a source type, use a POST method and the following URL:https://<server>:<port>/Unity/SourceTypes
You define the parameter values in the JSON format in the HTTP message body.The values are the same as the ones that are listed in table 1. For example:{
"name": "Test","indexingConfig": {}, - Valid index configuration JSON"inputType": 0, - 0 for log file"splitter": {
"ruleSet": <ruleset_id>,"fileSet": <fileset_id>},"annotator": {"ruleSet": <ruleset_id>,
"fileSet": <fileset_id>,"postOnFailure": true
}}
Update (PUT method)
To update a source type, use a PUT method and the following URL:https://<server>:<port>/Unity/SourceTypes?id=<sourcetype_id>
where <sourcetype_id> is the identifier of the source type that you want to update.
You define the parameter values in the JSON format in the HTTP message body.The values are the same as the ones that are listed in table 1. The input JSON isthe same as that described for POST method.
Delete (DELETE method)
To delete a source type, uses a DELETE method and the following URL:https://<server>:<port>/Unity/SourceTypes?id=<sourcetype_id>
where <sourcetype_id> is the identifier of the source type that you want to delete.
CollectionsYou can use various HTTP methods to load, create, update, and delete collections.
Administrating 421

Load (GET methods)
To load a single collection, use a GET method and the following URL:https://<server>:<port>/Unity/Collections
To return a specific collection, use a GET method and the following URL:https://<server>:<port>/Unity/Collections?id=<collection_id>
where <collection_id> is the ID of the collection that you want to retrieve.
The method returns the information in the JSON format. The returned values arelisted in the table.
Table 95. Parameters for GET method
Parameter Description
indexingConfig The valid index configuration value for theJSON file.
sourceType The source type ID of the returnedcollection.
name The name of the returned collection.
id The identifier of the returned collection.
annotator This parameter value can be either 0 or 1. 0means that the source type is used to splitlog files. 1 indicates that the source type isused to annotate log files.
For example:{
"indexingConfig": null,"sourceType": 15,"name": "Javacore-Collection1","id": 1,"annotator": 0
}
Create (POST method)
To create a collection, use the POST method and the following URL:https://<server>:<port>/Unity/Collections
You define the parameter values in the JSON format in the HTTP message body.The parameter values are:
Name Specify the name for the collection.
sourceTypeSpecify the number that represents the new source type.
For example:{
"name": "Test","sourceType": 6
}
422 IBM Operations Analytics - Log Analysis: Installation, Configuration, and Administration Guide

Update (PUT method)
To update a collection, use a PUT method and the following URL:https://<server>:<port>/Unity/Collections?id=<collection_id>
where <collection_id> is the identifier of the collection that you want to update.
You define the updated parameter values in the JSON format in the HTTP messagebody. The parameter values and input JSON are the same as those that are used bythe POST method.
Delete (DELETE method)
To delete a collection, use a DELETE method and the following URL:https://<server>:<port>/Unity/Collections?id=<collection_id>
where <collection_id> is the identifier of the collection that you want to delete.
Log sourcesYou can use various HTTP methods to load, create, update, and delete datasources.
Data sources are called log sources in the REST API files.
Load (GET method)
To load all the data sources and associated tags, use a GET method and thefollowing URL:https://<server>:<port>/Unity/Logsources/ChildTags
The data sources are returned in a JSON array. The returned values for each datasource are listed in the table.
Table 96. Returned values for GET method
Parameter Description
type Identifies whether the entry is a tag or a logsource.
name The name of the tag or log source.
id The ID of the tag. This only applies to tags.
logsource_pk The ID of the log source. This only appliesto log sources.
For example:[
{"type": "tag","name": "day trader","id": <tag id>
},{
"type": "logSource","logsource_pk": <logsource id>,
Administrating 423

"name": "WASLS04"}.....
]
To list all the data sources and tags that are defined beneath a specified tag, usethe following URL:https://<server>:<port>/Unity/Logsources/ChildTags?tag_id=<tag_id>
where <tag_id> is the ID of the tag that you want to specify.
This method returns an array in the JSON format that is the same as that returnedfor the previous method.
To load the data sources and tags for a specific data source name, use thefollowing URL:https://<server>:<port>/Unity/Logsources?name=<logsource_name>
where <logsource_name> is the name of the log source that you want to load.
You can also use the log source ID to specify the data source:https://<server>:<port>/Unity/Logsources?logsource_pk=<logsource_id>
where <logsource_id> is the identifier of the log source that you want to load.
Both of these methods return the data source and tag information as a JSON file.The returned values are listed in the table.
Table 97. Returned values for GET method (single log source)
Parameter Description
log_path The full path and log file name.
tag_id The identifier for any tags that areassociated with the data source.
userid The identifier for the user who created thedata source.
time_format The time format used by the data source.
name The name of the data source.
state The status of the data source.
hostname The host name that is specified when thedata source is created. This value is eitherlocal, that is the same as the machine whereIBM Operations Analytics - Log Analysis isinstalled or it is remote, that is different tothe machine where IBM OperationsAnalytics - Log Analysis is installed.
rolling_pattern Identifies whether the data source usesrolling patterns for log files. NULL signifiesthat rolling pattern log files are not used.
encrypted_password The encrypted password for the specifieduser ID.
config_type The type of data source. This can be local,remote or custom.
collectionId The identifier of the associated collection.
424 IBM Operations Analytics - Log Analysis: Installation, Configuration, and Administration Guide

Table 97. Returned values for GET method (single log source) (continued)
Parameter Description
group The name of the group that is associatedwith the data source, if any.
logsource_pk The log source ID.
description The description entered during log sourcecreation.
For example:{
"log_path": "/home/...../SystemOut.log","tag_id": <tag id>,"userid": <user id>,"time_format": "","name": "WASLS01","state": 0,"hostname": "nc9118041071","rolling_pattern": null,"encrypted_password": null,"config_type": "custom","collectionId": <collection id>,"service_topology": "","logsource_pk": <logsource id>,"description": ""
}
Create (POST method)
To create a new data source, use a POST method and the following URL:https://<server>:<port>/Unity/DataSourceConfig
You define the parameter values in the JSON format in the HTTP message body.The input parameters are listed in the table.
Table 98. Input parameters for POST method
Parameter Description
config_type The type of data source. This can be local,remote, or custom.
hostname The host name of the machine where thedata that the data source collects resides.
userid The user name that is associated with thedata source. This parameter is optional.
encrypted_password The password that is associated with theuser name. This parameter is optional.
datasourcepath The full path and log file name of the logfile that is loaded by this data source.
sourceType The identifier of the source type that isassociated with the data source.
rollingfile If you want to use the data source to collectrolling log files, set this parameter to True. Ifyou do not, set it to False.
filepattern The file pattern that is associated with thedata source. This parameter is optional.
Administrating 425
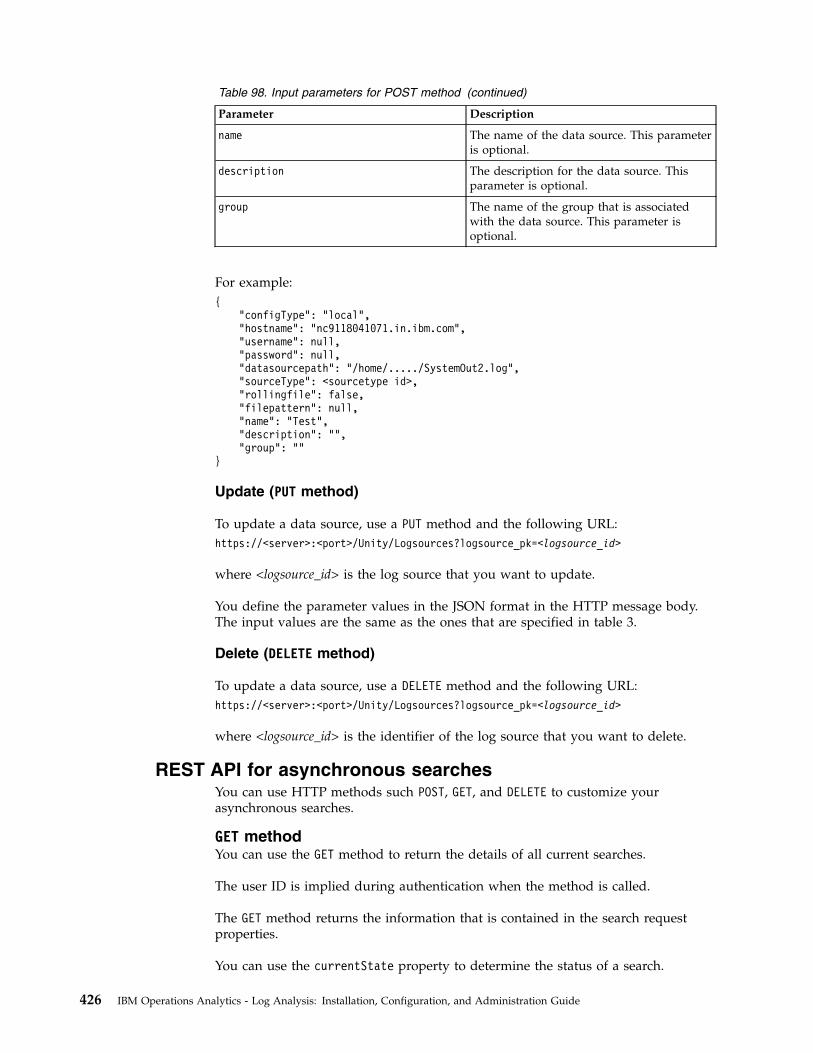
Table 98. Input parameters for POST method (continued)
Parameter Description
name The name of the data source. This parameteris optional.
description The description for the data source. Thisparameter is optional.
group The name of the group that is associatedwith the data source. This parameter isoptional.
For example:{
"configType": "local","hostname": "nc9118041071.in.ibm.com","username": null,"password": null,"datasourcepath": "/home/...../SystemOut2.log","sourceType": <sourcetype id>,"rollingfile": false,"filepattern": null,"name": "Test","description": "","group": ""
}
Update (PUT method)
To update a data source, use a PUT method and the following URL:https://<server>:<port>/Unity/Logsources?logsource_pk=<logsource_id>
where <logsource_id> is the log source that you want to update.
You define the parameter values in the JSON format in the HTTP message body.The input values are the same as the ones that are specified in table 3.
Delete (DELETE method)
To update a data source, use a DELETE method and the following URL:https://<server>:<port>/Unity/Logsources?logsource_pk=<logsource_id>
where <logsource_id> is the identifier of the log source that you want to delete.
REST API for asynchronous searchesYou can use HTTP methods such POST, GET, and DELETE to customize yourasynchronous searches.
GET methodYou can use the GET method to return the details of all current searches.
The user ID is implied during authentication when the method is called.
The GET method returns the information that is contained in the search requestproperties.
You can use the currentState property to determine the status of a search.
426 IBM Operations Analytics - Log Analysis: Installation, Configuration, and Administration Guide

Request values
Table 1 outlines the values that you must specify in the request.
Table 99. Request values for GET
Name Type Default value Description
Size Number 30 Indicates themaximum number ofrecords that arereturned. To returnall records, specify-1.
Start Number 0 Index number for thefirst record that isreturned.
Returned values
Table 2 outlines the values that are returned by the function.
Table 100. Returned values for GET
Attribute Description
currentState Returns the status of a search. Possiblevalues are QUEUED, PARSING, RUNNING, PAUSED,FINALIZING, FAILED, DONE.
completionProgress A number from 1 - 100 that indicates anapproximation of the progress of the search.
isDone Indicates that the search is finished.
isFailed Indicates that the search failed with anunrecoverable error. For example, if thesearch string uses an incorrect syntax.
isPaused Indicates that the search is paused.
messages Contains the error and debugging messagesthat are generated during the search.
priority A number from 1 - 10 that indicates thepriority of the search.
searchRequest Lists the JSON file that is used to define thesearch.
POST methodYou can use the POST method to start a search and return the search request ID.
You use the search parameter to specify a JSON file. The file specifies a searchquery that contains information about the search string, time filter, facets, andmore.
The function returns the search request ID. You can add these amendments to thesearch URL to view and manage the search. Table 1 outlines these amendments.
Table 101. Search URL amendments
URL amendment Description
search/<search_request_ID> View the status of the search request.
Administrating 427
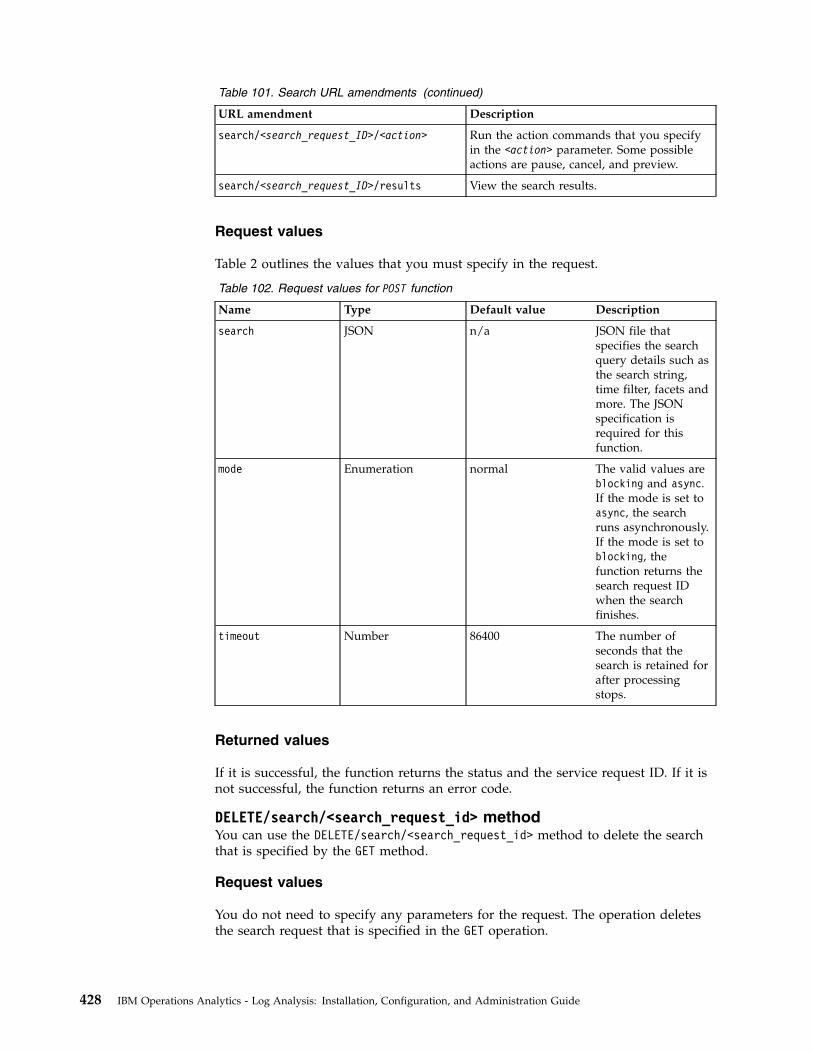
Table 101. Search URL amendments (continued)
URL amendment Description
search/<search_request_ID>/<action> Run the action commands that you specifyin the <action> parameter. Some possibleactions are pause, cancel, and preview.
search/<search_request_ID>/results View the search results.
Request values
Table 2 outlines the values that you must specify in the request.
Table 102. Request values for POST function
Name Type Default value Description
search JSON n/a JSON file thatspecifies the searchquery details such asthe search string,time filter, facets andmore. The JSONspecification isrequired for thisfunction.
mode Enumeration normal The valid values areblocking and async.If the mode is set toasync, the searchruns asynchronously.If the mode is set toblocking, thefunction returns thesearch request IDwhen the searchfinishes.
timeout Number 86400 The number ofseconds that thesearch is retained forafter processingstops.
Returned values
If it is successful, the function returns the status and the service request ID. If it isnot successful, the function returns an error code.
DELETE/search/<search_request_id> methodYou can use the DELETE/search/<search_request_id> method to delete the searchthat is specified by the GET method.
Request values
You do not need to specify any parameters for the request. The operation deletesthe search request that is specified in the GET operation.
428 IBM Operations Analytics - Log Analysis: Installation, Configuration, and Administration Guide

Response codes
The two possible response codes are outlined in table 1.
Table 103. Response codes
Status code Description
200 Search deleted successfully.
404 The search request does not exist.
Returned values
The operation returns the same values as the GET operation. For more information,see “GET method” on page 426.
GET/search/<search_request_id> methodYou can use the GET/search/<search_request_id> method to return details aboutthe search request that is associated with the user who runs the call.
The method returns information about the search request properties such as thetime taken to complete the search.
The parameters to POST /search provides details on search request propertieswhen creating a search.
Request values
There are no request values as the operation uses the user ID of the user who runsthe operation to identify the search request ID.
Response codes
The response codes are outlined in table 1.
Table 104. Response codes
Status code Description
200 Search request was retrieved successfully.
403 Cannot retrieve search request. User doesnot have the authorization to view thesearch request.
404 The search request does not exist.
Return values
The operation also returns a JSON file that contains information about the searchrequest.
POST/search/<search_request_id>/action methodYou can use the POST/search/<search_request_id>/action method to request anaction for a specific search request.
Administrating 429

Request values
Table 1 outlines the request values that you can use with this operation.
Table 105. Request values
Name Type Default Description
name Enumeration n/a The action that iscarried out. Validvalues are pause,unpause, cancel,setpriority
The following values are valid for the name request:
pause Suspends the current search.
unpauseResumes the current search if it is paused.
cancel Stops the current search and deletes the cached results.
setprioritySets the priority of the search request. This value can be any value from 1 -10.
Response codes
The response codes are outlined in table 2.
Table 106. Response codes
Status code Description
200 Search updated successfully.
403 User does not have the authorization that isrequired to edit the search request.
404 The specified search request does not exist.
Returned values
The operation returns the status of the search request and any related messages.
GET/search/<search_request_id>/results methodYou can use the GET/search/<search_request_id>/results method to return theresults of the specified service request at the time the request is made.
Response codes
The response codes are outlined in table 1.
Table 107. Response codes
Status code Description
200 Results that are returned successfully.
204 Search exists but the search results are notready. Run the request again.
430 IBM Operations Analytics - Log Analysis: Installation, Configuration, and Administration Guide

Table 107. Response codes (continued)
Status code Description
403 User does not have the authorization that isrequired to display the specified searchrequest.
404 The specified search request does not exist.
Returned values
The request returns the status and the related values. For example, a successfulrequest returns the JSON file that contains the search results and related facets.
Administrating 431

432 IBM Operations Analytics - Log Analysis: Installation, Configuration, and Administration Guide

Loading and streaming data
Before you can perform a search on log or other data, you must first load the datainto IBM Operations Analytics - Log Analysis. When the file is loaded the data isindexed and is then available to be searched.
There are two main scenarios for loading data:v Batch loading historic data. For example, you may want to ingest historic log
data in a single batch for analysis or for testing.v Streaming data from a monitored application. You may want to load data that is
streamed from a local or remote server.
You can load or stream data from local or remote servers. However, each tool isdesigned for a particular scenario. This is explained in the Intended uses of dataloading components table. IBM Operations Analytics - Log Analysis is installed withan internal version of the IBM Tivoli Monitoring Log File Agent. However, IBMOperations Analytics - Log Analysis can also load data from a separate installationof the IBM Tivoli Monitoring Log File Agent, known as an external IBM TivoliMonitoring Log File Agent.
Table 108. Intended uses of data loading components
Load batch of historic data Stream data
Component Local Remote Local Remote
Data Collectorclient
Yes Yes No No
Internal IBMTivoliMonitoring LogFile Agent
Yes Yes Yes Yes
External IBMTivoliMonitoring LogFile Agent
Yes Yes Yes Yes
logstash Yes Yes Yes Yes
Generic Receiver Yes Yes No No
Note: You must create a Data Source before you configure data loading. Forinformation about creating a Data Source, see the Data source creation topic.You can load log data into IBM Operations Analytics - Log Analysis using anumber of different methods:
Data Collector clientUse the Data Collector client to ingest data in batch mode. This is theeasiest method if you want to ingest a large log file for historic analysis ifyou want to test your IBM Operations Analytics - Log Analysisconfiguration before attempting the more complex IBM Tivoli MonitoringLog File Agent configuration. The Data Collector client is not designed foringesting data from remote sources. If you want to ingest a batch ofhistorical data from a remote source, use the IBM Tivoli Monitoring LogFile Agent.
© Copyright IBM Corp. 2015 433

For a video that demonstrates how to batch upload a WebSphereApplication Server or DB2 file using the Data Collector client, see ITOAvideos. For information about batch uploading alternative log file typessuch as Oracle alert logs, see Batch uploading Oracle Alert logs.
IBM Tivoli Monitoring Log File AgentUse the IBM Tivoli Monitoring Log File Agent for scenarios where youwant to stream log data from your production environment or to streamdata from a remote server.
For a video that demonstrates how to upload a WebSphere ApplicationServer or DB2 file using the IBM Tivoli Monitoring Log File Agent, seeITOA videos.
logstashlogstash can be used as a method to collect and load data into IBMOperations Analytics - Log Analysis.
Generic ReceiverUse the Generic Receiver to load data from the REST interface into IBMOperations Analytics - Log Analysis.
You cannot use IBM Operations Analytics - Log Analysis to index log records thatcontain non-ASCII characters. If your log records contain non-ASCII characters, therecords are not added when you use the IBM Tivoli Monitoring Log File Agent orthe Data Collector client. When you use the Data Collector client errors that relateto non-ASCII characters are added to the Generic Receiver log.
Example scenarios
The following table outlines a number of example scenarios to help illustrate howyou use the different components for different scenarios.
Table 109. Example data loading scenarios
Example Component
I want to load a batch of historic log data totest the environment.
Data Collector client
I want to monitor an application on aremote server.
IBM Tivoli Monitoring Log File Agent
I want to use logstash to monitor log files ona remote server.
logstash
I want to load a batch of historic log data inthe JSON format.
Generic Receiver
Supported operating systems
The supported operating systems that you can install IBM Operations Analytics -Log Analysis are listed in the Installing Guide. In addition to these, you also needto know what operating systems are supported by the data streaming and loadingscenarios. For example, if you want to use the internal to stream data from aremote source, you need to know the supported operating systems.
434 IBM Operations Analytics - Log Analysis: Installation, Configuration, and Administration Guide
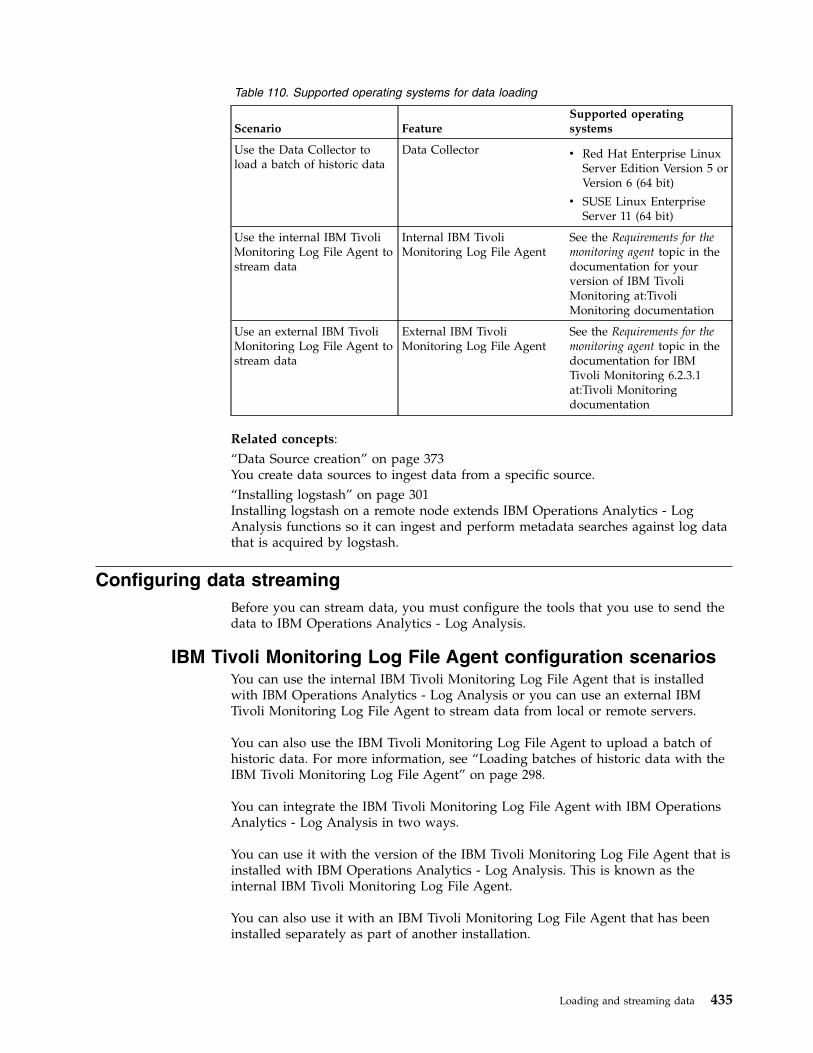
Table 110. Supported operating systems for data loading
Scenario FeatureSupported operatingsystems
Use the Data Collector toload a batch of historic data
Data Collector v Red Hat Enterprise LinuxServer Edition Version 5 orVersion 6 (64 bit)
v SUSE Linux EnterpriseServer 11 (64 bit)
Use the internal IBM TivoliMonitoring Log File Agent tostream data
Internal IBM TivoliMonitoring Log File Agent
See the Requirements for themonitoring agent topic in thedocumentation for yourversion of IBM TivoliMonitoring at:TivoliMonitoring documentation
Use an external IBM TivoliMonitoring Log File Agent tostream data
External IBM TivoliMonitoring Log File Agent
See the Requirements for themonitoring agent topic in thedocumentation for IBMTivoli Monitoring 6.2.3.1at:Tivoli Monitoringdocumentation
Related concepts:“Data Source creation” on page 373You create data sources to ingest data from a specific source.“Installing logstash” on page 301Installing logstash on a remote node extends IBM Operations Analytics - LogAnalysis functions so it can ingest and perform metadata searches against log datathat is acquired by logstash.
Configuring data streamingBefore you can stream data, you must configure the tools that you use to send thedata to IBM Operations Analytics - Log Analysis.
IBM Tivoli Monitoring Log File Agent configuration scenariosYou can use the internal IBM Tivoli Monitoring Log File Agent that is installedwith IBM Operations Analytics - Log Analysis or you can use an external IBMTivoli Monitoring Log File Agent to stream data from local or remote servers.
You can also use the IBM Tivoli Monitoring Log File Agent to upload a batch ofhistoric data. For more information, see “Loading batches of historic data with theIBM Tivoli Monitoring Log File Agent” on page 298.
You can integrate the IBM Tivoli Monitoring Log File Agent with IBM OperationsAnalytics - Log Analysis in two ways.
You can use it with the version of the IBM Tivoli Monitoring Log File Agent that isinstalled with IBM Operations Analytics - Log Analysis. This is known as theinternal IBM Tivoli Monitoring Log File Agent.
You can also use it with an IBM Tivoli Monitoring Log File Agent that has beeninstalled separately as part of another installation.
Loading and streaming data 435

You can use local and remote versions of both types of IBM Tivoli Monitoring LogFile Agent.
The following graphic illustrates these possibilities:
The following possible scenarios are illustrated in the graphic:
1. Internal IBM Tivoli Monitoring Log File Agent on a local serverIn this scenario, you use the version of the IBM Tivoli Monitoring Log FileAgent that is installed with IBM Operations Analytics - Log Analysis toload data from the local installation of IBM Tivoli Monitoring to IBMOperations Analytics - Log Analysis.
2. External IBM Tivoli Monitoring Log File Agent on a local serverIn this scenario, you use a version of the IBM Tivoli Monitoring Log FileAgent that was not installed with IBM Operations Analytics - Log Analysisbut that is installed on the same server as IBM Operations Analytics - LogAnalysis.
3. External IBM Tivoli Monitoring Log File Agent on a remote serverIn this scenario, you use an installation of an external IBM TivoliMonitoring Log File Agent to push data to IBM Tivoli Monitoring Log FileAgent. To facilitate this integration, you modify the properties of the IBMTivoli Monitoring Log File Agent.
4. Remote instance of the internal IBM Tivoli Monitoring Log File AgentIn this scenario, you use a the remote installer tool to install a remoteinstance of the internal IBM Tivoli Monitoring Log File Agent.
The following table summarizes the different configurations required for thescenarios.
436 IBM Operations Analytics - Log Analysis: Installation, Configuration, and Administration Guide

Table 111. Configuration for data streaming scenarios
Data streamingscenario
IBM TivoliMonitoring Log FileAgent type Log file location
Required parametersin .conf file
1 Internal and local Local Datasources
2 Internal and remote.You use the remoteinstaller to create theremote instance.
Remote Datasources,ServerLocation,ServerPort,BufEvtMaxSize.
3 Local and external Local Datasources
4 Remote and external Remote Datasources,SshAuthType,SshHostList,SshPassword, SshPort,SshPrivKeyfile,SshPubKeyfile,SshUserid.
Specifying the configuration and format filesBefore you use an internal or external LFA, you may want to modify theconfiguration and format files.
About this task
For more information about how configuration and format files are used, see “LFAconfiguration and format files” on page 263.
For more information about the required parameters in the configuration file, see“Configuration file parameters” on page 230.
Procedure1. Open the configuration file that you want to use.2. Define the required parameters in the configuration file. The required
parameters are different depending on the data loading scenario.v To stream data from a local server, specify the data sources in the
DataSources parameter.v To push data from a remote directory, you must specify values for the
Datasources, ServerLocation, ServerPort, and BufEvtMaxSize parameter.v To use an external IBM Tivoli Monitoring Log File Agent that is not installed
as part of IBM Operations Analytics - Log Analysis, you must specify valuesfor the Datasources, SshAuthType, SshHostList, SshPassword, SshPort,SshPrivKeyfile, SshPubKeyfile, and SshUserid parameters.
3. Define the format file as required.4. (Optional) If you want to monitor log files type where the log files rotate
resulting in multiple log files, update the .fmt file for each rotating log type toallow for the appropriate name change. Open the .fmt file, and edit the line:-file FILENAME
to reflect the file name rotation. For example, for SystemOut log files where anumber is appended to the file name for each additional log, the FILENAME mustread:-file SystemOut*.log
Loading and streaming data 437

5. Save your changes.
Example
For example:===============SshHostList=host1,host2,host3SshUserid=loguserSshAuthType=PASSWORDSshPassword=<password>
=====================SshHostList=host1,host2,host3SshUserid=loguserSshAuthType=PUBLICKEYSshPrivKeyfile = <SshUserid_Private_Key_File_Path>(Or)SshPubKeyfile = <SshUserid_Private_Key_File_Path>
======================
where <password> is the password that you want to use.
<SshUserid_Private_Key_File_Path> is the full path for the file that contains theprivate key of the user that is specified in the SshUserid user. For example, if yousave the password to a file called password.txt in the <HOME>/utilities directory,the full path is as follows:SshPrivKeyfile = <HOME>/utilities/password.txt
LFA configuration and format files:
If you use an internal or external LFA, you can edit the configuration and propertyfiles to suit your specific installation.
The LFA configuration for a particular data source is defined in the following files:v A <name>.conf file that contains the properties that are used by the LFA for
processing the log files.v A <name>.fmt file that contains an expression and format that is used by the
agent to identify matching log file records and to identify the properties toinclude in the Event Integration Format (EIF) record. The EIF is sent from theagent to the receiving server. The receiving server is the server where the LogAnalysis server is installed. The <name>.fmt file uses a regular expression todetermine matching records in the log file and to send each matching record tothe LFA server in an EIF event.
If you want to use the LFA to send your log files to the LFA server, you mustcustomize the regular expression and define your own stanza in the <name>.fmtfile to capture the log records that are to be sent. The event record format mustinclude the host name, file name, log path, and text message. The LFA server usesthese values to process the logs. For more information about the IBM Tivoli 6.3 LogFile Agent and the configuration files and properties, see Tivoli Log File AgentUser's Guide.
The file names must be identical for both files. For example,WASContentPack_v1.1.0-lfawas.conf and WASContentPack_v1.1.0-lfawas.fmt.
438 IBM Operations Analytics - Log Analysis: Installation, Configuration, and Administration Guide

After you modify the configuration files as required, you use the LFA to load thedata into LFA. For a general description of how to do this, see “Loading a batch oflog files with the LFA” on page 274
If you use an external instance of the LFA to load data into the Log Analysisserver, you must install the configuration files into the agent. This configurationensures that the agent knows where the log files for a data source are located, howto process the records in the log file, and the server to which records are sent.
LFA configuration file examples
The following example shows the files that are installed as part of the WebSphereInsight Pack that is included as standard with Log Analysis.
The WASContentPack_v1.1.0-lfawas.conf file contains many properties, includingthe following examples:# Files to monitor. The single file /tmp/regextest.log, or any file like/tmp/foo-1.log or /tmp/foo-a.log.
LogSources=/home/unityadm/IBM/LogAnalysis/logsources/WASInsightPack/*
# Our EIF receiver host and port.ServerLocation=<EIF Receiver host name>ServerPort=5529
The WASContentPack_v1.1.0-lfawas.fmt file contains the following regularexpression that matches any record within a monitored log file. In this example,the regular expression matches all the log records in the file and to the OperationsAnalytics server as an EIF event. The EIF event contains the host name where theagent is running, the file name of the log file, the log file path of the log file, andthe log file record itself.// Matches records for any Log file:
//
REGEX AllRecords(.*)hostname LABEL-file FILENAMElogpath PRINTF("%s",file)text $1END
Configuration file parameters:
The IBM Tivoli Monitoring Log File Agent uses the information that is specified inthe configuration file to process log file information.
Table 1 explains that parameters that you can modify in this file.
Table 112. Parameter summary
Parameter Description
DataSources Specify the data source that you want tomonitor. If you are specifying multiple datasources, they must be comma-separated andwithout spaces. When you configure aremote directory in the LFA conf file, thedirectory you specify must not contain anysubdirectories.
Loading and streaming data 439

Table 112. Parameter summary (continued)
Parameter Description
SshAuthType You must set this value to either PASSWORD orPUBLICKEY.
If you set this value to PASSWORD, IBMOperations Analytics - Log Analysis uses thevalue that is entered for SshPassword as thepassword for Secure Shell (SSH)authentication with all remote systems.
If you set this value to PUBLICKEY, IBMOperations Analytics - Log Analysis uses thevalue that is entered for SshPassword as passphrase that controls access to the private keyfile.
SshHostList You use the SshHostList value to specify thehosts where the remotely monitored log filesare generated. IBM Operations Analytics -Log Analysis monitors all the log files thatare specified in the LogSources orRegexLogSources statements in each remotesystem.
If you specify the local machine as a valuefor this parameter, the LFA monitors the filesdirectly on the local system. If you specifythat the localhost SSH is not used to accessthe files on the system, IBM OperationsAnalytics - Log Analysis reads the filesdirectly.
SshPassword If the value of the SshAuthType parameter isPASSWORD, enter the account password for theuser that is specified in the SshUseridparameter as the value for the SshPasswordparameter.
If the value of the SshAuthType parameter isPUBLICKEY, enter the pass phrase thatdecrypts the private key that is specified inthe SshPrivKeyfile parameter.
SshPort You specify the TCP port that is used forSSH connections. If you do not enteranything, this value is defaulted to 22.
SshPrivKeyfile If the value of the SshAuthType parameter isset to PUBLICKEY, enter the directory path tothe file that contains the private key of theuser that is specified in the SshUseridparameter as the value for this parameter.
If the value of the SshAuthType parameter isnot set to PUBLICKEY, this value is notrequired.
440 IBM Operations Analytics - Log Analysis: Installation, Configuration, and Administration Guide

Table 112. Parameter summary (continued)
Parameter Description
SshPubKeyfile If the value of the SshAuthType parameter isset to PUBLICKEY, enter the directory path tothe file that contains the public key of theuser that is specified in the SshUseridparameter as the value for this parameter.
If the value of the SshAuthType parameter isnot set to PUBLICKEY, this value is notrequired.
SshUserid Enter the user name from the remote systemthat the agent uses for SSH authentication.
Configuring and deploying LFAs in the command lineYou can use the command line to configure and deploy LFAs.
Before you begin
Before you can configure and deploy an LFA. You need to create the configurationand format files.
For more information about how configuration and format files are used, see “LFAconfiguration and format files” on page 263.
For more information about the required parameters in the configuration file, see“Configuration file parameters” on page 230.
About this task
CAUTION:
You cannot use non-ASCII characters in the installation path. The installationpath cannot exceed 80 characters.
For more information, about this and about how to configure the monitoring agentin step 3 see:
Configuring the monitoring agent
Procedure1. To configure the LFA, run the command:
./itmcmd config -A pc
where pc is the product code for your agent. For example: ./itmcmd config –Alo.
2. You are prompted to supply the following information:
Enter instance name (default is: ):Enter the instance name. For example, rhelagent.
Conf file (default is: ):Enter the configuration file path. For example, /unity/IBM/ITM/config/lo/.
Loading and streaming data 441

Format File (default is: ):Enter the format file path. For example, /unity/IBM/ITM/config/lo/.
Note: All fields must be completed. Blank fields can cause the LFA to fail.3. Where prompted, provide the monitoring agent configuration information.4. To start the LFA, run the command
./itmcmd agent -o instance name start lo
Configuring a remote LFA to stream dataIf you use a LFA that is installed on a remote server to stream data to IBMOperations Analytics - Log Analysis, you must update the configuration andformat files for the LFA.
Before you begin
You must create a custom data source before you configure data loading. Forinformation about creating a data source, see “Data Source creation” on page 373.
About this task
You can use the configuration files in the <HOME>/IBM-LFA-6.30/config/lo directoryas a basis for the configuration files on your remote server. However, you mustensure that the configuration files that you create:v contain a line separator between each property that you define in the .conf file.v use the .conf file extension and that the format file uses the .fmt extension.
To enable the LFA configuration, complete the following procedure:
Procedure1. Specify a value or values for the DataSources property. If you have multiple
locations, you can list the locations and use a comma as a separator. Ensurethat you do not leave any spaces. For example, you specify the followingvalues to represent two data sources:DataSources=/opt/IBM/WAS1/logs/SystemOut.log,/opt/IBM/WAS2/logs/SystemOut.log
When you create a data source for a remote server, you must enter the correctversion of the host name for that server. To find the correct host name, run thefollowing command on the remote server:uname -a
Enter the name that is returned by this command in the host name parameterfor the data source.
2. Specify the server location for the EIF receiver server. For example, for a serverthat is at 111.222.333.444, specify the following value:ServerLocation=111.222.333.444
3. Specify the port that the EIF receiver uses. For example:ServerPort=5529
4. Specify the BufEvtPath for the LFA. The cached events are stored in this file.For example:BufEvtPath=/opt/IBM/LogAnalysis/logs/lfa-WASInsightPack.cache
5. Specify the maximum buffer size for the LFA. This parameter is the maximumsize that the cache is allowed to be. If the cache is full, events are dropped andperformance can decline. The value that you enter here is in kilobytes. Forexample:
442 IBM Operations Analytics - Log Analysis: Installation, Configuration, and Administration Guide

BufEvtMaxSize=102400
6. (Optional) If you want to monitor log files type where the log files rotateresulting in multiple log files, update the .fmt file for each rotating log type toallow for the appropriate name change. Open the .fmt file, and edit the line:-file FILENAME
to reflect the file name rotation. For example, for SystemOut log files where anumber is appended to the file name for each additional log, the FILENAME mustread:-file SystemOut*.log
7. Save your changes.
What to do next
Allow time for the log data to be loaded and then search for a value that iscontained in your log file to validate that the configuration is correct.
Configuring LFA subnodesCreate an LFA subnode to group an explicit set of configurations that the LFA usesto identify and process a log event.
About this task
The subnode consists of a format (.fmt) file and a configuration (.conf) file. Asingle instance of the LFA can have multiple subnodes. Each subnode behaves likea single thread that is running in the same instance of the LFA.
You can create subnodes for the following use cases:
Improve performance by making generic format settings more specificTo improve overall performance, you can create specific configurations toreplace more generic ones. For example, you can specify the same regularexpression (REGEX) in a generic .fmt file to parse both WebSphereApplication Server (WAS) and DB2 log files. However, as the content of thelog files differs, this operation can become inefficient. To improveperformance, replace the single .fmt files with two new files that containtwo specific REGEXs for WAS and DB2 in two new subnodes.
Improve performance by making generic configuration settings more specificSimilarly, you can improve performance by replacing genericconfigurations with more specific ones. For example, you can specify thesame rollover behavior in a generic .conf to process both WAS and DB2log files. However, as the rollover behavior in the log files differs, thisconfiguration results in some of the logs not being processed correctly andis inefficient. To improve performance, replace the single .conf with twonew files in two new subnodes.
Improve performance for many data sourcesIf you use many data sources to monitor the log events, you can createsubnodes to spread the workload.
Remote monitoring with IBM Tivoli Monitoring Log File Agent 6.3With IBM Tivoli Monitoring Log File Agent 6.3, you can modify the .conffile to monitor logs from multiple remote sources. However, the usercredentials might not be the same for the remote servers. You can maintainonly one set of user credentials in the LFA configuration file. In this case,
Loading and streaming data 443

you create multiple subnodes with different user credentials in each. Youcan use this feature to monitor multiple remote sources from a single LFAnode with multiple subnodes.
There is also a limitation on the naming of subnodes. For more information, see“Character limits for subnode names” on page 270.
Procedure1. Go to the directory where the LFA is installed. For example, if you are using
the internal LFA that is delivered with Log Analysis, the directory is<HOME>/IBM/LogAnalysis/IBM-LFA-6.30/config/lo.
2. To open LFA configuration window, run the following command:bin/CandleManage
3. Right-click the Tivoli Log File Agent service and click Configure.4. Click the instance that you want to configure and click OK. The Configure
Tivoli Log File Agent window is displayed.5. On the Log File Adapter Configuration tab, ensure that the Conf file and
Format File fields are blank.6. Click the Log File Adapter Global Settings tab and note the directory that is
specified in the Configuration file autodiscovery directory. This path is thedirectory where you save the subnode configuration files. Click OK.
7. In the subsequent window, you can ignore the other changes and click Save tosave your changes.
8. Enter the root user password when prompted to implement your changes.9. Copy the subnode configuration files to the directory that you noted in step 6.
The LFA automatically detects the changes. You do not need to restart the LFAinstance.
Results
The procedure describes how to configure subnodes in the LFA UI. You can alsouse the command line. To use the command line to configure the subnodes:1. Go to the directory where the LFA is installed.2. Run the following command:
itmcmd config -A lo
3. Complete the required steps.4. Specify the configuration file autodiscovery directory.5. Complete the configuration.6. Save the subnode configuration file to the directory that you specified in step 4.
Character limits for subnode names:
When you name a subnode, ensure that you are aware of the character andnaming limitations.
32 character limitation
The LFA uses msn to name and identify the subnode. IBM Tivoli Monitoring limitsthe length of this name to 32 characters. The limit includes the identifier, the dash,and the semi-colon. This leaves 28 new characters for the host name, subnode andconfiguration file name.
444 IBM Operations Analytics - Log Analysis: Installation, Configuration, and Administration Guide

The subnode name is specified in the following format:LO:<Hostname>_<Subnode>-<Conffilename>
where LO is an identifier that is assigned to all subnodes. <Hostname> is the hostname of the machine where the subnode is installed. <Subnode> is the name of thesubnode.<Conffilename> is the name of the subnode configuration file.
For example:LO:nc1234567890_WASInsightPack-lfawas
However, IBM Tivoli Monitoring limits the length of this name to 32 characters.The example name is 35 characters long. The limit includes the identifier, the dash,and the semi-colon, leaving 28 characters for the host name, subnode andconfiguration file name. To work around this limitation, IBM Tivoli Monitoringrenames the subnode as:LO:nc1234567890_WASInsightPack-l
This name is 32 characters long. The host name uses 12 characters. The subnodeuses 14 characters.
This limitation can cause an issue if you use similar names for the configurationfiles. For example, after you name the first subnode, you create another subnodecalled:LO:nc1234567890_WASInsightPack-lfawas2
IBM Tivoli Monitoring renames this subnode as:LO:nc1234567890_WASInsightPack-l
As you can see, due to the truncation, both subnodes now have the same name,meaning that the LFA will not detect the new configuration.
Increasing the limit
The host name is used for integrations with Tivoli Endpoint Manager, where ithelps you to identify subnodes. However, this is not required for Log Analysis.You remove the host name from the default naming convention so that you canuse all 28 characters for the configuration file name.
To change the host name setting:1. Stop the LFA.2. Open the <HOME>/IBM/LogAnalysis/IBM-LFA-6.30/config/lo/
lo_default_workload_instance.conf file.3. Change the default value for the following property from Y (Yes) to N (No):
CDP_DP_USE_HOSTNAME_IN_SUBNODE_MSN=’N’
4. Save the updated file.5. Restart the LFA.
After you change this configuration setting, the subnode name no longer includesthe host name. For example, the subnodes in the previous example are now namedLO:WASInsightPack-lfawas and LO:WASInsightPack-lfawas2.
Considerations when using the LFABefore you use the LFA, read this topic to help you to understand some importantconsiderations and limitations.
Loading and streaming data 445
Log file size
If your log files are likely to exceed 50 MB, increase the size of the LFA cache: Inthe appropriate configuration file, set BufEvtMaxSize=102400. For WAS log files,update <HOME>/IBM/LogAnalysis/IBM-LFA-6.30/config/lo/WASInsightPack-lfawas.conf. For DB2 log files, update <HOME>/IBM/LogAnalysis/IBM-LFA-6.30/config/lo/DB2InsightPack-lfadb2.conf.
You must delete the appropriate existing cache file. For WAS log files, delete<HOME>/IBM/LogAnalysis/logs/lfa-WASInsightPack.cache and for DB2 log files,delete <HOME>/IBM/LogAnalysis/logs/lfa-DB2InsightPack.cache
For very large log files, update the cache size of the EIF receiver. In the<HOME>/IBM/LogAnalysis/UnityEIFReceiver/config/eif.conf file, increase thevalue of the BufEvtMaxSize property.
For WAS, update <HOME>/IBM-LFA-6.30/config/lo/WASInsightPack-lfawas.conffile. DB2 update <HOME>/IBM-LFA-6.30/config/lo/DB2InsightPack-lfadb2.conf file.
If you make any changes to the configuration, you must restart the service for thechanges to take effect. To restart the service, from the <HOME>/IBM/LogAnalysis/utilities directory, run the following commands:v unity.sh -stop
v unity.sh -start
Maximum log line length
The LFA monitors each log file line. The default maximum line length that can beprocessed by the LFA is 4096 bytes. This is equivalent to 4096 ASCII characters.This limitation is related to the log line and not the log record. If a log recordconsists of multiple log lines, such as in the case of a stack trace, the limit appliesto each line. This is a limitation of the LFA and does not apply if you use analternative data collection mechanism.
Performance implications of using the LFA
Loading logs using the LFA is a CPU bound process. If your system does not meetthe minimum requirements you will need to increase the MaxEventQueueDepth. Onsome systems, altering this value may produce a noticeable impact onperformance. This will buffer additional LFA events while they are waiting to beprocessed. The required value for MaxEventQueueDepth may vary depending on thesize of the rolled log and the number/speed of your CPU's. If you choose not toincrease this value, then older events may be replaced on the event queue bynewer events and not sent to the Log Analysis server.
To minimize the chance of data loss due to CPU bottlenecks, and to reduce thelatency between when a log record is written to the file and when it is loaded, werecommend that the maximum size of a log be small enough so that you systemdoes not fall behind while processing the logs.
Common LFA configuration conflictsWhen you create a remote LFA node and a custom data source and both use thesame log path, you can create a conflict.
When you create a custom data source and use it monitor a directory on a remoteLFA subnode and you later create another data source, like a remote data source,
446 IBM Operations Analytics - Log Analysis: Installation, Configuration, and Administration Guide

that monitors the same directory, you can create a conflict in the LFA configuration.These conflicts may cause errors in the Log Analysis log files and reduce theperformance of Log Analysis.
The following example is provided to help you to understand this situation.
To avoid these conflicts, you need to avoid monitoring the same directory withdifferent data sources. If you want to monitor two files in the same directory,include the file name in the Log Path field when you create the data source.
Example
For example, you are an administrator and you want to monitor files from an LFAthat is installed on a remote server as described in the Knowledge Centerdocumentation. See “Configuring a remote LFA to stream data” on page 267. Inthis case, the LFA is not part of the Log Analysis product.
First, you must create a custom data source called Customdatasource to load datafrom remote instance of the LFA. In the Data Source creation wizard, you specifythe host name and the following log path:/opt/WAS/WAS_logs/myLogFile.log
Next, you need to create the configuration and format files for the LFA sub nodes.You create two files, lfa1.conf and lfa1.fmt. In the lfa1.conf file, you specify thefollowing data source:Datasources=/WAS/WAS_logs/some_dir/*
Logs that are subsequently generated or appended are ingested by the Datasource1data source.
After some time, you create another data source to load data from the same remoteserver. The new log file is called newLogFile.log and it is located in the samedirectory as the file that you created the Customdatasource data source for. Youcreate a remote data source called Remotedatasource and specify the log path as:/opt/WAS/WAS_logs/newLogFile.log
Finally, you push the log files into Log Analysis.
However, after you push the log file, you notice some strange behaviour in the LogAnalysis log files. The GenericReceiver.log log file shows that the data is beingingested for /opt/WAS/WAS_logs/newLogFile.log. However, it also says that the/opt/WAS/WAS_logs/newLogFile.log log file is not a valid data source.
This occurs because the same log file is being monitored by both data sources. As aresult, it is monitored by two different LFA sub nodes and in two different streams.The data is loaded but this can waste resources and decrease the overallperformance.
To avoid this situation, you must be aware of any possible conflicts especiallywhen you create a custom data source that monitors a directory rather than a file.
Regular expression support for the LFAThe LFA supports specific implementations of regular expressions.
Loading and streaming data 447

Single-line unstructured data
If you want to use the DSV toolkit to extract and export the data in thecomma-separated value (CSV) format for use with the DSV toolkit, you can use aregular expression to extract and export the data.
For example, consider the following log file record:10453072 23460 E5D27197E653C548BDA744E8B407845B AOBEAI1 /EAI I H R SACP9002BPUSRSYS/612 23460 - XGNEA108:662:000042:06:E036977:WWS00003:7000:16:1:REV=NProc Time=000.03
You can configure Log Analysis to use a regular expression to extract and exportthe data in the comma-separated value (CSV) format. For example, here is anexample of a regular expression that is defined in the .fmt file:REGEX EAILOG⌂([0-9]*)(.*)SACP9002(.*):([0-9]*):([0-9]*):([0-9]*):([a-zA-Z0-9]*):([a-zA-Z0-9]*):([a-zA-Z0-9]*):(.*)Proc Time=([0-9]*.[0-9]*)timestamp $1 CustomSlot1discard $2SACP9002 $3bankID $4 CustomSlot3branchID $5 CustomSlot4discard3 $6tellerSID $7 CustomSlot5workstationID $8 CustomSlot6transactionTypeID $9 CustomSlot7discard4 $10responseTime $11 CustomSlot8msg PRINTF("%s,%s,%s,%s,%s,%s,%s",timestamp,bankID,branchID,tellerSID,workstationID,transactionTypeID,responseTime)END
Manipulating date time information for the Generic Annotation InsightPack
If you use the Generic Annotation Insight Pack or the date time rule set from theGeneric Annotation Insight Pack in a custom Insight Pack, you can use somelimited regular expressions that you can use to parse time and date information.
The second delimiter, which is a colon (:), is not supported. The regular expressionreplaces the second delimiter with a period (.), which is supported. For example,to change a date from 15/12/2014 12:12:12:088 GMT to 15/12/2014 12:12:12.088GMT, you can add the following regular expression to the .fmt file:// Matches records for any Log file:// Log Analytics Data Source chas_access.log
REGEX nongr([0-9][0-9])/([0-9][0-9])/([0-9][0-9]) ([0-9][0-9]):([0-9][0-9]):([0-9][0-9]):([0-9][0-9][0-9]) ([A-Z][A-Z][A-Z])(.*Batch Status for.*)month $1day $2year $3hour $4minute $5second $6ms $7zone $8message $9hostname example.com
448 IBM Operations Analytics - Log Analysis: Installation, Configuration, and Administration Guide

-file /opt/la/IBM/LogAnalysis/logs/GenericReceiver.logRemoteHost ""logpath PRINTF("%s",file)text PRINTF("%s/%s/%s %s:%s:%s.%s %s %s", month, day, year, hour, minute,second, ms, zone, message)END
Loading a batch of log files with the LFAUse this example to help you to understand how to use the LFA to load log abatch of files.
Before you begin
Consider the size of the log files that you want to load. If a log file is in the regionof 50 MB, or more, in size, increase the size of the log file agent cache. In theappropriate configuration file, set BufEvtMaxSize=102400. For WAS log files, update<HOME>/IBM/LogAnalysis/IBM-LFA-6.30/config/lo/WASInsightPack-lfawas.conf.For DB2 log files, update <HOME>/IBM/LogAnalysis/IBM-LFA-6.30/config/lo/DB2InsightPack-lfadb2.conf.
You must delete the appropriate existing cache file. For WAS log files, delete<HOME>/IBM/LogAnalysis/logs/lfa-WASInsightPack.cache and for DB2 log files,delete <HOME>/IBM/LogAnalysis/logs/lfa-DB2InsightPack.cache
For very large log files, update the cache size of the EIF receiver. In the<HOME>/IBM/LogAnalysis/UnityEIFReceiver/config/eif.conf file, increase thevalue of the BufEvtMaxSize property.
Lines in a log that are longer than 4096 characters are, by default, ignored by theLFA. To force it to read lines longer than 4096 characters, add theEventMaxSize=<length_of_longest_line> property to the .conf file that will beused while loading the log.
For WAS update $UNITY_HOME/IBM-LFA-6.30/config/lo/WASInsightPack-lfawas.conf file. DB2 update $UNITY_HOME/IBM-LFA-6.30/config/lo/DB2InsightPack-lfadb2.conf file.
If you make any changes to the configuration, you must restart the service for thechanges to take effect. To restart the service, from the <HOME>/IBM/LogAnalysis/utilities directory, run the following commands:v <HOME>/IBM/LogAnalysis/utilities/unity.sh -stop
v <HOME>/IBM/LogAnalysis/utilities/unity.sh -start
About this task
The LFA might be on the same server as IBM Operations Analytics - Log Analysisand monitoring a local directory. In this scenario, the installation of IBMOperations Analytics - Log Analysis completes all of the configuration required.
If the LFA is on the same server as IBM Operations Analytics - Log Analysis, butmonitoring remote directories, some additional configuration is required. If youwant to monitor log files on remote servers, you must make some specific settingschanges. For more information about these specific settings, see the Configuringremote monitoring that uses the predefined configuration files topic under IBM Tivoli LogFile Agent Configuration in the Extending IBM Operations Analytics - Log Analysissection.
Loading and streaming data 449

If your configuration requires it, you can use a remote LFA. In this scenario, installand configure the LFA based on the your requirements. For more information, seethe IBM Tivoli Monitoring documentation: http://www-01.ibm.com/support/knowledgecenter/SSTFXA_6.3.0/com.ibm.itm.doc_6.3/welcome.htm
Procedure
To use the log file agent to load log information, complete the following steps:1. In the Administrative Settings page, define an appropriate log file source.2. Ensure that the log file you want to add is in the appropriate directory. For
WAS logs, place the log file in the following directory:<HOME>/IBM/LogAnalysis/logsources/WASInsightPack
For DB2 logs, place the log file in the following directory:<HOME>/IBM/LogAnalysis/logsources/DB2InsightPack
For Generic annotator log files, place the log file in the following directory:$UNITY_HOME/logsources/GAInsightPack
The log file is automatically picked up and analyzed. Depending on the size ofthe log file, processing it could take some time.
3. Optional: To monitor progress, check the following log files:v <HOME>/IBM/LogAnalysis/logs/GenericReceiver.log
v <HOME>/IBM/LogAnalysis/logs/UnityEifReceiver.log
When you are using the LFA to perform data collection, monitor theUnityEIFReceiver.log and GenericReceiver.log log files located in the$UNITY_HOME/logs directory to ensure that the data ingestion has completedcorrectly.This example illustrates the addition of a batch of log records. The result isindicated in the RESPONSE MESSAGE section of the log file:~~~~~~~~~~~~~~~~~~~~~~~~~~~~~~~~~~~~~~~~~~~~~~~~~~~~~~~~~~~~~~~~~~~~2013-04-20 04:43:10,032 [pool-5-thread-1] INFO - LogEventPoster : -Posting Event to UNITY DATA COLLECTOR -
https://nc9118041070:9987/Unity/DataCollector2013-04-20 04:43:24,273 [pool-5-thread-1] INFO - LogEventPoster :
+++++++++ RESPONSE MESSAGE +++++++++2013-04-20 04:43:24,273 [pool-5-thread-1] INFO - LogEventPoster : OK2013-04-20 04:43:24,273 [pool-5-thread-1] INFO - LogEventPoster :
{ "batchSize": 2078,"failures": [ ], "numFailures": 0 }2013-04-20 04:43:24,273 [pool-5-thread-1] INFO - LogEventPoster :
++++++++++++++++++++++++++++++++++++2013-04-2 04:43:24,273 [pool-5-thread-1] INFO - LogEventPoster :
EIF event delivery to Generic Receiver -- SUCCESS~~~~~~~~~~~~~~~~~~~~~~~~~~~~~~~~~~~~~~~~~~~~~~~~~~~~~~~~~~~~~~~~~~~~~
In this log, the number of log records processed is indicated in the line:{ "batchSize": 2078, "failures": [ ], "numFailures": 0 }
2078 log records were successfully ingested. The numFailures value indicatesthe number of failures in the ingestion of the log records. For example, a valueof 5 for the numFailures value indicates that 5 log records were not ingested.When data collection has completed, if the EIF Receiver buffer is partiallyfilled, any remaining log records are posted to the Generic Receiver. This isrecorded in the log as a TIMEOUT FLUSH event. These events are added to the logfile at the end of the session of data collection:
450 IBM Operations Analytics - Log Analysis: Installation, Configuration, and Administration Guide

~~~~~~~~~~~~~~~~~~~~~~~~~~~~~~~~~~~~~~~~~~~~~~~~~~~~~~~~~~~~~~~~~~~~~~
2013-04-20 04:54:26,341 [pool-4-thread-1] INFO - LogEventService :TIMEOUT FLUSH for logsource:nc9118041070::/home/example/LogAnalytics/logsources/
WASInsightPack/TipTrace5.log2013-04-20 04:54:26,359 [pool-5-thread-1] INFO - LogEventPoster : ---Posting Event to UNITY DATA COLLECTOR -
https://nc9118041070:9987/Unity/DataCollector2013-04-20 04:54:38,581 [pool-5-thread-1] INFO - LogEventPoster :
+++++++++ RESPONSE MESSAGE +++++++++2013-04-20 04:54:38,582 [pool-5-thread-1] INFO - LogEventPoster : OK2013-04-20 04:54:38,582 [pool-5-thread-1] INFO - LogEventPoster :
{ "batchSize": 1714,"failures": [ ], "numFailures": 0 }2013-04-20 04:54:38,582 [pool-5-thread-1] INFO - LogEventPoster :
++++++++++++++++++++++++++++++++++++2013-04-20 04:54:38,582 [pool-5-thread-1] INFO - LogEventPoster :
EIF event delivery to Generic Receiver -- SUCCESS2013-04-20 04:54:38,583 [pool-4-thread-1] INFO - LogEventService :
POST RESULT:{"failures":[],"batchSize":1714,"numFailures":0}
~~~~~~~~~~~~~~~~~~~~~~~~~~~~~~~~~~~~~~~~~~~~~~~~~~~~~~~~~~~~~~~~~~~~~~~~
To calculate the number of events that have been processed, calculate the sumof all of the batchSize values. To calculate the number of events ingested,calculate the sum of all of the batchSize values and deduct the total sum ofnumFailure values.If the ingestion fails, an error message is recorded in the UnityEIFReceiver.log:2013-05-16 02:16:11,184 [pool-7-thread-1] INFO - LogEventPoster :
+++++++++ RESPONSE MESSAGE +++++++++2013-05-16 02:16:11,184 [pool-7-thread-1] INFO - LogEventPoster : Not Found2013-05-16 02:16:11,184 [pool-7-thread-1] INFO - LogEventPoster :
{"BATCH_STATUS":"NONE","RESPONSE_MESSAGE":"CTGLA0401E : Missing log source ","RESPONSE_CODE":404}2013-05-16 02:16:11,184 [pool-7-thread-1] INFO - LogEventPoster :
++++++++++++++++++++++++++++++++++++2013-05-16 02:16:11,184 [pool-7-thread-1] INFO - LogEventPoster :
FAILURE - ResponseCode:404 ResponseMessage:Not Found
Additional HTTP response codes are as follows:
413 Request Entity Too Large: Displayed if a batch size is greater than theGeneric Receiver default value set in the $UNITY_HOME/wlp/usr/servers/Unity/apps/Unity.war/WEB-INF/unitysetup.properties.
500 Internal Server Error: Displayed when there is any issue withIBMOperations Analytics - Log Analysis such as a database error or anyother runtime error.
404 Not Found: Displayed when a Log Source is not found for a hostnameand log path combination in the request.
409 Conflict: Displayed if the data batch is posted for a Log Source that isan inactive state or if there is a conflict between the data posted andthe data expected by the server. For example, the inputType field in therequest JSON does not match the inputType field in the Collection forthe requested hostname and log path combination.
200 OK: Displayed when the request is processed by the server. The statusof the processed batch of records is returned with the total number ofrecords ingested, how many failed records are present and whichfailed.
Loading and streaming data 451

400 Bad Request: Displayed when the request JSON does not contain therequired fields expected by the Generic Receiver or where the JSON isnot properly formed.
Results
After the task completes, the log file is indexed and can be searched using theSearch field on the IBM Operations Analytics - Log Analysis Dashboard.
Troubleshooting data loadingWhen you are using the IBM Tivoli Monitoring Log File Agent to perform datacollection, monitor the UnityEIFReceiver.log and GenericReceiver.log log fileslocated in the <HOME>/logs directory to ensure that the data ingestion hascompleted correctly.
This example illustrates the addition of a batch of log records. The result isindicated in the RESPONSE MESSAGE section of the log file:~~~~~~~~~~~~~~~~~~~~~~~~~~~~~~~~~~~~~~~~~~~~~~~~~~~~~~~~~~~~~~~~~~~~~~~~~~~~~~~~~2013-04-20 04:43:10,032 [pool-5-thread-1] INFO - LogEventPoster : -----------Posting Event to UNITY DATA COLLECTOR -
https://nc9118041070:9987/Unity/DataCollector2013-04-20 04:43:24,273 [pool-5-thread-1] INFO - LogEventPoster :
+++++++++ RESPONSE MESSAGE +++++++++2013-04-20 04:43:24,273 [pool-5-thread-1] INFO - LogEventPoster : OK2013-04-20 04:43:24,273 [pool-5-thread-1] INFO - LogEventPoster :
{ "batchSize": 2078,"failures": [ ], "numFailures": 0 }2013-04-20 04:43:24,273 [pool-5-thread-1] INFO - LogEventPoster :
++++++++++++++++++++++++++++++++++++2013-04-2 04:43:24,273 [pool-5-thread-1] INFO - LogEventPoster :
EIF event delivery to Generic Receiver -- SUCCESS~~~~~~~~~~~~~~~~~~~~~~~~~~~~~~~~~~~~~~~~~~~~~~~~~~~~~~~~~~~~~~~~~~~~~~~~~~~~~~~~~
In this log, the number of log records processed is indicated in the line:{ "batchSize": 2078, "failures": [ ], "numFailures": 0 }
2078 log records were successfully ingested. The numFailures value indicates thenumber of failures in the ingestion of the log records. For example, a value of 5 forthe numFailures value indicates that 5 log records were not ingested.
When data collection has completed, if the EIF Receiver buffer is partially filled,any remaining log records are posted to the Generic Receiver. This is recorded inthe log as a TIMEOUT FLUSH event. These events are added to the log file at the endof the session of data collection:~~~~~~~~~~~~~~~~~~~~~~~~~~~~~~~~~~~~~~~~~~~~~~~~~~~~~~~~~~~~~~~~~~~~~~~~~~~~~~~~~
2013-04-20 04:54:26,341 [pool-4-thread-1] INFO - LogEventService :TIMEOUT FLUSH for datasource:nc9118041070::/home/yogesh/IBM/LogAnalysis/logsources/WASInsightPack/TipTrace5.log
2013-04-20 04:54:26,359 [pool-5-thread-1] INFO - LogEventPoster : -----------Posting Event to UNITY DATA COLLECTOR -
https://nc9118041070:9987/Unity/DataCollector2013-04-20 04:54:38,581 [pool-5-thread-1] INFO - LogEventPoster :
+++++++++ RESPONSE MESSAGE +++++++++2013-04-20 04:54:38,582 [pool-5-thread-1] INFO - LogEventPoster : OK2013-04-20 04:54:38,582 [pool-5-thread-1] INFO - LogEventPoster :
{ "batchSize": 1714,"failures": [ ], "numFailures": 0 }2013-04-20 04:54:38,582 [pool-5-thread-1] INFO - LogEventPoster :
++++++++++++++++++++++++++++++++++++2013-04-20 04:54:38,582 [pool-5-thread-1] INFO - LogEventPoster :
452 IBM Operations Analytics - Log Analysis: Installation, Configuration, and Administration Guide

EIF event delivery to Generic Receiver -- SUCCESS2013-04-20 04:54:38,583 [pool-4-thread-1] INFO - LogEventService :
POST RESULT:{"failures":[],"batchSize":1714,"numFailures":0}
~~~~~~~~~~~~~~~~~~~~~~~~~~~~~~~~~~~~~~~~~~~~~~~~~~~~~~~~~~~~~~~~~~~~~~~~~~~~~~~~~
To calculate the number of events that have been processed, calculate the sum ofall of the batchSize values. To calculate the number of events ingested, calculatethe sum of all of the batchSize values and deduct the total sum of numFailurevalues.
If the ingestion fails, an error message is recorded in the UnityEIFReceiver.log:2013-05-16 02:16:11,184 [pool-7-thread-1] INFO - LogEventPoster :
+++++++++ RESPONSE MESSAGE +++++++++2013-05-16 02:16:11,184 [pool-7-thread-1] INFO - LogEventPoster : Not Found2013-05-16 02:16:11,184 [pool-7-thread-1] INFO - LogEventPoster :
{"BATCH_STATUS":"NONE","RESPONSE_MESSAGE":"CTGLA0401E : Missing data source ","RESPONSE_CODE":404}2013-05-16 02:16:11,184 [pool-7-thread-1] INFO - LogEventPoster :
++++++++++++++++++++++++++++++++++++2013-05-16 02:16:11,184 [pool-7-thread-1] INFO - LogEventPoster :
FAILURE - ResponseCode:404 ResponseMessage:Not Found
Additional HTTP response codes are as follows:
413 Request Entity Too Large: Displayed if a batch size is greater than theGeneric Receiver default value set in the $UNITY_HOME/wlp/usr/servers/Unity/apps/Unity.war/WEB-INF/unitysetup.properties.
500 Internal Server Error: Displayed when there is any issue withIBMOperations Analytics - Log Analysis such as a database error or any otherruntime error.
404 Not Found: Displayed when a data source is not found for a hostname andlog path combination in the request.
409 Conflict: Displayed if the data batch is posted for a data source that is aninactive state or if there is a conflict between the data posted and the dataexpected by the server. For example, the inputType field in the requestJSON does not match the inputType field in the Collection for therequested hostname and log path combination.
200 OK: Displayed when the request is processed by the server. The status ofthe processed batch of records is returned with the total number of recordsingested, how many failed records are present and which failed.
400 Bad Request: Displayed when the request JSON does not contain therequired fields expected by the Generic Receiver or where the JSON is notproperly formed.
Configuring the EIF ReceiverHow to configure remote or local installations of the Tivoli Event IntegrationFacility (EIF) receiver to work with IBM Operations Analytics - Log Analysis.
About this task
The following steps are the same for remote and local installations of the EIFunless stated otherwise.
Loading and streaming data 453

Configuring receiver buffer size and timeoutWhen collecting data using the IBM Tivoli Monitoring Log File Agent (LFA) andTivoli Event Integration Facility (EIF) Adapter flow, you might need to change therate at which events are flushed to the generic receiver for indexing. Incomingevents are buffered at the EIF receiver side.
About this task
To improve overall IBM Operations Analytics - Log Analysis performance, you canconfigure the buffer size and timeout period to match the rate of incoming events.When the event rate increases, increase the buffer size and decrease the timeoutperiod. When the event rate decreases, decrease the buffer size and keep thetimeout interval at the default value or increase it, depending on the event rate.
The following steps are the same for remote and local installations of the EIFunless stated otherwise.
Procedure
To change the buffer size and timeout parameters:1. Stop IBM Operations Analytics - Log Analysis:v If you use a local installation of the EIF, use the following command to stop
IBM Operations Analytics - Log Analysis:<HOME>/IBM/LogAnalysis/utilities/unity.sh -stop
v If you use a remote installation of the EIF, use the eifutil.sh -stopcommand to stop the instances. For more information, see “eifutil.shcommand” on page 77.
2. Open the configuration file for editing:v If you use a local installation of the EIF, open the unity.conf file in the
<HOME>/IBM/LogAnalysis/UnityEIFReceiver/config/ directory.v If you use a remote installation of the EIF, the unity.conf file is in the
<remote_deployment_location>/LogAnalysis/DataForwarders/EIFReceivers/<eif_inst_#>/config/unity.conf directory. Where<remote_deployment_location> is the directory on the remote machine whereyou deployed the EIF instance. <eif_inst_#> is the folder used for the specificremote EIF instance.
3. Change the Timeout and Buffer Size parameters to suit your operatingenvironment:#Timeout in Secondslogsource.buffer.wait.timeout=10#Buffer Size in Byteslogsource.max.buffer.size=250000
4. Save your changes.5. Start IBM Operations Analytics - Log Analysis:v If you use a local installation of the EIF, use the following command to start
IBM Operations Analytics - Log Analysis:<HOME>/IBM/LogAnalysis/utilities/unity.sh -start
v If you use a remote installation of the EIF, use the eifutil.sh -startcommand to start the instances. For more information, see “eifutil.shcommand” on page 77.
454 IBM Operations Analytics - Log Analysis: Installation, Configuration, and Administration Guide

Results
With higher buffer sizes, notice that it takes a longer time to fill the buffer withevents and for batches to be posted to the receiver.
Configuring the EIF receiver user accountThe Tivoli Event Integration Facility (EIF) receiver uses the default unityuser useraccount to access the generic receiver. You can change the user account or thedefault user password in the unity.conf configuration file.
About this task
The following steps are the same for remote and local installations of the EIFunless stated otherwise.
Procedure
To change the default EIF user or password:1. Stop IBM Operations Analytics - Log Analysis:v If you use a local installation of the EIF, use the following command to stop
IBM Operations Analytics - Log Analysis:<HOME>/IBM/LogAnalysis/utilities/unity.sh -stop
v If you use a remote installation of the EIF, use the eifutil.sh -stopcommand to stop the instances. For more information, see “eifutil.shcommand” on page 77.
2. Open the configuration file for editing:v If you use a local installation of the EIF, open the unity.conf file in the
<HOME>/IBM/LogAnalysis/UnityEIFReceiver/config/ directory.v If you use a remote installation of the EIF, the unity.conf file is in the
<remote_deployment_location>/LogAnalysis/DataForwarders/EIFReceivers/<eif_inst_#>/config/unity.conf directory. Where<remote_deployment_location> is the directory on the remote machine whereyou deployed the EIF instance. <eif_inst_#> is the folder that is used for thespecific remote EIF instance.
3. Change the following userid and password parameters to suit your operatingenvironment:unity.data.collector.userid=unityuser
unity.data.collector.password=password
To encrypt the password, use the unity_securityUtility.sh command. Formore information, see “Changing the default password for the Data Collectorand EIF Receiver” on page 300.
4. Save your changes.5. Restart IBM Operations Analytics - Log Analysis:v If you use a local installation of the EIF, use the following command to
restart IBM Operations Analytics - Log Analysis:<HOME>/IBM/LogAnalysis/utilities/unity.sh -restart
v If you use a remote installation of the EIF, use the eifutil.sh -restartcommand to restart the instances. For more information, see “eifutil.shcommand” on page 77.
Loading and streaming data 455

Results
The EIF receiver uses the new credentials to access the generic receiver.
Configuring the number of events in the EIF ReceiverYou can configure the number of events that the EIF Receiver stores for eachinternal queue. If you intend to ingest a large quantity of data and at a high rate,configure these values to larger values. However, increasing this value alsoincreases the memory requirements for EIF Receiver.
About this task
Ensure that you have sufficient memory to support the number of events in thequeue.
The following steps are the same for remote and local installations of the EIFunless stated otherwise.
Procedure
To change this setting:1. Stop IBM Operations Analytics - Log Analysis:v If you use a local installation of the EIF, use the following command to stop
IBM Operations Analytics - Log Analysis:<HOME>/IBM/LogAnalysis/utilities/unity.sh -stop
v If you use a remote installation of the EIF, use the eifutil.sh -stopcommand to stop the instances. For more information, see “eifutil.shcommand” on page 77.
2. Open the configuration file for editing:v If you use a local installation of the EIF, open the unity.conf file in the
<HOME>/IBM/LogAnalysis/UnityEIFReceiver/config/ directory.v If you use a remote installation of the EIF, the unity.conf file is in the
<remote_deployment_location>/LogAnalysis/DataForwarders/EIFReceivers/<eif_inst_#>/config/unity.conf directory. Where<remote_deployment_location> is the directory on the remote machine whereyou deployed the EIF instance. <eif_inst_#> is the folder used for the specificremote EIF instance.
3. Locate these lines and change the value to reflect your requirements:unity.data.collector.eif.consumer.num.events=1000000unity.data.collector.event.manager.num.events=20000
The following settings are applicable per data source:unity.data.collector.event.service.num.events=20000unity.data.collector.event.poster.num.events=500
4. Save your changes.5. Start IBM Operations Analytics - Log Analysis:v If you use a local installation of the EIF, use the following command to start
IBM Operations Analytics - Log Analysis:<HOME>/IBM/LogAnalysis/utilities/unity.sh -start
v If you use a remote installation of the EIF, use the eifutil.sh -startcommand to stop the instances. For more information, see “eifutil.shcommand” on page 77.
456 IBM Operations Analytics - Log Analysis: Installation, Configuration, and Administration Guide

Configuring the EIF Receiver memory clean up intervalIBM Operations Analytics - Log Analysis ensures that the memory used for datacollection with the Log File Agent using a property in the <HOME>/IBM/LogAnalysis/UnityEIFReceiver/config/unity.conf file. The EIF Receiver uses thisvalue to manage the memory usage. The configuration cycle is set to a value inminutes with a default value of 2 minutes.
About this task
The following steps are the same for remote and local installations of the EIFunless stated otherwise.
Procedure
To configure this property:1. Stop IBM Operations Analytics - Log Analysis:v If you use a local installation of the EIF, use the following command to stop
IBM Operations Analytics - Log Analysis:<HOME>/IBM/LogAnalysis/utilities/unity.sh -stop
v If you use a remote installation of the EIF, use the eifutil.sh -stopcommand to stop the instances. For more information, see “eifutil.shcommand” on page 77.
2. Open the configuration file for editing:v If you use a local installation of the EIF, open the unity.conf file in the
<HOME>/IBM/LogAnalysis/UnityEIFReceiver/config/ directory.v If you use a remote installation of the EIF, the unity.conf file is in the
<remote_deployment_location>/LogAnalysis/DataForwarders/EIFReceivers/<eif_inst_#>/config/unity.conf directory. Where<remote_deployment_location> is the directory on the remote machine whereyou deployed the EIF instance. <eif_inst_#> is the folder that is used for thespecific remote EIF instance.
3. Change the parameters to suit your operating environment:#gc interval is in minutesunity.data.collector.gc.interval=2
4. Save your changes.5. Start IBM Operations Analytics - Log Analysis:v If you use a local installation of the EIF, use the following command to start
IBM Operations Analytics - Log Analysis:<HOME>/IBM/LogAnalysis/utilities/unity.sh -start
v If you use a remote installation of the EIF, use the eifutil.sh -startcommand to start the instances. For more information, see “eifutil.shcommand” on page 77.
Configuring scalable data streaming from multiple, remotesources
To facilitate dynamic data streaming that is scalable across multiple remote sources,you must configure IBM Operations Analytics - Log Analysis after you install it.
To enable data collection from remote hosts, you must complete the followingsteps:1. Install Apache Solr on the remote machine.
Loading and streaming data 457

2. Set up Secure Shell (SSH) communication.3. Configure SSH to work with the remote installer utility.4. Use the remote installer utility to install instances of the Event Integration
Facility (EIF) or the IBM Tivoli Monitoring Log File Agent (LFA) on remotemachines.
5. Configure the EIF so that it is compatible with the remote instances that yourcreate. If you use the LFA, you do not have to configure the local installation.However, you do have to manually configure the sub nodes.
You can also maintain and administer these connections after you set them up.
As an alternative to streaming data, You can batch load data. For moreinformation, see “Loading and streaming data” on page 258.
Installing Apache Solr on remote machinesAfter you install IBM Operations Analytics - Log Analysis, you can use the ApacheSolr remote installer to install Apache Solr on a remote machine.
About this task
If no local instances of Apache Solr exist, then you need to install the instances onthe remote machine as soon as you install IBM Operations Analytics - LogAnalysis. If there is a local instance of Apache Solr, you can install the remoteinstances whenever you want.
You must use a non-root user to run the script.
You cannot use the installer to install Apache Solr on a local machine.
You cannot use the installer to install multiple Apache Solr nodes on a singleremote machine.
Ensure that the Apache Solr ports are open and free from any firewall restrictionson the remote machine.
To install Apache Solr on multiple remote machines, run the script separately foreach remote machine. You cannot use the installer to install instances of ApacheSolr simultaneously or in parallel.
Procedure1. Change the directory to <HOME>/IBM/LogAnalysis/solr_install_tool. For
example:cd <HOME>/IBM/LogAnalysis/solr_install_tool
2. To run the remote_deploy.sh script, enter the following command:./remote_deploy_solr.sh -install
3. The script prompts you for the following information:
Remote Hostname in FQDN formatEnter the Fully Qualified Domain Name (FQDN) of the remote host.
UsernameEnter the user name.
PasswordEnter the password if password-less SSH authentication is disabled. Ifpassword-less SSH is enabled between the IBM Operations Analytics -
458 IBM Operations Analytics - Log Analysis: Installation, Configuration, and Administration Guide

Log Analysis server and the remote host, the script reads the valuesthat are specified in the ssh_config.properties file in the<HOME>/IBM/LogAnalysis/utilities/config directory. For moreinformation, see the Setting up Secure Shell to use key-based authenticationtopic in the IBM Operations Analytics - Log Analysis informationcenter.
SSH PortEnter the remote machine port that is used for SSH. To use the defaultvalue of 22, press enter.
Top-level Installation DirectoryTo use the default value, which is <HOME>, press enter. Alternatively, youcan enter the path to the directory where you want to install the DE.
Apache Solr Search PortTo use the default value, 9989, press enter. To use another port, enterthe port number for another valid port. Do not enter a port that isbeing used for something else.
Apache Solr Query Service PortTo use the default value, 7205, press enter. To use another port, enterthe port number for another valid port. Do not enter a port that isbeing used for something else.
4. To start the installation, press enter. In most cases, the installation takes about 5minutes to complete.
Results
The results of the installation are output in the log file in the <HOME>/IBM/LogAnalysis/solr_install_tool/logs/ManageSolrnodes.log file.
To view the status for the instances of Apache Solr that are installed remotemachines, run the unity.sh -status command.
Example
Here is an example script output:Remote Hostname in FQDN format:12345.example.comusername:unitypassword:*********SSH port: [22]Top-level Installation Directory: [/home/unity]Solr Search Port: [9989]Solr Query Service Port: [7205]
Script is ready for remote installation of Solr:Review the following inputs ....-----------------------------------------------------------------------------Remote Host Name: 12345.example.comRemote User Name: unityRemote SSH Port: 22Top-level remote installation directory: /home/unitySolr v9.0 - remote installation directory:/home/unity/IBM/LogAnalysisSolr - remote ports: 9989, 7205------------------------------------------------------------------------[’q’ - Abort][’Enter’ - Install]
Sat Nov 16 03:08:38 CST 2013 Starting remote installation of Solr, this will take couple of minutes to complete ....
Loading and streaming data 459

Sat Nov 16 03:08:38 CST 2013 Waiting for remote installation to complete ....Sat Nov 16 03:11:47 CST 2013 Successfully installed SolrSolr on remote host:12345.example.com ....
Removing Apache Solr instances:
Before you remove an installation of IBM Operations Analytics - Log Analysis, youmust remove Apache Solr.
About this task
Note: Do not remove Apache Solr if IBM Operations Analytics - Log Analysis isstill being used. IBM Operations Analytics - Log Analysis does not functionproperly when any instances of Apache Solr are removed. For this reason, onlyremove Apache Solr when you are about to uninstall IBM Operations Analytics -Log Analysis.
If you installed Apache Solr locally and remotely, remove the local instance first,then remove the remotely installed instances.
This process uses Installation Manager to remove Apache Solr instances. You canalso do so silently. To run the silent removal, run following imcl -c command,enter 3 to modify the installation, and remove the instance.
Procedure
1. Change the directory to <HOME>/IBM/LogAnalysis/solr_install_tool. Forexample:cd <HOME>/IBM/LogAnalysis/solr_install_tool
2. To run the remote_deploy.sh uninstall script, enter the following command:./remote_deploy.sh -uninstall
3. The script prompts you for the following information:
Remote Hostname in FQDN formatEnter the Fully Qualified Domain Name (FQDN) of the remote host.
UsernameEnter the user name.
PasswordEnter the password if password less SSH authentication is disabled. Ifpassword less SSH is enabled between the IBM Operations Analytics -Log Analysis server and the remote host, the script reads the valuesthat are specified in the ssh_config.properties file in the<UNITY_HOME>/utilities/config directory. For more information, seethe Setting up Secure Shell to use key-based authentication topic in the IBMOperations Analytics - Log Analysis information center.
SSH PortEnter the remote machine port that is used for SSH. To use the defaultvalue of 22, press enter.
Top-level Installation DirectoryTo use the default value, which is <HOME>/IBM/LogAnalysis, press enter.Alternatively, you can enter the path to the directory where ApacheSolr is installed.
4. To start the removal, press enter. You can view the logs in the<HOME>/IBM/LogAnalysis/solr_install_tool/logs directory.
460 IBM Operations Analytics - Log Analysis: Installation, Configuration, and Administration Guide

Results
When all the remote nodes are removed, you can safely uninstall IBM OperationsAnalytics - Log Analysis.
Setting up Secure Shell to use key-based authenticationSecure Shell (SSH) is a cryptographic network protocol for secure datacommunication between different computers. You set up key-based authenticationbetween the IBM Operations Analytics - Log Analysis servers and the remotecomputers to which it connects.
About this task
Benefits of using key-based authentication:v Data is transferred across a secure channel.v The administrator is no longer concerned about the password changes for the
remote servers.v The passphrase is independent of the individual server password policy.v One passphrase is used for multiple servers. Only the public key file must be
copied to the client server.
For more information you can view the man pages for ssh-keygen by running thiscommand:man ssh-keygen
Procedure1. To generate public and private keys, enter the following command:
ssh-keygen -t rsa
or either of the following commands:ssh-keygen(This command generates the same results as ssh-keygen -t rsa.)
ssh-keygen -t dsa(If you specify dsa, the generated keys include _dsa in their file names.)
The following example shows what a valid output might look like:
bash-3.2$bash-3.2$ ssh-keygen -t rsaGenerating public/private rsa key pair.Enter file in which you want to save the key (/home/unity/.ssh/id_rsa):Enter passphrase (empty for no passphrase):Enter same passphrase again:Your identification has been saved in /home/unity/.ssh/id_rsa.Your public key has been saved in /home/unity/.ssh/id_rsa.pub.The key fingerprint is:4a:ef:d5:7a:d8:55:b3:98:a1:1f:62:be:dd:c4:60:6e unity@<variable>.example.comThe key’s randomart image is:+--[ RSA 2048]----+| || || || . ..|| . S .o+.o|| . o =o++. || . . +o+E.o || . ..o=.o || . .o.. . |+-----------------+bash-3.2$
Loading and streaming data 461

Enter the passphrase. (The Enter passphrase field can remain blank to specifyan empty passphrase.)
2. To view the contents of the public key file, run the following commands:cd ~/.sshls -l id_rsa*cat id_rsa.pub
The command output is:bash-3.2$bash-3.2$ cat .ssh/id_rsa.pubssh-rsa AAAAB3NzaC1yc2EAAAADAQABAAABAQDg0/GGoxGzyC7Awjbwnp0hCaeztIRt6yhAgGKdwM7nb7Iiv0RgwT4/48E26K1Ur9HrI1W/j0K0JHQwvaAFibqeLmqLdK9ctCE901ywTOPFcYeBYPUF9vp/MgaypgGxVwDbW/e0SNPb7YAtZpjRoqeUqoYoKzFXXspQkxdhcQfpx0RYMbQdGGg03hDCM2wr2KPVuTVniF2IvDu1C4fcRkUPr8aQNMiuEcJgV3VHhlau/0Uo0YpH53NXKhn/sx8xdyTVsKQ1rhW8g07HIVc2Tf9ZF2gYXn/HbjE509xK/APu2nztt0h+AirJyT5jYMi/IvSI0zbPyc0p9WijPeG8r/v unity@<variable>.in.ibm.combash-3.2$
3. Create a directory called .ssh on the remote server. Use this to store the publickey.
4. Copy the public key file (id_rsa.pub) to the .ssh directory on the remote client:scp /home/unity/.ssh/id_rsa.pub<username>@<remotehostname>:/<HOME>/.ssh/id_rsa.pub
where <hostname> is the system host name and <username> is the system username.
5. Add the content of the public key to the authorized_keys file on the remotehost.bash-3.2$ ssh <username>@<remotehostname>bash-3.2$ cd ~/.sshbash-3.2$ cat id_rsa.pub >> authorized_keysbash-3.2$ rm id_rsa.pubbash-3.2$ exit
6. Ensure that there are no duplicate keys for the same client in theauthorized_keys file.
7. Log in to the remote computer to ensure that key-based SSH is working:ssh <username>@<hostname>
Enter the passphrase, if prompted.
bash-3.2$ bash-3.2$ ssh <username>@<remotehostname>Enter passphrase for key ’/home/unity/.ssh/id_rsa’:Last unsuccessful login: Mon Jul 15 14:22:37 2013 on ssh from <variable>.example.comLast login: Mon Jul 15 14:26:54 2013 on ssh from <variable>.example.com$
Configuration of key-based authentication is complete.
Results
The steps may not work because different versions of SSH are supported by theoperating systems that are used by the remote servers. For more information abouthow to solve this issue, see the Secure Shell (SSH) configuration does not work topicin the Troubleshooting IBM Operations Analytics - Log Analysis guide.
Configuring secure shell (SSH) communication for multiple remote hosts:
Before you can use the remote installer utility, you must configure the SSH for theremote hosts.
462 IBM Operations Analytics - Log Analysis: Installation, Configuration, and Administration Guide

Before you begin
Before you configure SSH for multiple remote hosts, you must configure SSHbetween IBM Operations Analytics - Log Analysis and the remote hosts. For moreinformation, see the Setting up Secure Shell to use key-based authentication topic in theInformation Center.
About this task
By default, the SSH properties file, ssh-config.properties file, is in the<HOME>/IBM/LogAnalysis/remote_install_tool/config directory. If you save the fileto another location, the utility requests that the user enters values for the remotehost, user, and password. In this case, the utility does not use the values specifiedin the file.
If you save the ssh-config.properties file in the <HOME>/IBM/LogAnalysis/remote_install_tool/config directory, the eif_remote_install_tool utility usesthe properties specified in the file.
The SSH communication can be based on a password or public key. If youimplement both options, the public key configurations are used by default.
To set up password based SSH, you specify a value for the password and commentout the private key file. The remote installer utility uses the specified password forSSH authentication when it connects to the remote host.
To set up private key file based authentication, you specify the private key filepath and do not specify a value for the password. The utility uses the file to createa password-less SSH connection.
If you specify values for both the password and the private key file path, theutility uses the file to create a password-less SSH connection.
If you do not specify a value for the password or the private key file path, IBMOperations Analytics - Log Analysis cannot create a connection and insteadgenerates an error message in the log:
ERROR:example.unity.remote.SshConfigException:
Property file config/ssh-config.properties must contain at least one of:PASSWORD, PATH_OF_PASSWORD_LESS_SSH_KEY
Correct SSH configuration OR reconfigure and retryInstallation Aborted....!
Procedure
1. Navigate to the <HOME>/IBM/LogAnalysis/remote_install_tool/config directoryand open the ssh-config.properties file.
2. Specify values for the following properties for each remote host:v Remote hostv Remote user IDv Portv Connection timeout in milliseconds. The default is 6000.
For example:
Loading and streaming data 463

REMOTE_HOST=<REMOTE_HOST>PORT=<PORT>TIME_OUT=60000USER=<REMOTE_USER>
3. For password-based authentication, you also need to specify the password inthe configuration file. For example:PASSWORD=password1
4. For public key based authentication, specify the path to the directory thatcontains the private key file. For example:PATH_OF_PASSWORD_LESS_SSH_KEY=/home/pass/.ssh/id_rsa
5. If your installation of SSH requires a passphrase, specify the passphrase. Forexample:PASSPHRASE_OF_PASSWORD_LESS_SSH_KEY=passphrase1
Configuring data collection for scalability on multiple remotenodesTo facilitate scalable data collection on multiple remote nodes, use the install.shcommand to install the Tivoli Event Integration Facility Receiver or the IBM TivoliMonitoring Log File Agent on a remote server.
Before you begin
Before you run the command, you must configure secure shell (SSH)communication between the local installation of IBM Operations Analytics - LogAnalysis and the remote host. For more information about how to do so, see“Configuring secure shell (SSH) communication for multiple remote hosts” onpage 74.
About this task
The install.sh command is in the <HOME>/IBM/LogAnalysis/remote_install_tool/directory on the local installation of IBM Operations Analytics - Log Analysis.
You can use the remote installer in the following scenarios:v If you have a high rate of data ingestion on multiple data sources. For example,
if you have 100 or more events per second and 20 or more data sources.v If you require improved throughput performance on the remote server.v If the hardware resources on the remote server are restrained.v If you want to optimize performance according to the conditions described on
the Performance developer works page here: https://www.ibm.com/developerworks/community/wikis/home?lang=en#!/wiki/IBM Log AnalyticsBeta/page/Performance and tuning
You can use the command to deploy up to 20 instances of the Tivoli EventIntegration Facility Receiver or a single instance of the IBM Tivoli Monitoring LogFile Agent on a remote node. The command deploys and configures IBM Java 1.8.The command also configures the deployed Tivoli Event Integration FacilityReceiver instance to communicate with the IBM Operations Analytics - LogAnalysis Data Collector interface.
However, this command does not configure the IBM Tivoli Monitoring Log FileAgent subnode. You must configure this setting manually. Both the remote andlocal instance of the IBM Tivoli Monitoring Log File Agent can monitor remote
464 IBM Operations Analytics - Log Analysis: Installation, Configuration, and Administration Guide

data sources. For more information about configuring IBM Tivoli Monitoring LogFile Agent, see “Configuring a remote LFA to stream data” on page 267.
To ensure that the remote instances of the Tivoli Event Integration Facility workwith the local Data Collector interface, you must create the remotelydeployedTivoli Event Integration Facility or IBM Tivoli Monitoring Log File Agentinstances as part of the same installation. This is because the encryptionconfiguration and signature generation is done during the main installation. If youinstall IBM Operations Analytics - Log Analysis after you set up the remote nodes,you must install the remote Tivoli Event Integration Facility or IBM TivoliMonitoring Log File Agent instances again. However, you can remove remoteinstances of the Tivoli Event Integration Facility or IBM Tivoli Monitoring Log FileAgent without installing IBM Operations Analytics - Log Analysis again.
Note: If you use the script to install the remote instance on a server that uses theSUSE Linux Enterprise Server 11 operating system, the script fails. To resolve thisissue, see the Cannot install remote EIF instance on SUSE topic in the TroubleshootingIBM Operations Analytics - Log Analysis guide.
Note:
The remote installer that you use to install instances of the IBM Tivoli MonitoringLog File Agent and the Tivoli Event Integration Facility does not support crossoperating system integration. You must use the remote installers to install remoteinstances on servers that use the same operating system. For example, if you installIBM Operations Analytics - Log Analysis on Linux on System z, you must installthe remote instances on Linux on System z. In this example, you cannot installremote instances on Linux on System x.
Procedure1. Navigate to the <HOME>/IBM/LogAnalysis/remote_install_tool/ directory and
run the install.sh command. You are prompted for a series of inputs.2. Enter the remote installation directory. This value must be the location where
the deployed artifacts are installed on the remote host.3. If you want to deploy the Tivoli Event Integration Facility Receiver, select it. If
you do, enter the Tivoli Event Integration Facility Receiver instances that youwant to deploy.
4. If you want to deploy the IBM Tivoli Monitoring Log File Agent instance onthe remote node, select it.
Results
After you complete the procedure, you can now collect data from the remote hosts.
What to do next
After the initial setup, you will want to periodically change the configuration. IBMprovides two commands to start and stop the instances so that you can update theconfiguration.
To administer Tivoli Event Integration Facility Receiver instances, use theeifutil.sh command.
To administer IBM Tivoli Monitoring Log File Agent instances, use the lfautil.shcommand.
Loading and streaming data 465

eifutil.sh command:
To administer EIF Receiver instances, use the eifutil.sh command.
Syntax
The eifutil.sh command has the following syntax and is in the<USER_HOME_REMOTE>/DataForwarders/EIFReceivers/utilities where<USER_HOME_REMOTE> is the directory on the remote host where the EIFReceiver instances are deployed:eifutil.sh -status|-start <Inst_ID>|-stop <Inst_ID>|-startAll|-stopAll|-restart<Inst_ID>|-restartAll
where <Inst_ID> is the ID for the specific EIF instance.
Parameters
-statusDisplays the status for the installed instances. For example:============================================================================COMPONENT Instance PID PORT STATUS============================================================================EIF Receiver eif_inst_1 13983 6601 UPEIF Receiver eif_inst_2 14475 6602 UPEIF Receiver eif_inst_3 14982 6603 UPEIF Receiver eif_inst_4 15474 6604 UPEIF Receiver eif_inst_5 15966 6605 UP============================================================================
-start <Inst_id>Starts the specified instance.
-stop <Inst_id>Stops the specified instance.
-startAllStarts all instances.
-stopAllStops all instances.
-restart<Inst_id>Restarts the specified instance.
-restartAllRestarts all the instances.
lfautil.sh command:
To administer IBM Tivoli Monitoring Log File Agent (LFA) instances, use thelfautil.sh command.
Syntax
The lfautil.sh command has the following syntax and is in the<USER_HOME_REMOTE>/utilities/ directory on the remote host where<USER_HOME_REMOTE> is the directory on the remote host where the LFAinstances are deployed:lfautil.sh -start|-stop|-status|-restart
466 IBM Operations Analytics - Log Analysis: Installation, Configuration, and Administration Guide

Parameters
-start Starts all the LFA instances on the remote host.
-stop Stops all the LFA instances on the remote host.
-statusDisplays the status for the LFA instances on the remote host. For example:==========================================COMPONENT PID STATUS==========================================Log File Agent 23995 UP==========================================
-restartRestarts the LFA instances on the remote host.
Loading batches of dataIn addition to streaming data directly, you can also load batches of historic data fortest or other purposes.
Generic ReceiverThe Generic Receiver is a component of IBM Operations Analytics - Log Analysisthat supports the REST interface for loading data into IBM Operations Analytics -Log Analysis. The REST API uses JSON (JavaScript Object Notation) as an inputand returns JSON as an output after the incoming logs are processed. If an erroroccurs, the API returns an error code and a message.
Processing a batch
Invoking the Generic Receiver API initiates the processing of a batch that iscontained in the Input JSON. Buffer a set of log records to create a batch and senddata in batches to IBM Operations Analytics - Log Analysis. The batches must besent in the order in which logs are generated for a specific data source. The size ofeach batch must be less than the batch size (500000 bytes) supported by IBMOperations Analytics - Log Analysis. At the minimum, you can send data for asingle log record in a batch. The Generic Receiver processes a batch by:v Splitting the batch into multiple log records by using the Splitter that was
specified during the creation of the SourceType from the Admin UIcorresponding to the data source
v Annotates every log record that is found by the Splitter by using the Annotatorthat is specified during the creation of the SourceType from the Admin UIcorresponding to the data source
v Indexing the annotated log record in the back-end search engine
As special cases, split and annotated steps are skipped if the Splitter or Annotatoris specified as null in the SourceType. Even if there is no data to split, you need tosend an empty string in the text field of the Input JSON.
Batching of data at the client might lead to an incomplete log record at the end ofthe batch. This incomplete log record gets buffered in IBM Operations Analytics -Log Analysis and stitched with the remaining data in the subsequent batch to forma complete log record. This stitching assumes that you are maintaining the logrecord order of the data that is sent to IBM Operations Analytics - Log Analysis. Ifthe order is not maintained, then logs are not correctly split into log records.
Loading and streaming data 467

Input JSON
The basic structure of an Input JSON file is:{"hostname": , (String)"logpath":" , (String)"batchsize": , (String)"inputType": // Optional (String) "LOGS";"flush": // Optional (boolean)"payload": // (JSONObject){"name1":"value1", // Optional......"nameN":"valueN" , // Optionaltext : "log record 1 log record 2 ..." (String)}}
The following parameters in the Input JSON are mandatory:hostname
The host name that corresponds to the data source for which you want toingest data.
logpathThe log path that corresponds to the data source for which you want toingest data.
batchsizeThe number of BYTES of logs that are sent in one batch to IBM OperationsAnalytics - Log Analysis (less than 500,000).
inputType The type of input data: LOGS.
flush flagA flag that indicates to the Generic Receiver whether the last record in thebatch is a complete log record. Typically, this flag would be set to true inthe last batch upon reaching the end of file.
payload.txtThis text contains the actual log records to be split, annotated, and indexedinto IBM Operations Analytics - Log Analysis. The text portion is split intolog records by the Splitter, annotated by the Annotator, and then indexed.If you do not have any log records, but want to index only structured(name-value pairs) data, you can specify this mandatory field as an emptystring.
More metadata (optional) to be indexed with every log record of the batch can bespecified as name-value pairs in the input JSON or the payload within the inputJSON. This metadata is applicable at the batch level. For posting distinct metadatafor each log record, send 1 log record at a time in the batch.
Post the input JSON to the following URL:http://<UNITY_HOST_NAME>:<UNITY_PORT>/Unity/DataCollector
where <UNITY_HOST_NAME> is the machine on which you installed IBM OperationsAnalytics - Log Analysis and <UNITY_PORT> is the port on which it is running. Thedefault port is 9988. The client (Java or Script) sending data into IBM OperationsAnalytics - Log Analysis needs to authenticate by using the form-based mechanismthat is implemented in IBM Operations Analytics - Log Analysis before the DataCollector API is invoked. Refer to the authentication and security design documentfor details.
468 IBM Operations Analytics - Log Analysis: Installation, Configuration, and Administration Guide

Output JSON
The output that is sent by the Generic Receiver after indexing logs contains thecount and detailed information on the failure cases in a JSON Array. The detailsinclude the actual logRecord, specific error message, and any exception. The basicstructure of an Output JSON file is:{"batchSize" : , // (int)"numFailures" : , // (int)"failures" : // (JSONArray)
[{"logRecord" : , // (JSONObject)"errorMessage": , // (String)"exception" : , // (JSONArray)},...{
}]}
Serviceability
As you send data into IBM Operations Analytics - Log Analysis, you mightencounter errors that occur before the incoming batch gets processed or errors thatoccur during processing of batch and indexing log records.
If errors occur before the incoming batch gets processed, the Generic receiverreturns an error code and message. To correct the problem, process the error code,make any required changes, and resend the data.
Possible causes for error code 400 (HttpServletResponse.SC_BAD_REQUEST)include:v Invalid input JSONv Input batch size is greater than what is supported (500000 bytes)v No data source is configured from the Admin UI for the host name and log path
combination that is sent in the input JSONv The input type (LOGS) specified in the batch does not match the value that is
specified in the logsource that is configured from the Admin UI
Possible causes for error code 500(HttpServletResponse.SC_INTERNAL_SERVER_ERROR) include:v An exception that is encountered in any of the steps of the ingestion pipeline
(for example, during splitting of a batch).v An internal IBM Operations Analytics - Log Analysis database-related error.v Any other exception in IBM Operations Analytics - Log Analysis.
If errors occur during processing of batch and indexing log records, the outputJSON provides details of indexing failure. To correct the problem, process the errorcode, make any required changes, and resend only the affected log records.Sending the same log record twice to IBM Operations Analytics - Log Analysisresults in duplicate records in the back-end index and duplicate records in thesearch results.
Loading and streaming data 469

Batch loading historic log data with the Data Collector clientUse the Data Collector client to ingest data in batch mode. Use this method toreview historic log data. This is the easiest method if you want to ingest large logfiles for historic analysis.
Before you begin
If you want to use the Data Collector client to load data from remote sources, youmust configure the data collector on the remote host before you can configure thelocal data collector as described here. For more information, see “Configuring theData Collector client to ingest data from remote hosts” on page 297.
About this task
If you want to load a log file that does not include time stamp information, ensurethat the values for timestamp and timestampFormat are configured injavaDatacollector.properties. IBM Operations Analytics - Log Analysis cannotindex log files without a time stamp, but if no time stamp information is found ina log file, the value that is configured in javaDatacollector.properties is used.
Procedure
To use the Data Collector client to load log file information, complete the followingsteps:1. In the Administrative Settings page, define an appropriate log file source.2. At the command line, navigate to the <HOME>/utilities/datacollector-client
directory.3. Update the configuration file that is used by the Data Collector client,
javaDatacollector.properties. Set the following properties, as appropriate:
logFileThe full path of the file you want to ingest.
servletURLThe URL of the Data Collector service.
userid The user ID for the Data Collector service.
passwordThe password for the Data Collector service.
datasourceThe datasource that you want to use to load data.
timestampThe time stamp to use if a time stamp is not found in the log file.
batchsizeThe number of BYTES of logs that are sent in one batch. The defaultvalue is 500,000.
keystoreThe full path to the keystore file.
inputType The valid input types are: LOGS, CONFIGFILES, SUPPORTDOCS. The defaultvalue is LOGS.
flush flagIf the default true is set, the client sends a flush signal to the Generic
470 IBM Operations Analytics - Log Analysis: Installation, Configuration, and Administration Guide

Receiver for the last batch of the file. If set to false, no flush signal issent when the end of file is reached.
The following sample javaDatacollector.properties file displays theconfiguration for loading the SystemOut.log log file.#Full path of the file you want to read and upload to UnitylogFile = SystemOut.log#The URL of the REST service. Update the host/port information if requiredservletURL = https://hostname:9987/Unity/DataCollector#The user ID to use to access the unity rest serviceuserid=unityuser#The password to use to access the unity rest servicepassword=passworddatasource=Systemout#Time stamp to use if your content can not find a time stamp in log record.The same time stamp would be used for all recordstimestamp = 01/16/2013 17:27:23:964 GMT+05:30#The number of BYTES of logs sent in one batch to Unitybatchsize = 500000#The full path to the keystore filekeystore = /home/unity/IBM/LogAnalysisTest/wlp/usr/servers/Unity/keystore/unity.ks#input data type - LOGS, CONFIGFILES, SUPPORTDOCSinputType = LOGS#flush flag:#true : (default) if the client should send a flush signal to the GenericReceiver for the last batch of this file
#false : if no flush signal to be sent upon reaching eod-of-fileflushflag = true#Other properties (name/value pairs, e.g. middleware = WAS) that you wantto add to all json records
#These properties need to be appropriately added to the index configuration
4. Ensure that the Data Collector client JAR file, datacollector-client.jar, hasexecute permissions.
5. Use the following command to run the Data Collector client with the correctinputs:<HOME>/ibm-java/bin/java-jar datacollector-client.jar
Results
After the task completes, the log file is indexed and can be searched in the Searchworkspace.
Configuring the Data Collector client to ingest data fromremote hosts
If you want to use the Data Collector client to collect data from a remote serverand return it to the local machine, you must configure the data collector on theremote host.
Before you begin
You must use the instance of IBM Java Runtime Engine (JRE) 1.8 that is installedby the remote installer. Before you configure the data collector, you must use theremote installer to install at least one instance of IBM Tivoli Monitoring Log FileAgent or the EIF Receiver on a remote machine. For more information, see theConfiguring data collection for scalability on multiple remote nodes topic in theInstallation Guide.
Loading and streaming data 471

About this task
To configure the Data Collector on the remote host, copy the data collector clientfiles from your local version of the data collector files to the remote host.
Procedure1. Copy the <HOME>/utilities/datacollector-client directory and all the files
that are contained in it from the local installation of IBM Operations Analytics -Log Analysis to the remote machine.
2. Add the location of the log and keystore files to thejavaDatacollector.properties file in the directory that you copied the datacollector to in the previous step. The keystore file is named unity.ks and it isavailable in the <Remote_install_dir>/LogAnalysis/store/ directory on theremote machine. Where <Remote_install_dir> is the directory where youinstalled the remote instance as described in the Prerequisites section here.
Results
After you complete the configuration, you must complete the Data Collectorconfiguration. For more information about how to do this, see “Batch loadinghistoric log data with the Data Collector client” on page 295. You must ensure thatthe remote installation uses the IBM Java Runtime Engine (JRE) 1.8 that is installedby the remote installer. IBM Java Runtime Engine (JRE) 1.8 is stored in the<Remote_install_dir>/LogAnalysis/ibm-java/ directory.
Data Collector propertiesBefore you can use the data collector to stream data or load a batch of historicdata, edit the javaDatacollector.props file.
The javaDatacollector.props file is in the <HOME>/IBM/LogAnalysis/utilitiesdatacollector-client folder.
The logFile, hostname, logpath, and keystore parameters are required.
The userid, password, and keystore parameters are automatically populated withthe default values that are created during the installation. If you want, you canchange these but you do not need to.
Table 113. Data Collector properties
Parameter Value
logFile The full path of the file you want to load.
servletURL The URL of the Data Collector service.
userid The user ID for the Data Collector service.
password The password for the Data Collector service.
datasource The datasource that you want to use to loaddata.
timestamp The time stamp to use if a time stamp is notfound in the log file.
batchsize The number of BYTES of logs sent in onebatch. The default value is 500,000.
keystore The full path to the keystore file.
inputType The valid input type is LOGS.
472 IBM Operations Analytics - Log Analysis: Installation, Configuration, and Administration Guide

Table 113. Data Collector properties (continued)
Parameter Value
flush flag If the default true is set, the client sends aflush signal to the Generic Receiver for thelast batch of the file. If set to false no flushsignal is sent when the end-of-file isreached.
Loading batches of historic data with the IBM TivoliMonitoring Log File Agent
You can use the IBM Tivoli Monitoring Log File Agent to load batches of historicdata for testing and other purposes.
Procedure1. Copy the log files that you want to load to a temporary directory on the IBM
Operations Analytics - Log Analysis server. For example, to upload a batch oflog files from an installation of WebSphere Application Server, you copy theSampleSystemOut.log file to the /tmp/logs/ directory.
2. Create a custom data source.3. Copy the log file to the directory that you specified in the logpath parameter
when you created the data source.
Extending storage space available to Apache SolrYou can add more Apache Solr storage directories outside the initial IBMOperations Analytics - Log Analysis Apache Solr installation location if the disk onwhich Apache Solr was installed reached maximum capacity.
Before you begin
Ensure that the Apache Solr storage directories are present on all Apache Solrservers and are writable.
About this task
Switching to a new Apache Solr directory is not instantaneous. Therefore, it is tomonitor the disk usage of your Apache Solr directory to ensure that extradirectories are added before the current storage directory reaches maximumcapacity.
Procedure
To enable the storage extension capability, complete the following steps.1. Stop IBM Operations Analytics - Log Analysis with the following command.
<HOME>/IBM/LogAnalysis/utilities/unity.sh -stop
2. Open the unitysetup.properties file in the <HOME>/IBM/LogAnalysis/wlp/usr/servers/Unity/apps/Unity.war/WEB-INF directory.
3. Add the following property to the directoryENABLE_STORAGE_RELOCATION=true
4. Create the following properties file<HOME>/solrConfigs/storageConfig.properties
Loading and streaming data 473

For example,/home/unity/IBM/LogAnalysis/solrConfigs/storageConfig.properties
5. Open the storageConfig.properties file and add the following property to thefile.SOLR_STORAGE_DIR=storage-path-on-solr-nodes
For example,SOLR_STORAGE_DIR=/opt/scala/ext_storage
6. Restart IBM Operations Analytics - Log Analysis with the following command.<HOME>/IBM/LogAnalysis/utilities/unity.sh -restart
Results
The new IBM Operations Analytics - Log Analysis configuration file enables thespecification of custom data storage locations. The new locations are written towhen IBM Operations Analytics - Log Analysis crosses the default boundary of 1day.
Changing the default boundary for creating Apache Solrcollections
You can change the default boundary that is associated with extending ApacheSolr storage space depending on your business needs.
Procedure1. Open the <HOME>/IBM/LogAnalysis/wlp/usr/servers/Unity/apps/Unity.war/
WEB-INF/unitysetup.properties file.2. Locate and modify the value of the COLLECTION_ASYNC_WINDOW property from the
default value of 1d (1 day).
Note: The minimum property size is 6h.The boundary size can be specified in minutes (m), hours (h), or days (d).
3. Restart IBM Operations Analytics - Log Analysis with the following command.<HOME>/IBM/LogAnalysis/utilities/unity.sh -restart
Changing the default password for the Data Collector and EIF ReceiverIf you want, you can change the default password that the Data Collector and EIFReceiver use to connect to IBM Operations Analytics. This is optional.
Changing the default EIF Receiver or Data Collector passwordYou can change the default password that the Data Collector and EIF Receiver useto connect to IBM Operations Analytics - Log Analysis.
About this task
After you install IBM Operations Analytics - Log Analysis, the EIF Receiver andthe Data Collector are configured to use the default user name and password toconnect to IBM Operations Analytics - Log Analysis. The encrypted passwords aredefined in the following files:v Data Collector client is named <HOME>/IBM/LogAnalysis/utilities/
datacollector-client/javaDatacollector.properties.
474 IBM Operations Analytics - Log Analysis: Installation, Configuration, and Administration Guide
v EIF Receiver is named<HOME>/IBM/LogAnalysis/UnityEIFReceiver/config/unity.conf.
IBM Operations Analytics - Log Analysis uses the Advanced Encryption Standard(AES) to encrypt and decrypt passwords for your installation, in the followingformat:password={aes}<Unique_string_of_alphanumeric_characters>
For example, the javaDatacollector.properties file uses the unityuser user ID toaccess the Data Collector server. In this example, IBM Operations Analytics - LogAnalysis uses the Advanced Encryption Standard (AES) to generate the followingpassword:{aes}7DB629EC03AABEC6C4484F160FB23EE8
The encrypted password is replicated to the configuration files for the DataCollector and the EIF Receiver.
Procedure1. To change the default password, use the unity_securityUtility.sh command.
For more information about this command, see “unity_securityUtility.shcommand” on page 234.
2. Update the configuration files for the Data Collector or the EIF Receiver.3. Optional: If you want to change the password on remote instances of the EIF
Receiver, complete the previous steps and copy the unity.conf file from the<HOME>/IBM/LogAnalysis/UnityEIFReceiver/config/ directory on the localmachine to the <remote_deployment_location>/LogAnalysis/DataForwarders/EIFReceivers/<eif_inst_#>/config/unity.conf directory on the remotemachine. Where <remote_deployment_location> is the directory on the remotemachine where you deployed the EIF instance. <eif_inst_#> is the folder that isused for the specific remote EIF instance.
Example
For example, you want to change the default password for the default user that theData Collector and EIF Receiver use to connect to IBM Operations Analytics - LogAnalysis to myNewPassword. Complete the following steps:1. Go to the IBM/LogAnalysis/utilities directory.2. Run the unity_securityUtility.sh command as follows:
[utilities]$ ./unity_securityUtility.sh encode myNewPasswordUsing keystore file unity.ks<HOME>/IBM/LogAnalysis/utilities/../wlp/usr/servers/Unity/
keystore/unity.ks{aes}E6FF5235A9787013DD2725D302F7D08
3. Copy the AES encrypted password to the relevant configuration files, forexample copy it to the Data Collector file. You must copy the complete,encrypted string from the command output, including the {aes} prefix. Forexample:{aes}E6FF5235A9787013DD2725D302F7D088
unity_securityUtility.sh commandYou can use the unity_securityUtility.sh command to change the password thatthe Data Collector and EIF Receiver use to connect to IBM Operations Analytics -Log Analysis.
Loading and streaming data 475
Syntax
The unity_securityUtility.sh command is in the <HOME>/IBM/LogAnalysis/utilities directory and it has the following syntax:unity_securityUtility.sh encode [textToEncode] [unity.ks]
Parameters
The unity_securityUtility.sh command has the following parameters:
encode
The encode action returns an AES encrypted version of the text that youenter as the text to encrypt.
[textToEncode]Use the [textToEncode] parameter to enter the password that you want toencrypt. If you do not specify a password for this parameter, IBMOperations Analytics - Log Analysis prompts you for one.
[unity.ks]
The unity.ks file is the default keystore that is generated automaticallyduring installation. It controls how the password is encrypted anddecrypted.
The unity.ks file is used to encrypt and decrypt passwords for thefollowing features:v Java data collector client in the <HOME>/IBM/LogAnalysis/utilities/
datacollector-client/javaDatacollector.properties file.v EIF Receiver in the <HOME>/IBM/LogAnalysis/utilities/
UnityEIFReceiver/config/unity.conf file.
For an example of how to use this command, see “Changing the default EIFReceiver or Data Collector password” on page 300.
Installing logstashInstalling logstash on a remote node extends IBM Operations Analytics - LogAnalysis functions so it can ingest and perform metadata searches against log datathat is acquired by logstash.
logstash 1.5.3 is bundled and installed with IBM Operations Analytics - LogAnalysis. You can install logstash on a local host but to improve systemperformance, install logstash on a remote node.
This document describes the version of logstash that is installed when you installIBM Operations Analytics - Log Analysis.
logstash is an open source tool for managing events and logs. It can be used tocollect logs, parse them, and send them to another tool such as IBM OperationsAnalytics - Log Analysis to store them for later use.
The logstash agent is an event pipeline that consists of three parts:1. Inputs2. Filters3. Outputs
476 IBM Operations Analytics - Log Analysis: Installation, Configuration, and Administration Guide

Inputs generate events. Filters modify events. Outputs send the event somewhere.For example, events can be sent to storage for future display or search, or to theIBM Operations Analytics - Log Analysis framework. Events can have a type,which is used to trigger certain filters. Tags can be used to specify an order forevent processing as well as event routing to specific filters and outputs.
logstash can be used as a "pre-processor" to analyze sources and provide asemi-structured or structured feed to IBM Operations Analytics - Log Analysis forthe purposes of searching and potential usage within custom analytics applications.
Note: To install logstash on a local node, use the remote installation feature andset the SSH configuration REMOTE_HOST value to localhost or IP Address/hostnameof the node. For more information about installing logstash on a remote node, see“Installing logstash on a remote node” on page 303.
For more information on logstash events, see the section the life of an event inlogstash at https://www.elastic.co/guide/en/logstash/current/index.html.
DependenciesSupported versions of logstash and its dependencies.
Supported logstash version
The supported version of logstash is 1.5.3.
Java version requirement
Open JDK 1.7.0_51 or higher.
DSV Toolkit requirement
DSV Toolkit v1.1.0.4 or higher for generating IBM Operations Analytics - LogAnalysis Insight Packs. The Insight Packs are used to index log records that havebeen annotated using logstash. You only require the DSV toolkit if you want to uselogstash to perform ingestion, splitting, annotating or for when the data being readby logstash is in DSV format. For more information on this user scenario, see“Configuring logstash for rapid annotation and pre-indexing processing” on page307.
Generic Annotation Insight Pack
Generic Annotation v1.1.0, or v1.1.1 (refresh 1) is recommended for the normalizedtimestamp splitter function, which recognizes a variety of timestamps.
Installing logstash on a remote nodeYou can install logstash on a remote node to improve system performance.
Before you begin
Ensure that the SSH user has the correct permissions for installation. For moreinformation about SSH configuration, see “Secure Shell (ssh) configuration forremote logstash” on page 304 in the Loading and streaming data guide.
Loading and streaming data 477

About this task
logstash is processor and system resource intensive. logstash can be installed onthe local host but to improve system performance, install logstash on a remotenode.
Procedure1. To install logstash, run the following command:
<HOME>/IBM/LogAnalysis/remote_install_tool/install.sh
2. The installation script installs logstash, and provides options to install the EIFreceivers and log file Agent. To select each option, including logstash, select yor Y.
3. Provide the path to the installation location on the remote host.
Results
logstash is installed in the <install-dir>/Logstash/logstash-1.5.3/ directory. Toconfirm the installation, logon to the remote node as the configured SSH user andgo to the installation location.
Note: To install logstash on a local node, use the remote installation feature andset the SSH configuration REMOTE_HOST value to localhost or IP Address/hostnameof the node.
Example
The following are example deployments:
logstash example:<install-dir>/Logstash/logstash-1.5.3/
Output plug-in configuration path:<install-dir>/Logstash/logstash-1.5.3/logstash-scala/logstash/config/logstash-scala.conf
Output plug-in jar directory<install-dir>/Logstash/logstash-1.5.3/logstash-scala/logstash/outputs
Secure Shell (ssh) configuration for remote logstashBefore you can use the remote installer utility, you must configure the SSH for theremote hosts.
The ssh_config.properties file is in the <HOME>/IBM/LogAnalysis/remote_install_tool/config directory. Configure the parameter values as outlined inTable 1.
The SSH communication can be based on a password or public key. If youimplement both options, the public key configurations are used by default.
To set up password-based SSH, you specify a value for the password and commentout the private key file. The remote installer utility uses the specified password forSSH authentication when it connects to the remote host.
478 IBM Operations Analytics - Log Analysis: Installation, Configuration, and Administration Guide

To set up private key file-based authentication, you specify the private key filepath and do not specify a value for the password. The utility uses the file to createa password-less SSH connection.
To set up command-line authentication, rename the ssh-config properties file ormove the properties file to a new location. By default the configurations areselected from the properties file. If the file is unavailable, the user is prompted forcommand-line input.
Table 114. ssh_config parameters
Parameter Value
REMOTE_HOST= <REMOTE SERVER IP/FQ HOSTNAME>
PORT= <SSH PORT>
THE DEFAULT VALUE IS 22
USER= <SSH_USER>
PASSWORD= <SSH PASSWORD>
logstash configurationlogstash can be configured as a log file agent to ingest logs from a number ofdifferent sources.
About this task
There are two established use cases for using logstash with IBM OperationsAnalytics - Log Analysis, these are:v Configuring logstash as an alternative to ITM LFAv Configuring logstash for rapid annotation and pre-indexing processing
Both use cases are described in this section.
Configuring logstash as an alternative to ITM LFAlogstash can be used as a log file agent to ingest logs from a number of differentsources. It can also support integration with numerous alternative log file agentssuch as Lumberjack, Minuswell, Beaver, and Syslog.
About this task
Log records are written to the IBM Operations Analytics - Log Analysis that thensends the message to the IBM Operations Analytics - Log Analysis server forannotating and indexing.
Procedure1. Update the logstash sample configuration file with your configuration
information, <logstash-install_dir>/LogStash/logstash-1.5.3/logstash-scala/logstash/config/logstash-scala.conf. Where <logstash-install_dir> ispath to where logstash is installed using the IBM Operations Analytics - LogAnalysis remote deploy toola. Define the input and filter in the logstash configuration file.
For example:input {file {type => "http"
Loading and streaming data 479

path => ["/tmp/myhttp.log"]}}filter{
mutate{replace => ["host","<hostname>"]replace => ["path","/tmp/apache.log"]
}}
Note: For Windows, the logstash file plug-in requires a drive letterspecification for the path, for example:path => ["c:/tmp/myhttp.log"]
b. Modify the logstash configuration file to add the scala output plug-in.The scala output plug-in buffers and sends the logstash event to the IBMOperations Analytics - Log Analysis server by using the Log Analysis serveringestion REST API. The logstash configuration file can contain one or morescala output plug-ins. The output plug-ins can be configured to write todifferent Log Analysis servers or to the same Log Analysis server with adifferent set of configurations.Every event that is sent to the scala output plug-in must contain at leastthe host and path fields. The values of these fields are used by the scalaoutput plug-in to determine the target data source for the event. Any eventthat does not contain either of these fields is dropped by the output plug-in.The following are the default parameters, with sample values, for the IBMOperations Analytics - Log Analysis scala output plug-in:output {scala {scala_url => "https://<la_server>:<port>/Unity/DataCollector"scala_user => "<LA_user>"scala_password => "<LA_Password>"scala_keystore_path => ""batch_size => 500000idle_flush_time => 5sequential_flush => truenum_concurrent_writers => 20use_structured_api => falsedisk_cache_path => "<install-dir>/Logstash/cache-dir"scala_fields =>
{"host1@path1,host2@path2"
=> "event_field11,event_field12,...,event_field1N""host3@path3"
=> "event_field21,event_field22,...,event_field2N"}
date_format_string => "yyyy-MM-dd’T’HH:mm:ssX"log_file => "<install-dir>/Logstash/logs/scala_logstash.log"log_level => "info"}
Where:v scala_url is the REST endpoint for the Log Analysis ingestion REST API.v scala_user is the Log Analysis user name.v scala_password is the Log Analysis user password.v scala_keystore_path is blank.v batch_size is the maximum number of bytes that can be buffered for a
data source before transmitting to the Log Analysis server. The default is500000 bytes.
480 IBM Operations Analytics - Log Analysis: Installation, Configuration, and Administration Guide

Note: Significantly decreasing the batch size impacts on throughput.Increasing the batch size requires more heap memory.
v idle_flush_time is the maximum time between successive datatransmissions for a data source.
v sequential_flush defines whether batches for each data source are sentsequentially. It is set to true to send the batches sequentially.
Note: Sequential sending is required when the input contains multi-linerecords that are combined in an Insight Pack in the Log Analysis server.
v num_concurrent_writers is the number of threads that concurrentlytransmit batches of data to the Log Analysis server.
v use_structured_api determines whether data is transmitted to the LogAnalysis server in the JSON format. It is set to true to transmit data in theJSON format.
Note: The target Log Analysis data source must be associated with asource type that uses the Log Analysis structured API.
v disk_cache_path is the path on the file system that temporarily buffersdata. The scala output plug-in writes data to this path beforetransmission. The available disk space under the path must be largeenough to store bursts of input data that is not immediately handled bythe Log Analysis server.
v scala_fields is the map that specifies the names of fields that must beretrieved from the incoming logstash event and transmitted to the LogAnalysis server. The keys for the map are a comma-separated list of hostand path names that correspond to a Log Analysis data source.The scala plug-in extracts the host and path fields from each eventbefore consulting the scala_fields map for a host and path combinationentry. If there is an entry with field names, the scala plug-in extracts thecorresponding field values from the event. The values are transmitted tothe Log Analysis server. If the host and path entries are not in thescala_fields map, the scala plug-in extracts the contents of the messagefield from the event and transmits it to the Log Analysis server.
v date_format_string is the string value that all fields are transformed tobefore transmission to the Log Analysis server. The scala plug-in uses thedate_format_string parameter to convert date values to the appropriatestring value.
v log_file is the file that is used for logging information from the scalaoutput plug-in.
v log_level is the level of logging information. The supported levels arefatal, error, warn, info, and debug.
2. Create a custom data source. For more information, see data source creation inthe Administering section.Ensure that the Hostname and File Path match the host and path that isspecified in the filter mutate section of logstash configuration file,logstash-scala.conf.Ensure that the Type matches the type of log file that is being ingested and isdefined in the filter mutate section, for example DB2Diag.For example, if you specified /tmp/myhttp.log as an input file, then create acustom data source with path set to /tmp/myhttp.log.
Loading and streaming data 481

What to do next
Start logstash.Related tasks:“logstash operations” on page 311You can use the logstash-util script to start, stop, restart, or provide the status oflogstash.
Configuring logstash for rapid annotation and pre-indexingprocessinglogstash can be used to split log records and do basic annotation. For log types notcurrently supported by IBM Operations Analytics - Log Analysis, this is analternative approach to writing AQL to annotate log files.
About this task
logstash includes a broad list of filtering, manipulation, and processing capabilities,for example, the grok filter can be used to parse text into structured data. You canuse it to match text without the need to master regular expressions. There areapproximately 120 grok patterns that are shipped by default, though you can addmore. It also includes patterns for known log file formats, such as Apache'scombined access log format.
In this scenario, you use the grok filter with logstash used as the splitter orannotator of the log file. The scala output plugin sends a single log record to theIBM Operations Analytics - Log Analysis EIF Receiver, with the annotations in adelimiter separated value (DSV) format. Then, using the DSV Toolkit, the usermust create and install an insight pack that matches the DSV format so that IBMOperations Analytics - Log Analysis can index the annotations.
Procedure1. To configure your logstash installation, specify the required values in the
<logstash_install>/Logstash/logstash-1.5.3/logstash-scala/logstash/config/logstash-scala.conf file.a. Define the input in the logstash configuration file.
For example:input {file {type => "apache"path => ["/tmp/logs/myapache.log"]}}
Note: For Windows, the logstash file plugin requires a drive letterspecification for the path, for example:path => ["C:/tmp/logs/myapache.log"]
b. Add a filter or filters to the logstash configuration file to identify thepattern of the log file format. This also creates the annotations. To triggerthe filter, the type must match the input type.For example:filter {
if [type] == "http" {grok {
match => ["message", "%{IP:client} %{WORD:method}%{URIPATHPARAM:request} %{NUMBER:bytes} %{NUMBER:duration}"]
482 IBM Operations Analytics - Log Analysis: Installation, Configuration, and Administration Guide

}}mutate{
replace => ["host","<hostname>"]replace => ["path","/tmp/apache.log"]
}}
In this example, the fields client, method, request, bytes, and duration areannotated by the pattern. However, only the fields client, method, andrequest are sent to IBM Operations Analytics - Log Analysis. Thus, those arethe only three annotations that can be included in the index configuration.The output module sends the event text in DSV format as:“client”, “method”, “request”
The user can also use one of the many predefined grok log format patternssuch as:filter {
if [type] == "apache" {grok {
match => ["message", "%{COMBINEDAPACHELOG}"]}}mutate{
replace => ["host","<hostname>"]replace => ["path","/tmp/apache.log"]
}}
c. In the output section of the configuration file, for {COMBINEDAPACHELOG}specify the scala_fieldsas follows:
scala_fields =>{
"<host>@<path>" => "clientip,ident,auth,timestamp,verb,request,httpversion,rawrequest,response,bytes,referrer,agent"
}
Where <host> and <path> are the values that are defined in the mutatesection of the grok filter.
2. Create an IBM Operations Analytics - Log Analysis DSV-generated Insight Packin order to index the annotated data in IBM Operations Analytics - LogAnalysis.You can use the ApacheDSV.properties file to create an Apache-based InsightPacks.For more information about theApacheDSV.properties file, seeApacheDSV.properties in the Reference section of the Extending guide.Edit this properties file to configure information about your IBM OperationsAnalytics - Log Analysis server:[SCALA_server]username: unityadminpassword: unityadminscalaHome: $HOME/IBM/LogAnalysis
Use the dsvGen.py script that is provided with the DSV Toolkit to generate anddeploy the Apache Insight Pack:python dsvGen.py <path>/ApacheDSV.properties -d
3. Create a custom data source. For more information, see data source creation inthe Administering section.Ensure that the Hostname and File Path match the host and path that isspecified in the filter mutate section of logstash configuration file,logstash-scala.conf.
Loading and streaming data 483

Ensure that the Type matches the type of log file that is being ingested and isdefined in the filter mutate section, for example DB2Diag.For example, if you specified /tmp/myhttp.log as an input file, then create acustom data source with path set to /tmp/myhttp.log.
What to do next
Start logstash. For more information on starting logstash, see logstash operations.Related tasks:“logstash operations” on page 311You can use the logstash-util script to start, stop, restart, or provide the status oflogstash.Related reference:ApacheDSV.propertiesYou can use this property file with the DSV tooling to generate an Insight Packassociated with the COMBINEDAPACHELOG grok pattern.
Example - Annotating Combined Apache log files:
Using logstash to annotate Apache log files.
Procedure
1. To configure your logstash installation, specify the required values in the<logstash_install>/Logstash/logstash-1.5.3/logstash-scala/logstash/config/logstash-scala.conf file.a. In the input section, specify the Apache log file to be monitored.
input {file {type => "apache"path => ["/tmp/apache.log"]}}
b. Add the logstash grok filter with the predefined COMBINEDAPACHELOG patternto annotate the Apache log files.For example:filter {if [type] == "apache" {grok {
match => ["message", "%{COMBINEDAPACHELOG}"]}}mutate{
replace => ["host","<hostname>"]replace => ["path","/tmp/apache.log"]
}}
The COMBINEDAPACHELOG pattern is defined as:COMBINEDAPACHELOG %{IPORHOST:clientip} %{USER:ident} %{USER:auth}\[%{HTTPDATE:timestamp}\] "(?:%{WORD:verb} %{NOTSPACE:request}(?: HTTP/%{NUMBER:httpversion})?|%{DATA:rawrequest})" %{NUMBER:response}(?:%{NUMBER:bytes}|-) %{QS:referrer} %{QS:agent}
For more information about Apache log files, see http://httpd.apache.org/docs/2.4/logs.html.The logstash event contains annotations for clientip, ident, auth,timestamp, verb, request, httpversion, rawrequest, response, bytes,referrer, and agent.
484 IBM Operations Analytics - Log Analysis: Installation, Configuration, and Administration Guide

c. Change the <hostname> and path value to the <hostname> of the logstashserver and path to the log file. For examplemutate{replace => ["host","<hostname>"]replace => ["path","/tmp/apache.log"]}
d. In the output section of the configuration file, specify the IBM OperationsAnalytics - Log Analysis output plug-in. The scala_fields in the outputplug-in must be defined as follows:
scala_fields =>{
"<host>@<path>" => "clientip,ident,auth,timestamp,verb,request,httpversion,rawrequest,response,bytes,referrer,agent"
}
Where <host> and <path> are the values defined in the mutate section of thegrok filter.
2. The ApacheDSV.properties file can be used with the DSV Toolkit to create anApache Insight Pack. For more information about the ApacheDSV.propertiesfile, see ApacheDSV.properties in the Reference section of the Extending guide. Editthis properties file to configure information about your IBM OperationsAnalytics - Log Analysis server:[SCALA_server]username: unityadminpassword: unityadminscalaHome: $HOME/IBM/LogAnalysis
3. Use the dsvGen.py script that is provided with the DSV Toolkit to generate anddeploy the Apache Insight Pack:python dsvGen.py <path>/ApacheDSV.properties -d
4. In the IBM Operations Analytics - Log Analysis Administrative Settings UI,create a data source, which has the Apache source type that is created by theDSV toolkit in step 3, in your logstash configuration file.
5. To start logstash with the configuration file, and start loading Apache log files,run the following command:<logstash_install>/utilities/logstash-util.sh start
Related reference:ApacheDSV.propertiesYou can use this property file with the DSV tooling to generate an Insight Packassociated with the COMBINEDAPACHELOG grok pattern.
logstash operationsYou can use the logstash-util script to start, stop, restart, or provide the status oflogstash.
About this task
You can use the logstash-util script for logstash process lifecycle management.
Procedure1. To start, stop, restart, or provide the status of logstash, run the following
command:<install-dir>/utilities/logstash-util.sh start| stop| restart| status
where <install-dir> is the name of the logstash installation location.
Loading and streaming data 485

2. To confirm that logstash is running, run the logstash-util script and use thestatus option. The status option also displays the logstash process identifier.
logstash best practicesBest practices for logstash based on information from their user community.
For performance reasons it is recommend that logstash be installed on a differentserver than IBM Operations Analytics - Log Analysis. logstash is processor,memory, and disk intensive if the annotation and indexing functions are utilized.
Users who have memory constraints do not use logstash as a forwarding agent.They do not install logstash on the end client servers. They use other applicationssuch as rsyslog to forward logs to a central server with logstash. Seehttps://support.shotgunsoftware.com/entries/23163863-Installing-logstash-Central-Server for an example configuration.
Users with logstash at the end client who are concerned about performance haveused applications such as Redis to forward logs to a central server with logstash.See the following for configuration of Redis http://www.linux-magazine.com/Online/Features/Consolidating-Logs-with-logstash .
To fine tune logstash, especially the startup time, users can tweak Java's minimumand maximum heap size with the -Xms and -Xmx flags. The -Xms parameter is theinitial Java memory heap size when the JVM is started, and the -Xmx parameter isthe maximum heap size.
ReferencesLinks for more information on the logstash application.
logstash website: http://logstash.net
Getting Started with logstash Guide:https://www.elastic.co/guide/en/logstash/current/getting-started-with-logstash.html
logstash Download: http://logstash.net (Click download button)
The logstash Book:http://www.logstashbook.com/
IBM Operations Analytics - Log Analysis wiki: http://www.ibm.com/developerworks/servicemanagement/ioa/log/downloads.html
IBM Operations Analytics - Log Analysis wiki: Logstash Toolkit Resources: https://www.ibm.com/developerworks/community/wikis/home?lang=en#!/wiki/IBM%20Log%20Analytics%20Beta/page/Logstash%20Toolkit%20Resources
Known issuesKnown issues when using logstash with IBM Operations Analytics - Log Analysis.
There are a number of known issues and their workarounds described in thissection. To get the latest information on any issues or workarounds, please consult
486 IBM Operations Analytics - Log Analysis: Installation, Configuration, and Administration Guide

the IBM Operations Analytics - Log Analysis wiki:https://www.ibm.com/developerworks/community/wikis/home?lang=en#!/wiki/IBM%20Log%20Analytics%20Beta/page/Welcome
Could not load FFI ProviderStarting logstash fails with the Ruby exception “Could not load FFI Provider”.
SymptomsThe Ruby exception “Could not load FFI Provider”.
CausesThe most common cause of this error is that /tmp is mounted with the noexec flag.
Resolving the problemYou can resolve this either by:v Making /tmp mounted without the noexec flagv Edit the startlogstash-scala script and amend the start command as follows:
LSCMD="$MYJAVA -jar -Djava.io.tmpdir=</some/tmp/dir> $LSJAR agent--pluginpath $PLUGPATH -f $CONF"
Where </some/tmp/dir> is a temporary directory.
Duplication of log records on the SCALA serverOn occasion, when the logstash agent is re-started, and the log file beingmonitored is updated (for example, via a streaming log), logstash will ingest theentire file again rather than restarting from where it stopped monitoring.
SymptomsThe problem results in a duplication of log records on the SCALA server.
CausesSeveral problems have been reported on the logstash forum (https://logstash.jira.com/secure/Dashboard.jspa) that its sincedb pointer (which tracks thelast monitored position in the log file) sometimes is not updated correctly. Inaddition, using control-C to terminate the logstash agent does not always killlogstash. The result is a "phantom" logstash agent that is still monitoring log files.This can also result in duplicate log records.
Resolving the problem1. A workaround to avoid duplicate log records after restarting logstash is to set
the sincedb_path parameter in the file plugin to /dev/null, thereby tellinglogstash to ignore tracking the last-monitored file position, and always startmonitoring from the end of the file. However, this will result in logstashignoring any updates to the log file while the logstash agent is down. Forexample, in logstash-scala.conf, update:input {
file {type => "apache"path => ["/tmp/logs/myapache.log"]sincedb_path => "/dev/null"
}}
Before re-starting logstash after making these configuration changes, you mayalso want to clean up any sincedb databases that were already created. Bydefault, the sincedb database is stored in the directory $HOME, and havefilenames starting with ".sincedb_".
Loading and streaming data 487

2. When terminating the logstash agent using control-C, verify that the logstashjava process was actually terminated. You can use the following command tosee if logstash is still running:
ps -ef | grep logstash
Logs do not appear in the Search UILog records are ingested by logstash, but do not appear in the IBM OperationsAnalytics - Log Analysis Search UI.
SymptomsLog records are ingested by logstash, but do not appear in the IBM OperationsAnalytics - Log Analysis Search UI.
CausesLog records ingested by logstash are forwarded to the IBM Operations Analytics -Log Analysis server for splitting and annotating, and indexing. If the IBMOperations Analytics - Log Analysis server goes down during this process, it ispossible to lose some log records.
488 IBM Operations Analytics - Log Analysis: Installation, Configuration, and Administration Guide

Notices
This information was developed for products and services that are offered in theUSA.
IBM may not offer the products, services, or features discussed in this document inother countries. Consult your local IBM representative for information on theproducts and services currently available in your area. Any reference to an IBMproduct, program, or service is not intended to state or imply that only that IBMproduct, program, or service may be used. Any functionally equivalent product,program, or service that does not infringe any IBM intellectual property right maybe used instead. However, it is the user's responsibility to evaluate and verify theoperation of any non-IBM product, program, or service.
IBM may have patents or pending patent applications covering subject matterdescribed in this document. The furnishing of this document does not grant youany license to these patents. You can send license inquiries, in writing, to:
IBM Director of LicensingIBM CorporationNorth Castle Drive, MD-NC119Armonk, NY 10504-1785United States of America
For license inquiries regarding double-byte character set (DBCS) information,contact the IBM Intellectual Property Department in your country or sendinquiries, in writing, to:
Intellectual Property LicensingLegal and Intellectual Property LawIBM Japan Ltd.19-21, Nihonbashi-Hakozakicho, Chuo-kuTokyo 103-8510, Japan
The following paragraph does not apply to the United Kingdom or any othercountry where such provisions are inconsistent with local law:INTERNATIONAL BUSINESS MACHINES CORPORATION PROVIDES THISPUBLICATION "AS IS" WITHOUT WARRANTY OF ANY KIND, EITHEREXPRESS OR IMPLIED, INCLUDING, BUT NOT LIMITED TO, THE IMPLIEDWARRANTIES OF NON-INFRINGEMENT, MERCHANTABILITY OR FITNESSFOR A PARTICULAR PURPOSE. Some states do not allow disclaimer of express orimplied warranties in certain transactions, therefore, this statement may not applyto you.
This information could include technical inaccuracies or typographical errors.Changes are periodically made to the information herein; these changes will beincorporated in new editions of the publication. IBM may make improvementsand/or changes in the product(s) and/or the program(s) described in thispublication at any time without notice.
Any references in this information to non-IBM websites are provided forconvenience only and do not in any manner serve as an endorsement of those
© Copyright IBM Corp. 2015 489

websites. The materials at those websites are not part of the materials for this IBMproduct and use of those websites is at your own risk.
IBM may use or distribute any of the information you supply in any way itbelieves appropriate without incurring any obligation to you.
Licensees of this program who wish to have information about it for the purposeof enabling: (i) the exchange of information between independently createdprograms and other programs (including this one) and (ii) the mutual use of theinformation which has been exchanged, should contact:
IBM Corporation2Z4A/10111400 Burnet RoadAustin, TX 78758 U.S.A.
Such information may be available, subject to appropriate terms and conditions,including in some cases, payment of a fee.
The licensed program described in this document and all licensed materialavailable for it are provided by IBM under terms of the IBM Customer Agreement,IBM International Program License Agreement or any equivalent agreementbetween us.
Any performance data contained herein was determined in a controlledenvironment. Therefore, the results obtained in other operating environments mayvary significantly. Some measurements may have been made on development-levelsystems and there is no guarantee that these measurements will be the same ongenerally available systems. Furthermore, some measurements may have beenestimated through extrapolation. Actual results may vary. Users of this documentshould verify the applicable data for their specific environment.
Information concerning non-IBM products was obtained from the suppliers ofthose products, their published announcements or other publicly available sources.IBM has not tested those products and cannot confirm the accuracy ofperformance, compatibility or any other claims related to non-IBM products.Questions on the capabilities of non-IBM products should be addressed to thesuppliers of those products.
All statements regarding IBM's future direction or intent are subject to change orwithdrawal without notice, and represent goals and objectives only.
All IBM prices shown are IBM's suggested retail prices, are current and are subjectto change without notice. Dealer prices may vary.
This information is for planning purposes only. The information herein is subject tochange before the products described become available.
This information contains examples of data and reports used in daily businessoperations. To illustrate them as completely as possible, the examples include thenames of individuals, companies, brands, and products. All of these names arefictitious and any similarity to the names and addresses used by an actual businessenterprise is entirely coincidental.
COPYRIGHT LICENSE:
490 IBM Operations Analytics - Log Analysis: Installation, Configuration, and Administration Guide

This information contains sample application programs in source language, whichillustrate programming techniques on various operating platforms. You may copy,modify, and distribute these sample programs in any form without payment toIBM, for the purposes of developing, using, marketing or distributing applicationprograms conforming to the application programming interface for the operatingplatform for which the sample programs are written. These examples have notbeen thoroughly tested under all conditions. IBM, therefore, cannot guarantee orimply reliability, serviceability, or function of these programs. The sampleprograms are provided "AS IS", without warranty of any kind. IBM shall not beliable for any damages arising out of your use of the sample programs.
© Copyright IBM Corp. 2015. All rights reserved.
TrademarksIBM, the IBM logo, and ibm.com are trademarks or registered trademarks ofInternational Business Machines Corp., registered in many jurisdictions worldwide.Other product and service names might be trademarks of IBM or other companies.A current list of IBM trademarks is available on the web at www.ibm.com/legal/copytrade.shtml.
Terms and conditions for product documentationPermissions for the use of these publications are granted subject to the followingterms and conditions.
Applicability
These terms and conditions are in addition to any terms of use for the IBMwebsite.
Personal use
You may reproduce these publications for your personal, noncommercial useprovided that all proprietary notices are preserved. You may not distribute, displayor make derivative work of these publications, or any portion thereof, without theexpress consent of IBM.
Commercial use
You may reproduce, distribute and display these publications solely within yourenterprise provided that all proprietary notices are preserved. You may not makederivative works of these publications, or reproduce, distribute or display thesepublications or any portion thereof outside your enterprise, without the expressconsent of IBM.
Rights
Except as expressly granted in this permission, no other permissions, licenses orrights are granted, either express or implied, to the publications or anyinformation, data, software or other intellectual property contained therein.
IBM reserves the right to withdraw the permissions granted herein whenever, in itsdiscretion, the use of the publications is detrimental to its interest or, asdetermined by IBM, the above instructions are not being properly followed.
Notices 491

You may not download, export or re-export this information except in fullcompliance with all applicable laws and regulations, including all United Statesexport laws and regulations.
IBM MAKES NO GUARANTEE ABOUT THE CONTENT OF THESEPUBLICATIONS. THE PUBLICATIONS ARE PROVIDED "AS-IS" AND WITHOUTWARRANTY OF ANY KIND, EITHER EXPRESSED OR IMPLIED, INCLUDINGBUT NOT LIMITED TO IMPLIED WARRANTIES OF MERCHANTABILITY,NON-INFRINGEMENT, AND FITNESS FOR A PARTICULAR PURPOSE.
IBM Online Privacy StatementPrivacy Policy Considerations
IBM Software products, including software as a service solutions, (“SoftwareOfferings”) may use cookies or other technologies to collect product usageinformation, to help improve the end user experience, to tailor interactions withthe end user, or for other purposes. In many cases no personally identifiableinformation is collected by the Software Offerings. Some of our Software Offeringscan help enable you to collect personally identifiable information. If this SoftwareOffering uses cookies to collect personally identifiable information, specificinformation about this offering's use of cookies is set forth below.
Depending upon the configurations deployed, this Software Offering may usesession and persistent cookies that collect each user's user name and password forpurposes of session management, authentication, enhanced user usability, andsingle sign-on configuration. These cookies cannot be disabled.
If the configurations deployed for this Software Offering provide you as customerthe ability to collect personally identifiable information from end users via cookiesand other technologies, you should seek your own legal advice about any lawsapplicable to such data collection, including any requirements for notice andconsent.
For more information about the use of various technologies, including cookies, forthese purposes, see IBM's Privacy Policy at http://www.ibm.com/privacy andIBM's Online Privacy Statement at http://www.ibm.com/privacy/details in thesection entitled “Cookies, Web Beacons and Other Technologies” and the “IBMSoftware Products and Software-as-a-Service Privacy Statement” athttp://www.ibm.com/software/info/product-privacy.
TrademarksIBM, the IBM logo, and ibm.com are trademarks or registered trademarks ofInternational Business Machines Corp., registered in many jurisdictions worldwide.Other product and service names might be trademarks of IBM or other companies.A current list of IBM trademarks is available on the Web at “Copyright andtrademark information” at www.ibm.com/legal/copytrade.shtml.
Adobe, Acrobat, PostScript and all Adobe-based trademarks are either registeredtrademarks or trademarks of Adobe Systems Incorporated in the United States,other countries, or both.
492 IBM Operations Analytics - Log Analysis: Installation, Configuration, and Administration Guide

Java and all Java-based trademarks and logos are trademarks or registeredtrademarks of Oracle and/or its affiliates.
Linux is a trademark of Linus Torvalds in the United States, other countries, orboth.
Microsoft, Windows, Windows NT, and the Windows logo are trademarks ofMicrosoft Corporation in the United States, other countries, or both.
UNIX is a registered trademark of The Open Group in the United States and othercountries.
Other product and service names might be trademarks of IBM or other companies.
Notices 493

494 IBM Operations Analytics - Log Analysis: Installation, Configuration, and Administration Guide


IBM®
Product Number:
Printed in USA