ibm ibm fairly valued buying index™ 4 value rating
TRANSCRIPT
Valuentum Retail Equity Research Ratings as of 15-Nov-2021 Data as of 15-Nov-2021
Buying Index™ 4 Value RatingEconomic CastleVery Attractive
Investment ConsiderationsDCF ValuationRelative Valuation
Stock Chart (weekly) ValueCreation™ValueRisk™ValueTrend™Cash Flow GenerationFinancial LeverageGrowthTechnical EvaluationRelative StrengthMoney Flow Index (MFI)Upside/Downside Volume (U/D)Near-term Technical Resistance, 10-wk MADCF = Discounted Cash Flow; MFI, U/D = Please see glossary. MA = Moving Average
Business Quality ValueCreation™
ValueRisk™ Very Poor Poor Good ExcellentCompany Vitals Investment HighlightsMarket Cap (USD) $106,525Avg Weekly Vol (30 wks) 23,29430-week Range (USD) 118.39 - 146.12Valuentum Sector Information Technology5-week Return -13.7%13-week Return -11.0%30-week Return -12.7%Dividend Yield % 5.5% Firms that generate economic profits with little operating variability score near the top right of the matrix.
Dividends per Share 6.56 Relative Valuation Forward P/E PEG Price / FV
Forward Dividend Payout Ratio 62.3% Alphabet 29.2 2.2 85.1%Est. Normal Diluted EPS 10.96 Amazon.com NMF 2.8 100.9%P/E on Est. Normal Diluted EPS 10.8 Apple 26.2 3.3 94.0%Est. Normal EBITDA 19,325 Microsoft 36.1 2.9 98.3%Forward EV/EBITDA 8.1 Peer Median 29.2 2.8 96.2%EV/Est. Normal EBITDA 8.0 IBM 11.3 1.7 86.7%Forward Revenue Growth (5-yr) 2.4% Price / FV = Current Stock Price divided by Estimated Fair Value
Forward EPS Growth (5-yr) 11.4% Financial Summary ProjectedNMF = Not Meaningful; Est. = Estimated; FY = Fiscal Year
Fiscal Year End: Dec-19 Dec-20 Dec-21
Returns Summary 3-year Historical Average Revenue 77,147 73,620 74,577Return on Equity 42.5% Revenue, YoY% -3.1% -4.6% 1.3%Return on Assets 5.8% Operating Income 9,894 6,160 12,237ROIC, with goodwill 15.8% Operating Margin % 12.8% 8.4% 16.4%ROIC, without goodwill 42.0% Net Income 9,435 5,501 9,306ROIC = Return on Invested Capital; NMF = Not Meaningful Net Income Margin % 12.2% 7.5% 12.5%Leverage, Coverage, and Liquidity Diluted EPS 10.57 6.14 10.53In Millions of USD Diluted EPS, YoY % 11.0% -41.9% 71.7%Total Debt 61,538 Free Cash Flow (CFO-capex) 11,863 14,967 11,049Net Debt 47,263 Free Cash Flow Margin % 15.4% 20.3% 14.8%Total Debt/EBITDA 4.8 In Millions of USD (except for per share items)
Net Debt/EBITDA 3.7 LARGE-CEBITDA/Interest 10.0 NEUTRALCurrent Ratio 1.0Quick Ratio 0.6
Structure of the Computer Hardware IndustryThe computer hardware space, which spans the personal computer to the iPhone and iPad, is highly competitive. The industry is characterized by frequent product introductions and rapid technological advances that can cause dramatic market share shifts. Though some firms benefit from a strong brand, participants often price aggressively, pressuring margins. Firms are also subject to potential component shortages/disruptions, which can punish performance. Obsolescence may be an eventuality for some, and services revenue has become critical for others. We’re neutral on the space.
NMF = Not Meaningful
The information and data contained in this report is not represented or warranted to be timely, complete, accurate, or correct. This report is for informational purposes only and should not be considered a solicitation to buy or sell a security. Before acting on any information in this report, you should consider whether the information is suitable for your particular circumstances and, if necessary, seek professional advice. Assumptions, opinions, and estimates are based on our judgment as of the date of the report and are subject to change without notice. Valuentum is not responsible for any errors or omissions or for results obtained from the use of this report. Redistribution is prohibited without written permission. To license Valuentum research, contact us at [email protected].
Medium
High
Low 1Very High
FAIRLY VALUEDATTRACTIVE
BEARISHWEAK
NEUTRALBEARISH
128.00
Visit us at www.valuentum.com
IBM IBM FAIRLY VALUED Estimated Fair Value Fair Value Range Investment Style Sector
EXCELLENTLOW
POSITIVE
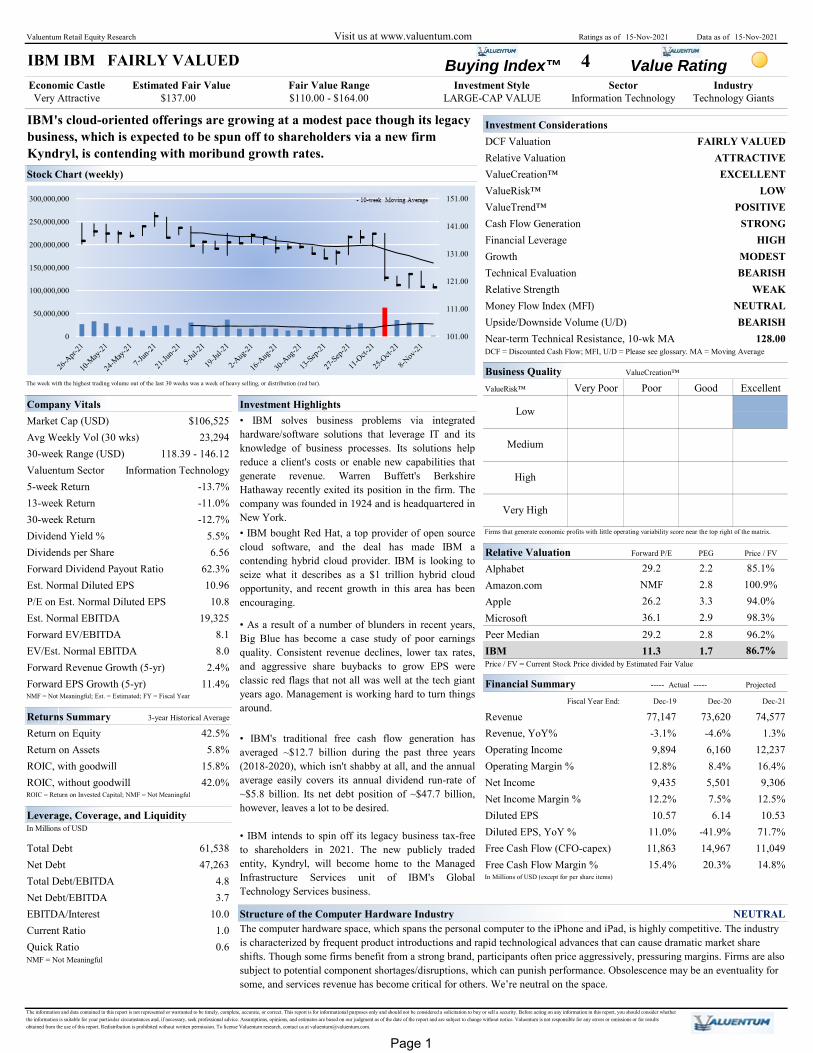
IBM's cloud-oriented offerings are growing at a modest pace though its legacy business, which is expected to be spun off to shareholders via a new firm Kyndryl, is contending with moribund growth rates.
Industry $137.00 $110.00 - $164.00 LARGE-CAP VALUE Information Technology Technology Giants
STRONGHIGH
MODEST
The week with the highest trading volume out of the last 30 weeks was a week of heavy selling, or distribution (red bar).
• IBM bought Red Hat, a top provider of open sourcecloud software, and the deal has made IBM acontending hybrid cloud provider. IBM is looking toseize what it describes as a $1 trillion hybrid cloudopportunity, and recent growth in this area has beenencouraging.
• As a result of a number of blunders in recent years,Big Blue has become a case study of poor earningsquality. Consistent revenue declines, lower tax rates,and aggressive share buybacks to grow EPS wereclassic red flags that not all was well at the tech giantyears ago. Management is working hard to turn thingsaround.
----- Actual -----
• IBM's traditional free cash flow generation hasaveraged ~$12.7 billion during the past three years(2018-2020), which isn't shabby at all, and the annualaverage easily covers its annual dividend run-rate of~$5.8 billion. Its net debt position of ~$47.7 billion,however, leaves a lot to be desired.
• IBM solves business problems via integratedhardware/software solutions that leverage IT and itsknowledge of business processes. Its solutions helpreduce a client's costs or enable new capabilities thatgenerate revenue. Warren Buffett's BerkshireHathaway recently exited its position in the firm. Thecompany was founded in 1924 and is headquartered inNew York.
• IBM intends to spin off its legacy business tax-freeto shareholders in 2021. The new publicly tradedentity, Kyndryl, will become home to the ManagedInfrastructure Services unit of IBM's GlobalTechnology Services business.
101.00
111.00
121.00
131.00
141.00
151.00
0
50,000,000
100,000,000
150,000,000
200,000,000
250,000,000
300,000,000
Page 1

Valuentum Retail Equity Research (10=best) Data as of 15-Nov-2021
Buying Index™ 4 Value RatingEconomic CastleVery Attractive
Economic Profit Analysis
ValueCreation™ EXCELLENT Return on Invested Capital (ROIC)
ROIC - WACC Spread, 3-year historical average 32.9%ROIC - WACC Spread, 5-year projected average 53.4%These spreads equal the firm's annual average ROIC (excluding goodwill) less its WACC.
ValueTrend™ POSITIVE
Weighted Average Cost of Capital (WACC) The graph above shows the firm's ROIC (excluding goodwill) compared with historical averages and its WACC.
ROIC CalculationFiscal Year End: Dec-18 Dec-19 Dec-20
Earnings before InterestOperating Income after Depreciation 12,191 9,894 6,160- Adjusted Taxes (at 15% of EBIT) 1,829 1,484 924+ Amortization 1,353 1,850 2,468+ Non-cash Operating Items 632 -720 5,912- Minority Interest 0 0 0Earnings before Interest 12,347 9,540 13,616
Cost of Equity Invested CapitalRisk Free Rate Assumption Inventories 1,682 1,619 1,839Fundamental Beta (ERP multiplier) + Receivables 8,175 9,603 7,846Estimated Equity Risk Premium + Current Deferred Income Taxes 0 0 0Cost of Equity Assumption + Other Current Assets 27,067 18,189 15,205
+ Property, Plant and Equipment, Net 10,792 10,010 10,040After-tax Cost of Debt + Goodwill, Net (Cost in Excess) 36,265 58,222 59,617Risk Free Rate Assumption + Intangibles 3,087 15,235 13,796Synthetic Credit Spread + Non Current Deferred Income Taxes 5,216 5,182 9,241Cost of Debt Assumption - Accounts Payable 6,558 4,896 4,908Cash Tax Rate Assumption - Other Current Liabilities 21,462 24,008 27,778After-tax Cost of Debt Assumption
Invested Capital, with goodwill 64,264 89,156 84,898Cost of Preferred Stock Invested Capital, without goodwill 27,999 30,934 25,281Preferred DividendsValue of Preferred Stock Return on Invested Capital, with goodwill 19.4% 12.4% 15.6%Cost of Preferred Assumption Return on Invested Capital, without goodwill 45.3% 32.4% 48.4%
In Millions of USD
Weighted Average Cost of Capital (WACC)ERP = Equity Risk Premium
The information and data contained in this report is not represented or warranted to be timely, complete, accurate, or correct. This report is for informational purposes only and should not be considered a solicitation to buy or sell a security. Before acting on any information in this report, you should consider whether the information is suitable for your particular circumstances and, if necessary, seek professional advice. Assumptions, opinions, and estimates are based on our judgment as of the date of the report and are subject to change without notice. Valuentum is not responsible for any errors or omissions or for results obtained from the use of this report. Redistribution is prohibited without written permission. To license Valuentum research, contact us at [email protected].
15.0%6.2%
00
NA
9.1%
1.06.5%
10.8%
4.3%3.00%
7.3%
IBM receives a ValueTrend™ rating of POSITIVE, which is based on the company'strailing three-year performance. The firm's ROIC (excluding goodwill) increased to48.4% last year from its trailing 3-year average of 42%. We expect ROIC (excludinggoodwill) to be in the ballpark of about 74% by the end of our discrete forecast period,with upside potential to about 86% over that time period.
---------- Actual ----------
4.3%
$137.00 $110.00 - $164.00 LARGE-CAP VALUE Information Technology Technology Giants
The best measure of a firm's ability to create value for shareholders is expressed bycomparing its return on invested capital (ROIC) with its weighted average cost ofcapital (WACC). The gap or difference between ROIC and WACC is called the firm'seconomic profit spread. IBM's 3-year historical return on invested capital (withoutgoodwill) is 42%, which is above the estimate of its cost of capital of 9.1%. As such,we assign the firm a ValueCreation™ rating of EXCELLENT. In the chart to the right,we show the probable path of ROIC in the years ahead based on the estimated volatilityof key drivers behind the measure. The solid grey line reflects the most likely outcome,in our opinion, and represents the scenario that results in our fair value estimate.
IBM IBM FAIRLY VALUED Estimated Fair Value Fair Value Range Investment Style Sector Industry
Note: Valuentum may provide an adjusted ROIC measure to better reflect the economic substance of a company's operations, as in the case of companies with negative invested capital.
85.8%
73.8%
45.3%
32.4%
48.4%
61.8%
WACC, 9.1%
0.0%
10.0%
20.0%
30.0%
40.0%
50.0%
60.0%
70.0%
80.0%
90.0%
100.0%
63.4%
36.6%
Equity
Debt
Preferred
Capital Structure
Page 2

Valuentum Retail Equity Research (10=best) Data as of 15-Nov-2021
Buying Index™ 4 Value RatingEconomic CastleVery Attractive
Growth Analysis
Revenue Growth MODEST Projected Revenue (in millions of USD) Source: Company Filings, Valuentum Projections
Last Fiscal Year
Revenue3-year Historical
CAGR5-year Projected
CAGRIBM USD 73,620 -2.4% 2.4%
Alphabet USD 182,527 18.1% 18.3%
Amazon.com USD 386,064 29.5% 16.7%
Apple USD 365,817 11.3% 6.1%
Microsoft USD 168,088 15.1% 11.5%
Peer Median 16.6% 14.1%
Industry Median 7.7% 11.6%
In the chart above, we show our baseline forecast for revenue as well as potential upside and downside cases.
EBITDA Growth Projected EBITDA (in millions of USD) Source: Company Filings, Valuentum Projections
Last Fiscal Year
EBITDA3-year Historical
CAGR5-year Projected
CAGRIBM USD 12,855 -4.7% 8.0%
Alphabet USD 54,921 15.3% 22.8%
Amazon.com USD 48,075 44.9% 26.3%
Apple USD 120,233 13.7% 6.4%
Microsoft USD 81,602 21.7% 13.7%
Peer Median 18.5% 18.2%
Industry Median 10.4% 13.9%
In the chart above, we show our baseline forecast for EBITDA as well as potential upside and downside cases.
Net Income Growth Projected Net Income (in millions of USD) Source: Company Filings, Valuentum Projections
Last Fiscal Year Net Income
3-year Historical CAGR
5-year Projected CAGR
IBM USD 5,501 -1.0% 9.4%
Alphabet USD 40,269 47.1% 21.8%
Amazon.com USD 21,331 91.6% 31.4%
Apple USD 94,680 16.7% 5.9%
Microsoft USD 61,271 54.6% 14.0%
Peer Median 50.8% 17.9%
Industry Median 17.5% 14.2%
In the chart above, we show our baseline forecast for net income as well as potential upside and downside cases.
IBM's EBITDA expansion has trailed both that of its peer group and its industry groupduring the past three years. We expect the firm's pace of EBITDA growth to fall belowthat of both its peer group and industry group during the next five years.Amazon.comsports the highest expected EBITDA growth rate among peers.
IBM's net income expansion has trailed both that of its peer group and its industrygroup during the past three years. We expect the firm's pace of net income growth tofall below that of both its peer group and industry group during the next five years.Amazon.com sports the highest expected net income growth rate among peers.
The information and data contained in this report is not represented or warranted to be timely, complete, accurate, or correct. This report is for informational purposes only and should not be considered a solicitation to buy or sell a security. Before acting on any information in this report, you should consider whether the information is suitable for your particular circumstances and, if necessary, seek professional advice. Assumptions, opinions, and estimates are based on our judgment as of the date of the report and are subject to change without notice. Valuentum is not responsible for any errors or omissions or for results obtained from the use of this report. Redistribution is prohibited without written permission. To license Valuentum research, contact us at [email protected].
$137.00 $110.00 - $164.00 LARGE-CAP VALUE Information Technology Technology Giants
IBM's revenue expansion has trailed the median of both its peer group and its industrygroup during the past three years. We expect the firm's pace of revenue growth to fallbelow the median of both its peer group and industry group during the next five years.Our growth assessment of each firm is based on the firm's 5-year forward revenueCAGR. IBM's future pace of revenue growth is MODEST, in our opinion.
IBM IBM FAIRLY VALUED Estimated Fair Value Fair Value Range Investment Style Sector Industry
79,591
77,147
73,620
86,789
82,959
79,130
65,000
70,000
75,000
80,000
85,000
90,000
16,671 15,953
12,855
21,891
18,846
15,800
0
5,000
10,000
15,000
20,000
25,000
8,7289,431
5,590
11,411
8,777
6,144
0
2,000
4,000
6,000
8,000
10,000
12,000
14,000
Page 3

Valuentum Retail Equity Research (10=best) Data as of 15-Nov-2021
Buying Index™ 4 Value RatingEconomic CastleVery Attractive
Cash Flow and Financial Leverage AnalysisCash Flow Generation STRONG Financial Leverage HIGH
The bars above show the firms operating cash flow, capital expenditures, and free cash flow, respectively. The bars above show the firm's annual debt-to-EBITDA. The red line shows the firm's normalized measure.
Cash Flow from Operations Projected Operating Cash Flow (in millions of USD) Source: Company Filings, Valuentum Projections
Last Fiscal Year CFO
3-year Historical CAGR
5-year Projected CAGR
IBM USD 18,197 2.9% -1.7%
Alphabet USD 65,124 20.6% 18.8%
Amazon.com USD 66,064 53.0% 19.5%
Apple USD 104,038 10.3% 8.7%
Microsoft USD 76,740 20.5% 14.9%
Peer Median 20.6% 16.8%
Industry Median 11.1% 14.5%
In the chart above, we show our baseline forecast for CFO as well as potential upside and downside cases.
Free Cash Flow (CFO-capital expenditures) Projected Free Cash Flow (in millions of USD) Source: Company Filings, Valuentum Projections
Last Fiscal Year FCF
3-year Historical CAGR
5-year Projected CAGR Source: Company Filings, Valuentum Projections
IBM USD 14,967 4.9% -6.4%
Alphabet USD 42,843 21.5% 20.6%
Amazon.com USD 25,924 58.8% 27.8%
Apple USD 92,953 13.2% 8.6%
Microsoft USD 56,078 20.2% 17.1%
Peer Median 20.9% 18.8%
Industry Median 10.0% 14.4%
In the chart above, we show our baseline forecast for free cash flow as well as potential upside and downside cases.
IBM's cash flow from operations expansion has trailed both that of its peer group andits industry group during the past three years. We expect the firm's pace of cash flowfrom operations growth to fall below that of both its peer group and industry groupduring the next five years. Amazon.com sports the highest expected cash flow fromoperations growth rate among peers.
IBM's free cash flow expansion has trailed both that of its peer group and its industrygroup during the past three years. We expect the firm's pace of free cash flow growth tofall below that of both its peer group and industry group during the next five years.Amazon.com sports the highest expected free cash flow growth rate among peers.
The information and data contained in this report is not represented or warranted to be timely, complete, accurate, or correct. This report is for informational purposes only and should not be considered a solicitation to buy or sell a security. Before acting on any information in this report, you should consider whether the information is suitable for your particular circumstances and, if necessary, seek professional advice. Assumptions, opinions, and estimates are based on our judgment as of the date of the report and are subject to change without notice. Valuentum is not responsible for any errors or omissions or for results obtained from the use of this report. Redistribution is prohibited without written permission. To license Valuentum research, contact us at [email protected].
$137.00 $110.00 - $164.00 LARGE-CAP VALUE Information Technology Technology Giants
Firms that generate a free cash flow margin (free cash flow divided by total revenue)above 5% are usually considered cash cows. IBM's free cash flow margin has averagedabout 16.6% during the past 3 years. As such, we think the firm's cash flow generationis relatively STRONG. The free cash flow measure shown above is derived by takingcash flow from operations less capital expenditures and differs from enterprise free cashflow (FCFF), which we use in deriving our fair value estimate for the company. Formore information on the differences between these two measures, please visit ourwebsite at Valuentum.com. At IBM, cash flow from operations increased about 19%from levels registered two years ago, while capital expenditures fell about 19% over thesame time period.
Firms that exhibit high leverage tend to be more risky than firms with relatively lowdebt loads, all else equal. We measure financial leverage by taking a firm's currenttotal debt load and dividing it by the firm's trailing average 3-year annual EBITDA.Firms that are over 3 for this metric, we rate as having high leverage. Companies thathave less than 1.5 turns of leverage (or a measure below 1.5), we rate as having lowleverage. IBM's normalized debt-to-EBITDA measure of about 4.06 puts it in theHIGH camp.
IBM IBM FAIRLY VALUED Estimated Fair Value Fair Value Range Investment Style Sector Industry
15,247 14,770
18,197
3,9642,907 3,230
11,283 11,863
14,967
Dec-18 Dec-19 Dec-20
Cash from Operations Capital Expenditures Free Cash FlowIBM - normalized
leverage, 4.06
0
1
2
3
4
5
6
12/31/2018 12/31/2019 12/31/2020
IBM- annual leverage IBM - normalized leverageMedium Threshold HighThreshold
15,247 14,770
18,197 18,499
16,71914,938
0
2,000
4,000
6,000
8,000
10,000
12,000
14,000
16,000
18,000
20,000
11,283 11,863
14,967
12,223
10,7659,306
0
2,000
4,000
6,000
8,000
10,000
12,000
14,000
16,000
Page 4

Valuentum Retail Equity Research (10=best) Data as of 15-Nov-2021
Buying Index™ 4 Value RatingEconomic CastleVery Attractive
Valuation Analysis
Valuation Assumptions Valuation BreakdownIn Millions of USD (except for per share items)
Revenue CAGR %Avg. EBIT Margin %Avg. Cash Tax Rate %Earnings Before Interest CAGR %Earnings Per Share CAGR %Free Cash Flow to the Firm CAGR %Earnings before interest = Net operating profits less adjusted taxes
Phase II --> III FCFF CAGR % 2.7% (II) 3% (III)Cost of Equity %After-tax Cost of Debt %Discount Rate (WACC) %Synthetic credit spread = 3%
Phase I Present ValuePhase II Present ValuePhase III Present ValueTotal Firm Value
Net Balance Sheet Impact
Total Equity ValueDiluted Shares OutstandingFair Value per Share
DCF Valuation Summary Enterprise Free Cash FlowFiscal Year End: 12/31/2018 12/31/2019 12/31/2020
12,347 9,540 13,6163,127 4,209 4,2273,964 2,907 3,230-839 2,515 -4,073
- Acquisitions 0 32,630 33612,349 -24,303 18,350
In Millions of USD
Source: Company Filings, Valuentum Projections
Company NameValuentum Buying
Index™Forward Price-to-
Earnings
Price/Earnings-to-Growth (PEG), 5-
yearEV/Est. Normal
EBITDA
5-year Forward Earnings per Share CAGR
3-year Hist Avg ROIC, without
goodwillDividend Yield
%
Stock Price / Fair Value Estimate
IBM 4 11.3 1.7 8.0 11.4% 42.0% 5.5% 86.7%
Alphabet 6 29.2 2.2 15.6 22.4% 67.5% 0.0% 85.1%
Amazon.com 6 NMF 2.8 17.1 30.1% 25.9% 0.0% 100.9%
Apple 6 26.2 3.3 17.5 8.1% 34.8% 0.6% 94.0%
Microsoft 6 36.1 2.9 20.1 14.5% 64.9% 0.7% 98.3%
Peer Median 6.0 29.2 2.8 17.3 18.5% 49.8% 0.3% 96.2%
Industry Median 6.0 23.7 2.4 14.9 15.6% 62.8% 0.6% 99.1%
View back of report for a full list of industry constituents covered by Valuentum. VBI: Valuentum's ranking for the attractiveness of this investment at the date of the report.
The information and data contained in this report is not represented or warranted to be timely, complete, accurate, or correct. This report is for informational purposes only and should not be considered a solicitation to buy or sell a security. Before acting on any information in this report, you should consider whether the information is suitable for your particular circumstances and, if necessary, seek professional advice. Assumptions, opinions, and estimates are based on our judgment as of the date of the report and are subject to change without notice. Valuentum is not responsible for any errors or omissions or for results obtained from the use of this report. Redistribution is prohibited without written permission. To license Valuentum research, contact us at [email protected].
27.0 26.3
25.1 23.2
19.9 16.9
23.2 19.6
36.0 27.8
21.8 20.1
Company Metrics versus Peer and Industry Medians
P/E on Est. Normal Diluted EPS Forward EV/EBITDA
10.8 8.1
In addition to the firm's cap structure, the net balance sheet impact considers the funded status of the firm's pension (-1034). In Millions of USD
---------- Actual ----------
We think IBM is worth $137 per share with a fair value range of $110.00 - $164.00.The margin of safety around our fair value estimate is driven by the firm's LOWValueRisk™ rating, which is derived from an evaluation of the historical volatility ofkey valuation drivers and a future assessment of them. Our near-term operatingforecasts, including revenue and earnings, do not differ much from consensus estimatesor management guidance. Our model reflects a compound annual revenue growth rateof 2.4% during the next five years, a pace that is higher than the firm's 3-year historicalcompound annual growth rate of -2.4%. Our model reflects a 5-year projected averageoperating margin of 15.8%, which is above IBM's trailing 3-year average. Beyond year5, we assume free cash flow will grow at an annual rate of 2.7% for the next 15 yearsand 3% in perpetuity. For IBM, we use a 9.1% weighted average cost of capital todiscount future free cash flows.
Earnings before Interest+ Depreciation - Capital Expenditures - Change in Working Capital
Enterprise Free Cash Flow (FCFF)
Our future forecasts for key valuation drivers result in a future free enterprise cashflow stream. Above, we show how we calculate enterprise free cash flow and thehistorical performance of the metric for IBM. Over the next five years, we expect thefirm's enterprise free cash flow to expand at about a -8% compound annual growthrate. During years 6 through 20, we expect the measure to grow at a 2.7% rate.Beyond year 20 (in perpetuity), we grow the firm's free cash flow at inflation (3%).
-48,297
122,464896.6
$137.00
72,71251,680
170,761
9.1%Results46,370
-0.7%11.4%-8.4%
Long-term Projections
10.8%6.2%
$137.00 $110.00 - $164.00 LARGE-CAP VALUE Information Technology Technology Giants
5-year Projections In the chart below, we show the build up to our estimate of total enterprise value forIBM and the break down to the firm's total equity value, which we estimate to beabout 122.46USD billion. The present value of the enterprise free cash flowsgenerated during each phase of our model and the net balance sheet impact, whichconsiders the firm's pension, is displayed. We divide total equity value by dilutedshares outstanding to arrive at our $137 per share fair value estimate.
2.4%15.8%15.0%
IBM IBM FAIRLY VALUED Estimated Fair Value Fair Value Range Investment Style Sector Industry
46,370
72,712
51,68048,297
122,464
0
20,000
40,000
60,000
80,000
100,000
120,000
140,000
160,000
180,000
Yr 1-5 Yr 6-20 Perpetuity Net Balance SheetImpact
Equity Value
Page 5
Valuentum Retail Equity Research (10=best) Data as of 15-Nov-2021
Buying Index™ 4 Value RatingEconomic CastleVery Attractive
Margin of Safety Analysis
Range of Potential Outcomes ValueRisk™ LOW
Revenue Volatility 3.7%Gross Margin Volatility 1.6%Earnings (EBI) Volatility 13.0%Cash Flow (FCFF) Volatility Greater than 50%Fair Value Range 20.0%The Fair Value Range sets the premium or discount on our estimate of the firm's fair value.
Upside and Downside ProbabilitiesProbability (fair value < $0) Less than 0.1%Probability (fair value > 2x current share price) 0.01%
Future Path of Fair Value
The graph above shows the expected future fair value of the firm's shares relative to its current stock price.
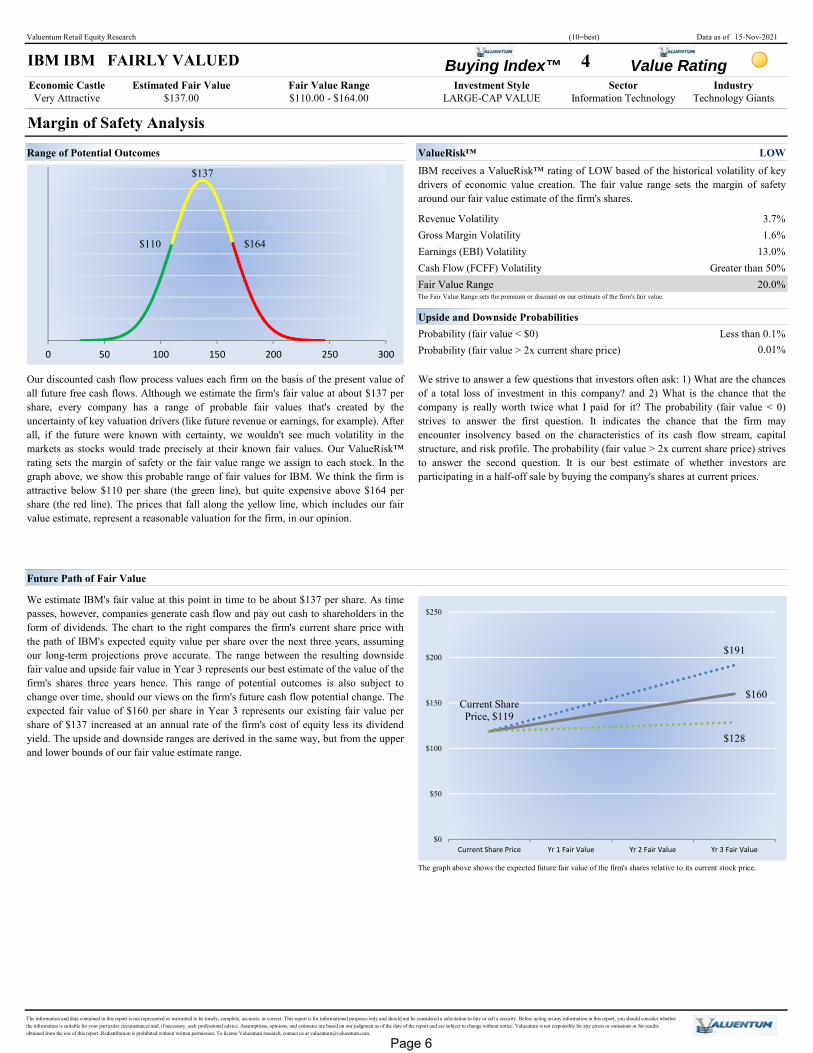
Our discounted cash flow process values each firm on the basis of the present value ofall future free cash flows. Although we estimate the firm's fair value at about $137 pershare, every company has a range of probable fair values that's created by theuncertainty of key valuation drivers (like future revenue or earnings, for example). After all, if the future were known with certainty, we wouldn't see much volatility in themarkets as stocks would trade precisely at their known fair values. Our ValueRisk™rating sets the margin of safety or the fair value range we assign to each stock. In thegraph above, we show this probable range of fair values for IBM. We think the firm isattractive below $110 per share (the green line), but quite expensive above $164 pershare (the red line). The prices that fall along the yellow line, which includes our fairvalue estimate, represent a reasonable valuation for the firm, in our opinion.
We strive to answer a few questions that investors often ask: 1) What are the chancesof a total loss of investment in this company? and 2) What is the chance that thecompany is really worth twice what I paid for it? The probability (fair value < 0)strives to answer the first question. It indicates the chance that the firm mayencounter insolvency based on the characteristics of its cash flow stream, capitalstructure, and risk profile. The probability (fair value > 2x current share price) strivesto answer the second question. It is our best estimate of whether investors areparticipating in a half-off sale by buying the company's shares at current prices.
We estimate IBM's fair value at this point in time to be about $137 per share. As timepasses, however, companies generate cash flow and pay out cash to shareholders in theform of dividends. The chart to the right compares the firm's current share price withthe path of IBM's expected equity value per share over the next three years, assumingour long-term projections prove accurate. The range between the resulting downsidefair value and upside fair value in Year 3 represents our best estimate of the value of thefirm's shares three years hence. This range of potential outcomes is also subject tochange over time, should our views on the firm's future cash flow potential change. Theexpected fair value of $160 per share in Year 3 represents our existing fair value pershare of $137 increased at an annual rate of the firm's cost of equity less its dividendyield. The upside and downside ranges are derived in the same way, but from the upperand lower bounds of our fair value estimate range.
The information and data contained in this report is not represented or warranted to be timely, complete, accurate, or correct. This report is for informational purposes only and should not be considered a solicitation to buy or sell a security. Before acting on any information in this report, you should consider whether the information is suitable for your particular circumstances and, if necessary, seek professional advice. Assumptions, opinions, and estimates are based on our judgment as of the date of the report and are subject to change without notice. Valuentum is not responsible for any errors or omissions or for results obtained from the use of this report. Redistribution is prohibited without written permission. To license Valuentum research, contact us at [email protected].
$137.00 $110.00 - $164.00 LARGE-CAP VALUE Information Technology Technology Giants
IBM receives a ValueRisk™ rating of LOW based of the historical volatility of keydrivers of economic value creation. The fair value range sets the margin of safetyaround our fair value estimate of the firm's shares.
IBM IBM FAIRLY VALUED Estimated Fair Value Fair Value Range Investment Style Sector Industry
$110
$137
$164
0 50 100 150 200 250 300
$191
$160Current Share Price, $119
$128
$0
$50
$100
$150
$200
$250
Current Share Price Yr 1 Fair Value Yr 2 Fair Value Yr 3 Fair Value
Page 6

Valuentum Retail Equity Research (10=best) Data as of 15-Nov-2021
Buying Index™ 4 Value RatingEconomic CastleVery Attractive
Technical Analysis
Technical Evaluation BEARISH Money Flow Index (MFI) NEUTRAL
30-week Price and Volume Chart (weekly)Relative Price Strength WEAK
5-week Company Performance -13.7%5-week Market Benchmark Performance 2.5%5-week Relative Performance vs. Market Benchmark -16.2%13-week Company Performance -11.0%13-week Market Benchmark Performance 1.4%13-week Relative Performance vs. Market Benchmark -12.4%30-week Company Performance -12.7%30-week Market Benchmark Performance 13.0%30-week Relative Performance vs. Market Benchmark -25.7%
Upside/Downside Volume BEARISH Timeliness Matrix™ Equity Valuation
Relative Strength
Firms that are undervalued and currently showing near-term pricing strength score near the top right of the matrix.
The information and data contained in this report is not represented or warranted to be timely, complete, accurate, or correct. This report is for informational purposes only and should not be considered a solicitation to buy or sell a security. Before acting on any information in this report, you should consider whether the information is suitable for your particular circumstances and, if necessary, seek professional advice. Assumptions, opinions, and estimates are based on our judgment as of the date of the report and are subject to change without notice. Valuentum is not responsible for any errors or omissions or for results obtained from the use of this report. Redistribution is prohibited without written permission. To license Valuentum research, contact us at [email protected].
Weak 1Companies that are undervalued and showing near-term relative price strength couldrepresent timely buys, as the stock may be attractive to both value and momentuminvestors. A cross section of the firm's equity valuation and its relative share pricestrength is shown in the matrix above. We tend to prefer undervalued stocks that have strong pricing momentum, also called Valuentum stocks.
The level and trend of the Upside/Downside (U/D) volume ratio reveals whetherinstitutional participation has been bullish or bearish as of late. IBM's U/D volume ratioof 0.5 is not only less than 1 but also is lower than its trailing average, indicatingBEARISH institutional interest during the past several weeks.
Strong
Neutral
The firm's near-term moving average (5-week, grey line) and medium-term movingaverage (13-week, red line) are shown in the chart above. Typically, when a shorter-term moving average crosses a medium- or longer-term moving average from below, itrepresents a bullish signal. If the short-term moving average crosses from above, tradersoften view this as bearish. IBM's 5-week moving average is below its 13-week measure,indicating a BEARISH trend. This activity further confirms the company's 30-weekdowntrend.
The Money Flow Index (MFI) is an oscillator that uses price and volume to measurebuying and selling pressure. Chartists often look for overbought (above 80) andoversold (below 20) levels to warn of unsustainable near-term price extremes. IBM'sMFI of 30 (green line) is neutral, suggesting the firm's stock is neither overbought nor oversold at this time. However, a score below 50 tends to favor bears. The MFI canalso be used to gauge the strength or weakness of a firm's price trend. In IBM's case,its stock price and money flow neither reveals a bullish nor bearish divergence,further supporting our neutral view on its money flow action.
A firm's relative price strength can be assessed over any number of time horizons. Weshow the firm's performance over the past 5 weeks, 13 weeks, and 30 weeks below.In arriving at our relative strength rating for each company, we assess the past 13weeks, which includes the market's reaction to the firm's most recently reportedquarter, where applicable, and other more recent economic events. During the past 13weeks, IBM's shares returned -11%, while the market benchmark returned 1.4%. Wethink IBM's 13-week relative price performance is WEAK.
In the chart above, we pinpoint the heaviest accumulation or distribution week of thefirm, determined by the week with the highest trading volume during the past 30 weeks.A heavy accumulation (buying) or distribution (selling) week often determines thefuture near-term direction of the firm's share price, as money managers continue tomove in or out of the stock in the days and weeks ahead driving the stock up or down,respectively. For IBM, the week with the highest trading volume out of the last 30weeks was a week of heavy selling, or distribution (red bar). Such market activity couldindicate a reversal of an uptrend or further confirmation of a downtrend.
Overvalued Fairly Valued Undervalued
Estimated Fair Value Fair Value Range Investment Style Sector Industry $137.00 $110.00 - $164.00 LARGE-CAP VALUE Information Technology Technology Giants
IBM IBM FAIRLY VALUED
101
111
121
131
141
151
0
50,000,000
100,000,000
150,000,000
200,000,000
250,000,000
300,000,000
5-week Moving Average 13-week Moving
Average
Stock Price
109114119124129134139144149
Overbought Line
Oversold Line
55
30
0102030405060708090
1.3
0.5
Average, 0.9
0.0
0.2
0.4
0.6
0.8
1.0
1.2
1.4
- 10-week Moving Average
Page 7
Valuentum Retail Equity Research (10=best) Data as of 15-Nov-2021
Buying Index™ 4 Value RatingEconomic CastleVery Attractive
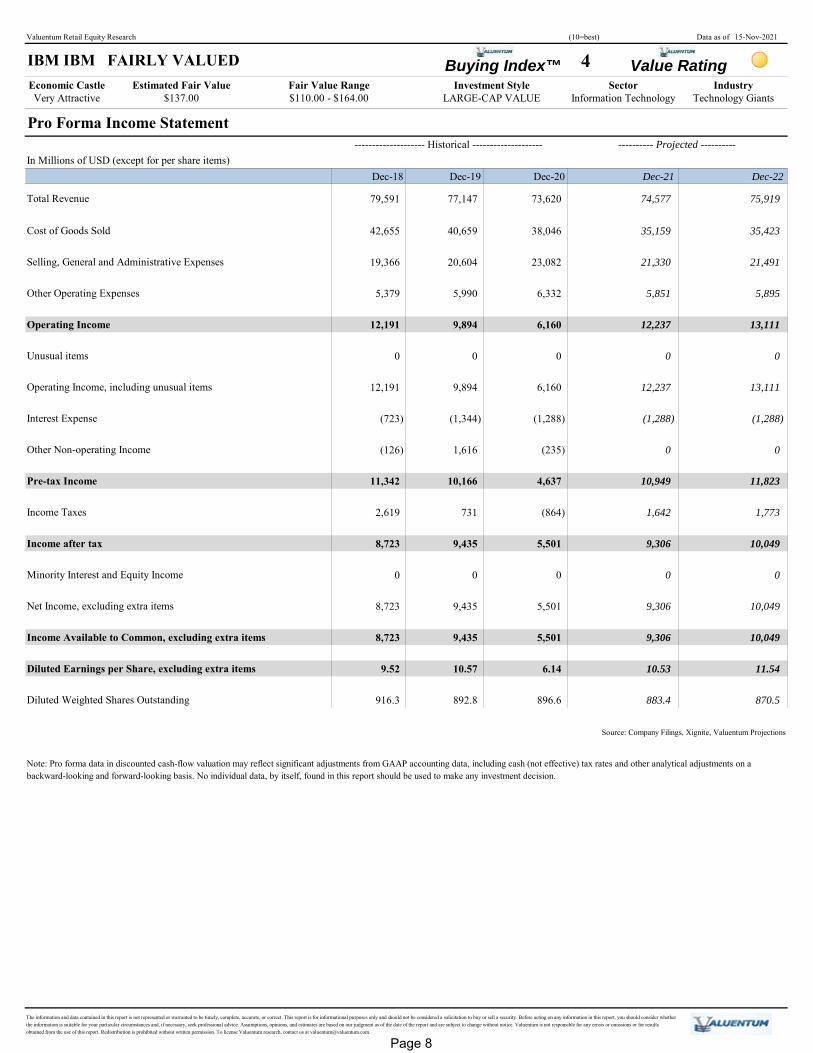
Pro Forma Income Statement -------------------- Historical --------------------
In Millions of USD (except for per share items)Dec-18 Dec-20
Total Revenue 79,591 73,620
Cost of Goods Sold 42,655 38,046
Selling, General and Administrative Expenses 19,366 23,082
Other Operating Expenses 5,379 6,332
Operating Income 12,191 6,160
Unusual items 0 0
Operating Income, including unusual items 12,191 6,160
Interest Expense (723) (1,288)
Other Non-operating Income (126) (235)
Pre-tax Income 11,342 4,637
Income Taxes 2,619 (864)
Income after tax 8,723 5,501
Minority Interest and Equity Income 0 0
Net Income, excluding extra items 8,723 5,501
Income Available to Common, excluding extra items 8,723 5,501
Diluted Earnings per Share, excluding extra items 9.52 6.14
Diluted Weighted Shares Outstanding 916.3 896.6
Source: Company Filings, Xignite, Valuentum Projections
892.8 883.4 870.5
The information and data contained in this report is not represented or warranted to be timely, complete, accurate, or correct. This report is for informational purposes only and should not be considered a solicitation to buy or sell a security. Before acting on any information in this report, you should consider whether the information is suitable for your particular circumstances and, if necessary, seek professional advice. Assumptions, opinions, and estimates are based on our judgment as of the date of the report and are subject to change without notice. Valuentum is not responsible for any errors or omissions or for results obtained from the use of this report. Redistribution is prohibited without written permission. To license Valuentum research, contact us at [email protected].
10.57 10.53 11.54
9,435 9,306 10,049
9,435 9,306 10,049
0 0 0
9,435 9,306 10,049
731 1,642 1,773
10,166 10,949 11,823
1,616 0 0
(1,344) (1,288) (1,288)
0 0 0
9,894 12,237 13,111
9,894 12,237 13,111
5,990 5,851 5,895
40,659 35,159 35,423
20,604 21,330 21,491
77,147 74,577 75,919
Dec-19 Dec-21 Dec-22
$137.00 $110.00 - $164.00 LARGE-CAP VALUE Information Technology Technology Giants
---------- Projected ----------
IBM IBM FAIRLY VALUED Estimated Fair Value Fair Value Range Investment Style Sector Industry
Note: Pro forma data in discounted cash-flow valuation may reflect significant adjustments from GAAP accounting data, including cash (not effective) tax rates and other analytical adjustments on a backward-looking and forward-looking basis. No individual data, by itself, found in this report should be used to make any investment decision.
Page 8

Valuentum Retail Equity Research (10=best) Data as of 15-Nov-2021
Buying Index™ 4 Value RatingEconomic CastleVery Attractive
Pro Forma Balance Sheet -------------------- Historical --------------------
In Millions of USD (except for per share items)Dec-18 Dec-20
AssetsTotal Cash (including marketable securities) 12,222 14,275Inventory 1,682 1,839Accounts Receivable 8,175 7,846Other Current Assets 27,067 15,205Total Current Assets 49,146 39,165
Gross Fixed Assets 32,460 33,176(Accumulated Depreciation) (21,668) (23,136)Net Property, Plant, and Equipment 10,792 10,040
Goodwill, Net 36,265 59,617Intangibles, Net 3,087 13,796Other Long-term Assets 24,092 33,353Total Assets 123,382 155,971
LiabilitiesAccounts Payable 6,558 4,908Other Current Liabilities 21,462 27,778Current Portion of Long-term Debt 10,207 7,183Total Current Liabilities 38,227 39,869
Long-term Debt 35,605 54,355Other Long-term Liabilities 32,755 41,149Total Liabilities 106,587 135,373
Preferred Stock 0 0
Shareholders' EquityCommon Stock and Additional Paid in Capital 55,151 56,556Retained Earnings 159,206 162,717Other Equity (197,562) (198,675)Total Shareholders' Equity 16,795 20,598
Total Liabilities and Shareholders' Equity 123,382 155,971
Source: Company Filings, Xignite, Valuentum Projections
The information and data contained in this report is not represented or warranted to be timely, complete, accurate, or correct. This report is for informational purposes only and should not be considered a solicitation to buy or sell a security. Before acting on any information in this report, you should consider whether the information is suitable for your particular circumstances and, if necessary, seek professional advice. Assumptions, opinions, and estimates are based on our judgment as of the date of the report and are subject to change without notice. Valuentum is not responsible for any errors or omissions or for results obtained from the use of this report. Redistribution is prohibited without written permission. To license Valuentum research, contact us at [email protected].
152,186 157,274 159,030
(198,008) (200,735) (203,272)20,841 22,049 23,737
55,895 56,556 56,556162,954 166,228 170,453
0 0 0
131,345 135,225 135,292
54,102 54,355 54,35539,542 41,149 41,149
37,701 39,721 39,788
24,008 27,991 27,9718,797 7,183 7,183
4,896 4,547 4,634
152,186 157,274 159,030
15,235 11,328 8,86030,299 33,353 33,353
10,010 10,119 10,774
58,222 59,617 59,617
32,028 37,537 42,551(22,018) (27,418) (31,777)
18,189 15,205 15,20538,420 42,857 46,425
1,619 1,674 1,6619,603 8,009 8,215
9,009 17,969 21,344
---------- Projected ----------
Dec-19 Dec-21 Dec-22
Estimated Fair Value Fair Value Range Investment Style Sector Industry $137.00 $110.00 - $164.00 LARGE-CAP VALUE Information Technology Technology Giants
IBM IBM FAIRLY VALUED
Note: Pro forma data in discounted cash-flow valuation may reflect significant adjustments from GAAP accounting data, including cash (not effective) tax rates and other analytical adjustments on a backward-looking and forward-looking basis. No individual data, by itself, found in this report should be used to make any investment decision.
Page 9
Valuentum Retail Equity Research (10=best) Data as of 15-Nov-2021
Buying Index™ 4 Value RatingEconomic CastleVery Attractive
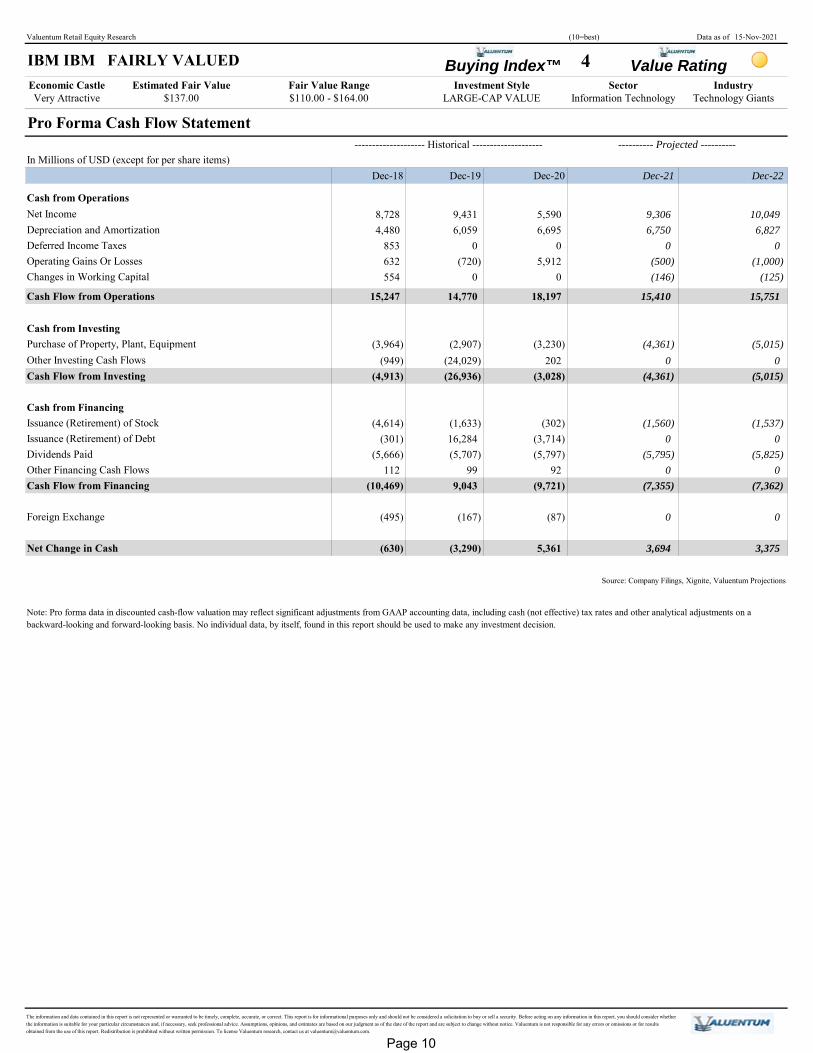
Pro Forma Cash Flow Statement -------------------- Historical --------------------
In Millions of USD (except for per share items)Dec-18 Dec-20
Cash from OperationsNet Income 8,728 5,590Depreciation and Amortization 4,480 6,695Deferred Income Taxes 853 0Operating Gains Or Losses 632 5,912Changes in Working Capital 554 0
Cash Flow from Operations 15,247 18,197
Cash from InvestingPurchase of Property, Plant, Equipment (3,964) (3,230)Other Investing Cash Flows (949) 202Cash Flow from Investing (4,913) (3,028)
Cash from FinancingIssuance (Retirement) of Stock (4,614) (302)Issuance (Retirement) of Debt (301) (3,714)Dividends Paid (5,666) (5,797)Other Financing Cash Flows 112 92Cash Flow from Financing (10,469) (9,721)
Foreign Exchange (495) (87)
Net Change in Cash (630) 5,361
Source: Company Filings, Xignite, Valuentum Projections
The information and data contained in this report is not represented or warranted to be timely, complete, accurate, or correct. This report is for informational purposes only and should not be considered a solicitation to buy or sell a security. Before acting on any information in this report, you should consider whether the information is suitable for your particular circumstances and, if necessary, seek professional advice. Assumptions, opinions, and estimates are based on our judgment as of the date of the report and are subject to change without notice. Valuentum is not responsible for any errors or omissions or for results obtained from the use of this report. Redistribution is prohibited without written permission. To license Valuentum research, contact us at [email protected].
(167) 0 0
(3,290) 3,694 3,375
9,043 (7,355) (7,362)
(5,707) (5,795) (5,825)99 0 0
(1,633) (1,560) (1,537)16,284 0 0
(26,936) (4,361) (5,015)
(2,907) (4,361) (5,015)(24,029) 0 0
14,770 15,410 15,751
(720) (500) (1,000)0 (146) (125)
6,059 6,750 6,8270 0 0
9,431 9,306 10,049
Dec-19 Dec-21 Dec-22
$137.00 $110.00 - $164.00 LARGE-CAP VALUE Information Technology Technology Giants
---------- Projected ----------
IBM IBM FAIRLY VALUED Estimated Fair Value Fair Value Range Investment Style Sector Industry
Note: Pro forma data in discounted cash-flow valuation may reflect significant adjustments from GAAP accounting data, including cash (not effective) tax rates and other analytical adjustments on a backward-looking and forward-looking basis. No individual data, by itself, found in this report should be used to make any investment decision.
Page 10

Valuentum Retail Equity Research (10=best) Data as of 15-Nov-2021
Buying Index™ 4 Value RatingEconomic CastleVery Attractive
Technology GiantsTechnology Giants FAIRLY VALUED
Company Name TickerMarket Cap (USD-
mil) DCF Valuation ValueCreation™ ValueRisk™ ValueTrend™ Technicals Relative Strength
Adobe Systems ADBE 319,358 FAIRLY VALUED EXCELLENT LOW POSITIVE BULLISH NEUTRAL
Advanced Micro Devices AMD 175,643 FAIRLY VALUED POOR HIGH NEGATIVE BULLISH STRONG
Alibaba BABA 460,248 FAIRLY VALUED EXCELLENT MEDIUM NEGATIVE BULLISH STRONG
Alphabet GOOG 2,010,779 FAIRLY VALUED EXCELLENT LOW POSITIVE BULLISH STRONG
Amazon.com AMZN 1,807,338 FAIRLY VALUED EXCELLENT MEDIUM POSITIVE BULLISH STRONG
Analog Devices ADI 69,047 FAIRLY VALUED EXCELLENT LOW NEGATIVE BULLISH STRONG
Apple AAPL 2,537,158 FAIRLY VALUED EXCELLENT LOW POSITIVE BULLISH NEUTRAL
Applied Materials AMAT 145,360 FAIRLY VALUED EXCELLENT MEDIUM NEGATIVE BULLISH STRONG
Automatic Data Processing ADP 98,725 FAIRLY VALUED EXCELLENT LOW POSITIVE BULLISH STRONG
Baidu BIDU 58,203 FAIRLY VALUED EXCELLENT MEDIUM NEGATIVE BULLISH STRONG
Booking Holdings BKNG 99,179 FAIRLY VALUED EXCELLENT LOW NEGATIVE VERY BEARISH STRONG
Broadcom AVGO 237,495 FAIRLY VALUED EXCELLENT MEDIUM NEGATIVE BULLISH STRONG
Cisco CSCO 243,104 FAIRLY VALUED EXCELLENT LOW POSITIVE VERY BULLISH NEUTRAL
eBay EBAY 54,008 FAIRLY VALUED POOR MEDIUM NEGATIVE BULLISH NEUTRAL
F5 Networks FFIV 14,310 FAIRLY VALUED EXCELLENT LOW NEGATIVE BULLISH STRONG
Facebook FB 1,009,847 UNDERVALUED EXCELLENT MEDIUM NEGATIVE VERY BULLISH WEAK
IBM IBM 106,525 FAIRLY VALUED EXCELLENT LOW POSITIVE BEARISH WEAK
Intel INTC 212,362 FAIRLY VALUED EXCELLENT LOW POSITIVE BEARISH WEAK
KLA-Tencor KLAC 65,912 FAIRLY VALUED EXCELLENT LOW POSITIVE BULLISH STRONG
Korn/Ferry KFY 4,303 FAIRLY VALUED EXCELLENT LOW POSITIVE BULLISH STRONG
Lam Research LRCX 91,887 FAIRLY VALUED EXCELLENT LOW POSITIVE BULLISH STRONG
Manpower MAN 6,012 FAIRLY VALUED EXCELLENT MEDIUM POSITIVE BEARISH WEAK
Mastercard MA 365,528 FAIRLY VALUED EXCELLENT LOW NEGATIVE BULLISH NEUTRAL
Micron Technology MU 87,446 FAIRLY VALUED EXCELLENT MEDIUM POSITIVE BULLISH STRONG
Microsoft MSFT 2,550,316 FAIRLY VALUED EXCELLENT LOW POSITIVE BULLISH STRONG
Nvidia NVDA 738,120 FAIRLY VALUED EXCELLENT MEDIUM NEGATIVE BULLISH STRONG
Oracle ORCL 283,524 FAIRLY VALUED EXCELLENT LOW POSITIVE BULLISH STRONG
Paychex PAYX 44,756 FAIRLY VALUED EXCELLENT MEDIUM NEGATIVE BULLISH STRONG
PayPal PYPL 250,267 UNDERVALUED EXCELLENT LOW NEGATIVE NEUTRAL WEAK
QUALCOMM QCOM 191,205 FAIRLY VALUED EXCELLENT LOW NEGATIVE BULLISH STRONG
Salesforce.com CRM 284,534 FAIRLY VALUED EXCELLENT LOW NEGATIVE BULLISH STRONG
Taiwan Semiconductor TSM 609,951 FAIRLY VALUED EXCELLENT MEDIUM POSITIVE VERY BULLISH STRONG
Texas Instruments TXN 176,804 FAIRLY VALUED EXCELLENT MEDIUM NEGATIVE BEARISH NEUTRAL
Twitter TWTR 42,060 FAIRLY VALUED EXCELLENT MEDIUM POSITIVE BEARISH WEAK
Visa V 466,263 FAIRLY VALUED EXCELLENT LOW POSITIVE BEARISH WEAK
MEGA-CAP BLEND NEUTRAL
LARGE-CAP VALUE ATTRACTIVE
MEGA-CAP GROWTH UNATTRACTIVE
MEGA-CAP BLEND ATTRACTIVE
Silicon Motion Technology BEARISH
MEGA-CAP BLEND ATTRACTIVE
LARGE-CAP GROWTH NEUTRAL
LARGE-CAP BLEND UNATTRACTIVE
MEGA-CAP GROWTH UNATTRACTIVE
MEGA-CAP CORE NEUTRAL
LARGE-CAP CORE UNATTRACTIVE
MEGA-CAP GROWTH UNATTRACTIVE
LARGE-CAP BLEND ATTRACTIVE
MEGA-CAP BLEND UNATTRACTIVE
MID-CAP VALUE ATTRACTIVE
LARGE-CAP VALUE ATTRACTIVE
MID-CAP VALUE NEUTRAL
LARGE-CAP VALUE ATTRACTIVE
MEGA-CAP VALUE NEUTRAL
LARGE-CAP GROWTH ATTRACTIVE
LARGE-CAP CORE ATTRACTIVE
LARGE-CAP CORE ATTRACTIVE
MEGA-CAP BLEND ATTRACTIVE
LARGE-CAP GROWTH UNATTRACTIVE
MEGA-CAP CORE NEUTRAL
MEGA-CAP VALUE ATTRACTIVE
LARGE-CAP GROWTH ATTRACTIVE
LARGE-CAP CORE UNATTRACTIVE
LARGE-CAP BLEND NEUTRAL
MEGA-CAP GROWTH UNATTRACTIVE
LARGE-CAP GROWTH ATTRACTIVE
MEGA-CAP VALUE NEUTRAL
LARGE-CAP GROWTH UNATTRACTIVE
MEGA-CAP BLEND NEUTRAL
MEGA-CAP BLEND NEUTRAL
The above bar chart reveals the price/fair value of the company, its peers, and the industry as a whole.Shaded blue denotes that the firm has earned the highest rating for that respective category.Investment Style Relative Valuation
MEGA-CAP GROWTH UNATTRACTIVE
$137.00 $110.00 - $164.00 LARGE-CAP VALUE Information Technology Technology Giants
We think the Technology Giants industry is fairly valued at this time. The industry'smarket cap is trading between 80% and 120% of our estimate of its fair value based onour DCF process. Although we use a firm-specific ValueRisk™ measure to determinewhether a firm is undervalued or overvalued based on our DCF process, we consider anindustry to be undervalued if it is trading below 80% of our estimate of its fair valueand overvalued if it is trading at over 120% of our estimate of its fair value. We thinkthese fair value ranges are appropriate given the diversification benefits of holding abasket of stocks. Although there may be individual opportunities within the TechnologyGiants industry, we don't find the industry as a whole attractive based solely onvaluation.
IBM IBM FAIRLY VALUED Estimated Fair Value Fair Value Range Investment Style Sector Industry
86.7%
96.2%
99.1%
80%82%84%86%88%90%92%94%96%98%
100%102%
IBM Peer Median Technology Giants
Page 11

Valuentum's Full Page Stock Report
Silicon Motion Technology
BA
G
I
N
C
J
D
M
H
E
L
K
A DCF ValuationShows whether the firm is undervalued, fairly valued, or overvalued based on our DCF process and by how much.
B Valuentum Buying Index (VBI)Provides insight into the timeliness of an investment opportunity. We rank firms from 1 to 10 based on rigorous fiancial, valuation, and technical analysis. A 10 represents one of our top picks.
C Valuentum Value Rating (VVR) Indicates whether we think a firm is undervalued, fairly valued, or overvalued on the basis of our DCF process.
D Investment ConsiderationsEvaluates firms on 12 different measures, from the firm's growth and cash flow generation to the stock's money flow index and upside/downside volume. We reveal technical support and resistance levels.
E 30-week Price and Volume ActionDisplays the last accumulation or distribution week of the stock and historical price and volume action.
G Company VitalsShows sector,industry and other relevant company information.
H Business QualitySummary of the firm's ability to create value for shareholders compared wth the underlying risk of its operations.
I Normalized EPS and EBITDAEstimation of the firm's normalized earnings measures and the corresponding valuation mutliples.
J Investment HighlightsOur opinion of the company, including analysis of its financial and technical strengths and weaknesses.
K Relative ValuationComparison of the firm's PE, PEG, and Price/FV ratios versus peers.
L Returns Summary3-year averages of the firm's key return measures, including return on invested capital, with and without goodwill.
M Leverage, Coverage, and LiquidityA snapshot of the company's financial health.
N Financial SummaryA summary of the proforma financial statements found in the extended report.
VBI Score Action10 Top Pick9 We'd Consider Buying
6 to 8 Constructive (add/trim)3 to 6 Less Exciting (add/trim)1 to 2 We'd Consider Selling
Page 12

UNDERVALUED
FAIRLY VALUED
OVERVALUED
• Revenue Volatility • Margin Volatility • Earnings Volatility • Cash Flow Volatility
About Valuentum
@Valuentum, we strive to stand out from the crowd. Mostinvestment research publishers fall into a few camps,whether it be value, growth, income, momentum, chartistor some variant of the aforementioned. We think each inits own right holds merit, but we think the combination ofthese approaches can be even more powerful. After all,stock price movements aren’t just driven by investors ofthe value or growth variety, but by all market participants.Therefore, we look at stocks from a variety of investmentperspectives in order to better understand and identifyideas. We want to provide relevant information.
The core of our process is grounded in rigorous discountedcash flow analysis and incorporates the concept of amargin of safety. We offer a fair value estimate for eachcompany and provide a relative valuation assessment inthe context of a company’s industry and closest peers. Across section of our ValueCreation™ and ValueRisk™ratings provides a financial assessment of a company’sbusiness quality, while our ValueTrend™ rating offersinsight into the trajectory of a firm’s economic profitcreation. The Economic Castle rating measures themagnitude of future economic value generation, and theDividend Cushion ratio assesses the financial capacity of acompany to keep raising its dividend.
Our analysis doesn’t stop there. We also offer a technicalevaluation of the stock as well as other momentumindicators. We not only want to reveal to readers whichfirms may be undervalued, in our view, but we also wantto provide readers with information to help them assessentry and exit points. Most research publishers focus onarriving at a target price or fair value estimate, but mayfall short of providing a technical assessment to bolsterbuy and sell disciplines. We strive to go the distance andprovide readers with answers--not half the story.
An explanation of our approach would not be complete ifwe didn’t describe our ideal stock idea. We’re lookingfor companies that are undervalued--both on a DCF basisand versus peers--have strong growth potential, have asolid track record of creating economic profits forshareholders with reasonable risk, are strong cash flowgenerators, have manageable financial leverage, and arecurrently showing bullish technical and momentumindicators. For dividend growth ideas, we look forcompanies that have both the capacity and willingness tokeep raising the dividend.
Can such stock ideas exist? Subscribe to Valuentum toreceive our best investment ideas and analysis onhundreds of stocks, dividends, ETFs and more.
Historical firm-specific financial data generates our ValueCreation™, ValueRisk™, and ValueTrend™ ratings. The data provides the basis for our financial forecasts. Full annual forecasts of income statement, balance sheet, and cash flow statement items. Firm-specific cost of equity, cost of debt, weighted average cost of capital, and long-term growth and profitability measures estimated.
A complete three-stage free cash flow to the firm valuation model generates an estimate of the firm's equity value per share based on estimated future free cash flows.The volatility of key valuation drivers are estimated and a margin of safety is determined.
The firm's stock price is compared to the suggested margin of safety. If a firm's stock price falls below the lower bound of our estimated fair value range, it receives Valuentum's highest Value Rating.
Silicon Motion Technology
Financial Forecasts
Financial Statement Analysis
Discounted Cash Flow Valuation
ModelValueRisk™
Rating
Valuentum Value Rating (VVR)
Page 13

VBI Score Action10 Top Pick9 We'd Consider Buying
6 to 8 Constructive (add/trim)3 to 6 Less Exciting (add/trim)1 to 2 We'd Consider Selling
Methodology for Picking Stocks - Valuentum Buying Index™ (VBI)
@ Valuentum, we like to look at companies from anumber of different perspectives. The Valuentum BuyingIndex (VBI) combines rigorous financial and valuationanalysis with an evaluation of a stock's technicals to derivea rating between 1 and 10 for each company. The VBIplaces considerable emphasis on a company's discountedcash-flow (DCF) valuation, its relative valuation versuspeers (both forward PE and PEG ratios), and its technicalsin order to help readers assess entry and exit points on themost interesting ideas.
Let's follow the red line on the flow chart below to seehow a company can score a 10, the best mark on the index(a "Top Pick"). First, the company would need to be'undervalued' on a DCF basis and 'attractive' on a relativevalue basis. The stock would also have to be exhibiting
'bullish' technicals. The firm would need aValueCreation™ rating of 'good' or 'excellent', exhibit'high' or 'aggressive' growth prospects, and generate atleast a 'medium' or 'neutral' assessment for cash flowgeneration, financial leverage, and relative price strength.
This is a tall order for any company. Stocks that don'tmake the cut for a 10 are ranked accordingly, with theleast attractive stocks, in our opinion, garnering a ratingof 1 ("We'd sell"). Most of our coverage universeregisters ratings between 3 and 7, but at any given timethere could be large number of companies garneringeither very high or very low scores, especially at marketlows or tops, respectively.
The Best Ideas Newsletter portfolio puts the VBI intopractice.
The information contained in this report is not represented or warranted to be accurate, correct, complete, or timely. This report is for informational purposes only and should not be considered a solicitation to buy or sell a security. Before acting on any information in this material, you should consider whether it is suitable for your particular circumstances and, if necessary, seek professional advice. Assumptions, opinions, and estimates are based on our judgment as of the date of the report and are subject to change without notice. Valuentum is not responsible for any errors or omissions or for results obtained from the use of this report. Redistribution is prohibited without written permission. To license Valuentum research, contact us at [email protected].
DCF FairlyValued
DCF Undervalued
Relative ValueUnattractive/Neutral
Relative Value Attractive
Relative ValueUnattractive/Neutral
Relative Value Attractive
Technicals Bearish: 1
Technicals Neutral: 2
TechnicalsBullish: 4
Technicals Bullish: 7
TechnicalsBearish: 6
Technicals >= BullishValueCreation(TM) >= GoodGrowth >= HighCash Flow Generation >= MediumFinancial Leverage <= MediumRelative Strength >= Neutral
Final Score: 10
Technicals Bullish: 9
Technicals Neutral: 8
TechnicalsBearish: 3
Relative Value Unattractive/Neutral
Relative Value Attractive
Technicals Bearish: 3
Technicals Neutral: 6
Technicals Bullish: 7
Technicals Bearish: 3
Technicals Bullish: 6
Technicals Bullish: 7
Technicals Neutral: 5
Technicals Bearish: 4
Technicals Neutral: 4
Initial Index Score
DCF Overvalued
Page 14

The information contained in this report is not represented or warranted to be accurate, correct, complete, or timely. This report is for informational purposes only and should not be considered a solicitation to buy or sell a security. Before acting on any information in this material, you should consider whether it is suitable for your particular circumstances and, if necessary, seek professional advice. Assumptions, opinions, and estimates are based on our judgment as of the date of the report and are subject to change without notice. Valuentum is not responsible for any errors or omissions or for results obtained from the use of this report. Redistribution is prohibited without written permission. To license Valuentum research, contact us at [email protected].
ValueRisk™. This is a proprietary Valuentum measure. ValueRisk™ indicates thehistorical volatility of key valuation drivers, including revenue, gross margin, earningsbefore interest, and enterprise free cash flow. The standard deviation of each measure iscalculated and scaled against last year's measure to arrive at a percentage deviation foreach item. These percentage deviations are weighted equally to arrive at thecorresponding fair value range for each stock, measured in percentage terms. The firm'sperformance is measured along the scale of LOW, MEDIUM, HIGH, and VERY HIGH.The ValueRisk™ rating for each firm also determines the fundamental beta of eachfirm along the following scale: LOW (0.85), MEDIUM (1), HIGH (1.15), VERY HIGH(1.3).
Range of Potential Outcomes. The firm's margin of safety is shown in the graphicof a normal distribution. We consider a firm to be undervalued if its stock price fallsalong the green line and overvalued if the stock price falls along the red line. Weconsider the firm to be fairly valued if its stock price falls along the yellow line.
Return on Invested Capital. At Valuentum, we place considerable emphasis onreturn on invested capital (both with and without goodwill). The measure focuses onthe return (earnings) the company is generating on its operating assets and is superiorto return on equity and return on assets, which can be skewed by a firm's leverage orexcess cash balance, respectively. ValueTrend™. This is a proprietary Valuentum measure. ValueTrend™ indicates the
trajectory of the firm's return on invested capital (ROIC). Firms that earned an ROIClast year that was greater than the 3-year average of the measure earn a POSITIVErating. Firms that earned an ROIC last year that was less than the 3-year average of themeasure earn a NEGATIVE rating.
Technical Evaluation. We evaluate a firm's near-term and medium-term movingaverages and money flow index (MFI) to assign each firm a rating along thefollowing scale: VERY BULLISH, BULLISH, NEUTRAL, BEARISH, and VERYBEARISH.
Cash Flow Generation. Firms' cash flow generation capacity are measured along thescale of STRONG, MEDIUM, and WEAK. A firm with a 3-year historical free cashflow margin (free cash flow divided by sales) greater than 5% receives a STRONGrating, while firms earning less than 1% of sales as free cash flow receive a WEAKrating.
Stock Price Relative Strength. We assess the perfomance of the company's stockduring the past quarter, 13 weeks, relative to an ETF that mirrors the aggregateperformance of constituents of the stock market. Firms are measured along the scaleof STRONG, NEUTRAL, and WEAK. Companies that have outperformed themarket index by more than 2.5% during this 13-week period receive a STRONGrating, while firms that trailed the market index by more than 2.5% during this 13-week period receive a WEAK rating.
Financial Leverage. Based on the firm's normalized debt-to-EBITDA metric, we rank firms on the following scale: LOW, MEDIUM, and HIGH. Companies with a normalized debt-to-EBITDA ratio below 1.5 receive a LOW score, while those with a measure above 3 receive a HIGH score.
Money Flow Index (MFI). The MFI is a technical indicator that measures buyingand selling pressure based on both price and volume. Traders typically use thismeasure to identify potential reversals with overbought and oversold levels. We use a14-week measure to rank firms along the following scale: EXTREMELYOVERBOUGHT (>90), OVERBOUGHT (80-90), NEUTRAL (20-80), OVERSOLD(10-20), EXTREMELY OVERSOLD (0-10).
Upside/Downside Volume. Heavy volume on up days and lower volume on down days suggests that institutions are heavily participating in a stock's upward advance. We use the trailing 14-week average of upside and downside volume to calculate an informative ratio. We rank each firm's U/D volume ratio along the following scale: BULLISH, IMPROVING, DETERIORATING, and BEARISH.
GlossaryEstimated Fair Value. This measure is our opinion of the fair equity value per share ofthe company. If our forecasts prove accurate, which may not always be the case, wemay expect a firm's stock price to converge to this value within the next 3 years.
Investment Style. Valuentum uses its own proprietary stock-classification system.Nano-cap: Less than $50 million; Micro-cap: Between $50 million and $200 million;Small-cap: Between $200 million and $2 billion; Mid-cap: Between $2 billion and$10 billion; Large-cap: Between $10 billion and $200 billion; Mega-cap: Over $200billion. Blend: Firm's that we think are undervalued and exhibit high growthprospects (growth in excess of three times the rate of assumed inflation). Value:Firm's that we believe are undervalued, but do not exhibit high growth prospects.Growth: Firms that are not undervalued, in our opinion, but exhibit high growthprospects. Core: Firms that are neither undervalued nor exhibit high growthprospects.
Fair Value Range. The fair value range represents an upper bound and lower bound,between which we would consider the firm to be fairly valued. The range considers ourestimate of the firm's fair value and the margin of safety suggested by the volatility ofkey valuation drivers, including revenue, gross margin, earnings before interest, andenterprise free cash flow (the determinants behind our ValueRisk™ rating).
DCF Valuation. We opine on the firm's valuation based on our DCF process. Firmsthat are trading with an appropriate discount to our fair value estimate receive anUNDERVALUED rating. Firms that are trading within our fair value range receive aFAIRLY VALUED rating, while firms that are trading above the upper bound of ourfair value range receive an OVERVALUED rating.
Company Vitals. In this section, we list key financial information and the sector andindustry that Valuentum assigns to the stock. The P/E-Growth (5-yr), or PEG ratio,divides the current share price by last year's earnings (EPS) and then divides thatquotient by our estimate of the firm's 5-year EPS growth rate. The estimatednormalized diluted EPS and estimated normalized EBITDA represent the five-yearforward average of these measures used in our discounted cash flow model. The P/Eon estimated normalized EPS divides the current share price by estimated normalizeddiluted EPS. The EV/estimated normalized EBITDA considers the current enterprisevalue of the company and divides it by estimated normalized EBITDA. EV is definedas the firm's market capitalization plus total debt, minority interest, preferred stockless cash and cash equivalents.
Relative Value. We compare the firm's forward price-to earnings (PE) ratio and itsprice/earnings-to-growth (PEG) ratio to that of its peers. If both measures fall below thepeer median, the firm receives an ATTRACTIVE rating. If both are above the peermedian, the firm receives an UNATTRACTIVE rating. Any other combination resultsin a NEUTRAL rating.
ValueCreation™. This is a proprietary Valuentum measure. ValueCreation™indicates the firm's historical track record in creating economic value for shareholders,taking the average difference between ROIC (without goodwill) and the firm'sestimated WACC during the past three years. The firm's performance is measured alongthe scale of EXCELLENT, GOOD, POOR, and VERY POOR. Those firms withEXCELLENT ratings have a demonstrated track record of creating economic value,while those that register a VERY POOR mark have been destroying economic value.
Business Quality Matrix. We compare the firm's ValueCreation™ and ValueRisk™ratings. The box is an easy way for investors to quickly assess the business quality ofa company. Firms that generate economic profits with little operating variabilityscore near the top right of the matrix.
Timeliness Matrix. We compare the company's recent stock performance relative tothe market benchmark with our assessment of its valuation. Firms that areexperiencing near-term stock price outperformance and are undervalued by ourestimate may represent timely buys.
Page 15

IBM Rating History Price Fair Value VBI15-Nov-21 $118.81 $137.00 415-Apr-21 $132.59 $133.00 73-Dec-20 $123.61 $134.00 78-Jun-20 $135.75 $129.00 722-Oct-19 $133.96 $149.00 415-Apr-19 $140.33 $149.00 54-Feb-19 $136.32 $146.00 610-Sep-18 $148.95 $155.00 74-May-18 $143.91 $156.00 412-Jan-18 $163.14 $158.00 615-Sep-17 $144.82 $154.00 42-Jun-17 $152.05 $160.00 520-Jan-17 $170.55 $163.00 719-Aug-16 $160.04 $164.00 6
Affiliate RelationshipCustomers of Valuentum acknowledge and agree that Valuentum’s affiliate, Pigeon Oak Capital Management, LLC (“Advisor”), may act as an investment advisor to other clients and receive fees for such services. The advice given and the actions taken with respect to such clients and Advisor’s own account may differ from opinions or the timing and nature of action taken with respect to Valuentum’s ratings or published research. Customers of Valuentum must further recognize that transactions in a specific security are not completed for Valuentum customers’ accounts because Valuentum does not have the authority to make trades or provide personalized advice for newsletter clients. The Advisor has discretion to make trades in its clients’ accounts without receiving prior authorization in each instance. Valuentum’s customers also acknowledge that in managing the Advisors’ clients’ assets, Advisor may purchase or sell securities in which Valuentum has an opposite opinion on, and Advisor, its members, officers, directors, or employees, directly or indirectly, have or may acquire a position or interest that contradicts that of Valuentum’s opinion. Due to the fiduciary relationship between Advisor and its clients, Valuentum’s customers will not receive alerts of trades done by Advisor, and trades done by Valuentum’s customers based on opinions of Valuentum might lag trades done by Advisor’s clients. Advisor or its affiliated persons may obtain material, nonpublic or other confidential information that, if disclosed, might affect an investor’s decision to buy, sell or hold a security. Under applicable law, Advisor or Valuentum and their affiliated persons cannot improperly disclose or use this information for their personal benefit or for the benefit of any person, including clients of Advisor or customers of Valuentum. If Advisor or any affiliated person obtains nonpublic or other confidential information about any issuer, Valuentum will have no obligation to disclose the information to customers of it, clients of Advisor or use it for their benefit.
Disclosures, Disclaimers & Additional SourcesTo send us feedback or if you have any questions, please contact us at [email protected]. We're always looking for ways to better serve your investment needs and improve our research.
Copyright (c) 2017 by Valuentum, Inc. All rights reserved.No part of this publication may be reproduced in any form or by any means.The information contained in this report is not represented or warranted to be accurate, correct,complete, or timely. This report is for informational purposes only and should not be considered asolicitation to buy or sell any security. No warranty or guarantee may be created or extended bysales or promotional materials, whether by email or in any other format. The securities or strategiesmentioned herein may not be suitable for all types of investors. The information contained in thisreport does not constitute any advice, especially on the tax consequences of making any particularinvestment decision. This material is not intended for any specific type of investor and does nottake into account an investor's particular investment objectives, financial situation or needs. Thisreport is not intended as a recommendation of the security highlighted or any particular investmentstrategy. Before acting on any information found in this report, readers should consider whethersuch an investment is suitable for their particular circumstances, perform their own due-diligence,and if necessary, seek professional advice. The sources of the data used in this report are believed by Valuentum to be reliable, but the data’saccuracy, completeness or interpretation cannot be guaranteed. Assumptions, opinions, andestimates are based on our judgment as of the date of the report and are subject to change withoutnotice. Valuentum is not responsible for any errors or omissions or for results obtained from the useof this report and accepts no liability for how readers may choose to utilize the content. In no eventshall Valuentum be liable to any party for any direct, indirect, incidental, exemplary, compensatory,punitive, special or consequential damages, costs, expenses, legal fees, or losses (including, withoutlimitation, lost income or lost profits and opportunity costs) in connection with any use of theinformation contained in this document. Investors should consider this report as only a single factorin making their investment decision. Valuentum is not a money manager, is not a registered investment advisor, and does not offerbrokerage or investment banking services. Valuentum has not received any compensation from thecompany or companies highlighted in this report. Valuentum, its employees, independentcontractors and affiliates may have long, short or derivative positions in the securities mentionedherein. Information and data in Valuentum’s valuation models and analysis may not capture allsubjective, qualitative influences such as changes in management, business and political trends, orlegal and regulatory developments. Redistribution is prohibited without written permission. Readersshould be aware that information in this work may have changed between when this work waswritten or created and when it is read. There is risk of substantial loss associated with investing infinancial instruments. Valuentum's company-specific forecasts used in its discounted cash flow model are rules-based.These rules reflect the experience and opinions of Valuentum's analyst team. Historical data used inour valuation model is provided by Xignite and from other publicly available sources includingannual and quarterly regulatory filings. Stock price and volume data is provided by Xignite. Nowarranty is made regarding the accuracy of any data or any opinions. Valuentum's valuation modelis based on sound academic principles, and other forecasts in the model such as inflation and theequity risk premium are based on long-term averages. The Valuentum proprietary automated text-generation system creates text that will vary by company and may often change for the samecompany upon subsequent updates. Valuentum uses its own proprietary stock investment style and industry classification systems. Peercompanies are selected based on the opinions of the Valuentum analyst team. Research reports anddata are updated periodically, though Valuentum assumes no obligation to update its reports,opinions, or data following publication in any form or format. Performance assessment ofValuentum metrics, including the Valuentum Buying Index, is ongoing, and we intend to updateinvestors periodically, though Valuentum assumes no obligation to do so. Not all information isavailable on all companies. There may be a lag before reports and data are updated for stock splitsand stock dividends. Past simulated performance, whether backtested or walk-forward or other, is not a guarantee offuture results. For general information about Valuentum's products and services, please contact usat [email protected] or visit our website at www.valuentum.com.
The High Yield Dividend Newsletter portfolio, the Best Ideas Newsletter portfolio and Dividend Growth Newsletter portfolio are not real money portfolios. Any performance, including that in the Nelson Exclusive publication, is hypothetical and does not represent actual trading. Past performance is not a guarantee of future results.
Valuentum is an investment research publishing company.
Valuentum has not owned and does not own any shares of stocks mentioned on its website or in this report. President of Investment Research Brian Nelson does not own any shares of stocks mentioned on Valuentum's website or in this report. Majority share owner of Valuentum, Elizabeth Nelson, currently has exposure to HON in her retirement account.
If an independent contributor or employee mentions a stock he or she owns, we disclose it in the article/report that mentions the security. Please view individual articles on Valuentum's website for additional disclosures. Contact us to learn more about Valuentum's editorial policies.
Page 16