· iberdrola’s sustainability report 2016 sets forth the activities performed in the economic,...
TRANSCRIPT


Information Supplementary to the Sustainability Report 2016 /
1

/ Information Supplementary to the Sustainability Report 2016
2 / Table of Contents
Table of Contents

Information Supplementary to the Sustainability Report 2016 /
Table of Contents / 3
Introduction 4
Part I. General Standard Disclosures 6
G4-9 7
G4-10 8
G4-11 9
EU1 10
EU2 11
EU3 12
EU4 13
Part II. Specific Standard Disclosures 14
A) Economic Dimension 15
G4-EC1 16
G4-EC4 17
G4-EC5 18
EU11 18
B) Environmental Dimension 19
G4-EN1 20
G4-EN3 20
G4-EN8 21
G4-EN15 22
G4-EN16 22
G4-EN21 23
G4-EN23 26
C) Social Dimension 27
C1) Labour Practices and Decent Work 28
G4-LA1 29
G4-LA2 33
G4-LA3 34
G4-LA5 35
G4-LA6 35
G4-LA9 39
G4-LA11 43
G4-LA12 45
G4-LA13 47
EU15 48
C2) Human Rights 50
G4-HR10/G4-HR11 51
C4) Product Responsibility 52
EU27 53
EU30 55

/ Information Supplementary to the Sustainability Report 2016
4 / Introduction
Introduction
Information Supplementary to the Sustainability Report 2016 /
Introduction / 5
Notes:– The tables of this report use the terms “Basic boundary”, “Expanded boundary”, and “Iberdrola Total”, which are defined in section
G4-17 of the Sustainability Report 2016.– The figures included in this translation follow the customary English convention, with figures in thousands separated by a comma (,)
and decimals indicated by a full stop (.).
Iberdrola’s Sustainability Report 2016 sets forth the activities performed in the economic, environmental, social, and corporate governance dimensions, following the Sustainability Reporting Guidelines, of the Global Reporting Initiative (GRI Guidelines), version G4, also including aspects and indicators from the Electric Utilities Sector Supplement.
Some of the information in such report has been summarised to avoid an excessively lengthy report and to focus attention on the most significant information.
To complete the information in accordance with the GRI Protocols, this Information Supplementary to the Sustainability Report 2016 presents detailed information regarding those indicators that have been presented in summarised form in the Sustainability Report 2016.

/ Information Supplementary to the Sustainability Report 2016
6 / Part I. General Standard Disclosures
Part I. General Standard Disclosures
Information Supplementary to the Sustainability Report 2016 /
Part I. General Standard Disclosures / 7
G4-9 Scale of the organisation
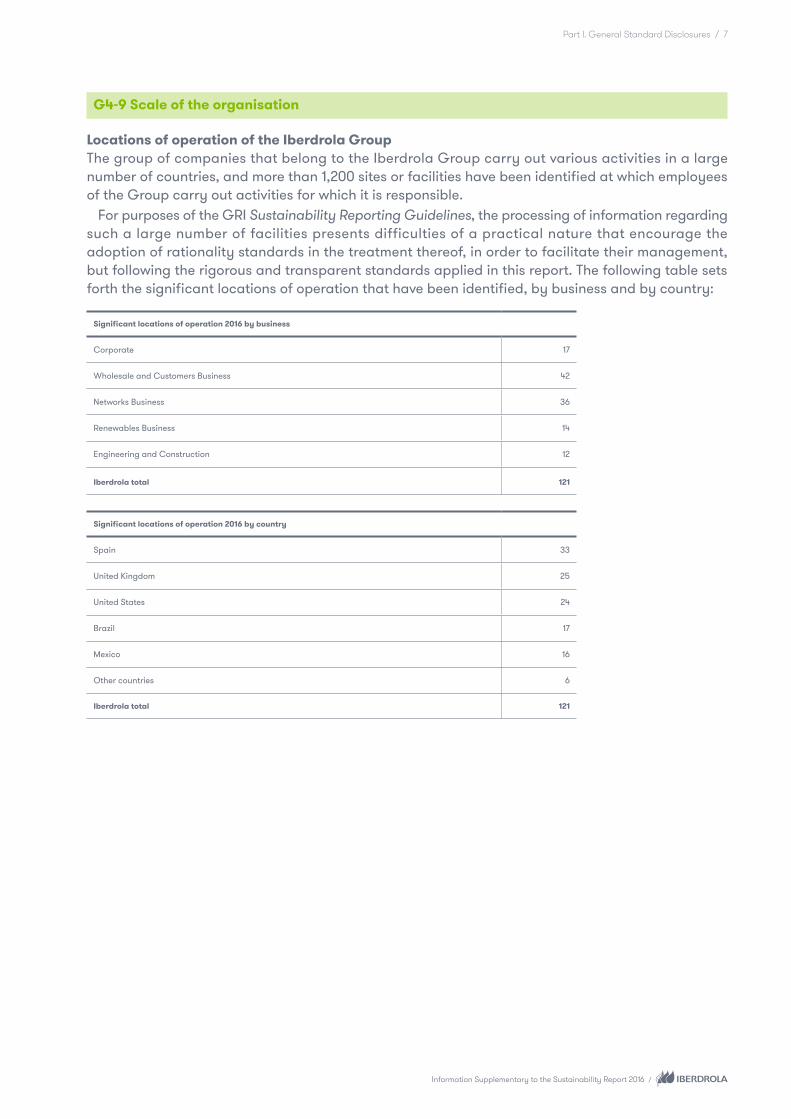
Locations of operation of the Iberdrola GroupThe group of companies that belong to the Iberdrola Group carry out various activities in a large number of countries, and more than 1,200 sites or facilities have been identified at which employees of the Group carry out activities for which it is responsible.
For purposes of the GRI Sustainability Reporting Guidelines, the processing of information regarding such a large number of facilities presents difficulties of a practical nature that encourage the adoption of rationality standards in the treatment thereof, in order to facilitate their management, but following the rigorous and transparent standards applied in this report. The following table sets forth the significant locations of operation that have been identified, by business and by country:
Significant locations of operation 2016 by business
Corporate 17
Wholesale and Customers Business 42
Networks Business 36
Renewables Business 14
Engineering and Construction 12
Iberdrola total 121
Significant locations of operation 2016 by country
Spain 33
United Kingdom 25
United States 24
Brazil 17
Mexico 16
Other countries 6
Iberdrola total 121

/ Information Supplementary to the Sustainability Report 2016
8 / Part I. General Standard Disclosures
For the rational treatment of these facilities, the number of persons performing their activities at a facility has been adopted as the basic standard, and based thereon:
– in the countries deemed to be at low risk for the violation of rights, the largest facilities are identified as operational locations, assuming that the personnel at the smaller facilities are part of a functional or hierarchical reporting structure that assures their rights through the tools and procedures established at the organisation.
– in countries with a higher risk the standard is more restrictive: if there are several facilities of different sizes dedicated to similar activities, the largest facilities are deemed to be operational locations, with the smaller ones deemed to be dependent centres with the same basic guarantees; if the number of facilities is low or it is deemed that the risk is higher, such facilities are considered to be operational locations, regardless of the number of persons working therein.
The company has performed a study to identify the significant locations of operation at which there might be some risk of violation of human rights, which is described in detail in indicator G4-HR9 of the Sustainability Report 2016.
G4-10 Workforce
Total workforce by employment type, employment contract, region, and gender
Spain United Kingdom United States Mexico
2016 2015 2014 2016 2015 2014 2016 2015 2014 2016 2015 2014
Total workforce 10,395 10,569 10,838 6,373 6,696 6,856 6,849 6,889 5,057 874 801 736
By employment type
Full-time 10,390 10,564 10,832 5,631 5,945 6,100 6,834 6,870 5,049 874 801 736
Men 8,404 8,614 8,866 4,224 4,512 4,610 4,836 4,807 3,526 736 664 620
Women 1,986 1,950 1,966 1,407 1,433 1,490 1,998 2,063 1,523 138 137 116
Part-time 5 5 6 742 751 756 15 19 8 0 0 0
Men 4 4 4 56 51 52 2 4 2 0 0 0
Women 1 1 2 686 700 704 13 15 6 0 0 0
By type of contract
Permanent 10,338 10,435 10,751 6,340 6,671 6,842 6,830 6,885 5,032 682 574 526
Men 8,368 8,508 8,803 4,255 4,546 4,656 4,829 4,808 3,512 580 478 445
Women 1,970 1,927 1,948 2,085 2,125 2,186 2,001 2,077 1,520 102 96 81
Temporary 57 134 87 33 25 14 19 4 25 192 227 210
Men 40 110 67 25 17 6 9 3 16 156 186 175
Women 17 24 20 8 8 8 10 1 9 36 41 35

Information Supplementary to the Sustainability Report 2016 /
Part I. General Standard Disclosures / 9
Total workforce by employment type, employment contract, region, and gender
Brazil Other countries Basic boundary Expanded boundary
2016 2015 2014 2016 2015 2014 2016 2015 2014 2016 2015 2014
Total workforce 3,742 3,747 3,745 162 158 155 28,395 28,860 27,387 30,591 30,938 29,597
By employment type
Full-time 3,409 3,408 3,389 162 158 155 27,300 27,746 26,261 29,490 29,823 28,468
Men 3,089 3,104 3,110 133 123 114 21,422 21,824 20,846 23,100 23,410 22,551
Women 320 304 279 29 35 41 5,878 5,922 5,415 6,390 6,413 5,917
Part-time 333 339 356 0 0 0 1,095 1,114 1,126 1,101 1,115 1,129
Men 133 129 141 0 0 0 195 188 199 199 189 201
Women 200 210 215 0 0 0 900 926 927 902 926 928
By type of contract
Permanent 3,715 3,692 3,682 148 144 125 28,053 28,401 26,958 30,177 30,472 29,162
Men 3,199 3,199 3,204 120 111 94 21,351 21,650 20,714 22,985 23,233 22,419
Women 516 493 478 28 33 31 6,702 6,751 6,244 7,192 7,239 6,743
Temporary 27 55 63 14 14 30 342 459 429 414 466 435
Men 23 34 47 13 12 20 266 362 331 314 366 333
Women 4 21 16 1 2 10 76 97 98 100 100 102
G4-11 Employees covered by collective bargaining agreements
Personnel covered by a collective bargaining agreement, by region
2016 2015 2014
No. of Employees % No. of Employees % No. of Employees %
Spain 9,753 93.82 9,894 93.61 10,062 92.84
United Kingdom 4,510 70.77 4,825 72.06 4,970 72.49
United States 3,234 47.22 3,197 46.41 2,395 47.36
Mexico 241 27.57 212 26.47 199 27.04
Brazil 3,504 93.64 3,507 93.59 3,504 93.56
Other countries 82 50.62 0 0.00 91 58.71
Basic boundary 21,324 75.10 21,635 74.97 21,221 77.49
Expanded boundary 23,520 76.89 23,698 76.60 23,375 78.98

/ Information Supplementary to the Sustainability Report 2016
10 / Part I. General Standard Disclosures
EU1 Installed capacity
Installed capacity by region and energy source (MW)
Spain United Kingdom United States Mexico
2016 2015 2014 2016 2015 2014 2016 2015 2014 2016 2015 2014
Hydroelectric 9,715 9,712 8,807 563 563 563 118 118 118 0 0 0
Renewable1 6,104 6,106 6,109 2,006 1,630 1,627 5,912 5,695 5,695 367 367 231
Thermal coal-fuel 874 874 874 0 2,304 2,304 0 0 0 0 0 0
Combined cycle 5,695 5,695 5,695 1,967 1,967 1,967 209 9 30 5,200 4,793 4,847
Cogeneration 364 390 388 1 1 1 636 636 636 236 183 181
Nuclear 3,410 3,410 3,410 0 0 0 0 0 0 0 0 0
Total 26,162 26,187 25,283 4,537 6,465 6,462 6,875 6,458 6,479 5,804 5,343 5,259
Installed capacity by region and energy source (MW)
Brazil Other countries Iberdrola total
2016 2015 2014 2016 2015 2014 2016 2015 2014
Hydroelectric 764 682 381 0 0 0 11,161 11,076 9,869
Renewable1 246 246 246 621 744 744 15,256 14,787 14,652
Thermal coal-fuel 0 0 0 0 0 0 874 3,178 3,178
Combined cycle 208 208 203 0 0 0 13,279 12,671 12,742
Cogeneration 29 29 32 0 0 0 1,267 1,239 1,238
Nuclear 0 0 0 0 0 0 3,410 3,410 3,410
Total 1,247 1,165 862 621 744 744 45,246 46,361 45,089
1 Renewable: wind, solar, mini-hydro.

Information Supplementary to the Sustainability Report 2016 /
Part I. General Standard Disclosures / 11
EU2 Energy production
Net energy output, by region and source of energy (GWh)
Spain United Kingdom United States Mexico
2016 2015 2014 2016 2015 2014 2016 2015 2014 2016 2015 2014
Hydroelectric 18,325 12,366 17,742 590 708 716 327 366 392 N/A N/A N/A
Renewable2 11,994 11,896 13,208 3,098 3,710 3,110 15,002 14,261 14,869 1,119 738 671
Thermal coal-fuel 2,084 3,642 2,472 1,719 7,879 9,630 N/A N/A N/A N/A N/A N/A
Combined cycle 3,709 2,288 1,189 8,341 6,333 5,459 26 0.4 1 34,795 36,380 34,002
Cogeneration 2,290 2,179 2,010 0 4 6 2,557 2,780 2,287 1,654 1,523 1,255
Nuclear 24,381 23,142 24,431 N/A N/A N/A N/A N/A N/A N/A N/A N/A
Total 62,784 55,512 61,052 13,748 18,635 18,921 17,912 17,407 17,549 37,569 38,641 35,928
Net energy output, by region and source of energy (GWh)
Brazil Other countries Iberdrola total
2016 2015 2014 2016 2015 2014 2016 2015 2014
Hydroelectric 1,303 663 1,786 N/A N/A N/A 20,545 14,102 20,636
Renewable2 848 541 550 1,437 1,561 1,454 33,498 32,707 33,862
Thermal coal-fuel N/A N/A N/A N/A N/A N/A 3,803 11,520 12,102
Combined cycle 1,575 1,239 1,475 N/A N/A N/A 48,447 46,240 42,126
Cogeneration 174 176 176 N/A N/A N/A 6,675 6,662 5,734
Nuclear N/A N/A N/A N/A N/A N/A 24,381 23,142 24,431
Total 3,901 2,619 3,987 1,437 1,561 1,454 137,350 134,374 138,891
2 Renewable: wind, solar, mini-hydro.
/ Information Supplementary to the Sustainability Report 2016
12 / Part I. General Standard Disclosures
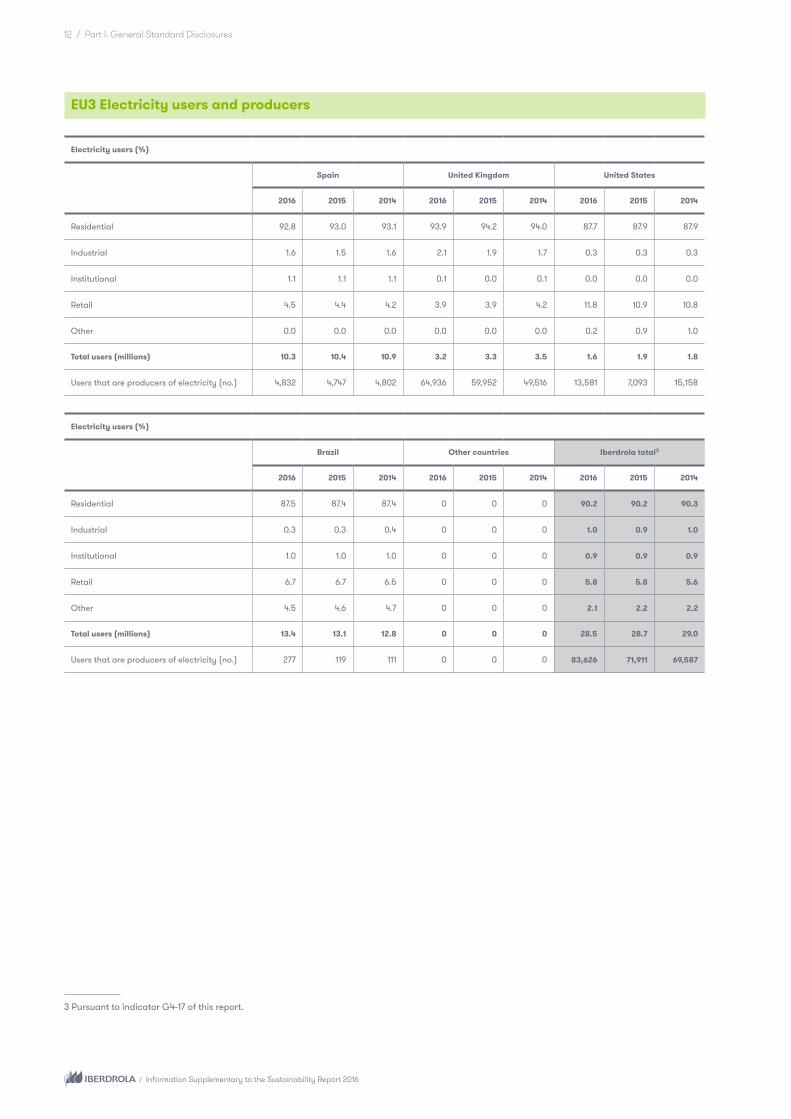
EU3 Electricity users and producers
Electricity users (%)
Spain United Kingdom United States
2016 2015 2014 2016 2015 2014 2016 2015 2014
Residential 92.8 93.0 93.1 93.9 94.2 94.0 87.7 87.9 87.9
Industrial 1.6 1.5 1.6 2.1 1.9 1.7 0.3 0.3 0.3
Institutional 1.1 1.1 1.1 0.1 0.0 0.1 0.0 0.0 0.0
Retail 4.5 4.4 4.2 3.9 3.9 4.2 11.8 10.9 10.8
Other 0.0 0.0 0.0 0.0 0.0 0.0 0.2 0.9 1.0
Total users (millions) 10.3 10.4 10.9 3.2 3.3 3.5 1.6 1.9 1.8
Users that are producers of electricity (no.) 4,832 4,747 4,802 64,936 59,952 49,516 13,581 7,093 15,158
Electricity users (%)
Brazil Other countries Iberdrola total3
2016 2015 2014 2016 2015 2014 2016 2015 2014
Residential 87.5 87.4 87.4 0 0 0 90.2 90.2 90.3
Industrial 0.3 0.3 0.4 0 0 0 1.0 0.9 1.0
Institutional 1.0 1.0 1.0 0 0 0 0.9 0.9 0.9
Retail 6.7 6.7 6.5 0 0 0 5.8 5.8 5.6
Other 4.5 4.6 4.7 0 0 0 2.1 2.2 2.2
Total users (millions) 13.4 13.1 12.8 0 0 0 28.5 28.7 29.0
Users that are producers of electricity (no.) 277 119 111 0 0 0 83,626 71,911 69,587
3 Pursuant to indicator G4-17 of this report.

Information Supplementary to the Sustainability Report 2016 /
Part I. General Standard Disclosures / 13
EU4 Transmission and distribution lines
Power lines (Km)
Spain United Kingdom United States
2016 2015 2014 2016 2015 2014 2016 2015 2014
Transmission
Overhead 0 0 0 3,637 3,637 3,667 13,294 13,030 12,683
Underground 0 0 0 352 352 325 603 555 604
Total 0 0 0 3,989 3,989 3,992 13,897 13,585 13,287
Distribution
Overhead 155,317 155,132 154,977 38,718 38,749 38,789 102,431 97,169 95,963
Underground 112,259 111,686 111,047 66,111 65,496 65,289 14,463 11,236 11,135
Total 267,576 266,818 266,024 104,829 104,245 104,078 116,894 108,405 107,098
Power lines (Km)
Brazil Other countries Iberdrola total
2016 2015 2014 2016 2015 2014 2016 2015 2014
Transmission
Overhead 13,560 13,190 13,096 0 0 0 30,491 29,857 29,446
Underground 31 31 31 0 0 0 986 938 960
Total 13,591 13,221 13,127 0 0 0 31,477 30,795 30,406
Distribution
Overhead 578,674 565,411 556,552 0 0 0 875,140 856,461 846,281
Underground 452 410 397 0 0 0 193,285 188,828 187,868
Total 579,126 565,821 556,949 0 0 0 1,068,425 1,045,289 1,034,149

/ Information Supplementary to the Sustainability Report 2016
14 / Part II. Specific Standard Disclosures
Part II. Specific Standard Disclosures

Information Supplementary to the Sustainability Report 2016 /
Part II. Specific Standard Disclosures / 15
A. Economic Dimension

/ Information Supplementary to the Sustainability Report 2016
16 / Part II. Specific Standard Disclosures
Aspect: Economic performance
G4-EC1 Direct economic value generated and distributed
Economic value generated, distributed, and retained (€ millions)
Spain United Kingdom United States Mexico
2016 2015 2014 2016 2015 2014 2016 2015 2014 2016 2015 2014
Revenue (sales and other income) 14,280 15,026 15,122 6,776 9,251 8,928 5,430 4,033 3,337 1,769 1,837 1,719
Operating costs 8,457 9,555 9,305 4,607 6,484 6,513 2,470 2,002 1,411 1,119 1,190 1,228
Employee remuneration (excluding company social security costs) 847 911 1,030 466 559 461 806 577 453 32 34 29
Payments to providers of capital 1,784 1,031 1,977 231 217 184 315 173 143 189 145 110
Payments to government administrations 1,581 1,704 1,351 380 466 502 596 395 343 108 110 123
Community investments 15 13 13 14 13 9 4 2 2 1 0 0
Economic value retained 1,596 1,812 1,446 1,078 1,512 1,259 1,239 884 985 320 358 229
Economic value generated, distributed, and retained (€ millions)
Brazil Other countries Iberdrola consolidated total
2016 2015 2014 2016 2015 2014 2016 2015 2014
Revenue (sales and other income) 1,717 2,006 1,800 734 268 528 30,706 32,421 31,434
Operating costs 1,266 1,500 1,279 669 264 176 18,588 20,995 19,912
Employee remuneration (excluding company social security costs) 94 93 99 15 13 14 2,260 2,187 2,086
Payments to providers of capital 119 146 100 54 (66) 239 2,692 1,646 2,753
Payments to government administrations 51 50 68 24 21 58 2,740 2,746 2,445
Community investments 2 2 3 0 0 0 36 30 27
Economic value retained 185 215 251 (28) 36 41 4,390 4,817 4,211

Information Supplementary to the Sustainability Report 2016 /
Part II. Specific Standard Disclosures / 17
Tax contribution (€ millions)
Company contributionsContributions due to third-party
payments Iberdrola consolidated total
2016 2015 2014 2016 2015 2014 2016 2015 2014
Spain 1,550 1,704 1,351 1,904 1,789 1,940 3,454 3,493 3,291
United Kingdom 380 466 502 156 174 (48) 536 640 454
United States 596 395 343 268 168 117 864 563 460
Mexico 108 110 123 101 65 61 209 175 184
Brazil 51 50 68 542 550 446 593 600 514
Other4 24 21 58 70 28 50 94 49 108
Total 2,709 2,746 2,445 3,041 2,774 2,566 5,750 5,520 5,011
G4-EC4 Financial assistance received from governments
Financial assistance (€ millions)
Spain United Kingdom United States Mexico
2016 2015 2014 2016 2015 2014 2016 2015 2014 2016 2015 2014
Capital subsidies 13 1 0 0 0 0 0 15 0 0 0 0
Investment tax credits 0 0 0 0 0 0 0 0 0 0 0 0
Emissions rights 0 0 0 0 0 0 0 0 0 0 0 0
Assistance for other items included in the GRI Protocol 0 0 0 0 0 0 0 0 0 0 0 0
Total 13 1 0 0 0 0 0 15 0 0 0 0
Financial assistance (€ millions)
Brazil Other countries Iberdrola consolidated total
2016 2015 2014 2016 2015 2014 2016 2015 2014
Capital subsidies 0 0 0 0 0 0 13 16 0
Investment tax credits 0 0 0 0 0 0 0 0 0
Emissions rights 0 0 0 0 0 0 0 0 0
Assistance for other items included in the GRI Protocol 0 0 0 0 0 0 0 0 0
Total 0 0 0 0 0 0 13 16 0
4 The figure for “Other” is mainly distributed among countries of the European Union: Portugal (€60 million), Greece (€14 million), Hungary (€8 million), Germany (€5 million), and the Netherlands (€4 million).

/ Information Supplementary to the Sustainability Report 2016
18 / Part II. Specific Standard Disclosures
Aspect: Market presence
G4-EC5 Ratios of entry level wage to local minimum wage
Iberdrola’s hiring terms, which are contained in the various collective bargaining agreements of the Group, guarantee that the entry level salaries applied at the Company are the same for men and women. However, due to the specific nature of the workforces of certain companies and the weighting of the calculations made, the statistical treatment of information at the Group level gives the figures in the following table, but should not be interpreted to show a difference in hiring terms between both groups.
Basic entry-level wage compared to local minimum wage (%)
2016 2015 2014
Men Women Total Men Women Total Men Women Total
Spain 162.91 174.66 165.16 159.87 154.06 158.80 189.48 180.70 187.88
United Kingdom 116.02 115.64 115.90 121.59 120.05 121.10 124.94 122.60 124.19
United States 195.17 156.67 183.87 204.09 166.47 193.88 177.36 167.10 174.25
Mexico 387.60 435.89 393.25 451.02 451.11 451.03 463.84 467.56 464.42
Brazil 143.60 139.42 143.02 146.40 141.20 145.68 147.74 142.13 147.19
Other countries 209.59 208.86 209.46 213.40 200.14 210.40 199.88 181.73 194.68
Basic boundary 157.24 143.11 153.44 156.27 141.49 152.36 163.43 149.41 160.87
Expanded boundary 158.13 144.25 154.42 156.31 141.83 152.51 164.59 150.13 161.38
Aspect: System efficiency
EU11 Average generation efficiency of thermal plants
Average thermal efficiency5 at generating facilities6 (%)
Spain7 United Kingdom United States
2016 2015 2014 2016 2015 2014 2016 2015 2014
Combined cycle 48.28 47.81 68.67 49.93 50.17 51.40 N/A N/A N/A
Conventional thermal 33.00 34.61 34.35 33.00 31.57 34.28 N/A N/A N/A
Cogeneration 62.08 64.21 63.62 48.00 76.00 51.40 47.00 47.00 47.00
Average thermal efficiency5 at generating facilities6 (%)
Mexico Brazil Expanded boundary
2016 2015 2014 2016 2015 2014 2016 2015 2014
Combined cycle 52.99 53.24 52.90 49.00 47.39 18.16 51.97 52.36 53.09
Conventional thermal N/A N/A N/A N/A N/A N/A 33.00 32.53 34.29
Cogeneration 58.31 55.64 46.85 71.07 86.60 27.78 55.63 55.56 55.46
5 Average of efficiencies weighted by the annual production of each thermal power plant. 6 The data for 2015 have changed compared to previous reporting due to revision and update. 7 Does not include the Puertollano thermo solar plant.

Information Supplementary to the Sustainability Report 2016 /
Part II. Specific Standard Disclosures / 19
B. Environmental Dimension

/ Information Supplementary to the Sustainability Report 2016
20 / Part II. Specific Standard Disclosures
Aspect: Materials
G4-EN1 Materials used by weight or volume
Distribution of fuels consumed (%) Coal Fuel-oil Natural Gas Gas-oil UraniumBiomass
and WDF8
Expanded boundary
Spain 54.5 100 12.9 17.8 100 100
United Kingdom 45.5 0.0 14.2 0.0 0.0 0.0
United States 0.0 0.0 5.9 0.0 0.0 0.0
Mexico 0.0 0.0 63.8 82.2 0.0 0.0
Brazil 0.0 0.0 3.2 0.0 0.0 0.0
Other countries 0.0 0.0 0.0 0.0 0.0 0.0
Aspect: Energy
G4-EN3 Energy consumption within the organization
Fuel consumption (GJ) 2016 2015 2014
Spain 357,133,305 357,769,516 344,305,029
United Kingdom 82,202,552 144,349,186 147,168,361
United States 20,396,131 21,898,280 18,693,345
Mexico 268,503,578 260,484,235 269,052,206
Brazil 14,098,785 10,872,353 14,010,479
Expanded boundary 742,334,351 795,373,571 793,228,398
Energy consumption in buildings (GJ)9 2016 2015 2014
Spain 165,637 177,606 148,667
United Kingdom 121,327 118,290 121,787
United States 519,317 312,010 270,016
Mexico 911 627 606
Brazil 46,099 83,953 91,087
Other countries10 1,218 1,223 486
Expanded boundary 854,509 693,710 632,650
8 WDF: Waste Derived Fuel (WDF). Some cogeneration plants in Spain can partially operate with this fuel.9 Data has been changed from MWh to GJ with respect to the table from last year.10 Other countries: Greece, Romania, and Hungary.

Information Supplementary to the Sustainability Report 2016 /
Part II. Specific Standard Disclosures / 21
Aspect: Water
G4-EN8 Total water withdrawal by source
Water use in thermal generationThe following shows the withdrawal of water at the thermal generation facilities (coal, combined cycle, nuclear, and cogeneration) in 2016.
Water use (hm3)
Withdrawal Discharge
Total withdrawal
Withdrawal process and
standbyservices
Withdrawal for cooling
Evaporation of water used for
cooling
Discharge into receptor environment
Spain 1,352.85 4.45 1,348.40 57.51 1,317.38
United Kingdom11 447.54 447.54 0.00 0.01 432.04
United States 3.50 3.36 0.14 1.79 1.52
Mexico 54.96 5.78 49.18 22.73 26.52
Brazil 0.09 0.09 0.00 0.00 0.00
Expanded boundary12 1,858.94 461.22 1,397.72 82.04 1,777.46
Water consumption at offices and control facilities
Water consumption at offices and facilities13 (m3) 2016 2015 2014
Spain 84,693 85,614 96,416
United Kingdom 93,375 126,707 103,429
United States 139,385 123,995 73,218
Mexico 1,000 1,246 996
Brazil 89,576 84,384 89,841
Other countries 901 1,826 4,192
Expanded boundary 408,930 423,770 368,092
11 The cooling systems in the United Kingdom are open circuits or air condensers, and therefore it is estimated that the volume of evaporated water is prac-tically zero, except for steam from cogeneration. The data include the Daldowie thermal drying facility and the Hatfield gas storage facility.12 The total discharge figure includes the return from cooling, the return of water used in processes, and rainwater collected at some thermal facilities without an independent storm sewer system. 13 Includes offices, substations, and control buildings at wind farms.

/ Information Supplementary to the Sustainability Report 2016
22 / Part II. Specific Standard Disclosures
Aspect: Emissions, effluents, and waste
G4-EN15 Direct greenhouse gas emissions. Scope 1 (per GHG Protocol)
CO2 emissions (t) 2016 2015 2014
Spain 5,268,737 6,036,503 4,102,756
Generating plants 3,912,787 4,737,368 2,898,266
Cogeneration 1,355,950 1,299,135 1,204,490
United Kingdom 4,512,945 9,933,933 11,315,840
Generating plants 4,496,453 9,917,776 11,315,840
Cogeneration 16,492 16,157 0
United States14 1,040,335 1,111,020 920,579
Generating plants N/A N/A N/A
Cogeneration 1,040,335 1,111,020 920,579
Mexico 13,543,570 13,979,392 13,051,669
Generating plants 12,598,910 13,091,776 12,288,192
Cogeneration 944,660 887,616 763,477
Brazil 678,562 526,946 674,807
Generating plants 533,928 383,630 525,933
Cogeneration 144,633 143,320 148,874
Expanded boundary 25,044,149 31,587,793 30,065,651
Generating plants 21,542,079 28,130,547 27,028,231
Cogeneration 3,502,070 3,457,246 3,037,420
G4-EN16 Indirect greenhouse gas emissions. Scope 2 (per GHG Protocol)
Emissions associated with the consumption of energy at offices CO2 (kt)
Spain 7.92
United Kingdom 13.89
United States 62.53
Mexico 0.12
Brazil 1.08
Other countries15 0.00
Expanded boundary 85.54
14 Klamath cogeneration facility and Enstor.15 Not taken into account to calculate the Carbon Footprint as it entails less than 0.1% of the internal energy consumption of the group.

Information Supplementary to the Sustainability Report 2016 /
Part II. Specific Standard Disclosures / 23
G4-EN21 NOx, SOx and other significant air emissions
NOx emissions (t) 2016 2015 2014
Spain 12,172 14,121 12,096
Generating plants 5,013 8,660 7,070
Cogeneration 7,159 5,462 5,026
United Kingdom 5,363 15,218 18,651
Generating plants 5,363 15,218 18,651
Cogeneration N/A N/Av. N/Av.
United States16 152 146 123
Generating plants N/A N/A N/A
Cogeneration 152 146 123
Mexico 2,583 2,572 2,426
Generating plants 2,325 2,275 2,214
Cogeneration 258 296 212
Brazil 276 250 269
Generating plants 93 78 95
Cogeneration 183 172 173
Expanded boundary 20,546 32,306 33,564
Generating plants 12,794 26,230 28,031
Cogeneration 7,752 6,076 5,533
16 Klamath cogeneration facility and Enstor.
/ Information Supplementary to the Sustainability Report 2016
24 / Part II. Specific Standard Disclosures
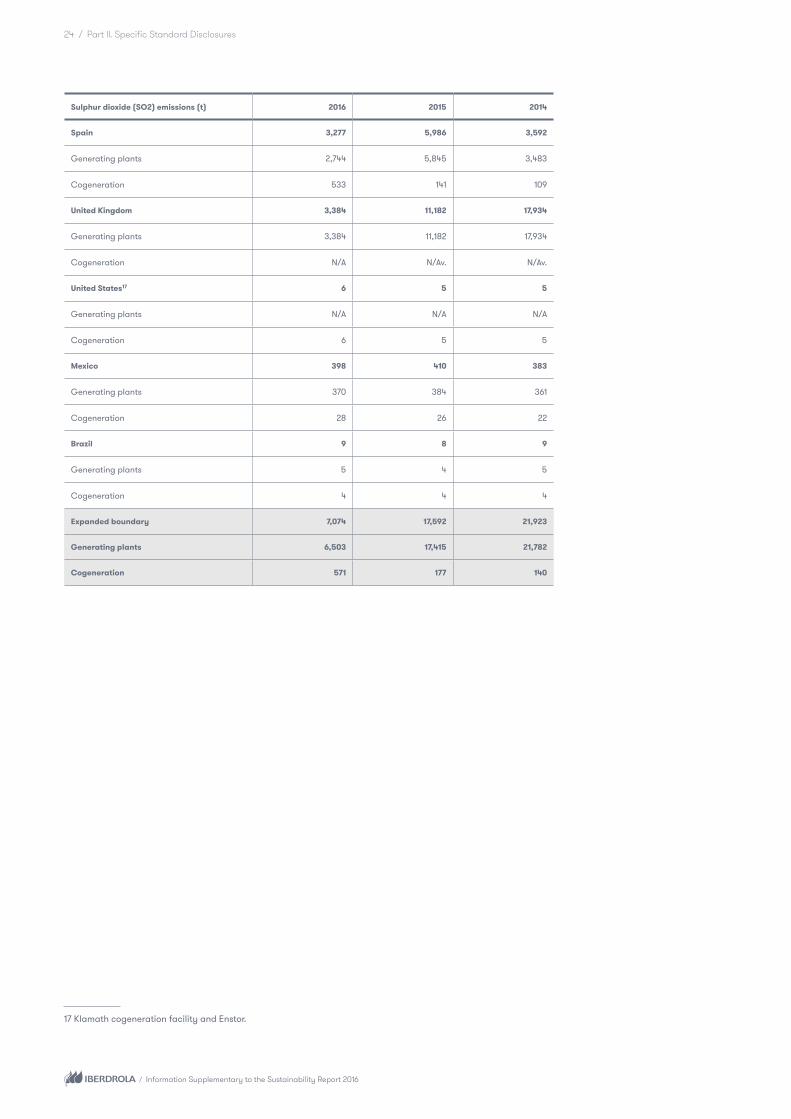
Sulphur dioxide (SO2) emissions (t) 2016 2015 2014
Spain 3,277 5,986 3,592
Generating plants 2,744 5,845 3,483
Cogeneration 533 141 109
United Kingdom 3,384 11,182 17,934
Generating plants 3,384 11,182 17,934
Cogeneration N/A N/Av. N/Av.
United States17 6 5 5
Generating plants N/A N/A N/A
Cogeneration 6 5 5
Mexico 398 410 383
Generating plants 370 384 361
Cogeneration 28 26 22
Brazil 9 8 9
Generating plants 5 4 5
Cogeneration 4 4 4
Expanded boundary 7,074 17,592 21,923
Generating plants 6,503 17,415 21,782
Cogeneration 571 177 140
17 Klamath cogeneration facility and Enstor.

Information Supplementary to the Sustainability Report 2016 /
Part II. Specific Standard Disclosures / 25
Particulate emissions (t) 2016 2015 2014
Spain 305 388 309
Generating plants 259 366 292
Cogeneration 46 22 17
United Kingdom 88 302 534
Generating plants 88 302 534
Cogeneration N/A N/Av. N/Av.
United States18 19 18 15
Generating plants N/A N/A N/A
Cogeneration 19 18 15
Mexico 774 799 746
Generating plants 720 748 702
Cogeneration 54 51 44
Brazil 9 8 16
Generating plants N/A N/A N/A
Cogeneration 9 8 16
Expanded boundary 1,195 1,515 1,620
Generating plants 1,067 1,416 1,528
Cogeneration 128 99 92
18 Klamath cogeneration facility and Enstor.

/ Information Supplementary to the Sustainability Report 2016
26 / Part II. Specific Standard Disclosures
G4-EN23 Total weight of waste by type and disposal method
Hazardous waste generation (t)19
2016 2015 2014
Produced(Total)
Deposited and/or
incinerated
Recovered, recycled,
reusedProduced
(Total)
Deposited and/or
incinerated
Recovered, recycled,
reusedProduced
(Total)
Deposited and/or
incinerated
Recovered, recycled,
reused
Spain 5,418 849 4,539 19,828 16,158 3,626 15,552 9,693 5,815
United Kingdom 3,568 482 2,161 2,775 547 2,196 9,630 1,633 7,996
United States 1,183 601 478 591 141 451 699 302 315
Mexico 126 126 0 149 149 0 84 84 0
Brazil 184 38 139 1,258 39 1,213 3,523 3,491 241
Other countries 50 15 35 33 7 27 119 25 66
Expanded boundary 10,529 2,111 7,352 24,635 17,041 7,512 29,607 15,229 14,433
Generation of non-hazardous waste (t)19
2016 2015 2014
Produced(Total)
Deposited and/or
incinerated
Recovered, recycled,
reusedProduced
(Total)
Deposited and/or
incinerated
Recovered, recycled,
reusedProduced
(Total)
Deposited and/or
incinerated
Recovered, recycled,
reused
Spain 208,680 129,179 79,512 438,413 326,811 111,340 333,781 288,694 44,588
United Kingdom 387,924 189,641 155,103 185,790 28,174 157,013 158,848 68,603 33,571
United States 338,276 107,134 231,038 66,377 52,210 14,196 55,487 48,273 6,799
Mexico 16,449 16,449 0 13,901 13,901 0 15,469 15,469 0
Brazil 17,794 1,036 5,141 34,314 3,086 29,287 73,779 4,833 68,530
Other countries 3 3 0 0 0 0 0 0 0
Expanded boundary 969,126 443,442 470,794 738,795 424,182 311,836 637,365 425,872 153,487
19 Liquid waste has been converted into kg using a density of 1.3 kg/m3.

Information Supplementary to the Sustainability Report 2016 /
Part II. Specific Standard Disclosures / 27
C. Social Dimension

/ Information Supplementary to the Sustainability Report 2016
28 / Part II. Specific Standard Disclosures
C1. Labour Practices and Decent Work 20
20 As the percentage interests in certain companies may not be 100%, the sums added may not correspond to the total presented due to rounding.

Information Supplementary to the Sustainability Report 2016 /
Part II. Specific Standard Disclosures / 29
Aspect: Employment
G4-LA1 New employee hires and employee turnover
New hires by region, gender, and age group
Spain United Kingdom United States Mexico
2016 2015 2014 2016 2015 2014 2016 2015 2014 2016 2015 2014
Total workforce 10,395 10,569 10,838 6,373 6,696 6,856 6,849 6,889 5,057 874 801 736
By gender
Men 244 193 131 261 179 233 369 268 266 146 166 181
Women 93 89 63 81 51 86 126 116 116 31 41 38
By gender (%)
Men 2.90 2.24 1.48 6.10 3.92 5.00 7.63 5.57 7.54 19.84 25.00 29.19
Women 4.68 4.56 3.18 3.87 2.39 3.92 6.27 5.58 7.59 22.46 29.93 32.76
By age group
Men
Up to 30 years old 121 99 60 112 119 128 141 130 149 72 74 78
Between 31 and 50 years old 116 85 63 109 54 99 181 110 107 67 85 91
More than 50 years old 7 9 8 40 6 6 47 28 10 7 7 12
Women
Up to 30 years old 35 24 17 25 25 39 37 41 55 17 19 20
Between 31 and 50 years old 55 59 46 52 25 45 75 62 48 14 22 18
More than 50 years old 3 6 0 4 1 2 14 13 13 0 0 0
By age group (%)
Men
Up to 30 years old 30.17 24.03 11.72 18.51 20.70 20.95 27.87 24.90 39.95 39.13 52.86 62.40
Between 31 and 50 years old 2.65 1.92 1.40 5.01 2.32 4.01 8.24 5.04 6.59 13.70 18.48 20.87
More than 50 years old 0.19 0.24 0.21 2.67 0.36 0.38 2.20 1.33 0.65 11.11 10.94 20.34
Women
Up to 30 years old 39.77 28.57 16.24 11.90 10.50 13.73 22.98 21.47 35.03 44.74 47.50 55.56
Between 31 and 50 years old 4.02 4.35 3.35 3.70 1.75 3.03 7.89 6.24 6.25 14.74 23.40 23.08
More than 50 years old 0.56 1.00 0.00 1.00 0.00 0.00 2.00 1.00 2.00 0.00 0.00 0.00

/ Information Supplementary to the Sustainability Report 2016
30 / Part II. Specific Standard Disclosures
New hires by region, gender, and age group
Brazil Other countries Basic boundary Expanded boundary
2016 2015 2014 2016 2015 2014 2016 2015 2014 2016 2015 2014
Total workforce 3,742 3,747 3,745 162 158 155 28,395 28,860 27,387 30,591 30,938 29,597
By gender
Men 244 252 305 13 18 7 1,277 1,076 1,123 1,481 1,275 1,309
Women 72 89 79 0 3 5 403 389 387 472 473 442
By gender (%)
Men 7.58 7.79 9.38 9.77 14.63 6.14 5.91 4.89 5.34 6.36 5.40 5.75
Women 13.90 17.32 15.99 0.00 8.57 12.20 5.95 5.68 6.10 6.47 6.45 6.44
By age group
Men
Up to 30 years old 164 183 214 1 5 0 611 610 629 738 744 758
Between 31 and 50 79 69 89 9 12 7 561 415 456 637 475 511
More than 50 years 1 0 2 3 1 0 105 51 38 106 56 40
Women
Up to 30 years old 54 63 59 0 0 2 168 172 192 209 226 225
Between 31 and 50 18 25 19 0 3 3 214 196 179 242 225 201
More than 50 years 0 1 1 0 0 0 21 21 16 21 22 16
By age group (%)
Men
Up to 30 years old 17.23 18.07 19.40 11.11 50.00 0.00 23.00 22.83 23.01 23.80 24.31 24.43
Between 31 and 50 3.87 3.47 4.63 8.04 11.54 7.14 4.93 3.61 4.13 5.22 3.87 4.32
More than 50 years 0.43 0.00 0.89 25.00 11.11 0.00 1.39 0.65 0.52 1.33 0.68 0.51
Women
Up to 30 years old 27.00 29.72 28.23 0.00 0.00 50.00 24.03 22.43 24.19 24.76 24.84 24.56
Between 31 and 50 6.04 8.90 7.22 0.00 9.68 8.82 5.17 4.68 4.49 5.43 5.03 4.69
More than 50 years 0.00 4.76 4.55 0.00 0.00 0.00 1.08 1.11 1.03 1.05 1.12 0.97

Information Supplementary to the Sustainability Report 2016 /
Part II. Specific Standard Disclosures / 31
Persons leaving the Company by region, gender, and age group
Spain United Kingdom United States Mexico
2016 2015 2014 2016 2015 2014 2016 2015 2014 2016 2015 2014
Total workforce 10,395 10,569 10,838 6,373 6,696 6,856 6,889 6,889 5,057 801 801 736
By gender
Men 452 443 450 516 264 432 320 327 292 95 120 136
Women 66 108 108 119 110 415 172 160 109 18 22 14
By gender (%)
Men 5.38 5.14 5.07 12.06 5.79 9.27 6.61 6.80 8.28 12.91 18.07 21.94
Women 3.32 5.54 5.46 5.69 5.16 18.92 8.55 7.70 7.13 13.04 16.06 12.07
By age group
Men
Up to 30 years old 6 7 12 33 39 57 69 51 84 30 29 52
Between 31 and 50 years old 74 83 87 173 119 192 89 97 99 55 75 79
More than 50 years old 372 353 351 310 106 183 162 179 109 10 16 5
Women
Up to 30 years old 3 2 8 9 19 48 30 22 16 8 11 6
Between 31 and 50 years old 32 61 45 58 65 180 61 56 54 10 11 8
More than 50 years old 31 45 55 52 26 187 81 82 39 0 0 0
By age group (%)21
Men
Up to 30 years old 1.50 1.70 2.24 5.45 6.78 9.33 13.64 9.77 22.52 16.30 20.71 2.24
Between 31 and 50 years old 1.69 1.87 1.95 7.95 5.12 7.78 4.05 4.44 6.10 11.25 16.30 1.95
More than 50 years old 10.23 9.35 9.05 20.69 6.37 11.55 7.59 8.50 7.12 15.87 25.00 9.05
Women
Up to 30 years old 3.41 2.38 7.39 4.29 7.98 16.90 18.63 11.52 10.19 21.05 27.50 7.39
Between 31 and 50 years old 2.34 4.50 3.27 4.12 4.55 12.22 6.42 5.64 7.03 10.53 11.70 3.27
More than 50 years old 5.83 8.81 11.19 10.92 5.59 42.79 9.00 9.17 6.46 0.00 0.00 11.19
21 Of the headcount of this group at year end.

/ Information Supplementary to the Sustainability Report 2016
32 / Part II. Specific Standard Disclosures
Persons leaving the Company by region, gender, and age group
Brazil Other countries Basic boundary Expanded boundary
2016 2015 2014 2016 2015 2014 2016 2015 2014 2016 2015 2014
Total workforce 3,742 3,747 3,745 162 158 155 28,395 28,860 27,387 30,591 30,938 29,597
By gender
Men 256 271 296 11 16 11 1,650 1,441 1,617 1,756 1,637 1,780
Women 65 68 68 5 5 12 445 473 726 489 531 762
By gender (%)
Men 7.95 8.38 9.10 8.27 13.01 9.16 7.63 6.55 7.68 7.54 6.92 7.82
Women 12.50 13.23 13.77 17.24 14.29 27.91 6.57 6.91 11.44 6.71 7.17 11.13
By age group
Men
Up to 30 years old 69 101 121 0 1 3 207 228 329 225 248 354
Between 31 and 50 years old 140 129 142 10 13 7 541 516 606 565 567 660
More than 50 years old 47 41 33 1 2 1 902 697 682 966 821 766
Women
Up to 30 years old 34 36 40 0 0 3 84 90 121 92 98 127
Between 31 and 50 years old 27 26 26 5 5 8 193 224 321 212 244 339
More than 50 years old 4 6 2 0 0 1 168 159 284 185 186 296
By age group (%)22
Men
Up to 30 years old 7.25 9.97 10.97 0.00 10.00 33.33 7.79 8.53 12.01 7.26 8.10 11.42
Between 31 and 50 years old 6.87 6.48 7.38 8.93 12.50 7.14 4.75 4.49 5.50 4.63 4.62 5.58
More than 50 years old 20.35 17.90 14.67 8.33 22.22 14.29 11.91 8.88 9.36 12.09 9.92 9.78
Women
Up to 30 years old 17.00 16.98 19.14 0.00 0.00 75.00 12.02 11.73 15.22 10.90 10.77 13.88
Between 31 and 50 years old 9.06 9.25 9.89 20.00 16.13 23.53 4.66 5.35 8.04 4.76 5.46 7.93
More than 50 years old 18.18 28.57 9.09 0.00 0.00 33.33 8.67 8.39 18.21 9.28 9.49 17.91
22 Of the headcount of this group at year end.

Information Supplementary to the Sustainability Report 2016 /
Part II. Specific Standard Disclosures / 33
G4-LA2 Benefits provided to full-time employees that are not provided to temporary or part-time employees, by significant locations of operation
Benefits offered
2016
Life insurance
Medical insurance
Disability insurance
Maternity/ paternity leave
Pension fund Shares
Basic boundary
Spain All All All All All N/A
United Kingdom All All N/A All All All
United States All All Full-time All All N/A
Mexico Full-time Full-time All All Full-time N/A
Brazil All23 All All All All All24
All: Includes full-time and part-time employees.
23 Only for managers/senior specialists/executives and interns.24 Only for executives.

/ Information Supplementary to the Sustainability Report 2016
34 / Part II. Specific Standard Disclosures
G4-LA3 Return to work and retention rates after parental leave, by gender
Leaves from and returns to work due to maternity/paternity, by region
Spain United Kingdom United States Mexico
2016 2015 2014 2016 2015 2014 2016 2015 2014 2016 2015 2014
Employees entitled to parental leave
Men 8,408 8,618 8,870 4,280 4,563 4,662 4,838 3,499 3,528 736 664 620
Women 1,987 1,951 1,968 2,093 2,133 2,194 2,011 1,508 1,529 138 137 116
Total 10,395 10,569 10,838 6,373 6,696 6,856 6,849 5,007 5,057 874 801 736
Employees taking parental leave
Men 276 345 303 26 0 0 0 0 0 0 0 0
Women 158 197 198 151 142 177 125 47 50 10 8 6
Total 434 542 501 177 142 177 125 47 50 10 8 6
Leaves from and returns to work due to maternity/paternity, by region
Brazil Other countries Basic boundary Expanded boundary
2016 2015 2014 2016 2015 2014 2016 2015 2014 2016 2015 2014
Employees entitled to parental leave
Men 3,222 3,233 3,251 133 123 114 21,617 20,700 21,045 23,299 22,287 22,752
Women 520 514 494 29 35 41 6,778 6,278 6,342 7,292 6,769 6,845
Total 3,742 3,747 3,745 162 158 155 28,395 26,978 27,387 30,591 29,056 29,597
Employees taking parental leave
Men 132 129 119 0 0 0 434 474 422 434 474 452
Women 18 26 21 1 3 6 463 423 458 464 424 484
Total 150 155 140 1 3 6 897 897 880 898 898 936

Information Supplementary to the Sustainability Report 2016 /
Part II. Specific Standard Disclosures / 35
Aspect: Occupational health and safety
G4-LA5 Percentage of total workforce represented in formal joint management-worker health and safety committees that help monitor and advise on occupational health and safety programmes
Employees represented on health and safety committees, by region (%) 2016 2015 2014
Spain 95.89 96.48 96.69
United Kingdom 94.68 94.64 95.25
United States 99.40 96.98 99.76
Mexico 48.97 84.27 53.40
Brazil 99.17 99.09 99.15
Other countries 66.05 25.95 0.00
Basic boundary 95.28 95.74 95.52
Expanded boundary 94.24 95.20 94.58
G4-LA6 Type of injury and rates of injury, occupational diseases, lost days, and absenteeism, and total number of work-related fatalities, by region and by gender
Number of accidents by region and gender
Spain United Kingdom United States Mexico
2016 2015 2014 2016 2015 2014 2016 2015 2014 2016 2015 2014
By gender
Men 83 84 102 74 105 113 154 70 113 6 0 2
Women 8 8 9 27 26 35 20 21 14 0 0 0
Total 91 92 111 101 131 148 174 91 127 6 0 2
Number of accidents by region and gender
Brazil Other countries Basic boundary Expanded boundary
2016 2015 2014 2016 2015 2014 2016 2015 2014 2016 2015 2014
By gender
Men 47 47 92 1 1 2 365 308 424 380 326 455
Women 2 4 1 0 0 0 57 59 59 60 60 66
Total 49 51 93 1 1 2 422 366 483 440 386 521

/ Information Supplementary to the Sustainability Report 2016
36 / Part II. Specific Standard Disclosures
Number of accidents by type, region, and gender
Spain United Kingdom United States Mexico
2016 2015 2014 2016 2015 2014 2016 2015 2014 2016 2015 2014
Fatal
Men 0 0 0 0 0 0 0 0 1 0 0 0
Women 0 0 0 0 0 0 0 0 0 0 0 0
Total 0 0 0 0 0 0 0 0 1 0 0 0
With leave
Men 25 25 33 7 9 6 38 16 20 2 0 0
Women 1 3 5 0 0 0 8 7 5 0 0 0
Total 26 28 38 7 9 6 46 23 25 2 0 0
Without leave
Men 58 59 69 67 96 107 116 55 92 4 0 2
Women 7 5 4 27 26 35 12 14 9 0 0 0
Total 65 64 73 94 122 142 128 69 101 4 0 2
Number of accidents by type, region, and gender
Brazil Other countries Basic boundary Expanded boundary
2016 2015 2014 2016 2015 2014 2016 2015 2014 2016 2015 2014
Fatal
Men 0 0 0 0 0 0 0 0 1 0 0 1
Women 0 0 0 0 0 0 0 0 0 0 0 0
Total 0 0 0 0 0 0 0 0 1 0 0 1
With leave
Men 1 0 3 1 1 2 74 51 64 82 63 86
Women 0 0 0 0 0 0 9 10 10 10 11 15
Total 1 0 3 1 1 2 83 61 74 92 74 101
Without leave
Men 46 47 89 0 0 0 291 257 359 298 263 367
Women 2 4 1 0 0 0 48 49 49 50 50 52
Total 48 51 90 0 0 0 339 306 408 348 313 419
Information Supplementary to the Sustainability Report 2016 /
Part II. Specific Standard Disclosures / 37
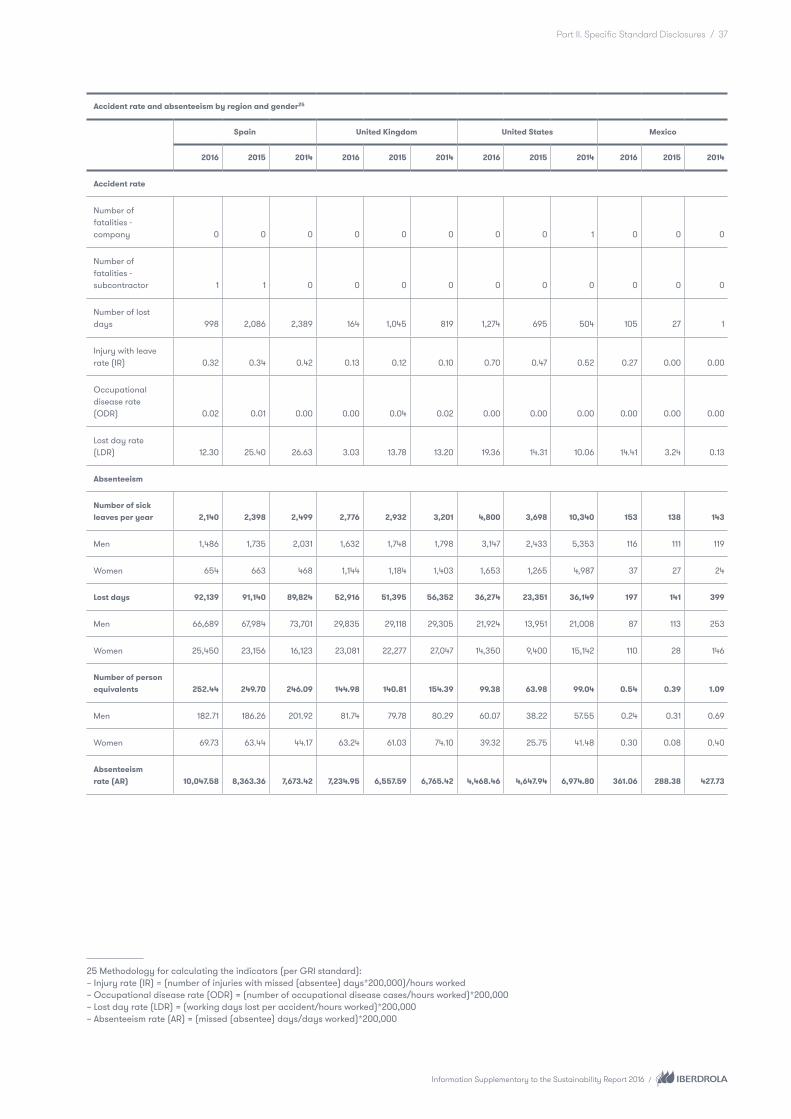
Accident rate and absenteeism by region and gender25
Spain United Kingdom United States Mexico
2016 2015 2014 2016 2015 2014 2016 2015 2014 2016 2015 2014
Accident rate
Number of fatalities - company 0 0 0 0 0 0 0 0 1 0 0 0
Number of fatalities - subcontractor 1 1 0 0 0 0 0 0 0 0 0 0
Number of lost days 998 2,086 2,389 164 1,045 819 1,274 695 504 105 27 1
Injury with leave rate (IR) 0.32 0.34 0.42 0.13 0.12 0.10 0.70 0.47 0.52 0.27 0.00 0.00
Occupational disease rate (ODR) 0.02 0.01 0.00 0.00 0.04 0.02 0.00 0.00 0.00 0.00 0.00 0.00
Lost day rate (LDR) 12.30 25.40 26.63 3.03 13.78 13.20 19.36 14.31 10.06 14.41 3.24 0.13
Absenteeism
Number of sick leaves per year 2,140 2,398 2,499 2,776 2,932 3,201 4,800 3,698 10,340 153 138 143
Men 1,486 1,735 2,031 1,632 1,748 1,798 3,147 2,433 5,353 116 111 119
Women 654 663 468 1,144 1,184 1,403 1,653 1,265 4,987 37 27 24
Lost days 92,139 91,140 89,824 52,916 51,395 56,352 36,274 23,351 36,149 197 141 399
Men 66,689 67,984 73,701 29,835 29,118 29,305 21,924 13,951 21,008 87 113 253
Women 25,450 23,156 16,123 23,081 22,277 27,047 14,350 9,400 15,142 110 28 146
Number of person equivalents 252.44 249.70 246.09 144.98 140.81 154.39 99.38 63.98 99.04 0.54 0.39 1.09
Men 182.71 186.26 201.92 81.74 79.78 80.29 60.07 38.22 57.55 0.24 0.31 0.69
Women 69.73 63.44 44.17 63.24 61.03 74.10 39.32 25.75 41.48 0.30 0.08 0.40
Absenteeism rate (AR) 10,047.58 8,363.36 7,673.42 7,234.95 6,557.59 6,765.42 4,468.46 4,647.94 6,974.80 361.06 288.38 427.73
25 Methodology for calculating the indicators (per GRI standard): – Injury rate (IR) = (number of injuries with missed (absentee) days*200,000)/hours worked– Occupational disease rate (ODR) = (number of occupational disease cases/hours worked)*200,000– Lost day rate (LDR) = (working days lost per accident/hours worked)*200,000– Absenteeism rate (AR) = (missed (absentee) days/days worked)*200,000
/ Information Supplementary to the Sustainability Report 2016
38 / Part II. Specific Standard Disclosures
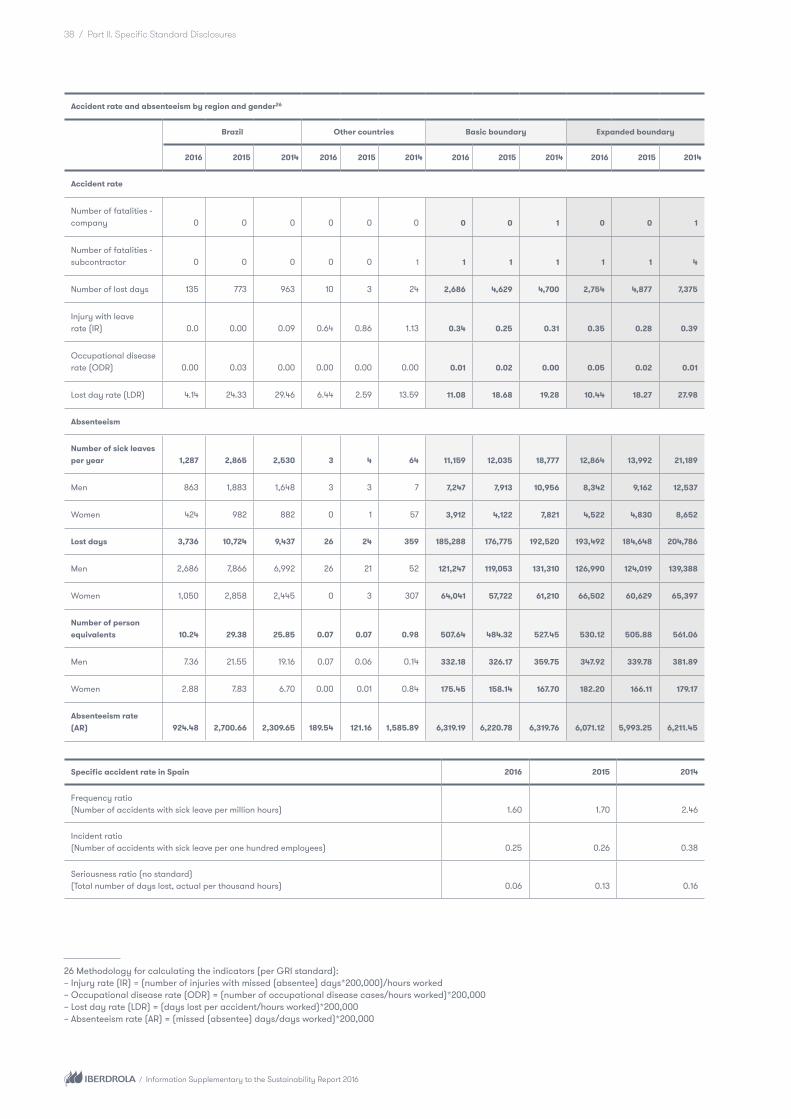
Accident rate and absenteeism by region and gender26
Brazil Other countries Basic boundary Expanded boundary
2016 2015 2014 2016 2015 2014 2016 2015 2014 2016 2015 2014
Accident rate
Number of fatalities - company 0 0 0 0 0 0 0 0 1 0 0 1
Number of fatalities - subcontractor 0 0 0 0 0 1 1 1 1 1 1 4
Number of lost days 135 773 963 10 3 24 2,686 4,629 4,700 2,754 4,877 7,375
Injury with leave rate (IR) 0.0 0.00 0.09 0.64 0.86 1.13 0.34 0.25 0.31 0.35 0.28 0.39
Occupational disease rate (ODR) 0.00 0.03 0.00 0.00 0.00 0.00 0.01 0.02 0.00 0.05 0.02 0.01
Lost day rate (LDR) 4.14 24.33 29.46 6.44 2.59 13.59 11.08 18.68 19.28 10.44 18.27 27.98
Absenteeism
Number of sick leaves per year 1,287 2,865 2,530 3 4 64 11,159 12,035 18,777 12,864 13,992 21,189
Men 863 1,883 1,648 3 3 7 7,247 7,913 10,956 8,342 9,162 12,537
Women 424 982 882 0 1 57 3,912 4,122 7,821 4,522 4,830 8,652
Lost days 3,736 10,724 9,437 26 24 359 185,288 176,775 192,520 193,492 184,648 204,786
Men 2,686 7,866 6,992 26 21 52 121,247 119,053 131,310 126,990 124,019 139,388
Women 1,050 2,858 2,445 0 3 307 64,041 57,722 61,210 66,502 60,629 65,397
Number of person equivalents 10.24 29.38 25.85 0.07 0.07 0.98 507.64 484.32 527.45 530.12 505.88 561.06
Men 7.36 21.55 19.16 0.07 0.06 0.14 332.18 326.17 359.75 347.92 339.78 381.89
Women 2.88 7.83 6.70 0.00 0.01 0.84 175.45 158.14 167.70 182.20 166.11 179.17
Absenteeism rate (AR) 924.48 2,700.66 2,309.65 189.54 121.16 1,585.89 6,319.19 6,220.78 6,319.76 6,071.12 5,993.25 6,211.45
Specific accident rate in Spain 2016 2015 2014
Frequency ratio (Number of accidents with sick leave per million hours) 1.60 1.70 2.46
Incident ratio (Number of accidents with sick leave per one hundred employees) 0.25 0.26 0.38
Seriousness ratio (no standard) (Total number of days lost, actual per thousand hours) 0.06 0.13 0.16
26 Methodology for calculating the indicators (per GRI standard): – Injury rate (IR) = (number of injuries with missed (absentee) days*200,000)/hours worked– Occupational disease rate (ODR) = (number of occupational disease cases/hours worked)*200,000– Lost day rate (LDR) = (days lost per accident/hours worked)*200,000– Absenteeism rate (AR) = (missed (absentee) days/days worked)*200,000
Information Supplementary to the Sustainability Report 2016 /
Part II. Specific Standard Disclosures / 39
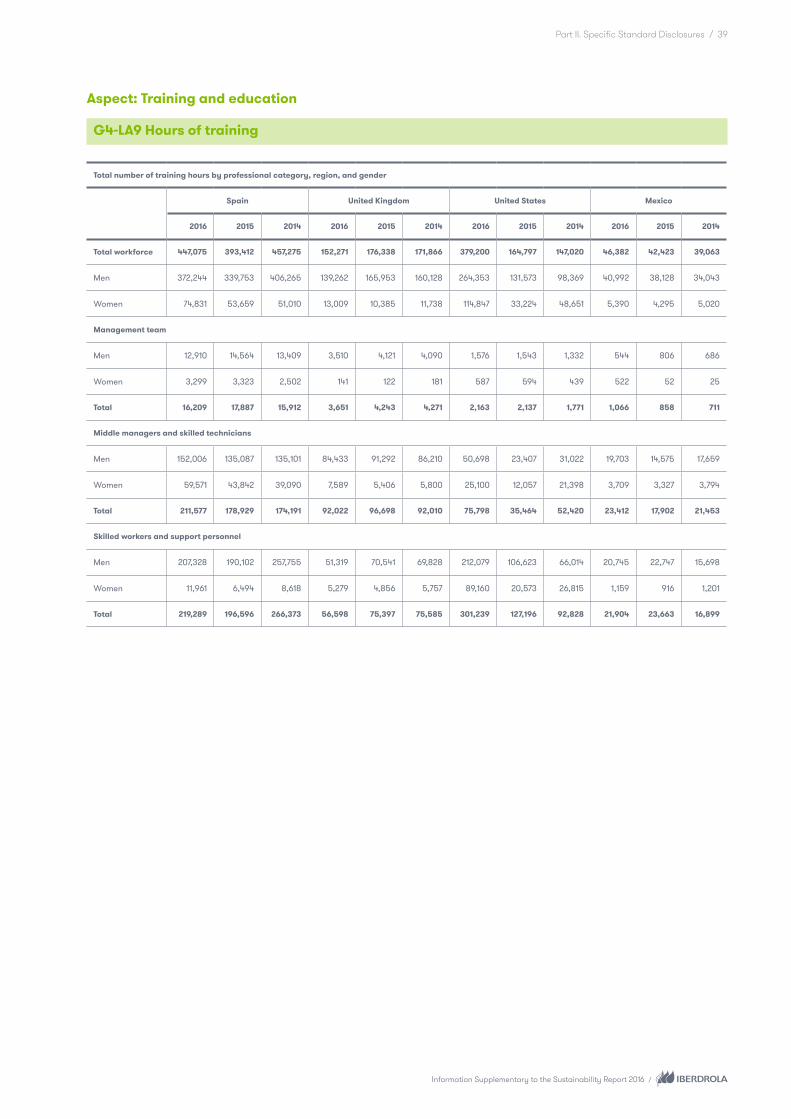
Aspect: Training and education
G4-LA9 Hours of training
Total number of training hours by professional category, region, and gender
Spain United Kingdom United States Mexico
2016 2015 2014 2016 2015 2014 2016 2015 2014 2016 2015 2014
Total workforce 447,075 393,412 457,275 152,271 176,338 171,866 379,200 164,797 147,020 46,382 42,423 39,063
Men 372,244 339,753 406,265 139,262 165,953 160,128 264,353 131,573 98,369 40,992 38,128 34,043
Women 74,831 53,659 51,010 13,009 10,385 11,738 114,847 33,224 48,651 5,390 4,295 5,020
Management team
Men 12,910 14,564 13,409 3,510 4,121 4,090 1,576 1,543 1,332 544 806 686
Women 3,299 3,323 2,502 141 122 181 587 594 439 522 52 25
Total 16,209 17,887 15,912 3,651 4,243 4,271 2,163 2,137 1,771 1,066 858 711
Middle managers and skilled technicians
Men 152,006 135,087 135,101 84,433 91,292 86,210 50,698 23,407 31,022 19,703 14,575 17,659
Women 59,571 43,842 39,090 7,589 5,406 5,800 25,100 12,057 21,398 3,709 3,327 3,794
Total 211,577 178,929 174,191 92,022 96,698 92,010 75,798 35,464 52,420 23,412 17,902 21,453
Skilled workers and support personnel
Men 207,328 190,102 257,755 51,319 70,541 69,828 212,079 106,623 66,014 20,745 22,747 15,698
Women 11,961 6,494 8,618 5,279 4,856 5,757 89,160 20,573 26,815 1,159 916 1,201
Total 219,289 196,596 266,373 56,598 75,397 75,585 301,239 127,196 92,828 21,904 23,663 16,899

/ Information Supplementary to the Sustainability Report 2016
40 / Part II. Specific Standard Disclosures
Total number of training hours by professional category, region, and gender
Brazil Other countries Basic boundary Expanded boundary
2016 2015 2014 2016 2015 2014 2016 2015 2014 2016 2015 2014
Total workforce 166,493 127,278 73,912 2,551 3,659 2,615 1,193,972 907,907 891,750 1,262,813 983,968 1,025,883
Men 147,126 116,158 66,776 2,242 3,062 1,831 966,219 794,628 767,412 1,024,574 859,333 877,106
Women 19,367 11,120 7,135 309 597 784 227,753 113,279 124,338 238,239 124,635 148,777
Management team
Men 934 243 592 8 61 62 19,482 21,338 20,172 20,661 22,792 21,608
Women 190 124 356 0 98 16 4,739 4,314 3,519 4,747 4,350 3,519
Total 1,124 367 948 8 159 78 24,221 25,652 23,691 25,408 27,142 25,127
Middle managers and skilled technicians
Men 21,086 6,991 6,495 1,254 1,081 655 329,180 272,433 277,142 375,160 327,681 370,174
Women 8,830 3,618 3,719 280 236 691 105,079 68,486 75,291 114,363 78,109 97,929
Total 29,916 10,609 10,214 1,534 1,317 1,346 434,259 340,919 352,433 489,523 405,790 468,104
Skilled workers and support personnel
Men 125,106 108,924 59,689 980 1,920 1,114 617,557 500,857 470,098 628,753 508,860 485,324
Women 10,347 7,378 3,060 29 263 77 117,935 40,480 45,528 119,129 42,176 47,329
Total 135,453 116,302 62,750 1,009 2,183 1,191 735,492 541,337 515,626 747,882 551,036 532,653

Information Supplementary to the Sustainability Report 2016 /
Part II. Specific Standard Disclosures / 41
Average hours of training per employee trained, broken down by professional category, region, and gender
Spain United Kingdom United States Mexico
2016 2015 2014 2016 2015 2014 2016 2015 2014 2016 2015 2014
Total workforce 44.67 39.11 42.41 35.57 42.56 41.02 56.49 31.28 27.56 87.35 62.02 60.19
Men 45.77 41.23 45.95 39.50 47.98 46.49 55.28 35.50 26.32 87.59 64.84 61.67
Women 39.91 29.50 26.31 17.23 15.18 15.73 59.48 21.26 30.46 85.56 44.74 51.75
Management team
Men 36.37 36.96 31.06 39.89 46.30 47.01 15.92 16.59 15.32 36.27 31.00 28.58
Women 45.19 46.80 35.04 14.10 13.56 15.08 15.05 20.48 18.27 174.00 13.00 25.00
Total 37.87 38.47 31.63 37.26 43.30 43.14 15.67 17.52 15.95 59.20 28.60 28.44
Middle managers and skilled technicians
Men 47.00 42.15 39.12 39.02 46.13 44.97 27.27 17.31 23.15 78.19 47.02 63.98
Women 47.77 36.66 32.63 18.93 15.58 16.29 22.86 13.40 23.80 67.45 46.21 54.20
Total 47.22 40.66 37.42 35.88 41.57 40.48 25.63 15.75 23.41 76.26 46.86 62.00
Skilled workers and support personnel
Men 45.64 40.96 52.00 40.28 50.71 48.49 75.10 47.16 28.58 103.21 90.27 62.29
Women 21.51 11.74 13.37 15.35 14.80 15.23 112.29 32.45 39.78 231.80 45.80 46.19
Total 43.01 37.85 47.55 34.98 43.86 41.58 83.26 43.94 31.11 106.33 87.00 60.79

/ Information Supplementary to the Sustainability Report 2016
42 / Part II. Specific Standard Disclosures
Average hours of training per employee trained, broken down by professional category, region, and gender
Brazil Other countries Basic boundary Expanded boundary
2016 2015 2014 2016 2015 2014 2016 2015 2014 2016 2015 2014
Total workforce 43.29 37.17 20.94 8.80 14.18 17.67 46.51 38.09 36.2 46.02 38.62 38.69
Men 44.49 39.94 20.58 8.37 13.43 14.77 47.17 41.54 38.48 46.86 42.18 40.92
Women 35.94 21.55 25.04 14.05 19.90 32.67 43.93 24.06 26.52 42.75 24.41 29.27
Management team
Men 37.36 11.57 31.17 8.00 15.25 20.67 33.41 34.03 30.95 33.65 34.48 31.35
Women 31.67 20.67 71.2 0.00 49.00 16.00 36.16 35.65 30.76 35.96 35.66 30.76
Total 36.26 13.59 39.51 8.00 26.50 20.5 33.90 34.29 30.92 34.06 34.66 31.27
Middle managers and skilled technicians
Men 31.80 16.26 14.21 10.63 14.04 14.24 39.71 37.05 37.00 40.23 39.23 43.03
Women 34.49 16.75 18.59 17.50 11.24 36.37 34.19 24.89 27.21 33.80 25.69 31.50
Total 32.55 16.42 15.55 11.45 13.44 20.71 38.22 33.74 34.36 38.52 35.62 39.97
Skilled workers and support personnel
Men 47.77 44.33 21.56 6.58 13.06 14.85 53.19 44.92 39.83 52.71 44.79 39.98
Women 37.36 25.10 38.25 4.83 37.57 19.25 59.50 22.05 25.20 57.91 21.71 25.44
Total 46.77 42.28 22.03 6.51 14.18 15.08 54.11 41.69 37.89 53.48 41.42 38.05

Information Supplementary to the Sustainability Report 2016 /
Part II. Specific Standard Disclosures / 43
G4-LA11 Employees receiving regular performance and career development reviews
Employees receiving performance reviews by region and gender
Spain United Kingdom United States Mexico
2016 2015 2014 2016 2015 2014 2016 201527 2014 2016 2015 2014
By professional category
Men 8,408 8,618 8,870 4,280 4,563 4,662 4,838 3,499 3,528 736 664 620
Management team 424 444 475 111 115 120 104 95 83 22 24 26
Middle managers and skilled technicians 3,435 3,501 3,517 2,576 2,589 2,582 1,856 1,292 1,277 418 389 350
Skilled workers and support personnel 4,549 4,673 4,878 1,593 1,859 1,960 2,878 2,112 2,168 296 251 244
Women 1,987 1,951 1,968 2,093 2,133 2,194 2,011 1,508 1,529 138 137 116
Management team 80 71 69 28 27 34 42 31 22 3 4 3
Middle managers and skilled technicians 1,308 1,275 1,267 1,054 1,011 997 1,097 878 865 110 105 83
Skilled workers and support personnel 599 605 632 1,011 1,095 1,163 872 599 642 25 28 30
Total 10,395 10,569 10,838 6,373 6,696 6,856 6,849 5,007 5,057 874 801 736
Receiving performance reviews (%)
Men 95.48 94.58 95.40 99.60 98.90 100.00 48.08 20.26 19.61 45.92 95.63 98.71
Management team 100.00 98.20 99.58 98.20 99.13 100.00 100.00 0.00 21.69 4.55 100.00 100.00
Middle managers and skilled technicians 95.81 95.57 97.67 99.42 97.80 100.00 99.57 31.04 28.82 69.62 92.54 97.16
Skilled workers and support personnel 94.64 93.49 93.32 100.00 100.43 100.00 13.00 14.58 14.11 15.54 100.00 99.18
Women 94.71 96.67 98.32 100.00 99.44 99.68 63.45 26.72 11.77 65.94 96.35 96.55
Management team 97.50 100.00 98.55 100.00 100.00 100.00 100.00 6.45 4.55 33.33 100.00 100.00
Middle managers and skilled technicians 95.49 97.10 99.61 100.00 98.81 99.30 99.54 44.19 14.91 73.64 96.19 92.86
Skilled workers and support personnel 92.82 95.37 96.04 100.00 100.00 100.00 16.28 2.17 7.79 36.00 96.43 103.33
Total 95.33 94.97 95.93 99.75 99.07 99.90 52.59 22.21 17.24 49.08 95.76 98.37
27 The percentage of women with performance reviews for 2015 was changed compared to previous reporting due to revision and update.

/ Information Supplementary to the Sustainability Report 2016
44 / Part II. Specific Standard Disclosures
Employees receiving performance reviews by region and gender
Brazil Other countries Basic boundary Expanded boundary
2016 2015 2014 2016 2015 2014 2016 2015 2014 2016 2015 2014
By professional category
Men 3,222 3,233 3,251 133 123 114 21,617 20,700 21,045 23,298 22,287 22,752
Management team 21 21 25 6 5 3 688 704 732 694 710 753
Middle managers and skilled technicians 458 466 459 75 65 52 8,818 8,301 8,237 9,987 9,416 9,393
Skilled workers and support personnel 2,743 2,746 2,767 52 53 59 12,111 11,695 12,076 12,617 12,161 12,606
Women 520 514 494 29 35 41 6,778 6,278 6,342 7,293 6,769 6,845
Management team 6 6 10 2 2 2 161 141 140 161 141 140
Middle managers and skilled technicians 246 224 201 22 28 28 3,837 3,521 3,441 4,224 3,880 3,808
Skilled workers and support personnel 268 284 283 5 5 11 2,780 2,616 2,761 2,908 2,748 2,897
Total 3,742 3,747 3,745 162 158 155 28,395 26,978 27,387 30,591 29,056 29,597
Receiving performance reviews (%)
Men 93.45 88.43 86.31 48.87 39.02 19.30 83.42 76.84 81.99 83.71 77.17 81.61
Management team 100.00 95.24 80.00 66.67 60.00 33.33 97.53 84.80 89.90 96.83 84.23 87.65
Middle managers and skilled technicians 96.29 91.20 91.29 61.33 44.62 11.54 96.16 85.45 75.79 96.04 84.73 85.66
Skilled workers and support personnel 92.89 87.91 85.54 28.85 30.19 25.42 73.33 78.82 78.19 73.23 79.23 78.22
Women 85.77 76.46 78.14 37.93 40.00 17.07 85.56 72.27 75.79 85.68 72.75 75.80
Management team 100.00 100.00 50.00 100.00 50.00 50.00 98.14 81.04 80.56 98.14 79.43 80.00
Middle managers and skilled technicians 84.15 82.59 86.57 27.27 32.14 14.29 96.14 82.91 76.58 95.12 82.81 76.65
Skilled workers and support personnel 86.57 71.13 73.14 60.00 80.00 18.18 70.25 73.32 74.61 71.29 73.25 74.49
Total 92.38 86.79 85.23 46.91 39.24 18.71 83.93 81.04 80.56 84.18 81.05 80.26

Information Supplementary to the Sustainability Report 2016 /
Part II. Specific Standard Disclosures / 45
Aspect: Diversity and equal opportunity
G4-LA12 Composition of governance bodies and breakdown of employees per employee category according to gender, age group, minority group membership, and other indicators of diversity
Total workforce by region, gender, and professional category
Spain United Kingdom United States Mexico
2016 2015 2014 2016 2015 2014 2016 201528 2014 2016 2015 2014
Total workforce 10,395 10,569 10,838 6,373 6,696 6,856 6,849 6,889 5,057 874 801 736
By gender
Men 8,408 8,618 8,870 4,280 4,563 4,662 4,838 4,811 3,528 736 664 620
Women 1,987 1,951 1,968 2,093 2,133 2,194 2,011 2,078 1,529 138 137 116
By gender (%)
Men 81% 82% 82% 67% 68% 68% 71% 70% 70% 84% 83% 84%
Women 19% 18% 18% 33% 32% 32% 29% 30% 30% 16% 17% 16%
By professional category
Men
Management team 424 444 475 111 115 120 104 95 83 22 24 26
Middle managers and skilled technicians 3,435 3,501 3,517 2,576 2,589 2,582 1,856 1,292 1,277 418 389 350
Skilled workers and support personnel 4,549 4,673 4,878 1,593 1,859 1,960 2,878 2,112 2,168 296 251 244
Women
Management team 80 71 69 28 27 34 42 31 22 3 4 3
Middle managers and skilled technicians 1,308 1,275 1,267 1,054 1,011 997 1,097 878 865 110 105 83
Skilled workers and support personnel 599 605 632 1,011 1,095 1,163 872 599 642 25 28 30
By professional category (%)
Men
Management team 4% 4% 4% 2% 2% 2% 2% 1% 2% 3% 3% 4%
Middle managers and skilled technicians 33% 33% 32% 40% 39% 38% 27% 19% 25% 48% 49% 48%
Skilled workers and support personnel 44% 44% 45% 25% 28% 29% 42% 31% 43% 34% 31% 33%
Women
Management team 1% 1% 1% 0% 0% 0% 1% 0% 0% 0% 0% 0%
Middle managers and skilled technicians 13% 12% 12% 17% 15% 15% 16% 13% 17% 13% 13% 11%
Skilled workers and support personnel 6% 6% 6% 16% 16% 17% 13% 9% 13% 3% 3% 4%
By age group
Men
Up to 30 years old 401 412 513 605 575 611 506 522 373 184 140 125
Between 31 and 50 years old 4,370 4,431 4,480 2,177 2,325 2,467 2,197 2,184 1,624 489 460 436
More than 50 years old 3,637 3,775 3,877 1,498 1,663 1,584 2,135 2,105 1,531 63 64 59
Women
Up to 30 years old 88 84 102 210 238 284 161 191 157 38 40 36
Between 31 and 50 years old 1,367 1,356 1,375 1,407 1,430 1,473 950 993 768 95 94 78
More than 50 years old 532 511 492 476 465 437 900 894 604 5 3 2
By age group (%)
Men
Up to 30 years old 4% 4% 5% 9% 9% 9% 7% 8% 7% 21% 17% 17%
Between 31 and 50 years old 42% 42% 41% 34% 35% 36% 32% 32% 32% 56% 57% 59%
More than 50 years old 35% 36% 36% 24% 25% 23% 31% 31% 30% 7% 8% 8%
Women
Up to 30 years old 1% 1% 1% 3% 4% 4% 2% 3% 3% 4% 5% 5%
Between 31 and 50 years old 13% 13% 13% 22% 21% 21% 14% 14% 15% 11% 12% 11%
More than 50 years old 5% 5% 5% 7% 7% 6% 13% 13% 12% 1% 0% 0%
28 The breakdown by professional category does not include those for the former UIL Holdings corporation since its merger with Avangrid in the United States on 16 December 2015, as they are not yet included in the corporate systems.

/ Information Supplementary to the Sustainability Report 2016
46 / Part II. Specific Standard Disclosures
Total workforce by region, gender, and professional category
Brazil Other countries Basic boundary Expanded boundary
2016 2015 2014 2016 2015 2014 2016 2015 2014 2016 2015 2014
Total workforce 3,742 3,747 3,745 162 158 155 28,395 28,860 27,387 30,591 30,938 29,597
By gender
Men 3,222 3,233 3,251 133 123 114 21,617 22,012 21,045 23,299 23,599 22,752
Women 520 514 494 29 35 41 6,778 6,848 6,342 7,292 7,339 6,845
By gender (%)
Men 86% 86% 87% 82% 78% 74% 76% 76% 77% 76% 76% 77%
Women 14% 14% 13% 18% 22% 26% 24% 24% 23% 24% 24% 23%
By professional category
Men
Management team 21 21 25 6 5 3 688 704 732 694 710 753
Middle managers and skilled technicians 458 466 459 75 65 52 8,818 8,301 8,237 9,987 9,416 9,393
Skilled workers and support personnel 2,743 2,746 2,767 52 53 59 12,111 11,694 12,076 12,617 12,161 12,606
Women
Management team 6 6 10 2 2 2 161 141 140 161 141 140
Middle managers and skilled technicians 246 224 201 22 28 28 3,837 3,522 3,441 4,224 3,881 3,808
Skilled workers and support personnel 268 284 283 5 5 11 2,780 2,616 2,761 2,908 2,748 2,897
By professional category (%)
Men
Management team 1% 1% 1% 4% 3% 2% 2% 2% 3% 2% 2% 3%
Middle managers and skilled technicians 12% 12% 12% 46% 41% 34% 31% 29% 30% 33% 30% 32%
Skilled workers and support personnel 73% 73% 74% 32% 34% 38% 43% 41% 44% 41% 39% 43%
Women
Management team 0% 0% 0% 1% 1% 1% 1% 0% 1% 1% 0% 0%
Middle managers and skilled technicians 7% 6% 5% 14% 18% 18% 13% 12% 13% 14% 13% 13%
Skilled workers and support personnel 7% 8% 8% 3% 3% 7% 10% 9% 10% 10% 9% 10%
By age group
Men
Up to 30 years old 952 1,013 1,103 9 10 9 2,656 2,672 2,734 3,101 3,060 3,104
Between 31 and 50 years old 2,039 1,991 1,923 112 104 98 11,384 11,495 11,028 12,211 12,259 11,822
More than 50 years old 231 229 225 12 9 7 7,576 7,845 7,283 7,987 8,280 7,826
Women
Up to 30 years old 199 212 209 2 2 4 699 767 792 844 910 916
Between 31 and 50 years old 298 281 263 25 31 34 4,143 4,185 3,991 4,454 4,470 4,277
More than 50 years old 22 21 22 2 2 3 1,937 1,896 1,560 1,994 1,959 1,652
By age group (%)
Men
Up to 30 years old 25% 27% 29% 6% 6% 6% 9% 9% 10% 10% 10% 10%
Between 31 and 50 years old 55% 53% 51% 69% 66% 63% 40% 40% 40% 40% 40% 40%
More than 50 years old 6% 6% 6% 7% 6% 5% 27% 27% 27% 26% 27% 26%
Women
Up to 30 years old 5% 6% 6% 1% 1% 3% 2% 3% 3% 3% 3% 3%
Between 31 and 50 years old 8% 7% 7% 15% 20% 22% 15% 15% 15% 15% 14% 14%
More than 50 years old 1% 1% 1% 1% 1% 2% 7% 7% 6% 7% 6% 6%

Information Supplementary to the Sustainability Report 2016 /
Part II. Specific Standard Disclosures / 47
Breakdown of Board of Directors by gender and age group
Number of membersof the Board
2016 2015 2014
no. % no. % no. %
MenUp to 30 years oldBetween 31 and 50 years oldMore than 50 years old
0 1 8
0% 7%
57%
0 0 9
0% 0%
64%
0 0 9
0% 0%
64%
WomenUp to 30 years oldBetween 31 and 50 years oldMore than 50 years old
0 2 3
0%
14%21%
0 23
0%
14%21%
0 23
0%
14%21%
Aspect: Equal remuneration for women and men
G4-LA13 Ratio of basic salary and remuneration of women to men by employee category, by professional category and region
The table below shows the salary ratio of men to women within the various boundaries, and although the data set forth therein might suggest inconsistency with the management approach for the “Diversity and Equal Opportunity” Aspect and the “Equal Remuneration for Women and Men” Aspect described in the Sustainability Report 2016, the differences between the salaries of men and women are a consequence of changes in the structure of the workforce rather than the result of a policy of discrimination, given that each professional category includes:
– different professional levels, with different proportions between men and women, and– groups from different geographical areas, in different currencies and salary bands.The ratio of employees by professional category and gender is available in indicator G4-LA12.
Ratio of basic salary of men to women by professional category (%)
Spain United Kingdom United States Mexico
2016 2015 2014 2016 2015 2014 2016 2015 2014 2016 2015 2014
Middle managers and skilled technicians 110.89 115.70 102.09 115.16 115.00 116.52 122.61 106.20 130.33 126.45 126.00 129.04
Skilled workers and support personnel 104.43 101.00 96.35 125.76 127.90 129.36 128.28 137.30 138.12 78.77 98.10 102.99
Ratio of basic salary of men to women by professional category (%)
Brazil Other countries Basic boundary Expanded boundary
2016 2015 2014 2016 2015 2014 2016 2015 2014 2016 2015 2014
Middle managers and skilled technicians 131.46 100.80 127.23 140.62 131.10 104.76 113.00 108.70 108.97 106.63 105.50 106.81
Skilled workers and support personnel 120.37 103.30 123.51 92.60 103.60 132.61 100.02 99.00 98.87 99.84 100.70 99.11

/ Information Supplementary to the Sustainability Report 2016
48 / Part II. Specific Standard Disclosures
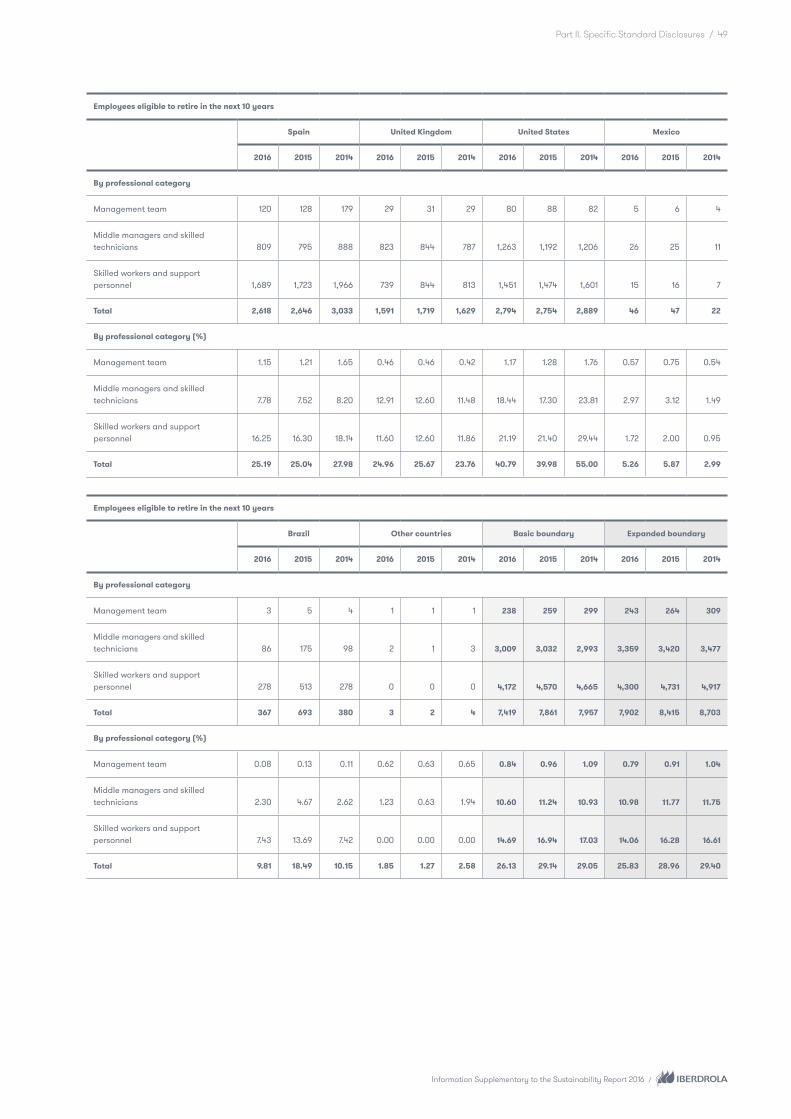
EU15 Percentage of employees eligible to retire in the next 5 and 10 years broken down by job category and by region
Employees eligible to retire in the next 5 years
Spain United Kingdom United States29 Mexico
2016 2015 2014 2016 2015 2014 2016 2015 2014 2016 2015 2014
By professional category
Management team 46 56 89 6 7 7 36 65 60 2 2 3
Middle managers and skilled technicians 303 292 366 300 334 309 685 875 859 14 8 7
Skilled workers and support personnel 606 636 810 320 372 339 726 1,091 1,177 3 1 5
Total 955 984 1,265 626 713 655 1,447 2,031 2,096 19 11 15
By professional category (%)
Management team 0.44 0.53 0.82 0.09 0.10 0.10 0.53 1.30 1.19 0.23 0.25 0.41
Middle managers and skilled technicians 2.91 2.76 3.38 4.71 4.99 4.51 10.00 17.48 16.99 1.60 1.00 0.95
Skilled workers and support personnel 5.83 6.02 7.48 5.02 5.56 4.94 10.60 21.79 23.27 0.34 0.12 0.68
Total 9.19 9.31 11.68 9.82 10.65 9.55 21.13 40.56 41.45 2.17 1.37 2.04
Employees eligible to retire in the next 5 years
Brazil Other countries Basic boundary Expanded boundary
2016 2015 2014 2016 2015 2014 2016 2015 2014 2016 2015 2014
By professional category
Management team 1 1 2 1 1 0 92 132 161 93 133 165
Middle managers and skilled technicians 42 60 60 1 1 3 1,345 1,570 1,604 1,591 1,818 1,769
Skilled workers and support personnel 116 119 119 0 0 0 1,771 2,219 2,450 1,869 2,323 2,548
Total 159 180 181 2 2 3 3,208 3,921 4,216 3,553 4,274 4,481
By professional category (%)
Management team 0.03 0.03 0.05 0.62 0.63 0.00 0.32 0.49 0.59 0.30 0.46 0.56
Middle managers and skilled technicians 1.12 1.60 1.60 0.62 0.63 1.94 4.74 5.82 5.98 5.20 6.26 5.98
Skilled workers and support personnel 3.10 3.18 3.18 0.00 0.00 0.00 6.24 8.23 8.95 6.11 7.99 8.61
Total 4.23 4.80 4.83 1.23 1.27 1.94 11.30 14.53 15.39 11.61 14.71 15.14
29 The change in the United States is due to a change in the calculation standard, which now uses 62 years as the reference age.
Information Supplementary to the Sustainability Report 2016 /
Part II. Specific Standard Disclosures / 49
Employees eligible to retire in the next 10 years
Spain United Kingdom United States Mexico
2016 2015 2014 2016 2015 2014 2016 2015 2014 2016 2015 2014
By professional category
Management team 120 128 179 29 31 29 80 88 82 5 6 4
Middle managers and skilled technicians 809 795 888 823 844 787 1,263 1,192 1,206 26 25 11
Skilled workers and support personnel 1,689 1,723 1,966 739 844 813 1,451 1,474 1,601 15 16 7
Total 2,618 2,646 3,033 1,591 1,719 1,629 2,794 2,754 2,889 46 47 22
By professional category (%)
Management team 1.15 1.21 1.65 0.46 0.46 0.42 1.17 1.28 1.76 0.57 0.75 0.54
Middle managers and skilled technicians 7.78 7.52 8.20 12.91 12.60 11.48 18.44 17.30 23.81 2.97 3.12 1.49
Skilled workers and support personnel 16.25 16.30 18.14 11.60 12.60 11.86 21.19 21.40 29.44 1.72 2.00 0.95
Total 25.19 25.04 27.98 24.96 25.67 23.76 40.79 39.98 55.00 5.26 5.87 2.99
Employees eligible to retire in the next 10 years
Brazil Other countries Basic boundary Expanded boundary
2016 2015 2014 2016 2015 2014 2016 2015 2014 2016 2015 2014
By professional category
Management team 3 5 4 1 1 1 238 259 299 243 264 309
Middle managers and skilled technicians 86 175 98 2 1 3 3,009 3,032 2,993 3,359 3,420 3,477
Skilled workers and support personnel 278 513 278 0 0 0 4,172 4,570 4,665 4,300 4,731 4,917
Total 367 693 380 3 2 4 7,419 7,861 7,957 7,902 8,415 8,703
By professional category (%)
Management team 0.08 0.13 0.11 0.62 0.63 0.65 0.84 0.96 1.09 0.79 0.91 1.04
Middle managers and skilled technicians 2.30 4.67 2.62 1.23 0.63 1.94 10.60 11.24 10.93 10.98 11.77 11.75
Skilled workers and support personnel 7.43 13.69 7.42 0.00 0.00 0.00 14.69 16.94 17.03 14.06 16.28 16.61
Total 9.81 18.49 10.15 1.85 1.27 2.58 26.13 29.14 29.05 25.83 28.96 29.40
/ Information Supplementary to the Sustainability Report 2016
50 / Part II. Specific Standard Disclosures
C2. Human Rights
Information Supplementary to the Sustainability Report 2016 /
Part II. Specific Standard Disclosures / 51
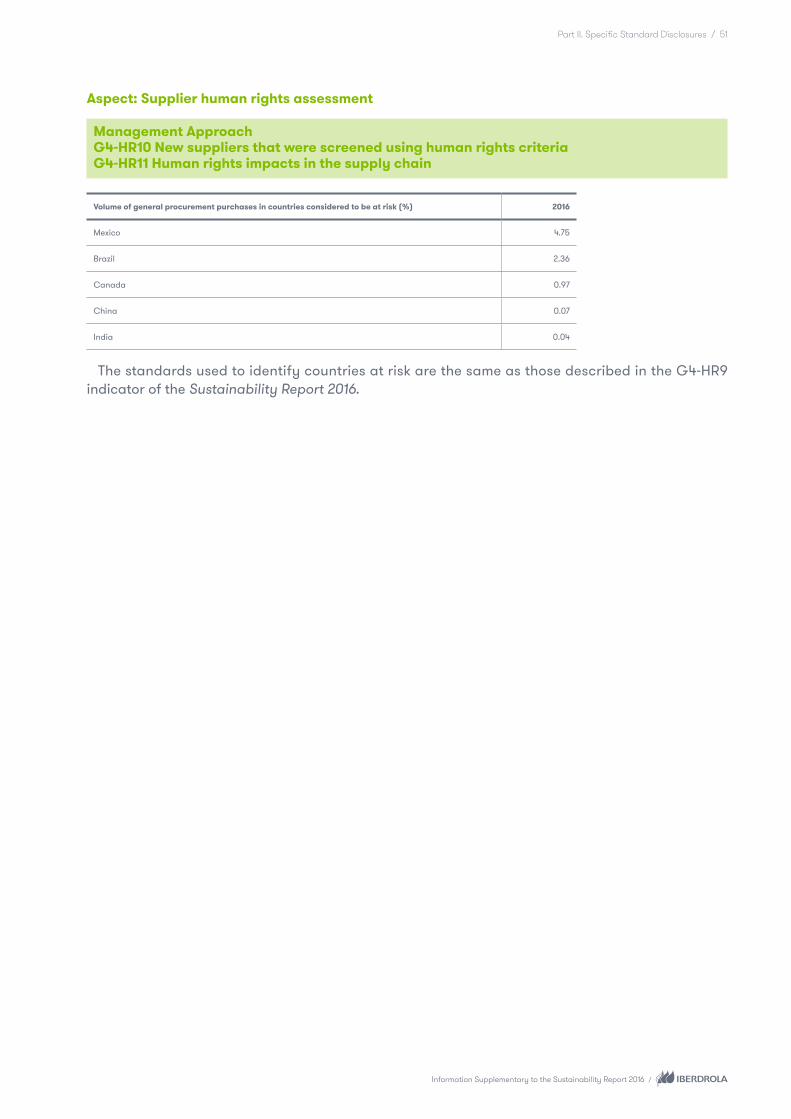
Aspect: Supplier human rights assessment
Management Approach G4-HR10 New suppliers that were screened using human rights criteria G4-HR11 Human rights impacts in the supply chain
Volume of general procurement purchases in countries considered to be at risk (%) 2016
Mexico 4.75
Brazil 2.36
Canada 0.97
China 0.07
India 0.04
The standards used to identify countries at risk are the same as those described in the G4-HR9 indicator of the Sustainability Report 2016.
/ Information Supplementary to the Sustainability Report 2016
52 / Part II. Specific Standard Disclosures
C4. Product Responsibility
Information Supplementary to the Sustainability Report 2016 /
Part II. Specific Standard Disclosures / 53
Electric Utilities Sector Specific Aspect: Access
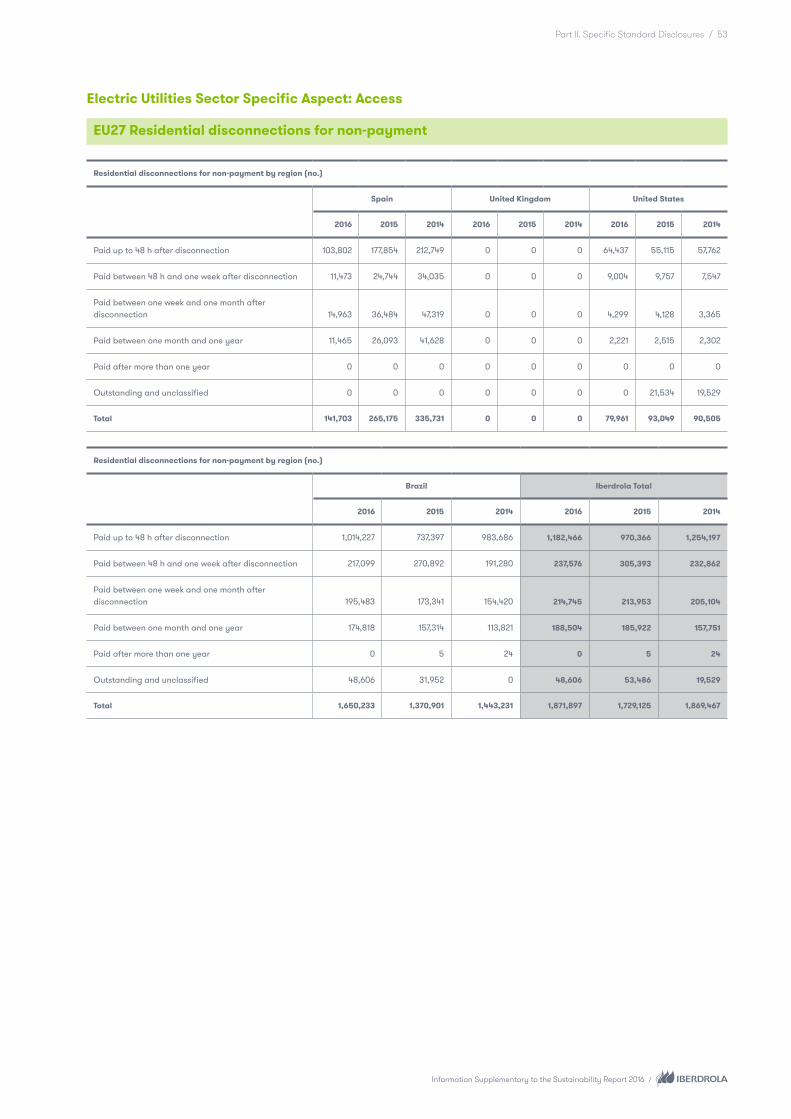
EU27 Residential disconnections for non-payment
Residential disconnections for non-payment by region (no.)
Spain United Kingdom United States
2016 2015 2014 2016 2015 2014 2016 2015 2014
Paid up to 48 h after disconnection 103,802 177,854 212,749 0 0 0 64,437 55,115 57,762
Paid between 48 h and one week after disconnection 11,473 24,744 34,035 0 0 0 9,004 9,757 7,547
Paid between one week and one month after disconnection 14,963 36,484 47,319 0 0 0 4,299 4,128 3,365
Paid between one month and one year 11,465 26,093 41,628 0 0 0 2,221 2,515 2,302
Paid after more than one year 0 0 0 0 0 0 0 0 0
Outstanding and unclassified 0 0 0 0 0 0 0 21,534 19,529
Total 141,703 265,175 335,731 0 0 0 79,961 93,049 90,505
Residential disconnections for non-payment by region (no.)
Brazil Iberdrola Total
2016 2015 2014 2016 2015 2014
Paid up to 48 h after disconnection 1,014,227 737,397 983,686 1,182,466 970,366 1,254,197
Paid between 48 h and one week after disconnection 217,099 270,892 191,280 237,576 305,393 232,862
Paid between one week and one month after disconnection 195,483 173,341 154,420 214,745 213,953 205,104
Paid between one month and one year 174,818 157,314 113,821 188,504 185,922 157,751
Paid after more than one year 0 5 24 0 5 24
Outstanding and unclassified 48,606 31,952 0 48,606 53,486 19,529
Total 1,650,233 1,370,901 1,443,231 1,871,897 1,729,125 1,869,467

/ Information Supplementary to the Sustainability Report 2016
54 / Part II. Specific Standard Disclosures
Residential reconnections following payment of unpaid bills, by region (no.)
Spain United Kingdom United States
2016 2015 2014 2016 2015 2014 2016 2015 2014
Less than 24 h after payment 139,706 261,145 322,466 0 0 0 43,262 21,534 54,650
Between 24 h and one week after payment 3,537 7,177 11,724 0 0 0 5,663 12,049 6,025
More than one week after payment 173 386 622 0 0 0 5,296 1,076 5,999
Unclassified 0 0 0 0 0 0 0 0 0
Total 143,416 268,708 334,812 0 0 0 54,221 34,659 66,674
Residential reconnections following payment of unpaid bills, by region (no.)
Brazil Total Iberdrola
2016 2015 2014 2016 2015 2014
Less than 24 h after payment 1,378,234 1,161,881 1,170,114 1,561,202 1,444,560 1,547,230
Between 24 h and one week after payment 182,132 143,614 156,071 191,332 162,840 173,820
More than one week after payment 96,599 103,999 106,308 102,068 105,461 112,929
Unclassified 14,634 9,156 70,512 14,634 9,156 70,512
Total 1,671,599 1,418,650 1,503,005 1,869,236 1,722,017 1,904,491
Information Supplementary to the Sustainability Report 2016 /
Part II. Specific Standard Disclosures / 55
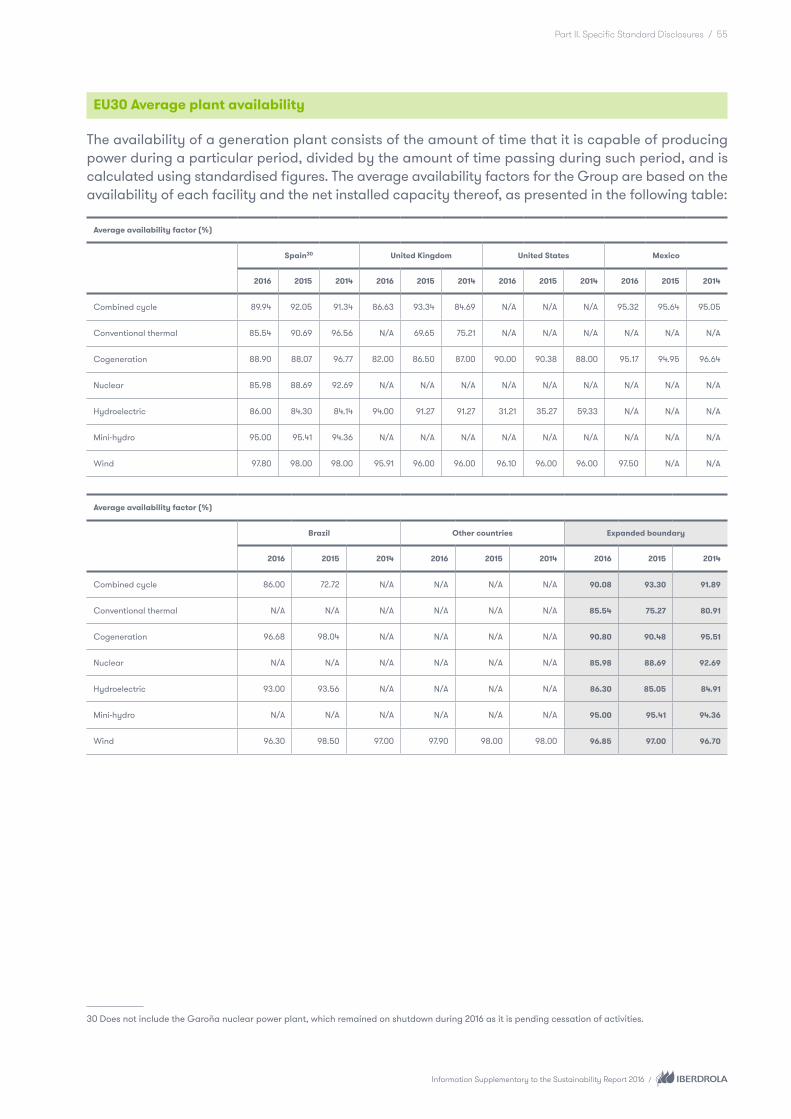
EU30 Average plant availability
The availability of a generation plant consists of the amount of time that it is capable of producing power during a particular period, divided by the amount of time passing during such period, and is calculated using standardised figures. The average availability factors for the Group are based on the availability of each facility and the net installed capacity thereof, as presented in the following table:
Average availability factor (%)
Spain30 United Kingdom United States Mexico
2016 2015 2014 2016 2015 2014 2016 2015 2014 2016 2015 2014
Combined cycle 89.94 92.05 91.34 86.63 93.34 84.69 N/A N/A N/A 95.32 95.64 95.05
Conventional thermal 85.54 90.69 96.56 N/A 69.65 75.21 N/A N/A N/A N/A N/A N/A
Cogeneration 88.90 88.07 96.77 82.00 86.50 87.00 90.00 90.38 88.00 95.17 94.95 96.64
Nuclear 85.98 88.69 92.69 N/A N/A N/A N/A N/A N/A N/A N/A N/A
Hydroelectric 86.00 84.30 84.14 94.00 91.27 91.27 31.21 35.27 59.33 N/A N/A N/A
Mini-hydro 95.00 95.41 94.36 N/A N/A N/A N/A N/A N/A N/A N/A N/A
Wind 97.80 98.00 98.00 95.91 96.00 96.00 96.10 96.00 96.00 97.50 N/A N/A
Average availability factor (%)
Brazil Other countries Expanded boundary
2016 2015 2014 2016 2015 2014 2016 2015 2014
Combined cycle 86.00 72.72 N/A N/A N/A N/A 90.08 93.30 91.89
Conventional thermal N/A N/A N/A N/A N/A N/A 85.54 75.27 80.91
Cogeneration 96.68 98.04 N/A N/A N/A N/A 90.80 90.48 95.51
Nuclear N/A N/A N/A N/A N/A N/A 85.98 88.69 92.69
Hydroelectric 93.00 93.56 N/A N/A N/A N/A 86.30 85.05 84.91
Mini-hydro N/A N/A N/A N/A N/A N/A 95.00 95.41 94.36
Wind 96.30 98.50 97.00 97.90 98.00 98.00 96.85 97.00 96.70
30 Does not include the Garoña nuclear power plant, which remained on shutdown during 2016 as it is pending cessation of activities.

/ Information Supplementary to the Sustainability Report 2016
56