ib extended essay biology - core · extended essay - biology barış bakir - d1129012 page 4 of 32...
TRANSCRIPT

IB Extended Essay
Biology
Research on the effects of varying Zn2+ solution concentrations on the
growth rate of terrestrial plant Cicer arietinum L. (Chickpea)
measured in terms of length
Name: Barış Bakır
Session number: 001129-012
School name, code: TED Ankara College Foundation Private High School [001129]
Session: May 2011
Word count: 3465
Date: November, 2010

Extended Essay - Biology Barış BAKIR - D1129012
Page 2 of 32
Abstract
Pollution is a big problem in today’s world. Zinc deposition in nature can cause toxic effect
for living organisms and human activity is big source of zinc output. This experiment focused
on effects zinc deposition and dealt with the research question, “How is the growth
(irreversible change in size) of Cicer arietinum L. (Chickpea) in terms of height (cm) effected
by different concentrations of Zn2+ solutions mixed different groups while the soil quality, pH,
temperature and pressure is tried to be constant for all groups?” Would zinc increase of
decrease plant growth? How would it affect photosynthesis? Scope of this experiment is
limited to terrestrial plants and the effects of zinc given in zinc sulfate form. Results may not
be valid for aquatic plants and zinc given in different forms and mixed with other materials.
The plant used in this experiment was Cicer arietinum L. (Chickpea). 10 mL of solutions
having different concentrations of zinc were added once two days to plant samples and stem
lengths were recorded daily. Five groups were tested, they were watered, 0g /10 mL, 0.25 g
/10 mL, 0.50 g /10 mL, 0.75 g /10 mL and 1.00 g /10 mL for groups 1, 2, 3, 4 and 5
respectively. The samples were observed for 20 days and their growths were measured.
The results showed that there was a clear decline in growth as the zinc concentrations
increased. There was significant growth difference present between the groups. The results of
this experiment supported my hypothesis that stated there would be significant growth
difference caused by zinc deposition and lead to the conclusion that high quantities of zinc has
a toxic effect and had a negative effect on plant growth.
Word Count: 285
Extended Essay - Biology Barış BAKIR - D1129012
Page 3 of 32
Table of Contents
Abstract ...................................................................................................................................... 2
Table of Contents ....................................................................................................................... 3
Introduction ................................................................................................................................ 4
Hypothesis .................................................................................................................................. 7
Method Development and Planning ........................................................................................... 8
Diagrams .................................................................................................................................. 13
Materials/Apparatus ................................................................................................................. 16
Method ..................................................................................................................................... 16
Results and Analysis ................................................................................................................ 19
Conclusion and Evaluation ....................................................................................................... 27
Bibliography ............................................................................................................................. 30
Extended Essay - Biology Barış BAKIR - D1129012
Page 4 of 32
Research on the effects of varying Zn2+ solution concentrations on the growth rate of
terrestrial plant Cicer arietinum L. (Chickpea) measured in terms of length
Introduction
The first time it was a daunting task for me to select a topic that could be investigated
seriously. I had lots of interest areas in biology but the experiments were very hard to
perform. One day, I saw a program on TV about the use of hormones, fertilizers and various
minerals in agriculture and also pollution’s effects on plants. It was particularly an interesting
subject for me and I based my study on that area.
I researched on the substances and minerals that effect plant growth. Zinc is required for
growth of the plants because it is a very important cofactor that works with various types of
enzyme classes such as lyases, transferases, hydrolases, oxidoreductases, isomerases, and
ligases.1 It is also essential for the transformation of carbohydrates and regulates sugar
consumption.2 Zinc deficiency has negative effects such as reduced protein and starch
production in tomato.3 Zinc is essential but excess of it has a toxic effect on living
organisms.4, 5 This toxicity is seen in contaminated soils because of mining and other urban
activities.6 It is hard to determine the optimum amount of zinc since zinc toxicity tolerance
varies even in the same specie.7 It is recorded that plants show toxicity symptoms when the
zinc concentration at leaf is above 300 mg Zn per kg dry weight.5
1 Webb, EC. Enzyme nomenclature, recommendations of the Nomenclature Committee of the International Union of Biochemistry and Molecular Biology. New York: Academic Press, 1992. 2 “Plant Nutrients.” Kids World - Plant Nutrition. Brought by NCDA&CS. Date of access 07 September 2010. <http://www.ncagr.gov/cyber/kidswrld/plant/nutrient.htm#Zinc> 3 Hoagland, DR. Lectures on the inorganic nutrition of plants. 2nd ed. Waltham: Chronica Botanica Company, 1948. 4 Fosmire, Gary J. "Zinc toxicity.” The American Journal of Clinical Nutrition. 29 Mar 1990. Date of access 07 Sep 2010. <http://www.ajcn.org/content/51/2/225.full.pdf> 5 Chaney, RL. “Zinc phytotoxicity.” Ed. A.D. Robson. Zinc in soil and plants. Dordrecht: Kluwer Academic Publishers, 1993. 135–150. 6 Kahvecioğlu, Özge; Güldem Kartal, Aybars Güven, and Servet Timur. “Metallerin Çevresel Etkileri–I (Trans: Environmental Effects of Metals–I).” UCTEA Chamber of Metallurgical Engineers. 13 Mar 2009. Date of access 25 Sep 2010. <http://www.metalurji.org.tr/dergi/dergi136/d136_4753.pdf> 7 Davies, BE. “Radish as an indicator plant for derelict land – uptake of zinc at toxic concentrations.” Communications in Soil Science and Plant Analysis. 1993.

Extended Essay - Biology Barış BAKIR - D1129012
Page 5 of 32
Plants receive Zinc from the soil. A source of zinc is the parent rocks’ physical and chemical
weathering; Lithosphere comprises 70–80 micrograms of zinc per gram, sedimentary rocks
have 10–120 micrograms of zinc per gram.8, 9, 10 Another natural source of zinc in soil is
atmospheric and biotic processes that usually takes place on the surface of the earth.8 There is
also large amounts of zinc input into soil by human activities such as mining and industrial
activities.11
In later research, I decided to work on the specie Cicer arietinum L. (Chickpea). Chickpea is
from the Plantae kingdom, Tracheobionta subkingdom, Spermatophyta superdivision,
Magnoliophyta division, Magnoliopsida class, Rosidae subclass, Fabales order, Fabaceae
family, Faboideae subfamily and Cicer genus.12 Chick pea is grown in temperate, sub-tropical
and tropical regions.13
Cicer arietinum L. (Chickpea) seeds are used in many dishes served in various ways. It can be
fried, roasted, boiled or eaten fresh. Its can be served as a usual snack, condiment or sweet.
Also Cicer arietinum L. (Chickpea) seed separated from its seed coat can be used in soups
and as flour for snacks, Cicer arietinum L. (Chickpea) seeds are very nutritive because of
their high protein content reaching 25.3-28.9 %.14, 15 Also The Vegetarian Society states that a
200g single serving of chickpeas contain approximately 2.8 mg zinc, which makes it a good
source of zinc which is a very important mineral for humans.16
8 Friedland AJ. “The movement of metals through soils and ecosystems.” Heavy metal tolerance in plants: evolutionary aspects. Ed. A.J. Shaw. Boca Raton: CRC Press, 1990. Pages 7–19. 9 Barak, P., and P.A. Helmke. “The chemistry of zinc.” Zinc in soil and plants. Ed: AD Robson. Dordrecht: Kluwer Academic Publishers, 1993. Pages 1–13. 10 Alloway, BJ. Heavy metals in soils, 2nd edition. London: Blackie Academic & Professional, 1995. 11 Nriagu, JO. “A history of global metal pollution.” 1996. Science 272: 223–224. 12 “Cicer arietinum L.” USDA – Natural Resources Conservation Service, Plant Database. Date of access 05 Sep 2010. <http://plants.usda.gov/java/profile?symbol=CIAR5> 13 Malhotra, R.S., R.P.S. Pundir and A.E. Slinkard. “Genetic resources of chickpea.” The Chickpea. Ed. M.C. Saxena and K.B. Singh. Aberystwyth: C.A.B. International Cambrian News Ltd, 1987. Pages 67-81. 14 Hulse, J.H. “Nature, composition and utilization of grain legumes.” Uses of tropical Legumes: Proceedings of a Consultants' Meeting, 27-30 March 1989. Patancheru: ICRISAT Center. ICRISAT, 1991. Pages 11-27. 15 Muehlbauer , F.J., Abebe Tulu, contributors. “Cicer arietinum L.” Purdue University. 1997. <http://www.hort.purdue.edu/newcrop/cropfactsheets/chickpea.html> 16 Vegetarian Society. Date of access 29 Sep 2010. <http://www.vegsoc.org/info/zinc.html#diet>

Extended Essay - Biology Barış BAKIR - D1129012
Page 6 of 32
Turkey is one of the top producers of Cicer arietinum L. (Chickpea), being the 3rd biggest
producer of it in 2009, producing 562564 tones that year.17 This reflects the economical
importance of chickpea agriculture in Turkey.
A couple of Cicer arietinum L. (Chickpea) seeds were planted before the actual experiment to
see how it would grow and check if it was suitable for my experiment. The seeds germinate in
a couple of days and grow very fast. Also it has a straight stem that makes length
measurements easier. So Cicer arietinum L. (Chickpea) is a very suitable specie for this
particular experiment.
This research is narrowed down on the effects of different zinc solution concentrations on
terrestrial plant Cicer arietinum L. (Chickpea). Zinc in solutions was obtained from mixing
zinc sulfate with water. The results obtained from this experiment may not apply directly for
other types of plants such as aquatic and epiphytic plants.
This experiment will focus on the research question:
“How is the growth (irreversible change in size) of Cicer arietinum L. (Chickpea) in
terms of height (cm) effected by different concentrations of Zn2+ solutions added to
different groups while the soil quality, pH, temperature and pressure is tried to be
constant for all groups?”
The importance of this research topic is to demonstrate the effects of pollution mainly due to
mining activities. This kind of pollution may be harmful for crops and effect agriculture.
Changes in agriculture directly affect human beings since nutrition is an essential part of our
lives. Researching the effects of zinc – a substance that could effect plant growth – on
terrestrial plant Cicer arietinum L. (Chickpea) could represent a model for the effects of zinc
deposition in nature and its effect on agriculture.
17 “FAOSTAT > Production > Crops.” FAOSTAT - Food and Agriculture Organization of the United Nations. Date of access 25 Oct 2010. <http://faostat.fao.org/site/567/DesktopDefault.aspx?PageID=567#ancor>

Extended Essay - Biology Barış BAKIR - D1129012
Page 7 of 32
Hypothesis
Zn is an essential substance for a plant. Plants require a minimum amount of zinc for its
growth, but excess zinc could be toxic as explained in the introduction. By looking at the
proportions used in this experiment, it is possible to predict that zinc toxicity would be
observed and growth of the plant growth would be inhibited. Quantities used in this
experiment are high above micrograms, which in this case could be considered excess for a
plant. If any toxic effect occurs, it would imply that changing zinc quantities would affect
plant growth. As a result it can be hypothesized that “Different concentrations of Zn2+
solutions will affect the growth rate of Cicer arietinum L. (Chickpea)”. The hypothesis
implies a few possible outcomes; zinc can either increase or inhibit growth of the plant. My
prediction is that zinc would show its toxic effect and inhibit plant growth.
Extended Essay - Biology Barış BAKIR - D1129012
Page 8 of 32
Method Development and Planning
A suitable method should be designed for the experiment to be performed. There are
lots of variables that could affect the results so all the variables should be kept constant except
the independent variable which in this case is the amount of zinc we put in the soil. The
dependent variable in this case is the growth of Cicer arietinum L. (Chickpea) measured by
height of the plant (in cm). It will change according to the independent variable. Other
variables that could affect the results are given below. These variables are to be kept constant
to observe the effect of different zinc concentrations.
Watering quantity
Water source
Watering time
Watering technique
Zinc source
Zinc adding time
Soil quantity
Soil source (composition)
Height of soil (under and on) the seed
Suppression of soil
Cup size, width, height (cups must be identical)
Similar seed weight, color, size, appearance (genetic variation)
Seed planting height (vertical)
Seed planting place (horizontal)
Room temperature
Room pressure
Humidity level
Surrounding air
Light exposure
Time interval and measurement time
Extended Essay - Biology Barış BAKIR - D1129012
Page 9 of 32
Water is obviously an essential material for plant growth. Plants are made up of 90% water
and water is used many important tasks such as:
1. Being the main component of transpiration and photosynthesis.
2. Keeping the turgor pressure that holds the plant erect by inflating the cells.
3. Working as a solvent to carry minerals and organic material through the plant.
4. Being the source of pressure to move roots through the soil.
5. Providing the required medium for biochemical reactions to take place.18
Because water is an essential material for growth, it has to be added at the same amounts for
each test subject. 10 mL of water should be given once two days to each test subject at 20:30
from a 20 mL (±0.5mL) injector. Subjects should be watered at 20.30 because during daytime
water would evaporate and it would be less effective.19 Watering technique is important since
watering the edges of the cup would be less beneficial for water absorption because the seed
is at the center. Watering should be done by starting from the center and watering the cup
homogenously. Water extraction from the airtight cups must be quickly done as possible
because water would evaporate increasing the concentration of the solution.
While watering the plants spreading water equally is an important aspect since it may
interfere with the growth process. The same water- Karacakaya® Natural Spring Water should
be used through the whole experiment. An important point is that it does not contain zinc.
Chemical analysis of the water is given at table 1.
18 Whiting, David, Michael Roll and Larry Vickerman. “Plant Growth Factors: Water.” Colorado State University Extension. Date of access 17 Sep 2010. <http://www.cmg.colostate.edu/gardennotes/144.pdf> 19 BBC Worldwide. “How to water your plants.” Gardeners’ World.com. Date of access 17 Sep 2010. <http://www.gardenersworld.com/how-to/projects/water-plants/>

Extended Essay - Biology Barış BAKIR - D1129012
Page 10 of 32
Chemical properties of the water used in irrigation (Karacakaya® natural spring water)
Aluminum 17 µg/L Manganese 0 mg/L
Ammonium 0 mg/L Smell Appropriate
Chloride 1.4 mg/L pH 7.15
C. perifiringes 0 in 100 mL Sulfate 4.92 mg/L
Color Appropriate Sodium 6.35 mg/L
Conductivity
(at 20ºC) 96.2 µS/cm Taste Appropriate
Iron 43 µg/L Blurriness Appropriate
Table 1: Chemical properties of the water used for irrigation during experiment.
Zinc source for this experiment is zinc sulfate (ZnSO4) because it is the mostly used zinc
source in fertilizers. 20, 21 Zinc is found in nature in many forms but this experiment does not
extend to that so only zinc sulfate (ZnSO4) compound is used. Zinc should be added to the
subjects at the closest time possible to keep the zinc addition time same for all plants since it
can interfere with the results.
Zinc addition before germination may prevent germination. This experiments scope is limited
on zincs effect on growth, not germination. Zinc addition should start after observing the first
green leave of the plant. This means that the plant has started to do photosynthesis and
growing on its own.
The composition of soil used in growing plants is very important because plant absorbs the
necessary minerals from it. A zinc free soil is required for this experiment since this
experiment focuses on zinc deposition, soil containing zinc would affect the results. Güpaş®
Özel houseplant soil was used to grow the plants. Its chemical analysis is provided at table 2.
20 Follett, R.H. and D.G. Westfall. “Zinc and Iron Deficiencies” Colorado State University Extension. Date of access 12 Sep 2010. <http://www.ext.colostate.edu/pubs/crops/00545.pdf> 21 Westfall, D.G., M. Amrani, and G.A. Peterson “Water-Solubility of Zinc Fertilizer: Does It Matter?” International Plant Nutrition Institute. Date of access 12 Sep 2010. <http://www.ipni.net/ppiweb/bcrops.nsf/$webindex/948276DF7FC729A6852568EF005CE470/$file/99-2p18.pdf>

Extended Essay - Biology Barış BAKIR - D1129012
Page 11 of 32
Chemical properties of the soil used in experiment (Güpaş® Özel houseplant soil)
Peat (turf): %80
Organic matter: %20
pH: 6.5 – 7.2
Nitrogen (N): % 0.4 – 1.0
Phosphorus (P2O5): 150 – 300 ppm
Potassium (K2O): 600 – 1200 ppm
Table 2: Chemical properties of the soil used in experiment.
Some important statements on the brand are that:
“Güpaş® Özel houseplant soil contains all the necessary nutrients in desired level and ideal
combinations for plants to grow.”
“In normal conditions Güpaş® Özel houseplant soil provides perfect growth in plants for a
long time without fertilization.”
Same type cups must be used for each plant to provide them equal area of growth. White
plastic cups were used in this experiment. The cup dimensions are given at diagram 1. (See
diagram 1)
5 liters of soil (weighing 2.4 kg) divided to 25 by volume, provides each test subject with 200
mL soil weighing 96 grams. Put the seed between layers of soil. First layer is 7.50 cm high.
The seed is put on top of that. Then 2.50 cm of additional soil is put. The same soil quantities
should be put for every plant since their roots would be similar. Having different quantities of
soil would affect the results. (See diagram 2)
To demonstrate the natural conditions, the soil must not be pressed. It must be left out as it is.
Also suppressing the soil would close the air gaps in the soil. With less air present, respiration
rate of roots could be affected therefore resulting with less growth.

Extended Essay - Biology Barış BAKIR - D1129012
Page 12 of 32
Seeds should be planted at the horizontal center and vertically 7.50 cm height. Its roots
touching the cup surface is an unwanted situation since it doesn’t reflect the natural
conditions. In natural conditions there wouldn’t be any manufactured plastic inside soil. So to
minimize contact, the seed is put right at the center because it’s the maximum far distance
from all the surfaces of the cup
Plants are put at least 10 cm apart to prevent shading or affecting each other. All other room
conditions must be similar for plants. The experiment started for all the plants at the same
time. All the test subjects are at the same room so the humidity, temperature and air that they
are exposed is the same. Light intensity is a factor affecting photosynthesis rate and therefore
growth of the plant. Test subjects must be located in the same area with no light receiving
differences or shadows shading some plants.
The experiment lasted for 20 days starting on 23 November (Day 1) and ending on 12
December (Day 20). Measurements were taken daily, at the same time. Measurements were
taken from 23 November (Day 1) until 12 December (Day 20). If the seed hadn’t germinated
yet, its length was recorded as 0.00 cm.

Extended Essay - Biology Barış BAKIR - D1129012
Page 13 of 32
Diagrams
Diagram 1: Diagram illustrating the plastic cups used in this experiment.
Diagram 2: Diagram illustrating the placing of the seed.

Extended Essay - Biology Barış BAKIR - D1129012
Page 14 of 32
Diagram 3: General setup of the experiment groups, and the quantity of zinc that each plant
receives in each group.
Diagram 4: Length measurement technique for the plant stems.

Extended Essay - Biology Barış BAKIR - D1129012
Page 15 of 32
Diagram 5: Diagram showing correct and incorrect measurement techniques.

Extended Essay - Biology Barış BAKIR - D1129012
Page 16 of 32
Materials/Apparatus:
500 mL beaker (± 5 mL) 5 liter Karacakaya® natural spring water
Cicer arietinum L. (Chickpea) seeds (X25) Güpaş® Özel houseplant soil (5 liters or 2.4 kg)
20 mL injector (± 0.05 mL) 50 cm ruler (± 0.05 cm)
Digital weight (± 0.001 g) Rope that is at least 50 cm long
Jars or any airtight container (X4) Pen
50 mL Graduated cylinder (± 0.05 mL) Labeling stickers (X30)
Method
1. 25 plastic cups were separated and labeled accordingly:
Group 1 Group 2 Group 3 Group 4 Group 5
Sample 1 G1S1 G2S1 G3S1 G4S1 G5S1
Sample 2 G1S2 G2S2 G3S2 G4S2 G5S2
Sample 3 G1S3 G2S3 G3S3 G4S3 G5S3
Sample 4 G1S4 G2S4 G3S4 G4S4 G5S4
Sample 5 G1S5 G2S5 G3S5 G4S5 G5S5
Table 3: Labeling system for five samples for each of the five groups. “G” is the abbreviation
for group and “S” is the abbreviation for sample. For example the name “G4S2” represents
sample 2 in group 4.
Extended Essay - Biology Barış BAKIR - D1129012
Page 17 of 32
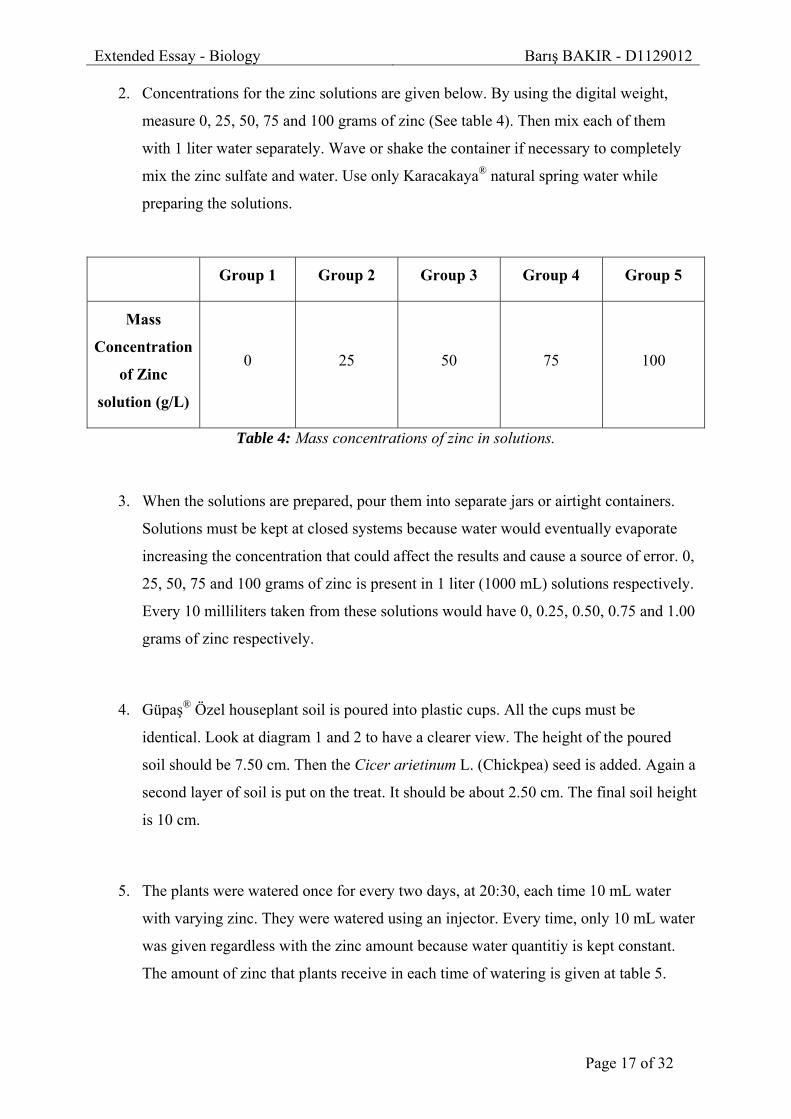
2. Concentrations for the zinc solutions are given below. By using the digital weight,
measure 0, 25, 50, 75 and 100 grams of zinc (See table 4). Then mix each of them
with 1 liter water separately. Wave or shake the container if necessary to completely
mix the zinc sulfate and water. Use only Karacakaya® natural spring water while
preparing the solutions.
Group 1 Group 2 Group 3 Group 4 Group 5
Mass
Concentration
of Zinc
solution (g/L)
0 25 50 75 100
Table 4: Mass concentrations of zinc in solutions.
3. When the solutions are prepared, pour them into separate jars or airtight containers.
Solutions must be kept at closed systems because water would eventually evaporate
increasing the concentration that could affect the results and cause a source of error. 0,
25, 50, 75 and 100 grams of zinc is present in 1 liter (1000 mL) solutions respectively.
Every 10 milliliters taken from these solutions would have 0, 0.25, 0.50, 0.75 and 1.00
grams of zinc respectively.
4. Güpaş® Özel houseplant soil is poured into plastic cups. All the cups must be
identical. Look at diagram 1 and 2 to have a clearer view. The height of the poured
soil should be 7.50 cm. Then the Cicer arietinum L. (Chickpea) seed is added. Again a
second layer of soil is put on the treat. It should be about 2.50 cm. The final soil height
is 10 cm.
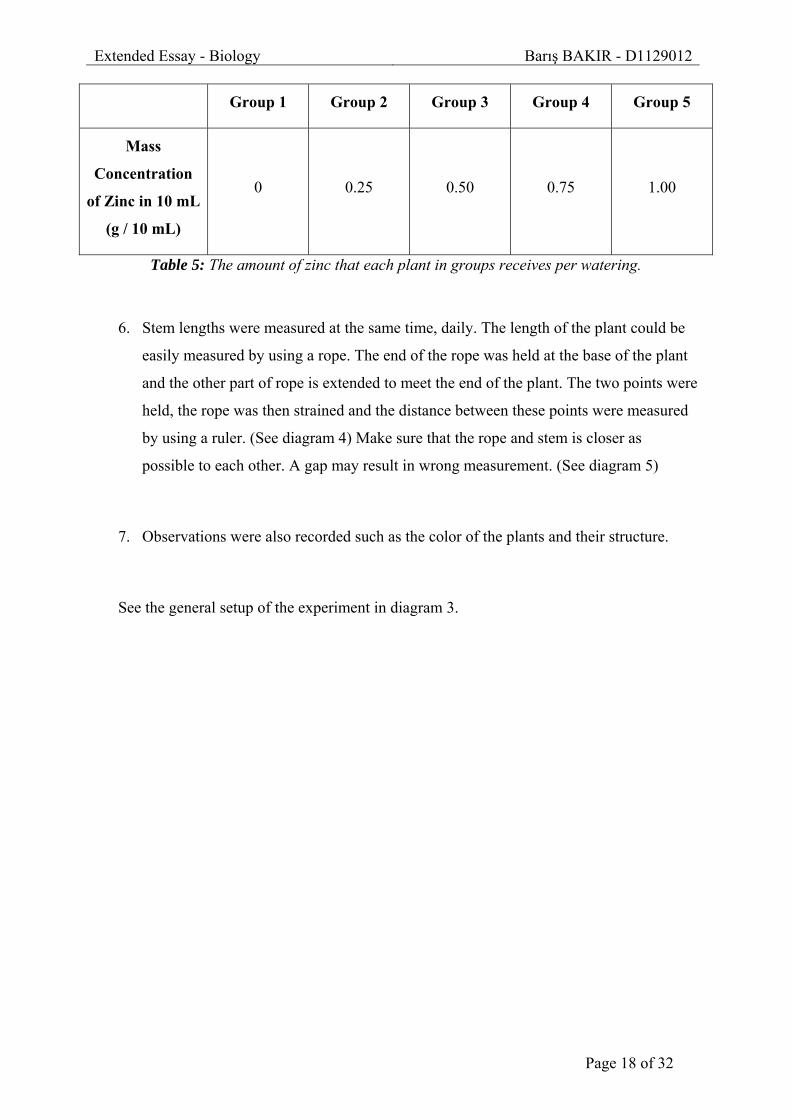
5. The plants were watered once for every two days, at 20:30, each time 10 mL water
with varying zinc. They were watered using an injector. Every time, only 10 mL water
was given regardless with the zinc amount because water quantitiy is kept constant.
The amount of zinc that plants receive in each time of watering is given at table 5.
Extended Essay - Biology Barış BAKIR - D1129012
Page 18 of 32
Group 1 Group 2 Group 3 Group 4 Group 5
Mass
Concentration
of Zinc in 10 mL
(g / 10 mL)
0 0.25 0.50 0.75 1.00
Table 5: The amount of zinc that each plant in groups receives per watering.
6. Stem lengths were measured at the same time, daily. The length of the plant could be
easily measured by using a rope. The end of the rope was held at the base of the plant
and the other part of rope is extended to meet the end of the plant. The two points were
held, the rope was then strained and the distance between these points were measured
by using a ruler. (See diagram 4) Make sure that the rope and stem is closer as
possible to each other. A gap may result in wrong measurement. (See diagram 5)
7. Observations were also recorded such as the color of the plants and their structure.
See the general setup of the experiment in diagram 3.
Extended Essay - Biology Barış BAKIR - D1129012
Page 19 of 32
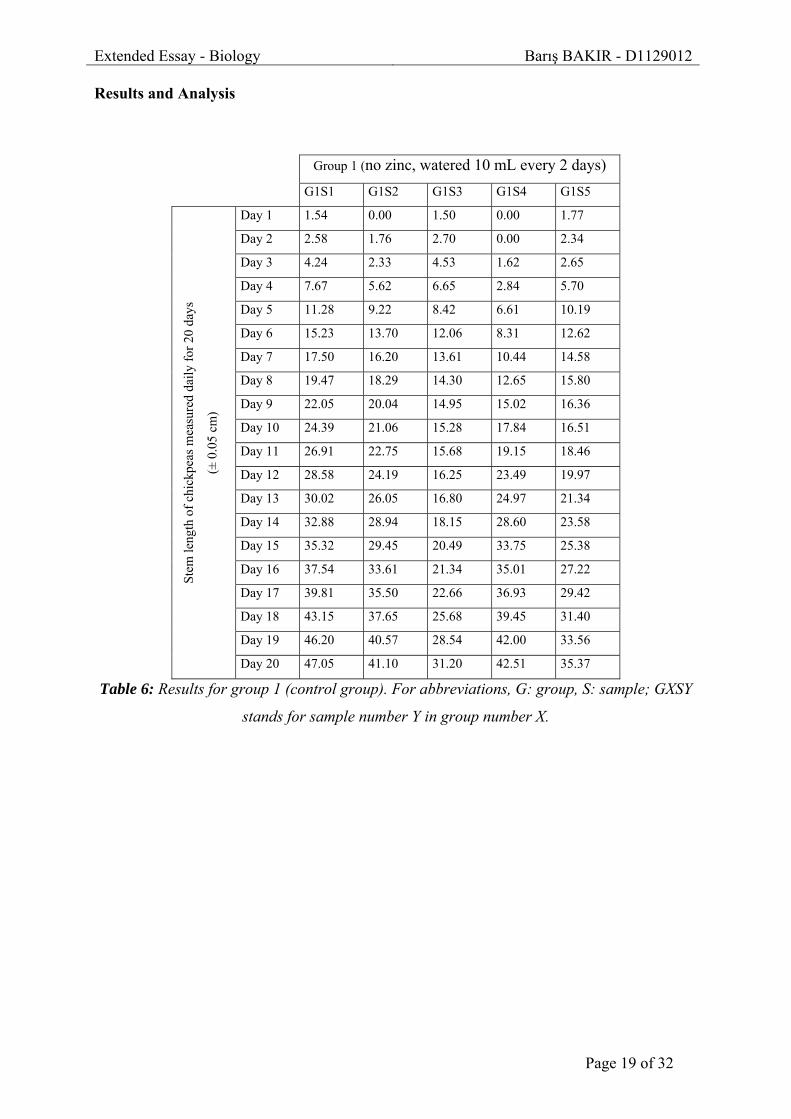
Results and Analysis
Group 1 (no zinc, watered 10 mL every 2 days)
G1S1 G1S2 G1S3 G1S4 G1S5 S
tem
leng
th o
f ch
ickp
eas
mea
sure
d da
ily f
or 2
0 da
ys
(± 0
.05
cm)
Day 1 1.54 0.00 1.50 0.00 1.77
Day 2 2.58 1.76 2.70 0.00 2.34
Day 3 4.24 2.33 4.53 1.62 2.65
Day 4 7.67 5.62 6.65 2.84 5.70
Day 5 11.28 9.22 8.42 6.61 10.19
Day 6 15.23 13.70 12.06 8.31 12.62
Day 7 17.50 16.20 13.61 10.44 14.58
Day 8 19.47 18.29 14.30 12.65 15.80
Day 9 22.05 20.04 14.95 15.02 16.36
Day 10 24.39 21.06 15.28 17.84 16.51
Day 11 26.91 22.75 15.68 19.15 18.46
Day 12 28.58 24.19 16.25 23.49 19.97
Day 13 30.02 26.05 16.80 24.97 21.34
Day 14 32.88 28.94 18.15 28.60 23.58
Day 15 35.32 29.45 20.49 33.75 25.38
Day 16 37.54 33.61 21.34 35.01 27.22
Day 17 39.81 35.50 22.66 36.93 29.42
Day 18 43.15 37.65 25.68 39.45 31.40
Day 19 46.20 40.57 28.54 42.00 33.56
Day 20 47.05 41.10 31.20 42.51 35.37
Table 6: Results for group 1 (control group). For abbreviations, G: group, S: sample; GXSY
stands for sample number Y in group number X.
Extended Essay - Biology Barış BAKIR - D1129012
Page 20 of 32
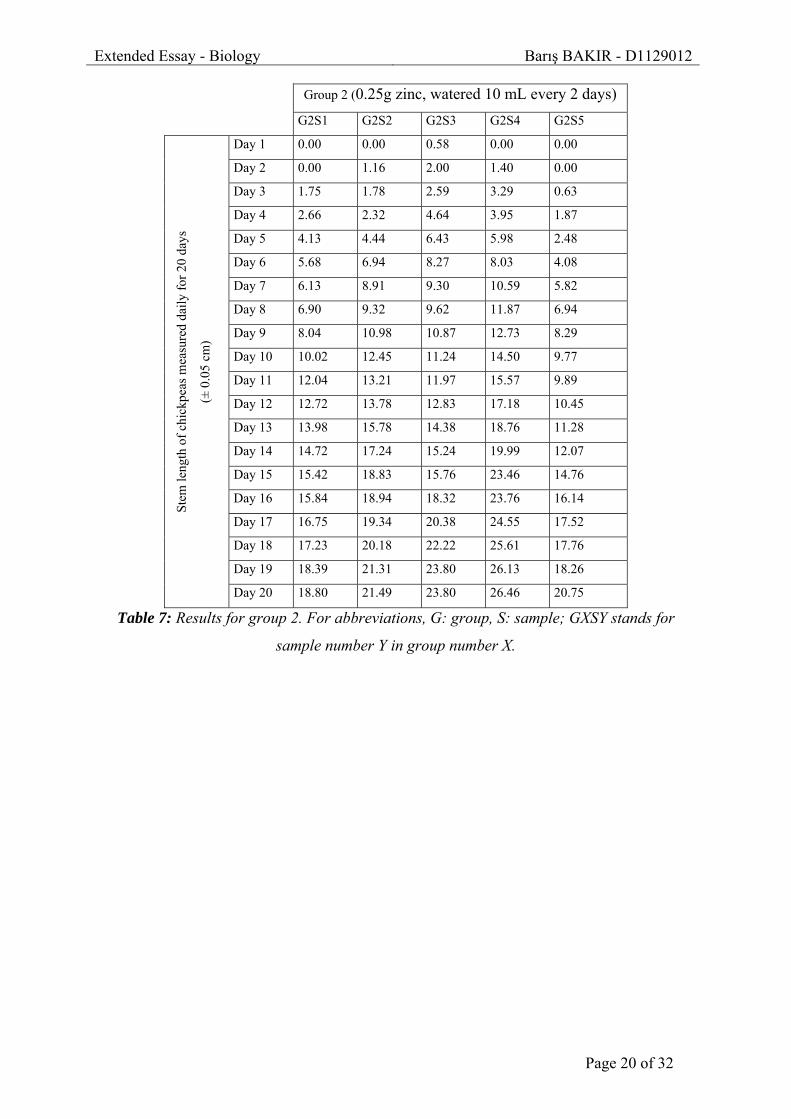
Group 2 (0.25g zinc, watered 10 mL every 2 days)
G2S1 G2S2 G2S3 G2S4 G2S5
Ste
m le
ngth
of
chic
kpea
s m
easu
red
daily
for
20
days
(± 0
.05
cm)
Day 1 0.00 0.00 0.58 0.00 0.00
Day 2 0.00 1.16 2.00 1.40 0.00
Day 3 1.75 1.78 2.59 3.29 0.63
Day 4 2.66 2.32 4.64 3.95 1.87
Day 5 4.13 4.44 6.43 5.98 2.48
Day 6 5.68 6.94 8.27 8.03 4.08
Day 7 6.13 8.91 9.30 10.59 5.82
Day 8 6.90 9.32 9.62 11.87 6.94
Day 9 8.04 10.98 10.87 12.73 8.29
Day 10 10.02 12.45 11.24 14.50 9.77
Day 11 12.04 13.21 11.97 15.57 9.89
Day 12 12.72 13.78 12.83 17.18 10.45
Day 13 13.98 15.78 14.38 18.76 11.28
Day 14 14.72 17.24 15.24 19.99 12.07
Day 15 15.42 18.83 15.76 23.46 14.76
Day 16 15.84 18.94 18.32 23.76 16.14
Day 17 16.75 19.34 20.38 24.55 17.52
Day 18 17.23 20.18 22.22 25.61 17.76
Day 19 18.39 21.31 23.80 26.13 18.26
Day 20 18.80 21.49 23.80 26.46 20.75
Table 7: Results for group 2. For abbreviations, G: group, S: sample; GXSY stands for
sample number Y in group number X.

Extended Essay - Biology Barış BAKIR - D1129012
Page 21 of 32
Group 3 (0.50g zinc, watered 10 mL every 2 days)
G3S1 G3S2 G3S3 G3S4 G3S5
Ste
m le
ngth
of
chic
kpea
s m
easu
red
daily
for
20
days
(± 0
.05
cm)
Day 1 0.00 0.00 0.00 0.11 0.00
Day 2 0.00 0.00 0.32 0.45 0.95
Day 3 1.84 0.57 1.55 1.55 2.49
Day 4 2.21 1.61 2.43 2.56 3.86
Day 5 2.30 1.90 2.97 3.74 4.28
Day 6 2.96 2.61 3.27 4.03 4.49
Day 7 3.22 3.14 3.78 4.73 5.62
Day 8 4.56 3.87 3.84 6.08 6.29
Day 9 5.31 4.58 4.29 7.92 6.56
Day 10 5.88 5.44 4.79 8.90 6.90
Day 11 5.90 5.74 5.44 9.16 6.43
Day 12 5.96 6.54 5.86 10.37 7.19
Day 13 6.57 8.09 5.95 11.22 7.33
Day 14 6.00 8.89 5.90 11.06 7.59
Day 15 6.00 9.67 5.90 11.06 7.59
Day 16 5.92 9.91 5.42 11.06 8.00
Day 17 5.87 10.23 5.42 10.78 7.85
Day 18 5.51 10.54 5.42 10.64 7.64
Day 19 5.51 10.54 5.42 10.64 7.60
Day 20 5.51 9.98 5.28 10.64 7.44
Table 8: Results for group 3. For abbreviations, G: group, S: sample; GXSY stands for
sample number Y in group number X.

Extended Essay - Biology Barış BAKIR - D1129012
Page 22 of 32
Group 4 (0.75g zinc, watered 10 mL every 2 days)
G4S1 G4S2 G4S3 G4S4 G4S5
Ste
m le
ngth
of
chic
kpea
s m
easu
red
daily
for
20
days
(± 0
.05
cm)
Day 1 0.00 0.00 0.24 0.00 0.00
Day 2 0.15 0.00 0.50 0.00 0.49
Day 3 0.63 0.00 0.83 0.78 1.07
Day 4 1.19 0.22 1.30 1.27 1.67
Day 5 1.60 0.77 2.32 1.87 1.98
Day 6 2.32 1.00 2.92 2.42 2.40
Day 7 3.39 1.59 3.05 2.89 2.57
Day 8 3.82 1.78 3.66 3.35 3.27
Day 9 5.21 2.54 4.53 3.84 4.40
Day 10 5.21 2.74 4.88 5.84 4.82
Day 11 5.23 3.92 5.78 5.84 5.52
Day 12 5.27 4.95 5.99 6.18 6.10
Day 13 5.27 5.63 6.17 6.19 6.10
Day 14 5.27 5.63 6.54 6.19 6.10
Day 15 5.39 6.23 6.77 6.31 6.47
Day 16 5.39 6.43 6.77 6.31 6.47
Day 17 5.39 6.53 6.81 6.31 6.47
Day 18 4.49 6.53 6.81 5.71 6.47
Day 19 4.49 6.22 6.81 5.71 6.33
Day 20 4.49 6.22 6.81 5.71 6.33
Table 9: Results for group 4. For abbreviations, G: group, S: sample; GXSY stands for
sample number Y in group number X.
Extended Essay - Biology Barış BAKIR - D1129012
Page 23 of 32
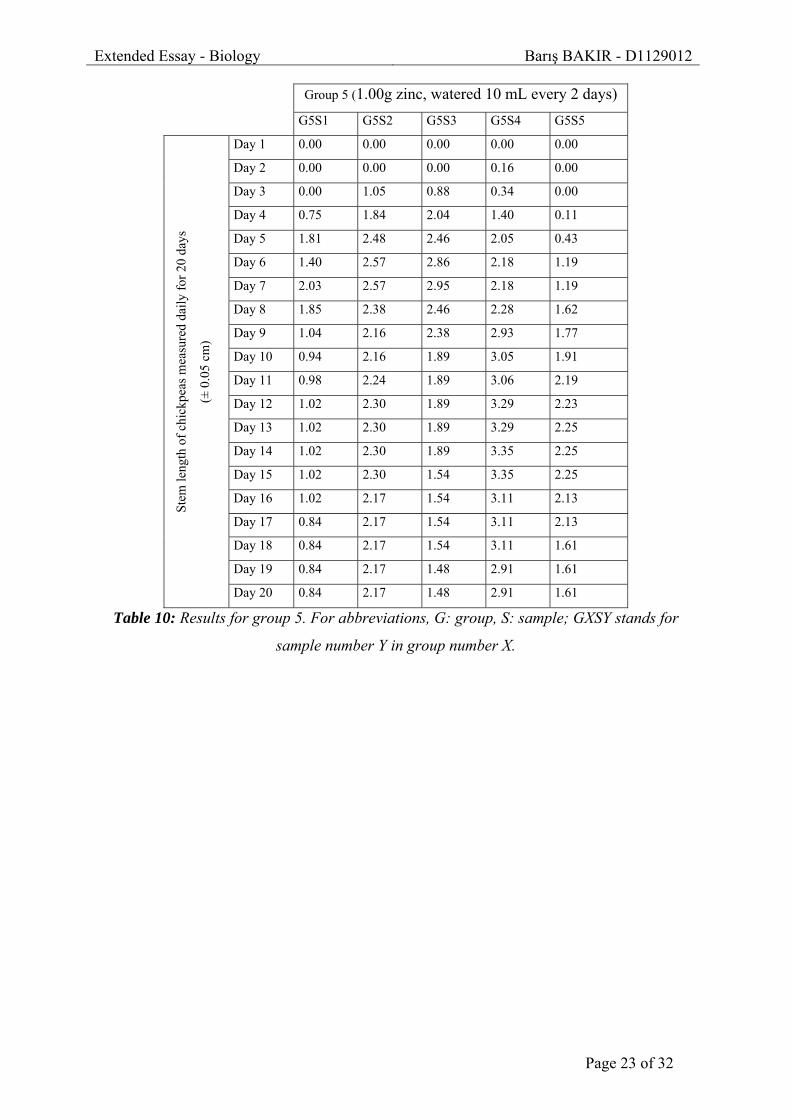
Group 5 (1.00g zinc, watered 10 mL every 2 days)
G5S1 G5S2 G5S3 G5S4 G5S5
Ste
m le
ngth
of
chic
kpea
s m
easu
red
daily
for
20
days
(± 0
.05
cm)
Day 1 0.00 0.00 0.00 0.00 0.00
Day 2 0.00 0.00 0.00 0.16 0.00
Day 3 0.00 1.05 0.88 0.34 0.00
Day 4 0.75 1.84 2.04 1.40 0.11
Day 5 1.81 2.48 2.46 2.05 0.43
Day 6 1.40 2.57 2.86 2.18 1.19
Day 7 2.03 2.57 2.95 2.18 1.19
Day 8 1.85 2.38 2.46 2.28 1.62
Day 9 1.04 2.16 2.38 2.93 1.77
Day 10 0.94 2.16 1.89 3.05 1.91
Day 11 0.98 2.24 1.89 3.06 2.19
Day 12 1.02 2.30 1.89 3.29 2.23
Day 13 1.02 2.30 1.89 3.29 2.25
Day 14 1.02 2.30 1.89 3.35 2.25
Day 15 1.02 2.30 1.54 3.35 2.25
Day 16 1.02 2.17 1.54 3.11 2.13
Day 17 0.84 2.17 1.54 3.11 2.13
Day 18 0.84 2.17 1.54 3.11 1.61
Day 19 0.84 2.17 1.48 2.91 1.61
Day 20 0.84 2.17 1.48 2.91 1.61
Table 10: Results for group 5. For abbreviations, G: group, S: sample; GXSY stands for
sample number Y in group number X.

Extended Essay - Biology Barış BAKIR - D1129012
Page 24 of 32
Group 1
(0g/10 mL)
Group 2
(0.25g/10 mL)
Group 3
(0.50g/10 mL)
Group 4
(0.75g/10 mL)
Group 5
(1.00g/10 mL)M
ean
stem
leng
ths
of c
hick
peas
am
ong
grou
ps (
± 0.
05 c
m)
23-Nov Day 1 0.96 0.12 0.02 0.05 0.00
24-Nov Day 2 1.88 0.91 0.34 0.23 0.03
25-Nov Day 3 3.07 2.01 1.60 0.66 0.45
26-Nov Day 4 5.70 3.09 2.53 1.13 1.23
27-Nov Day 5 9.14 4.69 3.04 1.71 1.85
28-Nov Day 6 12.38 6.60 3.47 2.21 2.04
29-Nov Day 7 14.47 8.15 4.10 2.70 2.18
30-Nov Day 8 16.10 8.93 4.93 3.18 2.12
1-Dec Day 9 17.68 10.18 5.73 4.10 2.06
2-Dec Day 10 19.02 11.60 6.38 4.70 1.99
3-Dec Day 11 20.59 12.54 6.53 5.26 2.07
4-Dec Day 12 22.50 13.39 7.18 5.70 2.15
5-Dec Day 13 23.84 14.84 7.83 5.87 2.15
6-Dec Day 14 26.43 15.85 7.89 5.95 2.16
7-Dec Day 15 28.88 17.65 8.04 6.23 2.09
8-Dec Day 16 30.94 18.60 8.06 6.27 1.99
9-Dec Day 17 32.86 19.71 8.03 6.30 1.96
10-Dec Day 18 35.47 20.60 7.95 6.00 1.85
11-Dec Day 19 38.17 21.58 7.94 5.91 1.80
12-Dec Day 20 39.45 22.26 7.77 5.91 1.80
Table 11: Mean stem lengths of chickpeas among groups. Averages from tables 6, 7, 8, 9 and
10.
Mean stem lengths of groups versus time
0,00
5,00
10,00
15,00
20,00
25,00
30,00
35,00
40,00
45,00
0 5 10 15 20 25
Time (days)
Me
an
ste
m le
ng
th (
± 0
.05
cm
) Group 1
Group 2
Group 3
Group 4
Group 5
Group 1
Group 2
Group 3
Group 4
Group 5
Graph 1: Graphical indication of average length given at table 11.
Extended Essay - Biology Barış BAKIR - D1129012
Page 25 of 32
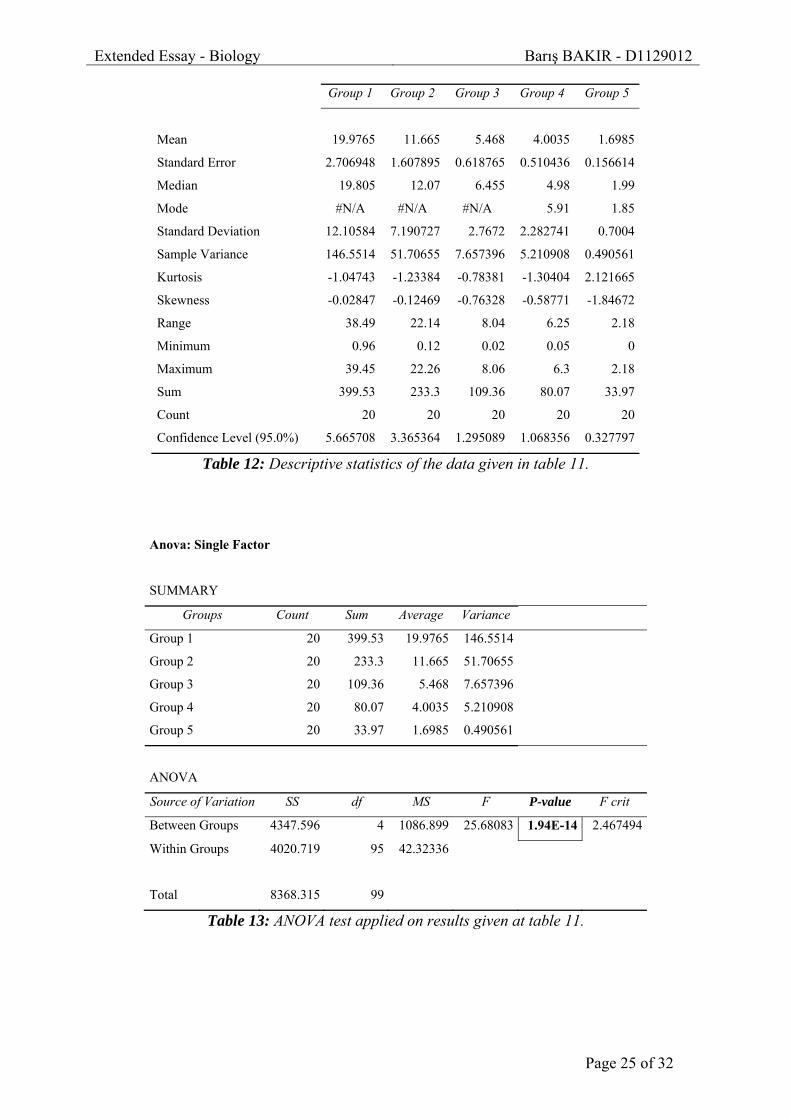
Group 1 Group 2 Group 3 Group 4 Group 5
Mean 19.9765 11.665 5.468 4.0035 1.6985
Standard Error 2.706948 1.607895 0.618765 0.510436 0.156614
Median 19.805 12.07 6.455 4.98 1.99
Mode #N/A #N/A #N/A 5.91 1.85
Standard Deviation 12.10584 7.190727 2.7672 2.282741 0.7004
Sample Variance 146.5514 51.70655 7.657396 5.210908 0.490561
Kurtosis -1.04743 -1.23384 -0.78381 -1.30404 2.121665
Skewness -0.02847 -0.12469 -0.76328 -0.58771 -1.84672
Range 38.49 22.14 8.04 6.25 2.18
Minimum 0.96 0.12 0.02 0.05 0
Maximum 39.45 22.26 8.06 6.3 2.18
Sum 399.53 233.3 109.36 80.07 33.97
Count 20 20 20 20 20
Confidence Level (95.0%) 5.665708 3.365364 1.295089 1.068356 0.327797
Table 12: Descriptive statistics of the data given in table 11.
Anova: Single Factor
SUMMARY
Groups Count Sum Average Variance
Group 1 20 399.53 19.9765 146.5514
Group 2 20 233.3 11.665 51.70655
Group 3 20 109.36 5.468 7.657396
Group 4 20 80.07 4.0035 5.210908
Group 5 20 33.97 1.6985 0.490561
ANOVA
Source of Variation SS df MS F P-value F crit
Between Groups 4347.596 4 1086.899 25.68083 1.94E-14 2.467494
Within Groups 4020.719 95 42.32336
Total 8368.315 99
Table 13: ANOVA test applied on results given at table 11.

Extended Essay - Biology Barış BAKIR - D1129012
Page 26 of 32
It could be tested if there is a significant statistical difference present between the means of
groups by applying ANOVA test. Null hypothesis and alternative hypothesis for the test is
given below. Discussion of the valid hypothesis is in the Conclusion and Evaluation section.
H1: Different concentrations of zinc solutions will affect the growth rate of Cicer arietinum L.
(Chickpea)
H0: Different concentrations of zinc solutions wouldn’t have any affect on the growth rate of
Cicer arietinum L. (Chickpea)

Extended Essay - Biology Barış BAKIR - D1129012
Page 27 of 32
Conclusion and Evaluation
My aim in this experiment was to find the effect of adding varying zinc concentrations to the
growth rate of Cicer arietinum L. (Chickpea).
5 groups were present in this experiment, groups being watered every 2 days with 10 mL
water containing 0, 0.25, 0.50, 0.75 and 1.00 grams of zinc for groups 1, 2, 3, 4 and 5
respectively. Watering was done at 20:30. Plant growth was measured by stem length of the
plants in terms of centimeters. Measurements were taken daily for 20 days. Cicer arietinum L.
(Chickpea) plant was used and the source of zinc was zinc sulfate.
The average growth heights of plants were found 19.9765, 11.665, 5.468, 4.0035 and 1.6985
cm for groups 1, 2, 3, 4 and 5 respectively. See graph 1 to observe the behavior of the data.
There is a notable decline in the growth rates of the plants as zinc quantities increase.
See table 13, ANOVA test is applied to correctly evaluate this data. ANOVA test results
indicate that there is a statistically significant mean difference between groups. This
evaluation is made by looking at the P-value. Look at table 13, P-value is indicated by bold.
The P-value found is a smaller value than value.
= 0.05 < P-value = 1.94 x 10⁻¹⁴
P-value being smaller than 0.05 indicates that there is a statistically significant mean
difference amongst groups. As a result, H1: “Different concentrations of zinc solutions will
affect the growth rate of Cicer arietinum L. (Chickpea)” is accepted and H0: “Different
concentrations of zinc solutions wouldn’t have any affect on the growth rate of Cicer
arietinum L. (Chickpea)” is rejected.
Although results seem accurate there are several reasons for possible errors that should be
noted. Plants do photosynthesis and produce their own organic material for growth. Therefore
the rate of photosynthesis is closely related with the rate of plant growth. As a result, factors
affecting photosynthesis reaction rate also affect the growth rate.
Extended Essay - Biology Barış BAKIR - D1129012
Page 28 of 32
The approach angle of the sunlight could change the energy that is absorbed by a body of
mass. More light means more heat and energy. Both factors affect the photosynthesis rate. For
example sunlight approaching an area in right angle transfers more energy than light coming
from 30 degrees. Sunlight may not approach all the plants used in experiment at same angles.
Light rays are reflected from lots of surfaces and also could be received by samples from
different angles. So the energy that they receive may not be equal therefore changing the
photosynthesis rate and growth rate.
Genetic variance is also a major source of error since genes and environmental conditions
determine the number of leaves, structure of leaves, sizes of the leaves, structure and length of
the plant, photosynthesis rate, hormone production and their management. All these factors
affect the photosynthesis rate which is closely related with the stem length of the plant.
The surrounding air and air current in the room are also effective factors against
photosynthesis rate. The samples were put next to each other but the air homogeneity could
have changed due to environment.
Another source of error could be interference of any microorganism or chemical substance
that is carried by the air or soil. Although soil from the same package was used in all plants, it
is always possible for microorganisms to produce in any of the plant pots. These organisms or
chemicals could have interfered with the process of growth and may affect the results.
Some possible improvements could be made to eliminate errors such as repeating the
experiment with soil that has different chemical properties other than Güpaş houseplant soil.
Güpaş houseplant soil was used in this experiment, but using natural soil may cause different
results. Houseplant soil does not completely demonstrate the natural circumstances for plants.
Also using larger pots and doing the experiment outdoors, in the natural environment of Cicer
arietinum L. (Chickpea) may help demonstrate the natural conditions better.
Increasing the number of trials and test subjects would aid in generalizing the results. The
experiment done on large numbers of plants would reflect the agricultural effects of zinc
deposition better. With these improvements included, it may be possible to obtain more
precise and accurate data.

Extended Essay - Biology Barış BAKIR - D1129012
Page 29 of 32
To conclude that; results, graph and the ANOVA test shows a decline in growth as zinc
concentration increases. It is important observation to note is that plants watered with high
zinc concentrations dried and turned yellow. The research question was “How is the growth
(irreversible change in size) of Cicer arietinum L. (Chickpea) in terms of height (cm) effected
by different concentrations of Zn2+ solutions added to different groups while the soil quality,
pH, temperature and pressure is tried to be constant for all groups?” for this experiment. Since
it is possible to observe the decline in growth it can be said that increasing amounts of zinc
show toxicity and inhibit growth. It is important to note that the results and ANOVA test
supports the main hypothesis. So therefore the main hypothesis, H1: “Different concentrations
of zinc solutions will affect the growth rate of Cicer arietinum L. (Chickpea)” is accepted. H0:
“Different concentrations of zinc solutions wouldn’t have any affect on the growth rate of
Cicer arietinum L. (Chickpea)” is rejected.
If the results were interpreted in a broad point of view, it is possible to say that high amounts
of zinc deposition may reduce the number healthy crops and reduce the yield. These
substances deposited inside plants are carried to our bodies by the food we eat, so pollution
could affect human health. Reduced yield of crops would have a negative effect on agriculture
and economy.

Extended Essay - Biology Barış BAKIR - D1129012
Page 30 of 32
Bibliography
1 Webb EC. Enzyme nomenclature, recommendations of the Nomenclature Committee of the
International Union of Biochemistry and Molecular Biology.
New York: Academic Press, 1992.
2 “Plant Nutrients.” Kids World - Plant Nutrition. Brought by NCDA&CS. Date of access 07
September 2010. <http://www.ncagr.gov/cyber/kidswrld/plant/nutrient.htm#Zinc>
3 Hoagland DR. Lectures on the inorganic nutrition of plants. 2nd ed. Waltham: Chronica
Botanica Company, 1948.
4 Fosmire, Gary J. "Zinc toxicity.” The American Journal of Clinical Nutrition. 29 Mar 1990.
Date of access 07 Sep 2010. <http://www.ajcn.org/content/51/2/225.full.pdf>
5 Chaney RL. “Zinc phytotoxicity.” Ed. A.D. Robson. Zinc in soil and plants. Dordrecht:
Kluwer Academic Publishers, 1993. 135–150.
6 Kahvecioğlu, Özge; Güldem Kartal, Aybars Güven, and Servet Timur. “Metallerin Çevresel
Etkileri–I (Trans: Environmental Effects of Metals–I).” UCTEA Chamber of Metallurgical
Engineers. 13 Mar 2009. Date of access 25 Sep 2010.
<http://www.metalurji.org.tr/dergi/dergi136/d136_4753.pdf>
7 Davies BE. “Radish as an indicator plant for derelict land – uptake of zinc at toxic
concentrations.” Communications in Soil Science and Plant Analysis. 1993.
8 Friedland AJ. “The movement of metals through soils and ecosystems.” Heavy metal
tolerance in plants: evolutionary aspects. Ed. A.J. Shaw. Boca Raton: CRC Press, 1990.
Pages 7–19.
9 Barak P., and P.A. Helmke. “The chemistry of zinc.” Zinc in soil and plants. Ed: AD
Robson. Dordrecht: Kluwer Academic Publishers, 1993. Pages 1–13.
Extended Essay - Biology Barış BAKIR - D1129012
Page 31 of 32
10 Alloway BJ. Heavy metals in soils, 2nd edn. London: Blackie Academic & Professional,
1995.
11 Nriagu JO. “A history of global metal pollution.” 1996. Science 272: 223–224.
12 “Cicer arietinum L.” USDA – Natural Resources Conservation Service, Plant Database.
Date of access 05 Sep 2010. <http://plants.usda.gov/java/profile?symbol=CIAR5>
13 Malhotra, R.S., R.P.S. Pundir and A.E. Slinkard. “Genetic resources of chickpea.” The
Chickpea. Ed. M.C. Saxena and K.B. Singh. Aberystwyth: C.A.B. International Cambrian
News Ltd, 1987. Pages 67-81.
14 Hulse, J.H. “Nature, composition and utilization of grain legumes.” Uses of tropical
Legumes: Proceedings of a Consultants' Meeting, 27-30 March 1989. Patancheru: ICRISAT
Center. ICRISAT, 1991. Pages 11-27.
15 Muehlbauer , F.J. and Abebe Tulu, contributors. “Cicer arietinum L.” Purdue University.
1997. <http://www.hort.purdue.edu/newcrop/cropfactsheets/chickpea.html>
16 Vegetarian Society. Date of access 29 Sep 2010.
<http://www.vegsoc.org/info/zinc.html#diet>
17 “FAOSTAT > Production > Crops.” FAOSTAT - Food and Agriculture Organization of the
United Nations. Date of access 25 Oct 2010.
<http://faostat.fao.org/site/567/DesktopDefault.aspx?PageID=567#ancor>
18 Whiting, David, Michael Roll and Larry Vickerman. “Plant Growth Factors: Water.”
Colorado State University Extension. Date of access 17 Sep 2010.
<http://www.cmg.colostate.edu/gardennotes/144.pdf>
19 BBC Worldwide. “How to water your plants.” Gardeners’ World.com. Date of access 17
Sep 2010. <http://www.gardenersworld.com/how-to/projects/water-plants/>

Extended Essay - Biology Barış BAKIR - D1129012
Page 32 of 32
20 Follett, R.H. and D.G. Westfall. “Zinc and Iron Deficiencies” Colorado State University
Extension. Date of access 12 Sep 2010. <http://www.ext.colostate.edu/pubs/crops/00545.pdf>
21 Westfall, D.G., M. Amrani, and G.A. Peterson “Water-Solubility of Zinc Fertilizer: Does It
Matter?” International Plant Nutrition Institute. Date of access 12 Sep 2010.
<http://www.ipni.net/ppiweb/bcrops.nsf/$webindex/948276DF7FC729A6852568EF005CE47
0/$file/99-2p18.pdf>