iar embedded workbench® ideftp.iar.se/ · iar embedded workbench® ide user guide using the...
TRANSCRIPT

UEW-8:1
IAR Embedded Workbench® IDE
User Guide
UEW-8:1
COPYRIGHT NOTICECopyright © 1996–2009 IAR Systems AB.
No part of this document may be reproduced without the prior written consent of IAR Systems AB. The software described in this document is furnished under a license and may only be used or copied in accordance with the terms of such a license.
DISCLAIMERThe information in this document is subject to change without notice and does not represent a commitment on any part of IAR Systems. While the information contained herein is assumed to be accurate, IAR Systems assumes no responsibility for any errors or omissions.
In no event shall IAR Systems, its employees, its contractors, or the authors of this document be liable for special, direct, indirect, or consequential damage, losses, costs, charges, claims, demands, claim for lost profits, fees, or expenses of any nature or kind.
TRADEMARKSIAR Systems, IAR Embedded Workbench, C-SPY, visualSTATE, From Idea To Target, IAR KickStart Kit, IAR PowerPac, IAR YellowSuite, IAR Advanced Development Kit, IAR, and the IAR Systems logotype are trademarks or registered trademarks owned by IAR Systems AB. J-Link is a trademark licensed to IAR Systems AB.
Microsoft and Windows are registered trademarks of Microsoft Corporation.
Adobe and Acrobat Reader are registered trademarks of Adobe Systems Incorporated. CodeWright is a registered trademark of Starbase Corporation.
All other product names are trademarks or registered trademarks of their respective owners.
EDITION NOTICEEighth edition: March 2009
Part number: UEW-8
Internal reference: 5.4.x. tut2009.1, ISUD.
Brief contentsTables ................................................................................................................... xxiii
Figures ................................................................................................................ xxvii
Preface ................................................................................................................ xxxv
Part 1. Product overview ............................................................. 1
Product introduction ........................................................................................ 3
Installed files ........................................................................................................ 15
Part 2. Tutorials .................................................................................... 23
Welcome to the tutorials ............................................................................. 25
Creating an application project ................................................................. 29
Debugging using the IAR C-SPY® Debugger ..................................... 39
Mixing C and assembler modules ............................................................ 49
Using C++ ............................................................................................................ 53
Simulating an interrupt .................................................................................. 59
Creating and using libraries ......................................................................... 69
Part 3. Project management and building ............ 73
The development environment ................................................................. 75
Managing projects ............................................................................................. 81
Building ................................................................................................................... 91
Editing ..................................................................................................................... 99
Part 4. Debugging .............................................................................. 109
UEW-8:1
iii
iv
The IAR C-SPY® Debugger ..................................................................... 111
Executing your application ......................................................................... 119
Working with variables and expressions ............................................ 125
Using breakpoints ........................................................................................... 133
Monitoring memory and registers ........................................................ 141
Using the C-SPY® macro system .......................................................... 145
Analyzing your application ......................................................................... 153
Part 5. The C-SPY® Simulator ......................................... 159
Simulator-specific debugging ..................................................................... 161
Simulating interrupts ..................................................................................... 179
Part 6. Reference information ........................................... 191
IAR Embedded Workbench® IDE reference ................................... 193
C-SPY® reference .......................................................................................... 273
General options .............................................................................................. 311
Compiler options ........................................................................................... 317
Assembler options ......................................................................................... 331
Custom build options ................................................................................... 337
Build actions options .................................................................................... 339
Linker options .................................................................................................. 341
Library builder options ................................................................................ 355
Debugger options ........................................................................................... 357
The C-SPY Command Line Utility—cspybat ................................... 361
C-SPY® macros reference ........................................................................ 369
UEW-8:1
IAR Embedded Workbench® IDEUser Guide

Brief contents
Glossary .............................................................................................................. 395
Index ..................................................................................................................... 409
UEW-8:1
v

vi
UEW-8:1
IAR Embedded Workbench® IDEUser Guide
ContentsTables ................................................................................................................... xxiii
Figures ................................................................................................................ xxvii
Preface ................................................................................................................ xxxv
Who should read this guide ........................................................... xxxv
How to use this guide ....................................................................... xxxv
What this guide contains ................................................................ xxxvi
Other documentation ......................................................................xxxix
Document conventions ...................................................................xxxix
Typographic conventions ..............................................................xxxix
Naming conventions ...........................................................................xl
Part 1. Product overview ............................................................. 1
Product introduction ........................................................................................ 3
The IAR Embedded Workbench IDE .............................................. 3
An extensible and modular environment ............................................. 3
Features ................................................................................................ 4
Documentation ..................................................................................... 5
IAR C-SPY Debugger .............................................................................. 5
The C-SPY driver ................................................................................. 6
General C-SPY debugger features ....................................................... 6
C-SPY plugin modules ......................................................................... 8
RTOS awareness .................................................................................. 8
IAR C-SPY Simulator .......................................................................... 9
Documentation ..................................................................................... 9
IAR C/C++ Compiler ............................................................................... 9
Features .............................................................................................. 10
Runtime environment ......................................................................... 10
Documentation ................................................................................... 11
UEW-8:1
vii
viii
IAR Assembler ......................................................................................... 11
Features .............................................................................................. 11
Documentation ................................................................................... 11
IAR XLINK Linker .................................................................................. 12
Features .............................................................................................. 12
Documentation ................................................................................... 12
IAR XAR Library Builder and IAR XLIB Librarian .................. 13
Features .............................................................................................. 13
Documentation ................................................................................... 13
Installed files ........................................................................................................ 15
Directory structure ................................................................................ 15
Root directory .................................................................................... 15
The CPUNAME directory .................................................................. 15
The common directory ....................................................................... 17
The install-info directory ................................................................... 17
File types ..................................................................................................... 17
Files with non-default filename extensions ....................................... 19
Documentation ........................................................................................ 20
The user and reference guides ............................................................ 20
Online help ......................................................................................... 21
IAR Systems on the web .................................................................... 21
Part 2. Tutorials .................................................................................... 23
Welcome to the tutorials ............................................................................. 25
Tutorials overview ................................................................................. 25
Creating an application project .......................................................... 25
Debugging using the IAR C-SPY® Debugger .................................. 25
Mixing C and assembler modules ...................................................... 26
Using C++ .......................................................................................... 26
Simulating an interrupt ....................................................................... 26
Creating and using libraries ............................................................... 26
Getting started .................................................................................... 27
UEW-8:1
IAR Embedded Workbench® IDEUser Guide
Contents
Creating an application project ................................................................. 29
Setting up a new project ..................................................................... 29
Creating a Workspace ........................................................................ 29
Creating the new project .................................................................... 30
Adding files to the project .................................................................. 32
Setting project options ....................................................................... 33
Compiling and linking the application ........................................... 34
Compiling the source files ................................................................. 34
Viewing the list file ............................................................................ 35
Linking the application ...................................................................... 37
Viewing the map file .......................................................................... 38
Debugging using the IAR C-SPY® Debugger ..................................... 39
Debugging the application .................................................................. 39
Starting the debugger ......................................................................... 39
Organizing the windows .................................................................... 39
Inspecting source statements .............................................................. 40
Inspecting variables ........................................................................... 42
Setting and monitoring breakpoints ................................................... 44
Monitoring registers ........................................................................... 46
Monitoring memory ........................................................................... 46
Viewing terminal I/O ......................................................................... 47
Reaching program exit ....................................................................... 47
Mixing C and assembler modules ............................................................ 49
Examining the calling convention .................................................... 49
Adding an assembler module to the project .............................. 51
Setting up the project ......................................................................... 51
Using C++ ............................................................................................................ 53
Creating a C++ application ................................................................. 53
Compiling and linking the C++ application ....................................... 53
Setting a breakpoint and executing to it ............................................. 54
Printing the Fibonacci numbers ......................................................... 56
UEW-8:1
ix

x
Simulating an interrupt .................................................................................. 59
Adding an interrupt handler .............................................................. 59
The application—a brief description .................................................. 59
Writing an interrupt handler ............................................................... 60
Setting up the project ......................................................................... 60
Setting up the simulation environment ........................................ 60
Defining a C-SPY setup macro file .................................................... 61
Setting C-SPY options ....................................................................... 62
Building the project ............................................................................ 63
Starting the simulator ......................................................................... 64
Specifying a simulated interrupt ....................................................... 64
Setting an immediate breakpoint ........................................................ 65
Simulating the interrupt ...................................................................... 66
Executing the application ................................................................... 66
Using macros for interrupts and breakpoints ............................ 67
Creating and using libraries ......................................................................... 69
Using libraries .......................................................................................... 69
Creating a new project ....................................................................... 70
Creating a library project ................................................................... 70
Using the library in your application project ..................................... 71
Part 3. Project management and building ............ 73
The development environment ................................................................. 75
The IAR Embedded Workbench IDE ............................................ 75
The tool chain ..................................................................................... 75
Running the IDE ............................................................................... 76
Exiting ................................................................................................ 77
Customizing the environment .......................................................... 77
Organizing the windows on the screen .............................................. 77
Customizing the IDE .......................................................................... 78
Invoking external tools ....................................................................... 79
UEW-8:1
IAR Embedded Workbench® IDEUser Guide
Contents
Managing projects ............................................................................................. 81
The project model .................................................................................. 81
How projects are organized ................................................................ 81
Creating and managing workspaces ................................................... 83
Navigating project files ........................................................................ 85
Viewing the workspace ...................................................................... 86
Displaying browse information .......................................................... 87
Source code control .............................................................................. 88
Interacting with source code control systems .................................... 88
Building ................................................................................................................... 91
Building your application ..................................................................... 91
Setting options .................................................................................... 91
Building a project ............................................................................... 93
Building multiple configurations in a batch ....................................... 93
Using pre- and post-build actions ...................................................... 94
Correcting errors found during build ................................................. 94
Building from the command line ....................................................... 95
Extending the tool chain ...................................................................... 95
Tools that can be added to the tool chain ........................................... 96
Adding an external tool ...................................................................... 96
Editing ..................................................................................................................... 99
Using the IAR Embedded Workbench editor ............................ 99
Editing a file ....................................................................................... 99
Using and adding code templates ..................................................... 103
Navigating in and between files ....................................................... 105
Searching .......................................................................................... 106
Customizing the editor environment .......................................... 106
Using an external editor ................................................................... 106
UEW-8:1
xi
xii
Part 4. Debugging .............................................................................. 109
The IAR C-SPY® Debugger ..................................................................... 111
Debugger concepts .............................................................................. 111
C-SPY and target systems ................................................................ 111
Debugger .......................................................................................... 112
Target system ................................................................................... 112
User application ............................................................................... 112
C-SPY Debugger systems ................................................................ 112
ROM-monitor program .................................................................... 113
Third-party debuggers ...................................................................... 113
The C-SPY environment ................................................................... 113
An integrated environment ............................................................... 113
Setting up C-SPY .................................................................................. 114
Choosing a debug driver .................................................................. 114
Executing from reset ....................................................................... 115
Using a setup macro file ................................................................... 115
Selecting a device description file ................................................... 115
Loading plugin modules ................................................................... 116
Starting C-SPY ..................................................................................... 116
Executable files built outside of the IDE ......................................... 117
Loading multiple debug files ........................................................... 117
Redirecting debugger output to a file ............................................... 117
Executing your application ......................................................................... 119
Source and disassembly mode debugging ................................. 119
Executing .................................................................................................. 119
Step ................................................................................................... 120
Go ..................................................................................................... 122
Run to Cursor ................................................................................... 122
Highlighting ..................................................................................... 122
Using breakpoints to stop ................................................................. 122
Using the Break button to stop ......................................................... 123
Stop at program exit ......................................................................... 123
UEW-8:1
IAR Embedded Workbench® IDEUser Guide
Contents
Call stack information ........................................................................ 123
Terminal input and output ............................................................... 124
Working with variables and expressions ............................................ 125
C-SPY expressions ............................................................................... 125
C symbols ......................................................................................... 125
Assembler symbols .......................................................................... 126
Macro functions .............................................................................. 126
Macro variables ................................................................................ 127
Limitations on variable information ............................................. 127
Effects of optimizations ................................................................... 127
Viewing variables and expressions ................................................ 128
Working with the windows .............................................................. 128
Using the trace system ..................................................................... 129
Viewing assembler variables ........................................................... 130
Using breakpoints ........................................................................................... 133
The breakpoint system ...................................................................... 133
Defining breakpoints ........................................................................... 133
Breakpoint icons .............................................................................. 134
Different ways to set a breakpoint ................................................... 134
Toggling a simple code breakpoint .................................................. 135
Defining breakpoints using the dialog box ...................................... 135
Setting a data breakpoint in the Memory window ........................... 136
Defining breakpoints using system macros ..................................... 137
Useful breakpoint tips ...................................................................... 137
Viewing all breakpoints ...................................................................... 138
Using the Breakpoint Usage dialog box .......................................... 139
Breakpoint consumers ...................................................................... 140
Monitoring memory and registers ........................................................ 141
Memory addressing .............................................................................. 141
Windows for monitoring memory and registers .................... 141
Using the Stack window .................................................................. 142
Working with registers ..................................................................... 143
UEW-8:1
xiii
xiv
Using the C-SPY® macro system .......................................................... 145
The macro system ................................................................................ 145
The macro language ......................................................................... 146
The macro file .................................................................................. 146
Setup macro functions ...................................................................... 147
Using C-SPY macros ........................................................................... 147
Using the Macro Configuration dialog box ..................................... 148
Registering and executing using setup macros and setup files ........ 149
Executing macros using Quick Watch ............................................ 150
Executing a macro by connecting it to a breakpoint ........................ 151
Analyzing your application ......................................................................... 153
Function-level profiling ...................................................................... 153
Using the profiler ............................................................................. 153
Code coverage ....................................................................................... 155
Using Code Coverage ...................................................................... 155
Part 5. The C-SPY® Simulator ......................................... 159
Simulator-specific debugging ..................................................................... 161
The C-SPY Simulator introduction .............................................. 161
Features ............................................................................................ 161
Selecting the simulator driver .......................................................... 161
Simulator-specific menus .................................................................. 162
Simulator menu ................................................................................ 162
Using the trace system in the simulator .................................... 163
Trace window ................................................................................... 163
Function Trace window ................................................................... 164
Trace Expressions window .............................................................. 166
Find In Trace window ...................................................................... 167
Find in Trace dialog box .................................................................. 167
Memory access checking ................................................................... 169
Memory Access setup dialog box .................................................... 169
Edit Memory Access dialog box ...................................................... 172
UEW-8:1
IAR Embedded Workbench® IDEUser Guide
Contents
Using breakpoints in the simulator .............................................. 173
Data breakpoints .............................................................................. 173
Immediate breakpoints ..................................................................... 176
Breakpoint Usage dialog box ........................................................... 178
Simulating interrupts ..................................................................................... 179
The C-SPY interrupt simulation system .................................... 179
Interrupt characteristics .................................................................... 180
Interrupt simulation states ................................................................ 180
Using the interrupt simulation system ....................................... 182
Target-adapting the interrupt simulation system ............................. 182
Interrupt Setup dialog box ................................................................ 183
Edit Interrupt dialog box .................................................................. 184
Forced interrupt window .................................................................. 185
C-SPY system macros for interrupts ................................................ 186
Interrupt Log window ...................................................................... 187
Simulating a simple interrupt ......................................................... 189
Part 6. Reference information ........................................... 191
IAR Embedded Workbench® IDE reference ................................... 193
Windows ................................................................................................... 193
IAR Embedded Workbench IDE window ....................................... 194
Workspace window .......................................................................... 196
Editor window .................................................................................. 204
Source Browser window .................................................................. 210
Breakpoints window ........................................................................ 213
Build window ................................................................................... 219
Find in Files window ........................................................................ 219
Tool Output window ........................................................................ 220
Debug Log window .......................................................................... 221
Menus ......................................................................................................... 222
File menu .......................................................................................... 222
Edit menu ......................................................................................... 225
UEW-8:1
xv
xvi
View menu ....................................................................................... 233
Project menu .................................................................................... 235
Tools menu ....................................................................................... 244
Common fonts options ..................................................................... 245
Key Bindings options ....................................................................... 246
Language options ............................................................................. 247
Editor options ................................................................................... 248
Configure Auto Indent dialog box ................................................... 250
External Editor options .................................................................... 251
Editor Setup Files options ................................................................ 253
Editor Colors and Fonts options ....................................................... 254
Messages options ............................................................................. 255
Project options .................................................................................. 257
Source Code Control options ........................................................... 258
Debugger options ............................................................................. 259
Stack options .................................................................................... 261
Register Filter options ...................................................................... 263
Terminal I/O options ........................................................................ 264
Configure Tools dialog box ............................................................. 265
Filename Extensions dialog box ...................................................... 267
Filename Extension Overrides dialog box ....................................... 268
Edit Filename Extensions dialog box ............................................... 268
Configure Viewers dialog box ........................................................ 269
Edit Viewer Extensions dialog box ................................................. 269
Window menu .................................................................................. 270
Help menu ........................................................................................ 271
Embedded Workbench Startup dialog box ...................................... 271
C-SPY® reference .......................................................................................... 273
C-SPY windows ...................................................................................... 273
Editing in C-SPY windows .............................................................. 274
C-SPY Debugger main window ....................................................... 274
Disassembly window ....................................................................... 275
Memory window .............................................................................. 278
UEW-8:1
IAR Embedded Workbench® IDEUser Guide
Contents
Fill dialog box .................................................................................. 282
Memory Save dialog box ................................................................. 283
Memory Restore dialog box ............................................................. 284
Symbolic Memory window .............................................................. 284
Register window .............................................................................. 286
Watch window ................................................................................. 287
Locals window ................................................................................. 289
Auto window .................................................................................... 289
Live Watch window ......................................................................... 290
Quick Watch window ....................................................................... 291
Statics window ................................................................................. 291
Select Statics dialog box .................................................................. 293
Call Stack window ........................................................................... 294
Terminal I/O window ....................................................................... 295
Code Coverage window ................................................................... 296
Profiling window .............................................................................. 298
Stack window ................................................................................... 300
Symbols window .............................................................................. 303
C-SPY menus .......................................................................................... 304
Debug menu ..................................................................................... 305
General options .............................................................................................. 311
Target ........................................................................................................ 311
Output ....................................................................................................... 311
Output file ........................................................................................ 312
Output directories ............................................................................. 312
Library Configuration ......................................................................... 313
Library .............................................................................................. 313
Library file ....................................................................................... 313
Configuration file ............................................................................. 313
Library Options ..................................................................................... 314
Printf formatter ................................................................................. 314
Scanf formatter ................................................................................. 314
Stack/Heap .............................................................................................. 315
UEW-8:1
xvii
xvi
Compiler options ........................................................................................... 317
Multi-file compilation .......................................................................... 317
Language .................................................................................................. 318
Language .......................................................................................... 318
Require prototypes ........................................................................... 319
Language conformance .................................................................... 319
Plain 'char' is ................................................................................... 319
Enable multibyte support ................................................................. 320
Enable IAR migration preprocessor extensions ............................... 320
Code ........................................................................................................... 320
Optimizations ......................................................................................... 321
Optimizations ................................................................................... 321
Output ....................................................................................................... 322
Module type ..................................................................................... 323
Generate debug information ............................................................. 323
List ............................................................................................................... 323
Output list file .................................................................................. 324
Output assembler file ....................................................................... 324
Preprocessor ........................................................................................... 325
Ignore standard include directories .................................................. 325
Additional include directories .......................................................... 325
Preinclude file .................................................................................. 326
Defined symbols .............................................................................. 326
Preprocessor output to file ............................................................... 326
Diagnostics .............................................................................................. 326
Enable remarks ................................................................................. 327
Suppress these diagnostics ............................................................... 327
Treat these as remarks ...................................................................... 327
Treat these as warnings .................................................................... 328
Treat these as errors ........................................................................ 328
Treat all warnings as errors .............................................................. 328
Extra Options ......................................................................................... 328
Use command line options ............................................................... 329
UEW-8:1
iiIAR Embedded Workbench® IDEUser Guide
Contents
Assembler options ......................................................................................... 331
Language .................................................................................................. 331
User symbols are case sensitive ....................................................... 331
Enable multibyte support ................................................................ 331
Allow mnemonics in first column .................................................... 331
Allow directives in first column ....................................................... 331
Macro quote characters .................................................................... 332
Output ....................................................................................................... 332
Generate debug information ............................................................. 333
List ............................................................................................................... 333
Preprocessor ........................................................................................... 333
Ignore standard include directories .................................................. 333
Additional include directories ......................................................... 333
Defined symbols .............................................................................. 334
Preprocessor output to file ............................................................... 334
Diagnostics .............................................................................................. 335
Extra Options ......................................................................................... 335
Use command line options ............................................................... 335
Custom build options ................................................................................... 337
Custom Tool Configuration ............................................................. 337
Build actions options .................................................................................... 339
Build Actions Configuration ............................................................ 339
Pre-build command line ................................................................... 339
Post-build command line ................................................................. 339
Linker options .................................................................................................. 341
Output ....................................................................................................... 341
Output file ....................................................................................... 341
Format .............................................................................................. 342
Extra Output .......................................................................................... 344
#define ....................................................................................................... 345
Define symbol ................................................................................. 345
UEW-8:1
xix
xx
Diagnostics .............................................................................................. 346
Always generate output .................................................................... 346
Segment overlap warnings ............................................................... 346
No global type checking .................................................................. 346
Range checks .................................................................................... 347
Warnings/Errors ............................................................................... 347
List ............................................................................................................... 348
Generate linker listing ...................................................................... 348
Config ......................................................................................................... 350
Linker command file ....................................................................... 350
Command file configuration tool ..................................................... 350
Override default program entry ........................................................ 350
Search paths ..................................................................................... 351
Raw binary image ............................................................................ 351
Processing ................................................................................................ 352
Fill unused code memory ................................................................. 352
Extra Options ......................................................................................... 354
Use command line options ............................................................... 354
Library builder options ................................................................................ 355
Output ....................................................................................................... 355
Debugger options ........................................................................................... 357
Setup .......................................................................................................... 357
Driver ............................................................................................... 357
Run to .............................................................................................. 358
Setup macros ................................................................................... 358
Device description file .................................................................... 358
Download ................................................................................................. 358
Extra Options ......................................................................................... 359
Use command line options ............................................................... 359
Plugins ....................................................................................................... 359
UEW-8:1
IAR Embedded Workbench® IDEUser Guide

Contents
The C-SPY Command Line Utility—cspybat ................................... 361
Using C-SPY in batch mode ............................................................. 361
Invocation syntax ............................................................................. 361
Output ............................................................................................... 362
Using an automatically generated batch file .................................... 362
C-SPY command line options ......................................................... 363
General cspybat options ................................................................... 363
Options available for all C-SPY drivers .......................................... 363
Options available for the simulator driver ....................................... 363
Options available for the C-SPY hardware driver ........................... 363
Descriptions of C-SPY command line options ......................... 364
C-SPY® macros reference ........................................................................ 369
The macro language ............................................................................ 369
Macro functions ............................................................................... 369
Predefined system macro functions ................................................. 369
Macro variables ................................................................................ 370
Macro statements ............................................................................. 371
Formatted output .............................................................................. 372
Setup macro functions summary .................................................. 374
C-SPY system macros summary ................................................... 375
Description of C-SPY system macros .......................................... 376
Glossary .............................................................................................................. 395
Index ..................................................................................................................... 409
UEW-8:1
xxi

xxi
UEW-8:1
iIAR Embedded Workbench® IDEUser Guide
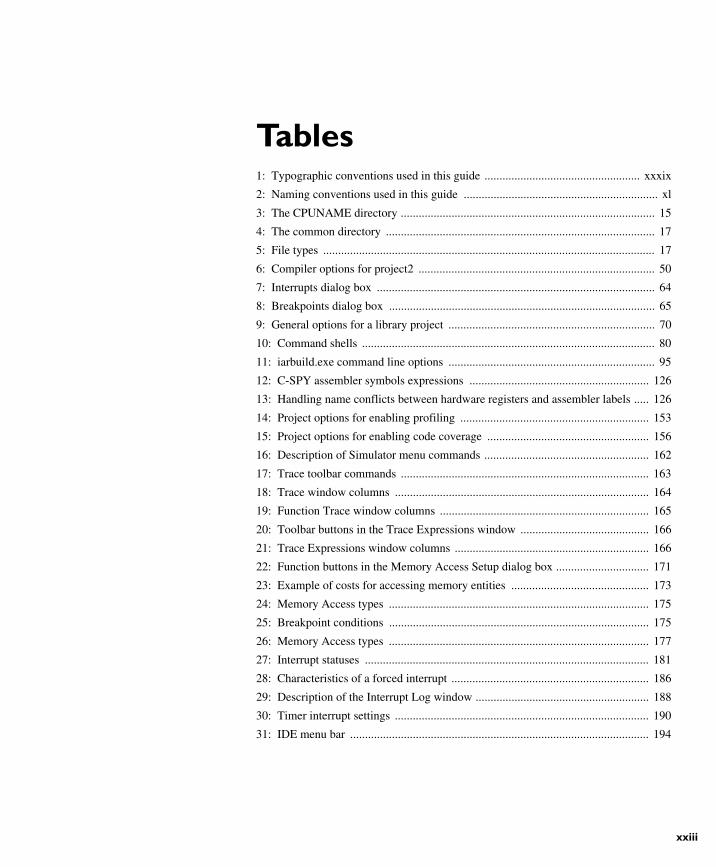
Tables1: Typographic conventions used in this guide .................................................... xxxix
2: Naming conventions used in this guide ................................................................. xl
3: The CPUNAME directory ..................................................................................... 15
4: The common directory .......................................................................................... 17
5: File types ............................................................................................................... 17
6: Compiler options for project2 ............................................................................... 50
7: Interrupts dialog box ............................................................................................. 64
8: Breakpoints dialog box ......................................................................................... 65
9: General options for a library project ..................................................................... 70
10: Command shells .................................................................................................. 80
11: iarbuild.exe command line options ..................................................................... 95
12: C-SPY assembler symbols expressions ............................................................ 126
13: Handling name conflicts between hardware registers and assembler labels ..... 126
14: Project options for enabling profiling ............................................................... 153
15: Project options for enabling code coverage ...................................................... 156
16: Description of Simulator menu commands ....................................................... 162
17: Trace toolbar commands ................................................................................... 163
18: Trace window columns ..................................................................................... 164
19: Function Trace window columns ...................................................................... 165
20: Toolbar buttons in the Trace Expressions window ........................................... 166
21: Trace Expressions window columns ................................................................. 166
22: Function buttons in the Memory Access Setup dialog box ............................... 171
23: Example of costs for accessing memory entities .............................................. 173
24: Memory Access types ....................................................................................... 175
25: Breakpoint conditions ....................................................................................... 175
26: Memory Access types ....................................................................................... 177
27: Interrupt statuses ............................................................................................... 181
28: Characteristics of a forced interrupt .................................................................. 186
29: Description of the Interrupt Log window .......................................................... 188
30: Timer interrupt settings ..................................................................................... 190
31: IDE menu bar .................................................................................................... 194
UEW-8:1
xxiii
xxi
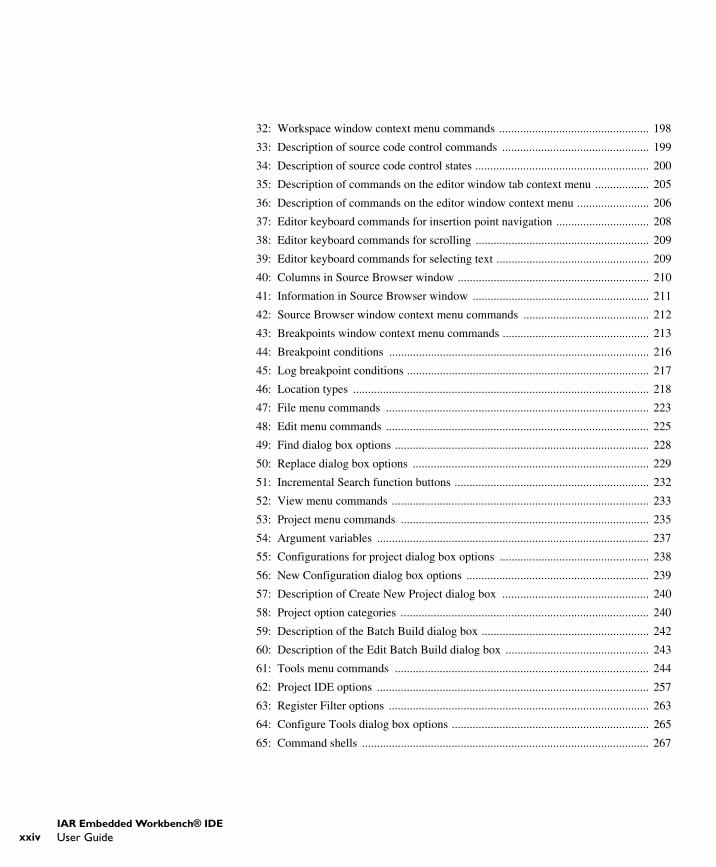
32: Workspace window context menu commands .................................................. 198
33: Description of source code control commands ................................................. 199
34: Description of source code control states .......................................................... 200
35: Description of commands on the editor window tab context menu .................. 205
36: Description of commands on the editor window context menu ........................ 206
37: Editor keyboard commands for insertion point navigation ............................... 208
38: Editor keyboard commands for scrolling .......................................................... 209
39: Editor keyboard commands for selecting text ................................................... 209
40: Columns in Source Browser window ................................................................ 210
41: Information in Source Browser window ........................................................... 211
42: Source Browser window context menu commands .......................................... 212
43: Breakpoints window context menu commands ................................................. 213
44: Breakpoint conditions ....................................................................................... 216
45: Log breakpoint conditions ................................................................................. 217
46: Location types ................................................................................................... 218
47: File menu commands ........................................................................................ 223
48: Edit menu commands ........................................................................................ 225
49: Find dialog box options ..................................................................................... 228
50: Replace dialog box options ............................................................................... 229
51: Incremental Search function buttons ................................................................. 232
52: View menu commands ...................................................................................... 233
53: Project menu commands ................................................................................... 235
54: Argument variables ........................................................................................... 237
55: Configurations for project dialog box options .................................................. 238
56: New Configuration dialog box options ............................................................. 239
57: Description of Create New Project dialog box ................................................. 240
58: Project option categories ................................................................................... 240
59: Description of the Batch Build dialog box ........................................................ 242
60: Description of the Edit Batch Build dialog box ................................................ 243
61: Tools menu commands ..................................................................................... 244
62: Project IDE options ........................................................................................... 257
63: Register Filter options ....................................................................................... 263
64: Configure Tools dialog box options .................................................................. 265
65: Command shells ................................................................................................ 267
UEW-8:1
vIAR Embedded Workbench® IDEUser Guide

Tables
66: Window menu commands ................................................................................. 270
67: Editing in C-SPY windows ............................................................................... 274
68: Disassembly window toolbar ............................................................................ 276
69: Disassembly context menu commands ............................................................. 277
70: Memory window operations ............................................................................. 279
71: Commands on the memory window context menu ........................................... 281
72: Fill dialog box options ...................................................................................... 282
73: Memory fill operations ...................................................................................... 282
74: Symbolic Memory window toolbar .................................................................. 285
75: Symbolic memory window columns ................................................................. 285
76: Commands on the Symbolic Memory window context menu .......................... 286
77: Watch window context menu commands ......................................................... 288
78: Effects of display format setting on different types of expressions .................. 288
79: Symbolic memory window columns ................................................................. 292
80: Statics window context menu commands ......................................................... 293
81: Code Coverage window toolbar ........................................................................ 297
82: Code Coverage window context menu commands ........................................... 298
83: Profiling window columns ................................................................................ 300
84: Stack window columns ..................................................................................... 302
85: Symbols window columns ................................................................................ 303
86: Commands on the Symbols window context menu .......................................... 304
87: Debug menu commands .................................................................................... 305
88: Log file options ................................................................................................. 308
89: XLINK range check options ............................................................................. 347
90: XLINK list file options ..................................................................................... 348
91: XLINK list file format options .......................................................................... 349
92: Linker checksum algorithms ............................................................................. 353
93: cspybat parameters ............................................................................................ 361
94: Examples of C-SPY macro variables ................................................................ 370
95: C-SPY setup macros ......................................................................................... 374
96: Summary of system macros .............................................................................. 375
97: __cancelInterrupt return values ......................................................................... 377
98: __disableInterrupts return values ...................................................................... 378
99: __driverType return values ............................................................................... 378
UEW-8:1
xxv
xxv
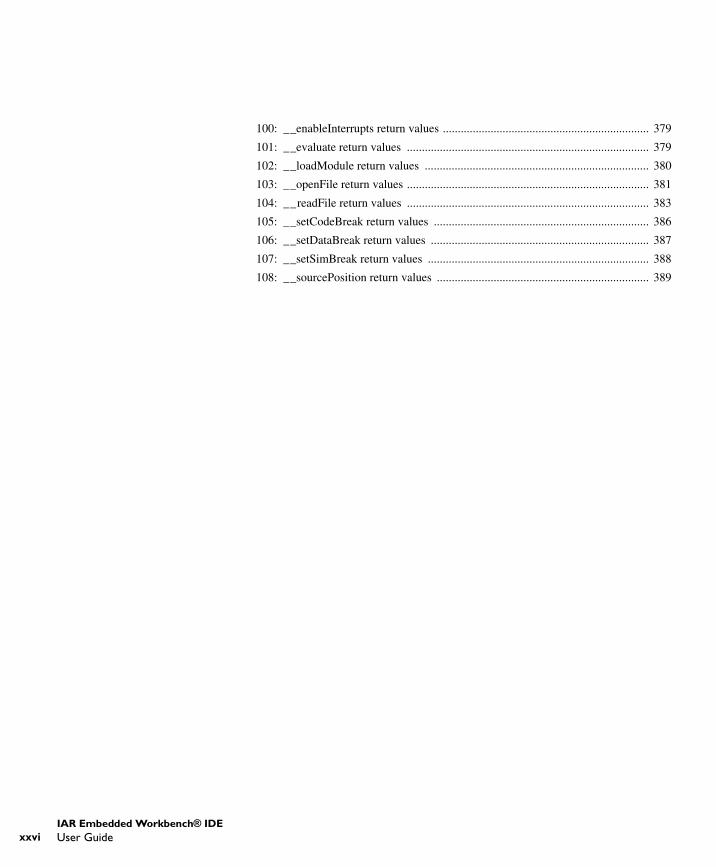
100: __enableInterrupts return values ..................................................................... 379
101: __evaluate return values ................................................................................. 379
102: __loadModule return values ........................................................................... 380
103: __openFile return values ................................................................................. 381
104: __readFile return values ................................................................................. 383
105: __setCodeBreak return values ........................................................................ 386
106: __setDataBreak return values ......................................................................... 387
107: __setSimBreak return values .......................................................................... 388
108: __sourcePosition return values ....................................................................... 389
UEW-8:1
iIAR Embedded Workbench® IDEUser Guide
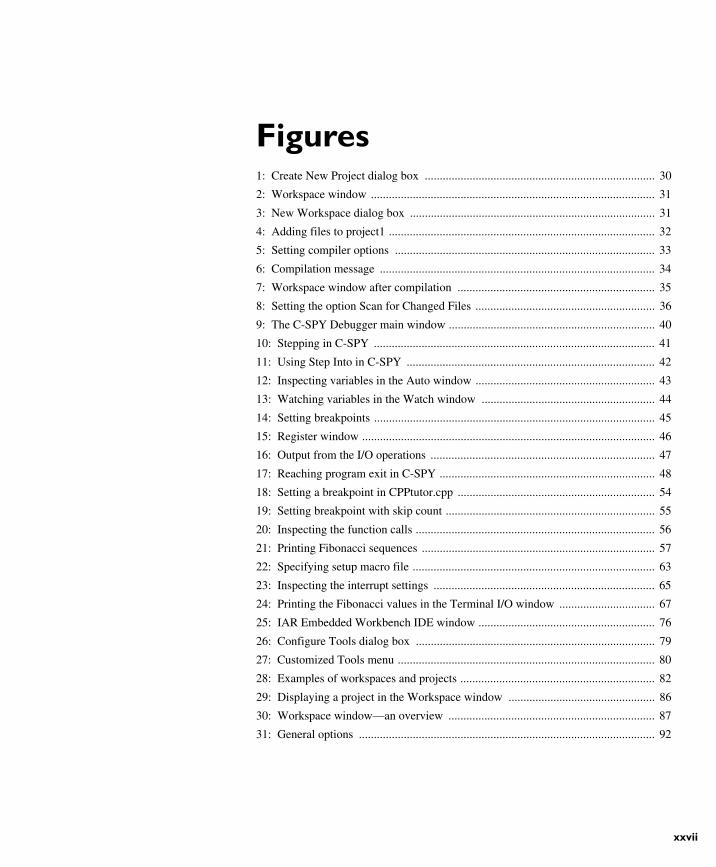
Figures1: Create New Project dialog box ............................................................................. 30
2: Workspace window ............................................................................................... 31
3: New Workspace dialog box .................................................................................. 31
4: Adding files to project1 ......................................................................................... 32
5: Setting compiler options ....................................................................................... 33
6: Compilation message ............................................................................................ 34
7: Workspace window after compilation .................................................................. 35
8: Setting the option Scan for Changed Files ............................................................ 36
9: The C-SPY Debugger main window ..................................................................... 40
10: Stepping in C-SPY .............................................................................................. 41
11: Using Step Into in C-SPY ................................................................................... 42
12: Inspecting variables in the Auto window ............................................................ 43
13: Watching variables in the Watch window .......................................................... 44
14: Setting breakpoints .............................................................................................. 45
15: Register window .................................................................................................. 46
16: Output from the I/O operations ........................................................................... 47
17: Reaching program exit in C-SPY ........................................................................ 48
18: Setting a breakpoint in CPPtutor.cpp .................................................................. 54
19: Setting breakpoint with skip count ...................................................................... 55
20: Inspecting the function calls ................................................................................ 56
21: Printing Fibonacci sequences .............................................................................. 57
22: Specifying setup macro file ................................................................................. 63
23: Inspecting the interrupt settings .......................................................................... 65
24: Printing the Fibonacci values in the Terminal I/O window ................................ 67
25: IAR Embedded Workbench IDE window ........................................................... 76
26: Configure Tools dialog box ................................................................................ 79
27: Customized Tools menu ...................................................................................... 80
28: Examples of workspaces and projects ................................................................. 82
29: Displaying a project in the Workspace window ................................................. 86
30: Workspace window—an overview ..................................................................... 87
31: General options ................................................................................................... 92
UEW-8:1
xxvii
xxv
32: Editor window ................................................................................................... 100
33: Parentheses matching in editor window ............................................................ 103
34: Editor window status bar ................................................................................... 103
35: Editor window code template menu .................................................................. 104
36: Specifying external command line editor ......................................................... 107
37: External editor DDE settings ............................................................................ 108
38: C-SPY and target systems ................................................................................. 112
39: C-SPY highlighting source location .................................................................. 122
40: Viewing assembler variables in the Watch window ......................................... 131
41: Breakpoint icons ................................................................................................ 134
42: Setting breakpoints via the context menu ......................................................... 136
43: Breakpoint Usage dialog box ............................................................................ 139
44: Stack window .................................................................................................... 142
45: Register window ................................................................................................ 143
46: Register Filter page ........................................................................................... 144
47: Macro Configuration dialog box ....................................................................... 149
48: Quick Watch window ........................................................................................ 151
49: Profiling window ............................................................................................... 154
50: Graphs in Profiling window .............................................................................. 154
51: Function details window ................................................................................... 155
52: Code Coverage window .................................................................................... 156
53: Simulator menu ................................................................................................. 162
54: Trace window .................................................................................................... 163
55: Function Trace window ..................................................................................... 165
56: Trace Expressions window ............................................................................... 166
57: Find In Trace window ....................................................................................... 167
58: Find in Trace dialog box ................................................................................... 168
59: Memory Access Setup dialog box ..................................................................... 170
60: Edit Memory Access dialog box ....................................................................... 172
61: Data breakpoints dialog box .............................................................................. 174
62: Immediate breakpoints page ............................................................................. 177
63: Breakpoint Usage dialog box ............................................................................ 178
64: Simulated interrupt configuration ..................................................................... 180
65: Simulation states - example 1 ........................................................................... 181
UEW-8:1
iiiIAR Embedded Workbench® IDEUser Guide
Figures
66: Simulation states - example 2 ........................................................................... 182
67: Interrupt Setup dialog box ................................................................................. 183
68: Edit Interrupt dialog box ................................................................................... 184
69: Forced Interrupt window ................................................................................... 185
70: Interrupt Log window ....................................................................................... 188
71: IAR Embedded Workbench IDE window ......................................................... 194
72: IDE toolbar ........................................................................................................ 195
73: IAR Embedded Workbench IDE window status bar ........................................ 196
74: Workspace window ........................................................................................... 196
75: Workspace window context menu .................................................................... 198
76: Source Code Control menu ............................................................................... 199
77: Select Source Code Control Provider dialog box ............................................. 201
78: Check In Files dialog box ................................................................................. 202
79: Check Out Files dialog box ............................................................................... 203
80: Editor window ................................................................................................... 204
81: Editor window tab context menu ...................................................................... 205
82: Editor window context menu ............................................................................ 206
83: Source Browser window ................................................................................... 210
84: Source Browser window context menu ............................................................. 212
85: Breakpoints window .......................................................................................... 213
86: Breakpoints window context menu ................................................................... 213
87: Code breakpoints page ...................................................................................... 215
88: Log breakpoints page ........................................................................................ 216
89: Enter Location dialog box ................................................................................. 218
90: Build window (message window) ..................................................................... 219
91: Build window context menu ............................................................................. 219
92: Find in Files window (message window) .......................................................... 220
93: Find in Files window context menu .................................................................. 220
94: Tool Output window (message window) .......................................................... 221
95: Tool Output window context menu ................................................................... 221
96: Debug Log window (message window) ............................................................ 221
97: Debug Log window context menu .................................................................... 222
98: File menu ........................................................................................................... 223
99: Edit menu .......................................................................................................... 225
UEW-8:1
xxix
xxx
100: Find in Files dialog box ................................................................................... 229
101: Incremental Search dialog box ........................................................................ 231
102: Template dialog box ........................................................................................ 232
103: View menu ...................................................................................................... 233
104: Project menu .................................................................................................... 235
105: Configurations for project dialog box ............................................................. 238
106: New Configuration dialog box ........................................................................ 239
107: Create New Project dialog box ....................................................................... 240
108: Batch Build dialog box .................................................................................... 242
109: Edit Batch Build dialog box ............................................................................ 243
110: Tools menu ...................................................................................................... 244
111: Common Fonts options ................................................................................... 245
112: Key Bindings options ...................................................................................... 246
113: Language options ............................................................................................ 247
114: Editor options .................................................................................................. 248
115: Configure Auto Indent dialog box .................................................................. 250
116: External Editor options ................................................................................... 251
117: Editor Setup Files options ............................................................................... 253
118: Editor Colors and Fonts options ...................................................................... 254
119: Messages option .............................................................................................. 255
120: Message dialog box containing a Don’t show again option ........................... 256
121: Project options ................................................................................................. 257
122: Source Code Control options .......................................................................... 258
123: Debugger options ............................................................................................ 259
124: Stack options ................................................................................................... 261
125: Register Filter options ..................................................................................... 263
126: Terminal I/O options ....................................................................................... 264
127: Configure Tools dialog box ............................................................................ 265
128: Customized Tools menu .................................................................................. 266
129: Filename Extensions dialog box ..................................................................... 267
130: Filename Extension Overrides dialog box ...................................................... 268
131: Edit Filename Extensions dialog box .............................................................. 268
132: Configure Viewers dialog box ........................................................................ 269
133: Edit Viewer Extensions dialog box ................................................................. 269
UEW-8:1
IAR Embedded Workbench® IDEUser Guide
Figures
134: Window menu ................................................................................................. 270
135: Embedded Workbench Startup dialog box ..................................................... 271
136: C-SPY debug toolbar ...................................................................................... 275
137: C-SPY Disassembly window .......................................................................... 275
138: Disassembly window context menu ................................................................ 277
139: Memory window ............................................................................................. 279
140: Memory window context menu ...................................................................... 280
141: Fill dialog box ................................................................................................. 282
142: Memory Save dialog box ................................................................................ 283
143: Memory Restore dialog box ............................................................................ 284
144: Symbolic Memory window ............................................................................. 285
145: Symbolic Memory window context menu ...................................................... 286
146: Register window .............................................................................................. 287
147: Watch window ................................................................................................ 287
148: Watch window context menu .......................................................................... 288
149: Locals window ................................................................................................ 289
150: Auto window ................................................................................................... 289
151: Live Watch window ........................................................................................ 290
152: Quick Watch window ...................................................................................... 291
153: Statics window ................................................................................................ 292
154: Statics window context menu .......................................................................... 292
155: Select Statics dialog box ................................................................................. 293
156: Call Stack window .......................................................................................... 294
157: Call Stack window context menu .................................................................... 294
158: Terminal I/O window ...................................................................................... 295
159: Ctrl codes menu ............................................................................................... 295
160: Input Mode dialog box .................................................................................... 296
161: Code Coverage window .................................................................................. 296
162: Code coverage context menu .......................................................................... 298
163: Profiling window ............................................................................................. 299
164: Profiling context menu .................................................................................... 299
165: Stack window .................................................................................................. 301
166: Stack window context menu ........................................................................... 302
167: Symbols window ............................................................................................. 303
UEW-8:1
xxxi
xxx
168: Symbols window context menu ...................................................................... 304
169: Debug menu .................................................................................................... 305
170: Autostep settings dialog box ........................................................................... 306
171: Macro Configuration dialog box ..................................................................... 307
172: Log File dialog box ......................................................................................... 308
173: Terminal I/O Log File dialog box ................................................................... 309
174: Output options ................................................................................................. 311
175: Library Configuration options ......................................................................... 313
176: Library Options page ....................................................................................... 314
177: Multi-file Compilation .................................................................................... 317
178: Compiler language options ............................................................................. 318
179: Compiler optimizations options ...................................................................... 321
180: Compiler output options .................................................................................. 322
181: Compiler list file options ................................................................................. 323
182: Compiler preprocessor options ....................................................................... 325
183: Compiler diagnostics options .......................................................................... 327
184: Extra Options page for the compiler ............................................................... 328
185: Choosing macro quote characters ................................................................... 332
186: Assembler output options ................................................................................ 332
187: Assembler preprocessor options ..................................................................... 333
188: Extra Options page for the assembler ............................................................. 335
189: Custom tool options ........................................................................................ 337
190: Build actions options ....................................................................................... 339
191: XLINK output file options .............................................................................. 341
192: XLINK extra output file options ..................................................................... 344
193: Linker defined symbols options ...................................................................... 345
194: Linker diagnostics options .............................................................................. 346
195: Linker list file options ..................................................................................... 348
196: Linker config options ...................................................................................... 350
197: Linker processing options ............................................................................... 352
198: Extra Options page for the linker .................................................................... 354
199: Library builder output options ........................................................................ 355
200: Generic C-SPY options ................................................................................... 357
201: Extra Options page for C-SPY ........................................................................ 359
UEW-8:1
iiIAR Embedded Workbench® IDEUser Guide

Figures
202: C-SPY plugin options ..................................................................................... 360
UEW-8:1
xxxiii

xxx
UEW-8:1
ivIAR Embedded Workbench® IDEUser Guide

PrefaceWelcome to the IAR Embedded Workbench® IDE User Guide. The purpose of this guide is to help you fully use the features in IAR Embedded Workbench with its integrated Windows development tools. The IAR Embedded Workbench IDE is a very powerful Integrated Development Environment that allows you to develop and manage a complete embedded application project.
The user guide includes product overviews and reference information, as well as tutorials that will help you get started. It also describes the processes of editing, project managing, building, and debugging.
Note: Some descriptions in this guide only apply to certain versions of the IAR Embedded Workbench® IDE. For example, not all versions support C++.
Who should read this guideRead this guide if you want to get the most out of the features and tools available in the IDE. In addition, you should have working knowledge of:
● The C or C++ programming language
● Application development for embedded systems
● The architecture and instruction set of the processor (refer to the chip manufacturer's documentation)
● The operating system of your host computer.
Refer to the IAR C/C++ Compiler Reference Guide, IAR Assembler Reference Guide, and IAR Linker and Library Tools Reference Guide for more information about the other development tools incorporated in the IDE.
How to use this guideIf you are new to using this product, we suggest that you first read Part 1. Product overview for an overview of the tools and the features that the IDE offers.
If you already have had some experience using IAR Embedded Workbench, but need refreshing on how to work with the IAR Systems development tools, Part 2. Tutorials is a good place to begin. The process of managing projects and building, as well as
UEW-8:1
xxxv

xxx
What this guide contains
editing, is described in Part 3. Project management and building, page 73, whereas information about how to use C-SPY is described in Part 4. Debugging, page 109.
If you are an experienced user and need this guide only for reference information, see the reference chapters in Part 6. Reference information and the online help system available from the IAR Embedded Workbench IDE Help menu.
Finally, we recommend the Glossary if you should encounter any unfamiliar terms in the IAR Systems user and reference guides.
What this guide containsThis is a brief outline and summary of the chapters in this guide. Some chapters only apply to certain versions of the IAR Embedded Workbench® IDE, partly or in their entirety.
Part 1. Product overview
This section provides a general overview of all the IAR Systems development tools so that you can become familiar with them:
● Product introduction provides a brief summary and lists the features offered in each of the IAR Systems development tools—IAR Embedded Workbench® IDE, IAR C/C++ Compiler, IAR Assembler, IAR XLINK Linker, IAR XAR Library Builder, IAR XLIB Librarian, and IAR C-SPY Debugger.
● Installed files describes the directory structure and the types of files it contains. The chapter also includes an overview of the documentation supplied with the IAR Systems development tools.
Part 2. Tutorials
The tutorials give you hands-on training to help you get started with using the tools:
● Welcome to the tutorials gives you an overview of the tutorial projects.
● Creating an application project guides you through setting up a new project, compiling your application, examining the list file, and linking your application. The tutorial demonstrates a typical development cycle, which is continued with debugging in the next chapter.
● Debugging using the IAR C-SPY® Debugger explores the basic facilities of the debugger.
● Mixing C and assembler modules demonstrates how you can easily combine source modules written in C with assembler modules. The chapter also demonstrates how to use the compiler for examining the calling convention.
UEW-8:1
viIAR Embedded Workbench® IDEUser Guide
Preface
● Using C++ shows how to create a C++ class, which creates two independent objects. The application is then built and debugged. This chapter only applies to product versions with C++ support.
● Simulating an interrupt shows how to add an interrupt handler to the project and how to simulate this interrupt, using C-SPY facilities for simulated interrupts, breakpoints, and macros.
● Creating and using libraries demonstrates how to create library modules.
Part 3. Project management and building
This section describes the process of editing and building your application:
● The development environment introduces you to the IAR Embedded Workbench development environment. The chapter also demonstrates the facilities available for customizing the environment to meet your requirements.
● Managing projects describes how you can create workspaces with multiple projects, build configurations, groups, source files, and options that helps you handle different versions of your applications.
● Building discusses the process of building your application.
● Editing contains detailed descriptions about the IAR Embedded Workbench editor, how to use it, and the facilities related to its usage. The final section also contains information about how to integrate an external editor of your choice.
Part 4. Debugging
This section gives conceptual information about C-SPY functionality and how to use it:
● The IAR C-SPY® Debugger introduces some of the concepts that are related to debugging in general and to the IAR C-SPY Debugger in particular. It also introduces you to the C-SPY environment and how to setup, start, and configure the debugger to reflect the target hardware.
● Executing your application describes how you initialize C-SPY, the conceptual differences between source and disassembly mode debugging, the facilities for executing your application, and finally, how you can handle terminal input and output.
● Working with variables and expressions defines the syntax of the expressions and variables used in C-SPY, as well as the limitations on variable information. The chapter also demonstrates the various methods for monitoring variables and expressions.
● Using breakpoints describes the breakpoint system and the various ways to define breakpoints.
UEW-8:1
xxxvii

xxx
What this guide contains
● Monitoring memory and registers shows how you can examine memory and registers.
● Using the C-SPY® macro system describes the C-SPY macro system, its features, the purposes of these features, and how to use them.
● Analyzing your application presents facilities for analyzing your application.
Part 5. The C-SPY® Simulator
● Simulator-specific debugging describes the functionality specific to the simulator.
● Simulating interrupts contains detailed information about the C-SPY interrupt simulation system and how to configure the simulated interrupts to make them reflect the interrupts of your target hardware.
Part 6. Reference information
● IAR Embedded Workbench® IDE reference contains detailed reference information about the development environment, such as details about the graphical user interface.
● C-SPY® reference provides detailed reference information about the graphical user interface of the IAR C-SPY Debugger.
● General options specifies the target, output, library, heap, and stack options.
● Compiler options specifies compiler options for language, optimizations, output, list file, preprocessor, and diagnostics.
● Assembler options describes the assembler options for language, output, list, preprocessor, and diagnostics.
● Custom build options describes the options available for custom tool configuration.
● Build actions options describes the options available for pre-build and post-build actions.
● Linker options describes the XLINK options for output, defining symbols, diagnostics, list generation, setting up the include paths, input, and processing.
● Library builder options describes the XAR options available in the Embedded Workbench.
● Debugger options gives reference information about generic C-SPY options.
● The C-SPY Command Line Utility—cspybat describes how to use the debugger in batch mode.
● C-SPY® macros reference gives reference information about C-SPY macros, such as a syntax description of the macro language, summaries of the available setup macro functions, and pre-defined system macros. Finally, a description of each system macro is provided.
UEW-8:1
viiIAR Embedded Workbench® IDEUser Guide

Preface
Other documentationThe complete set of IAR Systems development tools are described in a series of guides. For information about:
● Programming for the IAR C/C++ Compiler, refer to the IAR C/C++ Compiler Reference Guide
● Programming for the IAR Assembler, refer to the IAR Assembler Reference Guide● Using the IAR XLINK Linker, the IAR XAR Library Builder, and the IAR XLIB
Librarian, refer to the IAR Linker and Library Tools Reference Guide
All of these guides are delivered in hypertext PDF or HTML format on the installation media. Some of them are also delivered as printed books. Note that additional documentation might be available on the Help menu depending on your product installation.
Recommended web sites:
● The chip manufacturer web site contains information and news about the microcontroller.
● The IAR Systems web site, www.iar.com, holds application notes and other product information.
● Finally, the Embedded C++ Technical Committee web site, www.caravan.net/ec2plus, contains information about the Embedded C++ standard.
Document conventions When, in this text, we refer to the programming language C, the text also applies to C++, unless otherwise stated.
When referring to a directory in your product installation, for example cpuname\doc, the full path to the location is assumed, for example c:\Program Files\IAR Systems\Embedded Workbench 5.n\cpuname\doc.
TYPOGRAPHIC CONVENTIONS
This guide uses the following typographic conventions:
Style Used for
computer • Source code examples and file paths.• Text on the command line.• Binary, hexadecimal, and octal numbers.
Table 1: Typographic conventions used in this guide
UEW-8:1
xxxix
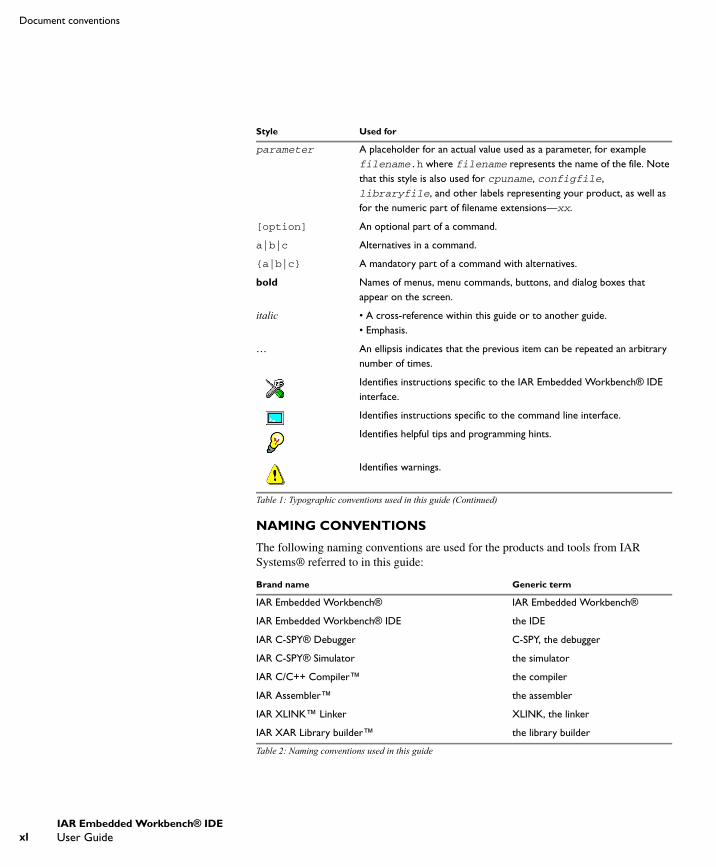
xl
Document conventions
NAMING CONVENTIONS
The following naming conventions are used for the products and tools from IAR Systems® referred to in this guide:
parameter A placeholder for an actual value used as a parameter, for example filename.h where filename represents the name of the file. Note that this style is also used for cpuname, configfile, libraryfile, and other labels representing your product, as well as for the numeric part of filename extensions—xx.
[option] An optional part of a command.
a|b|c Alternatives in a command.
{a|b|c} A mandatory part of a command with alternatives.
bold Names of menus, menu commands, buttons, and dialog boxes that appear on the screen.
italic • A cross-reference within this guide or to another guide.• Emphasis.
… An ellipsis indicates that the previous item can be repeated an arbitrary number of times.
Identifies instructions specific to the IAR Embedded Workbench® IDE interface.
Identifies instructions specific to the command line interface.
Identifies helpful tips and programming hints.
Identifies warnings.
Brand name Generic term
IAR Embedded Workbench® IAR Embedded Workbench®
IAR Embedded Workbench® IDE the IDE
IAR C-SPY® Debugger C-SPY, the debugger
IAR C-SPY® Simulator the simulator
IAR C/C++ Compiler™ the compiler
IAR Assembler™ the assembler
IAR XLINK™ Linker XLINK, the linker
IAR XAR Library builder™ the library builder
Table 2: Naming conventions used in this guide
Style Used for
Table 1: Typographic conventions used in this guide (Continued)
UEW-8:1
IAR Embedded Workbench® IDEUser Guide
Preface
IAR XLIB Librarian™ the librarian
Brand name Generic term
Table 2: Naming conventions used in this guide (Continued)
UEW-8:1
xli

xlii
Document conventions
UEW-8:1
IAR Embedded Workbench® IDEUser Guide

Part 1. Product overviewThis part of the IAR Embedded Workbench® IDE User Guide includes the following chapters:
● Product introduction
● Installed files.
UEW-8:1
1

2
UEW-8:1
Product introductionThe IAR Embedded Workbench® IDE is a very powerful Integrated Development Environment, that allows you to develop and manage complete embedded application projects. It is a development platform, with all the features you would expect to find in your everyday working place.
This chapter describes the IDE and provides a general overview of all the tools that are integrated in this product.
The IAR Embedded Workbench IDEThe IDE is the framework where all necessary tools are seamlessly integrated:
● The highly optimizing IAR C/C++ Compiler
● The IAR Assembler
● The versatile IAR XLINK Linker
● The IAR XAR Library Builder and the IAR XLIB Librarian
● A powerful editor
● A project manager
● A command line build utility
● The IAR C-SPY® Debugger, a state-of-the-art high-level language debugger.
IAR Embedded Workbench is available for many microprocessors and microcontrollers in the 8-, 16-, and 32-bit segments, allowing you to stay within a well-known development environment also for your next project. It provides an easy-to-learn and highly efficient development environment with maximum code inheritance capabilities, comprehensive and specific target support. IAR Embedded Workbench promotes a useful working methodology, and you can reduce your development time significantly by using the IAR Systems tools.
If you want detailed information about supported target processors, contact your software distributor or your IAR Systems representative, or visit the IAR Systems web site www.iar.com for information about recent product releases.
AN EXTENSIBLE AND MODULAR ENVIRONMENT
Although the IDE provides all the features required for a successful project, we also recognize the need to integrate other tools. Therefore the IDE is easily adapted to work with your favorite editor and source code control system. The IAR XLINK Linker can
UEW-8:1
Part 1. Product overview 3
4
The IAR Embedded Workbench IDE
produce many output formats, allowing for debugging on most third-party emulators. Support for RTOS-aware debugging and high-level debugging of state machines can also be added to the product.
The compiler, assembler, and linker can also be run from a command line environment, if you want to use them as external tools in an already established project environment.
FEATURES
The IDE is a flexible integrated development environment, allowing you to develop applications for a variety of target processors. It provides a convenient Windows interface for rapid development and debugging.
Project management
The IDE comes with functions that will help you to stay in control of all project modules, for example, C or C++ source code files, assembler files, include files, and other related modules. You create workspaces and let them contain one or several projects. Files can be grouped, and options can be set on all levels—project, group, or file. Changes are tracked so that a request for rebuild will retranslate all required modules, making sure that no executable files contain out-of-date modules. This list shows some additional features:
● Project templates to create a project that can be built and executed out of the box for a smooth development startup
● Hierarchical project representation
● Source browser with an hierarchical symbol presentation
● Options can be set globally, on groups of source files, or on individual source files
● The Make command automatically detects changes and performs only the required operations
● Text-based project files
● Custom Build utility to expand the standard tool chain in an easy way
● Command line build with the project file as input.
Source code control
Source code control (SCC)—or revision control—is useful for keeping track of different versions of your source code. IAR Embedded Workbench can identify and access any third-party source code control system that conforms to the SCC interface published by Microsoft.
UEW-8:1
IAR Embedded Workbench® IDEUser Guide

Product introduction
Window management
To give you full and convenient control of the placement of the windows, each window is dockable and you can optionally organize the windows in tab groups. The system of dockable windows also provides a space-saving way to keep many windows open at the same time. It also makes it easy to rearrange the size of the windows.
The text editor
The integrated text editor allows editing of multiple files in parallel, and provides all basic editing features expected from a modern editor, including unlimited undo/redo and automatic completion. In addition, it provides functions specific to software development, like coloring of keywords (C/C++, assembler, and user-defined), block indent, and function navigation within source files. It also recognizes C language elements like matching brackets. This list shows some additional features:
● Context-sensitive help system that can display reference information for DLIB library functions
● Syntax of C or C++ programs and assembler directives shown using text styles and colors
● Powerful search and replace commands, including multi-file search
● Direct jump to context from error listing
● Multibyte character support
● Parenthesis matching
● Automatic indentation
● Bookmarks
● Unlimited undo and redo for each window.
DOCUMENTATION
The IDE is documented in the IAR Embedded Workbench® IDE User Guide (this guide). Help and hypertext PDF versions of the user documentation are available online.
IAR C-SPY DebuggerThe IAR C-SPY Debugger is a high-level-language debugger for embedded applications. It is designed for use with the IAR Systems compilers and assemblers, and
UEW-8:1
Part 1. Product overview 5
6
IAR C-SPY Debugger
it is completely integrated in the IDE, providing seamless switching between development and debugging. This will give you possibilities such as:
● Editing while debugging. During a debug session, you can make corrections directly into the same source code window that is used to control the debugging. Changes will be included in the next project rebuild.
● Setting source code breakpoints before starting the debugger. Breakpoints in source code will be associated with the same piece of source code even if additional code is inserted.
THE C-SPY DRIVER
C-SPY consists both of a general part which provides a basic set of debugger features, and of a driver. The C-SPY driver is the part that provides communication with and control of the target system. The driver also provides a user interface—special menus, windows, and dialog boxes—to the features that the target system provides, for instance, special breakpoints.
Contact your software distributor or IAR Systems representative for information about available C-SPY drivers. You can also find information on the IAR Systems website, www.iar.com.
Depending on your product installation, C-SPY is available with a simulator driver and optional drivers for hardware debugger systems. For information about hardware debugger systems, see the online help system available from the Help menu.
GENERAL C-SPY DEBUGGER FEATURES
Because IAR Systems provides an entire tool chain, the output from the compiler and linker can include extensive debug information for the debugger, resulting in good debugging possibilities for you. C-SPY offers the general features described in this section.
Source and disassembly level debugging
C-SPY allows you to switch between source and disassembly debugging as required, for both C or C++ and assembler source code.
Debugging the C or C++ source code provides the quickest and easiest way of verifying the program logic of your application whereas disassembly debugging lets you focus on the critical sections of your application, and provides you with precise control over the hardware. In Mixed-Mode display, the debugger also displays the corresponding C/C++ source code interleaved with the disassembly listing.
UEW-8:1
IAR Embedded Workbench® IDEUser Guide
Product introduction
Single-stepping on a function call level
Compared to traditional debuggers, where the finest granularity for source level stepping is line by line, C-SPY provides a finer level of control by identifying every statement and function call as a step point. This means that each function call—inside expressions, and function calls that are part of parameter lists to other functions—can be single-stepped. The latter is especially useful when debugging C++ code, where numerous extra function calls are made, for example to object constructors.
The debug information also presents inlined functions as if a call was made, making the source code of the inlined function available.
Code and data breakpoints
The C-SPY breakpoint system lets you set breakpoints of various kinds in the application being debugged, allowing you to stop at locations of particular interest. You can set a code breakpoint to investigate whether your program logic is correct. You can also set a data breakpoint, to investigate how and when the data changes. Finally, you can add conditions and connect actions to your breakpoints.
Monitoring variables and expressions
When you work with variables and expressions you are presented with a wide choice of facilities. Any variable and expression can be evaluated in one-shot views. You can easily both monitor and log values of a defined set of expressions during a longer period of time. You have instant control over local variables, and real-time data is displayed non-intrusively. Finally, the last referred variables are displayed automatically.
Container awareness
When you run your application in C-SPY, you can view the elements of library data types such as STL lists and vectors. This gives you a very good overview and premium debugging opportunities when you work with C++ STL containers.
Call stack information
The compiler generates extensive call stack information. This allows the debugger to show, without any runtime penalty, the complete stack of function calls wherever the program counter is. You can select any function in the call stack, and for each function you get valid information for local variables and registers available.
Powerful macro system
C-SPY includes a powerful internal macro system, to allow you to define complex sets of actions to be performed. C-SPY macros can be used solely or in conjunction with
UEW-8:1
Part 1. Product overview 7

8
IAR C-SPY Debugger
complex breakpoints and—if you are using the simulator—the interrupt simulation system to perform a wide variety of tasks.
Additional general C-SPY debugger features
This list shows some additional features:
● A modular and extensible architecture allowing third-party extensions to the debugger, for example, real-time operating systems, peripheral simulation modules, and emulator drivers
● Threaded execution keeps the IDE responsive while running the target application
● Automatic stepping
● Source browser provides easy navigation to functions, types and variables
● Extensive type recognition of variables
● Configurable registers (CPU and peripherals) and memory windows
● Dedicated Stack window
● Support for code coverage and function level profiling
● The target application can access files on host PC using file I/O
● Optional terminal I/O emulation
● UBROF, Intel-extended, and Motorola input formats supported.
C-SPY PLUGIN MODULES
C-SPY is designed as a modular architecture with an open SDK that can be used for implementing additional functionality to the debugger in the form of plugin modules. These modules can be seamlessly integrated in the IDE.
Plugin modules are provided by IAR Systems, and can be supplied by third-party vendors. Examples of such modules are:
● Code Coverage, Profiling, and the Stack window, all well-integrated in the IDE.
● The various C-SPY drivers for debugging using certain debug systems.
● RTOS plugin modules for support for real-time OS awareness debugging.
● C-SPYLink that bridges IAR visualSTATE and IAR Embedded Workbench to make true high-level state machine debugging possible directly in C-SPY, in addition to the normal C level symbolic debugging. For more information, refer to the documentation provided with IAR visualSTATE.
For more information about the C-SPY SDK, contact IAR Systems.
RTOS AWARENESS
C-SPY supports real-time OS awareness debugging.
UEW-8:1
IAR Embedded Workbench® IDEUser Guide
Product introduction
RTOS plugin modules can be provided by IAR Systems, and by third-party suppliers. Contact your software distributor or IAR Systems representative, alternatively visit the IAR Systems web site, for information about supported RTOS modules.
IAR C-SPY SIMULATOR
The C-SPY simulator driver simulates the functions of the target processor entirely in software. With this driver, you can debug the program logic long before any hardware is available. Because no hardware is required, it is also the most cost-effective solution for many applications.
Features
In addition to the general features of C-SPY, the simulator driver also provides:
● Instruction-level simulation
● Memory configuration and validation
● Interrupt simulation
● Peripheral simulation, using the C-SPY macro system in conjunction with immediate breakpoints.
For additional information about the IAR C-SPY Simulator, refer to Part 5. The C-SPY® Simulator in this guide.
DOCUMENTATION
C-SPY is documented in the IAR Embedded Workbench® IDE User Guide (this guide). Generic debugger features are described in Part 4. Debugging, whereas features specific to each debugger driver are described in Part 5. The C-SPY® Simulator. Features specific to supported hardware debugger systems are described in the online help system available from the Help menu.
IAR C/C++ CompilerThe IAR C/C++ Compiler is a state-of-the-art compiler that offers the standard features of the C or C++ languages, plus many extensions designed to take advantage of the target-specific facilities.
The compiler is integrated with other IAR Systems software in the IDE.
UEW-8:1
Part 1. Product overview 9
10
IAR C/C++ Compiler
FEATURES
The compiler provides the following features:
Code generation
● Generic and target-specific optimization techniques produce very efficient machine code
● Comprehensive output options, including relocatable object code, assembler source code, and list files with optional assembler mnemonics
● The object code can be linked together with assembler routines
● Generation of extensive debug information.
Language facilities
● Support for the C and C++ programming languages (some product packages do not support C++)
● Support for IAR Extended EC++ with features such as full template support, namespace support, the cast operators static_cast, const_cast, and reinterpret_cast, as well as the Standard Template Library (STL). Applies only to product versions that support C++.
● Placement of classes in various memory types (depends on your product package)
● Conformance to the ISO/ANSI C standard for a free-standing environment
● Target-specific language extensions, such as special function types, extended keywords, pragma directives, predefined symbols, intrinsic functions, absolute allocation, and inline assembler
● Standard library of functions applicable to embedded systems
● IEEE-compatible floating-point arithmetic
● Interrupt functions can be written in C or C++.
Type checking
● Extensive type checking at compile time
● External references are type checked at link time
● Link-time inter-module consistency checking of the application.
RUNTIME ENVIRONMENT
Several mechanisms for customizing the runtime environment and the runtime libraries are available. For further information about the runtime environment, see the IAR C/C++ Compiler Reference Guide.
UEW-8:1
IAR Embedded Workbench® IDEUser Guide
Product introduction
DOCUMENTATION
The compiler is documented in the IAR C/C++ Compiler Reference Guide.
IAR AssemblerThe IAR Assembler is integrated with the other IAR Systems software tools. It is a powerful relocating macro assembler (supporting the Intel/Motorola style) with a versatile set of directives and expression operators. The assembler features a built-in C language preprocessor.
FEATURES
The IAR Assembler provides these features:
● C preprocessor
● List file with extensive cross-reference output
● Number of symbols and program size limited only by available memory
● Support for complex expressions with external references
● Up to 65536 relocatable segments per module
● 255 significant characters in symbol names.
DOCUMENTATION
The assembler is documented in the IAR Assembler Reference Guide.
UEW-8:1
Part 1. Product overview 11
12
IAR XLINK Linker
IAR XLINK LinkerThe IAR XLINK Linker links one or more relocatable object files produced by the IAR Assembler or IAR C/C++ Compiler to produce machine code for the processor you are using. It is equally well suited for linking small, single-file, absolute assembler applications as for linking large, relocatable, multi-module, C/C++, or mixed C/C++ and assembler applications.
It can generate one out of more than 30 industry-standard loader formats, in addition to the IAR Systems proprietary debug format used by the IAR C-SPY Debugger—UBROF (Universal Binary Relocatable Object Format). An application can be made up of any number of UBROF relocatable files, in any combination of assembler and C or C++ applications.
The final output from the IAR XLINK Linker is an absolute, target-executable object file that can be downloaded to the processor or to a hardware emulator. Optionally, the output file might or might not contain debug information depending on the output format you choose.
The IAR XLINK Linker supports user libraries, and will load only those modules that are actually needed by the application you are linking. Before linking, the IAR XLINK Linker performs a full C-level type checking across all modules as well as a full dependency resolution of all symbols in all input files, independent of input order. It also checks for consistent compiler settings for all modules and makes sure that the correct version and variant of the C or C++ runtime library is used.
FEATURES
● Full inter-module type checking
● Simple override of library modules
● Flexible segment commands allow detailed control of code and data placement
● Link-time symbol definition enables flexible configuration control
● Optional code checksum generation for runtime checking
● Removes unused code and data.
DOCUMENTATION
The IAR XLINK Linker is documented in the IAR Linker and Library Tools Reference Guide.
UEW-8:1
IAR Embedded Workbench® IDEUser Guide
Product introduction
IAR XAR Library Builder and IAR XLIB Librarian A library is a single file that contains several relocatable object modules, each of which can be loaded independently from other modules in the file as it is needed. The IAR XAR Library Builder assists you to build libraries easily. In addition the IAR XLIB Librarian enables you to manipulate the relocatable library object files produced by the IAR Systems assembler and compiler.
A library file is no different from any other relocatable object file produced by the assembler or compiler, except that it includes several modules of the LIBRARY type. All C or C++ applications make use of libraries, and the compiler is supplied with several standard library files.
FEATURES
The IAR XAR Library Builder and IAR XLIB Librarian both provide these features:
● Modules can be combined into a library file
● Interactive or batch mode operation.
The IAR XLIB Librarian provides the following additional features:
● Modules can be listed, added, inserted, replaced, or removed
● Modules can be changed between program and library type
● Segments can be listed
● Symbols can be listed.
DOCUMENTATION
The IAR XLIB Librarian and the IAR XAR Library Builder are documented in the IAR Linker and Library Tools Reference Guide, a PDF document available from the IDE Help menu.
UEW-8:1
Part 1. Product overview 13

14
IAR XAR Library Builder and IAR XLIB Librarian
UEW-8:1
IAR Embedded Workbench® IDEUser Guide
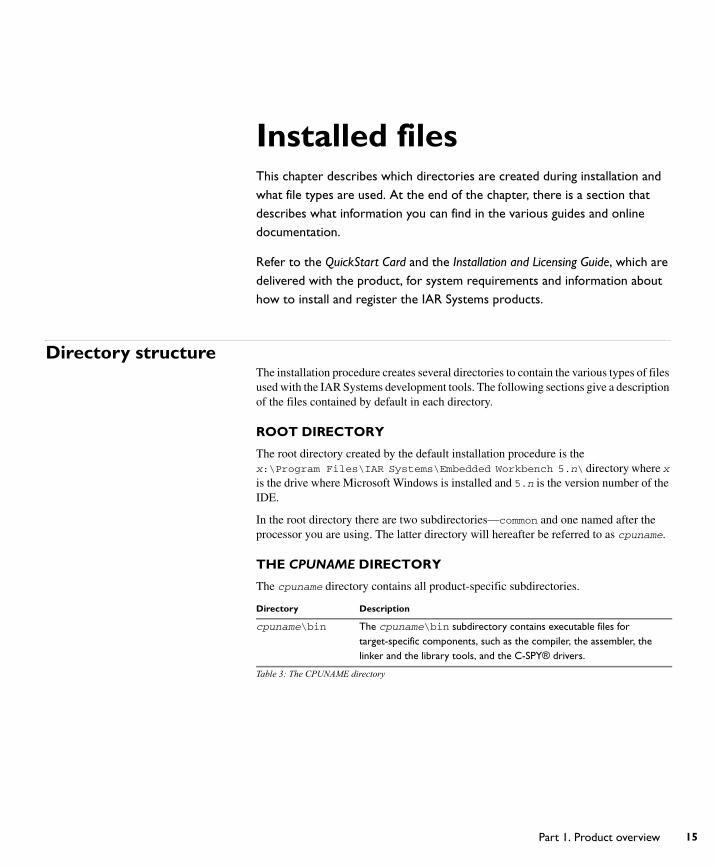
Installed filesThis chapter describes which directories are created during installation and what file types are used. At the end of the chapter, there is a section that describes what information you can find in the various guides and online documentation.
Refer to the QuickStart Card and the Installation and Licensing Guide, which are delivered with the product, for system requirements and information about how to install and register the IAR Systems products.
Directory structure The installation procedure creates several directories to contain the various types of files used with the IAR Systems development tools. The following sections give a description of the files contained by default in each directory.
ROOT DIRECTORY
The root directory created by the default installation procedure is the x:\Program Files\IAR Systems\Embedded Workbench 5.n\ directory where x is the drive where Microsoft Windows is installed and 5.n is the version number of the IDE.
In the root directory there are two subdirectories—common and one named after the processor you are using. The latter directory will hereafter be referred to as cpuname.
THE CPUNAME DIRECTORY
The cpuname directory contains all product-specific subdirectories.
Directory Description
cpuname\bin The cpuname\bin subdirectory contains executable files for target-specific components, such as the compiler, the assembler, the linker and the library tools, and the C-SPY® drivers.
Table 3: The CPUNAME directory
UEW-8:1
Part 1. Product overview 15
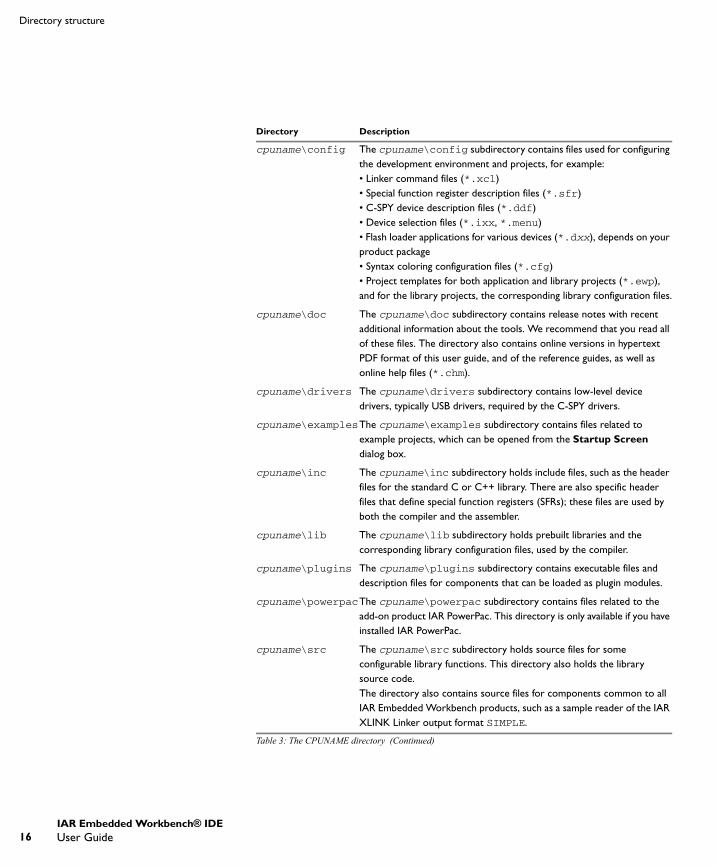
16
Directory structure
cpuname\config The cpuname\config subdirectory contains files used for configuring the development environment and projects, for example: • Linker command files (*.xcl)• Special function register description files (*.sfr)• C-SPY device description files (*.ddf)• Device selection files (*.ixx, *.menu)• Flash loader applications for various devices (*.dxx), depends on your product package• Syntax coloring configuration files (*.cfg)• Project templates for both application and library projects (*.ewp), and for the library projects, the corresponding library configuration files.
cpuname\doc The cpuname\doc subdirectory contains release notes with recent additional information about the tools. We recommend that you read all of these files. The directory also contains online versions in hypertext PDF format of this user guide, and of the reference guides, as well as online help files (*.chm).
cpuname\drivers The cpuname\drivers subdirectory contains low-level device drivers, typically USB drivers, required by the C-SPY drivers.
cpuname\examplesThe cpuname\examples subdirectory contains files related to example projects, which can be opened from the Startup Screen dialog box.
cpuname\inc The cpuname\inc subdirectory holds include files, such as the header files for the standard C or C++ library. There are also specific header files that define special function registers (SFRs); these files are used by both the compiler and the assembler.
cpuname\lib The cpuname\lib subdirectory holds prebuilt libraries and the corresponding library configuration files, used by the compiler.
cpuname\plugins The cpuname\plugins subdirectory contains executable files and description files for components that can be loaded as plugin modules.
cpuname\powerpacThe cpuname\powerpac subdirectory contains files related to the add-on product IAR PowerPac. This directory is only available if you have installed IAR PowerPac.
cpuname\src The cpuname\src subdirectory holds source files for some configurable library functions. This directory also holds the library source code.The directory also contains source files for components common to all IAR Embedded Workbench products, such as a sample reader of the IAR XLINK Linker output format SIMPLE.
Directory Description
Table 3: The CPUNAME directory (Continued)
UEW-8:1
IAR Embedded Workbench® IDEUser Guide

Installed files
THE COMMON DIRECTORY
The common directory contains subdirectories for components shared by all IAR Embedded Workbench products.
THE INSTALL-INFO DIRECTORY
The install-info directory contains metadata (version number, name, etc.) about the installed product components. Do not modify these files.
File typesThe versions of the IAR Systems development tools use the following default filename extensions to identify the produced files and other recognized file types:
cpuname\tutor The cpuname\tutor subdirectory contains the files used for the tutorials in this guide.
Directory Description
common\bin The common\bin subdirectory contains executable files for components common to all IAR Embedded Workbench products, such as the editor and the graphical user interface components. The executable file for the IDE is also located here.
common\config The common\config subdirectory contains files used by the IDE for holding settings in the development environment.
common\doc The common\doc subdirectory contains release notes with recent additional information about the components common to all IAR Embedded Workbench products, such as the linker and library tools. We recommend that you read these files. The directory also contains an online version in PDF format of the IAR Linker and Library Tools Reference Guide.
common\plugins The common\plugins subdirectory contains executable files and description files for components that can be loaded as plugin modules, for example modules for Code coverage and Profiling.
Table 4: The common directory
Directory Description
Table 3: The CPUNAME directory (Continued)
Ext. Type of file Output from Input to
axx Target application XLINK EPROM, C-SPY, etc.
asm Assembler source code Text editor Assembler
Table 5: File types
UEW-8:1
Part 1. Product overview 17
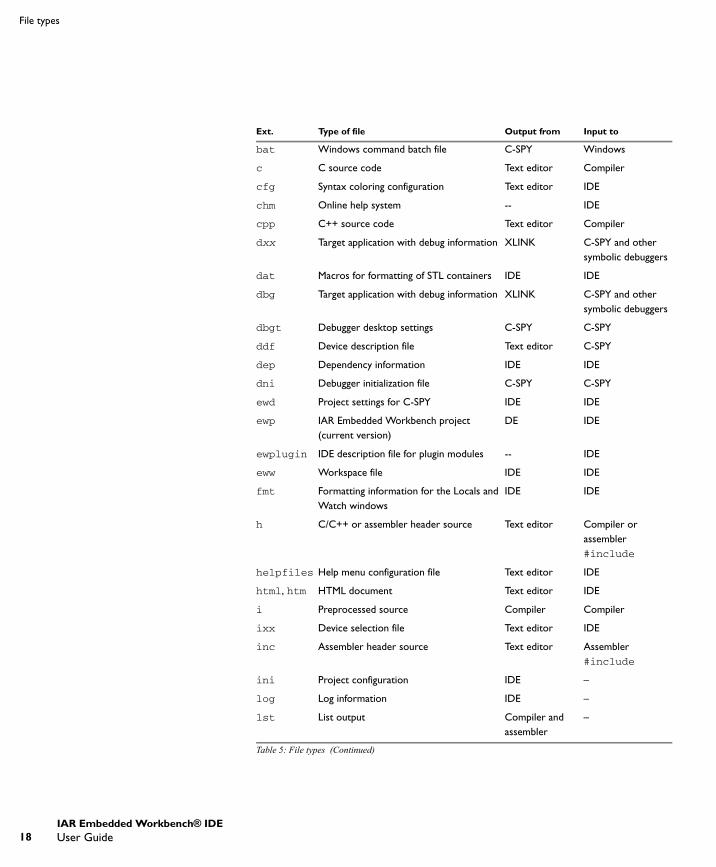
18
File types
bat Windows command batch file C-SPY Windows
c C source code Text editor Compiler
cfg Syntax coloring configuration Text editor IDE
chm Online help system -- IDE
cpp C++ source code Text editor Compiler
dxx Target application with debug information XLINK C-SPY and other symbolic debuggers
dat Macros for formatting of STL containers IDE IDE
dbg Target application with debug information XLINK C-SPY and other symbolic debuggers
dbgt Debugger desktop settings C-SPY C-SPY
ddf Device description file Text editor C-SPY
dep Dependency information IDE IDE
dni Debugger initialization file C-SPY C-SPY
ewd Project settings for C-SPY IDE IDE
ewp IAR Embedded Workbench project (current version)
DE IDE
ewplugin IDE description file for plugin modules -- IDE
eww Workspace file IDE IDE
fmt Formatting information for the Locals and Watch windows
IDE IDE
h C/C++ or assembler header source Text editor Compiler or assembler #include
helpfiles Help menu configuration file Text editor IDE
html, htm HTML document Text editor IDE
i Preprocessed source Compiler Compiler
ixx Device selection file Text editor IDE
inc Assembler header source Text editor Assembler #include
ini Project configuration IDE –
log Log information IDE –
lst List output Compiler and assembler
–
Ext. Type of file Output from Input to
Table 5: File types (Continued)
UEW-8:1
IAR Embedded Workbench® IDEUser Guide
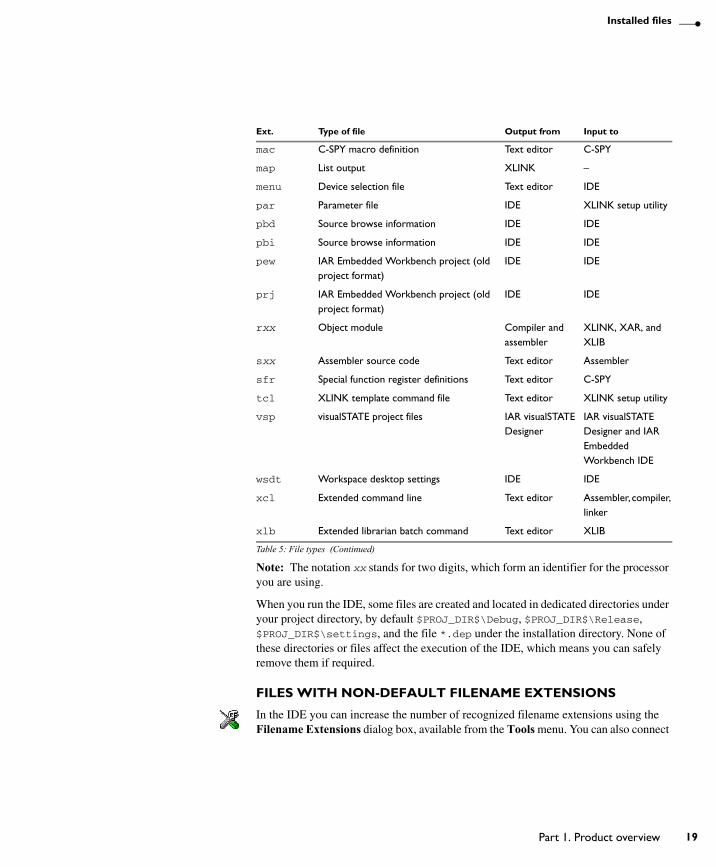
Installed files
Note: The notation xx stands for two digits, which form an identifier for the processor you are using.
When you run the IDE, some files are created and located in dedicated directories under your project directory, by default $PROJ_DIR$\Debug, $PROJ_DIR$\Release, $PROJ_DIR$\settings, and the file *.dep under the installation directory. None of these directories or files affect the execution of the IDE, which means you can safely remove them if required.
FILES WITH NON-DEFAULT FILENAME EXTENSIONS
In the IDE you can increase the number of recognized filename extensions using the Filename Extensions dialog box, available from the Tools menu. You can also connect
mac C-SPY macro definition Text editor C-SPY
map List output XLINK –
menu Device selection file Text editor IDE
par Parameter file IDE XLINK setup utility
pbd Source browse information IDE IDE
pbi Source browse information IDE IDE
pew IAR Embedded Workbench project (old project format)
IDE IDE
prj IAR Embedded Workbench project (old project format)
IDE IDE
rxx Object module Compiler and assembler
XLINK, XAR, and XLIB
sxx Assembler source code Text editor Assembler
sfr Special function register definitions Text editor C-SPY
tcl XLINK template command file Text editor XLINK setup utility
vsp visualSTATE project files IAR visualSTATE Designer
IAR visualSTATE Designer and IAR Embedded Workbench IDE
wsdt Workspace desktop settings IDE IDE
xcl Extended command line Text editor Assembler, compiler, linker
xlb Extended librarian batch command Text editor XLIB
Ext. Type of file Output from Input to
Table 5: File types (Continued)
UEW-8:1
Part 1. Product overview 19
20
Documentation
your filename extension to a specific tool in the tool chain. See Filename Extensions dialog box, page 267.
To override the default filename extension from the command line, include an explicit extension when you specify a filename.
Note: If you run the tools from the command line, the XLINK listings (map files) will, by default, have the extension lst, which might overwrite the list file generated by the compiler. Therefore, we recommend that you name XLINK map files explicitly, for example project1.map.
DocumentationThis section briefly describes the information that is available in the user and reference guides, in the online help, and on the Internet.
You can access the online documentation from the Help menu in the IDE. Help is also available via the F1 key in the IDE.
We recommend that you read the file readme.htm for recent information that might not be included in the user guides. It is located in the cpuname\doc directory.
Note: Additional documentation might be available depending on your product installation.
THE USER AND REFERENCE GUIDES
The user and reference guides provided with IAR Embedded Workbench are as follows:
IAR Embedded Workbench® IDE User Guide
This guide. For a brief overview, see What this guide contains, page xxxvi.
IAR C/C++ Compiler Reference Guide
This guide provides reference information about the IAR C/C++ Compiler. Refer to this guide for information about:
● How to configure the compiler to suit your target processor and application requirements
● How to write efficient code for your target processor
● The assembler language interface and the calling convention
● The available data types
● The runtime libraries
● The IAR Systems language extensions.
UEW-8:1
IAR Embedded Workbench® IDEUser Guide
Installed files
IAR Assembler Reference Guide
This guide provides reference information about the IAR Assembler, including details of the assembler source format, and reference information about the assembler operators, directives, mnemonics, and diagnostics.
IAR Linker and Library Tools Reference Guide
This online PDF guide provides reference information about the IAR Systems linker and library tools:
● The IAR XLINK Linker reference sections provide information about XLINK options, output formats, environment variables, and diagnostics.
● The IAR XAR Library Builder reference sections provide information about XAR options and output.
● The IAR XLIB Librarian reference sections provide information about XLIB commands, environment variables, and diagnostics.
ONLINE HELP
The context-sensitive online help contains reference information about the menus and dialog boxes in the IDE. It also contains keyword reference information for specific functions. To obtain reference information for a function, select the function name in the editor window and press F1.
IAR SYSTEMS ON THE WEB
You can find the latest news from IAR Systems at the web site www.iar.com, available from the Help menu in the IDE. Visit it for information about:
● Product announcements
● Updates and news about current versions
● Special offerings
● Evaluation copies of the IAR Systems products
● Technical Support, including technical notes
● Application notes
● Links to chip manufacturers and other interesting sites
● Distributors; the names and addresses of distributors in each country.
UEW-8:1
Part 1. Product overview 21

22
Documentation
UEW-8:1
IAR Embedded Workbench® IDEUser Guide
Part 2. TutorialsThis part of the IAR Embedded Workbench® IDE User Guide contains the following chapters:
● Welcome to the tutorials
● Creating an application project
● Debugging using the IAR C-SPY® Debugger
● Mixing C and assembler modules
● Using C++
● Simulating an interrupt
● Creating and using libraries.
UEW-8:1
23

24
UEW-8:1

Welcome to the tutorialsThe tutorials give you hands-on training to help you get started using the IAR Embedded Workbench IDE and its tools.
Below you will get an overview of the tutorials.
Tutorials overviewThe tutorials are divided into different parts. You can work through all tutorials as a suite or you can choose to go through the tutorials individually.
Note: The tutorials call the printf library function, which calls the low-level write function part of the DLIB library or the putchar function part of the CLIB library. This works in the C-SPY simulator, but if you want to run the tutorials in a release configuration on real hardware, you must provide your own version of these functions (depending on the library that you are using), adapted to your hardware.
CREATING AN APPLICATION PROJECT
This tutorial guides you through how to set up a new project, compiling your application, examining the list file, and linking your application. These are the related files:
DEBUGGING USING THE IAR C-SPY® DEBUGGER
This tutorial explores the basic facilities of the debugger while debugging the application used in project1. These are the related files:
Workspace: tutorials.eww
Project files: project1.ewp
Source files: Tutor.c, Tutor.h, Utilities.c, and Utilities.h
Workspace: tutorials.eww
Project files: project1.ewp
Source files: Tutor.c, Tutor.h, Utilities.c, and Utilities.h
UEW-8:1
Part 2. Tutorials 25

26
Tutorials overview
MIXING C AND ASSEMBLER MODULES
This tutorial demonstrates how you can easily combine source modules written in C with assembler modules. The chapter also demonstrates how to use the compiler for examining the compiler calling convention. These are the related files:
USING C++
This tutorial demonstrates how to create a C++ class, which creates two independent objects. The application is then built and debugged. This chapter only applies to product versions with C++ support. These are the related files:
SIMULATING AN INTERRUPT
This tutorial demonstrates how you add an interrupt handler to the project and how you simulate this interrupt, using C-SPY facilities for simulated interrupts, breakpoints, and macros. These are the related files:
CREATING AND USING LIBRARIES
This tutorial demonstrates how to create library modules. These are the related files:
Workspace: tutorials.eww
Project files: project2.ewp
Source files: Tutor.c, Tutor.h, Utilities.c, Utilities.h, and Utilities.sxx
Workspace: tutorials.eww
Project files: project3.ewp
Source files: CppTutor.cpp, Fibonacci.cpp, and Fibonacci.h
Workspace: tutorials.eww
Project files: project4.ewp
Source files: Interrupt.c, Utilities.c, and Utilities.h
Workspace: tutorials.eww
Project files: project5.ewp and tutor_library.ewp
Source files: Main.sxx, MaxMin.sxx, and Utilities.h
UEW-8:1
IAR Embedded Workbench® IDEUser Guide

Welcome to the tutorials
GETTING STARTED
Before you start, we recommend that you create a specific directory where you can store all your project files. In this tutorial we call the directory projects. You can find all the files needed for the tutorials in the cpuname\tutor directory. Make a copy of the tutor directory in your projects directory.
Alternatively, you can access the tutorials from the Startup Screen available from the Help menu in the IDE. In this case, click Example Applications and select Tutorials. This will create a copy of the workspace and its associated project files. You can also open the workspace with Open Existing workspace, but then you will be working with the original files instead of a copy of the workspace.
Note: It is possible to customize the amount of information to be displayed in the Build messages window. In the tutorial projects, the default setting is not used. Thus, the contents of the Build messages window on your screen might differ from the screen shots in the text.
Now you can start with the first tutorial project: Creating an application project, page 29.
UEW-8:1
Part 2. Tutorials 27

28
Tutorials overview
UEW-8:1
IAR Embedded Workbench® IDEUser Guide
Creating an application projectThis chapter introduces you to the IAR Embedded Workbench® integrated development environment (IDE). The tutorial demonstrates a typical development cycle and shows how you use the compiler and the linker to create a small application for your device. For instance, creating a workspace, setting up a project with C source files, and compiling and linking your application.
For a short overview of all tutorials and their related files, see Tutorials overview, page 25.
Setting up a new projectUsing the IDE, you can design advanced project models. You create a workspace to which you add one or several projects. There are ready-made project templates for both application and library projects. Each project can contain a hierarchy of groups in which you collect your source files. For each project you can define one or several build configurations. For more details about designing project models, see the chapter Managing projects in this guide.
Because the application in this tutorial is a simple application with very few files, the tutorial does not need an advanced project model.
Before you can create your project you must first create a workspace.
CREATING A WORKSPACE
The first step is to create a new workspace for the tutorial application. When you start the IDE for the first time, there is already a ready-made workspace, which you can use for the tutorial projects. If you are using that workspace, you can ignore the first step.
Choose File>New>Workspace. Now you are ready to create a project and add it to the workspace.
UEW-8:1
Part 2. Tutorials 29

30
Setting up a new project
CREATING THE NEW PROJECT
1 To create a new project, choose Project>Create New Project. The Create New Project dialog box appears, which lets you base your new project on a project template.
Figure 1: Create New Project dialog box
2 From the Tool chain drop-down list, choose the tool chain you are using and click OK.
3 For this tutorial, select the project template Empty project, which simply creates an empty project that uses default project settings.
4 In the standard Save As dialog box that appears, specify where you want to place your project file, that is, in your newly created projects directory. Type project1 in the File name box, and click Save to create the new project.
Note: If you copied all files from the cpuname\tutor dierctory before you started with the tutorials, a project file will already be available in your projects directory. You can use that ready-made file, or create your own file.
UEW-8:1
IAR Embedded Workbench® IDEUser Guide

Creating an application project
The project will appear in the Workspace window.
Figure 2: Workspace window
By default, two build configurations are created: Debug and Release. In this tutorial only Debug will be used. You choose the build configuration from the drop-down menu at the top of the window. The asterisk in the project name indicates that there are changes that have not been saved.
A project file—with the filename extension ewp—will be created in the projects directory, not immediately, but later on when you save the workspace. This file contains information about your project-specific settings, such as build options.
5 Before you add any files to your project, you should save the workspace. Choose File>Save Workspace and specify where you want to place your workspace file. In this tutorial, you should place it in your newly created projects directory. Type tutorials in the File name box, and click Save to create the new workspace.
Figure 3: New Workspace dialog box
UEW-8:1
Part 2. Tutorials 31
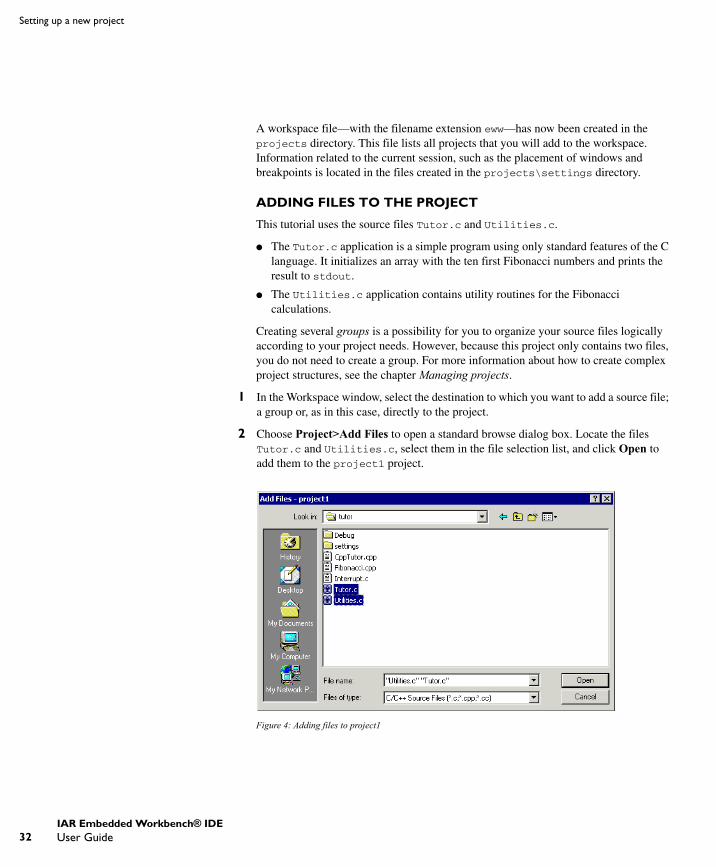
32
Setting up a new project
A workspace file—with the filename extension eww—has now been created in the projects directory. This file lists all projects that you will add to the workspace. Information related to the current session, such as the placement of windows and breakpoints is located in the files created in the projects\settings directory.
ADDING FILES TO THE PROJECT
This tutorial uses the source files Tutor.c and Utilities.c.
● The Tutor.c application is a simple program using only standard features of the C language. It initializes an array with the ten first Fibonacci numbers and prints the result to stdout.
● The Utilities.c application contains utility routines for the Fibonacci calculations.
Creating several groups is a possibility for you to organize your source files logically according to your project needs. However, because this project only contains two files, you do not need to create a group. For more information about how to create complex project structures, see the chapter Managing projects.
1 In the Workspace window, select the destination to which you want to add a source file; a group or, as in this case, directly to the project.
2 Choose Project>Add Files to open a standard browse dialog box. Locate the files Tutor.c and Utilities.c, select them in the file selection list, and click Open to add them to the project1 project.
Figure 4: Adding files to project1
UEW-8:1
IAR Embedded Workbench® IDEUser Guide

Creating an application project
SETTING PROJECT OPTIONS
Now you will set the project options. For application projects, options can be set on all levels of nodes. First you will set the general options to suit the processor configuration in this tutorial. Because these options must be the same for the whole build configuration, they must be set on the project node.
1 Select the project folder icon project1 - Debug in the Workspace window and choose Project>Options. In this tutorial you should use the default settings. Then set the compiler options for the project.
2 Select C/C++ Compiler in the Category list to display the compiler option pages.
Figure 5: Setting compiler options
3 Verify that default settings are used. In addition to the default settings, click the List tab, and select the options Output list file and Assembler mnemonics. Click OK to set the options you have specified.
The project is now ready to be built.
UEW-8:1
Part 2. Tutorials 33

34
Compiling and linking the application
Compiling and linking the applicationYou can now compile and link the application. You will also view the compiler list file and the linker map file.
COMPILING THE SOURCE FILES
1 To compile the file Utilities.c, select it in the Workspace window.
2 Choose Project>Compile.
Alternatively, click the Compile button in the toolbar or choose the Compile command from the context menu that appears when you right-click on the selected file in the Workspace window.
The progress is displayed in the Build messages window.
Figure 6: Compilation message
3 Compile the file Tutor.c in the same manner.
The IDE has now created new directories in your project directory. Because you are using the build configuration Debug, a Debug directory has been created containing the directories List, Obj, and Exe:
● The List directory is the destination directory for the list files. The list files have the extension lst.
● The Obj directory is the destination directory for the object files from the compiler and the assembler. These files have the extension rxx and are used as input to the IAR XLINK Linker.
● The Exe directory is the destination directory for the executable file. It has the extension dxx and is used as input to the IAR C-SPY® Debugger. Note that this directory is empty until you have linked the object files.
Click on the plus signs in the Workspace window to expand the view. As you can see, the IDE has also created an output folder icon in the Workspace window containing any
UEW-8:1
IAR Embedded Workbench® IDEUser Guide
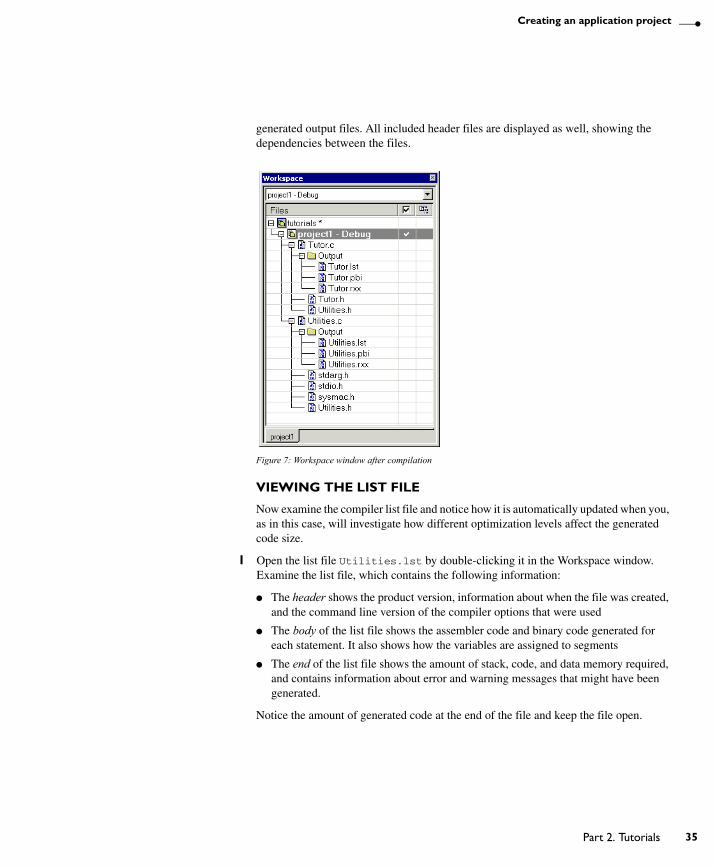
Creating an application project
generated output files. All included header files are displayed as well, showing the dependencies between the files.
Figure 7: Workspace window after compilation
VIEWING THE LIST FILE
Now examine the compiler list file and notice how it is automatically updated when you, as in this case, will investigate how different optimization levels affect the generated code size.
1 Open the list file Utilities.lst by double-clicking it in the Workspace window. Examine the list file, which contains the following information:
● The header shows the product version, information about when the file was created, and the command line version of the compiler options that were used
● The body of the list file shows the assembler code and binary code generated for each statement. It also shows how the variables are assigned to segments
● The end of the list file shows the amount of stack, code, and data memory required, and contains information about error and warning messages that might have been generated.
Notice the amount of generated code at the end of the file and keep the file open.
UEW-8:1
Part 2. Tutorials 35
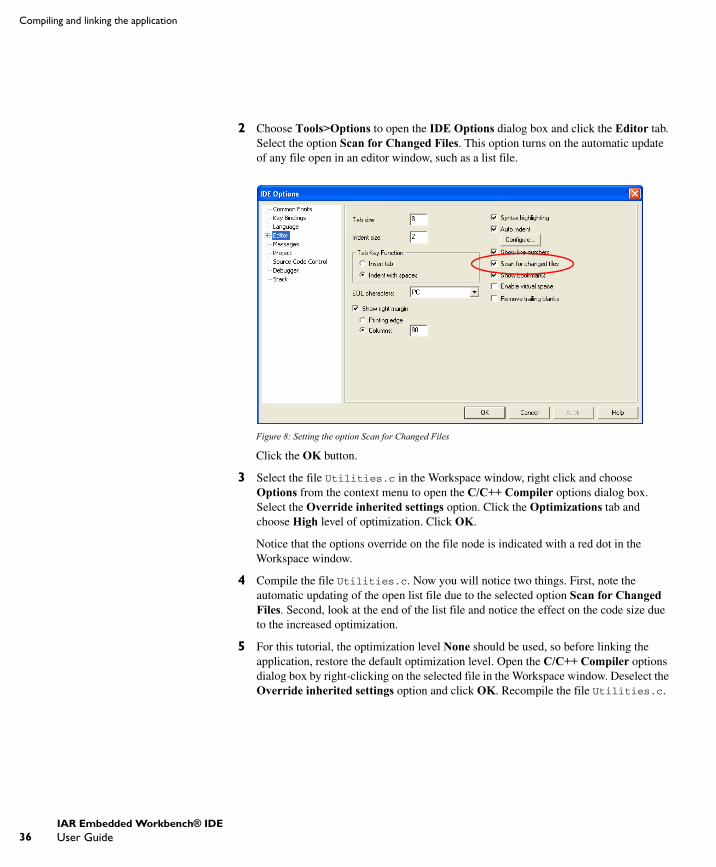
36
Compiling and linking the application
2 Choose Tools>Options to open the IDE Options dialog box and click the Editor tab. Select the option Scan for Changed Files. This option turns on the automatic update of any file open in an editor window, such as a list file.
Figure 8: Setting the option Scan for Changed Files
Click the OK button.
3 Select the file Utilities.c in the Workspace window, right click and choose Options from the context menu to open the C/C++ Compiler options dialog box. Select the Override inherited settings option. Click the Optimizations tab and choose High level of optimization. Click OK.
Notice that the options override on the file node is indicated with a red dot in the Workspace window.
4 Compile the file Utilities.c. Now you will notice two things. First, note the automatic updating of the open list file due to the selected option Scan for Changed Files. Second, look at the end of the list file and notice the effect on the code size due to the increased optimization.
5 For this tutorial, the optimization level None should be used, so before linking the application, restore the default optimization level. Open the C/C++ Compiler options dialog box by right-clicking on the selected file in the Workspace window. Deselect the Override inherited settings option and click OK. Recompile the file Utilities.c.
UEW-8:1
IAR Embedded Workbench® IDEUser Guide
Creating an application project
LINKING THE APPLICATION
Now you should set up the options for the IAR XLINK Linker.
1 Select the project folder icon project1 - Debug in the Workspace window and choose Project>Options, or right click and choose Options from the context menu. Then select Linker in the Category list to display the linker option pages.
For this tutorial, default factory settings are used. However, pay attention to the choice of output format and linker command file.
Output format
It is important to choose the output format that suits your purpose. You might want to load it to a debugger—which means that you need output with debug information. In this tutorial you will use the default output options suitable for C-SPY—Debug information for C-SPY, With runtime control modules, and With I/O emulation modules—which means that some low-level routines will be linked that direct stdin and stdout to the Terminal I/O window in the C-SPY Debugger. You find these options on the Output page.
Alternatively, in your real application project, you might want to load the output to a PROM programmer—in which case you need an output format without debug information, such as Intel-hex or Motorola S-records.
Linker command file
In the linker command file (filename extension xcl), the XLINK command line options for segment control are used for placing segments. It is important to be familiar with the linker command file and placement of segments. Read more about this in the IAR C/C++ Compiler Reference Guide.
Note: In the simulator, you can use the linker command file templates supplied with the product as they are, but when you use them for your target system you might have to adapt them to your actual hardware memory layout. You can find supplied linker command files in the config directory.
In this tutorial you will use the default linker command file, which you can see on the Config page.
If you want to examine the linker command file, use a suitable text editor, such as the IAR Embedded Workbench editor, or print a copy of the file, and verify that the definitions match your requirements.
Linker map file
By default, no linker map file is generated. To generate a linker map file, click the List tab and select the options Generate linker listing, Segment map, and Module map.
UEW-8:1
Part 2. Tutorials 37
38
Compiling and linking the application
2 Click OK to save the linker options.
Now you should link the object file, to generate code that can be debugged.
3 Choose Project>Make. The progress will as usual be displayed in the Build messages window. The result of the linking is a code file project1.dxx with debug information located in the Debug\Exe directory and a map file project1.map located in the Debug\List directory.
VIEWING THE MAP FILE
Examine the file project1.map to see how the segment definitions and code were placed in memory. These are the main points of interest in a map file:
● The header includes the options used for linking.
● The CROSS REFERENCE section shows the address of the program entry.
● The RUNTIME MODEL section shows the runtime model attributes that are used.
● The MODULE MAP shows the files that are linked. For each file, information about the modules that were loaded as part of your application, including segments and global symbols declared within each segment, is displayed.
● The SEGMENTS IN ADDRESS ORDER section lists all the segments that constitute your application.
The project1.dxx application is now ready to be run in C-SPY.
UEW-8:1
IAR Embedded Workbench® IDEUser Guide
Debugging using the IAR C-SPY® Debugger This chapter continues the development cycle started in the previous chapter and explores the basic features of C-SPY.
Note that, depending on what IAR Systems product package you have installed, C-SPY might or might not be included. The tutorials assume that you are using the C-SPY Simulator.
For a short overview of all tutorials and their related files, see Tutorials overview, page 25.
Debugging the applicationThe project1.dxx application, created in the previous chapter, is now ready to be run in C-SPY where you can watch variables, set breakpoints, view code in disassembly mode, monitor registers and memory, and print the program output in the Terminal I/O window, etc.
STARTING THE DEBUGGER
Before starting C-SPY, you must set a few options.
1 Choose Project>Options and then the Debugger category. On the Setup page, make sure that you have chosen Simulator from the Driver drop-down list and that Run to main is selected. Click OK.
2 Choose Project>Download and Debug. Alternatively, click the Download and Debug button in the toolbar. C-SPY starts with the project1.dxx application loaded. In addition to the windows already opened in the IDE, a set of C-SPY-specific windows are now available.
ORGANIZING THE WINDOWS
In the IDE, you can dock windows at specific places, and organize them in tab groups. You can also make a window floating, which means it is always on top of other windows. If you change the size or position of a floating window, other currently open windows are not affected.
UEW-8:1
Part 2. Tutorials 39
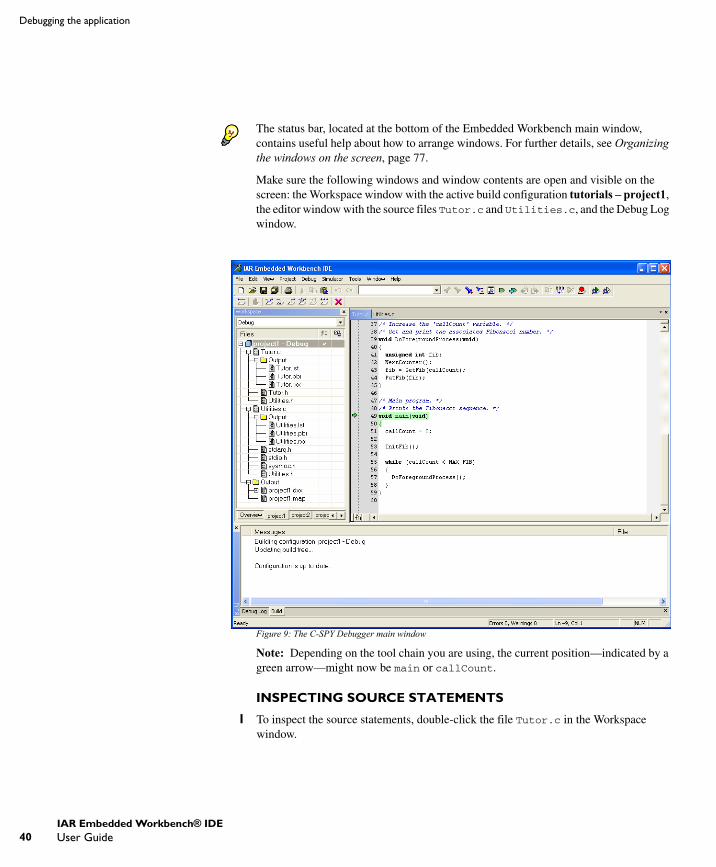
40
Debugging the application
The status bar, located at the bottom of the Embedded Workbench main window, contains useful help about how to arrange windows. For further details, see Organizing the windows on the screen, page 77.
Make sure the following windows and window contents are open and visible on the screen: the Workspace window with the active build configuration tutorials – project1, the editor window with the source files Tutor.c and Utilities.c, and the Debug Log window.
Figure 9: The C-SPY Debugger main window
Note: Depending on the tool chain you are using, the current position—indicated by a green arrow—might now be main or callCount.
INSPECTING SOURCE STATEMENTS
1 To inspect the source statements, double-click the file Tutor.c in the Workspace window.
UEW-8:1
IAR Embedded Workbench® IDEUser Guide

Debugging using the IAR C-SPY® Debugger
2 With the file Tutor.c displayed in the editor window, first step over with the Debug>Step Over command.
Alternatively, click the Step Over button on the toolbar.
Step until the call to the InitFib function.
Figure 10: Stepping in C-SPY
3 Choose Debug>Step Into to step into the function InitFib.
Alternatively, click the Step Into button on the toolbar.
At source level, the Step Over and Step Into commands allow you to execute your application a statement at a time. Step Into continues stepping inside function or subroutine calls, whereas Step Over executes each function call in a single step. For further details, see Step, page 120.
When Step Into is executed you will notice that the active window changes to Utilities.c as the function InitFib is located in this file.
UEW-8:1
Part 2. Tutorials 41

42
Debugging the application
4 Use the Step Into command until you reach the for loop.
Figure 11: Using Step Into in C-SPY
5 Use Step Over until you are back in the header of the for loop. Notice that the step points are on a function call level, not on a statement level.
You can also step on a statement level. Choose Debug>Next statement to execute one statement at a time. Alternatively, click the Next statement button on the toolbar.
Notice how this command differs from the Step Over and the Step Into commands.
6 Debugging with C-SPY is usually quicker and more straightforward in C/C++ source mode. However, if you want to have full control over low-level routines, you can debug in disassembly mode where each step corresponds to one assembler instruction. C-SPY lets you switch freely between the two modes.
Choose View>Disassembly to open the Disassembly window, if it is not already open.You will see the assembler code corresponding to the current C statement.
Try the step commands also in the Disassembly window.
INSPECTING VARIABLES
C-SPY allows you to watch variables or expressions in the source code, so that you can keep track of their values as you execute your application. You can look at a variable in several ways. For example, point at it in the source window with the mouse pointer, or open one of the Auto, Locals, Live Watch, Statics, or Watch windows. In this tutorial, we will look into some of these methods. For more information about inspecting variables, see the chapter Working with variables and expressions.
Note: When optimization level None is used, all non-static variables will live during their entire scope and thus, the variables are fully debuggable. When higher levels of optimizations are used, variables might not be fully debuggable.
UEW-8:1
IAR Embedded Workbench® IDEUser Guide

Debugging using the IAR C-SPY® Debugger
Using the Auto window
1 Choose View>Auto to open the Auto window.
The Auto window will show the current value of recently modified expressions.
Figure 12: Inspecting variables in the Auto window
2 Keep stepping to see how the values change.
Setting a watchpoint
Next you will use the Watch window to inspect variables.
3 Choose View>Watch to open the Watch window. Notice that it is, by default, grouped together with the currently open Auto window; the windows are located as a tab group.
4 Set a watchpoint on the variable i using this procedure: Click the dotted rectangle in the Watch window. In the entry field that appears, type i and press the Enter key.
You can also drag a variable from the editor window to the Watch window.
5 Select the Fib array in the InitFib function, then drag it to the Watch window.
UEW-8:1
Part 2. Tutorials 43
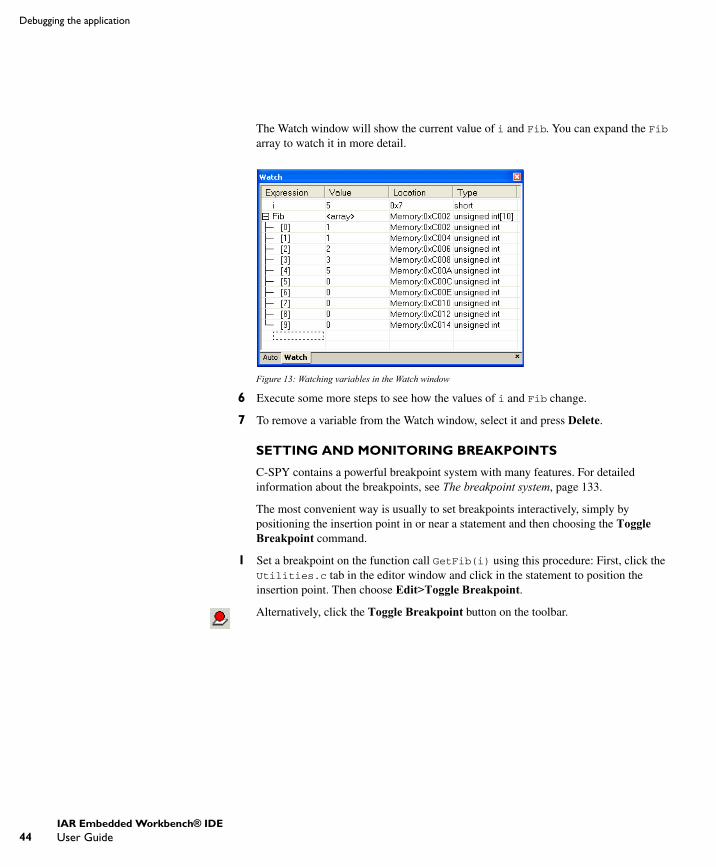
44
Debugging the application
The Watch window will show the current value of i and Fib. You can expand the Fib array to watch it in more detail.
Figure 13: Watching variables in the Watch window
6 Execute some more steps to see how the values of i and Fib change.
7 To remove a variable from the Watch window, select it and press Delete.
SETTING AND MONITORING BREAKPOINTS
C-SPY contains a powerful breakpoint system with many features. For detailed information about the breakpoints, see The breakpoint system, page 133.
The most convenient way is usually to set breakpoints interactively, simply by positioning the insertion point in or near a statement and then choosing the Toggle Breakpoint command.
1 Set a breakpoint on the function call GetFib(i) using this procedure: First, click the Utilities.c tab in the editor window and click in the statement to position the insertion point. Then choose Edit>Toggle Breakpoint.
Alternatively, click the Toggle Breakpoint button on the toolbar.
UEW-8:1
IAR Embedded Workbench® IDEUser Guide

Debugging using the IAR C-SPY® Debugger
A breakpoint will be set at this function call. The function call will be highlighted and there will be a red dot in the margin to show that there is a breakpoint there.
Figure 14: Setting breakpoints
To view all defined breakpoints, choose View>Breakpoints to open the Breakpoints window. You can find information about the breakpoint execution in the Debug Log window.
Executing up to a breakpoint
2 To execute your application until it reaches the breakpoint, choose Debug>Go.
Alternatively, click the Go button on the toolbar.
The application will execute up to the breakpoint you set. The Watch window will display the value of the Fib expression and the Debug Log window will contain information about the breakpoint.
3 Select the breakpoint, right click and choose Toggle Breakpoint (Code) from the context menu, alternatively choose Toggle Breakpoint from the Edit menu to remove the breakpoint.
UEW-8:1
Part 2. Tutorials 45
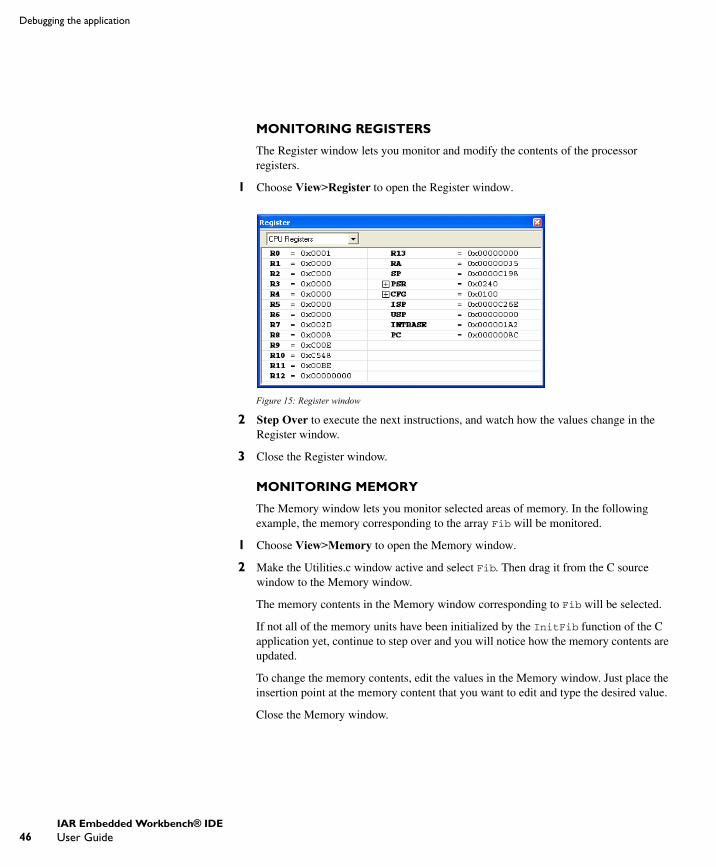
46
Debugging the application
MONITORING REGISTERS
The Register window lets you monitor and modify the contents of the processor registers.
1 Choose View>Register to open the Register window.
Figure 15: Register window
2 Step Over to execute the next instructions, and watch how the values change in the Register window.
3 Close the Register window.
MONITORING MEMORY
The Memory window lets you monitor selected areas of memory. In the following example, the memory corresponding to the array Fib will be monitored.
1 Choose View>Memory to open the Memory window.
2 Make the Utilities.c window active and select Fib. Then drag it from the C source window to the Memory window.
The memory contents in the Memory window corresponding to Fib will be selected.
If not all of the memory units have been initialized by the InitFib function of the C application yet, continue to step over and you will notice how the memory contents are updated.
To change the memory contents, edit the values in the Memory window. Just place the insertion point at the memory content that you want to edit and type the desired value.
Close the Memory window.
UEW-8:1
IAR Embedded Workbench® IDEUser Guide
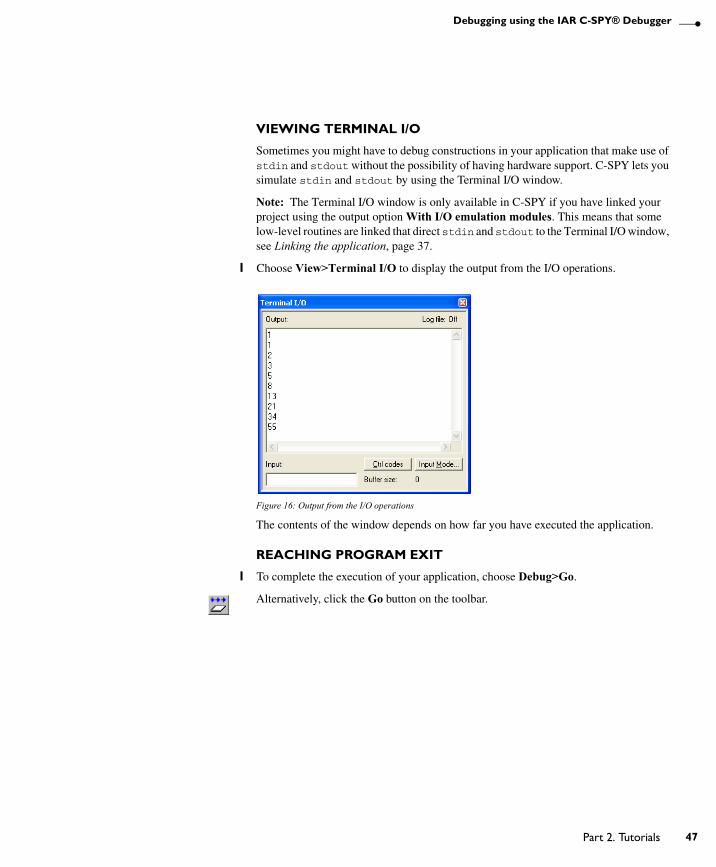
Debugging using the IAR C-SPY® Debugger
VIEWING TERMINAL I/O
Sometimes you might have to debug constructions in your application that make use of stdin and stdout without the possibility of having hardware support. C-SPY lets you simulate stdin and stdout by using the Terminal I/O window.
Note: The Terminal I/O window is only available in C-SPY if you have linked your project using the output option With I/O emulation modules. This means that some low-level routines are linked that direct stdin and stdout to the Terminal I/O window, see Linking the application, page 37.
1 Choose View>Terminal I/O to display the output from the I/O operations.
Figure 16: Output from the I/O operations
The contents of the window depends on how far you have executed the application.
REACHING PROGRAM EXIT
1 To complete the execution of your application, choose Debug>Go.
Alternatively, click the Go button on the toolbar.
UEW-8:1
Part 2. Tutorials 47
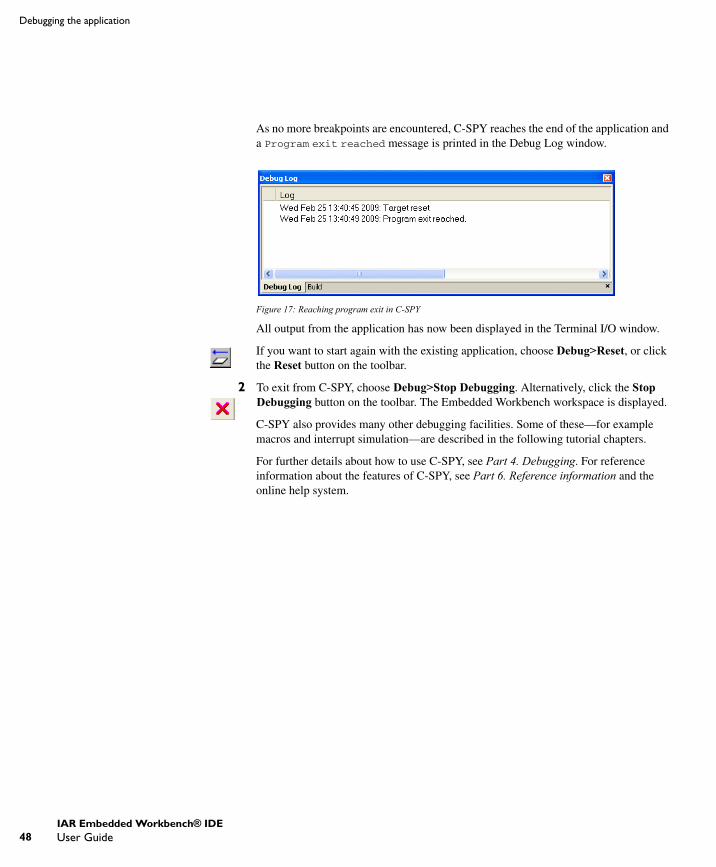
48
Debugging the application
As no more breakpoints are encountered, C-SPY reaches the end of the application and a Program exit reached message is printed in the Debug Log window.
Figure 17: Reaching program exit in C-SPY
All output from the application has now been displayed in the Terminal I/O window.
If you want to start again with the existing application, choose Debug>Reset, or click the Reset button on the toolbar.
2 To exit from C-SPY, choose Debug>Stop Debugging. Alternatively, click the Stop Debugging button on the toolbar. The Embedded Workbench workspace is displayed.
C-SPY also provides many other debugging facilities. Some of these—for example macros and interrupt simulation—are described in the following tutorial chapters.
For further details about how to use C-SPY, see Part 4. Debugging. For reference information about the features of C-SPY, see Part 6. Reference information and the online help system.
UEW-8:1
IAR Embedded Workbench® IDEUser Guide
Mixing C and assembler modulesIn some projects it might be necessary to write certain pieces of source code in assembler language. The chapter first demonstrates how the compiler can be helpful in examining the calling convention, which you must be familiar with when calling assembler modules from C/C++ modules or vice versa. Furthermore, this chapter demonstrates how you can easily combine source modules written in C with assembler modules, but the procedure is applicable to projects containing source modules written in C++, too, if your product version supports C++.
This tutorial assumes that you are familiar with the basics of the IAR Embedded Workbench® IDE described in the previous tutorial chapters.
For a short overview of all tutorials and their related files, see Tutorials overview, page 25.
Examining the calling conventionWhen you write an assembler routine that is called from a C routine, you must be aware of the calling convention that the compiler uses. If you create skeleton code in C and let the compiler produce an assembler output file from it, you can study the produced assembler output file and find the details of the calling convention.
In this example you will make the compiler create an assembler output file from the file Utilities.c.
1 Create a new project in the same workspace tutorials as used in the previous tutorial project, and name the project project2.
2 Add the files Tutor.c and Utilities.c to the project.
To display an overview of the workspace, click the Overview tab available at the bottom of the Workspace window. To view only the newly created project, click the project2 tab. For now, the project2 view should be visible.
3 To set options, choose Project>Options, and select the General Options category. On project level, default factory settings should be used in this tutorial. Click OK.
UEW-8:1
Part 2. Tutorials 49
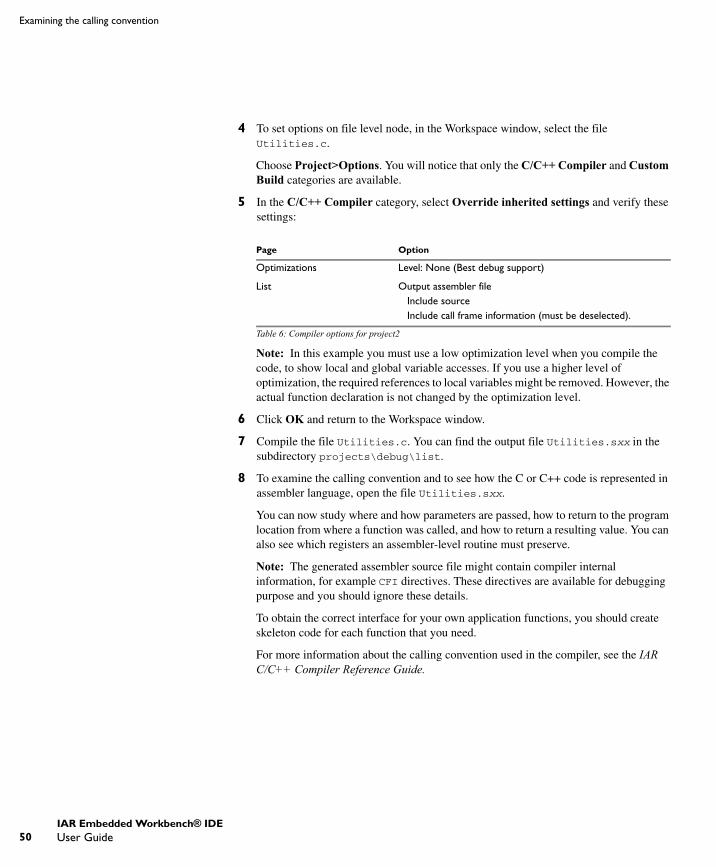
50
Examining the calling convention
4 To set options on file level node, in the Workspace window, select the file Utilities.c.
Choose Project>Options. You will notice that only the C/C++ Compiler and Custom Build categories are available.
5 In the C/C++ Compiler category, select Override inherited settings and verify these settings:
Note: In this example you must use a low optimization level when you compile the code, to show local and global variable accesses. If you use a higher level of optimization, the required references to local variables might be removed. However, the actual function declaration is not changed by the optimization level.
6 Click OK and return to the Workspace window.
7 Compile the file Utilities.c. You can find the output file Utilities.sxx in the subdirectory projects\debug\list.
8 To examine the calling convention and to see how the C or C++ code is represented in assembler language, open the file Utilities.sxx.
You can now study where and how parameters are passed, how to return to the program location from where a function was called, and how to return a resulting value. You can also see which registers an assembler-level routine must preserve.
Note: The generated assembler source file might contain compiler internal information, for example CFI directives. These directives are available for debugging purpose and you should ignore these details.
To obtain the correct interface for your own application functions, you should create skeleton code for each function that you need.
For more information about the calling convention used in the compiler, see the IAR C/C++ Compiler Reference Guide.
Page Option
Optimizations Level: None (Best debug support)
List Output assembler file Include source Include call frame information (must be deselected).
Table 6: Compiler options for project2
UEW-8:1
IAR Embedded Workbench® IDEUser Guide
Mixing C and assembler modules
Adding an assembler module to the projectThis tutorial demonstrates how you can easily create a project containing both assembler modules and C modules. You will also compile the project and view the assembler output list file.
SETTING UP THE PROJECT
1 Modify project2 by adding the Utilities.sxx file that you just created and removing the Utilities.c file.
Note: To view assembler files in the Add files dialog box, choose Project>Add Files and choose Assembler Files from the Files of type drop-down list.
2 Select the project level node in the Workspace window, choose Project>Options. Use the default settings in the General Options, C/C++ Compiler, and Linker categories. Select the Assembler category, click the List tab, and select the option Output list file
Click OK.
3 Select the file Utilities.sxx in the Workspace window and choose Project>Compile to assemble it.
Assuming that the source file was assembled successfully, the file Utilities.rxx is created, containing the linkable object code.
Viewing the assembler list file
4 Open the list file by double-clicking the file Utilities.lst available in the Output folder icon in the Workspace window.
The end of the file contains a summary of errors and warnings that were generated.
For further details of the list file format, see the IAR Assembler Reference Guide.
5 Choose Project>Make to relink project2.
6 Start C-SPY to run the project2.dxx application and see that it behaves like the application in the previous tutorial.
Exit the debugger when you are done.
UEW-8:1
Part 2. Tutorials 51

52
Adding an assembler module to the project
UEW-8:1
IAR Embedded Workbench® IDEUser Guide

Using C++In this chapter, C++ is used to create a C++ class. The class is then used for creating two independent objects, and the application is built and debugged. We also show an example of how to set a conditional breakpoint.
This tutorial assumes that you are familiar with the basics of the IAR Embedded Workbench® IDE described in the previous tutorial chapters.
Note that, depending on what IAR Systems product package you have installed, support for C++ might or might not be included. This tutorial assumes that the product supports C++.
For a short overview of all tutorials and their related files, see Tutorials overview, page 25.
Creating a C++ applicationThis tutorial demonstrates how to use the C++ features. The tutorial consists of two files:
● Fibonacci.h and Fibonacci.cpp define a class Fibonacci that can be used to extract a series of Fibonacci numbers
● CppTutor.cpp creates two objects, fib1 and fib2, from the class Fibonacci and extracts two sequences of Fibonacci numbers using the Fibonacci class.
To demonstrate that the two objects are independent of each other, the numbers are extracted at different speeds. A number is extracted from fib1 each turn in the loop while a number is extracted from fib2 only every second turn.
The object fib1 is created using the default constructor while the definition of fib2 uses the constructor that takes an integer as its argument.
COMPILING AND LINKING THE C++ APPLICATION
1 In the workspace tutorials used in the previous chapters, create a new project, project3.
2 Add the files Fibonacci.cpp and CppTutor.cpp to project3.
3 Choose Project>Options and make sure default factory settings are used.
UEW-8:1
Part 2. Tutorials 53
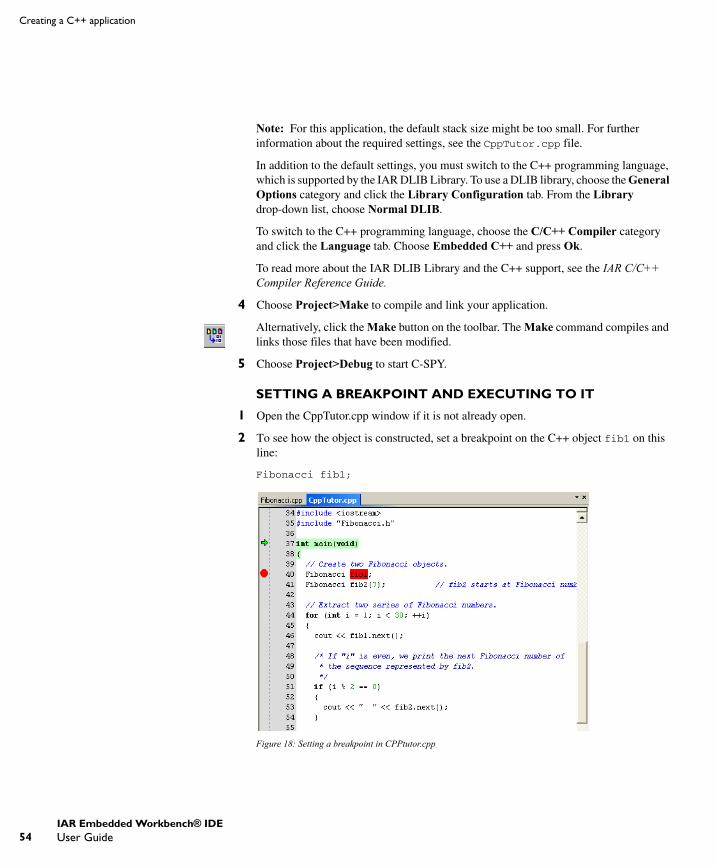
54
Creating a C++ application
Note: For this application, the default stack size might be too small. For further information about the required settings, see the CppTutor.cpp file.
In addition to the default settings, you must switch to the C++ programming language, which is supported by the IAR DLIB Library. To use a DLIB library, choose the General Options category and click the Library Configuration tab. From the Library drop-down list, choose Normal DLIB.
To switch to the C++ programming language, choose the C/C++ Compiler category and click the Language tab. Choose Embedded C++ and press Ok.
To read more about the IAR DLIB Library and the C++ support, see the IAR C/C++ Compiler Reference Guide.
4 Choose Project>Make to compile and link your application.
Alternatively, click the Make button on the toolbar. The Make command compiles and links those files that have been modified.
5 Choose Project>Debug to start C-SPY.
SETTING A BREAKPOINT AND EXECUTING TO IT
1 Open the CppTutor.cpp window if it is not already open.
2 To see how the object is constructed, set a breakpoint on the C++ object fib1 on this line:
Fibonacci fib1;
Figure 18: Setting a breakpoint in CPPtutor.cpp
UEW-8:1
IAR Embedded Workbench® IDEUser Guide
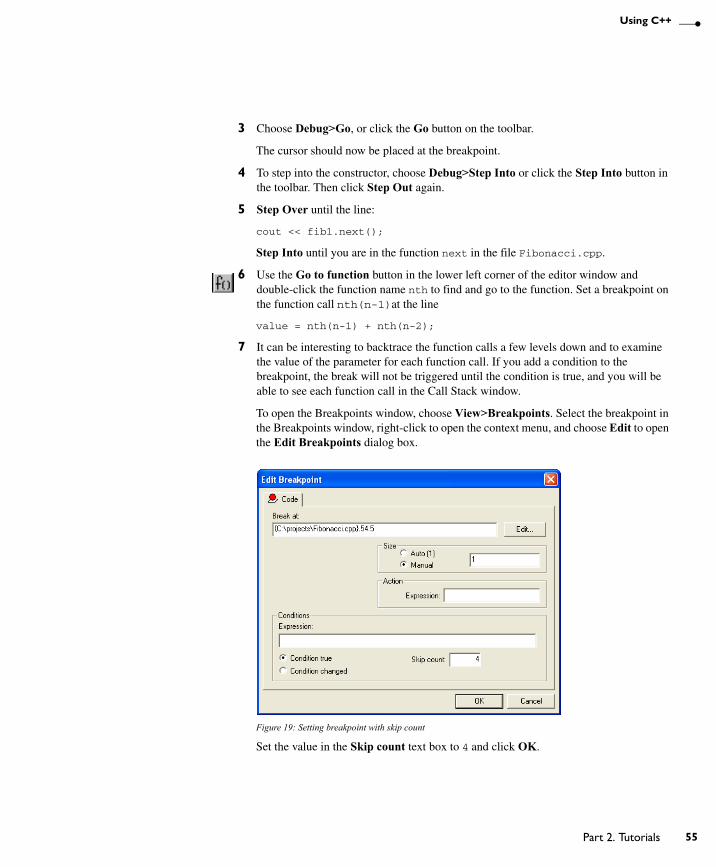
Using C++
3 Choose Debug>Go, or click the Go button on the toolbar.
The cursor should now be placed at the breakpoint.
4 To step into the constructor, choose Debug>Step Into or click the Step Into button in the toolbar. Then click Step Out again.
5 Step Over until the line:
cout << fib1.next();
Step Into until you are in the function next in the file Fibonacci.cpp.
6 Use the Go to function button in the lower left corner of the editor window and double-click the function name nth to find and go to the function. Set a breakpoint on the function call nth(n-1)at the line
value = nth(n-1) + nth(n-2);
7 It can be interesting to backtrace the function calls a few levels down and to examine the value of the parameter for each function call. If you add a condition to the breakpoint, the break will not be triggered until the condition is true, and you will be able to see each function call in the Call Stack window.
To open the Breakpoints window, choose View>Breakpoints. Select the breakpoint in the Breakpoints window, right-click to open the context menu, and choose Edit to open the Edit Breakpoints dialog box.
Figure 19: Setting breakpoint with skip count
Set the value in the Skip count text box to 4 and click OK.
UEW-8:1
Part 2. Tutorials 55

56
Creating a C++ application
Looking at the function calls
8 Choose Debug>Go to execute the application until the breakpoint condition is fulfilled.
9 When C-SPY stops at the breakpoint, choose View>Call Stack to open the Call Stack window.
Figure 20: Inspecting the function calls
Five instances of the function nth are displayed on the call stack. Because the Call Stack window displays the values of the function parameters, you can see the different values of n in the different function instances.
You can also open the Register window to see how it is updated as you trace the function calls by double-clicking on the function instances.
PRINTING THE FIBONACCI NUMBERS
1 Open the Terminal I/O window from the View menu.
UEW-8:1
IAR Embedded Workbench® IDEUser Guide
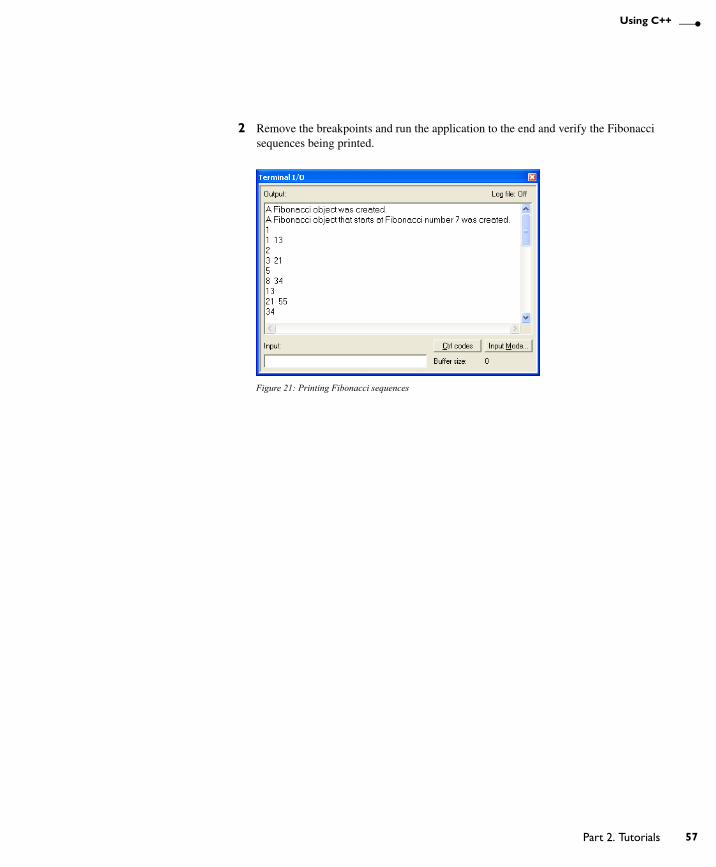
Using C++
2 Remove the breakpoints and run the application to the end and verify the Fibonacci sequences being printed.
Figure 21: Printing Fibonacci sequences
UEW-8:1
Part 2. Tutorials 57

58
Creating a C++ application
UEW-8:1
IAR Embedded Workbench® IDEUser Guide
Simulating an interruptIn this tutorial an interrupt handler for a serial port is added to the project. The Fibonacci numbers are read from an on-chip communication peripheral device (UART).
This tutorial will show how the compiler interrupt keyword and the #pragma vector directive can be used. The tutorial will also show how to simulate an interrupt, using the features that support interrupts, breakpoints, and macros. Notice that this example does not describe an exact simulation; the purpose is to illustrate a situation where C-SPY® macros, breakpoints, and the interrupt system can be useful to simulate hardware.
This tutorial assumes that you are familiar with the basics of the IAR Embedded Workbench® IDE described in the previous tutorial chapters.
Note that interrupt simulation is possible only when you are using the IAR C-SPY Simulator.
For a short overview of all tutorials and their related files, see Tutorials overview, page 25.
Adding an interrupt handlerThis section will demonstrate how to write an interrupt in an easy way. It starts with a brief description of the application used in this project, followed by a description of how to set up the project.
THE APPLICATION—A BRIEF DESCRIPTION
The interrupt handler will read values from the serial communication port receive register (UART), RBUF. It will then print the value. The main program enables interrupts and starts printing periods (.) in the foreground process while waiting for interrupts.
Note: In this tutorial, the serial communication port UART and the receive buffer register RBUF are symbolic names. To follow this tutorial and simulate the interrupt in the C-SPY Simulator, you should instead use names that are suitable for your target system. See the Interrupt.c file in the cpuname\tutor directory.
UEW-8:1
Part 2. Tutorials 59
60
Setting up the simulation environment
WRITING AN INTERRUPT HANDLER
The following lines define the interrupt handler used in this tutorial (the complete source code can be found in the file Interrupt.c in project4 supplied in the cpuname\tutor directory):
/* Defines an interrupt handler. */#pragma vector=UARTR_VECTOR__interrupt __root void UartReceiveHandler( void )
The #pragma vector directive is used for specifying the interrupt vector address—in this case the interrupt vector for the UART receive interrupt—and the keyword __interrupt is used for directing the compiler to use the calling convention needed for an interrupt function.
Note: In this tutorial, the name of the vector is symbolic. To follow this tutorial and simulate the interrupt in the C-SPY Simulator, you should instead use a name that is suitable for your target system. See the Interrupt.c file in the cpuname\tutor directory.
For detailed information about the extended keywords and pragma directives used in this tutorial, see the IAR C/C++ Compiler Reference Guide.
SETTING UP THE PROJECT
1 Add a new project—project4—to the workspace tutorials used in previous tutorials.
2 Add the files Utilities.c and Interrupt.c to it.
3 In the Workspace window, select the project level node and choose Project>Options. Make sure default factory settings are used in the General Options, C/C++ Compiler, and Linker categories.
Note: The file Interrupt.c might specify any specific settings required.
Next you will set up the simulation environment.
Setting up the simulation environment The C-SPY interrupt system is based on the cycle counter. You can specify the amount of cycles to pass before C-SPY generates an interrupt.
To simulate the input to UART, values are read from the file InputData.txt, which contains the Fibonacci series. You will set an immediate read breakpoint on the UART receive register, RBUF, and connect a user-defined macro function to it (in this example the Access macro function). The macro reads the Fibonacci values from the text file.
UEW-8:1
IAR Embedded Workbench® IDEUser Guide
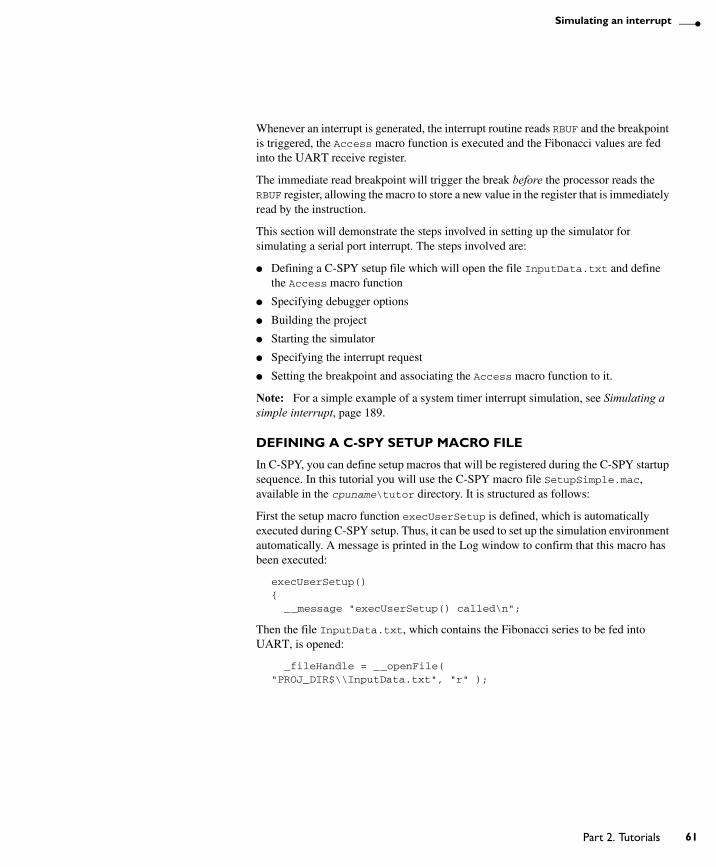
Simulating an interrupt
Whenever an interrupt is generated, the interrupt routine reads RBUF and the breakpoint is triggered, the Access macro function is executed and the Fibonacci values are fed into the UART receive register.
The immediate read breakpoint will trigger the break before the processor reads the RBUF register, allowing the macro to store a new value in the register that is immediately read by the instruction.
This section will demonstrate the steps involved in setting up the simulator for simulating a serial port interrupt. The steps involved are:
● Defining a C-SPY setup file which will open the file InputData.txt and define the Access macro function
● Specifying debugger options
● Building the project
● Starting the simulator
● Specifying the interrupt request
● Setting the breakpoint and associating the Access macro function to it.
Note: For a simple example of a system timer interrupt simulation, see Simulating a simple interrupt, page 189.
DEFINING A C-SPY SETUP MACRO FILE
In C-SPY, you can define setup macros that will be registered during the C-SPY startup sequence. In this tutorial you will use the C-SPY macro file SetupSimple.mac, available in the cpuname\tutor directory. It is structured as follows:
First the setup macro function execUserSetup is defined, which is automatically executed during C-SPY setup. Thus, it can be used to set up the simulation environment automatically. A message is printed in the Log window to confirm that this macro has been executed:
execUserSetup(){ __message "execUserSetup() called\n";
Then the file InputData.txt, which contains the Fibonacci series to be fed into UART, is opened:
_fileHandle = __openFile( "PROJ_DIR$\\InputData.txt", "r" );
UEW-8:1
Part 2. Tutorials 61

62
Setting up the simulation environment
After that, the macro function Access is defined. It will read the Fibonacci values from the file InputData.txt, and assign them to the receive register address:
Access(){ __message "Access() called\n"; __var _fibValue; if( 0 == __readFile( _fileHandle, &_fibValue ) ) { RBUF = _fibValue; }}
You must connect the Access macro to an immediate read breakpoint. However, this will be done at a later stage in this tutorial.
Finally, the file contains two macro functions for managing correct file handling at reset and exit.
For detailed information about macros, see the chapters Using the C-SPY® macro system and C-SPY® macros reference.
Next you will specify the macro file and set the other debugger options needed.
SETTING C-SPY OPTIONS
1 To set debugger options, choose Project>Options. In the Debugger category, click the Setup tab.
2 Use the Use macro file browse button to specify the macro file to be used:
SetupSimple.mac
UEW-8:1
IAR Embedded Workbench® IDEUser Guide
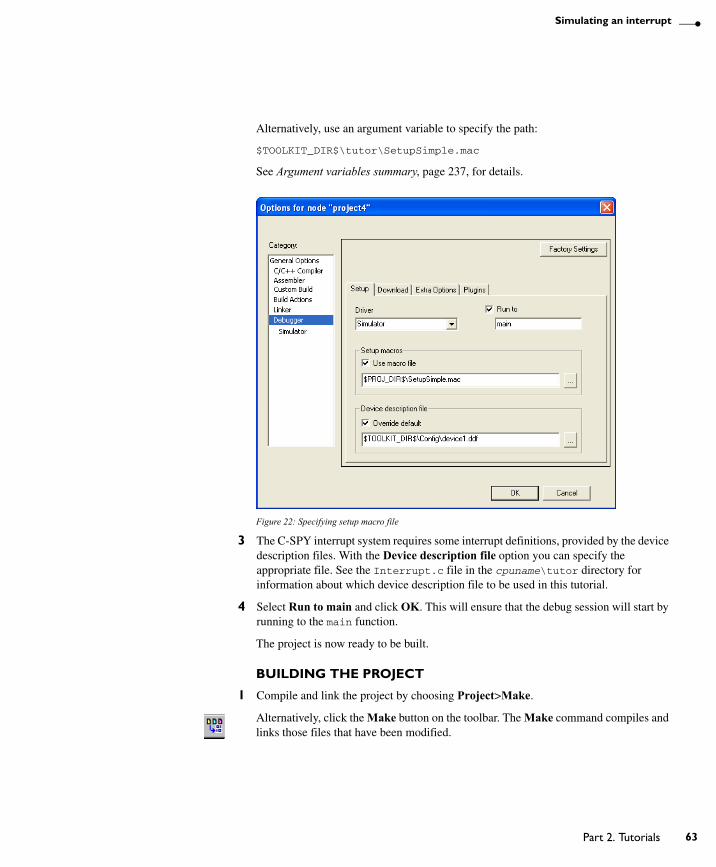
Simulating an interrupt
Alternatively, use an argument variable to specify the path:
$TOOLKIT_DIR$\tutor\SetupSimple.mac
See Argument variables summary, page 237, for details.
Figure 22: Specifying setup macro file
3 The C-SPY interrupt system requires some interrupt definitions, provided by the device description files. With the Device description file option you can specify the appropriate file. See the Interrupt.c file in the cpuname\tutor directory for information about which device description file to be used in this tutorial.
4 Select Run to main and click OK. This will ensure that the debug session will start by running to the main function.
The project is now ready to be built.
BUILDING THE PROJECT
1 Compile and link the project by choosing Project>Make.
Alternatively, click the Make button on the toolbar. The Make command compiles and links those files that have been modified.
UEW-8:1
Part 2. Tutorials 63
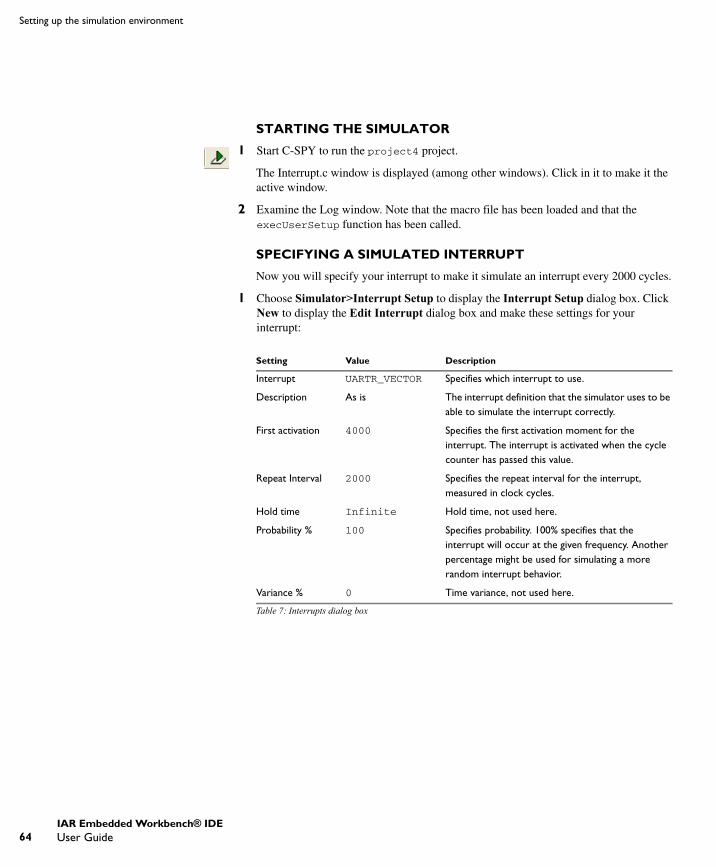
64
Setting up the simulation environment
STARTING THE SIMULATOR
1 Start C-SPY to run the project4 project.
The Interrupt.c window is displayed (among other windows). Click in it to make it the active window.
2 Examine the Log window. Note that the macro file has been loaded and that the execUserSetup function has been called.
SPECIFYING A SIMULATED INTERRUPT
Now you will specify your interrupt to make it simulate an interrupt every 2000 cycles.
1 Choose Simulator>Interrupt Setup to display the Interrupt Setup dialog box. Click New to display the Edit Interrupt dialog box and make these settings for your interrupt:
Setting Value Description
Interrupt UARTR_VECTOR Specifies which interrupt to use.
Description As is The interrupt definition that the simulator uses to be able to simulate the interrupt correctly.
First activation 4000 Specifies the first activation moment for the interrupt. The interrupt is activated when the cycle counter has passed this value.
Repeat Interval 2000 Specifies the repeat interval for the interrupt, measured in clock cycles.
Hold time Infinite Hold time, not used here.
Probability % 100 Specifies probability. 100% specifies that the interrupt will occur at the given frequency. Another percentage might be used for simulating a more random interrupt behavior.
Variance % 0 Time variance, not used here.
Table 7: Interrupts dialog box
UEW-8:1
IAR Embedded Workbench® IDEUser Guide
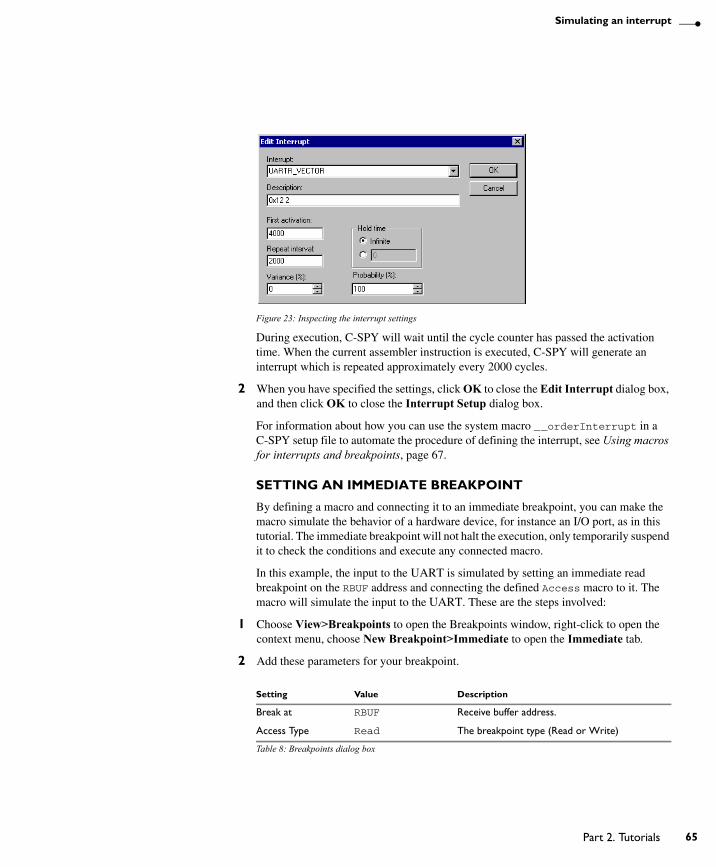
Simulating an interrupt
Figure 23: Inspecting the interrupt settings
During execution, C-SPY will wait until the cycle counter has passed the activation time. When the current assembler instruction is executed, C-SPY will generate an interrupt which is repeated approximately every 2000 cycles.
2 When you have specified the settings, click OK to close the Edit Interrupt dialog box, and then click OK to close the Interrupt Setup dialog box.
For information about how you can use the system macro __orderInterrupt in a C-SPY setup file to automate the procedure of defining the interrupt, see Using macros for interrupts and breakpoints, page 67.
SETTING AN IMMEDIATE BREAKPOINT
By defining a macro and connecting it to an immediate breakpoint, you can make the macro simulate the behavior of a hardware device, for instance an I/O port, as in this tutorial. The immediate breakpoint will not halt the execution, only temporarily suspend it to check the conditions and execute any connected macro.
In this example, the input to the UART is simulated by setting an immediate read breakpoint on the RBUF address and connecting the defined Access macro to it. The macro will simulate the input to the UART. These are the steps involved:
1 Choose View>Breakpoints to open the Breakpoints window, right-click to open the context menu, choose New Breakpoint>Immediate to open the Immediate tab.
2 Add these parameters for your breakpoint.
Setting Value Description
Break at RBUF Receive buffer address.
Access Type Read The breakpoint type (Read or Write)
Table 8: Breakpoints dialog box
UEW-8:1
Part 2. Tutorials 65
66
Simulating the interrupt
During execution, when C-SPY detects a read access from the RBUF address, C-SPY will temporarily suspend the simulation and execute the Access macro. The macro will read a value from the file InputData.txt and write it to RBUF. C-SPY will then resume the simulation by reading the receive buffer value in RBUF.
3 Click OK to close the breakpoints dialog box.
For information about how you can use the system macro __setSimBreak in a C-SPY setup file to automate the breakpoint setting, see Using macros for interrupts and breakpoints, page 67.
Simulating the interruptIn this section you will execute your application and simulate the serial port interrupt.
EXECUTING THE APPLICATION
1 In the Interrupt.c source window, step through the application and stop when it reaches the while loop, where the application waits for input.
2 In the Interrupt.c source window, locate the function UartReceiveHandler.
3 Place the insertion point on the ++callCount; statement in this function and set a breakpoint by choosing Edit>Toggle Breakpoint, or click the Toggle Breakpoint button on the toolbar. Alternatively, use the context menu.
If you want to inspect the details of the breakpoint, choose View>Breakpoints.
4 Open the Terminal I/O window and run your application by choosing Debug>Go or clicking the Go button on the toolbar.
The application should stop in the interrupt function.
5 Click Go again to see the next number being printed in the Terminal I/O window.
Because the main program has an upper limit on the Fibonacci value counter, the tutorial application will soon reach the exit label and stop.
Action Access() The macro connected to the breakpoint.
Setting Value Description
Table 8: Breakpoints dialog box (Continued)
UEW-8:1
IAR Embedded Workbench® IDEUser Guide
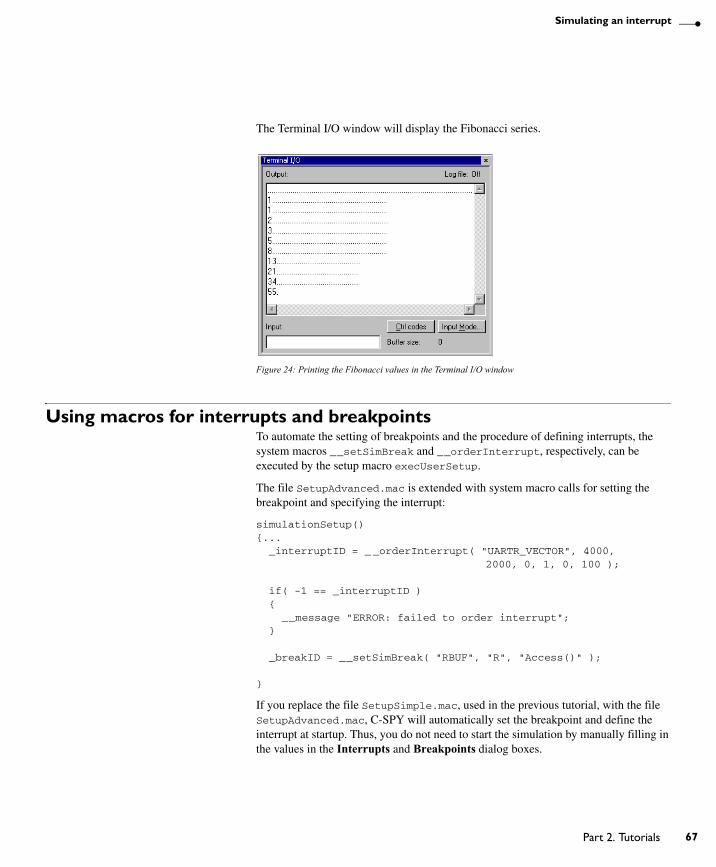
Simulating an interrupt
The Terminal I/O window will display the Fibonacci series.
Figure 24: Printing the Fibonacci values in the Terminal I/O window
Using macros for interrupts and breakpointsTo automate the setting of breakpoints and the procedure of defining interrupts, the system macros __setSimBreak and __orderInterrupt, respectively, can be executed by the setup macro execUserSetup.
The file SetupAdvanced.mac is extended with system macro calls for setting the breakpoint and specifying the interrupt:
simulationSetup(){... _interruptID = __orderInterrupt( "UARTR_VECTOR", 4000, 2000, 0, 1, 0, 100 );
if( -1 == _interruptID ) { __message "ERROR: failed to order interrupt"; }
_breakID = __setSimBreak( "RBUF", "R", "Access()" ); }
If you replace the file SetupSimple.mac, used in the previous tutorial, with the file SetupAdvanced.mac, C-SPY will automatically set the breakpoint and define the interrupt at startup. Thus, you do not need to start the simulation by manually filling in the values in the Interrupts and Breakpoints dialog boxes.
UEW-8:1
Part 2. Tutorials 67

68
Using macros for interrupts and breakpoints
Note: Before you load the file SetupAdvanced.mac you should remove the previously defined breakpoint and interrupt.
UEW-8:1
IAR Embedded Workbench® IDEUser Guide

Creating and using librariesThis tutorial demonstrates how to create a library project and how you can combine it with an application project.
This tutorial assumes that you are familiar with the basics of the IAR Embedded Workbench® IDE described in the previous tutorial chapters.
For a short overview of all tutorials and their related files, see Tutorials overview, page 25.
Using librariesIf you are working on a large project, you will soon accumulate a collection of useful modules that contain one or more routines to be used by several of your applications. To avoid having to assemble or compile a module each time it is needed, you can store such modules as object files, that is, assembled or compiled but not linked.
You can collect many modules in a single object file which then is referred to as a library. It is recommended that you use library files to create collections of related routines, such as a device driver.
Use the IAR XAR Library Builder to build libraries.
The Main.sxx program
The Main.sxx program uses a routine called max to set the contents of one register to the maximum value of two other registers. The EXTERN directive declares max as an external symbol, to be resolved at link time.
A copy of the program is provided in the cpuname\tutor directory.
The library routines
The two library routines will form a separately assembled library. It consists of the max routine called by main, and a corresponding min routine, both of which operate on the contents of the registers used in the Main.sxx program. The Maxmin.sxx file contains these library routines and a copy is provided in the cpuname\tutor directory.
UEW-8:1
Part 2. Tutorials 69
70
Using libraries
The routines are defined as library modules by the MODULE directive, which instructs the IAR XLINK Linker to include the modules only if they are referenced by another module.
The PUBLIC directive makes the max and min symbols public to other modules.
For detailed information about the MODULE and PUBLIC directives, see the IAR Assembler Reference Guide.
CREATING A NEW PROJECT
1 In the workspace tutorials used in previous chapters, add a new project called project5.
2 Add the file Main.sxx to the new project.
3 To set options, choose Project>Options. Select the General Options category and click the Library Configuration tab. Choose None from the Library drop-down list, which means that a standard C/C++ library will not be linked.
The default options are used for the other option categories.
4 To assemble the file Main.sxx, choose Project>Compile.
You can also click the Compile button on the toolbar.
CREATING A LIBRARY PROJECT
Now you are ready to create a library project.
1 In the same workspace tutorials, add a new project called tutor_library.
2 Add the file Maxmin.sxx to the project.
3 To set options, choose Project>Options. In the General Options category, verify these settings:
Note that Library Builder appears in the list of categories, which means that the IAR XAR Library Builder is added to the build tool chain. You do not have to set any XAR-specific options for this tutorial.
Click OK.
4 Choose Project>Make.
Page Option
Output Output file: Library
Library Configuration Library: None
Table 9: General options for a library project
UEW-8:1
IAR Embedded Workbench® IDEUser Guide
Creating and using libraries
The library output file tutor_library.rxx has now been created in the projects\Debug\Exe directory.
USING THE LIBRARY IN YOUR APPLICATION PROJECT
Now add your library containing the maxmin routine to project5.
1 In the Workspace window, click the project5 tab. Choose Project>Add Files and add the file tutor_library.rxx located in the projects\Debug\Exe directory. Click Open.
2 Click Make to build your project.
3 You have now combined a library with an executable project, and the application is ready to be executed. For information about how to manipulate the library, see the IAR Linker and Library Tools Reference Guide.
UEW-8:1
Part 2. Tutorials 71

72
Using libraries
UEW-8:1
IAR Embedded Workbench® IDEUser Guide

Part 3. Project management and buildingThis part of the IAR Embedded Workbench® IDE User Guide contains the following chapters:
● The development environment
● Managing projects
● Building
● Editing.
UEW-8:1
73

74
UEW-8:1

The development environmentThis chapter introduces you to the IAR Embedded Workbench® development environment (IDE). The chapter also demonstrates how you can customize the environment to suit your requirements.
The IAR Embedded Workbench IDETHE TOOL CHAIN
The IDE is the framework where all necessary tools—the tool chain—are seamlessly integrated: a C/C++ compiler, an assembler, the IAR XLINK Linker, the IAR XAR Library Builder, the IAR XLIB Librarian, an editor, a project manager with Make utility, and the IAR C-SPY® Debugger, which is a high-level language debugger. The tools used specifically for building your source code are referred to as the build tools.
The tool chain that comes with your product installation is adapted for a certain microcontroller. However, the IDE can simultaneously manage multiple tool chains for various microcontrollers.
You can also add IAR visualSTATE to the tool chain, which means that you can add state machine diagrams directly to your project in the IDE.
You can use the Custom Build mechanism to incorporate also other tools to the tool chain, see Extending the tool chain, page 95.
The compiler, assembler, and linker can also be run from a command line environment, if you want to use them as external tools in an already established project environment.
UEW-8:1
Part 3. Project management and building 75
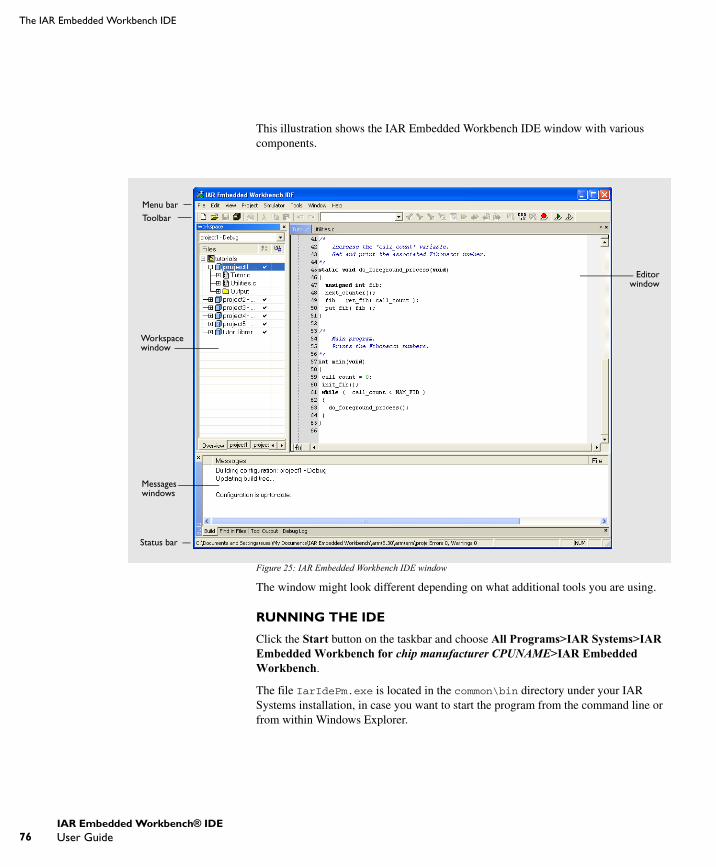
76
The IAR Embedded Workbench IDE
This illustration shows the IAR Embedded Workbench IDE window with various components.
Figure 25: IAR Embedded Workbench IDE window
The window might look different depending on what additional tools you are using.
RUNNING THE IDE
Click the Start button on the taskbar and choose All Programs>IAR Systems>IAR Embedded Workbench for chip manufacturer CPUNAME>IAR Embedded Workbench.
The file IarIdePm.exe is located in the common\bin directory under your IAR Systems installation, in case you want to start the program from the command line or from within Windows Explorer.
ToolbarMenu bar
Workspace window
Messages windows
Editorwindow
Status bar
UEW-8:1
IAR Embedded Workbench® IDEUser Guide
The development environment
Double-clicking the workspace filename
The workspace file has the filename extension eww. If you double-click a workspace filename, the IDE starts. If you have several versions of IAR Embedded Workbench installed, the workspace file is opened by the most recently used version of your IAR Embedded Workbench that uses that file type.
EXITING
To exit the IDE, choose File>Exit. You will be asked whether you want to save any changes to editor windows, the projects, and the workspace before closing them.
Customizing the environmentThe IDE is a highly customizable environment. This section demonstrates how you can work with and organize the windows on the screen, the possibilities for customizing the IDE, and how you can set up the environment to communicate with external tools.
ORGANIZING THE WINDOWS ON THE SCREEN
In the IDE, you can position the windows and arrange a layout according to your preferences. You can dock windows at specific places, and organize them in tab groups. You can also make a window floating, which means it is always on top of other windows. If you change the size or position of a floating window, other currently open windows are not affected.
Each time you open a previously saved workspace, the same windows are open, and they have the same sizes and positions.
For every project that is executed in the C-SPY environment, a separate layout is saved. In addition to the information saved for the workspace, information about all open debugger-specific windows is also saved.
Using docked versus floating windows
Each window that you open has a default location, which depends on other currently open windows. To give you full and convenient control of window placement, each window can either be docked or floating.
A docked window is locked to a specific area in the Embedded Workbench main window, which you can decide. To keep many windows open at the same time, you can organize the windows in tab groups. This means one area of the screen is used for several concurrently open windows. The system also makes it easy to rearrange the size of the windows. If you rearrange the size of one docked window, the sizes of any other docked windows are adjusted accordingly.
UEW-8:1
Part 3. Project management and building 77

78
Customizing the environment
A floating window is always on top of other windows. Its location and size does not affect other currently open windows. You can move a floating window to any place on your screen, also outside of the IAR Embedded Workbench IDE main window.
Note: The editor window is always docked. When you open the editor window, its placement is decided automatically depending on other currently open windows. For more information about how to work with the editor window, see Using the IAR Embedded Workbench editor, page 99.
Organizing windows
To place a window as a separate window, drag it next to another open window.
To place a window in the same tab group as another open window, drag the window you want to locate to the middle of the area and drop the window.
To make a window floating, double-click on the window’s title bar.
The status bar, located at the bottom of the IAR Embedded Workbench IDE main window, contains useful help about how to arrange windows.
CUSTOMIZING THE IDE
To customize the IDE, choose Tools>Options to get access to a vide variety of commands for:
● Configuring the editor
● Configuring the editor colors and fonts
● Configuring the project build command
● Organizing the windows in C-SPY
● Using an external editor
● Changing common fonts
● Changing key bindings
● Configuring the amount of output to the Messages window.
In addition, you can increase the number of recognized filename extensions. By default, each tool in the build tool chain accepts a set of standard filename extensions. If you have source files with a different filename extension, you can modify the set of accepted filename extensions. Choose Tools>Filename Extensions to get access to the necessary commands.
For reference information about the commands for customizing the IDE, see Tools menu, page 244. You can also find further information related to customizing the editor in the section Customizing the editor environment, page 106. For further information about customizations related to C-SPY, see Part 4. Debugging.
UEW-8:1
IAR Embedded Workbench® IDEUser Guide
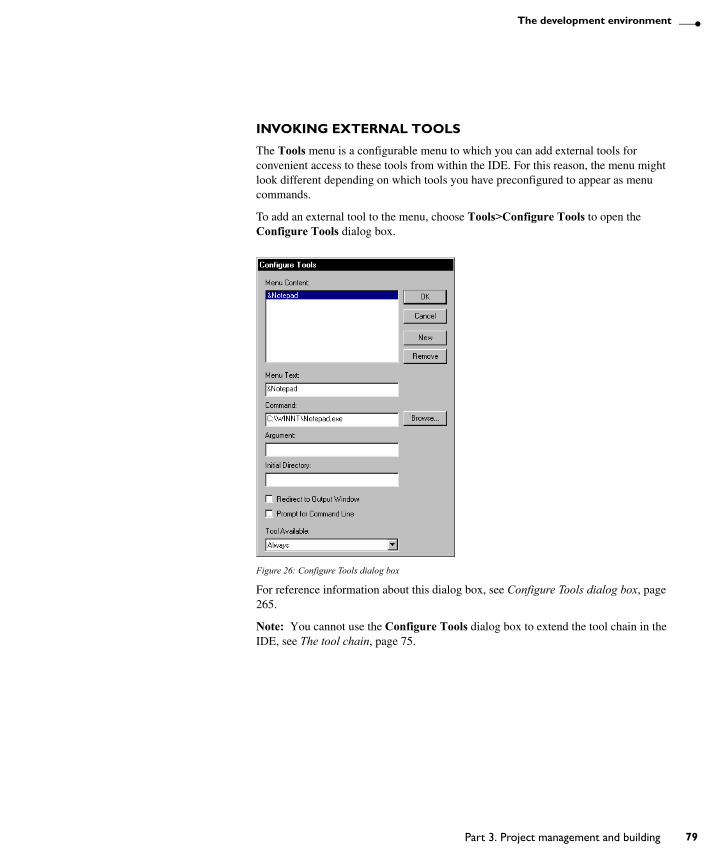
The development environment
INVOKING EXTERNAL TOOLS
The Tools menu is a configurable menu to which you can add external tools for convenient access to these tools from within the IDE. For this reason, the menu might look different depending on which tools you have preconfigured to appear as menu commands.
To add an external tool to the menu, choose Tools>Configure Tools to open the Configure Tools dialog box.
Figure 26: Configure Tools dialog box
For reference information about this dialog box, see Configure Tools dialog box, page 265.
Note: You cannot use the Configure Tools dialog box to extend the tool chain in the IDE, see The tool chain, page 75.
UEW-8:1
Part 3. Project management and building 79
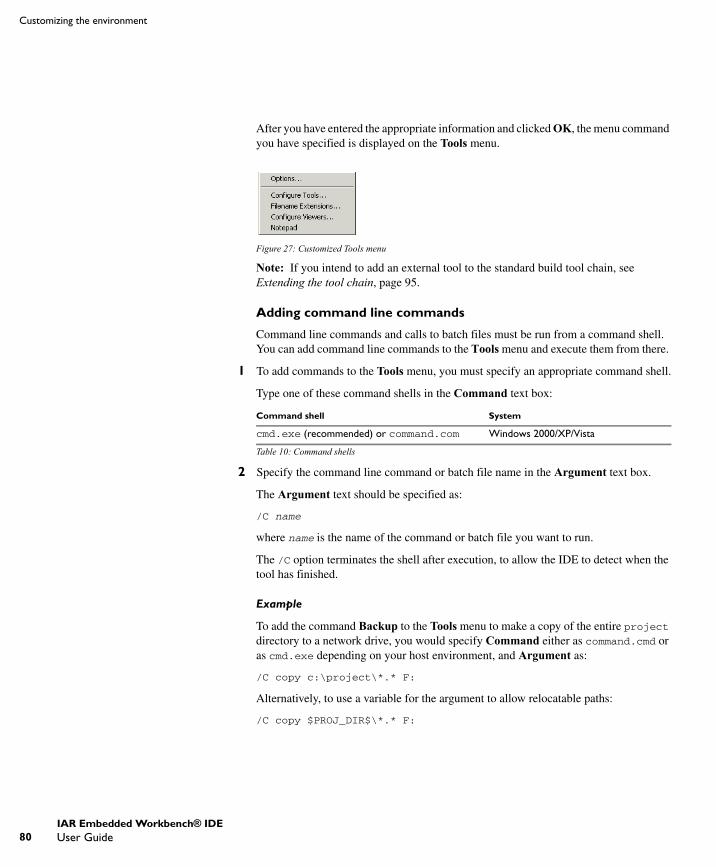
80
Customizing the environment
After you have entered the appropriate information and clicked OK, the menu command you have specified is displayed on the Tools menu.
Figure 27: Customized Tools menu
Note: If you intend to add an external tool to the standard build tool chain, see Extending the tool chain, page 95.
Adding command line commands
Command line commands and calls to batch files must be run from a command shell. You can add command line commands to the Tools menu and execute them from there.
1 To add commands to the Tools menu, you must specify an appropriate command shell.
Type one of these command shells in the Command text box:
2 Specify the command line command or batch file name in the Argument text box.
The Argument text should be specified as:
/C name
where name is the name of the command or batch file you want to run.
The /C option terminates the shell after execution, to allow the IDE to detect when the tool has finished.
Example
To add the command Backup to the Tools menu to make a copy of the entire project directory to a network drive, you would specify Command either as command.cmd or as cmd.exe depending on your host environment, and Argument as:
/C copy c:\project\*.* F:
Alternatively, to use a variable for the argument to allow relocatable paths:
/C copy $PROJ_DIR$\*.* F:
Command shell System
cmd.exe (recommended) or command.com Windows 2000/XP/Vista
Table 10: Command shells
UEW-8:1
IAR Embedded Workbench® IDEUser Guide
Managing projectsThis chapter discusses the project model used by the IAR Embedded Workbench IDE. It covers how projects are organized and how you can specify workspaces with multiple projects, build configurations, groups, source files, and options that help you handle different versions of your applications. The chapter also describes the steps involved in interacting with an external third-party source code control system.
The project modelIn a large-scale development project, with hundreds of files, you must be able to organize the files in a structure that is easily navigated and maintained by perhaps several engineers involved.
The IDE is a flexible environment for developing projects also with several different target processors in the same project, and a selection of tools for each target processor.
HOW PROJECTS ARE ORGANIZED
The IDE has been designed to suit the way that software development projects are typically organized. For example, perhaps you need to develop related versions of an application for different versions of the target hardware, and you might also want to include debugging routines into the early versions, but not in the final application.
Versions of your applications for different target hardware will often have source files in common, and you might want to be able to maintain only one unique copy of these files, so that improvements are automatically carried through to each version of the application. Perhaps you also have source files that differ between different versions of the application, such as those dealing with hardware-dependent aspects of the application.
The IDE allows you to organize projects in a hierarchical tree structure showing the logical structure at a glance. In the following sections the various levels of the hierarchy are described.
Projects and workspaces
Typically you create a project which contains the source files needed for your embedded systems application. If you have several related projects, you can access and work with them simultaneously. To achieve this, you can organize related projects in workspaces.
UEW-8:1
Part 3. Project management and building 81
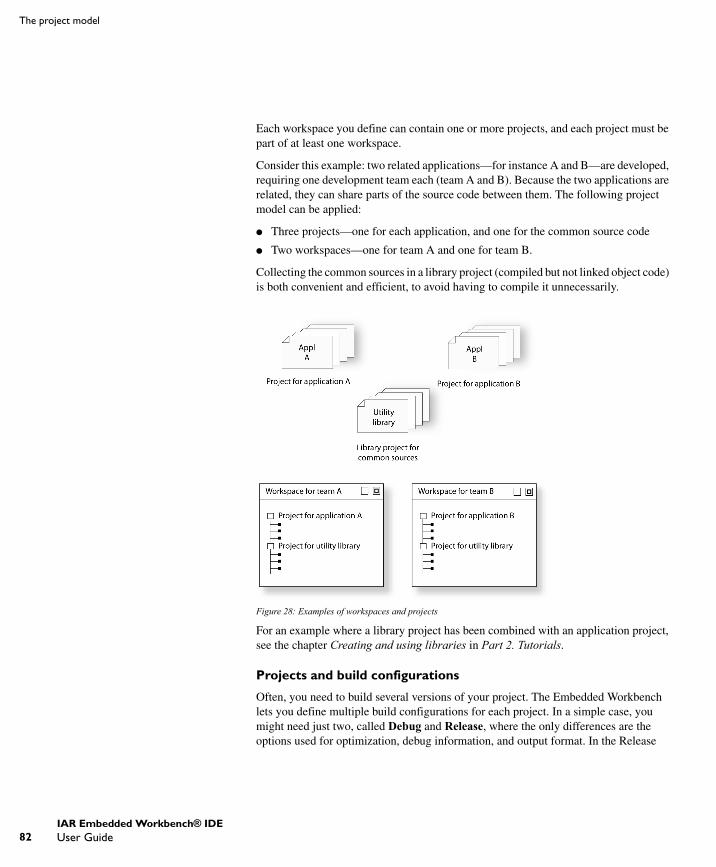
82
The project model
Each workspace you define can contain one or more projects, and each project must be part of at least one workspace.
Consider this example: two related applications—for instance A and B—are developed, requiring one development team each (team A and B). Because the two applications are related, they can share parts of the source code between them. The following project model can be applied:
● Three projects—one for each application, and one for the common source code
● Two workspaces—one for team A and one for team B.
Collecting the common sources in a library project (compiled but not linked object code) is both convenient and efficient, to avoid having to compile it unnecessarily.
Figure 28: Examples of workspaces and projects
For an example where a library project has been combined with an application project, see the chapter Creating and using libraries in Part 2. Tutorials.
Projects and build configurations
Often, you need to build several versions of your project. The Embedded Workbench lets you define multiple build configurations for each project. In a simple case, you might need just two, called Debug and Release, where the only differences are the options used for optimization, debug information, and output format. In the Release
UEW-8:1
IAR Embedded Workbench® IDEUser Guide
Managing projects
configuration, the preprocessor symbol NDEBUG is defined, which means the application will not contain any asserts.
Additional build configurations might be useful, for instance, if you intend to use the application on different target devices. The application is the same, but hardware-related parts of the code differ. Thus, depending on which target device you intend to build for, you can exclude some source files from the build configuration. These build configurations might fulfil these requirements for Project A:
● Project A - Device 1:Release
● Project A - Device 1:Debug
● Project A - Device 2:Release
● Project A - Device 2:Debug
Groups
Normally, projects contain hundreds of files that are logically related. You can define each project to contain one or more groups, in which you can collect related source files. You can also define multiple levels of subgroups to achieve a logical hierarchy. By default, each group is present in all build configurations of the project, but you can also specify a group to be excluded from a particular build configuration.
Source files
Source files can be located directly under the project node or in a hierarchy of groups. The latter is convenient if the amount of files makes the project difficult to survey. By default, each file is present in all build configurations of the project, but you can also specify a file to be excluded from a particular build configuration.
Only the files that are part of a build configuration will actually be built and linked into the output code.
Once a project has been successfully built, all include files and output files are displayed in the structure below the source file that included or generated them.
Note: The settings for a build configuration can affect which include files that are used during the compilation of a source file. This means that the set of include files associated with the source file after compilation can differ between the build configurations.
CREATING AND MANAGING WORKSPACES
This section describes the overall procedure for creating the workspace, projects, groups, files, and build configurations. The File menu provides the commands for creating workspaces. The Project menu provides commands for creating projects, adding files to a project, creating groups, specifying project options, and running the IAR Systems development tools on the current projects.
UEW-8:1
Part 3. Project management and building 83

84
The project model
For reference information about these menus, menu commands, and dialog boxes, see the chapter IAR Embedded Workbench® IDE reference.
The steps involved for creating and managing a workspace and its contents are:
● Creating a workspace.
An empty Workspace window appears, which is the place where you can view your projects, groups, and files.
● Adding new or existing projects to the workspace.
When creating a new project, you can base it on a template project with preconfigured project settings. Template projects are available for C applications, C++ applications, assembler applications, and library projects.
● Creating groups.
A group can be added either to the project’s top node or to another group within the project.
● Adding files to the project.
A file can be added either to the project’s top node or to a group within the project.
● Creating new build configurations.
By default, each project you add to a workspace will have two build configurations called Debug and Release.
You can base a new configuration on an already existing configuration. Alternatively, you can choose to create a default build configuration.
Note that you do not have to use the same tool chain for the new build configuration as for other build configurations in the same project.
● Excluding groups and files from a build configuration.
Note that the icon indicating the excluded group or file will change to white in the Workspace window.
● Removing items from a project.
For a detailed example, see Creating an application project, page 29.
Note: It might not be necessary for you to perform all of these steps.
Drag and drop
You can easily drag individual source files and project files from the Windows file explorer to the Workspace window. Source files dropped on a group are added to that group. Source files dropped outside the project tree—on the Workspace window background—are added to the active project.
UEW-8:1
IAR Embedded Workbench® IDEUser Guide
Managing projects
Source file paths
The IDE supports relative source file paths to a certain degree, for:
● Project file
Paths to files part of the project file is relative if they are located on the same drive. The path is relative either to $PROJ_DIR$ or $EW_DIR$. The argument variable $EW_DIR$ is only used if the path refers to a file located in subdirectory to $EW_DIR$ and the distance from $EW_DIR$ is shorter than the distance from $PROJ_DIR$.
Paths to files that are part of the project file are absolute if the files are located on different drives.
● Workspace file
For files located on the same drive as the workspace file, the path is relative to $PROJ_DIR$.
For files located on another drive as the workspace file, the path is absolute.
● Debug files
The path is absolute if the file is built with IAR Systems compilation tools.
Navigating project filesThere are two main different ways to navigate your project files: using the Workspace window or the Source Browser window. The Workspace window displays an hierarchical view of the source files, dependency files, and output files and how they are logically grouped. The Source Browser window, on the other hand, displays information about the build configuration that is currently active in the Workspace window. For that configuration, the Source Browser window displays a hierarchical view of all globally defined symbols, such as variables, functions, and type definitions. For classes, information about any base classes is also displayed.
UEW-8:1
Part 3. Project management and building 85
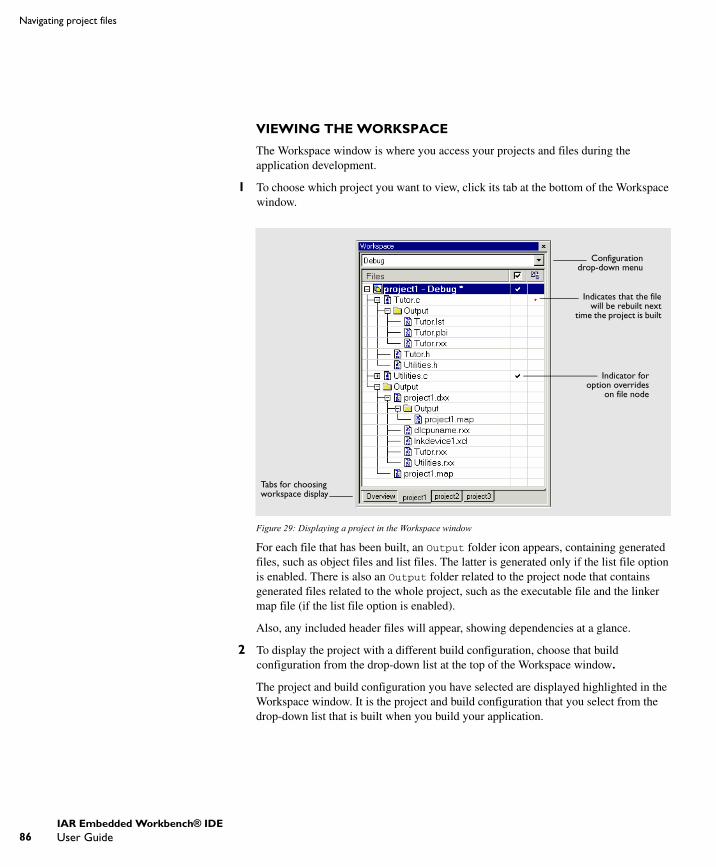
86
Navigating project files
VIEWING THE WORKSPACE
The Workspace window is where you access your projects and files during the application development.
1 To choose which project you want to view, click its tab at the bottom of the Workspace window.
Figure 29: Displaying a project in the Workspace window
For each file that has been built, an Output folder icon appears, containing generated files, such as object files and list files. The latter is generated only if the list file option is enabled. There is also an Output folder related to the project node that contains generated files related to the whole project, such as the executable file and the linker map file (if the list file option is enabled).
Also, any included header files will appear, showing dependencies at a glance.
2 To display the project with a different build configuration, choose that build configuration from the drop-down list at the top of the Workspace window.
The project and build configuration you have selected are displayed highlighted in the Workspace window. It is the project and build configuration that you select from the drop-down list that is built when you build your application.
Configurationdrop-down menu
Indicator foroption overrides
on file node
Tabs for choosing workspace display
Indicates that the filewill be rebuilt next
time the project is built
UEW-8:1
IAR Embedded Workbench® IDEUser Guide
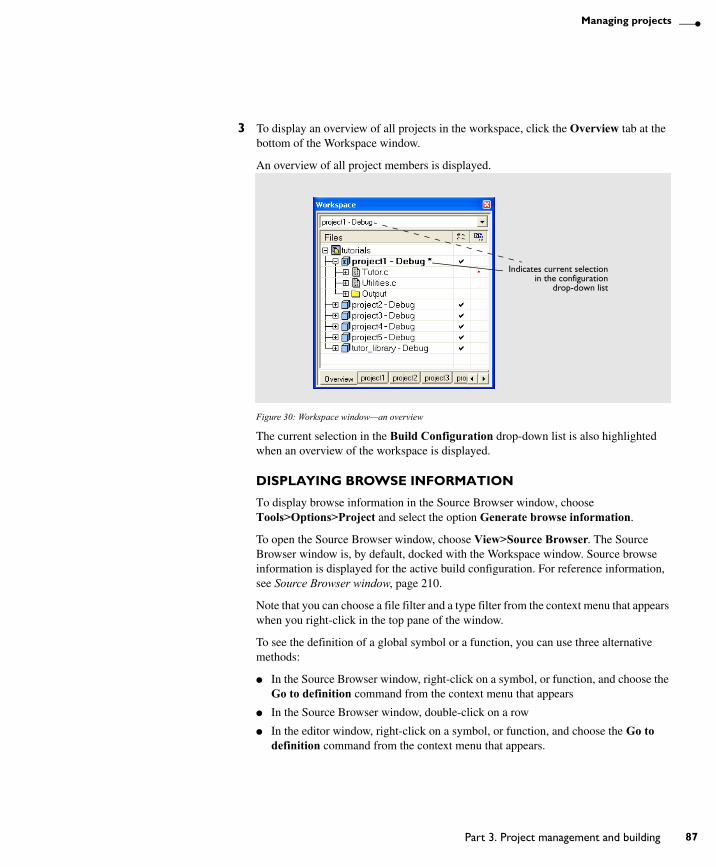
Managing projects
3 To display an overview of all projects in the workspace, click the Overview tab at the bottom of the Workspace window.
An overview of all project members is displayed.
Figure 30: Workspace window—an overview
The current selection in the Build Configuration drop-down list is also highlighted when an overview of the workspace is displayed.
DISPLAYING BROWSE INFORMATION
To display browse information in the Source Browser window, choose Tools>Options>Project and select the option Generate browse information.
To open the Source Browser window, choose View>Source Browser. The Source Browser window is, by default, docked with the Workspace window. Source browse information is displayed for the active build configuration. For reference information, see Source Browser window, page 210.
Note that you can choose a file filter and a type filter from the context menu that appears when you right-click in the top pane of the window.
To see the definition of a global symbol or a function, you can use three alternative methods:
● In the Source Browser window, right-click on a symbol, or function, and choose the Go to definition command from the context menu that appears
● In the Source Browser window, double-click on a row
● In the editor window, right-click on a symbol, or function, and choose the Go to definition command from the context menu that appears.
Indicates current selectionin the configuration
drop-down list
UEW-8:1
Part 3. Project management and building 87
88
Source code control
The definition of the symbol or function is displayed in the editor window.
The source browse information is continuously updated in the background. While you are editing source files, or when you open a new project, there will be a short delay before the information is up-to-date.
Source code controlIAR Embedded Workbench can identify and access any installed third-party source code control (SCC) system that conforms to the SCC interface published by Microsoft corporation. From within the IDE you can connect an IAR Embedded Workbench project to an external SCC project, and perform some of the most commonly used operations.
To connect your IAR Embedded Workbench project to a source code control system you should be familiar with the source code control client application you are using. Note that some of the windows and dialog boxes that appear when you work with source code control in the IAR Embedded Workbench IDE originate from the SCC system and are not described in the documentation from IAR Systems. For information about details in the client application, refer to the documentation supplied with that application.
Note: Different SCC systems use very different terminology even for some of the most basic concepts involved. You must keep this in mind when you read the following description.
INTERACTING WITH SOURCE CODE CONTROL SYSTEMS
In any SCC system, you use a client application to maintain a central archive. In this archive you keep the working copies of the files of your project. The SCC integration in IAR Embedded Workbench allows you to conveniently perform a few of the most common SCC operations directly from within the IDE. However, several tasks must still be performed in the client application.
To connect an IAR Embedded Workbench project to a source code control system, you should:
● In the SCC client application, set up an SCC project
● In IAR Embedded Workbench, connect your project to the SCC project.
Setting up an SCC project in the SCC client application
Use your SCC client tools to set up a working directory for the files in your IAR Embedded Workbench project that you want to control using your SCC system. The files can be placed in one or more nested subdirectories, all located under a common
UEW-8:1
IAR Embedded Workbench® IDEUser Guide
Managing projects
root. Specifically, all the source files must reside in the same directory as the ewp project file, or nested in subdirectories of this directory.
For information about the steps involved, refer to the documentation supplied with the SCC client application.
Connecting projects in IAR Embedded Workbench
In IAR Embedded Workbench, connect your application project to the SCC project.
1 In the Workspace window, select the project for which you have created an SCC project. From the Project menu, choose Source Code Control>Add Project To Source Control. This command is also available from the context menu that appears when you right-click in the Workspace window.
Note: The commands on the Source Code Control submenu are available when at least one SCC client application is available.
2 If you have source code control systems from different vendors installed, a dialog box will appear to let you choose which system you want to connect to.
3 An SCC-specific dialog box will appear where you can navigate to the proper SCC project that you have set up.
Viewing the SCC states
When your IAR Embedded Workbench project has been connected to the SCC project, a column that contains status information for source code control will appear in the Workspace window. Different icons are displayed depending on whether:
● a file is checked out to you
● a file is checked out to someone else
● a file is checked in
● a file has been modified
● a new version of a file is in the archive.
There are also icons for some combinations of these states. Note that the interpretation of these states depends on the SCC client application you are using. For reference information about the icons and the different states they represent, see Source code control states, page 200.
For reference information about the commands available for accessing the SCC system, see Source Code Control menu, page 199.
UEW-8:1
Part 3. Project management and building 89

90
Source code control
Configuring the source code control system
To customize the source code control system, choose Tools>Options and click the Source Code Control tab. For reference information about the available commands, see Terminal I/O options, page 264.
UEW-8:1
IAR Embedded Workbench® IDEUser Guide
BuildingThis chapter briefly discusses the process of building your application, and describes how you can extend the chain of build tools with tools from third-party suppliers.
Building your applicationThe building process consists of these steps:
● Setting project options
● Building the project
● Correcting any errors detected during the build procedure.
To make the build process more efficient, you can use the Batch Build command. This gives you the possibility to perform several builds in one operation. If necessary, you can also specify pre-build and post-build actions.
In addition to using the IAR Embedded Workbench IDE to build projects, you can also use the command line utility iarbuild.exe.
For examples of building application and library projects, see Part 2. Tutorials in this guide. For further information about building library projects, see the IAR C/C++ Compiler Reference Guide.
SETTING OPTIONS
To specify how your application should be built, you must define one or several build configurations. Every build configuration has its own settings, which are independent of the other configurations. All settings are indicated in a separate column in the Workspace window.
For example, a configuration that is used for debugging would not be highly optimized, and would produce output that suits the debugging. Conversely, a configuration for building the final application would be highly optimized, and produce output that suits a flash or PROM programmer.
For each build configuration, you can set options on the project level, group level, and file level. Many options can only be set on the project level because they affect the entire build configuration. Examples of such options are General Options, linker settings, and debug settings. Other options, such as compiler and assembler options, that you set on project level are default for the entire build configuration.
UEW-8:1
Part 3. Project management and building 91
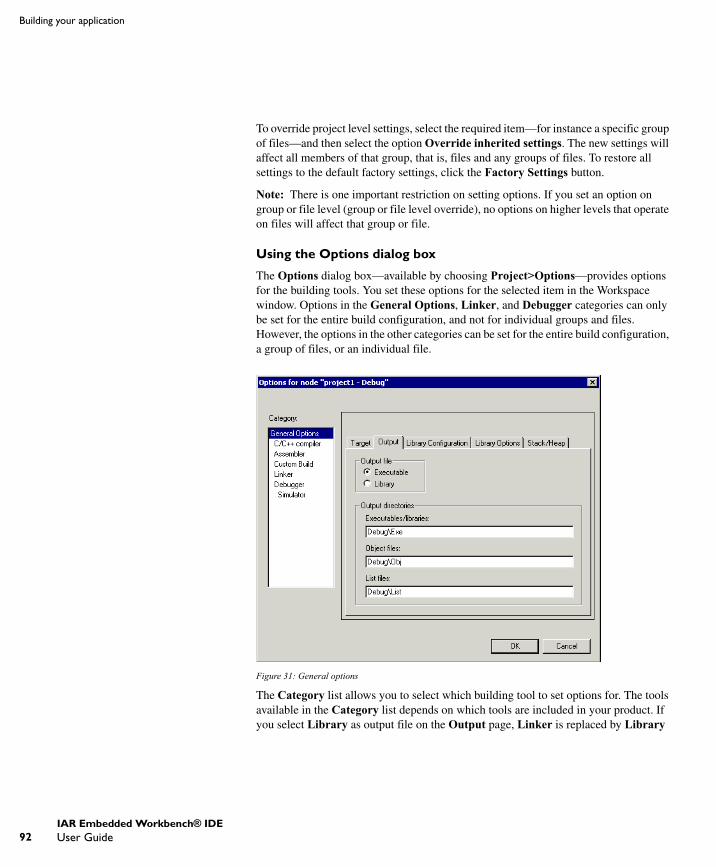
92
Building your application
To override project level settings, select the required item—for instance a specific group of files—and then select the option Override inherited settings. The new settings will affect all members of that group, that is, files and any groups of files. To restore all settings to the default factory settings, click the Factory Settings button.
Note: There is one important restriction on setting options. If you set an option on group or file level (group or file level override), no options on higher levels that operate on files will affect that group or file.
Using the Options dialog box
The Options dialog box—available by choosing Project>Options—provides options for the building tools. You set these options for the selected item in the Workspace window. Options in the General Options, Linker, and Debugger categories can only be set for the entire build configuration, and not for individual groups and files. However, the options in the other categories can be set for the entire build configuration, a group of files, or an individual file.
Figure 31: General options
The Category list allows you to select which building tool to set options for. The tools available in the Category list depends on which tools are included in your product. If you select Library as output file on the Output page, Linker is replaced by Library
UEW-8:1
IAR Embedded Workbench® IDEUser Guide
Building
Builder in the category list. When you select a category, one or more pages containing options for that component are displayed.
Click the tab corresponding to the type of options you want to view or change. To restore all settings to the default factory settings, click the Factory Settings button, which is available for all categories except General Options and Custom Build. Note that two sets of factory settings are available: Debug and Release. Which one that is used depends on your build configuration; see New Configuration dialog box, page 239.
For information about each option and how to set options, see the chapters General options, Compiler options, Assembler options, Linker options, Library builder options, Custom build options, and Debugger options in Part 6. Reference information in this guide. For information about options specific to the C-SPY driver you are using, see the part of this book that corresponds to your driver.
Note: If you add to your project a source file with a non-recognized filename extension, you cannot set options on that source file. However, you can add support for additional filename extensions. For reference information, see Filename Extensions dialog box, page 267.
BUILDING A PROJECT
You have access to the build commands both from the Project menu and from the context menu that appears if you right-click an item in the Workspace window.
The three build commands Make, Compile, and Rebuild All run in the background, so you can continue editing or working with the IDE while your project is being built.
For further reference information, see Project menu, page 235.
BUILDING MULTIPLE CONFIGURATIONS IN A BATCH
Use the batch build feature when you want to build more than one configuration at once. A batch is an ordered list of build configurations. The Batch Build dialog box—available from the Project menu—lets you create, modify, and build batches of configurations.
For workspaces that contain several configurations, it is convenient to define one or more different batches. Instead of building the entire workspace, you can build only the appropriate build configurations, for instance Release or Debug configurations.
For detailed information about the Batch Build dialog box, see Batch Build dialog box, page 242.
UEW-8:1
Part 3. Project management and building 93
94
Building your application
USING PRE- AND POST-BUILD ACTIONS
If necessary, you can specify pre-build and post-build actions that you want to occur before or after the build. The Build Actions dialog box—available from the Project menu—lets you specify the actions required.
For detailed information about the Build Actions dialog box, see Build actions options, page 339.
Using pre-build actions for time stamping
You can use pre-build actions to embed a time stamp for the build in the resulting binary file. Follow these steps:
1 Create a dedicated time stamp file, for example, timestamp.c and add it to your project.
2 In this source file, use the preprocessor macros __TIME__ and __DATE__ to initialize a string variable.
3 Choose Project>Options>Build Actions to open the Build Actions dialog box.
4 In the Pre-build command line text field, specify for example this pre-build action:
"touch $PROJ_DIR$\timestamp.c"
You can use the open source command line utility touch for this purpose or any other suitable utility which updates the modification time of the source file.
5 If the project is not entirely up-to-date, the next time you use the Make command, the pre-build action will be invoked before the regular build process. The regular build process then always must recompile timestamp.c and the correct timestamp will end up in the binary file.
If the project already is up-to-date, the pre-build action will not be invoked. This means that nothing is built, and the binary file still contains the timestamp for when it was last built.
CORRECTING ERRORS FOUND DURING BUILD
The compiler, assembler, and debugger are fully integrated with the development environment. If your source code contains errors, you can jump directly to the correct position in the appropriate source file by double-clicking the error message in the error listing in the Build message window, or selecting the error and pressing Enter.
After you have resolved any problems reported during the build process and rebuilt the project, you can directly start debugging the resulting code at the source level.
To specify the level of output to the Build message window, choose Tools>Options to open the IDE Options dialog box. Click the Messages tab and select the level of output
UEW-8:1
IAR Embedded Workbench® IDEUser Guide
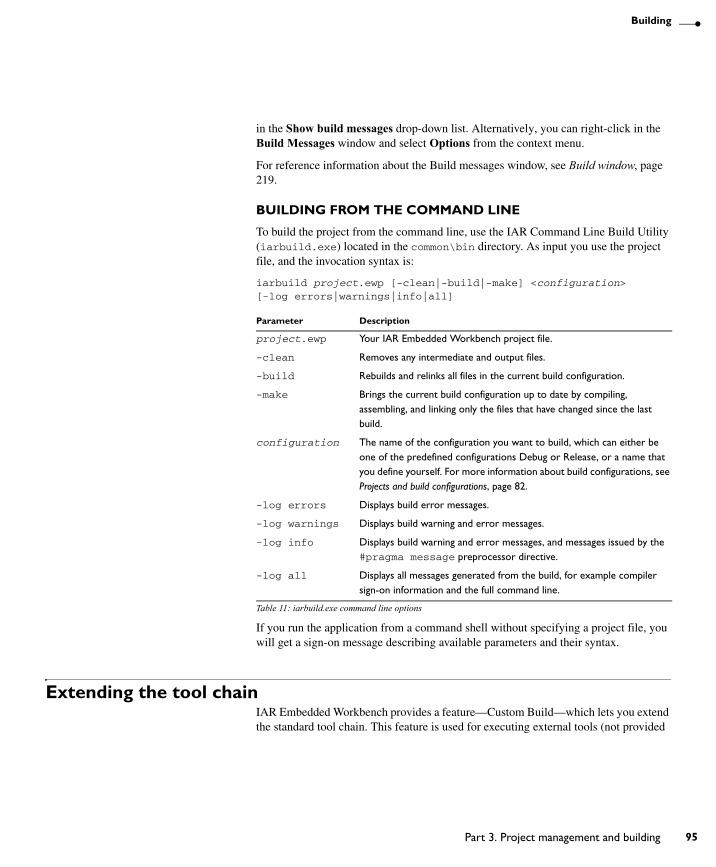
Building
in the Show build messages drop-down list. Alternatively, you can right-click in the Build Messages window and select Options from the context menu.
For reference information about the Build messages window, see Build window, page 219.
BUILDING FROM THE COMMAND LINE
To build the project from the command line, use the IAR Command Line Build Utility (iarbuild.exe) located in the common\bin directory. As input you use the project file, and the invocation syntax is:
iarbuild project.ewp [-clean|-build|-make] <configuration> [-log errors|warnings|info|all]
If you run the application from a command shell without specifying a project file, you will get a sign-on message describing available parameters and their syntax.
Extending the tool chainIAR Embedded Workbench provides a feature—Custom Build—which lets you extend the standard tool chain. This feature is used for executing external tools (not provided
Parameter Description
project.ewp Your IAR Embedded Workbench project file.
-clean Removes any intermediate and output files.
-build Rebuilds and relinks all files in the current build configuration.
-make Brings the current build configuration up to date by compiling, assembling, and linking only the files that have changed since the last build.
configuration The name of the configuration you want to build, which can either be one of the predefined configurations Debug or Release, or a name that you define yourself. For more information about build configurations, see Projects and build configurations, page 82.
-log errors Displays build error messages.
-log warnings Displays build warning and error messages.
-log info Displays build warning and error messages, and messages issued by the #pragma message preprocessor directive.
-log all Displays all messages generated from the build, for example compiler sign-on information and the full command line.
Table 11: iarbuild.exe command line options
UEW-8:1
Part 3. Project management and building 95
96
Extending the tool chain
by IAR Systems). You can make these tools execute each time specific files in your project have changed.
If you specify custom build options on the Custom tool configuration page, the build commands treat the external tool and its associated files in the same way as the standard tools within the IAR Embedded Workbench IDE and their associated files. The relation between the external tool and its input files and generated output files is similar to the relation between the C/C++ Compiler, c files, h files, and rxx files. See Custom build options, page 337, for details about available custom build options.
You specify filename extensions of the files used as input to the external tool. If the input file has changed since you last built your project, the external tool is executed; just as the compiler executes if a c file has changed. In the same way, any changes in additional input files (for instance include files) are detected.
You must specify the name of the external tool. You can also specify any necessary command line options needed by the external tool, and the name of the output files generated by the external tool. Note that you can use argument variables for substituting file paths.
For some of the file information, you can use argument variables.
You can specify custom build options to any level in the project tree. The options you specify are inherited by any sublevel in the project tree.
TOOLS THAT CAN BE ADDED TO THE TOOL CHAIN
Some examples of external tools, or types of tools, that you can add to the IAR Embedded Workbench tool chain are:
● Tools that generate files from a specification, such as Lex and YACC
● Tools that convert binary files—for example files that contain bitmap images or audio data—to a table of data in an assembler or C source file. This data can then be compiled and linked together with the rest of your application.
ADDING AN EXTERNAL TOOL
The following example demonstrates how to add the tool Flex to the tool chain. The same procedure can be used also for other tools.
In the example, Flex takes the file foo.lex as input. The two files foo.c and foo.h are generated as output.
1 Add the file you want to work with to your project, for example foo.lex.
2 Select this file in the Workspace window and choose Project>Options. Select Custom Build from the list of categories.
UEW-8:1
IAR Embedded Workbench® IDEUser Guide
Building
3 In the Filename extensions field, type the filename extension .lex. Remember to specify the leading period (.).
4 In the Command line field, type the command line for executing the external tool, for example
flex $FILE_PATH$ -o$FILE_BPATH$.c
During the build process, this command line is expanded to:
flex foo.lex -ofoo.c
Note the usage of argument variables. For further details of these variables, see Argument variables summary, page 237.
Take special note of the use of $FILE_BNAME$ which gives the base name of the input file, in this example appended with the c extension to provide a C source file in the same directory as the input file foo.lex.
5 In the Output files field, describe the output files that are relevant for the build. In this example, the tool Flex would generate two files—one source file and one header file. The text in the Output files text box for these two files would look like this:
$FILE_BPATH$.c$FILE_BPATH$.h
6 If the external tool uses any additional files during the build, these should be added in the Additional input files field: for instance:
$TOOLKIT_DIR$\inc\stdio.h
This is important, because if the dependency files change, the conditions will no longer be the same and the need for a rebuild is detected.
7 Click OK.
8 To build your application, choose Project>Make.
UEW-8:1
Part 3. Project management and building 97

98
Extending the tool chain
UEW-8:1
IAR Embedded Workbench® IDEUser Guide
EditingThis chapter describes in detail how to use the IAR Embedded Workbench editor. The final section describes how to customize the editor and how to use an external editor of your choice.
Using the IAR Embedded Workbench editorThe integrated text editor allows editing of multiple files in parallel, and provides all basic editing features expected from a modern editor. In addition, it provides features specific to software development. It also recognizes C or C++ language elements.
EDITING A FILE
The editor window is where you write, view, and modify your source code. You can open one or several text files, either from the File menu, or by double-clicking a file in the Workspace window. If you open several files, they are organized in a tab group. Several editor windows can be open at the same time.
UEW-8:1
Part 3. Project management and building 99
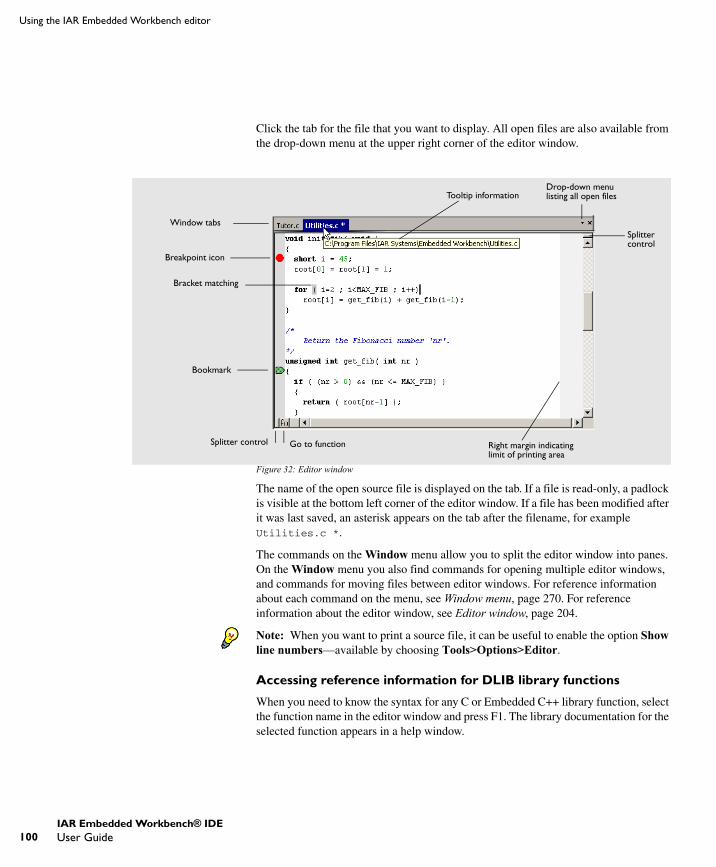
100
Using the IAR Embedded Workbench editor
Click the tab for the file that you want to display. All open files are also available from the drop-down menu at the upper right corner of the editor window.
Figure 32: Editor window
The name of the open source file is displayed on the tab. If a file is read-only, a padlock is visible at the bottom left corner of the editor window. If a file has been modified after it was last saved, an asterisk appears on the tab after the filename, for example Utilities.c *.
The commands on the Window menu allow you to split the editor window into panes. On the Window menu you also find commands for opening multiple editor windows, and commands for moving files between editor windows. For reference information about each command on the menu, see Window menu, page 270. For reference information about the editor window, see Editor window, page 204.
Note: When you want to print a source file, it can be useful to enable the option Show line numbers—available by choosing Tools>Options>Editor.
Accessing reference information for DLIB library functions
When you need to know the syntax for any C or Embedded C++ library function, select the function name in the editor window and press F1. The library documentation for the selected function appears in a help window.
Window tabs
Breakpoint icon
Bracket matching
Bookmark
Splittercontrol
Drop-down menulisting all open files
Splitter control Go to function
Tooltip information
Right margin indicating limit of printing area
UEW-8:1
IAR Embedded Workbench® IDEUser Guide
Editing
Using and customizing editor commands and shortcut keys
The Edit menu provides commands for editing and searching in editor windows, for instance, unlimited undo/redo (the Edit>Undo and Edit>Redo commands, respectively). You can also find some of these commands on the context menu that appears when you right-click in the editor window. For reference information about each command, see Edit menu, page 225.
There are also editor shortcut keys for:
● moving the insertion point
● scrolling text
● selecting text.
For detailed information about these shortcut keys, see Editor key summary, page 208.
To change the default shortcut key bindings, choose Tools>Options, and click the Key Bindings tab. For further details, see Key Bindings options, page 246.
Splitting the editor window into panes
You can split the editor window horizontally or vertically into multiple panes, to look at different parts of the same source file at once, or to move text between two different panes.
To split the window, double-click the appropriate splitter bar, or drag it to the middle of the window. Alternatively, you can split a window into panes using the Window>Split command.
To revert to a single pane, double-click the splitter control or drag it back to the end of the scroll bar.
Dragging and dropping of text
You can easily move text within an editor window or between editor windows. Select the text and drag it to the new location.
Syntax coloring
If the Tools>Options>Editor>Syntax highlighting option is enabled, the IAR Embedded Workbench editor automatically recognizes the syntax of:
● C and C++ keywords
● C and C++ comments
● Assembler directives and comments
● Preprocessor directives
● Strings.
UEW-8:1
Part 3. Project management and building 101
102
Using the IAR Embedded Workbench editor
The different parts of source code are displayed in different text styles.
To change these styles, choose Tools>Options, and use the Editor>Colors and Fonts options. For additional information, see Editor Colors and Fonts options, page 254.
In addition, you can define your own set of keywords that should be syntax-colored automatically:
1 In a text file, list all the keywords that you want to be automatically syntax-colored. Separate each keyword with either a space or a new line.
2 Choose Tools>Options and select Editor>Setup Files.
3 Select the Use Custom Keyword File option and specify your newly created text file. A browse button is available for your convenience.
4 Select Edit>Colors and Fonts and choose User Keyword from the Syntax Coloring list. Specify the font, color, and type style of your choice. For additional information, see Editor Colors and Fonts options, page 254.
5 In the editor window, type any of the keywords you listed in your keyword file; see how the keyword is syntax-colored according to your specification.
Automatic text indentation
The text editor can perform various kinds of indentation. For assembler source files and normal text files, the editor automatically indents a line to match the previous line. If you want to indent several lines, select the lines and press the Tab key. Press Shift-Tab to move a whole block of lines to the left.
For C/C++ source files, the editor indents lines according to the syntax of the C/C++ source code. This is performed whenever you:
● Press the Return key
● Type any of the special characters {, }, :, and #
● Have selected one or several lines, and choose the Edit>Auto Indent command.
To enable or disable the indentation:
1 Choose Tools>Options and select Editor.
2 Select or deselect the Auto indent option.
To customize the C/C++ automatic indentation, click the Configure button.
For additional information, see Configure Auto Indent dialog box, page 250.
UEW-8:1
IAR Embedded Workbench® IDEUser Guide
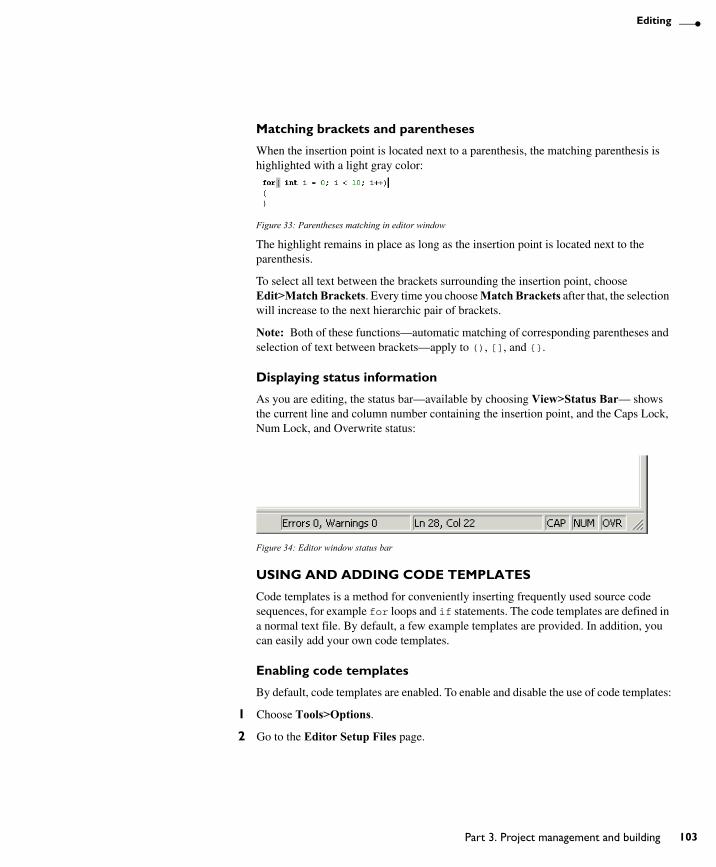
Editing
Matching brackets and parentheses
When the insertion point is located next to a parenthesis, the matching parenthesis is highlighted with a light gray color:
Figure 33: Parentheses matching in editor window
The highlight remains in place as long as the insertion point is located next to the parenthesis.
To select all text between the brackets surrounding the insertion point, choose Edit>Match Brackets. Every time you choose Match Brackets after that, the selection will increase to the next hierarchic pair of brackets.
Note: Both of these functions—automatic matching of corresponding parentheses and selection of text between brackets—apply to (), [], and {}.
Displaying status information
As you are editing, the status bar—available by choosing View>Status Bar— shows the current line and column number containing the insertion point, and the Caps Lock, Num Lock, and Overwrite status:
Figure 34: Editor window status bar
USING AND ADDING CODE TEMPLATES
Code templates is a method for conveniently inserting frequently used source code sequences, for example for loops and if statements. The code templates are defined in a normal text file. By default, a few example templates are provided. In addition, you can easily add your own code templates.
Enabling code templates
By default, code templates are enabled. To enable and disable the use of code templates:
1 Choose Tools>Options.
2 Go to the Editor Setup Files page.
UEW-8:1
Part 3. Project management and building 103

104
Using the IAR Embedded Workbench editor
3 Select or deselect the Use Code Templates option.
4 In the text field, specify which template file you want to use; either the default file or one of your own template files. A browse button is available for your convenience.
Inserting a code template in your source code
To insert a code template in your source code, place the insertion point at the location where you want the template to be inserted and choose Edit>Insert Template. This command displays a list in the editor window from which you can choose a code template.
Figure 35: Editor window code template menu
If the code template you choose requires any type of field input, as in the for loop example which needs an end value and a count variable, an input dialog box appears.
Adding your own code templates
The source code templates are defined in a normal text file. The original template file CodeTemplates.txt is located in the common\config installation directory. The first time you use IAR Embedded Workbench, the original template file is copied to a directory for local settings, and this is the file that is used by default if code templates are enabled. To use your own template file, follow the procedure described in Enabling code templates, page 103.
To open the template file and define your own code templates, choose Edit>Code Templates>Edit Templates.
The syntax for defining templates is described in the default template file.
Selecting the correct language version of the code template file
When you start the IAR Embedded Workbench IDE for the very first time, you are asked to select a language version. This only applies if you are using an IDE that is available in other languages than English.
UEW-8:1
IAR Embedded Workbench® IDEUser Guide
Editing
Selecting a language creates a corresponding language version of the default code template file in the Application Data\IAR Embedded Workbench subdirectory of the current Windows user (for example CodeTemplates.ENU.txt for English and CodeTemplates.JPN.txt for Japanese). The default code template file does not change automatically if you change the language version of the IDE afterwards.
To change the code template:
1 Choose Tools>Options>IDE Options>Editor>Setup Files.
2 Click the browse button of the Use Code Templates option and select a different template file.
If the code template file you want to select is not in the browsed directory, you must:
3 Delete the file name in the Use Code Templates text box.
4 Deselect the Use Code Templates option and click OK.
5 Restart the IAR Embedded Workbench IDE.
6 Then choose Tools>Options>IDE Options>Editor>Setup Files again.
The default code template file for the selected language version of the IDE should now be displayed in the Use Code Templates text box. Select the check box to enable the template.
NAVIGATING IN AND BETWEEN FILES
The editor provides several functions for easy navigation within the files and between files:
● Switching between source and header files
If the insertion point is located on an #include line, you can choose the Open "header.h" command from the context menu, which opens the header file in an editor window. You can also choose the command Open Header/Source File, which opens the header or source file that corresponds to the current file, or activates it if it is already open. This command is available if the insertion point is located on any line except an #include line.
● Function navigation
Click the Go to function button in the bottom left corner in an editor window to list all functions defined in the source file displayed in the window. You can then choose to go directly to one of the functions by double-clicking it in the list.
● Adding bookmarks
Use the Edit>Navigate>Toggle Bookmark command to add and remove bookmarks. To switch between the marked locations, choose Edit>Navigate>Go to Bookmark.
UEW-8:1
Part 3. Project management and building 105
106
Customizing the editor environment
SEARCHING
There are several standard search functions available in the editor:
● Quick search text box
● Find dialog box
● Replace dialog box
● Find in files dialog box
● Incremental Search dialog box.
To use the Quick search text box on the toolbar, type the text you want to search for and press Enter. Press Esc to cancel the search. This is a quick method for searching for text in the active editor window.
To use the Find, Replace, Find in Files, and Incremental Search functions, choose the corresponding command from the Edit menu. For reference information about each search function, see Edit menu, page 225.
Customizing the editor environmentThe IDE editor can be configured on the IDE Options pages Editor and Editor Colors and Fonts. Choose Tools>Options to access the pages.
For details about these pages, see Tools menu, page 244.
USING AN EXTERNAL EDITOR
The External Editor options—available by choosing Tools>Options>Editor—let you specify an external editor of your choice.
Note: While debugging using C-SPY, C-SPY will not use the external editor for displaying the current debug state. Instead, the built-in editor will be used.
To specify an external editor of your choice, follow this procedure:
1 Select the option Use External Editor.
2 An external editor can be called in one of two ways, using the Type drop-down menu.
Command Line calls the external editor by passing command line parameters.
DDE calls the external editor by using DDE (Windows Dynamic Data Exchange).
3 If you use the command line, specify the command line to pass to the editor, that is, the name of the editor and its path, for instance:
C:\WINNT\NOTEPAD.EXE.
UEW-8:1
IAR Embedded Workbench® IDEUser Guide
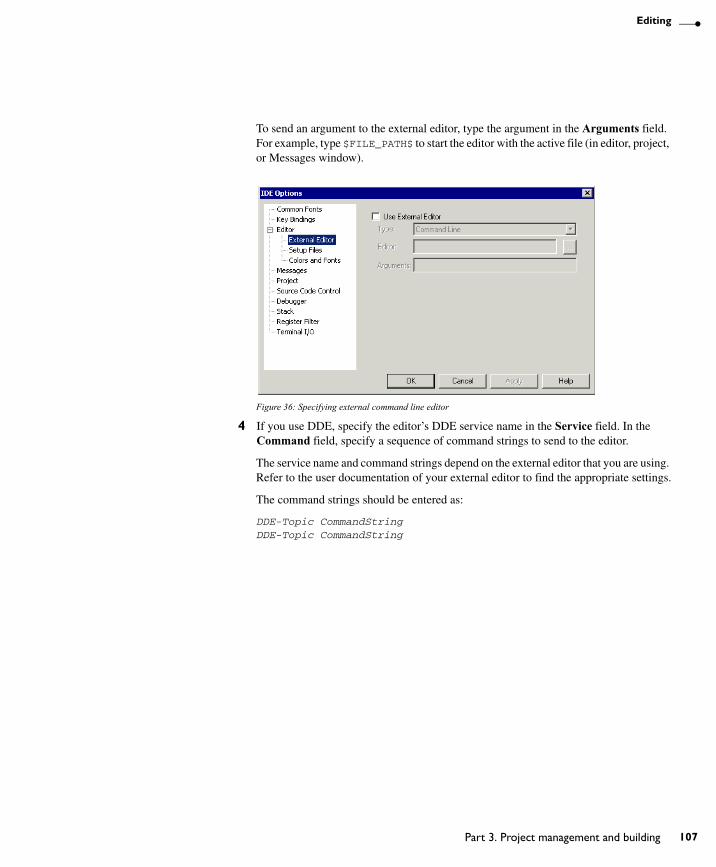
Editing
To send an argument to the external editor, type the argument in the Arguments field. For example, type $FILE_PATH$ to start the editor with the active file (in editor, project, or Messages window).
Figure 36: Specifying external command line editor
4 If you use DDE, specify the editor’s DDE service name in the Service field. In the Command field, specify a sequence of command strings to send to the editor.
The service name and command strings depend on the external editor that you are using. Refer to the user documentation of your external editor to find the appropriate settings.
The command strings should be entered as:
DDE-Topic CommandStringDDE-Topic CommandString
UEW-8:1
Part 3. Project management and building 107
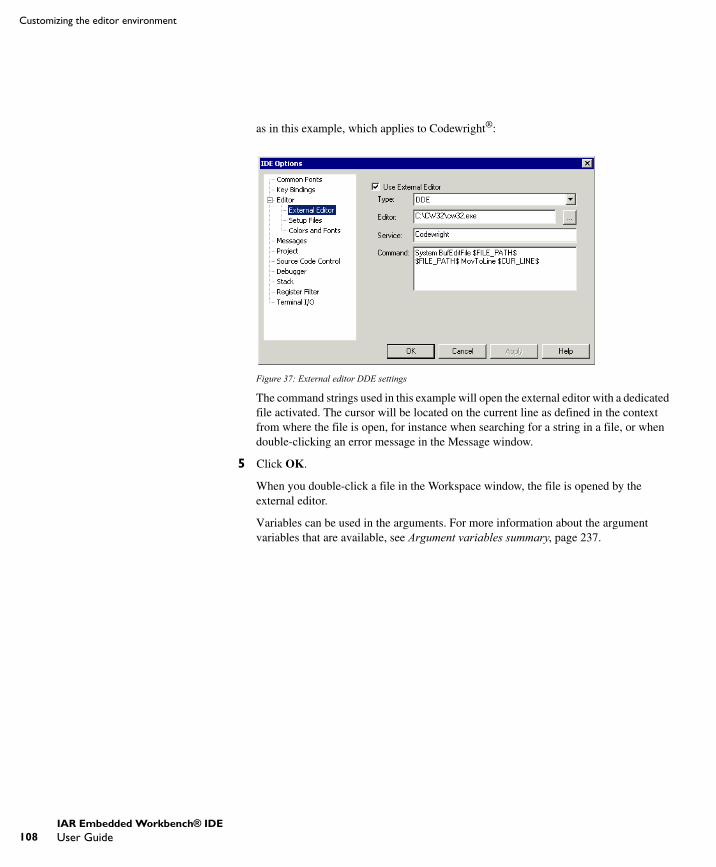
108
Customizing the editor environment
as in this example, which applies to Codewright®:
Figure 37: External editor DDE settings
The command strings used in this example will open the external editor with a dedicated file activated. The cursor will be located on the current line as defined in the context from where the file is open, for instance when searching for a string in a file, or when double-clicking an error message in the Message window.
5 Click OK.
When you double-click a file in the Workspace window, the file is opened by the external editor.
Variables can be used in the arguments. For more information about the argument variables that are available, see Argument variables summary, page 237.
UEW-8:1
IAR Embedded Workbench® IDEUser Guide

Part 4. DebuggingThis part of the IAR Embedded Workbench® IDE User Guide contains the following chapters:
● The IAR C-SPY® Debugger
● Executing your application
● Working with variables and expressions
● Using breakpoints
● Monitoring memory and registers
● Using the C-SPY® macro system
● Analyzing your application.
UEW-8:1
109

110
UEW-8:1

The IAR C-SPY® DebuggerThis chapter introduces you to the IAR C-SPY Debugger. First some of the concepts are introduced that are related to debugging in general and to C-SPY in particular. Then C-SPY environment is presented, followed by a description of how to setup, start, and finally adapt C-SPY to target hardware.
Debugger conceptsThis section introduces some of the concepts that are related to debugging in general and to C-SPY in particular. This section does not contain specific conceptual information related to the functionality of C-SPY. Instead, you will find such information in each chapter of this part of the guide. The IAR Systems user documentation uses the following terms when referring to these concepts.
C-SPY AND TARGET SYSTEMS
You can use C-SPY to debug either a software target system or a hardware target system.
UEW-8:1
Part 4. Debugging 111

112
Debugger concepts
This figure shows an overview of C-SPY and possible target systems.
Figure 38: C-SPY and target systems
DEBUGGER
The debugger, for instance C-SPY, is the program that you use for debugging your applications on a target system.
TARGET SYSTEM
The target system is the system on which you execute your application when you are debugging it. The target system can consist of hardware, either an evaluation board or your own hardware design. It can also be completely or partially simulated by software. Each type of target system needs a dedicated C-SPY driver.
USER APPLICATION
A user application is the software you have developed and which you want to debug using C-SPY.
C-SPY DEBUGGER SYSTEMS
C-SPY consists of both a general part which provides a basic set of debugger features, and a driver. The C-SPY driver is the part that provides communication with and control of the target system. The driver also provides the user interface—menus, windows, and
UEW-8:1
IAR Embedded Workbench® IDEUser Guide
The IAR C-SPY® Debugger
dialog boxes—to the functions provided by the target system, for instance, special breakpoints. There are three main types of C-SPY drivers:
● Simulator driver
● ROM-monitor driver
● Emulator driver
If you have more than one C-SPY driver installed on your computer, you can switch between them from within the IDE.
For an overview of the general features of C-SPY, see IAR C-SPY Debugger, page 5. For an overview of the functionality provided by each driver, see the online help system available from the Help menu. There might also be a driver guide in hypertext PDF format available in the doc directory. Contact your software distributor or IAR Systems representative for information about available C-SPY drivers. You can also find information on the IAR Systems website, www.iar.com.
ROM-MONITOR PROGRAM
The ROM-monitor program is a piece of firmware that is loaded to non-volatile memory on your target hardware; it runs in parallel with your application. The ROM-monitor communicates with the debugger and provides services needed for debugging the application, for instance stepping and breakpoints.
THIRD-PARTY DEBUGGERS
You can use a third-party debugger together with the IAR Systems tool chain as long as the third-party debugger can read any of the output formats provided by XLINK, such as UBROF, ELF/DWARF, COFF, Intel-extended, Motorola, or any other available format. For information about which format to use with third-party debuggers, see the user documentation supplied with that tool.
The C-SPY environmentAN INTEGRATED ENVIRONMENT
C-SPY is a high-level-language debugger for embedded applications. It is designed for use with the IAR Systems compiler and assembler, and is completely integrated in the IDE, providing development and debugging within the same application.
All windows that are open in the Embedded Workbench workspace will stay open when you start the C-SPY Debugger. In addition, a set of C-SPY-specific windows are opened.
UEW-8:1
Part 4. Debugging 113
114
Setting up C-SPY
You can modify your source code in an editor window during the debug session, but changes will not take effect until you exit from the debugger and rebuild your application.
The integration also makes it possible to set breakpoints in the text editor at any point during the development cycle. You can inspect and modify breakpoint definitions also when the debugger is not running, and breakpoint definitions flow with the text as you edit. Your debug settings, such as watch properties, window layouts, and register groups will remain between your debug sessions. When the debugger is running, breakpoints are highlighted in the editor windows.
In addition to the features available in the IDE, the C-SPY environment consists of a set of C-SPY-specific items, such as a debugging toolbar, menus, windows, and dialog boxes.
For reference information about each item specific to C-SPY, see the chapter C-SPY® reference, page 273.
For specific information about a C-SPY driver, see the part of the book corresponding to the driver.
Setting up C-SPYBefore you start C-SPY, you should set options to set up the debugger system. These options are available on the Setup page of the Debugger category, available with the Project>Options command. On the Plugins page you can find options for loading plug-in modules.
In addition to the options for setting up the debugger system, you can also set debugger-specific IDE options. These options are available with the Tools>Options command. For further information about these options, see Debugger options, page 259.
CHOOSING A DEBUG DRIVER
Before starting C-SPY, you must choose a driver for the debugger system from the Driver drop-down list on the Setup page. The contents of the drop-down list depend on your product installation; drivers for hardware debugger systems might, or might not be available. If you choose a driver for a hardware debugger system, you must also set hardware-specific options. For information about these options, see the online help system available from the Help menu.
If you choose a driver for a hardware debugger system, you must also set hardware-specific options. For information about these options, see the online help system available from the Help menu and Part 6. Reference information in this guide.
Note: You can only choose a driver you have installed on your computer.
UEW-8:1
IAR Embedded Workbench® IDEUser Guide
The IAR C-SPY® Debugger
EXECUTING FROM RESET
Using the Run to option, you can specify a location you want C-SPY to run to when you start the debugger as well as after each reset. C-SPY will place a breakpoint at this location and all code up to this point is executed before stopping at the location.
The default location to run to is the main function. Type the name of the location if you want C-SPY to run to a different location. You can specify assembler labels or whatever can be evaluated to such, for instance function names.
If you leave the check box empty, the program counter will then contain the regular hardware reset address at each reset.
If no breakpoints are available when C-SPY starts, a warning message notifies you that single stepping will be required and that this is time consuming. You can then continue execution in single step mode or stop at the first instruction. If you choose to stop at the first instruction, the debugger starts executing with the PC (program counter) at the default reset location instead of the location you typed in the Run to box.
Note: This message will never be displayed in the C-SPY Simulator, where breakpoints are not limited.
For driver-specific information about breakpoints, see the online help system available from the Help menu.
USING A SETUP MACRO FILE
A setup macro file is a standard macro file that you choose to load automatically when C-SPY starts. You can define the setup macro file to perform actions according to your needs, using setup macro functions and system macros. Thus, if you load a setup macro file you can initialize C-SPY to perform actions automatically.
To register a setup macro file, select Use macro file and type the path and name of your setup macro file, for example Setup.mac. If you do not type a filename extension, the extension mac is assumed. A browse button is available for your convenience.
For detailed information about setup macro files and functions, see The macro file, page 146. For an example about how to use a setup macro file, see the chapter Simulating an interrupt in Part 2. Tutorials.
SELECTING A DEVICE DESCRIPTION FILE
C-SPY uses device description files to handle several of the target-specific adaptations. They contain device-specific information about for example, definitions of peripheral units and CPU registers, and groups of these.
If you want to use the device-specific information provided in the device description file during your debug session, you must select the appropriate device description file.
UEW-8:1
Part 4. Debugging 115
116
Starting C-SPY
Device description files are provided in the cpuname\config directory and they have the filename extension ddf.
To load a device description file that suits your device, you must, before you start C-SPY, choose Project>Options and select the Debugger category. On the Setup page, enable the use of a description file and select a file using the Device description file browse button.
For an example about how to use a setup macro file, see Simulating an interrupt in Part 2. Tutorials.
LOADING PLUGIN MODULES
On the Plugins page you can specify C-SPY plugin modules that are to be loaded and made available during debug sessions. Plugin modules can be provided by IAR Systems, and by third-party suppliers. Contact your software distributor or IAR Systems representative, or visit the IAR Systems web site, for information about available modules.
For information about how to load plugin modules, see Plugins, page 359.
The C-SPY RTOS awareness plugin modules
Provided that one or more real-time operating systems plugin modules is supported for the IAR Embedded Workbench version you are using, you can load one for use with C-SPY. C-SPY RTOS awareness plugin modules give you a high level of control and visibility over an application built on top of a real-time operating system. It displays RTOS-specific items like task lists, queues, semaphores, mailboxes and various RTOS system variables. Task-specific breakpoints and task-specific stepping make it easier to debug tasks.
A loaded plugin will add its own set of windows and buttons when a debug session is started (provided that the RTOS is linked with the application). For information about other RTOS awareness plugin modules, refer to the manufacturer of the plugin module.
Starting C-SPY When you have set up the debugger, you are ready to start a debug session.
To start C-SPY and load the current project, click the Download and Debug button. Alternatively, choose Project>Download and Debug.
To start C-SPY without reloading the current project, click the Debug without Downloading button. Alternatively, choose Project>Debug without Downloading.
For information about how to execute your application and how to use the C-SPY features, see the remaining chapters in Part 4. Debugging.
UEW-8:1
IAR Embedded Workbench® IDEUser Guide

The IAR C-SPY® Debugger
EXECUTABLE FILES BUILT OUTSIDE OF THE IDE
You can also load C-SPY with a project that was built outside the IDE, for example projects built on the command line. To be able to set debugger options for the externally built project, you must create a project within the IDE.
To load an externally built executable file, you must first create a project for it in your workspace. Choose Project>Create New Project, and specify a project name. To add the executable file to the project, choose Project>Add Files and make sure to choose All Files in the Files of type drop-down list. Locate the executable file (filename extension dxx). To start the executable file, select the project in the Workspace window and click the Debug button. The project can be reused whenever you rebuild your executable file.
The only project options that are meaningful to set for this kind of project are options in the General Options and Debugger categories. Make sure to set up the general project options in the same way as when the executable file was built.
To flash an externally generated application, a corresponding sim file must be available in the same directory as the dxx file.
LOADING MULTIPLE DEBUG FILES
Normally, a debuggable application consists of exactly one file that you debug. However, it is also possible to load additional debug files after a debug session has started. This means that the complete program consists of several debug files.
Typically, this is useful if you want to debug your application in combination with a prebuilt ROM image that contains an additional library for some platform-provided features. The ROM image and the application are built using separate projects in the IAR Embedded Workbench IDE and generate separate output files. Normally, you will only have access to debug information for the debug file of the active project.
To load an additional debug file, use the __loadModule system macro. For more information, see __loadModule, page 380.
REDIRECTING DEBUGGER OUTPUT TO A FILE
The Debug Log window—available from the View menu—displays debugger output, such as diagnostic messages and trace information. It can sometimes be convenient to log the information to a file where you can easily inspect it. The Log Files dialog box—available from the Debug menu—allows you to log output from C-SPY to a file. The two main advantages are:
● The file can be opened in another tool, for instance an editor, so you can navigate and search within the file for particularly interesting parts
UEW-8:1
Part 4. Debugging 117

118
Starting C-SPY
● The file provides history about how you have controlled the execution, for instance, what breakpoints have been triggered etc.
By default, the information printed in the file is the same as the information listed in the Log window. However, you can choose what you want to log in the file: errors, warnings, system information, user messages, or all of these. For reference information about the Log File options, see Log File dialog box, page 308.
UEW-8:1
IAR Embedded Workbench® IDEUser Guide
Executing your applicationThe IAR C-SPY® Debugger provides a flexible range of facilities for executing your application during debugging. This chapter contains information about:
● The conceptual differences between source mode and disassembly mode debugging
● Executing your application
● The call stack
● Handling terminal input and output.
Source and disassembly mode debuggingC-SPY allows you to switch seamlessly between source mode and disassembly mode debugging as required.
Source debugging provides the fastest and easiest way of developing your application, without having to worry about how the compiler or assembler has implemented the code. In the editor windows you can execute the application one statement at a time while monitoring the values of variables and data structures.
Disassembly mode debugging lets you focus on the critical sections of your application, and provides you with precise control over the hardware. You can open a disassembly window which displays a mnemonic assembler listing of your application based on actual memory contents rather than source code, and lets you execute the application exactly one instruction at a time. In Mixed-Mode display, the debugger also displays the corresponding C/C++ source code interleaved with the disassembly listing.
Regardless of which mode you are debugging in, you can display registers and memory, and change their contents.
For an example of a debug session both in C source mode and disassembly mode, see Debugging the application, page 39.
ExecutingC-SPY provides a flexible range of features for executing your application. You can find commands for executing on the Debug menu and on the toolbar.
UEW-8:1
Part 4. Debugging 119

120
Executing
STEP
C-SPY allows more stepping precision than most other debuggers because it is not line-oriented but statement-oriented. The compiler generates detailed stepping information in the form of step points at each statement, and at each function call. That is, source code locations where you might consider whether to execute a step into or a step over command. Because the step points are located not only at each statement but also at each function call, the step functionality allows a finer granularity than just stepping on statements. There are four step commands:
● Step Into
● Step Over
● Next Statement
● Step Out
Consider this example and assume that the previous step has taken you to the f(i) function call (highlighted):
int f(int n){ value = f(n-1) + f(n-2) + f(n-3); return value; }...f(i);value ++;
While stepping, you typically consider whether to step into a function and continue stepping inside the function or subroutine. The Step Into command takes you to the first step point within the subroutine, f(n-1):
int f(int n){ value = f(n-1) + f(n-2) + f(n-3); return value;}...f(i);value ++;
The Step Into command executes to the next step point in the normal flow of control, regardless of whether it is in the same or another function.
The Step Over command executes to the next step point in the same function, without stopping inside called functions. The command would take you to the f(n-2) function call, which is not a statement on its own but part of the same statement as f(n-1). Thus,
UEW-8:1
IAR Embedded Workbench® IDEUser Guide
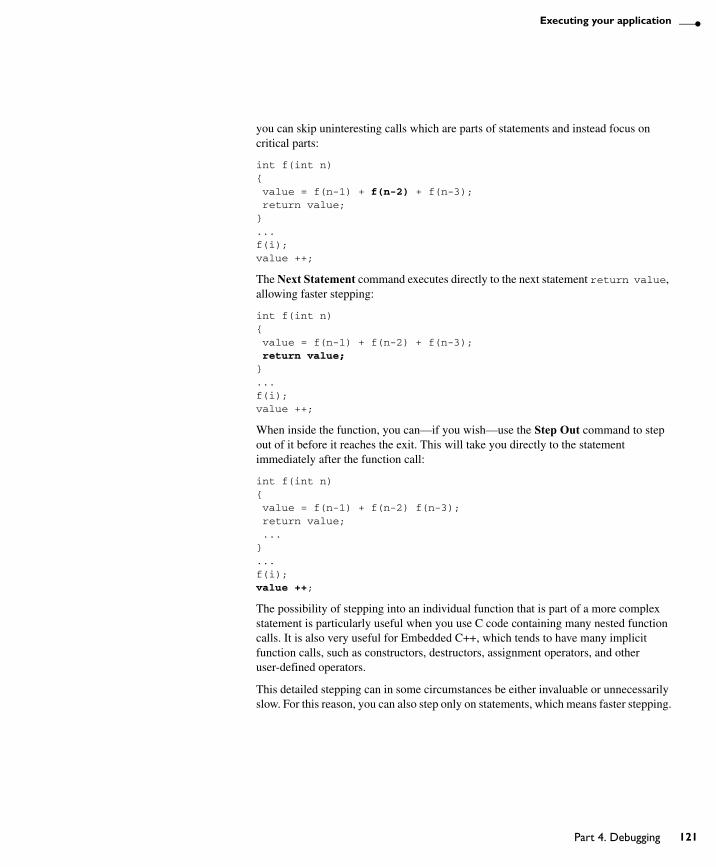
Executing your application
you can skip uninteresting calls which are parts of statements and instead focus on critical parts:
int f(int n){ value = f(n-1) + f(n-2) + f(n-3); return value;}...f(i);value ++;
The Next Statement command executes directly to the next statement return value, allowing faster stepping:
int f(int n){ value = f(n-1) + f(n-2) + f(n-3); return value;}...f(i);value ++;
When inside the function, you can—if you wish—use the Step Out command to step out of it before it reaches the exit. This will take you directly to the statement immediately after the function call:
int f(int n){ value = f(n-1) + f(n-2) f(n-3); return value; ...}...f(i);value ++;
The possibility of stepping into an individual function that is part of a more complex statement is particularly useful when you use C code containing many nested function calls. It is also very useful for Embedded C++, which tends to have many implicit function calls, such as constructors, destructors, assignment operators, and other user-defined operators.
This detailed stepping can in some circumstances be either invaluable or unnecessarily slow. For this reason, you can also step only on statements, which means faster stepping.
UEW-8:1
Part 4. Debugging 121

122
Executing
GO
The Go command continues execution from the current position until a breakpoint or program exit is reached.
RUN TO CURSOR
The Run to Cursor command executes to the position in the source code where you have placed the cursor. The Run to Cursor command also works in the Disassembly window and in the Call Stack window.
HIGHLIGHTING
At each stop, C-SPY highlights the corresponding C or C++ source or instruction with a green color, in the editor and the Disassembly window respectively. In addition, a green arrow appears in the editor window when you step on C or C++ source level, and in the Disassembly window when you step on disassembly level. This is determined by which of the windows is the active window. If none of the windows are active, it is determined by which of the window is currently placed over the other window.
Figure 39: C-SPY highlighting source location
For simple statements without function calls, the whole statement is typically highlighted. When stopping at a statement with function calls, C-SPY highlights the first call because this illustrates more clearly what Step Into and Step Over would mean at that time.
Occasionally, you will notice that a statement in the source window is highlighted using a pale variant of the normal highlight color. This happens when the program counter is at an assembler instruction which is part of a source statement but not exactly at a step point. This is often the case when stepping in the Disassembly window. Only when the program counter is at the first instruction of the source statement, the ordinary highlight color is used.
USING BREAKPOINTS TO STOP
You can set breakpoints in the application to stop at locations of particular interest. These locations can be either at code sections where you want to investigate whether your program logic is correct, or at data accesses to investigate when and how the data
UEW-8:1
IAR Embedded Workbench® IDEUser Guide
Executing your application
is changed. Depending on which debugger system you are using you might also have access to additional types of breakpoints. For instance, if you are using the C-SPY Simulator, a special kind of breakpoint facilitates simulation of simple hardware devices. See the chapter Simulator-specific debugging for further details.
For a more advanced simulation, you can stop under certain conditions, which you specify. You can also connect a C-SPY macro to the breakpoint. The macro can be defined to perform actions, which for instance can simulate specific hardware behavior.
All these possibilities provide you with a flexible tool for investigating the status of, for example, variables and registers at different stages during the application execution.
For detailed information about the breakpoint system and how to use the breakpoint types, see the chapter Using breakpoints.
USING THE BREAK BUTTON TO STOP
While your application is executing, the Break button on the debug toolbar is highlighted in red. To stop the execution, click the Break button or choose the Debug>Break command.
STOP AT PROGRAM EXIT
Typically, the execution of an embedded application is not intended to end, which means that the application will not make use of a traditional exit. However, in some situations a controlled exit is necessary, such as during debug sessions. You can link your application with a special library that contains an exit label. A breakpoint will be automatically set on that label to stop execution when it gets there. Before you start C-SPY, choose Project>Options, and select the Linker category. On the Output page, select the option With runtime control modules (-r).
Call stack informationThe compiler generates extensive backtrace information. This allows C-SPY to show, without any runtime penalty, the complete call chain at any time.
Typically, this is useful for two purposes:
● Determining in what context the current function has been called
● Tracing the origin of incorrect values in variables and incorrect values in parameters, thus locating the function in the call chain where the problem occurred.
The Call Stack window—available from the View menu—shows a list of function calls, with the current function at the top. When you inspect a function in the call chain, by double-clicking on any function call frame, the contents of all affected windows are updated to display the state of that particular call frame. This includes the editor, Locals,
UEW-8:1
Part 4. Debugging 123
124
Terminal input and output
Register, Watch and Disassembly windows. A function would normally not make use of all registers, so these registers might have undefined states and be displayed as dashes (---). For reference information about the Call Stack window, see Call Stack window, page 294.
In the editor and Disassembly windows, a green highlight indicates the topmost, or current, call frame; a yellow highlight is used when inspecting other frames.
For your convenience, it is possible to select a function in the call stack and click the Run to Cursor command—available on the Debug menu, or alternatively on the context menu—to execute to that function.
Assembler source code does not automatically contain any backtrace information. To be able to see the call chain also for your assembler modules, you can add the appropriate CFI assembler directives to the source code. For further information, see the IAR Assembler Reference Guide.
Terminal input and outputSometimes you might have to debug constructions in your application that use stdin and stdout without an actual hardware device for input and output. The Terminal I/O window—available on the View menu—lets you enter input to your application, and display output from it.
This facility is useful in two different contexts:
● If your application uses stdin and stdout
● For producing debug trace printouts.
To use this window, you must link your application with the option With I/O emulation modules. C-SPY will then direct stdin, stdout, and stderr to this window.
For reference information, see Terminal I/O window, page 295.
Directing stdin and stdout to a file
You can also direct stdin and stdout directly to a file. You can then open the file in another tool, for instance an editor, to navigate and search within the file for particularly interesting parts. The Terminal I/O Log Files dialog box—available by choosing Debug>Logging—allows you to select a destination log file, and to log terminal I/O input and output from C-SPY to this file.
For reference information, see Terminal I/O Log File dialog box, page 309.
UEW-8:1
IAR Embedded Workbench® IDEUser Guide
Working with variables and expressionsThis chapter defines the variables and expressions used in C-SPY®. It also demonstrates the methods for examining variables and expressions.
C-SPY expressionsC-SPY lets you examine the C variables, C expressions, and assembler symbols that you have defined in your application code. In addition, C-SPY allows you to define C-SPY macro variables and macro functions and use them when evaluating expressions. Expressions that are built with these components are called C-SPY expressions and there are several methods for monitoring these in C-SPY.
C-SPY expressions can include any type of C expression, except function calls. The following types of symbols can be used in expressions:
● C/C++ symbols
● Assembler symbols (register names and assembler labels)
● C-SPY macro functions
● C-SPY macro variables
Examples of valid C-SPY expressions are:
i + ji = 42#asm_label#R2#PCmy_macro_func(19)
C SYMBOLS
C symbols are symbols that you have defined in the C source code of your application, for instance variables, constants, and functions. C symbols can be referenced by their names.
UEW-8:1
Part 4. Debugging 125
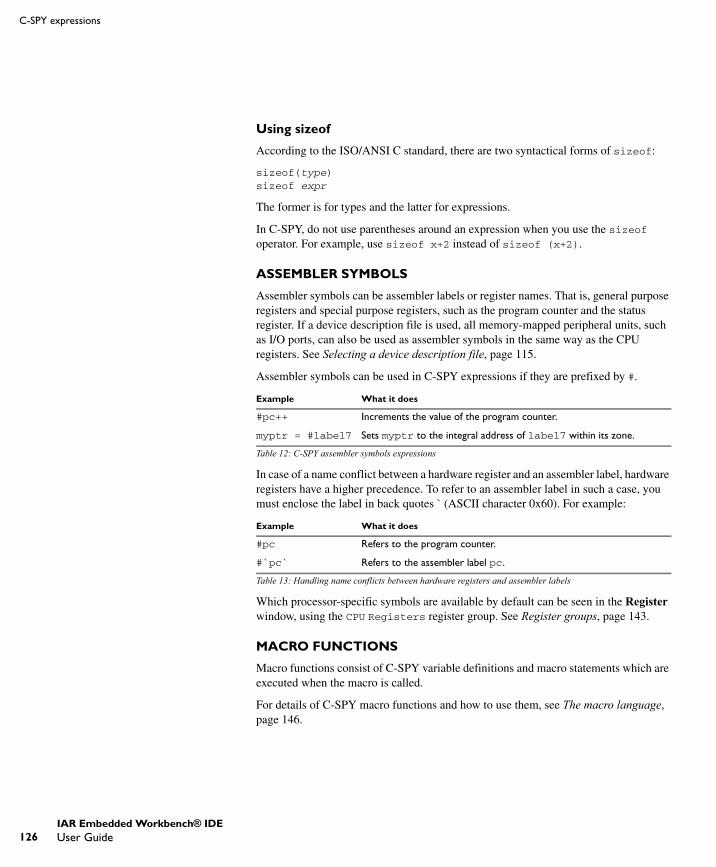
126
C-SPY expressions
Using sizeof
According to the ISO/ANSI C standard, there are two syntactical forms of sizeof:
sizeof(type)sizeof expr
The former is for types and the latter for expressions.
In C-SPY, do not use parentheses around an expression when you use the sizeof operator. For example, use sizeof x+2 instead of sizeof (x+2).
ASSEMBLER SYMBOLS
Assembler symbols can be assembler labels or register names. That is, general purpose registers and special purpose registers, such as the program counter and the status register. If a device description file is used, all memory-mapped peripheral units, such as I/O ports, can also be used as assembler symbols in the same way as the CPU registers. See Selecting a device description file, page 115.
Assembler symbols can be used in C-SPY expressions if they are prefixed by #.
In case of a name conflict between a hardware register and an assembler label, hardware registers have a higher precedence. To refer to an assembler label in such a case, you must enclose the label in back quotes ` (ASCII character 0x60). For example:
Which processor-specific symbols are available by default can be seen in the Register window, using the CPU Registers register group. See Register groups, page 143.
MACRO FUNCTIONS
Macro functions consist of C-SPY variable definitions and macro statements which are executed when the macro is called.
For details of C-SPY macro functions and how to use them, see The macro language, page 146.
Example What it does
#pc++ Increments the value of the program counter.
myptr = #label7 Sets myptr to the integral address of label7 within its zone.
Table 12: C-SPY assembler symbols expressions
Example What it does
#pc Refers to the program counter.
#`pc` Refers to the assembler label pc.
Table 13: Handling name conflicts between hardware registers and assembler labels
UEW-8:1
IAR Embedded Workbench® IDEUser Guide

Working with variables and expressions
MACRO VARIABLES
Macro variables are defined and allocated outside your application, and can be used in a C-SPY expression. In case of a name conflict between a C symbol and a C-SPY macro variable, the C-SPY macro variable will have a higher precedence than the C variable. Assignments to a macro variable assigns both its value and type.
For details of C-SPY macro variables and how to use them, see The macro language, page 369.
Limitations on variable informationThe value of a C variable is valid only on step points, that is, the first instruction of a statement and on function calls. This is indicated in the editor window with a bright green highlight color. In practice the value of the variable is accessible and correct more often than that.
When the program counter is inside a statement, but not at a step point, the statement or part of the statement is highlighted with a pale variant of the ordinary highlight color.
EFFECTS OF OPTIMIZATIONS
The compiler is free to optimize the application software as much as possible, as long as the expected behavior remains. Depending on your project settings, a high level of optimization results in smaller or faster code, but also in increased compile time. Debugging might be more difficult because it will be less clear how the generated code relates to the source code. Typically, using a high optimization level can affect the code in a way that will not allow you to view a value of a variable as expected.
Consider this example:
foo(){ int i = 42; ... x = bar(i); //Not until here the value of i is known to C-SPY ...}
From the point where the variable i is declared until it is actually used, the compiler does not need to waste stack or register space on it. The compiler can optimize the code, which means C-SPY will not be able to display the value until it is actually used. If you try to view a value of a variable that is temporarily unavailable, C-SPY will display the text:
Unavailable
UEW-8:1
Part 4. Debugging 127
128
Viewing variables and expressions
If you need full information about values of variables during your debugging session, you should make sure to use the lowest optimization level during compilation, that is, None.
Viewing variables and expressionsThere are several methods for looking at variables and calculating their values:
● Tooltip watch—in the editor window—provides the simplest way of viewing the value of a variable or more complex expressions. Just point at the variable with the pointer. The value is displayed next to the variable.
● The Auto window—available from the View menu—automatically displays a useful selection of variables and expressions in, or near, the current statement.
● The Locals window—available from the View menu—automatically displays the local variables, that is, auto variables and function parameters for the active function.
● The Watch window—available from the View menu—allows you to monitor the values of C-SPY expressions and variables.
● The Live Watch window—available from the View menu—repeatedly samples and displays the value of expressions while your application is executing. Variables in the expressions must be statically located, such as global variables.
● The Statics window—available from the View menu—automatically displays the values of variables with static storage duration.
● The Quick Watch window, see Using the Quick Watch window, page 129.
● The Trace system, see Using the trace system, page 129.
For text that is too wide to fit in a column—in any of the these windows, except the Trace window—and thus is truncated, just point at the text with the mouse pointer and tooltip information is displayed.
For reference information about the windows, see C-SPY windows, page 273.
WORKING WITH THE WINDOWS
All the windows are easy to use. You can add, modify, and remove expressions, and change the display format.
A context menu containing useful commands is available in all windows if you right-click in each window. Convenient drag-and-drop between windows is supported, except for in the Locals window and the Quick Watch window where it is not applicable.
UEW-8:1
IAR Embedded Workbench® IDEUser Guide

Working with variables and expressions
To add a value you can also click in the dotted rectangle and type the expression you want to examine. To modify the value of an expression, click in the Value field and modify its content. To remove an expression, select it and press the Delete key.
Using the Quick Watch window
The Quick Watch window—available from the View menu—lets you watch the value of a variable or expression and evaluate expressions.
The Quick Watch window is different from the Watch window in the following ways:
● The Quick Watch window offers a fast method for inspecting and evaluating expressions. Right-click on the expression you want to examine and choose Quick Watch from the context menu that appears. The expression will automatically appear in the Quick Watch window.
● In contrast to the Watch window, the Quick Watch window gives you precise control over when to evaluate the expression. For single variables this might not be necessary, but for expressions with side effects, such as assignments and C-SPY macro functions, it allows you to perform evaluations under controlled conditions.
USING THE TRACE SYSTEM
A trace is a recorded sequence of events in the target system, typically executed machine instructions. Depending on what C-SPY driver you are using, additional types of trace data can be recorded. For example, read and write accesses to memory, and the values of C-SPY expressions.
By using the trace system, you can trace the program flow up to a specific state, for instance an application crash, and use the trace information to locate the origin of the problem. Trace information can be useful for locating programming errors that have irregular symptoms and occur sporadically. Trace information can also be useful as test documentation.
The trace system is not supported by all C-SPY drivers. For detailed information about the trace system and the components provided by the C-SPY driver you are using, see the corresponding driver documentation.
Which trace system functionality that is provided depends on the C-SPY driver you are using. However, for all C-SPY drivers that support the trace system, the Trace window, the Find in Trace window, and the Find in Trace dialog box are always available. You can save the trace information to a file to be analyzed later.
The Trace window and its browse mode
The type of information that is displayed in the Trace window depends on the C-SPY driver you are using. The various types of trace data are displayed in separate columns,
UEW-8:1
Part 4. Debugging 129
130
Viewing variables and expressions
but the Trace column is always available if the driver you are using supports the trace system. The corresponding source code can also be shown.
To follow the execution history, simply look and scroll in the Trace window. Alternatively, you can enter browse mode. To enter browse mode, double-click an item in the Trace window, or click the Browse toolbar button. The selected item turns yellow and the source and disassembly windows will highlight the corresponding location. You can now move around in the Trace window using the up and down arrow keys, or by scrolling and clicking; the source and Disassembly windows will be updated to show the corresponding location. Double-click again to leave browse mode.
Searching in the trace data
You can perform advanced searches in the recorded trace data. You specify the search criteria in the Find in Trace dialog box and view the result in the Find in Trace window.
The Find in Trace window is very similar to the Trace window, showing the same columns and data, but only those rows that match the specified search criteria. Double-clicking an item in the Find in Trace window brings up the same item in the Trace window.
VIEWING ASSEMBLER VARIABLES
An assembler label does not convey any type information at all, which means C-SPY cannot easily display data located at that label without getting extra information. To view data conveniently, C-SPY treats, by default, all data located at assembler labels as variables of type int. However, in the Watch, Quick Watch, and Live Watch windows, you can select a different interpretation to better suit the declaration of the variables.
UEW-8:1
IAR Embedded Workbench® IDEUser Guide
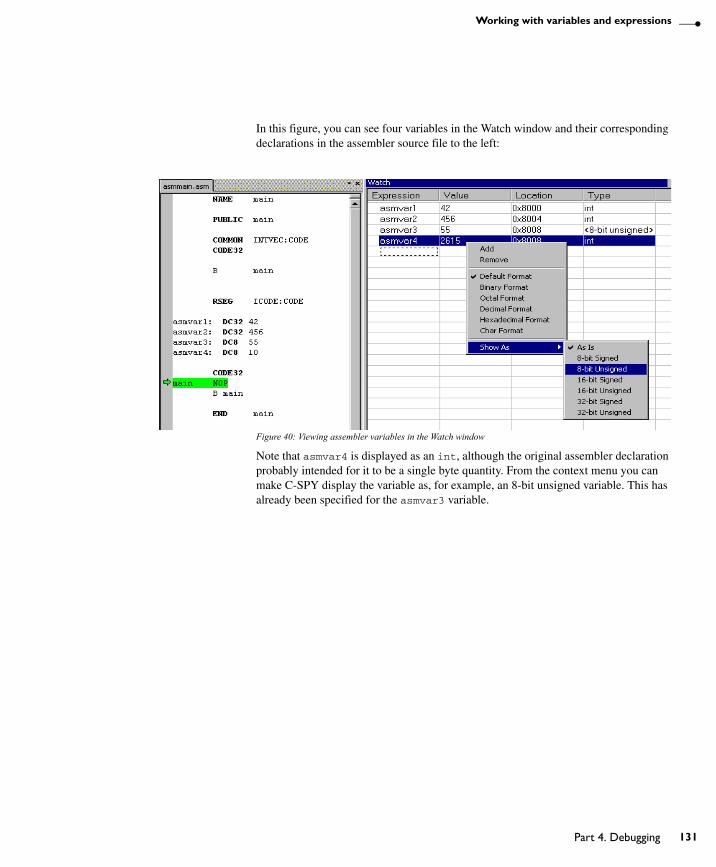
Working with variables and expressions
In this figure, you can see four variables in the Watch window and their corresponding declarations in the assembler source file to the left:
Figure 40: Viewing assembler variables in the Watch window
Note that asmvar4 is displayed as an int, although the original assembler declaration probably intended for it to be a single byte quantity. From the context menu you can make C-SPY display the variable as, for example, an 8-bit unsigned variable. This has already been specified for the asmvar3 variable.
UEW-8:1
Part 4. Debugging 131

132
Viewing variables and expressions
UEW-8:1
IAR Embedded Workbench® IDEUser Guide
Using breakpointsThis chapter describes the breakpoint system and various ways to create and monitor breakpoints. The chapter also gives some useful breakpoint tips and information about breakpoint consumers.
The breakpoint systemThe C-SPY® breakpoint system lets you set various kinds of breakpoints in the application you are debugging, allowing you to stop at locations of particular interest. You can set a breakpoint at a code location to investigate whether your program logic is correct, or to get trace printouts. In addition to code breakpoints, and depending on what C-SPY driver you are using, additional breakpoint types might be available. For example, you might be able to set a data breakpoint, to investigate how and when the data changes. If you are using the simulator driver you can also set immediate breakpoints. C-SPY also provides several ways of defining the breakpoints.
All your breakpoints are listed in the Breakpoints window where you can conveniently monitor, enable, and disable them.
You can let the execution stop only under certain conditions, which you specify. You can also let the breakpoint trigger a side effect, for instance executing a C-SPY macro function, without stopping the execution. The macro function can be defined to perform a wide variety of actions, for instance, simulating hardware behavior.
You can set breakpoints while you edit your code even if no debug session is active. The breakpoints will then be validated when the debug session starts. Breakpoints are preserved between debug sessions.
All these possibilities provide you with a flexible tool for investigating the status of your application.
Defining breakpointsYou can set breakpoints in many various ways and the breakpoints you define will appear in the Breakpoints window. From this window you can conveniently view all breakpoints, enable and disable breakpoints, and open a dialog box for defining new breakpoints.
Breakpoints are set with a higher precision than single lines, using the same mechanism as when stepping; for more details about the precision, see Step, page 120.
UEW-8:1
Part 4. Debugging 133
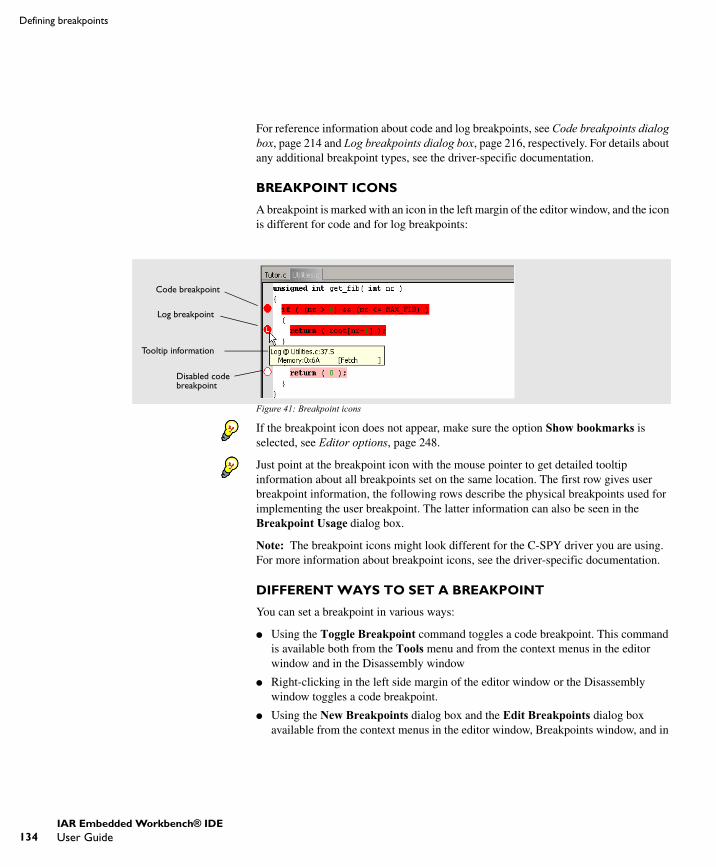
134
Defining breakpoints
For reference information about code and log breakpoints, see Code breakpoints dialog box, page 214 and Log breakpoints dialog box, page 216, respectively. For details about any additional breakpoint types, see the driver-specific documentation.
BREAKPOINT ICONS
A breakpoint is marked with an icon in the left margin of the editor window, and the icon is different for code and for log breakpoints:
Figure 41: Breakpoint icons
If the breakpoint icon does not appear, make sure the option Show bookmarks is selected, see Editor options, page 248.
Just point at the breakpoint icon with the mouse pointer to get detailed tooltip information about all breakpoints set on the same location. The first row gives user breakpoint information, the following rows describe the physical breakpoints used for implementing the user breakpoint. The latter information can also be seen in the Breakpoint Usage dialog box.
Note: The breakpoint icons might look different for the C-SPY driver you are using. For more information about breakpoint icons, see the driver-specific documentation.
DIFFERENT WAYS TO SET A BREAKPOINT
You can set a breakpoint in various ways:
● Using the Toggle Breakpoint command toggles a code breakpoint. This command is available both from the Tools menu and from the context menus in the editor window and in the Disassembly window
● Right-clicking in the left side margin of the editor window or the Disassembly window toggles a code breakpoint.
● Using the New Breakpoints dialog box and the Edit Breakpoints dialog box available from the context menus in the editor window, Breakpoints window, and in
Code breakpoint
Log breakpoint
Tooltip information
Disabled code breakpoint
UEW-8:1
IAR Embedded Workbench® IDEUser Guide

Using breakpoints
the Disassembly window. The dialog boxes give you access to all breakpoint options.
● Setting a data breakpoint on a memory area directly in the Memory window.
● Using predefined system macros for setting breakpoints, which allows automation.
The different methods allow different levels of simplicity, complexity, and automation.
TOGGLING A SIMPLE CODE BREAKPOINT
Toggling a code breakpoint is a quick method of setting a breakpoint. The following methods are available both in the editor window and in the Disassembly window:
● Double-click in the gray left-side margin of the window
● Place the insertion point in the C source statement or assembler instruction where you want the breakpoint, and click the Toggle Breakpoint button in the toolbar
● Choose Edit>Toggle Breakpoint● Right-click and choose Toggle Breakpoint from the context menu.
DEFINING BREAKPOINTS USING THE DIALOG BOX
The advantage of using a breakpoint dialog box is that it provides you with a graphical interface where you can interactively fine-tune the characteristics of the breakpoints. You can set the options and quickly test whether the breakpoint works according to your intentions.
All breakpoints you define using a breakpoint dialog box are preserved between debug sessions.
You can open the dialog box from the context menu available in the editor window, Breakpoints window, and in the Disassembly window.
To define a new breakpoint
1 Choose View>Breakpoints to open the Breakpoints window.
2 In the Breakpoints window, right-click to open the context menu.
3 On the context menu, choose New Breakpoint.
4 On the submenu, choose the breakpoint type you want to set. Depending on the C-SPY driver you are using, different breakpoint types might be available.
UEW-8:1
Part 4. Debugging 135
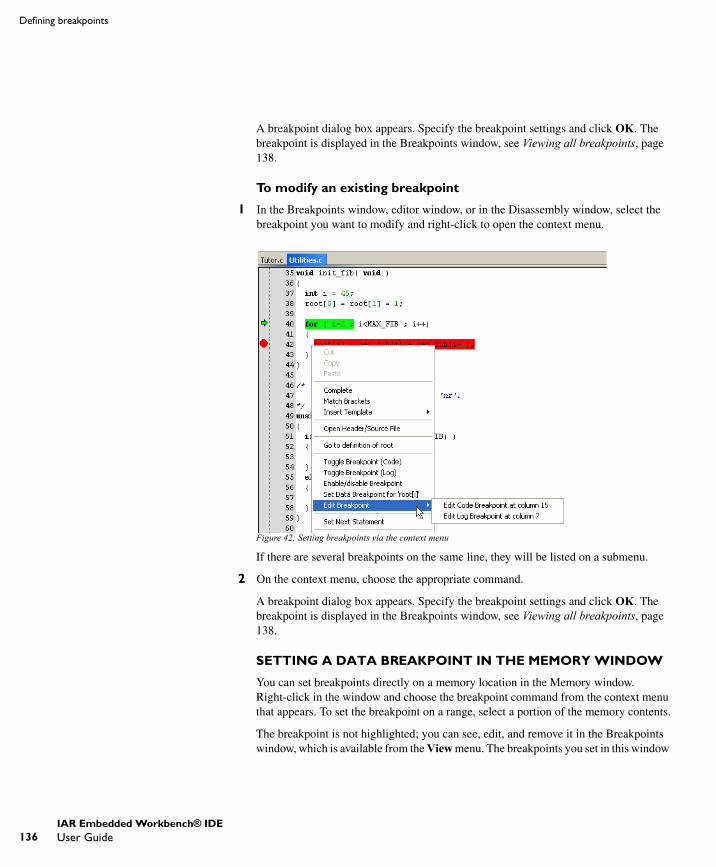
136
Defining breakpoints
A breakpoint dialog box appears. Specify the breakpoint settings and click OK. The breakpoint is displayed in the Breakpoints window, see Viewing all breakpoints, page 138.
To modify an existing breakpoint
1 In the Breakpoints window, editor window, or in the Disassembly window, select the breakpoint you want to modify and right-click to open the context menu.
Figure 42: Setting breakpoints via the context menu
If there are several breakpoints on the same line, they will be listed on a submenu.
2 On the context menu, choose the appropriate command.
A breakpoint dialog box appears. Specify the breakpoint settings and click OK. The breakpoint is displayed in the Breakpoints window, see Viewing all breakpoints, page 138.
SETTING A DATA BREAKPOINT IN THE MEMORY WINDOW
You can set breakpoints directly on a memory location in the Memory window. Right-click in the window and choose the breakpoint command from the context menu that appears. To set the breakpoint on a range, select a portion of the memory contents.
The breakpoint is not highlighted; you can see, edit, and remove it in the Breakpoints window, which is available from the View menu. The breakpoints you set in this window
UEW-8:1
IAR Embedded Workbench® IDEUser Guide
Using breakpoints
will be triggered for both read and write accesses. All breakpoints defined in the Memory window are preserved between debug sessions.
Setting different types of breakpoints in the Memory window is only supported if the driver you use supports these types of breakpoints.
DEFINING BREAKPOINTS USING SYSTEM MACROS
You can define breakpoints not only in the breakpoint dialog box but also by using built-in C-SPY system macros. When you use macros for defining breakpoints, the breakpoint characteristics are specified as function parameters.
Macros are useful when you have already specified your breakpoints so that they fully meet your requirements. You can define your breakpoints in a macro file, using built-in system macros, and execute the file at C-SPY startup. The breakpoints will then be set automatically each time you start C-SPY. Another advantage is that the debug session will be documented, and that several engineers involved in the development project can share the macro files.
If you use system macros for setting breakpoints, you can still view and modify them in the Breakpoints window. In contrast to using the dialog box for defining breakpoints, all breakpoints that are defined using system macros are removed when you exit the debug session.
These breakpoint macros are available:
__setCodeBreak__setDataBreak__setSimBreak__clearBreak
For details of each breakpoint macro, see the chapter C-SPY® macros reference.
Defining breakpoints at C-SPY startup using a setup macro file
You can use a setup macro file to define breakpoints at C-SPY startup. Follow the procedure described in Registering and executing using setup macros and setup files, page 149.
USEFUL BREAKPOINT TIPS
Below comes some useful tips related to setting breakpoints.
Tracing incorrect function arguments
If a function with a pointer argument is sometimes incorrectly called with a NULL argument, it is useful to put a breakpoint on the first line of the function with a condition
UEW-8:1
Part 4. Debugging 137
138
Viewing all breakpoints
that is true only when the parameter is 0. The breakpoint will then not be triggered until the problematic situation actually occurs.
Performing a task with or without stopping execution
You can perform a task when a breakpoint is triggered with or without stopping the execution.
You can use the Action text box to associate an action with the breakpoint, for instance a C-SPY macro function. When the breakpoint is triggered and the execution of your application has stopped, the macro function will be executed.
If you instead want to perform a task without stopping the execution, you can set a condition which returns 0 (false). When the breakpoint is triggered, the condition is evaluated and because it is not true, execution continues.
Consider this example where the C-SPY macro function performs a simple task:
__var my_counter;
count(){ my_counter += 1; return 0;}
To use this function as a condition for the breakpoint, type count() in the Expression text box under Conditions. The task will then be performed when the breakpoint is triggered. Because the macro function count returns 0, the condition is false and the execution of the program will resume automatically, without any stop.
Viewing all breakpointsTo view breakpoints, you can use the Breakpoints window and the Breakpoints Usage dialog box.
For information about the Breakpoints window, see Breakpoints window, page 213.
UEW-8:1
IAR Embedded Workbench® IDEUser Guide
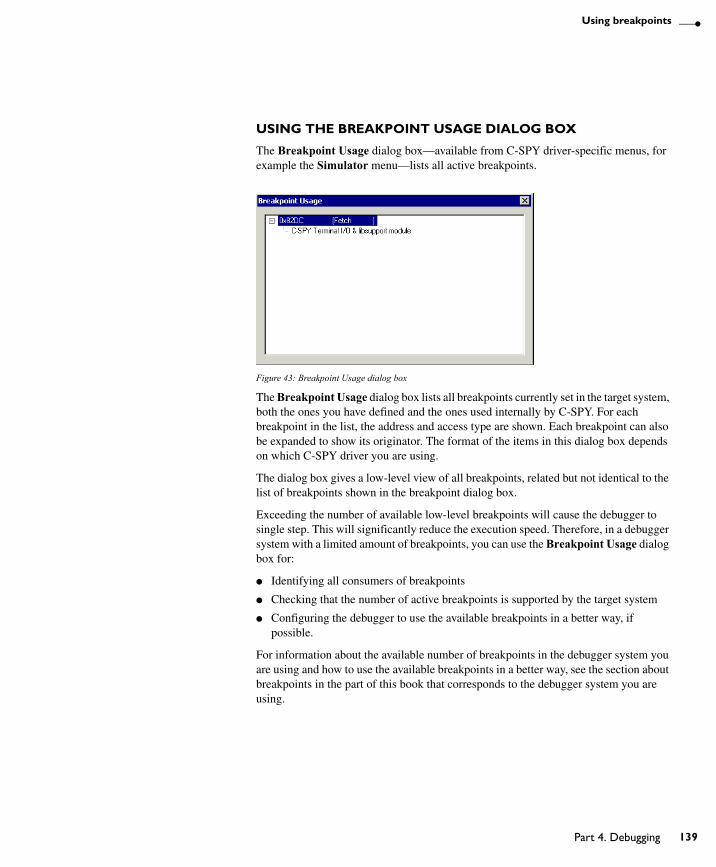
Using breakpoints
USING THE BREAKPOINT USAGE DIALOG BOX
The Breakpoint Usage dialog box—available from C-SPY driver-specific menus, for example the Simulator menu—lists all active breakpoints.
Figure 43: Breakpoint Usage dialog box
The Breakpoint Usage dialog box lists all breakpoints currently set in the target system, both the ones you have defined and the ones used internally by C-SPY. For each breakpoint in the list, the address and access type are shown. Each breakpoint can also be expanded to show its originator. The format of the items in this dialog box depends on which C-SPY driver you are using.
The dialog box gives a low-level view of all breakpoints, related but not identical to the list of breakpoints shown in the breakpoint dialog box.
Exceeding the number of available low-level breakpoints will cause the debugger to single step. This will significantly reduce the execution speed. Therefore, in a debugger system with a limited amount of breakpoints, you can use the Breakpoint Usage dialog box for:
● Identifying all consumers of breakpoints
● Checking that the number of active breakpoints is supported by the target system
● Configuring the debugger to use the available breakpoints in a better way, if possible.
For information about the available number of breakpoints in the debugger system you are using and how to use the available breakpoints in a better way, see the section about breakpoints in the part of this book that corresponds to the debugger system you are using.
UEW-8:1
Part 4. Debugging 139
140
Viewing all breakpoints
BREAKPOINT CONSUMERS
A debugger system includes several consumers of breakpoints.
User breakpoints—the breakpoints you define in the breakpoint dialog box or by toggling breakpoints in the editor window—often consume one low-level breakpoint each, but this can vary greatly. Some user breakpoints consume several low-level breakpoints and conversely, several user breakpoints can share one low-level breakpoint. User breakpoints are displayed in the same way both in the Breakpoint Usage dialog box and in the Breakpoints window, for example Data @[R] callCount.
C-SPY itself also consumes breakpoints. C-SPY will set a breakpoint if:
● the debugger option Run to has been selected, and any step command is used. These are temporary breakpoints which are only set when the debugger system is running. This means that they are not visible in the Breakpoint Usage window.
● the linker options With I/O emulation modules has been selected.
These types of breakpoint consumers are displayed in the Breakpoint Usage dialog box, for example, C-SPY Terminal I/O & libsupport module.
C-SPY plugin modules, for example modules for real-time operating systems, can consume additional breakpoints. Specifically, by default, the Stack window consumes a breakpoint. To disable the breakpoint used by the Stack window:
● Choose Tools>Options>Stack.
● Deselect the Stack pointer(s) not valid until program reaches: label option.
UEW-8:1
IAR Embedded Workbench® IDEUser Guide

Monitoring memory and registersThis chapter describes how to use the features available in the IAR C-SPY® Debugger for examining memory and registers.
Memory addressingIn C-SPY, the term zone is used for a named memory area. A memory address, or location, is a combination of a zone and a numerical offset into that zone.
Memory zones are used in several contexts, perhaps most importantly in the Memory and Disassembly windows. The Zone box in these windows allows you to choose which memory zone to display.
Memory zones are defined in the device description files. For further information, see Selecting a device description file, page 115.
Windows for monitoring memory and registersC-SPY provides many windows for monitoring memory and registers, each of them available from the View menu:
● The Memory window
Gives an up-to-date display of a specified area of memory—a memory zone—and allows you to edit it. Different colors are used for indicating data coverage along with execution of your application. You can fill specified areas with specific values and you can set breakpoints directly on a memory location or range. You can open several instances of this window, to monitor different memory areas. For more information, see Memory window, page 278. See also Setting a data breakpoint in the Memory window, page 136.
● The Symbolic memory window
Displays how variables with static storage duration are laid out in memory. This can be useful for better understanding memory usage or for investigating problems caused by variables being overwritten, for example by buffer overruns.
● The Stack window
Displays the contents of the stack, including how stack variables are laid out in memory. In addition, some integrity checks of the stack can be performed to detect
UEW-8:1
Part 4. Debugging 141
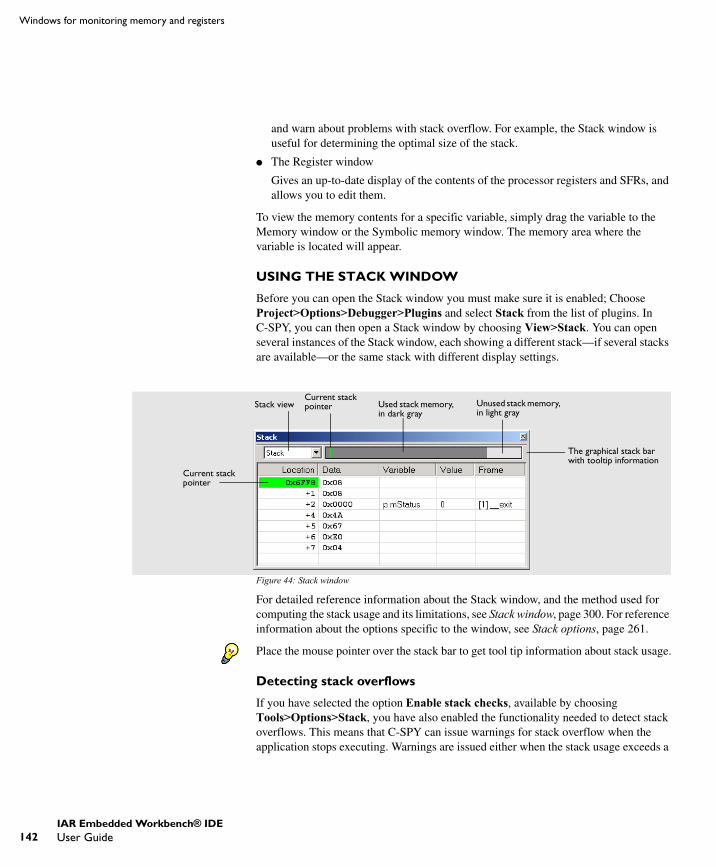
142
Windows for monitoring memory and registers
and warn about problems with stack overflow. For example, the Stack window is useful for determining the optimal size of the stack.
● The Register window
Gives an up-to-date display of the contents of the processor registers and SFRs, and allows you to edit them.
To view the memory contents for a specific variable, simply drag the variable to the Memory window or the Symbolic memory window. The memory area where the variable is located will appear.
USING THE STACK WINDOW
Before you can open the Stack window you must make sure it is enabled; Choose Project>Options>Debugger>Plugins and select Stack from the list of plugins. In C-SPY, you can then open a Stack window by choosing View>Stack. You can open several instances of the Stack window, each showing a different stack—if several stacks are available—or the same stack with different display settings.
Figure 44: Stack window
For detailed reference information about the Stack window, and the method used for computing the stack usage and its limitations, see Stack window, page 300. For reference information about the options specific to the window, see Stack options, page 261.
Place the mouse pointer over the stack bar to get tool tip information about stack usage.
Detecting stack overflows
If you have selected the option Enable stack checks, available by choosing Tools>Options>Stack, you have also enabled the functionality needed to detect stack overflows. This means that C-SPY can issue warnings for stack overflow when the application stops executing. Warnings are issued either when the stack usage exceeds a
Current stack pointer
Unused stack memory, in light gray
Current stack pointer Used stack memory,
in dark grayStack view
The graphical stack bar with tooltip information
UEW-8:1
IAR Embedded Workbench® IDEUser Guide
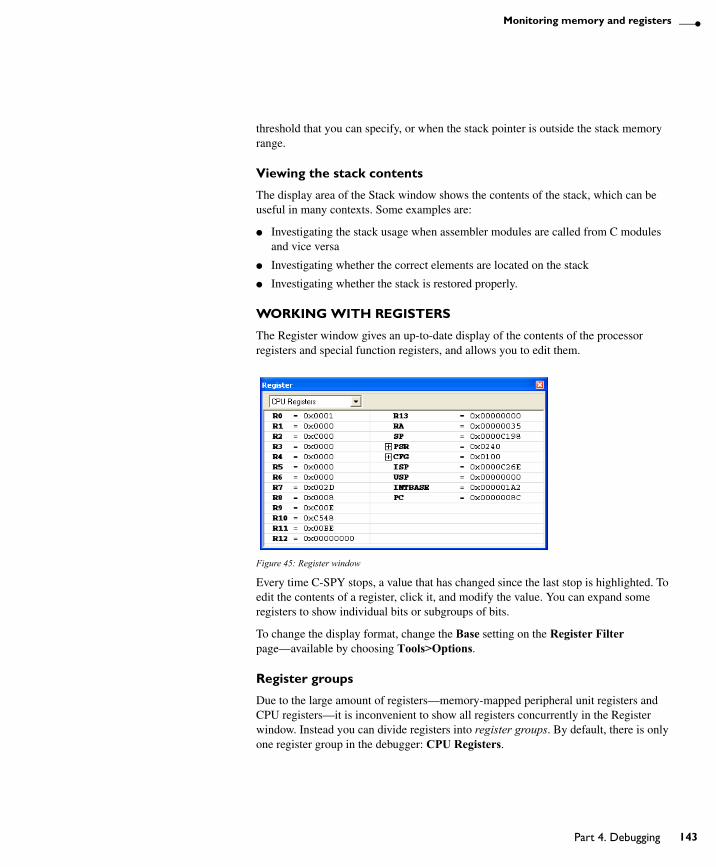
Monitoring memory and registers
threshold that you can specify, or when the stack pointer is outside the stack memory range.
Viewing the stack contents
The display area of the Stack window shows the contents of the stack, which can be useful in many contexts. Some examples are:
● Investigating the stack usage when assembler modules are called from C modules and vice versa
● Investigating whether the correct elements are located on the stack
● Investigating whether the stack is restored properly.
WORKING WITH REGISTERS
The Register window gives an up-to-date display of the contents of the processor registers and special function registers, and allows you to edit them.
Figure 45: Register window
Every time C-SPY stops, a value that has changed since the last stop is highlighted. To edit the contents of a register, click it, and modify the value. You can expand some registers to show individual bits or subgroups of bits.
To change the display format, change the Base setting on the Register Filter page—available by choosing Tools>Options.
Register groups
Due to the large amount of registers—memory-mapped peripheral unit registers and CPU registers—it is inconvenient to show all registers concurrently in the Register window. Instead you can divide registers into register groups. By default, there is only one register group in the debugger: CPU Registers.
UEW-8:1
Part 4. Debugging 143
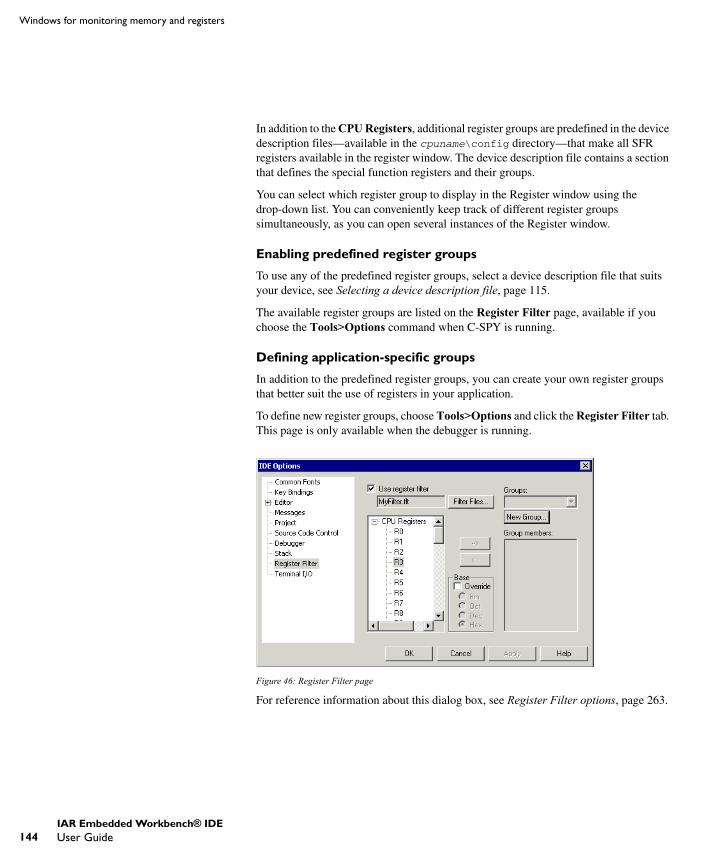
144
Windows for monitoring memory and registers
In addition to the CPU Registers, additional register groups are predefined in the device description files—available in the cpuname\config directory—that make all SFR registers available in the register window. The device description file contains a section that defines the special function registers and their groups.
You can select which register group to display in the Register window using the drop-down list. You can conveniently keep track of different register groups simultaneously, as you can open several instances of the Register window.
Enabling predefined register groups
To use any of the predefined register groups, select a device description file that suits your device, see Selecting a device description file, page 115.
The available register groups are listed on the Register Filter page, available if you choose the Tools>Options command when C-SPY is running.
Defining application-specific groups
In addition to the predefined register groups, you can create your own register groups that better suit the use of registers in your application.
To define new register groups, choose Tools>Options and click the Register Filter tab. This page is only available when the debugger is running.
Figure 46: Register Filter page
For reference information about this dialog box, see Register Filter options, page 263.
UEW-8:1
IAR Embedded Workbench® IDEUser Guide
Using the C-SPY® macro systemC-SPY includes a comprehensive macro system which allows you to automate the debugging process and to simulate peripheral devices. Macros can be used in conjunction with complex breakpoints and interrupt simulation to perform a wide variety of tasks.
This chapter describes the macro system, its features, for what purpose these features can be used, and how to use them.
The macro systemYou can use C-SPY macros either by themselves or in conjunction with complex breakpoints and interrupt simulation to perform a wide variety of tasks. Some examples where macros can be useful:
● Automating the debug session, for instance with trace printouts, printing values of variables, and setting breakpoints.
● Hardware configuring, such as initializing hardware registers.
● Developing small debug utility functions, for instance calculating the stack depth.
● Simulating peripheral devices, see the chapter Simulating interrupts. This only applies if you are using the simulator driver.
The macro system has several features:
● The similarity between the macro language and the C language, which lets you write your own macro functions.
● Predefined system macros which perform useful tasks such as opening and closing files, setting breakpoints and defining simulated interrupts.
● Reserved setup macro functions which can be used for defining at which stage the macro function should be executed. You define the function yourself, in a setup macro file.
● The option of collecting your macro functions in one or several macro files.● A dialog box where you can view, register, and edit your macro functions and files.
Alternatively, you can register and execute your macro files and functions using either the setup functionality or system macros.
UEW-8:1
Part 4. Debugging 145

146
The macro system
Many C-SPY tasks can be performed either in a dialog box or by using macro functions. The advantage of using a dialog box is that it provides you with a graphical interface where you can interactively fine-tune the characteristics of the task you want to perform, for instance setting a breakpoint. You can add parameters and quickly test whether the breakpoint works according to your intentions.
Macros, on the other hand, are useful when you already have specified your breakpoints so that they fully meet your requirements. To set up your simulator environment automatically, write a macro file and execute it, for instance, when you start C-SPY. Another advantage is that the debug session will be documented, and if several engineers are involved in the development project, you can share the macro files within the group.
THE MACRO LANGUAGE
The syntax of the macro language is very similar to the C language. There are macro statements, which are similar to C statements. You can define macro functions, with or without parameters and return values. You can use built-in system macros, similar to C library functions. Finally, you can define global and local macro variables. For a detailed description of the macro language components, see The macro language, page 369.
Example
Consider this example of a macro function which illustrates the various components of the macro language:
CheckLatest(value){ oldvalue; if (oldvalue != value) { __message "Message: Changed from ", oldvalue, " to ", value; oldvalue = value; }}
Note: Reserved macro words begin with double underscores to prevent name conflicts.
THE MACRO FILE
You collect your macro variables and functions in one or several macro files. To define a macro variable or macro function, first create a text file containing the definition. You can use any suitable text editor, such as the editor supplied with the IDE. Save the file with a suitable name using the filename extension mac.
UEW-8:1
IAR Embedded Workbench® IDEUser Guide
Using the C-SPY® macro system
Setup macro file
You can load a macro file at C-SPY startup; such a file is called a setup macro file. This is especially convenient if you want to make C-SPY perform actions before you load your application software, for instance to initialize some CPU registers or memory-mapped peripheral units. Other reasons might be if you want to automate the initialization of C-SPY, or if you want to register multiple setup macro files. You will find an example of a C-SPY setup macro file, SetupSimple.mac, in the cpuname\tutor directory.
For information about how to load a setup macro file, see Registering and executing using setup macros and setup files, page 149. For an example of how to use setup macro files, see the chapter Simulating an interrupt in Part 2. Tutorials.
SETUP MACRO FUNCTIONS
The setup macro functions are reserved macro function names that are called by C-SPY at specific stages during execution. The stages to choose between are:
● After communication with the target system has been established but before downloading the application software
● Once after your application software has been downloaded
● Each time the reset command is issued
● Once when the debug session ends.
To define a macro function to be called at a specific stage, you should define and register a macro function with the name of a setup macro function. For instance, if you want to clear a specific memory area before you load your application software, the macro setup function execUserPreload is suitable. This function is also suitable if you want to initialize some CPU registers or memory mapped peripheral units before you load your application software. For detailed information about each setup macro function, see Setup macro functions summary, page 374.
As with any macro function, you collect your setup macro functions in a macro file. Because many of the setup macro functions execute before main is reached, you should define these functions in a setup macro file.
Using C-SPY macrosIf you decide to use C-SPY macros, you must first create a macro file in which you define your macro functions. C-SPY must know that you intend to use your defined macro functions, and thus you must register (load) your macro file. During the debug session, you might have to list all available macro functions and execute them.
UEW-8:1
Part 4. Debugging 147
148
Using C-SPY macros
To list the registered macro functions, you can use the Macro Configuration dialog box. There are various ways to both register and execute macro functions:
● You can register a macro interactively in the Macro Configuration dialog box.
● You can register and execute macro functions at the C-SPY startup sequence by defining setup macro functions in a setup macro file.
● You can register a file containing macro function definitions, using the system macro __registerMacroFile. This means that you can dynamically select which macro files to register, depending on the runtime conditions. Using the system macro also lets you register multiple files at the same moment. For details about the system macro, see __registerMacroFile, page 385.
● The Quick Watch window lets you evaluate expressions, and can thus be used for executing macro functions.
● A macro can be connected to a breakpoint; when the breakpoint is triggered the macro is executed.
USING THE MACRO CONFIGURATION DIALOG BOX
The Macro Configuration dialog box—available by choosing Debug>Macros—lets you list, register, and edit your macro files and functions. The dialog box offers you an interactive interface for registering your macro functions which is convenient when you develop macro functions and continuously want to load and test them.
UEW-8:1
IAR Embedded Workbench® IDEUser Guide
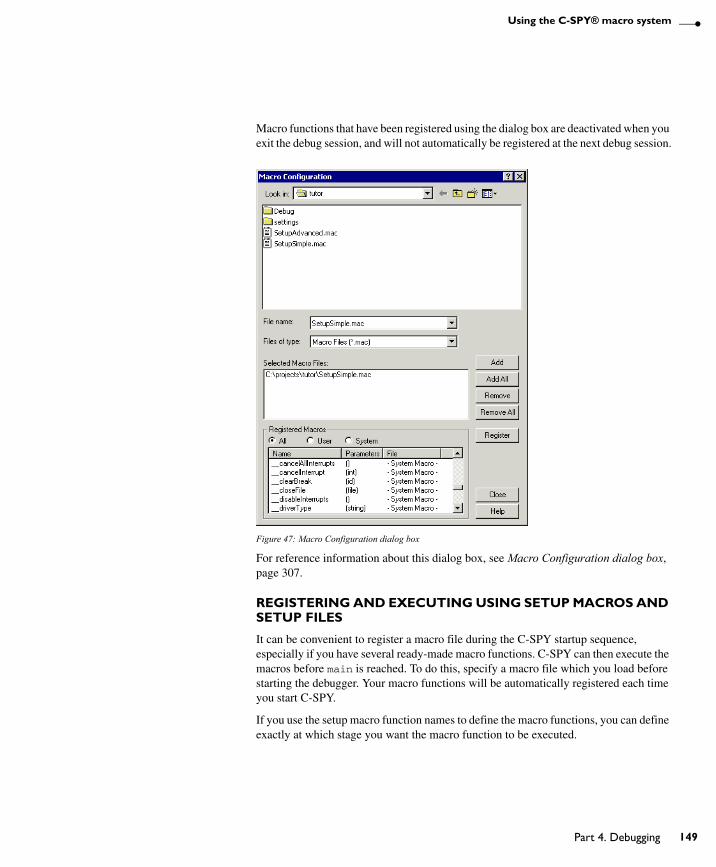
Using the C-SPY® macro system
Macro functions that have been registered using the dialog box are deactivated when you exit the debug session, and will not automatically be registered at the next debug session.
Figure 47: Macro Configuration dialog box
For reference information about this dialog box, see Macro Configuration dialog box, page 307.
REGISTERING AND EXECUTING USING SETUP MACROS AND SETUP FILES
It can be convenient to register a macro file during the C-SPY startup sequence, especially if you have several ready-made macro functions. C-SPY can then execute the macros before main is reached. To do this, specify a macro file which you load before starting the debugger. Your macro functions will be automatically registered each time you start C-SPY.
If you use the setup macro function names to define the macro functions, you can define exactly at which stage you want the macro function to be executed.
UEW-8:1
Part 4. Debugging 149
150
Using C-SPY macros
Follow these steps:
1 Create a new text file where you can define your macro function.
For example:
execUserSetup(){ ... __registerMacroFile("MyMacroUtils.mac"); __registerMacroFile("MyDeviceSimulation.mac");
}
This macro function registers the macro files MyMacroUtils.mac and MyDeviceSimulation.mac. Because the macro function is defined with the execUserSetup function name, it will be executed directly after your application has been downloaded.
2 Save the file using the filename extension mac.
3 Before you start C-SPY, choose Project>Options and click the Setup tab in the Debugger category. Select the check box Use Setup file and choose the macro file you just created.
The interrupt macro will now be loaded during the C-SPY startup sequence.
EXECUTING MACROS USING QUICK WATCH
The Quick Watch window—available from the View menu—lets you watch the value of any variables or expressions and evaluate them. For macros, the Quick Watch window is especially useful because it is a method which lets you dynamically choose when to execute a macro function.
Consider this simple macro function which checks the status of a watchdog timer interrupt enable bit:
WDTstatus(){ if (#WDreg & 0x01 != 0) /* Checks the status of WDTIE */ return "Timer enabled"; /* C-SPY macro string used */ else return "Timer disabled"; /* C-SPY macro string used */}
1 Save the macro function using the filename extension mac. Keep the file open.
2 To register the macro file, choose Debug>Macros. The Macro Configuration dialog box appears. Locate the file, click Add and then Register. The macro function appears in the list of registered macros.
UEW-8:1
IAR Embedded Workbench® IDEUser Guide
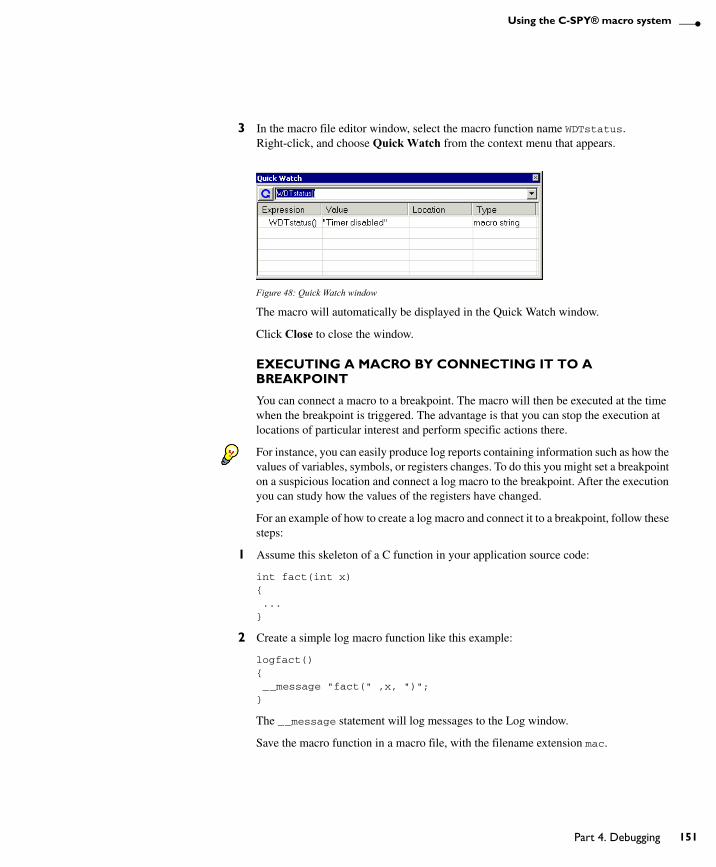
Using the C-SPY® macro system
3 In the macro file editor window, select the macro function name WDTstatus. Right-click, and choose Quick Watch from the context menu that appears.
Figure 48: Quick Watch window
The macro will automatically be displayed in the Quick Watch window.
Click Close to close the window.
EXECUTING A MACRO BY CONNECTING IT TO A BREAKPOINT
You can connect a macro to a breakpoint. The macro will then be executed at the time when the breakpoint is triggered. The advantage is that you can stop the execution at locations of particular interest and perform specific actions there.
For instance, you can easily produce log reports containing information such as how the values of variables, symbols, or registers changes. To do this you might set a breakpoint on a suspicious location and connect a log macro to the breakpoint. After the execution you can study how the values of the registers have changed.
For an example of how to create a log macro and connect it to a breakpoint, follow these steps:
1 Assume this skeleton of a C function in your application source code:
int fact(int x){ ...}
2 Create a simple log macro function like this example:
logfact(){ __message "fact(" ,x, ")";}
The __message statement will log messages to the Log window.
Save the macro function in a macro file, with the filename extension mac.
UEW-8:1
Part 4. Debugging 151
152
Using C-SPY macros
3 Before you can execute the macro it must be registered. Open the Macro Configuration dialog box—available by choosing Debug>Macros—and add your macro file to the list Selected Macro Files. Click Register and your macro function will appear in the list Registered Macros. Close the dialog box.
4 Next, you should toggle a code breakpoint—using the Toggle Breakpoint button—on the first statement within the function fact in your application source code. Open the Breakpoint dialog box—available by choosing Edit>Breakpoints—your breakpoint will appear in the list of breakpoints at the bottom of the dialog box. Select the breakpoint.
5 Connect the log macro function to the breakpoint by typing the name of the macro function, logfact(), in the Action field and clicking Apply. Close the dialog box.
6 Now you can execute your application source code. When the breakpoint has been triggered, the macro function will be executed. You can see the result in the Log window.
You can easily enhance the log macro function by, for instance, using the __fmessage statement instead, which will print the log information to a file. For information about the __fmessage statement, see Formatted output, page 372.
For a complete example where a serial port input buffer is simulated using the method of connecting a macro to a breakpoint, see the chapter Simulating an interrupt in Part 2. Tutorials.
UEW-8:1
IAR Embedded Workbench® IDEUser Guide

Analyzing your applicationIt is important to locate an application’s bottle-necks and to verify that all parts of an application have been tested. This chapter presents facilities available in the IAR C-SPY® Debugger for analyzing your application so that you can efficiently spend time and effort on optimizations.
Function-level profilingThe profiler will help you find the functions where most time is spent during execution, for a given stimulus. Those functions are the parts you should focus on when spending time and effort on optimizing your code. A simple method of optimizing a function is to compile it using speed optimization. Alternatively, you can move the function into the memory which uses the most efficient addressing mode. For detailed information about efficient memory usage, see the IAR C/C++ Compiler Reference Guide.
The Profiling window displays profiling information, that is, timing information for the functions in an application. Profiling must be turned on explicitly using a button on the window’s toolbar, and will stay active until it is turned off.
The profiler measures the time between the entry and return of a function. This means that time consumed in a function is not added until the function returns or another function is called. You will only notice this if you are stepping into a function.
For reference information about the Profiling window, see Profiling window, page 298.
USING THE PROFILER
Before you can use the Profiling window, you must build your application using these options:
1 After you have built your application and started C-SPY, choose View>Profiling to open the window, and click the Activate button to turn on the profiler.
2 Click the Clear button, alternatively use the context menu available when you right-click in the window, when you want to start a new sampling.
Category Setting
C/C++ Compiler Output>Generate debug information
Linker Format>Debug information for C-SPY
Debugger Plugins>Profiling
Table 14: Project options for enabling profiling
UEW-8:1
Part 4. Debugging 153
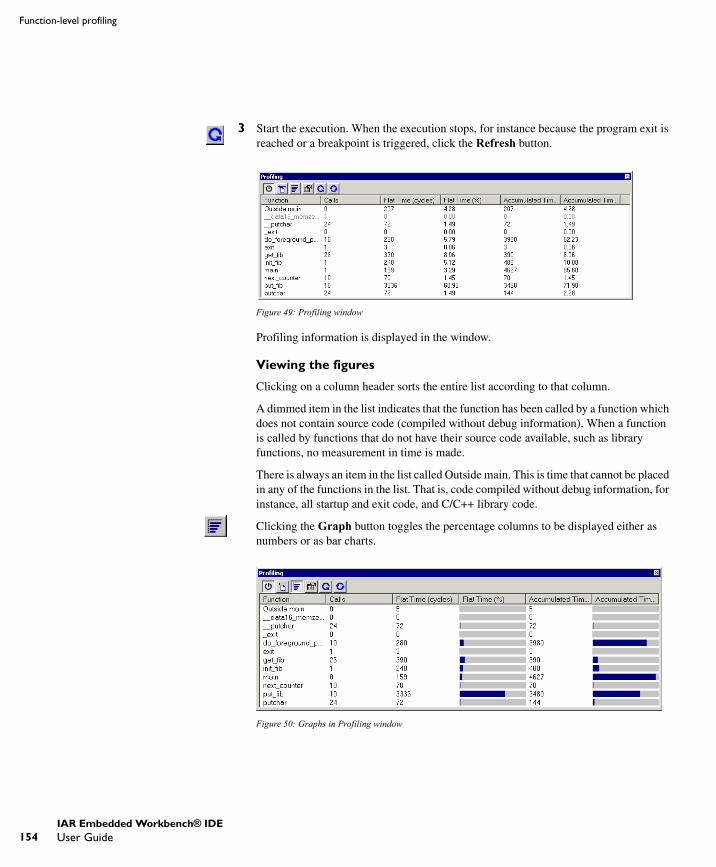
154
Function-level profiling
3 Start the execution. When the execution stops, for instance because the program exit is reached or a breakpoint is triggered, click the Refresh button.
Figure 49: Profiling window
Profiling information is displayed in the window.
Viewing the figures
Clicking on a column header sorts the entire list according to that column.
A dimmed item in the list indicates that the function has been called by a function which does not contain source code (compiled without debug information). When a function is called by functions that do not have their source code available, such as library functions, no measurement in time is made.
There is always an item in the list called Outside main. This is time that cannot be placed in any of the functions in the list. That is, code compiled without debug information, for instance, all startup and exit code, and C/C++ library code.
Clicking the Graph button toggles the percentage columns to be displayed either as numbers or as bar charts.
Figure 50: Graphs in Profiling window
UEW-8:1
IAR Embedded Workbench® IDEUser Guide
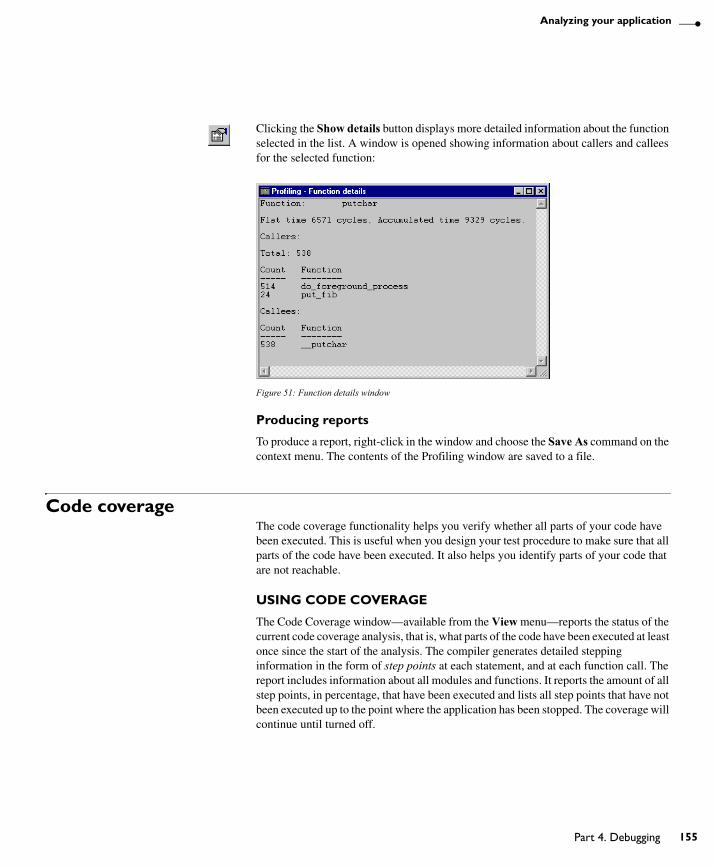
Analyzing your application
Clicking the Show details button displays more detailed information about the function selected in the list. A window is opened showing information about callers and callees for the selected function:
Figure 51: Function details window
Producing reports
To produce a report, right-click in the window and choose the Save As command on the context menu. The contents of the Profiling window are saved to a file.
Code coverageThe code coverage functionality helps you verify whether all parts of your code have been executed. This is useful when you design your test procedure to make sure that all parts of the code have been executed. It also helps you identify parts of your code that are not reachable.
USING CODE COVERAGE
The Code Coverage window—available from the View menu—reports the status of the current code coverage analysis, that is, what parts of the code have been executed at least once since the start of the analysis. The compiler generates detailed stepping information in the form of step points at each statement, and at each function call. The report includes information about all modules and functions. It reports the amount of all step points, in percentage, that have been executed and lists all step points that have not been executed up to the point where the application has been stopped. The coverage will continue until turned off.
UEW-8:1
Part 4. Debugging 155
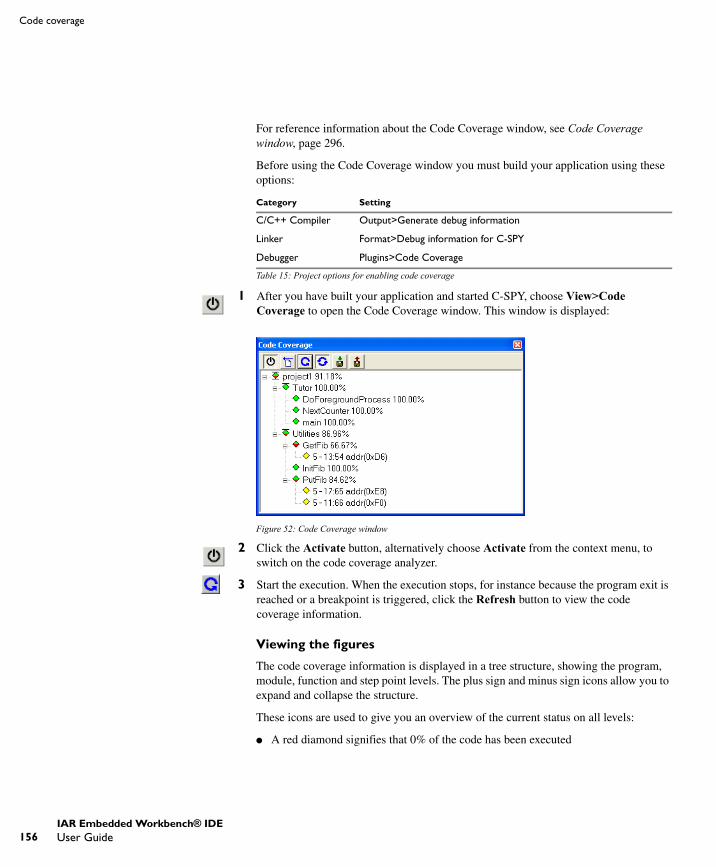
156
Code coverage
For reference information about the Code Coverage window, see Code Coverage window, page 296.
Before using the Code Coverage window you must build your application using these options:
1 After you have built your application and started C-SPY, choose View>Code Coverage to open the Code Coverage window. This window is displayed:
Figure 52: Code Coverage window
2 Click the Activate button, alternatively choose Activate from the context menu, to switch on the code coverage analyzer.
3 Start the execution. When the execution stops, for instance because the program exit is reached or a breakpoint is triggered, click the Refresh button to view the code coverage information.
Viewing the figures
The code coverage information is displayed in a tree structure, showing the program, module, function and step point levels. The plus sign and minus sign icons allow you to expand and collapse the structure.
These icons are used to give you an overview of the current status on all levels:
● A red diamond signifies that 0% of the code has been executed
Category Setting
C/C++ Compiler Output>Generate debug information
Linker Format>Debug information for C-SPY
Debugger Plugins>Code Coverage
Table 15: Project options for enabling code coverage
UEW-8:1
IAR Embedded Workbench® IDEUser Guide
Analyzing your application
● A green diamond signifies that 100% of the code has been executed
● A red and green diamond signifies that some of the code has been executed
● A yellow diamond signifies a step point that has not been executed.
The percentage displayed at the end of every program, module and function line shows the amount of code that has been covered so far, that is, the number of executed step points divided with the total number of step points.
For step point lines, the information displayed is the column number range and the row number of the step point in the source window, followed by the address of the step point.
<column start>-<column end>:row.
A step point is considered to be executed when one of its instructions has been executed. When a step point has been executed, it is removed from the window.
Double-clicking a step point or a function in the Code Coverage window displays that step point or function as the current position in the source window, which becomes the active window. Double-clicking a module on the program level expands or collapses the tree structure.
An asterisk (*) in the title bar indicates that C-SPY has continued to execute, and that the Code Coverage window must be refreshed because the displayed information is no longer up to date. To update the information, use the Refresh command.
What parts of the code are displayed?
The window displays only statements that were compiled with debug information. Thus, startup code, exit code and library code are not displayed in the window. Furthermore, coverage information for statements in inlined functions is not displayed. Only the statement containing the inlined function call is marked as executed.
Producing reports
To produce a report, right-click in the window and choose the Save As command on the context menu. The contents of the Code Coverage window are saved to a file.
UEW-8:1
Part 4. Debugging 157

158
Code coverage
UEW-8:1
IAR Embedded Workbench® IDEUser Guide

Part 5. The C-SPY® SimulatorThis part of the IAR Embedded Workbench® IDE User Guide contains the following chapters:
● Simulator-specific debugging
● Simulating interrupts.
UEW-8:1
159

160
UEW-8:1
Simulator-specific debuggingIn addition to the general C-SPY® features, the C-SPY Simulator provides some simulator-specific features, which are described in this chapter.
You will get reference information, and information about driver-specific characteristics, such as memory access checking and breakpoints.
The C-SPY Simulator introductionThe C-SPY Simulator simulates the functions of the target processor entirely in software, which means that you can debug the program logic long before any hardware is available. Because no hardware is required, it is also the most cost-effective solution for many applications.
FEATURES
In addition to the general features listed in the chapter Product introduction, the C-SPY Simulator also provides:
● Instruction-accurate simulated execution
● Memory configuration and validation
● Interrupt simulation
● Immediate breakpoints with resume functionality
● Peripheral simulation (using the C-SPY macro system).
SELECTING THE SIMULATOR DRIVER
Before starting C-SPY, you must choose the simulator driver. In the IDE, choose Project>Options and click the Setup tab in the Debugger category. Choose Simulator from the Driver drop-down list.
Depending on your product package, the list might or might not contain hardware drivers. You can only choose a driver you have installed on your computer.
UEW-8:1
Part 5. IAR C-SPY Simulator 161
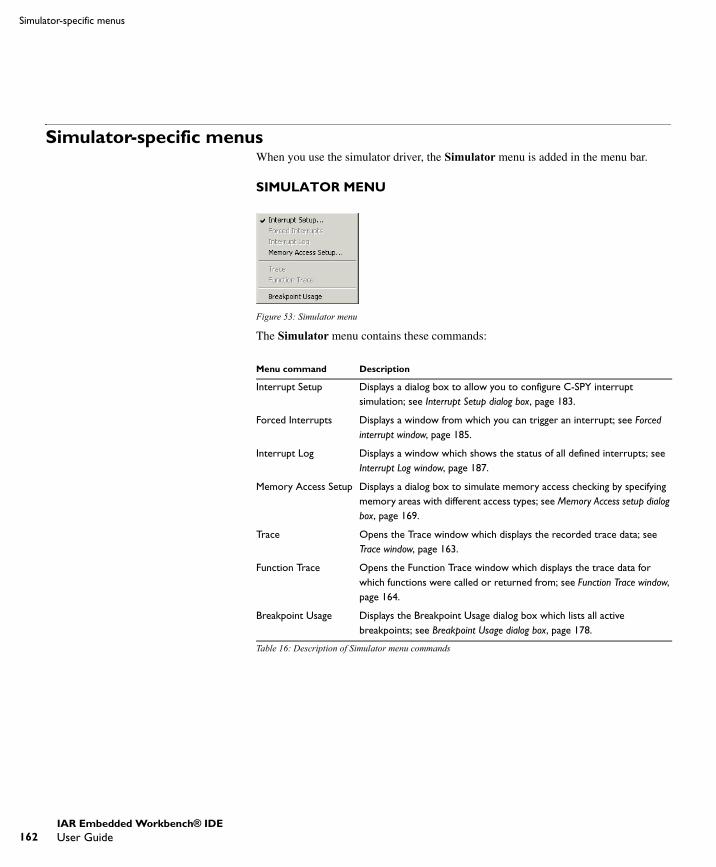
162
Simulator-specific menus
Simulator-specific menusWhen you use the simulator driver, the Simulator menu is added in the menu bar.
SIMULATOR MENU
Figure 53: Simulator menu
The Simulator menu contains these commands:
Menu command Description
Interrupt Setup Displays a dialog box to allow you to configure C-SPY interrupt simulation; see Interrupt Setup dialog box, page 183.
Forced Interrupts Displays a window from which you can trigger an interrupt; see Forced interrupt window, page 185.
Interrupt Log Displays a window which shows the status of all defined interrupts; see Interrupt Log window, page 187.
Memory Access Setup Displays a dialog box to simulate memory access checking by specifying memory areas with different access types; see Memory Access setup dialog box, page 169.
Trace Opens the Trace window which displays the recorded trace data; see Trace window, page 163.
Function Trace Opens the Function Trace window which displays the trace data for which functions were called or returned from; see Function Trace window, page 164.
Breakpoint Usage Displays the Breakpoint Usage dialog box which lists all active breakpoints; see Breakpoint Usage dialog box, page 178.
Table 16: Description of Simulator menu commands
UEW-8:1
IAR Embedded Workbench® IDEUser Guide
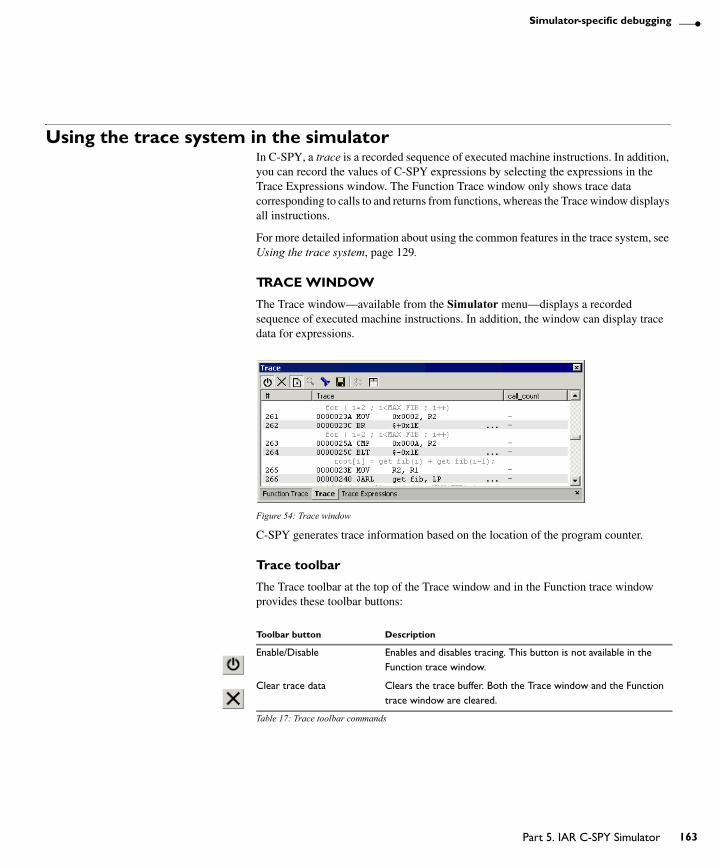
Simulator-specific debugging
Using the trace system in the simulatorIn C-SPY, a trace is a recorded sequence of executed machine instructions. In addition, you can record the values of C-SPY expressions by selecting the expressions in the Trace Expressions window. The Function Trace window only shows trace data corresponding to calls to and returns from functions, whereas the Trace window displays all instructions.
For more detailed information about using the common features in the trace system, see Using the trace system, page 129.
TRACE WINDOW
The Trace window—available from the Simulator menu—displays a recorded sequence of executed machine instructions. In addition, the window can display trace data for expressions.
Figure 54: Trace window
C-SPY generates trace information based on the location of the program counter.
Trace toolbar
The Trace toolbar at the top of the Trace window and in the Function trace window provides these toolbar buttons:
Toolbar button Description
Enable/Disable Enables and disables tracing. This button is not available in the Function trace window.
Clear trace data Clears the trace buffer. Both the Trace window and the Function trace window are cleared.
Table 17: Trace toolbar commands
UEW-8:1
Part 5. IAR C-SPY Simulator 163
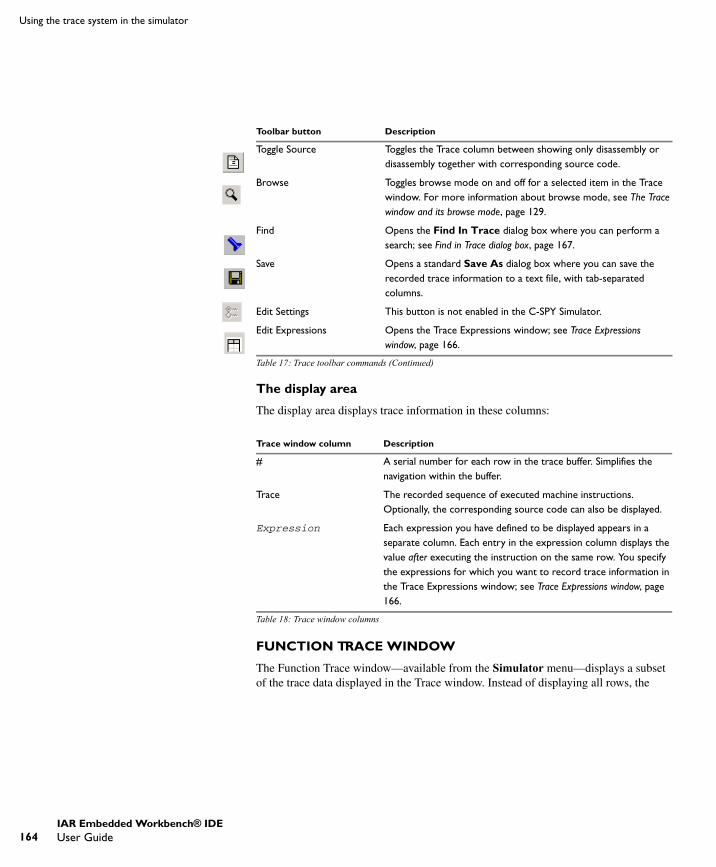
164
Using the trace system in the simulator
The display area
The display area displays trace information in these columns:
FUNCTION TRACE WINDOW
The Function Trace window—available from the Simulator menu—displays a subset of the trace data displayed in the Trace window. Instead of displaying all rows, the
Toggle Source Toggles the Trace column between showing only disassembly or disassembly together with corresponding source code.
Browse Toggles browse mode on and off for a selected item in the Trace window. For more information about browse mode, see The Trace window and its browse mode, page 129.
Find Opens the Find In Trace dialog box where you can perform a search; see Find in Trace dialog box, page 167.
Save Opens a standard Save As dialog box where you can save the recorded trace information to a text file, with tab-separated columns.
Edit Settings This button is not enabled in the C-SPY Simulator.
Edit Expressions Opens the Trace Expressions window; see Trace Expressions window, page 166.
Trace window column Description
# A serial number for each row in the trace buffer. Simplifies the navigation within the buffer.
Trace The recorded sequence of executed machine instructions. Optionally, the corresponding source code can also be displayed.
Expression Each expression you have defined to be displayed appears in a separate column. Each entry in the expression column displays the value after executing the instruction on the same row. You specify the expressions for which you want to record trace information in the Trace Expressions window; see Trace Expressions window, page 166.
Table 18: Trace window columns
Toolbar button Description
Table 17: Trace toolbar commands (Continued)
UEW-8:1
IAR Embedded Workbench® IDEUser Guide

Simulator-specific debugging
Function Trace window only shows trace data corresponding to calls to and returns from functions.
Figure 55: Function Trace window
Toolbar
For information about the toolbar, see Trace toolbar, page 163.
The display area
The display area displays trace information in these columns:
Trace window column Description
# A serial number for each row in the trace buffer. Simplifies the navigation within the buffer.
Trace The address and name of the function.
Expression Each expression you have defined to be displayed appears in a separate column. Each entry in the expression column displays the value after executing the instruction on the same row. You specify the expressions for which you want to record trace information in the Trace Expressions window; see Trace Expressions window, page 166.
Table 19: Function Trace window columns
UEW-8:1
Part 5. IAR C-SPY Simulator 165
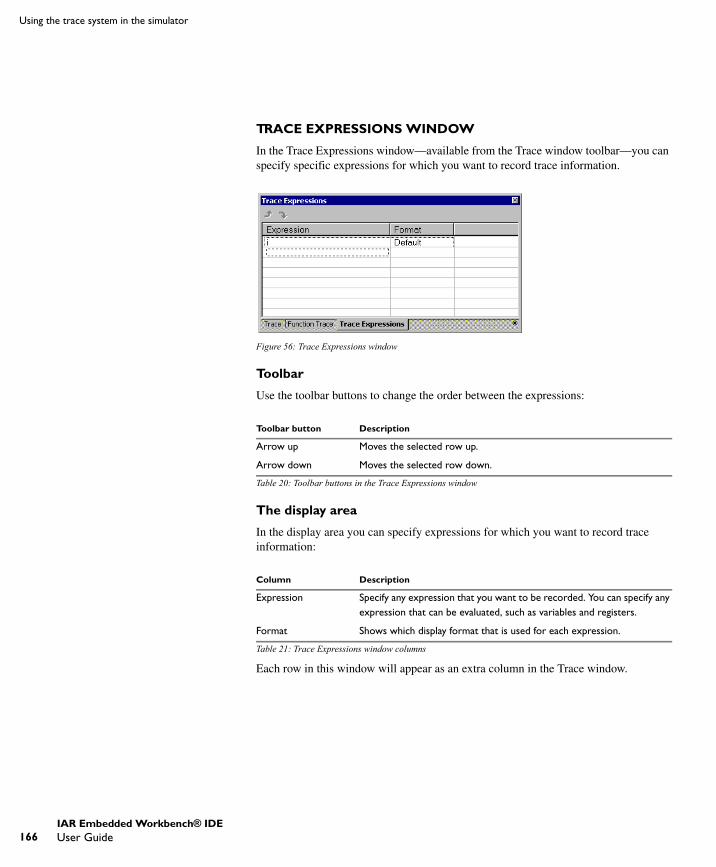
166
Using the trace system in the simulator
TRACE EXPRESSIONS WINDOW
In the Trace Expressions window—available from the Trace window toolbar—you can specify specific expressions for which you want to record trace information.
Figure 56: Trace Expressions window
Toolbar
Use the toolbar buttons to change the order between the expressions:
The display area
In the display area you can specify expressions for which you want to record trace information:
Each row in this window will appear as an extra column in the Trace window.
Toolbar button Description
Arrow up Moves the selected row up.
Arrow down Moves the selected row down.
Table 20: Toolbar buttons in the Trace Expressions window
Column Description
Expression Specify any expression that you want to be recorded. You can specify any expression that can be evaluated, such as variables and registers.
Format Shows which display format that is used for each expression.
Table 21: Trace Expressions window columns
UEW-8:1
IAR Embedded Workbench® IDEUser Guide
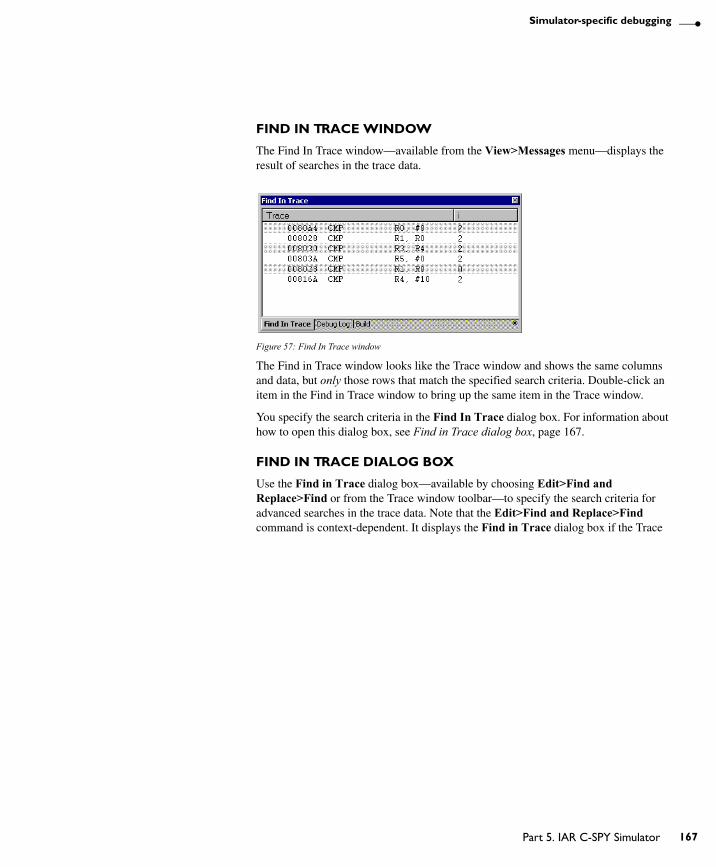
Simulator-specific debugging
FIND IN TRACE WINDOW
The Find In Trace window—available from the View>Messages menu—displays the result of searches in the trace data.
Figure 57: Find In Trace window
The Find in Trace window looks like the Trace window and shows the same columns and data, but only those rows that match the specified search criteria. Double-click an item in the Find in Trace window to bring up the same item in the Trace window.
You specify the search criteria in the Find In Trace dialog box. For information about how to open this dialog box, see Find in Trace dialog box, page 167.
FIND IN TRACE DIALOG BOX
Use the Find in Trace dialog box—available by choosing Edit>Find and Replace>Find or from the Trace window toolbar—to specify the search criteria for advanced searches in the trace data. Note that the Edit>Find and Replace>Find command is context-dependent. It displays the Find in Trace dialog box if the Trace
UEW-8:1
Part 5. IAR C-SPY Simulator 167

168
Using the trace system in the simulator
window is the current window or the Find dialog box if the editor window is the current window.
Figure 58: Find in Trace dialog box
The search results are displayed in the Find In Trace window—available by choosing the View>Messages command, see Find In Trace window, page 167.
In the Find in Trace dialog box, you specify the search criteria with the following settings:
Text search
A text field where you type the string you want to search for. Use these options to fine-tune the search:
Address Range
Use the text fields to specify an address range. The trace data within the address range is displayed. If you also have specied a text string in the Text search field, the text string is searched for within the address range.
Match Case Searches only for occurrences that exactly match the case of the specified text. Otherwise specifying int will also find INT and Int.
Match whole word Searches only for the string when it occurs as a separate word. Otherwise int will also find print, sprintf and so on.
Only search in one column
Searches only in the column you selected from the drop-down menu.
UEW-8:1
IAR Embedded Workbench® IDEUser Guide
Simulator-specific debugging
Memory access checkingC-SPY can simulate various memory access types of the target hardware and detect illegal accesses, for example a read access to write-only memory. If a memory access occurs that does not agree with the access type specified for the specific memory area, C-SPY will regard this as an illegal access. The purpose of memory access checking is to help you to identify any memory access violations.
The memory areas can either be the zones predefined in the device description file, or memory areas based on the segment information available in the debug file. In addition to these, you can define your own memory areas. The access type can be read and write, read only, or write only. You cannot map two different access types to the same memory area. You can choose between checking access type violation or checking accesses to unspecified ranges. Any violations are logged in the Debug Log window. You can also choose to have the execution halted.
In addition, you can specify the cost—in cycles—associated with accessing a byte in the memory during execution. The costs for read and write accesses are specified separately, because they can differ. These costs are added to the cycle counter whenever a byte is accessed.
In addition, you can specify the cost—in cycles—associated with accessing a memory entity during execution. The size of the memory entity depends on the bus width. The costs for read and write accesses are specified separately, because they can differ. You can also specify costs separately for sequential and non-sequential memory accesses. These costs are added to the cycle counter whenever a byte is accessed. These additional features related to specifying the cost might, or might not, be included in your product package.
Choose Simulator>Memory Access Setup to open the Memory Access Setup dialog box.
MEMORY ACCESS SETUP DIALOG BOX
The Memory Access Setup dialog box—available from the Simulator menu—lists all defined memory areas, where each column in the list specifies the properties of the area.
UEW-8:1
Part 5. IAR C-SPY Simulator 169
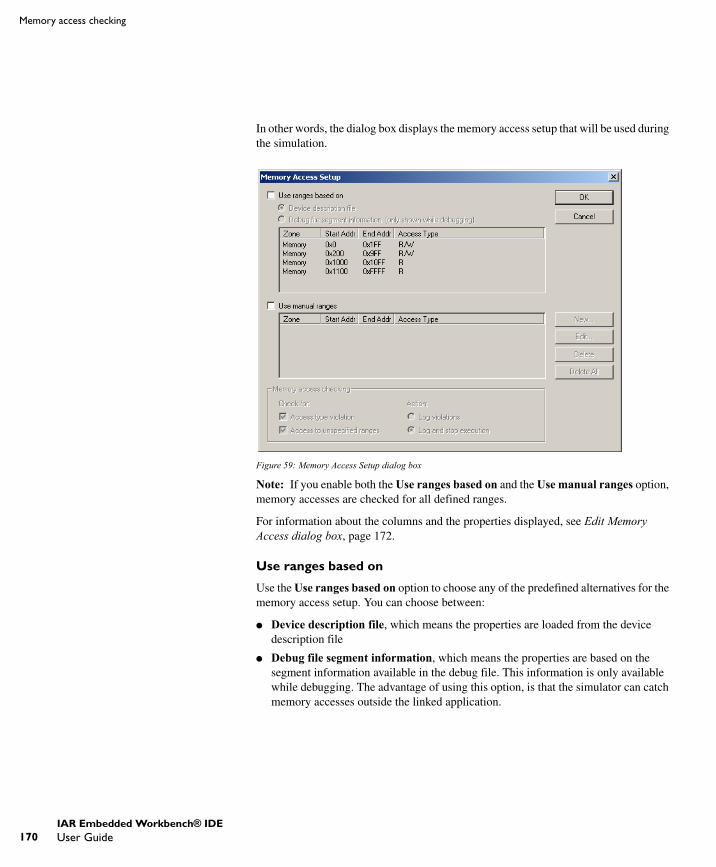
170
Memory access checking
In other words, the dialog box displays the memory access setup that will be used during the simulation.
Figure 59: Memory Access Setup dialog box
Note: If you enable both the Use ranges based on and the Use manual ranges option, memory accesses are checked for all defined ranges.
For information about the columns and the properties displayed, see Edit Memory Access dialog box, page 172.
Use ranges based on
Use the Use ranges based on option to choose any of the predefined alternatives for the memory access setup. You can choose between:
● Device description file, which means the properties are loaded from the device description file
● Debug file segment information, which means the properties are based on the segment information available in the debug file. This information is only available while debugging. The advantage of using this option, is that the simulator can catch memory accesses outside the linked application.
UEW-8:1
IAR Embedded Workbench® IDEUser Guide

Simulator-specific debugging
Use manual ranges
Use the Use manual ranges option to specify your own ranges manually via the Edit Memory Access dialog box. To open this dialog box, choose New to specify a new memory range, or select a memory zone and choose Edit to modify it. For more details, see Edit Memory Access dialog box, page 172.
The ranges you define manually are saved between debug sessions.
Memory access checking
Use the Check for options to specify what to check for. Choose between:
● Access type violation
● Access to unspecified ranges.
Use the Action options to specify the action to be performed if an access violation occurs. Choose between:
● Log violations
● Log and stop execution.
Any violations are logged in the Debug Log window.
Buttons
The Memory Access Setup dialog box contains these buttons:
Note: Except for the OK and Cancel buttons, buttons are only available when the option Use manual ranges is selected.
Button Description
OK Standard OK.
Cancel Standard Cancel.
New Opens the Edit Memory Access dialog box, where you can specify a new memory range and attach an access type to it; see Edit Memory Access dialog box, page 172.
Edit Opens the Edit Memory Access dialog box, where you can edit the selected memory area. See Edit Memory Access dialog box, page 172.
Delete Deletes the selected memory area definition.
Delete All Deletes all defined memory area definitions.
Table 22: Function buttons in the Memory Access Setup dialog box
UEW-8:1
Part 5. IAR C-SPY Simulator 171
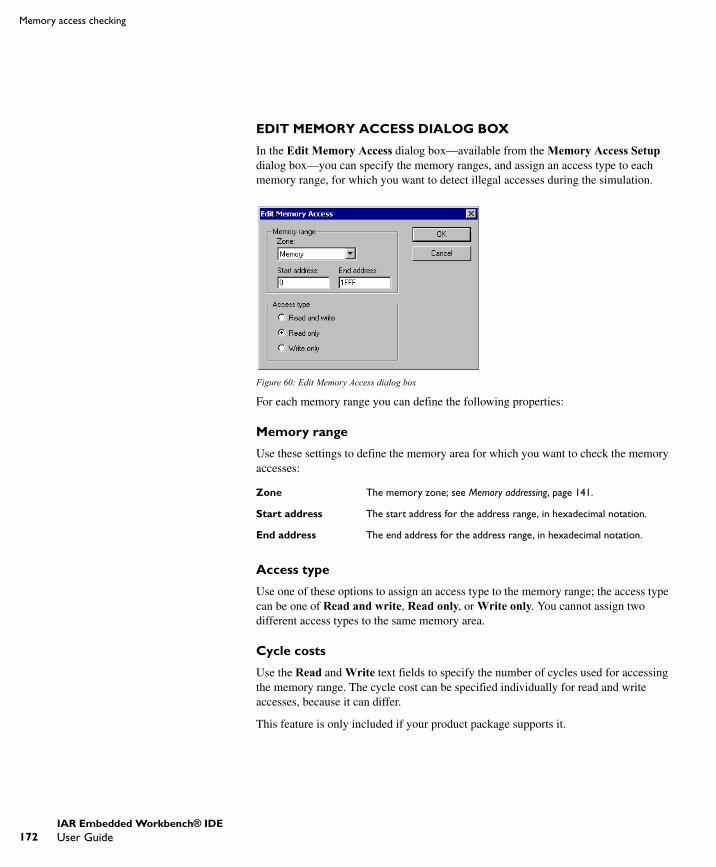
172
Memory access checking
EDIT MEMORY ACCESS DIALOG BOX
In the Edit Memory Access dialog box—available from the Memory Access Setup dialog box—you can specify the memory ranges, and assign an access type to each memory range, for which you want to detect illegal accesses during the simulation.
Figure 60: Edit Memory Access dialog box
For each memory range you can define the following properties:
Memory range
Use these settings to define the memory area for which you want to check the memory accesses:
Access type
Use one of these options to assign an access type to the memory range; the access type can be one of Read and write, Read only, or Write only. You cannot assign two different access types to the same memory area.
Cycle costs
Use the Read and Write text fields to specify the number of cycles used for accessing the memory range. The cycle cost can be specified individually for read and write accesses, because it can differ.
This feature is only included if your product package supports it.
Zone The memory zone; see Memory addressing, page 141.
Start address The start address for the address range, in hexadecimal notation.
End address The end address for the address range, in hexadecimal notation.
UEW-8:1
IAR Embedded Workbench® IDEUser Guide
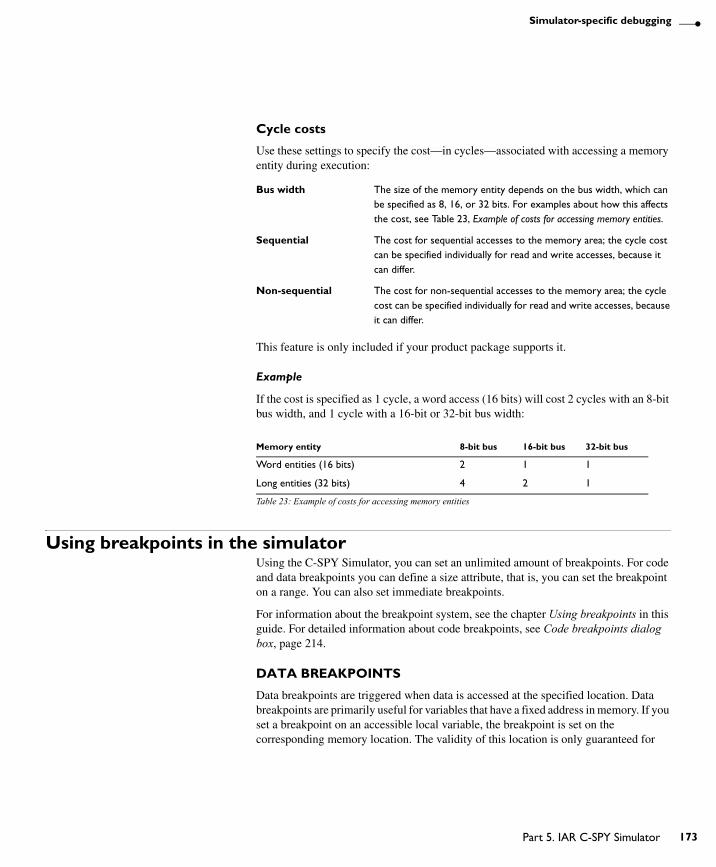
Simulator-specific debugging
Cycle costs
Use these settings to specify the cost—in cycles—associated with accessing a memory entity during execution:
This feature is only included if your product package supports it.
Example
If the cost is specified as 1 cycle, a word access (16 bits) will cost 2 cycles with an 8-bit bus width, and 1 cycle with a 16-bit or 32-bit bus width:
Using breakpoints in the simulatorUsing the C-SPY Simulator, you can set an unlimited amount of breakpoints. For code and data breakpoints you can define a size attribute, that is, you can set the breakpoint on a range. You can also set immediate breakpoints.
For information about the breakpoint system, see the chapter Using breakpoints in this guide. For detailed information about code breakpoints, see Code breakpoints dialog box, page 214.
DATA BREAKPOINTS
Data breakpoints are triggered when data is accessed at the specified location. Data breakpoints are primarily useful for variables that have a fixed address in memory. If you set a breakpoint on an accessible local variable, the breakpoint is set on the corresponding memory location. The validity of this location is only guaranteed for
Bus width The size of the memory entity depends on the bus width, which can be specified as 8, 16, or 32 bits. For examples about how this affects the cost, see Table 23, Example of costs for accessing memory entities.
Sequential The cost for sequential accesses to the memory area; the cycle cost can be specified individually for read and write accesses, because it can differ.
Non-sequential The cost for non-sequential accesses to the memory area; the cycle cost can be specified individually for read and write accesses, because it can differ.
Memory entity 8-bit bus 16-bit bus 32-bit bus
Word entities (16 bits) 2 1 1
Long entities (32 bits) 4 2 1
Table 23: Example of costs for accessing memory entities
UEW-8:1
Part 5. IAR C-SPY Simulator 173
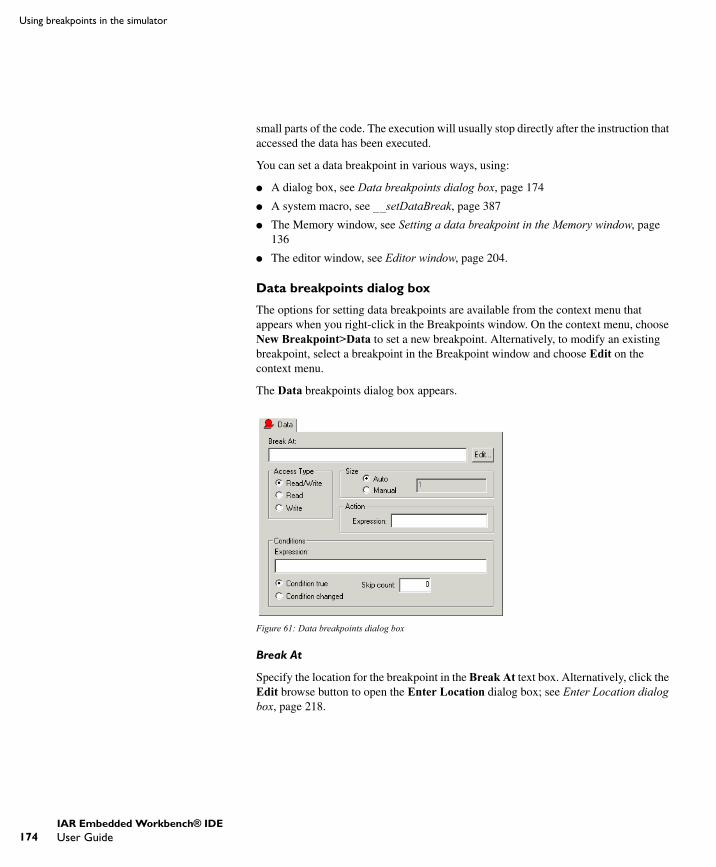
174
Using breakpoints in the simulator
small parts of the code. The execution will usually stop directly after the instruction that accessed the data has been executed.
You can set a data breakpoint in various ways, using:
● A dialog box, see Data breakpoints dialog box, page 174
● A system macro, see __setDataBreak, page 387
● The Memory window, see Setting a data breakpoint in the Memory window, page 136
● The editor window, see Editor window, page 204.
Data breakpoints dialog box
The options for setting data breakpoints are available from the context menu that appears when you right-click in the Breakpoints window. On the context menu, choose New Breakpoint>Data to set a new breakpoint. Alternatively, to modify an existing breakpoint, select a breakpoint in the Breakpoint window and choose Edit on the context menu.
The Data breakpoints dialog box appears.
Figure 61: Data breakpoints dialog box
Break At
Specify the location for the breakpoint in the Break At text box. Alternatively, click the Edit browse button to open the Enter Location dialog box; see Enter Location dialog box, page 218.
UEW-8:1
IAR Embedded Workbench® IDEUser Guide
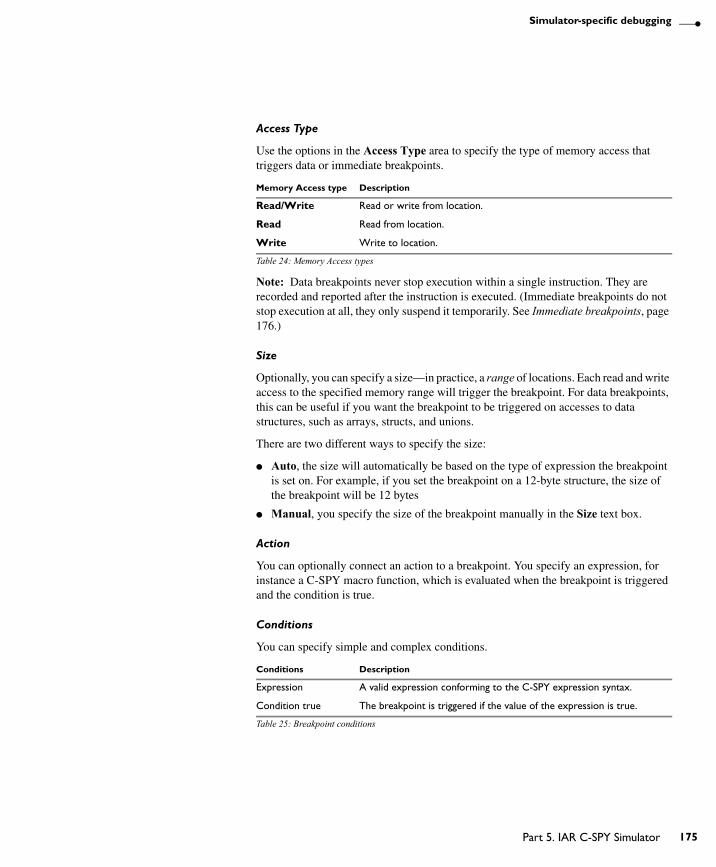
Simulator-specific debugging
Access Type
Use the options in the Access Type area to specify the type of memory access that triggers data or immediate breakpoints.
Note: Data breakpoints never stop execution within a single instruction. They are recorded and reported after the instruction is executed. (Immediate breakpoints do not stop execution at all, they only suspend it temporarily. See Immediate breakpoints, page 176.)
Size
Optionally, you can specify a size—in practice, a range of locations. Each read and write access to the specified memory range will trigger the breakpoint. For data breakpoints, this can be useful if you want the breakpoint to be triggered on accesses to data structures, such as arrays, structs, and unions.
There are two different ways to specify the size:
● Auto, the size will automatically be based on the type of expression the breakpoint is set on. For example, if you set the breakpoint on a 12-byte structure, the size of the breakpoint will be 12 bytes
● Manual, you specify the size of the breakpoint manually in the Size text box.
Action
You can optionally connect an action to a breakpoint. You specify an expression, for instance a C-SPY macro function, which is evaluated when the breakpoint is triggered and the condition is true.
Conditions
You can specify simple and complex conditions.
Memory Access type Description
Read/Write Read or write from location.
Read Read from location.
Write Write to location.
Table 24: Memory Access types
Conditions Description
Expression A valid expression conforming to the C-SPY expression syntax.
Condition true The breakpoint is triggered if the value of the expression is true.
Table 25: Breakpoint conditions
UEW-8:1
Part 5. IAR C-SPY Simulator 175
176
Using breakpoints in the simulator
IMMEDIATE BREAKPOINTS
In addition to generic breakpoints, the C-SPY Simulator lets you set immediate breakpoints, which will halt instruction execution only temporarily. This allows a C-SPY macro function to be called when the processor is about to read data from a location or immediately after it has written data. Instruction execution will resume after the action.
This type of breakpoint is useful for simulating memory-mapped devices of various kinds (for instance serial ports and timers). When the processor reads at a memory-mapped location, a C-SPY macro function can intervene and supply appropriate data. Conversely, when the processor writes to a memory-mapped location, a C-SPY macro function can act on the value that was written.
The two different methods of setting an immediate breakpoint are by using:
● A dialog box, see Immediate breakpoints dialog box, page 176
● A system macro, see __setSimBreak, page 388.
Immediate breakpoints dialog box
The options for setting immediate breakpoints are available from the context menu that appears when you right-click in the Breakpoints window. On the context menu, choose New Breakpoint>Immediate to set a new breakpoint. Alternatively, to modify an existing breakpoint, select a breakpoint in the Breakpoint window and choose Edit on the context menu.
Condition changed The breakpoint is triggered if the value of the expression has changed since it was last evaluated.
Skip count The number of times that the breakpoint must be fulfilled before a break occurs (integer).
Conditions Description
Table 25: Breakpoint conditions (Continued)
UEW-8:1
IAR Embedded Workbench® IDEUser Guide
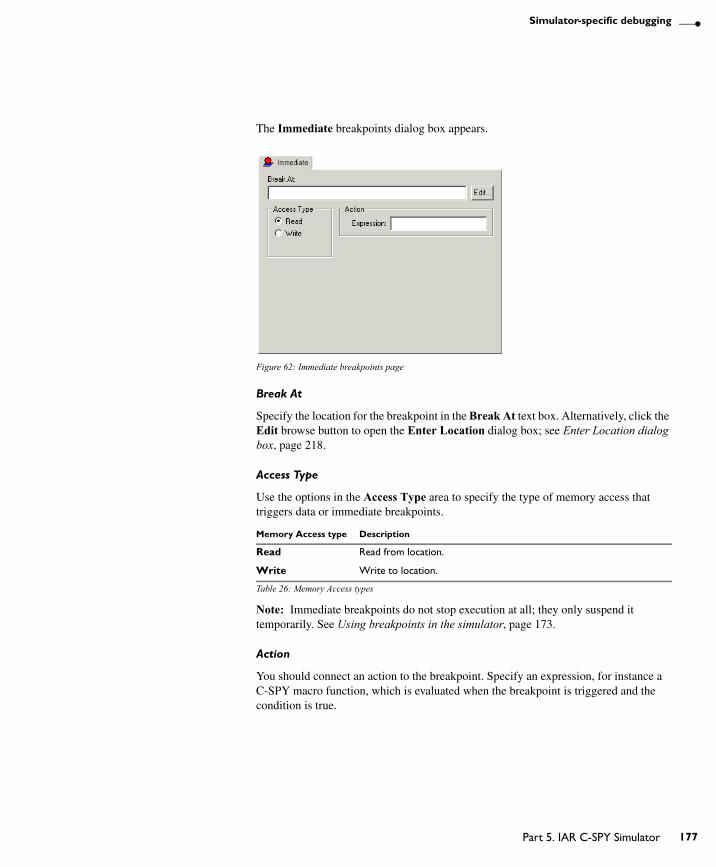
Simulator-specific debugging
The Immediate breakpoints dialog box appears.
Figure 62: Immediate breakpoints page
Break At
Specify the location for the breakpoint in the Break At text box. Alternatively, click the Edit browse button to open the Enter Location dialog box; see Enter Location dialog box, page 218.
Access Type
Use the options in the Access Type area to specify the type of memory access that triggers data or immediate breakpoints.
Note: Immediate breakpoints do not stop execution at all; they only suspend it temporarily. See Using breakpoints in the simulator, page 173.
Action
You should connect an action to the breakpoint. Specify an expression, for instance a C-SPY macro function, which is evaluated when the breakpoint is triggered and the condition is true.
Memory Access type Description
Read Read from location.
Write Write to location.
Table 26: Memory Access types
UEW-8:1
Part 5. IAR C-SPY Simulator 177
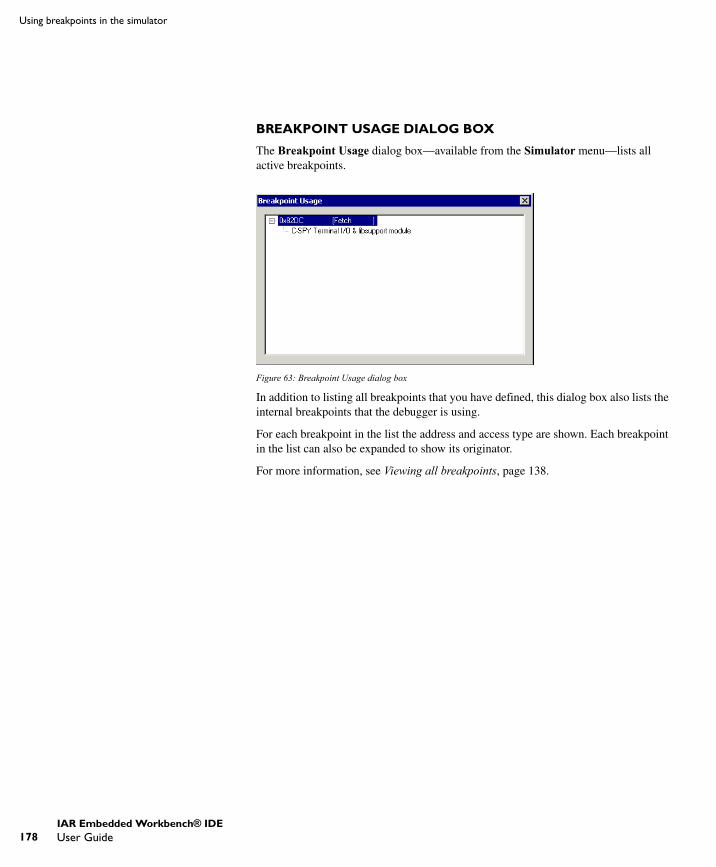
178
Using breakpoints in the simulator
BREAKPOINT USAGE DIALOG BOX
The Breakpoint Usage dialog box—available from the Simulator menu—lists all active breakpoints.
Figure 63: Breakpoint Usage dialog box
In addition to listing all breakpoints that you have defined, this dialog box also lists the internal breakpoints that the debugger is using.
For each breakpoint in the list the address and access type are shown. Each breakpoint in the list can also be expanded to show its originator.
For more information, see Viewing all breakpoints, page 138.
UEW-8:1
IAR Embedded Workbench® IDEUser Guide
Simulating interruptsBy being able to simulate interrupts, you can debug the program logic long before any hardware is available. This chapter contains detailed information about the C-SPY® interrupt simulation system and how to configure the simulated interrupts to make them reflect the interrupts of your target hardware. Finally, reference information about each interrupt system macro is provided.
For information about the interrupt-specific facilities useful when writing interrupt service routines, see the IAR C/C++ Compiler Reference Guide.
The C-SPY interrupt simulation systemThe C-SPY Simulator includes an interrupt simulation system that allows you to simulate the execution of interrupts during debugging. You can configure the interrupt simulation system so that it resembles your hardware interrupt system. If you use simulated interrupts in conjunction with C-SPY macros and breakpoints, you can compose a complex simulation of, for instance, interrupt-driven peripheral devices. Simulated interrupts also let you test the logic of your interrupt service routines.
The interrupt system has the following features:
● Simulated interrupt support for the microcontroller
● Single-occasion or periodical interrupts based on the cycle counter
● Predefined interrupts for various devices
● Configuration of hold time, probability, and timing variation
● State information for locating timing problems
● Two interfaces for configuring the simulated interrupts—a dialog box and a C-SPY system macro—that is, one interactive and one automating interface
● Activation of interrupts either instantly or based on parameters you define
● A log window which continuously displays the status for each defined interrupt.
The interrupt system is activated, by default, but if it is not required you can turn it off to speed up the simulation. You can turn the interrupt system on or off as required either in the Interrupt Setup dialog box, or using a system macro. Defined interrupts will be preserved until you remove them. All interrupts you define using the Interrupt Setup dialog box are preserved between debug sessions.
UEW-8:1
Part 5. IAR C-SPY Simulator 179

180
The C-SPY interrupt simulation system
INTERRUPT CHARACTERISTICS
The simulated interrupts consist of a set of characteristics which lets you fine-tune each interrupt to make it resemble the real interrupt on your target hardware. You can specify a first activation time, a repeat interval, a hold time, and a variance.
Figure 64: Simulated interrupt configuration
The interrupt simulation system uses the cycle counter as a clock to determine when an interrupt should be raised in the simulator. You specify the first activation time, which is based on the cycle counter. C-SPY will generate an interrupt when the cycle counter has passed the specified activation time. However, interrupts can only be raised between instructions, which means that a full assembler instruction must have been executed before the interrupt is generated, regardless of how many cycles an instruction takes.
To define the periodicity of the interrupt generation you can specify the repeat interval which defines the amount of cycles after which a new interrupt should be generated. In addition to the repeat interval, the periodicity depends on the two options probability—the probability, in percent, that the interrupt will actually appear in a period—and variance—a time variation range as a percentage of the repeat interval. These options make it possible to randomize the interrupt simulation. You can also specify a hold time which describes how long the interrupt remains pending until removed if it has not been processed. If the hold time is set to infinite, the corresponding pending bit will be set until the interrupt is acknowledged or removed.
INTERRUPT SIMULATION STATES
The interrupt simulation system contains status information that you can use for locating timing problems in your application. The Interrupt Setup dialog box displays the
UEW-8:1
IAR Embedded Workbench® IDEUser Guide
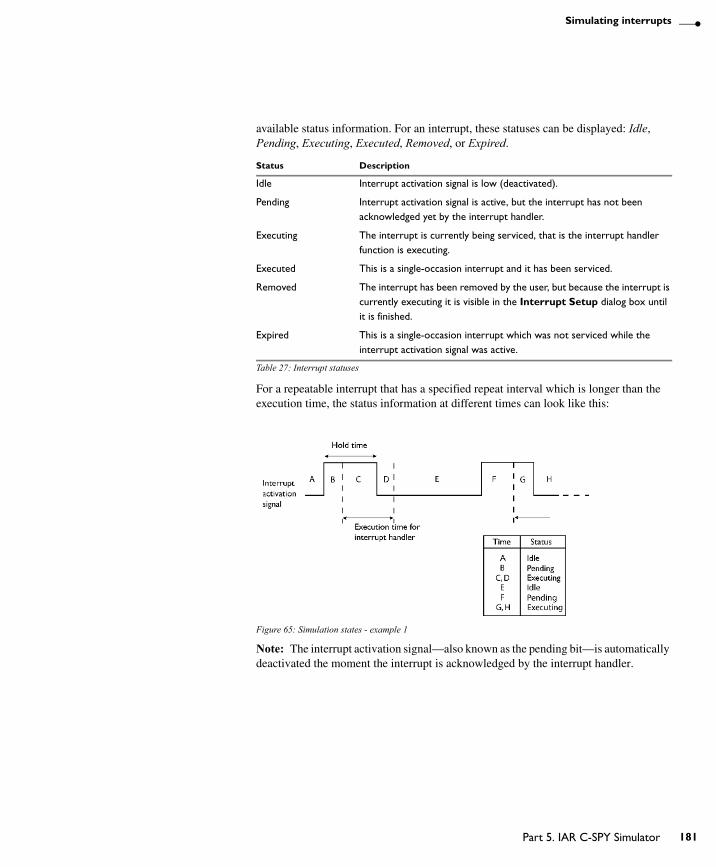
Simulating interrupts
available status information. For an interrupt, these statuses can be displayed: Idle, Pending, Executing, Executed, Removed, or Expired.
For a repeatable interrupt that has a specified repeat interval which is longer than the execution time, the status information at different times can look like this:
Figure 65: Simulation states - example 1
Note: The interrupt activation signal—also known as the pending bit—is automatically deactivated the moment the interrupt is acknowledged by the interrupt handler.
Status Description
Idle Interrupt activation signal is low (deactivated).
Pending Interrupt activation signal is active, but the interrupt has not been acknowledged yet by the interrupt handler.
Executing The interrupt is currently being serviced, that is the interrupt handler function is executing.
Executed This is a single-occasion interrupt and it has been serviced.
Removed The interrupt has been removed by the user, but because the interrupt is currently executing it is visible in the Interrupt Setup dialog box until it is finished.
Expired This is a single-occasion interrupt which was not serviced while the interrupt activation signal was active.
Table 27: Interrupt statuses
UEW-8:1
Part 5. IAR C-SPY Simulator 181
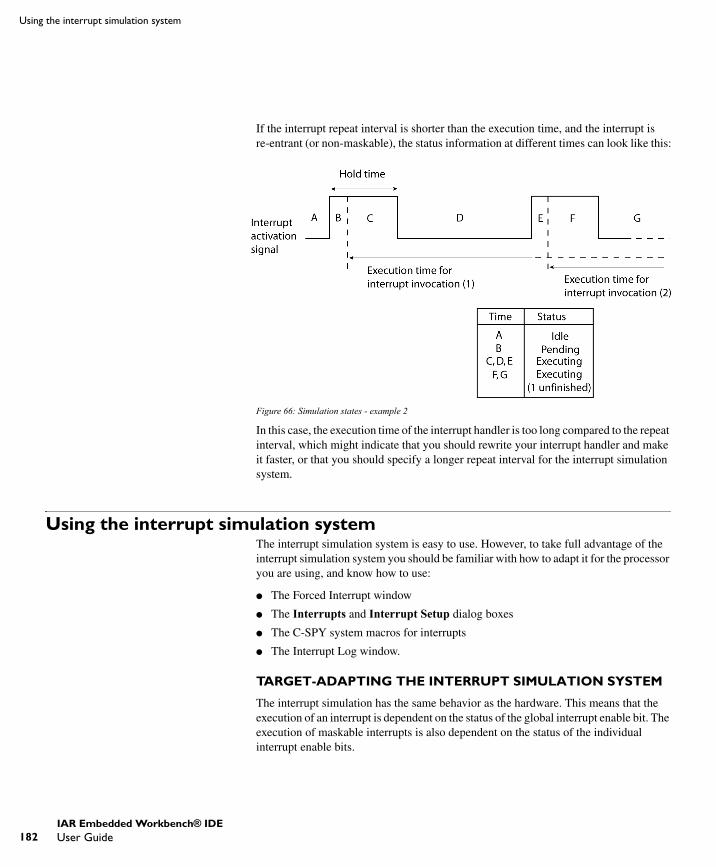
182
Using the interrupt simulation system
If the interrupt repeat interval is shorter than the execution time, and the interrupt is re-entrant (or non-maskable), the status information at different times can look like this:
Figure 66: Simulation states - example 2
In this case, the execution time of the interrupt handler is too long compared to the repeat interval, which might indicate that you should rewrite your interrupt handler and make it faster, or that you should specify a longer repeat interval for the interrupt simulation system.
Using the interrupt simulation systemThe interrupt simulation system is easy to use. However, to take full advantage of the interrupt simulation system you should be familiar with how to adapt it for the processor you are using, and know how to use:
● The Forced Interrupt window
● The Interrupts and Interrupt Setup dialog boxes
● The C-SPY system macros for interrupts
● The Interrupt Log window.
TARGET-ADAPTING THE INTERRUPT SIMULATION SYSTEM
The interrupt simulation has the same behavior as the hardware. This means that the execution of an interrupt is dependent on the status of the global interrupt enable bit. The execution of maskable interrupts is also dependent on the status of the individual interrupt enable bits.
UEW-8:1
IAR Embedded Workbench® IDEUser Guide
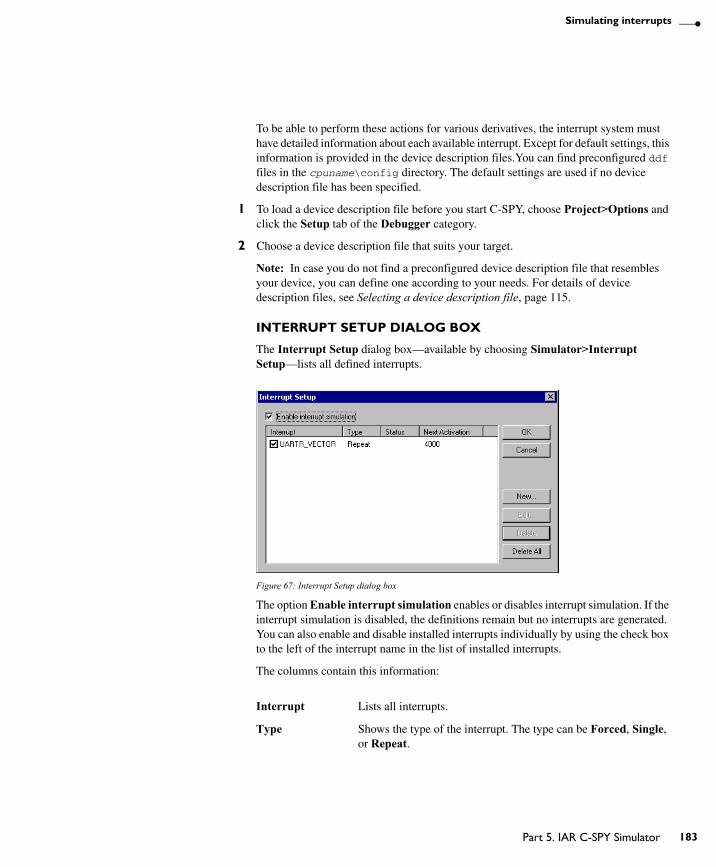
Simulating interrupts
To be able to perform these actions for various derivatives, the interrupt system must have detailed information about each available interrupt. Except for default settings, this information is provided in the device description files.You can find preconfigured ddf files in the cpuname\config directory. The default settings are used if no device description file has been specified.
1 To load a device description file before you start C-SPY, choose Project>Options and click the Setup tab of the Debugger category.
2 Choose a device description file that suits your target.
Note: In case you do not find a preconfigured device description file that resembles your device, you can define one according to your needs. For details of device description files, see Selecting a device description file, page 115.
INTERRUPT SETUP DIALOG BOX
The Interrupt Setup dialog box—available by choosing Simulator>Interrupt Setup—lists all defined interrupts.
Figure 67: Interrupt Setup dialog box
The option Enable interrupt simulation enables or disables interrupt simulation. If the interrupt simulation is disabled, the definitions remain but no interrupts are generated. You can also enable and disable installed interrupts individually by using the check box to the left of the interrupt name in the list of installed interrupts.
The columns contain this information:
Interrupt Lists all interrupts.
Type Shows the type of the interrupt. The type can be Forced, Single, or Repeat.
UEW-8:1
Part 5. IAR C-SPY Simulator 183
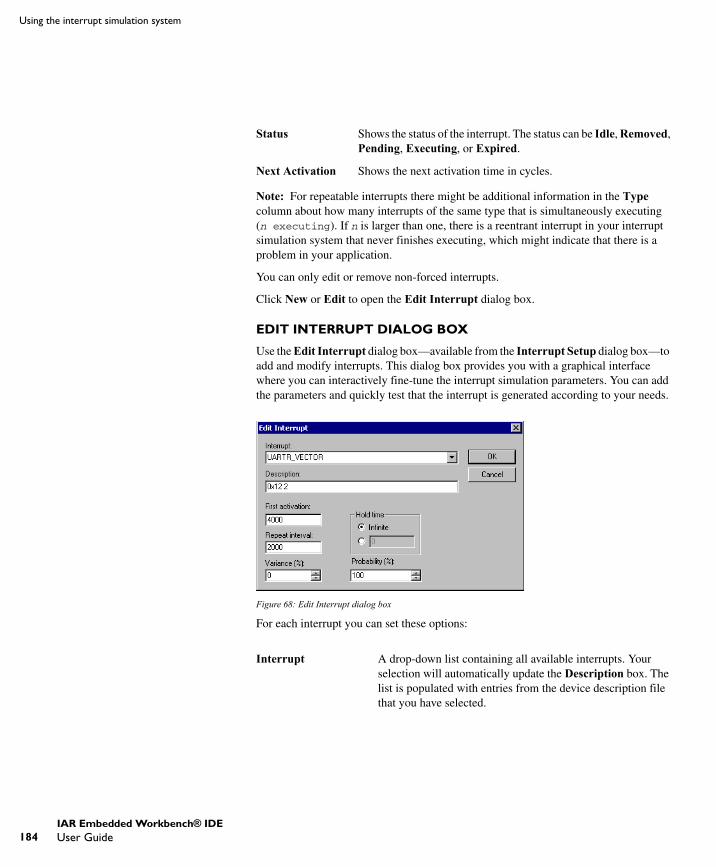
184
Using the interrupt simulation system
Note: For repeatable interrupts there might be additional information in the Type column about how many interrupts of the same type that is simultaneously executing (n executing). If n is larger than one, there is a reentrant interrupt in your interrupt simulation system that never finishes executing, which might indicate that there is a problem in your application.
You can only edit or remove non-forced interrupts.
Click New or Edit to open the Edit Interrupt dialog box.
EDIT INTERRUPT DIALOG BOX
Use the Edit Interrupt dialog box—available from the Interrupt Setup dialog box—to add and modify interrupts. This dialog box provides you with a graphical interface where you can interactively fine-tune the interrupt simulation parameters. You can add the parameters and quickly test that the interrupt is generated according to your needs.
Figure 68: Edit Interrupt dialog box
For each interrupt you can set these options:
Status Shows the status of the interrupt. The status can be Idle, Removed, Pending, Executing, or Expired.
Next Activation Shows the next activation time in cycles.
Interrupt A drop-down list containing all available interrupts. Your selection will automatically update the Description box. The list is populated with entries from the device description file that you have selected.
UEW-8:1
IAR Embedded Workbench® IDEUser Guide
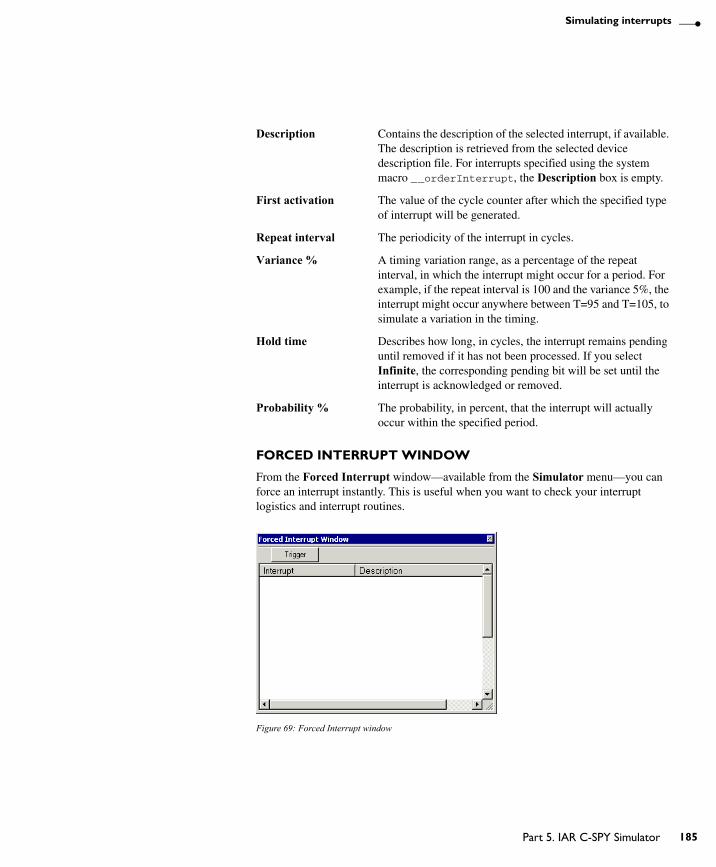
Simulating interrupts
FORCED INTERRUPT WINDOW
From the Forced Interrupt window—available from the Simulator menu—you can force an interrupt instantly. This is useful when you want to check your interrupt logistics and interrupt routines.
Figure 69: Forced Interrupt window
Description Contains the description of the selected interrupt, if available. The description is retrieved from the selected device description file. For interrupts specified using the system macro __orderInterrupt, the Description box is empty.
First activation The value of the cycle counter after which the specified type of interrupt will be generated.
Repeat interval The periodicity of the interrupt in cycles.
Variance % A timing variation range, as a percentage of the repeat interval, in which the interrupt might occur for a period. For example, if the repeat interval is 100 and the variance 5%, the interrupt might occur anywhere between T=95 and T=105, to simulate a variation in the timing.
Hold time Describes how long, in cycles, the interrupt remains pending until removed if it has not been processed. If you select Infinite, the corresponding pending bit will be set until the interrupt is acknowledged or removed.
Probability % The probability, in percent, that the interrupt will actually occur within the specified period.
UEW-8:1
Part 5. IAR C-SPY Simulator 185
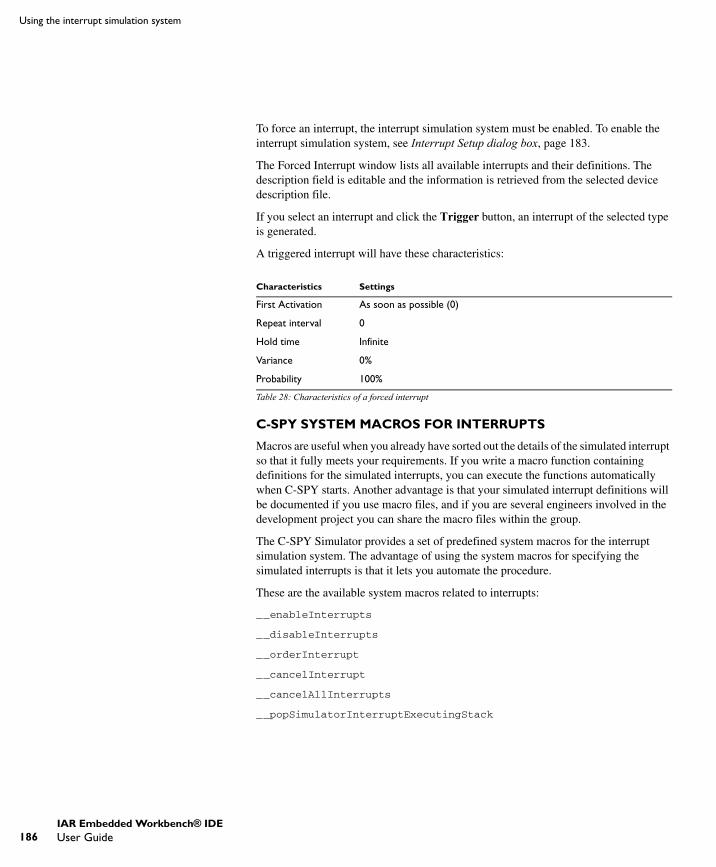
186
Using the interrupt simulation system
To force an interrupt, the interrupt simulation system must be enabled. To enable the interrupt simulation system, see Interrupt Setup dialog box, page 183.
The Forced Interrupt window lists all available interrupts and their definitions. The description field is editable and the information is retrieved from the selected device description file.
If you select an interrupt and click the Trigger button, an interrupt of the selected type is generated.
A triggered interrupt will have these characteristics:
C-SPY SYSTEM MACROS FOR INTERRUPTS
Macros are useful when you already have sorted out the details of the simulated interrupt so that it fully meets your requirements. If you write a macro function containing definitions for the simulated interrupts, you can execute the functions automatically when C-SPY starts. Another advantage is that your simulated interrupt definitions will be documented if you use macro files, and if you are several engineers involved in the development project you can share the macro files within the group.
The C-SPY Simulator provides a set of predefined system macros for the interrupt simulation system. The advantage of using the system macros for specifying the simulated interrupts is that it lets you automate the procedure.
These are the available system macros related to interrupts:
__enableInterrupts
__disableInterrupts
__orderInterrupt
__cancelInterrupt
__cancelAllInterrupts
__popSimulatorInterruptExecutingStack
Characteristics Settings
First Activation As soon as possible (0)
Repeat interval 0
Hold time Infinite
Variance 0%
Probability 100%
Table 28: Characteristics of a forced interrupt
UEW-8:1
IAR Embedded Workbench® IDEUser Guide
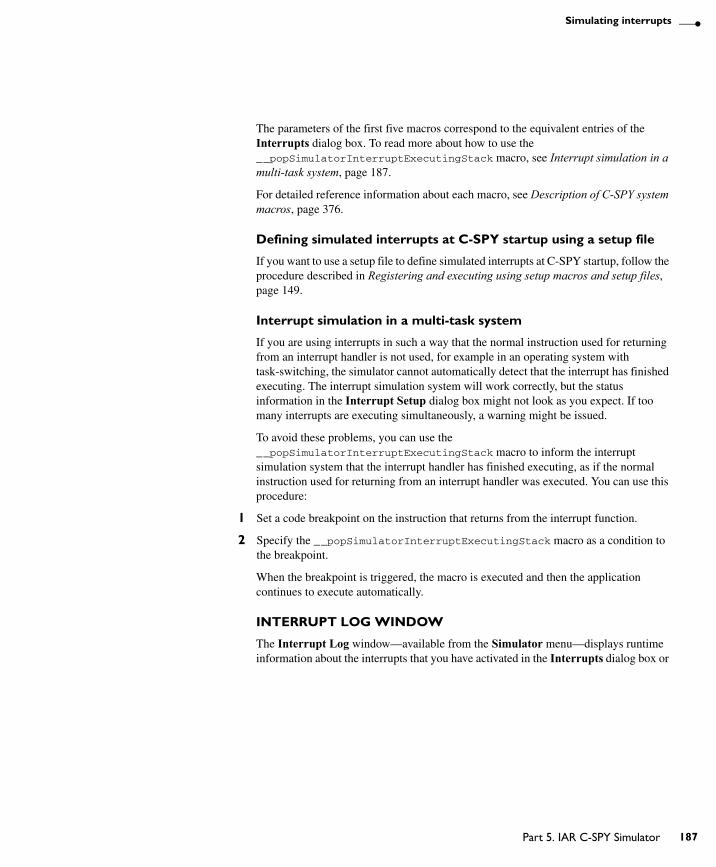
Simulating interrupts
The parameters of the first five macros correspond to the equivalent entries of the Interrupts dialog box. To read more about how to use the __popSimulatorInterruptExecutingStack macro, see Interrupt simulation in a multi-task system, page 187.
For detailed reference information about each macro, see Description of C-SPY system macros, page 376.
Defining simulated interrupts at C-SPY startup using a setup file
If you want to use a setup file to define simulated interrupts at C-SPY startup, follow the procedure described in Registering and executing using setup macros and setup files, page 149.
Interrupt simulation in a multi-task system
If you are using interrupts in such a way that the normal instruction used for returning from an interrupt handler is not used, for example in an operating system with task-switching, the simulator cannot automatically detect that the interrupt has finished executing. The interrupt simulation system will work correctly, but the status information in the Interrupt Setup dialog box might not look as you expect. If too many interrupts are executing simultaneously, a warning might be issued.
To avoid these problems, you can use the __popSimulatorInterruptExecutingStack macro to inform the interrupt simulation system that the interrupt handler has finished executing, as if the normal instruction used for returning from an interrupt handler was executed. You can use this procedure:
1 Set a code breakpoint on the instruction that returns from the interrupt function.
2 Specify the __popSimulatorInterruptExecutingStack macro as a condition to the breakpoint.
When the breakpoint is triggered, the macro is executed and then the application continues to execute automatically.
INTERRUPT LOG WINDOW
The Interrupt Log window—available from the Simulator menu—displays runtime information about the interrupts that you have activated in the Interrupts dialog box or
UEW-8:1
Part 5. IAR C-SPY Simulator 187
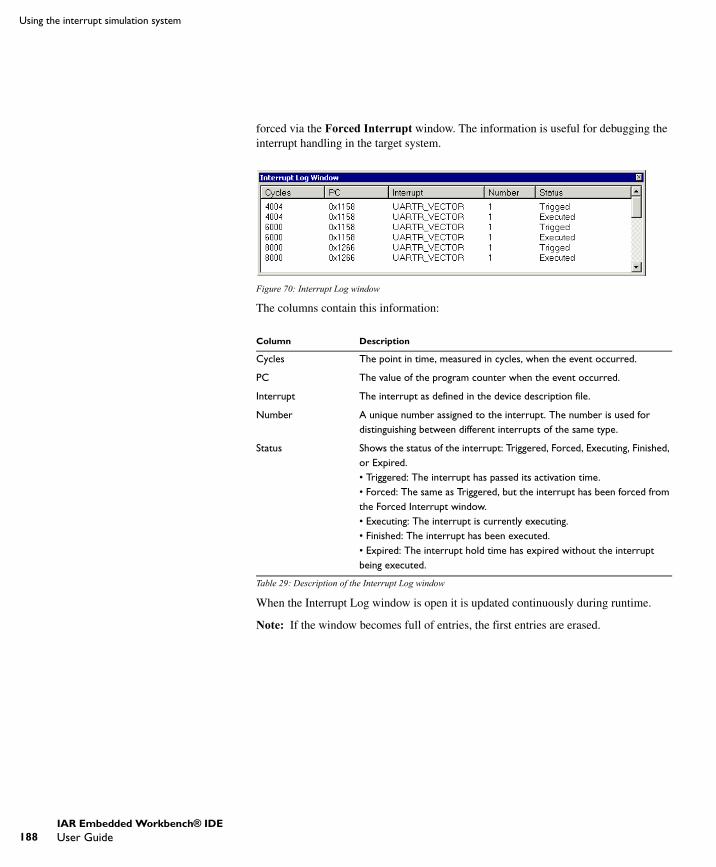
188
Using the interrupt simulation system
forced via the Forced Interrupt window. The information is useful for debugging the interrupt handling in the target system.
Figure 70: Interrupt Log window
The columns contain this information:
When the Interrupt Log window is open it is updated continuously during runtime.
Note: If the window becomes full of entries, the first entries are erased.
Column Description
Cycles The point in time, measured in cycles, when the event occurred.
PC The value of the program counter when the event occurred.
Interrupt The interrupt as defined in the device description file.
Number A unique number assigned to the interrupt. The number is used for distinguishing between different interrupts of the same type.
Status Shows the status of the interrupt: Triggered, Forced, Executing, Finished, or Expired.• Triggered: The interrupt has passed its activation time.• Forced: The same as Triggered, but the interrupt has been forced from the Forced Interrupt window.• Executing: The interrupt is currently executing.• Finished: The interrupt has been executed.• Expired: The interrupt hold time has expired without the interrupt being executed.
Table 29: Description of the Interrupt Log window
UEW-8:1
IAR Embedded Workbench® IDEUser Guide
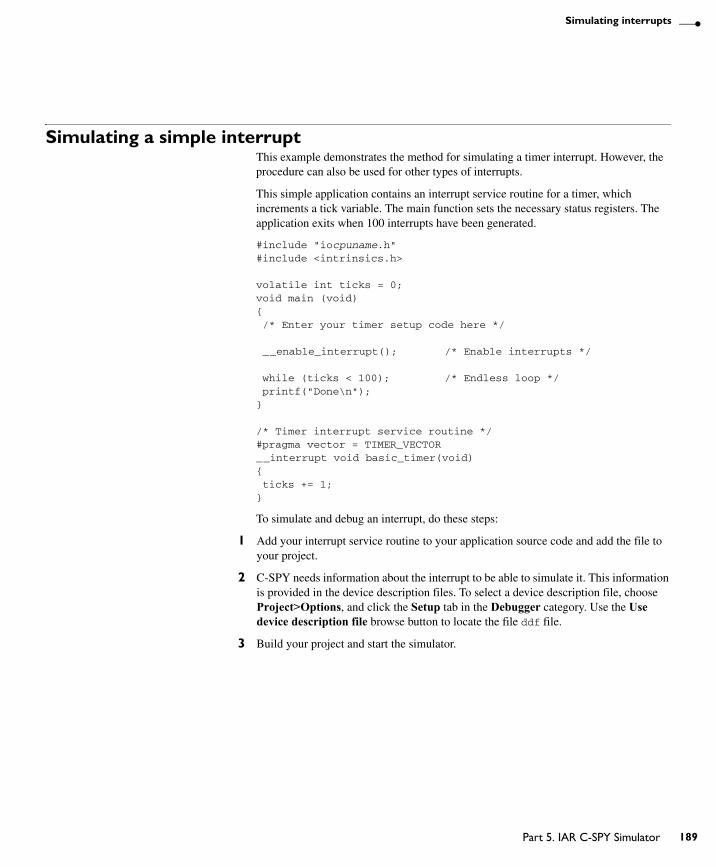
Simulating interrupts
Simulating a simple interruptThis example demonstrates the method for simulating a timer interrupt. However, the procedure can also be used for other types of interrupts.
This simple application contains an interrupt service routine for a timer, which increments a tick variable. The main function sets the necessary status registers. The application exits when 100 interrupts have been generated.
#include "iocpuname.h"#include <intrinsics.h>
volatile int ticks = 0;void main (void){ /* Enter your timer setup code here */
__enable_interrupt(); /* Enable interrupts */ while (ticks < 100); /* Endless loop */ printf("Done\n");}
/* Timer interrupt service routine */#pragma vector = TIMER_VECTOR__interrupt void basic_timer(void){ ticks += 1;}
To simulate and debug an interrupt, do these steps:
1 Add your interrupt service routine to your application source code and add the file to your project.
2 C-SPY needs information about the interrupt to be able to simulate it. This information is provided in the device description files. To select a device description file, choose Project>Options, and click the Setup tab in the Debugger category. Use the Use device description file browse button to locate the file ddf file.
3 Build your project and start the simulator.
UEW-8:1
Part 5. IAR C-SPY Simulator 189
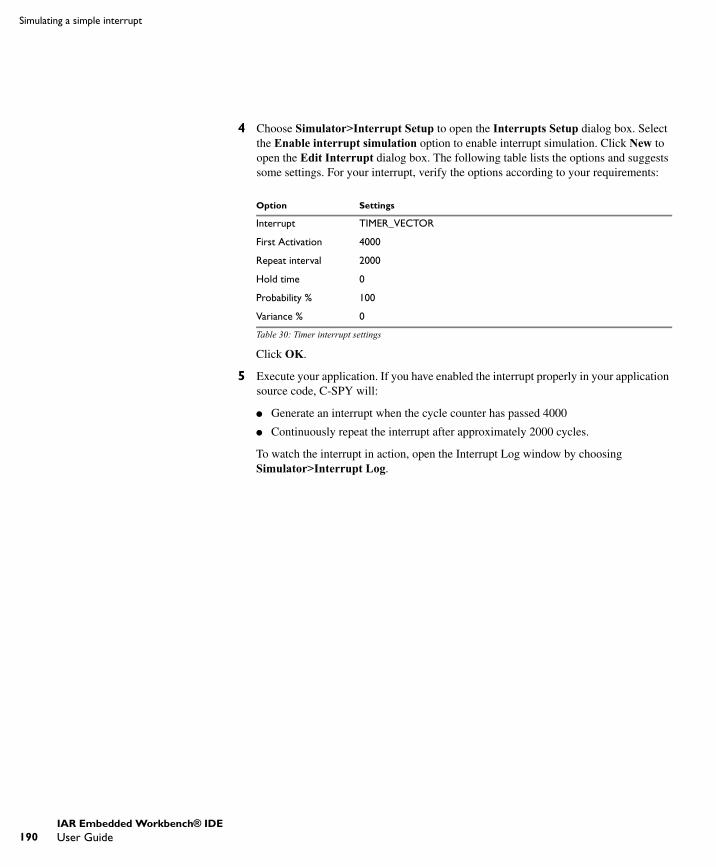
190
Simulating a simple interrupt
4 Choose Simulator>Interrupt Setup to open the Interrupts Setup dialog box. Select the Enable interrupt simulation option to enable interrupt simulation. Click New to open the Edit Interrupt dialog box. The following table lists the options and suggests some settings. For your interrupt, verify the options according to your requirements:
Click OK.
5 Execute your application. If you have enabled the interrupt properly in your application source code, C-SPY will:
● Generate an interrupt when the cycle counter has passed 4000
● Continuously repeat the interrupt after approximately 2000 cycles.
To watch the interrupt in action, open the Interrupt Log window by choosing Simulator>Interrupt Log.
Option Settings
Interrupt TIMER_VECTOR
First Activation 4000
Repeat interval 2000
Hold time 0
Probability % 100
Variance % 0
Table 30: Timer interrupt settings
UEW-8:1
IAR Embedded Workbench® IDEUser Guide

Part 6. Reference informationThis part of the IAR Embedded Workbench® IDE User Guide contains the following chapters:
● IAR Embedded Workbench® IDE reference
● C-SPY® reference
● General options
● Compiler options
● Assembler options
● Custom build options
● Build actions options
● Linker options
● Library builder options
● Debugger options
● The C-SPY Command Line Utility—cspybat
● C-SPY® macros reference.
UEW-8:1
191

192
UEW-8:1
IAR Embedded Workbench® IDE referenceThis chapter contains reference information about the windows, menus, menu commands, and the corresponding components that are found in the IDE. For information about how to best use the IDE for your purposes, see parts 3 to 5 in this guide. This chapter contains the following sections:
● Windows, page 193
● Menus, page 222.
The IDE is a modular application. Which menus are available depends on which components are installed.
WindowsThe available windows are:
● IAR Embedded Workbench IDE window
● Workspace window
● Editor window
● Source Browser window
● Breakpoints window
● Message windows.
In addition, a set of C-SPY®-specific windows becomes available when you start the debugger. For reference information about these windows, see the chapter C-SPY® reference in this guide.
UEW-8:1
Part 6. Reference information 193

194
Windows
IAR EMBEDDED WORKBENCH IDE WINDOW
The figure shows the main window of the IDE and its various components. The window might look different depending on which plugin modules you are using.
Figure 71: IAR Embedded Workbench IDE window
Each window item is explained in greater detail in the following sections.
Menu bar
Gives access to the IDE menus.
ToolbarMenu bar
Workspace window
Messages windows
Editorwindow
Status bar
Menu Description
File The File menu provides commands for opening source and project files, saving and printing, and exiting from the IDE.
Table 31: IDE menu bar
UEW-8:1
IAR Embedded Workbench® IDEUser Guide

IAR Embedded Workbench® IDE reference
For reference information for each menu, see Menus, page 222.
Toolbar
The IDE toolbar—available from the View menu—provides buttons for the most useful commands on the IDE menus, and a text box for typing a string to do a quick search.
For a description of any button, point to it with the mouse button. When a command is not available, the corresponding toolbar button is dimmed, and you will not be able to click it.
This figure shows the menu commands corresponding to each of the toolbar buttons:
Figure 72: IDE toolbar
Note: When you start C-SPY, the Download and Debug button will change to a Make and Debug button and the Debug without Downloading will change to a Restart Debugger button.
Edit The Edit menu provides commands for editing and searching in editor windows and for enabling and disabling breakpoints in C-SPY.
View Use the commands on the View menu to open windows and decide which toolbars to display.
Project The Project menu provides commands for adding files to a project, creating groups, and running the IAR Systems tools on the current project.
Tools The Tools menu is a user-configurable menu to which you can add tools for use with the IDE.
Window With the commands on the Window menu you can manipulate the IDE windows and change their arrangement on the screen.
Help The commands on the Help menu provide help about the IDE.
Menu Description
Table 31: IDE menu bar (Continued)
New Document
Save
Cut
Paste
Quick Search text box
Find Next
Replace
Open
Copy
Redo
Undo
Find Stop Build
Make
DebugFind Previous
Save All
Toggle Bookmark
Go to Bookmark
Navigate Backward
Navigate Forward ToggleBreakpoint
Compile
Go To
Debug without Downloading
UEW-8:1
Part 6. Reference information 195
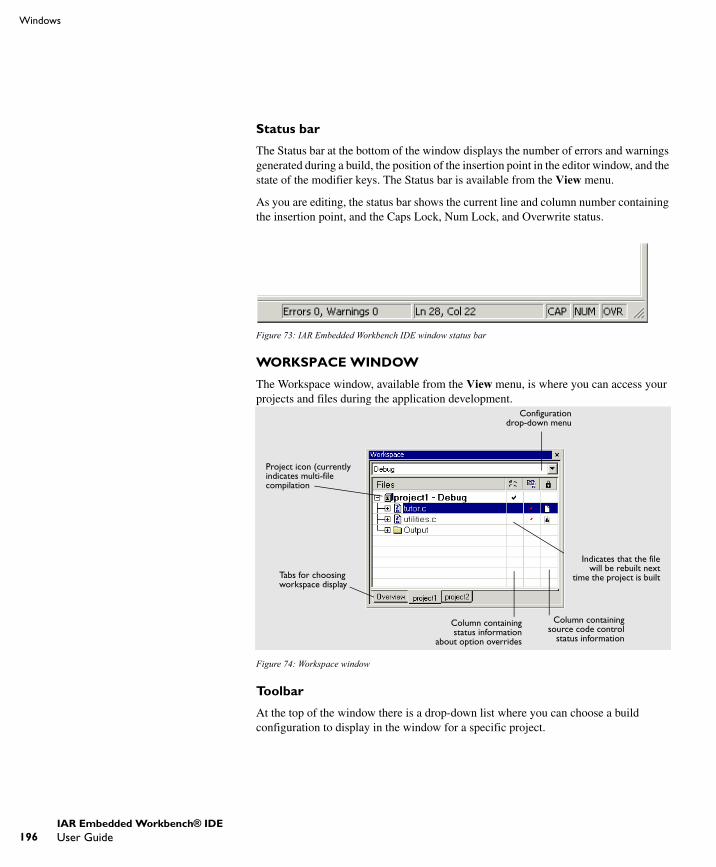
196
Windows
Status bar
The Status bar at the bottom of the window displays the number of errors and warnings generated during a build, the position of the insertion point in the editor window, and the state of the modifier keys. The Status bar is available from the View menu.
As you are editing, the status bar shows the current line and column number containing the insertion point, and the Caps Lock, Num Lock, and Overwrite status.
Figure 73: IAR Embedded Workbench IDE window status bar
WORKSPACE WINDOW
The Workspace window, available from the View menu, is where you can access your projects and files during the application development.
Figure 74: Workspace window
Toolbar
At the top of the window there is a drop-down list where you can choose a build configuration to display in the window for a specific project.
Configurationdrop-down menu
Tabs for choosing workspace display
Indicates that the filewill be rebuilt next
time the project is built
Column containingsource code control
status information
Column containingstatus information
about option overrides
Project icon (currently indicates multi-file compilation
UEW-8:1
IAR Embedded Workbench® IDEUser Guide

IAR Embedded Workbench® IDE reference
The display area
The display area is divided in different columns.
The Files column displays the name of the current workspace and a tree representation of the projects, groups and files included in the workspace.
The column that contains status information about option overrides can have one of three icons for each level in the project:
The column that contains build status information can have one of three icons for each file in the project:
For details about the various source code control icons, see Source code control states, page 200.
At the bottom of the window you can choose which project to display. Alternatively, you can choose to display an overview of the entire workspace.
For more information about project management and using the Workspace window, see the chapter Managing projects in Part 3. Project management and building in this guide.
Blank There are no settings/overrides for this file/group
Black check mark There are local settings/overrides for this file/group
Red check mark There are local settings/overrides for this file/group, but they are either identical to the inherited settings or they are ignored because you use of multi-file compilation, which means that the overrides are not needed.
Blank The file will not be rebuilt next time the project is built
Red star The file will be rebuilt next time the project is built
Gearwheel The file is being rebuilt.
UEW-8:1
Part 6. Reference information 197
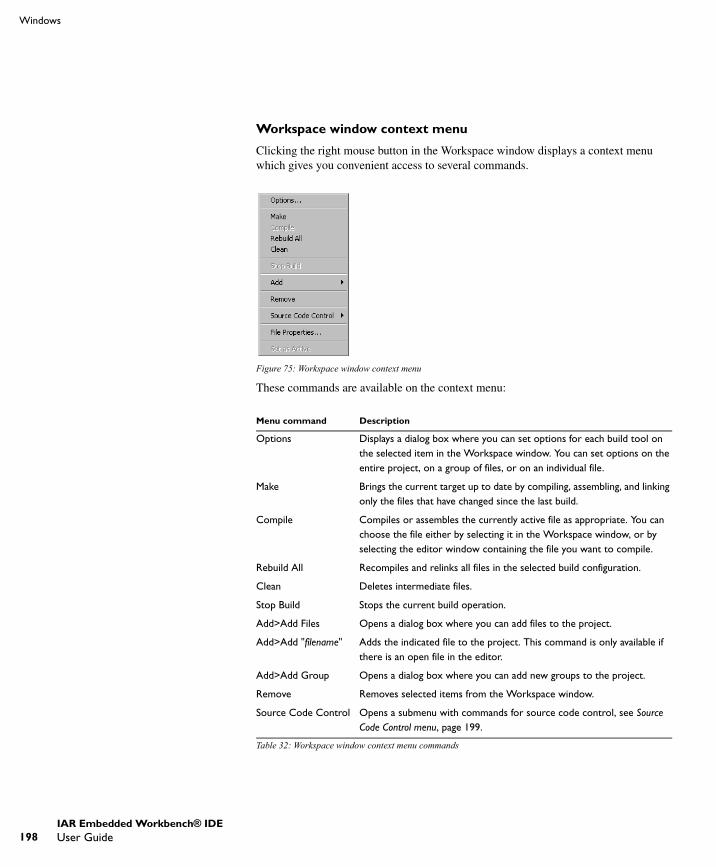
198
Windows
Workspace window context menu
Clicking the right mouse button in the Workspace window displays a context menu which gives you convenient access to several commands.
Figure 75: Workspace window context menu
These commands are available on the context menu:
Menu command Description
Options Displays a dialog box where you can set options for each build tool on the selected item in the Workspace window. You can set options on the entire project, on a group of files, or on an individual file.
Make Brings the current target up to date by compiling, assembling, and linking only the files that have changed since the last build.
Compile Compiles or assembles the currently active file as appropriate. You can choose the file either by selecting it in the Workspace window, or by selecting the editor window containing the file you want to compile.
Rebuild All Recompiles and relinks all files in the selected build configuration.
Clean Deletes intermediate files.
Stop Build Stops the current build operation.
Add>Add Files Opens a dialog box where you can add files to the project.
Add>Add "filename" Adds the indicated file to the project. This command is only available if there is an open file in the editor.
Add>Add Group Opens a dialog box where you can add new groups to the project.
Remove Removes selected items from the Workspace window.
Source Code Control Opens a submenu with commands for source code control, see Source Code Control menu, page 199.
Table 32: Workspace window context menu commands
UEW-8:1
IAR Embedded Workbench® IDEUser Guide
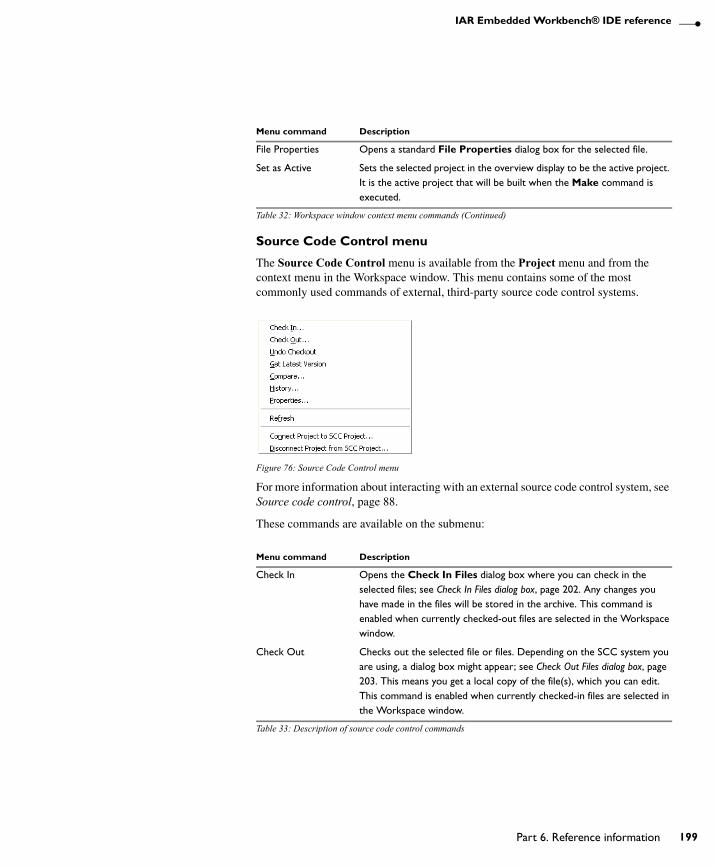
IAR Embedded Workbench® IDE reference
Source Code Control menu
The Source Code Control menu is available from the Project menu and from the context menu in the Workspace window. This menu contains some of the most commonly used commands of external, third-party source code control systems.
Figure 76: Source Code Control menu
For more information about interacting with an external source code control system, see Source code control, page 88.
These commands are available on the submenu:
File Properties Opens a standard File Properties dialog box for the selected file.
Set as Active Sets the selected project in the overview display to be the active project. It is the active project that will be built when the Make command is executed.
Menu command Description
Check In Opens the Check In Files dialog box where you can check in the selected files; see Check In Files dialog box, page 202. Any changes you have made in the files will be stored in the archive. This command is enabled when currently checked-out files are selected in the Workspace window.
Check Out Checks out the selected file or files. Depending on the SCC system you are using, a dialog box might appear; see Check Out Files dialog box, page 203. This means you get a local copy of the file(s), which you can edit. This command is enabled when currently checked-in files are selected in the Workspace window.
Table 33: Description of source code control commands
Menu command Description
Table 32: Workspace window context menu commands (Continued)
UEW-8:1
Part 6. Reference information 199
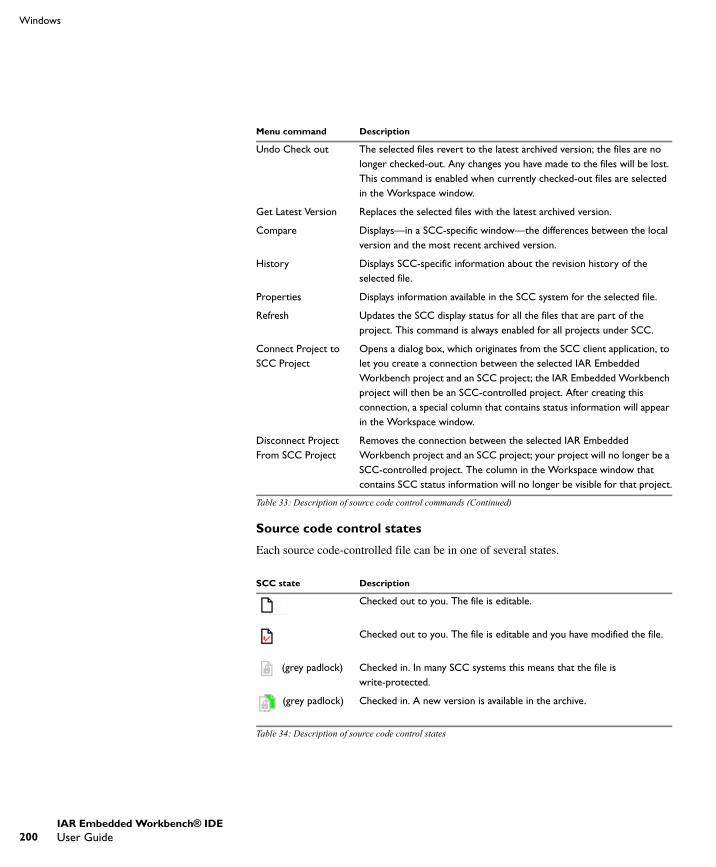
200
Windows
Source code control states
Each source code-controlled file can be in one of several states.
Undo Check out The selected files revert to the latest archived version; the files are no longer checked-out. Any changes you have made to the files will be lost. This command is enabled when currently checked-out files are selected in the Workspace window.
Get Latest Version Replaces the selected files with the latest archived version.
Compare Displays—in a SCC-specific window—the differences between the local version and the most recent archived version.
History Displays SCC-specific information about the revision history of the selected file.
Properties Displays information available in the SCC system for the selected file.
Refresh Updates the SCC display status for all the files that are part of the project. This command is always enabled for all projects under SCC.
Connect Project to SCC Project
Opens a dialog box, which originates from the SCC client application, to let you create a connection between the selected IAR Embedded Workbench project and an SCC project; the IAR Embedded Workbench project will then be an SCC-controlled project. After creating this connection, a special column that contains status information will appear in the Workspace window.
Disconnect Project From SCC Project
Removes the connection between the selected IAR Embedded Workbench project and an SCC project; your project will no longer be a SCC-controlled project. The column in the Workspace window that contains SCC status information will no longer be visible for that project.
SCC state Description
Checked out to you. The file is editable.
Checked out to you. The file is editable and you have modified the file.
(grey padlock) Checked in. In many SCC systems this means that the file is write-protected.
(grey padlock) Checked in. A new version is available in the archive.
Table 34: Description of source code control states
Menu command Description
Table 33: Description of source code control commands (Continued)
UEW-8:1
IAR Embedded Workbench® IDEUser Guide
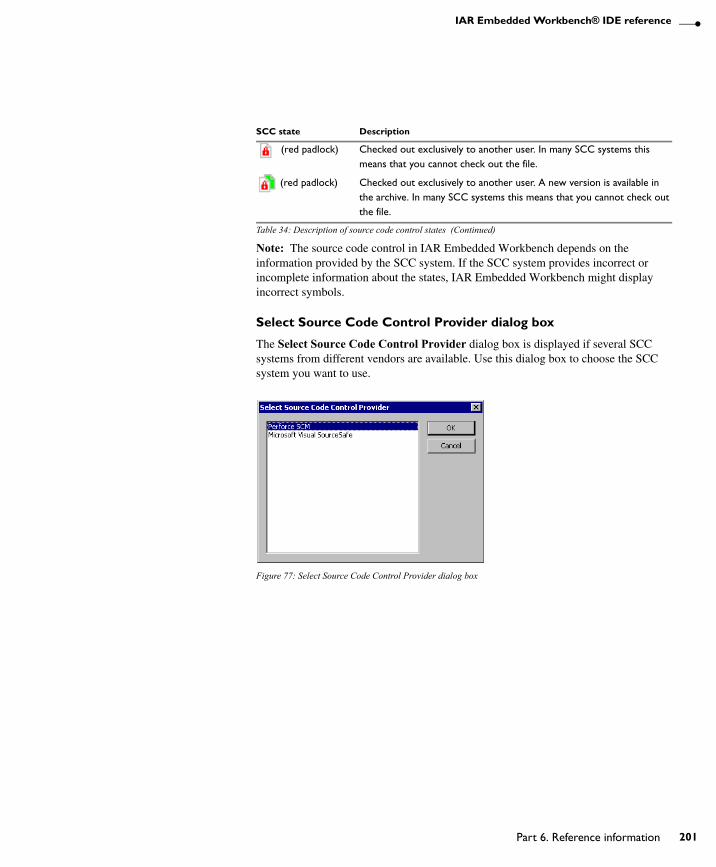
IAR Embedded Workbench® IDE reference
Note: The source code control in IAR Embedded Workbench depends on the information provided by the SCC system. If the SCC system provides incorrect or incomplete information about the states, IAR Embedded Workbench might display incorrect symbols.
Select Source Code Control Provider dialog box
The Select Source Code Control Provider dialog box is displayed if several SCC systems from different vendors are available. Use this dialog box to choose the SCC system you want to use.
Figure 77: Select Source Code Control Provider dialog box
(red padlock) Checked out exclusively to another user. In many SCC systems this means that you cannot check out the file.
(red padlock) Checked out exclusively to another user. A new version is available in the archive. In many SCC systems this means that you cannot check out the file.
SCC state Description
Table 34: Description of source code control states (Continued)
UEW-8:1
Part 6. Reference information 201
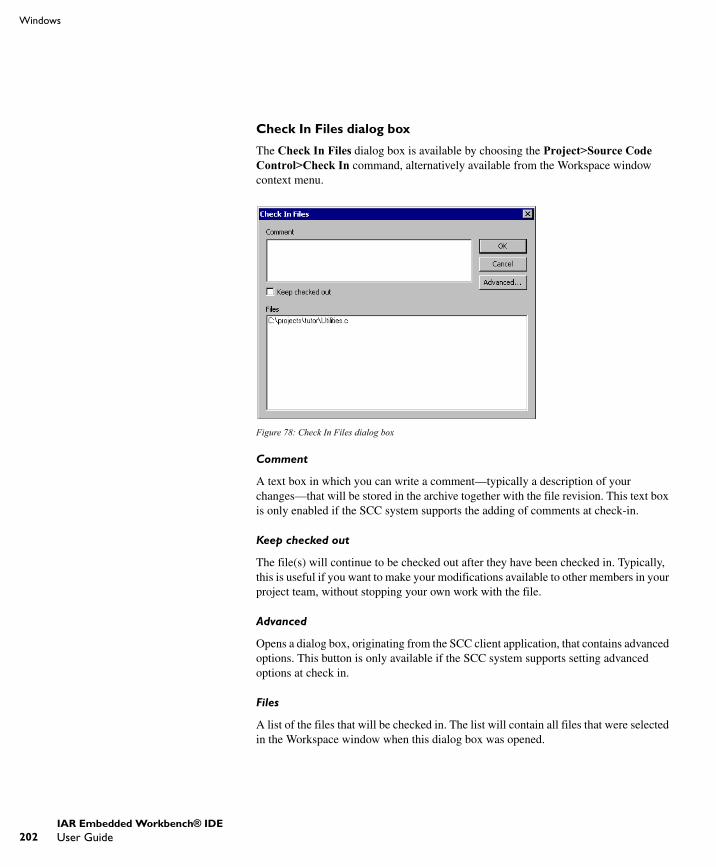
202
Windows
Check In Files dialog box
The Check In Files dialog box is available by choosing the Project>Source Code Control>Check In command, alternatively available from the Workspace window context menu.
Figure 78: Check In Files dialog box
Comment
A text box in which you can write a comment—typically a description of your changes—that will be stored in the archive together with the file revision. This text box is only enabled if the SCC system supports the adding of comments at check-in.
Keep checked out
The file(s) will continue to be checked out after they have been checked in. Typically, this is useful if you want to make your modifications available to other members in your project team, without stopping your own work with the file.
Advanced
Opens a dialog box, originating from the SCC client application, that contains advanced options. This button is only available if the SCC system supports setting advanced options at check in.
Files
A list of the files that will be checked in. The list will contain all files that were selected in the Workspace window when this dialog box was opened.
UEW-8:1
IAR Embedded Workbench® IDEUser Guide

IAR Embedded Workbench® IDE reference
Check Out Files dialog box
The Check Out File dialog box is available by choosing the Project>Source Code Control>Check Out command, alternatively available from the Workspace window context menu. However, this dialog box is only available if the SCC system supports adding comments at check-out or advanced options.
Figure 79: Check Out Files dialog box
Comment
A text field in which you can write a comment—typically the reason why the file is checked out—that will be placed in the archive together with the file revision. This text box is only enabled if the SCC system supports the adding of comments at check-out.
Advanced
Opens a dialog box, originating from the SCC client application, that contains advanced options. This button is only available if the SCC system supports setting advanced options at check out.
Files
A list of files that will be checked out. The list will contain all files that were selected in the Workspace window when this dialog box was opened.
UEW-8:1
Part 6. Reference information 203

204
Windows
EDITOR WINDOW
Source code files and HTML files are displayed in editor windows. You can have one or several editor windows open at the same time. The editor window is always docked, and its size and position depends on other currently open windows.
Figure 80: Editor window
The name of the open file is displayed on the tab. If a file is read-only, a padlock icon is visible at the bottom left corner of the editor window. If a file has been modified after it was last saved, an asterisk appears after the filename on the tab, for example Utilities.c *. All open files are available from the drop-down menu in the upper right corner of the editor window.
For information about using the editor, see the chapter Editing, page 99.
HTML files
Use the File>Open command to open HTML documents in the editor window. From an open HTML document you can navigate to other documents using hyperlinks:
● A link to an html or htm file works like in normal web browsing
● A link to an eww workspace file opens the workspace in the IDE, and closes any currently open workspace and the open HTML document.
Window tabs
Breakpoint icon
Bracket matching
Bookmark
Splittercontrol
Drop-down menulisting all open files
Splitter control Go to function
Tooltip information
Right margin indicating limit of printing area
UEW-8:1
IAR Embedded Workbench® IDEUser Guide
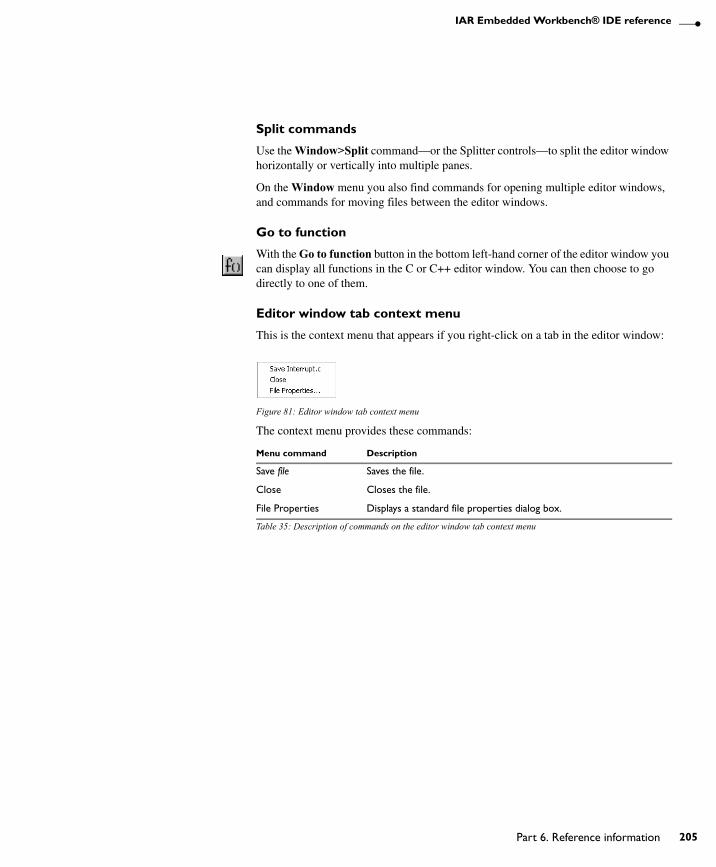
IAR Embedded Workbench® IDE reference
Split commands
Use the Window>Split command—or the Splitter controls—to split the editor window horizontally or vertically into multiple panes.
On the Window menu you also find commands for opening multiple editor windows, and commands for moving files between the editor windows.
Go to function
With the Go to function button in the bottom left-hand corner of the editor window you can display all functions in the C or C++ editor window. You can then choose to go directly to one of them.
Editor window tab context menu
This is the context menu that appears if you right-click on a tab in the editor window:
Figure 81: Editor window tab context menu
The context menu provides these commands:
Menu command Description
Save file Saves the file.
Close Closes the file.
File Properties Displays a standard file properties dialog box.
Table 35: Description of commands on the editor window tab context menu
UEW-8:1
Part 6. Reference information 205
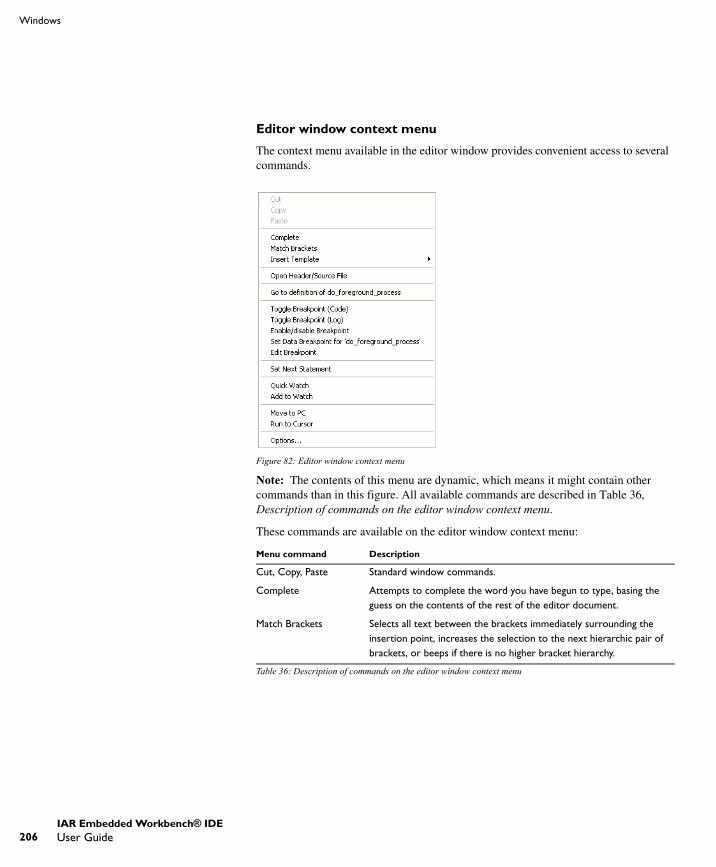
206
Windows
Editor window context menu
The context menu available in the editor window provides convenient access to several commands.
Figure 82: Editor window context menu
Note: The contents of this menu are dynamic, which means it might contain other commands than in this figure. All available commands are described in Table 36, Description of commands on the editor window context menu.
These commands are available on the editor window context menu:
Menu command Description
Cut, Copy, Paste Standard window commands.
Complete Attempts to complete the word you have begun to type, basing the guess on the contents of the rest of the editor document.
Match Brackets Selects all text between the brackets immediately surrounding the insertion point, increases the selection to the next hierarchic pair of brackets, or beeps if there is no higher bracket hierarchy.
Table 36: Description of commands on the editor window context menu
UEW-8:1
IAR Embedded Workbench® IDEUser Guide

IAR Embedded Workbench® IDE reference
Insert Template Displays a list in the editor window from which you can choose a code template to be inserted at the location of the insertion point. If the code template you choose requires any field input, the Template dialog box appears; for information about this dialog box, see Template dialog box, page 232. For information about using code templates, see Using and adding code templates, page 103.
Open "header.h" Opens the header file "header.h" in an editor window. This menu command is only available if the insertion point is located on an #include line when you open the context menu.
Open Header/Source File
Jumps from the current file to the corresponding header or source file. If the destination file is not open when performing the command, the file will first be opened. This menu command is only available if the insertion point is located on any line except an #include line when you open the context menu. This command is also available from the File>Open menu.
Go to definition of symbol
Shows the declaration of the symbol where the insertion point is placed.
Check InCheck OutUndo Checkout
Commands for source code control; for more details, see Source Code Control menu, page 199. These menu commands are only available if the current source file in the editor window is SCC-controlled. The file must also be a member of the current project.
Toggle Breakpoint (Code) Toggles a code breakpoint at the statement or instruction containing or close to the cursor in the source window. For information about code breakpoints, see Code breakpoints dialog box, page 214.
Toggle Breakpoint(Log)
Toggles a log breakpoint at the statement or instruction containing or close to the cursor in the source window. For information about log breakpoints, see Log breakpoints dialog box, page 216.
Enable/disableBreakpoint
Toggles a breakpoint between being disabled, but not actually removed—making it available for future use—and being enabled again.
Set Data Breakpointfor variable
Toggles a data breakpoint on variables with static storage duration. Requires support in the C-SPY driver you are using.
Edit Breakpoint Displays the Edit Breakpoint dialog box to let you edit the currently selected breakpoint. If there are more than one breakpoint on the selected line, a submenu is displayed that lists all available breakpoints on that line.
Set Next Statement Sets the PC directly to the selected statement or instruction without executing any code. Use this menu command with care. This menu command is only available when you are using the debugger.
Menu command Description
Table 36: Description of commands on the editor window context menu (Continued)
UEW-8:1
Part 6. Reference information 207
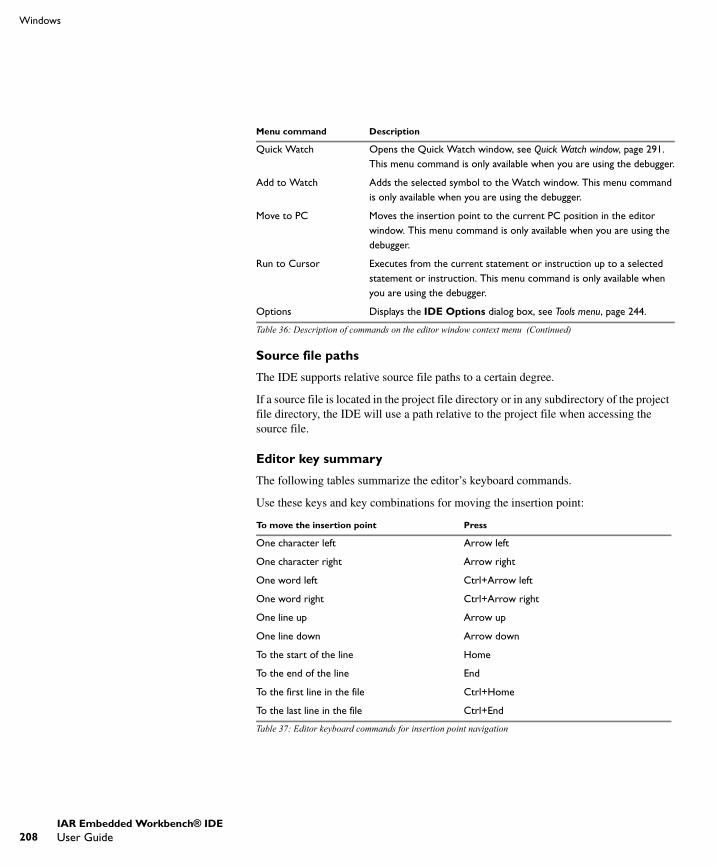
208
Windows
Source file paths
The IDE supports relative source file paths to a certain degree.
If a source file is located in the project file directory or in any subdirectory of the project file directory, the IDE will use a path relative to the project file when accessing the source file.
Editor key summary
The following tables summarize the editor’s keyboard commands.
Use these keys and key combinations for moving the insertion point:
Quick Watch Opens the Quick Watch window, see Quick Watch window, page 291. This menu command is only available when you are using the debugger.
Add to Watch Adds the selected symbol to the Watch window. This menu command is only available when you are using the debugger.
Move to PC Moves the insertion point to the current PC position in the editor window. This menu command is only available when you are using the debugger.
Run to Cursor Executes from the current statement or instruction up to a selected statement or instruction. This menu command is only available when you are using the debugger.
Options Displays the IDE Options dialog box, see Tools menu, page 244.
To move the insertion point Press
One character left Arrow left
One character right Arrow right
One word left Ctrl+Arrow left
One word right Ctrl+Arrow right
One line up Arrow up
One line down Arrow down
To the start of the line Home
To the end of the line End
To the first line in the file Ctrl+Home
To the last line in the file Ctrl+End
Table 37: Editor keyboard commands for insertion point navigation
Menu command Description
Table 36: Description of commands on the editor window context menu (Continued)
UEW-8:1
IAR Embedded Workbench® IDEUser Guide
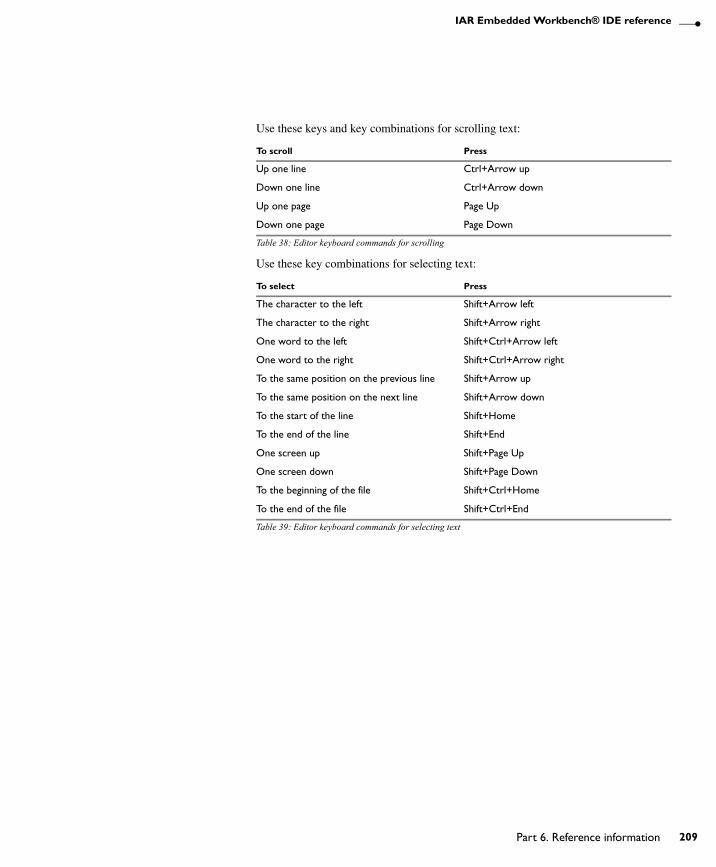
IAR Embedded Workbench® IDE reference
Use these keys and key combinations for scrolling text:
Use these key combinations for selecting text:
To scroll Press
Up one line Ctrl+Arrow up
Down one line Ctrl+Arrow down
Up one page Page Up
Down one page Page Down
Table 38: Editor keyboard commands for scrolling
To select Press
The character to the left Shift+Arrow left
The character to the right Shift+Arrow right
One word to the left Shift+Ctrl+Arrow left
One word to the right Shift+Ctrl+Arrow right
To the same position on the previous line Shift+Arrow up
To the same position on the next line Shift+Arrow down
To the start of the line Shift+Home
To the end of the line Shift+End
One screen up Shift+Page Up
One screen down Shift+Page Down
To the beginning of the file Shift+Ctrl+Home
To the end of the file Shift+Ctrl+End
Table 39: Editor keyboard commands for selecting text
UEW-8:1
Part 6. Reference information 209
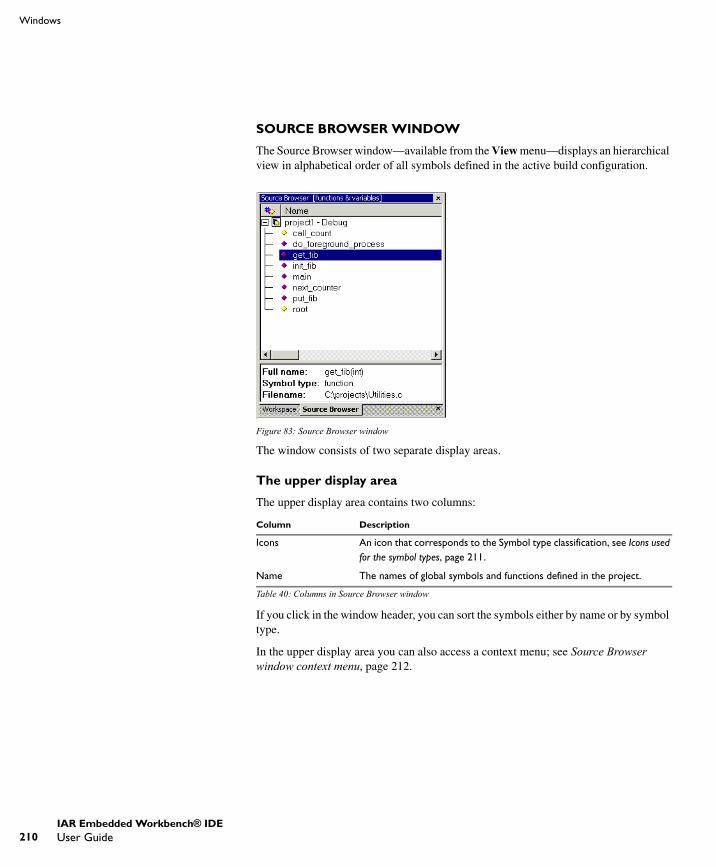
210
Windows
SOURCE BROWSER WINDOW
The Source Browser window—available from the View menu—displays an hierarchical view in alphabetical order of all symbols defined in the active build configuration.
Figure 83: Source Browser window
The window consists of two separate display areas.
The upper display area
The upper display area contains two columns:
If you click in the window header, you can sort the symbols either by name or by symbol type.
In the upper display area you can also access a context menu; see Source Browser window context menu, page 212.
Column Description
Icons An icon that corresponds to the Symbol type classification, see Icons used for the symbol types, page 211.
Name The names of global symbols and functions defined in the project.
Table 40: Columns in Source Browser window
UEW-8:1
IAR Embedded Workbench® IDEUser Guide
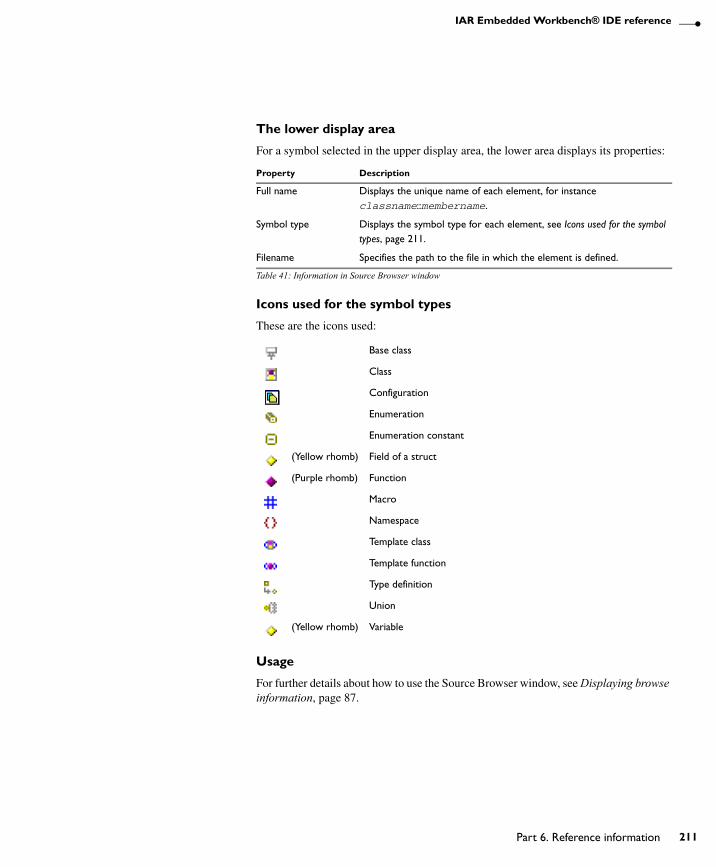
IAR Embedded Workbench® IDE reference
The lower display area
For a symbol selected in the upper display area, the lower area displays its properties:
Icons used for the symbol types
These are the icons used:
Usage
For further details about how to use the Source Browser window, see Displaying browse information, page 87.
Property Description
Full name Displays the unique name of each element, for instance classname::membername.
Symbol type Displays the symbol type for each element, see Icons used for the symbol types, page 211.
Filename Specifies the path to the file in which the element is defined.
Table 41: Information in Source Browser window
Base class
Class
Configuration
Enumeration
Enumeration constant
(Yellow rhomb) Field of a struct
(Purple rhomb) Function
Macro
Namespace
Template class
Template function
Type definition
Union
(Yellow rhomb) Variable
UEW-8:1
Part 6. Reference information 211
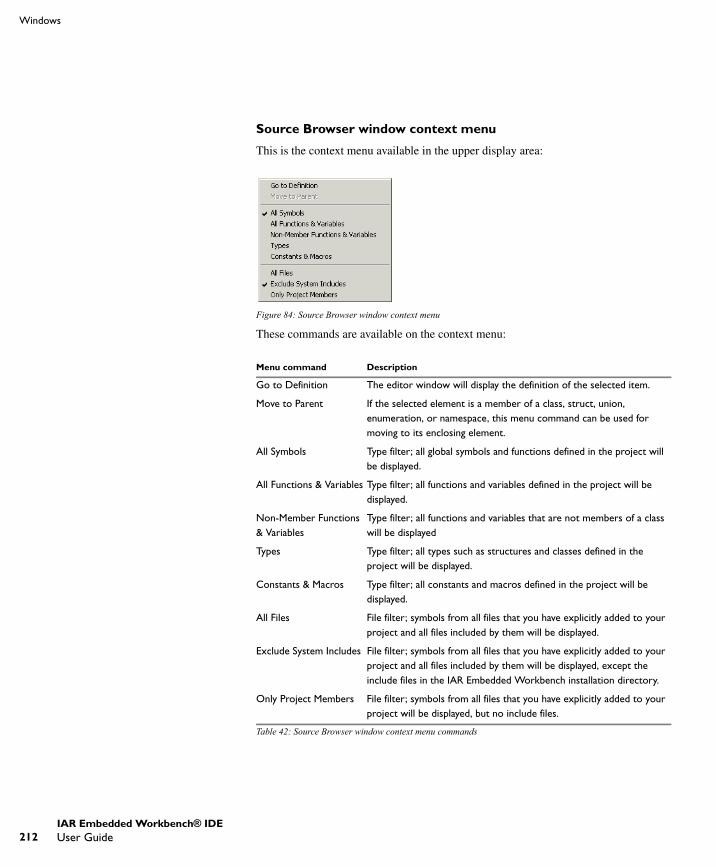
212
Windows
Source Browser window context menu
This is the context menu available in the upper display area:
Figure 84: Source Browser window context menu
These commands are available on the context menu:
Menu command Description
Go to Definition The editor window will display the definition of the selected item.
Move to Parent If the selected element is a member of a class, struct, union, enumeration, or namespace, this menu command can be used for moving to its enclosing element.
All Symbols Type filter; all global symbols and functions defined in the project will be displayed.
All Functions & Variables Type filter; all functions and variables defined in the project will be displayed.
Non-Member Functions & Variables
Type filter; all functions and variables that are not members of a class will be displayed
Types Type filter; all types such as structures and classes defined in the project will be displayed.
Constants & Macros Type filter; all constants and macros defined in the project will be displayed.
All Files File filter; symbols from all files that you have explicitly added to your project and all files included by them will be displayed.
Exclude System Includes File filter; symbols from all files that you have explicitly added to your project and all files included by them will be displayed, except the include files in the IAR Embedded Workbench installation directory.
Only Project Members File filter; symbols from all files that you have explicitly added to your project will be displayed, but no include files.
Table 42: Source Browser window context menu commands
UEW-8:1
IAR Embedded Workbench® IDEUser Guide

IAR Embedded Workbench® IDE reference
BREAKPOINTS WINDOW
The Breakpoints window—available from the View menu—lists all breakpoints. From the window you can conveniently monitor, enable, and disable breakpoints; you can also define new breakpoints and modify existing breakpoints.
Figure 85: Breakpoints window
All breakpoints you define are displayed in the Breakpoints window.
For more information about the breakpoint system and how to set breakpoints, see the chapter Using breakpoints in Part 4. Debugging.
Breakpoints window context menu
Right-clicking in the Breakpoints window displays a context menu with several commands.
Figure 86: Breakpoints window context menu
These commands are available on the context menu:
Menu command Description
Go to Source Moves the insertion point to the location of the breakpoint, if the breakpoint has a source location. Double-click a breakpoint in the Breakpoints window to perform the same command.
Edit Opens the Edit Breakpoint dialog box for the selected breakpoint.
Table 43: Breakpoints window context menu commands
UEW-8:1
Part 6. Reference information 213

214
Windows
Code breakpoints dialog box
Code breakpoints are triggered when an instruction is fetched from the specified location. If you have set the breakpoint on a specific machine instruction, the breakpoint will be triggered and the execution will stop, before the instruction is executed.
To set a code breakpoint, right-click in the Breakpoints window and choose New Breakpoint>Code on the context menu. To modify an existing breakpoint, select it in the Breakpoints window and choose Edit on the context menu.
Delete Deletes the selected breakpoint. Press the Delete key to perform the same command.
Enable Enables the selected breakpoint. The check box at the beginning of the line will be selected. You can also perform the command by manually selecting the check box. This command is only available if the selected breakpoint is disabled.
Disable Disables the selected breakpoint. The check box at the beginning of the line will be cleared. You can also perform this command by manually deselecting the check box.This command is only available if the selected breakpoint is enabled.
Enable All Enables all defined breakpoints.
Disable All Disables all defined breakpoints.
New Breakpoint Displays a submenu where you can open the New Breakpoint dialog box for the available breakpoint types. All breakpoints you define using the New Breakpoint dialog box are preserved between debug sessions. In addition to code and log breakpoints—see Code breakpoints dialog box, page 214 and —other types of breakpoints might be available depending on the C-SPY driver you are using. For information about driver-specific breakpoint types, see the driver-specific debugger documentation.
Menu command Description
Table 43: Breakpoints window context menu commands (Continued)
UEW-8:1
IAR Embedded Workbench® IDEUser Guide
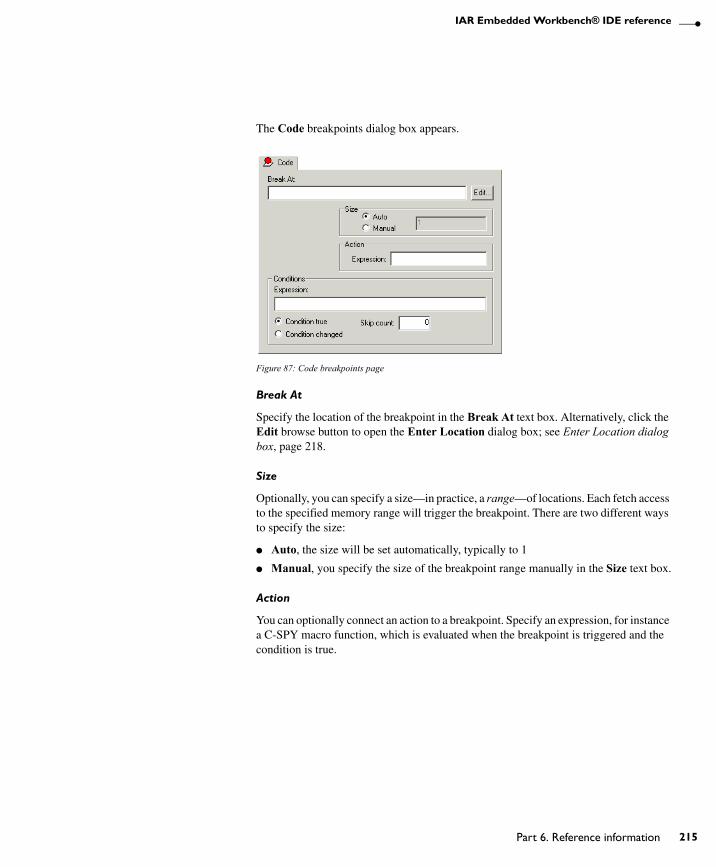
IAR Embedded Workbench® IDE reference
The Code breakpoints dialog box appears.
Figure 87: Code breakpoints page
Break At
Specify the location of the breakpoint in the Break At text box. Alternatively, click the Edit browse button to open the Enter Location dialog box; see Enter Location dialog box, page 218.
Size
Optionally, you can specify a size—in practice, a range—of locations. Each fetch access to the specified memory range will trigger the breakpoint. There are two different ways to specify the size:
● Auto, the size will be set automatically, typically to 1
● Manual, you specify the size of the breakpoint range manually in the Size text box.
Action
You can optionally connect an action to a breakpoint. Specify an expression, for instance a C-SPY macro function, which is evaluated when the breakpoint is triggered and the condition is true.
UEW-8:1
Part 6. Reference information 215
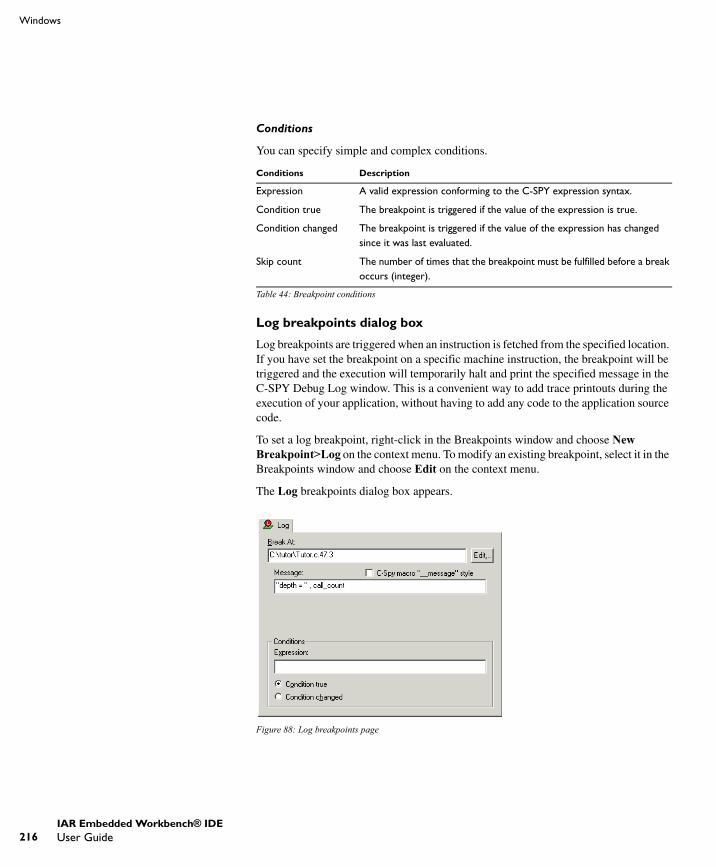
216
Windows
Conditions
You can specify simple and complex conditions.
Log breakpoints dialog box
Log breakpoints are triggered when an instruction is fetched from the specified location. If you have set the breakpoint on a specific machine instruction, the breakpoint will be triggered and the execution will temporarily halt and print the specified message in the C-SPY Debug Log window. This is a convenient way to add trace printouts during the execution of your application, without having to add any code to the application source code.
To set a log breakpoint, right-click in the Breakpoints window and choose New Breakpoint>Log on the context menu. To modify an existing breakpoint, select it in the Breakpoints window and choose Edit on the context menu.
The Log breakpoints dialog box appears.
Figure 88: Log breakpoints page
Conditions Description
Expression A valid expression conforming to the C-SPY expression syntax.
Condition true The breakpoint is triggered if the value of the expression is true.
Condition changed The breakpoint is triggered if the value of the expression has changed since it was last evaluated.
Skip count The number of times that the breakpoint must be fulfilled before a break occurs (integer).
Table 44: Breakpoint conditions
UEW-8:1
IAR Embedded Workbench® IDEUser Guide

IAR Embedded Workbench® IDE reference
The quickest—and typical—way to set a log breakpoint is by choosing Toggle Breakpoint (Log) from the context menu available when you right-click in either the editor or the Disassembly window. For more information about how to set breakpoints, see Defining breakpoints, page 133.
Break At
Specify the location of the breakpoint in the Break At text box. Alternatively, click the Edit button to open the Enter Location dialog box; see Enter Location dialog box, page 218.
Message
Specify the message you want to be displayed in the C-SPY Debug Log window. The message can either be plain text, or—if you also select the option C-SPY macro "__message" style—a comma-separated list of arguments.
C-SPY macro "__message" style
Select this option to make a comma-separated list of arguments specified in the Message text box be treated exactly as the arguments to the C-SPY macro language statement __message, see Formatted output, page 372.
Conditions
You can specify simple and complex conditions.
Conditions Description
Expression A valid expression conforming to the C-SPY expression syntax.
Condition true The breakpoint is triggered if the value of the expression is true.
Condition changed The breakpoint is triggered if the value of the expression has changed since it was last evaluated.
Table 45: Log breakpoint conditions
UEW-8:1
Part 6. Reference information 217

218
Windows
Enter Location dialog box
Use the Enter Location dialog box—available from a breakpoints dialog box—to specify the location of the breakpoint.
Figure 89: Enter Location dialog box
You can choose between these locations and their possible settings:
Location type Description/Examples
Expression Any expression that evaluates to a valid address, such as a function or variable name. Code breakpoints are set on functions and data breakpoints are set on variable names. For example, my_var refers to the location of the variable my_var, and arr[3] refers to the third element of the array arr.
Absolute Address An absolute location on the form zone:hexaddress or simply hexaddress. Zone specifies in which memory the address belongs. For example Memory:0x42.If you enter a combination of a zone and address that is not valid, C-SPY will indicate the mismatch.
Source Location A location in the C source code using the syntax:{file path}.row.column. File specifies the filename and full path. Row specifies the row in which you want the breakpoint. Column specifies the column in which you want the breakpoint. Note that the Source Location type is usually meaningful only for code breakpoints.For example, {C:\my_projects\Utilities.c}.22.3 sets a breakpoint on the third character position on line 22 in the source file Utilities.c.
Table 46: Location types
UEW-8:1
IAR Embedded Workbench® IDEUser Guide
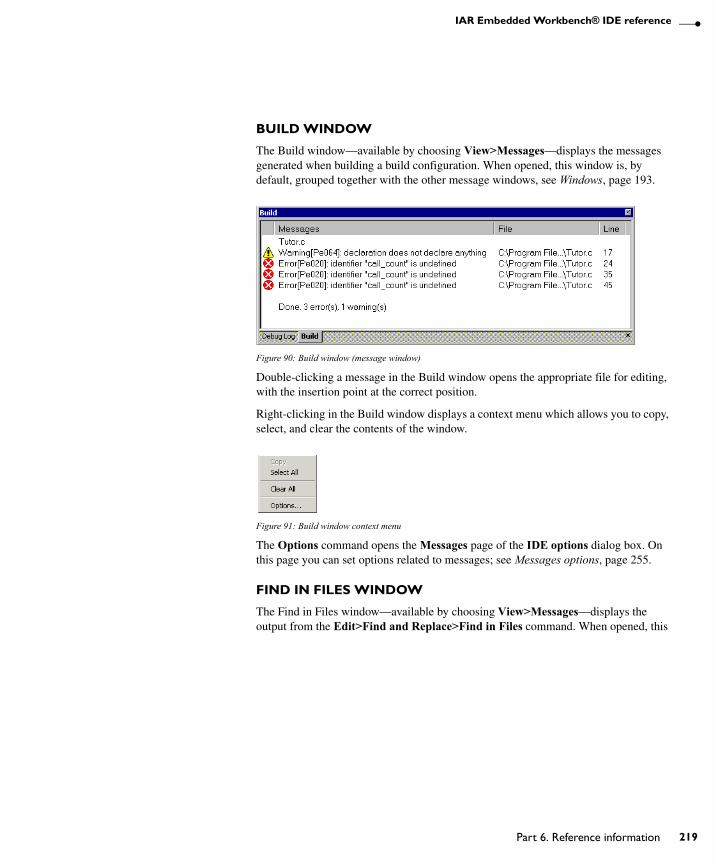
IAR Embedded Workbench® IDE reference
BUILD WINDOW
The Build window—available by choosing View>Messages—displays the messages generated when building a build configuration. When opened, this window is, by default, grouped together with the other message windows, see Windows, page 193.
Figure 90: Build window (message window)
Double-clicking a message in the Build window opens the appropriate file for editing, with the insertion point at the correct position.
Right-clicking in the Build window displays a context menu which allows you to copy, select, and clear the contents of the window.
Figure 91: Build window context menu
The Options command opens the Messages page of the IDE options dialog box. On this page you can set options related to messages; see Messages options, page 255.
FIND IN FILES WINDOW
The Find in Files window—available by choosing View>Messages—displays the output from the Edit>Find and Replace>Find in Files command. When opened, this
UEW-8:1
Part 6. Reference information 219

220
Windows
window is, by default, grouped together with the other message windows, see Windows, page 193.
Figure 92: Find in Files window (message window)
Double-clicking an entry in the page opens the appropriate file with the insertion point positioned at the correct location.
Right-clicking in the Find in Files window displays a context menu which allows you to copy, select, and clear the contents of the window.
Figure 93: Find in Files window context menu
TOOL OUTPUT WINDOW
The Tool Output window—available by choosing View>Messages—displays any messages output by user-defined tools in the Tools menu, provided that you have selected the option Redirect to Output Window in the Configure Tools dialog box;
UEW-8:1
IAR Embedded Workbench® IDEUser Guide

IAR Embedded Workbench® IDE reference
see Configure Tools dialog box, page 265. When opened, this window is, by default, grouped together with the other message windows, see Windows, page 193.
Figure 94: Tool Output window (message window)
Right-clicking in the Tool Output window displays a context menu which allows you to copy, select, and clear the contents of the window.
Figure 95: Tool Output window context menu
DEBUG LOG WINDOW
The Debug Log window—available by choosing View>Messages—displays debugger output, such as diagnostic messages and trace information. This output is only available when C-SPY is running. When opened, this window is, by default, grouped together with the other message windows, see Windows, page 193.
Figure 96: Debug Log window (message window)
UEW-8:1
Part 6. Reference information 221
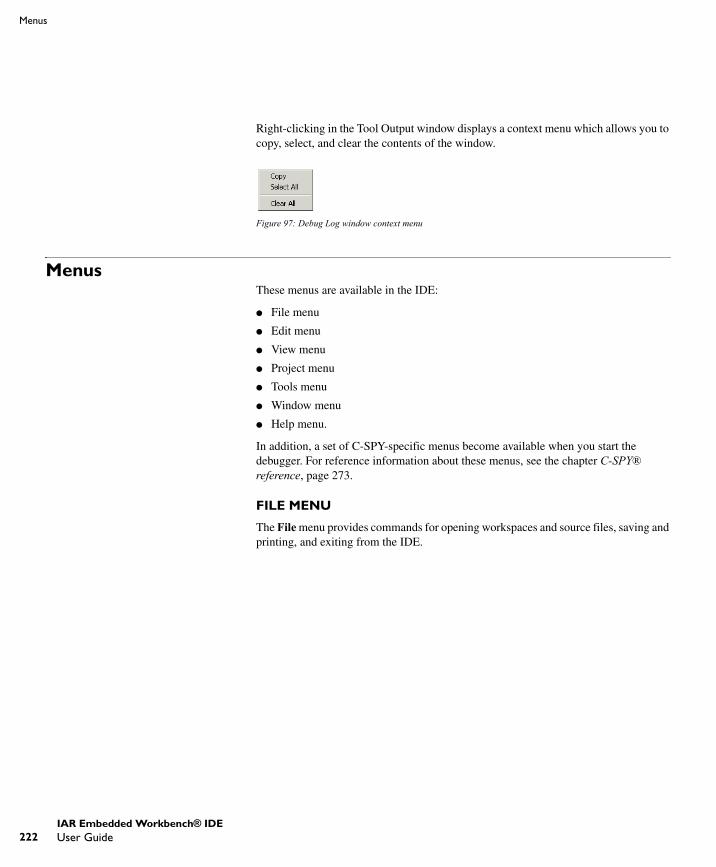
222
Menus
Right-clicking in the Tool Output window displays a context menu which allows you to copy, select, and clear the contents of the window.
Figure 97: Debug Log window context menu
MenusThese menus are available in the IDE:
● File menu
● Edit menu
● View menu
● Project menu
● Tools menu
● Window menu
● Help menu.
In addition, a set of C-SPY-specific menus become available when you start the debugger. For reference information about these menus, see the chapter C-SPY® reference, page 273.
FILE MENU
The File menu provides commands for opening workspaces and source files, saving and printing, and exiting from the IDE.
UEW-8:1
IAR Embedded Workbench® IDEUser Guide

IAR Embedded Workbench® IDE reference
The menu also includes a numbered list of the most recently opened files and workspaces. To open one of them, choose it from the menu.
Figure 98: File menu
These commands are available on the File menu:
Menu command Shortcut Description
New CTRL+N Displays a submenu with commands for creating a new workspace, or a new text file.
Open>File CTRL+O Displays a submenu from which you can select a text file or an HTML document to open.
Open>Workspace
Displays a submenu from which you can select a workspace file to open. Before a new workspace is opened you will be prompted to save and close any currently open workspaces.
Open>Header/Source File
CTRL+SHIFT+H
Opens the header file or source file that corresponds to the current file, and jumps from the current file to the newly opened file. This command is also available from the context menu available from the editor window.
Close Closes the active window. You will be given the opportunity to save any files that have been modified before closing.
Open Workspace Displays a dialog box where you can open a workspace file. You will be given the opportunity to save and close any currently open workspace file that has been modified before opening a new workspace.
Save Workspace Saves the current workspace file.
Close Workspace Closes the current workspace file.
Table 47: File menu commands
UEW-8:1
Part 6. Reference information 223
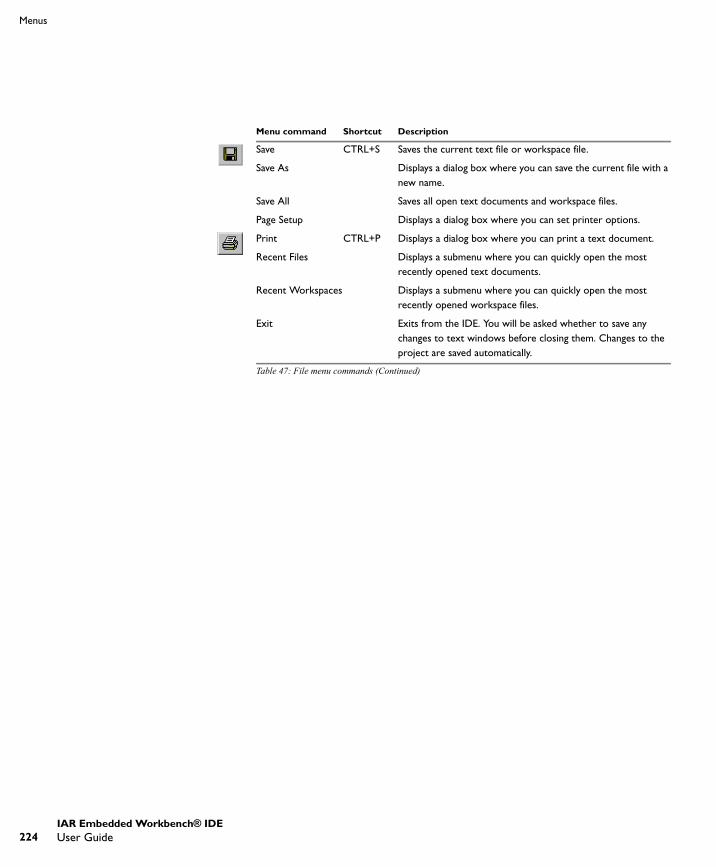
224
Menus
Save CTRL+S Saves the current text file or workspace file.
Save As Displays a dialog box where you can save the current file with a new name.
Save All Saves all open text documents and workspace files.
Page Setup Displays a dialog box where you can set printer options.
Print CTRL+P Displays a dialog box where you can print a text document.
Recent Files Displays a submenu where you can quickly open the most recently opened text documents.
Recent Workspaces Displays a submenu where you can quickly open the most recently opened workspace files.
Exit Exits from the IDE. You will be asked whether to save any changes to text windows before closing them. Changes to the project are saved automatically.
Menu command Shortcut Description
Table 47: File menu commands (Continued)
UEW-8:1
IAR Embedded Workbench® IDEUser Guide
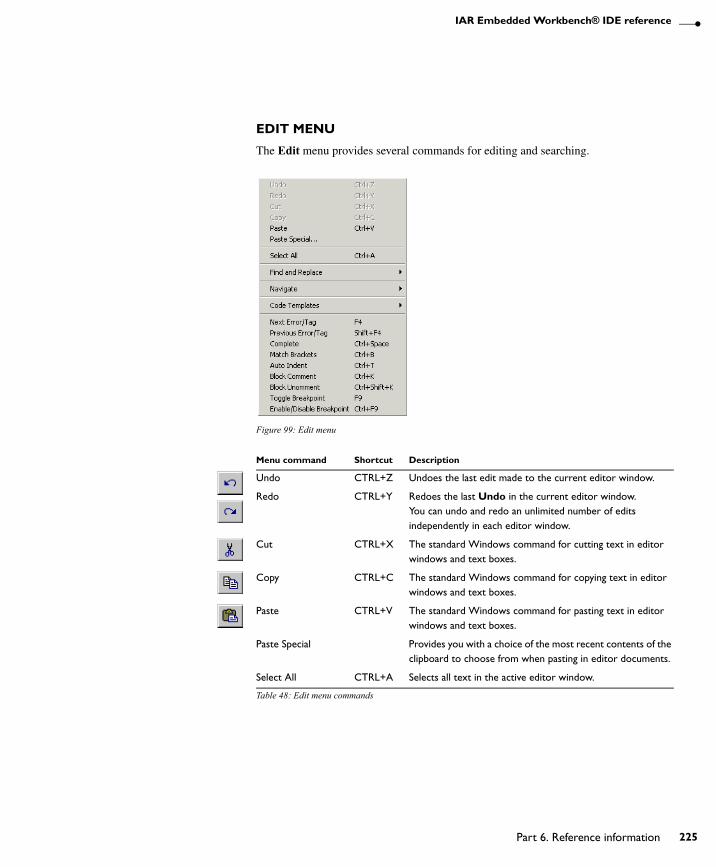
IAR Embedded Workbench® IDE reference
EDIT MENU
The Edit menu provides several commands for editing and searching.
Figure 99: Edit menu
Menu command Shortcut Description
Undo CTRL+Z Undoes the last edit made to the current editor window.
Redo CTRL+Y Redoes the last Undo in the current editor window.You can undo and redo an unlimited number of edits independently in each editor window.
Cut CTRL+X The standard Windows command for cutting text in editor windows and text boxes.
Copy CTRL+C The standard Windows command for copying text in editor windows and text boxes.
Paste CTRL+V The standard Windows command for pasting text in editor windows and text boxes.
Paste Special Provides you with a choice of the most recent contents of the clipboard to choose from when pasting in editor documents.
Select All CTRL+A Selects all text in the active editor window.
Table 48: Edit menu commands
UEW-8:1
Part 6. Reference information 225
226
Menus
Find and Replace>FindCTRL+F Displays the Find dialog box where you can search for text within the current editor window. Note that if the insertion point is located in the Memory window when you choose the Find command, the dialog box will contain a different set of options than it would otherwise do. If the insertion point is located in the Trace window when you choose the Find command, the Find in Trace dialog box is opened; the contents of this dialog box depend on the C-SPY driver you are using, see the driver documentation for more information.
Find and Replace>Find Next
F3 Finds the next occurrence of the specified string.
Find and Replace>Find Previous
SHIFT+F3 Finds the previous occurrence of the specified string.
Find and Replace>Find Next (Selected)
CTRL+F3 Searches for the next occurrence of the currently selected text or the word currently surrounding the insertion point.
Find and Replace>Find Previous (Selected)
CTRL+SHIFT+F3
Searches for the previous occurrence of the currently selected text or the word currently surrounding the insertion point.
Find and Replace>Replace
CTRL+H Displays a dialog box where you can search for a specified string and replace each occurrence with another string. Note that if the insertion point is located in the Memory window when you choose the Replace command, the dialog box will contain a different set of options than it would otherwise do.
Find and Replace>Find in Files
Displays a dialog box where you can search for a specified string in multiple text files; see Find in Files dialog box, page 229.
Find and Replace>Incremental Search
CTRL+I Displays a dialog box where you can gradually fine-tune or expand the search by continuously changing the search string.
Navigate>Go To CTRL+G Displays the Go to Line dialog box where you can move the insertion point to a specified line and column in the current editor window.
Navigate>Toggle Bookmark
CTRL+F2 Toggles a bookmark at the line where the insertion point is located in the active editor window.
Navigate>Go to Bookmark
F2 Moves the insertion point to the next bookmark that has been defined with the Toggle Bookmark command.
Menu command Shortcut Description
Table 48: Edit menu commands (Continued)
UEW-8:1
IAR Embedded Workbench® IDEUser Guide
IAR Embedded Workbench® IDE reference
Navigate>Navigate Backward
ALT+Left arrow
Navigates backward in the insertion point history. The current position of the insertion point is added to the history by actions like Go to definition and clicking on a result from the Find in Files command.
Navigate>Navigate Forward
ALT+Right arrow
Navigates forward in the insertion point history. The current position of the insertion point is added to the history by actions like Go to definition and clicking on a result from the Find in Files command.
Navigate>Go to Definition
F12 Shows the declaration of the selected symbol or the symbol where the insertion point is placed. This menu command is available when browse information has been enabled, see Project options, page 257.
Code Templates>Insert Template
CTRL+SHIFT+SPACE
Displays a list in the editor window from which you can choose a code template to be inserted at the location of the insertion point. If the code template you choose requires any field input, the Template dialog box appears; for information about this dialog box, see Template dialog box, page 232. For information about using code templates, see Using and adding code templates, page 103.
Code Templates>Edit Templates
Opens the current code template file, where you can modify existing code templates and add your own code templates. For information about using code templates, see Using and adding code templates, page 103.
Next Error/Tag F4 If the Messages window contains a list of error messages or the results from a Find in Files search, this command will display the next item from that list in the editor window.
Previous Error/Tag SHIFT+F4 If the Messages window contains a list of error messages or the results from a Find in Files search, this command will display the previous item from that list in the editor window.
Complete CTRL+SPACE
Attempts to complete the word you have begun to type, basing the guess on the contents of the rest of the editor document.
Match Brackets Selects all text between the brackets immediately surrounding the insertion point, increases the selection to the next hierarchic pair of brackets, or beeps if there is no higher bracket hierarchy.
Menu command Shortcut Description
Table 48: Edit menu commands (Continued)
UEW-8:1
Part 6. Reference information 227

228
Menus
Find dialog box
The Find dialog box is available from the Edit menu. Note that the contents of this dialog box look different if you search in an editor window compared to if you search in the Memory window.
Auto Indent CTRL+T Indents one or several lines you have selected in a C/C++ source file. To configure the indentation, see Configure Auto Indent dialog box, page 250.
Block Comment CTRL+K Places the C++ comment character sequence // at the beginning of the selected lines.
Block Uncomment CTRL+K Removes the C++ comment character sequence // from the beginning of the selected lines.
Toggle Breakpoint F9 Toggles a breakpoint at the statement or instruction that contains or is located near the cursor in the source window.This command is also available as an icon button in the debug bar.
Enable/Disable Breakpoint
CTRL+F9 Toggles a breakpoint between being disabled, but not actually removed—making it available for future use—and being enabled again.
Option Description
Find what Selects the text to search for.
Match case Searches only occurrences that exactly match the case of the specified text. Otherwise specifying int will also find INT and Int. This option is only available when you search in an editor window.
Match whole word Searches the specified text only if it occurs as a separate word. Otherwise specifying int will also find print, sprintf etc. This option is only available when you search in an editor window.
Search as hex Searches for the specified hexadecimal value. This option is only available when you search in the Memory window.
Find next Finds the next occurrence of the selected text.
Find previous Finds the previous occurrence of the selected text.
Stop Stops an ongoing search. This button is only available during a search in the Memory window.
Table 49: Find dialog box options
Menu command Shortcut Description
Table 48: Edit menu commands (Continued)
UEW-8:1
IAR Embedded Workbench® IDEUser Guide

IAR Embedded Workbench® IDE reference
Replace dialog box
The Replace dialog box is available from the Edit menu.
Find in Files dialog box
Use the Find in Files dialog box—available from the Edit menu—to search for a string in files.
Figure 100: Find in Files dialog box
Option Description
Find what Selects the text to search for.
Replace with Selects the text to replace each found occurrence in the Replace With box.
Match whole word Searches the specified text only if it occurs as a separate word. Otherwise int will also find print, sprintf etc. This checkbox is not available when you perform the search in the Memory window.
Search as hex Searches for the specified hexadecimal value. This checkbox is only available when you perform the search in the Memory window.
Find next Searches the next occurrence of the text you have specified.
Replace Replaces the searched text with the specified text.
Replace all Replaces all occurrences of the searched text in the current editor window.
Table 50: Replace dialog box options
UEW-8:1
Part 6. Reference information 229
230
Menus
The result of the search appears in the Find in Files messages window—available from the View menu. You can then go to each occurrence by choosing the Edit>Next Error/Tag command, alternatively by double-clicking the messages in the Find in Files messages window. This opens the corresponding file in an editor window with the insertion point positioned at the start of the specified text. A blue flag in the left-most margin indicates the line.
In the Find in Files dialog box, you specify the search criteria with the following settings.
Find what:
A text field in which you type the string you want to search for (short cut &n). There are two options for fine-tuning the search:
Look in
The options in the Look in area lets you specify which files you want to search in for a specified string. Choose between:
Match case Searches only for occurrences that exactly match the case of the specified text. Otherwise specifying int will also find INT and Int.
Match whole word Searches only for the string when it occurs as a separate word (short cut &w). Otherwise int will also find print, sprintf and so on.
Project files The search is performed in all files that you have explicitly added to your project.
Project files and user include files
The search is performed in all files that you have explicitly added to your project and all files that they include, except the include files in the IAR Embedded Workbench installation directory.
Project files and all include files
The search is performed in all project files that you have explicitly added to your project and all files that they include.
Directory The search is performed in the directory that you specify. Recent search locations are saved in the drop-down list. Locate the directory using the browse button.
Look in subdirectories
The search is performed in the directory that you have specified and all its subdirectories.
UEW-8:1
IAR Embedded Workbench® IDEUser Guide
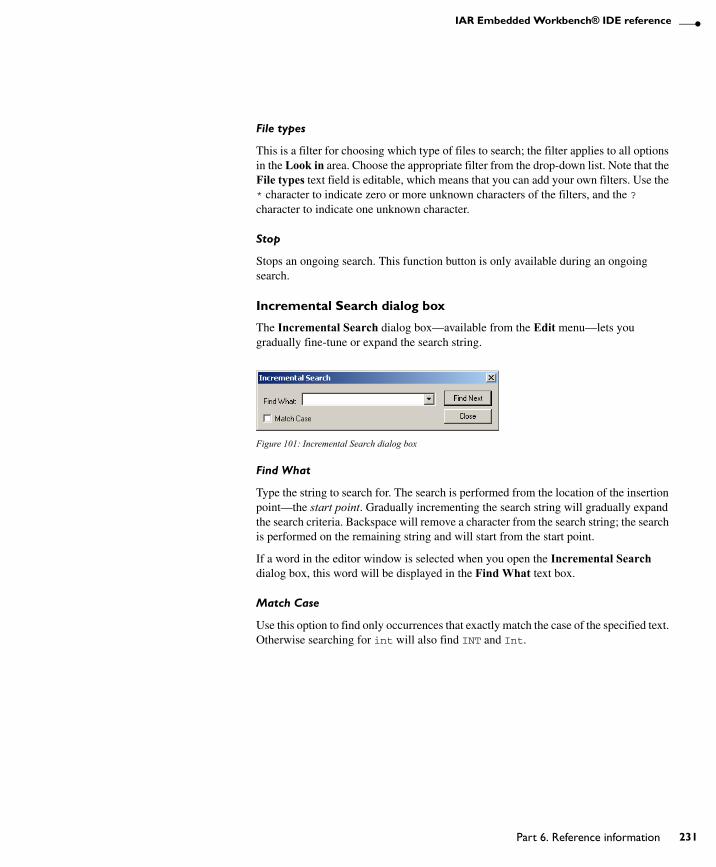
IAR Embedded Workbench® IDE reference
File types
This is a filter for choosing which type of files to search; the filter applies to all options in the Look in area. Choose the appropriate filter from the drop-down list. Note that the File types text field is editable, which means that you can add your own filters. Use the * character to indicate zero or more unknown characters of the filters, and the ? character to indicate one unknown character.
Stop
Stops an ongoing search. This function button is only available during an ongoing search.
Incremental Search dialog box
The Incremental Search dialog box—available from the Edit menu—lets you gradually fine-tune or expand the search string.
Figure 101: Incremental Search dialog box
Find What
Type the string to search for. The search is performed from the location of the insertion point—the start point. Gradually incrementing the search string will gradually expand the search criteria. Backspace will remove a character from the search string; the search is performed on the remaining string and will start from the start point.
If a word in the editor window is selected when you open the Incremental Search dialog box, this word will be displayed in the Find What text box.
Match Case
Use this option to find only occurrences that exactly match the case of the specified text. Otherwise searching for int will also find INT and Int.
UEW-8:1
Part 6. Reference information 231

232
Menus
Function buttons
Template dialog box
Use the Template dialog box to specify any field input that is required by the source code template you insert. This dialog box appears when you insert a code template that requires any field input.
Figure 102: Template dialog box
Note: This figure reflects the default code template that can be used for automatically inserting code for a for loop.
The contents of this dialog box match the code template. In other words, which fields that appear depends on how the code template is defined.
At the bottom of the dialog box, the code that would result from the code template is displayed.
For more information about using code templates, see Using and adding code templates, page 103.
Function button Description
Find Next Searches for the next occurrence of the current search string. If the Find What text box is empty when you click the Find Next button, a string to search for will automatically be selected from the drop-down list. To search for this string, click Find Next.
Close Closes this dialog box.
Table 51: Incremental Search function buttons
UEW-8:1
IAR Embedded Workbench® IDEUser Guide

IAR Embedded Workbench® IDE reference
VIEW MENU
With the commands on the View menu you can choose what to display in the IAR Embedded Workbench IDE. During a debug session you can also open debugger-specific windows from the View menu.
Figure 103: View menu
Menu command Description
Messages Opens a submenu which gives access to the message windows—Build, Find in Files, Tool Output, Debug Log—that display messages and text output from the IAR Embedded Workbench commands. If the window you choose from the menu is already open, it becomes the active window.
Workspace Opens the current Workspace window.
Source Browser Opens the Source Browser window.
Breakpoints Opens the Breakpoints window.
Toolbars The options Main and Debug toggle the two toolbars on and off.
Status bar Toggles the status bar on and off.
Table 52: View menu commands
UEW-8:1
Part 6. Reference information 233
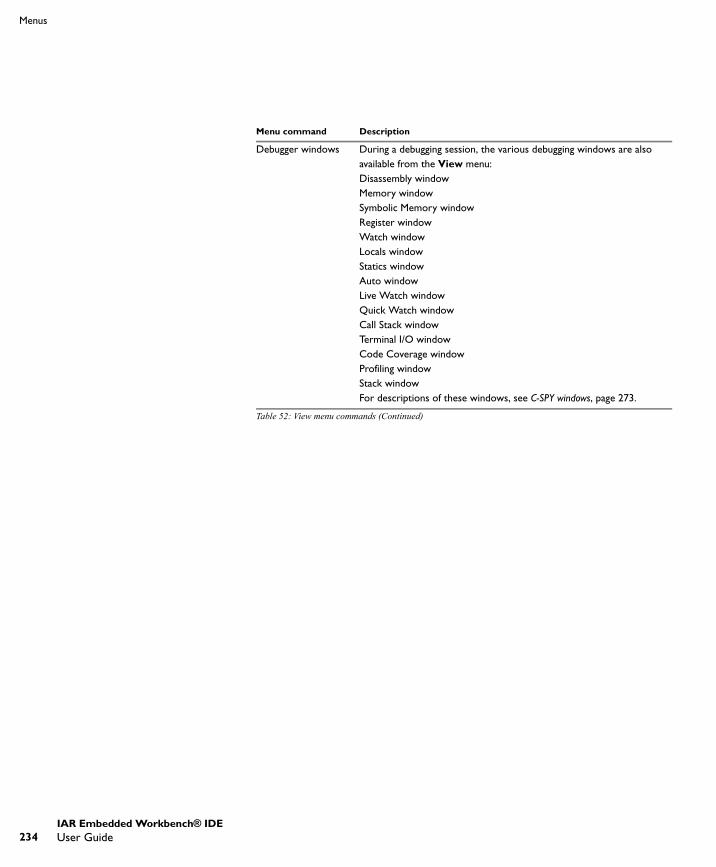
234
Menus
Debugger windows During a debugging session, the various debugging windows are also available from the View menu:Disassembly windowMemory windowSymbolic Memory windowRegister windowWatch windowLocals windowStatics windowAuto windowLive Watch windowQuick Watch windowCall Stack windowTerminal I/O windowCode Coverage windowProfiling windowStack windowFor descriptions of these windows, see C-SPY windows, page 273.
Menu command Description
Table 52: View menu commands (Continued)
UEW-8:1
IAR Embedded Workbench® IDEUser Guide
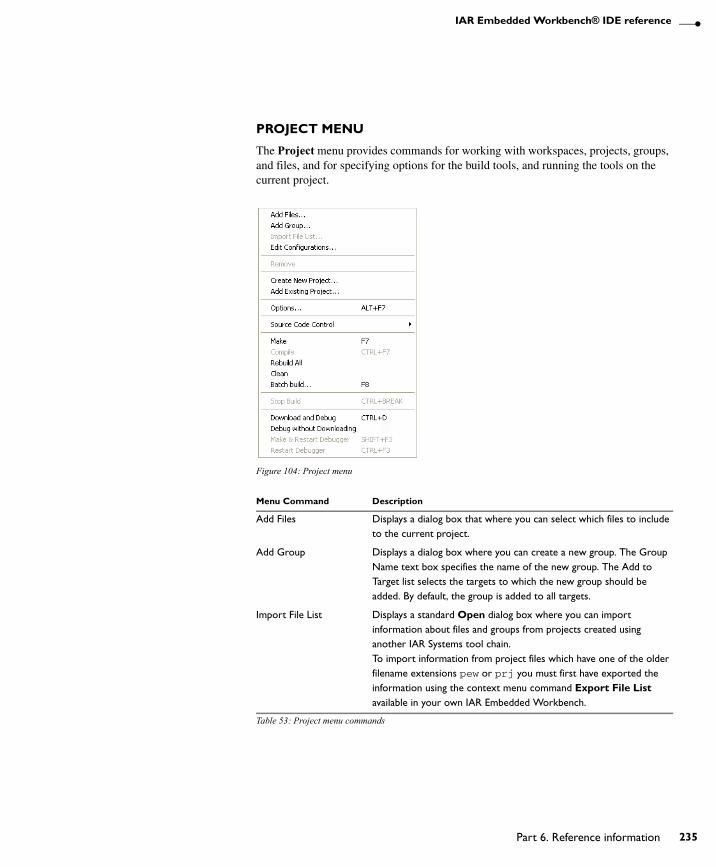
IAR Embedded Workbench® IDE reference
PROJECT MENU
The Project menu provides commands for working with workspaces, projects, groups, and files, and for specifying options for the build tools, and running the tools on the current project.
Figure 104: Project menu
Menu Command Description
Add Files Displays a dialog box that where you can select which files to include to the current project.
Add Group Displays a dialog box where you can create a new group. The Group Name text box specifies the name of the new group. The Add to Target list selects the targets to which the new group should be added. By default, the group is added to all targets.
Import File List Displays a standard Open dialog box where you can import information about files and groups from projects created using another IAR Systems tool chain.To import information from project files which have one of the older filename extensions pew or prj you must first have exported the information using the context menu command Export File List available in your own IAR Embedded Workbench.
Table 53: Project menu commands
UEW-8:1
Part 6. Reference information 235
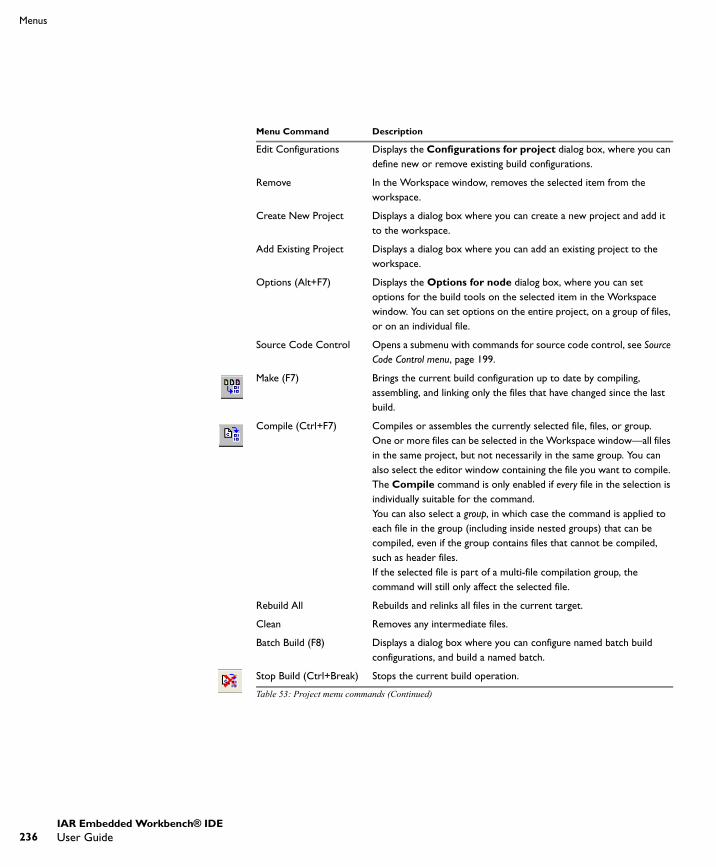
236
Menus
Edit Configurations Displays the Configurations for project dialog box, where you can define new or remove existing build configurations.
Remove In the Workspace window, removes the selected item from the workspace.
Create New Project Displays a dialog box where you can create a new project and add it to the workspace.
Add Existing Project Displays a dialog box where you can add an existing project to the workspace.
Options (Alt+F7) Displays the Options for node dialog box, where you can set options for the build tools on the selected item in the Workspace window. You can set options on the entire project, on a group of files, or on an individual file.
Source Code Control Opens a submenu with commands for source code control, see Source Code Control menu, page 199.
Make (F7) Brings the current build configuration up to date by compiling, assembling, and linking only the files that have changed since the last build.
Compile (Ctrl+F7) Compiles or assembles the currently selected file, files, or group.One or more files can be selected in the Workspace window—all files in the same project, but not necessarily in the same group. You can also select the editor window containing the file you want to compile. The Compile command is only enabled if every file in the selection is individually suitable for the command.You can also select a group, in which case the command is applied to each file in the group (including inside nested groups) that can be compiled, even if the group contains files that cannot be compiled, such as header files.If the selected file is part of a multi-file compilation group, the command will still only affect the selected file.
Rebuild All Rebuilds and relinks all files in the current target.
Clean Removes any intermediate files.
Batch Build (F8) Displays a dialog box where you can configure named batch build configurations, and build a named batch.
Stop Build (Ctrl+Break) Stops the current build operation.
Menu Command Description
Table 53: Project menu commands (Continued)
UEW-8:1
IAR Embedded Workbench® IDEUser Guide
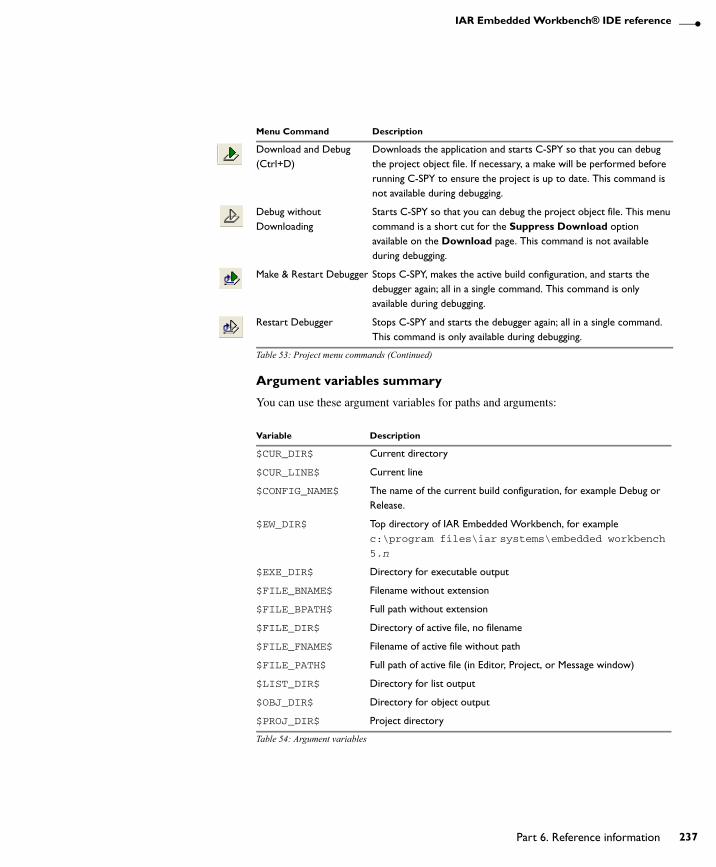
IAR Embedded Workbench® IDE reference
Argument variables summary
You can use these argument variables for paths and arguments:
Download and Debug (Ctrl+D)
Downloads the application and starts C-SPY so that you can debug the project object file. If necessary, a make will be performed before running C-SPY to ensure the project is up to date. This command is not available during debugging.
Debug without Downloading
Starts C-SPY so that you can debug the project object file. This menu command is a short cut for the Suppress Download option available on the Download page. This command is not available during debugging.
Make & Restart Debugger Stops C-SPY, makes the active build configuration, and starts the debugger again; all in a single command. This command is only available during debugging.
Restart Debugger Stops C-SPY and starts the debugger again; all in a single command. This command is only available during debugging.
Variable Description
$CUR_DIR$ Current directory
$CUR_LINE$ Current line
$CONFIG_NAME$ The name of the current build configuration, for example Debug or Release.
$EW_DIR$ Top directory of IAR Embedded Workbench, for example c:\program files\iar systems\embedded workbench 5.n
$EXE_DIR$ Directory for executable output
$FILE_BNAME$ Filename without extension
$FILE_BPATH$ Full path without extension
$FILE_DIR$ Directory of active file, no filename
$FILE_FNAME$ Filename of active file without path
$FILE_PATH$ Full path of active file (in Editor, Project, or Message window)
$LIST_DIR$ Directory for list output
$OBJ_DIR$ Directory for object output
$PROJ_DIR$ Project directory
Table 54: Argument variables
Menu Command Description
Table 53: Project menu commands (Continued)
UEW-8:1
Part 6. Reference information 237
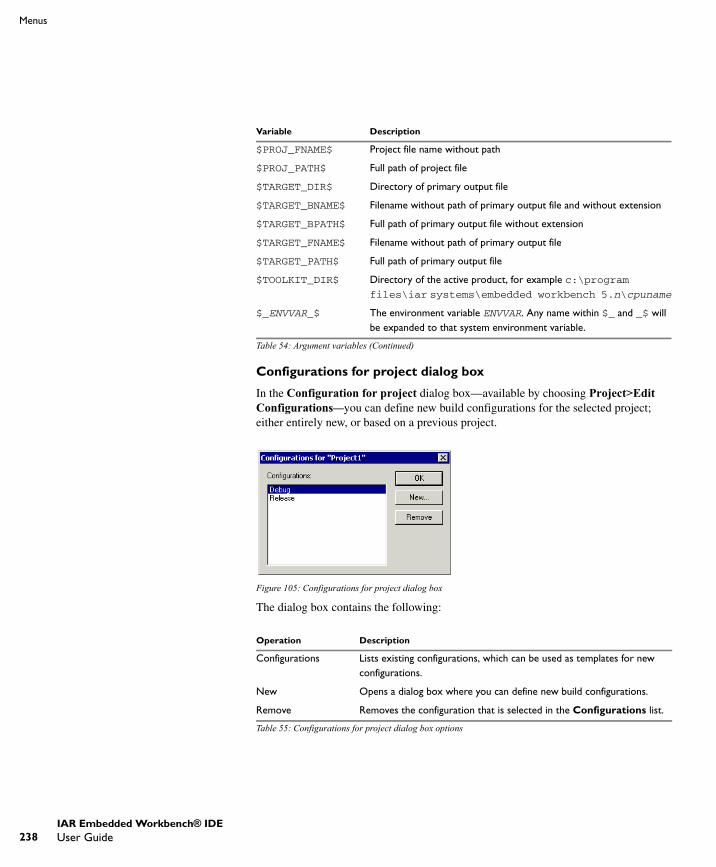
238
Menus
Configurations for project dialog box
In the Configuration for project dialog box—available by choosing Project>Edit Configurations—you can define new build configurations for the selected project; either entirely new, or based on a previous project.
Figure 105: Configurations for project dialog box
The dialog box contains the following:
$PROJ_FNAME$ Project file name without path
$PROJ_PATH$ Full path of project file
$TARGET_DIR$ Directory of primary output file
$TARGET_BNAME$ Filename without path of primary output file and without extension
$TARGET_BPATH$ Full path of primary output file without extension
$TARGET_FNAME$ Filename without path of primary output file
$TARGET_PATH$ Full path of primary output file
$TOOLKIT_DIR$ Directory of the active product, for example c:\program files\iar systems\embedded workbench 5.n\cpuname
$_ENVVAR_$ The environment variable ENVVAR. Any name within $_ and _$ will be expanded to that system environment variable.
Operation Description
Configurations Lists existing configurations, which can be used as templates for new configurations.
New Opens a dialog box where you can define new build configurations.
Remove Removes the configuration that is selected in the Configurations list.
Table 55: Configurations for project dialog box options
Variable Description
Table 54: Argument variables (Continued)
UEW-8:1
IAR Embedded Workbench® IDEUser Guide

IAR Embedded Workbench® IDE reference
New Configuration dialog box
In the New Configuration dialog box—available by clicking New in the Configurations for project dialog box—you can define new build configurations; either entirely new, or based on any currently defined configuration.
Figure 106: New Configuration dialog box
The dialog box contains the following:
Create New Project dialog box
The Create New Project dialog box is available from the Project menu, and lets you create a new project based on a template project. Template projects are available for
Item Description
Name The name of the build configuration.
Tool chain The target to build for. If you have several versions of IAR Embedded Workbench for different targets installed on your host computer, the drop-down list can contain these targets.
Based on configuration A currently defined build configuration that you want the new configuration to be based on. The new configuration will inherit the project settings and information about the factory settings from the old configuration. If you select None, the new configuration will have default factory settings and not be based on an already defined configuration.
Factory settings Specifies the default factory settings—either Debug or Release—that you want to apply to your new build configuration. These factory settings will be used by your project if you press the Factory Settings button in the Options dialog box.
Table 56: New Configuration dialog box options
UEW-8:1
Part 6. Reference information 239
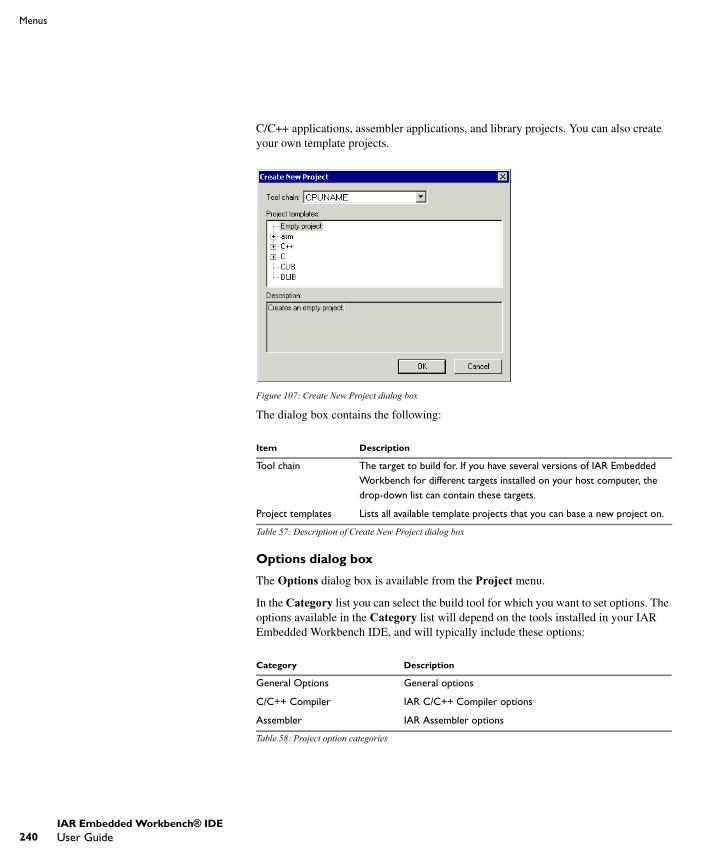
240
Menus
C/C++ applications, assembler applications, and library projects. You can also create your own template projects.
Figure 107: Create New Project dialog box
The dialog box contains the following:
Options dialog box
The Options dialog box is available from the Project menu.
In the Category list you can select the build tool for which you want to set options. The options available in the Category list will depend on the tools installed in your IAR Embedded Workbench IDE, and will typically include these options:
Item Description
Tool chain The target to build for. If you have several versions of IAR Embedded Workbench for different targets installed on your host computer, the drop-down list can contain these targets.
Project templates Lists all available template projects that you can base a new project on.
Table 57: Description of Create New Project dialog box
Category Description
General Options General options
C/C++ Compiler IAR C/C++ Compiler options
Assembler IAR Assembler options
Table 58: Project option categories
UEW-8:1
IAR Embedded Workbench® IDEUser Guide

IAR Embedded Workbench® IDE reference
Note: Additional debugger categories might be available depending on the debugger drivers installed.
Selecting a category displays one or more pages of options for that component of the IDE.
For detailed information about each option, see the option reference chapters:
● General options● Compiler options● Assembler options● Custom build options● Build actions options● Linker options● Library builder options● Debugger options.
For information about the options related to available hardware debugger systems, see the online help system.
Custom Build Options for extending the tool chain
Build Actions Options for pre-build and post-build actions
Linker IAR XLINK Linker options. This category is available for application projects.
Library Builder IAR XAR Library Builder options. This category is available for library projects.
Debugger IAR C-SPY Debugger options
Simulator Simulator-specific options
Category Description
Table 58: Project option categories (Continued)
UEW-8:1
Part 6. Reference information 241

242
Menus
Batch Build dialog box
The Batch Build dialog box—available by choosing Project>Batch build—lists all defined batches of build configurations.
Figure 108: Batch Build dialog box
The dialog box contains the following:
Item Description
Batches Lists all currently defined batches of build configurations.
New Displays the Edit Batch Build dialog box, where you can define new batches of build configurations.
Remove Removes the selected batch.
Edit Displays the Edit Batch Build dialog box, where you can modify already defined batches.
Build Consists of the three build commands Make, Clean, and Rebuild All.
Table 59: Description of the Batch Build dialog box
UEW-8:1
IAR Embedded Workbench® IDEUser Guide
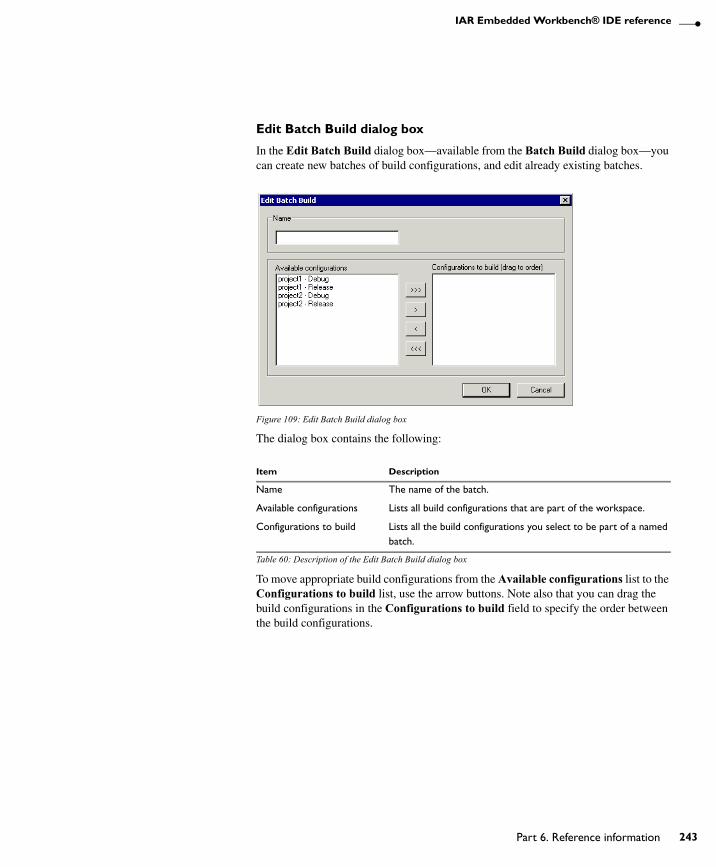
IAR Embedded Workbench® IDE reference
Edit Batch Build dialog box
In the Edit Batch Build dialog box—available from the Batch Build dialog box—you can create new batches of build configurations, and edit already existing batches.
Figure 109: Edit Batch Build dialog box
The dialog box contains the following:
To move appropriate build configurations from the Available configurations list to the Configurations to build list, use the arrow buttons. Note also that you can drag the build configurations in the Configurations to build field to specify the order between the build configurations.
Item Description
Name The name of the batch.
Available configurations Lists all build configurations that are part of the workspace.
Configurations to build Lists all the build configurations you select to be part of a named batch.
Table 60: Description of the Edit Batch Build dialog box
UEW-8:1
Part 6. Reference information 243

244
Menus
TOOLS MENU
The Tools menu provides commands for customizing the environment, such as changing common fonts and shortcut keys.
It is a user-configurable menu to which you can add tools for use with IAR Embedded Workbench. Thus, it might look different depending on which tools have been preconfigured to appear as menu items. See Configure Tools dialog box, page 265.
Figure 110: Tools menu
Tools menu commands
Menu command Description
Options Displays the IDE Options dialog box where you can customize the IDE. In the left side of the dialog box, select a category and the corresponding options are displayed in the right side of the dialog box. Which categories that are available in this dialog box depends on your IDE configuration, and whether the IDE is in a debugging session or not.
Configure Tools Displays a dialog box where you can set up the interface to use external tools.
Filename Extensions Displays a set of dialog boxes where you can define the filename extensions to be accepted by the build tools.
Configure Viewers Displays a dialog box where you can configure viewer applications to open documents with.
Notepad User-configured. This is an example of a user-configured addition to the Tools menu.
Table 61: Tools menu commands
UEW-8:1
IAR Embedded Workbench® IDEUser Guide

IAR Embedded Workbench® IDE reference
COMMON FONTS OPTIONS
Use the Common Fonts options—available by choosing Tools>Options—for configuring the fonts used for all project windows except the editor windows.
Figure 111: Common Fonts options
With the Font buttons you can change the fixed and proportional width fonts, respectively.
Any changes to the Fixed Width Font options will apply to the Disassembly, Register, and Memory windows. Any changes to the Proportional Width Font options will apply to all other windows.
None of the settings made on this page apply to the editor windows. For information about how to change the font in the editor windows, see Editor Colors and Fonts options, page 254.
UEW-8:1
Part 6. Reference information 245
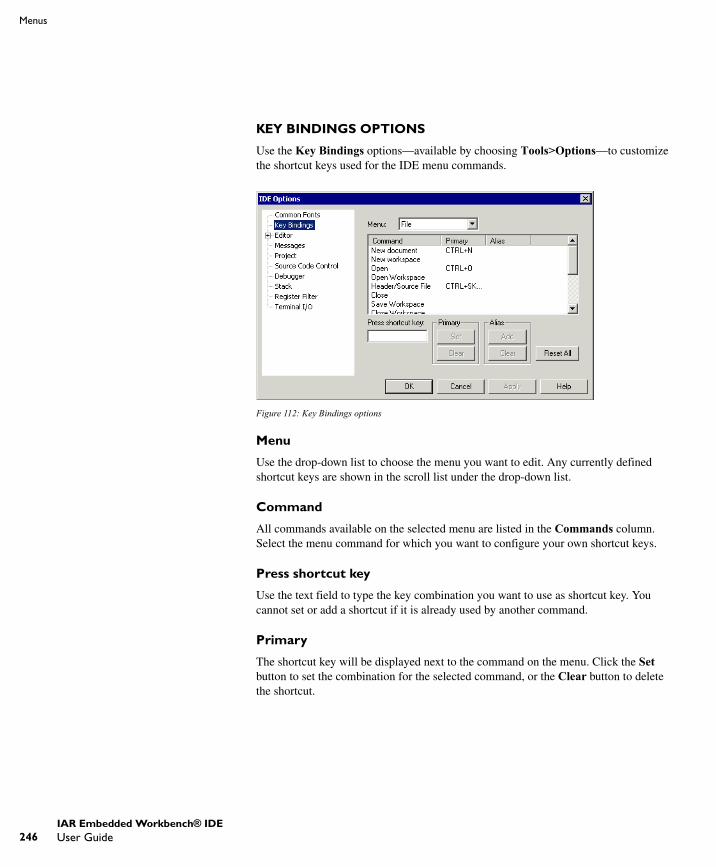
246
Menus
KEY BINDINGS OPTIONS
Use the Key Bindings options—available by choosing Tools>Options—to customize the shortcut keys used for the IDE menu commands.
Figure 112: Key Bindings options
Menu
Use the drop-down list to choose the menu you want to edit. Any currently defined shortcut keys are shown in the scroll list under the drop-down list.
Command
All commands available on the selected menu are listed in the Commands column. Select the menu command for which you want to configure your own shortcut keys.
Press shortcut key
Use the text field to type the key combination you want to use as shortcut key. You cannot set or add a shortcut if it is already used by another command.
Primary
The shortcut key will be displayed next to the command on the menu. Click the Set button to set the combination for the selected command, or the Clear button to delete the shortcut.
UEW-8:1
IAR Embedded Workbench® IDEUser Guide
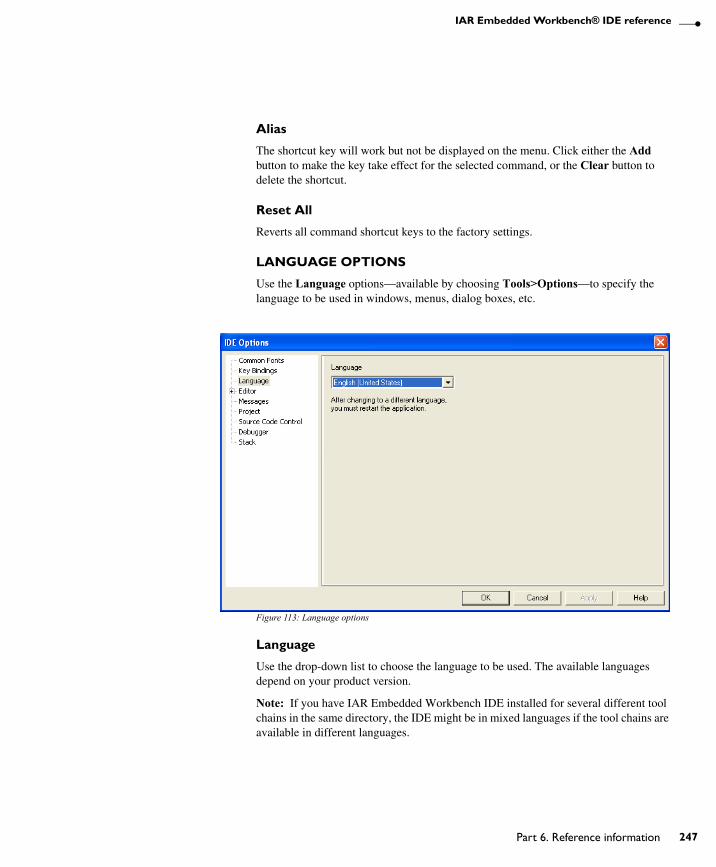
IAR Embedded Workbench® IDE reference
Alias
The shortcut key will work but not be displayed on the menu. Click either the Add button to make the key take effect for the selected command, or the Clear button to delete the shortcut.
Reset All
Reverts all command shortcut keys to the factory settings.
LANGUAGE OPTIONS
Use the Language options—available by choosing Tools>Options—to specify the language to be used in windows, menus, dialog boxes, etc.
Figure 113: Language options
Language
Use the drop-down list to choose the language to be used. The available languages depend on your product version.
Note: If you have IAR Embedded Workbench IDE installed for several different tool chains in the same directory, the IDE might be in mixed languages if the tool chains are available in different languages.
UEW-8:1
Part 6. Reference information 247

248
Menus
EDITOR OPTIONS
Use the Editor options—available by choosing Tools>Options—to configure the editor.
Figure 114: Editor options
For more information about the IAR Embedded Workbench IDE Editor and how to use it, see Editing, page 99.
Tab Size
Use this option to specify the number of character spaces corresponding to each tab.
Indent Size
Use this option to specify the number of character spaces to be used for indentation.
Tab Key Function
Use this option to specify how the Tab key is used. Choose between:
● Insert tab● Indent with spaces.
UEW-8:1
IAR Embedded Workbench® IDEUser Guide
IAR Embedded Workbench® IDE reference
EOL character
Use this option to select the line break character to be used when editor documents are saved. Choose between:
Show right margin
The area of the editor window outside the right-side margin is displayed as a light gray field. You can choose to set the size of the text field between the left-side margin and the right-side margin. Choose to set the size based on:
Syntax Highlighting
Use this option to make the editor display the syntax of C or C++ applications in different text styles.
To read more about syntax highlighting, see Editor Colors and Fonts options, page 254, and Syntax coloring, page 101.
Auto Indent
Use this option to ensure that when you press Return, the new line is indented automatically. For C/C++ source files, indentation is performed as configured in the Configure Auto Indent dialog box. Click the Configure button to open the dialog box where you can configure the automatic indentation; see Configure Auto Indent dialog box, page 250. For all other text files, the new line will have the same indentation as the previous line.
Show Line Numbers
Use this option to display line numbers in the editor window.
PC (default) Windows and DOS end of line characters. The PC format is used by default.
Unix UNIX end of line characters.
Preserve The same end of line character as the file had when it was opened, either PC or UNIX. If both types or neither type are present in the opened file, PC end of line characters are used.
Printing edge Size based on the printable area which is based on general printer settings.
Columns Size based on number of columns.
UEW-8:1
Part 6. Reference information 249
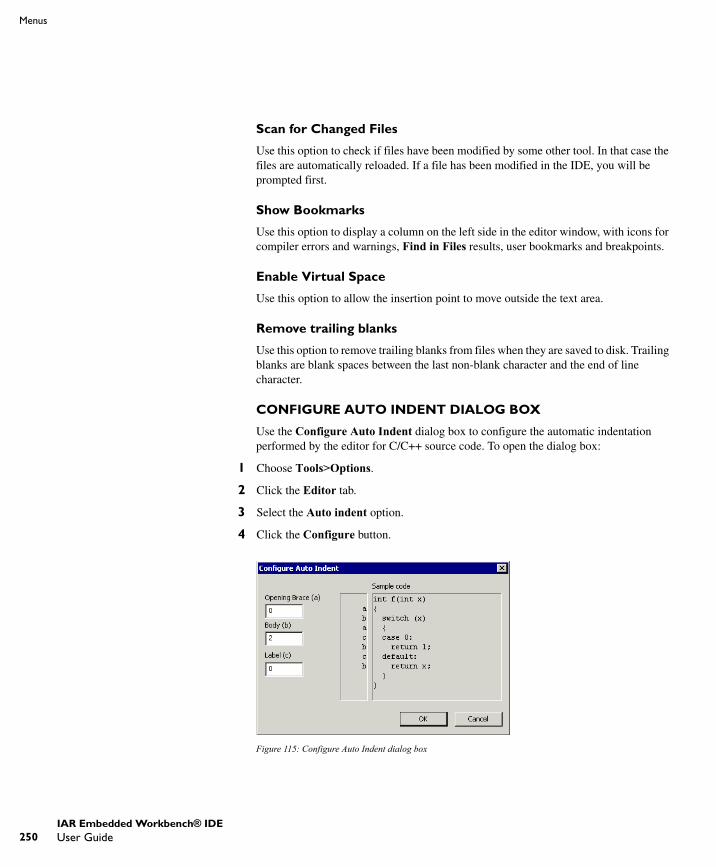
250
Menus
Scan for Changed Files
Use this option to check if files have been modified by some other tool. In that case the files are automatically reloaded. If a file has been modified in the IDE, you will be prompted first.
Show Bookmarks
Use this option to display a column on the left side in the editor window, with icons for compiler errors and warnings, Find in Files results, user bookmarks and breakpoints.
Enable Virtual Space
Use this option to allow the insertion point to move outside the text area.
Remove trailing blanks
Use this option to remove trailing blanks from files when they are saved to disk. Trailing blanks are blank spaces between the last non-blank character and the end of line character.
CONFIGURE AUTO INDENT DIALOG BOX
Use the Configure Auto Indent dialog box to configure the automatic indentation performed by the editor for C/C++ source code. To open the dialog box:
1 Choose Tools>Options.
2 Click the Editor tab.
3 Select the Auto indent option.
4 Click the Configure button.
Figure 115: Configure Auto Indent dialog box
UEW-8:1
IAR Embedded Workbench® IDEUser Guide
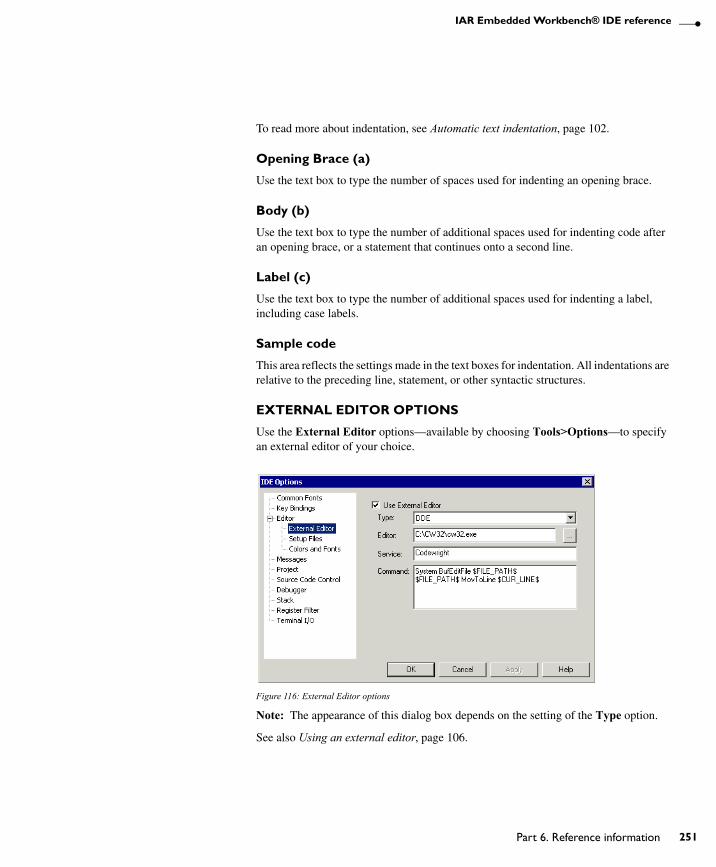
IAR Embedded Workbench® IDE reference
To read more about indentation, see Automatic text indentation, page 102.
Opening Brace (a)
Use the text box to type the number of spaces used for indenting an opening brace.
Body (b)
Use the text box to type the number of additional spaces used for indenting code after an opening brace, or a statement that continues onto a second line.
Label (c)
Use the text box to type the number of additional spaces used for indenting a label, including case labels.
Sample code
This area reflects the settings made in the text boxes for indentation. All indentations are relative to the preceding line, statement, or other syntactic structures.
EXTERNAL EDITOR OPTIONS
Use the External Editor options—available by choosing Tools>Options—to specify an external editor of your choice.
Figure 116: External Editor options
Note: The appearance of this dialog box depends on the setting of the Type option.
See also Using an external editor, page 106.
UEW-8:1
Part 6. Reference information 251
252
Menus
Use External Editor
Use this option to enable the use of an external editor.
Type
Use the drop-down list to select the type of interface. Choose between:
● Command Line● DDE (Windows Dynamic Data Exchange).
Editor
Use the text field to specify the filename and path of your external editor. A browse button is available for your convenience.
Arguments
Use the text field to specify any arguments to pass to the editor. Only applicable if you have selected Command Line as the interface type, see Type, page 252.
Service
Use the text field to specify the DDE service name used by the editor. Only applicable if you have selected DDE as the interface type, see Type, page 252.
The service name depends on the external editor that you are using. Refer to the user documentation of your external editor to find the appropriate settings.
Command
Use the text field to specify a sequence of command strings to send to the editor. The command strings should be typed as:
DDE-Topic CommandStringDDE-Topic CommandString
Only applicable if you have selected DDE as the interface type, see Type, page 252.
The command strings depend on the external editor that you are using. Refer to the user documentation of your external editor to find the appropriate settings.
Note: You can use variables in arguments. See Argument variables summary, page 237, for information about available argument variables.
UEW-8:1
IAR Embedded Workbench® IDEUser Guide

IAR Embedded Workbench® IDE reference
EDITOR SETUP FILES OPTIONS
Use the Editor Setup Files options—available by choosing Tools>Options—to specify setup files for the editor.
Figure 117: Editor Setup Files options
Use Custom Keyword File
Use this option to specify a text file containing keywords that you want the editor to highlight. For information about syntax coloring, see Syntax coloring, page 101.
Use Code Templates
Use this option to specify a text file with code templates that you can use for inserting frequently used code in your source file. For information about using code templates, see Using and adding code templates, page 103.
UEW-8:1
Part 6. Reference information 253

254
Menus
EDITOR COLORS AND FONTS OPTIONS
Use the Editor Colors and Fonts options—available by choosing Tools>Options—to specify the colors and fonts used for text in the editor windows.
Figure 118: Editor Colors and Fonts options
Editor Font
Press the Font button to open the standard Font dialog box where you can choose the font and its size to be used in editor windows.
Syntax Coloring
Use the Syntax Coloring options to choose color and type style for selected elements. The elements you can customize are: C or C++, compiler keywords, assembler keywords, and user-defined keywords. Use these options:
Scroll-bar list Lists the possible items for which you can specify font and style of syntax.
Color Provides a list of colors to choose from for the selected element.
Type Style Provides a list of type styles to choose from.
Sample Displays the current setting.
UEW-8:1
IAR Embedded Workbench® IDEUser Guide

IAR Embedded Workbench® IDE reference
The keywords controlling syntax highlighting for assembler and C or C++ source code are specified in the files syntax_icc.cfg and syntax_asm.cfg, respectively. These files are located in the config directory.
MESSAGES OPTIONS
Use the Messages options—available by choosing Tools>Options—to choose the amount of output in the Build messages window.
Figure 119: Messages option
Show build messages
Use this drop-down menu to specify the amount of output in the Build messages window. Choose between:
Background Color Provides a list of background colors to choose from for the editor window.
All Shows all messages, including compiler and linker information.
Messages Shows messages, warnings, and errors.
Warnings Shows warnings and errors.
Errors Shows errors only.
UEW-8:1
Part 6. Reference information 255
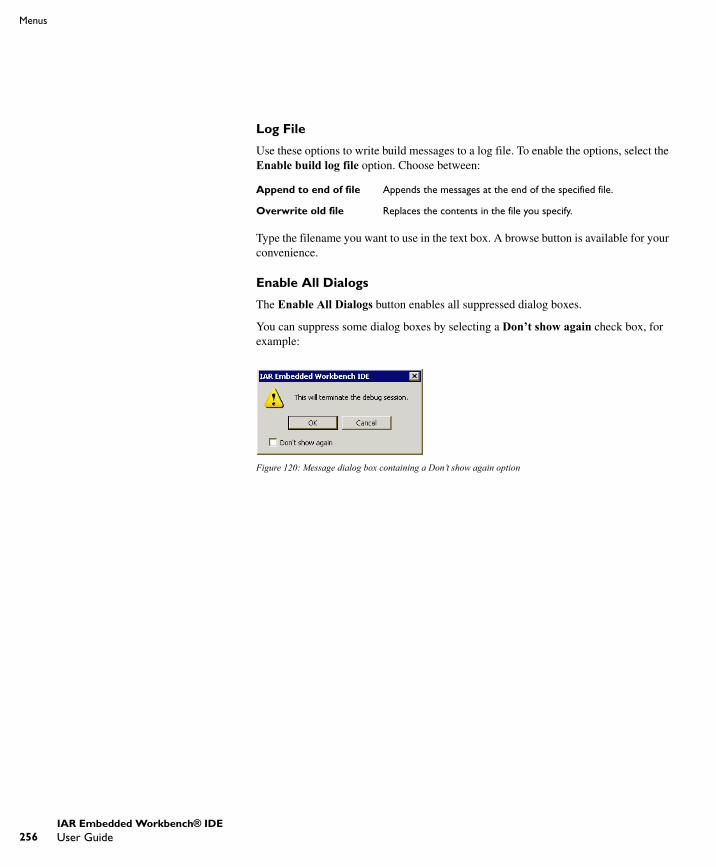
256
Menus
Log File
Use these options to write build messages to a log file. To enable the options, select the Enable build log file option. Choose between:
Type the filename you want to use in the text box. A browse button is available for your convenience.
Enable All Dialogs
The Enable All Dialogs button enables all suppressed dialog boxes.
You can suppress some dialog boxes by selecting a Don’t show again check box, for example:
Figure 120: Message dialog box containing a Don’t show again option
Append to end of file Appends the messages at the end of the specified file.
Overwrite old file Replaces the contents in the file you specify.
UEW-8:1
IAR Embedded Workbench® IDEUser Guide
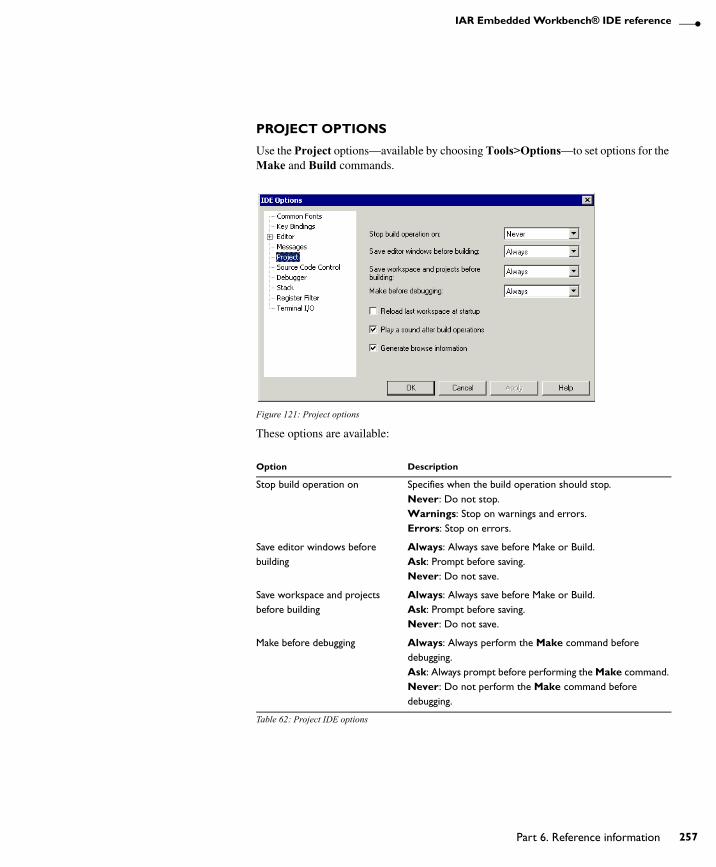
IAR Embedded Workbench® IDE reference
PROJECT OPTIONS
Use the Project options—available by choosing Tools>Options—to set options for the Make and Build commands.
Figure 121: Project options
These options are available:
Option Description
Stop build operation on Specifies when the build operation should stop.Never: Do not stop. Warnings: Stop on warnings and errors.Errors: Stop on errors.
Save editor windows before building
Always: Always save before Make or Build.Ask: Prompt before saving.Never: Do not save.
Save workspace and projects before building
Always: Always save before Make or Build.Ask: Prompt before saving.Never: Do not save.
Make before debugging Always: Always perform the Make command before debugging. Ask: Always prompt before performing the Make command. Never: Do not perform the Make command before debugging.
Table 62: Project IDE options
UEW-8:1
Part 6. Reference information 257

258
Menus
SOURCE CODE CONTROL OPTIONS
Use the Source Code Control options—available by choosing Tools>Options—to configure the interaction between an IAR Embedded Workbench project and an SCC project.
Figure 122: Source Code Control options
Keep items checked out when checking in
Determines the default setting for the option Keep Checked Out in the Check In Files dialog box; see Check In Files dialog box, page 202.
Reload last workspace at startup Select this option if you want the last active workspace to load automatically the next time you start IAR Embedded Workbench.
Play a sound after build operations Plays a sound when the build operations are finished.
Generate browse information Enables the use of the Source Browser window, see Source Browser window, page 210.
Option Description
Table 62: Project IDE options (Continued)
UEW-8:1
IAR Embedded Workbench® IDEUser Guide
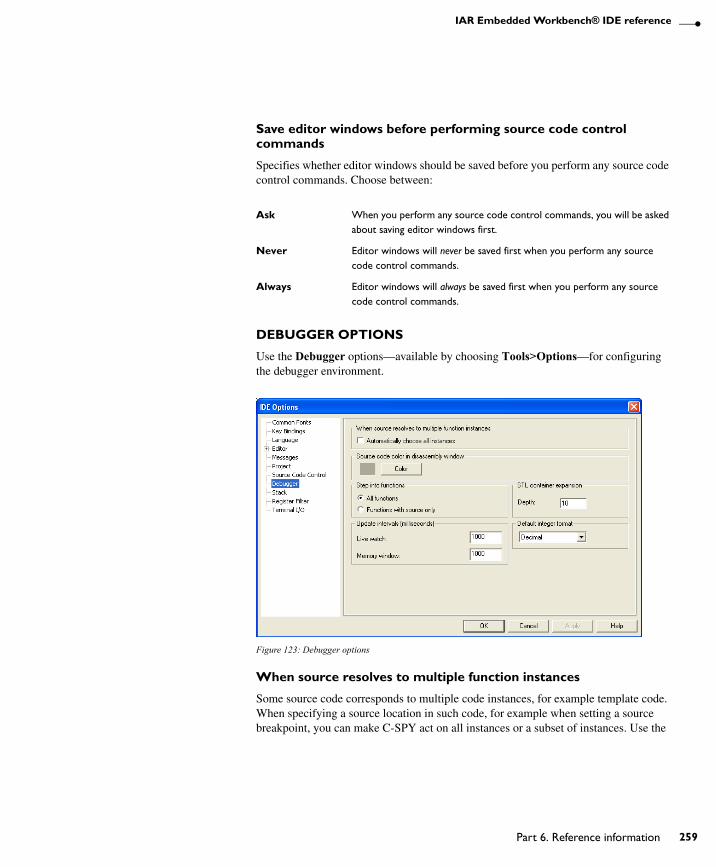
IAR Embedded Workbench® IDE reference
Save editor windows before performing source code control commands
Specifies whether editor windows should be saved before you perform any source code control commands. Choose between:
DEBUGGER OPTIONS
Use the Debugger options—available by choosing Tools>Options—for configuring the debugger environment.
Figure 123: Debugger options
When source resolves to multiple function instances
Some source code corresponds to multiple code instances, for example template code. When specifying a source location in such code, for example when setting a source breakpoint, you can make C-SPY act on all instances or a subset of instances. Use the
Ask When you perform any source code control commands, you will be asked about saving editor windows first.
Never Editor windows will never be saved first when you perform any source code control commands.
Always Editor windows will always be saved first when you perform any source code control commands.
UEW-8:1
Part 6. Reference information 259
260
Menus
Automatically choose all instances option to let C-SPY act on all instances without asking first.
Source code color in Disassembly window
Use the Color button to select the color of the source code in the Disassembly window.
Step into functions
Use this option to control the behavior of the Step Into command. Choose between:
STL container expansion
The Depth value decides how many elements that are shown initially when a container value is expanded in, for example, the Watch window. To show additional elements, click the expansion arrow.
Update intervals
The Update intervals options specify how often the contents of the Live Watch window and the Memory window are updated.
These options are available if the C-SPY driver you are using has access to the target system memory while executing your application.
Default integer format
Use the drop-down list to set the default integer format in the Watch, Locals, and related windows.
All functions The debugger will step into all functions.
Functions with source only The debugger will only step into functions for which the source code is known. This helps you avoid stepping into library functions or entering disassembly mode debugging.
UEW-8:1
IAR Embedded Workbench® IDEUser Guide

IAR Embedded Workbench® IDE reference
STACK OPTIONS
Use the Stack options—available by choosing Tools>Options or from the context menu in the Memory window—to set options specific to the Stack window.
Figure 124: Stack options
Enable graphical stack display and stack usage tracking
Use this option to enable the graphical stack bar available at the top of the Stack window. At the same time, it enables the functionality needed to detect stack overflows. To read more about the stack bar and the information it provides, see The graphical stack bar, page 301.
% stack usage threshold
Use this text field to specify the percentage of stack usage above which C-SPY should issue a warning for stack overflow.
UEW-8:1
Part 6. Reference information 261

262
Menus
Warn when exceeding stack threshold
Use this option to make C-SPY issue a warning when the stack usage exceeds the threshold specified in the % stack usage threshold option.
Warn when stack pointer is out of bounds
Use this option to make C-SPY issue a warning when the stack pointer is outside the stack memory range.
Stack pointer(s) not valid until reaching
Use this option to specify a location in your application code from where you want the stack display and verification to occur. The Stack window will not display any information about stack usage until execution has reached this location. By default, C-SPY will not track the stack usage before the main function. If your application does not have a main function, for example, if it is an assembler-only project, you should specify your own start label. If this option is used, after each reset C-SPY keeps a breakpoint on the given location until it is reached.
Typically, the stack pointer is set up in the system initialization code cstartup, but not necessarily from the very first instruction. If you use this option, you can avoid incorrect warnings or misleading stack display for this part of the application.
Warnings
You can choose to issue warnings using one of these options:
Limit stack display to
Use this option to limit the amount of memory displayed in the Stack window by specifying a number, counting from the stack pointer. This can be useful if you have a big stack or if you are only interested in the topmost part of the stack. Using this option can improve the Stack window performance, especially if reading memory from the target system is slow. By default, the Stack window shows the whole stack, or in other words, from the stack pointer to the bottom of the stack. If the debugger cannot determine the memory range for the stack, the byte limit is used even if the option is not selected.
Log Warnings are issued in the Debug Log window
Log and alert Warnings are issued in the Debug Log window and as alert dialog boxes.
UEW-8:1
IAR Embedded Workbench® IDEUser Guide

IAR Embedded Workbench® IDE reference
Note: The Stack window does not affect the execution performance of your application, but it might read a large amount of data to update the displayed information when the execution stops.
REGISTER FILTER OPTIONS
Use the Register Filter options—available by choosing Tools>Options when the debugger is running—to display registers in the Register window in groups you have created yourself. For more information about register groups, see Register groups, page 143.
Figure 125: Register Filter options
These options are available:
Option Description
Use register filter Enables the usage of register filters.
Filter Files Displays a dialog box where you can select or create a new filter file.
Groups Lists available groups in the register filter file, alternatively displays the new register group.
New Group The name for the new register group.
Group members Lists the registers selected from the register scroll bar window.
Base Changes the default integer base.
Table 63: Register Filter options
UEW-8:1
Part 6. Reference information 263
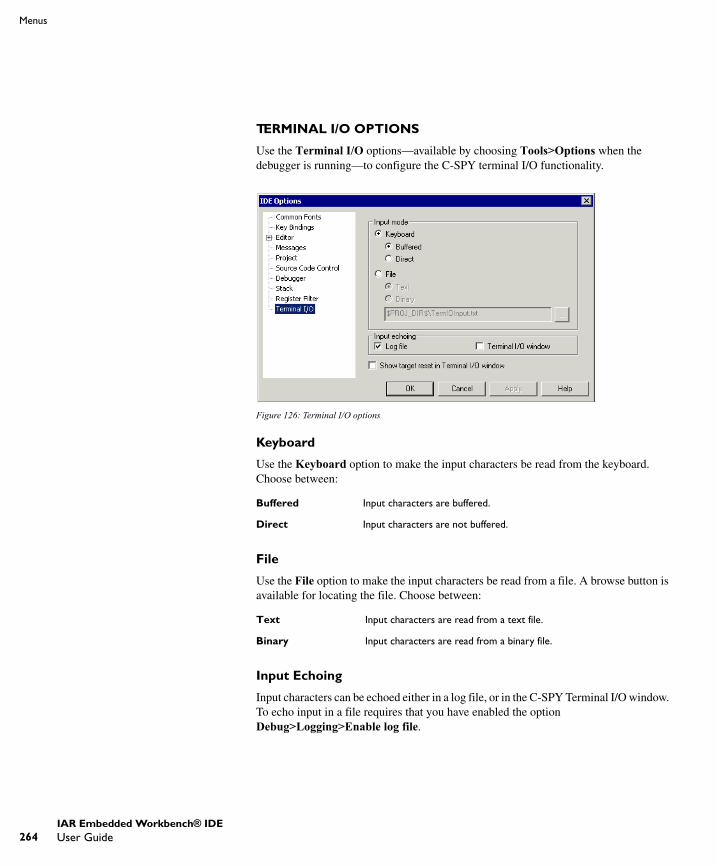
264
Menus
TERMINAL I/O OPTIONS
Use the Terminal I/O options—available by choosing Tools>Options when the debugger is running—to configure the C-SPY terminal I/O functionality.
Figure 126: Terminal I/O options
Keyboard
Use the Keyboard option to make the input characters be read from the keyboard. Choose between:
File
Use the File option to make the input characters be read from a file. A browse button is available for locating the file. Choose between:
Input Echoing
Input characters can be echoed either in a log file, or in the C-SPY Terminal I/O window. To echo input in a file requires that you have enabled the option Debug>Logging>Enable log file.
Buffered Input characters are buffered.
Direct Input characters are not buffered.
Text Input characters are read from a text file.
Binary Input characters are read from a binary file.
UEW-8:1
IAR Embedded Workbench® IDEUser Guide
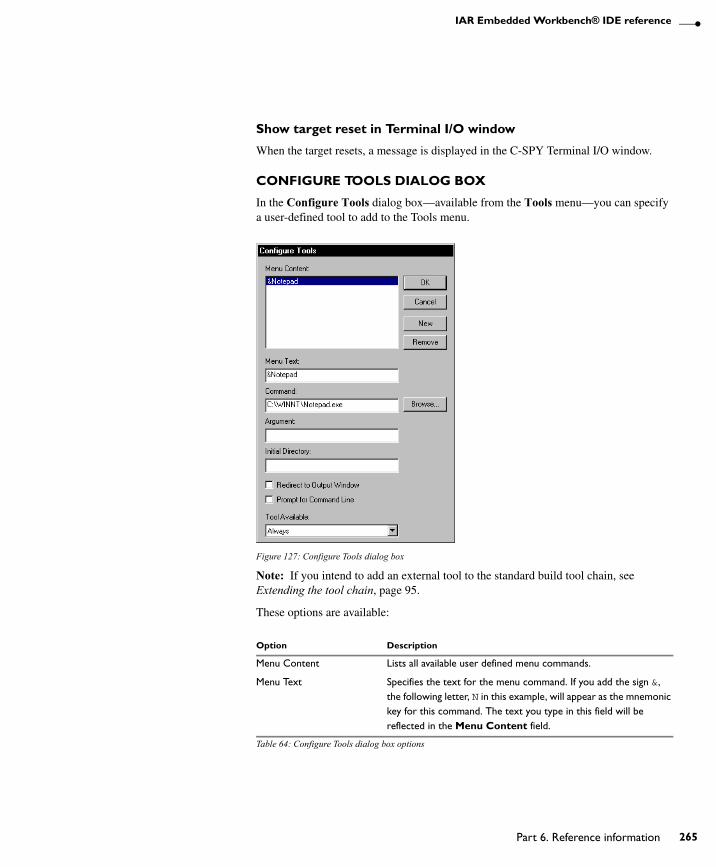
IAR Embedded Workbench® IDE reference
Show target reset in Terminal I/O window
When the target resets, a message is displayed in the C-SPY Terminal I/O window.
CONFIGURE TOOLS DIALOG BOX
In the Configure Tools dialog box—available from the Tools menu—you can specify a user-defined tool to add to the Tools menu.
Figure 127: Configure Tools dialog box
Note: If you intend to add an external tool to the standard build tool chain, see Extending the tool chain, page 95.
These options are available:
Option Description
Menu Content Lists all available user defined menu commands.
Menu Text Specifies the text for the menu command. If you add the sign &, the following letter, N in this example, will appear as the mnemonic key for this command. The text you type in this field will be reflected in the Menu Content field.
Table 64: Configure Tools dialog box options
UEW-8:1
Part 6. Reference information 265
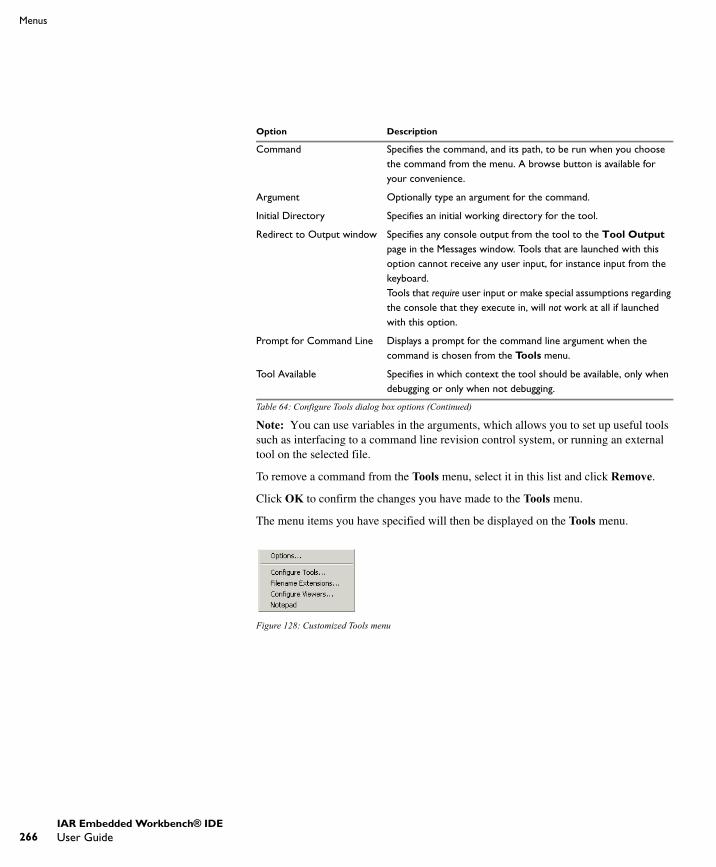
266
Menus
Note: You can use variables in the arguments, which allows you to set up useful tools such as interfacing to a command line revision control system, or running an external tool on the selected file.
To remove a command from the Tools menu, select it in this list and click Remove.
Click OK to confirm the changes you have made to the Tools menu.
The menu items you have specified will then be displayed on the Tools menu.
Figure 128: Customized Tools menu
Command Specifies the command, and its path, to be run when you choose the command from the menu. A browse button is available for your convenience.
Argument Optionally type an argument for the command.
Initial Directory Specifies an initial working directory for the tool.
Redirect to Output window Specifies any console output from the tool to the Tool Output page in the Messages window. Tools that are launched with this option cannot receive any user input, for instance input from the keyboard.Tools that require user input or make special assumptions regarding the console that they execute in, will not work at all if launched with this option.
Prompt for Command Line Displays a prompt for the command line argument when the command is chosen from the Tools menu.
Tool Available Specifies in which context the tool should be available, only when debugging or only when not debugging.
Option Description
Table 64: Configure Tools dialog box options (Continued)
UEW-8:1
IAR Embedded Workbench® IDEUser Guide
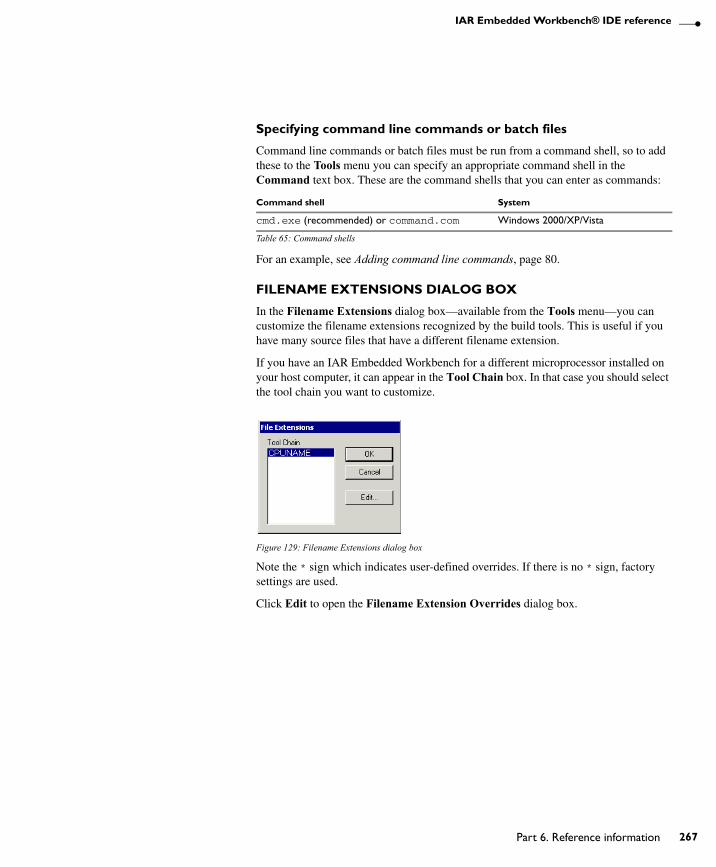
IAR Embedded Workbench® IDE reference
Specifying command line commands or batch files
Command line commands or batch files must be run from a command shell, so to add these to the Tools menu you can specify an appropriate command shell in the Command text box. These are the command shells that you can enter as commands:
For an example, see Adding command line commands, page 80.
FILENAME EXTENSIONS DIALOG BOX
In the Filename Extensions dialog box—available from the Tools menu—you can customize the filename extensions recognized by the build tools. This is useful if you have many source files that have a different filename extension.
If you have an IAR Embedded Workbench for a different microprocessor installed on your host computer, it can appear in the Tool Chain box. In that case you should select the tool chain you want to customize.
Figure 129: Filename Extensions dialog box
Note the * sign which indicates user-defined overrides. If there is no * sign, factory settings are used.
Click Edit to open the Filename Extension Overrides dialog box.
Command shell System
cmd.exe (recommended) or command.com Windows 2000/XP/Vista
Table 65: Command shells
UEW-8:1
Part 6. Reference information 267
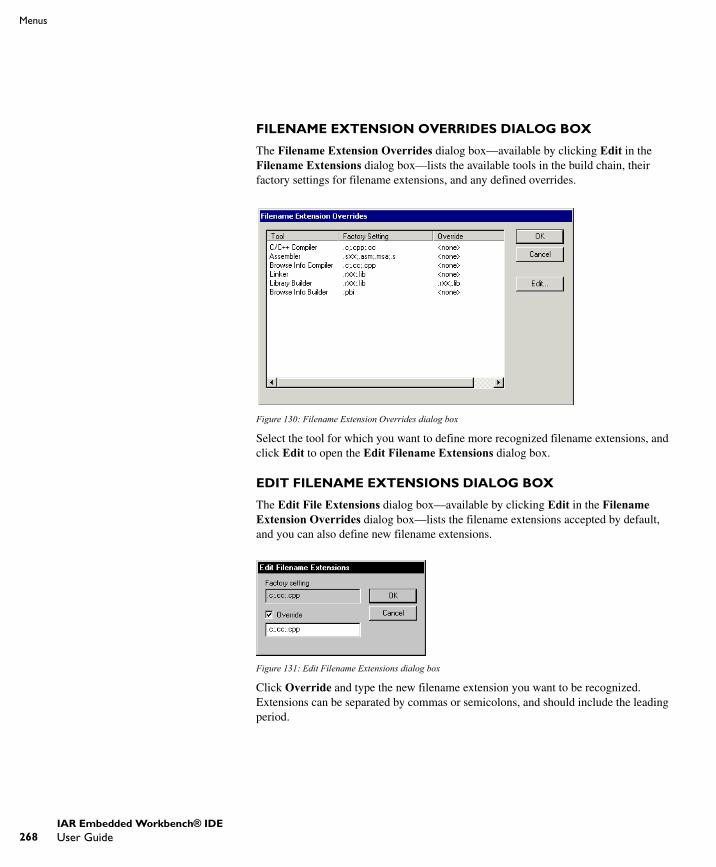
268
Menus
FILENAME EXTENSION OVERRIDES DIALOG BOX
The Filename Extension Overrides dialog box—available by clicking Edit in the Filename Extensions dialog box—lists the available tools in the build chain, their factory settings for filename extensions, and any defined overrides.
Figure 130: Filename Extension Overrides dialog box
Select the tool for which you want to define more recognized filename extensions, and click Edit to open the Edit Filename Extensions dialog box.
EDIT FILENAME EXTENSIONS DIALOG BOX
The Edit File Extensions dialog box—available by clicking Edit in the Filename Extension Overrides dialog box—lists the filename extensions accepted by default, and you can also define new filename extensions.
Figure 131: Edit Filename Extensions dialog box
Click Override and type the new filename extension you want to be recognized. Extensions can be separated by commas or semicolons, and should include the leading period.
UEW-8:1
IAR Embedded Workbench® IDEUser Guide
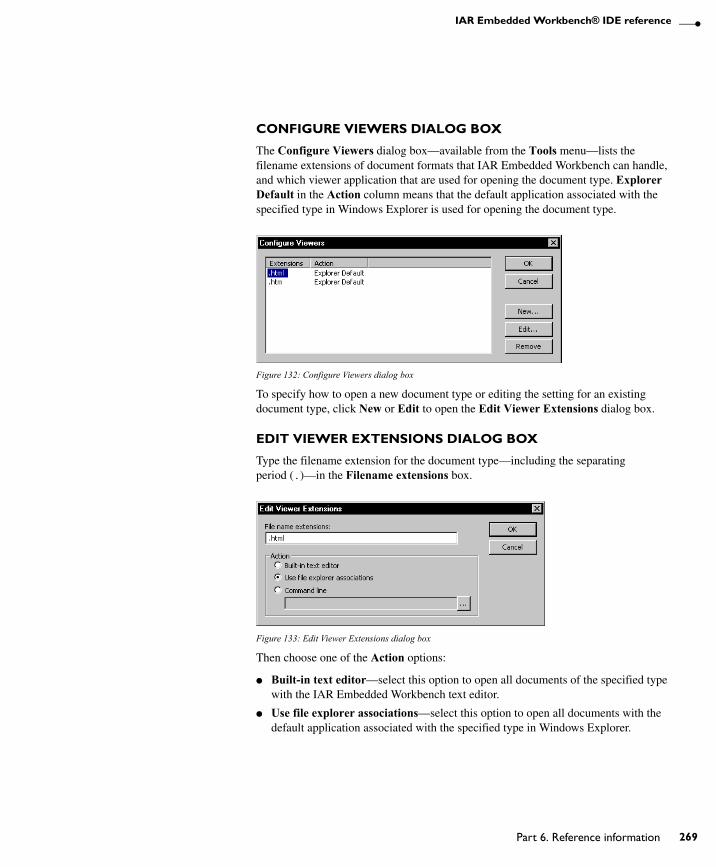
IAR Embedded Workbench® IDE reference
CONFIGURE VIEWERS DIALOG BOX
The Configure Viewers dialog box—available from the Tools menu—lists the filename extensions of document formats that IAR Embedded Workbench can handle, and which viewer application that are used for opening the document type. Explorer Default in the Action column means that the default application associated with the specified type in Windows Explorer is used for opening the document type.
Figure 132: Configure Viewers dialog box
To specify how to open a new document type or editing the setting for an existing document type, click New or Edit to open the Edit Viewer Extensions dialog box.
EDIT VIEWER EXTENSIONS DIALOG BOX
Type the filename extension for the document type—including the separating period (.)—in the Filename extensions box.
Figure 133: Edit Viewer Extensions dialog box
Then choose one of the Action options:
● Built-in text editor—select this option to open all documents of the specified type with the IAR Embedded Workbench text editor.
● Use file explorer associations—select this option to open all documents with the default application associated with the specified type in Windows Explorer.
UEW-8:1
Part 6. Reference information 269

270
Menus
● Command line—select this option and type or browse your way to the viewer application, and give any command line options you would like to the tool.
WINDOW MENU
Use the commands on the Window menu to manipulate the IDE windows and change their arrangement on the screen.
The last section of the Window menu lists the windows currently open on the screen. Choose the window you want to switch to.
Figure 134: Window menu
These commands are available on the Window menu:
Menu command Description
Close Tab Closes the active tab.
Close Window CTRL+F4 Closes the active editor window.
Split Splits an editor window horizontally or vertically into two, or four panes, to allow you to see more parts of a file simultaneously.
New Vertical Editor Window
Opens a new empty window next to current editor window.
New Horizontal Editor Window
Opens a new empty window under current editor window.
Move Tabs To Next Window
Moves all tabs in current window to next window.
Move Tabs To Previous Window
Moves all tabs in current window to previous window.
Close All Tabs Except Active
Closes all the tabs except the active tab.
Close All Editor Tabs Closes all tabs currently available in editor windows.
Table 66: Window menu commands
UEW-8:1
IAR Embedded Workbench® IDEUser Guide
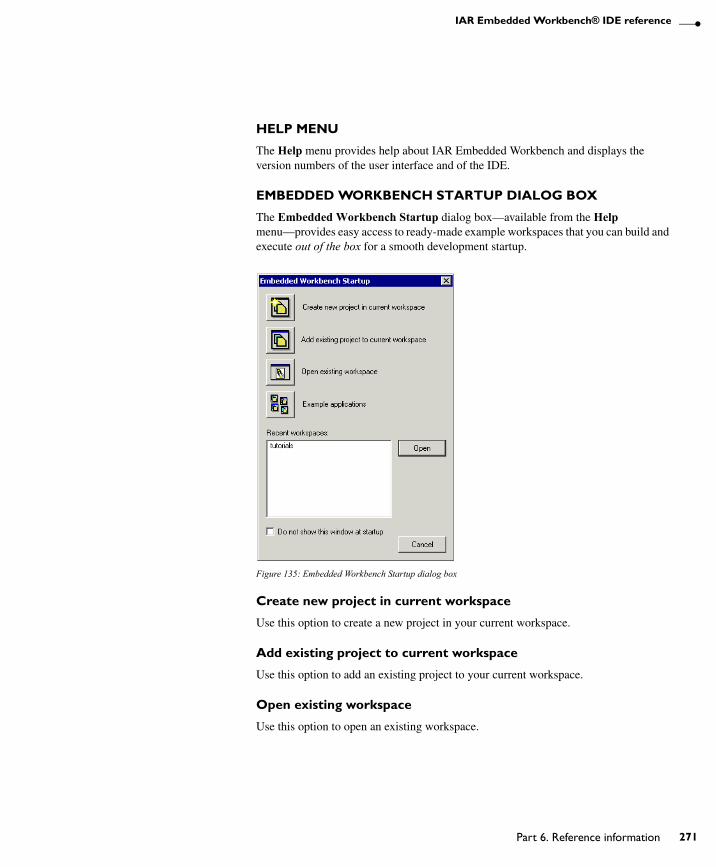
IAR Embedded Workbench® IDE reference
HELP MENU
The Help menu provides help about IAR Embedded Workbench and displays the version numbers of the user interface and of the IDE.
EMBEDDED WORKBENCH STARTUP DIALOG BOX
The Embedded Workbench Startup dialog box—available from the Help menu—provides easy access to ready-made example workspaces that you can build and execute out of the box for a smooth development startup.
Figure 135: Embedded Workbench Startup dialog box
Create new project in current workspace
Use this option to create a new project in your current workspace.
Add existing project to current workspace
Use this option to add an existing project to your current workspace.
Open existing workspace
Use this option to open an existing workspace.
UEW-8:1
Part 6. Reference information 271
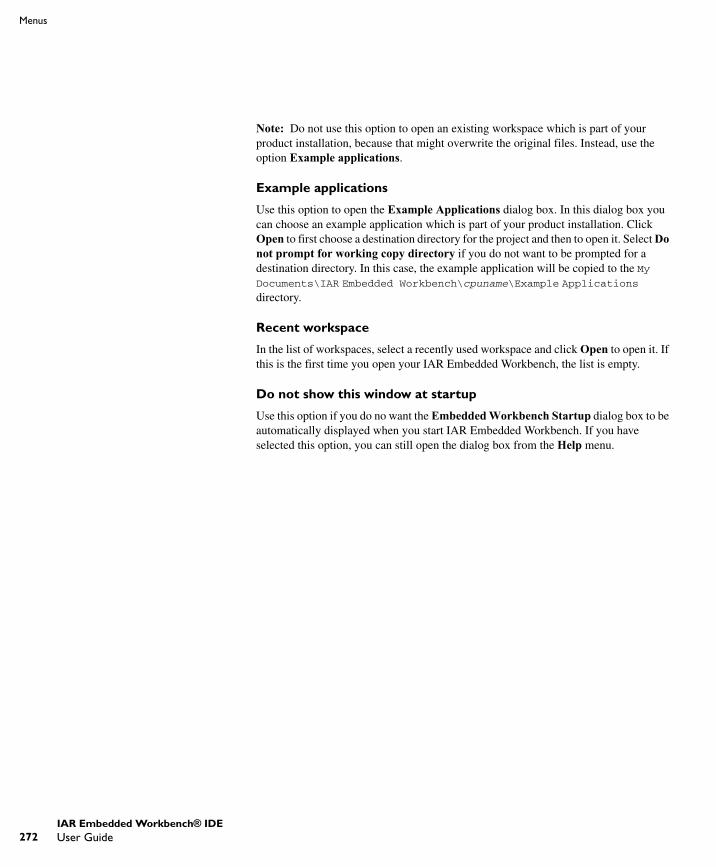
272
Menus
Note: Do not use this option to open an existing workspace which is part of your product installation, because that might overwrite the original files. Instead, use the option Example applications.
Example applications
Use this option to open the Example Applications dialog box. In this dialog box you can choose an example application which is part of your product installation. Click Open to first choose a destination directory for the project and then to open it. Select Do not prompt for working copy directory if you do not want to be prompted for a destination directory. In this case, the example application will be copied to the My Documents\IAR Embedded Workbench\cpuname\Example Applications directory.
Recent workspace
In the list of workspaces, select a recently used workspace and click Open to open it. If this is the first time you open your IAR Embedded Workbench, the list is empty.
Do not show this window at startup
Use this option if you do no want the Embedded Workbench Startup dialog box to be automatically displayed when you start IAR Embedded Workbench. If you have selected this option, you can still open the dialog box from the Help menu.
UEW-8:1
IAR Embedded Workbench® IDEUser Guide
C-SPY® referenceThis chapter contains reference information about the windows, menus, menu commands, and the corresponding components that are specific for the IAR C-SPY Debugger. This chapter contains the following sections:
● C-SPY windows, page 273
● C-SPY menus, page 304.
C-SPY windowsThe following windows specific to C-SPY are available:
● C-SPY Debugger main window
● Disassembly window
● Memory window
● Symbolic Memory window
● Register window
● Watch window
● Locals window
● Auto window
● Live Watch window
● Quick Watch window
● Statics window
● Call Stack window
● Terminal I/O window
● Code Coverage window
● Profiling window
● Stack window
● Symbols window.
Additional windows are available depending on which C-SPY driver you are using. For information about driver-specific windows, see the driver-specific documentation.
UEW-8:1
Part 6. Reference information 273

274
C-SPY windows
EDITING IN C-SPY WINDOWS
You can edit the contents of the Memory, Symbolic Memory, Register, Auto, Watch, Locals, Statics, Live Watch, and Quick Watch windows.
Use these keyboard keys to edit the contents of these windows:
C-SPY DEBUGGER MAIN WINDOW
When you start the debugger, these debugger-specific items appear in the main IAR Embedded Workbench IDE window:
● A dedicated debug menu with commands for executing and debugging your application
● Depending on the C-SPY driver you are using, a driver-specific menu. Typically, this menu contains menu commands for opening driver-specific windows and dialog boxes. See the driver-specific documentation for more information
● A special debug toolbar
● Several windows and dialog boxes specific to C-SPY.
The window might look different depending on which components you are using.
Each window item is explained in greater detail in the following sections.
Menu bar
In addition to the menus available in the development environment, the Debug menu is available when C-SPY is running. The Debug menu provides commands for executing and debugging the source application. Most of the commands are also available as icon buttons on the debug toolbar.
Additional menus might be available, depending on which debugger drivers have been installed; for information, see the driver-specific documentation.
Debug toolbar
The debug toolbar provides buttons for the most frequently-used commands on the Debug menu.
For a description of any button, point to it with the mouse pointer. When a command is not available the corresponding button is dimmed and you will not be able to select it.
Key Description
Enter Makes an item editable and saves the new value.
Esc Cancels a new value.
Table 67: Editing in C-SPY windows
UEW-8:1
IAR Embedded Workbench® IDEUser Guide
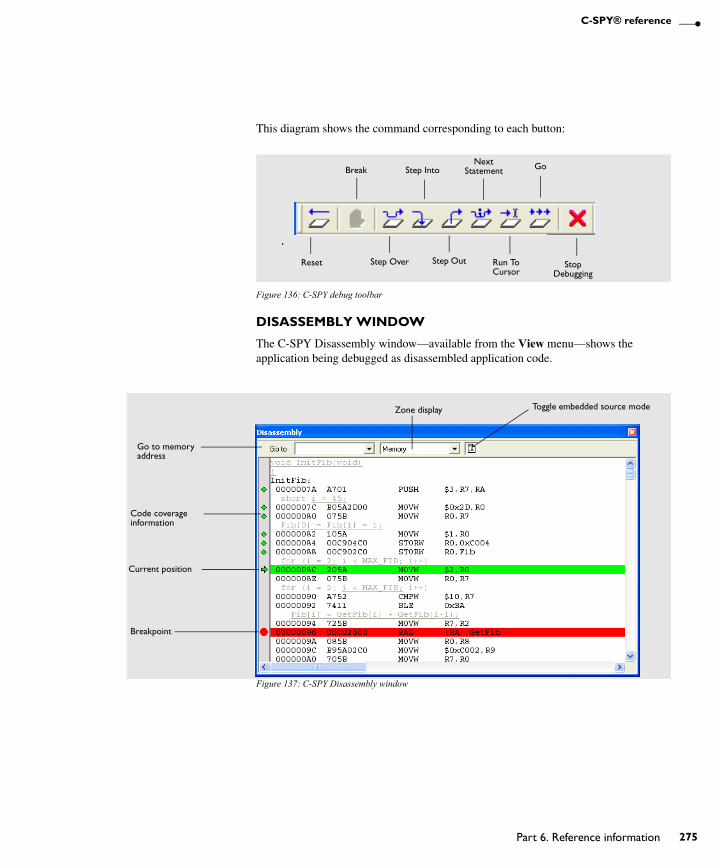
C-SPY® reference
This diagram shows the command corresponding to each button:
Figure 136: C-SPY debug toolbar
DISASSEMBLY WINDOW
The C-SPY Disassembly window—available from the View menu—shows the application being debugged as disassembled application code.
Figure 137: C-SPY Disassembly window
Reset
Break
Step Over
Step Into
Step Out
Next Statement
Run To Cursor
Go
Stop Debugging
Go to memory address
Current position
Breakpoint
Zone display Toggle embedded source mode
Code coverage information
UEW-8:1
Part 6. Reference information 275
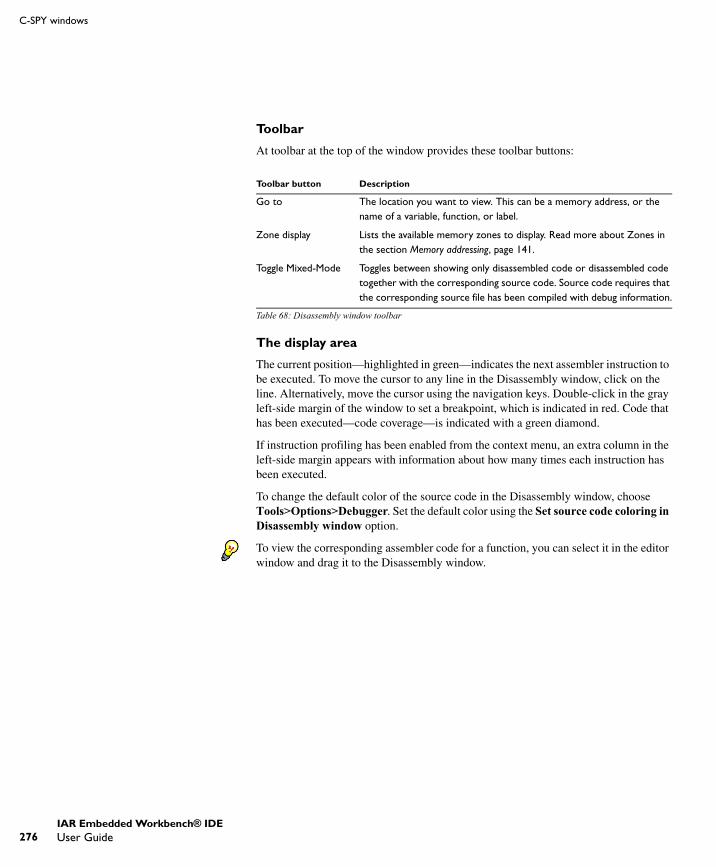
276
C-SPY windows
Toolbar
At toolbar at the top of the window provides these toolbar buttons:
The display area
The current position—highlighted in green—indicates the next assembler instruction to be executed. To move the cursor to any line in the Disassembly window, click on the line. Alternatively, move the cursor using the navigation keys. Double-click in the gray left-side margin of the window to set a breakpoint, which is indicated in red. Code that has been executed—code coverage—is indicated with a green diamond.
If instruction profiling has been enabled from the context menu, an extra column in the left-side margin appears with information about how many times each instruction has been executed.
To change the default color of the source code in the Disassembly window, choose Tools>Options>Debugger. Set the default color using the Set source code coloring in Disassembly window option.
To view the corresponding assembler code for a function, you can select it in the editor window and drag it to the Disassembly window.
Toolbar button Description
Go to The location you want to view. This can be a memory address, or the name of a variable, function, or label.
Zone display Lists the available memory zones to display. Read more about Zones in the section Memory addressing, page 141.
Toggle Mixed-Mode Toggles between showing only disassembled code or disassembled code together with the corresponding source code. Source code requires that the corresponding source file has been compiled with debug information.
Table 68: Disassembly window toolbar
UEW-8:1
IAR Embedded Workbench® IDEUser Guide
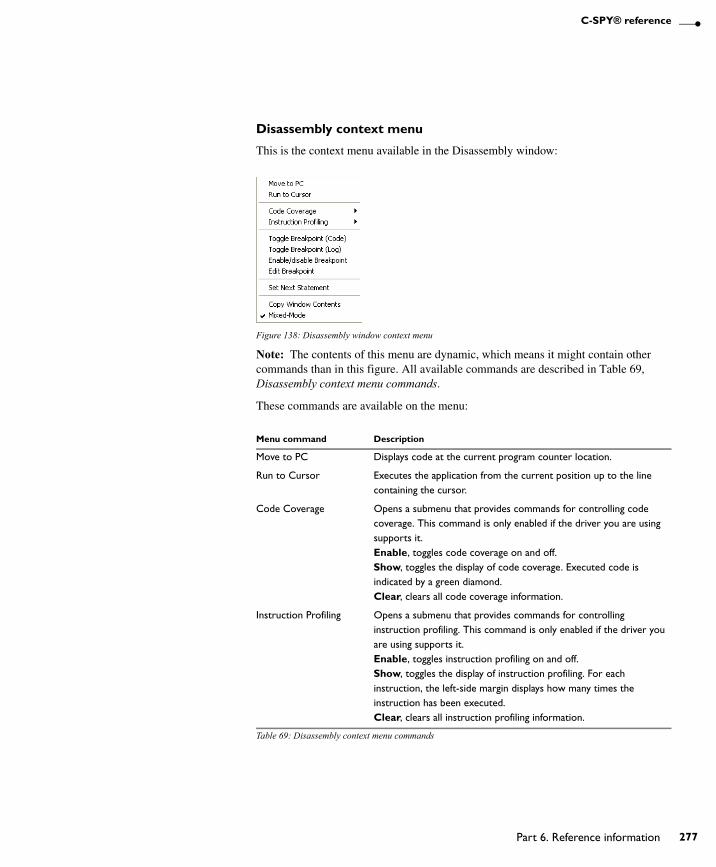
C-SPY® reference
Disassembly context menu
This is the context menu available in the Disassembly window:
Figure 138: Disassembly window context menu
Note: The contents of this menu are dynamic, which means it might contain other commands than in this figure. All available commands are described in Table 69, Disassembly context menu commands.
These commands are available on the menu:
Menu command Description
Move to PC Displays code at the current program counter location.
Run to Cursor Executes the application from the current position up to the line containing the cursor.
Code Coverage Opens a submenu that provides commands for controlling code coverage. This command is only enabled if the driver you are using supports it.Enable, toggles code coverage on and off.Show, toggles the display of code coverage. Executed code is indicated by a green diamond.Clear, clears all code coverage information.
Instruction Profiling Opens a submenu that provides commands for controlling instruction profiling. This command is only enabled if the driver you are using supports it.Enable, toggles instruction profiling on and off.Show, toggles the display of instruction profiling. For each instruction, the left-side margin displays how many times the instruction has been executed.Clear, clears all instruction profiling information.
Table 69: Disassembly context menu commands
UEW-8:1
Part 6. Reference information 277
278
C-SPY windows
MEMORY WINDOW
The Memory window—available from the View menu—gives an up-to-date display of a specified area of memory and allows you to edit it. You can open several instances of
Toggle Breakpoint (Code) Toggles a code breakpoint. Assembler instructions at which code breakpoints have been set are highlighted in red. For information about code breakpoints, see Code breakpoints dialog box, page 214.
Toggle Breakpoint (Log) Toggles a log breakpoint for trace printouts. Assembler instructions at which log breakpoints have been set are highlighted in red. For information about log breakpoints, see Log breakpoints dialog box, page 216.
Enable/Disable Breakpoint Enables and Disables a breakpoint.
Edit Breakpoint Displays the Edit Breakpoint dialog box to let you edit the currently selected breakpoint. If there are more than one breakpoint on the selected line, a submenu is displayed that lists all available breakpoints on that line.
Set Next Statement Sets program counter to the location of the insertion point.
Copy Window Contents Copies the selected contents of the Disassembly window to the clipboard.
Mixed-Mode Toggles between showing only disassembled code or disassembled code together with the corresponding source code. Source code requires that the corresponding source file has been compiled with debug information.
Menu command Description
Table 69: Disassembly context menu commands (Continued)
UEW-8:1
IAR Embedded Workbench® IDEUser Guide

C-SPY® reference
this window, which is very convenient if you want to keep track of several memory or register zones, or monitor different parts of the memory.
Figure 139: Memory window
Toolbar
The toolbar at the top of the window provides these commands:
Available zones
Memory addresses
Context menu buttonMemory contents
Data coverage information
Go to location
Memory contents in ASCII format
Operation Description
Go to The location you want to view. This can be a memory address, or the name of a variable, function, or label.
Zone display Lists the available memory zones to display. Read more about Zones in Memory addressing, page 141.
Context menu button Displays the context menu, see Memory window context menu, page 280.
Update Now Updates the content of the Memory window while your application is executing. This button is only enabled if the C-SPY driver you are using has access to the target system memory while your application is executing.
Table 70: Memory window operations
UEW-8:1
Part 6. Reference information 279
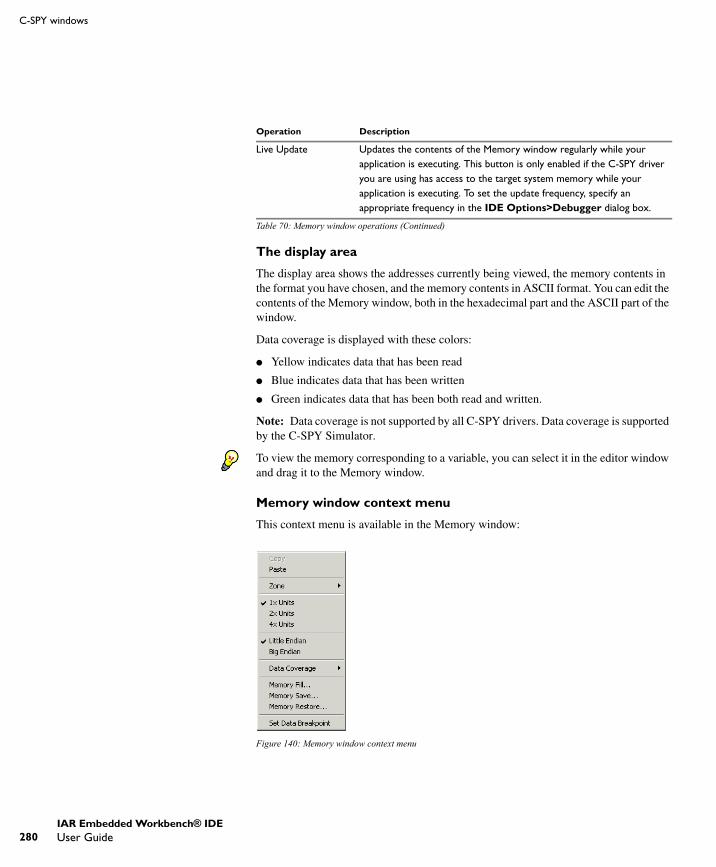
280
C-SPY windows
The display area
The display area shows the addresses currently being viewed, the memory contents in the format you have chosen, and the memory contents in ASCII format. You can edit the contents of the Memory window, both in the hexadecimal part and the ASCII part of the window.
Data coverage is displayed with these colors:
● Yellow indicates data that has been read
● Blue indicates data that has been written
● Green indicates data that has been both read and written.
Note: Data coverage is not supported by all C-SPY drivers. Data coverage is supported by the C-SPY Simulator.
To view the memory corresponding to a variable, you can select it in the editor window and drag it to the Memory window.
Memory window context menu
This context menu is available in the Memory window:
Figure 140: Memory window context menu
Live Update Updates the contents of the Memory window regularly while your application is executing. This button is only enabled if the C-SPY driver you are using has access to the target system memory while your application is executing. To set the update frequency, specify an appropriate frequency in the IDE Options>Debugger dialog box.
Operation Description
Table 70: Memory window operations (Continued)
UEW-8:1
IAR Embedded Workbench® IDEUser Guide
C-SPY® reference
These commands are available on the menu:
Menu command Description
Copy, Paste Standard editing commands.
Zone Lists the available memory zones to display. Read more about Zones in Memory addressing, page 141.
x1, x2, x4 Units Switches between displaying the memory contents in units of 8, 16, or 32 bits
Little EndianBig Endian
Switches between displaying the contents in big-endian or little-endian order.
Data CoverageEnableShowClear
Enable toggles data coverage on and off.Show toggles between showing and hiding data coverage.Clear clears all data coverage information.
Memory Fill Displays the Fill dialog box, where you can fill a specified area with a value, see Fill dialog box, page 282.
Memory Save Displays the Memory Save dialog box, where you can save the contents of a specified memory area to a file, see Memory Save dialog box, page 283.
Memory Restore Displays the Memory Restore dialog box, where you can load the contents of a file in Intex-hex or Motorola s-record format to a specified memory zone, see Memory Restore dialog box, page 284.
Set Data Breakpoint Sets breakpoints directly in the Memory window. The breakpoint is not highlighted; you can see, edit, and remove it in the Breakpoints dialog box. The breakpoints you set in this window will be triggered for both read and write access.
Table 71: Commands on the memory window context menu
UEW-8:1
Part 6. Reference information 281
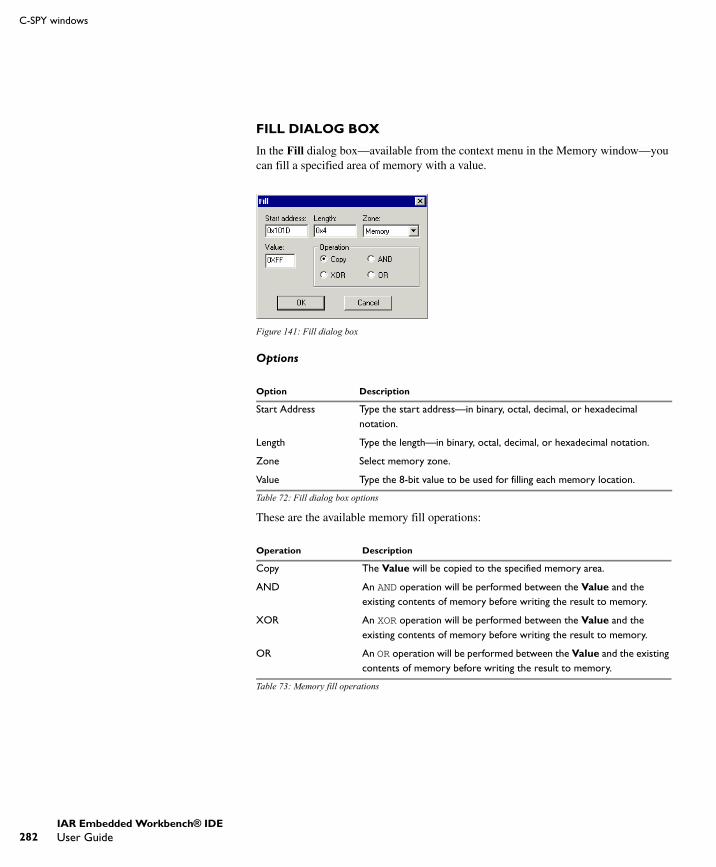
282
C-SPY windows
FILL DIALOG BOX
In the Fill dialog box—available from the context menu in the Memory window—you can fill a specified area of memory with a value.
Figure 141: Fill dialog box
Options
These are the available memory fill operations:
Option Description
Start Address Type the start address—in binary, octal, decimal, or hexadecimal notation.
Length Type the length—in binary, octal, decimal, or hexadecimal notation.
Zone Select memory zone.
Value Type the 8-bit value to be used for filling each memory location.
Table 72: Fill dialog box options
Operation Description
Copy The Value will be copied to the specified memory area.
AND An AND operation will be performed between the Value and the existing contents of memory before writing the result to memory.
XOR An XOR operation will be performed between the Value and the existing contents of memory before writing the result to memory.
OR An OR operation will be performed between the Value and the existing contents of memory before writing the result to memory.
Table 73: Memory fill operations
UEW-8:1
IAR Embedded Workbench® IDEUser Guide

C-SPY® reference
MEMORY SAVE DIALOG BOX
Use the Memory Save dialog box—available by choosing Debug>Memory>Save or from the context menu in the Memory window—to save the contents of a specified memory area to a file.
Figure 142: Memory Save dialog box
Zone
The available memory zones.
Start address
The start address of the memory range to be saved.
Stop address
The stop address of the memory range to be saved.
File format
The file format to be used, which is Intel-extended by default.
Filename
The destination file to be used; a browse button is available for your convenience.
Save
Saves the selected range of the memory zone to the specified file.
UEW-8:1
Part 6. Reference information 283

284
C-SPY windows
MEMORY RESTORE DIALOG BOX
Use the Memory Restore dialog box—available by choosing Debug>Memory>Save or from the context menu in the Memory window—to load the contents of a file in Intel-extended or Motorola S-record format to a specified memory zone.
Figure 143: Memory Restore dialog box
Zone
The available memory zones.
Filename
The file to be read; a browse button is available for your convenience.
Restore
Loads the contents of the specified file to the selected memory zone.
SYMBOLIC MEMORY WINDOW
The Symbolic Memory window—available from the View menu when the debugger is running—displays how variables with static storage duration, typically variables with file scope but also static variables in functions and classes, are laid out in memory. This
UEW-8:1
IAR Embedded Workbench® IDEUser Guide

C-SPY® reference
can be useful for spotting alignment holes or for understanding problems caused by buffers being overwritten.
Figure 144: Symbolic Memory window
Toolbar
The toolbar at the top of the window provides these toolbar buttons:
The display area
The display area displays the memory space, where information is provided in these columns:
Operation Description
Go to The memory location or symbol you want to view.
Zone display Lists the available memory zones to display. To read more about zones, see Memory addressing, page 141.
Previous Jumps to the previous symbol.
Next Jumps to the next symbol.
Table 74: Symbolic Memory window toolbar
Column Description
Location The memory address.
Data The memory contents in hexadecimal format. The data is grouped according to the size of the symbol. This column is editable.
Variable The variable name; requires that the variable has a fixed memory location. Local variables are not displayed.
Table 75: Symbolic memory window columns
UEW-8:1
Part 6. Reference information 285
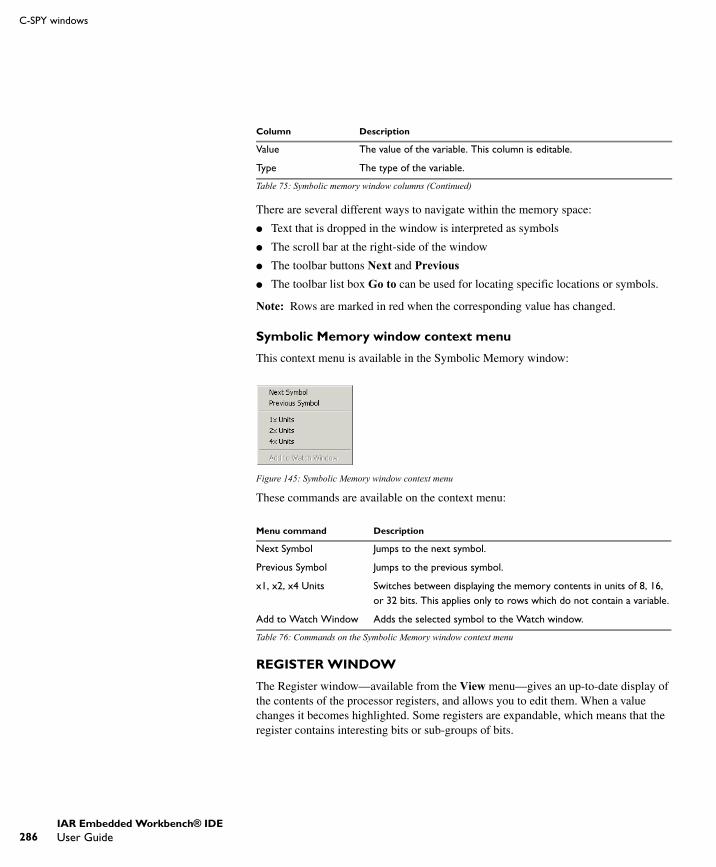
286
C-SPY windows
There are several different ways to navigate within the memory space:
● Text that is dropped in the window is interpreted as symbols
● The scroll bar at the right-side of the window
● The toolbar buttons Next and Previous● The toolbar list box Go to can be used for locating specific locations or symbols.
Note: Rows are marked in red when the corresponding value has changed.
Symbolic Memory window context menu
This context menu is available in the Symbolic Memory window:
Figure 145: Symbolic Memory window context menu
These commands are available on the context menu:
REGISTER WINDOW
The Register window—available from the View menu—gives an up-to-date display of the contents of the processor registers, and allows you to edit them. When a value changes it becomes highlighted. Some registers are expandable, which means that the register contains interesting bits or sub-groups of bits.
Value The value of the variable. This column is editable.
Type The type of the variable.
Menu command Description
Next Symbol Jumps to the next symbol.
Previous Symbol Jumps to the previous symbol.
x1, x2, x4 Units Switches between displaying the memory contents in units of 8, 16, or 32 bits. This applies only to rows which do not contain a variable.
Add to Watch Window Adds the selected symbol to the Watch window.
Table 76: Commands on the Symbolic Memory window context menu
Column Description
Table 75: Symbolic memory window columns (Continued)
UEW-8:1
IAR Embedded Workbench® IDEUser Guide

C-SPY® reference
You can open several instances of this window, which is very convenient if you want to keep track of different register groups.
Figure 146: Register window
Use the drop-down list to select which register group to display in the Register window. To define application-specific register groups, see Defining application-specific groups, page 144.
WATCH WINDOW
The Watch window—available from the View menu—allows you to monitor the values of C-SPY expressions or variables. You can view, add, modify, and remove expressions in the Watch window. Tree structures of arrays, structs, and unions are expandable, which means that you can study each item of these.
Figure 147: Watch window
UEW-8:1
Part 6. Reference information 287
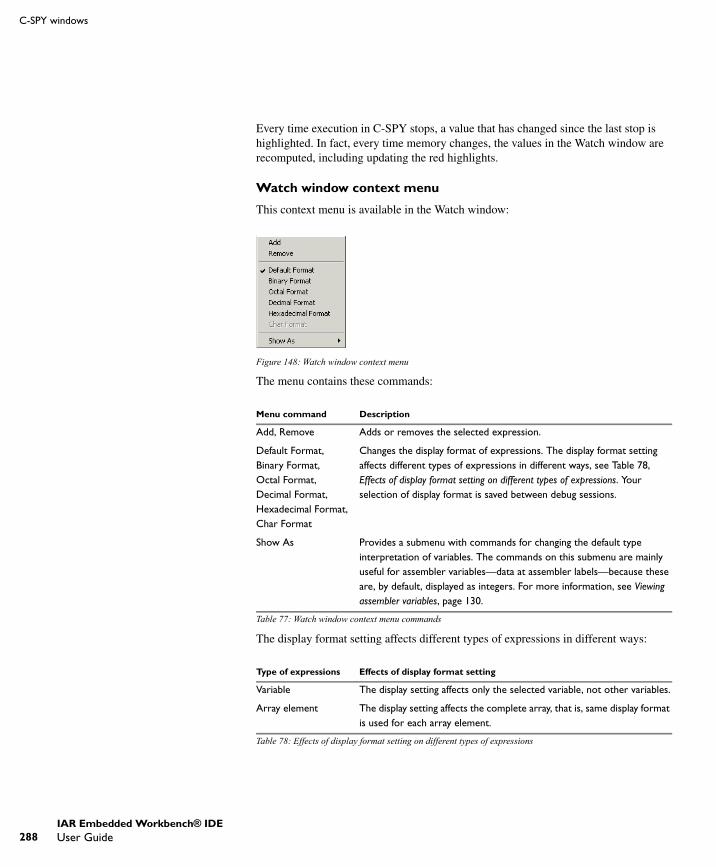
288
C-SPY windows
Every time execution in C-SPY stops, a value that has changed since the last stop is highlighted. In fact, every time memory changes, the values in the Watch window are recomputed, including updating the red highlights.
Watch window context menu
This context menu is available in the Watch window:
Figure 148: Watch window context menu
The menu contains these commands:
The display format setting affects different types of expressions in different ways:
Menu command Description
Add, Remove Adds or removes the selected expression.
Default Format,Binary Format,Octal Format,Decimal Format,Hexadecimal Format,Char Format
Changes the display format of expressions. The display format setting affects different types of expressions in different ways, see Table 78, Effects of display format setting on different types of expressions. Your selection of display format is saved between debug sessions.
Show As Provides a submenu with commands for changing the default type interpretation of variables. The commands on this submenu are mainly useful for assembler variables—data at assembler labels—because these are, by default, displayed as integers. For more information, see Viewing assembler variables, page 130.
Table 77: Watch window context menu commands
Type of expressions Effects of display format setting
Variable The display setting affects only the selected variable, not other variables.
Array element The display setting affects the complete array, that is, same display format is used for each array element.
Table 78: Effects of display format setting on different types of expressions
UEW-8:1
IAR Embedded Workbench® IDEUser Guide
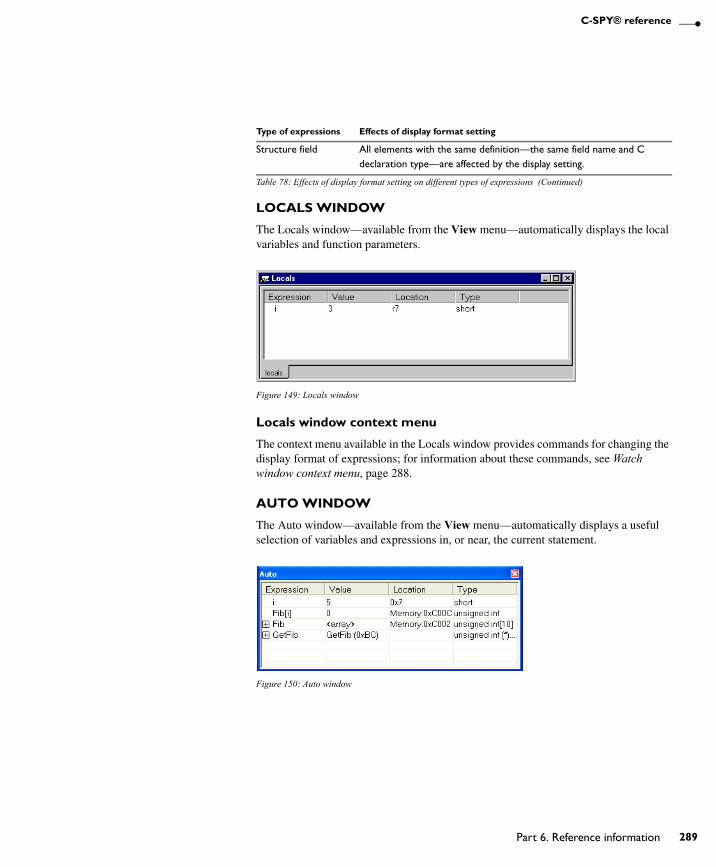
C-SPY® reference
LOCALS WINDOW
The Locals window—available from the View menu—automatically displays the local variables and function parameters.
Figure 149: Locals window
Locals window context menu
The context menu available in the Locals window provides commands for changing the display format of expressions; for information about these commands, see Watch window context menu, page 288.
AUTO WINDOW
The Auto window—available from the View menu—automatically displays a useful selection of variables and expressions in, or near, the current statement.
Figure 150: Auto window
Structure field All elements with the same definition—the same field name and C declaration type—are affected by the display setting.
Type of expressions Effects of display format setting
Table 78: Effects of display format setting on different types of expressions (Continued)
UEW-8:1
Part 6. Reference information 289
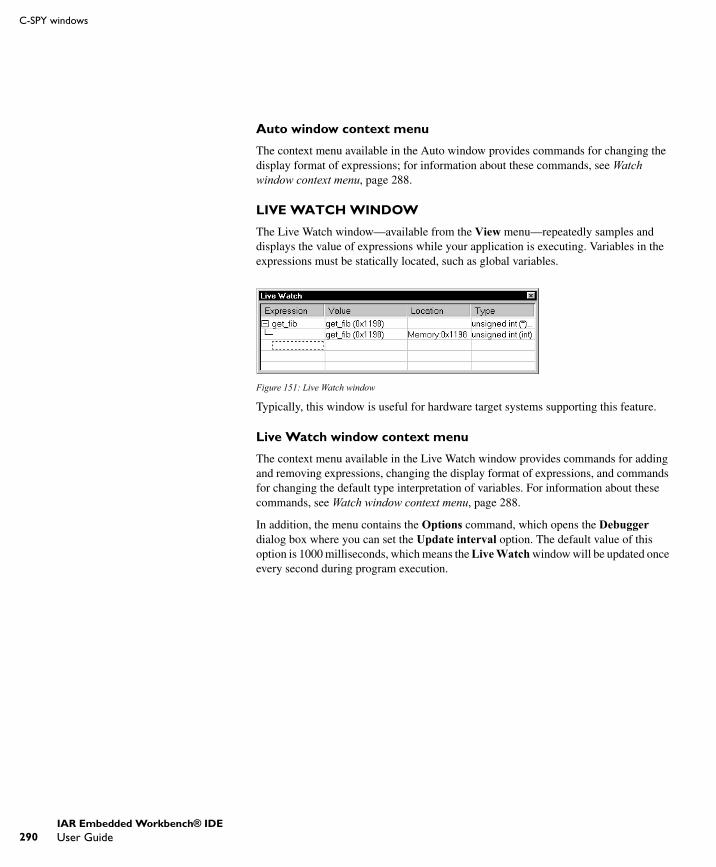
290
C-SPY windows
Auto window context menu
The context menu available in the Auto window provides commands for changing the display format of expressions; for information about these commands, see Watch window context menu, page 288.
LIVE WATCH WINDOW
The Live Watch window—available from the View menu—repeatedly samples and displays the value of expressions while your application is executing. Variables in the expressions must be statically located, such as global variables.
Figure 151: Live Watch window
Typically, this window is useful for hardware target systems supporting this feature.
Live Watch window context menu
The context menu available in the Live Watch window provides commands for adding and removing expressions, changing the display format of expressions, and commands for changing the default type interpretation of variables. For information about these commands, see Watch window context menu, page 288.
In addition, the menu contains the Options command, which opens the Debugger dialog box where you can set the Update interval option. The default value of this option is 1000 milliseconds, which means the Live Watch window will be updated once every second during program execution.
UEW-8:1
IAR Embedded Workbench® IDEUser Guide
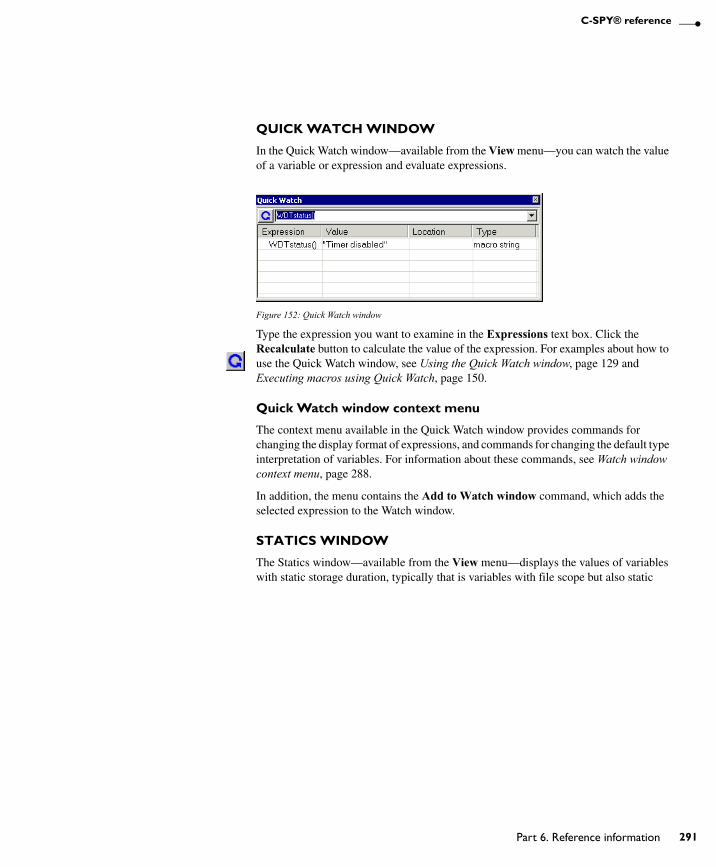
C-SPY® reference
QUICK WATCH WINDOW
In the Quick Watch window—available from the View menu—you can watch the value of a variable or expression and evaluate expressions.
Figure 152: Quick Watch window
Type the expression you want to examine in the Expressions text box. Click the Recalculate button to calculate the value of the expression. For examples about how to use the Quick Watch window, see Using the Quick Watch window, page 129 and Executing macros using Quick Watch, page 150.
Quick Watch window context menu
The context menu available in the Quick Watch window provides commands for changing the display format of expressions, and commands for changing the default type interpretation of variables. For information about these commands, see Watch window context menu, page 288.
In addition, the menu contains the Add to Watch window command, which adds the selected expression to the Watch window.
STATICS WINDOW
The Statics window—available from the View menu—displays the values of variables with static storage duration, typically that is variables with file scope but also static
UEW-8:1
Part 6. Reference information 291
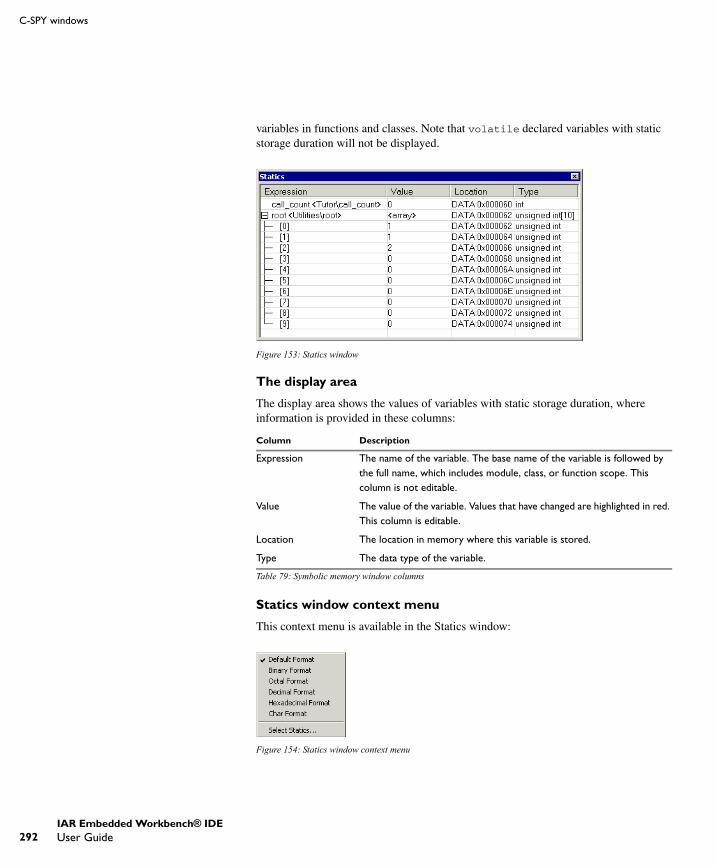
292
C-SPY windows
variables in functions and classes. Note that volatile declared variables with static storage duration will not be displayed.
Figure 153: Statics window
The display area
The display area shows the values of variables with static storage duration, where information is provided in these columns:
Statics window context menu
This context menu is available in the Statics window:
Figure 154: Statics window context menu
Column Description
Expression The name of the variable. The base name of the variable is followed by the full name, which includes module, class, or function scope. This column is not editable.
Value The value of the variable. Values that have changed are highlighted in red. This column is editable.
Location The location in memory where this variable is stored.
Type The data type of the variable.
Table 79: Symbolic memory window columns
UEW-8:1
IAR Embedded Workbench® IDEUser Guide
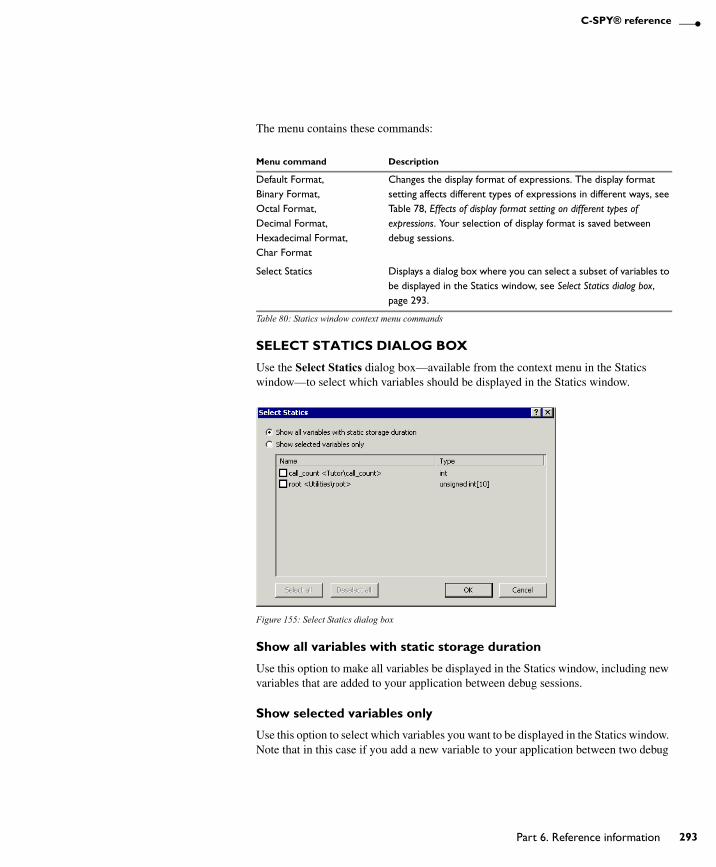
C-SPY® reference
The menu contains these commands:
SELECT STATICS DIALOG BOX
Use the Select Statics dialog box—available from the context menu in the Statics window—to select which variables should be displayed in the Statics window.
Figure 155: Select Statics dialog box
Show all variables with static storage duration
Use this option to make all variables be displayed in the Statics window, including new variables that are added to your application between debug sessions.
Show selected variables only
Use this option to select which variables you want to be displayed in the Statics window. Note that in this case if you add a new variable to your application between two debug
Menu command Description
Default Format,Binary Format,Octal Format,Decimal Format,Hexadecimal Format,Char Format
Changes the display format of expressions. The display format setting affects different types of expressions in different ways, see Table 78, Effects of display format setting on different types of expressions. Your selection of display format is saved between debug sessions.
Select Statics Displays a dialog box where you can select a subset of variables to be displayed in the Statics window, see Select Statics dialog box, page 293.
Table 80: Statics window context menu commands
UEW-8:1
Part 6. Reference information 293
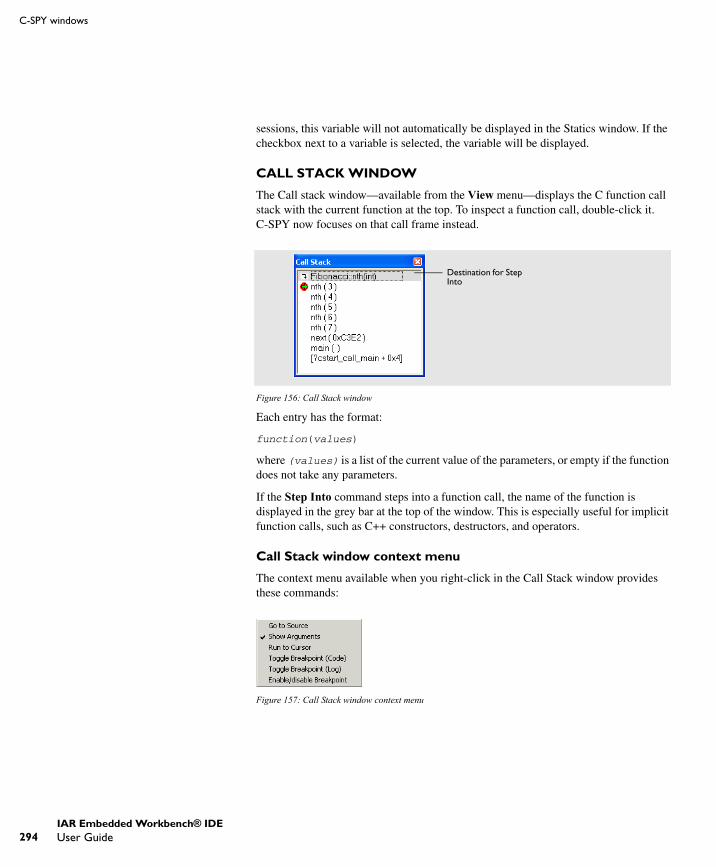
294
C-SPY windows
sessions, this variable will not automatically be displayed in the Statics window. If the checkbox next to a variable is selected, the variable will be displayed.
CALL STACK WINDOW
The Call stack window—available from the View menu—displays the C function call stack with the current function at the top. To inspect a function call, double-click it. C-SPY now focuses on that call frame instead.
Figure 156: Call Stack window
Each entry has the format:
function(values)
where (values) is a list of the current value of the parameters, or empty if the function does not take any parameters.
If the Step Into command steps into a function call, the name of the function is displayed in the grey bar at the top of the window. This is especially useful for implicit function calls, such as C++ constructors, destructors, and operators.
Call Stack window context menu
The context menu available when you right-click in the Call Stack window provides these commands:
Figure 157: Call Stack window context menu
Destination for Step Into
UEW-8:1
IAR Embedded Workbench® IDEUser Guide

C-SPY® reference
Commands
TERMINAL I/O WINDOW
In the Terminal I/O window—available from the View menu—you can enter input to the application, and display output from it. To use this window, you must link the application with the option Debug info with terminal I/O. C-SPY will then direct stdin, stdout and stderr to this window. If the Terminal I/O window is closed, C-SPY will open it automatically when input is required, but not for output.
Figure 158: Terminal I/O window
Clicking the Ctrl codes button opens a menu with submenus for input of special characters, such as EOF (end of file) and NUL.
Figure 159: Ctrl codes menu
Go to Source Displays the selected functions in the Disassembly or editor windows.
Show Arguments Shows function arguments.
Run to Cursor Executes to the function selected in the call stack.
Toggle Breakpoint (Code) Toggles a code breakpoint.
Toggle Breakpoint (Log) Toggles a log breakpoint.
Enable/Disable Breakpoint Enables or disables the selected breakpoint.
UEW-8:1
Part 6. Reference information 295
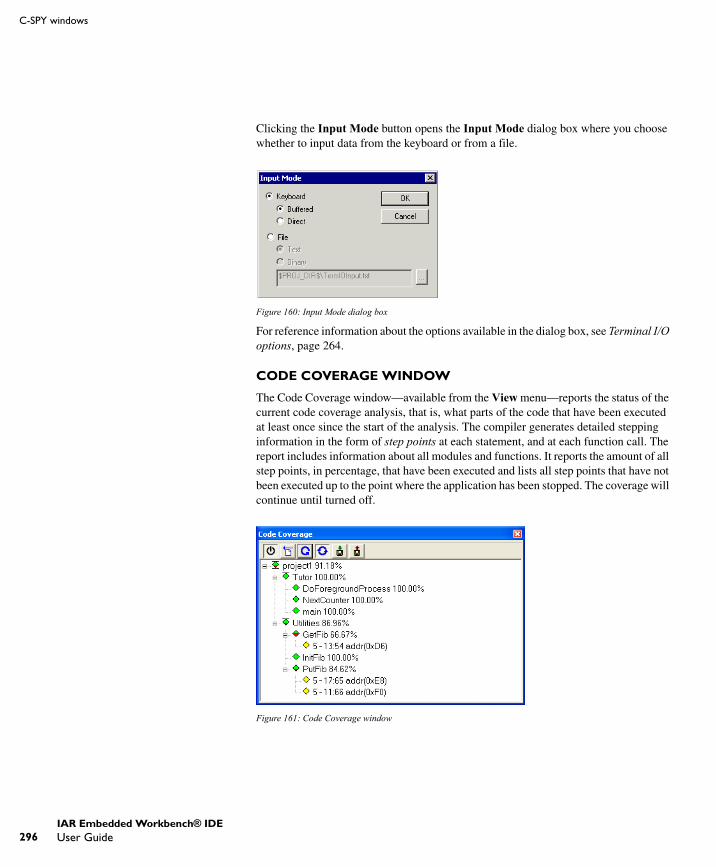
296
C-SPY windows
Clicking the Input Mode button opens the Input Mode dialog box where you choose whether to input data from the keyboard or from a file.
Figure 160: Input Mode dialog box
For reference information about the options available in the dialog box, see Terminal I/O options, page 264.
CODE COVERAGE WINDOW
The Code Coverage window—available from the View menu—reports the status of the current code coverage analysis, that is, what parts of the code that have been executed at least once since the start of the analysis. The compiler generates detailed stepping information in the form of step points at each statement, and at each function call. The report includes information about all modules and functions. It reports the amount of all step points, in percentage, that have been executed and lists all step points that have not been executed up to the point where the application has been stopped. The coverage will continue until turned off.
Figure 161: Code Coverage window
UEW-8:1
IAR Embedded Workbench® IDEUser Guide
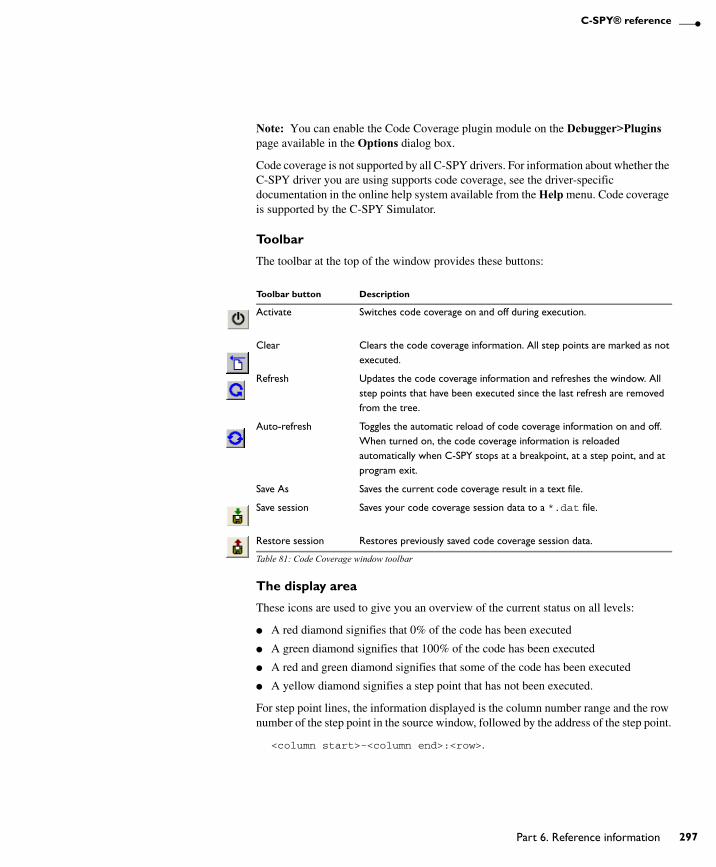
C-SPY® reference
Note: You can enable the Code Coverage plugin module on the Debugger>Plugins page available in the Options dialog box.
Code coverage is not supported by all C-SPY drivers. For information about whether the C-SPY driver you are using supports code coverage, see the driver-specific documentation in the online help system available from the Help menu. Code coverage is supported by the C-SPY Simulator.
Toolbar
The toolbar at the top of the window provides these buttons:
The display area
These icons are used to give you an overview of the current status on all levels:
● A red diamond signifies that 0% of the code has been executed
● A green diamond signifies that 100% of the code has been executed
● A red and green diamond signifies that some of the code has been executed
● A yellow diamond signifies a step point that has not been executed.
For step point lines, the information displayed is the column number range and the row number of the step point in the source window, followed by the address of the step point.
<column start>-<column end>:<row>.
Toolbar button Description
Activate Switches code coverage on and off during execution.
Clear Clears the code coverage information. All step points are marked as not executed.
Refresh Updates the code coverage information and refreshes the window. All step points that have been executed since the last refresh are removed from the tree.
Auto-refresh Toggles the automatic reload of code coverage information on and off. When turned on, the code coverage information is reloaded automatically when C-SPY stops at a breakpoint, at a step point, and at program exit.
Save As Saves the current code coverage result in a text file.
Save session Saves your code coverage session data to a *.dat file.
Restore session Restores previously saved code coverage session data.
Table 81: Code Coverage window toolbar
UEW-8:1
Part 6. Reference information 297

298
C-SPY windows
Code Coverage window context menu
This context menu is available in the Code Coverage window:
Figure 162: Code coverage context menu
These commands are available on the menu:
PROFILING WINDOW
The Profiling window—available from the View menu—displays profiling information, that is, timing information for the functions in an application. Profiling must be turned on explicitly using a button in the window’s toolbar, and will stay active until it is turned off.
Menu command Description
Activate Switches code coverage on and off during execution.
Clear Clears the code coverage information. All step points are marked as not executed.
Refresh Updates the code coverage information and refreshes the window. All step points that has been executed since the last refresh are removed from the tree.
Auto-refresh Toggles the automatic reload of code coverage information on and off. When turned on, the code coverage information is reloaded automatically when C-SPY stops at a breakpoint, at a step point, and at program exit.
Save As Saves the current code coverage result in a text file.
Table 82: Code Coverage window context menu commands
UEW-8:1
IAR Embedded Workbench® IDEUser Guide
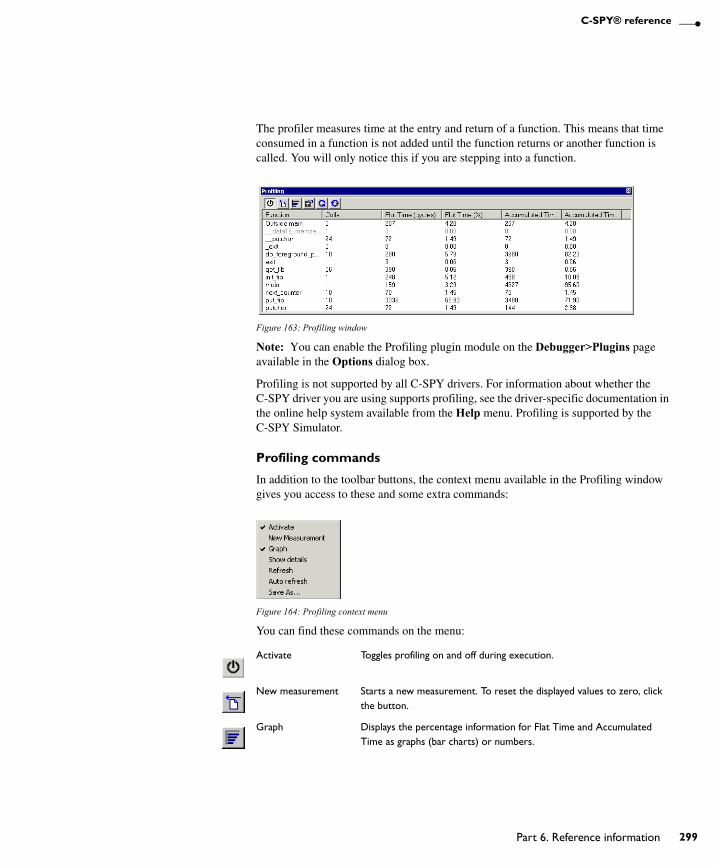
C-SPY® reference
The profiler measures time at the entry and return of a function. This means that time consumed in a function is not added until the function returns or another function is called. You will only notice this if you are stepping into a function.
Figure 163: Profiling window
Note: You can enable the Profiling plugin module on the Debugger>Plugins page available in the Options dialog box.
Profiling is not supported by all C-SPY drivers. For information about whether the C-SPY driver you are using supports profiling, see the driver-specific documentation in the online help system available from the Help menu. Profiling is supported by the C-SPY Simulator.
Profiling commands
In addition to the toolbar buttons, the context menu available in the Profiling window gives you access to these and some extra commands:
Figure 164: Profiling context menu
You can find these commands on the menu:
Activate Toggles profiling on and off during execution.
New measurement Starts a new measurement. To reset the displayed values to zero, click the button.
Graph Displays the percentage information for Flat Time and Accumulated Time as graphs (bar charts) or numbers.
UEW-8:1
Part 6. Reference information 299
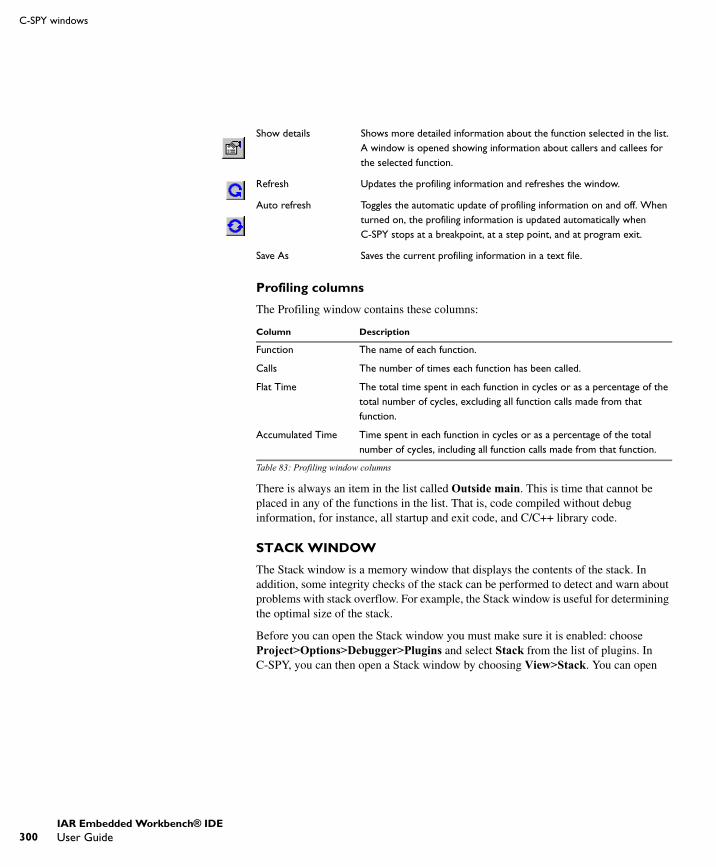
300
C-SPY windows
Profiling columns
The Profiling window contains these columns:
There is always an item in the list called Outside main. This is time that cannot be placed in any of the functions in the list. That is, code compiled without debug information, for instance, all startup and exit code, and C/C++ library code.
STACK WINDOW
The Stack window is a memory window that displays the contents of the stack. In addition, some integrity checks of the stack can be performed to detect and warn about problems with stack overflow. For example, the Stack window is useful for determining the optimal size of the stack.
Before you can open the Stack window you must make sure it is enabled: choose Project>Options>Debugger>Plugins and select Stack from the list of plugins. In C-SPY, you can then open a Stack window by choosing View>Stack. You can open
Show details Shows more detailed information about the function selected in the list. A window is opened showing information about callers and callees for the selected function.
Refresh Updates the profiling information and refreshes the window.
Auto refresh Toggles the automatic update of profiling information on and off. When turned on, the profiling information is updated automatically when C-SPY stops at a breakpoint, at a step point, and at program exit.
Save As Saves the current profiling information in a text file.
Column Description
Function The name of each function.
Calls The number of times each function has been called.
Flat Time The total time spent in each function in cycles or as a percentage of the total number of cycles, excluding all function calls made from that function.
Accumulated Time Time spent in each function in cycles or as a percentage of the total number of cycles, including all function calls made from that function.
Table 83: Profiling window columns
UEW-8:1
IAR Embedded Workbench® IDEUser Guide
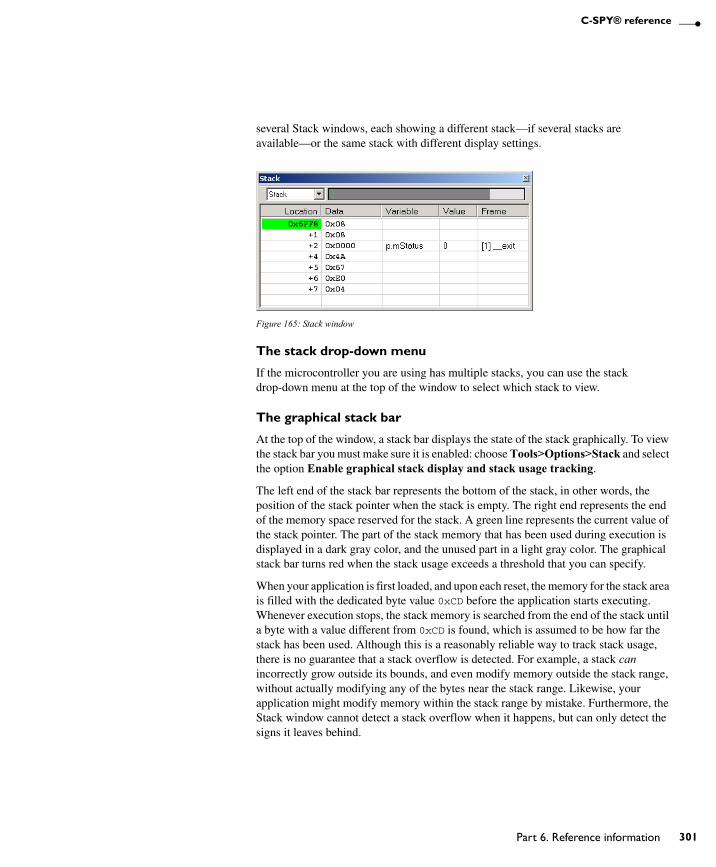
C-SPY® reference
several Stack windows, each showing a different stack—if several stacks are available—or the same stack with different display settings.
Figure 165: Stack window
The stack drop-down menu
If the microcontroller you are using has multiple stacks, you can use the stack drop-down menu at the top of the window to select which stack to view.
The graphical stack bar
At the top of the window, a stack bar displays the state of the stack graphically. To view the stack bar you must make sure it is enabled: choose Tools>Options>Stack and select the option Enable graphical stack display and stack usage tracking.
The left end of the stack bar represents the bottom of the stack, in other words, the position of the stack pointer when the stack is empty. The right end represents the end of the memory space reserved for the stack. A green line represents the current value of the stack pointer. The part of the stack memory that has been used during execution is displayed in a dark gray color, and the unused part in a light gray color. The graphical stack bar turns red when the stack usage exceeds a threshold that you can specify.
When your application is first loaded, and upon each reset, the memory for the stack area is filled with the dedicated byte value 0xCD before the application starts executing. Whenever execution stops, the stack memory is searched from the end of the stack until a byte with a value different from 0xCD is found, which is assumed to be how far the stack has been used. Although this is a reasonably reliable way to track stack usage, there is no guarantee that a stack overflow is detected. For example, a stack can incorrectly grow outside its bounds, and even modify memory outside the stack range, without actually modifying any of the bytes near the stack range. Likewise, your application might modify memory within the stack range by mistake. Furthermore, the Stack window cannot detect a stack overflow when it happens, but can only detect the signs it leaves behind.
UEW-8:1
Part 6. Reference information 301
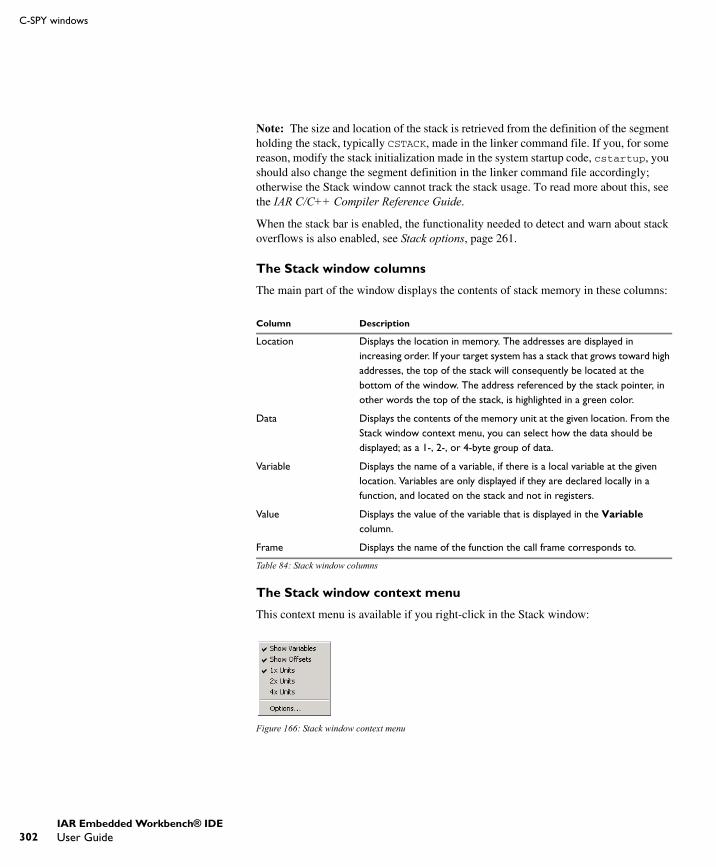
302
C-SPY windows
Note: The size and location of the stack is retrieved from the definition of the segment holding the stack, typically CSTACK, made in the linker command file. If you, for some reason, modify the stack initialization made in the system startup code, cstartup, you should also change the segment definition in the linker command file accordingly; otherwise the Stack window cannot track the stack usage. To read more about this, see the IAR C/C++ Compiler Reference Guide.
When the stack bar is enabled, the functionality needed to detect and warn about stack overflows is also enabled, see Stack options, page 261.
The Stack window columns
The main part of the window displays the contents of stack memory in these columns:
The Stack window context menu
This context menu is available if you right-click in the Stack window:
Figure 166: Stack window context menu
Column Description
Location Displays the location in memory. The addresses are displayed in increasing order. If your target system has a stack that grows toward high addresses, the top of the stack will consequently be located at the bottom of the window. The address referenced by the stack pointer, in other words the top of the stack, is highlighted in a green color.
Data Displays the contents of the memory unit at the given location. From the Stack window context menu, you can select how the data should be displayed; as a 1-, 2-, or 4-byte group of data.
Variable Displays the name of a variable, if there is a local variable at the given location. Variables are only displayed if they are declared locally in a function, and located on the stack and not in registers.
Value Displays the value of the variable that is displayed in the Variable column.
Frame Displays the name of the function the call frame corresponds to.
Table 84: Stack window columns
UEW-8:1
IAR Embedded Workbench® IDEUser Guide

C-SPY® reference
These commands are available on the context menu:
SYMBOLS WINDOW
The Symbols window—available from the View menu—displays all symbols with a static location, that is, C/C++ functions, assembler labels, and variables with static storage duration, including symbols from the runtime library.
Figure 167: Symbols window
The display area
The display area lists the symbols, where information is provided in these columns:
Show variables Separate columns named Variables, Value, and Frame are displayed in the Stack window. Variables located at memory addresses listed in the Stack window are displayed in these columns.
Show offsets When this option is selected, locations in the Location column are displayed as offsets from the stack pointer. When deselected, locations are displayed as absolute addresses.
1x Units The data in the Data column is displayed as single bytes.
2x Units The data in the Data column is displayed as 2-byte groups.
4x Units The data in the Data column is displayed as 4-byte groups.
Options Opens the IDE Options dialog box where you can set options specific to the Stack window, see Stack options, page 261.
Column Description
Symbol The symbol name.
Location The memory address.
Table 85: Symbols window columns
UEW-8:1
Part 6. Reference information 303
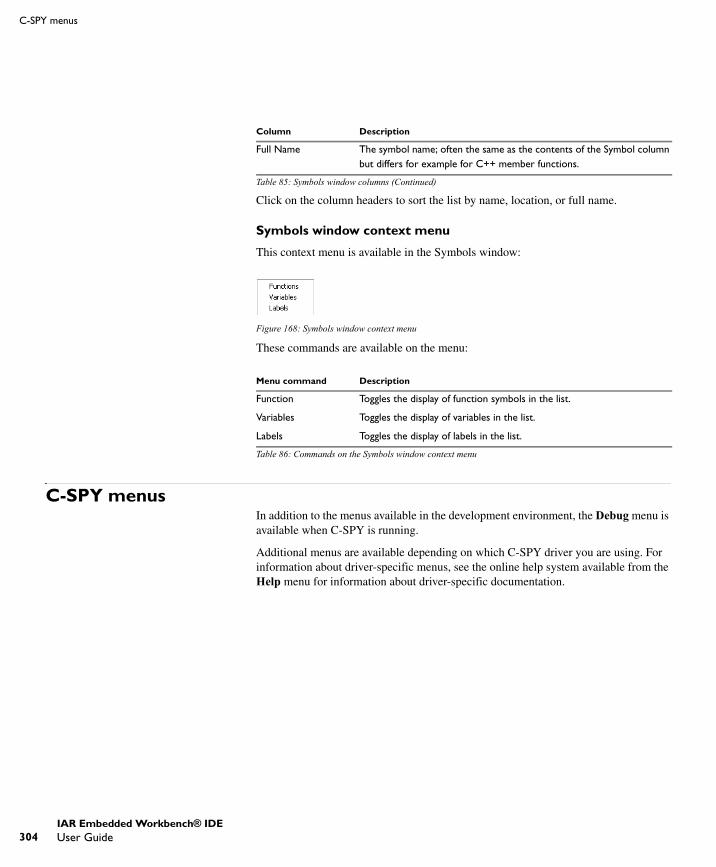
304
C-SPY menus
Click on the column headers to sort the list by name, location, or full name.
Symbols window context menu
This context menu is available in the Symbols window:
Figure 168: Symbols window context menu
These commands are available on the menu:
C-SPY menusIn addition to the menus available in the development environment, the Debug menu is available when C-SPY is running.
Additional menus are available depending on which C-SPY driver you are using. For information about driver-specific menus, see the online help system available from the Help menu for information about driver-specific documentation.
Full Name The symbol name; often the same as the contents of the Symbol column but differs for example for C++ member functions.
Menu command Description
Function Toggles the display of function symbols in the list.
Variables Toggles the display of variables in the list.
Labels Toggles the display of labels in the list.
Table 86: Commands on the Symbols window context menu
Column Description
Table 85: Symbols window columns (Continued)
UEW-8:1
IAR Embedded Workbench® IDEUser Guide
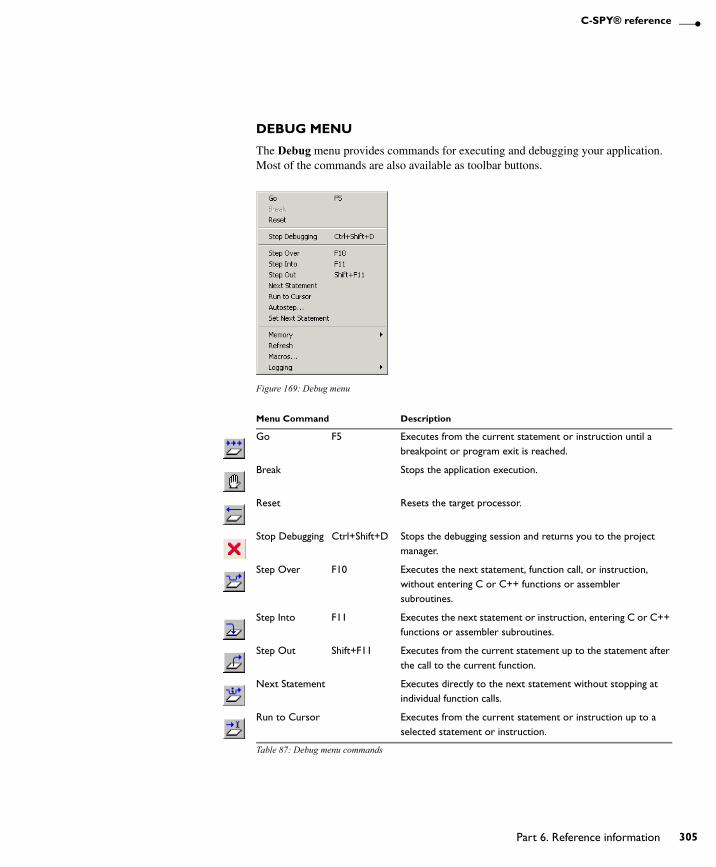
C-SPY® reference
DEBUG MENU
The Debug menu provides commands for executing and debugging your application. Most of the commands are also available as toolbar buttons.
Figure 169: Debug menu
Menu Command Description
Go F5 Executes from the current statement or instruction until a breakpoint or program exit is reached.
Break Stops the application execution.
Reset Resets the target processor.
Stop Debugging Ctrl+Shift+D Stops the debugging session and returns you to the project manager.
Step Over F10 Executes the next statement, function call, or instruction, without entering C or C++ functions or assembler subroutines.
Step Into F11 Executes the next statement or instruction, entering C or C++ functions or assembler subroutines.
Step Out Shift+F11 Executes from the current statement up to the statement after the call to the current function.
Next Statement Executes directly to the next statement without stopping at individual function calls.
Run to Cursor Executes from the current statement or instruction up to a selected statement or instruction.
Table 87: Debug menu commands
UEW-8:1
Part 6. Reference information 305

306
C-SPY menus
Autostep settings dialog box
In the Autostep settings dialog box—available from the Debug menu—you can customize autostepping.
Figure 170: Autostep settings dialog box
Autostep Displays the Autostep settings dialog box which lets you customize and perform autostepping.
Set Next Statement Moves the program counter directly to where the cursor is, without executing any source code. Note, however, that this creates an anomaly in the program flow and might have unexpected effects.
Memory>Save Displays the Memory Save dialog box, where you can save the contents of a specified memory area to a file, see Memory Save dialog box, page 283.
Memory>Restore Displays the Memory Restore dialog box, where you can load the contents of a file in Intex-extended or Motorola s-record format to a specified memory zone, see Memory Restore dialog box, page 284.
Refresh Refreshes the contents of all debugger windows. Because window updates are automatic, this is needed only in unusual situations, such as when target memory is modified in ways C-SPY cannot detect. It is also useful if code that is displayed in the Disassembly window is changed.
Macros Displays the Macro Configuration dialog box to allow you to list, register, and edit your macro files and functions.
Logging>Set Log file Displays a dialog box to allow you to log input and output from C-SPY to a file. You can select the type and the location of the log file. You can choose what you want to log: errors, warnings, system information, user messages, or all of these.
Logging>Set Terminal I/O Log file
Displays a dialog box to allow you to log terminal input and output from C-SPY to a file. You can select the destination of the log file.
Menu Command Description
Table 87: Debug menu commands (Continued)
UEW-8:1
IAR Embedded Workbench® IDEUser Guide
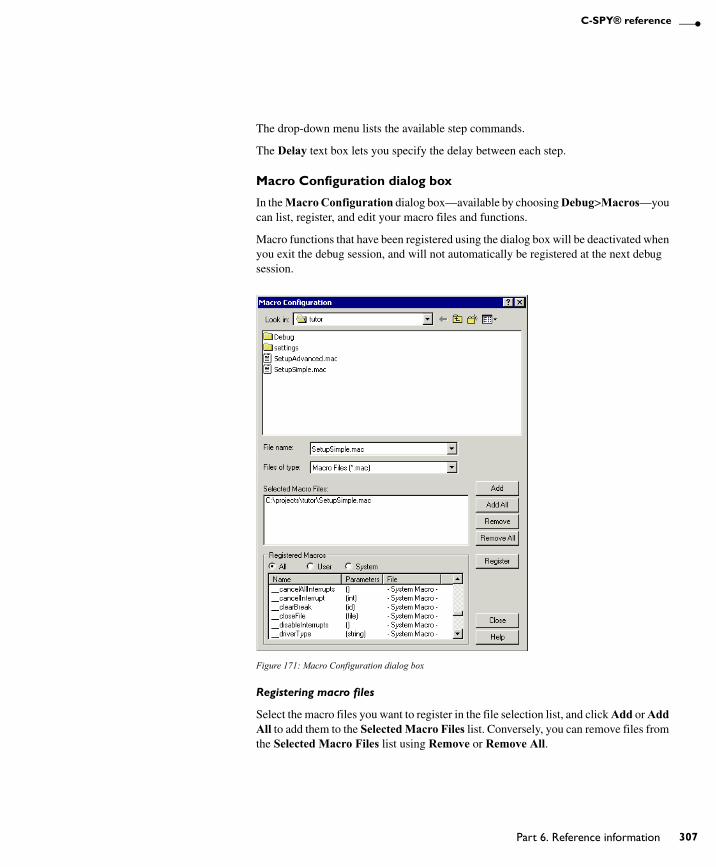
C-SPY® reference
The drop-down menu lists the available step commands.
The Delay text box lets you specify the delay between each step.
Macro Configuration dialog box
In the Macro Configuration dialog box—available by choosing Debug>Macros—you can list, register, and edit your macro files and functions.
Macro functions that have been registered using the dialog box will be deactivated when you exit the debug session, and will not automatically be registered at the next debug session.
Figure 171: Macro Configuration dialog box
Registering macro files
Select the macro files you want to register in the file selection list, and click Add or Add All to add them to the Selected Macro Files list. Conversely, you can remove files from the Selected Macro Files list using Remove or Remove All.
UEW-8:1
Part 6. Reference information 307
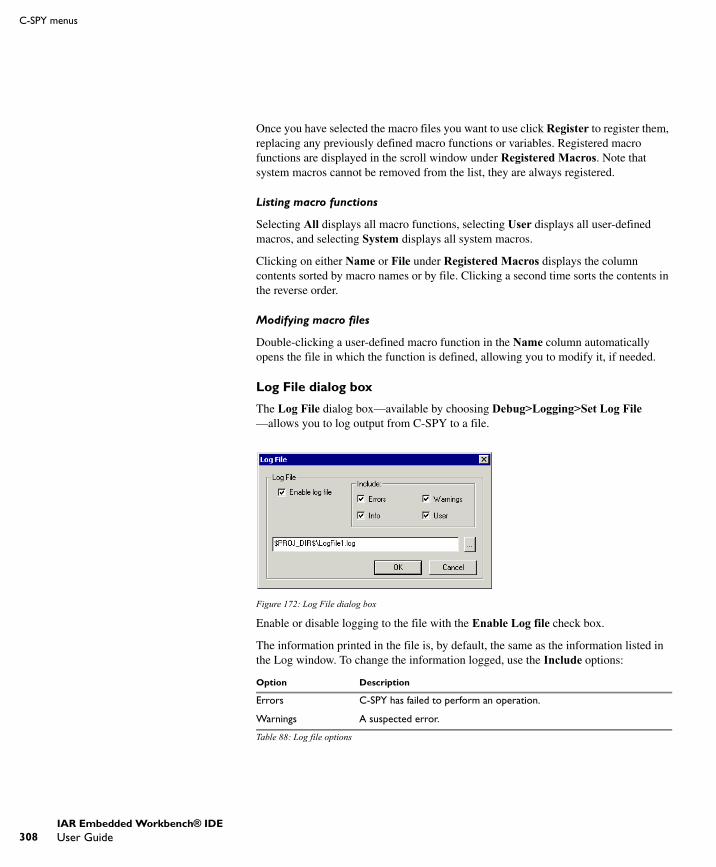
308
C-SPY menus
Once you have selected the macro files you want to use click Register to register them, replacing any previously defined macro functions or variables. Registered macro functions are displayed in the scroll window under Registered Macros. Note that system macros cannot be removed from the list, they are always registered.
Listing macro functions
Selecting All displays all macro functions, selecting User displays all user-defined macros, and selecting System displays all system macros.
Clicking on either Name or File under Registered Macros displays the column contents sorted by macro names or by file. Clicking a second time sorts the contents in the reverse order.
Modifying macro files
Double-clicking a user-defined macro function in the Name column automatically opens the file in which the function is defined, allowing you to modify it, if needed.
Log File dialog box
The Log File dialog box—available by choosing Debug>Logging>Set Log File —allows you to log output from C-SPY to a file.
Figure 172: Log File dialog box
Enable or disable logging to the file with the Enable Log file check box.
The information printed in the file is, by default, the same as the information listed in the Log window. To change the information logged, use the Include options:
Option Description
Errors C-SPY has failed to perform an operation.
Warnings A suspected error.
Table 88: Log file options
UEW-8:1
IAR Embedded Workbench® IDEUser Guide
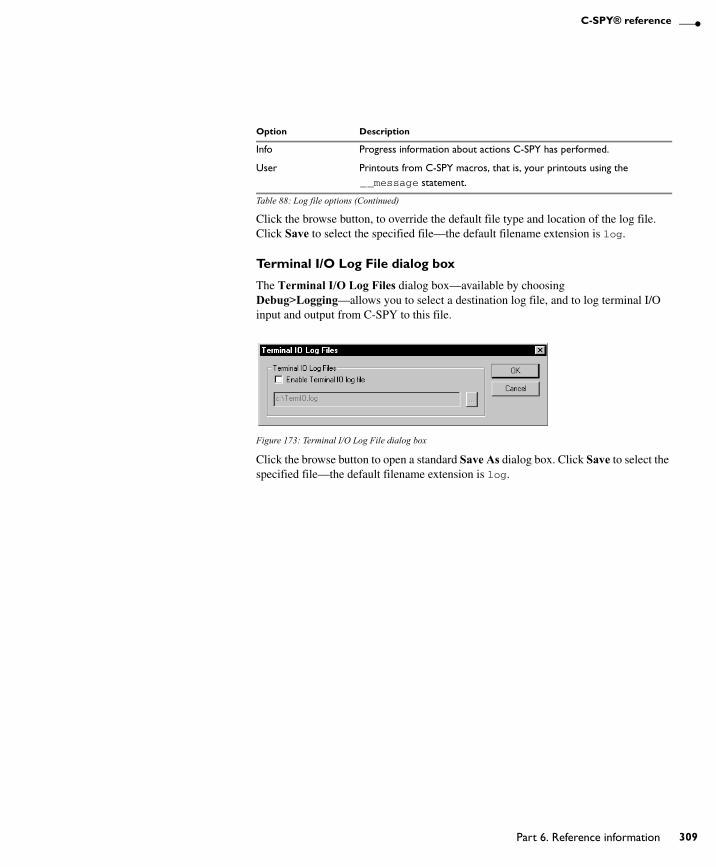
C-SPY® reference
Click the browse button, to override the default file type and location of the log file. Click Save to select the specified file—the default filename extension is log.
Terminal I/O Log File dialog box
The Terminal I/O Log Files dialog box—available by choosing Debug>Logging—allows you to select a destination log file, and to log terminal I/O input and output from C-SPY to this file.
Figure 173: Terminal I/O Log File dialog box
Click the browse button to open a standard Save As dialog box. Click Save to select the specified file—the default filename extension is log.
Info Progress information about actions C-SPY has performed.
User Printouts from C-SPY macros, that is, your printouts using the __message statement.
Option Description
Table 88: Log file options (Continued)
UEW-8:1
Part 6. Reference information 309

310
C-SPY menus
UEW-8:1
IAR Embedded Workbench® IDEUser Guide

General optionsThis chapter describes the general options in the IAR Embedded Workbench® IDE.
For information about how to set options, see Setting options, page 91.
TargetFor information about the Target options, see the online help system available from the Help menu.
OutputWith the Output options you can specify the type of output file—Executable or Library. You can also specify the destination directories for executable files, object files, and list files.
Figure 174: Output options
UEW-8:1
Part 6. Reference information 311

312
Output
OUTPUT FILE
Use these options to choose the type of output file. Choose between:
OUTPUT DIRECTORIES
Use these options to specify paths to destination directories. Note that incomplete paths are relative to your project directory. You can specify the paths to these destination directories:
Executable(default)
As a result of the build process, the linker will create an application (an executable output file). When this option is selected, linker options will be available in the Options dialog box. Before you create the output you should set the appropriate linker options.
Library As a result of the build process, the library builder will create a library file. When this option is selected, library builder options will be available in the Options dialog box, and Linker will disappear from the list of categories. Before you create the library you can set the options.
Executables/libraries Use this option to override the default directory for executable or library files. Type the name of the directory where you want to save executable files for the project.
Object files Use this option to override the default directory for object files. Type the name of the directory where you want to save object files for the project.
List files Use this option to override the default directory for list files. Type the name of the directory where you want to save list files for the project.
UEW-8:1
IAR Embedded Workbench® IDEUser Guide

General options
Library ConfigurationWith the Library Configuration options you can specify which library to use.
Figure 175: Library Configuration options
For information about the runtime library, library configurations, the runtime environment they provide, and the possible customizations, see IAR C/C++ Compiler Reference Guide.
LIBRARY
In the Library drop-down list you choose which runtime library to use. For information about available libraries, see the IAR C/C++ Compiler Reference Guide.
The names of the library object file and library configuration file that actually will be used are displayed in the Library file and Configuration file text boxes, respectively.
LIBRARY FILE
The Library file text box displays the library object file that will be used. A library object file is automatically chosen depending on some of your settings, see the IAR C/C++ Compiler Reference Guide.
If you have chosen Custom library in the Library drop-down list, you must specify your own library object file.
CONFIGURATION FILE
The Configuration file text box displays the library configuration file that will be used. A library configuration file is chosen automatically depending on the project settings. If you have chosen Custom DLIB in the Library drop-down list, you must specify your own library configuration file.
UEW-8:1
Part 6. Reference information 313
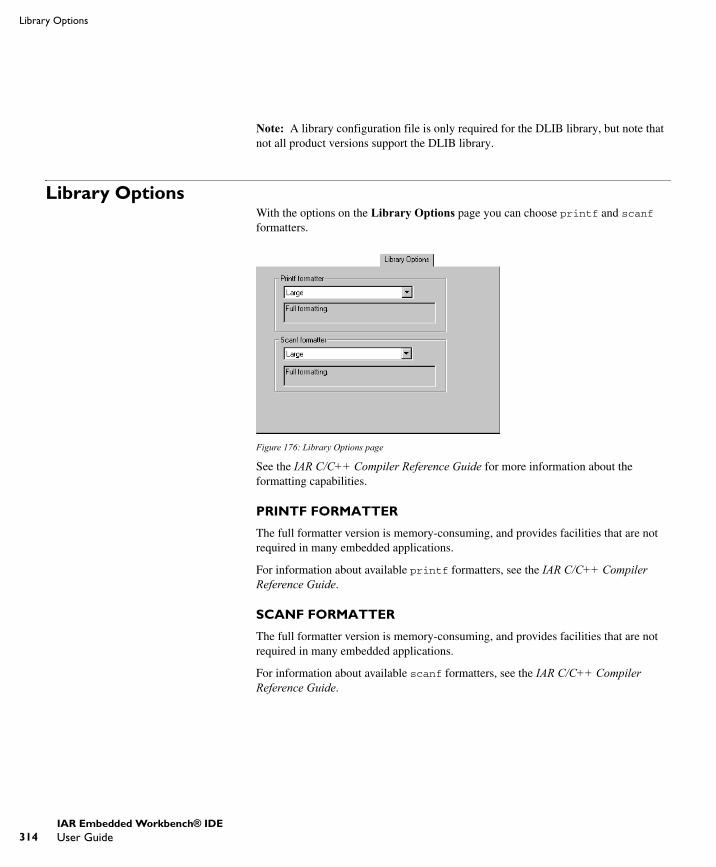
314
Library Options
Note: A library configuration file is only required for the DLIB library, but note that not all product versions support the DLIB library.
Library OptionsWith the options on the Library Options page you can choose printf and scanf formatters.
Figure 176: Library Options page
See the IAR C/C++ Compiler Reference Guide for more information about the formatting capabilities.
PRINTF FORMATTER
The full formatter version is memory-consuming, and provides facilities that are not required in many embedded applications.
For information about available printf formatters, see the IAR C/C++ Compiler Reference Guide.
SCANF FORMATTER
The full formatter version is memory-consuming, and provides facilities that are not required in many embedded applications.
For information about available scanf formatters, see the IAR C/C++ Compiler Reference Guide.
UEW-8:1
IAR Embedded Workbench® IDEUser Guide
General options
Stack/HeapWith the options on the Stack/Heap page you can customize the heap and stack sizes. For more information, see the online help system available from the Help menu.
For more information about using the stacks and heaps, see the IAR C/C++ Compiler Reference Guide.
UEW-8:1
Part 6. Reference information 315

316
Stack/Heap
UEW-8:1
IAR Embedded Workbench® IDEUser Guide
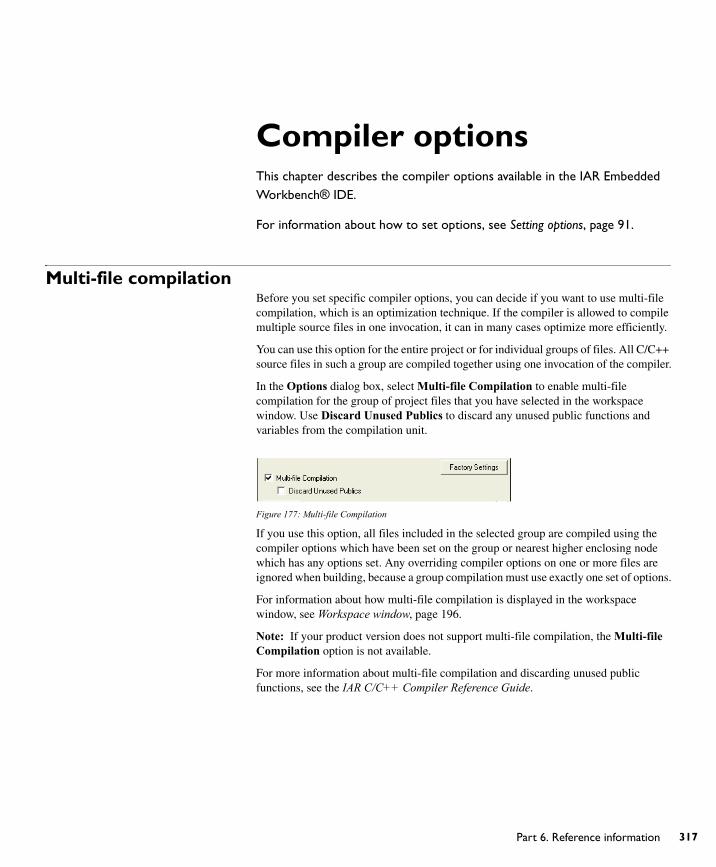
Compiler optionsThis chapter describes the compiler options available in the IAR Embedded Workbench® IDE.
For information about how to set options, see Setting options, page 91.
Multi-file compilationBefore you set specific compiler options, you can decide if you want to use multi-file compilation, which is an optimization technique. If the compiler is allowed to compile multiple source files in one invocation, it can in many cases optimize more efficiently.
You can use this option for the entire project or for individual groups of files. All C/C++ source files in such a group are compiled together using one invocation of the compiler.
In the Options dialog box, select Multi-file Compilation to enable multi-file compilation for the group of project files that you have selected in the workspace window. Use Discard Unused Publics to discard any unused public functions and variables from the compilation unit.
Figure 177: Multi-file Compilation
If you use this option, all files included in the selected group are compiled using the compiler options which have been set on the group or nearest higher enclosing node which has any options set. Any overriding compiler options on one or more files are ignored when building, because a group compilation must use exactly one set of options.
For information about how multi-file compilation is displayed in the workspace window, see Workspace window, page 196.
Note: If your product version does not support multi-file compilation, the Multi-file Compilation option is not available.
For more information about multi-file compilation and discarding unused public functions, see the IAR C/C++ Compiler Reference Guide.
UEW-8:1
Part 6. Reference information 317

318
Language
LanguageThe Language options enable the use of target-dependent extensions to the C or C++ language.
Figure 178: Compiler language options
LANGUAGE
With the Language options you can specify the language support you need.
For information about Embedded C++ and Extended Embedded C++, see the IAR C/C++ Compiler Reference Guide. (Note that not all product packages support C++.)
C
By default, the IAR C/C++ Compiler runs in ISO/ANSI C mode, in which features specific to Embedded C++ and Extended Embedded C++ cannot be used.
Embedded C++
In Embedded C++ mode, the compiler treats the source code as Embedded C++. This means that features specific to Embedded C++, such as classes and overloading, can be used.
Embedded C++ requires that a DLIB library (C/C++ library) is used.
Extended Embedded C++
In Extended Embedded C++ mode, you can take advantage of features like namespaces or the standard template library in your source code.
Extended Embedded C++ requires that a DLIB library (C/C++ library) is used.
UEW-8:1
IAR Embedded Workbench® IDEUser Guide
Compiler options
Automatic
If you select Automatic, language support is decided automatically depending on the filename extension of the file being compiled:
● Files with the filename extension c will be compiled as C source files
● Files with the filename extension cpp will be compiled as Extended Embedded C++ source files.
This option requires that a DLIB library (C/C++ library) is used.
Note: Not all product packages support C++. For products without C++ support, the Language options will not be available.
REQUIRE PROTOTYPES
This option forces the compiler to verify that all functions have proper prototypes. Using this option means that code containing any of the following will generate an error:
● A function call of a function with no declaration, or with a Kernighan & Ritchie C declaration
● A function definition of a public function with no previous prototype declaration
● An indirect function call through a function pointer with a type that does not include a prototype.
LANGUAGE CONFORMANCE
Language extensions must be enabled for the compiler to be able to accept target-specific keywords as extensions to the standard C or C++ language. In the IDE, the option Allow IAR extensions is enabled by default.
The option Relaxed ISO/ANSI disables IAR Systems extensions, but does not adhere to strict ISO/ANSI.
Select the option Strict ISO/ANSI to adhere to the strict ISO/ANSI C standard.
For details about language extensions, see the IAR C/C++ Compiler Reference Guide.
PLAIN 'CHAR' IS
Normally, the compiler interprets the char type as unsigned char. Use this option to make the compiler interpret the char type as signed char instead, for example for compatibility with another compiler.
Note: The runtime library is compiled with unsigned plain characters. If you select the Signed option, you might get type mismatch warnings from the linker as the library uses unsigned char.
UEW-8:1
Part 6. Reference information 319

320
Code
ENABLE MULTIBYTE SUPPORT
By default, multibyte characters cannot be used in C or Embedded C++ source code. If you use this option, multibyte characters in the source code are interpreted according to the host computer’s default setting for multibyte support.
Multibyte characters are allowed in C and C++ style comments, in string literals, and in character constants. They are transferred untouched to the generated code.
ENABLE IAR MIGRATION PREPROCESSOR EXTENSIONS
Migration preprocessor extensions extend the preprocessor, to ease migration of code from earlier IAR Systems compilers. If you need to migrate code from an earlier IAR C or C++ compiler, you might want to use this option. Note that, depending on your product installation, this option might not be available.
Note: If you use this option, not only will the compiler accept code that is not standard conformant, but it will also reject some code that does conform to standard.
Important! Do not depend on these extensions in newly written code. Support for them might be removed in future compiler versions.
CodeWith the options on the Code page you can customize the code generation. For more information, see the online help system available from the Help menu. Note that, depending on your product installation, this page might not be available.
UEW-8:1
IAR Embedded Workbench® IDEUser Guide
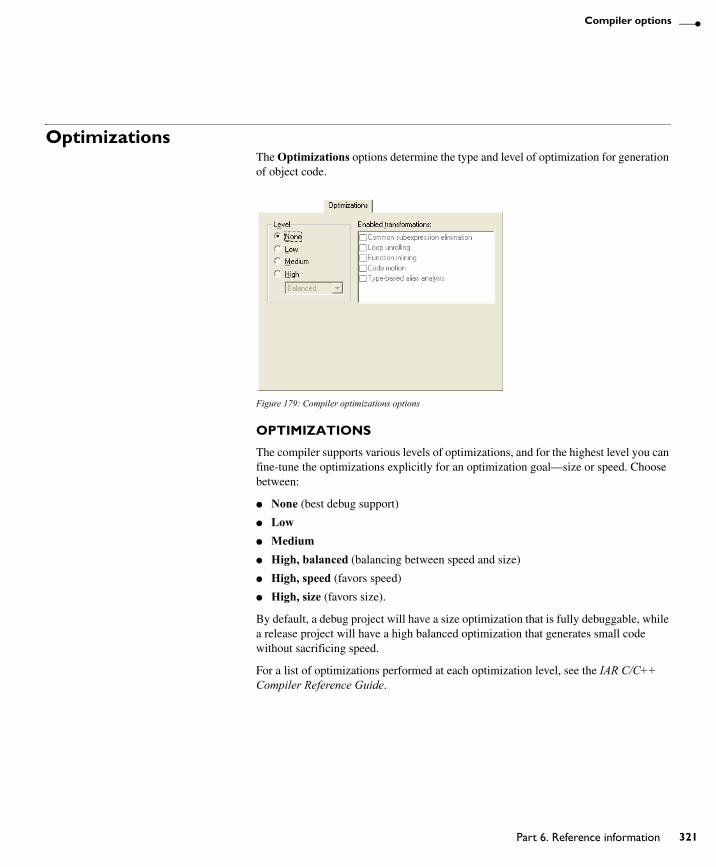
Compiler options
OptimizationsThe Optimizations options determine the type and level of optimization for generation of object code.
Figure 179: Compiler optimizations options
OPTIMIZATIONS
The compiler supports various levels of optimizations, and for the highest level you can fine-tune the optimizations explicitly for an optimization goal—size or speed. Choose between:
● None (best debug support)
● Low● Medium● High, balanced (balancing between speed and size)
● High, speed (favors speed)
● High, size (favors size).
By default, a debug project will have a size optimization that is fully debuggable, while a release project will have a high balanced optimization that generates small code without sacrificing speed.
For a list of optimizations performed at each optimization level, see the IAR C/C++ Compiler Reference Guide.
UEW-8:1
Part 6. Reference information 321
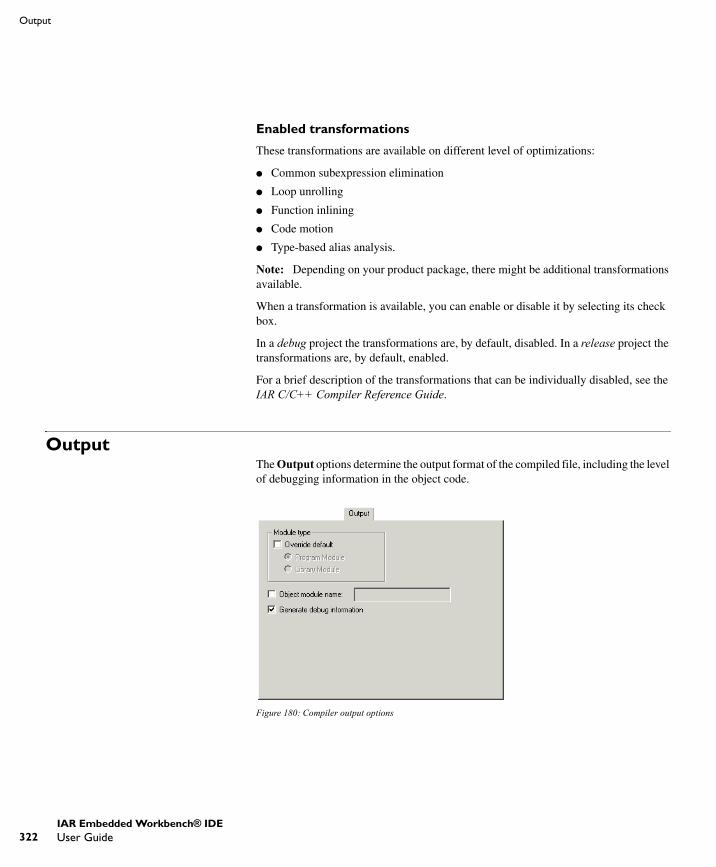
322
Output
Enabled transformations
These transformations are available on different level of optimizations:
● Common subexpression elimination
● Loop unrolling
● Function inlining
● Code motion
● Type-based alias analysis.
Note: Depending on your product package, there might be additional transformations available.
When a transformation is available, you can enable or disable it by selecting its check box.
In a debug project the transformations are, by default, disabled. In a release project the transformations are, by default, enabled.
For a brief description of the transformations that can be individually disabled, see the IAR C/C++ Compiler Reference Guide.
OutputThe Output options determine the output format of the compiled file, including the level of debugging information in the object code.
Figure 180: Compiler output options
UEW-8:1
IAR Embedded Workbench® IDEUser Guide

Compiler options
MODULE TYPE
By default, the compiler generates program modules. Use this option to make a library module that will only be included if it is referenced in your application. Select the Override default check box and choose one of:
For information about program and library modules, and working with libraries, see the XLIB and XAR chapters in the IAR Linker and Library Tools Reference Guide, available from the Help menu.
GENERATE DEBUG INFORMATION
This option causes the compiler to include additional information in the object modules that is required by C-SPY® and other symbolic debuggers.
The Generate debug information option is selected by default. Deselect this option if you do not want the compiler to generate debug information.
Note: The included debug information increases the size of the object files.
ListThe List options determine whether a list file is produced, and the information is included in the list file.
Figure 181: Compiler list file options
Program Module The object file will be treated as a program module rather than as a library module.
Library Module The object file will be treated as a library module rather than as a program module.
UEW-8:1
Part 6. Reference information 323
324
List
Normally, the compiler does not generate a list file. Select any of the following options to generate a list file or an assembler file. The list file will be saved in the List directory, and its filename will consist of the source filename, plus the filename extension lst. You can open the output files directly from the Output folder which is available in the Workspace window.
OUTPUT LIST FILE
Select the Output list file option and choose the type of information to include in the list file:
OUTPUT ASSEMBLER FILE
Select the Output assembler file option and choose the type of information to include in the list file:
Assembler mnemonics Includes assembler mnemonics in the list file.
Diagnostics Includes diagnostic information in the list file.
Include source Includes source code in the assembler file.
Include call frame information Includes compiler-generated information for runtime model attributes, call frame information, and frame size information.
UEW-8:1
IAR Embedded Workbench® IDEUser Guide
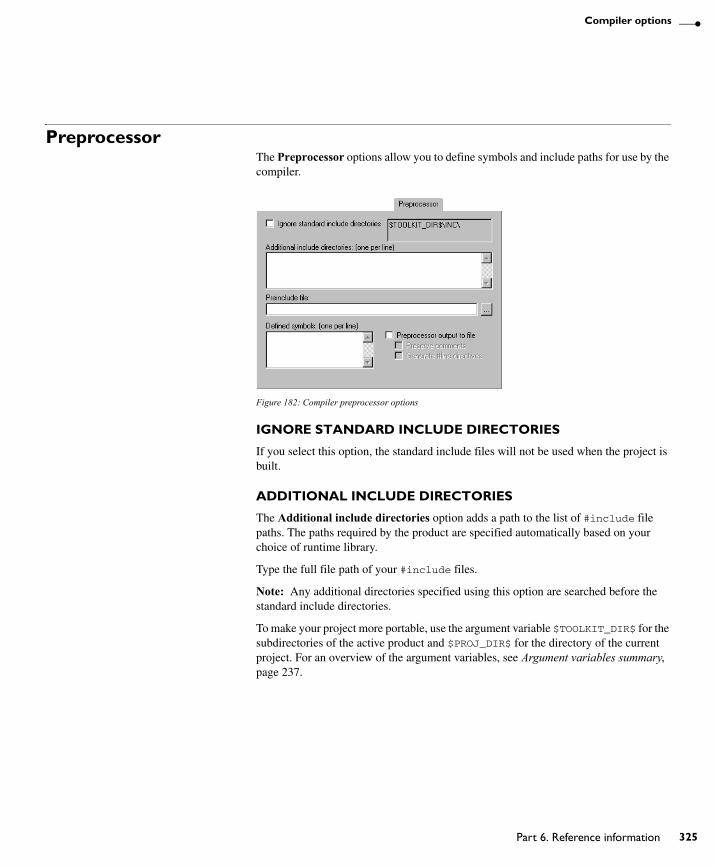
Compiler options
PreprocessorThe Preprocessor options allow you to define symbols and include paths for use by the compiler.
Figure 182: Compiler preprocessor options
IGNORE STANDARD INCLUDE DIRECTORIES
If you select this option, the standard include files will not be used when the project is built.
ADDITIONAL INCLUDE DIRECTORIES
The Additional include directories option adds a path to the list of #include file paths. The paths required by the product are specified automatically based on your choice of runtime library.
Type the full file path of your #include files.
Note: Any additional directories specified using this option are searched before the standard include directories.
To make your project more portable, use the argument variable $TOOLKIT_DIR$ for the subdirectories of the active product and $PROJ_DIR$ for the directory of the current project. For an overview of the argument variables, see Argument variables summary, page 237.
UEW-8:1
Part 6. Reference information 325
326
Diagnostics
PREINCLUDE FILE
Use this option to make the compiler include the specified include file before it starts to read the source file. This is useful if you want to change something in the source code for the entire application, for instance if you want to define a new symbol.
DEFINED SYMBOLS
The Defined symbols option is useful for conveniently specifying a value or choice that would otherwise be specified in the source file.
Type the symbols that you want to define for the project, for example:
TESTVER=1
Note that there should be no space around the equal sign.
The Defined symbols option has the same effect as a #define statement at the top of the source file.
For example, you might arrange your source to produce either the test or production version of your application depending on whether the symbol TESTVER was defined. To do this you would use include sections such as:
#ifdef TESTVER... ; additional code lines for test version only
#endif
You would then define the symbol TESTVER in the Debug target but not in the Release target.
PREPROCESSOR OUTPUT TO FILE
By default, the compiler does not generate preprocessor output.
Select the Preprocessor output to file option if you want to generate preprocessor output. You can also choose to preserve comments and/or to generate #line directives.
DiagnosticsThe Diagnostics options determine how diagnostics are classified and displayed. Use the diagnostics options to override the default classification of the specified diagnostics.
UEW-8:1
IAR Embedded Workbench® IDEUser Guide
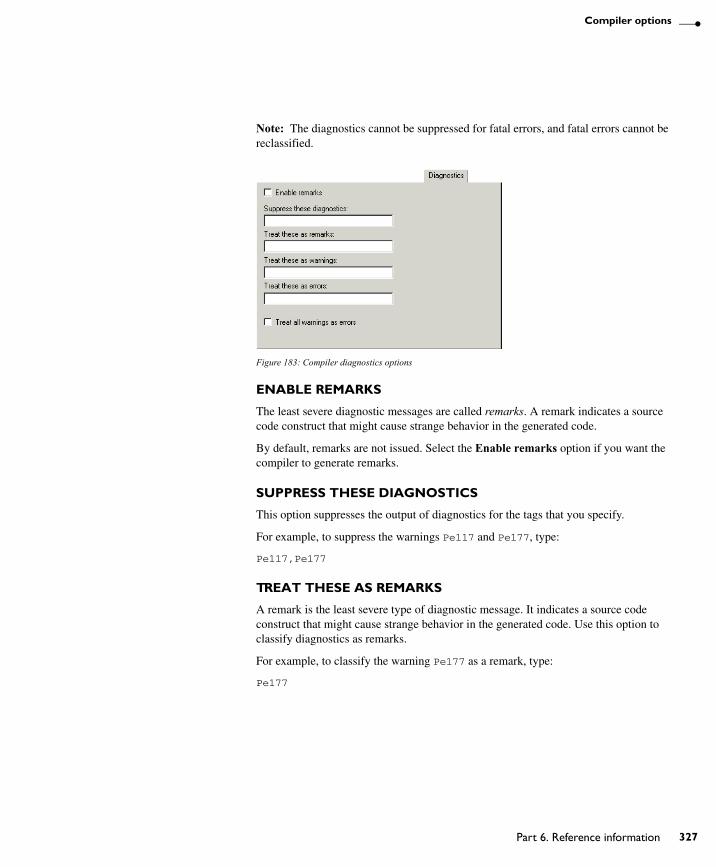
Compiler options
Note: The diagnostics cannot be suppressed for fatal errors, and fatal errors cannot be reclassified.
Figure 183: Compiler diagnostics options
ENABLE REMARKS
The least severe diagnostic messages are called remarks. A remark indicates a source code construct that might cause strange behavior in the generated code.
By default, remarks are not issued. Select the Enable remarks option if you want the compiler to generate remarks.
SUPPRESS THESE DIAGNOSTICS
This option suppresses the output of diagnostics for the tags that you specify.
For example, to suppress the warnings Pe117 and Pe177, type:
Pe117,Pe177
TREAT THESE AS REMARKS
A remark is the least severe type of diagnostic message. It indicates a source code construct that might cause strange behavior in the generated code. Use this option to classify diagnostics as remarks.
For example, to classify the warning Pe177 as a remark, type:
Pe177
UEW-8:1
Part 6. Reference information 327
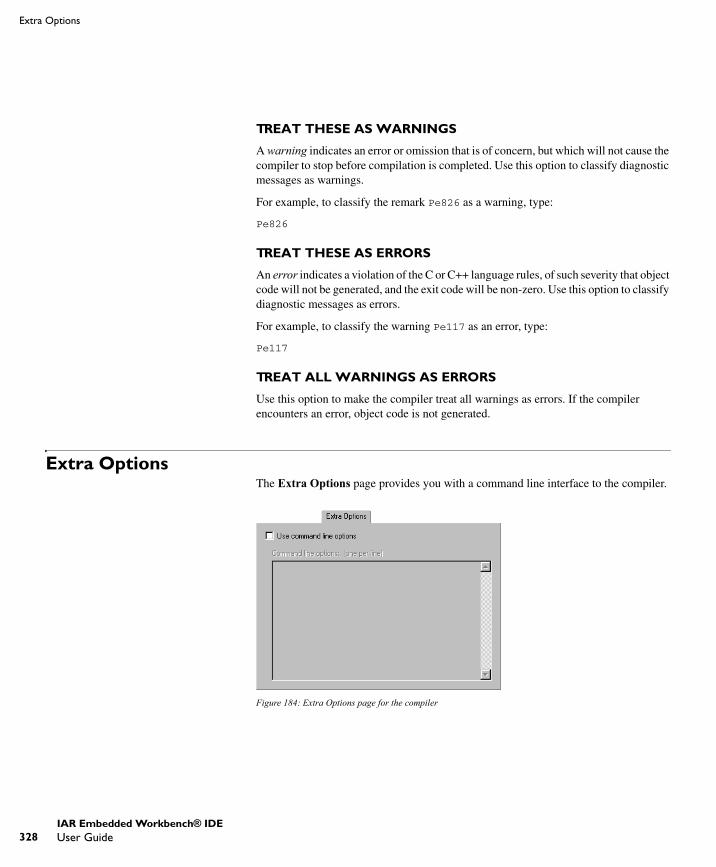
328
Extra Options
TREAT THESE AS WARNINGS
A warning indicates an error or omission that is of concern, but which will not cause the compiler to stop before compilation is completed. Use this option to classify diagnostic messages as warnings.
For example, to classify the remark Pe826 as a warning, type:
Pe826
TREAT THESE AS ERRORS
An error indicates a violation of the C or C++ language rules, of such severity that object code will not be generated, and the exit code will be non-zero. Use this option to classify diagnostic messages as errors.
For example, to classify the warning Pe117 as an error, type:
Pe117
TREAT ALL WARNINGS AS ERRORS
Use this option to make the compiler treat all warnings as errors. If the compiler encounters an error, object code is not generated.
Extra OptionsThe Extra Options page provides you with a command line interface to the compiler.
Figure 184: Extra Options page for the compiler
UEW-8:1
IAR Embedded Workbench® IDEUser Guide

Compiler options
USE COMMAND LINE OPTIONS
Additional command line arguments for the compiler (not supported by the GUI) can be specified here.
UEW-8:1
Part 6. Reference information 329

330
Extra Options
UEW-8:1
IAR Embedded Workbench® IDEUser Guide

Assembler optionsThis chapter describes the assembler options available in the IAR Embedded Workbench® IDE.
For information about how to set options, see Setting options, page 91.
LanguageThe Language options control the code generation of the assembler.
Note: Some of the options described here might not be available in the product package you are using.
USER SYMBOLS ARE CASE SENSITIVE
By default, case sensitivity is on. This means that, for example, LABEL and label refer to different symbols. You can deselect User symbols are case sensitive to turn case sensitivity off, in which case LABEL and label will refer to the same symbol.
ENABLE MULTIBYTE SUPPORT
By default, multibyte characters cannot be used in assembler source code. If you use this option, multibyte characters in the source code are interpreted according to the host computer’s default setting for multibyte support.
Multibyte characters are allowed in comments, in string literals, and in character constants. They are transferred untouched to the generated code.
ALLOW MNEMONICS IN FIRST COLUMN
The default behavior of the assembler is to treat all identifiers starting in the first column as labels.
Use this option to make mnemonics names (without a trailing colon) starting in the first column to be recognized as mnemonics.
ALLOW DIRECTIVES IN FIRST COLUMN
The default behavior of the assembler is to treat all identifiers starting in the first column as labels.
Use this option to make directive names (without a trailing colon) that start in the first column to be recognized as directives.
UEW-8:1
Part 6. Reference information 331

332
MACRO QUOTE CHARACTERS
The Macro quote characters option sets the characters used for the left and right quotes of each macro argument.
By default, the characters are < and >. This option allows you to change the quote characters to suit an alternative convention or simply to allow a macro argument to contain < or >.
From the drop-down list, choose one of four types of brackets to be used as macro quote characters:
Figure 185: Choosing macro quote characters
OutputThe Output options allow you to generate information to be used by a debugger such as the IAR C-SPY® Debugger.
Figure 186: Assembler output options
UEW-8:1
IAR Embedded Workbench® IDEUser Guide

Assembler options
GENERATE DEBUG INFORMATION
The Generate debug information option must be selected if you want to use a debugger with your application. By default, this option is selected in a Debug project, but not in a Release project.
ListThe List options are used for making the assembler generate a list file and for selecting the list file contents. For reference information about each option, see the online help system available from the Help menu.
PreprocessorThe Preprocessor options allow you to define include paths and symbols in the assembler.
Figure 187: Assembler preprocessor options
IGNORE STANDARD INCLUDE DIRECTORIES
If you select this option, the standard include files will not be used when the project is built.
ADDITIONAL INCLUDE DIRECTORIES
The Additional include directories option adds paths to the list of #include file paths. The path required by the product is specified automatically.
Type the full path of the directories that you want the assembler to search for #include files.
UEW-8:1
Part 6. Reference information 333
334
To make your project more portable, use the argument variable $TOOLKIT_DIR$ for the subdirectories of the active product and $PROJ_DIR$ for the directory of the current project. For an overview of the argument variables, see Table 54, Argument variables, page 237.
See the IAR Assembler Reference Guide for information about the #include directive.
Note: By default, the assembler also searches for #include files in the paths specified in the ACPUNAME_INC environment variable. We do not, however, recommend that you use environment variables in the IDE.
DEFINED SYMBOLS
This option provides a convenient way of specifying a value or choice that you would otherwise have to specify in the source file.
Type the symbols you want to define, one per line.
● For example, you might arrange your source to produce either the test or production version of your application depending on whether the symbol TESTVER was defined. To do this you would use include sections such as:
#ifdef TESTVER... ; additional code lines for test version only#endif
You would then define the symbol TESTVER in the Debug target but not in the Release target.
● Alternatively, your source might use a variable that you need to change often, for example FRAMERATE. You would leave the variable undefined in the source and use this option to specify a value for the project, for example FRAMERATE=3.
To delete a user-defined symbol, select in the Defined symbols list and press the Delete key.
PREPROCESSOR OUTPUT TO FILE
By default, the assembler does not generate preprocessor output.
Select the Preprocessor output to file option if you want to generate preprocessor output. You can also choose to preserve comments and/or to generate #line directives.
Note: This option might not be available in the product package you are using.
UEW-8:1
IAR Embedded Workbench® IDEUser Guide
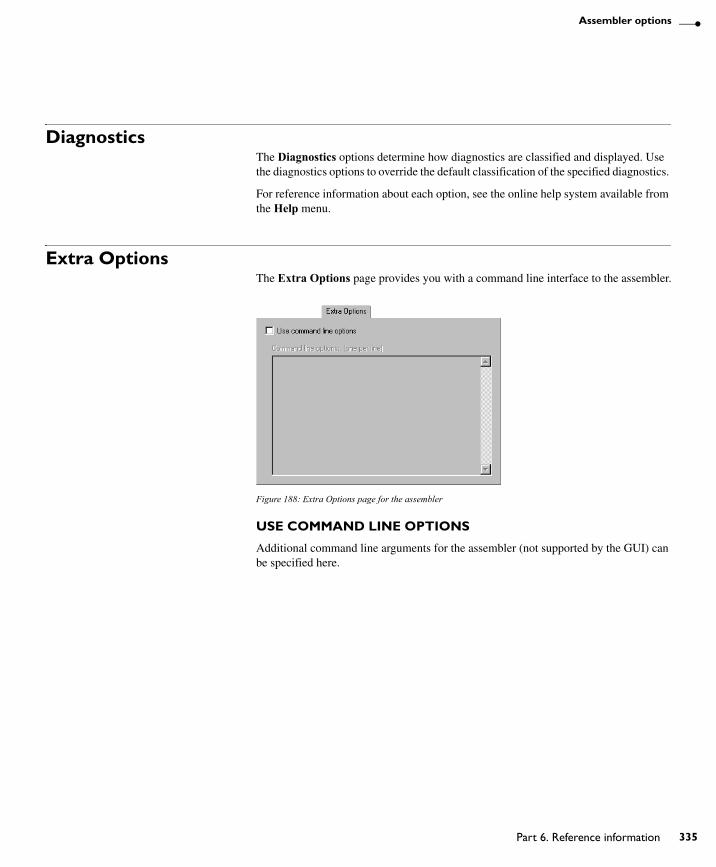
Assembler options
DiagnosticsThe Diagnostics options determine how diagnostics are classified and displayed. Use the diagnostics options to override the default classification of the specified diagnostics.
For reference information about each option, see the online help system available from the Help menu.
Extra OptionsThe Extra Options page provides you with a command line interface to the assembler.
Figure 188: Extra Options page for the assembler
USE COMMAND LINE OPTIONS
Additional command line arguments for the assembler (not supported by the GUI) can be specified here.
UEW-8:1
Part 6. Reference information 335

336
UEW-8:1
IAR Embedded Workbench® IDEUser Guide
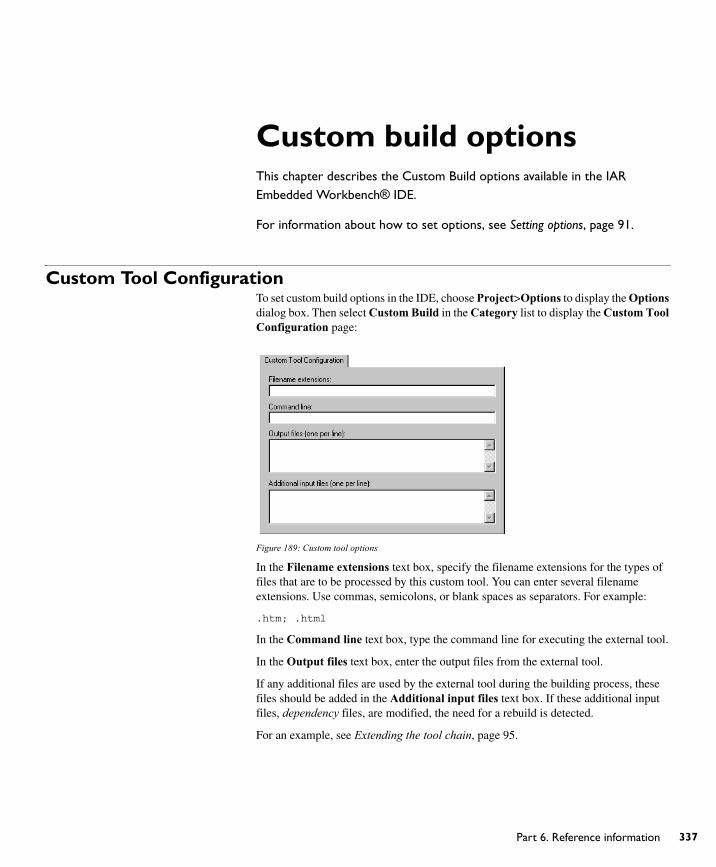
Custom build optionsThis chapter describes the Custom Build options available in the IAR Embedded Workbench® IDE.
For information about how to set options, see Setting options, page 91.
Custom Tool ConfigurationTo set custom build options in the IDE, choose Project>Options to display the Options dialog box. Then select Custom Build in the Category list to display the Custom Tool Configuration page:
Figure 189: Custom tool options
In the Filename extensions text box, specify the filename extensions for the types of files that are to be processed by this custom tool. You can enter several filename extensions. Use commas, semicolons, or blank spaces as separators. For example:
.htm; .html
In the Command line text box, type the command line for executing the external tool.
In the Output files text box, enter the output files from the external tool.
If any additional files are used by the external tool during the building process, these files should be added in the Additional input files text box. If these additional input files, dependency files, are modified, the need for a rebuild is detected.
For an example, see Extending the tool chain, page 95.
UEW-8:1
Part 6. Reference information 337

338
Custom Tool Configuration
UEW-8:1
IAR Embedded Workbench® IDEUser Guide
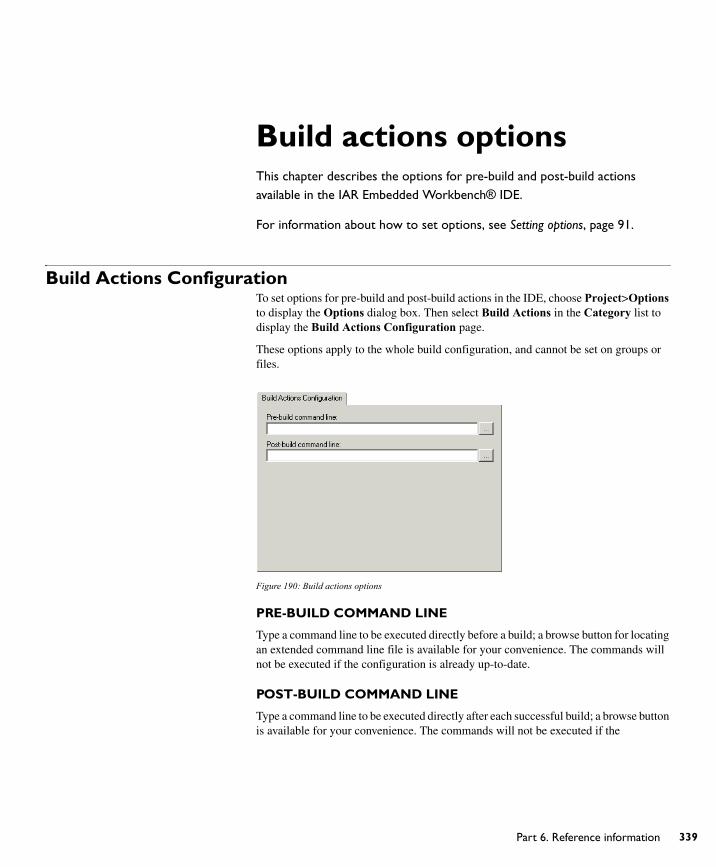
Build actions optionsThis chapter describes the options for pre-build and post-build actions available in the IAR Embedded Workbench® IDE.
For information about how to set options, see Setting options, page 91.
Build Actions ConfigurationTo set options for pre-build and post-build actions in the IDE, choose Project>Options to display the Options dialog box. Then select Build Actions in the Category list to display the Build Actions Configuration page.
These options apply to the whole build configuration, and cannot be set on groups or files.
Figure 190: Build actions options
PRE-BUILD COMMAND LINE
Type a command line to be executed directly before a build; a browse button for locating an extended command line file is available for your convenience. The commands will not be executed if the configuration is already up-to-date.
POST-BUILD COMMAND LINE
Type a command line to be executed directly after each successful build; a browse button is available for your convenience. The commands will not be executed if the
UEW-8:1
Part 6. Reference information 339

340
Build Actions Configuration
configuration was up-to-date. This is useful for copying or post-processing the output file.
UEW-8:1
IAR Embedded Workbench® IDEUser Guide
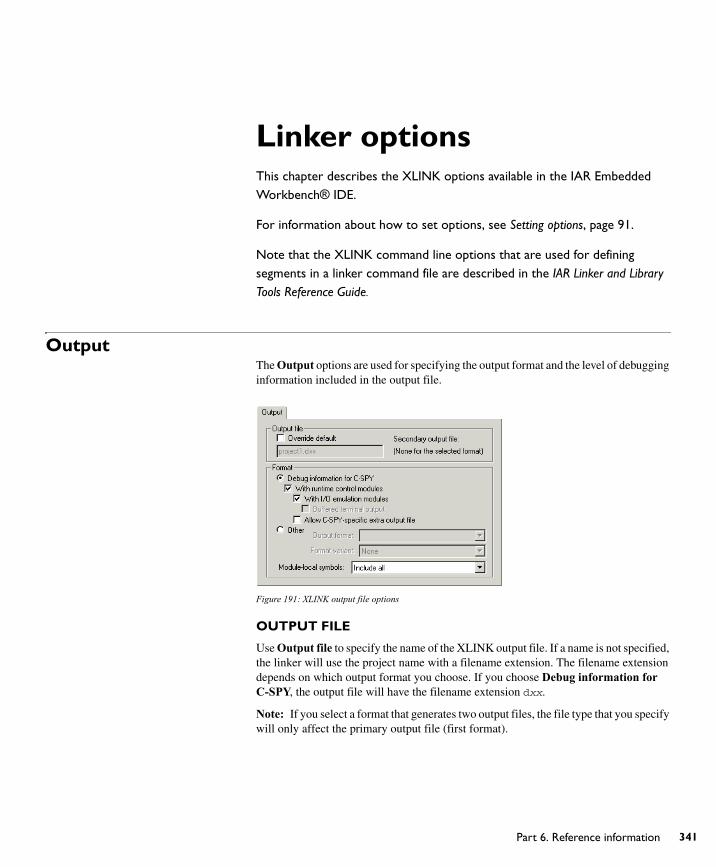
Linker optionsThis chapter describes the XLINK options available in the IAR Embedded Workbench® IDE.
For information about how to set options, see Setting options, page 91.
Note that the XLINK command line options that are used for defining segments in a linker command file are described in the IAR Linker and Library Tools Reference Guide.
OutputThe Output options are used for specifying the output format and the level of debugging information included in the output file.
Figure 191: XLINK output file options
OUTPUT FILE
Use Output file to specify the name of the XLINK output file. If a name is not specified, the linker will use the project name with a filename extension. The filename extension depends on which output format you choose. If you choose Debug information for C-SPY, the output file will have the filename extension dxx.
Note: If you select a format that generates two output files, the file type that you specify will only affect the primary output file (first format).
UEW-8:1
Part 6. Reference information 341
342
Output
Override default
Use this option to specify a filename or filename extension other than the default.
FORMAT
The output options determine the format of the output file generated by the IAR XLINK Linker. The output file is used as input to either a debugger or as input for programming the target system. The IAR Systems proprietary output format is called UBROF, Universal Binary Relocatable Object Format.
The default output settings are:
● In a debug project, Debug information for C-SPY, With runtime control modules, and With I/O emulation modules are selected by default
● In a release project, an output format suitable for target download is selected automatically.
Note: For debuggers other than C-SPY®, check the user documentation supplied with that debugger for information about which format/variant should be used.
Debug information for C-SPY
This option creates a UBROF output file, with a dxx filename extension, to be used with C-SPY.
With runtime control modules
This option produces the same output as the Debug information for C-SPY option, but also includes debugger support for handling program abort, exit, and assertions. Special C-SPY variants for the corresponding library functions are linked with your application. For more information about the debugger runtime interface, see the IAR C/C++ Compiler Reference Guide.
With I/O emulation modules
This option produces the same output as the Debug information for C-SPY and With runtime control modules options, but also includes debugger support for I/O handling, which means that stdin and stdout are redirected to the Terminal I/O window, and that you can access files on the host computer during debugging.
For more information about the debugger runtime interface, see the IAR C/C++ Compiler Reference Guide.
UEW-8:1
IAR Embedded Workbench® IDEUser Guide
Linker options
Buffered terminal output
During program execution in C-SPY, instead of instantly printing each new character to the C-SPY Terminal I/O window, this option will buffer the output. This option is useful when using debugger systems that have slow communication.
Allow C-SPY-specific extra output file
Use this option to enable the options available on the Extra Output page.
If you choose any of the options With runtime control modules or With I/O emulation modules, the generated output file will contain dummy implementations for certain library functions, such as putchar, and extra debug information required by C-SPY to handle those functions. In this case, the options available on the Extra Output page are disabled, which means you cannot generate an extra output file. The reason is that the extra output file would still contain the dummy functions, but would lack the required extra debug information, and would therefore normally be useless.
However, for some debugger systems, two output files from the same build process are required—one with the required debug information, and one that you can burn to your hardware before debugging. This is useful when you want to debug code that is located in non-volatile memory. In this case, you must choose the Allow C-SPY-specific extra output file option to make it possible to generate an extra output file.
Other
Use this option to generate output other than those generated by the options Debug information for C-SPY, With runtime control modules, and With I/O emulation modules.
Use the Output format drop-down list to select the appropriate output. If applicable, use Format variant to select variants available for some of the output formats. The alternatives depend on the output format chosen.
When you specify the Other>Output format option as either debug (ubrof), or ubrof, a UBROF output file with the filename extension dbg is created. The generated output file will not contain debugging information for simulating facilities such as stop at program exit, long jump instructions, and terminal I/O. If you need support for these facilities during debugging, use the Debug information for C-SPY, With runtime control modules, and With I/O emulation modules options, respectively.
For more information, see the IAR Linker and Library Tools Reference Guide.
Module-local symbols
Use this option to specify whether local (non-public) symbols in the input modules should be included or not by the IAR XLINK Linker. If suppressed, the local symbols
UEW-8:1
Part 6. Reference information 343
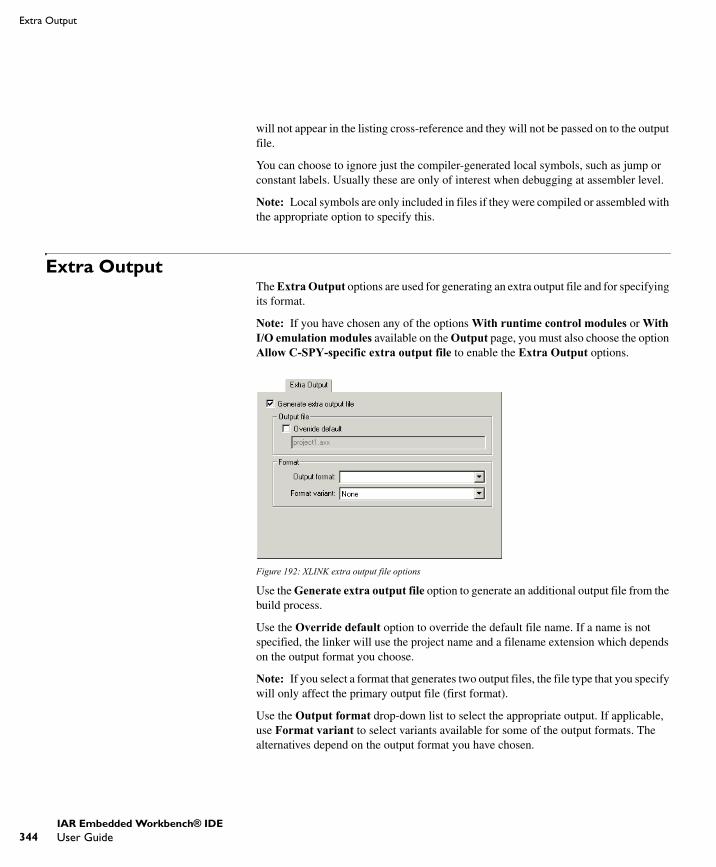
344
Extra Output
will not appear in the listing cross-reference and they will not be passed on to the output file.
You can choose to ignore just the compiler-generated local symbols, such as jump or constant labels. Usually these are only of interest when debugging at assembler level.
Note: Local symbols are only included in files if they were compiled or assembled with the appropriate option to specify this.
Extra OutputThe Extra Output options are used for generating an extra output file and for specifying its format.
Note: If you have chosen any of the options With runtime control modules or With I/O emulation modules available on the Output page, you must also choose the option Allow C-SPY-specific extra output file to enable the Extra Output options.
Figure 192: XLINK extra output file options
Use the Generate extra output file option to generate an additional output file from the build process.
Use the Override default option to override the default file name. If a name is not specified, the linker will use the project name and a filename extension which depends on the output format you choose.
Note: If you select a format that generates two output files, the file type that you specify will only affect the primary output file (first format).
Use the Output format drop-down list to select the appropriate output. If applicable, use Format variant to select variants available for some of the output formats. The alternatives depend on the output format you have chosen.
UEW-8:1
IAR Embedded Workbench® IDEUser Guide
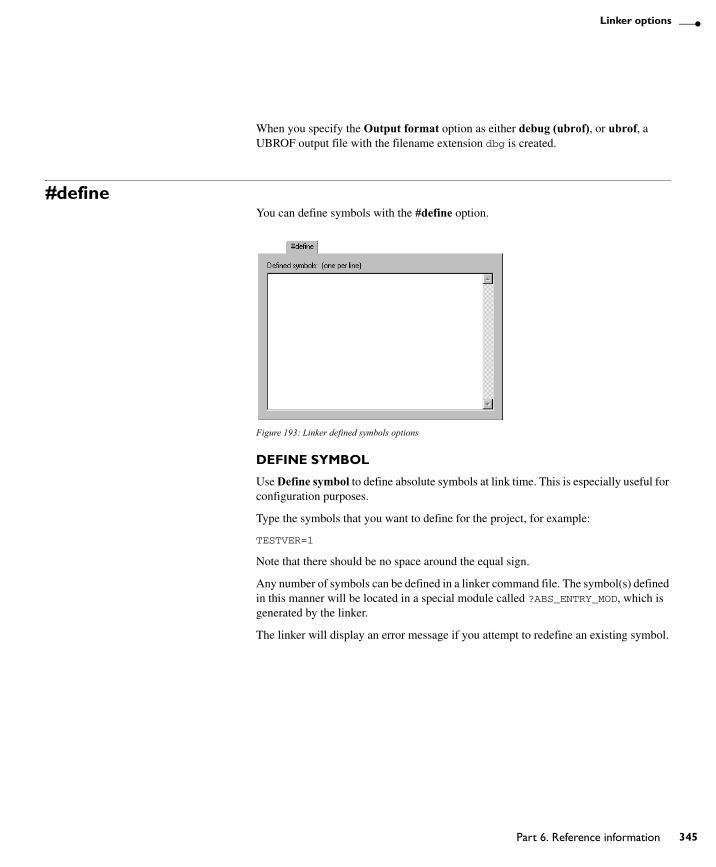
Linker options
When you specify the Output format option as either debug (ubrof), or ubrof, a UBROF output file with the filename extension dbg is created.
#defineYou can define symbols with the #define option.
Figure 193: Linker defined symbols options
DEFINE SYMBOL
Use Define symbol to define absolute symbols at link time. This is especially useful for configuration purposes.
Type the symbols that you want to define for the project, for example:
TESTVER=1
Note that there should be no space around the equal sign.
Any number of symbols can be defined in a linker command file. The symbol(s) defined in this manner will be located in a special module called ?ABS_ENTRY_MOD, which is generated by the linker.
The linker will display an error message if you attempt to redefine an existing symbol.
UEW-8:1
Part 6. Reference information 345

346
Diagnostics
DiagnosticsThe Diagnostics options determine the error and warning messages generated by the IAR XLINK Linker.
Figure 194: Linker diagnostics options
ALWAYS GENERATE OUTPUT
Use Always generate output to generate an output file even if a non-fatal error was encountered during the linking process, such as a missing global entry or a duplicate declaration. Normally, XLINK will not generate an output file if an error is encountered.
Note: XLINK always aborts on fatal errors, even when this option is used.
The Always generate output option allows missing entries to be patched in later in the absolute output image.
SEGMENT OVERLAP WARNINGS
Use Segment overlap warnings to reduce segment overlap errors to warnings, making it possible to produce cross-reference maps, etc.
NO GLOBAL TYPE CHECKING
Use No global type checking to disable type checking at link time. While a well-written application should not need this option, there might be occasions where it is helpful.
By default, XLINK performs link-time type checking between modules by comparing the external references to an entry with the PUBLIC entry (if the information exists in the object modules involved). A warning is generated if there are mismatches.
UEW-8:1
IAR Embedded Workbench® IDEUser Guide
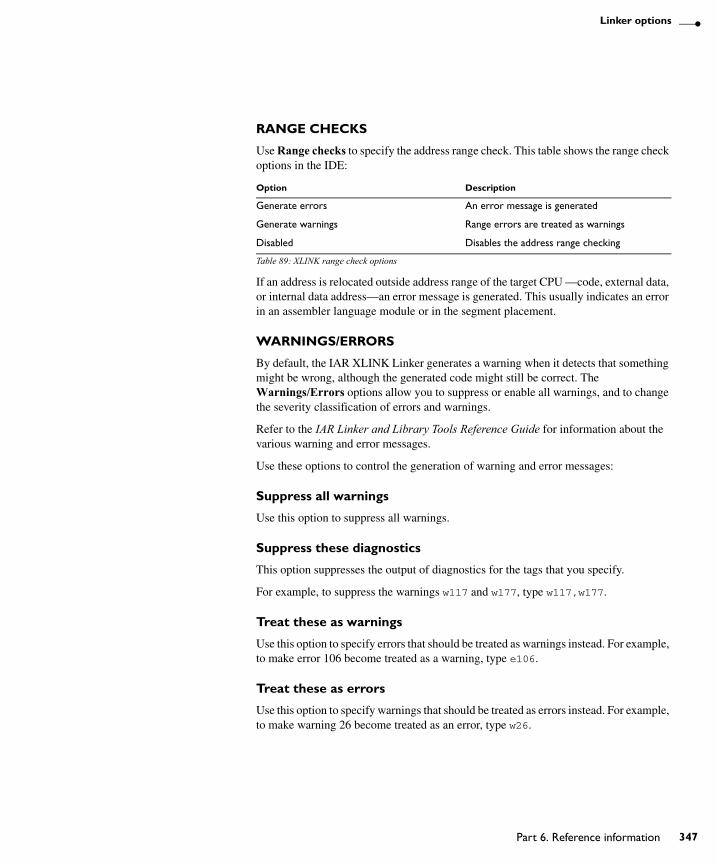
Linker options
RANGE CHECKS
Use Range checks to specify the address range check. This table shows the range check options in the IDE:
If an address is relocated outside address range of the target CPU —code, external data, or internal data address—an error message is generated. This usually indicates an error in an assembler language module or in the segment placement.
WARNINGS/ERRORS
By default, the IAR XLINK Linker generates a warning when it detects that something might be wrong, although the generated code might still be correct. The Warnings/Errors options allow you to suppress or enable all warnings, and to change the severity classification of errors and warnings.
Refer to the IAR Linker and Library Tools Reference Guide for information about the various warning and error messages.
Use these options to control the generation of warning and error messages:
Suppress all warnings
Use this option to suppress all warnings.
Suppress these diagnostics
This option suppresses the output of diagnostics for the tags that you specify.
For example, to suppress the warnings w117 and w177, type w117,w177.
Treat these as warnings
Use this option to specify errors that should be treated as warnings instead. For example, to make error 106 become treated as a warning, type e106.
Treat these as errors
Use this option to specify warnings that should be treated as errors instead. For example, to make warning 26 become treated as an error, type w26.
Option Description
Generate errors An error message is generated
Generate warnings Range errors are treated as warnings
Disabled Disables the address range checking
Table 89: XLINK range check options
UEW-8:1
Part 6. Reference information 347
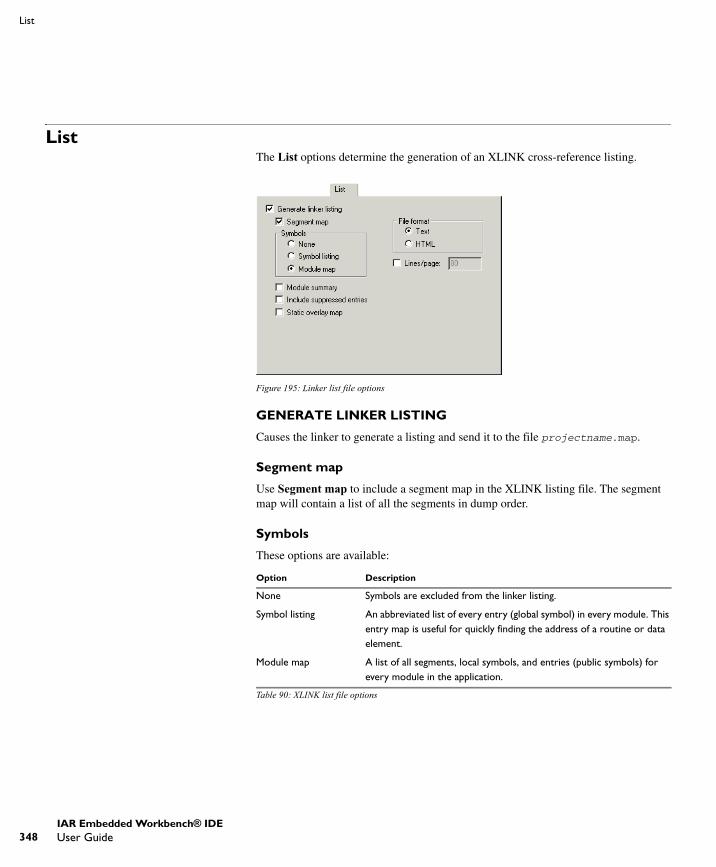
348
List
ListThe List options determine the generation of an XLINK cross-reference listing.
Figure 195: Linker list file options
GENERATE LINKER LISTING
Causes the linker to generate a listing and send it to the file projectname.map.
Segment map
Use Segment map to include a segment map in the XLINK listing file. The segment map will contain a list of all the segments in dump order.
Symbols
These options are available:
Option Description
None Symbols are excluded from the linker listing.
Symbol listing An abbreviated list of every entry (global symbol) in every module. This entry map is useful for quickly finding the address of a routine or data element.
Module map A list of all segments, local symbols, and entries (public symbols) for every module in the application.
Table 90: XLINK list file options
UEW-8:1
IAR Embedded Workbench® IDEUser Guide
Linker options
Module summary
Use the Module summary option to generate a summary of the contributions to the total memory use from each module.
Only modules with a contribution to memory use are listed.
Include suppressed entries
Use this option to include all segment parts in a linked module in the list file, not just the segment parts that were included in the output. This makes it possible to determine exactly which entries that were not needed.
Static overlay map
If the compiler uses static overlay, this option includes a listing of the static overlay system in the list file. Read more about static overlay maps in the IAR Linker and Library Tools Reference Guide.
File format
These options are available:
Lines/page
Sets the number of lines per page for the XLINK listings to lines, which must be in the range 10 to 150.
Option Description
Text Plain text file
HTML HTML format, with hyperlinks
Table 91: XLINK list file format options
UEW-8:1
Part 6. Reference information 349

350
Config
ConfigWith the Config options you can specify the path and name of the linker command file, override the default program entry, and specify the library search path.
Figure 196: Linker config options
LINKER COMMAND FILE
A default linker command file is selected automatically for the chosen Target settings in the General Options category. To override this, select the Override default option and specify an alternative file.
The argument variables $TOOLKIT_DIR$ or $PROJ_DIR$ can be used here too, to specify a project-specific or predefined linker command file.
COMMAND FILE CONFIGURATION TOOL
You can override the default linker command file and click Command file configuration tool to configure a linker command file yourself. For more information about the options related to the configuration tool, see the online help system available from the Help menu. Note that this option might not be available in your product version.
For information about the command file configuration tool, see Processing, page 352.
OVERRIDE DEFAULT PROGRAM ENTRY
By default, the program entry is the label __program_start. The linker will make sure that a module containing the program entry label is included, and that the segment part containing the label is not discarded.
UEW-8:1
IAR Embedded Workbench® IDEUser Guide
Linker options
To override the default program handling, select Override default program entry.
Selecting the option Entry label will make it possible to specify a label other than __program_start to use for the program entry.
Selecting the option Defined by application disables the use of a start label. The linker will, as always, include all program modules, and enough library modules to satisfy all symbol references, keeping all segment parts that are marked with the root attribute or that are referenced, directly or indirectly, from such a segment part.
SEARCH PATHS
The Search paths option specifies the names of the directories which XLINK will search if it fails to find the object files to be linked in the current working directory. Add the full paths of any further directories that you want XLINK to search.
The paths required by the product are specified automatically based on your choice of runtime library. If the box is left empty, XLINK searches for object files only in the current working directory.
Type the full file path of your #include files. To make your project more portable, use the argument variable $TOOLKIT_DIR$ for the subdirectories of the active product and $PROJ_DIR$ for the directory of the current project. For an overview of the argument variables, see Argument variables summary, page 237.
RAW BINARY IMAGE
Use the Raw binary image options to link pure binary files in addition to the ordinary input files. Use the text boxes to specify these parameters:
The entire contents of the file are placed in the segment you specify, which means it can only contain pure binary data, for example, the raw-binary output format. The segment part where the contents of the specified file is placed, is only included if the specified symbol is required by your application. Use the -g linker option if you want to force a reference to the symbol. Read more about single output files and the -g option in the IAR Linker and Library Tools Reference Guide.
File The pure binary file you want to link.
Symbol The symbol defined by the segment part where the binary data is placed.
Segment The segment where the binary data is placed.
Align The alignment of the segment part where the binary data is placed.
UEW-8:1
Part 6. Reference information 351
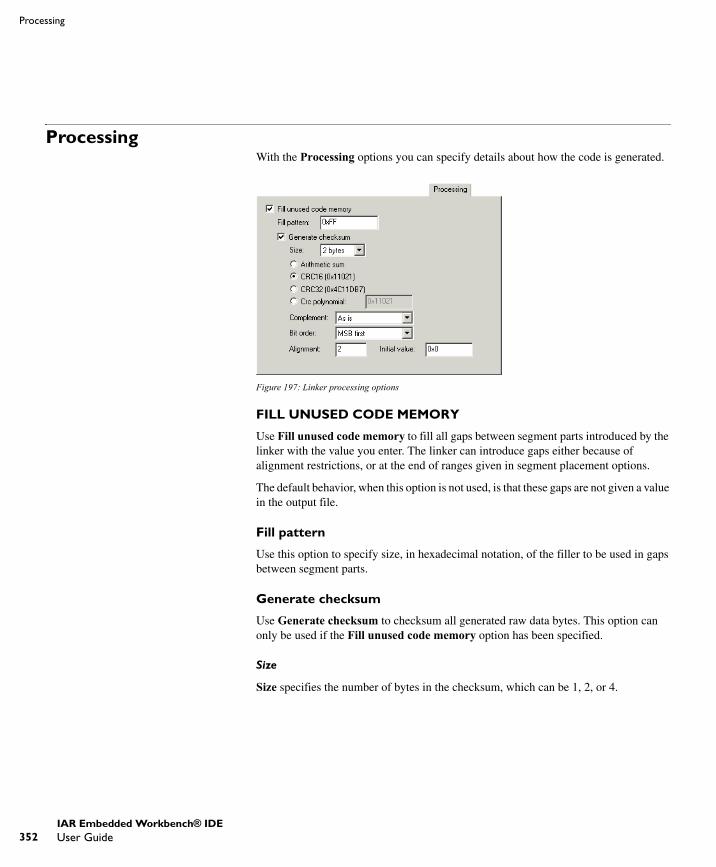
352
Processing
ProcessingWith the Processing options you can specify details about how the code is generated.
Figure 197: Linker processing options
FILL UNUSED CODE MEMORY
Use Fill unused code memory to fill all gaps between segment parts introduced by the linker with the value you enter. The linker can introduce gaps either because of alignment restrictions, or at the end of ranges given in segment placement options.
The default behavior, when this option is not used, is that these gaps are not given a value in the output file.
Fill pattern
Use this option to specify size, in hexadecimal notation, of the filler to be used in gaps between segment parts.
Generate checksum
Use Generate checksum to checksum all generated raw data bytes. This option can only be used if the Fill unused code memory option has been specified.
Size
Size specifies the number of bytes in the checksum, which can be 1, 2, or 4.
UEW-8:1
IAR Embedded Workbench® IDEUser Guide
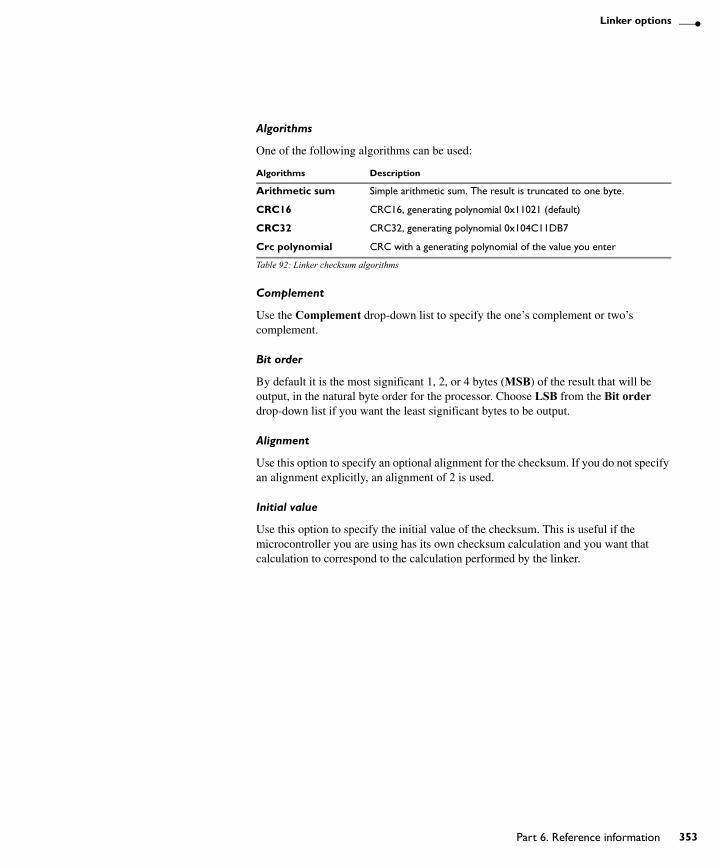
Linker options
Algorithms
One of the following algorithms can be used:
Complement
Use the Complement drop-down list to specify the one’s complement or two’s complement.
Bit order
By default it is the most significant 1, 2, or 4 bytes (MSB) of the result that will be output, in the natural byte order for the processor. Choose LSB from the Bit order drop-down list if you want the least significant bytes to be output.
Alignment
Use this option to specify an optional alignment for the checksum. If you do not specify an alignment explicitly, an alignment of 2 is used.
Initial value
Use this option to specify the initial value of the checksum. This is useful if the microcontroller you are using has its own checksum calculation and you want that calculation to correspond to the calculation performed by the linker.
Algorithms Description
Arithmetic sum Simple arithmetic sum. The result is truncated to one byte.
CRC16 CRC16, generating polynomial 0x11021 (default)
CRC32 CRC32, generating polynomial 0x104C11DB7
Crc polynomial CRC with a generating polynomial of the value you enter
Table 92: Linker checksum algorithms
UEW-8:1
Part 6. Reference information 353

354
Extra Options
Extra OptionsThe Extra Options page provides you with a command line interface to the linker.
Figure 198: Extra Options page for the linker
USE COMMAND LINE OPTIONS
Additional command line arguments for the linker (not supported by the GUI) can be specified here.
UEW-8:1
IAR Embedded Workbench® IDEUser Guide
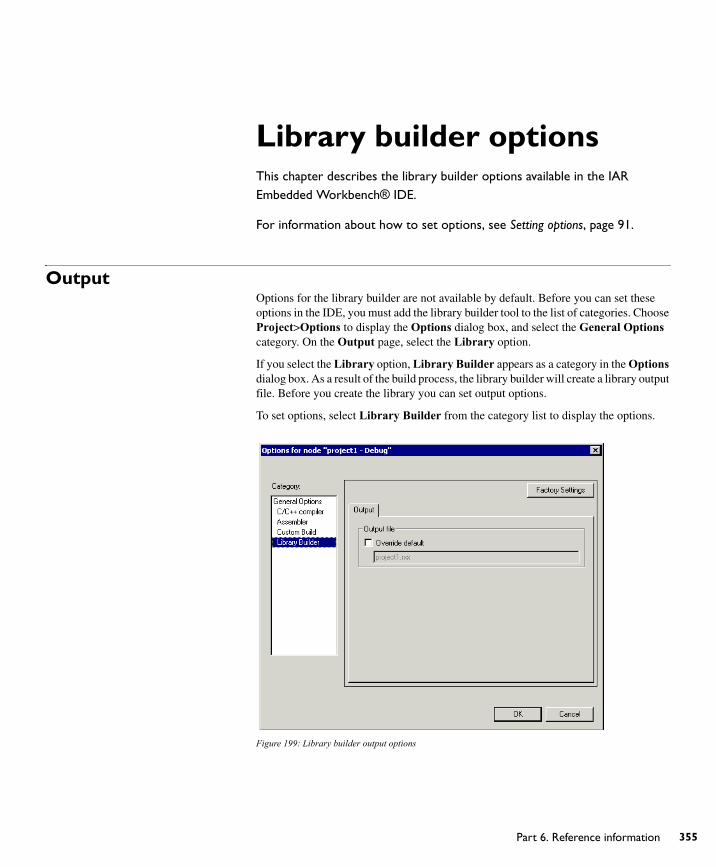
Library builder optionsThis chapter describes the library builder options available in the IAR Embedded Workbench® IDE.
For information about how to set options, see Setting options, page 91.
OutputOptions for the library builder are not available by default. Before you can set these options in the IDE, you must add the library builder tool to the list of categories. Choose Project>Options to display the Options dialog box, and select the General Options category. On the Output page, select the Library option.
If you select the Library option, Library Builder appears as a category in the Options dialog box. As a result of the build process, the library builder will create a library output file. Before you create the library you can set output options.
To set options, select Library Builder from the category list to display the options.
Figure 199: Library builder output options
UEW-8:1
Part 6. Reference information 355

356
Output
To restore all settings to the default factory settings, click the Factory Settings button.
The Output file option overrides the default name of the output file. Enter a new name in the Override default text box.
UEW-8:1
IAR Embedded Workbench® IDEUser Guide

Debugger optionsThis chapter describes the C-SPY® options available in the IAR Embedded Workbench® IDE.
For information about how to set options, see Setting options, page 91.
In addition, for information about options specific to the C-SPY hardware debugger systems, see the online help system available from the Help menu.
SetupTo set C-SPY options in the IDE, choose Project>Options to display the Options dialog box. Then select Debugger in the Category list. The Setup page contains the generic C-SPY options.
Figure 200: Generic C-SPY options
To restore all settings to the default factory settings, click the Factory Settings button.
The Setup options specify the C-SPY driver, the setup macro file, and device description file to be used, and which default source code location to run to.
DRIVER
Selects the appropriate driver for use with C-SPY, for example a simulator or an emulator.
UEW-8:1
Part 6. Reference information 357
358
Setup
Contact your distributor or IAR Systems representative, or visit the IAR Systems web site at www.iar.com for the most recent information about the available C-SPY drivers.
RUN TO
Use this option to specify a location you want C-SPY to run to when you start the debugger and after a reset.
The default location to run to is the main function. Type the name of the location if you want C-SPY to run to a different location. You can specify assembler labels or whatever can be evaluated to such, for example function names.
If the option is deselected, the program counter will contain the regular hardware reset address at each reset.
SETUP MACROS
To register the contents of a setup macro file in the C-SPY startup sequence, select Use macro file and enter the path and name of the setup file, for example SetupSimple.mac. If no extension is specified, the extension mac is assumed. A browse button is available for your convenience.
DEVICE DESCRIPTION FILE
Use this option to load a device description file that contains device-specific information.
For details about the device description file, see Selecting a device description file, page 115.
Device description files are provided in the directory cpuname\config and have the filename extension ddf.
DownloadOptions specific to the C-SPY drivers are described in the online help system available from the Help menu.
UEW-8:1
IAR Embedded Workbench® IDEUser Guide
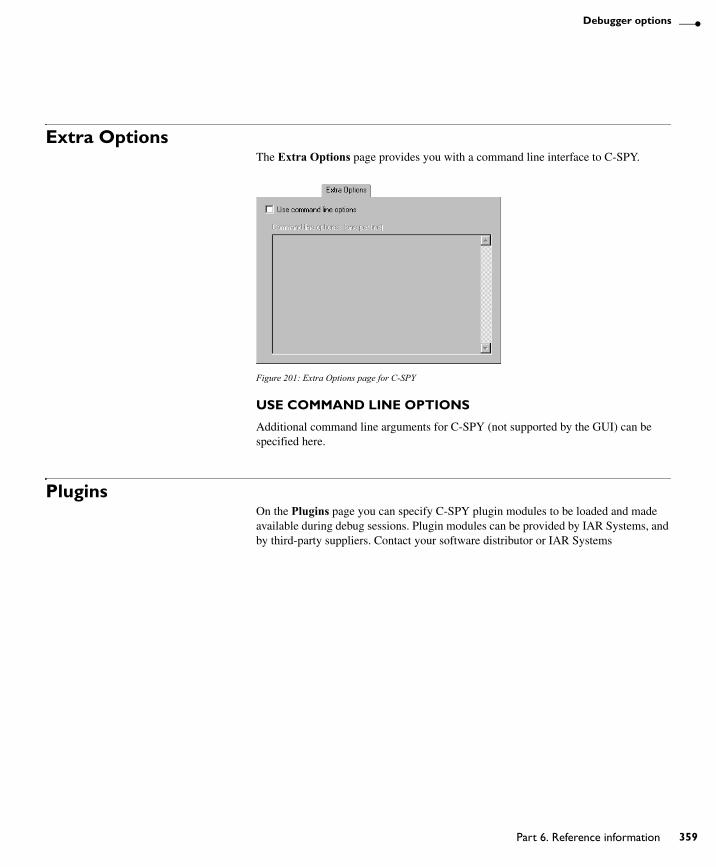
Debugger options
Extra OptionsThe Extra Options page provides you with a command line interface to C-SPY.
Figure 201: Extra Options page for C-SPY
USE COMMAND LINE OPTIONS
Additional command line arguments for C-SPY (not supported by the GUI) can be specified here.
PluginsOn the Plugins page you can specify C-SPY plugin modules to be loaded and made available during debug sessions. Plugin modules can be provided by IAR Systems, and by third-party suppliers. Contact your software distributor or IAR Systems
UEW-8:1
Part 6. Reference information 359

360
Plugins
representative, or visit the IAR Systems web site, for information about available modules.
Figure 202: C-SPY plugin options
By default, Select plugins to load lists the plugin modules delivered with the product installation.
If you have any C-SPY plugin modules delivered by any third-party vendor, these will also appear in the list.
The common\plugins directory is intended for generic plugin modules. The cpuname\plugins directory is intended for target-specific plugin modules.
UEW-8:1
IAR Embedded Workbench® IDEUser Guide
The C-SPY Command Line Utility—cspybatYou can execute the IAR C-SPY Debugger in batch mode, using the C-SPY Command Line Utility—cspybat.exe—which is described in this chapter.
Using C-SPY in batch modeYou can execute C-SPY in batch mode if you use the command line utility cspybat, installed in the directory common\bin.
INVOCATION SYNTAX
The invocation syntax for cspybat is:
cspybat processor_DLL driver_DLL debug_file [cspybat_options] --backend driver_options
Note: In those cases where a filename is required—including the DLL files—you are recommended to give a full path to the filename.
Parameters
The parameters are:
Parameter Description
processor_DLL The processor-specific DLL file; available in cpuname\bin.
driver_DLL The C-SPY driver DLL file; available in cpuname\bin.
debug_file The object file that you want to debug (filename extension dxx).
cspybat_options The command line options that you want to pass to cspybat. Note that these options are optional. For information about each option, see Descriptions of C-SPY command line options, page 364.
--backend Marks the beginning of the parameters to the C-SPY driver; all options that follow will be sent to the driver. Note that this option is mandatory.
driver_options The command line options that you want to pass to the C-SPY driver. Note that some of these options are mandatory and some are optional. For information about each option, see Descriptions of C-SPY command line options, page 364.
Table 93: cspybat parameters
UEW-8:1
Part 6. Reference information 361
362
Using C-SPY in batch mode
Example
This example starts cspybat using the simulator driver:
EW_DIR\common\bin\cspybat EW_DIR\cpuname\bin\cpunameproc.dll EW_DIR\cpuname\bin\cpunamesim.dll PROJ_DIR\myproject.dxx --plugin EW_DIR\cpuname\bin\cpunamebat.dll --backend -d sim -B -p EW_DIR\cpuname\bin\config\devicedescription.ddf
where EW_DIR is the full path of the directory where you have installed IAR Embedded Workbench
and where PROJ_DIR is the path of your project directory.
For a complete example, see the online help system available from the Help menu, alternatively the file HelpCPUNAMEIDE2.chm available in the cpuname\doc directory.
OUTPUT
When you run cspybat, these types of output can be produced:
● Terminal output from cspybat itself
All such terminal output is directed to stderr. Note that if you run cspybat from the command line without any arguments, the cspybat version number and all available options including brief descriptions are directed to stdout and displayed on your screen.
● Terminal output from the application you are debugging
All such terminal output is directed to stdout.
● Error return codes
cspybat return status information to the host operating system that can be tested in a batch file. For successful, the value int 0 is returned, and for unsuccessful the value int 1 is returned.
USING AN AUTOMATICALLY GENERATED BATCH FILE
When you use C-SPY in the IDE, C-SPY generates a batch file projectname.cspy.bat every time C-SPY is initialized. You can find the file in the directory $PROJ_DIR$\settings. This batch file contains the same settings as in the IDE, and with minimal modifications, you can use it from the command line to start cspybat. The file also contains information about required modifications.
UEW-8:1
IAR Embedded Workbench® IDEUser Guide
The C-SPY Command Line Utility—cspybat
C-SPY command line optionsGENERAL CSPYBAT OPTIONS
OPTIONS AVAILABLE FOR ALL C-SPY DRIVERS
Note that there might be additional target-specific options available. For a list of available options, see the online help system available from the Help menu, alternatively the file HelpCPUNAMEIDE2.chm available in the cpuname\doc directory.
OPTIONS AVAILABLE FOR THE SIMULATOR DRIVER
For a list of available options, see the online help system available from the Help menu, alternatively the file HelpCPUNAMEIDE2.chm available in the cpuname\doc directory.
OPTIONS AVAILABLE FOR THE C-SPY HARDWARE DRIVER
For a list of available options, see the online help system available from the Help menu, alternatively the HelpCPUNAMEHW.chm file available in the cpuname\doc directory.
--backend Marks the beginning of the parameters to be sent to the C-SPY driver (mandatory).
--cycles Specifies the maximum number of cycles to run.
--flash_loader Specifies a flash loader specification XML file. Applies only to product packages that support flash loaders.
--macro Specifies a macro file to be used.
--plugin Specifies a plugin file to be used.
--silent Omits the sign-on message.
-B Enables batch mode (mandatory).
-d Specifies the C-SPY driver to be used.
-p Specifies the device description file to be used.
--mapu Activates memory access checking.
UEW-8:1
Part 6. Reference information 363
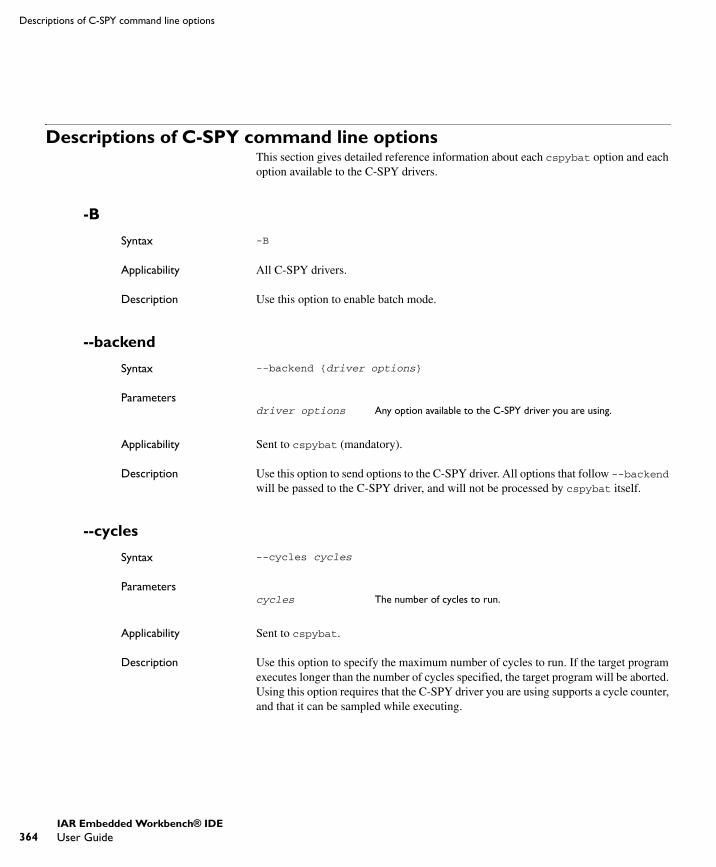
364
Descriptions of C-SPY command line options
Descriptions of C-SPY command line optionsThis section gives detailed reference information about each cspybat option and each option available to the C-SPY drivers.
-B
Syntax -B
Applicability All C-SPY drivers.
Description Use this option to enable batch mode.
--backend
Syntax --backend {driver options}
Parameters
Applicability Sent to cspybat (mandatory).
Description Use this option to send options to the C-SPY driver. All options that follow --backend will be passed to the C-SPY driver, and will not be processed by cspybat itself.
--cycles
Syntax --cycles cycles
Parameters
Applicability Sent to cspybat.
Description Use this option to specify the maximum number of cycles to run. If the target program executes longer than the number of cycles specified, the target program will be aborted. Using this option requires that the C-SPY driver you are using supports a cycle counter, and that it can be sampled while executing.
driver options Any option available to the C-SPY driver you are using.
cycles The number of cycles to run.
UEW-8:1
IAR Embedded Workbench® IDEUser Guide
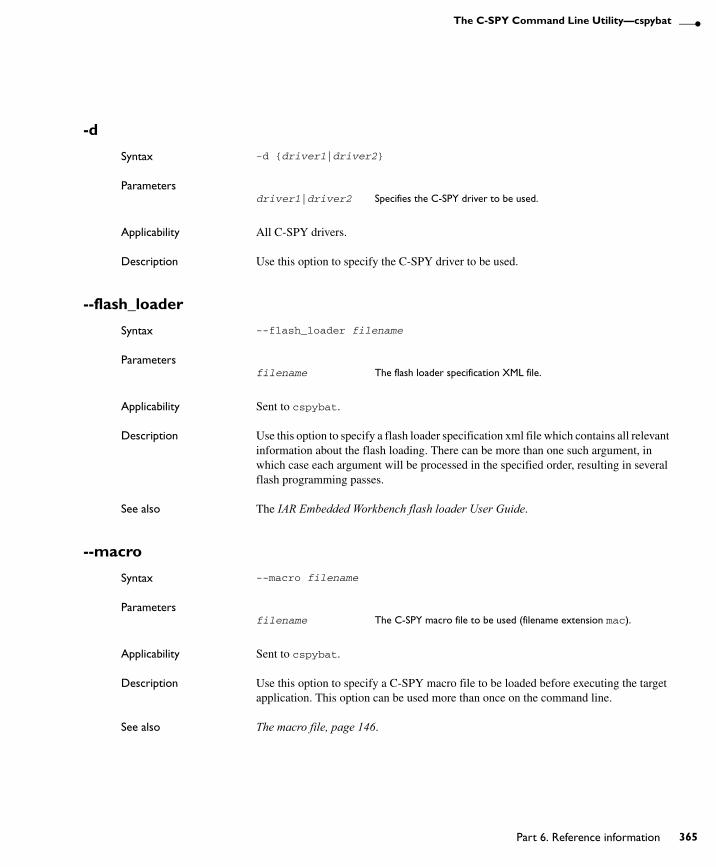
The C-SPY Command Line Utility—cspybat
-d
Syntax -d {driver1|driver2}
Parameters
Applicability All C-SPY drivers.
Description Use this option to specify the C-SPY driver to be used.
--flash_loader
Syntax --flash_loader filename
Parameters
Applicability Sent to cspybat.
Description Use this option to specify a flash loader specification xml file which contains all relevant information about the flash loading. There can be more than one such argument, in which case each argument will be processed in the specified order, resulting in several flash programming passes.
See also The IAR Embedded Workbench flash loader User Guide.
--macro
Syntax --macro filename
Parameters
Applicability Sent to cspybat.
Description Use this option to specify a C-SPY macro file to be loaded before executing the target application. This option can be used more than once on the command line.
See also The macro file, page 146.
driver1|driver2 Specifies the C-SPY driver to be used.
filename The flash loader specification XML file.
filename The C-SPY macro file to be used (filename extension mac).
UEW-8:1
Part 6. Reference information 365
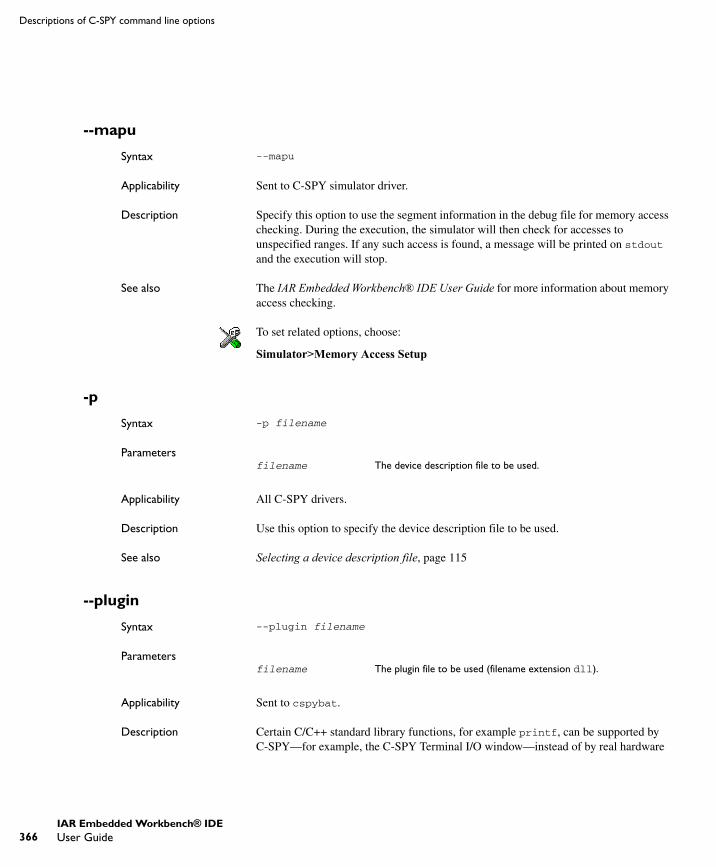
366
Descriptions of C-SPY command line options
--mapu
Syntax --mapu
Applicability Sent to C-SPY simulator driver.
Description Specify this option to use the segment information in the debug file for memory access checking. During the execution, the simulator will then check for accesses to unspecified ranges. If any such access is found, a message will be printed on stdout and the execution will stop.
See also The IAR Embedded Workbench® IDE User Guide for more information about memory access checking.
To set related options, choose:
Simulator>Memory Access Setup
-p
Syntax -p filename
Parameters
Applicability All C-SPY drivers.
Description Use this option to specify the device description file to be used.
See also Selecting a device description file, page 115
--plugin
Syntax --plugin filename
Parameters
Applicability Sent to cspybat.
Description Certain C/C++ standard library functions, for example printf, can be supported by C-SPY—for example, the C-SPY Terminal I/O window—instead of by real hardware
filename The device description file to be used.
filename The plugin file to be used (filename extension dll).
UEW-8:1
IAR Embedded Workbench® IDEUser Guide
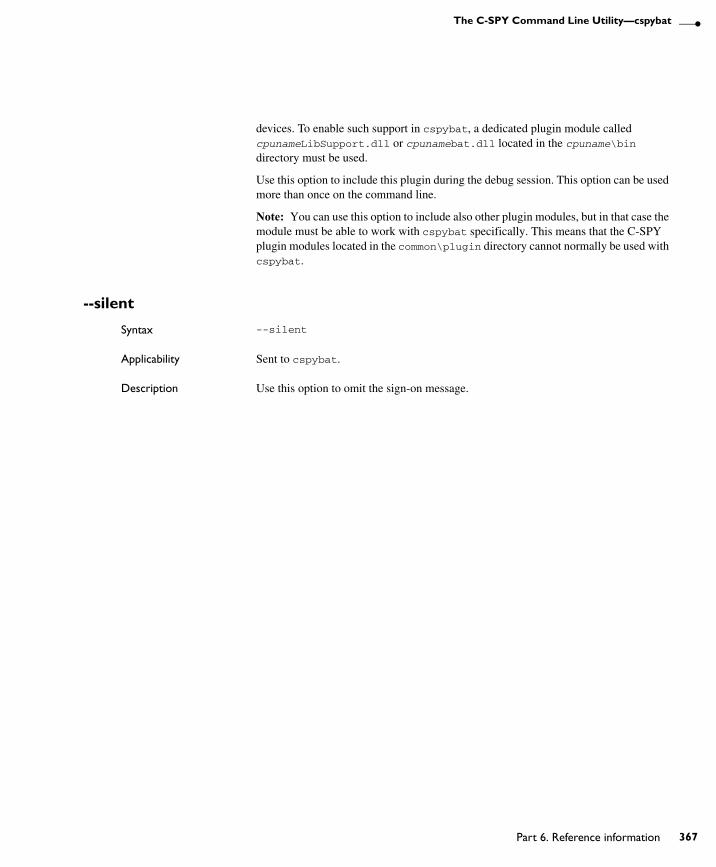
The C-SPY Command Line Utility—cspybat
devices. To enable such support in cspybat, a dedicated plugin module called cpunameLibSupport.dll or cpunamebat.dll located in the cpuname\bin directory must be used.
Use this option to include this plugin during the debug session. This option can be used more than once on the command line.
Note: You can use this option to include also other plugin modules, but in that case the module must be able to work with cspybat specifically. This means that the C-SPY plugin modules located in the common\plugin directory cannot normally be used with cspybat.
--silent
Syntax --silent
Applicability Sent to cspybat.
Description Use this option to omit the sign-on message.
UEW-8:1
Part 6. Reference information 367

368
Descriptions of C-SPY command line options
UEW-8:1
IAR Embedded Workbench® IDEUser Guide

C-SPY® macros referenceThis chapter gives reference information about the C-SPY macros. First a syntax description of the macro language is provided. Then, the available setup macro functions and the pre-defined system macros are summarized. Finally, each system macro is described in detail.
The macro languageThe syntax of the macro language is very similar to the C language. There are macro statements, which are similar to C statements. You can define macro functions, with or without parameters and return value. You can use built-in system macros, similar to C library functions. Finally, you can define global and local macro variables. You can collect your macro functions in a macro file (filename extension mac).
MACRO FUNCTIONS
C-SPY macro functions consist of C-SPY variable definitions and macro statements which are executed when the macro is called. An unlimited number of parameters can be passed to a macro function, and macro functions can return a value on exit.
A C-SPY macro has this form:
macroName (parameterList){ macroBody}
where parameterList is a list of macro parameters separated by commas, and macroBody is any series of C-SPY variable definitions and C-SPY statements.
Type checking is neither performed on the values passed to the macro functions nor on the return value.
PREDEFINED SYSTEM MACRO FUNCTIONS
The macro language also includes a wide set of predefined system macro functions (built-in functions), similar to C library functions. For detailed information about each system macro, see Description of C-SPY system macros, page 376.
UEW-8:1
Part 6. Reference information 369
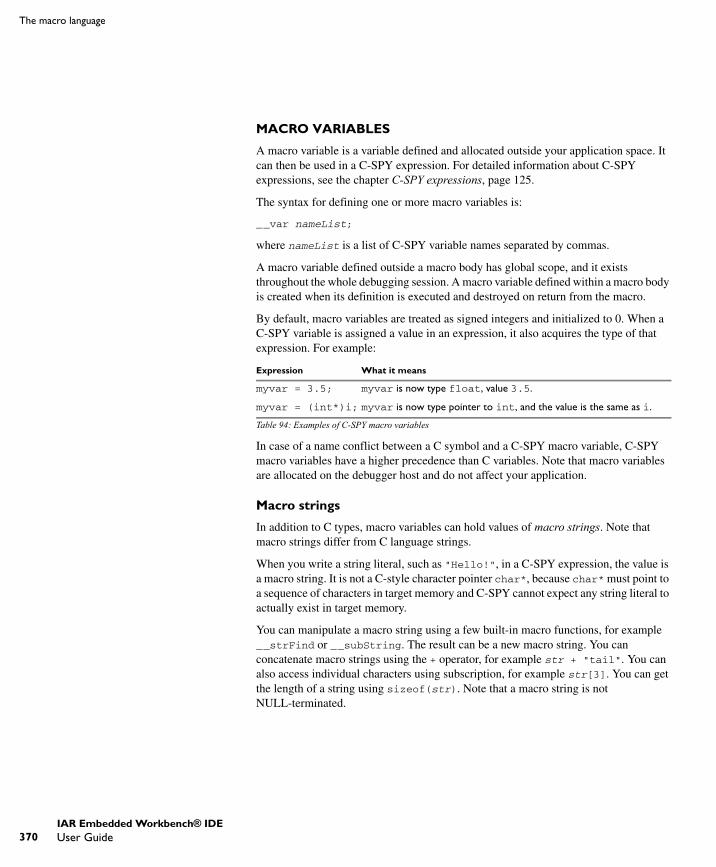
370
The macro language
MACRO VARIABLES
A macro variable is a variable defined and allocated outside your application space. It can then be used in a C-SPY expression. For detailed information about C-SPY expressions, see the chapter C-SPY expressions, page 125.
The syntax for defining one or more macro variables is:
__var nameList;
where nameList is a list of C-SPY variable names separated by commas.
A macro variable defined outside a macro body has global scope, and it exists throughout the whole debugging session. A macro variable defined within a macro body is created when its definition is executed and destroyed on return from the macro.
By default, macro variables are treated as signed integers and initialized to 0. When a C-SPY variable is assigned a value in an expression, it also acquires the type of that expression. For example:
In case of a name conflict between a C symbol and a C-SPY macro variable, C-SPY macro variables have a higher precedence than C variables. Note that macro variables are allocated on the debugger host and do not affect your application.
Macro strings
In addition to C types, macro variables can hold values of macro strings. Note that macro strings differ from C language strings.
When you write a string literal, such as "Hello!", in a C-SPY expression, the value is a macro string. It is not a C-style character pointer char*, because char* must point to a sequence of characters in target memory and C-SPY cannot expect any string literal to actually exist in target memory.
You can manipulate a macro string using a few built-in macro functions, for example __strFind or __subString. The result can be a new macro string. You can concatenate macro strings using the + operator, for example str + "tail". You can also access individual characters using subscription, for example str[3]. You can get the length of a string using sizeof(str). Note that a macro string is not NULL-terminated.
Expression What it means
myvar = 3.5; myvar is now type float, value 3.5.
myvar = (int*)i; myvar is now type pointer to int, and the value is the same as i.
Table 94: Examples of C-SPY macro variables
UEW-8:1
IAR Embedded Workbench® IDEUser Guide

C-SPY® macros reference
The macro function __toString is used for converting from a NULL-terminated C string in your application (char* or char[]) to a macro string. For example, assume this definition of a C string in your application:
char const *cstr = "Hello";
Then examine these examples:
__var str; /* A macro variable */str = cstr /* str is now just a pointer to char */sizeof str /* same as sizeof (char*), typically 2 or 4 */str = __toString(cstr,512) /* str is now a macro string */sizeof str /* 5, the length of the string */str[1] /* 101, the ASCII code for 'e' */str += " World!" /* str is now "Hello World!" */
See also Formatted output, page 372.
MACRO STATEMENTS
Statements are expected to behave in the same way as the corresponding C statements would do. The following C-SPY macro statements are accepted:
Expressions
expression;
For detailed information about C-SPY expressions, see C-SPY expressions, page 125.
Conditional statements
if (expression) statement
if (expression) statementelse statement
Loop statements
for (init_expression; cond_expression; update_expression) statement
while (expression) statement
do statement
UEW-8:1
Part 6. Reference information 371
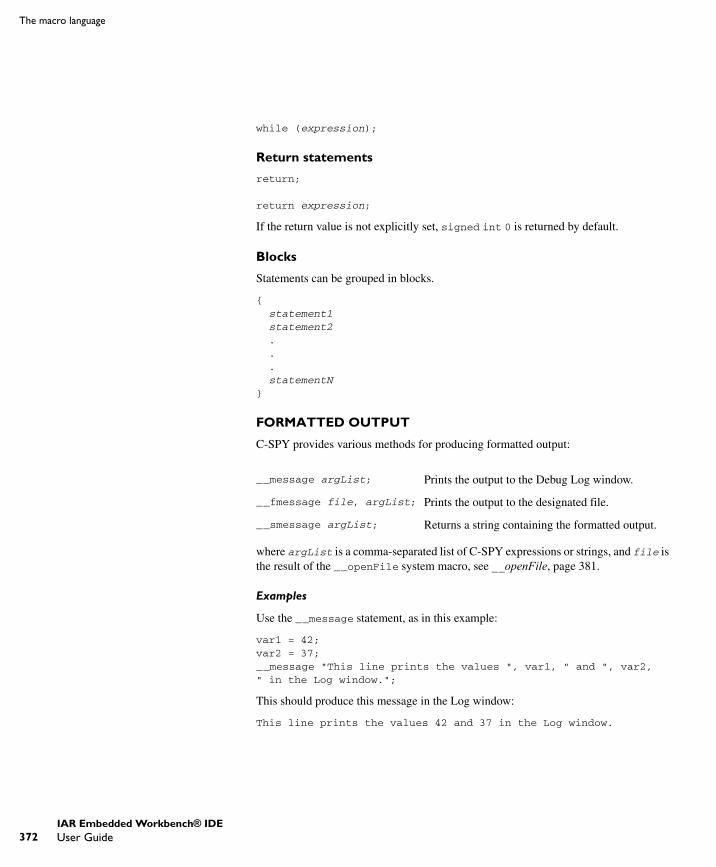
372
The macro language
while (expression);
Return statements
return;
return expression;
If the return value is not explicitly set, signed int 0 is returned by default.
Blocks
Statements can be grouped in blocks.
{ statement1 statement2 . . . statementN}
FORMATTED OUTPUT
C-SPY provides various methods for producing formatted output:
where argList is a comma-separated list of C-SPY expressions or strings, and file is the result of the __openFile system macro, see __openFile, page 381.
Examples
Use the __message statement, as in this example:
var1 = 42;var2 = 37;__message "This line prints the values ", var1, " and ", var2, " in the Log window.";
This should produce this message in the Log window:
This line prints the values 42 and 37 in the Log window.
__message argList; Prints the output to the Debug Log window.
__fmessage file, argList; Prints the output to the designated file.
__smessage argList; Returns a string containing the formatted output.
UEW-8:1
IAR Embedded Workbench® IDEUser Guide
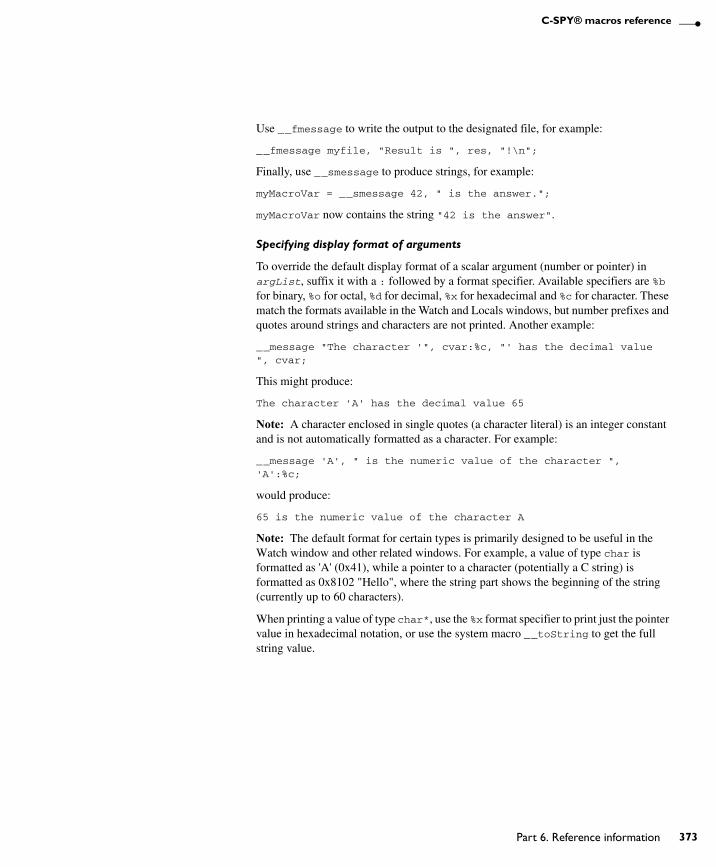
C-SPY® macros reference
Use __fmessage to write the output to the designated file, for example:
__fmessage myfile, "Result is ", res, "!\n";
Finally, use __smessage to produce strings, for example:
myMacroVar = __smessage 42, " is the answer.";
myMacroVar now contains the string "42 is the answer".
Specifying display format of arguments
To override the default display format of a scalar argument (number or pointer) in argList, suffix it with a : followed by a format specifier. Available specifiers are %b for binary, %o for octal, %d for decimal, %x for hexadecimal and %c for character. These match the formats available in the Watch and Locals windows, but number prefixes and quotes around strings and characters are not printed. Another example:
__message "The character '", cvar:%c, "' has the decimal value ", cvar;
This might produce:
The character 'A' has the decimal value 65
Note: A character enclosed in single quotes (a character literal) is an integer constant and is not automatically formatted as a character. For example:
__message 'A', " is the numeric value of the character ", 'A':%c;
would produce:
65 is the numeric value of the character A
Note: The default format for certain types is primarily designed to be useful in the Watch window and other related windows. For example, a value of type char is formatted as 'A' (0x41), while a pointer to a character (potentially a C string) is formatted as 0x8102 "Hello", where the string part shows the beginning of the string (currently up to 60 characters).
When printing a value of type char*, use the %x format specifier to print just the pointer value in hexadecimal notation, or use the system macro __toString to get the full string value.
UEW-8:1
Part 6. Reference information 373
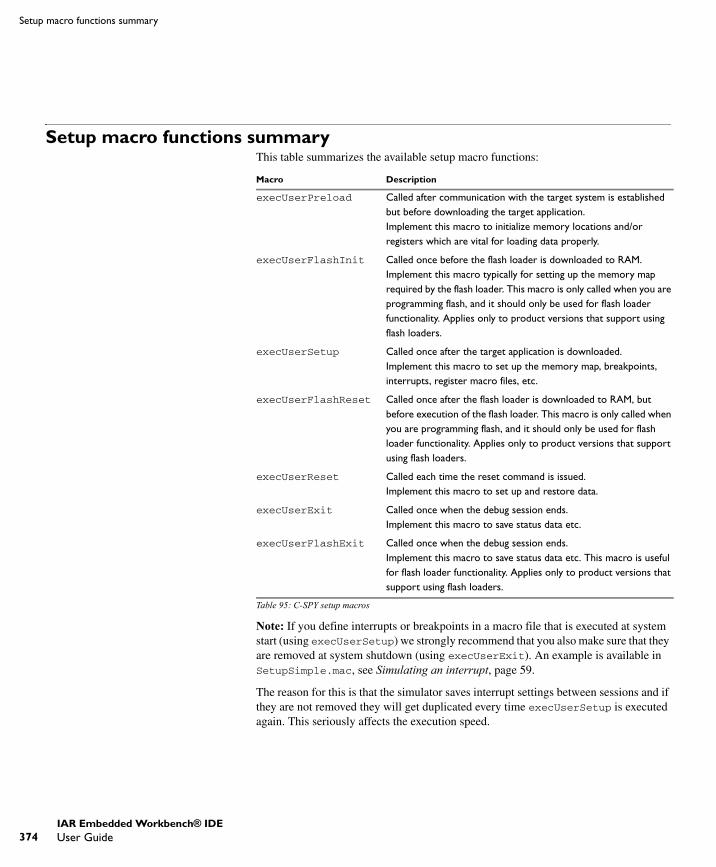
374
Setup macro functions summary
Setup macro functions summaryThis table summarizes the available setup macro functions:
Note: If you define interrupts or breakpoints in a macro file that is executed at system start (using execUserSetup) we strongly recommend that you also make sure that they are removed at system shutdown (using execUserExit). An example is available in SetupSimple.mac, see Simulating an interrupt, page 59.
The reason for this is that the simulator saves interrupt settings between sessions and if they are not removed they will get duplicated every time execUserSetup is executed again. This seriously affects the execution speed.
Macro Description
execUserPreload Called after communication with the target system is established but before downloading the target application. Implement this macro to initialize memory locations and/or registers which are vital for loading data properly.
execUserFlashInit Called once before the flash loader is downloaded to RAM. Implement this macro typically for setting up the memory map required by the flash loader. This macro is only called when you are programming flash, and it should only be used for flash loader functionality. Applies only to product versions that support using flash loaders.
execUserSetup Called once after the target application is downloaded.Implement this macro to set up the memory map, breakpoints, interrupts, register macro files, etc.
execUserFlashReset Called once after the flash loader is downloaded to RAM, but before execution of the flash loader. This macro is only called when you are programming flash, and it should only be used for flash loader functionality. Applies only to product versions that support using flash loaders.
execUserReset Called each time the reset command is issued.Implement this macro to set up and restore data.
execUserExit Called once when the debug session ends. Implement this macro to save status data etc.
execUserFlashExit Called once when the debug session ends. Implement this macro to save status data etc. This macro is useful for flash loader functionality. Applies only to product versions that support using flash loaders.
Table 95: C-SPY setup macros
UEW-8:1
IAR Embedded Workbench® IDEUser Guide
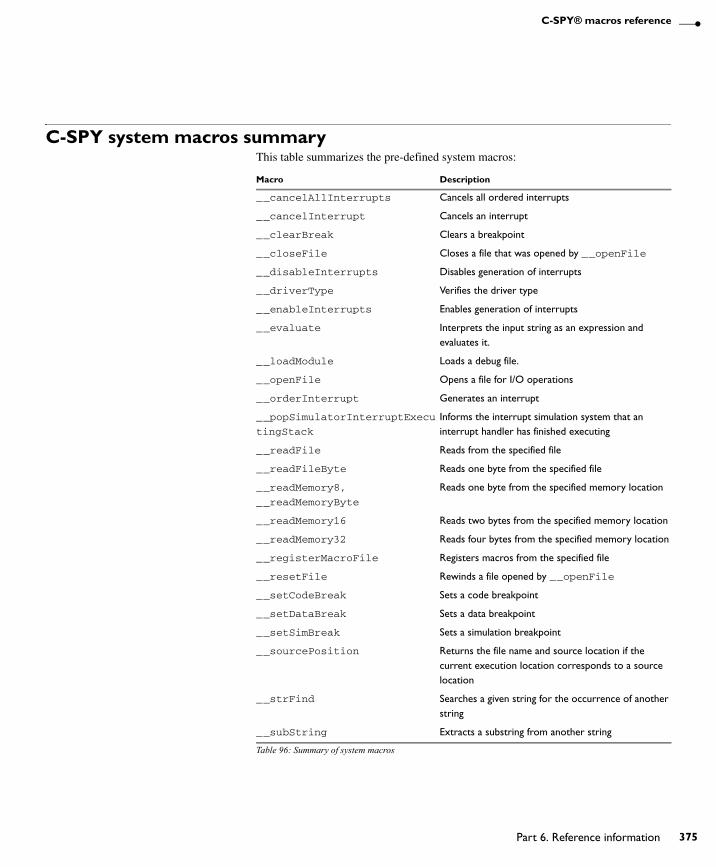
C-SPY® macros reference
C-SPY system macros summaryThis table summarizes the pre-defined system macros:
Macro Description
__cancelAllInterrupts Cancels all ordered interrupts
__cancelInterrupt Cancels an interrupt
__clearBreak Clears a breakpoint
__closeFile Closes a file that was opened by __openFile
__disableInterrupts Disables generation of interrupts
__driverType Verifies the driver type
__enableInterrupts Enables generation of interrupts
__evaluate Interprets the input string as an expression and evaluates it.
__loadModule Loads a debug file.
__openFile Opens a file for I/O operations
__orderInterrupt Generates an interrupt
__popSimulatorInterruptExecu
tingStack
Informs the interrupt simulation system that an interrupt handler has finished executing
__readFile Reads from the specified file
__readFileByte Reads one byte from the specified file
__readMemory8,
__readMemoryByte
Reads one byte from the specified memory location
__readMemory16 Reads two bytes from the specified memory location
__readMemory32 Reads four bytes from the specified memory location
__registerMacroFile Registers macros from the specified file
__resetFile Rewinds a file opened by __openFile
__setCodeBreak Sets a code breakpoint
__setDataBreak Sets a data breakpoint
__setSimBreak Sets a simulation breakpoint
__sourcePosition Returns the file name and source location if the current execution location corresponds to a source location
__strFind Searches a given string for the occurrence of another string
__subString Extracts a substring from another string
Table 96: Summary of system macros
UEW-8:1
Part 6. Reference information 375
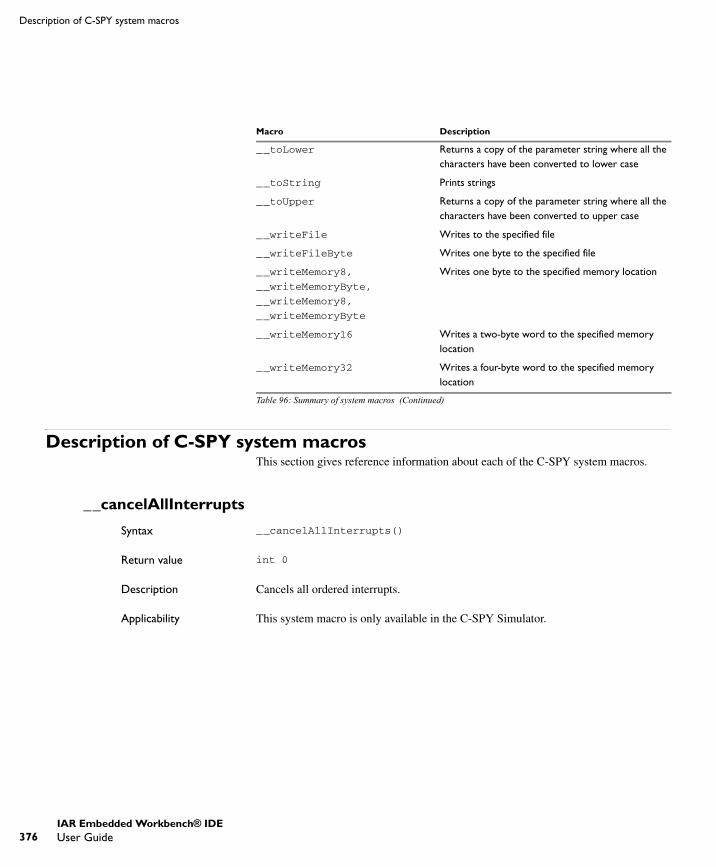
376
Description of C-SPY system macros
Description of C-SPY system macrosThis section gives reference information about each of the C-SPY system macros.
__cancelAllInterrupts
Syntax __cancelAllInterrupts()
Return value int 0
Description Cancels all ordered interrupts.
Applicability This system macro is only available in the C-SPY Simulator.
__toLower Returns a copy of the parameter string where all the characters have been converted to lower case
__toString Prints strings
__toUpper Returns a copy of the parameter string where all the characters have been converted to upper case
__writeFile Writes to the specified file
__writeFileByte Writes one byte to the specified file
__writeMemory8,
__writeMemoryByte,
__writeMemory8,
__writeMemoryByte
Writes one byte to the specified memory location
__writeMemory16 Writes a two-byte word to the specified memory location
__writeMemory32 Writes a four-byte word to the specified memory location
Macro Description
Table 96: Summary of system macros (Continued)
UEW-8:1
IAR Embedded Workbench® IDEUser Guide

C-SPY® macros reference
__cancelInterrupt
Syntax __cancelInterrupt(interrupt_id)
Parameter
Return value
Description Cancels the specified interrupt.
Applicability This system macro is only available in the C-SPY Simulator.
__clearBreak
Syntax __clearBreak(break_id)
Parameter
Return value int 0
Description Clears a user-defined breakpoint.
See also Defining breakpoints, page 133.
__closeFile
Syntax __closeFile(filehandle)
Parameter
Return value int 0
Description Closes a file previously opened by __openFile.
interrupt_id The value returned by the corresponding __orderInterrupt macro call (unsigned long)
Result Value
Successful int 0
Unsuccessful Non-zero error number
Table 97: __cancelInterrupt return values
break_id The value returned by any of the set breakpoint macros
filehandle The macro variable used as filehandle by the __openFile macro
UEW-8:1
Part 6. Reference information 377
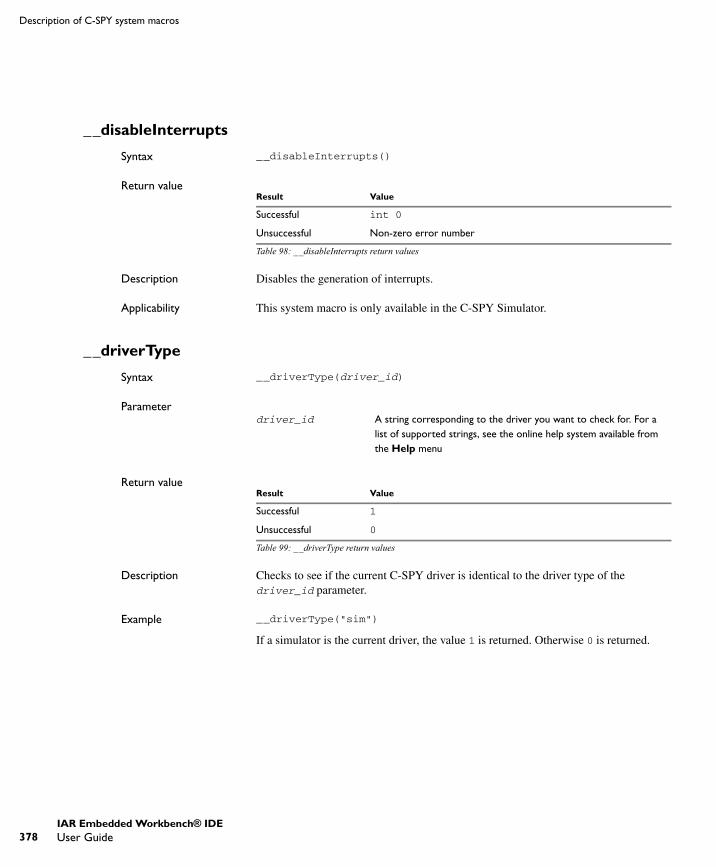
378
Description of C-SPY system macros
__disableInterrupts
Syntax __disableInterrupts()
Return value
Description Disables the generation of interrupts.
Applicability This system macro is only available in the C-SPY Simulator.
__driverType
Syntax __driverType(driver_id)
Parameter
Return value
Description Checks to see if the current C-SPY driver is identical to the driver type of the driver_id parameter.
Example __driverType("sim")
If a simulator is the current driver, the value 1 is returned. Otherwise 0 is returned.
Result Value
Successful int 0
Unsuccessful Non-zero error number
Table 98: __disableInterrupts return values
driver_id A string corresponding to the driver you want to check for. For a list of supported strings, see the online help system available from the Help menu
Result Value
Successful 1
Unsuccessful 0
Table 99: __driverType return values
UEW-8:1
IAR Embedded Workbench® IDEUser Guide
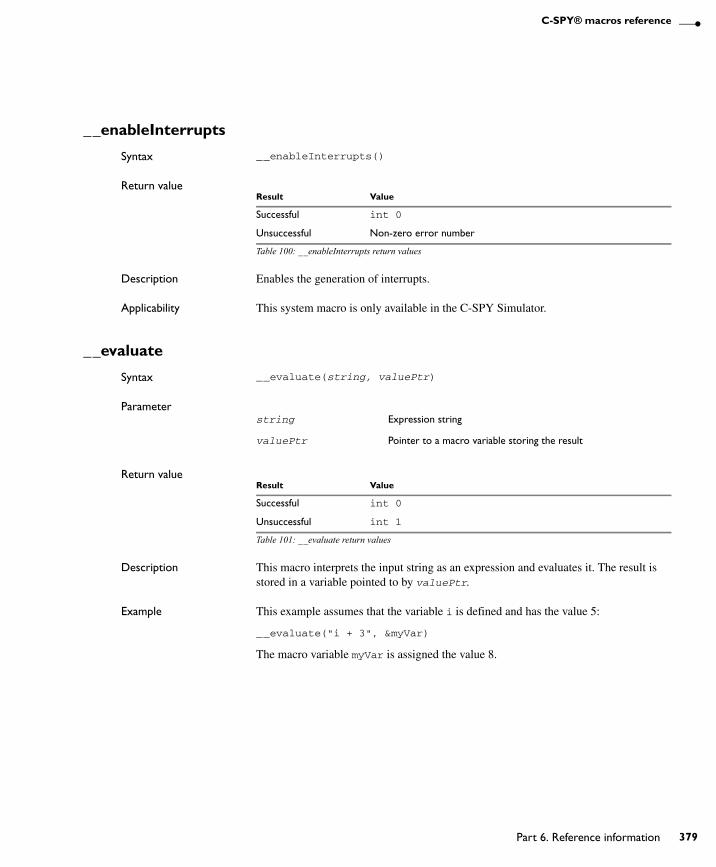
C-SPY® macros reference
__enableInterrupts
Syntax __enableInterrupts()
Return value
Description Enables the generation of interrupts.
Applicability This system macro is only available in the C-SPY Simulator.
__evaluate
Syntax __evaluate(string, valuePtr)
Parameter
Return value
Description This macro interprets the input string as an expression and evaluates it. The result is stored in a variable pointed to by valuePtr.
Example This example assumes that the variable i is defined and has the value 5:
__evaluate("i + 3", &myVar)
The macro variable myVar is assigned the value 8.
Result Value
Successful int 0
Unsuccessful Non-zero error number
Table 100: __enableInterrupts return values
string Expression string
valuePtr Pointer to a macro variable storing the result
Result Value
Successful int 0
Unsuccessful int 1
Table 101: __evaluate return values
UEW-8:1
Part 6. Reference information 379
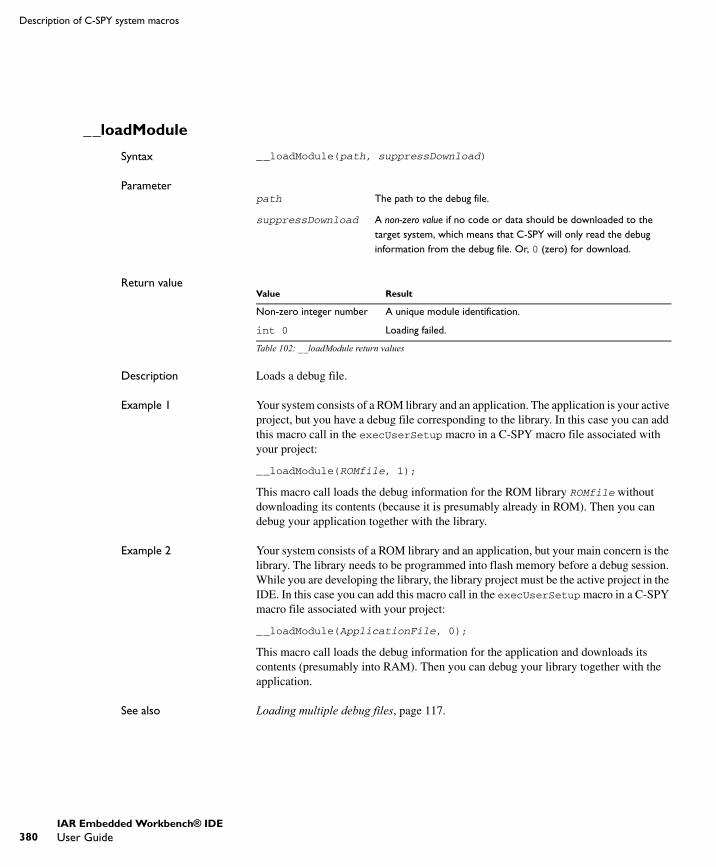
380
Description of C-SPY system macros
__loadModule
Syntax __loadModule(path, suppressDownload)
Parameter
Return value
Description Loads a debug file.
Example 1 Your system consists of a ROM library and an application. The application is your active project, but you have a debug file corresponding to the library. In this case you can add this macro call in the execUserSetup macro in a C-SPY macro file associated with your project:
__loadModule(ROMfile, 1);
This macro call loads the debug information for the ROM library ROMfile without downloading its contents (because it is presumably already in ROM). Then you can debug your application together with the library.
Example 2 Your system consists of a ROM library and an application, but your main concern is the library. The library needs to be programmed into flash memory before a debug session. While you are developing the library, the library project must be the active project in the IDE. In this case you can add this macro call in the execUserSetup macro in a C-SPY macro file associated with your project:
__loadModule(ApplicationFile, 0);
This macro call loads the debug information for the application and downloads its contents (presumably into RAM). Then you can debug your library together with the application.
See also Loading multiple debug files, page 117.
path The path to the debug file.
suppressDownload A non-zero value if no code or data should be downloaded to the target system, which means that C-SPY will only read the debug information from the debug file. Or, 0 (zero) for download.
Value Result
Non-zero integer number A unique module identification.
int 0 Loading failed.
Table 102: __loadModule return values
UEW-8:1
IAR Embedded Workbench® IDEUser Guide

C-SPY® macros reference
__openFile
Syntax __openFile(file, access)
Parameters
Return value
Description Opens a file for I/O operations. The default base directory of this macro is where the currently open project file (*.pew or *.prj) is located. The argument to __openFile can specify a location relative to this directory. In addition, you can use argument variables such as $PROJ_DIR$ and $TOOLKIT_DIR$ in the path argument.
Example __var filehandle; /* The macro variable to contain */ /* the file handle */filehandle = __openFile("Debug\\Exe\\test.tst", "r");if (filehandle){ /* successful opening */}
See also Argument variables summary, page 237.
file The filename as a string
access The access type (string).These are mandatory but mutually exclusive:"a" append, new data will be appended at the end of the open file"r" read"w" writeThese are optional and mutually exclusive:"b" binary, opens the file in binary mode"t" ASCII text, opens the file in text modeThis access type is optional:"+" together with r, w, or a; r+ or w+ is read and write, while a+ is read and append
Result Value
Successful The file handle
Unsuccessful An invalid file handle, which tests as False
Table 103: __openFile return values
UEW-8:1
Part 6. Reference information 381
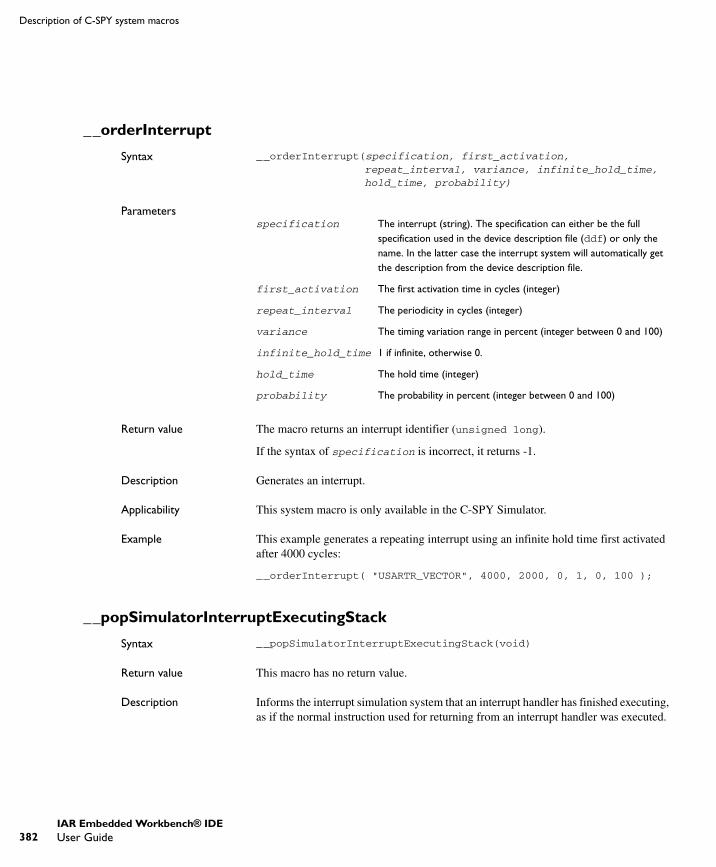
382
Description of C-SPY system macros
__orderInterrupt
Syntax __orderInterrupt(specification, first_activation, repeat_interval, variance, infinite_hold_time, hold_time, probability)
Parameters
Return value The macro returns an interrupt identifier (unsigned long).
If the syntax of specification is incorrect, it returns -1.
Description Generates an interrupt.
Applicability This system macro is only available in the C-SPY Simulator.
Example This example generates a repeating interrupt using an infinite hold time first activated after 4000 cycles:
__orderInterrupt( "USARTR_VECTOR", 4000, 2000, 0, 1, 0, 100 );
__popSimulatorInterruptExecutingStack
Syntax __popSimulatorInterruptExecutingStack(void)
Return value This macro has no return value.
Description Informs the interrupt simulation system that an interrupt handler has finished executing, as if the normal instruction used for returning from an interrupt handler was executed.
specification The interrupt (string). The specification can either be the full specification used in the device description file (ddf) or only the name. In the latter case the interrupt system will automatically get the description from the device description file.
first_activation The first activation time in cycles (integer)
repeat_interval The periodicity in cycles (integer)
variance The timing variation range in percent (integer between 0 and 100)
infinite_hold_time 1 if infinite, otherwise 0.
hold_time The hold time (integer)
probability The probability in percent (integer between 0 and 100)
UEW-8:1
IAR Embedded Workbench® IDEUser Guide
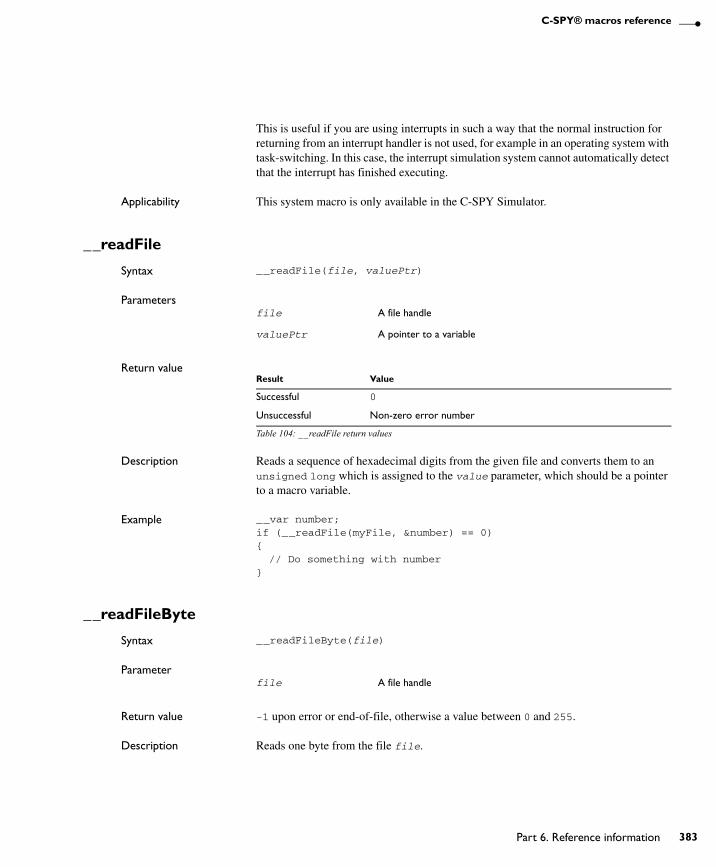
C-SPY® macros reference
This is useful if you are using interrupts in such a way that the normal instruction for returning from an interrupt handler is not used, for example in an operating system with task-switching. In this case, the interrupt simulation system cannot automatically detect that the interrupt has finished executing.
Applicability This system macro is only available in the C-SPY Simulator.
__readFile
Syntax __readFile(file, valuePtr)
Parameters
Return value
Description Reads a sequence of hexadecimal digits from the given file and converts them to an unsigned long which is assigned to the value parameter, which should be a pointer to a macro variable.
Example __var number;if (__readFile(myFile, &number) == 0){ // Do something with number}
__readFileByte
Syntax __readFileByte(file)
Parameter
Return value -1 upon error or end-of-file, otherwise a value between 0 and 255.
Description Reads one byte from the file file.
file A file handle
valuePtr A pointer to a variable
Result Value
Successful 0
Unsuccessful Non-zero error number
Table 104: __readFile return values
file A file handle
UEW-8:1
Part 6. Reference information 383
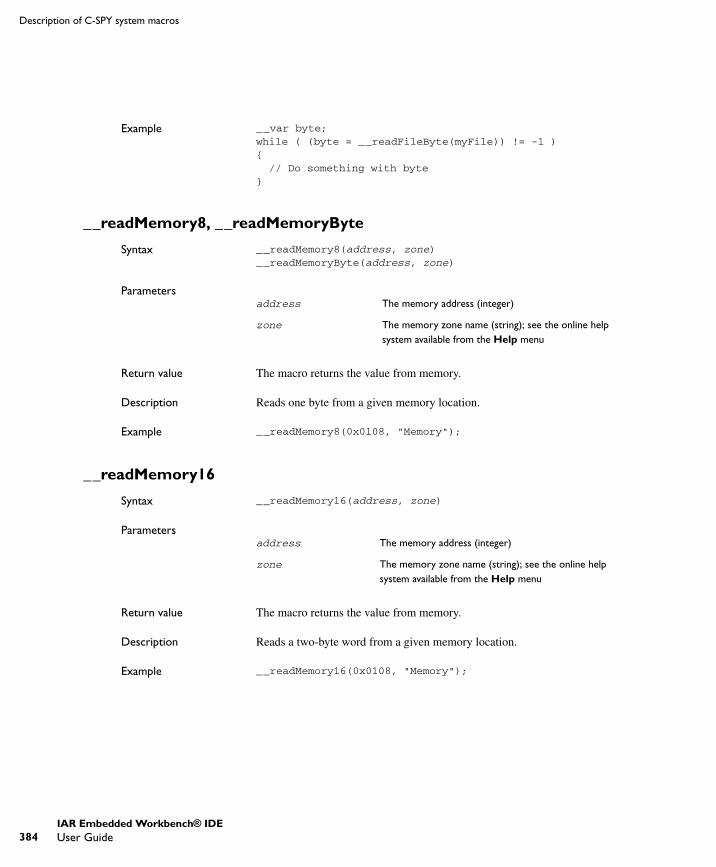
384
Description of C-SPY system macros
Example __var byte;while ( (byte = __readFileByte(myFile)) != -1 ){ // Do something with byte}
__readMemory8, __readMemoryByte
Syntax __readMemory8(address, zone)__readMemoryByte(address, zone)
Parameters
Return value The macro returns the value from memory.
Description Reads one byte from a given memory location.
Example __readMemory8(0x0108, "Memory");
__readMemory16
Syntax __readMemory16(address, zone)
Parameters
Return value The macro returns the value from memory.
Description Reads a two-byte word from a given memory location.
Example __readMemory16(0x0108, "Memory");
address The memory address (integer)
zone The memory zone name (string); see the online help system available from the Help menu
address The memory address (integer)
zone The memory zone name (string); see the online help system available from the Help menu
UEW-8:1
IAR Embedded Workbench® IDEUser Guide

C-SPY® macros reference
__readMemory32
Syntax __readMemory32(address, zone)
Parameters
Return value The macro returns the value from memory.
Description Reads a four-byte word from a given memory location.
Example __readMemory32(0x0108, "Memory");
__registerMacroFile
Syntax __registerMacroFile(filename)
Parameter
Return value int 0
Description Registers macros from a setup macro file. With this function you can register multiple macro files during C-SPY startup.
Example __registerMacroFile("c:\\testdir\\macro.mac");
See also Registering and executing using setup macros and setup files, page 149.
__resetFile
Syntax __resetFile(filehandle)
Parameter
Return value int 0
address The memory address (integer)
zone The memory zone name (string); see the online help system available from the Help menu
filename A file containing the macros to be registered (string)
filehandle The macro variable used as filehandle by the __openFile macro
UEW-8:1
Part 6. Reference information 385
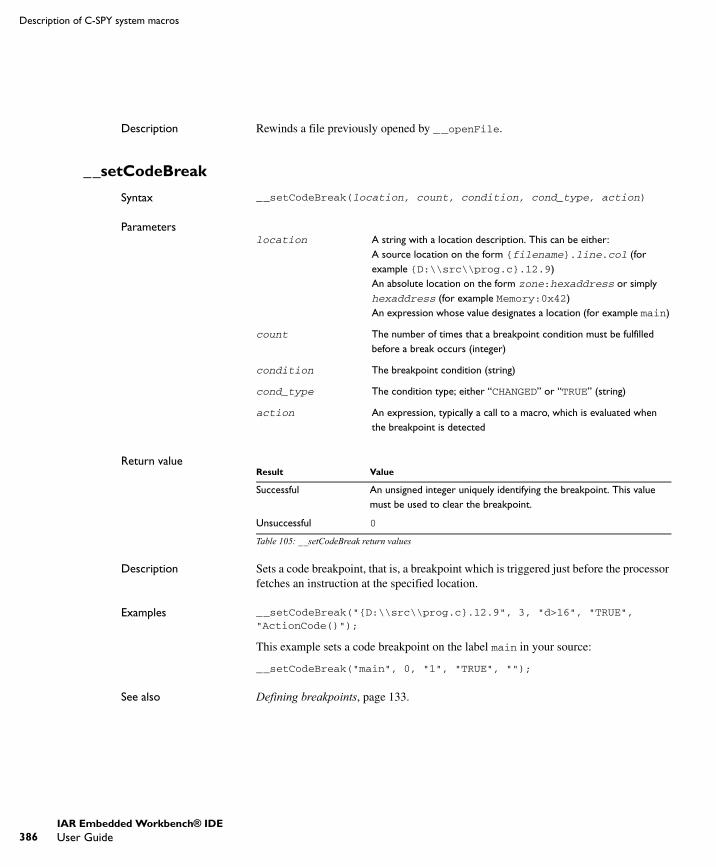
386
Description of C-SPY system macros
Description Rewinds a file previously opened by __openFile.
__setCodeBreak
Syntax __setCodeBreak(location, count, condition, cond_type, action)
Parameters
Return value
Description Sets a code breakpoint, that is, a breakpoint which is triggered just before the processor fetches an instruction at the specified location.
Examples __setCodeBreak("{D:\\src\\prog.c}.12.9", 3, "d>16", "TRUE", "ActionCode()");
This example sets a code breakpoint on the label main in your source:
__setCodeBreak("main", 0, "1", "TRUE", "");
See also Defining breakpoints, page 133.
location A string with a location description. This can be either:A source location on the form {filename}.line.col (for example {D:\\src\\prog.c}.12.9)An absolute location on the form zone:hexaddress or simply hexaddress (for example Memory:0x42)An expression whose value designates a location (for example main)
count The number of times that a breakpoint condition must be fulfilled before a break occurs (integer)
condition The breakpoint condition (string)
cond_type The condition type; either “CHANGED” or “TRUE” (string)
action An expression, typically a call to a macro, which is evaluated when the breakpoint is detected
Result Value
Successful An unsigned integer uniquely identifying the breakpoint. This value must be used to clear the breakpoint.
Unsuccessful 0
Table 105: __setCodeBreak return values
UEW-8:1
IAR Embedded Workbench® IDEUser Guide

C-SPY® macros reference
__setDataBreak
Syntax __setDataBreak(location, count, condition, cond_type, access, action)
Parameters
Return value
Description Sets a data breakpoint, that is, a breakpoint which is triggered directly after the processor has read or written data at the specified location.
Applicability This system macro is only available in the C-SPY Simulator.
Example __var brk;brk = __setDataBreak("Memory:0x4710", 3, "d>6", "TRUE", "W", "ActionData()");...
location A string with a location description. This can be either:A source location on the form {filename}.line.col (for example {D:\\src\\prog.c}.12.9), although this is not very useful for data breakpoints
An absolute location on the form zone:hexaddress or simply hexaddress (for example Memory:0x42)
An expression whose value designates a location (for example my_global_variable).
count The number of times that a breakpoint condition must be fulfilled before a break occurs (integer)
condition The breakpoint condition (string)
cond_type The condition type; either “CHANGED” or “TRUE” (string)
access The memory access type: "R" for read, "W" for write, or "RW" for read/write
action An expression, typically a call to a macro, which is evaluated when the breakpoint is detected
Result Value
Successful An unsigned integer uniquely identifying the breakpoint. This value must be used to clear the breakpoint.
Unsuccessful 0
Table 106: __setDataBreak return values
UEW-8:1
Part 6. Reference information 387

388
Description of C-SPY system macros
__clearBreak(brk);
See also Defining breakpoints, page 133.
__setSimBreak
Syntax __setSimBreak(location, access, action)
Parameters
Return value
Description Use this system macro to set immediate breakpoints, which will halt instruction execution only temporarily. This allows a C-SPY macro function to be called when the processor is about to read data from a location or immediately after it has written data. Instruction execution will resume after the action.
This type of breakpoint is useful for simulating memory-mapped devices of various kinds (for instance serial ports and timers). When the processor reads at a memory-mapped location, a C-SPY macro function can intervene and supply the appropriate data. Conversely, when the processor writes to a memory-mapped location, a C-SPY macro function can act on the value that was written.
Applicability This system macro is only available in the C-SPY Simulator.
location A string with a location description. This can be either:A source location on the form {filename}.line.col (for example {D:\\src\\prog.c}.12.9), although this is not very useful for simulation breakpoints.An absolute location on the form zone:hexaddress or simply hexaddress (for example Memory:0xE01E).An expression whose value designates a location (for example my_global_variable).
access The memory access type: "R" for read or "W" for write
action An expression, typically a call to a macro function, which is evaluated when the breakpoint is detected
Result Value
Successful An unsigned integer uniquely identifying the breakpoint. This value must be used to clear the breakpoint.
Unsuccessful 0
Table 107: __setSimBreak return values
UEW-8:1
IAR Embedded Workbench® IDEUser Guide
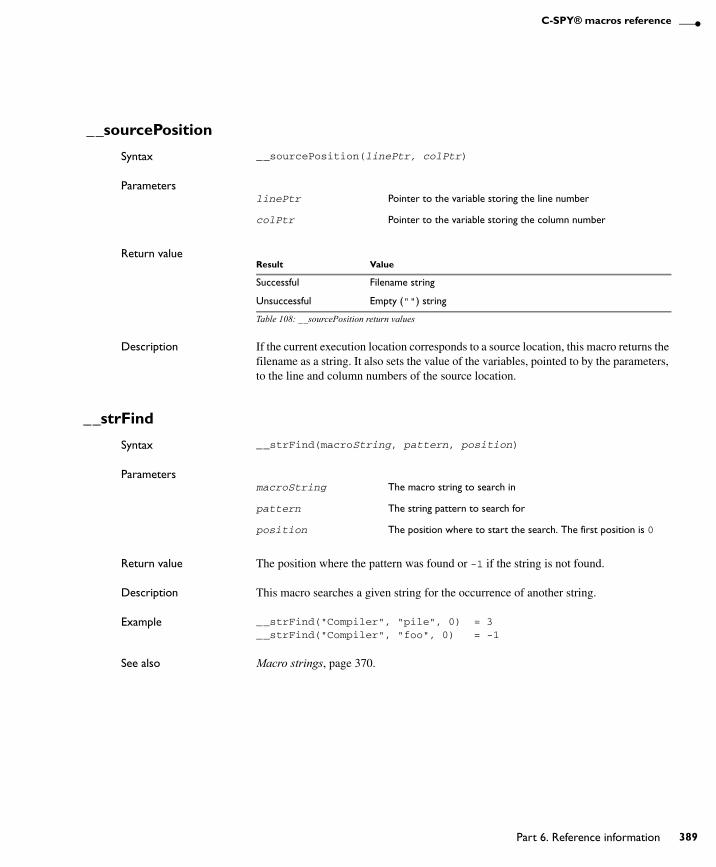
C-SPY® macros reference
__sourcePosition
Syntax __sourcePosition(linePtr, colPtr)
Parameters
Return value
Description If the current execution location corresponds to a source location, this macro returns the filename as a string. It also sets the value of the variables, pointed to by the parameters, to the line and column numbers of the source location.
__strFind
Syntax __strFind(macroString, pattern, position)
Parameters
Return value The position where the pattern was found or -1 if the string is not found.
Description This macro searches a given string for the occurrence of another string.
Example __strFind("Compiler", "pile", 0) = 3__strFind("Compiler", "foo", 0) = -1
See also Macro strings, page 370.
linePtr Pointer to the variable storing the line number
colPtr Pointer to the variable storing the column number
Result Value
Successful Filename string
Unsuccessful Empty ("") string
Table 108: __sourcePosition return values
macroString The macro string to search in
pattern The string pattern to search for
position The position where to start the search. The first position is 0
UEW-8:1
Part 6. Reference information 389
390
Description of C-SPY system macros
__subString
Syntax __subString(macroString, position, length)
Parameters
Return value A substring extracted from the given macro string.
Description This macro extracts a substring from another string.
Example __subString("Compiler", 0, 2)
The resulting macro string contains Co.
__subString("Compiler", 3, 4)
The resulting macro string contains pile.
See also Macro strings, page 370.
__toLower
Syntax __toLower(macroString)
Parameter macroString is any macro string.
Return value The converted macro string.
Description This macro returns a copy of the parameter string where all the characters have been converted to lower case.
Example __toLower("IAR")
The resulting macro string contains iar.
__toLower("Mix42")
The resulting macro string contains mix42.
See also Macro strings, page 370.
macroString The macro string from which to extract a substring
position The start position of the substring. The first position is 0.
length The length of the substring
UEW-8:1
IAR Embedded Workbench® IDEUser Guide
C-SPY® macros reference
__toString
Syntax __toString(C_string, maxlength)
Parameter
Return value Macro string.
Description This macro is used for converting C strings (char* or char[]) into macro strings.
Example Assuming your application contains this definition:
char const * hptr = "Hello World!";
this macro call:
__toString(hptr, 5)
would return the macro string containing Hello.
See also Macro strings, page 370.
__toUpper
Syntax __toUpper(macroString)
Parameter macroString is any macro string.
Return value The converted string.
Description This macro returns a copy of the parameter macroString where all the characters have been converted to upper case.
Example __toUpper("string")
The resulting macro string contains STRING.
See also Macro strings, page 370.
string Any null-terminated C string
maxlength The maximum length of the returned macro string
UEW-8:1
Part 6. Reference information 391
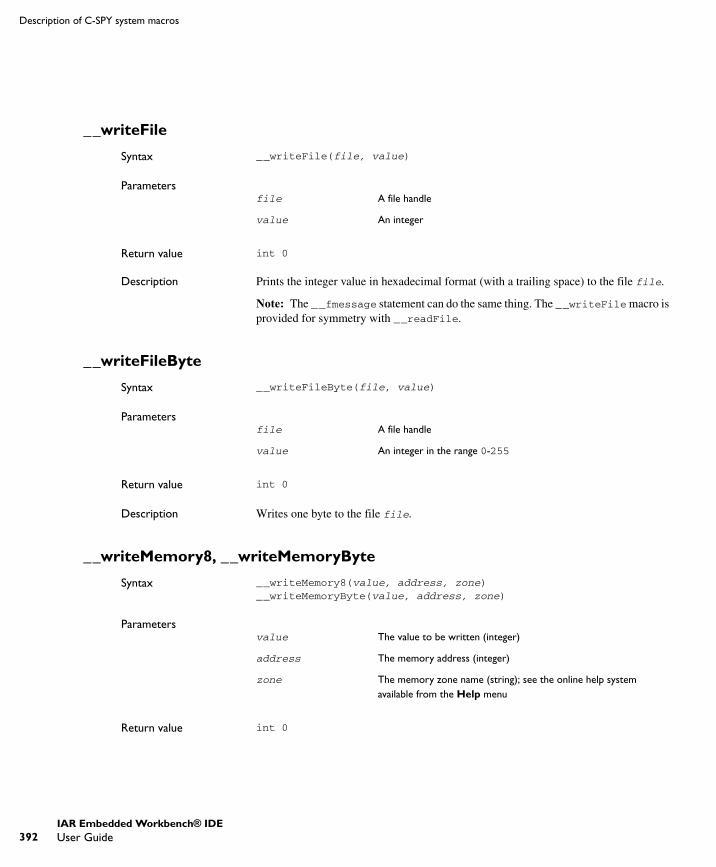
392
Description of C-SPY system macros
__writeFile
Syntax __writeFile(file, value)
Parameters
Return value int 0
Description Prints the integer value in hexadecimal format (with a trailing space) to the file file.
Note: The __fmessage statement can do the same thing. The __writeFile macro is provided for symmetry with __readFile.
__writeFileByte
Syntax __writeFileByte(file, value)
Parameters
Return value int 0
Description Writes one byte to the file file.
__writeMemory8, __writeMemoryByte
Syntax __writeMemory8(value, address, zone)__writeMemoryByte(value, address, zone)
Parameters
Return value int 0
file A file handle
value An integer
file A file handle
value An integer in the range 0-255
value The value to be written (integer)
address The memory address (integer)
zone The memory zone name (string); see the online help system available from the Help menu
UEW-8:1
IAR Embedded Workbench® IDEUser Guide
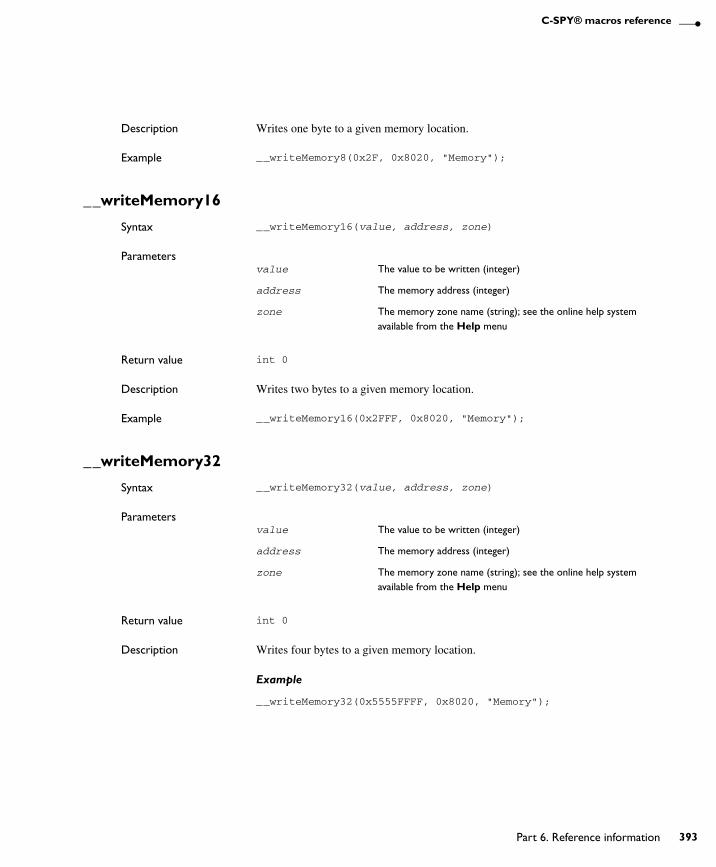
C-SPY® macros reference
Description Writes one byte to a given memory location.
Example __writeMemory8(0x2F, 0x8020, "Memory");
__writeMemory16
Syntax __writeMemory16(value, address, zone)
Parameters
Return value int 0
Description Writes two bytes to a given memory location.
Example __writeMemory16(0x2FFF, 0x8020, "Memory");
__writeMemory32
Syntax __writeMemory32(value, address, zone)
Parameters
Return value int 0
Description Writes four bytes to a given memory location.
Example
__writeMemory32(0x5555FFFF, 0x8020, "Memory");
value The value to be written (integer)
address The memory address (integer)
zone The memory zone name (string); see the online help system available from the Help menu
value The value to be written (integer)
address The memory address (integer)
zone The memory zone name (string); see the online help system available from the Help menu
UEW-8:1
Part 6. Reference information 393

394
Description of C-SPY system macros
UEW-8:1
IAR Embedded Workbench® IDEUser Guide
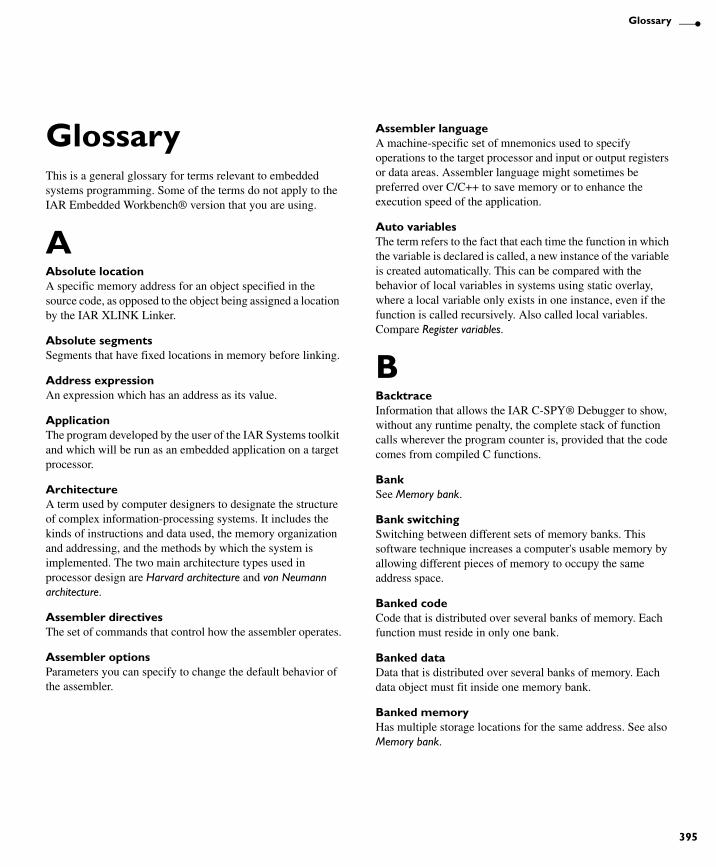
Glossary
GlossaryThis is a general glossary for terms relevant to embedded systems programming. Some of the terms do not apply to the IAR Embedded Workbench® version that you are using.
A Absolute locationA specific memory address for an object specified in the source code, as opposed to the object being assigned a location by the IAR XLINK Linker.
Absolute segmentsSegments that have fixed locations in memory before linking.
Address expressionAn expression which has an address as its value.
ApplicationThe program developed by the user of the IAR Systems toolkit and which will be run as an embedded application on a target processor.
ArchitectureA term used by computer designers to designate the structure of complex information-processing systems. It includes the kinds of instructions and data used, the memory organization and addressing, and the methods by which the system is implemented. The two main architecture types used in processor design are Harvard architecture and von Neumann architecture.
Assembler directivesThe set of commands that control how the assembler operates.
Assembler optionsParameters you can specify to change the default behavior of the assembler.
Assembler languageA machine-specific set of mnemonics used to specify operations to the target processor and input or output registers or data areas. Assembler language might sometimes be preferred over C/C++ to save memory or to enhance the execution speed of the application.
Auto variablesThe term refers to the fact that each time the function in which the variable is declared is called, a new instance of the variable is created automatically. This can be compared with the behavior of local variables in systems using static overlay, where a local variable only exists in one instance, even if the function is called recursively. Also called local variables. Compare Register variables.
BBacktraceInformation that allows the IAR C-SPY® Debugger to show, without any runtime penalty, the complete stack of function calls wherever the program counter is, provided that the code comes from compiled C functions.
BankSee Memory bank.
Bank switchingSwitching between different sets of memory banks. This software technique increases a computer's usable memory by allowing different pieces of memory to occupy the same address space.
Banked codeCode that is distributed over several banks of memory. Each function must reside in only one bank.
Banked dataData that is distributed over several banks of memory. Each data object must fit inside one memory bank.
Banked memoryHas multiple storage locations for the same address. See also Memory bank.
UEW-8:1
395
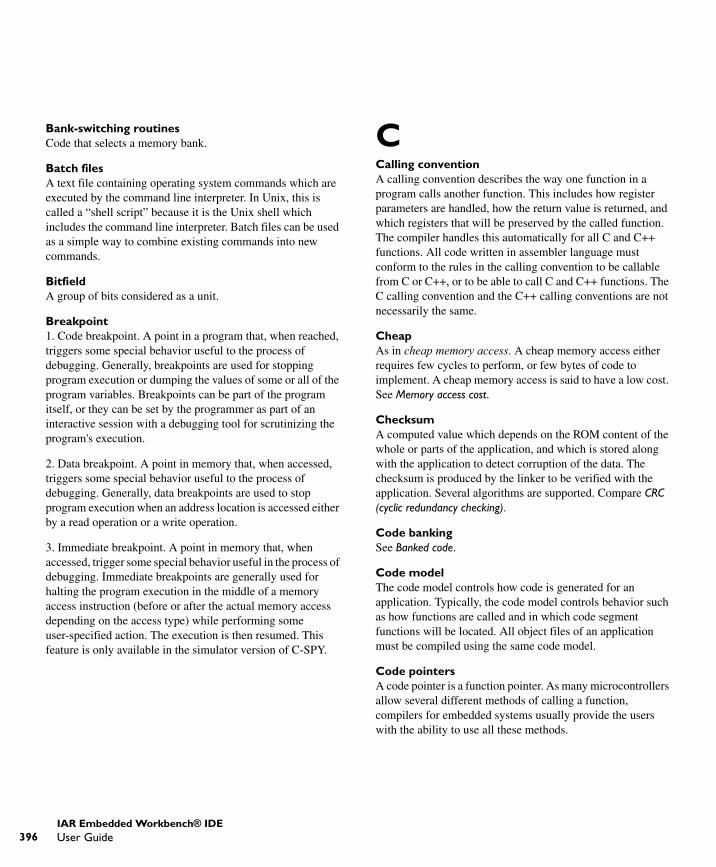
396
Bank-switching routinesCode that selects a memory bank.
Batch filesA text file containing operating system commands which are executed by the command line interpreter. In Unix, this is called a “shell script” because it is the Unix shell which includes the command line interpreter. Batch files can be used as a simple way to combine existing commands into new commands.
BitfieldA group of bits considered as a unit.
Breakpoint1. Code breakpoint. A point in a program that, when reached, triggers some special behavior useful to the process of debugging. Generally, breakpoints are used for stopping program execution or dumping the values of some or all of the program variables. Breakpoints can be part of the program itself, or they can be set by the programmer as part of an interactive session with a debugging tool for scrutinizing the program's execution.
2. Data breakpoint. A point in memory that, when accessed, triggers some special behavior useful to the process of debugging. Generally, data breakpoints are used to stop program execution when an address location is accessed either by a read operation or a write operation.
3. Immediate breakpoint. A point in memory that, when accessed, trigger some special behavior useful in the process of debugging. Immediate breakpoints are generally used for halting the program execution in the middle of a memory access instruction (before or after the actual memory access depending on the access type) while performing some user-specified action. The execution is then resumed. This feature is only available in the simulator version of C-SPY.
CCalling conventionA calling convention describes the way one function in a program calls another function. This includes how register parameters are handled, how the return value is returned, and which registers that will be preserved by the called function. The compiler handles this automatically for all C and C++ functions. All code written in assembler language must conform to the rules in the calling convention to be callable from C or C++, or to be able to call C and C++ functions. The C calling convention and the C++ calling conventions are not necessarily the same.
CheapAs in cheap memory access. A cheap memory access either requires few cycles to perform, or few bytes of code to implement. A cheap memory access is said to have a low cost. See Memory access cost.
ChecksumA computed value which depends on the ROM content of the whole or parts of the application, and which is stored along with the application to detect corruption of the data. The checksum is produced by the linker to be verified with the application. Several algorithms are supported. Compare CRC (cyclic redundancy checking).
Code bankingSee Banked code.
Code modelThe code model controls how code is generated for an application. Typically, the code model controls behavior such as how functions are called and in which code segment functions will be located. All object files of an application must be compiled using the same code model.
Code pointersA code pointer is a function pointer. As many microcontrollers allow several different methods of calling a function, compilers for embedded systems usually provide the users with the ability to use all these methods.
UEW-8:1
IAR Embedded Workbench® IDEUser Guide
Glossary
Do not confuse code pointers with data pointers.
Compilation unitSee Translation unit.
Compiler function directivesThe compiler function directives are generated by the compiler to pass information about functions and function calls to the IAR XLINK Linker. To view these directives, you must create an assembler list file. These directives are primarily intended for compilers that support static overlay, a feature which is useful in smaller microcontrollers.
Compiler optionsParameters you can specify to change the default behavior of the compiler.
CostSee Memory access cost.
CRC (cyclic redundancy checking)A number derived from, and stored with, a block of data to detect corruption. A CRC is based on polynomials and is a more advanced way of detecting errors than a simple arithmetic checksum. Compare Checksum.
C-SPY optionsParameters you can specify to change the default behavior of the IAR C-SPY Debugger.
CstartupCode that sets up the system before the application starts executing.
C-style preprocessorA preprocessor is either a stand-alone application or an integrated part of a compiler, that performs preprocessing of the input stream before the actual compilation occurs. A C-style preprocessor follows the rules set up in the ANSI specification of the C language and implements commands like #define, #if, and #include, which are used to handle textual macro substitution, conditional compilation, and inclusion of other files.
DData bankingSee Banked data.
Data modelThe data model specifies the default memory type. This means that the data model typically controls one or more of the following: The method used and the code generated to access static and global variables, dynamically allocated data, and the runtime stack. It also controls the default pointer type and in which data segments static and global variables will be located. A project can only use one data model at a time, and the same model must be used by all user modules and all library modules in the project.
Data pointersMany microcontrollers have different addressing modes to access different memory types or address spaces. Compilers for embedded systems usually have a set of different data pointer types so they can access the available memory efficiently.
Data representationHow different data types are laid out in memory and what value ranges they represent.
DeclarationA specification to the compiler that an object, a variable or function, exists. The object itself must be defined in exactly one translation unit (source file). An object must either be declared or defined before it is used. Normally an object that is used in many files is defined in one source file. A declaration is normally placed in a header file that is included by the files that use the object.
For example:
/* Variable "a" exists somewhere. Function "b" takes two int parameters and returns an int. */
extern int a; int b(int, int);
UEW-8:1
397
398
DefinitionThe variable or function itself. Only one definition can exist for each variable or function in an application. See also Tentative definition.
For example:
int a;int b(int x, int y){ return x + y;}
DerivativeOne of two or more processor variants in a series or family of microprocessors or microcontrollers.
Device description fileA file used by C-SPY that contains various device-specific information such as I/O registers (SFR) definitions, interrupt vectors, and control register definitions.
Device driverSoftware that provides a high-level programming interface to a particular peripheral device.
Digital signal processor (DSP)A device that is similar to a microprocessor, except that the internal CPU is optimized for use in applications involving discrete-time signal processing. In addition to standard microprocessor instructions, digital signal processors usually support a set of complex instructions to perform common signal-processing computations quickly.
Disassembly windowA C-SPY window that shows the memory contents disassembled as machine instructions, interspersed with the corresponding C source code (if available).
DWARFAn industry-standard debugging format which supports source level debugging. This is the format used by the IAR ILINK Linker for representing debug information in an object.
Dynamic initializationVariables in a program written in C are initialized during the initial phase of execution, before the main function is called. These variables are always initialized with a static value, which is determined either at compile time or at link time. This is called static initialization. In C++, variables might require initialization to be performed by executing code, for example, running the constructor of global objects, or performing dynamic memory allocation.
Dynamic memory allocationThere are two main strategies for storing variables: statically at link time, or dynamically at runtime. Dynamic memory allocation is often performed from the heap and it is the size of the heap that determines how much memory that can be used for dynamic objects and variables. The advantage of dynamic memory allocation is that several variables or objects that are not active at the same time can be stored in the same memory, thus reducing the memory requirements of an application. See also Heap memory.
Dynamic objectAn object that is allocated, created, destroyed, and released at runtime. Dynamic objects are almost always stored in memory that is dynamically allocated. Compare Static object.
EEEPROMElectrically Erasable, Programmable Read-Only Memory. A type of ROM that can be erased electronically, and then be re-programmed.
ELFExecutable and Linking Format, an industry-standard object file format. This is the format used by the IAR ILINK Linker. The debug information is formatted using DWARF.
EPROMErasable, Programmable Read-Only Memory. A type of ROM that can be erased by exposing it to ultraviolet light, and then be re-programmed.
UEW-8:1
IAR Embedded Workbench® IDEUser Guide
Glossary
Embedded C++A subset of the C++ programming language, which is intended for embedded systems programming. The fact that performance and portability are particularly important in embedded systems development was considered when defining the language.
Embedded systemA combination of hardware and software, designed for a specific purpose. Embedded systems are often part of a larger system or product.
EmulatorAn emulator is a hardware device that performs emulation of one or more derivatives of a processor family. An emulator can often be used instead of the actual microcontroller and connects directly to the printed circuit board—where the microcontroller would have been connected—via a connecting device. An emulator always behaves exactly as the processor it emulates, and is used when debugging requires all systems actuators, or when debugging device drivers.
EnumerationA type which includes in its definition an exhaustive list of possible values for variables of that type. Common examples include Boolean, which takes values from the list [true, false], and day-of-week which takes values [Sunday, Monday, Tuesday, Wednesday, Thursday, Friday, Saturday]. Enumerated types are a feature of typed languages, including C and Ada.
Characters, (fixed-size) integers, and even floating-point types might be (but are not usually) considered to be (large) enumerated types.
Executable imageContains the executable image; the result of linking several relocatable object files and libraries. The file format used for an object file is UBROF.
ExceptionsAn exception is an interrupt initiated by the processor hardware, or hardware that is tightly coupled with the processor, for instance, a memory management unit (MMU). The exception signals a violation of the rules of the architecture (access to protected memory), or an extreme error condition (division by zero).
Do not confuse this use of the word exception with the term exception used in the C++ language (but not in Embedded C++).
ExpensiveAs in expensive memory access. An expensive memory access either requires many cycles to perform, or many bytes of code to implement. An expensive memory access is said to have a high cost. See Memory access cost.
Extended keywordsNon-standard keywords in C and C++. These usually control the definition and declaration of objects (that is, data and functions). See also Keywords.
FFillingHow to fill up bytes—with a specific fill pattern—that exists between the segments in an executable image. These bytes exist because of the alignment demands on the segments.
Format specifiersUsed to specify the format of strings sent by library functions such as printf. In the following example, the function call contains one format string with one format specifier, %c, that prints the value of a as a single ASCII character:
printf("a = %c", a);
GGeneral optionsParameters you can specify to change the default behavior of all tools that are included in the IDE.
UEW-8:1
399

400
Generic pointersPointers that have the ability to point to all different memory types in, for example, a microcontroller based on the Harvard architecture.
HHarvard architectureA microcontroller based on the Harvard architecture has separate data and instruction buses. This allows execution to occur in parallel. As an instruction is being fetched, the current instruction is executing on the data bus. Once the current instruction is complete, the next instruction is ready to go. This theoretically allows for much faster execution than a von Neumann architecture, but adds some silicon complexity. Compare von Neumann architecture.
Heap memoryThe heap is a pool of memory in a system that is reserved for dynamic memory allocation. An application can request parts of the heap for its own use; once memory is allocated from the heap it remains valid until it is explicitly released back to the heap by the application. This type of memory is useful when the number of objects is not known until the application executes. Note that this type of memory is risky to use in systems with a limited amount of memory or systems that are expected to run for a very long time.
Heap sizeTotal size of memory that can be dynamically allocated.
HostThe computer that communicates with the target processor. The term is used to distinguish the computer on which the debugger is running from the microcontroller the embedded application you develop runs on.
IIDE (integrated development environment)A programming environment with all necessary tools integrated into one single application.
ILINKThe IAR ILINK Linker which produces absolute output in the ELF/DWARF format.
Include fileA text file which is included into a source file. This is often done by the preprocessor.
Inline assemblerAssembler language code that is inserted directly between C statements.
InliningAn optimization that replaces function calls with the body of the called function. This optimization increases the execution speed and can even reduce the size of the generated code.
Instruction mnemonicsA word or acronym used in assembler language to represent a machine instruction. Different processors have different instruction sets and therefore use a different set of mnemonics to represent them, such as, ADD, BR (branch), BLT (branch if less than), MOVE, LDR (load register).
Interrupt vectorA small piece of code that will be executed, or a pointer that points to code that will be executed when an interrupt occurs.
Interrupt vector tableA table containing interrupt vectors, indexed by interrupt type. This table contains the processor's mapping between interrupts and interrupt service routines and must be initialized by the programmer.
InterruptsIn embedded systems, the use of interrupts is a method of detecting external events immediately, for example a timer overflow or the pressing of a button.
Interrupts are asynchronous events that suspend normal processing and temporarily divert the flow of control through an “interrupt handler” routine. Interrupts can be caused by both hardware (I/O, timer, machine check) and software (supervisor, system call or trap instruction). Compare Trap.
UEW-8:1
IAR Embedded Workbench® IDEUser Guide
Glossary
IntrinsicAn adjective describing native compiler objects, properties, events, and methods.
Intrinsic functions1. Function calls that are directly expanded into specific sequences of machine code. 2. Functions called by the compiler for internal purposes (that is, floating point arithmetic etc.).
KKey bindingsKey shortcuts for menu commands used in the IDE.
KeywordsA fixed set of symbols built into the syntax of a programming language. All keywords used in a language are reserved—they cannot be used as identifiers (in other words, user-defined objects such as variables or procedures). See also Extended keywords.
LL-valueA value that can be found on the left side of an assignment and thus be changed. This includes plain variables and de-referenced pointers. Expressions like (x + 10) cannot be assigned a new value and are therefore not L-values.
Language extensionsTarget-specific extensions to the C language.
LibrarySee Runtime library.
Library configuration fileA file that contains a configuration of the runtime library. The file contains information about what functionality is part of the runtime environment. The file is used for tailoring a build of a runtime library. See also Runtime library.
Linker command fileA file used by the IAR XLINK Linker. It contains command line options which specify the locations where the memory segments can be placed, thereby assuring that your application fits on the target chip.
Because many of the chip-specific details are specified in the linker command file and not in the source code, the linker command file also helps to make the code portable.
In particular, the linker specifies the placement of segments, the stack size, and the heap size.
Local variableSee Auto variables.
Location counterSee Program location counter (PLC).
Logical addressSee Virtual address (logical address).
MMAC (Multiply and accumulate)A special instruction, or on-chip device, that performs a multiplication together with an addition. This is very useful when performing signal processing where many filters and transforms have the form:
The accumulator of the MAC usually has a higher precision (more bits) than normal registers. See also Digital signal processor (DSP).
Macro1. Assembler macros are user-defined sets of assembler lines that can be expanded later in the source file by referring to the given macro name. Parameters will be substituted if referred to.
UEW-8:1
401
402
2. C macro. A text substitution mechanism used during preprocessing of source files. Macros are defined using the #define preprocessing directive. The replacement text of each macro is then substituted for any occurrences of the macro name in the rest of the translation unit.
3. C-SPY macros are programs that you can write to enhance the functionality of C-SPY. A typical application of C-SPY macros is to associate them with breakpoints; when such a breakpoint is hit, the macro is run and can for example be used to simulate peripheral devices, to evaluate complex conditions, or to output a trace.
The C-SPY macro language is like a simple dialect of C, but is less strict with types.
MailboxA mailbox in an RTOS is a point of communication between two or more tasks. One task can send messages to another task by placing the message in the mailbox of the other task. Mailboxes are also known as message queues or message ports.
Memory access costThe cost of a memory access can be in clock cycles, or in the number of bytes of code needed to perform the access. A memory which requires large instructions or many instructions is said to have a higher access cost than a memory which can be accessed with few, or small instructions.
Memory areaA region of the memory.
Memory bankThe smallest unit of continuous memory in banked memory. One memory bank at a time is visible in a microcontroller’s physical address space.
Memory mapA map of the different memory areas available to the microcontroller.
Memory modelSpecifies the memory hierarchy and how much memory the system can handle. Your application must use only one memory model at a time, and the same model must be used by all user modules and all library modules.
MicrocontrollerA microprocessor on a single integrated circuit intended to operate as an embedded system. In addition to a CPU, a microcontroller typically includes small amounts of RAM, PROM, timers, and I/O ports.
MicroprocessorA CPU contained on one (or a few) integrated circuits. A single-chip microprocessor can include other components such as memory, memory management, caches, floating-point unit, I/O ports and timers. Such devices are also known as microcontrollers.
Multi-file compilationA technique which means that the compiler compiles several source files as one compilation unit, which enables for interprocedural optimizations such as inlining, cross call, and cross jump on multiple source files in a compilation unit.
ModuleAn object. An object file contains a module and library contains one or more objects. The basic unit of linking. A module contains definitions for symbols (exports) and references to external symbols (imports). When you compile C/C++, each translation unit produces one module. In assembler, each source file can produce more than one module.
NNested interruptsA system where an interrupt can be interrupted by another interrupt is said to have nested interrupts.
Non-banked memoryHas a single storage location for each memory address in a microcontroller’s physical address space.
UEW-8:1
IAR Embedded Workbench® IDEUser Guide
Glossary
Non-initialized memoryMemory that can contain any value at reset, or in the case of a soft reset, can remember the value it had before the reset.
Non-volatile storageMemory devices such as battery-backed RAM, ROM, magnetic tape and magnetic disks that can retain data when electric power is shut off. Compare Volatile storage.
NOPNo operation. This is an instruction that does not do anything, but is used to create a delay. In pipelined architectures, the NOP instruction can be used for synchronizing the pipeline. See also Pipeline.
OObjectAn object file or a library member.
Object file, absoluteSee Executable image.
Object file, relocatableThe result of compiling or assembling a source file. The file format used for an object file is UBROF.
OperatorA symbol used as a function, with infix syntax if it has two arguments (+, for example) or prefix syntax if it has only one (for instance, bitwise negation, ~). Many languages use operators for built-in functions such as arithmetic and logic.
Operator precedenceEach operator has a precedence number assigned to it that determines the order in which the operator and its operands are evaluated. The highest precedence operators are evaluated first. Use parentheses to group operators and operands to control the order in which the expressions are evaluated.
Output imageThe resulting application after linking. This term is equivalent to executable image, which is the term used in the IAR Systems user documentation.
PParameter passingSee Calling convention.
Peripheral unitA hardware component other than the processor, for example memory or an I/O device.
PipelineA structure that consists of a sequence of stages through which a computation flows. New operations can be initiated at the start of the pipeline even though other operations are already in progress through the pipeline.
PointerAn object that contains an address to another object of a specified type.
#pragmaDuring compilation of a C/C++ program, the #pragma preprocessing directive causes the compiler to behave in an implementation-defined manner. This can include, for example, producing output on the console, changing the declaration of a subsequent object, changing the optimization level, or enabling/disabling language extensions.
Pre-emptive multitaskingAn RTOS task is allowed to run until a higher priority process is activated. The higher priority task might become active as the result of an interrupt. The term preemptive indicates that although a task is allotted to run a given length of time (a timeslice), it might lose the processor at any time. Each time an interrupt occurs, the task scheduler looks for the highest priority task that is active and switches to that task. If the located task is different from the task that was executing before the interrupt, the previous task is suspended at the point of interruption.
Compare Round Robin.
Preprocessing directivesA set of directives that are executed before the parsing of the actual code is started.
UEW-8:1
403

404
PreprocessorSee C-style preprocessor.
Processor variantThe different chip setups that the compiler supports. See Derivative.
Program counter (PC)A special processor register that is used to address instructions. Compare Program location counter (PLC).
Program location counter (PLC)Used in the IAR Assembler to denote the code address of the current instruction. The PLC is represented by a special symbol (typically $) that can be used in arithmetic expressions. Also called simply location counter (LC).
PROMProgrammable Read-Only Memory. A type of ROM that can be programmed only once.
ProjectThe user application development project.
Project optionsGeneral options that apply to an entire project, for example the target processor that the application will run on.
QQualifiersSee Type qualifiers.
RR-valueA value that can be found on the right side of an assignment. This is just a plain value. See also L-value.
Real-time operating system (RTOS)An operating system which guarantees the latency between an interrupt being triggered and the interrupt handler starting, and how tasks are scheduled. An RTOS is typically much smaller than a normal desktop operating system. Compare Real-time system.
Real-time systemA computer system whose processes are time-sensitive. Compare Real-time operating system (RTOS).
Register constantA register constant is a value that is loaded into a dedicated processor register when the system is initialized. The compiler can then generate code that assumes that the constants are present in the dedicated registers.
RegisterA small on-chip memory unit, usually just one or a few bytes in size, which is particularly efficient to access and therefore often reserved as a temporary storage area during program execution.
Register lockingRegister locking means that the compiler can be instructed that some processor registers shall not be used during normal code generation. This is useful in many situations. For example, some parts of a system might be written in assembler language to gain speed. These parts might be given dedicated processor registers. Or the register might be used by an operating system, or by other third-party software.
Register variablesTypically, register variables are local variables that are placed in registers instead of on the (stack) frame of the function. Register variables are much more efficient than other variables because they do not require memory accesses, so the compiler can use shorter/faster instructions when working with them. See also Auto variables.
Relocatable segmentsSegments that have no fixed location in memory before linking.
UEW-8:1
IAR Embedded Workbench® IDEUser Guide
Glossary
ResetA reset is a restart from the initial state of a system. A reset can originate from hardware (hard reset), or from software (soft reset). A hard reset can usually not be distinguished from the power-on condition, which a soft reset can be.
ROM-monitorA piece of embedded software designed specifically for use as a debugging tool. It resides in the ROM of the evaluation board chip and communicates with a debugger via a serial port or network connection. The ROM-monitor provides a set of primitive commands to view and modify memory locations and registers, create and remove breakpoints, and execute your application. The debugger combines these primitives to fulfill higher-level requests like program download and single-step.
Round RobinTask scheduling in an operating system, where all tasks have the same priority level and are executed in turn, one after the other. Compare Pre-emptive multitasking.
RTOSSee Real-time operating system (RTOS).
Runtime libraryA collection of relocatable object files that will be included in the executable image only if referred to from an object file, in other words conditionally linked.
Runtime model attributesA mechanism that is designed to prevent modules that are not compatible to be linked into an application. A runtime attribute is a pair constituted of a named key and its corresponding value.
Two modules can only be linked together if they have the same value for each key that they both define.
SSaturation arithmeticsMost, if not all, C and C++ implementations use mod–2N 2-complement-based arithmetics where an overflow wraps the value in the value domain, that is, (127 + 1) = -128. Saturation arithmetics, on the other hand, does not allow wrapping in the value domain, for instance, (127 + 1) = 127, if 127 is the upper limit. Saturation arithmetics is often used in signal processing, where an overflow condition would have been fatal if value wrapping had been allowed.
SchedulerThe part of an RTOS that performs task-switching. It is also responsible for selecting which task that should be allowed to run. Many scheduling algorithms exist, but most of them are either based on static scheduling (performed at compile-time), or on dynamic scheduling (where the actual choice of which task to run next is taken at runtime, depending on the state of the system at the time of the task-switch). Most real-time systems use static scheduling, because it makes it possible to prove that the system will not violate the real-time requirements.
ScopeThe section of an application where a function or a variable can be referenced by name. The scope of an item can be limited to file, function, or block.
SegmentA chunk of data or code that should be mapped to a physical location in memory. The segment can either be placed in RAM (read-and-writeable memory) or in ROM (read-only memory).
Segment mapA set of segments and their locations.
SemaphoreA semaphore is a type of flag that is used for guaranteeing exclusive access to resources. The resource can be a hardware port, a configuration memory, or a set of variables. If several tasks must access the same resource, the parts of the code (the critical sections) that access the resource must be made exclusive for every task. This is done by obtaining the
UEW-8:1
405
406
semaphore that protects that resource, thus blocking all other tasks from it. If another task wishes to use the resource, it also must obtain the semaphore. If the semaphore is already in use, the second task must wait until the semaphore is released. After the semaphore is released, the second task is allowed to execute and can obtain the semaphore for its own exclusive access.
Severity levelThe level of seriousness of the diagnostic response from the assembler, compiler, or debugger, when it notices that something is wrong. Typical severity levels are remarks, warnings, errors, and fatal errors. A remark just points to a possible problem, while a fatal error means that the programming tool exits without finishing.
Short addressingMany microcontrollers have special addressing modes for efficient access to internal RAM and memory mapped I/O. Short addressing is therefore provided as an extended feature by many compilers for embedded systems. See also Data pointers.
Side effectAn expression in C or C++ is said to have a side-effect if it changes the state of the system. Examples are assignments to a variable, or using a variable with the post-increment operator. The C and C++ standards state that a variable that is subject to a side-effect should not be used more that once in an expression. As an example, this statement violates that rule:
*d++ = *d;
SignalSignals provide event-based communication between tasks. A task can wait for one or more signals from other tasks. Once a task receives a signal it waits for, execution continues. A task in an RTOS that waits for a signal does not use any processing time, which allows other tasks to execute.
SimulatorA debugging tool that runs on the host and behaves as similar to the target processor as possible. A simulator is used to debug the application when the hardware is unavailable, or not needed for proper debugging. A simulator is usually not connected to any physical peripheral devices. A simulated processor is often slower, or even much slower, than the real hardware.
Single steppingExecuting one instruction or one C statement at a time in the debugger.
Skeleton codeAn incomplete code framework that allows the user to specialize the code.
Special function register (SFR)A register that is used to read and write to the hardware components of the microcontroller.
Stack framesData structures containing data objects like preserved registers, local variables, and other data objects that must be stored temporary for a particular scope (usually a function).
Earlier compilers usually had a fixed size and layout on a stack frame throughout a complete function, while modern compilers might have a very dynamic layout and size that can change anywhere and anytime in a function.
Stack segmentsThe segment or segments that reserve space for the stack(s). Most processors use the same stack for calls and parameters, but some have separate stacks.
Standard librariesThe C and C++ library functions as specified by the C and C++ standard, and support routines for the compiler, like floating-point routines.
UEW-8:1
IAR Embedded Workbench® IDEUser Guide
Glossary
Statically allocated memoryThis kind of memory is allocated once and for all at link-time, and remains valid all through the execution of the application. Variables that are either global or declared static are allocated this way.
Static objectAn object whose memory is allocated at link-time and is created during system startup (or at first use). Compare Dynamic object.
Static overlayInstead of using a dynamic allocation scheme for parameters and auto variables, the linker allocates space for parameters and auto variables at link time. This generates a worst-case scenario of stack usage, but might be preferable for small chips with expensive stack access or no stack access at all.
Structure valueA collecting names for structs and unions. A struct is a collection of data object placed sequentially in memory (possibly with pad bytes between them). A union is a collection of data sharing the same memory location.
SymbolA name that represents a register, an absolute value, or a memory address (relative or absolute).
Symbolic locationA location that uses a symbolic name because the exact address is unknown.
TTarget1. An architecture. 2. A piece of hardware. The particular embedded system you are developing the application for. The term is usually used to distinguish the system from the host system.
Task (thread)A task is an execution thread in a system. Systems that contain many tasks that execute in parallel are called multitasking systems. Because a processor only executes one instruction stream at the time, most systems implement some sort of task-switch mechanism (often called context switch) so that all tasks get their share of processing time. The process of determining which task that should be allowed to run next is called scheduling. Two common scheduling methods are Pre-emptive multitasking and Round Robin.
Tentative definitionA variable that can be defined in multiple files, provided that the definition is identical and that it is an absolute variable.
Terminal I/OA simulated terminal window in C-SPY.
TimesliceThe (longest) time an RTOS allows a task to run without running the task-scheduling algorithm. A task might be allowed to execute during several consecutive timeslices before being switched out. A task might also not be allowed to use its entire time slice, for example if, in a preemptive system, a higher priority task is activated by an interrupt.
TimerA peripheral that counts independent of the program execution.
Translation unitA source file together with all the header files and source files included via the preprocessor directive #include, except for the lines skipped by conditional preprocessor directives such as #if and #ifdef.
TrapA trap is an interrupt initiated by inserting a special instruction into the instruction stream. Many systems use traps to call operating system functions. Another name for trap is software interrupt.
UEW-8:1
407
408
Type qualifiersIn standard C/C++, const or volatile. IAR Systems compilers usually add target-specific type qualifiers for memory and other type attributes.
UUBROF (Universal Binary Relocatable Object Format)File format produced by some of the IAR Systems programming tools.
VVirtual address (logical address)An address that must be translated by the compiler, linker or the runtime system into a physical memory address before it is used. The virtual address is the address seen by the application, which can be different from the address seen by other parts of the system.
Virtual spaceAn IAR Embedded Workbench Editor feature which allows you to place the insertion point outside of the area where there are actual characters.
Volatile storageData stored in a volatile storage device is not retained when the power to the device is turned off. To preserve data during a power-down cycle, you should store it in non-volatile storage. This should not be confused with the C keyword volatile. Compare Non-volatile storage.
von Neumann architectureA computer architecture where both instructions and data are transferred over a common data channel. Compare Harvard architecture.
WWatchpointsWatchpoints keep track of the values of C variables or expressions in the C-SPY Watch window as the application is being executed.
XXAR optionsThe set of commands that control how the IAR XAR Library Builder operates.
XLIB optionsThe set of commands that control how the IAR XLIB Librarian operates.
XLINKThe IAR XLINK Linker which uses the UBROF output format.
XLINK optionsParameters you can specify to change the default behavior of the IAR XLINK Linker.
ZZero-overhead loopA loop in which the loop condition, including branching back to the beginning of the loop, does not take any time at all. This is usually implemented as a special hardware feature of the processor and is not available in all architectures.
ZoneDifferent processors have widely differing memory architectures. Zone is the term C-SPY uses for a named memory area. For example, on processors with separately addressable code and data memory there would be at least two zones. A processor with an intricate banked memory scheme might have several zones.
UEW-8:1
IAR Embedded Workbench® IDEUser Guide
Index
Index
Aabsolute location
definition of . . . . . . . . . . . . . . . . . . . . . . . . . . . . . . . . . 395specifying for a breakpoint . . . . . . . . . . . . . . . . . . . . . 218
absolute segments, definition of . . . . . . . . . . . . . . . . . . . . 395Access Type (Breakpoints dialog box)
data breakpoint. . . . . . . . . . . . . . . . . . . . . . . . . . . . . . . 175immediate breakpoint. . . . . . . . . . . . . . . . . . . . . . . . . . 177
Action (Breakpoints dialog box)code breakpoint . . . . . . . . . . . . . . . . . . . . . . . . . . . . . . 215data breakpoint. . . . . . . . . . . . . . . . . . . . . . . . . . . . . . . 175immediate breakpoint. . . . . . . . . . . . . . . . . . . . . . . . . . 177
Add existing project to current workspace(Startup option). . . . . . . . . . . . . . . . . . . . . . . . . . . . . . . . . 271Additional include directories (assembler option). . . . . . . 333Additional include directories (compiler option) . . . . . . . 325address expression, definition of . . . . . . . . . . . . . . . . . . . . 395address range check, specifying in linker . . . . . . . . . . . . . 347Alias (Key bindings option) . . . . . . . . . . . . . . . . . . . . . . . 247Allow C-SPY-specific output file (linker option) . . . . . . . 343Allow directives in first column (assembler option) . . . . . 331Allow mnemonics in first column (assembler option). . . . 331Always generate output (linker option) . . . . . . . . . . . . . . . 346application
built outside the IDE . . . . . . . . . . . . . . . . . . . . . . . . . . 117definition of . . . . . . . . . . . . . . . . . . . . . . . . . . . . . . . . . 395testing . . . . . . . . . . . . . . . . . . . . . . . . . . . . . . . . . . 94, 153
architecture, definition of . . . . . . . . . . . . . . . . . . . . . . . . . 395argument variables . . . . . . . . . . . . . . . . . . . . . . . . . . . . . . 266
environment variables . . . . . . . . . . . . . . . . . . . . . . . . . 238in #include file paths
assembler . . . . . . . . . . . . . . . . . . . . . . . . . . . . . . . . 334compiler . . . . . . . . . . . . . . . . . . . . . . . . . . . . . . . . . 325linker. . . . . . . . . . . . . . . . . . . . . . . . . . . . . . . . . . . . 351
summary . . . . . . . . . . . . . . . . . . . . . . . . . . . . . . . . . . . 237Arguments (External editor option) . . . . . . . . . . . . . . . . . 252asm (filename extension) . . . . . . . . . . . . . . . . . . . . . . . . . . 17
assemblercommand line version . . . . . . . . . . . . . . . . . . . . . . . . . . 75documentation . . . . . . . . . . . . . . . . . . . . . . . . . . . . . . . . 21features . . . . . . . . . . . . . . . . . . . . . . . . . . . . . . . . . . . . . 11
assembler comments, text style in editor. . . . . . . . . . . . . . 101assembler directives . . . . . . . . . . . . . . . . . . . . . . . . . . . . . . 70
definition of . . . . . . . . . . . . . . . . . . . . . . . . . . . . . . . . . 395text style in editor . . . . . . . . . . . . . . . . . . . . . . . . . . . . 101
assembler labels, viewing . . . . . . . . . . . . . . . . . . . . . . . . . 130assembler language, definition of . . . . . . . . . . . . . . . . . . . 395assembler list files
compiler call frame informationformat . . . . . . . . . . . . . . . . . . . . . . . . . . . . . . . . . . . . . . 51generating . . . . . . . . . . . . . . . . . . . . . . . . . . . . . . . . . . 333
Assembler mnemonics (compiler option) . . . . . . . . . . . . . 324assembler options . . . . . . . . . . . . . . . . . . . . . . . . . . . . . . . 331
Diagnostics . . . . . . . . . . . . . . . . . . . . . . . . . . . . . . . . . 335Language . . . . . . . . . . . . . . . . . . . . . . . . . . . . . . . . . . . 331List. . . . . . . . . . . . . . . . . . . . . . . . . . . . . . . . . . . . . . . . 333Output . . . . . . . . . . . . . . . . . . . . . . . . . . . . . . . . . . . . . 332Preprocessor. . . . . . . . . . . . . . . . . . . . . . . . . . . . . . . . . 333
assembler options, definition of . . . . . . . . . . . . . . . . . . . . 395assembler output, including debug information . . . . . . . . 332assembler preprocessor . . . . . . . . . . . . . . . . . . . . . . . . . . . 333assembler symbols
defining . . . . . . . . . . . . . . . . . . . . . . . . . . . . . . . . . . . . 334using in C-SPY expressions . . . . . . . . . . . . . . . . . . . . . 126
assembler variables, viewing. . . . . . . . . . . . . . . . . . . . . . . 130assert, in built applications . . . . . . . . . . . . . . . . . . . . . . . . . 83assumptions, programming experience . . . . . . . . . . . . . . xxxvAuto indent (editor option) . . . . . . . . . . . . . . . . . . . . . . . . 249Auto window . . . . . . . . . . . . . . . . . . . . . . . . . . . . . . . . . . 289
context menu . . . . . . . . . . . . . . . . . . . . . . . . . . . . . . . . 290Automatic (compiler option). . . . . . . . . . . . . . . . . . . . . . . 319Autostep settings dialog box (Debug menu) . . . . . . . . . . . 306axx (filename extension). . . . . . . . . . . . . . . . . . . . . . . . . . . 17
UEW-8:1
409
410
B-B (C-SPY command line option). . . . . . . . . . . . . . . . . . . 364--backend (C-SPY command line option) . . . . . . . . . . . . . 364Background color (IDE Tools option). . . . . . . . . . . . . . . . 255backtrace information
definition of . . . . . . . . . . . . . . . . . . . . . . . . . . . . . . . . . 395generated by compiler . . . . . . . . . . . . . . . . . . . . . . . . . 123viewing in Call Stack window . . . . . . . . . . . . . . . . . . . 294
bank switching, definition of. . . . . . . . . . . . . . . . . . . . . . . 395banked code, definition of. . . . . . . . . . . . . . . . . . . . . . . . . 395banked data, definition of . . . . . . . . . . . . . . . . . . . . . . . . . 395banked memory, definition of . . . . . . . . . . . . . . . . . . . . . . 395bank-switching routines, definition of. . . . . . . . . . . . . . . . 396Base (Register filter option) . . . . . . . . . . . . . . . . . . . . . . . 263bat (filename extension) . . . . . . . . . . . . . . . . . . . . . . . . . . . 18Batch Build. . . . . . . . . . . . . . . . . . . . . . . . . . . . . . . . . . . . . 93Batch Build Configuration dialog box (Project menu) . . . 243Batch Build dialog box (Project menu) . . . . . . . . . . . . . . . 242batch files
definition of . . . . . . . . . . . . . . . . . . . . . . . . . . . . . . . . . 396specifying from the Tools menu. . . . . . . . . . . . . . . . . . . 80
batch mode, using C-SPY in . . . . . . . . . . . . . . . . . . . . . . . 361bin (subdirectory) . . . . . . . . . . . . . . . . . . . . . . . . . . . . . . . . 15bin, common (subdirectory) . . . . . . . . . . . . . . . . . . . . . . . . 17bitfield, definition of . . . . . . . . . . . . . . . . . . . . . . . . . . . . . 396blocks, in C-SPY macros . . . . . . . . . . . . . . . . . . . . . . . . . 372Body (b) (Configure auto indent option). . . . . . . . . . . . . . 251bold style, in this guide . . . . . . . . . . . . . . . . . . . . . . . . . . . . xlbookmarks
adding . . . . . . . . . . . . . . . . . . . . . . . . . . . . . . . . . . . . . 105showing in editor . . . . . . . . . . . . . . . . . . . . . . . . . . . . . 250
Break (button). . . . . . . . . . . . . . . . . . . . . . . . . . . . . . 123, 275breakpoint condition, example . . . . . . . . . . . . . . . . . 137–138breakpoint icons . . . . . . . . . . . . . . . . . . . . . . . . . . . . . . . . 134Breakpoint Usage dialog box (Simulator menu) . . . . . . . . 178
using . . . . . . . . . . . . . . . . . . . . . . . . . . . . . . . . . . . . . . 139breakpoints . . . . . . . . . . . . . . . . . . . . . . . . . . . . . . . . . . . . 122
code, example . . . . . . . . . . . . . . . . . . . . . . . . . . . . . . . 386
conditional, example . . . . . . . . . . . . . . . . . . . . . . . . . . . 65connecting a C-SPY macro . . . . . . . . . . . . . . . . . . . . . 151consumers . . . . . . . . . . . . . . . . . . . . . . . . . . . . . . . . . . 140data . . . . . . . . . . . . . . . . . . . . . . . . . . . . . . . . . . . 173–174
example. . . . . . . . . . . . . . . . . . . . . . . . . . . . . . . . . . 387immediate . . . . . . . . . . . . . . . . . . . . . . . . . . . . . . . . . . 176
example. . . . . . . . . . . . . . . . . . . . . . . . . . . . . . . . . . . 65in Memory window . . . . . . . . . . . . . . . . . . . . . . . . . . . 136in the simulator . . . . . . . . . . . . . . . . . . . . . . . . . . . . . . 173listing all . . . . . . . . . . . . . . . . . . . . . . . . . . . . . . . . . . . 139setting
in memory window . . . . . . . . . . . . . . . . . . . . . . . . . 136using system macros . . . . . . . . . . . . . . . . . . . . . . . . 137using the dialog box . . . . . . . . . . . . . . . . . . . . . . . . 135
settings. . . . . . . . . . . . . . . . . . . . . . . . . . . . . . . . . . . . . 239single-stepping if not available. . . . . . . . . . . . . . . . . . . 115system, description of . . . . . . . . . . . . . . . . . . . . . . . . . 133toggling . . . . . . . . . . . . . . . . . . . . . . . . . . . . . . . . . . . . 135useful tips. . . . . . . . . . . . . . . . . . . . . . . . . . . . . . . . . . . 137viewing . . . . . . . . . . . . . . . . . . . . . . . . . . . . . . . . . . . . 138
Breakpoints dialog boxCode . . . . . . . . . . . . . . . . . . . . . . . . . . . . . . . . . . . . . . 214Data . . . . . . . . . . . . . . . . . . . . . . . . . . . . . . . . . . . . . . . 174Immediate . . . . . . . . . . . . . . . . . . . . . . . . . . . . . . . . . . 176Log . . . . . . . . . . . . . . . . . . . . . . . . . . . . . . . . . . . . . . . 216
Breakpoints window (View menu) . . . . . . . . . . . . . . . . . . 213breakpoints, definition of . . . . . . . . . . . . . . . . . . . . . . . . . 396Buffered terminal output (linker option) . . . . . . . . . . . . . . 343-build (iarbuild command line option) . . . . . . . . . . . . . . . . 95Build Actions . . . . . . . . . . . . . . . . . . . . . . . . . . . . . . . . . . . 94Build Actions Configuration (Build Actions options) . . . . 339build configuration
creating . . . . . . . . . . . . . . . . . . . . . . . . . . . . . . . . . . . . . 84definition of . . . . . . . . . . . . . . . . . . . . . . . . . . . . . . . . . . 82
Build window context menu . . . . . . . . . . . . . . . . . . . . . . . 219Build window (View menu) . . . . . . . . . . . . . . . . . . . . . . . 219building
commands for . . . . . . . . . . . . . . . . . . . . . . . . . . . . . . . . 93from the command line . . . . . . . . . . . . . . . . . . . . . . . . . 95
UEW-8:1
IAR Embedded Workbench® IDEUser Guide
Index
options . . . . . . . . . . . . . . . . . . . . . . . . . . . . . . . . . . . . . 257pre- and post-actions . . . . . . . . . . . . . . . . . . . . . . . . . . . 94the process . . . . . . . . . . . . . . . . . . . . . . . . . . . . . . . . . . . 91
CC comments, text style in editor . . . . . . . . . . . . . . . . . . . . 101C compiler. See compilerC function information, in C-SPY. . . . . . . . . . . . . . . . . . . 123C keywords, text style in editor. . . . . . . . . . . . . . . . . . . . . 101C symbols, using in C-SPY expressions . . . . . . . . . . . . . . 125C variables, using in C-SPY expressions . . . . . . . . . . . . . 125c (filename extension). . . . . . . . . . . . . . . . . . . . . . . . . . . . . 18call chain, displaying in C-SPY . . . . . . . . . . . . . . . . . . . . 123call frame information
including in assembler list file . . . . . . . . . . . . . . . . . . . 324call frame information See also backtrace informationCall stack information. . . . . . . . . . . . . . . . . . . . . . . . . . . . 123Call Stack window . . . . . . . . . . . . . . . . . . . . . . . . . . . . . . 294
context menu . . . . . . . . . . . . . . . . . . . . . . . . . . . . . . . . 294example . . . . . . . . . . . . . . . . . . . . . . . . . . . . . . . . . . . . . 64for backtrace information. . . . . . . . . . . . . . . . . . . . . . . 123
calling conventiondefinition of . . . . . . . . . . . . . . . . . . . . . . . . . . . . . . . . . 396examining . . . . . . . . . . . . . . . . . . . . . . . . . . . . . . . . . . . 49
__cancelAllInterrupts (C-SPY system macro) . . . . . . . . . 376__cancelInterrupt (C-SPY system macro). . . . . . . . . . . . . 377category, in Options dialog box. . . . . . . . . . . . . . . . . . 92, 240cfg (filename extension) . . . . . . . . . . . . . . . . . . . . . . . . . . . 18characters, in assembler macro quotes . . . . . . . . . . . . . . . 332cheap memory access, definition of . . . . . . . . . . . . . . . . . 396Check In Files dialog box . . . . . . . . . . . . . . . . . . . . . . . . . 202Check Out Files dialog box. . . . . . . . . . . . . . . . . . . . . . . . 203checksum
definition of . . . . . . . . . . . . . . . . . . . . . . . . . . . . . . . . . 396generating . . . . . . . . . . . . . . . . . . . . . . . . . . . . . . . . . . 352
Checksum (linker options) . . . . . . . . . . . . . . . . . . . . . . . . 352chm (filename extension) . . . . . . . . . . . . . . . . . . . . . . . . . . 18-clean (iarbuild command line option) . . . . . . . . . . . . . . . . 95
__clearBreak (C-SPY system macro) . . . . . . . . . . . . . . . . 377Close Workspace (File menu) . . . . . . . . . . . . . . . . . . . . . . 223__closeFile (C-SPY system macro) . . . . . . . . . . . . . . . . . 377code
banked, definition of . . . . . . . . . . . . . . . . . . . . . . . . . . 395skeleton, definition of . . . . . . . . . . . . . . . . . . . . . . . . . 406testing . . . . . . . . . . . . . . . . . . . . . . . . . . . . . . . . . . . . . . 94
code coverageusing . . . . . . . . . . . . . . . . . . . . . . . . . . . . . . . . . . . . . . 155viewing . . . . . . . . . . . . . . . . . . . . . . . . . . . . . . . . . . . . 156
Code Coverage window . . . . . . . . . . . . . . . . . . . . . . . . . . 296context menu . . . . . . . . . . . . . . . . . . . . . . . . . . . . . . . . 298
code generationassembler . . . . . . . . . . . . . . . . . . . . . . . . . . . . . . . . . . . 331compiler, features. . . . . . . . . . . . . . . . . . . . . . . . . . . . . . 10
code integrity . . . . . . . . . . . . . . . . . . . . . . . . . . . . . . . . . . . 88code memory, filling unused . . . . . . . . . . . . . . . . . . . . . . . 352code model, definition of . . . . . . . . . . . . . . . . . . . . . . . . . 396Code page (compiler options) . . . . . . . . . . . . . . . . . . . . . . 320code pointers, definition of . . . . . . . . . . . . . . . . . . . . . . . . 396code templates, using in editor . . . . . . . . . . . . . . . . . . . . . 103Command file configuration tool (XLINK option) . . . . . . 350command line options
specifying from the Tools menu. . . . . . . . . . . . . . . . . . . 80typographic convention . . . . . . . . . . . . . . . . . . . . . . . . . xl
command prompt icon, in this guide . . . . . . . . . . . . . . . . . . xlCommand (External editor option) . . . . . . . . . . . . . . . . . . 252Common Fonts (IDE Options dialog box) . . . . . . . . . . . . 245common (directory) . . . . . . . . . . . . . . . . . . . . . . . . . . . . . . 17compiler
command line version . . . . . . . . . . . . . . . . . . . . . . . . 4, 75documentation . . . . . . . . . . . . . . . . . . . . . . . . . . . . . 11, 20features . . . . . . . . . . . . . . . . . . . . . . . . . . . . . . . . . . . . . . 9
compiler diagnostics . . . . . . . . . . . . . . . . . . . . . . . . . . . . . 324suppressing . . . . . . . . . . . . . . . . . . . . . . . . . . . . . . . . . 327
compiler function directives, definition of . . . . . . . . . . . . 397compiler list files
assembler mnemonics, including . . . . . . . . . . . . . . . . . 324example . . . . . . . . . . . . . . . . . . . . . . . . . . . . . . . . . . . . . 35
UEW-8:1
411
412
generating . . . . . . . . . . . . . . . . . . . . . . . . . . . . . . . . . . 324source code, including . . . . . . . . . . . . . . . . . . . . . . . . . 324
compiler options . . . . . . . . . . . . . . . . . . . . . . . . . . . . . . . . 317definition of . . . . . . . . . . . . . . . . . . . . . . . . . . . . . . . . . 397setting in Embedded Workbench, example . . . . . . . . . . 33Code . . . . . . . . . . . . . . . . . . . . . . . . . . . . . . . . . . . . . . 320Diagnostics . . . . . . . . . . . . . . . . . . . . . . . . . . . . . . . . . 326Language . . . . . . . . . . . . . . . . . . . . . . . . . . . . . . . . . . . 318List. . . . . . . . . . . . . . . . . . . . . . . . . . . . . . . . . . . . . . . . 323Optimizations. . . . . . . . . . . . . . . . . . . . . . . . . . . . . . . . 321Output . . . . . . . . . . . . . . . . . . . . . . . . . . . . . . . . . . . . . 322Preprocessor. . . . . . . . . . . . . . . . . . . . . . . . . . . . . . . . . 325
compiler outputincluding debug information . . . . . . . . . . . . . . . . . . . . 323program or library . . . . . . . . . . . . . . . . . . . . . . . . . . . . 323
compiler preprocessor. . . . . . . . . . . . . . . . . . . . . . . . . . . . 325compiler symbols, defining. . . . . . . . . . . . . . . . . . . . . . . . 326computer style, typographic convention . . . . . . . . . . . . xxxixconditional breakpoints, example . . . . . . . . . . . . . . . . . . . . 65conditional statements, in C-SPY macros . . . . . . . . . . . . . 371Conditions (Breakpoints dialog box)
code breakpoint . . . . . . . . . . . . . . . . . . . . . . . . . . . . . . 216data breakpoint. . . . . . . . . . . . . . . . . . . . . . . . . . . . . . . 175
Config (linker options) . . . . . . . . . . . . . . . . . . . . . . . . . . . 350config (subdirectory). . . . . . . . . . . . . . . . . . . . . . . . . . . . . . 16Configuration file (general option) . . . . . . . . . . . . . . . . . . 313configuration tool . . . . . . . . . . . . . . . . . . . . . . . . . . . . . . . 350Configurations for project dialog box (Project menu) . . . . 238Configure Auto Indent (IDE Options dialog box) . . . . . . . 250Configure Tools (Tools menu) . . . . . . . . . . . . . . . . . . . . . 265Configure Viewers dialog box (Tools menu). . . . . . . . . . . 269config, common (subdirectory) . . . . . . . . . . . . . . . . . . . . . . 17$CONFIG_NAME$ (argument variable) . . . . . . . . . . . . . 237context menu, in windows. . . . . . . . . . . . . . . . . . . . . . . . . 128conventions, used in this guide . . . . . . . . . . . . . . . . . . . xxxixCopy (button) . . . . . . . . . . . . . . . . . . . . . . . . . . . . . . . . . . 195copyright. . . . . . . . . . . . . . . . . . . . . . . . . . . . . . . . . . . . . . . . iicost. See memory access costcpp (filename extension) . . . . . . . . . . . . . . . . . . . . . . . . . . . 18
CPU registers, definitions in ddf file . . . . . . . . . . . . . . . . . 115CPU variant, definition of . . . . . . . . . . . . . . . . . . . . . . . . . 398CRC, definition of. . . . . . . . . . . . . . . . . . . . . . . . . . . . . . . 397Create New Project dialog box (Project menu) . . . . . . . . . 239Create new project in current workspace (Startup option). 271cross-references, in map files . . . . . . . . . . . . . . . . . . . . . . . 38cspybat . . . . . . . . . . . . . . . . . . . . . . . . . . . . . . . . . . . . . . . 361cstartup (system startup code)
definition of . . . . . . . . . . . . . . . . . . . . . . . . . . . . . . . . . 397stack pointers not valid until reaching . . . . . . . . . . . . . 262
current position, in C-SPY Disassembly window . . . . . . . 276cursor, in C-SPY Disassembly window. . . . . . . . . . . . . . . 276$CUR_DIR$ (argument variable) . . . . . . . . . . . . . . . . . . . 237$CUR_LINE$ (argument variable) . . . . . . . . . . . . . . . . . . 237custom build . . . . . . . . . . . . . . . . . . . . . . . . . . . . . . . . . . . . 95
using . . . . . . . . . . . . . . . . . . . . . . . . . . . . . . . . . . . . . . . 96custom tool configuration . . . . . . . . . . . . . . . . . . . . . . . . . . 96Custom Tool Configuration (Custom Build options). . . . . 337--cycles (C-SPY command line option) . . . . . . . . . . . . . . 364C++ comments, text style in editor . . . . . . . . . . . . . . . . . . 101C++ keywords, text style in editor . . . . . . . . . . . . . . . . . . 101C++ terminology. . . . . . . . . . . . . . . . . . . . . . . . . . . . . . xxxixC++ tutorial . . . . . . . . . . . . . . . . . . . . . . . . . . . . . . . . . . . . 53C-SPY
batch mode, using in . . . . . . . . . . . . . . . . . . . . . . . . . . 361command line options . . . . . . . . . . . . . . . . . . . . . . . . . 364debugger systems
overview . . . . . . . . . . . . . . . . . . . . . . . . . . . . . . . . . 112environment overview . . . . . . . . . . . . . . . . . . . . . . . . . 113IDE reference information . . . . . . . . . . . . . . . . . . . . . . 273overview . . . . . . . . . . . . . . . . . . . . . . . . . . . . . . . . . . . . . 5plugin modules, loading. . . . . . . . . . . . . . . . . . . . . . . . 116setting up . . . . . . . . . . . . . . . . . . . . . . . . . . . . . . . . . . . 114Simulator . . . . . . . . . . . . . . . . . . . . . . . . . . . . . . . . . . . 161starting the debugger . . . . . . . . . . . . . . . . . . . . . . . . . . 116
C-SPY drivers . . . . . . . . . . . . . . . . . . . . . . . . . . . . . . . . . . . . 6list of available. . . . . . . . . . . . . . . . . . . . . . . . . . . . . . . . . 6simulator . . . . . . . . . . . . . . . . . . . . . . . . . . . . . . . . . . . 161specifying . . . . . . . . . . . . . . . . . . . . . . . . . . . . . . . . . . 357
UEW-8:1
IAR Embedded Workbench® IDEUser Guide
Index
C-SPY expressions . . . . . . . . . . . . . . . . . . . . . . . . . . . . . . 125evaluating. . . . . . . . . . . . . . . . . . . . . . . . . . . . . . . . . . . 129in C-SPY macros . . . . . . . . . . . . . . . . . . . . . . . . . . . . . 371Quick Watch, using . . . . . . . . . . . . . . . . . . . . . . . . . . . 129Tooltip watch, using. . . . . . . . . . . . . . . . . . . . . . . . . . . 128Watch window, using . . . . . . . . . . . . . . . . . . . . . . . . . . 128
C-SPY macros . . . . . . . . . . . . . . . . . . . . . . . . . . . . . 145, 369blocks. . . . . . . . . . . . . . . . . . . . . . . . . . . . . . . . . . . . . . 372conditional statements . . . . . . . . . . . . . . . . . . . . . . . . . 371C-SPY expressions . . . . . . . . . . . . . . . . . . . . . . . . . . . 371dialog box . . . . . . . . . . . . . . . . . . . . . . . . . . . . . . . . . . 307
using . . . . . . . . . . . . . . . . . . . . . . . . . . . . . . . . . . . . 148examples . . . . . . . . . . . . . . . . . . . . . . . . . . . . . . . . . . . 146
checking status of register. . . . . . . . . . . . . . . . . . . . 150checking the status of WDT . . . . . . . . . . . . . . . . . . 150creating a log macro . . . . . . . . . . . . . . . . . . . . . . . . 151execUserSetup . . . . . . . . . . . . . . . . . . . . . . . . . . 61, 67
executing . . . . . . . . . . . . . . . . . . . . . . . . . . . . . . . . . . . 147connecting to a breakpoint . . . . . . . . . . . . . . . . . . . 151using Quick Watch . . . . . . . . . . . . . . . . . . . . . . . . . 150using setup macro and setup file . . . . . . . . . . . . . . . 149
functions . . . . . . . . . . . . . . . . . . . . . . . . . . . . . . . 126, 369loop statements . . . . . . . . . . . . . . . . . . . . . . . . . . . . . . 371macro statements . . . . . . . . . . . . . . . . . . . . . . . . . . . . . 371setup macro file
definition of . . . . . . . . . . . . . . . . . . . . . . . . . . . . . . 147executing. . . . . . . . . . . . . . . . . . . . . . . . . . . . . . . . . 149
setup macro functiondefinition of . . . . . . . . . . . . . . . . . . . . . . . . . . . . . . 147summary . . . . . . . . . . . . . . . . . . . . . . . . . . . . . . . . . 374
system macros, summary of. . . . . . . . . . . . . . . . . . . . . 375using . . . . . . . . . . . . . . . . . . . . . . . . . . . . . . . . . . . . . . 145variables. . . . . . . . . . . . . . . . . . . . . . . . . . . . . . . . 127, 370
C-SPY options . . . . . . . . . . . . . . . . . . . . . . . . . . . . . . . . . 357Extra Options. . . . . . . . . . . . . . . . . . . . . . . . . . . . . . . . 359for the simulator. . . . . . . . . . . . . . . . . . . . . . . . . . . . . . 161in Options dialog box. . . . . . . . . . . . . . . . . . . . . . . . . . 241Plugins . . . . . . . . . . . . . . . . . . . . . . . . . . . . . . . . . . . . . 359Setup . . . . . . . . . . . . . . . . . . . . . . . . . . . . . . . . . . . . . . 357
C-SPY options, definition of. . . . . . . . . . . . . . . . . . . . . . . 397C-SPYLink . . . . . . . . . . . . . . . . . . . . . . . . . . . . . . . . . . . . . . 8C-style preprocessor, definition of . . . . . . . . . . . . . . . . . . 397C/C++ syntax styles, options . . . . . . . . . . . . . . . . . . . . . . 254
D-d (C-SPY command line option) . . . . . . . . . . . . . . . . . . . 365dat (filename extension) . . . . . . . . . . . . . . . . . . . . . . . . . . . 18data breakpoints . . . . . . . . . . . . . . . . . . . . . . . . . . . . . . . . 173data coverage, in Memory window . . . . . . . . . . . . . . . . . . 280data model, definition of . . . . . . . . . . . . . . . . . . . . . . . . . . 397data pointers, definition of . . . . . . . . . . . . . . . . . . . . . . . . 397data representation, definition of. . . . . . . . . . . . . . . . . . . . 397dbg (filename extension). . . . . . . . . . . . . . . . . . . . . . . . . . . 18dbgt (filename extension) . . . . . . . . . . . . . . . . . . . . . . . . . . 18ddf (filename extension) . . . . . . . . . . . . . . . . . . . . . . . . . . . 18
selecting device description file . . . . . . . . . . . . . . . . . . 116Debug info with terminal I/O (linker option) . . . . . . . . . . 295debug information
generating in assembler . . . . . . . . . . . . . . . . . . . . . . . . 333in compiler, generating . . . . . . . . . . . . . . . . . . . . . . . . 323
Debug information for C-SPY (linker option). . . . . . . . . . 342Debug Log window context menu . . . . . . . . . . . . . . . . . . 222Debug Log window (View menu) . . . . . . . . . . . . . . . . . . . 221Debug menu . . . . . . . . . . . . . . . . . . . . . . . . . . . . . . . . . . . 305Debug without downloading text box . . . . . . . . . . . . . . . . 195debugger concepts, definitions of . . . . . . . . . . . . . . . . . . . 111debugger drivers See C-SPY driversdebugger system overview . . . . . . . . . . . . . . . . . . . . . . . . 112Debugger (IDE Options dialog box) . . . . . . . . . . . . . . . . . 259debugging projects
externally built applications . . . . . . . . . . . . . . . . . . . . . 117in disassembly mode, example. . . . . . . . . . . . . . . . . . . . 42loading multiple . . . . . . . . . . . . . . . . . . . . . . . . . . . . . . 117
debugging, RTOS awareness. . . . . . . . . . . . . . . . . . . . . . . . . 8declaration, definition of . . . . . . . . . . . . . . . . . . . . . . . . . . 397default installation path. . . . . . . . . . . . . . . . . . . . . . . . . . . . 15Default integer format (IDE option) . . . . . . . . . . . . . . . . . 260
UEW-8:1
413
414
#define options (linker options) . . . . . . . . . . . . . . . . . . . . 345#define statement, in compiler . . . . . . . . . . . . . . . . . . . . . 326Define symbol (linker option) . . . . . . . . . . . . . . . . . . . . . . 345define (linker options). . . . . . . . . . . . . . . . . . . . . . . . . . . . 345Defined symbols (assembler option) . . . . . . . . . . . . . . . . . 334Defined symbols (compiler option). . . . . . . . . . . . . . . . . . 326definition, definition of . . . . . . . . . . . . . . . . . . . . . . . . . . . 398dep (filename extension) . . . . . . . . . . . . . . . . . . . . . . . . . . . 18derivative, definition of . . . . . . . . . . . . . . . . . . . . . . . . . . . 398description (interrupt property) . . . . . . . . . . . . . . . . . . . . . 185development environment, introduction . . . . . . . . . . . . . . . 75Device description file (C-SPY option). . . . . . . . . . . . . . . 358device description files . . . . . . . . . . . . . . . . . . . . . . . . 16, 116
definition of . . . . . . . . . . . . . . . . . . . . . . . . . . . . . . . . . 398specifying interrupts . . . . . . . . . . . . . . . . . . . . . . . . . . 382
device driver, definition of . . . . . . . . . . . . . . . . . . . . . . . . 398device selection files . . . . . . . . . . . . . . . . . . . . . . . . . . . . . . 16diagnostics
compilerincluding in list file . . . . . . . . . . . . . . . . . . . . . . . . . 324suppressing . . . . . . . . . . . . . . . . . . . . . . . . . . . . . . . 327
linker, suppressing . . . . . . . . . . . . . . . . . . . . . . . . . . . . 347Diagnostics (assembler options) . . . . . . . . . . . . . . . . . . . . 335Diagnostics (compiler options) . . . . . . . . . . . . . . . . . . . . . 326Diagnostics (linker options) . . . . . . . . . . . . . . . . . . . . . . . 346digital signal processor, definition of . . . . . . . . . . . . . . . . 398directories . . . . . . . . . . . . . . . . . . . . . . . . . . . . . . . . . . . . . . 15
assembler, ignore standard include. . . . . . . . . . . . . . . . 333common . . . . . . . . . . . . . . . . . . . . . . . . . . . . . . . . . . . . . 17compiler, ignore standard include . . . . . . . . . . . . . . . . 325root . . . . . . . . . . . . . . . . . . . . . . . . . . . . . . . . . . . . . . . . 15
directory structure. . . . . . . . . . . . . . . . . . . . . . . . . . . . . . . . 15Disable language extensions (compiler option). . . . . . . . . 319__disableInterrupts (C-SPY system macro) . . . . . . . . . . . 378disassembly mode debugging, example . . . . . . . . . . . . . . . 42Disassembly window . . . . . . . . . . . . . . . . . . . . . . . . . . . . 275
context menu . . . . . . . . . . . . . . . . . . . . . . . . . . . . . . . . 277Disassembly window, definition of . . . . . . . . . . . . . . . . . . 398Discard Unused Publics (compiler option) . . . . . . . . . . . . 317
disclaimer . . . . . . . . . . . . . . . . . . . . . . . . . . . . . . . . . . . . . . . iiDLIB library functions, reference information . . . . . . . . . 100dni (filename extension) . . . . . . . . . . . . . . . . . . . . . . . . . . . 18Do not show this window at startup (startup option) . . . . . 272do (macro statement) . . . . . . . . . . . . . . . . . . . . . . . . . . . . 371doc (subdirectory) . . . . . . . . . . . . . . . . . . . . . . . . . . . . . . . . 16dockable windows. . . . . . . . . . . . . . . . . . . . . . . . . . . . . . . . 77document conventions. . . . . . . . . . . . . . . . . . . . . . . . . . xxxixdocumentation . . . . . . . . . . . . . . . . . . . . . . . . . . . . . . . . . . 15
assembler . . . . . . . . . . . . . . . . . . . . . . . . . . . . . . . . . . . . 11compiler. . . . . . . . . . . . . . . . . . . . . . . . . . . . . . . . . . . . . 11linker . . . . . . . . . . . . . . . . . . . . . . . . . . . . . . . . . . . . . . . 12online . . . . . . . . . . . . . . . . . . . . . . . . . . . . . . . . . . . . 16–17other guides . . . . . . . . . . . . . . . . . . . . . . . . . . . . . . . xxxixoverview . . . . . . . . . . . . . . . . . . . . . . . . . . . . . . . . . xxxviproduct. . . . . . . . . . . . . . . . . . . . . . . . . . . . . . . . . . . . . . 20this guide . . . . . . . . . . . . . . . . . . . . . . . . . . . . . . . . . . xxxvXLIB . . . . . . . . . . . . . . . . . . . . . . . . . . . . . . . . . . . . . . . 13
doc, common (subdirectory) . . . . . . . . . . . . . . . . . . . . . . . . 17drag-and-drop
of files in Workspace window . . . . . . . . . . . . . . . . . . . . 84text in editor window . . . . . . . . . . . . . . . . . . . . . . . . . . 101
Driver (C-SPY option) . . . . . . . . . . . . . . . . . . . . . . . . . . . 357drivers (subdirectory) . . . . . . . . . . . . . . . . . . . . . . . . . . . . . 16__driverType (C-SPY system macro) . . . . . . . . . . . . . . . . 378DSP. See digital signal processorDWARF, definition of . . . . . . . . . . . . . . . . . . . . . . . . . . . . 398dxx (filename extension). . . . . . . . . . . . . . . . . . . . . . . . . . . 18Dynamic Data Exchange (DDE). . . . . . . . . . . . . . . . . . . . 106
calling external editor . . . . . . . . . . . . . . . . . . . . . . . . . 252dynamic initialization
definition of . . . . . . . . . . . . . . . . . . . . . . . . . . . . . . . . . 398dynamic memory allocation, definition of . . . . . . . . . . . . 398dynamic object, definition of . . . . . . . . . . . . . . . . . . . . . . 398
EEdit Filename Extensions dialog box (Tools menu) . . . . . 268Edit Interrupt dialog box (Simulator menu) . . . . . . . . . . . 184
UEW-8:1
IAR Embedded Workbench® IDEUser Guide

Index
Edit Memory Access dialog box . . . . . . . . . . . . . . . . . . . . 172Edit menu . . . . . . . . . . . . . . . . . . . . . . . . . . . . . . . . . . . . . 225editing source files . . . . . . . . . . . . . . . . . . . . . . . . . . . . . . . 99edition, user guide. . . . . . . . . . . . . . . . . . . . . . . . . . . . . . . . . iieditor
code templates . . . . . . . . . . . . . . . . . . . . . . . . . . . . . . . 103commands . . . . . . . . . . . . . . . . . . . . . . . . . . . . . . . . . . 101customizing the environment . . . . . . . . . . . . . . . . . . . . 106external . . . . . . . . . . . . . . . . . . . . . . . . . . . . . . . . . . . . 106features . . . . . . . . . . . . . . . . . . . . . . . . . . . . . . . . . . . . . . 5HTML files . . . . . . . . . . . . . . . . . . . . . . . . . . . . . . . . . 204indentation . . . . . . . . . . . . . . . . . . . . . . . . . . . . . . . . . . 102keyboard commands . . . . . . . . . . . . . . . . . . . . . . . . . . 208matching parentheses and brackets . . . . . . . . . . . . . . . 103options . . . . . . . . . . . . . . . . . . . . . . . . . . . . . . . . . . . . . 248shortcut to functions. . . . . . . . . . . . . . . . . . . . . . . 105, 205splitter controls . . . . . . . . . . . . . . . . . . . . . . . . . . . . . . 205status bar, using in . . . . . . . . . . . . . . . . . . . . . . . . . . . . 103using . . . . . . . . . . . . . . . . . . . . . . . . . . . . . . . . . . . . . . . 99
Editor Colors and Fonts (IDE Options dialog box) . . . . . . 254Editor Font (Editor colors and fonts option) . . . . . . . . . . . 254Editor Setup Files (IDE Options dialog box) . . . . . . . . . . 253editor setup files, options . . . . . . . . . . . . . . . . . . . . . . . . . 253Editor window . . . . . . . . . . . . . . . . . . . . . . . . . . . . . . . . . 204
context menu . . . . . . . . . . . . . . . . . . . . . . . . . . . . . . . . 206tab, context menu. . . . . . . . . . . . . . . . . . . . . . . . . . . . . 205
Editor (External editor option) . . . . . . . . . . . . . . . . . . . . . 252Editor (IDE Options dialog box). . . . . . . . . . . . . . . . . . . . 248EEC++ syntax (compiler option) . . . . . . . . . . . . . . . . . . . 318EEPROM, definition of. . . . . . . . . . . . . . . . . . . . . . . . . . . 398Elf, definition of . . . . . . . . . . . . . . . . . . . . . . . . . . . . . . . . 398Embedded C++
definition of . . . . . . . . . . . . . . . . . . . . . . . . . . . . . . . . . 399syntax, enabling in compiler . . . . . . . . . . . . . . . . . . . . 318
Embedded C++ Technical Committee . . . . . . . . . . . . . xxxixEmbedded C++ (compiler option) . . . . . . . . . . . . . . . . . . 318embedded system, definition of . . . . . . . . . . . . . . . . . . . . 399Embedded Workbench
editor . . . . . . . . . . . . . . . . . . . . . . . . . . . . . . . . . . . . . . . 99
exiting from . . . . . . . . . . . . . . . . . . . . . . . . . . . . . . . . . . 77layout . . . . . . . . . . . . . . . . . . . . . . . . . . . . . . . . . . . . . . . 77main window . . . . . . . . . . . . . . . . . . . . . . . . . . . . . 76, 194reference information. . . . . . . . . . . . . . . . . . . . . . . . . . 193running. . . . . . . . . . . . . . . . . . . . . . . . . . . . . . . . . . . . . . 76version number, displaying . . . . . . . . . . . . . . . . . . . . . 271
Embedded Workbench Startup dialog box (Help menu) . . 271emulator (C-SPY driver)
definition of . . . . . . . . . . . . . . . . . . . . . . . . . . . . . . . . . 399third-party . . . . . . . . . . . . . . . . . . . . . . . . . . . . . . . . . . . . 4
Enable graphical stack display and stack usagetracking (Stack option) . . . . . . . . . . . . . . . . . . . . . . . . . . . 261Enable multibyte support (assembler option) . . . . . . . . . . 331Enable multibyte support (compiler option) . . . . . . . . . . . 320Enable remarks (compiler option). . . . . . . . . . . . . . . . . . . 327Enable Virtual Space (editor option) . . . . . . . . . . . . . . . . . 250enabled transformations, in compiler . . . . . . . . . . . . . . . . 322__enableInterrupts (C-SPY system macro) . . . . . . . . . . . . 379Enter Location (Breakpoints dialog box) . . . . . . . . . . . . . 218enumeration, definition of. . . . . . . . . . . . . . . . . . . . . . . . . 399environment variables, as argument variables . . . . . . . . . . 238EOL character (editor option) . . . . . . . . . . . . . . . . . . . . . . 249EPROM, definition of . . . . . . . . . . . . . . . . . . . . . . . . . . . . 398error messages
compiler. . . . . . . . . . . . . . . . . . . . . . . . . . . . . . . . . . . . 328linker . . . . . . . . . . . . . . . . . . . . . . . . . . . . . . . . . . . . . . 347
__evaluate (C-SPY system macro) . . . . . . . . . . . . . . . . . . 379ewd (filename extension) . . . . . . . . . . . . . . . . . . . . . . . . . . 18ewp (filename extension) . . . . . . . . . . . . . . . . . . . . . . . . . . 18ewplugin (filename extension) . . . . . . . . . . . . . . . . . . . . . . 18eww (filename extension) . . . . . . . . . . . . . . . . . . . . . . . . . . 18
the workspace file . . . . . . . . . . . . . . . . . . . . . . . . . . . . . 77$EW_DIR$ (argument variable) . . . . . . . . . . . . . . . . . . . . 237Example applications (Startup option) . . . . . . . . . . . . . . . 272examples
breakpoints . . . . . . . . . . . . . . . . . . . . . . . . . . . . . . . . . . 44executing up to . . . . . . . . . . . . . . . . . . . . . . . . . . . . . 45setting
using dialog box. . . . . . . . . . . . . . . . . . . . . . . . . . 65using macro . . . . . . . . . . . . . . . . . . . . . . . . . . . . . 67
UEW-8:1
415
416
calling convention, examining . . . . . . . . . . . . . . . . . . . . 49compiling. . . . . . . . . . . . . . . . . . . . . . . . . . . . . . . . . . . . 34C-SPY macros . . . . . . . . . . . . . . . . . . . . . . . . . . . . . . . 146C/C++ and assembler, mixing . . . . . . . . . . . . . . . . . . . . 51ddf file, using . . . . . . . . . . . . . . . . . . . . . . . . . . . . . . . . . 63debugging a program . . . . . . . . . . . . . . . . . . . . . . . . . . . 39disassembly mode debugging. . . . . . . . . . . . . . . . . . . . . 42function calls, displaying in C-SPY . . . . . . . . . . . . . . . . 64interrupts
timer . . . . . . . . . . . . . . . . . . . . . . . . . . . . . . . . . . . . 189using macro. . . . . . . . . . . . . . . . . . . . . . . . . . . . . . . . 67
linkinga compiler program. . . . . . . . . . . . . . . . . . . . . . . . . . 37viewing the map file . . . . . . . . . . . . . . . . . . . . . . . . . 38
macroschecking status of register. . . . . . . . . . . . . . . . . . . . 150checking status of WDT . . . . . . . . . . . . . . . . . . . . . 150creating a log macro . . . . . . . . . . . . . . . . . . . . . . . . 151for interrupts and breakpoints . . . . . . . . . . . . . . . . . . 67using Quick Watch . . . . . . . . . . . . . . . . . . . . . . . . . 150
Memory window, using . . . . . . . . . . . . . . . . . . . . . . . . . 46memory, monitoring. . . . . . . . . . . . . . . . . . . . . . . . . . . . 46mixing C and assembler. . . . . . . . . . . . . . . . . . . . . . . . . 49performing tasks without stopping execution. . . . . . . . 138project
adding files . . . . . . . . . . . . . . . . . . . . . . . . . . . . . . . . 32creating . . . . . . . . . . . . . . . . . . . . . . . . . . . . . . . . 29–30
reaching program exit . . . . . . . . . . . . . . . . . . . . . . . . . . 47registers, monitoring . . . . . . . . . . . . . . . . . . . . . . . . . . . 46Scan for Changed Files (editor option), using . . . . . . . . 36setting project options . . . . . . . . . . . . . . . . . . . . . . . . . . 33stepping . . . . . . . . . . . . . . . . . . . . . . . . . . . . . . . . . . . . . 41Terminal I/O, displaying . . . . . . . . . . . . . . . . . . . . . . . . 47tracing incorrect function arguments . . . . . . . . . . . . . . 137using libraries . . . . . . . . . . . . . . . . . . . . . . . . . . . . . . . . 69variables
setting a watch point . . . . . . . . . . . . . . . . . . . . . . . . . 43watching in C-SPY . . . . . . . . . . . . . . . . . . . . . . . . . . 42
viewing assembler list file . . . . . . . . . . . . . . . . . . . . . . . 51
viewing compiler list files . . . . . . . . . . . . . . . . . . . . . . . 35workspace, creating a new . . . . . . . . . . . . . . . . . . . . . . . 29
examples (subdirectory) . . . . . . . . . . . . . . . . . . . . . . . . . . . 16exceptions, definition of . . . . . . . . . . . . . . . . . . . . . . . . . . 399execUserExit (C-SPY setup macro) . . . . . . . . . . . . . . . . . 374execUserFlashExit (C-SPY setup macro) . . . . . . . . . . . . . 374execUserFlashInit (C-SPY setup macro). . . . . . . . . . . . . . 374execUserFlashReset (C-SPY setup macro) . . . . . . . . . . . . 374execUserPreload (C-SPY setup macro). . . . . . . . . . . . . . . 374execUserReset (C-SPY setup macro) . . . . . . . . . . . . . . . . 374execUserSetup (C-SPY setup macro) . . . . . . . . . . . . . . . . 374
example . . . . . . . . . . . . . . . . . . . . . . . . . . . . . . . . . . 61, 67executable image, definition of . . . . . . . . . . . . . . . . . . . . . 399Executable (output directory) . . . . . . . . . . . . . . . . . . . . . . 312executing a program up to a breakpoint . . . . . . . . . . . . . . . 45execution history, tracing . . . . . . . . . . . . . . . . . . . . . . . . . 130execution time, reducing . . . . . . . . . . . . . . . . . . . . . . . . . . 153$EXE_DIR$ (argument variable) . . . . . . . . . . . . . . . . . . . 237Exit (File menu) . . . . . . . . . . . . . . . . . . . . . . . . . . . . . . . . . 77exit, of user application. . . . . . . . . . . . . . . . . . . . . . . . . . . 123expensive memory access, definition of . . . . . . . . . . . . . . 399expressions. See C-SPY expressionsextended command line file . . . . . . . . . . . . . . . . . . . . . . . . 19
specifying for pre- and post-build actions . . . . . . . . . . 339Extended Embedded C++ syntax, enabling in compiler . . 318extended keywords
definition of . . . . . . . . . . . . . . . . . . . . . . . . . . . . . . . . . 399example of using __interrupt . . . . . . . . . . . . . . . . . . . . . 60
extensions. See filename extensions or language extensionsExternal Editor (IDE Options dialog box). . . . . . . . . . . . . 251external editor, using. . . . . . . . . . . . . . . . . . . . . . . . . . . . . 106Extra Options
for assembler . . . . . . . . . . . . . . . . . . . . . . . . . . . . . . . . 335for compiler . . . . . . . . . . . . . . . . . . . . . . . . . . . . . . . . . 328for C-SPY . . . . . . . . . . . . . . . . . . . . . . . . . . . . . . . . . . 359for linker . . . . . . . . . . . . . . . . . . . . . . . . . . . . . . . . . . . 354
Extra Output (linker options) . . . . . . . . . . . . . . . . . . . . . . 344
UEW-8:1
IAR Embedded Workbench® IDEUser Guide
Index
Ffactory settings
linker . . . . . . . . . . . . . . . . . . . . . . . . . . . . . . . . . . . . . . 356restoring default settings . . . . . . . . . . . . . . . . . . . . . . . . 93
featuresassembler . . . . . . . . . . . . . . . . . . . . . . . . . . . . . . . . . . . . 11compiler. . . . . . . . . . . . . . . . . . . . . . . . . . . . . . . . . . . . . . 9editor . . . . . . . . . . . . . . . . . . . . . . . . . . . . . . . . . . . . . . . . 5librarian . . . . . . . . . . . . . . . . . . . . . . . . . . . . . . . . . . . . . 13source code control . . . . . . . . . . . . . . . . . . . . . . . . . . . . . 4
file extensions. See filename extensionsFile menu . . . . . . . . . . . . . . . . . . . . . . . . . . . . . . . . . . . . . 222file types
device description . . . . . . . . . . . . . . . . . . . . . . . . . . . . . 16specifying in Embedded Workbench. . . . . . . . . . . . 116
device selection . . . . . . . . . . . . . . . . . . . . . . . . . . . . . . . 16documentation . . . . . . . . . . . . . . . . . . . . . . . . . . . . . . . . 16drivers . . . . . . . . . . . . . . . . . . . . . . . . . . . . . . . . . . . . . . 16extended command line . . . . . . . . . . . . . . . . . . . . . . . . . 19flash loader applications . . . . . . . . . . . . . . . . . . . . . . . . 16header . . . . . . . . . . . . . . . . . . . . . . . . . . . . . . . . . . . . . . 16include . . . . . . . . . . . . . . . . . . . . . . . . . . . . . . . . . . . . . . 16library . . . . . . . . . . . . . . . . . . . . . . . . . . . . . . . . . . . . . . 16linker command file templates . . . . . . . . . . . . . . . . . . . . 16macro . . . . . . . . . . . . . . . . . . . . . . . . . . . . . . . . . . 115, 358map . . . . . . . . . . . . . . . . . . . . . . . . . . . . . . . . . . . . . . . 348project templates . . . . . . . . . . . . . . . . . . . . . . . . . . . . . . 16readme . . . . . . . . . . . . . . . . . . . . . . . . . . . . . . . . . . . 16–17special function registers description files . . . . . . . . . . . 16syntax coloring configuration. . . . . . . . . . . . . . . . . . . . . 16
filename extensions. . . . . . . . . . . . . . . . . . . . . . . . . . . . . . . 17cfg, syntax highlighting . . . . . . . . . . . . . . . . . . . . . . . . 255ddf, selecting device description file . . . . . . . . . . . . . . 116eww, the workspace file . . . . . . . . . . . . . . . . . . . . . . . . . 77mac
the macro file . . . . . . . . . . . . . . . . . . . . . . . . . . . . . 146using macro file . . . . . . . . . . . . . . . . . . . . . . . . . . . 115
map, linker listing . . . . . . . . . . . . . . . . . . . . . . . . . . . . . 20
other than default . . . . . . . . . . . . . . . . . . . . . . . . . . . . . . 19xcl, linker command file . . . . . . . . . . . . . . . . . . . . . . . . 37
Filename Extensions dialog box (Tools menu) . . . . . . . . . 267Filename Extensions Overrides dialog box (Tools menu) . 268files
adding to a project . . . . . . . . . . . . . . . . . . . . . . . . . . . . . 32checking in and out . . . . . . . . . . . . . . . . . . . . . . . . . . . . 89compiling, example . . . . . . . . . . . . . . . . . . . . . . . . . . . . 34editing . . . . . . . . . . . . . . . . . . . . . . . . . . . . . . . . . . . . . . 99navigating among. . . . . . . . . . . . . . . . . . . . . . . . . . . . . . 85readme.htm . . . . . . . . . . . . . . . . . . . . . . . . . . . . . . . . . . 20
$FILE_DIR$ (argument variable) . . . . . . . . . . . . . . . . . . . 237$FILE_FNAME$ (argument variable) . . . . . . . . . . . . . . . 237$FILE_PATH$ (argument variable) . . . . . . . . . . . . . . . . . 237Fill dialog box (Memory window) . . . . . . . . . . . . . . . . . . 282Fill pattern (linker option). . . . . . . . . . . . . . . . . . . . . . . . . 352Fill unused code memory (linker option) . . . . . . . . . . . . . 352filling, definition of. . . . . . . . . . . . . . . . . . . . . . . . . . . . . . 399Filter Files (Register filter option). . . . . . . . . . . . . . . . . . . 263Find dialog box (Edit menu) . . . . . . . . . . . . . . . . . . . . . . . 228Find in Files dialog box (Edit menu) . . . . . . . . . . . . . . . . 229Find in Files window (View menu) . . . . . . . . . . . . . . . . . . 219
context menu . . . . . . . . . . . . . . . . . . . . . . . . . . . . . . . . 220Find in Trace dialog box . . . . . . . . . . . . . . . . . . . . . . . . . . 167Find in Trace window . . . . . . . . . . . . . . . . . . . . . . . . . . . . 167Find Next (button) . . . . . . . . . . . . . . . . . . . . . . . . . . . . . . 195Find Previous (button) . . . . . . . . . . . . . . . . . . . . . . . . . . . 195Find (button) . . . . . . . . . . . . . . . . . . . . . . . . . . . . . . . . . . . 195first activation time (interrupt property) . . . . . . . . . . . . . . 185
definition of . . . . . . . . . . . . . . . . . . . . . . . . . . . . . . . . . 180Fixed width font (IDE option). . . . . . . . . . . . . . . . . . . . . . 245flash loader applications . . . . . . . . . . . . . . . . . . . . . . . . . . . 16flash memory
load library module to . . . . . . . . . . . . . . . . . . . . . . . . . 380loading externally built applications to . . . . . . . . . . . . 117
--flash_loader (C-SPY command line option). . . . . . . . . . 365floating windows . . . . . . . . . . . . . . . . . . . . . . . . . . . . . . . . 77fmt (filename extension) . . . . . . . . . . . . . . . . . . . . . . . . . . . 18
UEW-8:1
417
418
fontEditor . . . . . . . . . . . . . . . . . . . . . . . . . . . . . . . . . . . . . . 254Fixed width . . . . . . . . . . . . . . . . . . . . . . . . . . . . . . . . . 245Proportional width . . . . . . . . . . . . . . . . . . . . . . . . . . . . 245
for (macro statement) . . . . . . . . . . . . . . . . . . . . . . . . . . . . 371Forced Interrupt window (Simulator menu) . . . . . . . . . . . 185format specifiers, definition of . . . . . . . . . . . . . . . . . . . . . 399Format (linker option). . . . . . . . . . . . . . . . . . . . . . . . . . . . 342formats
assembler list file . . . . . . . . . . . . . . . . . . . . . . . . . . . . . . 51compiler list file . . . . . . . . . . . . . . . . . . . . . . . . . . . . . . . 35C-SPY input. . . . . . . . . . . . . . . . . . . . . . . . . . . . . . . . . . . 8linker output
default, overriding. . . . . . . . . . . . . . . . . . . . . . 343–344specifying . . . . . . . . . . . . . . . . . . . . . . . . . . . . . . . . 342
function calls, displaying in C-SPY . . . . . . . . . . . . . . . . . . 64function level profiling . . . . . . . . . . . . . . . . . . . . . . . . . . . 153Function Trace (C-SPY window) . . . . . . . . . . . . . . . . . . . 164function trace, definition of. . . . . . . . . . . . . . . . . . . . . . . . 163functions
C-SPY running to when starting . . . . . . . . . . . . . 115, 358intrinsic, definition of. . . . . . . . . . . . . . . . . . . . . . . . . . 401shortcut to in editor windows. . . . . . . . . . . . . . . . 105, 205
Ggeneral options . . . . . . . . . . . . . . . . . . . . . . . . . . . . . . . . . 311
specifying, example . . . . . . . . . . . . . . . . . . . . . . . . . . . . 33Library Configuration . . . . . . . . . . . . . . . . . . . . . . . . . 313Library Options . . . . . . . . . . . . . . . . . . . . . . . . . . . . . . 314Output . . . . . . . . . . . . . . . . . . . . . . . . . . . . . . . . . . . . . 311Stack/Heap options . . . . . . . . . . . . . . . . . . . . . . . . . . . 315Target . . . . . . . . . . . . . . . . . . . . . . . . . . . . . . . . . . . . . . 311
general options, definition of . . . . . . . . . . . . . . . . . . . . . . 399Generate browse information (IDE Project options) . . . . . 258Generate checksum (linker option) . . . . . . . . . . . . . . . . . . 352Generate debug info (assembler option) . . . . . . . . . . . . . . 333Generate debug information (compiler option) . . . . . . . . . 323Generate extra output file (linker option) . . . . . . . . . . . . . 344
Generate linker listing (linker option) . . . . . . . . . . . . . . . . 348generating extra output file . . . . . . . . . . . . . . . . . . . . . . . . 343generic pointers, definition of . . . . . . . . . . . . . . . . . . . . . . 400glossary. . . . . . . . . . . . . . . . . . . . . . . . . . . . . . . . . . . . . . . 395Go to Bookmark (button) . . . . . . . . . . . . . . . . . . . . . . . . . 195Go to function (editor button) . . . . . . . . . . . . . . . . . . 105, 205Go to Line dialog box . . . . . . . . . . . . . . . . . . . . . . . . . . . . 226Go To (button) . . . . . . . . . . . . . . . . . . . . . . . . . . . . . . . . . 195Go (button) . . . . . . . . . . . . . . . . . . . . . . . . . . . . . . . . . . . . 275Go (Debug menu) . . . . . . . . . . . . . . . . . . . . . . . . . . . . . . . 122Group members (Register filter option) . . . . . . . . . . . . . . 263Groups (Register filter option) . . . . . . . . . . . . . . . . . . . . . 263groups, definition of . . . . . . . . . . . . . . . . . . . . . . . . . . . . . . 83
Hh (filename extension). . . . . . . . . . . . . . . . . . . . . . . . . . . . . 18Harvard architecture, definition of . . . . . . . . . . . . . . . . . . 400header files . . . . . . . . . . . . . . . . . . . . . . . . . . . . . . . . . . . . . 16
quick access to . . . . . . . . . . . . . . . . . . . . . . . . . . . . . . . 105heap memory, definition of . . . . . . . . . . . . . . . . . . . . . . . . 400heap size
definition of . . . . . . . . . . . . . . . . . . . . . . . . . . . . . . . . . 400specifying from IDE . . . . . . . . . . . . . . . . . . . . . . . . . . 315
Help menu . . . . . . . . . . . . . . . . . . . . . . . . . . . . . . . . . . . . 271helpfiles (filename extension) . . . . . . . . . . . . . . . . . . . . . . . 18highlighting, in C-SPY . . . . . . . . . . . . . . . . . . . . . . . . . . . 122hold time (interrupt property) . . . . . . . . . . . . . . . . . . . . . . 185
definition of . . . . . . . . . . . . . . . . . . . . . . . . . . . . . . . . . 180host, definition of . . . . . . . . . . . . . . . . . . . . . . . . . . . . . . . 400htm (filename extension) . . . . . . . . . . . . . . . . . . . . . . . . . . 18html (filename extension) . . . . . . . . . . . . . . . . . . . . . . . . . . 18
Ii (filename extension) . . . . . . . . . . . . . . . . . . . . . . . . . . . . . 18IAR Assembler Reference Guide . . . . . . . . . . . . . . . . . . . . 21IAR Compiler Reference Guide . . . . . . . . . . . . . . . . . . . . . 20IAR Linker and Library Tools Reference Guide . . . . . . . . . 21
UEW-8:1
IAR Embedded Workbench® IDEUser Guide
Index
IAR Systems web site . . . . . . . . . . . . . . . . . . . . . . . . . . . . . 21iarbuild, building from the command line . . . . . . . . . . . . . . 95IarIdePm.exe. . . . . . . . . . . . . . . . . . . . . . . . . . . . . . . . . . . . 76icons, in this guide . . . . . . . . . . . . . . . . . . . . . . . . . . . . . . . xlIDE . . . . . . . . . . . . . . . . . . . . . . . . . . . . . . . . . . . . . . . . . . 3–4
definition of . . . . . . . . . . . . . . . . . . . . . . . . . . . . . . . . . 400if else (macro statement) . . . . . . . . . . . . . . . . . . . . . . . . . . 371if (macro statement) . . . . . . . . . . . . . . . . . . . . . . . . . . . . . 371Ignore standard include directories (assembler option) . . . 333Ignore standard include directories (compiler option). . . . 325ILINK
definition of . . . . . . . . . . . . . . . . . . . . . . . . . . . . . . . . . 400See linker
illegal memory accesses, checking for . . . . . . . . . . . . . . . 169immediate breakpoints . . . . . . . . . . . . . . . . . . . . . . . . . . . 176inc (filename extension) . . . . . . . . . . . . . . . . . . . . . . . . . . . 18inc (subdirectory) . . . . . . . . . . . . . . . . . . . . . . . . . . . . . . . . 16Include compiler call frameinformation (compiler option). . . . . . . . . . . . . . . . . . . . . . 324include files. . . . . . . . . . . . . . . . . . . . . . . . . . . . . . . . . . . . . 16
assembler, specifying path . . . . . . . . . . . . . . . . . . . . . . 333compiler, specifying path . . . . . . . . . . . . . . . . . . . . . . . 325definition of . . . . . . . . . . . . . . . . . . . . . . . . . . . . . . . . . 400linker, specifying path . . . . . . . . . . . . . . . . . . . . . . . . . 351
Include source (compiler option) . . . . . . . . . . . . . . . . . . . 324Include suppressed entries (linker option). . . . . . . . . . . . . 349Incremental Search dialog box (Edit menu) . . . . . . . . . . . 231Indent Size (editor option) . . . . . . . . . . . . . . . . . . . . . . . . 248indentation, in editor . . . . . . . . . . . . . . . . . . . . . . . . . . . . . 102information, product . . . . . . . . . . . . . . . . . . . . . . . . . . . . . . 20inherited settings, overriding. . . . . . . . . . . . . . . . . . . . . . . . 92ini (filename extension) . . . . . . . . . . . . . . . . . . . . . . . . . . . 18inline assembler
definition of . . . . . . . . . . . . . . . . . . . . . . . . . . . . . . . . . 400language facilities in compiler . . . . . . . . . . . . . . . . . . . . 10
inlining, definition of . . . . . . . . . . . . . . . . . . . . . . . . . . . . 400input
redirecting to Terminal I/O window . . . . . . . . . . . . . . . 295special characters in Terminal I/O window . . . . . . . . . 295
input formats, C-SPY . . . . . . . . . . . . . . . . . . . . . . . . . . . . . . 8
Input Mode dialog box . . . . . . . . . . . . . . . . . . . . . . . . . . . 296insertion point, shortcut key for moving . . . . . . . . . . . . . . 101installation path, default . . . . . . . . . . . . . . . . . . . . . . . . . . . 15installed files. . . . . . . . . . . . . . . . . . . . . . . . . . . . . . . . . . . . 15
documentation . . . . . . . . . . . . . . . . . . . . . . . . . . . . . 16–17executable . . . . . . . . . . . . . . . . . . . . . . . . . . . . . . . . . . . 17include . . . . . . . . . . . . . . . . . . . . . . . . . . . . . . . . . . . . . . 16library . . . . . . . . . . . . . . . . . . . . . . . . . . . . . . . . . . . . . . 16
instruction mnemonics, definition of. . . . . . . . . . . . . . . . . 400Integrated Development Environment (IDE). . . . . . . . . . . 3–4
definition of . . . . . . . . . . . . . . . . . . . . . . . . . . . . . . . . . 400Intel-extended, C-SPY input format . . . . . . . . . . . . . . . 8, 113Internet, IAR Systems web site . . . . . . . . . . . . . . . . . . . . . . 21Interrupt Log window (Simulator menu). . . . . . . . . . . . . . 187Interrupt Setup dialog box (Simulator menu) . . . . . . . . . . 183interrupt system, using device description file . . . . . . . . . 183interrupt vector
definition of . . . . . . . . . . . . . . . . . . . . . . . . . . . . . . . . . 400specifying address for, example . . . . . . . . . . . . . . . . . . . 60
interrupt vector table, definition of . . . . . . . . . . . . . . . . . . 400interrupts
adapting C-SPY system for target hardware . . . . . . . . 182definition of . . . . . . . . . . . . . . . . . . . . . . . . . . . . . . . . . 400nested, definition of . . . . . . . . . . . . . . . . . . . . . . . . . . . 402options . . . . . . . . . . . . . . . . . . . . . . . . . . . . . . . . . . . . . 184simulated, definition of . . . . . . . . . . . . . . . . . . . . . . . . 179timer example . . . . . . . . . . . . . . . . . . . . . . . . . . . . . . . 189using system macros . . . . . . . . . . . . . . . . . . . . . . . . . . 186
intrinsic functionsdefinition of . . . . . . . . . . . . . . . . . . . . . . . . . . . . . . . . . 401language facilities in compiler . . . . . . . . . . . . . . . . . . . . 10
intrinsic, definition of . . . . . . . . . . . . . . . . . . . . . . . . . . . . 401ISO/ANSI C
making compiler adhering to . . . . . . . . . . . . . . . . . . . . 319sizeof operator in C-SPY . . . . . . . . . . . . . . . . . . . . . . . 126
italic style, in this guide . . . . . . . . . . . . . . . . . . . . . . . . . . . xlixx (filename extension) . . . . . . . . . . . . . . . . . . . . . . . . . . . 18
UEW-8:1
419
420
KKey bindings (IDE Options dialog box) . . . . . . . . . . . . . . 246key bindings, definition of . . . . . . . . . . . . . . . . . . . . . . . . 401key summary, editor . . . . . . . . . . . . . . . . . . . . . . . . . . . . . 208keywords, definition of . . . . . . . . . . . . . . . . . . . . . . . . . . . 401
LLabel (c) (Configure auto indent option). . . . . . . . . . . . . . 251labels (assembler), viewing. . . . . . . . . . . . . . . . . . . . . . . . 130Language conformance (compiler option) . . . . . . . . . . . . 319language extensions
definition of . . . . . . . . . . . . . . . . . . . . . . . . . . . . . . . . . 401disabling in compiler . . . . . . . . . . . . . . . . . . . . . . . . . . 319
language facilities, in compiler . . . . . . . . . . . . . . . . . . . . . . 10Language (assembler options). . . . . . . . . . . . . . . . . . . . . . 331Language (compiler options) . . . . . . . . . . . . . . . . . . . . . . 318Language (IDE Options dialog box) . . . . . . . . . . . . . . . . . 247Language (Language option) . . . . . . . . . . . . . . . . . . . . . . 247layout, of Embedded Workbench . . . . . . . . . . . . . . . . . . . . 77lib (subdirectory) . . . . . . . . . . . . . . . . . . . . . . . . . . . . . . . . 16librarian
documentation . . . . . . . . . . . . . . . . . . . . . . . . . . . . . . . . 21features . . . . . . . . . . . . . . . . . . . . . . . . . . . . . . . . . . . . . 13overview . . . . . . . . . . . . . . . . . . . . . . . . . . . . . . . . . . . . 13
librarycreating a project for . . . . . . . . . . . . . . . . . . . . . . . . . . . 70runtime. . . . . . . . . . . . . . . . . . . . . . . . . . . . . . . . . . . . . . 10
library builderdocumentation . . . . . . . . . . . . . . . . . . . . . . . . . . . . . . . . 21output options . . . . . . . . . . . . . . . . . . . . . . . . . . . . . . . 355overview . . . . . . . . . . . . . . . . . . . . . . . . . . . . . . . . . . . . 13using for building libraries . . . . . . . . . . . . . . . . . . . . . . . 69
library configuration filedefinition of . . . . . . . . . . . . . . . . . . . . . . . . . . . . . . . . . 401specifying from IDE . . . . . . . . . . . . . . . . . . . . . . . . . . 313
Library Configuration (general options) . . . . . . . . . . . . . . 313Library file (general option) . . . . . . . . . . . . . . . . . . . . . . . 313
library files . . . . . . . . . . . . . . . . . . . . . . . . . . . . . . . . . . 13, 16library functions
configurable . . . . . . . . . . . . . . . . . . . . . . . . . . . . . . . . . . 16reference information. . . . . . . . . . . . . . . . . . . . . . . . . . 100
library modulesexample . . . . . . . . . . . . . . . . . . . . . . . . . . . . . . . . . . . . . 69specifying in compiler . . . . . . . . . . . . . . . . . . . . . . . . . 323using . . . . . . . . . . . . . . . . . . . . . . . . . . . . . . . . . . . . . . . 69
Library Options (general options) . . . . . . . . . . . . . . . . . . . 314Library (general option) . . . . . . . . . . . . . . . . . . . . . . . . . . 313library, definition of . . . . . . . . . . . . . . . . . . . . . . . . . . . . . 405lightbulb icon, in this guide. . . . . . . . . . . . . . . . . . . . . . . . . xl#line directives, generating
in assembler . . . . . . . . . . . . . . . . . . . . . . . . . . . . . . . . . 334in compiler. . . . . . . . . . . . . . . . . . . . . . . . . . . . . . . . . . 326
Lines/page (linker option). . . . . . . . . . . . . . . . . . . . . . . . . 349linker
command line version . . . . . . . . . . . . . . . . . . . . . . . . . . 75diagnostics, suppressing. . . . . . . . . . . . . . . . . . . . . . . . 347documentation . . . . . . . . . . . . . . . . . . . . . . . . . . . . . . . . 21overriding default output . . . . . . . . . . . . . . . . . . . 343–344overview . . . . . . . . . . . . . . . . . . . . . . . . . . . . . . . . . . . . 12
linker command file . . . . . . . . . . . . . . . . . . . . . . . . . . . . . . 37definition of . . . . . . . . . . . . . . . . . . . . . . . . . . . . . . . . . 401overriding default. . . . . . . . . . . . . . . . . . . . . . . . . . . . . 350path, specifying . . . . . . . . . . . . . . . . . . . . . . . . . . . . . . 351specifying in linker . . . . . . . . . . . . . . . . . . . . . . . . . . . 350templates . . . . . . . . . . . . . . . . . . . . . . . . . . . . . . . . . . . . 16
Linker command file configuration tool . . . . . . . . . . . . . . 350Linker command file (linker option) . . . . . . . . . . . . . . . . . 350linker list files
generating . . . . . . . . . . . . . . . . . . . . . . . . . . . . . . . . . . 348including segment map . . . . . . . . . . . . . . . . . . . . . . . . 348specifying lines per page . . . . . . . . . . . . . . . . . . . . . . . 349
linker options . . . . . . . . . . . . . . . . . . . . . . . . . . . . . . . . . . 341factory settings. . . . . . . . . . . . . . . . . . . . . . . . . . . . . . . 356Config . . . . . . . . . . . . . . . . . . . . . . . . . . . . . . . . . . . . . 350define . . . . . . . . . . . . . . . . . . . . . . . . . . . . . . . . . . . . . . 345Diagnostics . . . . . . . . . . . . . . . . . . . . . . . . . . . . . . . . . 346
UEW-8:1
IAR Embedded Workbench® IDEUser Guide

Index
Extra Options. . . . . . . . . . . . . . . . . . . . . . . . . . . . . . . . 354Extra Output . . . . . . . . . . . . . . . . . . . . . . . . . . . . . . . . 344List. . . . . . . . . . . . . . . . . . . . . . . . . . . . . . . . . . . . . . . . 348Output . . . . . . . . . . . . . . . . . . . . . . . . . . . . . . . . . . . . . 341With I/O emulation modules . . . . . . . . . . . . . . . . . . . . 342
linker symbols, defining . . . . . . . . . . . . . . . . . . . . . . . . . . 345linking, example . . . . . . . . . . . . . . . . . . . . . . . . . . . . . . . . . 37list files
assembler . . . . . . . . . . . . . . . . . . . . . . . . . . . . . . . . . . . . 51compiler runtime information
compilerassembler mnemonics, including . . . . . . . . . . . . . . 324example. . . . . . . . . . . . . . . . . . . . . . . . . . . . . . . . . . . 35generating . . . . . . . . . . . . . . . . . . . . . . . . . . . . . . . . 324source code, including . . . . . . . . . . . . . . . . . . . . . . 324
linkergenerating . . . . . . . . . . . . . . . . . . . . . . . . . . . . . . . . 348including segment map . . . . . . . . . . . . . . . . . . . . . . 348specifying lines per page. . . . . . . . . . . . . . . . . . . . . 349
option for specifying destination . . . . . . . . . . . . . . . . . 312List (assembler options) . . . . . . . . . . . . . . . . . . . . . . . . . . 333List (compiler options) . . . . . . . . . . . . . . . . . . . . . . . . . . . 323List (linker options) . . . . . . . . . . . . . . . . . . . . . . . . . . . . . 348$LIST_DIR$ (argument variable) . . . . . . . . . . . . . . . . . . . 237Live Watch window . . . . . . . . . . . . . . . . . . . . . . . . . . . . . 290
context menu . . . . . . . . . . . . . . . . . . . . . . . . . . . . 290–291loading multiple debug files . . . . . . . . . . . . . . . . . . . . . . . 117__loadModule(C-SPY system macro). . . . . . . . . . . . . . . . 380Locals window . . . . . . . . . . . . . . . . . . . . . . . . . . . . . . . . . 289
context menu . . . . . . . . . . . . . . . . . . . . . . . . . . . . . . . . 289location counter, definition of . . . . . . . . . . . . . . . . . . . . . . 404-log (iarbuild command line option) . . . . . . . . . . . . . . . . . . 95Log File dialog box (Debug menu) . . . . . . . . . . . . . . . . . . 308log (filename extension) . . . . . . . . . . . . . . . . . . . . . . . . . . . 18logical address, definition of . . . . . . . . . . . . . . . . . . . . . . . 408loop statements, in C-SPY macros . . . . . . . . . . . . . . . . . . 371lst (filename extension). . . . . . . . . . . . . . . . . . . . . . . . . . . . 18L-value, definition of . . . . . . . . . . . . . . . . . . . . . . . . . . . . 401
Mmac (filename extension) . . . . . . . . . . . . . . . . . . . . . . . . . . 19
the macro file . . . . . . . . . . . . . . . . . . . . . . . . . . . . . . . . 146using a macro file. . . . . . . . . . . . . . . . . . . . . . . . . . . . . 115
--macro (C-SPY command line option) . . . . . . . . . . . . . . 365Macro Configuration dialog box (Debug menu) . . . . . . . . 307macro files, specifying . . . . . . . . . . . . . . . . . . . . . . . 115, 358Macro quote characters (assembler option). . . . . . . . . . . . 332macro statements . . . . . . . . . . . . . . . . . . . . . . . . . . . . . . . 371macros
definition of . . . . . . . . . . . . . . . . . . . . . . . . . . . . . . . . . 401executing . . . . . . . . . . . . . . . . . . . . . . . . . . . . . . . . . . . 147system . . . . . . . . . . . . . . . . . . . . . . . . . . . . . . . . . . . . . 369using . . . . . . . . . . . . . . . . . . . . . . . . . . . . . . . . . . . . . . 145
MAC, definition of . . . . . . . . . . . . . . . . . . . . . . . . . . . . . . 401mailbox (RTOS), definition of . . . . . . . . . . . . . . . . . . . . . 402main function, C-SPY running to when starting . . . . 115, 358main.sxx (assembler tutorial file) . . . . . . . . . . . . . . . . . . . . 69-make (iarbuild command line option) . . . . . . . . . . . . . . . . 95Make before debugging (IDE Project options) . . . . . . . . . 257managing projects . . . . . . . . . . . . . . . . . . . . . . . . . . . . . . . . . 4map files . . . . . . . . . . . . . . . . . . . . . . . . . . . . . . . . . . . . . . 348
example . . . . . . . . . . . . . . . . . . . . . . . . . . . . . . . . . . . . . 38viewing . . . . . . . . . . . . . . . . . . . . . . . . . . . . . . . . . . . . . 38
map (filename extension) . . . . . . . . . . . . . . . . . . . . . . . . . . 19linker listing. . . . . . . . . . . . . . . . . . . . . . . . . . . . . . . . . . 20
--mapu (C-SPY command line option) . . . . . . . . . . . . . . . 366maxmin.sxx (assembler tutorial file). . . . . . . . . . . . . . . . . . 69memory
filling unused . . . . . . . . . . . . . . . . . . . . . . . . . . . . . . . . 352monitoring, example . . . . . . . . . . . . . . . . . . . . . . . . . . . 46
memory access checking. . . . . . . . . . . . . . . . . . . . . . 169, 171memory access cost, definition of . . . . . . . . . . . . . . . . . . . 402Memory Access Setup dialog box (Simulator menu) . . . . 169memory accesses, illegal. . . . . . . . . . . . . . . . . . . . . . . . . . 169memory area, definition of . . . . . . . . . . . . . . . . . . . . . . . . 402memory bank, definition of. . . . . . . . . . . . . . . . . . . . . . . . 402
UEW-8:1
421
422
memory map . . . . . . . . . . . . . . . . . . . . . . . . . . . . . . . . . . . 169definition of . . . . . . . . . . . . . . . . . . . . . . . . . . . . . . . . . 402
memory model, definition of. . . . . . . . . . . . . . . . . . . . . . . 402Memory Restore dialog box . . . . . . . . . . . . . . . . . . . . . . . 284Memory Save dialog box . . . . . . . . . . . . . . . . . . . . . . . . . 283memory usage, summary of . . . . . . . . . . . . . . . . . . . . . . . 349Memory window. . . . . . . . . . . . . . . . . . . . . . . . . . . . . . . . 278
context menu . . . . . . . . . . . . . . . . . . . . . . . . . . . . . . . . 280memory zones. . . . . . . . . . . . . . . . . . . . . . . . . . . . . . . . . . 141menu bar . . . . . . . . . . . . . . . . . . . . . . . . . . . . . . . . . . . . . . 194
C-SPY-specific. . . . . . . . . . . . . . . . . . . . . . . . . . . . . . . 274menu (filename extension) . . . . . . . . . . . . . . . . . . . . . . . . . 19Menu (Key bindings option) . . . . . . . . . . . . . . . . . . . . . . . 246menus . . . . . . . . . . . . . . . . . . . . . . . . . . . . . . . . . . . . . . . . 222
specific to C-SPY. . . . . . . . . . . . . . . . . . . . . . . . . . . . . 304Messages window, amount of output . . . . . . . . . . . . . . . . 255Messages (IDE Options dialog box) . . . . . . . . . . . . . . . . . 255metadata (subdirectory) . . . . . . . . . . . . . . . . . . . . . . . . . . . 17microcontroller, definition of . . . . . . . . . . . . . . . . . . . . . . 402microprocessor, definition of . . . . . . . . . . . . . . . . . . . . . . 402migration, from earlier IAR compilers . . . . . . . . . . . . . . . 320module map, in map files . . . . . . . . . . . . . . . . . . . . . . . . . . 38Module summary (linker option) . . . . . . . . . . . . . . . . . . . 349Module type (compiler option) . . . . . . . . . . . . . . . . . . . . . 323MODULE (assembler directive) . . . . . . . . . . . . . . . . . . . . . 70modules
definition of . . . . . . . . . . . . . . . . . . . . . . . . . . . . . . . . . 402including local symbols in input . . . . . . . . . . . . . . . . . 343
Module-local symbols (linker option). . . . . . . . . . . . . . . . 343Motorola, C-SPY input format . . . . . . . . . . . . . . . . . . . 8, 113Multiply and accumulate, definition of . . . . . . . . . . . . . . . 401multitasking, definition of. . . . . . . . . . . . . . . . . . . . . . . . . 403multi-file compilation
definition of . . . . . . . . . . . . . . . . . . . . . . . . . . . . . . . . . 402specifying options for . . . . . . . . . . . . . . . . . . . . . . . . . 317
Nnaming conventions . . . . . . . . . . . . . . . . . . . . . . . . . . . . . . xl
Navigate Backward (button) . . . . . . . . . . . . . . . . . . . . . . . 195NDEBUG, preprocessor symbol . . . . . . . . . . . . . . . . . . . . . 83nested interrupts, definition of . . . . . . . . . . . . . . . . . . . . . 402New Configuration dialog box (Project menu) . . . . . . . . . 239New Document (button) . . . . . . . . . . . . . . . . . . . . . . . . . . 195New Group (Register filter option) . . . . . . . . . . . . . . . . . . 263Next Statement (button) . . . . . . . . . . . . . . . . . . . . . . . . . . 275No global type checking (linker option) . . . . . . . . . . . . . . 346non-banked memory, definition of . . . . . . . . . . . . . . . . . . 402non-initialized memory, definition of . . . . . . . . . . . . . . . . 403non-volatile storage, definition of . . . . . . . . . . . . . . . . . . . 403NOP, definition of . . . . . . . . . . . . . . . . . . . . . . . . . . . . . . . 403
Oobject file (absolute), definition of . . . . . . . . . . . . . . . . . . 403object file (relocatable), definition of . . . . . . . . . . . . . . . . 403object files, specifying output directory for. . . . . . . . . . . . 312object, definition of. . . . . . . . . . . . . . . . . . . . . . . . . . . . . . 403$OBJ_DIR$ (argument variable) . . . . . . . . . . . . . . . . . . . 237online documentation
available from Help menu . . . . . . . . . . . . . . . . . . . . . . 271common, in directory. . . . . . . . . . . . . . . . . . . . . . . . . . . 17target-specific, in directory . . . . . . . . . . . . . . . . . . . . . . 16
online help . . . . . . . . . . . . . . . . . . . . . . . . . . . . . . . . . . . . . 21Open existing workspace (Startup option) . . . . . . . . . . . . 271Open Workspace (File menu) . . . . . . . . . . . . . . . . . . . . . . 223__openFile (C-SPY system macro). . . . . . . . . . . . . . . . . . 381Opening Brace (a) (Configure auto indent option) . . . . . . 251operator precedence, definition of. . . . . . . . . . . . . . . . . . . 403operators
definition of . . . . . . . . . . . . . . . . . . . . . . . . . . . . . . . . . 403sizeof in C-SPY . . . . . . . . . . . . . . . . . . . . . . . . . . . . . . 126
optimization levels . . . . . . . . . . . . . . . . . . . . . . . . . . . . . . 321Optimizations page (compiler options) . . . . . . . . . . . . . . . 321Optimizations (compiler option) . . . . . . . . . . . . . . . . . . . . 321optimizations, effects on variables . . . . . . . . . . . . . . . . . . 127options
assembler . . . . . . . . . . . . . . . . . . . . . . . . . . . . . . . . . . . 331
UEW-8:1
IAR Embedded Workbench® IDEUser Guide
Index
build actions. . . . . . . . . . . . . . . . . . . . . . . . . . . . . . . . . 339compiler. . . . . . . . . . . . . . . . . . . . . . . . . . . . . . . . . . . . 317custom build . . . . . . . . . . . . . . . . . . . . . . . . . . . . . . . . 337C-SPY . . . . . . . . . . . . . . . . . . . . . . . . . . . . . . . . . . . . . 357C-SPY command line . . . . . . . . . . . . . . . . . . . . . . . . . 364editor . . . . . . . . . . . . . . . . . . . . . . . . . . . . . . . . . . . . . . 248general . . . . . . . . . . . . . . . . . . . . . . . . . . . . . . . . . . . . . 311
specifying . . . . . . . . . . . . . . . . . . . . . . . . . . . . . . . . . 33library builder . . . . . . . . . . . . . . . . . . . . . . . . . . . . . . . 355linker . . . . . . . . . . . . . . . . . . . . . . . . . . . . . . . . . . . . . . 341setup files for editor . . . . . . . . . . . . . . . . . . . . . . . . . . . 253
Options dialog box (Project menu) . . . . . . . . . . . . . . . . . . 240using . . . . . . . . . . . . . . . . . . . . . . . . . . . . . . . . . . . . . . . 92
__orderInterrupt (C-SPY system macro). . . . . . . . . . . . . . 382output
assemblerincluding debug information . . . . . . . . . . . . . . . . . . 332preprocessor, generating . . . . . . . . . . . . . . . . . . . . . 334
compilerincluding debug information . . . . . . . . . . . . . . . . . . 323preprocessor, generating . . . . . . . . . . . . . . . . . . . . . 326
formats. . . . . . . . . . . . . . . . . . . . . . . . . . . . . . . . . . . . . 342debug (ubrof) . . . . . . . . . . . . . . . . . . . . . . . . . . . . . 342
from C-SPY, redirecting to a file . . . . . . . . . . . . . . . . . 117generating extra file . . . . . . . . . . . . . . . . . . . . . . . . . . . 343linker
generating . . . . . . . . . . . . . . . . . . . . . . . . . . . . . . . . 346specifying filename. . . . . . . . . . . . . . . . . . . . . . . . . 341specifying filename on extra output . . . . . . . . . . . . 344
Output assembler file (compiler option) . . . . . . . . . . . . . . 324Output file (linker option) . . . . . . . . . . . . . . . . . . . . . . . . . 341Output format (linker option) . . . . . . . . . . . . . . . . . . 343–344Output list file (compiler option) . . . . . . . . . . . . . . . . . . . 324Output (assembler option). . . . . . . . . . . . . . . . . . . . . . . . . 332Output (compiler options). . . . . . . . . . . . . . . . . . . . . . . . . 322Output (general options) . . . . . . . . . . . . . . . . . . . . . . . . . . 311Output (library builder options) . . . . . . . . . . . . . . . . . . . . 355Output (linker options) . . . . . . . . . . . . . . . . . . . . . . . . . . . 341
P-p (C-SPY command line option) . . . . . . . . . . . . . . . . . . . 366par (filename extension) . . . . . . . . . . . . . . . . . . . . . . . . . . . 19parameters, typographic convention . . . . . . . . . . . . . . . . . . xlparentheses and brackets, matching (in editor) . . . . . . . . . 103part number, of user guide . . . . . . . . . . . . . . . . . . . . . . . . . . iiPaste (button) . . . . . . . . . . . . . . . . . . . . . . . . . . . . . . . . . . 195paths
assembler include files . . . . . . . . . . . . . . . . . . . . . . . . . 333compiler include files. . . . . . . . . . . . . . . . . . . . . . . . . . 325linker include files . . . . . . . . . . . . . . . . . . . . . . . . . . . . 351relative, in Embedded Workbench . . . . . . . . . . . . . 85, 208source files . . . . . . . . . . . . . . . . . . . . . . . . . . . . . . . . . . 208
pbd (filename extension). . . . . . . . . . . . . . . . . . . . . . . . . . . 19pbi (filename extension) . . . . . . . . . . . . . . . . . . . . . . . . . . . 19peripheral units
definition of . . . . . . . . . . . . . . . . . . . . . . . . . . . . . . . . . 403definitions in ddf file . . . . . . . . . . . . . . . . . . . . . . . . . . 115
pew (filename extension) . . . . . . . . . . . . . . . . . . . . . . . . . . 19pipeline, definition of . . . . . . . . . . . . . . . . . . . . . . . . . . . . 403Plain ‘char’ is (compiler option) . . . . . . . . . . . . . . . . . . . . 319Play a sound after build operations (IDE Project options). 258--plugin (C-SPY command line option) . . . . . . . . . . . . . . 366plugin modules (C-SPY). . . . . . . . . . . . . . . . . . . . . . . . . . . . 8
loading . . . . . . . . . . . . . . . . . . . . . . . . . . . . . . . . . . . . . 116Plugins (C-SPY options). . . . . . . . . . . . . . . . . . . . . . . . . . 359plugins (subdirectory) . . . . . . . . . . . . . . . . . . . . . . . . . . . . . 16plugins, common (subdirectory) . . . . . . . . . . . . . . . . . . . . . 17pointers
definition of . . . . . . . . . . . . . . . . . . . . . . . . . . . . . . . . . 403for stack is outside of memory range . . . . . . . . . . . . . . 143warn when stack pointer is out of range . . . . . . . . . . . . 262
__popSimulatorInterruptExecutingStack (C-SPYsystem macro). . . . . . . . . . . . . . . . . . . . . . . . . . . . . . . . . . 382powerpac (subdirectory) . . . . . . . . . . . . . . . . . . . . . . . . . . . 16#pragma directive, definition of . . . . . . . . . . . . . . . . . . . . 403precedence, definition of. . . . . . . . . . . . . . . . . . . . . . . . . . 403preemptive multitasking, definition of . . . . . . . . . . . . . . . 403
UEW-8:1
423
424
Preinclude file (compiler option) . . . . . . . . . . . . . . . . . . . 326preprocessor
definition of. See C-style preprocessorenable migration extensions for . . . . . . . . . . . . . . . . . . 320specifying output to file . . . . . . . . . . . . . . . . . . . . . . . . 326
preprocessor directivesdefinition of . . . . . . . . . . . . . . . . . . . . . . . . . . . . . . . . . 403text style in editor . . . . . . . . . . . . . . . . . . . . . . . . . . . . 101
Preprocessor output to file (assembler option) . . . . . . . . . 334Preprocessor output to file (compiler option) . . . . . . . . . . 326Preprocessor (assembler option) . . . . . . . . . . . . . . . . . . . . 333Preprocessor (compiler options) . . . . . . . . . . . . . . . . . . . . 325prerequisites, programming experience. . . . . . . . . . . . . . xxxvPress shortcut key (Key bindings option) . . . . . . . . . . . . . 246Primary (Key bindings option) . . . . . . . . . . . . . . . . . . . . . 246Printf formatter (general option) . . . . . . . . . . . . . . . . . . . . 314prj (filename extension) . . . . . . . . . . . . . . . . . . . . . . . . . . . 19probability (interrupt property) . . . . . . . . . . . . . . . . . . . . . 185
definition of . . . . . . . . . . . . . . . . . . . . . . . . . . . . . . . . . 180processor variant, definition of . . . . . . . . . . . . . . . . . . . . . 404product overview
assembler . . . . . . . . . . . . . . . . . . . . . . . . . . . . . . . . . . . . 11compiler. . . . . . . . . . . . . . . . . . . . . . . . . . . . . . . . . . . . . . 9C-SPY Debugger . . . . . . . . . . . . . . . . . . . . . . . . . . . . . . . 5directory structure . . . . . . . . . . . . . . . . . . . . . . . . . . . . . 15documentation . . . . . . . . . . . . . . . . . . . . . . . . . . . . . . . . 20file types . . . . . . . . . . . . . . . . . . . . . . . . . . . . . . . . . . . . 17IAR Embedded Workbench IDE . . . . . . . . . . . . . . . . . . . 3librarian . . . . . . . . . . . . . . . . . . . . . . . . . . . . . . . . . . . . . 13library builder . . . . . . . . . . . . . . . . . . . . . . . . . . . . . . . . 13linker . . . . . . . . . . . . . . . . . . . . . . . . . . . . . . . . . . . . . . . 12
profiling information. . . . . . . . . . . . . . . . . . . . . . . . . . . . . 153Profiling window . . . . . . . . . . . . . . . . . . . . . . . . . . . . . . . 298
using . . . . . . . . . . . . . . . . . . . . . . . . . . . . . . . . . . . . . . 153program counter, definition of. . . . . . . . . . . . . . . . . . . . . . 404program execution, in C-SPY . . . . . . . . . . . . . . . . . . . . . . 119program location counter, definition of . . . . . . . . . . . . . . . 404programming experience. . . . . . . . . . . . . . . . . . . . . . . . . xxxvProject Make, options . . . . . . . . . . . . . . . . . . . . . . . . . . . . 257
Project menu. . . . . . . . . . . . . . . . . . . . . . . . . . . . . . . . . . . 235project model . . . . . . . . . . . . . . . . . . . . . . . . . . . . . . . . . . . 81project options, definition of . . . . . . . . . . . . . . . . . . . . . . . 404Project page (IDE Options dialog box) . . . . . . . . . . . . . . . 257projects
adding files to . . . . . . . . . . . . . . . . . . . . . . . . . . . . 84, 235example. . . . . . . . . . . . . . . . . . . . . . . . . . . . . . . . . . . 32
build configuration, creating . . . . . . . . . . . . . . . . . . . . . 84building . . . . . . . . . . . . . . . . . . . . . . . . . . . . . . . . . . . . . 93
in batches . . . . . . . . . . . . . . . . . . . . . . . . . . . . . . . . . 93compiling, example . . . . . . . . . . . . . . . . . . . . . . . . . . . . 34creating . . . . . . . . . . . . . . . . . . . . . . . . . . . . . . . . . . 30, 84
example. . . . . . . . . . . . . . . . . . . . . . . . . . . . . . . . . . . 70definition of . . . . . . . . . . . . . . . . . . . . . . . . . . . . . . 81, 404excluding groups and files . . . . . . . . . . . . . . . . . . . . . . . 84files
checking in and out . . . . . . . . . . . . . . . . . . . . . . . . . . 89moving . . . . . . . . . . . . . . . . . . . . . . . . . . . . . . . . . . . 84
for debugging externally built applications . . . . . . . . . 117groups, creating . . . . . . . . . . . . . . . . . . . . . . . . . . . . . . . 84managing . . . . . . . . . . . . . . . . . . . . . . . . . . . . . . . . . . 4, 81organization . . . . . . . . . . . . . . . . . . . . . . . . . . . . . . . . . . 81removing items . . . . . . . . . . . . . . . . . . . . . . . . . . . . . . . 84setting options . . . . . . . . . . . . . . . . . . . . . . . . . . . . . . . . 91source code control . . . . . . . . . . . . . . . . . . . . . . . . . . . . 88testing . . . . . . . . . . . . . . . . . . . . . . . . . . . . . . . . . . . . . . 94version control systems . . . . . . . . . . . . . . . . . . . . . . . . . 88workspace, creating . . . . . . . . . . . . . . . . . . . . . . . . . . . . 84
$PROJ_DIR$ (argument variable) . . . . . . . . . . . . . . . . . . 237$PROJ_FNAME$ (argument variable) . . . . . . . . . . . . . . . 238$PROJ_PATH$ (argument variable) . . . . . . . . . . . . . . . . . 238PROM, definition of . . . . . . . . . . . . . . . . . . . . . . . . . . . . . 404Proportional width font (IDE option) . . . . . . . . . . . . . . . . 245PUBLIC (assembler directive) . . . . . . . . . . . . . . . . . . . . . . 70
Qqualifiers, definition of. See type qualifiersQuick Search text box. . . . . . . . . . . . . . . . . . . . . . . . . . . . 195
UEW-8:1
IAR Embedded Workbench® IDEUser Guide
Index
Quick Watch window . . . . . . . . . . . . . . . . . . . . . . . . . . . . 291executing C-SPY macros . . . . . . . . . . . . . . . . . . . . . . . 150using . . . . . . . . . . . . . . . . . . . . . . . . . . . . . . . . . . . . . . 129
RRange checks (linker option) . . . . . . . . . . . . . . . . . . . . . . 347Raw binary image (linker option) . . . . . . . . . . . . . . . . . . . 351__readFile (C-SPY system macro) . . . . . . . . . . . . . . . . . . 383__readFileByte (C-SPY system macro) . . . . . . . . . . . . . . 383reading guidelines. . . . . . . . . . . . . . . . . . . . . . . . . . . . . . xxxvreadme files. . . . . . . . . . . . . . . . . . . . . . . . . . . . . . . . . . . . . 16
See release notes__readMemoryByte (C-SPY system macro) . . . . . . . . . . . 384__readMemory8 (C-SPY system macro) . . . . . . . . . . . . . 384__readMemory16 (C-SPY system macro) . . . . . . . . . . . . 384__readMemory32 (C-SPY system macro) . . . . . . . . . . . . 385real-time operating system, definition of. . . . . . . . . . . . . . 404real-time system, definition of . . . . . . . . . . . . . . . . . . . . . 404Recent workspace (Startup option) . . . . . . . . . . . . . . . . . . 272Redo (button) . . . . . . . . . . . . . . . . . . . . . . . . . . . . . . . . . . 195reference information, typographic convention. . . . . . . . . . xlregister constant, definition of. . . . . . . . . . . . . . . . . . . . . . 404Register Filter (IDE Options dialog box) . . . . . . . . . . . . . 263register groups . . . . . . . . . . . . . . . . . . . . . . . . . . . . . . . . . 143
application-specific, defining . . . . . . . . . . . . . . . . . . . . 144predefined, enabling. . . . . . . . . . . . . . . . . . . . . . . . . . . 144
register locking, definition of . . . . . . . . . . . . . . . . . . . . . . 404register variables, definition of . . . . . . . . . . . . . . . . . . . . . 404Register window . . . . . . . . . . . . . . . . . . . . . . . . . . . . . . . . 286
example . . . . . . . . . . . . . . . . . . . . . . . . . . . . . . . . . . . . . 46using . . . . . . . . . . . . . . . . . . . . . . . . . . . . . . . . . . . . . . 143
registered trademarks . . . . . . . . . . . . . . . . . . . . . . . . . . . . . . ii__registerMacroFile (C-SPY system macro). . . . . . . . . . . 385registers
definition of . . . . . . . . . . . . . . . . . . . . . . . . . . . . . . . . . 404displayed in Register window . . . . . . . . . . . . . . . . . . . 143
relative paths. . . . . . . . . . . . . . . . . . . . . . . . . . . . . . . . 85, 208Relaxed ISO/ANSI (compiler option) . . . . . . . . . . . . . . . . 319
release notes . . . . . . . . . . . . . . . . . . . . . . . . . . . . . . . . . . . . 17readme.htm . . . . . . . . . . . . . . . . . . . . . . . . . . . . . . . . . . 20
Reload last workspace at startup (IDE Project options) . . 258relocatable segments, definition of . . . . . . . . . . . . . . . . . . 404remarks, compiler diagnostics. . . . . . . . . . . . . . . . . . . . . . 327Remove trailing blanks (editor option) . . . . . . . . . . . . . . . 250repeat interval (interrupt property) . . . . . . . . . . . . . . . . . . 185
definition of . . . . . . . . . . . . . . . . . . . . . . . . . . . . . . . . . 180Replace dialog box (Edit menu) . . . . . . . . . . . . . . . . . . . . 229Replace (button) . . . . . . . . . . . . . . . . . . . . . . . . . . . . . . . . 195Require prototypes (compiler option) . . . . . . . . . . . . . . . . 319Reset All (Key bindings option) . . . . . . . . . . . . . . . . . . . . 247Reset (button) . . . . . . . . . . . . . . . . . . . . . . . . . . . . . . . . . . 275Reset (Debug menu), example . . . . . . . . . . . . . . . . . . . . . . 48__resetFile (C-SPY system macro) . . . . . . . . . . . . . . . . . . 385reset, definition of . . . . . . . . . . . . . . . . . . . . . . . . . . . . . . . 405restoring default factory settings . . . . . . . . . . . . . . . . . . . . . 93return (macro statement) . . . . . . . . . . . . . . . . . . . . . . . . . . 372ROM-monitor, definition of . . . . . . . . . . . . . . . . . . . 113, 405root directory . . . . . . . . . . . . . . . . . . . . . . . . . . . . . . . . . . . 15Round Robin, definition of . . . . . . . . . . . . . . . . . . . . . . . . 405RTOS awareness debugging . . . . . . . . . . . . . . . . . . . . . . . . . 8RTOS awareness (C-SPY plugin module). . . . . . . . . . . . . 116RTOS, definition of. . . . . . . . . . . . . . . . . . . . . . . . . . . . . . 404Run to Cursor
button on debug toolbar . . . . . . . . . . . . . . . . . . . . . . . . 275command for executing . . . . . . . . . . . . . . . . . . . . . . . . 122on the Debug menu . . . . . . . . . . . . . . . . . . . . . . . . . . . 305
Run to (C-SPY option) . . . . . . . . . . . . . . . . . . . . . . . 115, 358runtime libraries . . . . . . . . . . . . . . . . . . . . . . . . . . . . . . . . . 10
definition of . . . . . . . . . . . . . . . . . . . . . . . . . . . . . . . . . 405runtime model attributes
definition of . . . . . . . . . . . . . . . . . . . . . . . . . . . . . . . . . 405in map files . . . . . . . . . . . . . . . . . . . . . . . . . . . . . . . . . . 38
rxx (filename extension) . . . . . . . . . . . . . . . . . . . . . . . . . . . 19R-value, definition of . . . . . . . . . . . . . . . . . . . . . . . . . . . . 404
UEW-8:1
425
426
Ssaturation arithmetics, definition of. . . . . . . . . . . . . . . . . . 405Save All (button). . . . . . . . . . . . . . . . . . . . . . . . . . . . . . . . 195Save All (File menu). . . . . . . . . . . . . . . . . . . . . . . . . . . . . 224Save As (File menu) . . . . . . . . . . . . . . . . . . . . . . . . . . . . . 224Save editor windows before building (IDE Projectoptions). . . . . . . . . . . . . . . . . . . . . . . . . . . . . . . . . . . . . . . 257Save workspace and projects before building (IDEProject options). . . . . . . . . . . . . . . . . . . . . . . . . . . . . . . . . 257Save Workspace (File menu). . . . . . . . . . . . . . . . . . . . . . . 223Save (button). . . . . . . . . . . . . . . . . . . . . . . . . . . . . . . . . . . 195Save (File menu). . . . . . . . . . . . . . . . . . . . . . . . . . . . . . . . 224Scan for Changed Files (editor option) . . . . . . . . . . . . . . . 250
using . . . . . . . . . . . . . . . . . . . . . . . . . . . . . . . . . . . . . . . 36Scanf formatter (general option) . . . . . . . . . . . . . . . . . . . . 314SCC. See source code control systemsscheduler (RTOS), definition of . . . . . . . . . . . . . . . . . . . . 405scope, definition of . . . . . . . . . . . . . . . . . . . . . . . . . . . . . . 405scrolling, shortcut key for . . . . . . . . . . . . . . . . . . . . . . . . . 101Search paths (linker option) . . . . . . . . . . . . . . . . . . . . . . . 351searching in editor windows . . . . . . . . . . . . . . . . . . . . . . . 106segment map
definition of . . . . . . . . . . . . . . . . . . . . . . . . . . . . . . . . . 405example of producing . . . . . . . . . . . . . . . . . . . . . . . . . . 37
Segment map (linker option). . . . . . . . . . . . . . . . . . . . . . . 348Segment overlap warnings (linker option). . . . . . . . . . . . . 346segment parts, including all in list file. . . . . . . . . . . . . . . . 349segments
definition of . . . . . . . . . . . . . . . . . . . . . . . . . . . . . . . . . 405overlap errors, reducing . . . . . . . . . . . . . . . . . . . . . . . . 346range checks, controlling . . . . . . . . . . . . . . . . . . . . . . . 347section in map files . . . . . . . . . . . . . . . . . . . . . . . . . . . . 38
Select SCC Provider dialog box (Project menu) . . . . . . . . 201Select Statics dialog box (Statics window) . . . . . . . . . . . . 293selecting text, shortcut key for . . . . . . . . . . . . . . . . . . . . . 101semaphores, definition of . . . . . . . . . . . . . . . . . . . . . . . . . 405Service (External editor option) . . . . . . . . . . . . . . . . . . . . 252Set Log file dialog box (Debug menu) . . . . . . . . . . . . . . . 306
__setCodeBreak (C-SPY system macro). . . . . . . . . . . . . . 386__setDataBreak (C-SPY system macro) . . . . . . . . . . . . . . 387__setSimBreak (C-SPY system macro) . . . . . . . . . . . . . . 388settings (directory) . . . . . . . . . . . . . . . . . . . . . . . . . . . . . . . 19Setup macros (C-SPY option). . . . . . . . . . . . . . . . . . . . . . 358setup macros, in C-SPY. See C-SPY macrosSetup (C-SPY options) . . . . . . . . . . . . . . . . . . . . . . . . . . . 357severity level, definition of . . . . . . . . . . . . . . . . . . . . . . . . 406SFR
definition of . . . . . . . . . . . . . . . . . . . . . . . . . . . . . . . . . 406in header files. . . . . . . . . . . . . . . . . . . . . . . . . . . . . . . . . 16in Register window . . . . . . . . . . . . . . . . . . . . . . . . . . . 144
sfr (filename extension) . . . . . . . . . . . . . . . . . . . . . . . . . . . 19short addressing, definition of. . . . . . . . . . . . . . . . . . . . . . 406shortcut keys . . . . . . . . . . . . . . . . . . . . . . . . . . . . . . . . . . . 101Show Bookmarks (editor option) . . . . . . . . . . . . . . . . . . . 250Show Line Number (editor option) . . . . . . . . . . . . . . . . . . 249Show right margin (editor option). . . . . . . . . . . . . . . . . . . 249side-effect, definition of . . . . . . . . . . . . . . . . . . . . . . . . . . 406signals, definition of . . . . . . . . . . . . . . . . . . . . . . . . . . . . . 406--silent (C-SPY command line option) . . . . . . . . . . . . . . . 367simulating interrupts, enabling/disabling . . . . . . . . . . . . . 183simulator
definition of . . . . . . . . . . . . . . . . . . . . . . . . . . . . . . . . . 406features . . . . . . . . . . . . . . . . . . . . . . . . . . . . . . . . . . . . . . 9introduction . . . . . . . . . . . . . . . . . . . . . . . . . . . . . . . . . 161
Simulator menu. . . . . . . . . . . . . . . . . . . . . . . . . . . . . . . . . 162size optimization. . . . . . . . . . . . . . . . . . . . . . . . . . . . . . . . 321Size (Breakpoints dialog) . . . . . . . . . . . . . . . . . . . . . 175, 215sizeof . . . . . . . . . . . . . . . . . . . . . . . . . . . . . . . . . . . . . . . . 126skeleton code, definition of . . . . . . . . . . . . . . . . . . . . . . . . 406Source Browser window . . . . . . . . . . . . . . . . . . . . . . . . . . 210
context menu . . . . . . . . . . . . . . . . . . . . . . . . . . . . . . . . 212using . . . . . . . . . . . . . . . . . . . . . . . . . . . . . . . . . . . . . . . 87
source codeincluding in compiler list file . . . . . . . . . . . . . . . . . . . . 324templates . . . . . . . . . . . . . . . . . . . . . . . . . . . . . . . . . . . 103
Source code color in Disassembly window (IDE option) . 260Source Code Control context menu. . . . . . . . . . . . . . . . . . 199
UEW-8:1
IAR Embedded Workbench® IDEUser Guide
Index
source code control systems . . . . . . . . . . . . . . . . . . . . . . . . 88Source Code Control (IDE Options dialog box) . . . . . . . . 258source code control, features. . . . . . . . . . . . . . . . . . . . . . . . . 4source file paths . . . . . . . . . . . . . . . . . . . . . . . . . . . . . 85, 208source files
adding to a project . . . . . . . . . . . . . . . . . . . . . . . . . . . . . 32editing . . . . . . . . . . . . . . . . . . . . . . . . . . . . . . . . . . . . . . 99managing in projects . . . . . . . . . . . . . . . . . . . . . . . . . . . 83
__sourcePosition (C-SPY system macro) . . . . . . . . . . . . . 389special function registers (SFR)
definition of . . . . . . . . . . . . . . . . . . . . . . . . . . . . . . . . . 406description files . . . . . . . . . . . . . . . . . . . . . . . . . . . . . . . 16in header files. . . . . . . . . . . . . . . . . . . . . . . . . . . . . . . . . 16using as assembler symbols . . . . . . . . . . . . . . . . . . . . . 126
speed optimization . . . . . . . . . . . . . . . . . . . . . . . . . . . . . . 321src (subdirectory) . . . . . . . . . . . . . . . . . . . . . . . . . . . . . . . . 16stack frames, definition of. . . . . . . . . . . . . . . . . . . . . . . . . 406stack segment, definition of . . . . . . . . . . . . . . . . . . . . . . . 406Stack window . . . . . . . . . . . . . . . . . . . . . . . . . . . . . . . . . . 300
using . . . . . . . . . . . . . . . . . . . . . . . . . . . . . . . . . . . . . . 142Stack (IDE Options dialog box) . . . . . . . . . . . . . . . . . . . . 261Stack/Heap (general options) . . . . . . . . . . . . . . . . . . . . . . 315standard libraries, definition of . . . . . . . . . . . . . . . . . . . . . 406static objects, definition of . . . . . . . . . . . . . . . . . . . . . . . . 407Static overlay map (linker option). . . . . . . . . . . . . . . . . . . 349static overlay, definition of . . . . . . . . . . . . . . . . . . . . . . . . 407statically allocated memory, definition of . . . . . . . . . . . . . 407Statics window . . . . . . . . . . . . . . . . . . . . . . . . . . . . . . . . . 291
context menu . . . . . . . . . . . . . . . . . . . . . . . . . . . . . . . . 292status bar. . . . . . . . . . . . . . . . . . . . . . . . . . . . . . . . . . . . . . 196stdin and stdout
redirecting to C-SPY window . . . . . . . . . . . . . . . . . . . 124redirecting to file . . . . . . . . . . . . . . . . . . . . . . . . . . . . . 124
Step Into . . . . . . . . . . . . . . . . . . . . . . . . . . . . . . . . . . . . . . 275description . . . . . . . . . . . . . . . . . . . . . . . . . . . . . . . . . . 120example of . . . . . . . . . . . . . . . . . . . . . . . . . . . . . . . . . . . 42
Step into functions (IDE option) . . . . . . . . . . . . . . . . . . . . 260Step Out . . . . . . . . . . . . . . . . . . . . . . . . . . . . . . . . . . . . . . 275
description . . . . . . . . . . . . . . . . . . . . . . . . . . . . . . . . . . 121
Step Over . . . . . . . . . . . . . . . . . . . . . . . . . . . . . . . . . . . . . 275description . . . . . . . . . . . . . . . . . . . . . . . . . . . . . . . . . . 120
step points, definition of . . . . . . . . . . . . . . . . . . . . . . . . . . 120stepping . . . . . . . . . . . . . . . . . . . . . . . . . . . . . . . . . . . . . . 120
example . . . . . . . . . . . . . . . . . . . . . . . . . . . . . . . . . . . . . 41stepping, definition of . . . . . . . . . . . . . . . . . . . . . . . . . . . . 406STL container expansion (IDE option) . . . . . . . . . . . . . . . 260Stop build operation on (IDE Project options) . . . . . . . . . 257Stop Debugging (button). . . . . . . . . . . . . . . . . . . . . . . . . . 275__strFind (C-SPY system macro) . . . . . . . . . . . . . . . . . . . 389Strict ISO/ANSI (compiler option) . . . . . . . . . . . . . . . . . . 319strings, text style in editor . . . . . . . . . . . . . . . . . . . . . . . . . 101structure value, definition of . . . . . . . . . . . . . . . . . . . . . . . 407__subString (C-SPY system macro) . . . . . . . . . . . . . . . . . 390support, technical . . . . . . . . . . . . . . . . . . . . . . . . . . . . . . . . 21Suppress all warnings (linker option) . . . . . . . . . . . . . . . . 347Suppress download (C-SPY option) . . . . . . . . . . . . . . . . . 161Suppress these diagnostics (compiler option) . . . . . . . . . . 327Suppress these diagnostics (linker option) . . . . . . . . . . . . 347sxx (filename extension) . . . . . . . . . . . . . . . . . . . . . . . . . . . 19symbolic location, definition of . . . . . . . . . . . . . . . . . . . . 407Symbolic Memory window. . . . . . . . . . . . . . . . . . . . . . . . 284
context menu . . . . . . . . . . . . . . . . . . . . . . . . . . . . . . . . 286toolbar . . . . . . . . . . . . . . . . . . . . . . . . . . . . . . . . . . . . . 285
symbolsSee also user symbolsdefining in assembler . . . . . . . . . . . . . . . . . . . . . . . . . . 334defining in compiler . . . . . . . . . . . . . . . . . . . . . . . . . . . 326defining in linker . . . . . . . . . . . . . . . . . . . . . . . . . . . . . 345definition of . . . . . . . . . . . . . . . . . . . . . . . . . . . . . . . . . 407in input modules . . . . . . . . . . . . . . . . . . . . . . . . . . . . . 343using in C-SPY expressions . . . . . . . . . . . . . . . . . . . . . 125
Symbols window . . . . . . . . . . . . . . . . . . . . . . . . . . . . . . . 303context menu . . . . . . . . . . . . . . . . . . . . . . . . . . . . . . . . 304
syntax coloringconfiguration files . . . . . . . . . . . . . . . . . . . . . . . . . . . . . 16in editor . . . . . . . . . . . . . . . . . . . . . . . . . . . . . . . . . . . . 101
Syntax Coloring (Editor colors and fonts option) . . . . . . . 254Syntax Highlighting (editor option) . . . . . . . . . . . . . . . . . 249
UEW-8:1
427
428
syntax highlighting, in editor window. . . . . . . . . . . . . . . . 102system macros. . . . . . . . . . . . . . . . . . . . . . . . . . . . . . . . . . 369
TTab Key Function (editor option) . . . . . . . . . . . . . . . . . . . 248Tab Size (editor option). . . . . . . . . . . . . . . . . . . . . . . . . . . 248Target options, specifying . . . . . . . . . . . . . . . . . . . . . . . . . 311target system, definition of . . . . . . . . . . . . . . . . . . . . . . . . 112Target (general options) . . . . . . . . . . . . . . . . . . . . . . . . . . 311target, definition of . . . . . . . . . . . . . . . . . . . . . . . . . . . . . . 407$TARGET_BNAME$ (argument variable) . . . . . . . . . . . . 238$TARGET_BPATH$ (argument variable) . . . . . . . . . . . . . 238$TARGET_DIR$ (argument variable) . . . . . . . . . . . . . . . 238$TARGET_FNAME$ (argument variable) . . . . . . . . . . . . 238$TARGET_PATH$ (argument variable) . . . . . . . . . . . . . . 238task, definition of . . . . . . . . . . . . . . . . . . . . . . . . . . . . . . . 407tcl (filename extension). . . . . . . . . . . . . . . . . . . . . . . . . . . . 19technical support. . . . . . . . . . . . . . . . . . . . . . . . . . . . . . . . . 21Template dialog box (Edit menu) . . . . . . . . . . . . . . . . . . . 232tentative definition, definition of . . . . . . . . . . . . . . . . . . . . 407terminal I/O
definition of . . . . . . . . . . . . . . . . . . . . . . . . . . . . . . . . . 407simulating . . . . . . . . . . . . . . . . . . . . . . . . . . . . . . . . . . 342
Terminal I/O Log File . . . . . . . . . . . . . . . . . . . . . . . . . . . . 124Terminal I/O Log File dialog box (Debug menu) . . . . . . . 309Terminal I/O window . . . . . . . . . . . . . . . . . . . . . . . . 124, 295
example of using . . . . . . . . . . . . . . . . . . . . . . . . . . . . . . 47Terminal I/O (IDE Options dialog box) . . . . . . . . . . . . . . 264terminology. . . . . . . . . . . . . . . . . . . . . . . . . . . . . . xxxix, 395testing, of code . . . . . . . . . . . . . . . . . . . . . . . . . . . . . . . . . . 94thread, definition of. . . . . . . . . . . . . . . . . . . . . . . . . . . . . . 407timer, definition of . . . . . . . . . . . . . . . . . . . . . . . . . . . . . . 407timeslice, definition of . . . . . . . . . . . . . . . . . . . . . . . . . . . 407Toggle Bookmark (button) . . . . . . . . . . . . . . . . . . . . . . . . 195Toggle Breakpoint (button) . . . . . . . . . . . . . . . . . . . . . . . . 195toggle breakpoint, example . . . . . . . . . . . . . . . . . . . . . . 44, 66__toLower (C-SPY system macro) . . . . . . . . . . . . . . . . . . 390
tool chainextending . . . . . . . . . . . . . . . . . . . . . . . . . . . . . . . . . . . . 95specifying . . . . . . . . . . . . . . . . . . . . . . . . . . . . . . . . . . . 30
Tool Output window . . . . . . . . . . . . . . . . . . . . . . . . . . . . . 220context menu . . . . . . . . . . . . . . . . . . . . . . . . . . . . . . . . 221
toolbardebug . . . . . . . . . . . . . . . . . . . . . . . . . . . . . . . . . . . . . . 274IDE . . . . . . . . . . . . . . . . . . . . . . . . . . . . . . . . . . . . . . . 195Trace . . . . . . . . . . . . . . . . . . . . . . . . . . . . . . . . . . . . . . 163
$TOOLKIT_DIR$ (argument variable) . . . . . . . . . . . . . . 238tools icon, in this guide . . . . . . . . . . . . . . . . . . . . . . . . . . . . xlTools menu . . . . . . . . . . . . . . . . . . . . . . . . . . . . . . . . . . . . 244tools, user-configured . . . . . . . . . . . . . . . . . . . . . . . . . . . . 265__toString (C-SPY system macro) . . . . . . . . . . . . . . . . . . 391touch, open-source command line utility . . . . . . . . . . . . . . 94__toUpper (C-SPY system macro) . . . . . . . . . . . . . . . . . . 391Trace Expressions window . . . . . . . . . . . . . . . . . . . . . . . . 166Trace window . . . . . . . . . . . . . . . . . . . . . . . . . . . . . . . . . . 163
toolbar . . . . . . . . . . . . . . . . . . . . . . . . . . . . . . . . . . . . . 163trace, definition of. . . . . . . . . . . . . . . . . . . . . . . . . . . . . . . 129trademarks . . . . . . . . . . . . . . . . . . . . . . . . . . . . . . . . . . . . . . iitransformations, enabled in compiler . . . . . . . . . . . . . . . . 322translation unit, definition of. . . . . . . . . . . . . . . . . . . . . . . 407trap, definition of . . . . . . . . . . . . . . . . . . . . . . . . . . . . . . . 407Treat all warnings as errors (compiler option). . . . . . . . . . 328Treat these as errors (compiler option) . . . . . . . . . . . . . . . 328Treat these as errors (linker option). . . . . . . . . . . . . . . . . . 347Treat these as remarks (compiler option) . . . . . . . . . . . . . 327Treat these as warnings (compiler option). . . . . . . . . . . . . 328Treat these as warnings (linker option) . . . . . . . . . . . . . . . 347tutor (subdirectory) . . . . . . . . . . . . . . . . . . . . . . . . . . . . . . . 17type qualifiers, definition of . . . . . . . . . . . . . . . . . . . . . . . 408Type (External editor option) . . . . . . . . . . . . . . . . . . . . . . 252type-checking . . . . . . . . . . . . . . . . . . . . . . . . . . . . . . . . 10, 12
disabling at link time . . . . . . . . . . . . . . . . . . . . . . . . . . 346typographic conventions . . . . . . . . . . . . . . . . . . . . . . . . xxxix
UEW-8:1
IAR Embedded Workbench® IDEUser Guide
Index
UUBROF. . . . . . . . . . . . . . . . . . . . . . . . . . . . . . . . . . . . . . 8, 12
definition of . . . . . . . . . . . . . . . . . . . . . . . . . . . . . . . . . 408Undo (button) . . . . . . . . . . . . . . . . . . . . . . . . . . . . . . . . . . 195Universal Binary Relocatable Object Format. See UBROFUpdate intervals (IDE option) . . . . . . . . . . . . . . . . . . . . . . 260Use Code Templates (editor option) . . . . . . . . . . . . . . . . . 253Use Custom Keyword File (editor option) . . . . . . . . . . . . 253Use External Editor (External editor option). . . . . . . . . . . 252Use register filter (Register filter option) . . . . . . . . . . . . . 263user application, definition of . . . . . . . . . . . . . . . . . . . . . . 112User symbols are case sensitive (assembler option) . . . . . 331
Vvariables
effects of optimizations . . . . . . . . . . . . . . . . . . . . . . . . 127information, limitation on . . . . . . . . . . . . . . . . . . . . . . 127using in arguments . . . . . . . . . . . . . . . . . . . . . . . . . . . . 266using in C-SPY expressions . . . . . . . . . . . . . . . . . . . . . 125watching in C-SPY . . . . . . . . . . . . . . . . . . . . . . . . . . . 128
example. . . . . . . . . . . . . . . . . . . . . . . . . . . . . . . . . . . 42variance (interrupt property) . . . . . . . . . . . . . . . . . . . . . . . 185
definition of . . . . . . . . . . . . . . . . . . . . . . . . . . . . . . . . . 180version control systems. . . . . . . . . . . . . . . . . . . . . . . . . . . . 88version number, of Embedded Workbench . . . . . . . . . . . . 271View menu . . . . . . . . . . . . . . . . . . . . . . . . . . . . . . . . . . . . 233virtual address, definition of . . . . . . . . . . . . . . . . . . . . . . . 408virtual space, definition of . . . . . . . . . . . . . . . . . . . . . . . . 408visualSTATE
C-SPY plugin module for . . . . . . . . . . . . . . . . . . . . . . . . 8part of the tool chain . . . . . . . . . . . . . . . . . . . . . . . . . . . 75project file . . . . . . . . . . . . . . . . . . . . . . . . . . . . . . . . . . . 19
volatile storage, definition of . . . . . . . . . . . . . . . . . . . . . . 408von Neumann architecture, definition of . . . . . . . . . . . . . . 408vsp (filename extension) . . . . . . . . . . . . . . . . . . . . . . . . . . . 19
WWarn when exceeding stack threshold (Stack option) . . . . 262Warn when stack pointer is out of bounds (Stack option) . 262warnings
compiler. . . . . . . . . . . . . . . . . . . . . . . . . . . . . . . . . . . . 328linker . . . . . . . . . . . . . . . . . . . . . . . . . . . . . . . . . . . . . . 347
warnings icon, in this guide . . . . . . . . . . . . . . . . . . . . . . . . xlWarnings/Errors (linker option) . . . . . . . . . . . . . . . . . . . . 347Watch window . . . . . . . . . . . . . . . . . . . . . . . . . . . . . . . . . 287
context menu . . . . . . . . . . . . . . . . . . . . . . . . . . . . . . . . 288using . . . . . . . . . . . . . . . . . . . . . . . . . . . . . . . . . . . . . . 128
watchpointsdefinition of . . . . . . . . . . . . . . . . . . . . . . . . . . . . . . . . . 408setting . . . . . . . . . . . . . . . . . . . . . . . . . . . . . . . . . . . . . . 42
web sites, recommended . . . . . . . . . . . . . . . . . . . . . . . . xxxixweb site, IAR Systems . . . . . . . . . . . . . . . . . . . . . . . . . . . . 21When source resolves to multiple function instances . . . . 259while (macro statement) . . . . . . . . . . . . . . . . . . . . . . . . . . 371Window menu. . . . . . . . . . . . . . . . . . . . . . . . . . . . . . . . . . 270windows . . . . . . . . . . . . . . . . . . . . . . . . . . . . . . . . . . . . . . 193
organizing on the screen . . . . . . . . . . . . . . . . . . . . . . . . 77specific to C-SPY. . . . . . . . . . . . . . . . . . . . . . . . . . . . . 273
With I/O emulation modules (linker option) . . . . . . . . . . . 342using . . . . . . . . . . . . . . . . . . . . . . . . . . . . . . . . . . . . . . 124
With runtime control modules (linker option). . . . . . . . . . 342Workspace window. . . . . . . . . . . . . . . . . . . . . . . . . . . . . . 196
context menu . . . . . . . . . . . . . . . . . . . . . . . . . . . . 198, 213drag-and-drop of files . . . . . . . . . . . . . . . . . . . . . . . . . . 84example . . . . . . . . . . . . . . . . . . . . . . . . . . . . . . . . . . . . . 31
workspacescreating . . . . . . . . . . . . . . . . . . . . . . . . . . . . . . . . . . 29, 84using . . . . . . . . . . . . . . . . . . . . . . . . . . . . . . . . . . . . . . . 83
__writeFile (C-SPY system macro) . . . . . . . . . . . . . . . . . 392__writeFileByte (C-SPY system macro) . . . . . . . . . . . . . . 392__writeMemoryByte (C-SPY system macro) . . . . . . . . . . 392__writeMemory8 (C-SPY system macro) . . . . . . . . . . . . . 392__writeMemory16 (C-SPY system macro) . . . . . . . . . . . . 393__writeMemory32 (C-SPY system macro) . . . . . . . . . . . . 393
UEW-8:1
429
430
wsdt (filename extension) . . . . . . . . . . . . . . . . . . . . . . . . . . 19www.iar.com. . . . . . . . . . . . . . . . . . . . . . . . . . . . . . . . . . . . 21
XXAR options, definition of . . . . . . . . . . . . . . . . . . . . . . . . 408XAR See library builderxcl (filename extension) . . . . . . . . . . . . . . . . . . . . . . . . . . . 19xlb (filename extension) . . . . . . . . . . . . . . . . . . . . . . . . . . . 19XLIB options, definition of. . . . . . . . . . . . . . . . . . . . . . . . 408XLIB See librarianXLINK options
definition of . . . . . . . . . . . . . . . . . . . . . . . . . . . . . . . . . 408Command file configuration tool . . . . . . . . . . . . . . . . . 350
XLINK See linkerXLINK, definition of . . . . . . . . . . . . . . . . . . . . . . . . . . . . 408
Zzero-overhead loop, definition of . . . . . . . . . . . . . . . . . . . 408zone
definition of . . . . . . . . . . . . . . . . . . . . . . . . . . . . . . . . . 408in C-SPY . . . . . . . . . . . . . . . . . . . . . . . . . . . . . . . . . . . 141
Symbols#define options (linker options) . . . . . . . . . . . . . . . . . . . . 345#define statement, in compiler . . . . . . . . . . . . . . . . . . . . . 326#line directives, generating in assembler. . . . . . . . . . . . . . 334#line directives, generating in compiler . . . . . . . . . . . . . . 326#pragma directive, definition of . . . . . . . . . . . . . . . . . . . . 403$CONFIG_NAME$ (argument variable) . . . . . . . . . . . . . 237$CUR_DIR$ (argument variable) . . . . . . . . . . . . . . . . . . . 237$CUR_LINE$ (argument variable) . . . . . . . . . . . . . . . . . . 237$EW_DIR$ (argument variable) . . . . . . . . . . . . . . . . . . . . 237$EXE_DIR$ (argument variable) . . . . . . . . . . . . . . . . . . . 237$FILE_DIR$ (argument variable) . . . . . . . . . . . . . . . . . . . 237$FILE_FNAME$ (argument variable) . . . . . . . . . . . . . . . 237$FILE_PATH$ (argument variable) . . . . . . . . . . . . . . . . . 237
$LIST_DIR$ (argument variable) . . . . . . . . . . . . . . . . . . . 237$OBJ_DIR$ (argument variable) . . . . . . . . . . . . . . . . . . . 237$PROJ_DIR$ (argument variable) . . . . . . . . . . . . . . . . . . 237$PROJ_FNAME$ (argument variable) . . . . . . . . . . . . . . . 238$PROJ_PATH$ (argument variable) . . . . . . . . . . . . . . . . . 238$TARGET_BNAME$ (argument variable) . . . . . . . . . . . . 238$TARGET_BPATH$ (argument variable) . . . . . . . . . . . . . 238$TARGET_DIR$ (argument variable) . . . . . . . . . . . . . . . 238$TARGET_FNAME$ (argument variable) . . . . . . . . . . . . 238$TARGET_PATH$ (argument variable) . . . . . . . . . . . . . . 238$TOOLKIT_DIR$ (argument variable) . . . . . . . . . . . . . . 238% stack usage threshold (Stack option). . . . . . . . . . . . . . . 261-B (C-SPY command line option). . . . . . . . . . . . . . . . . . . 364-d (C-SPY command line option) . . . . . . . . . . . . . . . . . . . 365-p (C-SPY command line option) . . . . . . . . . . . . . . . . . . . 366--backend (C-SPY command line option) . . . . . . . . . . . . . 364--cycles (C-SPY command line option) . . . . . . . . . . . . . . 364--flash_loader (C-SPY command line option). . . . . . . . . . 365--macro (C-SPY command line option) . . . . . . . . . . . . . . 365--mapu (C-SPY command line option) . . . . . . . . . . . . . . . 366--plugin (C-SPY command line option) . . . . . . . . . . . . . . 366--silent (C-SPY command line option) . . . . . . . . . . . . . . . 367__cancelAllInterrupts (C-SPY system macro) . . . . . . . . . 376__cancelInterrupt (C-SPY system macro). . . . . . . . . . . . . 377__clearBreak (C-SPY system macro) . . . . . . . . . . . . . . . . 377__closeFile (C-SPY system macro) . . . . . . . . . . . . . . . . . 377__disableInterrupts (C-SPY system macro) . . . . . . . . . . . 378__driverType (C-SPY system macro) . . . . . . . . . . . . . . . . 378__enableInterrupts (C-SPY system macro) . . . . . . . . . . . . 379__evaluate (C-SPY system macro) . . . . . . . . . . . . . . . . . . 379__fmessage (C-SPY macro statement) . . . . . . . . . . . . . . . 372__loadModule (C-SPY system macro) . . . . . . . . . . . . . . . 380__message (C-SPY macro statement) . . . . . . . . . . . . . . . . 372__openFile (C-SPY system macro). . . . . . . . . . . . . . . . . . 381__orderInterrupt (C-SPY system macro). . . . . . . . . . . . . . 382__popSimulatorInterruptExecutingStack (C-SPYsystem macro). . . . . . . . . . . . . . . . . . . . . . . . . . . . . . . . . . 382__readFile (C-SPY system macro) . . . . . . . . . . . . . . . . . . 383__readFileByte (C-SPY system macro) . . . . . . . . . . . . . . 383__readMemoryByte (C-SPY system macro) . . . . . . . . . . . 384
UEW-8:1
IAR Embedded Workbench® IDEUser Guide

Index
__readMemory8 (C-SPY system macro) . . . . . . . . . . . . . 384__readMemory16 (C-SPY system macro) . . . . . . . . . . . . 384__readMemory32 (C-SPY system macro) . . . . . . . . . . . . 385__registerMacroFile (C-SPY system macro). . . . . . . . . . . 385__resetFile (C-SPY system macro) . . . . . . . . . . . . . . . . . . 385__setCodeBreak (C-SPY system macro). . . . . . . . . . . . . . 386__setDataBreak (C-SPY system macro) . . . . . . . . . . . . . . 387__setSimBreak (C-SPY system macro) . . . . . . . . . . . . . . 388__smessage (C-SPY macro statement) . . . . . . . . . . . . . . . 372__sourcePosition (C-SPY system macro) . . . . . . . . . . . . . 389__strFind (C-SPY system macro) . . . . . . . . . . . . . . . . . . . 389__subString (C-SPY system macro) . . . . . . . . . . . . . . . . . 390__toLower (C-SPY system macro) . . . . . . . . . . . . . . . . . . 390__toString (C-SPY system macro) . . . . . . . . . . . . . . . . . . 391__toUpper (C-SPY system macro) . . . . . . . . . . . . . . . . . . 391__writeFile (C-SPY system macro) . . . . . . . . . . . . . . . . . 392__writeFileByte (C-SPY system macro) . . . . . . . . . . . . . . 392__writeMemoryByte (C-SPY system macro) . . . . . . . . . . 392__writeMemory8 (C-SPY system macro) . . . . . . . . . . . . . 392__writeMemory16 (C-SPY system macro) . . . . . . . . . . . . 393__writeMemory32 (C-SPY system macro) . . . . . . . . . . . . 393
UEW-8:1
431