iamai - aml mobile vas report - launch presentation - 2011-07
DESCRIPTION
Analysys Mason in collaboration with IAMAI has developed a Vision Document on Mobile VAS industry in India, titled “Evolution of Mobile VAS in India”. This report was released on 27th July, 2011 in New Delhi at a full day conference hosted jointly by Analysys Mason and IAMAI. The key findings of the report were released by Shri Sachin Pilot, Minister of State, Communications and IT, Government of India. Commenting upon the report, Shri Sachin Pilot said “The mobile value added services is miniscule at present in comparison to its potential and the government would make appropriate efforts to put the industry on an equitable and sustainable growth path.” However, in order for the industry to be a success, he suggested that service providers should provide locally relevant services in local languages. The inaugural session comprised of renowned industry delegates: Rajan Anandan, Managing Director, Google India; Dr. Kiran Karnik, Former President, NASSCOM; Hitesh Oberoi, Chairman, IAMAI & Managing Director & Chief Executive Officer, Infoedge India Ltd; Sandeep Sawhney, Chief Product & Innovation Officer, Aircel; D.P Venkatesh, CEO, mPortal. Kunal Bajaj, Partner & Director India, Analysys Mason gave a presentation on the launch of this report and stated: “Carriers are under tremendous pressure from competition and declining ARPUs, which have stunted revenue growth. Recent trends in the sector indicate that now is the right time for them to increase their focus on the VAS space to find new opportunities for differentiation and earnings.” Besides the inaugural session, the conference comprised of four panel discussions on current themes in the Mobile VAS industry: Mobile Entertainment, Livelihood Enhancement Services, Mobile Applications and Mobile Money. Each of these panels comprised of speakers (CXO level) from a cross-section representation of the industry and included leading carriers, technology platforms, mobile value added services providers and the government. The conference saw a turn out of over 200 leading industry delegates.TRANSCRIPT

Evolution of Mobile VAS in India Evolution of Mobile VAS in India
Imperatives for Exponential Growth Imperatives for Exponential Growth
July 2011 | A joint report by IAMAI and Analysys Mason
Launch Presentation Launch Presentation

2
List of Sponsors
Platinum Sponsor
Gold Sponsors

3
Peer Review / Acknowledgements
• Peer Review Steering Committee
We would like to thank the peer review steering committee for dedicating their time to this initiative and helping to identify the key issues to focus on. Producing this report would not have been possible without their inputs and feedback
Parag Kar VP, Government Affairs, Qualcomm (India & South Asia)
PG Ponnapa Chief Executive Officer- India/Asia Pac, MPortal
Sanjay K Goyal Founder & CEO, ACL Wireless
Dr. Subho Ray President, IAMAI
Vijay Shekhar Sharma Chairman & MD, One97
• Acknowledgements
We would like to acknowledge the following people for their extraordinary contributions
Anand Virani Business Development Lead, Services Ecosystem, Qualcomm (India & South Asia)
Chirag Jain Vice President - Marketing & Business Development, Webaroo
Mohit Narain Business Director, ACL Wireless
Rakesh Mahajan Independent Consultant

4
Global experience suggests that India has an opportunity to be a leading
‘mobile first’ market for data
Global Experience
Source: Analysys Mason, © Wireless Intelligence 2011, Telegeography
0%
15%
30%
45%
60%
Q1
2005
Q2
2005
Q3
2005
Q4
2005
Q1
2006
Q2
2006
Q3
2006
Q4
2006
Q1
2007
Q2
2007
Q3
2007
Q4
2007
Q1
2008
Q2
2008
Q3
2008
Q4
2008
Q1
2009
Q2
2009
Q3
2009
Q4
2009
Q1
2010
China Unicom, China Vivo, Brazil Globe, Philippines
Smart, Philippines Maxis, Malaysia AIS, Thailand
Telkomsel, Indonesia MTN, South Africa Vodacom, South Africa
Share of Non-Voice Revenues1 by Carrier, Country (%)
Launch of 3G Services
Messaging Driven Market
• Messaging dominant markets with
high base of non-voice revenues
• Philippines
High Growth post 3G
• Markets that have witnessed an
average change3 of ~4% per year
since 3G
• Malaysia, Brazil
Moderate Growth post 3G
• Markets that have witnessed an
average change3 of ~2.5% per year
since 3G
• Large potential for long term growth
due to the lack of alternate access
mechanism
• S Africa, Indonesia, Thailand & China
1
2
3
S Africa: 8.2%, 8.7%
Malaysia: 21.8%, 64.1%
Brazil: ~16%, 45.0%
China: ~4.8%, 28.2%
Note: 1. Non-voice revenues includes revenue from messaging, data usage and other non voice related activities; 2. PC penetration figures are
for 2005 and Internet Penetration figures are as of 2006; 3. Average yearly change in share of non voice revenues (within total revenues);
4. China Unicom was considered rather than China Mobile, because the latter launched 3G with TD-SCDMA while the former did so
with W-CDMA / HSPA; 5. Smart launched 3G services in Q1’06; 6. Vodacom launched 3G services in Q4’04
4
6
5
Legend2: Country: PC Penetration, Internet Penetration

5
Source: Analysys Mason, FICCI Frames 2010, Company Reports
Structural enablers in the market also indicate that the MVAS industry is at
an inflexion point
Mobile VAS Overview
51%
65%
2009 2010
Share of GPRS Enabled Handsets
in Total Handset Sales
DEVICE
• The device landscape in India
has changed significantly with
the entry of local Indian
handset OEMs
• Data enabled devices (both
GPRS and 3G) now constitute
~70-80% of the installed
handset base
ACCESS
• Mobile data is now widely
accessible with carriers
launching 3G services
• Low sachet pricing and pay-
per-site are encouraging
penetration of data services
adoption
Data (2.5G) Plan Tariffs (INR)1
CONTENT
• Wider variety of VAS content
and services available to
Indian user today; carriers
have become significant
distribution partners
• App stores with inventories
into the millions across
multiple categories and
genres are being launched by
carriers, handset OEMs and
third party stores
DEMAND
• The complete ecosystem
across devices, access and
content is resulting in
growing demand from
consumers for mobile
internet services 30
75
CY2008 CY2010
Active Mobile Data (GPRS)
Users in India
450
90
2008 20101
Indian Music Industry Revenues
by Component (2010)
41%
49%
10%
Digital Music
Physical Music
Others
Note: 1. Estimated price for entry level plan with unlimited monthly data usage

6
However, key market and policy enablers in the on-deck, off-deck and SMS
markets will be imperative for growth
Second Order Impact
Affordability
Price points for VAS remains flat,
due to lack of competitive offerings
Ecosystem Evolution
Lack of innovative product and
service offerings, with VAS providers
focusing on mass market services
Investments for Scalability
Limited investment in this sector due
to perceived risk around carrier
control on revenue shares and billing
Consumer Welfare
Lack of consumer interest protection,
with no clarity on data charges and
pricing for SMS/calls to short codes
Mobile VAS: Challenges
Challenges for On-Deck VAS1
1. Carrier control
2. MIS reconciliation
3. Dispute redressal
Key Issues
• Perceived scalability and profitability
constraints for D2C models, due to
high % of billing share, and lack of
alternate billing models
• Companies focusing on basic mass
market offerings which can drive
volumes in alignment with carriers
• Market inefficiencies resulting in
perceived scalability constraints for
VAS providers
• Focus of platform providers shifting to
international markets to drive higher
revenue from their offerings
First Order Impact
Challenges for Off-Deck VAS2
1. Lack of alternate payment channels
2. No control over end user pricing
3. Skewed revenue shares when
using carrier billing
Source: Analysys Mason, Industry Inputs
• Addressable base of SMS limited,
with only 47% penetration
• Mobile marketing / advertising on
SMS also constrained
Challenges for SMS adoption
1. Limited understanding of English /
Roman characters
Note: 1. On-Deck VAS: Value added services which are available through the carrier; 2. Off-Deck VAS: Value added services which are available through D2C models

7
Global experience suggests that a policy framework without licensing and
market determined revenue shares is the right way forward
1. Policy Framework without
Licensing
2. Licensing with Market Determined
Revenue Share
3. Licensing with Policy
Determined Revenue Share
• No separate VAS license needs to
be issued – but a policy framework
to support VAS providers is required
• A broader licensing framework, which
leaves revenue shares to be driven by
market forces
• A focused licensing regime needs to
be in place for VAS, including
regulation recommending minimum
revenue shares
• Revenue shares should be left to
market forces, as that will help drive
innovation
• Creating licenses will increase the
costs of the MVASPs and innovation
will suffer as smaller VAS providers
will not be able to bear the attendant
costs of a license
• Licensing will ensure that the VAS
industry gets support on critical issues
such as MIS reconciliation and dispute
redressal
• Revenue share is a commercial
agreement between entities and cannot
be mandated by the Government
• Once off-deck services gain traction,
market forces will drive revenue shares
without intervention
• Revenue shares remain a critical
element in the mobile VAS ecosystem
and are currently hampering growth
and investment in the industry because
of their low levels
• Once revenue shares are regulated,
other operational issues such as MIS
would also get addressed
• Formation of a self governed
industry forum to formally represent
the VASPs
• Formation of a premium number
policy which will govern the
operation of short codes
• A VAS licensing framework that will
regulate MIS, dispute redressal and
other issues, but will leave revenue
shares to market participants
• A VAS license framework that will
regulate revenue shares, and
recommend measures for
implementation and monitoring
Source: Analysys Mason, Industry Inputs
Mobile VAS: Recommended Solutions
Ration
ale
P
ote
ntia
l S
olu
tion
P
ositio
n

8
For on-deck, an industry self-governing board that can act as a formal
forum for participants in the MVAS ecosystem can be beneficial
On-Deck VAS
Source: Analysys Mason
Mobile VAS: On-Deck VAS Providers (Recommended Solutions)
MVAS Industry
Governing Board
IAMAI COAI / AUSPI
MVAS Services
Providers
Technology
Platform Providers Carriers
Formation of an MVAS Authority
Members From Stakeholders Across
the Value Chain
Formation of an Industry Association for Mobile VAS Providers in India
1. Self governing VAS forum
2. Board can draft guidelines for MIS
reconciliation between mobile VAS
providers and carriers
3. Act as a forum for grievance redressal
and issue directives for action
4. The functioning / structure of the board
can be modeled after the ASCI1
Handset
Manufacturers
Note: 1. ASCI stands for Advertising Standards Council of India

9
However, billing remains a major issue in addition to carrier control over
end user pricing of off-deck services
Source: Analysys Mason, Wireless Intelligence, Industry Inputs
10
3
10
15
10
30
3 3
10
15
10
30
0
10
20
30
Voice PremiumSMS
Mono Tone Poly Tone WallpaperDownload
CRBTSubscription
2007 2010
End user Price for Voice and Non-Voice
Offerings in India (2007 & 2010)1
Note: 1. For a 10 minute call; 2007 rate assumed at INR 1 per minute, 2009 rate at INR 0.5 paisa per second, Cost of per transaction for SMS,
monotone, polytone and wallpaper, monthly subscription for CRBT; 2. India (Paid game on Indiatimes), USA, UK, China (Paid game
on Apple Apps Store), Malaysia (GamesUnlimited; Maxis games site); Most games in China are cracked and available for free.
Number in parenthesis indicates the cost of game as a % of ARPU
161.6
2171.7
1507.5
444.6
722.3
54.0 44.6 42.8 44.6 119.7
0
500
1000
1500
2000
2500
India USA UK China Malaysia
ARPU Game Price
(33%)
(2%)
(3%)
(10%)
(17%)
INR INR
(10 mins call)1
Off-Deck VAS
Mobile VAS: Off-Deck Providers (Challenges)
ARPU vs. Price of Popular Game in Different Countries (INR)2

10
A policy framework (without licensing) that will mandate a premium
number policy can potentially address the challenges for off-deck billing
Mobile VAS: Off-Deck Providers (Recommended Solutions)
Source: Analysys Mason
Proposed Framework for Premium Number Policy
Central Short Code (CSC) Agency
Created & Mandated by TRAI
Carrier
1
Carrier
n
Carrier
2 ….
VAS Provider
• Short codes
allocated and
maintained by
this central
agency
• Pan India access
across all
carriers
• Mandated
turnaround time
of activation
across carriers
• VAS Provider Offers
Services to Users
Across Carriers
User Billed
by carrier
for service
Short Code Operational
Across Carriers
Host carrier pays
VASP; Keeps share
to cover
interconnection and
other costs
Revenue Flow Service Flow
• CSC agency to be set up as a
licensed entity under TRAI
• Licensing of CSC agency allows it to
enter into agreements with other
licensed entities
• TRAI to mandate a ‘Rate Card’ under
IUC regulations, which includes billing,
origination and termination charges for
carriers whose customer originates
service access request
• This policy will guarantee pan India
access across all carriers
Off-Deck VAS

11
Mandating the incorporation of a standards based local language solution
on all handsets can help drive SMS penetration
Mobile VAS: SMS (Challenges and Recommendation)
Source: Analysys Mason, Centre of Excellence in Wireless Technology (CEWiT) India Reports
Enablers: Local Language Support on Handsets
• Mandate standardization of character set of local
language fonts
Partnering with an organization like CEWiT and others
to get key standards in place for:
– Indic 7-bit encoding (improves text payload in a SMS)
– Simplified Indic keypad design (to make user adoption
easy)
– Memory efficient font libraries (critical for distribution
and field support)
• Mandate incorporation of local language
standards on all handsets sold in India
Partnering with top handset vendors to motivate
adoption of new standards by mid-2012 and launch of
an industry-wide education campaign
SMS Penetration
SMS Penetration, 2010
100%
80%
47%
0%
25%
50%
75%
100%
Philippines China India
• Apart from lower SMS pricing in Philippines and China than
in India, the ability to message in local language is the key
driver for high SMS penetration
• Different handset OEMs use their own proprietary standards
for Indian language text, creating interoperability issues

12
In the future, emerging areas of m-commerce & advertising, and changes
in the VAS value chain will modify the way services are consumed
Content Aggregators
Carriers
Technology Platform Enablers
Product/ Apps
Retail
Advertising/Profiling/Relevance Platform
Mobile Commerce Platform
Content Repurposing / ISV4
Online
Handset OEM
3rd Party VASP WAP SMS
Content Developer
UGC Device Integration
Carrier
Cash/ CC/ DC
MPG2 / Ad3 Voice
• Backward integration across the three segments e.g. TPE moving into content aggregation
• UGC gaining adoption
• Easy integration of VAS products on to the carrier SDP / network
• With initiatives like START/STOP, focus is on enabling users to experiment with multiple products
• Carriers offering ad-based services for secondary revenue streams
• Partnering with payment companies for additional revenue from mobile shopping and remittance
• M-commerce solution provider with one or more capabilities such as mobile payment, mobile banking, money transfer and mobile shopping
• Carriers deploying profiling / relevance platform for better targeting
• Ad-networks forming dedicated sales force to sell branded inventory
Managed Services / Network OEM /VAS SI
• Network OEMs are providing technology platform for carriers, e.g. Network OEM CRBT platform integration in carrier network
Carrier Billing
MPG2
Ad3
• Handset OEM is offering VAS under its brand on multiple sales channel: online, retail and mobile
• D2C players using alternate payment channels
Voice
SMS1
Online
WAP
Source: Analysys Mason, Industry Inputs
Note: 1. STK embedded content is included in SMS; 2. Mobile Payment Gateway; 3. Ad based revenues; 4. Independent Software Vendor
Mobile VAS Trends

13
Based on these structural changes and market trends, we have identified
nine themes which will have a significant role in shaping MVAS in India
Themes Introduction
Source: Analysys Mason
Category Current Situation Key Trends
Category Themes
1
Consumer
VAS
• Commerce • Current scalable models use prepaid cards, and not
mobile; pilots by carriers, banks, D2C • UID accepted as KYC will increase share of G2C; carriers
pushing financial inclusion also a key driver (banking,
domestic remittances)
2 • Entertainment
Services • Services around music and gaming has seen early
adoption among mid ARPU segment • New products such as streaming music, full song download
and mobile games
3 • Utility Services • Multiple pilots, with few scalable models (e.g. RML,
IKSL), Location based services • Utility apps and affordable feature-phones to drive adoption
of productivity and livelihood enhancement services
4 • Community Services • Carrier promoted SNCs (e.g. AirtelFrenz)
aggregating audience on an ad monetization model • Emergence of new monetization models based on micro
transactions, content sales (e.g. Rocketalk) with carrier
marketing support, and increased off-deck usage
5 • Mobile Video • Limited services on EDGE with very poor user
experience • Launch of 3G services by 2011 by all major carriers, with a
strong video services portfolio (e.g. mobile TV, video calling)
6 • Device Apps and App
Stores • Carrier app stores dominate; D2C app stores facing
issues of billing as credit card penetration is low • Emergence of affordable android based phones, app store
push by handset OEMs, launch of 3G, utility apps (e.g.
railway booking)
7 Network
VAS • Network Services
• Among all the network services such as CRBT, CMS,
Roaming, Recharging, Location Enablement, CRBT
contributes significant share to total MVAS market
• CRBT has reached a mature level of adoption, while few
network services such as voice mail is limited by cultural and
price points
8
Enterprise
VAS
• Mobile Ad / Marketing • SMS / display ads used for lead generation and
digital content sale; poor user experience • 3G and better device form factors expected to enhance
effectiveness of display advertising and help ecosystem
growth
9 • Enterprise Solutions • Enterprise messaging solutions (e.g. Valuefirst) ,
Sales force management • Emergence of enterprise mobility providers with vertical
specific, carrier / software agnostic middleware solutions
(e.g. Mobien)
14
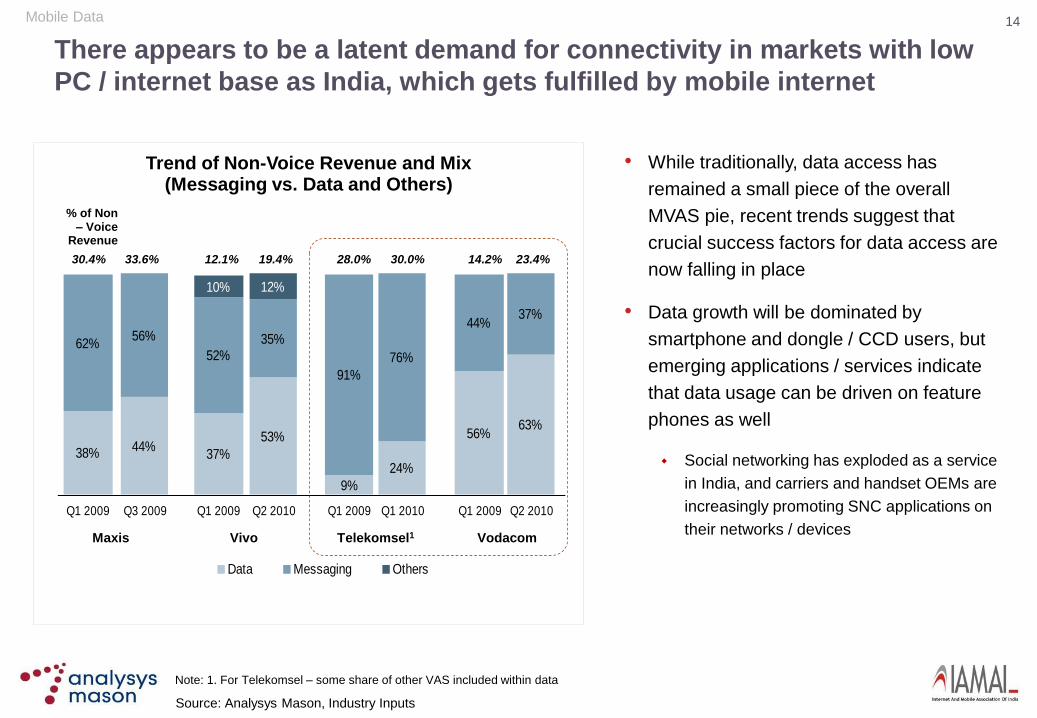
There appears to be a latent demand for connectivity in markets with low
PC / internet base as India, which gets fulfilled by mobile internet
• While traditionally, data access has
remained a small piece of the overall
MVAS pie, recent trends suggest that
crucial success factors for data access are
now falling in place
• Data growth will be dominated by
smartphone and dongle / CCD users, but
emerging applications / services indicate
that data usage can be driven on feature
phones as well
Social networking has exploded as a service
in India, and carriers and handset OEMs are
increasingly promoting SNC applications on
their networks / devices
Mobile Data
Note: 1. For Telekomsel – some share of other VAS included within data
38% 37%
9%
56%
62%52%
91%
44%
10%
Q1 2009 Q1 2009 Q1 2009 Q1 2009
Data Messaging Others
44%53%
24%
63%
56% 35%
76%
37%
12%
Q3 2009 Q2 2010 Q1 2010 Q2 2010
30.4% 33.6% 28.0% 30.0% 14.2% 23.4% 12.1% 19.4%
% of Non – Voice
Revenue
Maxis Vivo Telekomsel1 Vodacom
Source: Analysys Mason, Industry Inputs
Trend of Non-Voice Revenue and Mix (Messaging vs. Data and Others)

15
It appears that a scalable model for app stores in India would be carrier
app stores in partnership with OEM / OS companies
Source: Analysys Mason, Industry Inputs
Carrier App Store
Ap
p S
tore
OEM / OS App Store
Third Party App Store
Developer
Community
User
Experience /
Relevance
Monetization /
Billing
Carrier OEM / OS Third Party
Current Mapping of App stores and CSF1
Critical S
ucce
ss F
acto
rs
App Stores
• Revenue share is less
• No developer forum, except Airtel
• Better profiling of its subscriber
• Poor user interface
High Medium Low Favourability of CSF1:
• High rev share • Provides
continuous support to developers
• Provides high revenue share to developers
• Profiling based on handset model
• Better user interface
• Better user interface
• Seamless billing
• Ability to implement subscription model
• Unable to implement single click checkout and subscription plan
• Unable to implement single click checkout and subscription plan
Note: 1. CSF stands for Critical Success Factors
App Store
• Carriers have a strong hold in
the value chain of mobile
applications. They provide
seamless billing and multiple
business model
• OEM / OS with their better
relationship with developers
provide rich portfolio of mobile
applications
• Third party app stores such as
by Getjar have the lowest share
today of overall revenues in the
apps market in India
Three Kinds of App Store

16
Emerging services within mobile VAS also include social networking,
instant messaging and microblogging
Classification of Mobile Community Services based on Primary Service
Business Models for Mobile Community Services
Source: Analysys Mason, Industry Inputs
Primary
Service Description Key Service Providers
Social
Networking
Community
• Includes sharing of
multimedia content
along with posting
status messages to
a group of friends
Instant
Messaging
• Includes real time
P2P communication
over mobile internet
Micro-
blogging
• Includes sharing of
status messages
only
Mobile Community Services
Mobile Extension of Online Community Services
• These communities are feature rich platforms that
allows a wide range of activities including sharing of
text, photos and videos in addition to playing games
• Broadband connection and a wide screen is required
for taking advantage of the features available
• Mobile version, usually an application, is a strip down
version in terms of features and allowed activities
Custom Built for Mobile (Mobile Only Services)
• These communities have mobile as the primary
access channel and the platforms are highly
optimized for mobile usage
• Features offered through these communities are
customized to work on slow 2G data channel, as well
as other bearer channels
• The primary target users are ‘mobile first’ data users

17
Livelihood enhancement services, especially in rural areas, will play a key
role in the development of this sector
Source: Analysys Mason, Industry Inputs
Utility Services
Case
Study Description User base Pricing
RML
Information
Alert
Services
• Provides
agricultural and
commodity pricing
information service
via SMS
~ 0.3 mn farmers
have subscribed to
RML (Q1 2010)
So far, the service
has reached more
than 1 mn farmers
across 15K villages
(Nov 2010)
• Price: INR 175
(USD 3.8) for 3
months; INR 75
(USD ) per
month by Idea
Cellular
Behtar
Zindagi
Mobile
health
• Voice based rural
information services
on livestock, mandi
prices, fishery
advisory and others
Launched in March
2011
• Subscription
fee: INR 2 for 1
day and INR 30
for 30 days and
INR 1 per
minute
LifeLines –
Education
Mobile
Education
• Connects teachers
in rural areas with
education experts
whom they can
consult on
educational queries
via IVR
More than 25,000
academic query-
answer sets have
been facilitated
under this service in
2010
• Transaction
charge of INR 5
(USD 0.1) per
call
Eko
Financial
Inclusion
• Provides financial
services to the un-
banked population
in urban as well as
rural areas
Over 180,000 customers across Delhi-NCR and
Bihar-Jharkhand till October 2010
• Free
Access to Information
Uti
lity
Se
rvic
es
Access to Opportunity
Access to Infrastructure
• Alerts related to crop price,
weather updates
• Stocks and news alerts
• Location based services and
maps
• Push email
• Mobile education, tutorials for
English in multiple language
• Job listings on mobile
• Health support on mobile,
including regular health tips
• Mobile governance services
such as tracking passport
application, details of utility
payments
• Financial inclusions via mobile
and mobile ticketing
Use Case of Utility Services

18
Source: Analysys Mason, FICCI Frames 2010, Company Reports
M-Commerce will be another critical growth driver with carriers and D2C
providers experimenting with multiple models
Mobile Commerce
Payments
• Under the current regulations, there are two models for payment
using mobile: linked payment instruments and stored wallets
model
• The linked payment model has witnessed some traction for utility
bill payments and some small value shopping
• The stored wallets model is relatively new, and has the potential
to gain traction for small ticket items and eventually as an
alternative to credit cards for digital payment
• However, regulations do not allow cash out, which can potentially
slow adoption as users are reluctant to lock in cash
Banking
• Mobile banking reduces the transaction cost for banks and
provides a convenient channel for account holders
• Mobile will add relatively higher value for serving the needs of the
un-banked segment for banking and remittance
• BC based banking is expected to be popular amongst the un-
banked segment
• However, given low deposits this does not translate into a
significant market opportunity
MGNREGA Project FY-09 FY-101
Districts covered 615 619
Total Issued Job
Cards (mn) 100 109
Number of
households
benefited (mn)
45 43
Budget outlay
(USD bn) 6.5 8.5
G2C Payouts
• BC accounts opened with UIDs
will enable the unbanked
population to receive benefits
from government
• Government gives a lot of cash
benefits like old age pension,
disability pension, widows
pension and MGNREGA
payment
• Under the current regulations,
mobile enablement is possible
only for domestic remittance
• BC based remittance will form
the dominant portion, driven
by urban to rural channels.
Users will shift to mobile
remittance for convenience
and cost
Inter-state Remittance (2009)
Domestic Remittance Size
(Migrants) ~USD 12 bn
Via Post Office ~USD 1.8 bn1
Via ‘Friends & Family’ ~USD 10.2 bn
Informal (non-migrant) ~USD 13 bn
Average Annual Transaction
Value per Worker ~USD 150
Domestic Remittance

19
Mobile VAS Market Potential (INR bn) & Its Share of Telecom Revenue
Source: Analysys Mason, Industry Inputs
With the above market and policy initiatives, MVAS revenues is expected
to account for as much as 51% of incremental industry revenues in 2015
Forecasts: MVAS Industry
Note: 1. Others include m-commerce and CMS
• Indian MVAS industry will reach contribution
levels seen in other emerging markets such as
Malaysia and China
• Data access will be the biggest revenue driver
based on handset based access and CCD /
dongles
• CRBT will decline in revenue contribution due to
poor per unit economics for carriers and end
user affordability
• SMS penetration is expected to stabilize at the
current levels due to consumer behaviour and
literacy issues unless local language can be
introduced
25 49 88
150 201 215
48 58
62
81
123 148
13 16
19
23
28 34
96
132
159
182
202
219
28
32
34
34
35
37
2
4
6
9
14
19
213
291
368
480
603
671
16% 18%
22%
27%
31% 31%
2010 2011 2012 2013 2014 2015
Mobile Internet (Handset) Dongles / CCD Data Access
IVR Messaging
CRBT Others1
Share of MVAS

20
Data Users (mn)
Source: Analysys Mason, Industry Inputs
This growth is driven primarily by a forecasted 534 mn data users in 2015
across 2.5G, 3G and 4G, contributing 54% of total mobile VAS revenue
76 125
183
275
372
468
7
12
18
28
48
66
83
137
201
303
420
534
2010 2011 2012 2013 2014 2015
Handset Data Users Dongles & CCDs
Forecasts: MVAS Industry – Data Users
• Of an estimated active base of 1.1 bn
subscribers in 2015, 154 mn subscribers are
expected to access data on 2.5G and 314 mn
subscribers on 3G
• Adoption of mobile handset data will continue to
grow, with reduction in price per MB for HSPA
data, increasing penetration of feature-phones
and smartphones, as well as availability of
content and applications
• User base of 22 mn is expected on 3G handsets
in 2011, contributing a data ARPU of INR 133 in
2011 going down to INR 49 in 2015, with access
accounting for a major share of the revenues
• EVDO dongles are expected to dominate the
mobile broadband access market from PCs, as
they provide relatively better capacity and cost
per MB than HSPA
• 4G / LTE dongle and CCD base is expected to
reach 21 mn by 2015

21
www.iamai.in www.amalysysmason.com
To access the report, please visit:
www.iamai.in
www.analysysmason.com/india
www.slideshare.net/analysysmason