iaitc nutrition lessons - illinois aitc...colors and proportion of the food guide pyramid. 4. make...
TRANSCRIPT

IAITC Nutrition
Lessons
Activities to complement the Nutrition Ag Mag

Sorting It All Out
Grade Level: K-3 Objective: After completing this lesson, students should be able to distinguish between the food groups in which each food item belongs. Illinois Learning Standards: 12.A.1b; 23.B.1; 24.B.1 Assessment Standards: 12.4.02 Suggested Reading Materials: The Edible Pyramid: Good Eating Every Day (revised edition) by Loreen Leedy ISBN-13: 978-0-8234-2075-9 AITC Nutrition Ag Mag What you will need: 6 Hula Hoops Plastic Food or Pictures of Food Items that represent each food group Activity Instructions: 1. Label each hula hoop as one of the food groups-Fruits, Vegetables, Grains, Milk,
Meat & Beans, and Fats & Oils and place on the floor. 2. Hand out the plastic food or pictures of food to your students and then have them
come up and put them in the hula hoop that they think it belongs in. 3. After they are done, go through and discuss the foods that are in each category. If
foods are placed in the wrong category discuss why they do not belong, and what category they should be in.
Lesson Extenders: 1. Label the hula hoops with nutritional information. For example: Carbohydrates,
Protein, Calcium, Vitamins, Minerals. Have the students sort out their food accord-ing to what nutritional value would be gained by eating that particular food. For ex-ample: Milk would go in the calcium hoop.
2. Label the hula hoops with continents and have the students try to figure out which
continents are responsible for growing each food item. This is a great way to talk about different countries, climates, temperatures, soil types, trade, etc.
Health and Nutrition

Sorting It All Out
Additional Information For Teachers: Sorting By Continents (Top Producers): Information take from United States Department of Agriculture website: www.usda.gov North America Beef-U.S. #1, Brazil #2, European Union (EU) #3, China #4 Chickens-U.S. #1, China #2, Brazil #3, EU #4 Milk-U.S. #1, India #2, China #3, Russia #4 Cheese-U.S. #1, Brazil #2, Argentina #3 Potatoes-Canada #1, China #2, EU #3, U.S. #4 South America Citrus-Brazil #1, China #2, U.S. #3, Spain #4, Mexico #5 Asia Wheat-China #1, India #2, U.S. #3 Apples-China #1 Pears-China #1 Pork-China #1, EU #2, U.S. #3 Tomatoes-China #1, U.S. #2, EU #3 Butter-India #1, U.S. #2, New Zealand #3 Australia Africa Europe Grapes-EU (Italy, France, Spain) #1, China #2, U.S. #5 Antarctica

Perfect Proportions
Health and Nutrition
Math
Grade Level: K-3 Objective: After completing this activity, students will improve their record keeping skills. Students will be able to figure portion sizes and be able to count the number of servings from each food group. Students will also use their graphing skills. Illinois Learning Standards: 6.D.1; 10.B.1a; 10.B.1b; 10.B.1c; 23.B.1 Assessment Standards: 6.5.18; 10.4.02 Suggested Reading Material: Hungry Planet: What The World Eats by Peter Menzel & Faith D’Aluisio ISBN-10: 1580088694 Introduction: This lesson was designed to go along with the book Hungry Planet: What The World Eats and with the “What Do You Eat?” activity in the IAITC Nutrition Ag Mag. Activity Instructions: 1. Have the students record everything they eat for 1 week in a journal. Be sure to in-
clude breakfast, lunch, dinner and all snack and drinks. 2. Next, have the students figure how many servings of each food group they had for
the entire week. 3. Have the students fill in the squares of the graph to create their own bar graph. 4. Compare the bar graph to the food guide pyramid. Did the students eat the right pro-
portions of each food group?
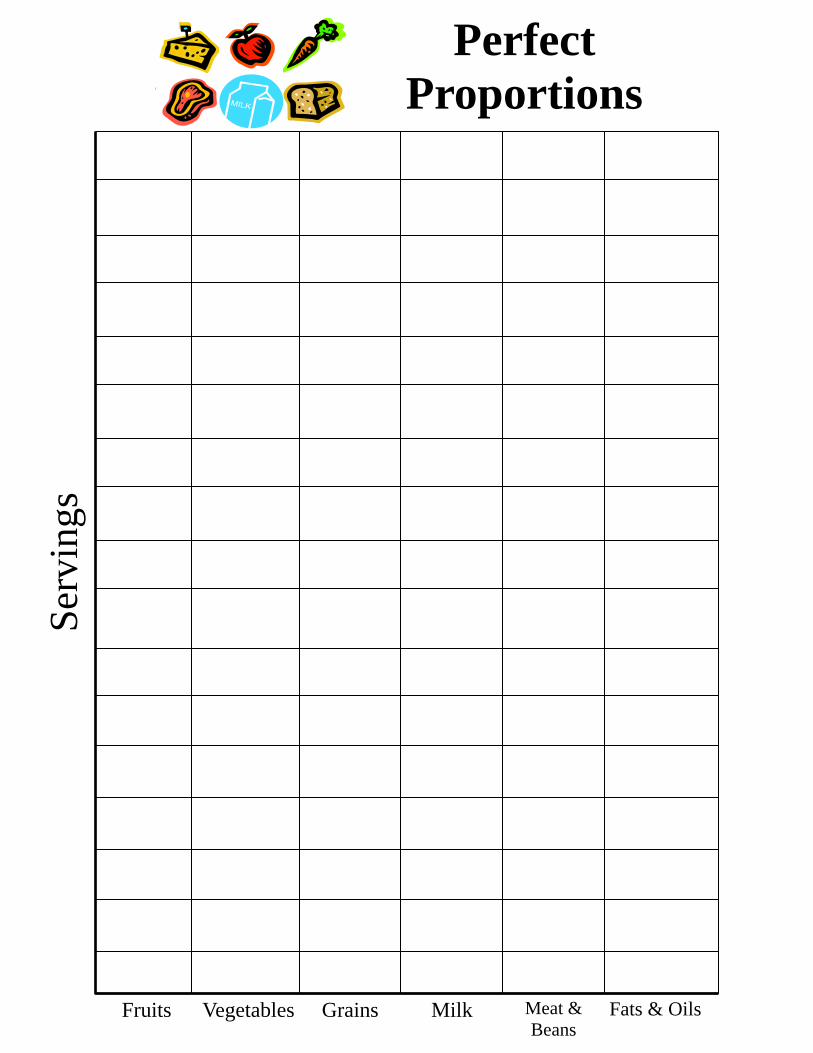
Ser
ving
s
Fruits Vegetables Grains Milk Meat & Beans
Fats & Oils
Perfect Proportions

Digesting the World’s Diet
Social Studies Writing
Grade Level: 4-6 Objective: After completing this activity, students will have explored the nutritional habit of families all around. Students will be able to compare and contrast these coun-tries with the United States and each other. They will also be able to investigate how weather, landscape and soil types affect agriculture all around the world. Illinois Learning Standards: 3.A.2; 3.B.2b; 3.C.2a; 4.B.2a; 5.A.2b; 5.C.2b; 15.A.2a; 17.A.2a; 23.C.2a; 23.C.3 Assessment Standards: 3.5.03; 3.5.06; 3.5.19; 3.5.28 Suggested Reading Materials: Hungry Planet: What The World Eats by Peter Menzel & Faith D’Aluisio ISBN-10: 1580088694 Activity Instructions: 1. Discuss the book, Hungry Planet: What The World Eats. 2. Have the students pick one of the countries in the book (any country but the United
States). Give the students a photocopy of the picture of their country from the book and the introductory page of each country which includes the cost of all their food purchased for one week.
3. Students should investigate the country using the internet, books, encyclopedias, etc. 4. Have the students write a report on their country including what items were pur-
chased and how much money was spent. Have them include agricultural aspects such as weather/climate, topography/landscape, soil types, etc. Each student should use these findings in their discussion of why the people of their assigned country can grow specific foods and why they can’t grow other types of food. Students should also discuss nutritional aspects. Does the food purchased fulfill all of the nutritional needs of the people in that country?
5. After writing their report, have the students prepare a short presentation about their country. This could be done with a PowerPoint presentation or just a general sharing session.
6. After all students have shared their findings, discuss how the United States differs from other countries. What kind of land and climate do we have? What types of food do we buy? How much money do American families spend on food?
Lesson Extender: 1. Combine this lesson with the “Perfect Proportions” lesson. Talk about what the stu-
dents eat for one week compared to their assigned countries. This could even be in-cluded in their reports.

Food Guide Face Off
Health and Nutrition
Grade Level: 4-6 Objective: After completing this activity, students should be able to answer all ques-tions regarding portions, nutritional value, and more. Illinois Learning Standards: 1.B.2a; 1.C.2b; 23.B.2 Assessment Standards: 1.4.16; 1.4.17; 1.4.18 Suggested Reading Materials: AITC Nutrition Ag Mag Activity Instructions: 1. Have students read and review the AITC Nutrition Ag Mag. 2. Divide students into teams of 5 (or whatever works best for your class). Have each
group make a food guide die (the pattern is included on the next page). 3. Have them label each of the side with a food group using the colors that correlate
with the Food Guide Pyramid. (Fruits-red, Vegetables-green, Milk-blue, Grains-orange, Meat & Beans-purple, Oils-yellow) This will help them to remember the colors and proportion of the Food Guide Pyramid.
4. Make your Jeopardy board on the chalkboard, dry erase board, or on an overhead. Label each category to correspond with the areas of the Food Guide Pyramid. Then list the $100, $200, $300, $400 and $500 categories.
5. Have groups pick a number to decide who goes first. 6. When it is the group’s turn to go, have them roll the die. The category that lands
face up is their category. They can choose any of the money values for that catego-ry. Read the question to correspond with the money value and give all the groups 15-20 seconds to discuss. Have all groups write their answer on a sheet of paper. If the choosing group is correct they get the dollar amount. If the group is incorrect, have the other groups show their answer. Give $25 to every correct group.
7. Continue this game until all of the questions have been read and answered. At the end, give the groups the “Face Off, Pay Off” question. The groups must tell the teacher how much they are wagering before reading the question. Give the groups 30 seconds to discuss and write down their answers.
Suggested questions follow


Food Guide Face Off
Fruits $100—True or False: Fruit is a good source of protein. False-Fruits are a good source of vitamins, especially Vitamin C. $200—True or False: Fruit Punch is a good way to get your daily serving of fruit. False-It contains too much sugar. Students should eat whole fruits or be sure the label says 100% fruit juice. $300—True or False: Raisins belong in the fruit category. True-Raisins are dried grapes $400—Which of the following does not belong in the fruit group? A. Apples B. Bananas C. Orange Juice D. None of the above-All belong $500—True or False: Pumpkin is a fruit. True-Pumpkins are considered a fruit because they contain seeds. Morton, Illinois is the Pumpkin Capital of the World. Vegetables $100—Name 5 green vegetables Broccoli, spinach, green beans, peas, lettuce, kale, asparagus, cucumbers, avocados, etc. $200—True or False: If I need to get more fiber, I should eat more vegetables. True-Vegetables are a good source of fiber, which helps the digestive system. $300—True or False: Horseradish is a vegetable. True-Horseradish is technically a vegetable, although it is commonly treated as a condiment or ingredient. Collinsville, IL is the Horseradish Capital of the world. $400—Which of the following vegetables helps with eyesight? A. Green Beans B. Peppers C. Carrots-They contain beta-carotene and Vitamin A which are both good for healthy eyesight. D. All of the above $500—True or False: Field corn or dent corn is a vegetable. False-It is a grain.

Food Guide Face Off
Milk $100—America’s favorite ice cream flavor is: A. Vanilla-according to an International Ice Cream Association survey posted on CNN.com, 29% of Americans rank vanilla as their favorite fla- vor. B. Chocolate C. Strawberry D. Neapolitan (chocolate, strawberry and vanilla) $200—True or False: All female dairy cows must have a calf to produce milk. True-Dairy cows that have not had a calf are called heifers. $300—Milk and milk products contain: A. Calcium B. Potassium C. Protein D. All of the above $400—True or False: Minerals help make hemoglobin in red blood cells, help maintain body fluids and help build strong teeth and bones. True-Calcium and phosphorus are the major minerals found in milk. $500—True or False: The average dairy cow produces 15,000 pounds of milk per year. True-According to the University of Illinois, 15,00 pounds of milk is average although that number can change as we are seeing more cows produce more milk. Grains $100—True or False: Carbohydrates are your major fuel source. True $200—True or False: Popcorn belongs in the grain group. True-It’s our state snack. Illinois is a top producer of popcorn. $300—Grains are used to make which of the following: A. Flour B. Livestock Feed C. Starches D. All of the above $400—The Soybean Capital of the World is: A. Beijing, China B. Rio de Janeiro, Brazil C. Decatur, Illinois D. Des Moines, Iowa $500—How much of your grain consumption should be whole grains? At least half - “make half your grains whole”

Meat & Beans $100—True or False: Pigs are the most intelligent animal. False-They are the fourth smartest animal. Chimpanzees, monkeys, apes etc. are the smartest $200—True or False: Protein supplies energy, builds cells and blood and aids in the growth of healthy muscles, organs, skin and hair. True $300—True or False: Eggs belong in the meat and beans group. True-It’s Poultry $400—Which of these foods does not belong in the Meat & Beans food group A. Chicken B. Pork Chop C. Peanut Butter D. None of the above-All listed foods belong in the meat & beans group $500—In your lifetime, you will eat approximately how many steers? A. 7 B. 10 C. 5 D. 13 Oils $100—True or False: Carbonated soft drinks are the number one beverage consumed by Americans. True-Milk is number 2 and bottled water is number 3 $200—True or False: Nuts, fish, olives and avocados are all naturally high in oils. True $300—True or False: We need oils and fats for good health. True-We do need some. You should get them from fish, nuts and liquid oils, not candy, soda, etc. $400—True or False:Energy drinks like Red Bull and Gatorade are a better alternative to drinking soda pop. True-They do contain less sugar than pop, but they are not a healthy drink. Try drinking more water, milk and 100% fruit juices. $500—True or False: Oils is a food group on the Food Guide Pyramid. False-Oils are not a food group, but you do need some for good health. Get your oils from fish, nuts and liquid oils such as corn oil, soybean oil or canola oil. Face Off, Pay Off Question Who created the first nutrition label? The Food and Drug Administration (FDA)-The Pure Food and Drug Act of 1906 was created in response to the book “The Jungle” by Upton Sinclair. This act required the proper labeling of foods and ingredients.
Food Guide Face Off

Higher or Lower: Ingredient Investigation
Grade Level: 4-6 Objective: After completing this lesson, students will improve their knowledge of non-nutritional ingredients used in food items used every day. Illinois Learning Standards: 10.A.2c; 10.B.2.2d Assessment Standards: 10.5.01 Suggested Reading Materials: AITC Nutrition Ag Mag What you will need: Any food items-examples include ketchup, Gatorade, Pepsi, etc. Activity Instructions: 1. Sit each food item on a table. Lay a card in front of each item and label each with an
incorrect amount of sugar, sodium or other non-nutritional item. For example: in front of the ketchup, write 16 grams of sugar on the card. You can write the correct answer on the back of the card.
2. Divide students up into two teams. 3. Call the students down in groups of two and play as though you are the host of The
Price Is Right. Each student should have two cards-one that says “higher” and one the says “lower.” Read the card for one item and have the students guess whether the answer is higher or lower than the correct answer. They should hold up their an-swer at the same time.
4. After each answer is given, read the correct answer. Discuss how much sugar, salt, etc. is in each food item and why those ingredients are not healthy.
5. Give each correct answer 25 points. Keep track of the points for each team. Lesson Extender: 1. Buy two bottles of each food item. Empty one of the bottles. Have the students
weigh and measure the amount of sugar, salt, or other unhealthy ingredient. Students will be able to see how much sugar is in a bottle of ketchup or Pepsi, etc. Students will also be able to use their measuring and math skills to complete the activity.
Health and Nutrition Math

Higher or Lower: Ingredient Investigation
Additional Information for Teacher Use: Recommended Daily Intake of sodium and sugar based on a 2,000 calorie diet if you are eating the correct amount of other foods like fruits and vegetables Sodium-2400 mg Required for nerve and muscle functioning Too much can damage kidneys and cause high blood pressure Average American's salt intake: 2-3 teaspoons a day (4,000-6,000 mg) or twice the recom-
mended intake Sugar-8 teaspoons (32 grams) added sugar Good sugars occur naturally in some food and supply key nutrients * Low-fat milk (skim, 1%, or soymilk) * Fresh and frozen fruits * Most veggies Average American's sugar intake: 20 teaspoons a day (80 grams) (2.5 times the recom-
mended) Sample Food Items:
FOOD ITEM SERVING SIZE
SERVINGS/ CONTAIN-
ER
SUGARS/ SERVING
SODIUM/ SERVING
Peanut Butter 2 Tablespoons 16 3 g 140 mg
Ketchup 1 Tablespoon 40 4 g 190 mg
V8 Vegetable Juice
1 Can 1 11 g 690 mg
Canned Green Beans
½ Cup 3.5 2 g 330 mg
Progresso Soup 1 Cup 2 2 g 870 mg
Coke-20 oz. 8 Fluid Ounces 2.5 27 g (whole bottle-67.5g)
35 mg
Gatorade 8 Fluid Ounces 4 14 g (whole bottle-56g)
110 mg
Juicy Juice 8 Fluid Ounces 6 26 g (whole bottle-156g)
20 mg

Make Your Own Pyramid Mobile
Objective: After completing this activity, students will know how to distinguish be-tween food groups and what food item belong in each food group. Suggested Reading Materials: The Edible Pyramid: Good Eating Every Day (revised edition) by Loreen Leedy ISBN-13: 978-0-8234-2075-9 AITC Nutrition Ag Mag Materials Needed: Pyramid pattern w/ clip art cut-outs (included on the following pages) Scissors Glue Yarn-Orange, green, red, yellow, blue and purple Fishing line Washer Directions: 1. Look at the pyramid pattern included on the next page. Remove the bottom quarter
of the page by cutting straight across the bottom line as indicated on the next page. 2. You should now have a square. Fold the square in half from corner to corner. Use
the dark lines as a guideline for folding. 3. Unfold the square and fold it in half from corner to corner in the opposite direction. 4. Unfold the square. Have your students color the sections of each food guide pyra-
mid. Correlate the colors with the correct colors of the food guide pyramid. Grains-orange; Vegetables-green; Fruits-red; Oils-yellow; Milk-blue; Meat & Beans-purple.
5. Next, cut along the dotted line from the corner to the middle of the sheet. 6. Tie a washer to the bottom of the fishing line. This will act as a weight for hanging
our pyramid. Insert a piece of fishing line into the middle of the pyramid via the cut you just made. This will hang our pyramid. Attach a paper clip the fishing line to act as our hook for hanging.
7. Fold the blank triangle under the triangle to the left and glue. 8. Have students tie the pictures of the food items to the correct food group. Have the
clip art copied onto construction paper or card stock colored the same as the food group it belongs in. Use yarn that is colored the same as each food group. Tie 2 food groups to each side of the pyramid. Tie the exercise picture to the washer in the middle.
9. Discuss the food groups as you’re making your mobile.

Gra
ins
Veg
etab
les
Fru
its
Oils
Milk
Mea
t & B
eans
Grains
Vegetables
Fruits
Oils
Milk
Meat & B
eans
Meat & Beans
Milk
Oils
Fru
its
Vegetables
Grains
Remove this bottom portion by cutting straight across the line above.


Additional Resources
For Information on the Food Guide Pyramid:
United Stated Department of Agriculture
www.mypyramid.gov
1701 Towanda Avenue Bloomington, IL 61701-2050
Phone: (309) 557-3334 www.agintheclassroom.org
For Information on lessons and activities, or to order Ag Mags, contact:
Your local County Farm Bureau www.ilfb.org Your local Agricultural Literacy Coordinator www.aginthclassroom.org