iadc isp program
TRANSCRIPT

IADC
ISP PROGRAM
Summary of Occupational Incidents
(Industry Totals)
Issued 15 June 2015

Table of Contents (Table of Contents is Hyperlinked, Just click on Topic & go)
SUMMARY OF OCCUPATIONAL INCIDENTS INTRODUCTORY BRIEFING: ....................... 1
2014 ISP PROGRAM INDUSTRY TOTALS .................................................................................... 7
2014 FINAL REPORT (TABLE 1) ..............................................................................................7 5 YEAR SUMMARY REPORT (TABLE 2) ...................................................................................8 2014 - IADC INDUSTRY TOTALS (TABLE 3) .....................................................................9
Total Industry LTI & Recordable Incidence Rates vs Man-hours (Figure 1) ............................................... 9 Total Industry Land LTI & Recordable Incidence Rates vs Man-hours (Figure 2) .................................... 10 Total Industry Water LTI & Recordable Incidence Rates vs Man-hours (Figure 3) .................................. 10
IADC 2014 TOTAL INDUSTRY CHARTS ................................................................................11 Total Industry Lost Time Incidents by Month (Chart 1).............................................................................. 11 Total Industry Recordable Incidents by Month (Chart 2) ........................................................................... 12 Total Industry Lost Time Incidents by Occupation (Chart 3) ..................................................................... 13 Total Industry Recordable Incidents by Occupation (Chart 4) ................................................................... 14 Total Industry Lost Time Incidents by Body Part (Chart 5) ........................................................................ 15 Total Industry Recordable Incidents by Body Part (Chart 6) ..................................................................... 16 Total Industry Lost Time Incidents by Incident Type (Chart 7) .................................................................. 17 Total Industry Recordable Incidents by Incident Type (Chart 8) ................................................................ 18 Total Industry Lost Time Incidents by Equipment (Chart 9) ....................................................................... 19 Total Industry Recordable Incidents by Equipment (Chart 10) .................................................................. 20 Total Industry Lost Time Incidents by Operation (Chart 11) ...................................................................... 21 Total Industry Recordable Incidents by Operation (Chart 12) ................................................................... 22 Total Industry Lost Time Incidents by Location (Chart 13) ........................................................................ 23 Total Industry Recordable Incidents by Location (Chart 14) ..................................................................... 24 Total Industry Lost Time Incidents by Time in Service (Chart 15) ............................................................. 25 Total Industry Recordable Incidents by Time in Service (Chart 16) ........................................................... 26 Total Industry Lost Time Incidents by Time of Day (Chart 17) .................................................................. 27 Total Industry Recordable Incidents by Time of Day (Chart 18) ................................................................ 28 Total Industry Lost Time Incidents by Age (Chart 19) ................................................................................ 29 Total Industry Recordable Incidents by Age (Chart 20) ............................................................................. 30
2014 ISP PROGRAM REGIONAL TOTALS ................................................................................. 31 IADC 2014 Africa Totals (Table 4) ............................................................................................................. 31 Africa Total LTI & Recordable Incidence Rates vs Man-hours (Figure 4) ................................................ 31 IADC 2014 Asia Pacific Totals (Table 5) ................................................................................................... 32 Asia Pacific Total LTI & Recordable Incidence Rates vs Man-hours (Figure 5) ....................................... 32 IADC 2014 Australasia Totals (Table 6) .................................................................................................... 33 Australasia Total LTI & Recordable Incidence Rates vs Man-hours (Figure 6) ........................................ 33 IADC 2014 Canada Totals (Table 7) .......................................................................................................... 34 Canada Total LTI & Recordable Incidence Rates vs Man-hours (Figure 7) .............................................. 34 IADC 2014 Central America & Caribbean Totals (Table 8) ...................................................................... 35 Central America & Caribbean Total LTI & Recordable Incidence Rates vs Man-hours (Figure 8) .......... 35 IADC 2014 European Totals (Table 9) ....................................................................................................... 36 European Total LTI & Recordable Incidence Rates vs Man-hours (Figure 9) ........................................... 36 IADC 2014 Middle East Totals (Table 10) ................................................................................................. 37 Middle East Total LTI & Recordable Incidence Rates vs Man-hours (Figure 10) ..................................... 37 IADC 2014 South American Totals (Table 11) ........................................................................................... 38 South America Total LTI & Recordable Incidence Rates vs Man-hours (Figure 11) ................................. 38 IADC 2014 US Totals (Table 12) ................................................................................................................ 39 US Total LTI & Recordable Incidence Rates vs Man-hours (Figure 12).................................................... 39

Issued 15 June 2015 1 Copyright © International Association of Drilling Contractors
Summary of Occupational Incidents Introductory Briefing:
Data gathered in the IADC Incident Statistics Program (ISP) data base, shows that the oil and gas well drilling industry continues work toward reducing incidents on rigs. Even though there was a slight decrease in rig demand in 2014, the incidence rates improved slightly over 2013. Although IADC ISP calculates both Incidence rates and Frequency rates, this report is based on Incidence rates which are calculated on incidents per 200,000 man-hours. The Summary of Occupational Incidents (SOI) is compiled annually from data volunteered by drilling contractors worldwide to the IADC ISP Program. During 2014, 107 contractors participated in the ISP representing a total of 601,351,971 million man-hours worked. Contractors striving for safety improvement by participating in the ISP program reported 2,264 Recordable incidents, 663 Lost Time incidents including 21 fatalities. Regional Reporting Safety data is compiled separately for Land and Offshore operations for nine geographic regions. This report is not designed to measure region against region, but to provide companies operating within each region tools to measure their efforts and make improvement in their safety efforts year over year.
Industry Improvement 2014 saw the drilling industry’s worldwide Lost Time Incidence Rate improve to 0.23 which is an 11.54% improvement of the 2013 report of 0.26. The 2014 Recordable Incident rate improved to 0.75 which is a 7.41% improvement over the 2013 report of 0.81. The oil and gas well drilling industry’s efforts towards safety have resulted in the industry’s occupational LTI Incidence rate to remain the same from more than 14.00 in 1963 to 0.23 in 2014, which is a 60 fold improvement. Fatalities: In 2014 the industry’s fatalities decreased to 21 incidents compared to 22 incidents reported in 2013. According to the data reported in 2014, three (3) fatalities occurred to employees who had ten or more years of service with the company. Seven (7) fatalities occurred to employees who had more than one year but less than five years of service and three (3) with less than three months of service. Four (4) of the victims had worked for the company between six months to one year and three (3) victims had worked for the company between five years and ten years. Six (6) fatalities occurred during tripping in/out and four (4) during rig/equipment repairs or maintenance. Eight (8) victims were struck-by while five (5) were due to caught between incidents. Three (3) of the fatalities occurred to floormen and four (4) fatalities occurred to motormen.

Issued 15 June 2015 2 Copyright © International Association of Drilling Contractors
Fatal Incidents by activity Fatal Incidents by type
Fatalities by Occupation Fatalities by Time in Service
Regional Summaries: Man-Hours vs Fatalities
European Land and Offshore categories together worked more than 89 million man-hours in 2014 with one (1) fatality. European offshore accounted for 39.3 million man-hours with no fatalities while European Land had 49.83 million man-hours and one (1) fatality. US Land and Offshore contractors together worked more than 144.85 million man-hours with ten (10) fatalities. US Land had 103.73 million man-hours with ten (10) fatalities while US water had 41.12 million man-hours and no fatalities. Canadian contractors accounted for 4.17 million man-hours and one (1) fatality. Canadian Land had 2.74 million man-hours and one (1) fatality while offshore had 1.43 million man-hours and
no fatalities. Central America and Caribbean accounted for 15.50 million man-hours with two (2) fatalities. Land operations reported 8.35 million man-hours and no fatalities while water operations reported just over 7.14 million man-hours and two (2) fatalities. Africa combined land and offshore accounted for 74.59 million man-hours with two (2) fatalities. Africa Land accounted for 42.08 million man-hours with one (1) fatality while Africa Water had 32.5 million man-hours and one (1) fatality. The Middle East region accounted for 136.54 million man-hours with no fatalities. The Land division had 98.53 million man-hours and no fatalities while there were 38.01 million man-hours and no fatalities for the offshore division. Asia Pacific accounted for 74.94 million man-hours and three
Making Connection
5% Material
Handling: Crane/Cherr
y Picker 5%
Rig/Equipment
Repairs/Maintenance
20%
Tripping in/out 30%
Other 5%
Rig Up/Down
10%
Routine Drilling Ops.
10%
Run Casing/ Tubing
9% Caught Between
25%
Other 15%
Slip/Fall Dif Level 5%
Struck By 40%
Struck Against
10%
Slip/Fall Same Level
5%
Crane Operator
5%
Derrickman 10%
Driller (Asst. Dr.) 15%
Electrician 15%
Floorman 15%
Maintenance Supervisor
5%
Mechanic 5%
Motorman 20%
Other 5%
Roustabout 5%
<3mo 15%
>6mo<1yr 20%
>1yr<5yr 35%
>5yr<10yr 15%
10 Yr + 15%

Issued 15 June 2015 3 Copyright © International Association of Drilling Contractors
(3) fatalities. Water had 51.99 million man-hours and three (3) fatalities while the Land Division had 22.94 million man-hours with no fatalities. South America made up 52.3 million man-hours with two (2) fatalities. Land had 31.97 million man-hours and no fatalities while Water had 20.32 million man-hours and two (2) fatalities. Australasia made up 9.28 million man-hours with no fatalities. Land had 6 million man-hours with no fatalities while offshore had 3.28 million man-hours with no fatalities.
Lost Time and Recordable Incidents by Region
Lost time incidents among US Offshore workers was better by 6.67% from 0.15 in 2013 to 0.14 in 2014. The Total Recordable Incidence Rate also improved 17.95% from 0.78 in 2013 to 0.64 in 2014. US Land LTI Incidence rate improved 19.61% from 0.51 in 2013 to 0.41 in 2014 and Recordable Incidence Rate improved 2.53% from 1.58 in 2013 to 1.54 in 2014. European Land workers saw their LTI rate improve 29% from 0.34 for 2013 to 0.24 for 2014. The Recordable Incidence Rate also improved 27% from 0.48 in 2013 to 0.35 in 2014. European Offshore workers LTI rate improved 29.6% from 0.27 in 2013 to 0.19 in 2014 while the Recordable Incidence rate improved 14% from 0.85 in 2013 to 0.73 in 2014. Canada Land had a 2013 LTI rate of 0.61 which improved 52% to 0.29 for 2014, while their Recordable Incidence worsened 17.68% from 1.98 in 2013 to 2.33 for 2014. Canada Offshore workers saw their 2013 LTI rate of 0.0 remain the same for 2014. The Recordable Incidence rate of 0.24 for 2013 worsened 191.67% to 0.70 for 2014. Central America and Caribbean Land 2013 LTI rate of 0.27 worsened 59% to 0.43 for 2014. Their 2013 Recordable Incidence rate of 0.64 worsen 1.56% to 0.65 for 2014. Central America and Caribbean Water 2013 LTI Rate of 0.22 worsened 54.55% to 0.34 in 2014. The Recordable rate of 0.54 for 2013 worsened 66%
to 0.90 for 2014. Africa Land LTI rate for 2013 was 0.38 improved 16% for 0.32 in 2014. The Recordable Incidence rate improved 2.8% from 1.07 in 2013 to 1.04 in 2014. Africa Water LTI rate of 0.16 for 2013 worsened 12.5% to 0.18 for 2014 and their Recordable Incidence rate worsened 25% from 0.52 in 2013 to 0.65 in 2014. In 2013, Middle East Land had a LTI rate of 0.14 which remained the same in 2014. Their 2013 Recordable Incidence rate of 0.65 improved 16.9% to 0.54 in 2014. Middle East Water LTI rate of 0.08 in 2013 remained the same in 2014 and their Recordable Incidence rate worsened 20.7% from 0.29 in 2013 to 0.35 in 2014. Asia Pacific Land 2013 LTI rate was 0.22 and slightly worsened 9% to 0.24 in 2014, while their Recordable Incidence rate improved 52% from 0.94 in 2013 to 0.45 in 2014. Asia Pacific Water 2013 LTI rate of 0.15 remained the same for 2014 and their Recordable Incidence rate improved 26% from 0.54 in 2013 to 0.40 in 2014. In 2013, South America Land had an LTI rate of 0.16 which worsened 18.6% to 0.19 in 2014 and a 2013 Recordable rate of 0.51 which worsened 5.5% to 0.54 in 2014. South America Water 2013 LTI rate was 0.27 which improved 3.7% to 0.26 in 2014 and a 2013 Recordable rate of 0.66 that also improved 18% to 0.54 in 2014. Australasia Land had a 2014 LTI rate of 0.23 and Recordable incident rate of 1.37 for 2014. Australasia Water had a 2014 LTI rate of 0.06 and Recordable incident rate of 0.61.
Greatest Risks:
Incidents occur in many places around the rig and to all crewmembers. Many types of equipment and rig operations are involved in incidents and all parts of the body are at risk. Incident data are analyzed by occupation, body part, incident type, equipment type, operation, location time in service and time of day the incident occurred.
0
100
200
300
Floorman Roustabout Driller (Asst.Dr.)
LTI by Occupation (Based on 647 incidents)
0200400600800
10001200
Floorman Roustabout Derrickman
REC by Occupation (Based on 2223 incidents)

Issued 15 June 2015 4 Copyright © International Association of Drilling Contractors
Data from the IADC ISP show that of all the categories, as with previous years, the Floorman position suffers the largest percentage of Lost Time and Recordable injuries.
Fingers remained the most vulnerable part of the body.
Caught Between accounted for most Lost Time and Recordable injuries and was closely followed by Struck by injuries.
“Other” equipment is the category responsible for the most Lost Time and Recordable incidents.
0
50
100
150
Fingers Feet/Ankles Legs
LTI by Body Part (Based on 647 incidents)
0
200
400
600
800
1000
Fingers Hands/Wrists Head/Face
REC by Body Part (Based on 2223 incidents)
0
100
200
300
Struck By Caught Bet. Slip/fall diflevel
LTI by Incident Type (Based on 647 incidents)
0200400600800
10001200
Struck By Caught Bet. Slip/Fall Diff.Level
REC by Incident Type (Based on 2223 incidents)
0
50
100
150
200
250
Pipe/Tubulars Tongs Other
LTI by Equipment (Based on 647 incidents)
150200250300350400450500550600650
Pipe/Tubulars Other Hand Tools: Manual
REC by Equipment (Based on 2223 incidents)

Issued 15 June 2015 5 Copyright © International Association of Drilling Contractors
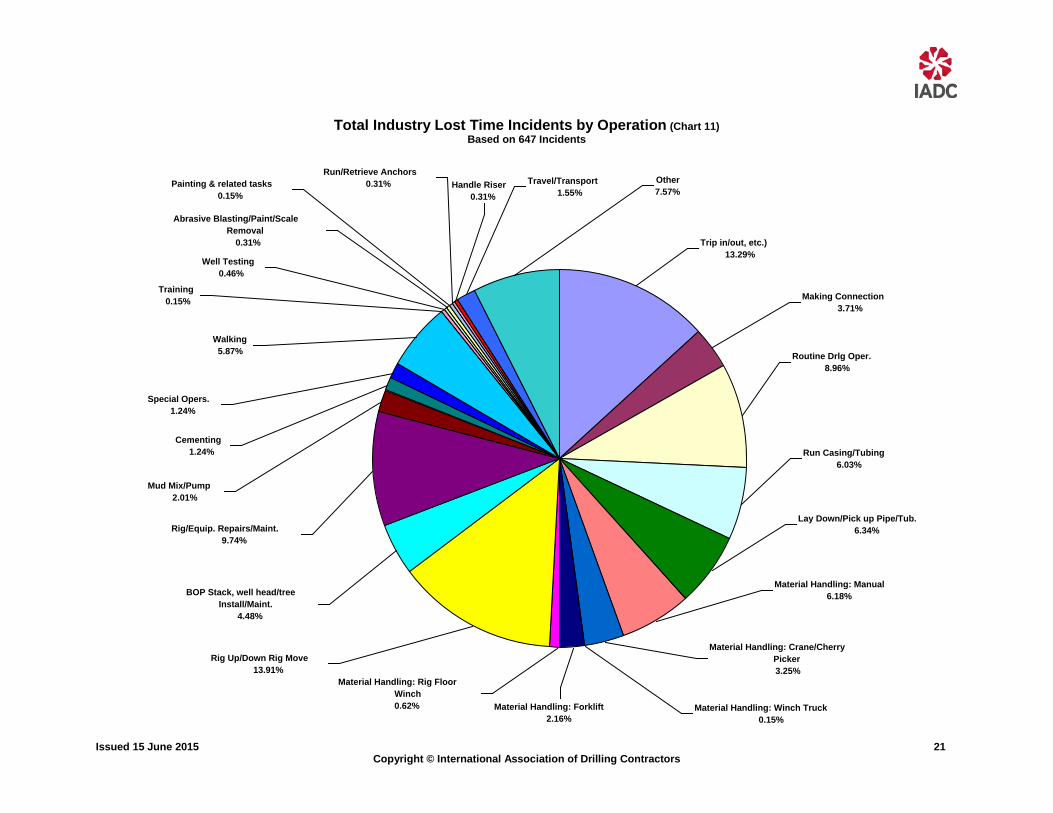
“Rig Up/Down” is the operation that involves the most Lost Time injuries while “Tripping in/out” involves the most Recordable injuries.
It is no surprise that by far the most Lost Time and Recordable injuries in drilling operations occur on the rig floor.
Lost Time and Recordable injuries based on Time in Service were led by employees with between one to five years of service.
0
50
100
150
Trip in/out Rig up/down Rig/EquipRepair/Maint.
LTI by Activity (Based on 647 incidents)
0100200300400500600
Rig Maint. Rig up/down Trip in/out
REC by Activity (Based on 2222 incidents)
050
100150200250300
Rig Pad/Deck Rigfloor Cellar/Substructure
LTI by Location (Based on 730 incidents)
0200400600800
1000
Rig Floor Rig Pad/Deck Other
REC by Location (Based on 2223 incidents)
050
100150200250300350
> 1 Yr. < 5Yrs.
0 mo. < 3mos.
> 5 Yrs. <10 Yrs.
LTI by Time In Service (Based on 633 incidents)
0200400600800
10001200
> 1 Yr. < 5Yrs.
> 5 Yr. < 10Yr.
0 mo < 3 mos
REC by Time In Service (Based on 2170 incidents)
Issued 15 June 2015 6 Copyright © International Association of Drilling Contractors
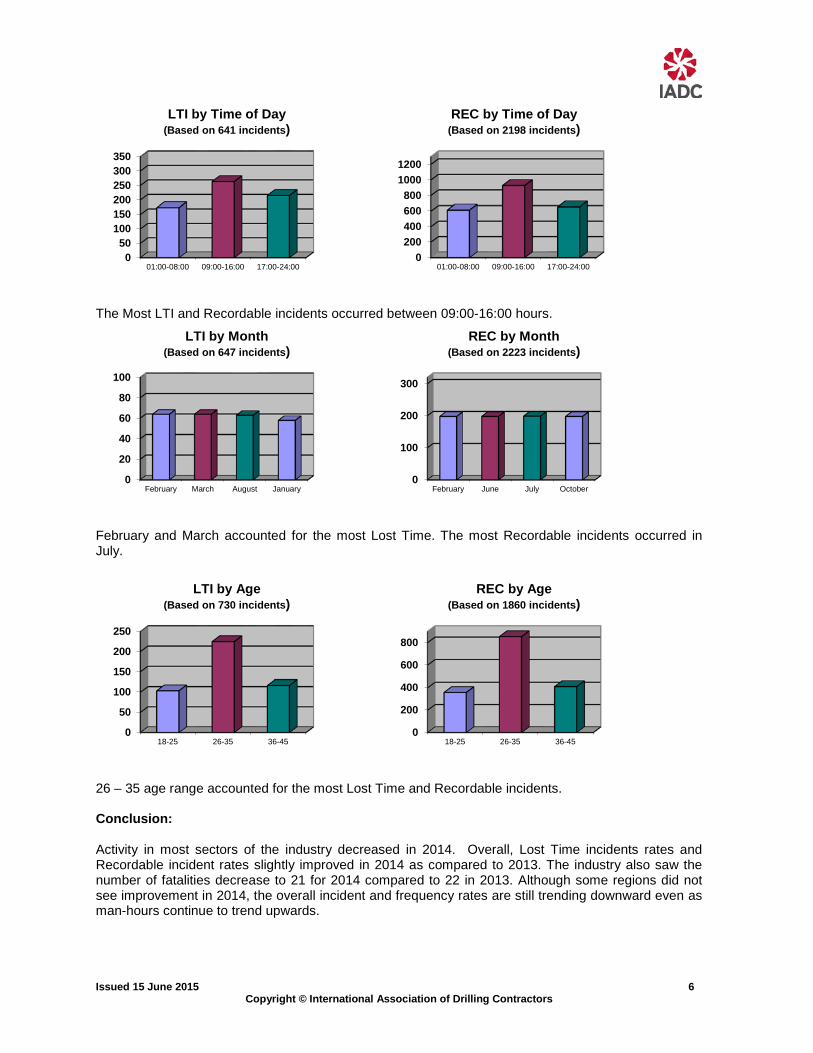
The Most LTI and Recordable incidents occurred between 09:00-16:00 hours.
February and March accounted for the most Lost Time. The most Recordable incidents occurred in July.
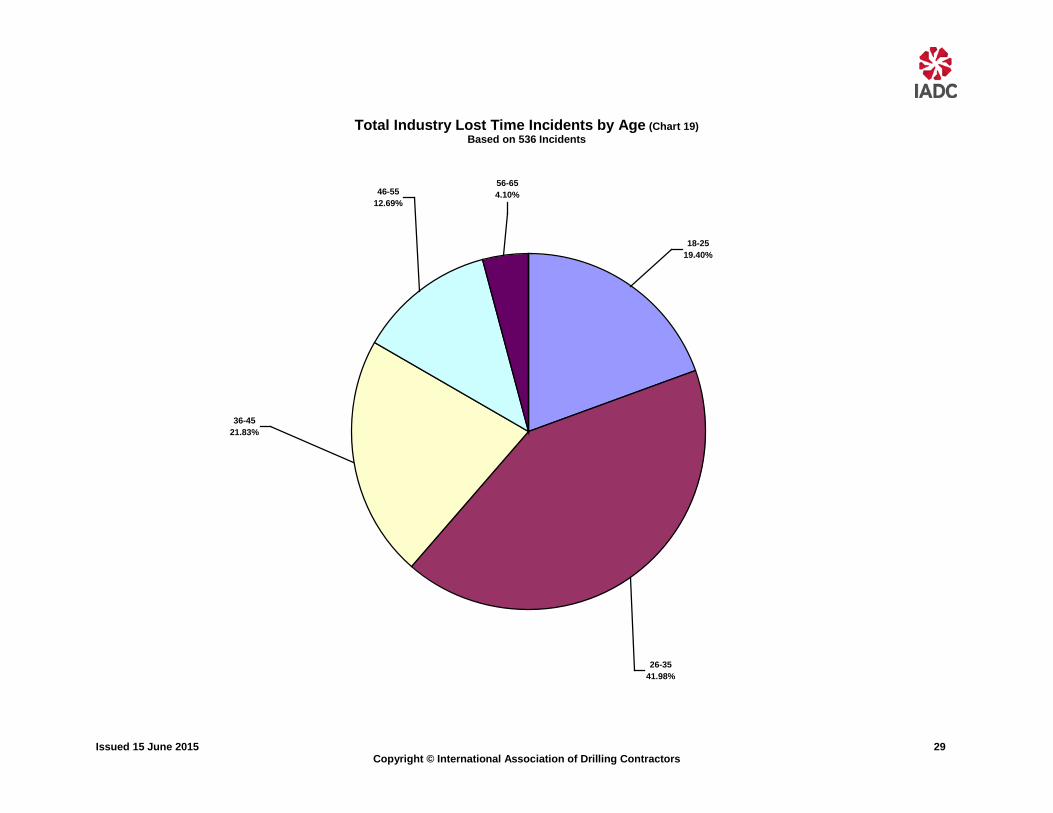
26 – 35 age range accounted for the most Lost Time and Recordable incidents. Conclusion: Activity in most sectors of the industry decreased in 2014. Overall, Lost Time incidents rates and Recordable incident rates slightly improved in 2014 as compared to 2013. The industry also saw the number of fatalities decrease to 21 for 2014 compared to 22 in 2013. Although some regions did not see improvement in 2014, the overall incident and frequency rates are still trending downward even as man-hours continue to trend upwards.
050
100150200250300350
01:00-08:00 09:00-16:00 17:00-24:00
LTI by Time of Day (Based on 641 incidents)
0200400600800
10001200
01:00-08:00 09:00-16:00 17:00-24:00
REC by Time of Day (Based on 2198 incidents)
0
20
40
60
80
100
February March August January
LTI by Month (Based on 647 incidents)
0
100
200
300
February June July October
REC by Month (Based on 2223 incidents)
0
50
100
150
200
250
18-25 26-35 36-45
LTI by Age (Based on 730 incidents)
0
200
400
600
800
18-25 26-35 36-45
REC by Age (Based on 1860 incidents)

Issued 15 June 2015 7 Copyright © International Association of Drilling Contractors
2014 ISP Program Industry Totals
IADC ISP Program 2014 Final Report (Table 1)
January – December Note: Figures are unaudited
CATEGORY TOTAL MANHOURS
TOTAL MTOs
TOTAL RWCs
TOTAL LTIs
TOTAL FTLs
TOTAL RCRD
LTI INCD. RATE
LTI FREQ. RATE
DART INCD. RATE
DART FREQ. RATE
RCRD INCD. RATE
RCRD FREQ. RATE
US - Land 103,733,079 317 269 205 10 801 0.41 2.07 0.93 4.67 1.54 7.72
US - Water 41,122,966 65 37 29 0 131 0.14 0.71 0.32 1.60 0.64 3.19 Canada - Land 2,745,151 22 6 3 1 32 0.29 1.46 0.73 3.64 2.33 11.66 Canada - Water 1,433,556 2 3 0 0 5 0.00 0.00 0.42 2.09 0.70 3.49 Central America & Caribbean - Land 8,351,724 7 2 18 0 27 0.43 2.16 0.48 2.39 0.65 3.23 Central America & Caribbean - Water 7,148,806 16 4 10 2 32 0.34 1.68 0.45 2.24 0.90 4.48 European - Land 49,839,013 13 16 58 1 88 0.24 1.18 0.30 1.50 0.35 1.77 European - Water 39,307,901 67 38 38 0 143 0.19 0.97 0.39 1.93 0.73 3.64 Africa - Land 42,085,855 38 113 66 1 218 0.32 1.59 0.86 4.28 1.04 5.18 Africa - Water 32,506,703 39 38 28 1 106 0.18 0.89 0.41 2.06 0.65 3.26 Middle East - Land 98,533,479 109 90 67 0 266 0.14 0.68 0.32 1.59 0.54 2.70 Middle East - Water 38,015,673 17 33 16 0 66 0.08 0.42 0.26 1.29 0.35 1.74 Asia Pacific - Land 22,946,866 17 8 27 0 52 0.24 1.18 0.31 1.53 0.45 2.27 Asia Pacific - Water 51,996,092 28 39 35 3 105 0.15 0.73 0.30 1.48 0.40 2.02 South America Land 31,975,404 19 36 31 0 86 0.19 0.97 0.42 2.10 0.54 2.69 South America Water 20,327,008 16 13 24 2 55 0.26 1.28 0.38 1.92 0.54 2.71 Australasia – Land 6,001,767 20 14 7 0 41 0.23 1.17 0.70 3.50 1.37 6.83 Australasia – Water 3,280,928 3 6 1 0 10 0.06 0.30 0.43 2.13 0.61 3.05 US Combined 144,856,045 382 306 234 10 932 0.34 1.68 0.76 3.80 1.29 6.43 Canada Combined 4,178,707 24 9 3 1 37 0.19 0.96 0.62 3.11 1.77 8.85 Central America & Caribbean Com. 15,500,530 23 6 28 2 59 0.39 1.94 0.46 2.32 0.76 3.81 European Combined 89,146,914 80 54 96 1 231 0.22 1.09 0.34 1.69 0.52 2.59 Africa Combined 74,592,558 77 151 94 2 324 0.26 1.29 0.66 3.31 0.87 4.34 Middle East Combined 136,549,152 126 123 83 0 332 0.12 0.61 0.30 1.51 0.49 2.43 Asia Pacific Combined 74,942,958 45 47 62 3 157 0.17 0.87 0.30 1.49 0.42 2.09 South America Combined 52,302,412 35 49 55 2 141 0.22 1.09 0.41 2.03 0.54 2.70 Australasia Combined 9,282,695 23 20 8 0 51 0.17 0.86 0.60 3.02 1.10 5.49
INDUSTRY TOTAL 601,351,971 815 765 663 21 2,264 0.23 1.14 0.48 2.409
6 0.75 3.76
MTO=Medical Treatment Only INCD = Incidence Rate (200,000
man-hours) : LTI INCD Rate = (LTI s+ FTLs) * 200000 / Total Man-hours DART INCD Rate = (RWC + LTI + FTL) * 200000 / Total Man-hours RCRD INCD Rate = (MTOs + RWCs + LTIs + FTLs) * 200000 / Total Man-hours
RWC =Restricted Work Case
LTI =Lost Time Incident FREQ = Frequency Rate (1,000,000 man-hours):
LTI FREQ Rate = (LTI s+ FTLs) * 1000000 / Total Man-hours DART FREQ Rate = (RWC + LTI + FTL) * 1000000 / Total Man-hours RCRD FREQ Rate = (MTOs + RWCs + LTIs + FTLs) * 1000000 / Total Man-hours
FTL =Fatalities
RCRD =Total Recordables
Issued 15 June 2015 8 Copyright © International Association of Drilling Contractors
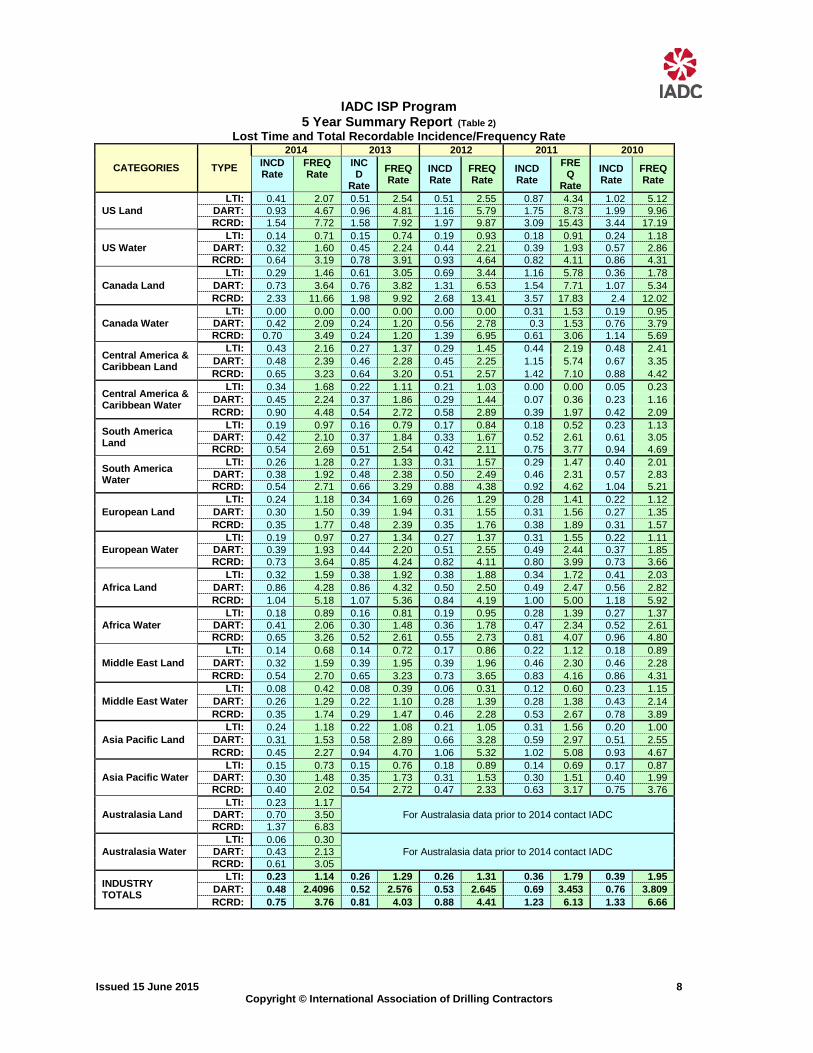
IADC ISP Program 5 Year Summary Report (Table 2)
Lost Time and Total Recordable Incidence/Frequency Rate
CATEGORIES TYPE
2014 2013 2012 2011 2010 INCD Rate
FREQ Rate
INCD
Rate FREQ Rate
INCD Rate
FREQ Rate
INCD Rate
FREQ
Rate INCD Rate
FREQ Rate
US Land LTI: 0.41 2.07 0.51 2.54 0.51 2.55 0.87 4.34 1.02 5.12
DART: 0.93 4.67 0.96 4.81 1.16 5.79 1.75 8.73 1.99 9.96 RCRD: 1.54 7.72 1.58 7.92 1.97 9.87 3.09 15.43 3.44 17.19
US Water LTI: 0.14 0.71 0.15 0.74 0.19 0.93 0.18 0.91 0.24 1.18
DART: 0.32 1.60 0.45 2.24 0.44 2.21 0.39 1.93 0.57 2.86 RCRD: 0.64 3.19 0.78 3.91 0.93 4.64 0.82 4.11 0.86 4.31
Canada Land LTI: 0.29 1.46 0.61 3.05 0.69 3.44 1.16 5.78 0.36 1.78
DART: 0.73 3.64 0.76 3.82 1.31 6.53 1.54 7.71 1.07 5.34 RCRD: 2.33 11.66 1.98 9.92 2.68 13.41 3.57 17.83 2.4 12.02
Canada Water LTI: 0.00 0.00 0.00 0.00 0.00 0.00 0.31 1.53 0.19 0.95
DART: 0.42 2.09 0.24 1.20 0.56 2.78 0.3 1.53 0.76 3.79 RCRD: 0.70 3.49 0.24 1.20 1.39 6.95 0.61 3.06 1.14 5.69
Central America & Caribbean Land
LTI: 0.43 2.16 0.27 1.37 0.29 1.45 0.44 2.19 0.48 2.41 DART: 0.48 2.39 0.46 2.28 0.45 2.25 1.15 5.74 0.67 3.35 RCRD: 0.65 3.23 0.64 3.20 0.51 2.57 1.42 7.10 0.88 4.42
Central America & Caribbean Water
LTI: 0.34 1.68 0.22 1.11 0.21 1.03 0.00 0.00 0.05 0.23 DART: 0.45 2.24 0.37 1.86 0.29 1.44 0.07 0.36 0.23 1.16 RCRD: 0.90 4.48 0.54 2.72 0.58 2.89 0.39 1.97 0.42 2.09
South America Land
LTI: 0.19 0.97 0.16 0.79 0.17 0.84 0.18 0.52 0.23 1.13 DART: 0.42 2.10 0.37 1.84 0.33 1.67 0.52 2.61 0.61 3.05 RCRD: 0.54 2.69 0.51 2.54 0.42 2.11 0.75 3.77 0.94 4.69
South America Water
LTI: 0.26 1.28 0.27 1.33 0.31 1.57 0.29 1.47 0.40 2.01 DART: 0.38 1.92 0.48 2.38 0.50 2.49 0.46 2.31 0.57 2.83 RCRD: 0.54 2.71 0.66 3.29 0.88 4.38 0.92 4.62 1.04 5.21
European Land LTI: 0.24 1.18 0.34 1.69 0.26 1.29 0.28 1.41 0.22 1.12
DART: 0.30 1.50 0.39 1.94 0.31 1.55 0.31 1.56 0.27 1.35 RCRD: 0.35 1.77 0.48 2.39 0.35 1.76 0.38 1.89 0.31 1.57
European Water LTI: 0.19 0.97 0.27 1.34 0.27 1.37 0.31 1.55 0.22 1.11
DART: 0.39 1.93 0.44 2.20 0.51 2.55 0.49 2.44 0.37 1.85 RCRD: 0.73 3.64 0.85 4.24 0.82 4.11 0.80 3.99 0.73 3.66
Africa Land LTI: 0.32 1.59 0.38 1.92 0.38 1.88 0.34 1.72 0.41 2.03
DART: 0.86 4.28 0.86 4.32 0.50 2.50 0.49 2.47 0.56 2.82 RCRD: 1.04 5.18 1.07 5.36 0.84 4.19 1.00 5.00 1.18 5.92
Africa Water LTI: 0.18 0.89 0.16 0.81 0.19 0.95 0.28 1.39 0.27 1.37
DART: 0.41 2.06 0.30 1.48 0.36 1.78 0.47 2.34 0.52 2.61 RCRD: 0.65 3.26 0.52 2.61 0.55 2.73 0.81 4.07 0.96 4.80
Middle East Land LTI: 0.14 0.68 0.14 0.72 0.17 0.86 0.22 1.12 0.18 0.89
DART: 0.32 1.59 0.39 1.95 0.39 1.96 0.46 2.30 0.46 2.28 RCRD: 0.54 2.70 0.65 3.23 0.73 3.65 0.83 4.16 0.86 4.31
Middle East Water LTI: 0.08 0.42 0.08 0.39 0.06 0.31 0.12 0.60 0.23 1.15
DART: 0.26 1.29 0.22 1.10 0.28 1.39 0.28 1.38 0.43 2.14 RCRD: 0.35 1.74 0.29 1.47 0.46 2.28 0.53 2.67 0.78 3.89
Asia Pacific Land LTI: 0.24 1.18 0.22 1.08 0.21 1.05 0.31 1.56 0.20 1.00
DART: 0.31 1.53 0.58 2.89 0.66 3.28 0.59 2.97 0.51 2.55 RCRD: 0.45 2.27 0.94 4.70 1.06 5.32 1.02 5.08 0.93 4.67
Asia Pacific Water LTI: 0.15 0.73 0.15 0.76 0.18 0.89 0.14 0.69 0.17 0.87
DART: 0.30 1.48 0.35 1.73 0.31 1.53 0.30 1.51 0.40 1.99 RCRD: 0.40 2.02 0.54 2.72 0.47 2.33 0.63 3.17 0.75 3.76
Australasia Land LTI: 0.23 1.17
For Australasia data prior to 2014 contact IADC DART: 0.70 3.50 RCRD: 1.37 6.83
Australasia Water LTI: 0.06 0.30
For Australasia data prior to 2014 contact IADC DART: 0.43 2.13 RCRD: 0.61 3.05
INDUSTRY TOTALS
LTI: 0.23 1.14 0.26 1.29 0.26 1.31 0.36 1.79 0.39 1.95 DART: 0.48 2.4096 0.52 2.576 0.53 2.645 0.69 3.453 0.76 3.809 RCRD: 0.75 3.76 0.81 4.03 0.88 4.41 1.23 6.13 1.33 6.66

Issued 15 June 2015 9 Copyright © International Association of Drilling Contractors
2014 - IADC INDUSTRY TOTALS (Table 3)
LAND WATER COMBINED TOTAL MANHOURS 360,210,571 231,858,705 592,069,276 TOTAL MEDICAL TREATMENT INCIDENTS 542 250 792 TOTAL RESTRICTED WORK INCIDENTS 540 205 745 TOTAL LOST TIME INCIDENTS 475 180 655 TOTAL FATALITIES 13 8 21 TOTAL RECORDABLES 1,570 643 2,213
MTO INCIDENCE RATE 0.30 0.22 0.27 RWC INCIDENCE RATE 0.30 0.18 0.25 LTI INCIDENCE RATE 0.27 0.16 0.23 LTI FREQUENCY RATE 1.35 0.81 1.14 DART INCIDENCE RATE 0.57 0.34 0.48 DART FREQUENCY RATE 2.85 1.69 2.40 RECORDABLE INCIDENCE RATE 0.87 0.55 0.75 RECORDABLE FREQUENCY RATE 4.36 2.77 3.74 MEDICAL TREATMENT INCIDENCE RATE = MTOs X 200,000 / MAN-HOURS (LTIs NOT INCLUDED) RESTRICTED WORK INCIDENCE RATE = RWCs X 200,000 / MAN-HOURS (LTIs NOT INCLUDED) LOST TIME INCIDENCE RATE -( LTIs+FTLs) X 200,000 / MAN-HOURS LOST TIME FREQUENCY RATE =( LTIs+FTLs) X 1,000,000 / MAN-HOURS DART INCIDENCE RATE - (LTIs+FTLs+RWCs) X 200,000 / MAN-HOURS DART INCIDENCE RATE - (LTIs+FTLs+RWCs) X 1,000,000 / MAN-HOURS RECORDABLE INCIDENCE RATE = RECORDABLES X 200,000 / MAN-HOURS RECORDABLE FREQUENCY RATE = RECORDABLES X 1,000,000 / MAN-HOURS
Number of participating companies: 107 – Total; 70 – Land; 55 – Water
Total Industry LTI & Recordable Incidence Rates vs Man-hours (Figure 1)
0
100000000
200000000
300000000
400000000
500000000
600000000
700000000
0
2
4
6
8
10
12
14
16
1968
1969
1970
1971
1972
1973
1974
1975
1976
1977
1978
1979
1980
1981
1982
1983
1984
1985
1986
1987
1988
1989
1990
1991
1992
1993
1994
1995
1996
1997
1998
1999
2000
2001
2002
2003
2004
2005
2006
2007
2008
2009
2010
2011
2012
2013
2014
Man
-hou
rs
Inci
denc
e R
ate
LTI Rate Rec. Rate DART Rate Man-hours

Issued 15 June 2015 10 Copyright © International Association of Drilling Contractors
Total Industry Land LTI & Recordable Incidence Rates vs Man-hours (Figure 2)
Total Industry Water LTI & Recordable Incidence Rates vs Man-hours (Figure 3)
0
50000000
100000000
150000000
200000000
250000000
300000000
350000000
400000000
0
1
2
3
4
5
6
7
8
919
93
1994
1995
1996
1997
1998
1999
2000
2001
2002
2003
2004
2005
2006
2007
2008
2009
2010
2011
2012
2013
2014
Man
-hou
rs
Inci
denc
e R
ate
LTI Rate Rec. Rate DART Rate Man-hours
0
50000000
100000000
150000000
200000000
250000000
300000000
0
0.5
1
1.5
2
2.5
3
3.5
4
4.5
1993
1994
1995
1996
1997
1998
1999
2000
2001
2002
2003
2004
2005
2006
2007
2008
2009
2010
2011
2012
2013
2014
Man
hour
s
Inci
denc
e R
ate
LTI Rate Rec. Rate DART Rate Man-hours

Issued 15 June 2015 11 Copyright © International Association of Drilling Contractors
IADC 2014 Total Industry Charts Total Industry Lost Time Incidents by Month (Chart 1)
Based on 647 Incidents
December8.19%
November7.26%
October7.42%
September6.80%
August9.74%
July8.19%
June8.66%
May7.11%
April7.88%
March9.89%
February9.89%
January8.96%

Issued 15 June 2015 12 Copyright © International Association of Drilling Contractors
Total Industry Recordable Incidents by Month (Chart 2)
Based on 2223 Incidents Note: Some pie charts may not appear to show all the slices due to the small percentage the slice represents.
December8.23%
November6.79%
October8.91%
September8.55%
August8.32%
July8.95%
June8.91%
May8.46%
April7.96%
March8.41%
February8.91%
January7.60%

Issued 15 June 2015 13 Copyright © International Association of Drilling Contractors
Total Industry Lost Time Incidents by Occupation (Chart 3) Based on 647 Incidents
Marine Crew0.46%
Welder2.47%
Rig Helper1.55%
Deck Super.0.93%
Subsea Eng.1.08%
Truck Driver/Pusher0.62%
Superintendent/Super.0.46%
Barge Engin./BCO0.62%
Crane/Forklift Oper1.08%
Mechanic3.55%
Motorman5.72%
Electrician2.01%
Toolpusher2.16%
Driller (Asst. Driller)14.06% Derrickman
11.13%
Floorman33.69%
Roustabout12.52%
Other5.87%

Issued 15 June 2015 14 Copyright © International Association of Drilling Contractors
Total Industry Recordable Incidents by Occupation (Chart 4)
Based on 2223 Incidents
Derrickman11.79%
Floorman37.25%
Roustabout13.81%
Marine Crew0.45%
Subsea Eng.1.08%Deck Super.
0.49%
Radio Oper.0.04%
Motorman5.71%
Toolpusher1.98%
Electrician2.43%
Mechanic3.73%
Superint./Supervisors0.27%
Barge Engin./BCO0.45%
Catering Personnel0.94%
Welder1.39%
Driller9.94%
Crane/Forklift Oper0.81%
Truck Driver/Pusher0.58%
Rig Helper0.81%
Truck Helper0.09%
Maint. Super0.13%
Other5.80%

Issued 15 June 2015 15 Copyright © International Association of Drilling Contractors
Total Industry Lost Time Incidents by Body Part (Chart 5) Based on 647 Incidents
Skin0.15%
Elbow(s)0.46%
Knee(s)3.86%
Digestive/Inter.0.31% Other
4.95%
Shoulder(s)4.02%
Neck0.62%
Toes2.16%
Feet/Ankles11.90%
Leg(s)10.82%
Finger(s) 25.50%
Hand(s) / Wrist(s)7.88%
Arm(s)6.65%
Trunk/Torso6.03%
Back6.03%
Head7.42%
Eyes (eyelid)1.24%

Issued 15 June 2015 16 Copyright © International Association of Drilling Contractors
Total Industry Recordable Incidents by Body Part (Chart 6) Based on 2223 Incidents
Skin0.09%
Knee(s)2.97%
Elbow(s)1.03%
Lungs/Resp. 0.09%
Digestive/Inter.0.18%
Other3.60%
Shoulder(s)3.78%
Neck0.58%
Toes1.21%
Feet/Ankles9.04%
Leg(s)7.02%
Finger(s) 32.30%
Hand(s) / Wrist(s)9.49%
Arm(s)4.50%
Trunk/Torso4.00%
Back5.89%
Head11.83%
Eyes (eyelid)2.38%

Issued 15 June 2015 17 Copyright © International Association of Drilling Contractors
Total Industry Lost Time Incidents by Incident Type (Chart 7) Based on 647 Incidents
Jump0.31%
Vehicle1.24%
Cut2.32%
Exposure to Weather0.15%
Debris0.31%
Sprain1.55%
Flame/heat/steam2.32%
Exposure to Gas0.15%
Heat Exh./Stroke0.93%
Caught On0.46%
Other3.25%
Chemicals/Fluids Contact1.70%
Electrical Shock0.46%
Strain/Overexertion5.56%
Slip/Fall: Different Level12.67%
Slip/Fall: Same Level8.04%
Struck By25.81%
Struck Against4.64%
Caught Between/In28.13%

Issued 15 June 2015 18 Copyright © International Association of Drilling Contractors
Total Industry Recordable Incidents by Incident Type (Chart 8) Based on 2223 Incidents
Caught Between/In29.10%
Struck Against4.95%
Struck By26.99%
Other3.60%
Slip/Fall: Same Level8.14%
Slip/Fall: Different Level8.28%
Strain/Overexertion5.40%
Chemicals/Fluids Contact1.84%
Flame/heat/steam1.30%
Electrical Shock0.27%
Debris0.54%
Cut5.58%
Caught On0.13%
Heat Exh./Stroke0.72%
Sprain2.20%
Exposure to Gas0.04%
Chemical Inhal.0.13%
Exposure to Weather0.04%
Vehicle0.49%
Jump0.22%

Issued 15 June 2015 19 Copyright © International Association of Drilling Contractors
Total Industry Lost Time Incidents by Equipment (Chart 9) Based on 647 Incidents
Anchor Chains/Cables/Winch1.24%
Rig Floor Winch/Deck Winch1.39%
Other28.44%
Boat Cargo0.46% Tongs
4.95%
Elevators3.55%
Slips (drill collar clamp)1.08%
Spinning Chain0.31%
Iron Roughneck, Pipe Spinner, etc.
2.94%Rotary0.77%
Pipes/Collars/Tubulars/Csg.14.22%
Cathead/Drawworks0.93%
Slings3.09%
Hand Tools: Manual4.17%
Hand Tools: Power0.77%
Engines/Pumps/Machinery4.02%
Top Drive (blocks, swivel, kelly)2.63%
Boat0.15%
Car,truck,bus1.85%
Kelly/Master Bushings0.77%
Stairs2.94%BOP Stack (well head, tree)
3.25%
Material1.55%
Pressure Hoses/Lines2.94%
Crane2.47%
Forklift1.08%
Chemicals1.39%
Welding, Cutting, Grinding Equipment
0.31%
Ladders1.70%
Decks (grating, walkway)4.64%

Issued 15 June 2015 20 Copyright © International Association of Drilling Contractors
Total Industry Recordable Incidents by Equipment (Chart 10)
Based on 2223 Incidents
Anchor Chains/Cables/Winch0.85%
Rig Floor Winch/Deck Winch1.03%
Boat Cargo0.45%
Other26.99%
Tongs5.71%
Elevators3.33%
Slips (drill collar clamp)1.84%
Spinning Chain0.13% Iron Roughneck, Pipe Spinner, etc.
2.70%
Rotary0.76%
Pipes/Collars/Tubulars/Csg.12.64%
Cathead/Drawworks0.49%
Slings3.46%
Hand Tools: Manual7.69%
Hand Tools: Power1.26%
Engines/Pumps/Machinery4.45%
Top Drive (blocks, swivel, kelly)1.84%
Chemicals1.48%
Welding, Cutting, Grinding Equipment
0.54%
Ladders1.30%
Forklift1.08% Winch Truck
0.09%
Crane1.93%
Pressure Hoses/Lines3.73%
Material2.74%
BOP Stack well-head, tree3.10%
Stairs2.83%
Kelly/Master Bushings0.36%
Trans. - Car,truck,bus1.08%
Trans. - Boat0.18%
Decks (grating, walkway)3.87%
Issued 15 June 2015 21 Copyright © International Association of Drilling Contractors
Total Industry Lost Time Incidents by Operation (Chart 11)
Based on 647 Incidents
Travel/Transport1.55%
Other7.57%
Walking5.87%
Cementing1.24%
Trip in/out, etc.)13.29%
Making Connection3.71%
Routine Drlg Oper.8.96%
Run Casing/Tubing6.03%
Lay Down/Pick up Pipe/Tub.6.34%
Material Handling: Manual6.18%
Material Handling: Crane/Cherry Picker3.25%
Material Handling: Winch Truck0.15%
Material Handling: Forklift2.16%
Material Handling: Rig Floor Winch0.62%
Rig Up/Down Rig Move 13.91%
BOP Stack, well head/tree Install/Maint.
4.48%
Handle Riser0.31%
Run/Retrieve Anchors0.31%Painting & related tasks
0.15%
Abrasive Blasting/Paint/Scale Removal
0.31%
Well Testing0.46%
Training0.15%
Special Opers.1.24%
Mud Mix/Pump2.01%
Rig/Equip. Repairs/Maint.9.74%

Issued 15 June 2015 22 Copyright © International Association of Drilling Contractors
Total Industry Recordable Incidents by Operation (Chart 12) Based on 2222 Incidents
Travel/Transport.1.17%
Other9.63%
Walking5.18%
Cementing1.08%
Trip in/out, etc.)14.45%
Making Connection3.65%
Routine Drlg Oper.8.82%
Run Casing/Tubing5.09%
Lay Down/Pick up Pipe/Tub.5.90%
Material Handling Manual5.90%
Material Handling Crane/Cherry Picker2.61%
Material Handling Winch Truck0.05%
Material Handling Forklift1.35%
Material Handling Rig Floor Winch0.41%
Rig Up/Down Rig Move 13.73%
BOP Stack, well head/tree Install/Maint.
4.28%
Jack Up/Down Oper.0.05%
Handle Riser0.32%
Run/Retrieve Anchors0.09%
Painting & related tasks0.32%
Abrasive Blasting/Paint/Scale Removal
0.27%
Well Testing0.36%
Training0.09%
Special Opers.1.08%
Mud Mix/Pump1.80%
Rig/Equip. Repairs/Maint.12.38%

Issued 15 June 2015 23 Copyright © International Association of Drilling Contractors
Total Industry Lost Time Incidents by Location (Chart 13)
Based on 647 Incidents
Forklift0.31% Other
5.72%
Rig Floor36.01%
Pipe Rack/Pipe Deck5.87%
Catwalk/V-door3.55%
Derrick/Mast 5.41%
BOP Stack, Well-head/tree Area3.25%
Stairs/Ladders2.78%
Engine/Gen. Room1.55%
Shale Shaker0.93%
Mud Pits/Tanks2.47%
Rig Pad/Rig Decks12.36%
Machinery Spaces1.24%
Fuel/Water Stor. Tanks0.46%
Mud Mixing Tank/Area3.09%
Mud Pump Room3.40%
Work, change, storage, room/house
1.39%
Crew/Work Boats0.46%
Cellar/Sub./Moonpool6.18%
Truck,Car,Bus1.24%
SCR/Electrical Room0.31%
Camp/Accom.2.01%

Issued 15 June 2015 24 Copyright © International Association of Drilling Contractors
Total Industry Recordable Incidents by Location (Chart 14) Based on 2223 Incidents
Forklift0.40%
Other8.50%
Camp/Accom.2.70%
Work, change, storage, room/house1.48%
Crew/Work Boats0.27%
Truck,Car,Bus1.12%
Cellar/Sub./Moonpool5.76%
Helicopter0.04%
Machinery Spaces0.76%
Mud Pump Room4.27%
Pontoon0.27%
Fuel/Water Stor. Tanks0.49%
Jack. House0.09%
Cherry Picker/Crane0.09%
Rig Pad/Rig Decks9.67%
Stairs/Ladders1.84%
SCR/Electrical Room0.36%
Engine/Gen. Room1.53%
Mud Pits/Tanks3.33%
Shale Shaker1.53%
Mud Mixing Tank/Area3.01%
BOP Stack, Well-head/tree Area3.78%
Derrick/Mast 5.22%
Catwalk/V-door2.65%
Pipe Rack/Pipe Deck6.25%
Rig Floor34.55%

Issued 15 June 2015 25 Copyright © International Association of Drilling Contractors
Total Industry Lost Time Incidents by Time in Service (Chart 15) Based on 633 Incidents
10+ yrs.8.37%
>5 yrs. < 10 yrs.14.22%
>1 yr. < 5 yrs.38.39%
>6 mos. < 1 yr.13.59%
>3 mos. < 6 mos.10.43%
0 mo. < 3 mos.15.01%

Issued 15 June 2015 26 Copyright © International Association of Drilling Contractors
Total Industry Recordable Incidents by Time in Service (Chart 16) Based on 2170 Incidents
10+ yrs.6.92%
>5 yrs. < 10 yrs.15.46%
>1 yr. < 5 yrs.38.53%
>6 mos. < 1 yr.13.98%
>3 mos. < 6 mos.10.71%
0 mo. < 3 mos.14.40%

Issued 15 June 2015 27 Copyright © International Association of Drilling Contractors
Total Industry Lost Time Incidents by Time of Day (Chart 17) Based on 641 Incidents
2:003.75%
3:002.81%
4:003.91%
24:00:002.34%
1:002.97%23:00
3.28%
22:005.00%
21:004.22%
20:003.28%
19:004.69%
18:004.53%
17:004.22%
16:004.53%
15:005.16%
14:006.41%
13:003.91%
12:004.38%
11:004.38%
5:003.59%
6:003.13%
7:002.19%
8:004.84%
9:006.88%
10:005.63%

Issued 15 June 2015 28 Copyright © International Association of Drilling Contractors
Total Industry Recordable Incidents by Time of Day (Chart 18) Based on 2198 Incidents
1:003.41%
2:004.00%
3:003.00%
4:003.50%
5:003.09%
6:003.14%
7:003.00%
8:004.87%
9:005.41%
10:005.55%
11:005.96%
12:004.96%
23:003.46%
24:00:002.14%
22:003.78%
21:004.14%
20:003.78%
19:003.55%
18:004.23%
17:004.55%
16:005.51%
15:005.10%
14:005.28%
13:004.60%
Issued 15 June 2015 29 Copyright © International Association of Drilling Contractors
Total Industry Lost Time Incidents by Age (Chart 19)
Based on 536 Incidents
18-2519.40%
26-3541.98%
36-4521.83%
46-5512.69%
56-654.10%

Issued 15 June 2015 30 Copyright © International Association of Drilling Contractors
Total Industry Recordable Incidents by Age (Chart 20) Based on 1860 Incidents
18-2519.30%
26-3545.91%
36-4522.15%
46-559.89%
56-652.69%
66 & Above0.05%

Issued 15 June 2015 - 31 – Copyright © International Association of Drilling Contractors
2014 ISP Program Regional Totals Combined Land & Water
IADC 2014 Africa Totals (Table 4)
LAND WATER COMBINED TOTAL MANHOURS 42,085,855 32,506,703 74,592,558 TOTAL MEDICAL TREATMENT INCIDENTS 38 39 77 TOTAL RESTRICTED WORK INCIDENTS 113 38 151 TOTAL LOST TIME INCIDENTS 66 28 94 TOTAL FATALITIES 1 1 2 TOTAL RECORDABLES 218 106 324 MTO INCIDENCE RATE 0.18 0.24 0.21 RWC INCIDENCE RATE 0.54 0.23 0.40 LTI INCIDENCE RATE 0.32 0.18 0.26 LTI FREQUENCY RATE 1.59 0.89 1.29 DART INCIDENCE RATE 0.86 0.41 0.66 DART FREQUENCY RATE 4.28 2.06 3.31 RECORDABLE INCIDENCE RATE 1.04 0.65 0.87 RECORDABLE FREQUENCY RATE 5.18 3.26 4.34 MEDICAL TREATMENT INCIDENCE RATE = MTOs X 200,000 / MAN-HOURS (LTIs NOT INCLUDED) RESTRICTED WORK INCIDENCE RATE = RWCs X 200,000 / MAN-HOURS (LTIs NOT INCLUDED) LOST TIME INCIDENCE RATE -( LTIs+FTLs) X 200,000 / MAN-HOURS LOST TIME FREQUENCY RATE =( LTIs+FTLs) X 1,000,000 / MAN-HOURS DART INCIDENCE RATE - (LTIs+FTLs+RWCs) X 200,000 / MAN-HOURS DART INCIDENCE RATE - (LTIs+FTLs+RWCs) X 1,000,000 / MAN-HOURS RECORDABLE INCIDENCE RATE = RECORDABLES X 200,000 / MAN-HOURS RECORDABLE FREQUENCY RATE = RECORDABLES X 1,000,000 / MAN-HOURS
Companies Reporting: Land – 14 Water – 26
Africa Total LTI & Recordable Incidence Rates vs Man-hours (Figure 4)
0
10000000
20000000
30000000
40000000
50000000
60000000
70000000
80000000
90000000
0
0.5
1
1.5
2
2.5
3
3.5
4
4.5
2001
2002
2003
2004
2005
2006
2007
2008
2009
2010
2011
2012
2013
2014
Man
-hou
rs
Inci
denc
e R
ate
LTI Rate Rec. Rate DART Rate Man-hours

Issued 15 June 2015 - 32 – Copyright © International Association of Drilling Contractors
IADC 2014 Asia Pacific Totals (Table 5)
LAND WATER COMBINED TOTAL MANHOURS 22,946,866 51,996,092 74,942,958 TOTAL MEDICAL TREATMENT INCIDENTS 17 28 45 TOTAL RESTRICTED WORK INCIDENTS 8 39 47 TOTAL LOST TIME INCIDENTS 27 35 62 TOTAL FATALITIES 0 3 3 TOTAL RECORDABLES 52 105 157 MTO INCIDENCE RATE 0.15 0.11 0.12 RWC INCIDENCE RATE 0.07 0.15 0.13 LTI INCIDENCE RATE 0.24 0.15 0.17 LTI FREQUENCY RATE 1.18 0.73 0.87 DART INCIDENCE RATE 0.31 0.30 0.30 DART FREQUENCY RATE 1.53 1.48 1.49 RECORDABLE INCIDENCE RATE 0.45 0.40 0.42 RECORDABLE FREQUENCY RATE 2.27 2.02 2.09 MEDICAL TREATMENT INCIDENCE RATE = MTOs X 200,000 / MAN-HOURS (LTIs NOT INCLUDED) RESTRICTED WORK INCIDENCE RATE = RWCs X 200,000 / MAN-HOURS (LTIs NOT INCLUDED) LOST TIME INCIDENCE RATE -( LTIs+FTLs) X 200,000 / MAN-HOURS LOST TIME FREQUENCY RATE =( LTIs+FTLs) X 1,000,000 / MAN-HOURS DART INCIDENCE RATE - (LTIs+FTLs+RWCs) X 200,000 / MAN-HOURS DART INCIDENCE RATE - (LTIs+FTLs+RWCs) X 1,000,000 / MAN-HOURS RECORDABLE INCIDENCE RATE = RECORDABLES X 200,000 / MAN-HOURS RECORDABLE FREQUENCY RATE = RECORDABLES X 1,000,000 / MAN-HOURS
Companies Reporting: Land – 14 Water – 33
Asia Pacific Total LTI & Recordable Incidence Rates vs Man-hours (Figure 5)
0
10000000
20000000
30000000
40000000
50000000
60000000
70000000
80000000
0
0.5
1
1.5
2
2.5
3
3.5
4
4.5
2001
2002
2003
2004
2005
2006
2007
2008
2009
2010
2011
2012
2013
2014
Man
-hou
rs
Inci
denc
e R
ate
LTI Rate Rec. Rate DART Rate Man-hours
Issued 15 June 2015 - 33 – Copyright © International Association of Drilling Contractors
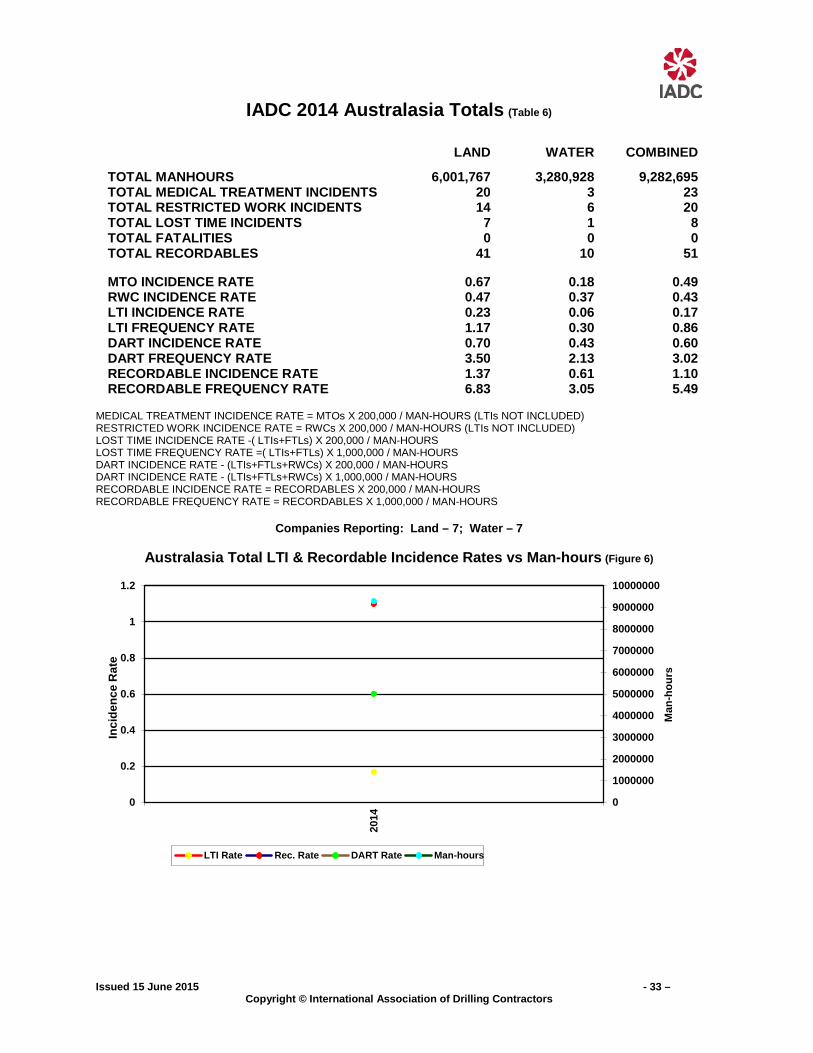
IADC 2014 Australasia Totals (Table 6) LAND WATER COMBINED TOTAL MANHOURS 6,001,767 3,280,928 9,282,695 TOTAL MEDICAL TREATMENT INCIDENTS 20 3 23 TOTAL RESTRICTED WORK INCIDENTS 14 6 20 TOTAL LOST TIME INCIDENTS 7 1 8 TOTAL FATALITIES 0 0 0 TOTAL RECORDABLES 41 10 51 MTO INCIDENCE RATE 0.67 0.18 0.49 RWC INCIDENCE RATE 0.47 0.37 0.43 LTI INCIDENCE RATE 0.23 0.06 0.17 LTI FREQUENCY RATE 1.17 0.30 0.86 DART INCIDENCE RATE 0.70 0.43 0.60 DART FREQUENCY RATE 3.50 2.13 3.02 RECORDABLE INCIDENCE RATE 1.37 0.61 1.10 RECORDABLE FREQUENCY RATE 6.83 3.05 5.49 MEDICAL TREATMENT INCIDENCE RATE = MTOs X 200,000 / MAN-HOURS (LTIs NOT INCLUDED) RESTRICTED WORK INCIDENCE RATE = RWCs X 200,000 / MAN-HOURS (LTIs NOT INCLUDED) LOST TIME INCIDENCE RATE -( LTIs+FTLs) X 200,000 / MAN-HOURS LOST TIME FREQUENCY RATE =( LTIs+FTLs) X 1,000,000 / MAN-HOURS DART INCIDENCE RATE - (LTIs+FTLs+RWCs) X 200,000 / MAN-HOURS DART INCIDENCE RATE - (LTIs+FTLs+RWCs) X 1,000,000 / MAN-HOURS RECORDABLE INCIDENCE RATE = RECORDABLES X 200,000 / MAN-HOURS RECORDABLE FREQUENCY RATE = RECORDABLES X 1,000,000 / MAN-HOURS
Companies Reporting: Land – 7; Water – 7
Australasia Total LTI & Recordable Incidence Rates vs Man-hours (Figure 6)
0
1000000
2000000
3000000
4000000
5000000
6000000
7000000
8000000
9000000
10000000
0
0.2
0.4
0.6
0.8
1
1.2
2014
Man
-hou
rs
Inci
denc
e R
ate
LTI Rate Rec. Rate DART Rate Man-hours
Issued 15 June 2015 - 34 – Copyright © International Association of Drilling Contractors
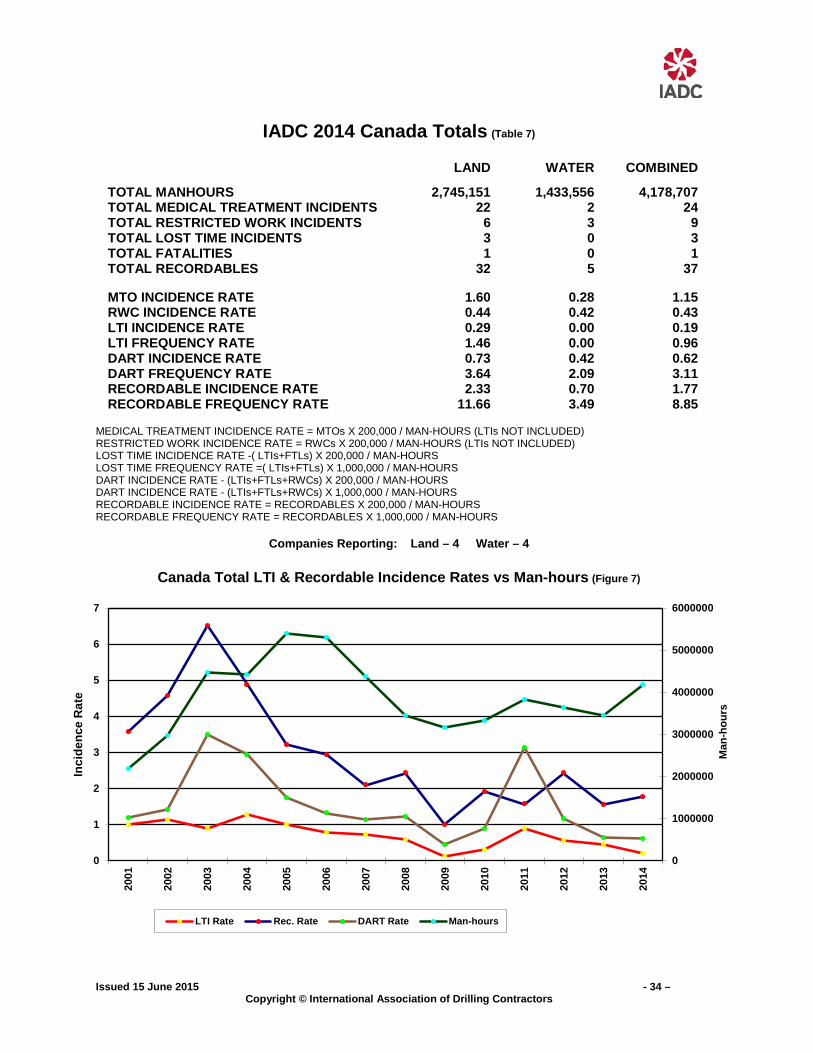
IADC 2014 Canada Totals (Table 7)
LAND WATER COMBINED TOTAL MANHOURS 2,745,151 1,433,556 4,178,707 TOTAL MEDICAL TREATMENT INCIDENTS 22 2 24 TOTAL RESTRICTED WORK INCIDENTS 6 3 9 TOTAL LOST TIME INCIDENTS 3 0 3 TOTAL FATALITIES 1 0 1 TOTAL RECORDABLES 32 5 37 MTO INCIDENCE RATE 1.60 0.28 1.15 RWC INCIDENCE RATE 0.44 0.42 0.43 LTI INCIDENCE RATE 0.29 0.00 0.19 LTI FREQUENCY RATE 1.46 0.00 0.96 DART INCIDENCE RATE 0.73 0.42 0.62 DART FREQUENCY RATE 3.64 2.09 3.11 RECORDABLE INCIDENCE RATE 2.33 0.70 1.77 RECORDABLE FREQUENCY RATE 11.66 3.49 8.85 MEDICAL TREATMENT INCIDENCE RATE = MTOs X 200,000 / MAN-HOURS (LTIs NOT INCLUDED) RESTRICTED WORK INCIDENCE RATE = RWCs X 200,000 / MAN-HOURS (LTIs NOT INCLUDED) LOST TIME INCIDENCE RATE -( LTIs+FTLs) X 200,000 / MAN-HOURS LOST TIME FREQUENCY RATE =( LTIs+FTLs) X 1,000,000 / MAN-HOURS DART INCIDENCE RATE - (LTIs+FTLs+RWCs) X 200,000 / MAN-HOURS DART INCIDENCE RATE - (LTIs+FTLs+RWCs) X 1,000,000 / MAN-HOURS RECORDABLE INCIDENCE RATE = RECORDABLES X 200,000 / MAN-HOURS RECORDABLE FREQUENCY RATE = RECORDABLES X 1,000,000 / MAN-HOURS
Companies Reporting: Land – 4 Water – 4
Canada Total LTI & Recordable Incidence Rates vs Man-hours (Figure 7)
0
1000000
2000000
3000000
4000000
5000000
6000000
0
1
2
3
4
5
6
7
2001
2002
2003
2004
2005
2006
2007
2008
2009
2010
2011
2012
2013
2014
Man
-hou
rs
Inci
denc
e R
ate
LTI Rate Rec. Rate DART Rate Man-hours

Issued 15 June 2015 - 35 – Copyright © International Association of Drilling Contractors
IADC 2014 Central America & Caribbean Totals (Table 8)
LAND WATER COMBINED TOTAL MANHOURS 8,351,724 7,148,806 15,500,530 TOTAL MEDICAL TREATMENT INCIDENTS 7 16 23 TOTAL RESTRICTED WORK INCIDENTS 2 4 6 TOTAL LOST TIME INCIDENTS 18 10 28 TOTAL FATALITIES 0 2 2 TOTAL RECORDABLES 27 32 59 MTO INCIDENCE RATE 0.17 0.45 0.30 RWC INCIDENCE RATE 0.05 0.11 0.08 LTI INCIDENCE RATE 0.43 0.34 0.39 LTI FREQUENCY RATE 2.16 1.68 1.94 DART INCIDENCE RATE 0.48 0.45 0.46 DART FREQUENCY RATE 2.39 2.24 2.32 RECORDABLE INCIDENCE RATE 0.65 0.90 0.76 RECORDABLE FREQUENCY RATE 3.23 4.48 3.81
MEDICAL TREATMENT INCIDENCE RATE = MTOs X 200,000 / MAN-HOURS (LTIs NOT INCLUDED) RESTRICTED WORK INCIDENCE RATE = RWCs X 200,000 / MAN-HOURS (LTIs NOT INCLUDED) LOST TIME INCIDENCE RATE -( LTIs+FTLs) X 200,000 / MAN-HOURS LOST TIME FREQUENCY RATE =( LTIs+FTLs) X 1,000,000 / MAN-HOURS DART INCIDENCE RATE - (LTIs+FTLs+RWCs) X 200,000 / MAN-HOURS DART INCIDENCE RATE - (LTIs+FTLs+RWCs) X 1,000,000 / MAN-HOURS RECORDABLE INCIDENCE RATE = RECORDABLES X 200,000 / MAN-HOURS RECORDABLE FREQUENCY RATE = RECORDABLES X 1,000,000 / MAN-HOURS
Companies Reporting: Land – 6 Water – 9
Central America & Caribbean Total LTI & Recordable Incidence Rates vs Man-hours
(Figure 8)
0
2000000
4000000
6000000
8000000
10000000
12000000
14000000
16000000
18000000
0
0.1
0.2
0.3
0.4
0.5
0.6
0.7
0.8
0.9
2010
2011
2012
2013
2014
Man
-hou
rs
Inci
denc
e R
ate
LTI Rate Rec. RateDART Rate Man-hours

Issued 15 June 2015 - 36 – Copyright © International Association of Drilling Contractors
IADC 2014 European Totals (Table 9)
LAND WATER COMBINED TOTAL MANHOURS 49,839,013 39,307,901 89,146,914 TOTAL MEDICAL TREATMENT INCIDENTS 13 67 80 TOTAL RESTRICTED WORK INCIDENTS 16 38 54 TOTAL LOST TIME INCIDENTS 58 38 96 TOTAL FATALITIES 1 0 1 TOTAL RECORDABLES 88 143 231 MTO INCIDENCE RATE 0.05 0.34 0.18 RWC INCIDENCE RATE 0.06 0.19 0.12 LTI INCIDENCE RATE 0.24 0.19 0.22 LTI FREQUENCY RATE 1.18 0.97 1.09 DART INCIDENCE RATE 0.30 0.39 0.34 DART FREQUENCY RATE 1.50 1.93 1.69 RECORDABLE INCIDENCE RATE 0.35 0.73 0.52 RECORDABLE FREQUENCY RATE 1.77 3.64 2.59 MEDICAL TREATMENT INCIDENCE RATE = MTOs X 200,000 / MAN-HOURS (LTIs NOT INCLUDED) RESTRICTED WORK INCIDENCE RATE = RWCs X 200,000 / MAN-HOURS (LTIs NOT INCLUDED) LOST TIME INCIDENCE RATE -( LTIs+FTLs) X 200,000 / MAN-HOURS LOST TIME FREQUENCY RATE =( LTIs+FTLs) X 1,000,000 / MAN-HOURS DART INCIDENCE RATE - (LTIs+FTLs+RWCs) X 200,000 / MAN-HOURS DART INCIDENCE RATE - (LTIs+FTLs+RWCs) X 1,000,000 / MAN-HOURS RECORDABLE INCIDENCE RATE = RECORDABLES X 200,000 / MAN-HOURS RECORDABLE FREQUENCY RATE = RECORDABLES X 1,000,000 / MAN-HOURS
Companies Reporting: Land – 14 Water – 22
European Total LTI & Recordable Incidence Rates vs Man-hours (Figure 9)
0
20000000
40000000
60000000
80000000
100000000
120000000
0
0.5
1
1.5
2
2.5
3
3.5
4
4.5
5
1993
1994
1995
1996
1997
1998
1999
2000
2001
2002
2003
2004
2005
2006
2007
2008
2009
2010
2011
2012
2013
2014
Man
-hou
rs
Inci
denc
e R
ate
LTI Rate Rec. Rate DART Rate Man-hours

Issued 15 June 2015 - 37 – Copyright © International Association of Drilling Contractors
IADC 2014 Middle East Totals (Table 10)
LAND WATER COMBINED TOTAL MANHOURS 98,533,479 38,015,673 136,549,152 TOTAL MEDICAL TREATMENT INCIDENTS 109 17 126 TOTAL RESTRICTED WORK INCIDENTS 90 33 123 TOTAL LOST TIME INCIDENTS 67 16 83 TOTAL FATALITIES 0 0 0 TOTAL RECORDABLES 266 66 332 MTO INCIDENCE RATE 0.22 0.09 0.18 RWC INCIDENCE RATE 0.18 0.17 0.18 LTI INCIDENCE RATE 0.14 0.08 0.12 LTI FREQUENCY RATE 0.68 0.42 0.61 DART INCIDENCE RATE 0.32 0.26 0.30 DART FREQUENCY RATE 1.59 1.29 1.51 RECORDABLE INCIDENCE RATE 0.54 0.35 0.49 RECORDABLE FREQUENCY RATE 2.70 1.74 2.43 MEDICAL TREATMENT INCIDENCE RATE = MTOs X 200,000 / MAN-HOURS (LTIs NOT INCLUDED) RESTRICTED WORK INCIDENCE RATE = RWCs X 200,000 / MAN-HOURS (LTIs NOT INCLUDED) LOST TIME INCIDENCE RATE -( LTIs+FTLs) X 200,000 / MAN-HOURS LOST TIME FREQUENCY RATE =( LTIs+FTLs) X 1,000,000 / MAN-HOURS DART INCIDENCE RATE - (LTIs+FTLs+RWCs) X 200,000 / MAN-HOURS DART INCIDENCE RATE - (LTIs+FTLs+RWCs) X 1,000,000 / MAN-HOURS RECORDABLE INCIDENCE RATE = RECORDABLES X 200,000 / MAN-HOURS RECORDABLE FREQUENCY RATE = RECORDABLES X 1,000,000 / MAN-HOURS
Companies Reporting: Land – 25 Water – 20
Middle East Total LTI & Recordable Incidence Rates vs Man-hours (Figure 10)
0
20000000
40000000
60000000
80000000
100000000
120000000
140000000
160000000
0
0.5
1
1.5
2
2.5
3
3.5
4
4.5
2001
2002
2003
2004
2005
2006
2007
2008
2009
2010
2011
2012
2013
2014
Man
-hou
rs
Inci
denc
e R
ate
LTI Rate Rec. Rate DART Rate Man-hours

Issued 15 June 2015 - 38 – Copyright © International Association of Drilling Contractors
IADC 2014 South American Totals (Table 11)
LAND WATER COMBINED TOTAL MANHOURS 31,975,404 20,327,008 52,302,412 TOTAL MEDICAL TREATMENT INCIDENTS 19 16 35 TOTAL RESTRICTED WORK INCIDENTS 36 13 49 TOTAL LOST TIME INCIDENTS 31 24 55 TOTAL FATALITIES 0 2 2 TOTAL RECORDABLES 86 55 141 MTO INCIDENCE RATE 0.12 0.16 0.13 RWC INCIDENCE RATE 0.23 0.13 0.19 LTI INCIDENCE RATE 0.19 0.26 0.22 LTI FREQUENCY RATE 0.97 1.28 1.09 DART INCIDENCE RATE 0.42 0.38 0.41 DART FREQUENCY RATE 2.10 1.92 2.03 RECORDABLE INCIDENCE RATE 0.54 0.54 0.54 RECORDABLE FREQUENCY RATE 2.69 2.71 2.70 MEDICAL TREATMENT INCIDENCE RATE = MTOs X 200,000 / MAN-HOURS (LTIs NOT INCLUDED) RESTRICTED WORK INCIDENCE RATE = RWCs X 200,000 / MAN-HOURS (LTIs NOT INCLUDED) LOST TIME INCIDENCE RATE -( LTIs+FTLs) X 200,000 / MAN-HOURS LOST TIME FREQUENCY RATE =( LTIs+FTLs) X 1,000,000 / MAN-HOURS DART INCIDENCE RATE - (LTIs+FTLs+RWCs) X 200,000 / MAN-HOURS DART INCIDENCE RATE - (LTIs+FTLs+RWCs) X 1,000,000 / MAN-HOURS RECORDABLE INCIDENCE RATE = RECORDABLES X 200,000 / MAN-HOURS RECORDABLE FREQUENCY RATE = RECORDABLES X 1,000,000 / MAN-HOURS
Companies Reporting: Land – 8 Water – 14
South America Total LTI & Recordable Incidence Rates vs Man-hours (Figure 11)
46000000
48000000
50000000
52000000
54000000
56000000
58000000
60000000
62000000
64000000
0
0.5
1
1.5
2
2.5
3
3.5
4
4.5
2010
2011
2012
2013
2014
Man
-hou
rs
Inci
denc
e R
ate
LTI Rate Rec. Rate DART Rate Man-hours

Issued 15 June 2015 - 39 – Copyright © International Association of Drilling Contractors
IADC 2014 US Totals (Table 12)
LAND WATER COMBINED TOTAL MANHOURS 103,733,079 41,122,966 144,856,045 TOTAL MEDICAL TREATMENT INCIDENTS 317 65 382 TOTAL RESTRICTED WORK INCIDENTS 269 37 306 TOTAL LOST TIME INCIDENTS 205 29 234 TOTAL FATALITIES 10 0 10 TOTAL RECORDABLES 801 131 932 MTO INCIDENCE RATE 0.61 0.32 0.53 RWC INCIDENCE RATE 0.52 0.18 0.42 LTI INCIDENCE RATE 0.41 0.14 0.34 LTI FREQUENCY RATE 2.07 0.71 1.68 DART INCIDENCE RATE 0.93 0.32 0.76 DART FREQUENCY RATE 4.67 1.60 3.80 RECORDABLE INCIDENCE RATE 1.54 0.64 1.29 RECORDABLE FREQUENCY RATE 7.72 3.19 6.43 MEDICAL TREATMENT INCIDENCE RATE = MTOs X 200,000 / MAN-HOURS (LTIs NOT INCLUDED) RESTRICTED WORK INCIDENCE RATE = RWCs X 200,000 / MAN-HOURS (LTIs NOT INCLUDED) LOST TIME INCIDENCE RATE -( LTIs+FTLs) X 200,000 / MAN-HOURS LOST TIME FREQUENCY RATE =( LTIs+FTLs) X 1,000,000 / MAN-HOURS DART INCIDENCE RATE - (LTIs+FTLs+RWCs) X 200,000 / MAN-HOURS DART INCIDENCE RATE - (LTIs+FTLs+RWCs) X 1,000,000 / MAN-HOURS RECORDABLE INCIDENCE RATE = RECORDABLES X 200,000 / MAN-HOURS RECORDABLE FREQUENCY RATE = RECORDABLES X 1,000,000 / MAN-HOURS
Companies Reporting: Land – 34; Water – 15
US Total LTI & Recordable Incidence Rates vs Man-hours (Figure 12)
0
20000000
40000000
60000000
80000000
100000000
120000000
140000000
160000000
0
1
2
3
4
5
6
7
8
9
10
1993
1994
1995
1996
1997
1998
1999
2000
2001
2002
2003
2004
2005
2006
2007
2008
2009
2010
2011
2012
2013
2014
Man
-hou
rs
Inci
denc
e R
ate
LTI Rate Rec. Rate DART Rate Man-hours