iaa mortality working group meeting los angeles may 2012
TRANSCRIPT
IAA Mortality Working Group Meeting Los Angeles May 2012 -
Country Report – Australia
General Population
Australia’s population at 30 September 2011 is estimated by the Australian Bureau of Statistics
(ABS)at 22.7 million.
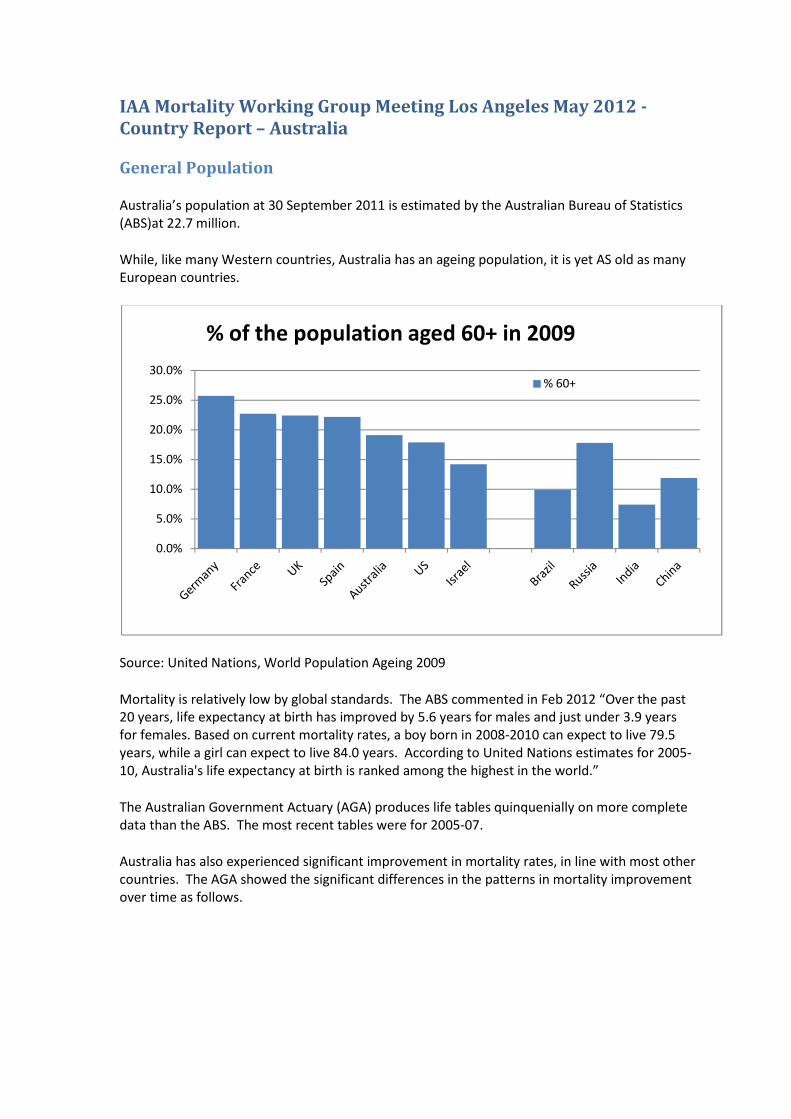
While, like many Western countries, Australia has an ageing population, it is yet AS old as many
European countries.
Source: United Nations, World Population Ageing 2009
Mortality is relatively low by global standards. The ABS commented in Feb 2012 “Over the past
20 years, life expectancy at birth has improved by 5.6 years for males and just under 3.9 years
for females. Based on current mortality rates, a boy born in 2008-2010 can expect to live 79.5
years, while a girl can expect to live 84.0 years. According to United Nations estimates for 2005-
10, Australia's life expectancy at birth is ranked among the highest in the world.”
The Australian Government Actuary (AGA) produces life tables quinquenially on more complete
data than the ABS. The most recent tables were for 2005-07.
Australia has also experienced significant improvement in mortality rates, in line with most other
countries. The AGA showed the significant differences in the patterns in mortality improvement
over time as follows.
0.0%
5.0%
10.0%
15.0%
20.0%
25.0%
30.0%
% of the population aged 60+ in 2009
% 60+
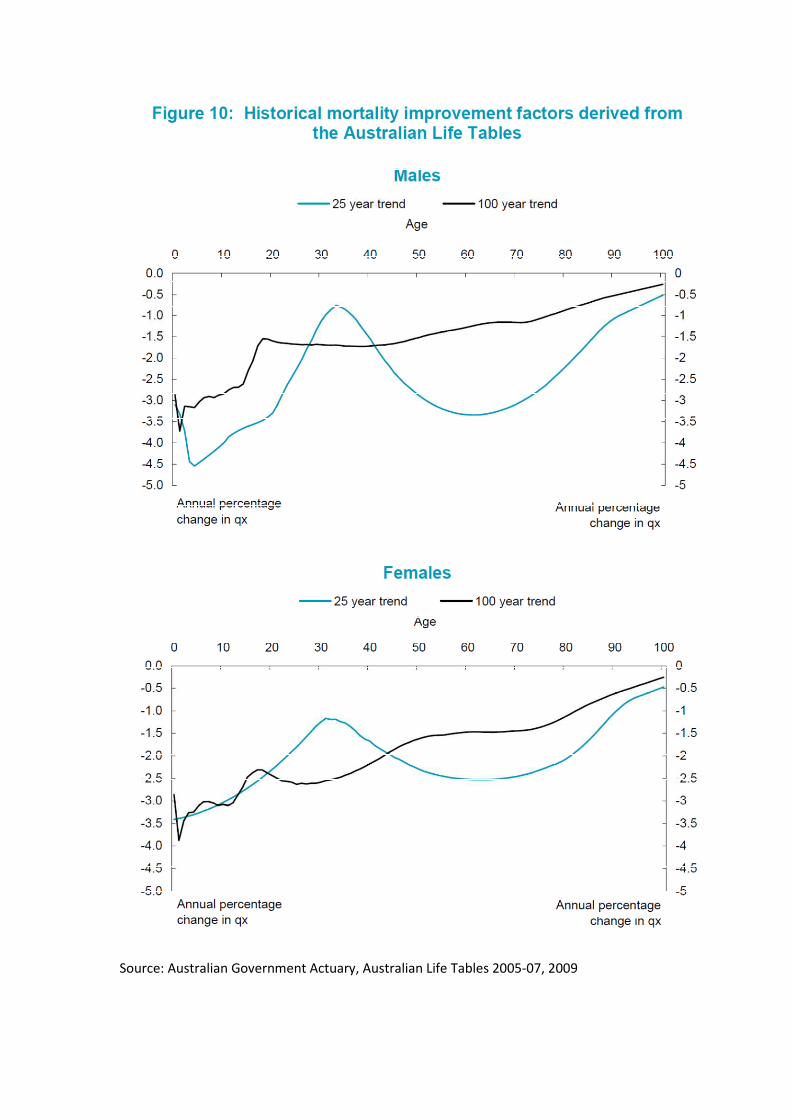
Source: Australian Government Actuary, Australian Life Tables 2005-07, 2009
Life Insurance Market
Australia currently lacks a significant private lifetime annuity market. The main source of
lifetime annuities (apart from the state provided Age Pension) are public sector and corporate
defined benefit schemes, which are rapidly reducing in size as they are closed to new members
and/or wound up.
There is hence no recent insured lives table for annuitants.
The most recent public insured lives table for mortality protection is IA95-97. The most recent
public experience investigation against this table was for the period 1998-99, published in 2004.
Since this time, responsibility for industry mortality investigations has been taken on by the
Financial Services Council (peak industry body for life insurers, among others) and KPMG. The
results of these studies are provided to contributors but are not publicly available.
The life insurance market is quite concentrated, with a significant presence of reinsurers. Both
Individual and Group business are competitive but remain profitable, according to latest APRA
statistics (30 June 2011 Half Yearly Bulletin).
There is no published analysis of mortality improvement for insured lives.
There is currently a project underway to reform capital standards for life and general insurers,
known as LAGIC, due to come into force 1 January 2013. The life insurance standard is scenario
based with explicit allowance for diversification benefits. There is no option currently for the
development of an internal model in the style of Solvency II. The addition of an explicit capital
requirement for extreme mortality events, such as a pandemic, is likely to increase mortality risk
capital requirements.
Country report – Belgium General information According to Belgium statistics, life expectancy for males is 77.15 and 82.43 for females. It is interesting to note that:
· the difference between female and male life expectancy decline during last decade (from 6.34 to 5.28). · the difference between the North and the South of the country of about 3 years. Possible causes are a more developed health service and a more educated population (with a higher salary) in the North of the country
All information are available on the following websitehttp://statbel.fgov.be/fr/statistiques/chiffres/population/deces_mort_esp_vie/tables/ Insurance reserving Reserving bases for classical life insurance are based on Makeham formula: . These are period life tables. According the main risk driver (survival or death) and the sex of the insured person, parameters may change. For example, parameters use for the tariff and reserving of a pure endowment (respectively males and females) are: k= 1.000.266,63 ||k=1.000.048,56 s= 0,999441703848 ||s=0,999669730966 g= 0,999733441115 ||g=0,999951440172 c= 1,101077536030 ||c=1,116792453830 For example, parameters use for tariff and reserving of term/whole life endowment (respectively males and females) are: k= 1.000.450,59 || k= 1.000.097,39
s= 0,999106875782 || s= 0,999257048061 g= 0,999549614043 || g= 0,999902624311 c= 1,103798111448 || c= 1,118239062025
However due to mortality improvements and the length of the commitment, life annuities should anticipate future mortality trend. Rather than considering projected life tables insurers prefer to use Makeham formula with parameters of classical survival insurance (see above) with a reduction of age of 5 years. Market valuation of insurance provisions (Solvency II Directive) Due to the emergence of Solvency II, many insurance undertakings value their technical provisions (except for life annuities) by using market tables which better reflect expected demographic. Market tables are built using mortality data arising from a collection of insurance and/or pension plans. The rationale for market tables lies usually in social class (i.e. adverse selection) as assessed through occupation, income or education. Social class often induces more difference in longevity than gender. In general, individuals with higher socio-economic status live longer than those in lower socio-economic groups. The effect of social class is significant for insurance market mortality statistics. Indeed, buying life insurance products often reveals that the individual belongs to upper socio-economic classes, which in turn yields lower mortality. Consequently, these market tables are built around three factors: gender, nature of the underlying risk [survival or death guarantee] and type of policy holder [group or individual] For more details on Market tables, please refer to the attached document [Chapter 4]produced by Michel Denuit (Professor of actuarial science in Belgium) and my-self.

As far as life annuities are concerned, projected life tables are commonly used for valuation. Indeed, the hypothesis of “static” mortality cannot be assumed in principle, at least when long periods of time are referred to. Hence, in Life insurance applications, the use of period life tables should be restricted to products involving short or medium durations, like term insurance or endowment insurance, whilst it should be avoided when dealing with Life annuities and pension schemes. Conversely, these products require life tables which allow for the anticipated future mortality trend constructed on the basis of the experienced mortality trend. Mortality forecasting Although several models could be used to project mortality, Lee & Carter methodology remains a benchmark as referred on the Belgian Actuarial Bulletin (www.belgianactuarialbulletin.be) or in my attached document [Chapter 3]. However, new models seem to surpass some difficulties of the Lee &Carter approach. Note also that official publication has already been performed on that topic:http://www.plan.be/admin/uploaded/200805081112390.pp105_fr.pdf Mortality miscellaneous A closed collaboration took place between actuary and notary in order to help notary to find the appropriate life tables to price usufruct. ----------------------------------- Benoît-Laurent Yerna Actuary Senior consultant Reacfin S.A. Place de l'Université, 25 B-1348 Louvain-la-Neuve Tva: BE 0862.986.729 Mobile: +32 497 78 22 37 www.reacfin.com
The introduction of mortality investigation of China’s Life
insurance industry
Zhan, Zhaolan
Member of standing committee of China Association of Actuaries
April, 2012

History and development of mainland China’s mortality investigation
There were two nation wide mortality investigations based upon assured lives
experience in mainland China. The first one lasted for nearly four years from year
1992 to year 1995 and ended up with the construction of the first standard life table
of mainland China, China Life Table (1990 1993). This table was dictated by China’s
insurance regulatory authority as the basis of the pricing of life insurance products
and the evaluation of their statutory reserve. The second one was finished on
November, 2005, and constructed China Life Table (2000 2003), the second standard
life table based on assured lives. China Life Table (2000 2003) was dictated by China’s
insurance regulatory authority as the basis of evaluation of statutory reserve, but not
the pricing; life insurers were allowed to pricing their products with their own
experience data. Based on the first two mortality investigations mentioned above,
the industry makes it a rule to make a mortality investigation every ten years.
The investigations into mortality were all organized by China’s insurance regulatory
authority before year 2007. Then China Association of Actuaries (CAA) took over the
responsibility of the mortality investigations after its foundation in 2007. Accordingly,
Mortality Investigation Office (MIO) was established under CAA on 2011 7 18.
Profile of MIO
MIO is a standing office under CAA. Currently its members include the specialists of
experience analysis from China Insurance Regulatory Commission (CIRC), China Re
Life and 6 other major players in China’s life insurance market. For each project of
MIO, the office coordinates the members of CAA from different insurance companies
and two full time staffs deal with the daily works.
The major duties of MIO include investigating into the experience data, preparing
and amending standard life tables and morbidity tables, publishing relevant working
paper, issuing related journals and organizing relevant seminars. MIO major
operations are specified as follows:

Investigating into mortality and morbidityMIO is responsible for the periodic investigations into mortality (life and annuity),morbidity for critical illness and the incident rate of accidental death; relatedstandard tables are also prepared.
Undertaking relevant researchesOrganizing the academic exchange on methods, techniques and practices of dataanalysis, periodically or ad hoc.Working with other organizations on the projects covering demographic statistics,medical investigation, investment data analysis and macro economics dataanalysis with the special skills as an actuarial institute.Publishing relevant research findings, working papers, journals and books;translating relevant foreign publications as well.Providing the platform to share information and findings with periodicalmeetings, website and other media resources.
International exchangeMIO is trying to connect with similar international working groups to strengthenacademic exchange.
Current projects of MIO
MIO is preparing the standard table of critical illness morbidity nowadays.
The background of the projectRecently China’s life insurance industry is focusing on the restructure of the productline and reaches a consensus to promote protection products. In China, as well assome other countries, critical illness products are the most important business lineamong protection products. The critical illness provisions in China today are on theirway to be well specified; however, there is still no standard morbidity table forpricing and evaluation. MIO is preparing this table now.
The goal of the project includes:Investigating into the morbidity experience of critical illness products withacceleration basis and stand alone basisConstructing the morbidity tables for acceleration critical illness and stand alonecritical illness; these tables will be used for pricing and evaluating statutoryreservesIssuing the final report of the project
Steps of the projectEstablish the task forceDefine the strategy of the projectPre research and preparation
Define the feature and the dimensionality of the tables and standards for dataData collection and verificationConstructing the standard tablesCollecting feedbacks, opinions and questionsPublishing the final tables
The progress todayThe project was launched on October, 2011 and from then on several meetings wereheld to discuss the organization, participants, data, relevant techniques, time table,budget and so on. Today, the project is at its stage of pre research. The first five stepsare expected to be finished before June, 2012 and then the sixth steps to be finishedbefore January, 2013. The whole project will ends by May, 2013.
Besides the critical illness morbidity investigations introduced above, MIO alsocontributes but not limited to the following topics:
Lapse rate experience analysis, experience study on days of hospitalization stays,frequency of outpatient treatment, expense analysis and investment analysis.The research on constructing of the table of disability by employment injury andthe table of LTC.The experience study of short term accident policies on their morbidity or lossratio.

Country report – Israel
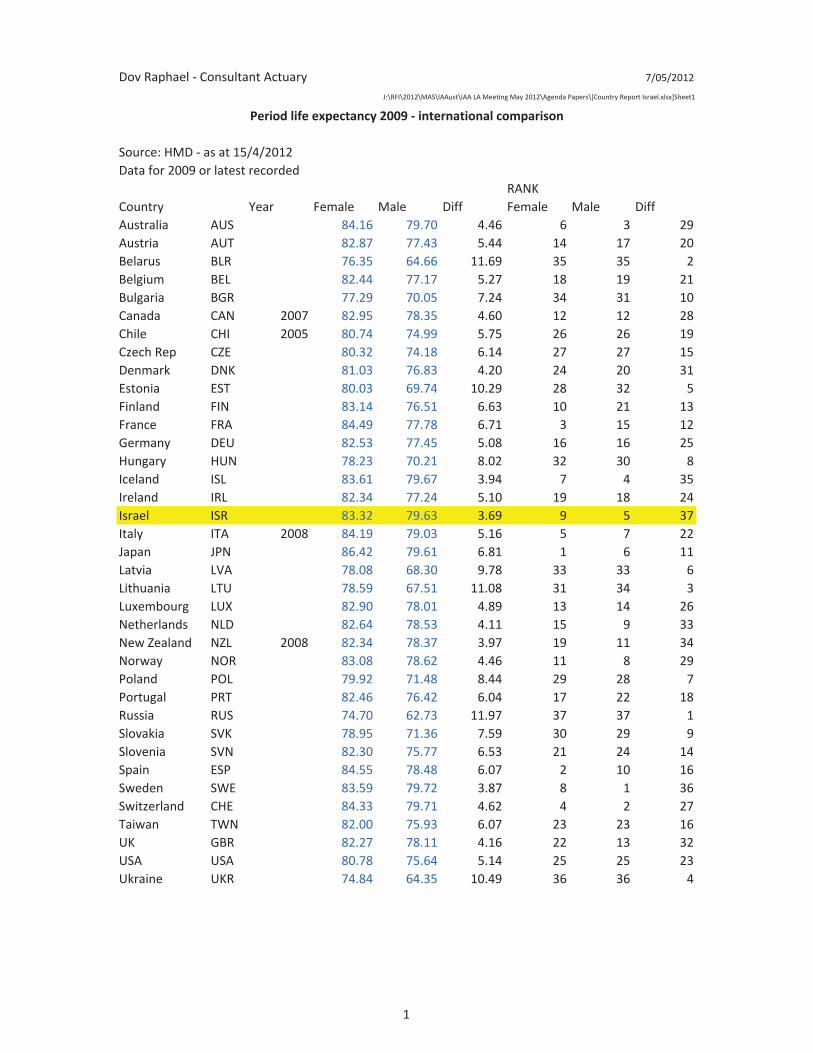
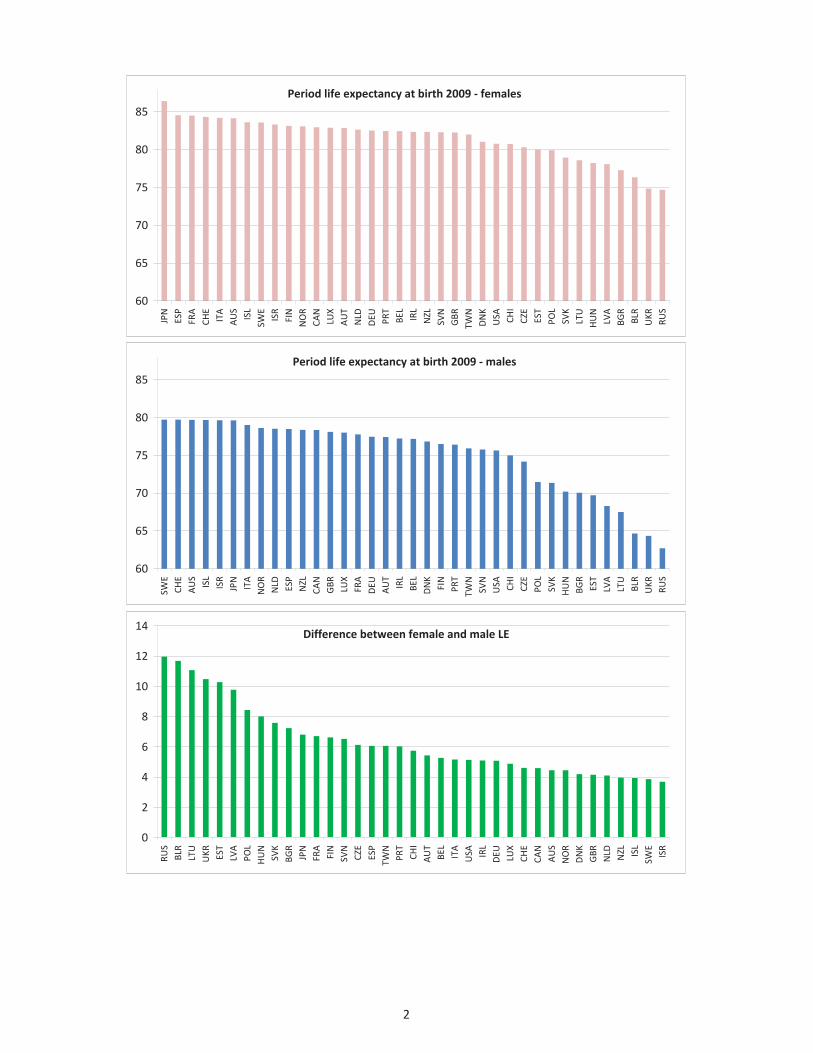
General informationA comparison of period life expectancy at birth in the 37 countries reporting to theHMD (data for 2009 or the latest available year)* puts Israel in 5th place for malesand 9th place for females. Possible causes are a well developed health service anda relatively educated population. It is interesting to note that the differencebetween female and male life expectancy is lower than any other country in theHMD: 3.7 years (the average is 6.4).
Israel has a very high rate of immigration. Many of the older population came asrefugees from Europe, North Africa and the Middle East in the mid 20th century.In the 1990s there were about 1.3 million immigrants from the former Soviet Union,which boosted the total population by nearly 20%.
Insurance and pension reservingReserving bases for pension schemes and deferred annuities (including GAOs, whichare standard in most life insurance contracts) follow the guidelines of theCommissioner of Insurance, with tables based on past experience and mortalityimprovement factors. These follow the “ – f” methodology of CMI17 (1999),adjusted for improvements from Israel population statistics, and taking into accountthe cohort effect. There is now a compulsory pension law for all employees.
The Commissioner is expected to issue revised guidelines in 2012. Since the laststudy, population mortality has increased faster than would be expected from thecurrent improvement factors, and it is anticipated that this applies also to theinsured population. The new tables and factors are therefore likely to increasepension liabilities considerably.
Problems in mortality forecastingThe unusual characteristics of the population, mentioned at the beginning of thisreport, raise a number of questions about the efficacy of projecting past experienceinto the future. Some examples are given below.
1) The unusually small gap between female and male mortality has been notedby researchers. One possible explanation is that within a family ofimmigrants, much of the stress of adjusting to a new life falls on the mother.The statistics could therefore “revert to normal” with a decline inimmigration.
2) The immigrant population in general may be “select”, as has been pointedout in O’Connell’s study about New Zealand (2010). This could evenprovide part of the explanation for the longevity of those born in the 1930sand 1940s.
3) The immigration from the FSU might have been expected to halt theimprovements in longevity – bearing in mind that male life expectancy inRussia and the Ukraine is less than 65 years at birth compared to 79 inIsrael! In fact, longevity continued to increase steadily during this

period. Michael Murray, who gave a presentation on mortality trends inthe FSU at the longevity conference in Warwick in 2011, suggested to me thatthe immigrants were not a typical cross sample of the population from whichthey came (for example, Jews tend to drink alcohol in moderation).
These points are a reminder that the usual methods of mortality forecasting assumestable characteristics of the observed population over time. With increasingpopulation movements around the world, the shifting make up of the populationbase could easily upset mortality forecasts.
Dov Raphael Consultant Actuary 7/05/2012
J:\RFI\2012\MAS\IAAust\IAA LA Meeting May 2012\Agenda Papers\[Country Report Israel.xlsx]Sheet1
Source: HMD as at 15/4/2012Data for 2009 or latest recorded
RANKCountry Year Female Male Diff Female Male DiffAustralia AUS 84.16 79.70 4.46 6 3 29Austria AUT 82.87 77.43 5.44 14 17 20Belarus BLR 76.35 64.66 11.69 35 35 2Belgium BEL 82.44 77.17 5.27 18 19 21Bulgaria BGR 77.29 70.05 7.24 34 31 10Canada CAN 2007 82.95 78.35 4.60 12 12 28Chile CHI 2005 80.74 74.99 5.75 26 26 19Czech Rep CZE 80.32 74.18 6.14 27 27 15Denmark DNK 81.03 76.83 4.20 24 20 31Estonia EST 80.03 69.74 10.29 28 32 5Finland FIN 83.14 76.51 6.63 10 21 13France FRA 84.49 77.78 6.71 3 15 12Germany DEU 82.53 77.45 5.08 16 16 25Hungary HUN 78.23 70.21 8.02 32 30 8Iceland ISL 83.61 79.67 3.94 7 4 35Ireland IRL 82.34 77.24 5.10 19 18 24Israel ISR 83.32 79.63 3.69 9 5 37Italy ITA 2008 84.19 79.03 5.16 5 7 22Japan JPN 86.42 79.61 6.81 1 6 11Latvia LVA 78.08 68.30 9.78 33 33 6Lithuania LTU 78.59 67.51 11.08 31 34 3Luxembourg LUX 82.90 78.01 4.89 13 14 26Netherlands NLD 82.64 78.53 4.11 15 9 33New Zealand NZL 2008 82.34 78.37 3.97 19 11 34Norway NOR 83.08 78.62 4.46 11 8 29Poland POL 79.92 71.48 8.44 29 28 7Portugal PRT 82.46 76.42 6.04 17 22 18Russia RUS 74.70 62.73 11.97 37 37 1Slovakia SVK 78.95 71.36 7.59 30 29 9Slovenia SVN 82.30 75.77 6.53 21 24 14Spain ESP 84.55 78.48 6.07 2 10 16Sweden SWE 83.59 79.72 3.87 8 1 36Switzerland CHE 84.33 79.71 4.62 4 2 27Taiwan TWN 82.00 75.93 6.07 23 23 16UK GBR 82.27 78.11 4.16 22 13 32USA USA 80.78 75.64 5.14 25 25 23Ukraine UKR 74.84 64.35 10.49 36 36 4
Period life expectancy 2009 international comparison
1
Period life expectancy at birth 2009 females
60
65
70
75
80
85
JPN
ESP
FRA
CHE
ITA
AUS
ISL
SWE
ISR
FIN
NOR
CAN
LUX
AUT
NLD
DEU PRT
BEL
IRL
NZL
SVN
GBR
TWN
DNK
USA CHI
CZE
EST
POL
SVK
LTU
HUN
LVA
BGR
BLR
UKR
RUS
Period life expectancy at birth 2009 males
60
65
70
75
80
85
SWE
CHE
AUS
ISL
ISR
JPN
ITA
NOR
NLD ESP
NZL
CAN
GBR LUX
FRA
DEU
AUT
IRL
BEL
DNK
FIN
PRT
TWN
SVN
USA CHI
CZE
POL
SVK
HUN
BGR
EST
LVA
LTU
BLR
UKR
RUS
Difference between female and male LE
0
2
4
6
8
10
12
14
RUS
BLR
LTU
UKR EST
LVA
POL
HUN
SVK
BGR
JPN
FRA
FIN
SVN
CZE
ESP
TWN
PRT
CHI
AUT
BEL
ITA
USA IRL
DEU LUX
CHE
CAN
AUS
NOR
DNK
GBR
NLD NZL ISL
SWE
ISR
2

Country report: Italy Ermanno Pitacco
The most important issue is currently the construction of projected tables describing the mortality of pensioners.
It is a work in progress, organized by the Italian actuarial professional body (Ordine Nazionale degli Attuari), which can be summarized as follows:
1. Observation period: 1980 – 2009.
2. Population size:
a) almost 10 millions pensioners (in 2009), belonging to various pension plans, managed by public and private institutions;
b) corresponding to approx 142 billions of annual benefits.
3. Projection methods adopted:
a) stochastic methods: Lee-Carter model, log-bilinerar Poisson model, Renshaw-Haberman model with cohort effect;
b) deterministic method: the APC (Age-Period-Cohort) model, proposed by the Continuous Mortality Investigation Bureau in UK.
4. Aim: the construction of projected mortality tables, separately referring to various “categories”, and in particular:
a) pensioners of the private sector;
b) pensioners of the public sector;
c) self-employed, split into professional categories (lawyers, doctors, etc.)
5. A further aim: analyzing and projected the mortality of annuitants who purchased life annuities, in order to assess the self-selection phenomenon (currently a difficult task because of the poor volumes of annuitization).


Country Report - Russia
Regarding country report, I can provide the overview of general situation with mortality issues in Russia.
1. The life insurance market in Russia is still underdeveloped. We don't have Russian specific mortality tables for insured persons. Companies use the adjusted population tables.
2. One of the main challenges these days is in the area of pension (state and non-state) schemes. Everybody understands current trends of mortality improvement (longevity). However, nobody knows to what extent such trend will realise in future. The first hypothesis is that the trend will be like in other G8 countries keeping the difference in mortality levels between Russia and other G8 countries as it is now. The alternative hypothesis is that Russian mortality will come closer to G8 countries. This implies that the rate of mortality improvement will be higher than in other G8 countries.
3. Life expectancy is one of the target indicators in Russian Strategy - year 2020 document. it was adopted by the Russian government in year 2006. It's worth mentioning that here we are talking about population mortality.
1
IAA Mortality Working Group Meeting Los Angeles May 2012 - Country Report – Slovenia
Darko Medved
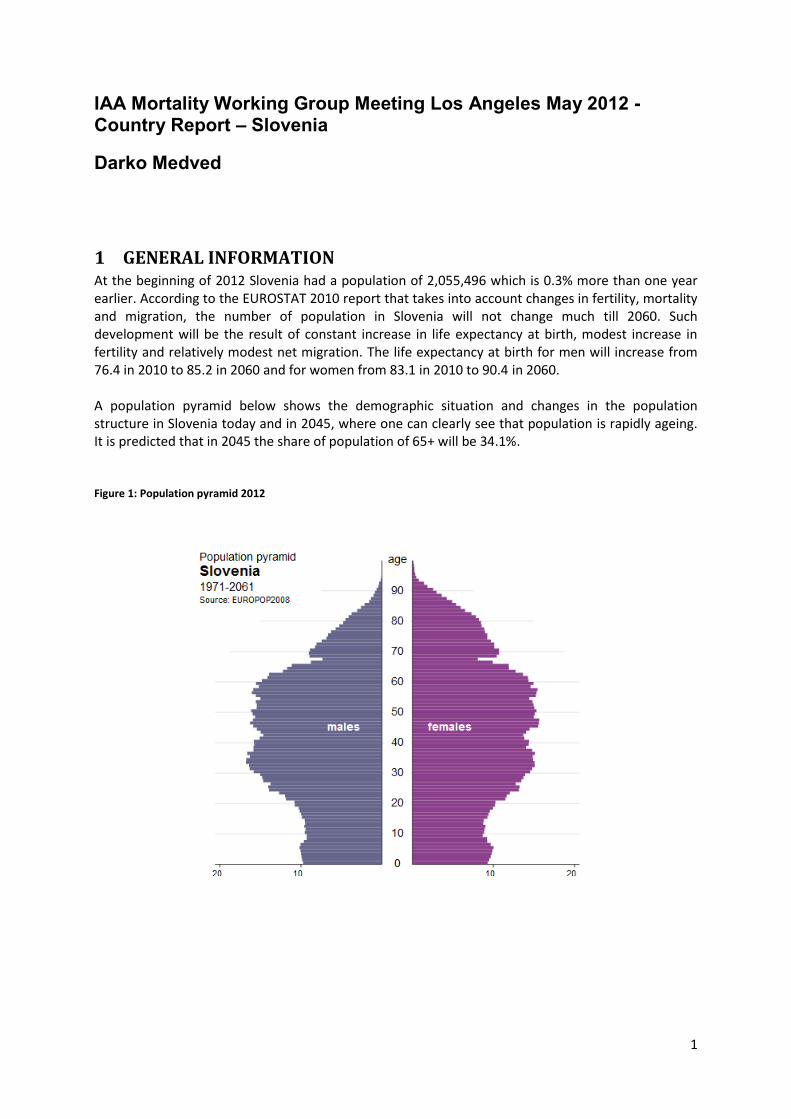
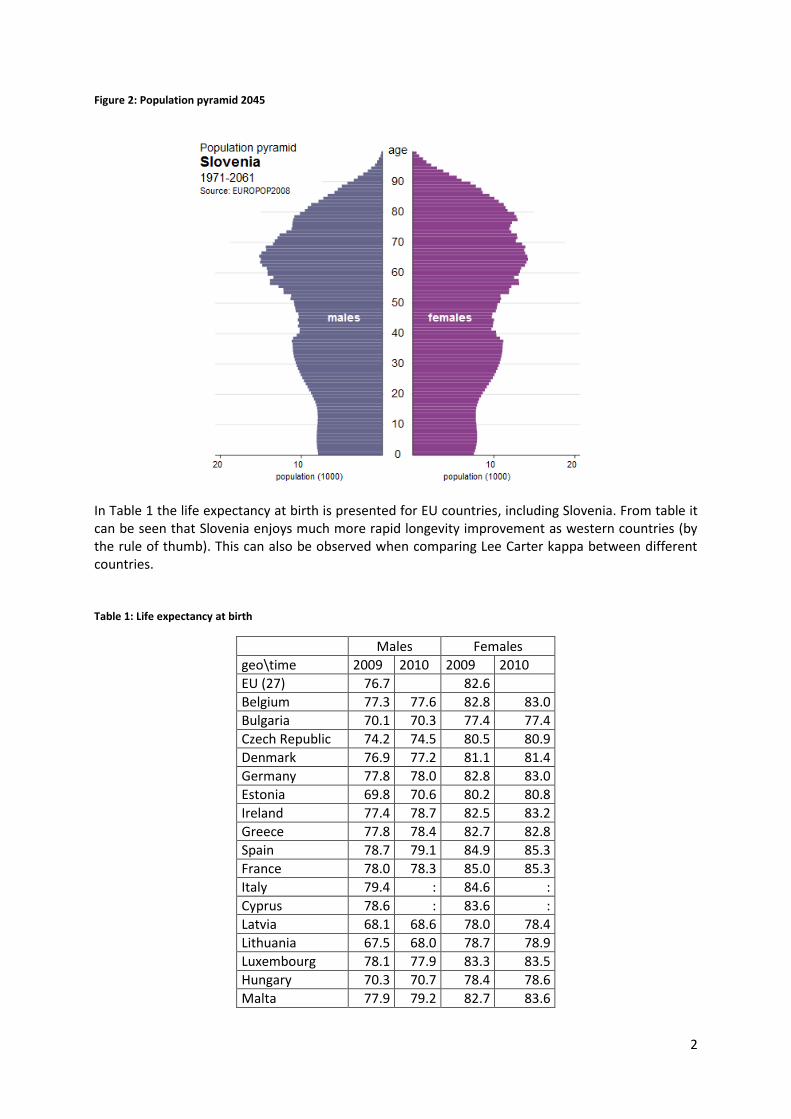
1 GENERAL INFORMATION At the beginning of 2012 Slovenia had a population of 2,055,496 which is 0.3% more than one year earlier. According to the EUROSTAT 2010 report that takes into account changes in fertility, mortality and migration, the number of population in Slovenia will not change much till 2060. Such development will be the result of constant increase in life expectancy at birth, modest increase in fertility and relatively modest net migration. The life expectancy at birth for men will increase from 76.4 in 2010 to 85.2 in 2060 and for women from 83.1 in 2010 to 90.4 in 2060. A population pyramid below shows the demographic situation and changes in the population structure in Slovenia today and in 2045, where one can clearly see that population is rapidly ageing. It is predicted that in 2045 the share of population of 65+ will be 34.1%. Figure 1: Population pyramid 2012
2
Figure 2: Population pyramid 2045
In Table 1 the life expectancy at birth is presented for EU countries, including Slovenia. From table it can be seen that Slovenia enjoys much more rapid longevity improvement as western countries (by the rule of thumb). This can also be observed when comparing Lee Carter kappa between different countries. Table 1: Life expectancy at birth
Males Females
geo\time 2009 2010 2009 2010
EU (27) 76.7 82.6
Belgium 77.3 77.6 82.8 83.0
Bulgaria 70.1 70.3 77.4 77.4
Czech Republic 74.2 74.5 80.5 80.9
Denmark 76.9 77.2 81.1 81.4
Germany 77.8 78.0 82.8 83.0
Estonia 69.8 70.6 80.2 80.8
Ireland 77.4 78.7 82.5 83.2
Greece 77.8 78.4 82.7 82.8
Spain 78.7 79.1 84.9 85.3
France 78.0 78.3 85.0 85.3
Italy 79.4 : 84.6 :
Cyprus 78.6 : 83.6 :
Latvia 68.1 68.6 78.0 78.4
Lithuania 67.5 68.0 78.7 78.9
Luxembourg 78.1 77.9 83.3 83.5
Hungary 70.3 70.7 78.4 78.6
Malta 77.9 79.2 82.7 83.6
3
Netherlands 78.7 78.9 82.9 83.0
Austria 77.6 77.9 83.2 83.5
Poland 71.5 72.1 80.1 80.7
Portugal 76.5 76.7 82.6 82.8
Romania 69.8 : 77.4 :
Slovenia 75.9 76.4 82.7 83.1
Slovakia 71.4 71.7 79.1 79.3
Finland 76.6 76.9 83.5 83.5
Sweden 79.4 79.6 83.5 83.6
United Kingdom 78.3 78.6 82.5 82.6
Iceland 79.8 79.8 83.8 84.1
Liechtenstein 79.5 79.5 83.6 84.3
Norway 78.7 79.0 83.2 83.3
Switzerland 79.9 80.3 84.6 84.9
Montenegro 72.9 73.5 77.6 78.4
Croatia 73.0 73.5 79.7 79.9
FYRM 72.3 72.9 76.7 77.2
Turkey 73.3 : 78.8 :
Source EUROPOP2010
2 SURVEY ON MORTALITY BY CAUSE In 2011 a large survey on mortality by cause was conducted in Slovenia. Below we presented some interesting results of this survey. This can give reader an insight on mortality pattern of Slovenian population as a typical CEE country. More can be found in Sambt, J. et al., Projecting future : longevity in
Slovenia based on cause of mortality. Zavarov. horiz., sep. 2011, year 7, no. 2, pg. 35-68.
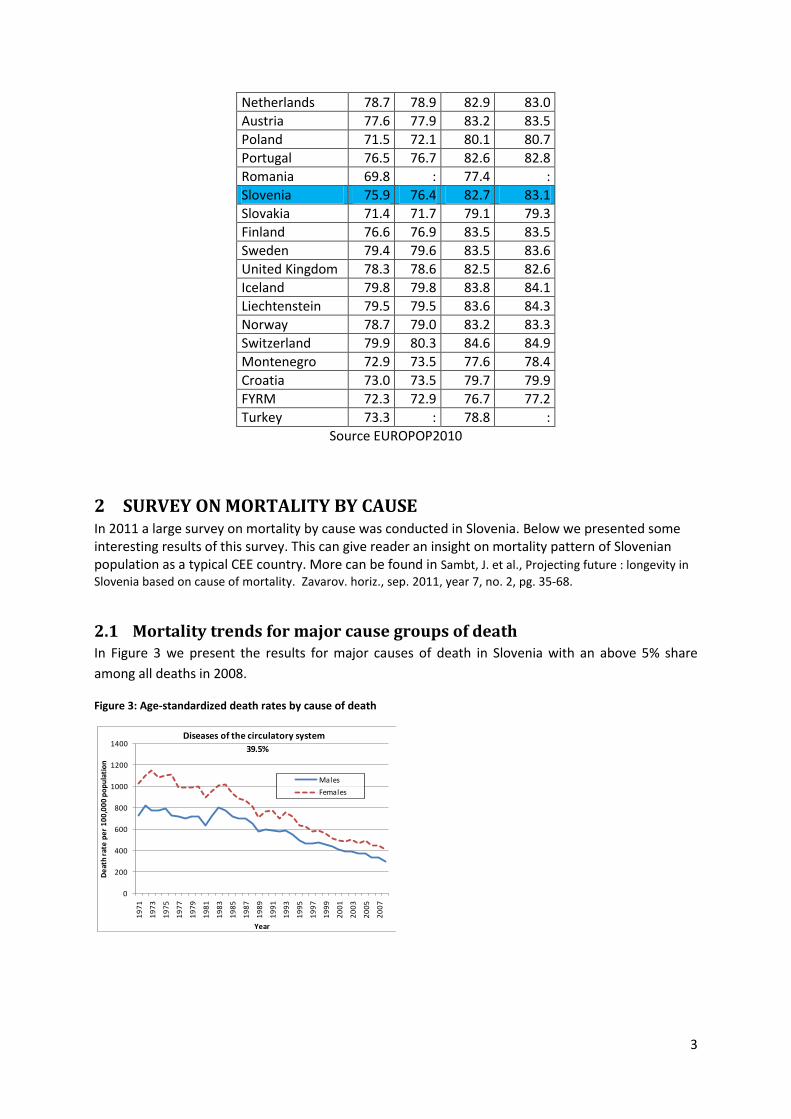
2.1 Mortality trends for major cause groups of death In Figure 3 we present the results for major causes of death in Slovenia with an above 5% share
among all deaths in 2008.
Figure 3: Age-standardized death rates by cause of death
0
200
400
600
800
1000
1200
1400
19
71
19
73
19
75
19
77
19
79
19
81
19
83
19
85
19
87
19
89
19
91
19
93
19
95
19
97
19
99
20
01
20
03
20
05
20
07
De
ath
rat
e p
er
10
0,0
00
po
pu
lati
on
Year
Diseases of the circulatory system
Males
Females
39.5%
4
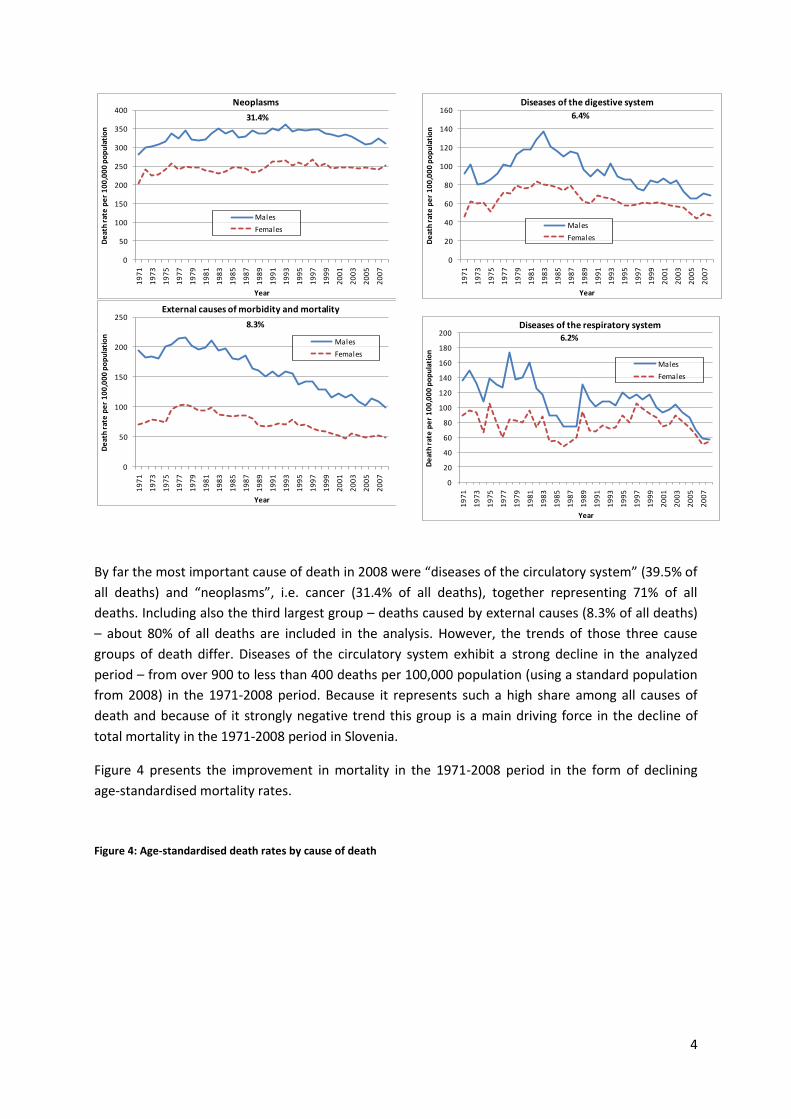
By far the most important cause of death in 2008 were “diseases of the circulatory system” (39.5% of
all deaths) and “neoplasms”, i.e. cancer (31.4% of all deaths), together representing 71% of all
deaths. Including also the third largest group – deaths caused by external causes (8.3% of all deaths)
– about 80% of all deaths are included in the analysis. However, the trends of those three cause
groups of death differ. Diseases of the circulatory system exhibit a strong decline in the analyzed
period – from over 900 to less than 400 deaths per 100,000 population (using a standard population
from 2008) in the 1971-2008 period. Because it represents such a high share among all causes of
death and because of it strongly negative trend this group is a main driving force in the decline of
total mortality in the 1971-2008 period in Slovenia.
Figure 4 presents the improvement in mortality in the 1971-2008 period in the form of declining
age-standardised mortality rates.
Figure 4: Age-standardised death rates by cause of death
0
50
100
150
200
250
300
350
400
19
71
19
73
19
75
19
77
19
79
19
81
19
83
19
85
19
87
19
89
19
91
19
93
19
95
19
97
19
99
20
01
20
03
20
05
20
07
De
ath
rat
e p
er
10
0,0
00
po
pu
lati
on
Year
Neoplasms
Males
Females
31.4%
0
50
100
150
200
250
19
71
19
73
19
75
19
77
19
79
19
81
19
83
19
85
19
87
19
89
19
91
19
93
19
95
19
97
19
99
20
01
20
03
20
05
20
07
De
ath
rat
e p
er
10
0,0
00
po
pu
lati
on
Year
External causes of morbidity and mortality
Males
Females
8.3%
0
20
40
60
80
100
120
140
160
19
71
19
73
19
75
19
77
19
79
19
81
19
83
19
85
19
87
19
89
19
91
19
93
19
95
19
97
19
99
20
01
20
03
20
05
20
07
De
ath
rat
e p
er
10
0,0
00
po
pu
lati
on
Year
Diseases of the digestive system
Males
Females
6.4%
0
20
40
60
80
100
120
140
160
180
200
19
71
19
73
19
75
19
77
19
79
19
81
19
83
19
85
19
87
19
89
19
91
19
93
19
95
19
97
19
99
20
01
20
03
20
05
20
07
De
ath
rat
e p
er
10
0,0
00
po
pu
lati
on
Year
Diseases of the respiratory system
Males
Females
6.2%
5
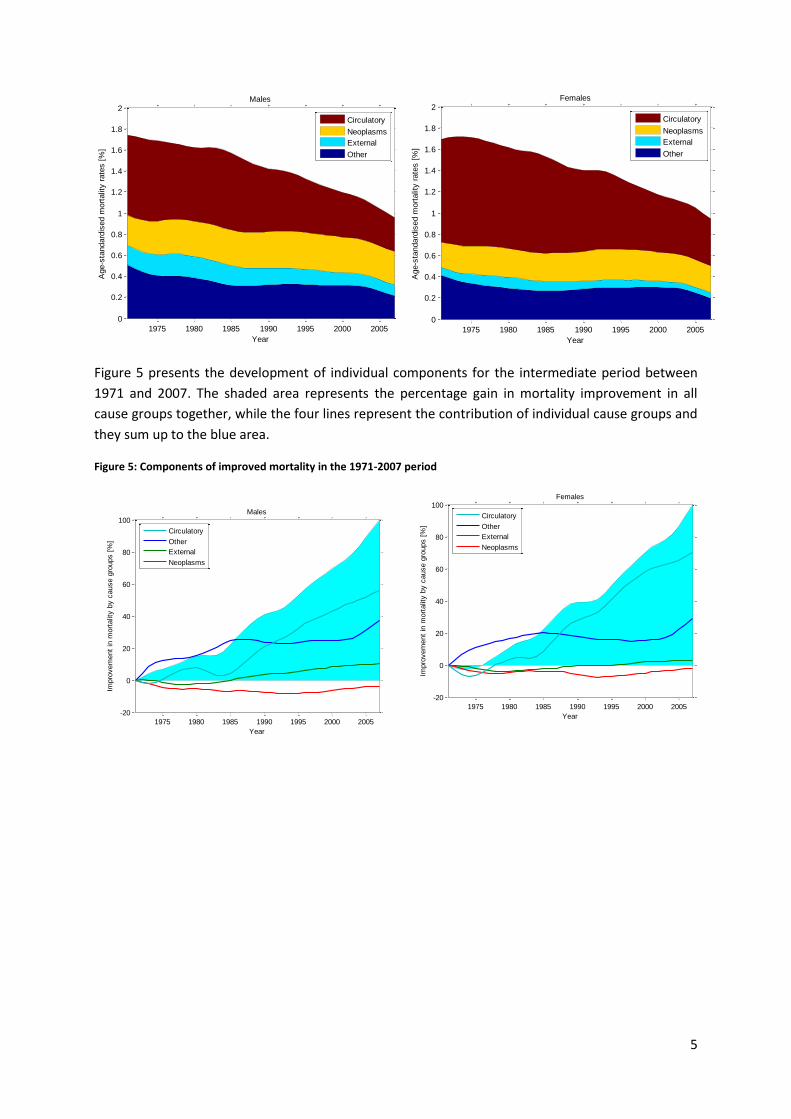
Figure 5 presents the development of individual components for the intermediate period between
1971 and 2007. The shaded area represents the percentage gain in mortality improvement in all
cause groups together, while the four lines represent the contribution of individual cause groups and
they sum up to the blue area.
Figure 5: Components of improved mortality in the 1971-2007 period
1975 1980 1985 1990 1995 2000 2005
0
0.2
0.4
0.6
0.8
1
1.2
1.4
1.6
1.8
2Males
Year
Age-s
tandard
ised m
ort
alit
y r
ate
s [
%]
Circulatory
Neoplasms
External
Other
1975 1980 1985 1990 1995 2000 2005
0
0.2
0.4
0.6
0.8
1
1.2
1.4
1.6
1.8
2Females
Year
Age-s
tandard
ised m
ort
alit
y r
ate
s [
%]
Circulatory
Neoplasms
External
Other
1975 1980 1985 1990 1995 2000 2005
-20
0
20
40
60
80
100Males
Year
Impro
vem
ent
in m
ort
alit
y b
y c
ause g
roups [
%]
Circulatory
Other
External
Neoplasms
1975 1980 1985 1990 1995 2000 2005
-20
0
20
40
60
80
100Females
Year
Impro
vem
ent
in m
ort
alit
y b
y c
ause g
roups [
%]
Circulatory
Other
External
Neoplasms
6
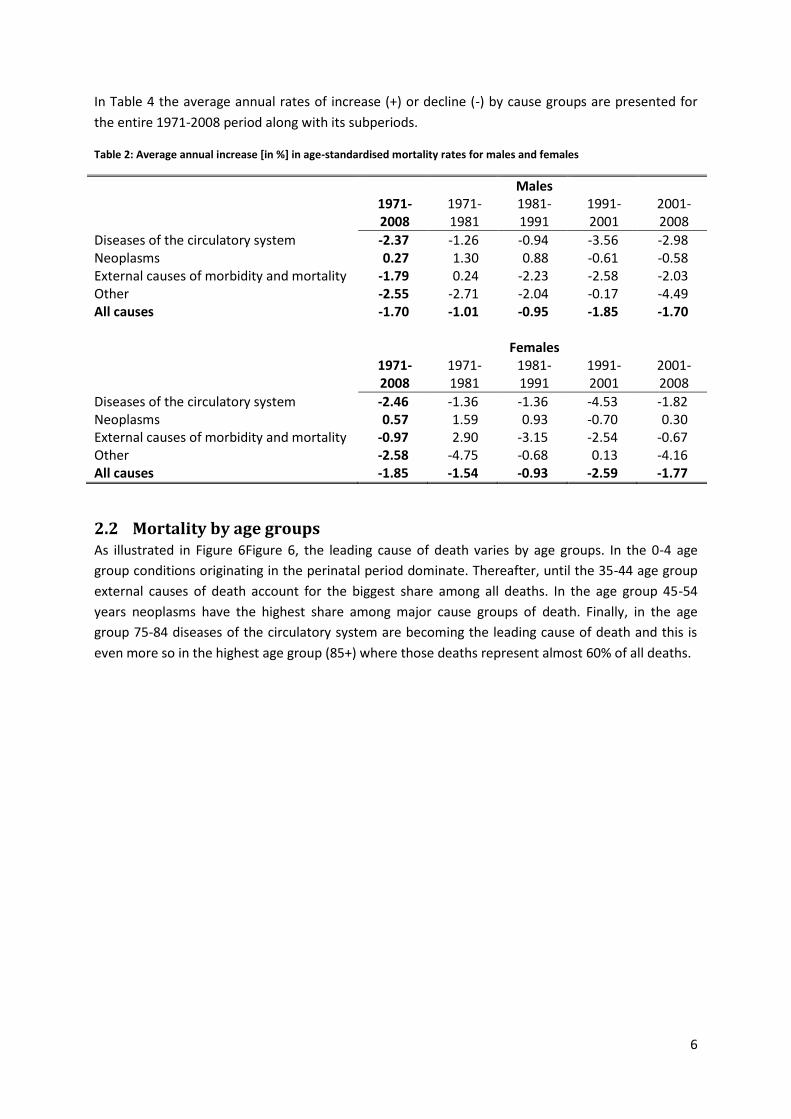
In Table 4 the average annual rates of increase (+) or decline (-) by cause groups are presented for
the entire 1971-2008 period along with its subperiods.
Table 2: Average annual increase [in %] in age-standardised mortality rates for males and females
Males 1971-
2008 1971-1981
1981-1991
1991-2001
2001-2008
Diseases of the circulatory system -2.37 -1.26 -0.94 -3.56 -2.98 Neoplasms 0.27 1.30 0.88 -0.61 -0.58 External causes of morbidity and mortality -1.79 0.24 -2.23 -2.58 -2.03 Other -2.55 -2.71 -2.04 -0.17 -4.49 All causes -1.70 -1.01 -0.95 -1.85 -1.70 Females 1971-
2008 1971-1981
1981-1991
1991-2001
2001-2008
Diseases of the circulatory system -2.46 -1.36 -1.36 -4.53 -1.82 Neoplasms 0.57 1.59 0.93 -0.70 0.30 External causes of morbidity and mortality -0.97 2.90 -3.15 -2.54 -0.67 Other -2.58 -4.75 -0.68 0.13 -4.16 All causes -1.85 -1.54 -0.93 -2.59 -1.77
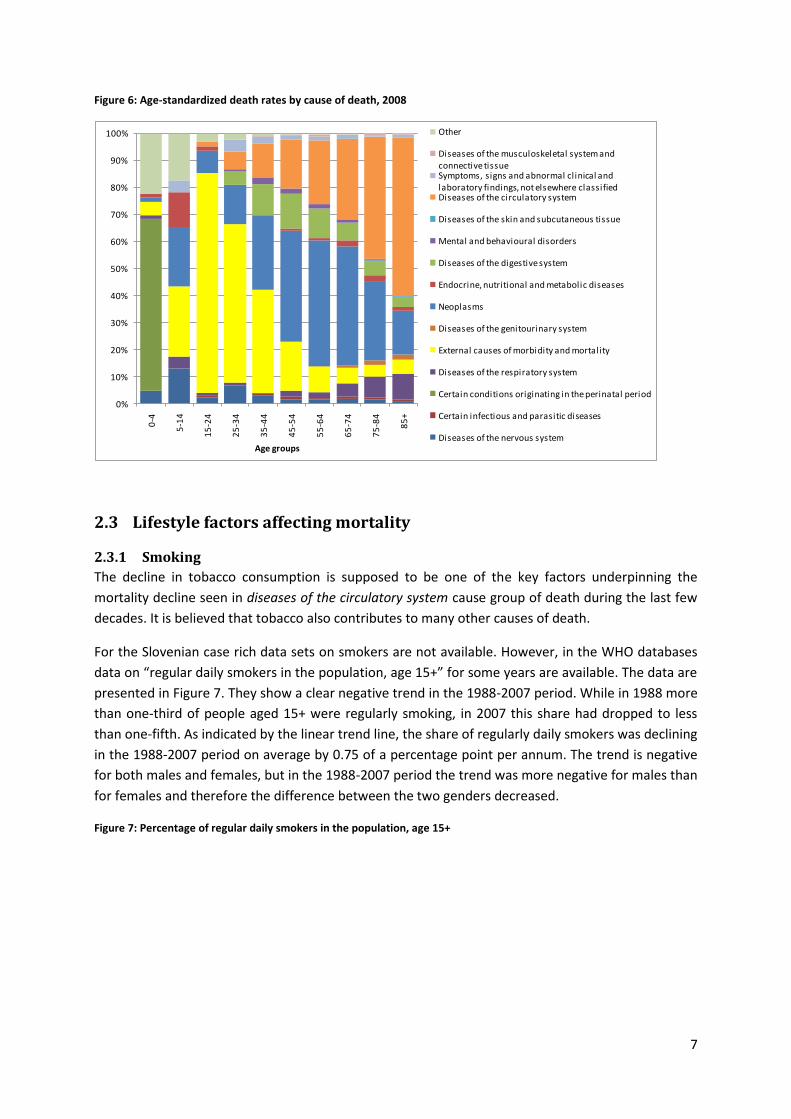
2.2 Mortality by age groups As illustrated in Figure 6Figure 6, the leading cause of death varies by age groups. In the 0-4 age
group conditions originating in the perinatal period dominate. Thereafter, until the 35-44 age group
external causes of death account for the biggest share among all deaths. In the age group 45-54
years neoplasms have the highest share among major cause groups of death. Finally, in the age
group 75-84 diseases of the circulatory system are becoming the leading cause of death and this is
even more so in the highest age group (85+) where those deaths represent almost 60% of all deaths.
7
Figure 6: Age-standardized death rates by cause of death, 2008
2.3 Lifestyle factors affecting mortality
2.3.1 Smoking
The decline in tobacco consumption is supposed to be one of the key factors underpinning the
mortality decline seen in diseases of the circulatory system cause group of death during the last few
decades. It is believed that tobacco also contributes to many other causes of death.
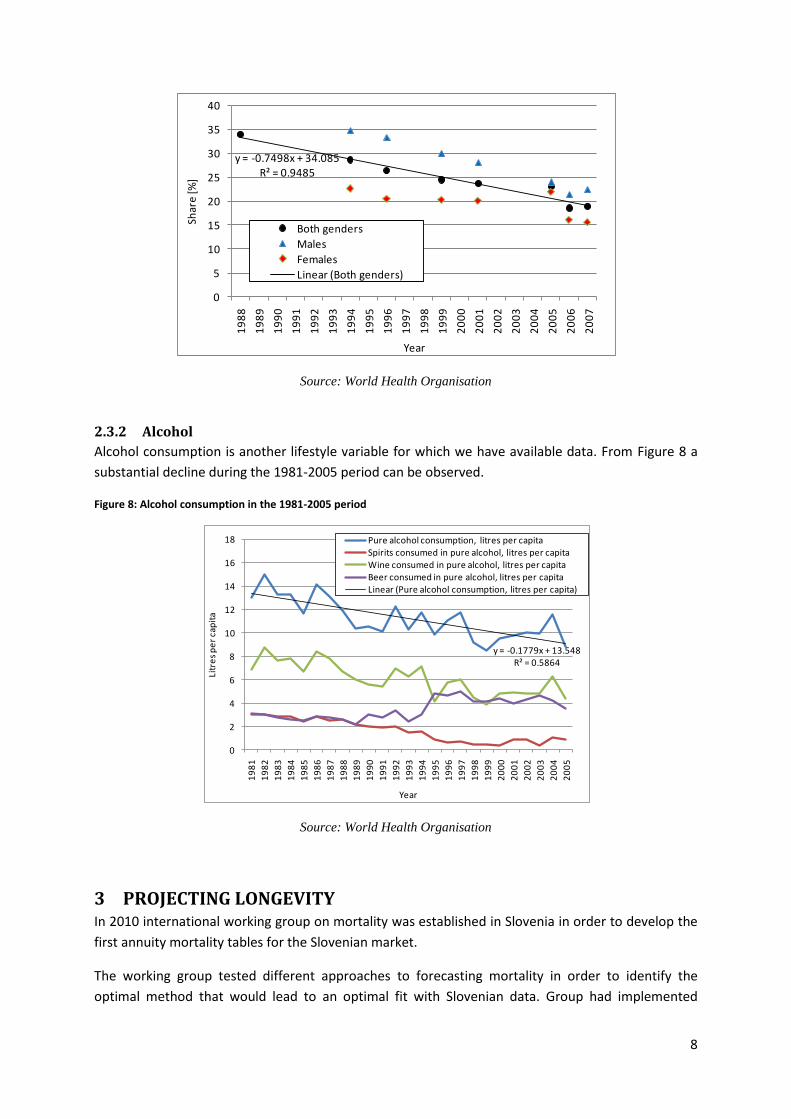
For the Slovenian case rich data sets on smokers are not available. However, in the WHO databases
data on “regular daily smokers in the population, age 15+” for some years are available. The data are
presented in Figure 7. They show a clear negative trend in the 1988-2007 period. While in 1988 more
than one-third of people aged 15+ were regularly smoking, in 2007 this share had dropped to less
than one-fifth. As indicated by the linear trend line, the share of regularly daily smokers was declining
in the 1988-2007 period on average by 0.75 of a percentage point per annum. The trend is negative
for both males and females, but in the 1988-2007 period the trend was more negative for males than
for females and therefore the difference between the two genders decreased.
Figure 7: Percentage of regular daily smokers in the population, age 15+
0%
10%
20%
30%
40%
50%
60%
70%
80%
90%
100%
0-4
5-1
4
15
-24
25
-34
35
-44
45
-54
55
-64
65
-74
75
-84
85
+
Age groups
Other
Diseases of the musculoskeletal system and connective tissueSymptoms, signs and abnormal clinical and laboratory findings, not elsewhere classifiedDiseases of the circulatory system
Diseases of the skin and subcutaneous tissue
Mental and behavioural disorders
Diseases of the digestive system
Endocrine, nutritional and metabolic diseases
Neoplasms
Diseases of the genitourinary system
External causes of morbidity and mortality
Diseases of the respiratory system
Certain conditions originating in the perinatal period
Certain infectious and parasitic diseases
Diseases of the nervous system
8
Source: World Health Organisation
2.3.2 Alcohol
Alcohol consumption is another lifestyle variable for which we have available data. From Figure 8 a
substantial decline during the 1981-2005 period can be observed.
Figure 8: Alcohol consumption in the 1981-2005 period
Source: World Health Organisation
3 PROJECTING LONGEVITY In 2010 international working group on mortality was established in Slovenia in order to develop the
first annuity mortality tables for the Slovenian market.
The working group tested different approaches to forecasting mortality in order to identify the
optimal method that would lead to an optimal fit with Slovenian data. Group had implemented
y = -0.7498x + 34.085R² = 0.9485
0
5
10
15
20
25
30
35
40
19
88
19
89
19
90
19
91
19
92
19
93
19
94
19
95
19
96
19
97
19
98
19
99
20
00
20
01
20
02
20
03
20
04
20
05
20
06
20
07
Shar
e [%
]
Year
Both genders
Males
Females
Linear (Both genders)
y = -0.1779x + 13.548R² = 0.5864
0
2
4
6
8
10
12
14
16
18
19
81
19
82
19
83
19
84
19
85
19
86
19
87
19
88
19
89
19
90
19
91
19
92
19
93
19
94
19
95
19
96
19
97
19
98
19
99
20
00
20
01
20
02
20
03
20
04
20
05
Litr
es
pe
r ca
pit
a
Year
Pure alcohol consumption, litres per capitaSpirits consumed in pure alcohol, litres per capitaWine consumed in pure alcohol, litres per capitaBeer consumed in pure alcohol, litres per capitaLinear (Pure alcohol consumption, litres per capita)
9
different deterministic approaches (exponential formula, scenario-based projections on cause of
mortality) and stochastic approaches (basic Lee-Carter, Poisson log-bilinear and APC model).
Based on a back-testing analysis the conclusion was made that the Poisson log bilinear model best
fits the past observed central death rates. It was then a natural conclusion that group would use a
Poisson log bilinear model for forecasting mortality in the future.
The birth year =1965 was used for the fundamental cohort year to generate the Slovenian base
cohort population mortality table.
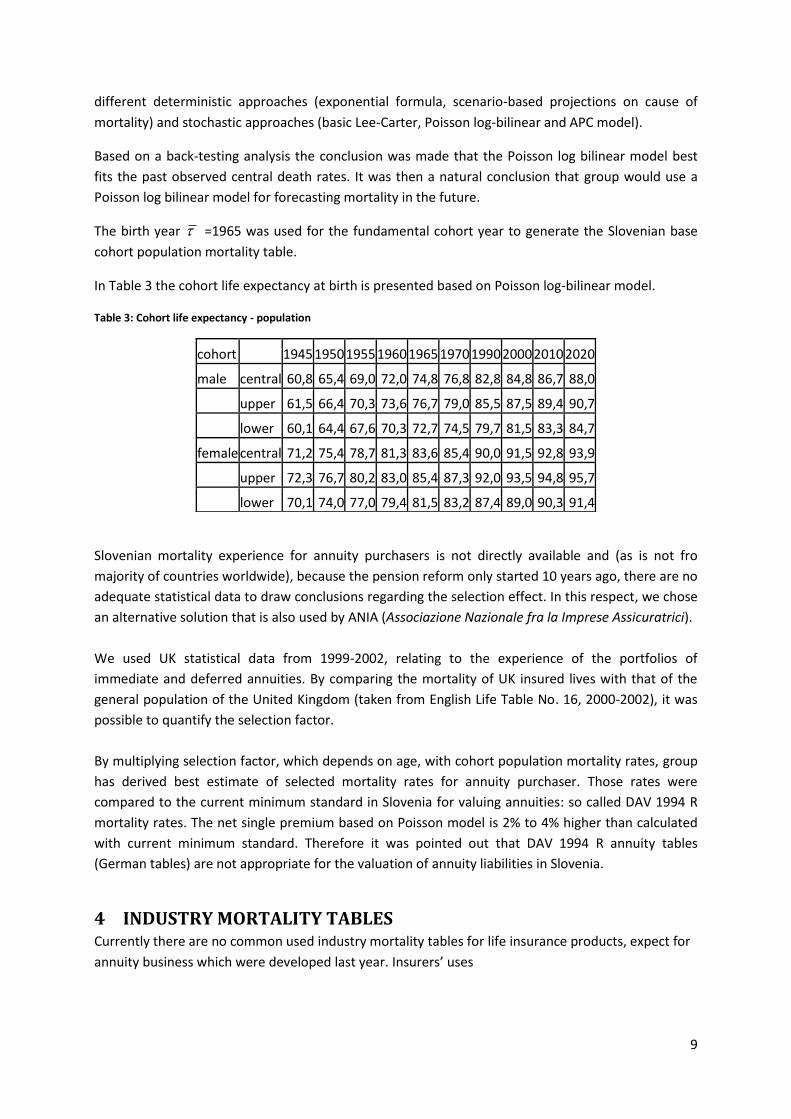
In Table 3 the cohort life expectancy at birth is presented based on Poisson log-bilinear model.
Table 3: Cohort life expectancy - population
Slovenian mortality experience for annuity purchasers is not directly available and (as is not fro
majority of countries worldwide), because the pension reform only started 10 years ago, there are no
adequate statistical data to draw conclusions regarding the selection effect. In this respect, we chose
an alternative solution that is also used by ANIA (Associazione Nazionale fra la Imprese Assicuratrici).
We used UK statistical data from 1999-2002, relating to the experience of the portfolios of
immediate and deferred annuities. By comparing the mortality of UK insured lives with that of the
general population of the United Kingdom (taken from English Life Table No. 16, 2000-2002), it was
possible to quantify the selection factor.
By multiplying selection factor, which depends on age, with cohort population mortality rates, group
has derived best estimate of selected mortality rates for annuity purchaser. Those rates were
compared to the current minimum standard in Slovenia for valuing annuities: so called DAV 1994 R
mortality rates. The net single premium based on Poisson model is 2% to 4% higher than calculated
with current minimum standard. Therefore it was pointed out that DAV 1994 R annuity tables
(German tables) are not appropriate for the valuation of annuity liabilities in Slovenia.
4 INDUSTRY MORTALITY TABLES Currently there are no common used industry mortality tables for life insurance products, expect for
annuity business which were developed last year. Insurers’ uses
cohort
1945 1950 1955 1960 1965 1970 1990 2000 2010 2020
male central 60,8 65,4 69,0 72,0 74,8 76,8 82,8 84,8 86,7 88,0
upper 61,5 66,4 70,3 73,6 76,7 79,0 85,5 87,5 89,4 90,7
lower 60,1 64,4 67,6 70,3 72,7 74,5 79,7 81,5 83,3 84,7
female central 71,2 75,4 78,7 81,3 83,6 85,4 90,0 91,5 92,8 93,9
upper 72,3 76,7 80,2 83,0 85,4 87,3 92,0 93,5 94,8 95,7
lower 70,1 74,0 77,0 79,4 81,5 83,2 87,4 89,0 90,3 91,4
10
i) own (portfolio) mortality statistics to develop product mortality tables (this is clearly possible only
for large portfolios);
ii) reinsurance mortality tables.
Average mortality rate for typical term product is around 60% - 80% of population mortality rates.
Preferred rates are not offered yet on the market.
5 UNISEX MORTALITY TABLES The European Court of Justice (ECJ) passed a new regulation on 1 March 2011 which bans gender-
specific differentiation in insurance pricing. The ECJ ruling means that gender-neutral premiums and
benefits for all new insurance policies taken out after 21 December 2012 should be implemented.
This decision will bring important changes to the development of new insurance products in all EU
markets, especially in the life line of business. In this respect, the unisex rates will introduce new risks
of uncertainties arising from the gender mix of the portfolio.
May 1, 2012 Page 1 of 2
IAA Mortality Working Group – Country report for South Africa May 2012
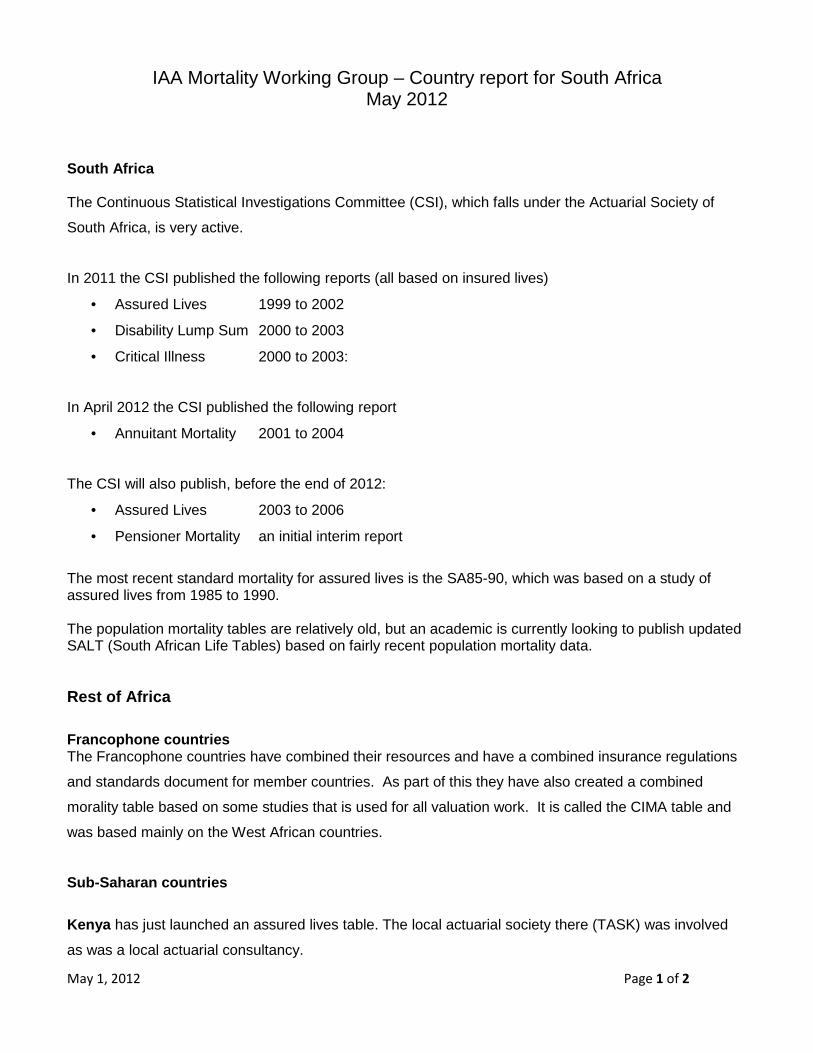
South Africa The Continuous Statistical Investigations Committee (CSI), which falls under the Actuarial Society of
South Africa, is very active.
In 2011 the CSI published the following reports (all based on insured lives)
• Assured Lives 1999 to 2002
• Disability Lump Sum 2000 to 2003
• Critical Illness 2000 to 2003:
In April 2012 the CSI published the following report
• Annuitant Mortality 2001 to 2004
The CSI will also publish, before the end of 2012:
• Assured Lives 2003 to 2006
• Pensioner Mortality an initial interim report
The most recent standard mortality for assured lives is the SA85-90, which was based on a study of assured lives from 1985 to 1990. The population mortality tables are relatively old, but an academic is currently looking to publish updated SALT (South African Life Tables) based on fairly recent population mortality data. Rest of Africa
Francophone countries The Francophone countries have combined their resources and have a combined insurance regulations
and standards document for member countries. As part of this they have also created a combined
morality table based on some studies that is used for all valuation work. It is called the CIMA table and
was based mainly on the West African countries.
Sub-Saharan countries
Kenya has just launched an assured lives table. The local actuarial society there (TASK) was involved
as was a local actuarial consultancy.

May 1, 2012 Page 2 of 2
Ghana recently tried to do an industry assured lives investigation sponsored by the IFC. There were
difficulties getting credible data.
Mauritius is starting a process to see if they can develop standard tables
Nigeria, Zambia, Lesotho, Swaziland, Malawi, Botswana, Namibia, Zimbabwe, Mauritius, Tanzania –
have no standard tables and tend to use SA or UK tables.
Some of the insurers in these countries may have done their own studies. Most countries have limited
actuarial resources so rely on consultants or reinsurers.
a
1
Internal Memo 9 May 2012
To Click here to enter recipient(s).
From Philippe C. Maeder
Cc Click here to enter Cc(s).
Subject Switzerland Mortality Report for the IAA
1 Available data Mortality data are accessible from various sources:
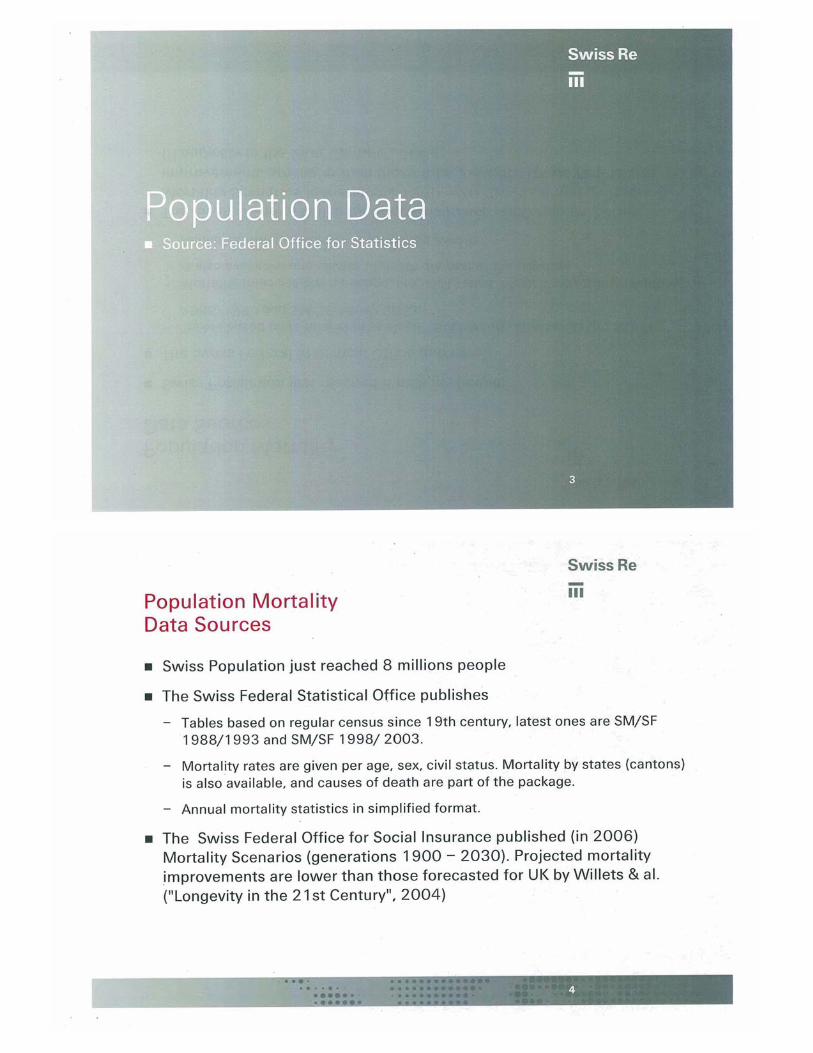
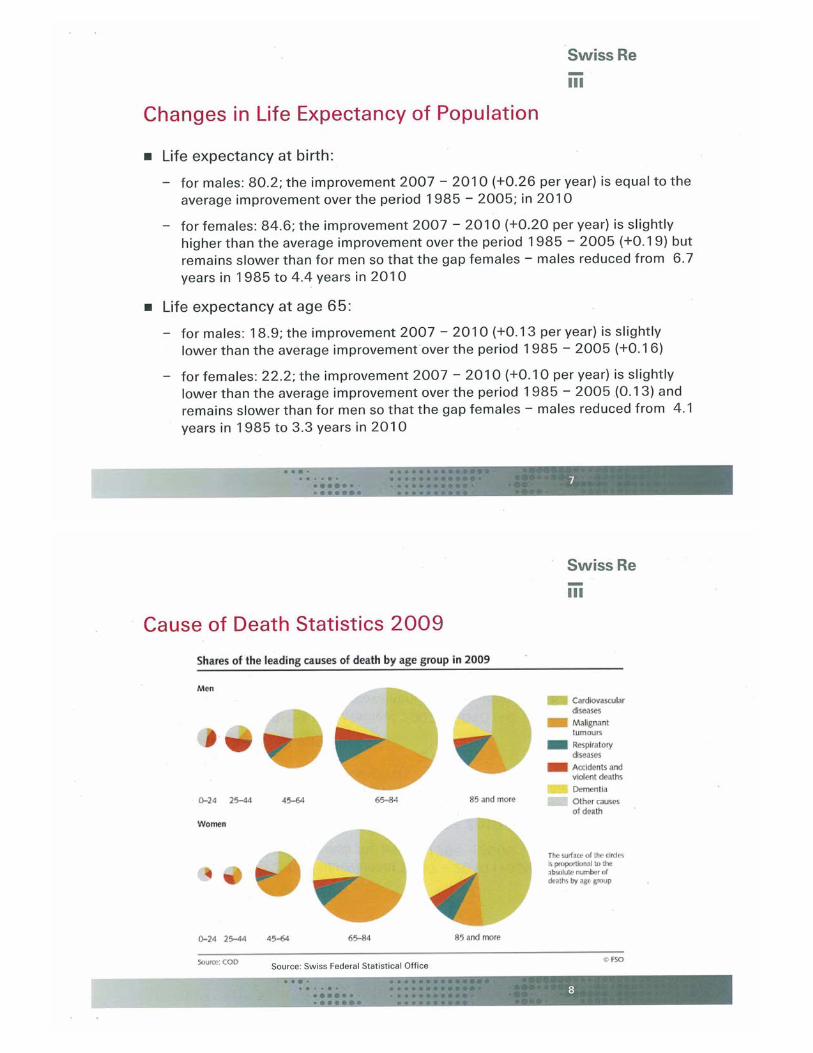
• For population, the Swiss Federal Statistical Office gives indications up to 2010. http://www.bfs.admin.ch/bfs/portal/de/index/themen/01/06/blank/key/04.html Detailed tables and studies are available in French and German.
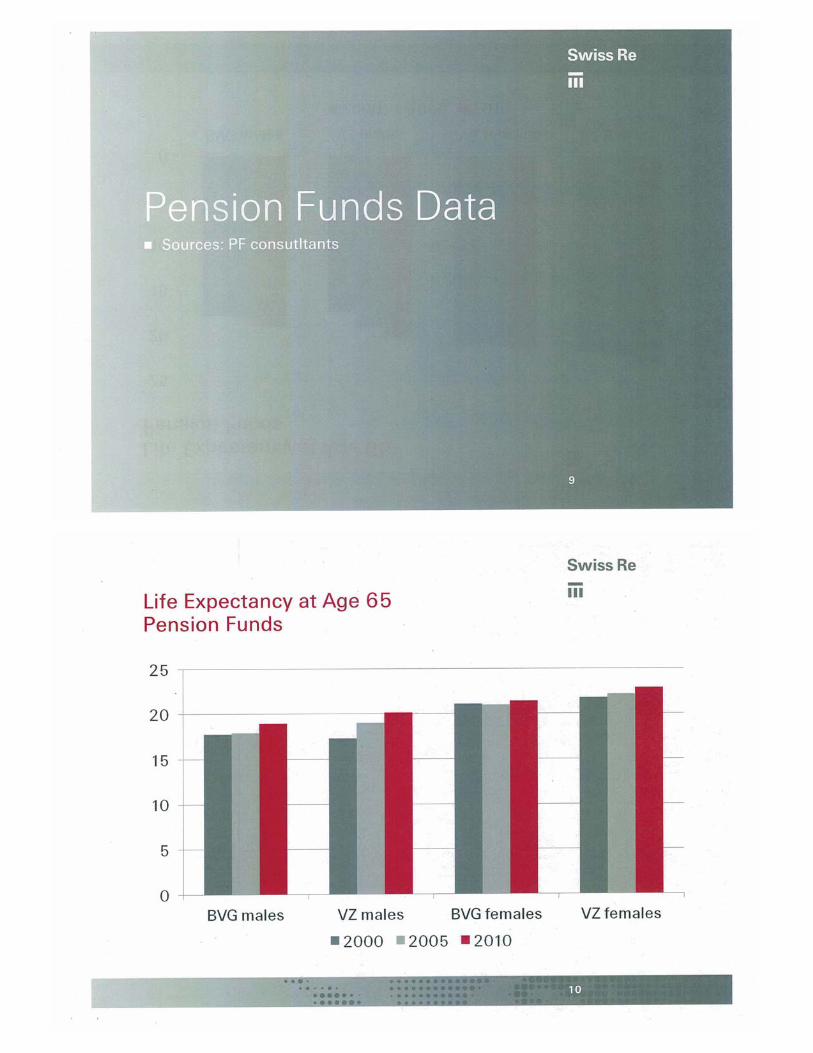
• For pension funds, latest tables were published in 2010: BVG 2010 , from fourteen large autonomous pension funds, computed by Aon Hewitt and LCP Libera. It relies on a total exposure (risks / years) of 1.208 million actives and 0.777 million retired people over the period 2005 – 2009. reference: http://www.aon.com/switzerland/attachments/Bibliothek_Hewitt/Aon%20Hewitt%20News_special%20edition_December%202010.pdf
• Pension VZ 2010 tables are based on statistics over 21 public pension funds (cantons and cities. First table (1960) was covering only the city of Zurich. Tables were computed by the Actuarial consultant Olivier Deprez. http://www.deprez.ch/ amd www.pkzh.ch They include mortality improvements according to the original Nofli model (exponential decrease of mortality) as well as the official demographic projection of the Swiss Federal Office for Social Insurance.
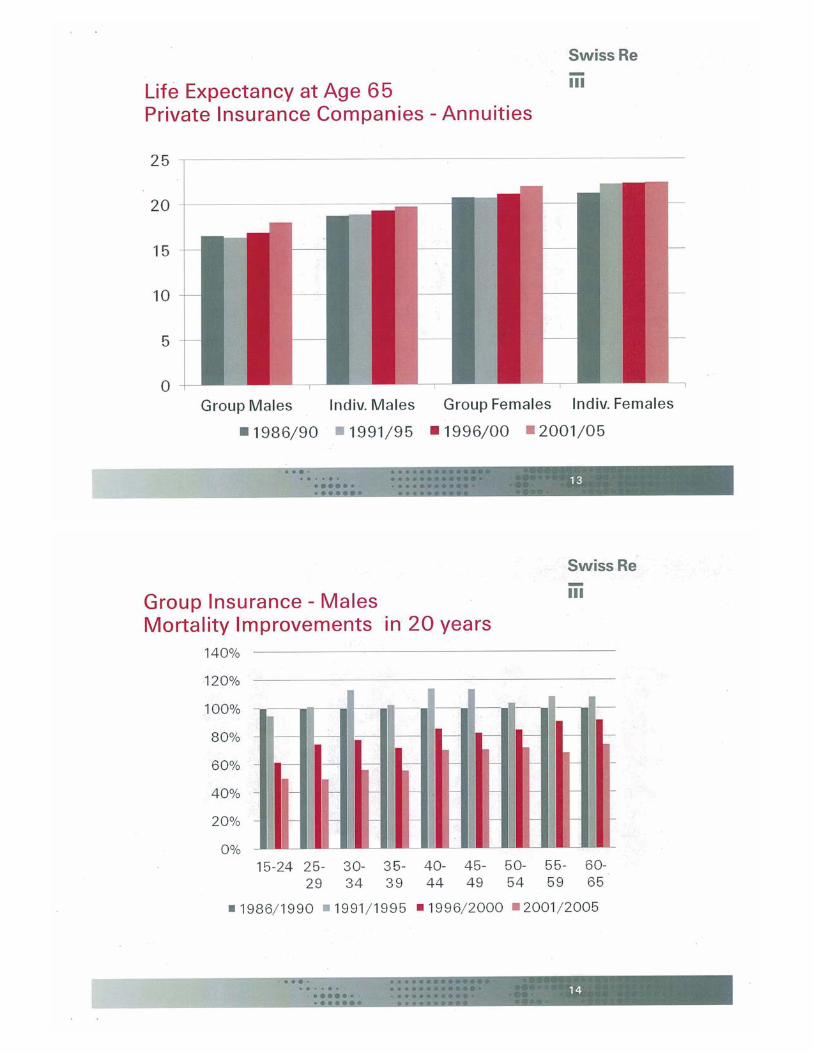
• Swiss Insurance Association: Members of the association (16 companies) group data and set up 5 year observation statistics – the first such report was produced for the period 1961/1965 - separately for individual insurance, individual annuities, group insurance and group annuities. This work is performed by a Statistics Working Group1 comparable to the British CMI Committee. Besides disability statistics, they compute one comprehensive report about mortality in individual insurance (life insurance and annuities) as well as group business (insurance and annuities, including widow(er) pensions, and in-between yearly simplified reports indicating trends from year to year. The latest reports are relative to the period 201/2005, the 2006/2010 report will be set up later this year. Those data are available free of charge to participant companies. They can be bought by outsiders, but they are not published. No “official” or reference tables of first order may be
1 Headed by Philippe Maeder, Swiss Re
a
2
set up, they are considered by the Competition Committee2 as an indirect limitation as illegal.
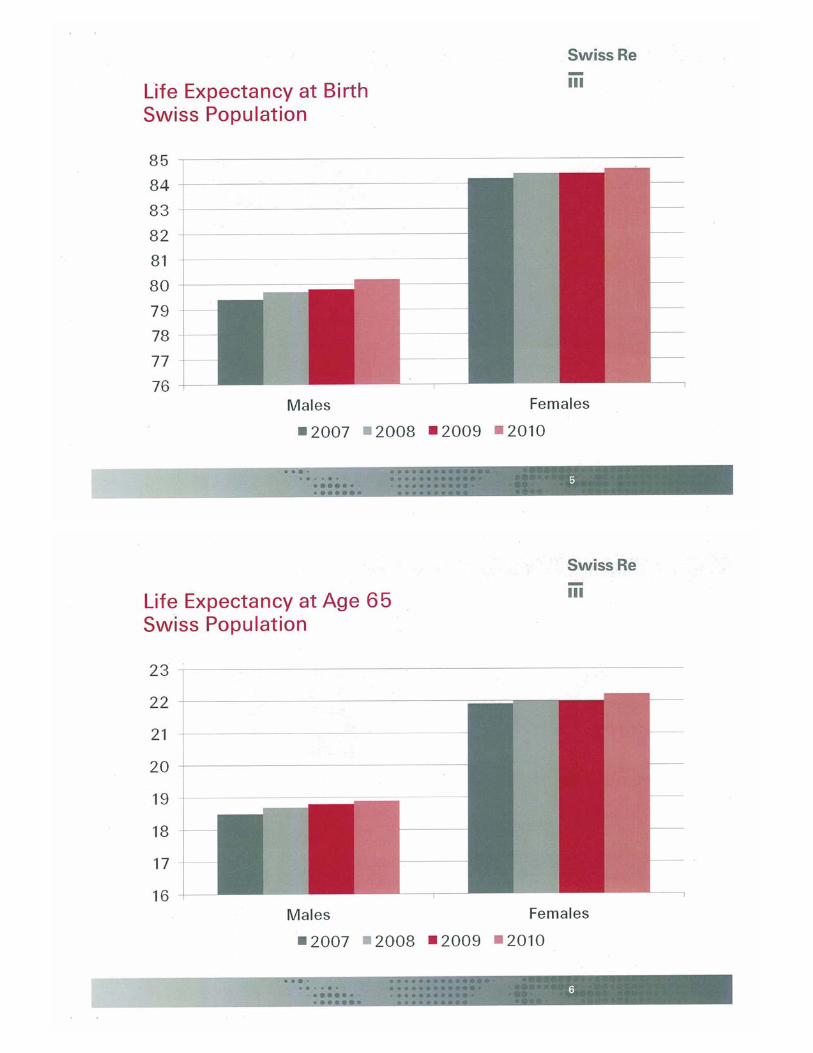
2 Mortality Trends and Differences For annuities, it can be observed that life expectancy, after a slower increase in the first half of the nineties, resumed growing again faster at the beginning of the 21st century. Due to generations effects, improvements are not identical for all age groups at a given time.
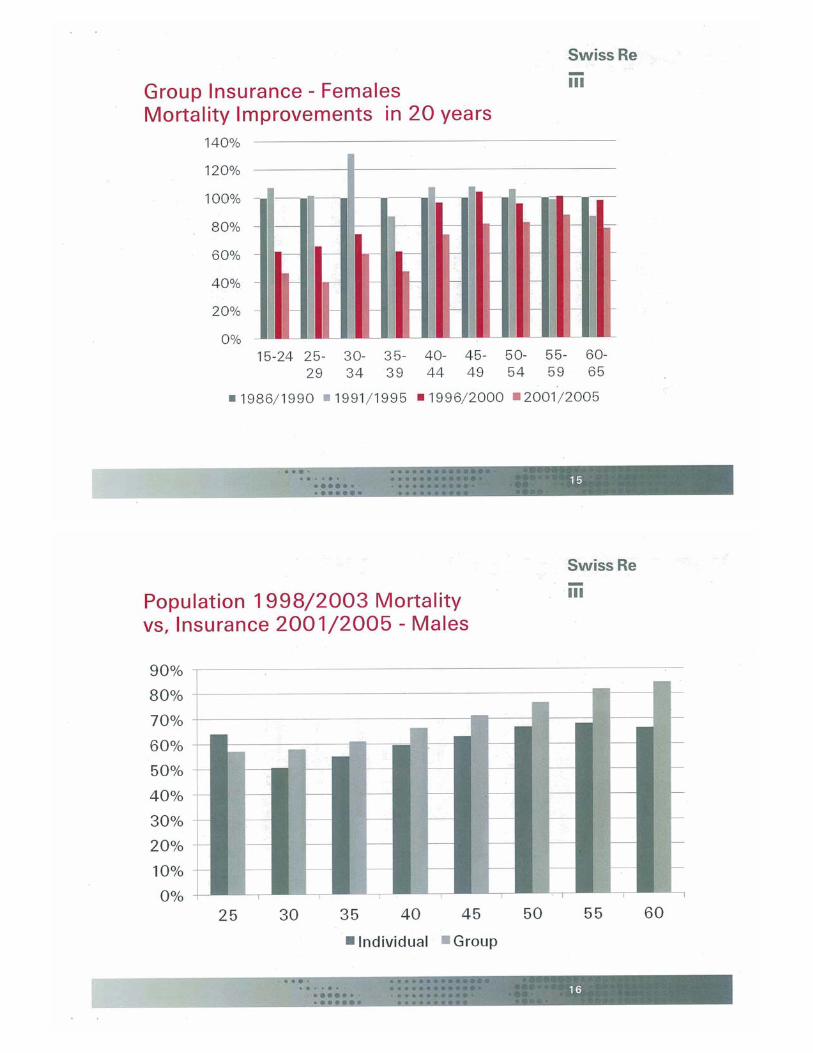
For group insurance, a fast improvement – mainly due to a reduction in accidental mortality – can be observed for younger ages. There is a slowdown of the improvement between 1996/2000 and 2001/2005 if we compare to the previous period. The annual trend reports confirm a continuation of this trend towards 2010. Young Females tend to have even faster improvement than Males, and it’s contrary above age 45.
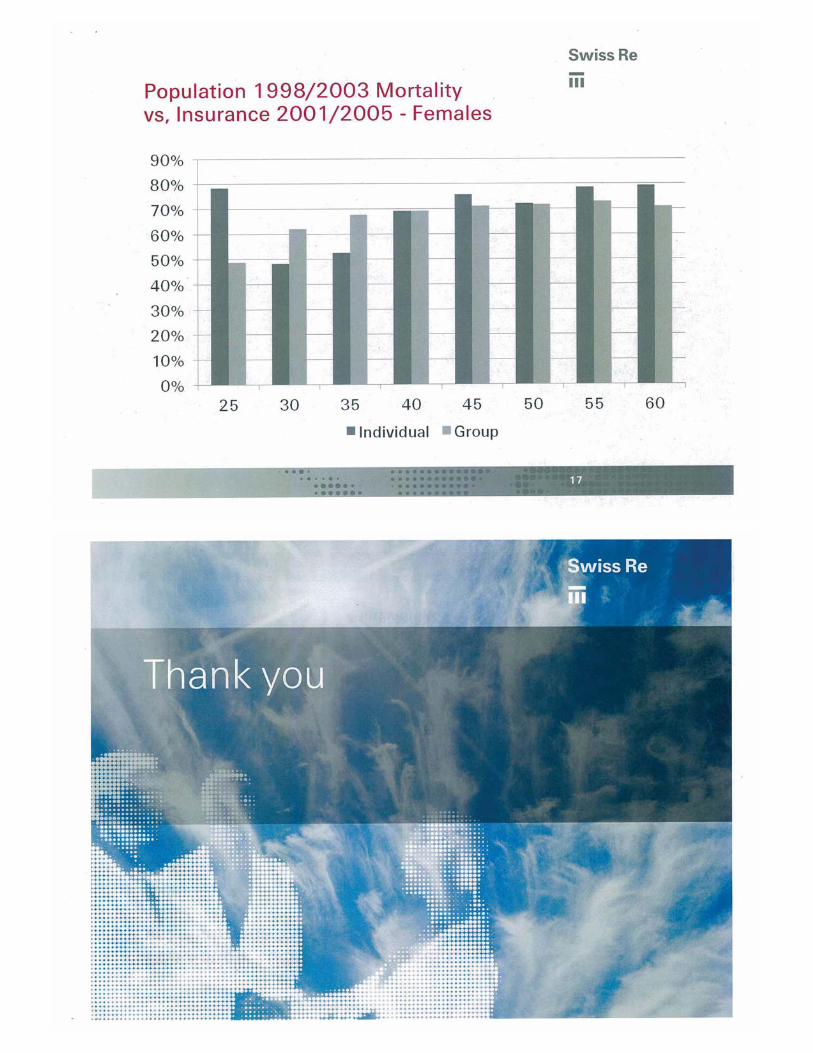
The comparison of mortality of population 1998 / 2003 and insurance 2001 / 2005 is of course a bit biased by the difference of 2-3 years between those two sets of statistics. However it shows – as expected – that insurance mortality is clearly lower, and it is also intuitive that individual insurance mortality is, for males, lower than group insurance mortality. But for females, there is barely any difference, which can be explained that amounts insured to females are in general lower than for males, hence the selection process is lighter.
2 http://www.weko.admin.ch/index.html?lang=en

IAA Mortality Committee – Chinese Taipei (May 2012) New Industry Mortality Table
A new mortality table TSO (Taiwan Standard Ordinary) 2011 was announced in 2011 and the industry will be required reserve based on 100% of this table for new business written starting July 1, 2012. Although not technically required to do so, it is standard industry practice to price premium rates based on the prevailing industry table.
TSO 2011 is the fifth industry table and will replace its predecessor TSO 2002 which has been in use since 2003. Like all its predecessors, TSO 2011 is an ultimate only table and rates are not differentiated by smoking status.
The regulators called for the construction of a new table as TSO 2002 has been in use for almost 10 years and industry experience has been favorable relative to TSO 2002. For example, published 2008 industry mortality experience indicated that ultimate experience (durations 16 and over) is around 60% of TSO 2002. Industry experience has also been consistently improving.
The following steps were involved in deriving TSO 2011:
• Industry experience from 2004 to 2008, with around 145,000 male claims and 74,000 female claims, serves as the main basis.
• Rates for ages 0 to 59 were based on smoothed data from the industry experience. • Rates for ages 60 to 92 is a function of smoothed industry data and Gompertz forecasts. • Rates above 92 are based on Gompertz forecasts as there was little industry experience. • Several smoothing techniques were tested with Kernel the final choice. • Margins were not disclosed.
TSO 2011 mortality rates have the following relativities to TSO 2002:
Age 5 15 25 35 45 55 65 75 85 95 105 Male 42% 46% 63% 81% 84% 79% 74% 73% 69% 72% 86% Female 49% 53% 70% 65% 66% 68% 67% 76% 80% 91% 118%
As mortality rates for TSO 2011 have generally decreased significantly from TSO 2002, the next project is to revise 2007 smoker distinct reserve tables which are based on TSO 2002.
Unofficial estimates of life expectancies of newborns under TSO 2011 are around 77 males / 83 females versus 73 males / 80 females using TSO 2002.
New Industry Annuity Table
Concurrently with TSO 2011, a new Second Industry Annuity Table was also approved by regulators as the industry standard starting July 1, 2012.
This did not cause much of a stir in the industry as few annuity policies are expected to be annuitized (as opposed to lump sum withdrawal).
For reference, mortality rates of the Second Annuity Table have the following relativities to TSO 2011:
Age 5 15 25 35 45 55 65 75 85 95 105 Male 58% 58% 64% 57% 63% 60% 51% 46% 40% 35% 30% Female 57% 56% 62% 63% 61% 59% 55% 44% 38% 31% 25%