ia saham amanah sabahpengurus dana luaran affin hwang asset management erhad kategori dana/ jenis...
TRANSCRIPT
Manager Saham Sabah Berhad Trustee Maybank Trustees Berhad External Fund Manager Affin Hwang Asset Management Berhad Fund Category / Type Equity Fund / Income and Growth Fund Launch Date 10 October 1994 Unit NAV as at 31 December 2019 0.3326 Unit in Circulation 1,231,974,000 Financial Year End 31 December Minimum Initial Investment 1,000 Units Minimum Additional Investment No Limit Benchmark 50% FBMT100 + 50% MXASJ Sales Charge 3.5% on NAV per Unit Redemption Charge None Annual Management Fee 1.5% Annual Trustee Fee 0.045% Transfer Fee RM 3.00 Asset Allocation Maximum 98% in equities Minimum 2% in cash Distribution Policy Payment of distribution is subject to the availability of income. The fund will declare distribution depending on the income available for distribution for the relevant period.
(303418-V)
Objective To produce a reasonable rate of return for Unit Holders over the medium to long term (3 years and above) without exposing their investment to undue risk through various types of investment.
Investor Profile Open to Sabahan individuals, companies and institutions. It is suitable for investors who prefer a medium to long term investment and want to achieve an adequate level of income and capital gain at an acceptable level of risk.
Historical NAV
Income Distribution History Performance Table
Based on the Fund’s portfolio returns as at 31 December 2019, the Volatility Factor (VF) for this Fund is 7.98 and is classified as Moderate. “Moderate” includes Funds with VF that are above 6.455 but not more than 8.845 (Source: Lipper)
Suite 1-9-W2, W3 & W4, 9th Floor, CPS Tower, Centre Point Sabah, No.1, Jalan Centre Point, 88000 Kota Kinabalu
Tel: 088-254967 /254968 Fax: 088-262588 Mobile No: 012-3677712
Investors are advised to read and understand the contents of the prevailing Saham Amanah Sabah’s Prospectus dated 18th November 2016 which has been registered with Securities Commission Malaysia and can be obtained at Saham Sabah Berhad’s office
before investing. Investors should consider fees and charges involved. Unit prices and income distributions (if any) may go down as well as up. Past performance of the fund is not guaranteed or an indication of future performance. Investors should rely on their own
evaluation to assess the merits and risks of the investment. If investors are unable to make their own evaluation, they are advised to consult professional advisers.
Saham Amanah Sabah Fund Fact Sheet
31 December 2019
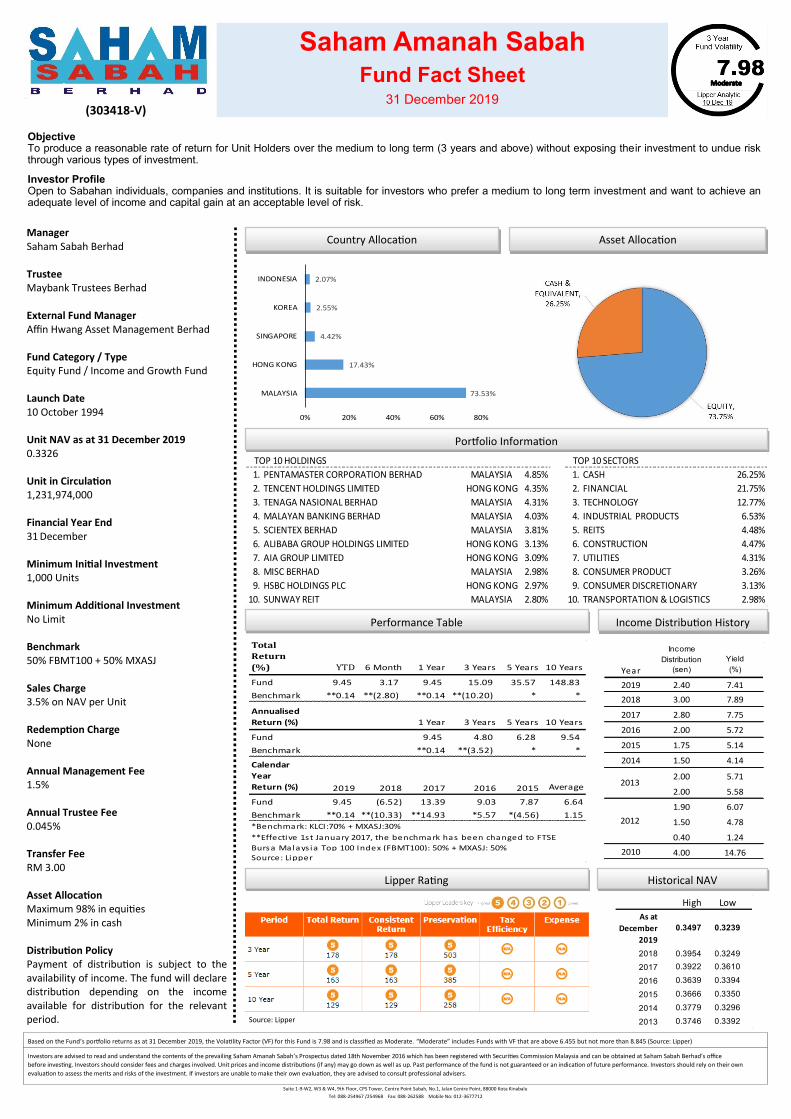
Asset Allocation Country Allocation
Portfolio Information
Lipper Rating
Source: Lipper
Year
Income
Distribution
(sen)
Yield
(%)
2019 2.40 7.41
2018 3.00 7.89
2017 2.80 7.75
2016 2.00 5.72
2015 1.75 5.14
2014 1.50 4.14
2.00 5.71
2.00 5.58
1.90 6.07
1.50 4.78
0.40 1.24
2010 4.00 14.76
2012
2013
1. PENTAMASTER CORPORATION BERHAD MALAYSIA 4.85% 1. CASH 26.25%
2. TENCENT HOLDINGS LIMITED HONG KONG 4.35% 2. FINANCIAL 21.75%
3. TENAGA NASIONAL BERHAD MALAYSIA 4.31% 3. TECHNOLOGY 12.77%
4. MALAYAN BANKING BERHAD MALAYSIA 4.03% 4. INDUSTRIAL PRODUCTS 6.53%
5. SCIENTEX BERHAD MALAYSIA 3.81% 5. REITS 4.48%
6. ALIBABA GROUP HOLDINGS LIMITED HONG KONG 3.13% 6. CONSTRUCTION 4.47%
7. AIA GROUP LIMITED HONG KONG 3.09% 7. UTILITIES 4.31%
8. MISC BERHAD MALAYSIA 2.98% 8. CONSUMER PRODUCT 3.26%
9. HSBC HOLDINGS PLC HONG KONG 2.97% 9. CONSUMER DISCRETIONARY 3.13%
10. SUNWAY REIT MALAYSIA 2.80% 10. TRANSPORTATION & LOGISTICS 2.98%
TOP 10 HOLDINGS TOP 10 SECTORS
73.53%
17.43%
4.42%
2.55%
2.07%
0% 20% 40% 60% 80%
MALAYSIA
HONG KONG
SINGAPORE
KOREA
INDONESIA
High Low
As at
December
2019
0.3497 0.3239
2018 0.3954 0.3249
2017 0.3922 0.3610
2016 0.3639 0.3394
2015 0.3666 0.3350
2014 0.3779 0.3296
2013 0.3746 0.3392
Total
Return
(%) YTD 6 Month 1 Year 3 Years 5 Years 10 Years
Fund 9.45 3.17 9.45 15.09 35.57 148.83
Benchmark **0.14 **(2.80) **0.14 **(10.20) * *
Annualised
Return (%) 1 Year 3 Years 5 Years 10 Years
Fund 9.45 4.80 6.28 9.54
Benchmark **0.14 **(3.52) * *
Calendar
Year
Return (%) 2019 2018 2017 2016 2015 Average
Fund 9.45 (6.52) 13.39 9.03 7.87 6.64
Benchmark **0.14 **(10.33) **14.93 *5.57 *(4.56) 1.15
**Effective 1st January 2017, the benchmark has been changed to FTSE
Bursa Malays ia Top 100 Index (FBMT100): 50% + MXASJ: 50%
*Benchmark: KLCI:70% + MXASJ:30%
Source: Lipper
Pengurus Saham Sabah Berhad
Pemegang Amanah Maybank Trustees Berhad
Pengurus Dana Luaran Affin Hwang Asset Management Berhad
Kategori Dana/ Jenis Dana Ekuiti/ Dana Pendapatan dan Pertumbuhan
Tarikh Pelancaran 10 Oktober 1994
NAB Unit pada 31 Disember 2019 0.3326
Unit dalam Edaran 1,231,974,000
Tahun Kewangan Berakhir 31 Disember
Pelaburan Permulaan Minimum 1,000 Unit
Pelaburan Tambahan Minimum Tiada had
Tanda Aras 50% FBMT100 + 50% MXASJ
Caj Jualan 3.5% pada NAB setiap Unit
Caj Belian Balik Tiada
Fi Pengurusan Tahunan 1.5%
Fi Pemegang Amanah Tahunan 0.045%
Fi Pindah Milk RM 3.00
Peruntukan Aset Maksimum 98% dalam ekuiti Minimum 2% dalam tunai
Polisi Pengagihan Pembayaran pengagihan adalah tertakluk kepada kesedia adaan pendapatan. Pengurus akan mengisytiharkan pengagihan bergantung kepada pendapatan yang sedia ada untuk diagihkan pada tempoh yang berkaitan.
(303418-V)
Nota: Lembaran ini telah diterjemah daripada lembaran asal (dalam Bahasa Inggeris) sebagai rujukan sahaja. Sekiranya terdapat perbezaan daripada lembaran asal, lembaran asal akan diguna pakai.
Objektif Untuk menghasilkan pulangan yang berpatutan kepada pemegang unit dalam jangka masa sederhana hingga panjang (3 tahun ke atas) tanpa mendedahkan pelaburan mereka kepada risiko yang tidak wajar melalui pelbagai jenis pelaburan.
Profil Pelabur Terbuka kepada rakyat Sabah serta institusi dan syarikat milik penuh rakyat Sabah. Ia sesuai untuk pelabur yang memilih pelaburan jangka masa sederhana hingga panjang dan ingin mencapai tahap pendapatan dan keuntungan modal yang mencukupi pada tahap risiko yang boleh diterima.
Sejarah NAB
Pengagihan Pendapatan Lalu Jadual Prestasi
Berdasarkan pulangan portfolio Dana pada 31 Disember 2019, Faktor Volatiliti (VF) untuk Dana ini adalah 7.98 dan diklasifikasikan sebagai Sederhana. "Sederhana" termasuk Dana dengan VF yang melebihi 6.455 tetapi tidak lebih daripada 8.845 (Sumber: Lipper)
Suite 1-9-W2, W3 & W4, 9th Floor, CPS Tower, Centre Point Sabah, No.1, Jalan Centre Point, 88000 Kota Kinabalu
Tel: 088-254967 /254968 Fax: 088-262588 Mobile No: 012-3677712
Pelabur dinasihatkan untuk membaca dan memahami kandungan Prospektus Saham Amanah Sabah yang bertarikh 18 November 2016 yang telah didaftarkan dengan Suruhanjaya Sekuriti Malaysia dan boleh diperolehi di pejabat Saham Sabah Berhad sebelum melabur.
Pelabur perlu mempertimbangkan yuran dan caj yang terlibat. Harga seunit dan pengagihan pendapatan (jika ada) boleh turun dan naik. Prestasi masa lalu dana tidak menjamin atau menunjukkan prestasi masa hadapan. Pelabur harus bergantung kepada penilainan
mereka sendiri untuk menilai merit dan risiko pelaburan. Jika pelabur tidak dapat membuat penilaian sendiri, mereka dinasihatkan untuk berunding dengan penasihat pelaburan profesional.
Saham Amanah Sabah Lembaran Fakta Dana
31 Disember 2019
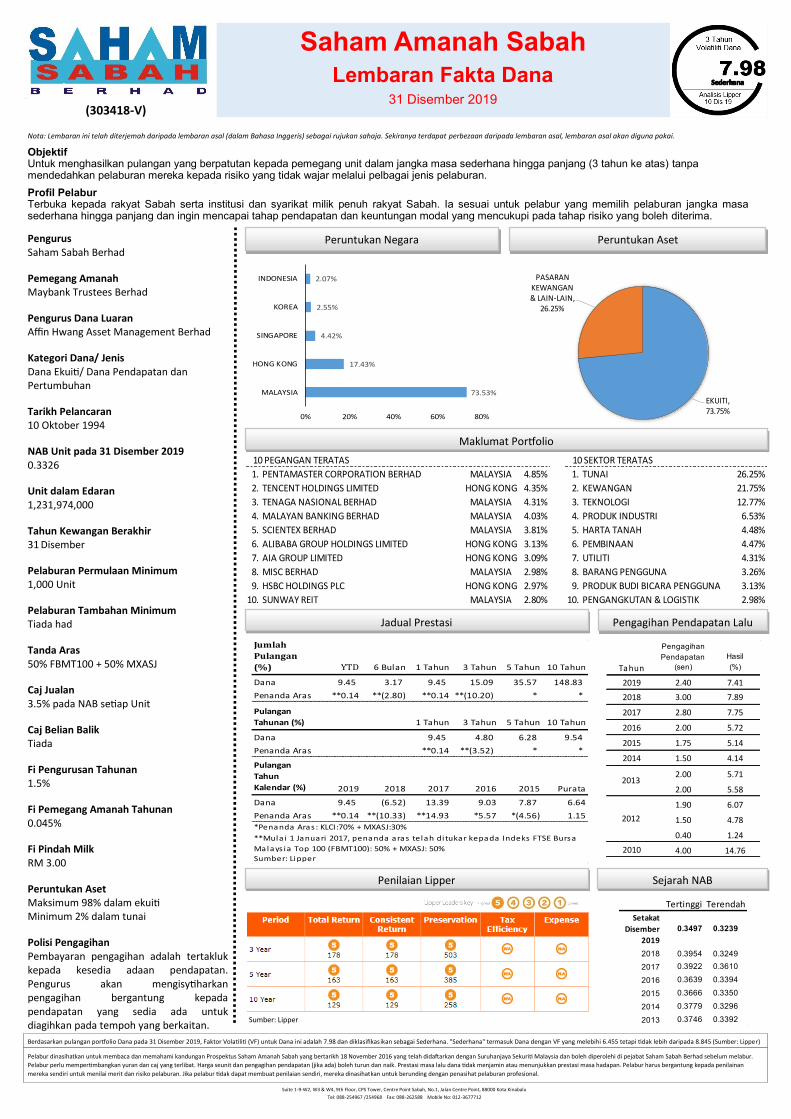
Peruntukan Aset Peruntukan Negara
Maklumat Portfolio
Penilaian Lipper
Sumber: Lipper
Tahun
Pengagihan
Pendapatan
(sen)
Hasil
(%)
2019 2.40 7.41
2018 3.00 7.89
2017 2.80 7.75
2016 2.00 5.72
2015 1.75 5.14
2014 1.50 4.14
2.00 5.71
2.00 5.58
1.90 6.07
1.50 4.78
0.40 1.24
2010 4.00 14.76
2013
2012
EKUITI, 73.75%
PASARAN KEWANGAN & LAIN-LAIN,
26.25%
1. PENTAMASTER CORPORATION BERHAD MALAYSIA 4.85% 1. TUNAI 26.25%
2. TENCENT HOLDINGS LIMITED HONG KONG 4.35% 2. KEWANGAN 21.75%
3. TENAGA NASIONAL BERHAD MALAYSIA 4.31% 3. TEKNOLOGI 12.77%
4. MALAYAN BANKING BERHAD MALAYSIA 4.03% 4. PRODUK INDUSTRI 6.53%
5. SCIENTEX BERHAD MALAYSIA 3.81% 5. HARTA TANAH 4.48%
6. ALIBABA GROUP HOLDINGS LIMITED HONG KONG 3.13% 6. PEMBINAAN 4.47%
7. AIA GROUP LIMITED HONG KONG 3.09% 7. UTILITI 4.31%
8. MISC BERHAD MALAYSIA 2.98% 8. BARANG PENGGUNA 3.26%
9. HSBC HOLDINGS PLC HONG KONG 2.97% 9. PRODUK BUDI BICARA PENGGUNA 3.13%
10. SUNWAY REIT MALAYSIA 2.80% 10. PENGANGKUTAN & LOGISTIK 2.98%
10 PEGANGAN TERATAS 10 SEKTOR TERATAS
73.53%
17.43%
4.42%
2.55%
2.07%
0% 20% 40% 60% 80%
MALAYSIA
HONG KONG
SINGAPORE
KOREA
INDONESIA
Tertinggi Terendah
Setakat
Disember
2019
0.3497 0.3239
2018 0.3954 0.3249
2017 0.3922 0.3610
2016 0.3639 0.3394
2015 0.3666 0.3350
2014 0.3779 0.3296
2013 0.3746 0.3392
Jumlah
Pulangan
(%) YTD 6 Bulan 1 Tahun 3 Tahun 5 Tahun 10 Tahun
Dana 9.45 3.17 9.45 15.09 35.57 148.83
Penanda Aras **0.14 **(2.80) **0.14 **(10.20) * *
Pulangan
Tahunan (%) 1 Tahun 3 Tahun 5 Tahun 10 Tahun
Dana 9.45 4.80 6.28 9.54
Penanda Aras **0.14 **(3.52) * *
Pulangan
Tahun
Kalendar (%) 2019 2018 2017 2016 2015 Purata
Dana 9.45 (6.52) 13.39 9.03 7.87 6.64
Penanda Aras **0.14 **(10.33) **14.93 *5.57 *(4.56) 1.15
*Penanda Aras : KLCI:70% + MXASJ:30%
**Mula i 1 Januari 2017, penanda aras telah di tukar kepada Indeks FTSE Bursa
Malays ia Top 100 (FBMT100): 50% + MXASJ: 50%
Sumber: Lipper