i6 - final kawa i&m plan revjun015.pdf
TRANSCRIPT
Appendix I6: Implementation and Monitoring Plan for Kawa
Stream, 2015

IMPLEMENTATION AND MONITORING PLAN FOR KAWA STREAM WASTELOAD ALLOCATION
FOR THE CITY AND COUNTY OF HONOLULU
MUNICIPAL SEPARATE STORM SEWER SYSTEM NPDES PERMIT NO. HI S000002
June 2015
Prepared by City and County of Honolulu
Department of Environmental Services Kapolei, Hawaii

I&M Plan for Kawa Stream WLA
i June 2015
Transmittal Letter
I&M Plan for Kawa Stream WLA
ii June 2015
I&M Plan for Kawa Stream WLA
iii June 2015
Table of Contents
Transmittal Letter .................................................................................................................................. i Table of Contents ................................................................................................................................. iii List of Tables ........................................................................................................................................ iv List of Figures ....................................................................................................................................... iv
List of Appendices ................................................................................................................................ iv Acronyms ............................................................................................................................................... v
Executive Summary............................................................................................................................. vii 1.0 Introduction .............................................................................................................................. 1 2.0 Kawa Stream Watershed .......................................................................................................... 3
3.0 TMDLs and WLAs for Kawa Stream Watershed ................................................................... 7 3.1 Adjustment for Margin of Safety .................................................................................... 7 3.2 CCH Annual WLA, Existing Loads, and Reduction Goals .............................................. 7 3.3 Quantification of TSS Load Reduction ........................................................................... 8 3.4 DOH Priority Action ...................................................................................................... 8
4.0 Proposed Best Management Practice Implementation and Monitoring Plan ......................... 9 4.1 Community Involvement and Outreach/Education .......................................................... 9
4.1.1 DOH Recommendation for Public Education and Outreach ................................ 9 4.1.2 Downspout Disconnection ................................................................................. 10 4.1.3 Community Involvement / Volunteer Cleanups .................................................. 11
4.2 Pollution Prevention and Good Housekeeping .............................................................. 12 4.2.1 Street Sweeping................................................................................................. 12 4.2.2 Maintenance of Storm Drainage System ............................................................ 16
4.3 Water Quality Improvement Projects ............................................................................ 16 4.3.1 Kawa Stream Bank Improvements ..................................................................... 16
4.4 DOH-IMP Recommendations ....................................................................................... 17 4.4.1 Tools for reducing nutrients and sediments in watershed runoff......................... 17 4.4.2 Tools for establishing vegetated buffers adjacent to stream ............................... 18 4.4.3 Tools for stabilizing the stream channel and improving the stream’s ability to move water, filter pollutants, and support aquatic life ................................................... 18
4.5 Permanent BMP ........................................................................................................... 18 4.6 Summary of BMP Activities ......................................................................................... 18 4.7 Summary of Activities to be Tracked ............................................................................ 19
5.0 Compliance Schedule .............................................................................................................. 21
6.0 References ............................................................................................................................... 23

I&M Plan for Kawa Stream WLA
iv June 2015
List of Tables
Table ES-1: Annual CCH WLA and Load Reduction Summary ............................................................. vii
Table ES-2: Summary of BMP Activities and Quantitative Reductions ................................................. viii
Table 1: Land Use within the Kawa Sub-basins1 ...................................................................................... 4
Table 2: Annual ENV (MS4) WLA and Load Reduction Summary .......................................................... 7
Table 3: Annual DPR (Small MS4) WLA and Load Reduction Summary ................................................ 8
Table 4: Downspout Disconnection Anticipated Load Reduction ........................................................... 11
Table 5: Summary of Street Sweeping Baseline Data Collection ............................................................ 12
Table 6: Summary of Street Sweeping Load Reduction Computations ................................................... 15
Table 7: Summary of BMP Activities and Quantitative Reductions ........................................................ 19
Table 8: Schedule of Compliance .......................................................................................................... 21
List of Figures
Figure 1: Kawa Stream Watershed ........................................................................................................... 3
Figure 2: Kawa Stream Sub-basins .......................................................................................................... 4
Figure 3: Land Use within Kawa Stream Watershed ................................................................................ 5
Figure 4: Typical Example of Connected Downspout............................................................................. 10
Figure 5: Typical Example of Disconnected Downspout Draining to Impervious Surfaces ..................... 10
Figure 6: Kawa Stream Bank Improvements Planning Study Project Limits ........................................... 17
List of Appendices
Appendix A – Downspout Disconnection Field Survey
I&M Plan for Kawa Stream WLA
v June 2015
Acronyms
BMP Best Management Practice
City/CCH City and County of Honolulu
CY Calendar Year
DDC City and County of Honolulu, Department of Design and Construction
DFM City and County of Honolulu, Department of Facility Maintenance
DOH State of Hawaii, Department of Health
DOH-CWB State of Hawaii, Department of Health, Clean Water Branch
DOH-EPO State of Hawaii, Department of Health, Environmental Planning Office
DOH-IMP State of Hawaii, Department of Health, Implementation Plan
DPR City and County of Honolulu, Department of Parks and Recreation
ENV City and County of Honolulu, Department of Environmental Services
EPA United States Environmental Protection Agency
FY Fiscal Year
GH Good Housekeeping
I&M Plan Implementation and Monitoring Plan
MOS Margin of Safety
MS4 Municipal Separate Storm Sewer System
NCDC National Climatic Data Center
NPDES National Pollutant Discharge Elimination System
OM Organic Matter
Permit NPDES Permit No. HI S000002
PM Particulate Matter
TMDL Total Maximum Daily Load
TN Total Nitrogen
TP Total Phosphorus
TSS Total Suspended Solids
WLA Wasteload Allocation

I&M Plan for Kawa Stream WLA
vi June 2015
This page is intentionally left blank.

I&M Plan for Kawa Stream WLA
vii June 2015
Executive Summary
This implementation and monitoring plan was developed to comply with the terms of the National Pollutant Discharge Elimination System Permit No. HI S000002 (Permit) for the City’s municipal separate storm sewer system (MS4).
In 2002, the State of Hawaii, Department of Health (DOH) developed and established Total Maximum Daily Loads (TMDLs) for Kawa Stream. In 2005, the DOH further defined Wasteload Allocations (WLAs) for the City and County of Honolulu (City or CCH) Department of Environmental Services large MS4 and CCH Department of Parks and Recreation (DPR) small MS4. Since the development of the TMDLs, the City’s Kaneohe Community and Senior Center, which is included in the DPR small MS4, has been consolidated into the City’s large MS4 permit.
Based on discussions with DOH representatives, it was determined that the City’s load reduction goals should be based on the annual storm runoff criteria, as defined by the TMDL report. In addition, the City applied reasonable adjustments to the margin of safety (MOS) assumptions and derived the following annual load reduction goals for Total Suspended Solids (TSS), Total Nitrogen (TN) and Total Phosphorus (TP):
Table ES-1: Annual CCH WLA and Load Reduction Summary
Unit TSS TN TP DPR (Small MS4) Reduction Required kg/yr 0 1 0 ENV (Large MS4) Reduction Required kg/yr 6,311 350 62 Total Reduction Required kg/yr 6,311 351 62 Total Reduction Required lbs/yr 13,913 774 137
Based on this analysis, the City will implement Best Management Practices (BMPs) targeted at removing 13,913 lbs of TSS, 774 lbs of TN, and 137 lbs of TP each year in the watershed. The City intends to track maintenance activities based on the entire watershed to maximize the benefit to the receiving waters rather than track each individual entity since (1) the discharges of the two systems are integrated and cannot be separated, and (2) the ultimate goal is to improve the overall health of the receiving waterbody which is Kaneohe Stream for all sub-basins and all land uses.
The City will implement a variety of BMPs to reduce pollutant loads in the watershed. These activities include:
Public education and outreach campaign to build awareness about sources of pollution, alternative products, safe disposal of wastes, and stream function and history (per the DOH implementation plan, 2002);
Public outreach efforts targeted to specific homeowners who could make improvements around their homes such as disconnecting roof drains;
Refining street sweeping routes and tracking/sampling procedures; and Inspection and cleaning of drainage structures and conveyances as necessary.
The combination of these efforts is expected to remove TSS and nutrients from the waste stream and ultimately achieve the targeted WLA. It is anticipated that a combination of public outreach and street sweeping five or six times throughout the year will collect sediment and organic matter in sufficient quantity to meet the City’s reduction goals. If additional activities (ex. additional street sweeping cycles, drain cleaning, and/or permanent BMPs, etc.) are required to meet the target reductions, the City will
I&M Plan for Kawa Stream WLA
viii June 2015
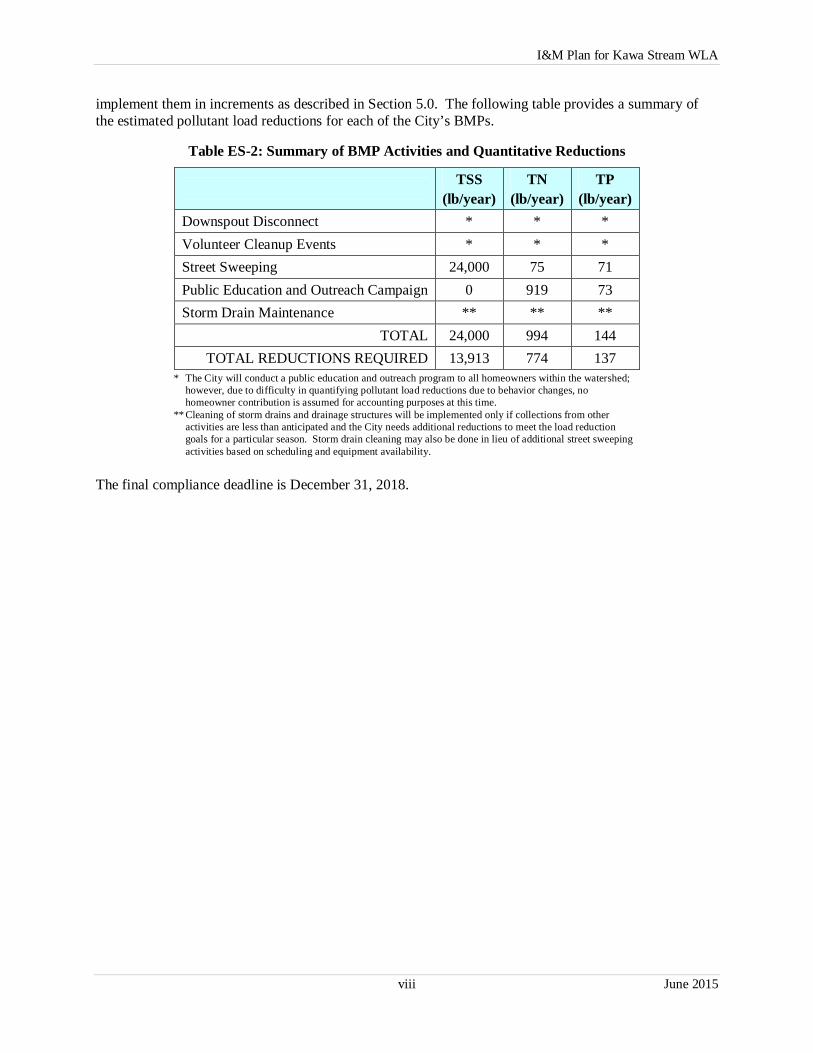
implement them in increments as described in Section 5.0. The following table provides a summary of the estimated pollutant load reductions for each of the City’s BMPs.
Table ES-2: Summary of BMP Activities and Quantitative Reductions
TSS (lb/year)
TN (lb/year)
TP (lb/year)
Downspout Disconnect * * * Volunteer Cleanup Events * * * Street Sweeping 24,000 75 71 Public Education and Outreach Campaign 0 919 73 Storm Drain Maintenance ** ** **
TOTAL 24,000 994 144 TOTAL REDUCTIONS REQUIRED 13,913 774 137
* The City will conduct a public education and outreach program to all homeowners within the watershed; however, due to difficulty in quantifying pollutant load reductions due to behavior changes, no homeowner contribution is assumed for accounting purposes at this time.
** Cleaning of storm drains and drainage structures will be implemented only if collections from other activities are less than anticipated and the City needs additional reductions to meet the load reduction goals for a particular season. Storm drain cleaning may also be done in lieu of additional street sweeping activities based on scheduling and equipment availability.
The final compliance deadline is December 31, 2018.
I&M Plan for Kawa Stream WLA
1 June 2015
1.0 Introduction
The National Pollutant Discharge Elimination System (NPDES) Permit No. HI S000002 (Permit) issued by the State of Hawaii, Department of Health (DOH) to the City and County of Honolulu (City for CCH) for their municipal separate storm sewer system (MS4) became effective February 16, 2015. It stipulates that the City develop an updated Wasteload Allocation (WLA) implementation and monitoring plan (I&M Plan) for Kawa Stream by the end of Fiscal Year 2015 (FY15). For the purpose of complying with the foregoing requirement, the City is submitting this I&M Plan for Kawa Stream.
The DOH developed and established Total Maximum Daily Loads (TMDLs) for the Kawa Stream in its technical report Allocation of Total Maximum Daily Loads for Total Suspended Solids, Nitrogen, and Phosphorus for Kawa Stream, Kaneohe, Hawaii (DOH, June 2005). This I&M Plan will address specific City activities targeted at reducing Total Suspended Solids, Total Nitrogen, and Total Phosphorus discharges in the Kawa Stream watershed as necessary to comply with the TMDLs and the City’s WLA. The monitoring plan specifies activity tracking necessary to demonstrate efforts by the City to comply with the urban source WLAs.

I&M Plan for Kawa Stream WLA
2 June 2015
This page is intentionally left blank
I&M Plan for Kawa Stream WLA
3 June 2015
2.0 Kawa Stream Watershed
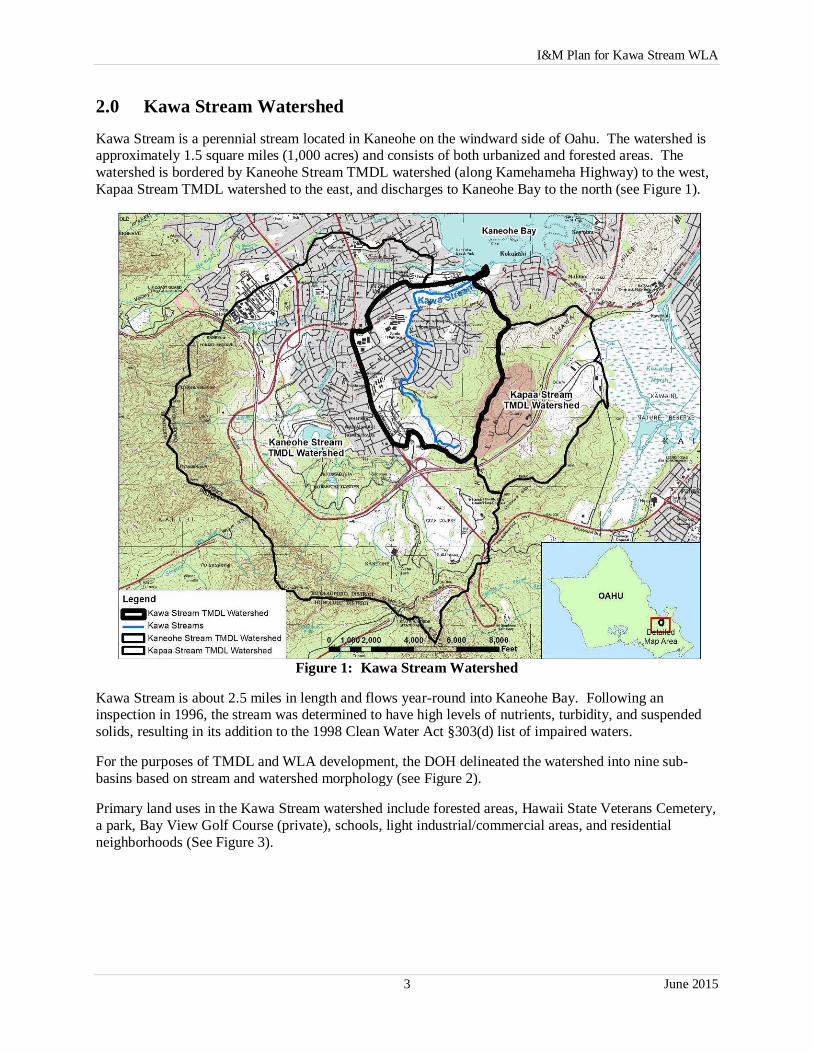
Kawa Stream is a perennial stream located in Kaneohe on the windward side of Oahu. The watershed is approximately 1.5 square miles (1,000 acres) and consists of both urbanized and forested areas. The watershed is bordered by Kaneohe Stream TMDL watershed (along Kamehameha Highway) to the west, Kapaa Stream TMDL watershed to the east, and discharges to Kaneohe Bay to the north (see Figure 1).
Figure 1: Kawa Stream Watershed
Kawa Stream is about 2.5 miles in length and flows year-round into Kaneohe Bay. Following an inspection in 1996, the stream was determined to have high levels of nutrients, turbidity, and suspended solids, resulting in its addition to the 1998 Clean Water Act §303(d) list of impaired waters.
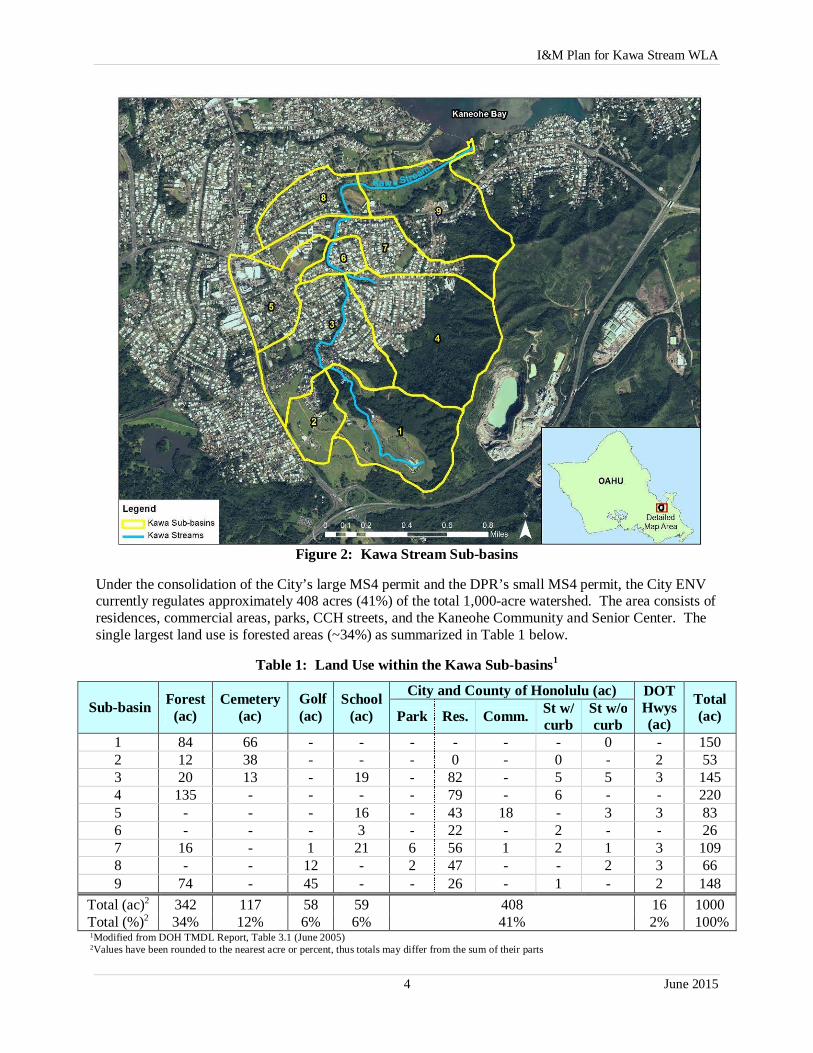
For the purposes of TMDL and WLA development, the DOH delineated the watershed into nine sub-basins based on stream and watershed morphology (see Figure 2).
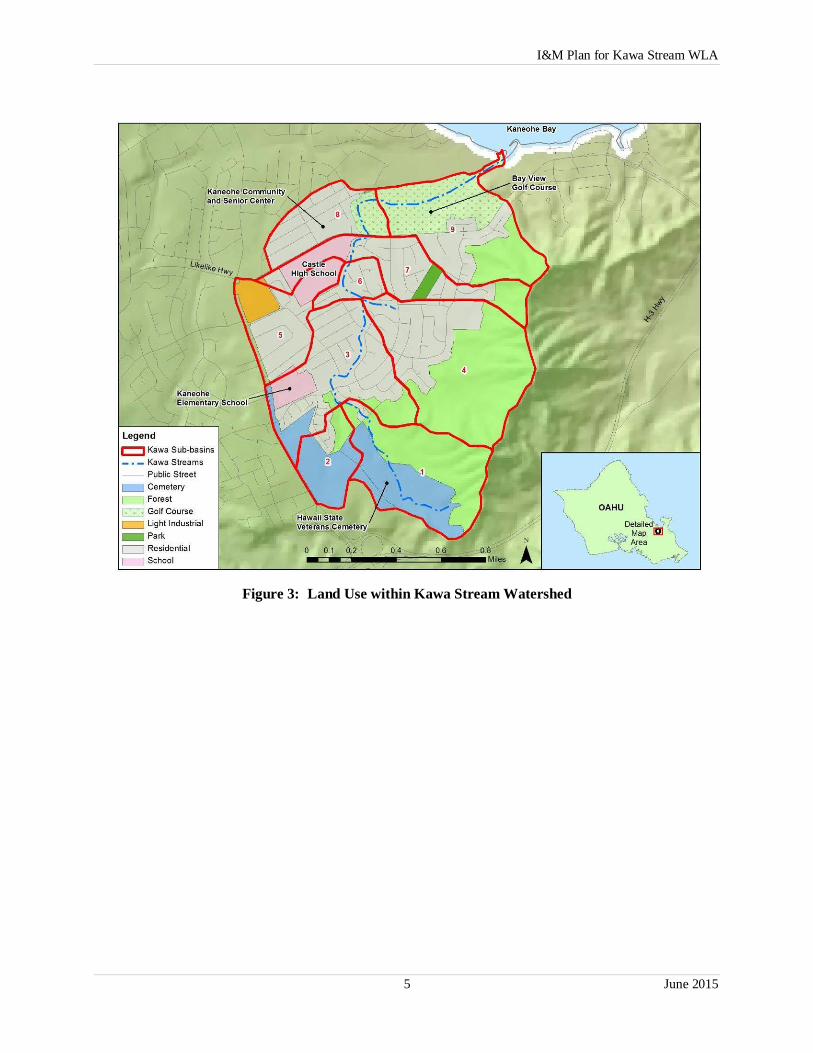
Primary land uses in the Kawa Stream watershed include forested areas, Hawaii State Veterans Cemetery, a park, Bay View Golf Course (private), schools, light industrial/commercial areas, and residential neighborhoods (See Figure 3).
I&M Plan for Kawa Stream WLA
4 June 2015
Figure 2: Kawa Stream Sub-basins
Under the consolidation of the City’s large MS4 permit and the DPR’s small MS4 permit, the City ENV currently regulates approximately 408 acres (41%) of the total 1,000-acre watershed. The area consists of residences, commercial areas, parks, CCH streets, and the Kaneohe Community and Senior Center. The single largest land use is forested areas (~34%) as summarized in Table 1 below.
Table 1: Land Use within the Kawa Sub-basins1
Sub-basin Forest (ac)
Cemetery (ac)
Golf (ac)
School (ac)
City and County of Honolulu (ac) DOT Hwys (ac)
Total (ac) Park Res. Comm. St w/
curb St w/o curb
1 84 66 - - - - - - 0 - 150 2 12 38 - - - 0 - 0 - 2 53 3 20 13 - 19 - 82 - 5 5 3 145 4 135 - - - - 79 - 6 - - 220 5 - - - 16 - 43 18 - 3 3 83 6 - - - 3 - 22 - 2 - - 26 7 16 - 1 21 6 56 1 2 1 3 109 8 - - 12 - 2 47 - - 2 3 66 9 74 - 45 - - 26 - 1 - 2 148
Total (ac)2 342 117 58 59 408 16 1000 Total (%)2 34% 12% 6% 6% 41% 2% 100% 1Modified from DOH TMDL Report, Table 3.1 (June 2005) 2Values have been rounded to the nearest acre or percent, thus totals may differ from the sum of their parts
I&M Plan for Kawa Stream WLA
5 June 2015
Figure 3: Land Use within Kawa Stream Watershed
I&M Plan for Kawa Stream WLA
6 June 2015
This page is intentionally left blank
I&M Plan for Kawa Stream WLA
7 June 2015
3.0 TMDLs and WLAs for Kawa Stream Watershed
TMDL is a calculation of the maximum amount of a pollutant that a waterbody can receive and still meet water quality standards and is an allocation of that load among the various sources of that pollutant. In 2002, the DOH published and the United States Environmental Protection Agency (EPA) approved TMDLs for Kawa Stream for Total Suspended Solids (TSS), Total Nitrogen (TN), and Total Phosphorus (TP). In 2005, the DOH further allocated the approved TMDLs between point source discharges and nonpoint source runoff. Wasteload allocations (WLAs) were defined for wet and dry season baseflow and annual storm runoff conditions. The TMDL report further established baseflow and annual existing loading rates for point source discharges including the City’s Department of Environmental Services (ENV) large MS4 and the Department of Parks and Recreation (DPR) small MS4 which includes Kaneohe Community and Senior Center. The following sections summarize the DOH TMDL calculations and describe the modifications made to those calculations to determine the City’s reduction goals.
3.1 Adjustment for Margin of Safety
The City conducted an independent review of the DOH TMDL calculations and noted that an excessive Margin of Safety (MOS) was incorporated into the calculations. MOS is an integral part of TMDL development and accounts for uncertainty regarding pollutant loads and waterbody response. Typically, this is incorporated either explicitly (i.e., leaving a portion of the assimilative capacity unallocated) or implicitly (by use of conservative analytical assumptions); however in this case, both were applied. Specifically, an explicit MOS of 10% in determining the loading capacity for TP, TN, and TSS was applied in addition to an implicit MOS derived from the TMDL storm runoff cumulative probability curves (80th percentile versus 70th percentile)(DOH, 2002). Calculations performed on the DOH’s comparison of the 70th percentile and 80th percentile cumulative probability curves for TN resulted in a 19% implicit MOS in addition to the 10% explicit MOS. Based on a review of other State’s TMDLs and examples from EPA, a typical MOS range is generally 5-10% (Crumpacker, 2009 and water.epa.gov). For this reason, the City subtracted the 10% explicit MOS from the reduction goals to determine a more reasonable reduction goal. The implicit MOS (reportedly as high as 19%) is considerably higher than the industry standard of 5-10%, and therefore still represents a conservative assumption. In fact, the City’s entire TSS load reduction goal (13,913 lbs/yr) is due to the implicit MOS.
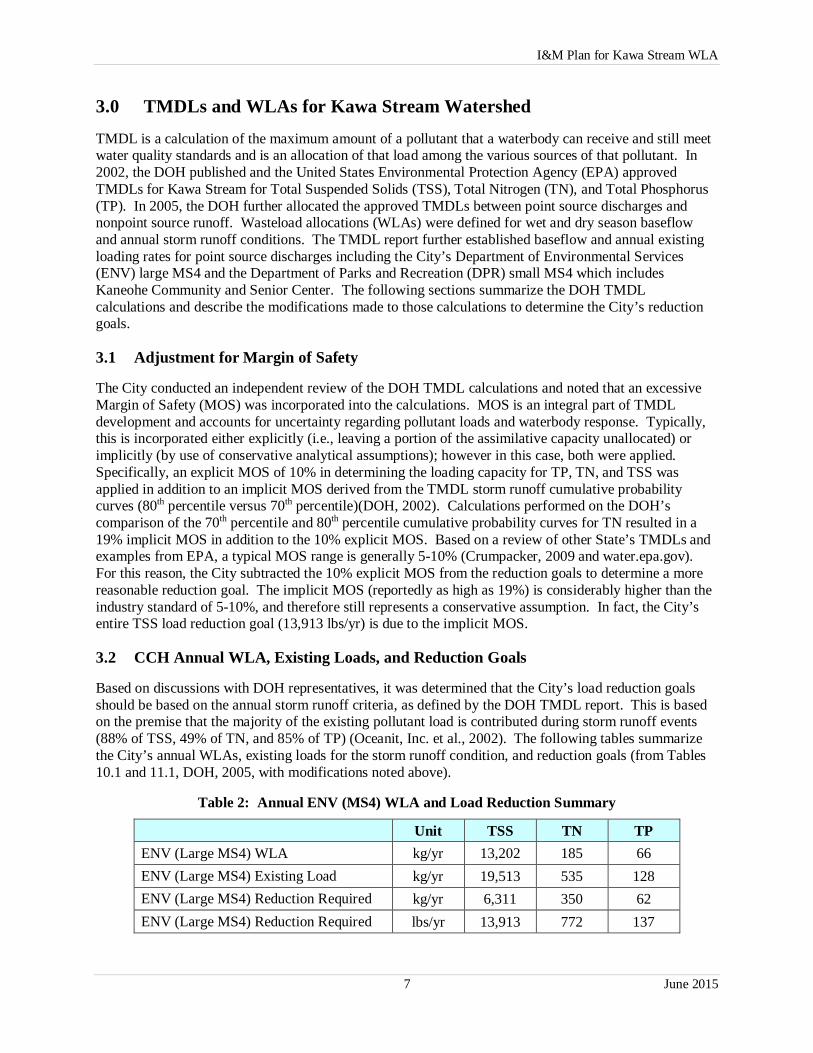
3.2 CCH Annual WLA, Existing Loads, and Reduction Goals
Based on discussions with DOH representatives, it was determined that the City’s load reduction goals should be based on the annual storm runoff criteria, as defined by the DOH TMDL report. This is based on the premise that the majority of the existing pollutant load is contributed during storm runoff events (88% of TSS, 49% of TN, and 85% of TP) (Oceanit, Inc. et al., 2002). The following tables summarize the City’s annual WLAs, existing loads for the storm runoff condition, and reduction goals (from Tables 10.1 and 11.1, DOH, 2005, with modifications noted above).
Table 2: Annual ENV (MS4) WLA and Load Reduction Summary
Unit TSS TN TP ENV (Large MS4) WLA kg/yr 13,202 185 66 ENV (Large MS4) Existing Load kg/yr 19,513 535 128 ENV (Large MS4) Reduction Required kg/yr 6,311 350 62 ENV (Large MS4) Reduction Required lbs/yr 13,913 772 137
I&M Plan for Kawa Stream WLA
8 June 2015
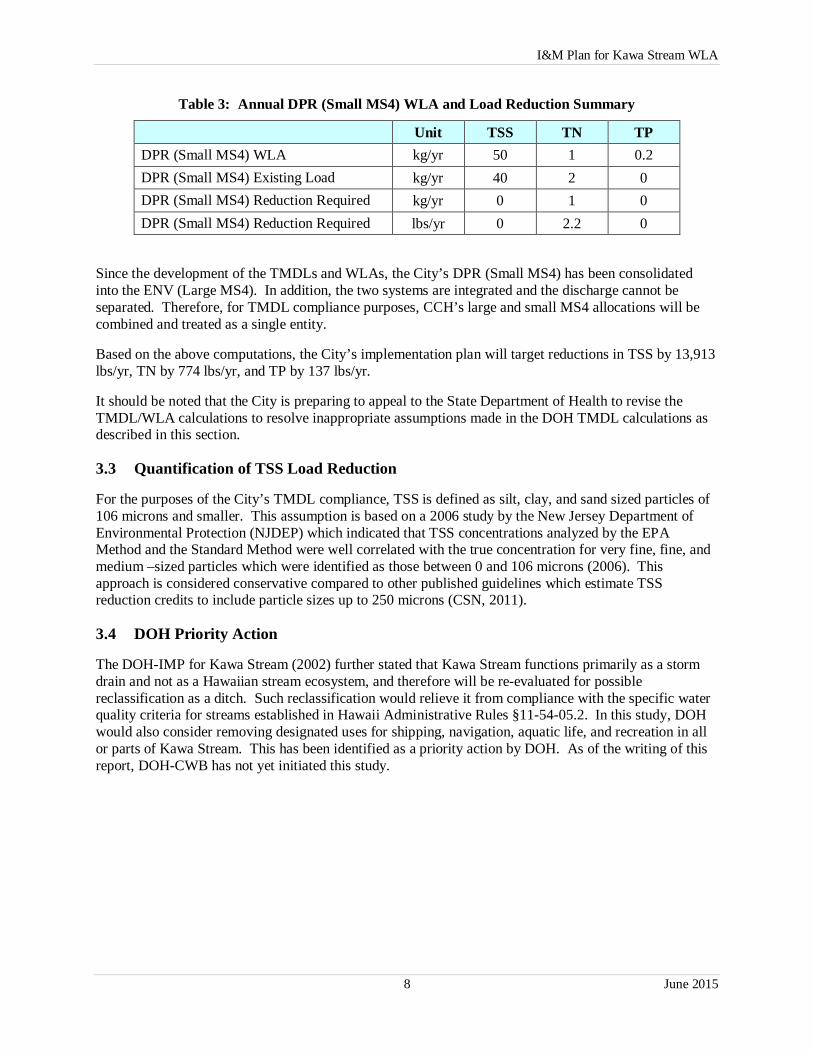
Table 3: Annual DPR (Small MS4) WLA and Load Reduction Summary
Unit TSS TN TP DPR (Small MS4) WLA kg/yr 50 1 0.2 DPR (Small MS4) Existing Load kg/yr 40 2 0 DPR (Small MS4) Reduction Required kg/yr 0 1 0 DPR (Small MS4) Reduction Required lbs/yr 0 2.2 0
Since the development of the TMDLs and WLAs, the City’s DPR (Small MS4) has been consolidated into the ENV (Large MS4). In addition, the two systems are integrated and the discharge cannot be separated. Therefore, for TMDL compliance purposes, CCH’s large and small MS4 allocations will be combined and treated as a single entity.
Based on the above computations, the City’s implementation plan will target reductions in TSS by 13,913 lbs/yr, TN by 774 lbs/yr, and TP by 137 lbs/yr.
It should be noted that the City is preparing to appeal to the State Department of Health to revise the TMDL/WLA calculations to resolve inappropriate assumptions made in the DOH TMDL calculations as described in this section.
3.3 Quantification of TSS Load Reduction
For the purposes of the City’s TMDL compliance, TSS is defined as silt, clay, and sand sized particles of 106 microns and smaller. This assumption is based on a 2006 study by the New Jersey Department of Environmental Protection (NJDEP) which indicated that TSS concentrations analyzed by the EPA Method and the Standard Method were well correlated with the true concentration for very fine, fine, and medium –sized particles which were identified as those between 0 and 106 microns (2006). This approach is considered conservative compared to other published guidelines which estimate TSS reduction credits to include particle sizes up to 250 microns (CSN, 2011).
3.4 DOH Priority Action
The DOH-IMP for Kawa Stream (2002) further stated that Kawa Stream functions primarily as a storm drain and not as a Hawaiian stream ecosystem, and therefore will be re-evaluated for possible reclassification as a ditch. Such reclassification would relieve it from compliance with the specific water quality criteria for streams established in Hawaii Administrative Rules §11-54-05.2. In this study, DOH would also consider removing designated uses for shipping, navigation, aquatic life, and recreation in all or parts of Kawa Stream. This has been identified as a priority action by DOH. As of the writing of this report, DOH-CWB has not yet initiated this study.

I&M Plan for Kawa Stream WLA
9 June 2015
4.0 Proposed Best Management Practice Implementation and Monitoring Plan
The City will implement various Best Management Practices (BMPs) to reduce pollutants, particularly TSS, TN and TP, from entering the stream. The aggregate effect of these individual activities is expected to reduce the pollutants in the City’s stormwater discharge to below the target WLA. This TMDL Implementation Plan identifies specific activities with the goal of reducing pollutants, improving water quality, and increasing the stream’s ability to support aquatic habitat. While ultimately the attainment of the Kawa Stream TMDL lies with all stakeholders, namely the residents, major landowners, and land operators, the City proposes to implement the following BMPs to reduce point source loads from the City’s streets and facilities.
Public Education and Outreach Campaign Community Involvement Activities Pollution Prevention and Good Housekeeping
4.1 Community Involvement and Outreach/Education
Outreach efforts which educate the general public to effect changes in their behavior can result in significant reductions of pollutants that would otherwise enter the storm drain system and receiving waters. As stated in the DOH-IMP (2002), Kaneohe residents are the ultimate force for reducing pollutant loads and improving water quality in Kawa Stream and Kaneohe Bay. The report further stated that, “it is clear that our everyday behavior creates many water quality problems”, and it encourages each resident and user of the watershed to accept responsibility for its health and future by refining this everyday behavior.
4.1.1 DOH Recommendation for Public Education and Outreach
In October 2002, the DOH published the report, How to Reduce Pollutants Loads and Improve Water Quality in Kawa Stream (Kaneohe, Oahu), A Total Maximum Daily Load Implementation Plan for Watershed Health. In it, the DOH suggested a framework for community action to reduce pollutant loads to the stream and acknowledged that the process for full watershed restoration may take several lifetimes to complete. The report further stated that excess nitrogen loads appear to be the single largest problem for TMDL implementation throughout the watershed. The largest sources of nitrogen and sediment loads were identified as cemetery lands and residential areas, whereas the largest phosphorus loads appear to originate from forested lands and residential areas.
Per the DOH Implementation Plan (DOH-IMP) (DOH-EPO, 2002), residents are identified as key participants in reducing nutrients and sediments in watershed runoff. This is particularly critical since residential areas were identified as one of the largest contributors of sediment, nitrogen, and phosphorus loads. The DOH-IMP identified the following action plan for residential participation, “Provide education and outreach to build awareness about sources of pollution, alternative products, safe disposal of wastes, and stream function and history”. The CCH will commit to a program of public education and outreach that satisfies each of these criteria.
Oceanit (2002) estimated the pollutant load reduction resulting from the implementation of the public education and outreach program at 919 lbs of TN per year (417 kg/yr) and 73 lbs of TP per year (33 kg/yr) (Tables 5.4, 5.5, and 5.6).
I&M Plan for Kawa Stream WLA
10 June 2015
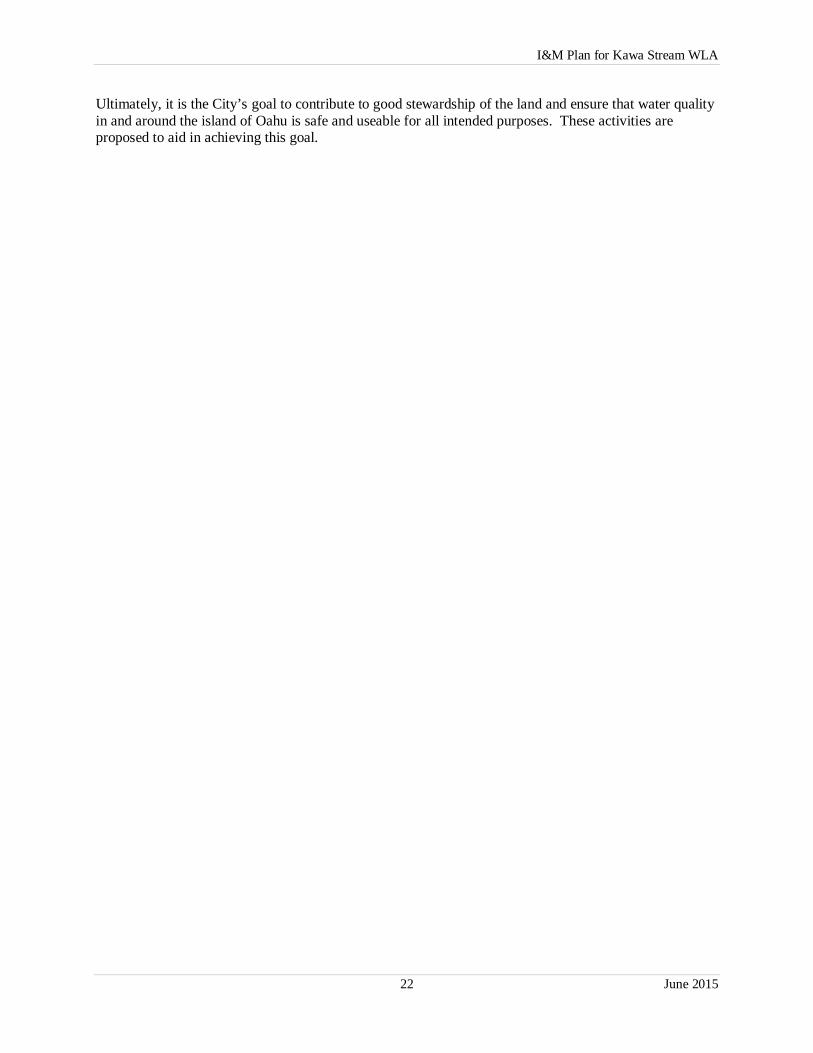
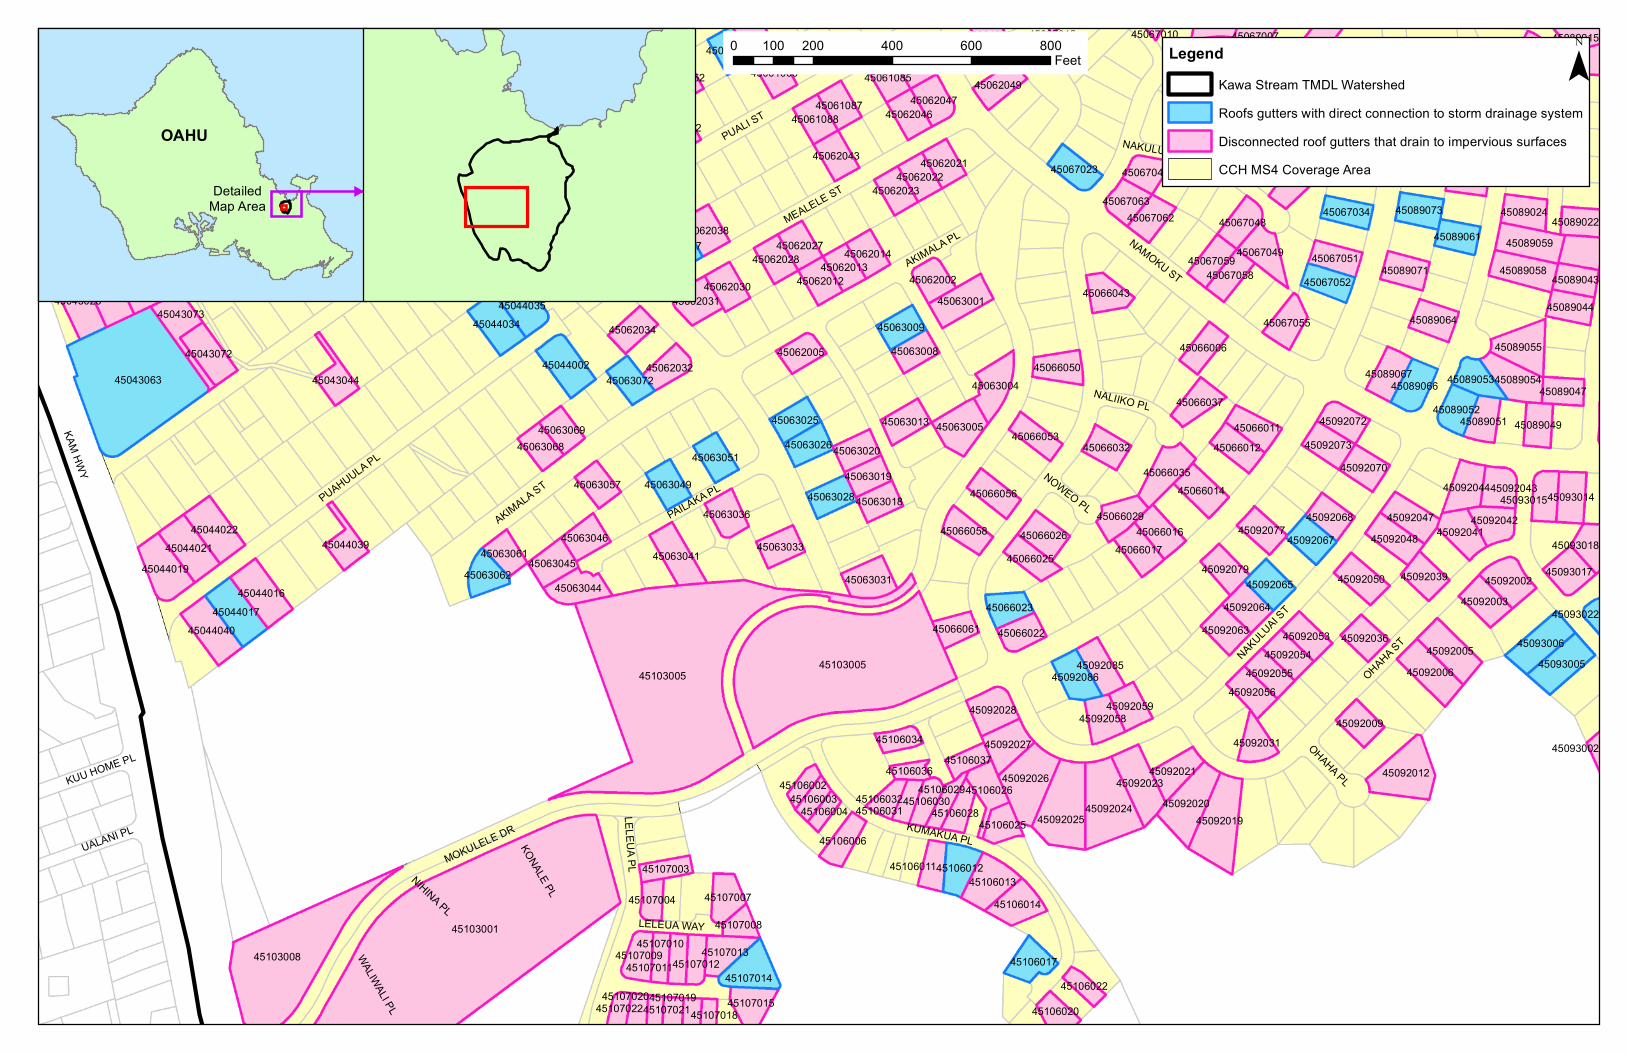
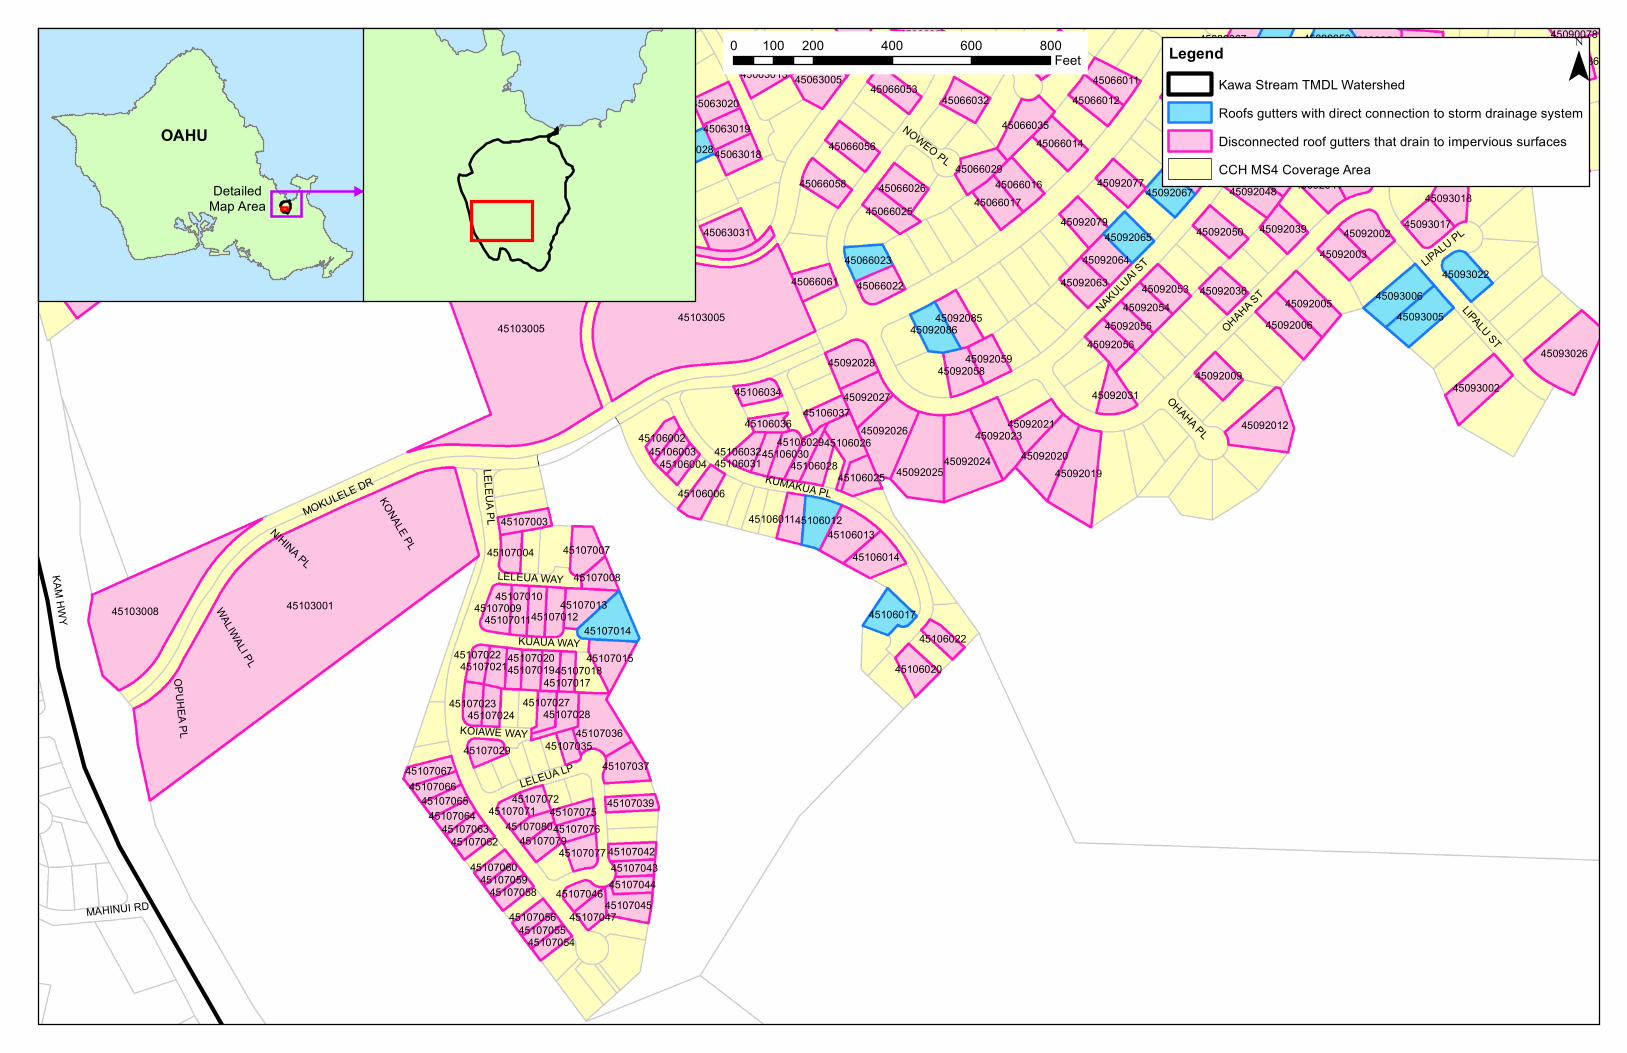
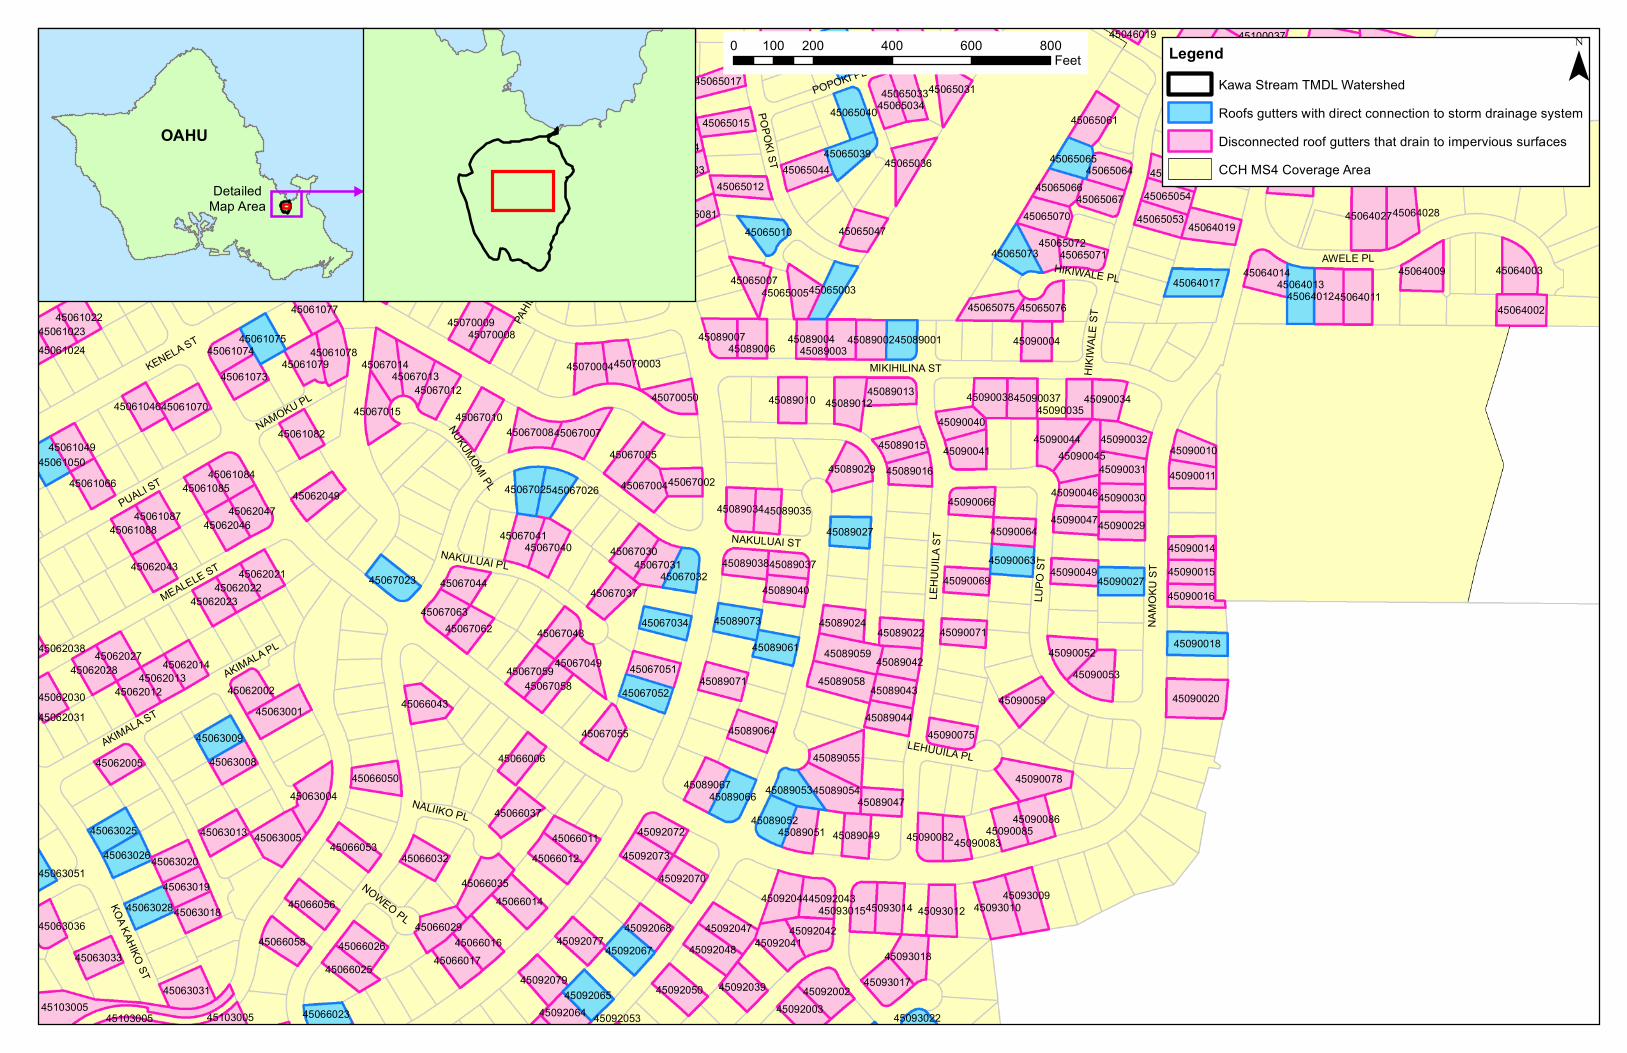
4.1.2 Downspout Disconnection
Building rooftops are impervious surfaces, similar to paved streets and parking lots that accumulate debris, chemicals, fine sediment, nutrients or other pollutants that could adversely affect water quality if the runoff is discharged untreated. Connected downspouts discharge rooftop runoff either directly to the storm drain system or to impervious surfaces. In both cases, there is little to no treatment of stormwater runoff before it reaches the stream system. Most of the nitrogen contained in stormwater is in the form of dissolved nitrate. Since the nitrogen is not in solid form, removal through plant uptake has been shown to be much more effective than filtration methods.
Downspout disconnection can help reduce runoff volume, rate, and accumulated rooftop pollutants introduced to local streams by allowing runoff water to pass through the initial plant uptake process as well as the secondary infiltration process rather than discharging directly to the storm drainage system. Disconnected downspouts typically drain to pervious areas such as yards and lawns, rain barrels, or rain gardens, all of which allow rooftop runoff to enter treatment prior to discharge.
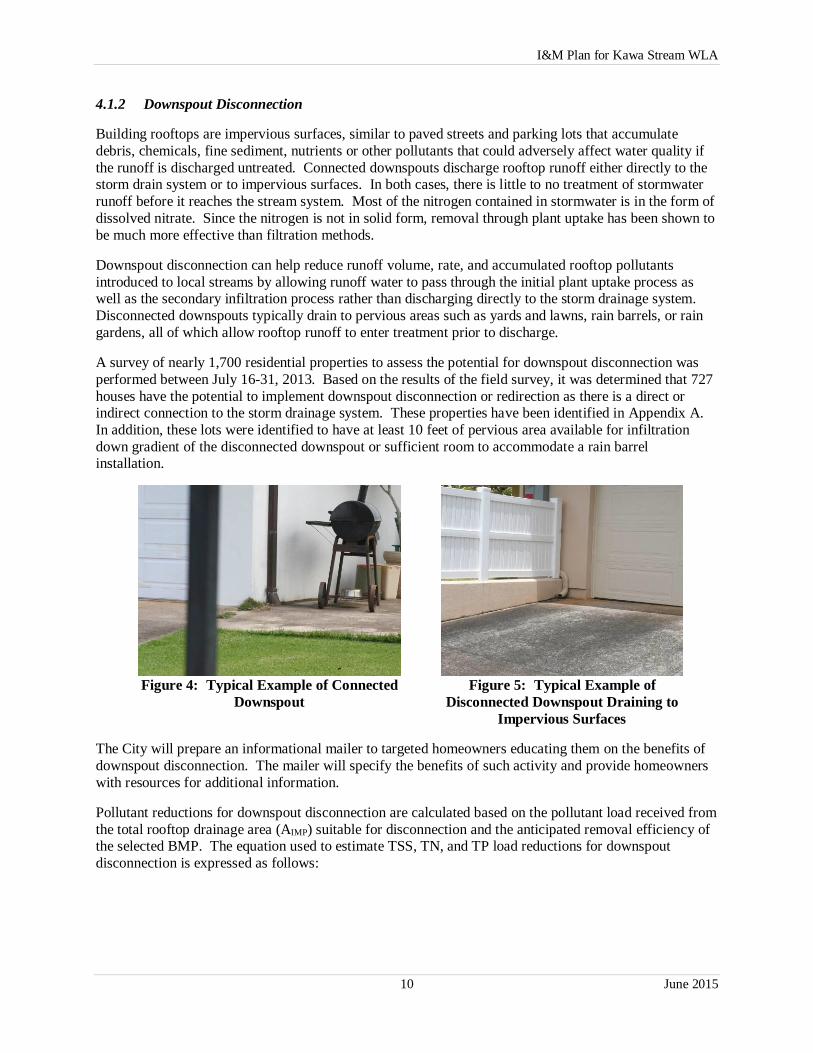
A survey of nearly 1,700 residential properties to assess the potential for downspout disconnection was performed between July 16-31, 2013. Based on the results of the field survey, it was determined that 727 houses have the potential to implement downspout disconnection or redirection as there is a direct or indirect connection to the storm drainage system. These properties have been identified in Appendix A. In addition, these lots were identified to have at least 10 feet of pervious area available for infiltration down gradient of the disconnected downspout or sufficient room to accommodate a rain barrel installation.
Figure 4: Typical Example of Connected
Downspout Figure 5: Typical Example of
Disconnected Downspout Draining to Impervious Surfaces
The City will prepare an informational mailer to targeted homeowners educating them on the benefits of downspout disconnection. The mailer will specify the benefits of such activity and provide homeowners with resources for additional information.
Pollutant reductions for downspout disconnection are calculated based on the pollutant load received from the total rooftop drainage area (AIMP) suitable for disconnection and the anticipated removal efficiency of the selected BMP. The equation used to estimate TSS, TN, and TP load reductions for downspout disconnection is expressed as follows:
I&M Plan for Kawa Stream WLA
11 June 2015
Load Reduction [lb/yr] = LR * AIMP * P * PP * RE * C, where:
LR = Loading rate for urban land use (NY State Stormwater Management Design Manual) (19 mg/L for TSS; 1.5 mg/L for TN; 0.11 mg/L for TP)
AIMP = impervious rooftop drainage area recommended for disconnection (estimated from Google Earth images) (55.75 Acres)
P = Average annual precipitation totals based on PRISM dataset of 30-yr Normals for 1971-2000 (75 in/yr)
PP = Percent of Residents who Participate (%)
RE = Removal Efficiency for Specific BMP Type (open channel removal rate of 81% for TSS, 56% for TN, and 24% for TP per National Pollutant Removal Performance Database, Center of Watershed Protection [CWP], 2007)
C = Conversion Factor, 0.2266
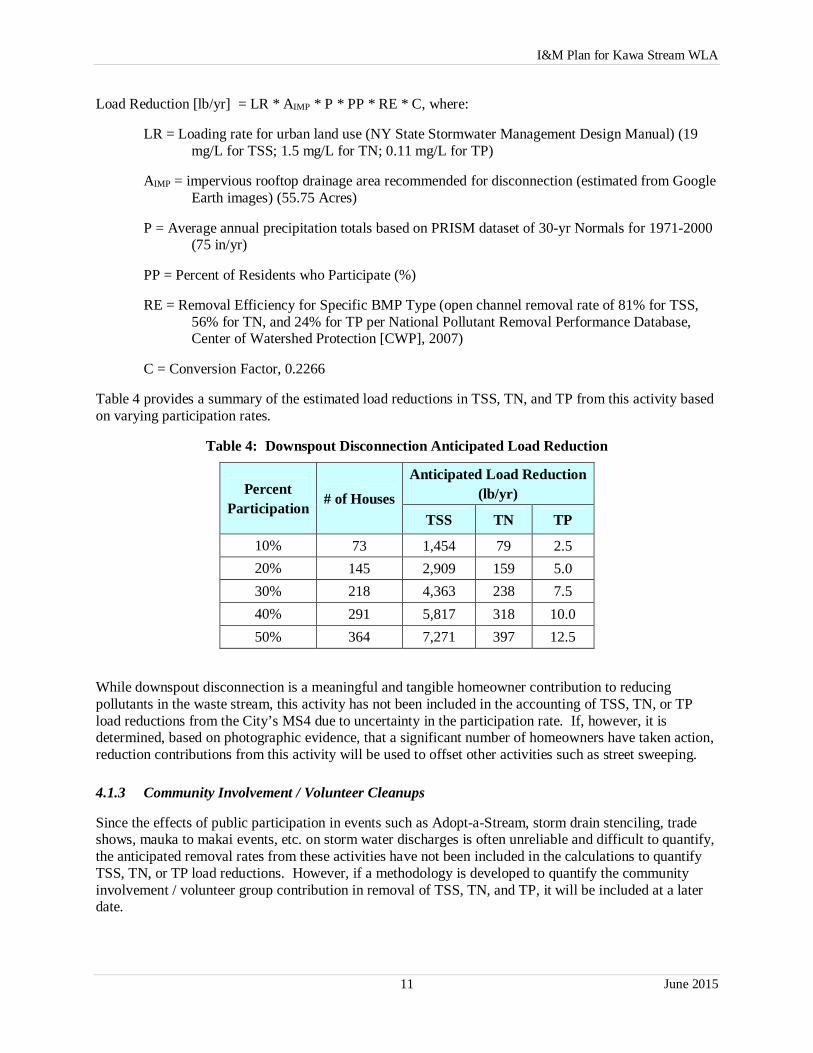
Table 4 provides a summary of the estimated load reductions in TSS, TN, and TP from this activity based on varying participation rates.
Table 4: Downspout Disconnection Anticipated Load Reduction
Percent Participation # of Houses
Anticipated Load Reduction (lb/yr)
TSS TN TP
10% 73 1,454 79 2.5 20% 145 2,909 159 5.0 30% 218 4,363 238 7.5 40% 291 5,817 318 10.0 50% 364 7,271 397 12.5
While downspout disconnection is a meaningful and tangible homeowner contribution to reducing pollutants in the waste stream, this activity has not been included in the accounting of TSS, TN, or TP load reductions from the City’s MS4 due to uncertainty in the participation rate. If, however, it is determined, based on photographic evidence, that a significant number of homeowners have taken action, reduction contributions from this activity will be used to offset other activities such as street sweeping.
4.1.3 Community Involvement / Volunteer Cleanups
Since the effects of public participation in events such as Adopt-a-Stream, storm drain stenciling, trade shows, mauka to makai events, etc. on storm water discharges is often unreliable and difficult to quantify, the anticipated removal rates from these activities have not been included in the calculations to quantify TSS, TN, or TP load reductions. However, if a methodology is developed to quantify the community involvement / volunteer group contribution in removal of TSS, TN, and TP, it will be included at a later date.
I&M Plan for Kawa Stream WLA
12 June 2015
4.2 Pollution Prevention and Good Housekeeping
The City currently implements a host of pollution prevention and good housekeeping (GH) practices across the island. Collectively, these programs are a key element in the diversion of trash, sediment, and nutrients from entering the storm drain system and discharging to receiving waters. The City will implement the following plan to expand its maintenance operations in the Kawa Stream watershed for the upcoming 2016 fiscal year (FY16).
4.2.1 Street Sweeping
The Kaneohe Corporation Yard of the City Department of Facility Maintenance (DFM) currently maintains the City’s streets and facilities within the Kawa Stream Watershed. The current street sweeping schedule is irregular and conducted based on the availability of staff and operability of the equipment. The baseyard currently uses a vacuum street sweeper (Allianz Johnston VT560) for its street sweeping operations.
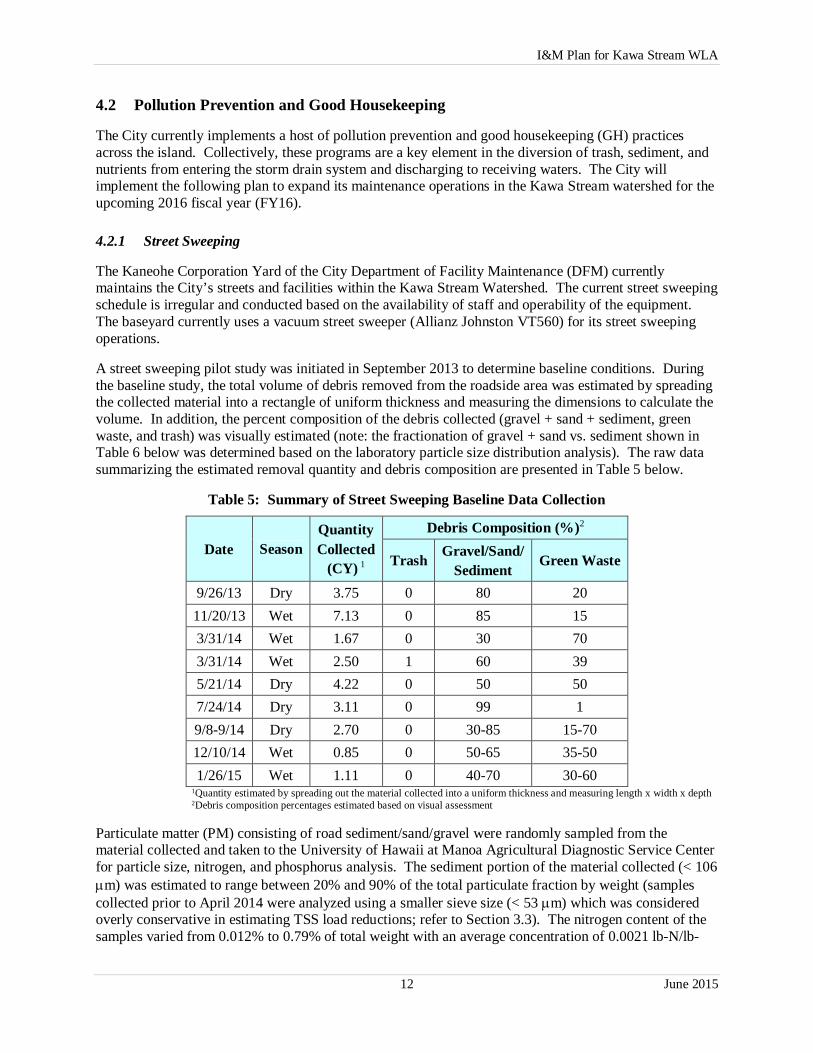
A street sweeping pilot study was initiated in September 2013 to determine baseline conditions. During the baseline study, the total volume of debris removed from the roadside area was estimated by spreading the collected material into a rectangle of uniform thickness and measuring the dimensions to calculate the volume. In addition, the percent composition of the debris collected (gravel + sand + sediment, green waste, and trash) was visually estimated (note: the fractionation of gravel + sand vs. sediment shown in Table 6 below was determined based on the laboratory particle size distribution analysis). The raw data summarizing the estimated removal quantity and debris composition are presented in Table 5 below.
Table 5: Summary of Street Sweeping Baseline Data Collection
Date Season Quantity Collected
(CY) 1
Debris Composition (%)2
Trash Gravel/Sand/ Sediment
Green Waste
9/26/13 Dry 3.75 0 80 20 11/20/13 Wet 7.13 0 85 15 3/31/14 Wet 1.67 0 30 70 3/31/14 Wet 2.50 1 60 39 5/21/14 Dry 4.22 0 50 50 7/24/14 Dry 3.11 0 99 1 9/8-9/14 Dry 2.70 0 30-85 15-70 12/10/14 Wet 0.85 0 50-65 35-50 1/26/15 Wet 1.11 0 40-70 30-60
1Quantity estimated by spreading out the material collected into a uniform thickness and measuring length x width x depth 2Debris composition percentages estimated based on visual assessment
Particulate matter (PM) consisting of road sediment/sand/gravel were randomly sampled from the material collected and taken to the University of Hawaii at Manoa Agricultural Diagnostic Service Center for particle size, nitrogen, and phosphorus analysis. The sediment portion of the material collected (< 106
m) was estimated to range between 20% and 90% of the total particulate fraction by weight (samples collected prior to April 2014 were analyzed using a smaller sieve size (< 53 m) which was considered overly conservative in estimating TSS load reductions; refer to Section 3.3). The nitrogen content of the samples varied from 0.012% to 0.79% of total weight with an average concentration of 0.0021 lb-N/lb-

I&M Plan for Kawa Stream WLA
13 June 2015
PM. The phosphorus content of the samples varied from 0.07% to 0.72% with an average concentration of 0.0017 lb-P/lb-PM, respectively.
Organic matter (OM) was also extracted from the material collected and taken to the University of Hawaii at Manoa Agricultural Diagnostic Service Center for nitrogen and phosphorus analysis. The nitrogen content of the samples varied from 0.26% to 2.23% of the total weight. The average nitrogen content of all OM collected was 0.0123 lb-N/lb-OM. The phosphorus content of the samples varied from 0.09% to 0.24% of the total weight. The average phosphorus content of all OM collected was 0.0013 lb-P/lb-OM.
EPA bulk density conversion factors were determined for “gravel” + “sand”, “soil” (for sediment), and “compost” (for green waste) (www.epa.gov/osw/conserve/smm/wastewise/pubs/conversions.pdf).
The TSS load reduction was estimated to include all particles of 106 microns and smaller (according to the particle size distribution analysis) per the following equation:
TSS Load Reduction [lb/sweep] = VTOTAL * FSEDIMENT * WSOIL, where:
VTOTAL = Total volume of material collected (CY)
FSEDIMENT = Estimated fraction of sediment by volume based on visual assessment and particle size analysis (%)
WSOIL = Bulk density conversion factor for sediment (2,392 lbs/CY)
TN and TP load reductions were estimated from the measured concentrations along with the bulk density conversion factors according to the following equations:
TN Load Reduction [lb/sweep] = (VTOTAL * FSEDIMENT * WSOIL * NPM ) + (VTOTAL * FGRAVEL * WGRAVEL * NPM ) + (VTOTAL * FOM * WCOMPOST * NOM ), where:
VTOTAL = Total volume of material collected (CY)
FSEDIMENT = Estimated fraction of sediment by volume based on visual assessment and particle size analysis (%)
FGRAVEL = Estimated fraction of gravel/sand by volume based on visual assessment and particle size analysis (%)
FOM = Estimated fraction of organic material by volume based on visual assessment (%)
WSOIL = Bulk density conversion factor for sediment (2,392 lbs/CY)
WGRAVEL = Average bulk density conversion factor for gravel and sand (2,600 lbs/CY)
WCOMPOST = Bulk density conversion factor for green waste (360 lbs/CY)
NPM = Nitrogen content of particulate matter (gravel, sand, and sediment) (lb-N/lb-PM)
NOM = Nitrogen content of organic material (lb-N/lb-OM)
TP Load Reduction [lb/sweep] = (VTOTAL * FSEDIMENT * WSOIL * PSEDIMENT ) + (VTOTAL * FGRAVEL * WGRAVEL * PSEDIMENT ) + (VTOTAL * FGREEN WASTE * WCOMPOST * PGREEN WASTE ), where:
VTOTAL = Total volume of material collected (CY)
I&M Plan for Kawa Stream WLA
14 June 2015
FSEDIMENT = Estimated fraction of sediment by volume based on visual assessment and particle size analysis (%)
FGRAVEL = Estimated fraction of gravel/sand by volume based on visual assessment and particle size analysis (%)
FOM = Estimated fraction of organic material by volume based on visual assessment (%)
WSOIL = Bulk density conversion factor for sediment (2,392 lbs/CY)
WGRAVEL = Average bulk density conversion factor for gravel and sand (2,600 lbs/CY)
WCOMPOST = Bulk density conversion factor for green waste (360 lbs/CY)
PPM = Phosphorus content of particulate matter (gravel, sand, and sediment) (lb-P/lb-PM)
POM = Phosphorus content of organic material (lb-P/lb-OM)
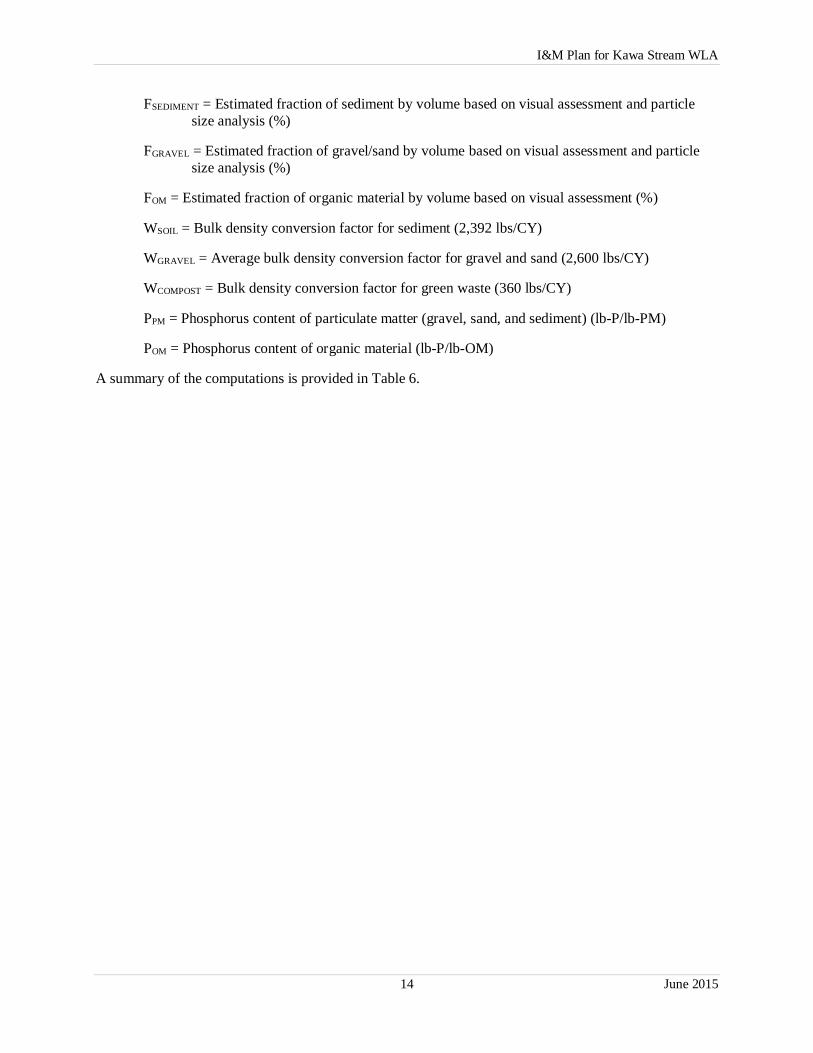
A summary of the computations is provided in Table 6.
I&M Plan for Kawa Stream WLA
15 June 2015
Table 6: Summary of Street Sweeping Load Reduction Computations
1Laboratory analysis for TSS defined as particles 53 microns and smaller (samples prior to April 2014); TSS fraction was estimated based on subsequent samples and laboratory analysis for particles sizes <106 microns 2Sediment is defined as particles 106 microns and smaller (post April 2014)
Date (Season)
Qty (CY)
Material Collected
Debris Composition
(%)
Bulk Density (lb/CY)
Concentration (lb/lb)
Qty Removed (lb/sweep)
TN TP TSS TN TP
9/26/13 (Dry) 3.75
Gravel+Sand 78.6 2,600 0.0002 0.0011 123 5.5 8.9 Sediment1 1.4 2,392 0.0002 0.0011
Green Waste 20 360 0.0144 0.0011
11/20/13 (Wet) 7.13
Gravel+Sand 81 2,600 0.0012 0.0013 676 19.8 20.9 Sediment1 4 2,392 0.0012 0.0013
Green Waste 15 360 0.0026 0.0014
3/31/14 (Wet) 1.67
Gravel+Sand 25.5 2,600 0.0079 0.0012 178 15.4 2.4 Sediment1 4.5 2,392 0.0079 0.0012
Green Waste 70 360 0.0126 0.0021
3/31/14 (Wet) 2.50
Gravel+Sand 56.8 2,600 0.0011 0.0016 193 5.2 6.7 Sediment1 3.2 2,392 0.0011 0.0016
Green Waste 39 360 0.0026 0.0015
5/21/14 (Dry) 4.22
Gravel+Sand 6.9 2,600 0.0036 0.0072 4,354 31.0 37.9 Sediment2 43.1 2,392 0.0036 0.0072
Green Waste 50 360 0.0166 0.0014
7/24/14 (Dry) 3.11
Gravel+Sand 10.2 2,600 0.0001 0.0016 6,609 0.9 11.9 Sediment2 88.8 2,392 0.0001 0.0016
Green Waste 1 360 0.0172 0.0013
9/8-9/14 (Dry) 2.70
Gravel+Sand 0.8-1.6 2,600 0.0004-0.0019
0.0010-0.0013
2,865 14.6 4.58 Sediment2 29.2-83.4 2,392 0.0004-0.0019
0.0010-0.0013
Green Waste 15-70 360 0.0096-0.0223
0.0010-0.0024
12/10/14 (Wet) 0.82
Gravel+Sand 2.8-10.7 2,600 0.0023-0.0064
0.0013-0.0016
1,166 5.53 2.08 Sediment2 39.3-62.2 2,392 0.0023-0.0064
0.0013-0.0016
Green Waste 35-50 360 0.0135-0.0148 0.0010
1/26/15 (Wet) 1.11
Gravel+Sand 0.6-1.5 2,600 0.0002-0.0020
0.0092-0.0099
1,512 3.93 1.24 Sediment2 39.4-68.5 2,392 0.0002-0.0020
0.0092-0.0099
Green Waste 30-60 360 0.0007 0.0009-0.0010
I&M Plan for Kawa Stream WLA
16 June 2015
The street sweeping pilot study will continue through the end of calendar year 2016 (CY16). Throughout this period, the total volume of material collected and the estimated debris composition will be tracked for each street sweeping cycle. In addition, laboratory analysis for TSS (particle size distribution) and the nutrient content of the particulate fraction and organic fraction of the material collected from street sweeping will be conducted.
Based on the data collected thus far, it is estimated that each street sweeping cycle is anticipated to reduce TSS loadings by 4,000-5,000 lbs, TN loadings by 12-13 lbs, and TP loadings by 11-12 lbs. On average, 1,300 lbs of TSS, 3.7 lbs of TN, and 3.5 lbs of TP are removed per cubic yard of street sweeping debris collected.
It is anticipated that this activity will need to occur approximately five to six times throughout the year to meet the City’s TSS, TN, and TP reduction goals. In the event the street sweeping equipment is out of commission for an extended period of time, the baseyard has alternate plans in place to borrow equipment from another baseyard to ensure the removal rate from this activity is sufficient to meet the City’s annual WLA.
The annual removal quantity will be measured based on the City’s fiscal year which begins on July 1st of each year. Data collected from each street sweeping cycle will be tallied and the running total will be measured against annual metrics to determine if collections are on target to meet the TSS, TN, and TP reduction goals for the year. If, at any time, the actual collections fall short of the estimates and it appears that routine street sweeping operations scheduled for the remainder of the fiscal year are not sufficient to meet the reduction goals, additional activities including drain cleaning will be conducted.
4.2.2 Maintenance of Storm Drainage System
Within the Kawa Stream watershed, the City currently maintains approximately 260 inlets (catch basins and grated inlets), 120 manholes, and nearly 45,000 linear feet of ditches, drainage pipes, and box culverts. The City routinely inspects its drainage facilities once every five years (once per permit term) and cleans all structures that are at least 50% full. Cleaning is performed more frequently if complaints are received. The City will continue this routine maintenance through the end of the permit term (2020).
It is not anticipated that annual or more frequent drain cleaning will be required to meet the City’s TSS, TN, or TP reduction goals. However, if it is determined that additional reductions are required, the City will implement drain cleaning on an as needed basis to supplement the regularly scheduled good housekeeping activities. The methodology to estimate pollutant removals will be similar to that presented for street sweeping. Consequently, similar data will be tracked, including total volume of material collected and debris composition.
The City also owns over 30 outfalls within the watershed boundary. Most outfalls discharge to hardened channels with little or no potential for erosion prevention improvement. Therefore, outfall improvements were not evaluated for this I&M Plan, but may be considered for future projects.
4.3 Water Quality Improvement Projects
4.3.1 Kawa Stream Bank Improvements
The Department of Design and Construction recently completed an erosion protection planning study for Kawa Stream and its tributary, Kawa Ditch. The primary emphasis of the study was to develop a stream rehabilitation plan to identify and categorize erosion problems and then determine a proper rehabilitation practice. The project limits along Kawa Stream extends from Kaneohe Bay Drive upstream approximately 4,000 linear feet to the end of the concrete lined ditch near the Koa Kahiko Street dead end
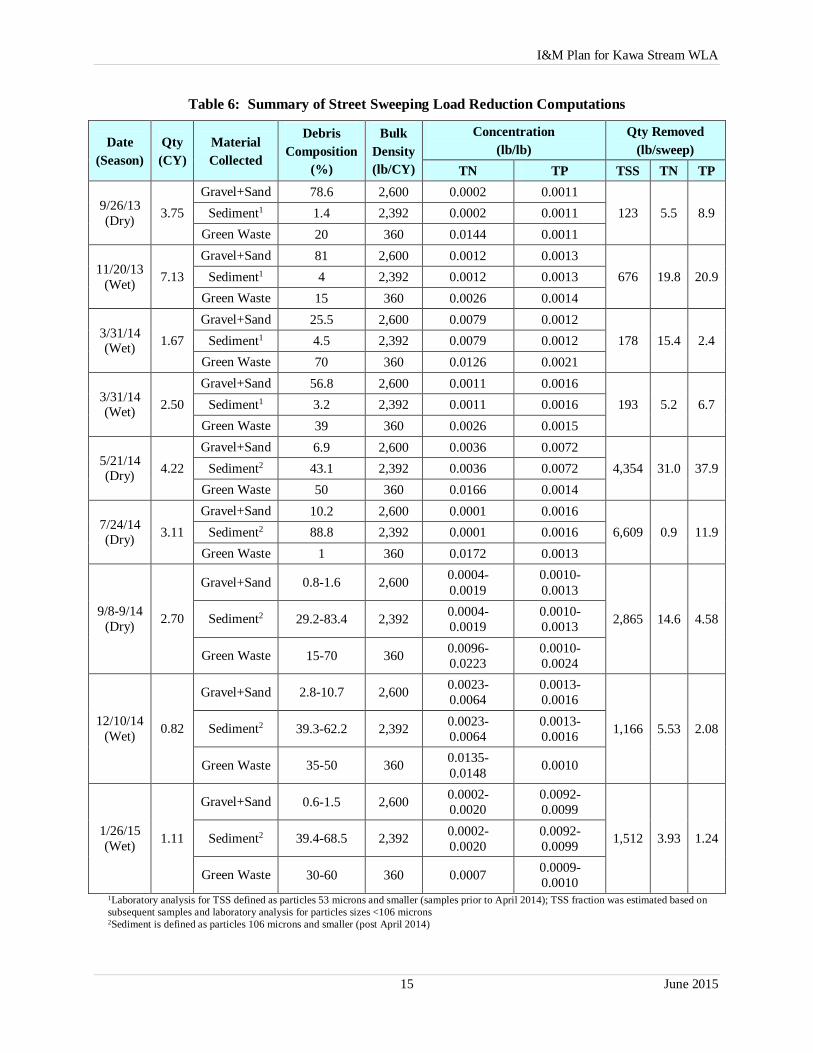
I&M Plan for Kawa Stream WLA
17 June 2015
(see Figure 6). Kawa Ditch begins at the point of confluence near the Kanela Street dead end and extends approximately 1,000 linear feet upstream to the culvert crossing at Mokulele Drive (see Figure 6).
Figure 6: Kawa Stream Bank Improvements Planning Study Project Limits
With the completion of the planning study in early 2014, the initial design phase is currently underway. It is anticipated that the complete stream rehabilitation improvement plan will incorporate a combination of restoration of hardened structures, re-vegetation of unlined stream banks, and installation of retaining walls. However, at the time of this writing, details on the specific improvements to be implemented were not available, and therefore, an erosion mitigation quantity could not be estimated.
4.4 DOH-IMP Recommendations
The DOH-IMP (2002) specified five major strategies to reducing pollutant loads and improving water quality in the Kawa Stream watershed. The report further identified the City’s expected role in four of the strategies as follows:
Reducing nutrients and sediments in watershed runoff (as an urban drainage system operator) Establishing vegetated buffers adjacent to the stream (as a riparian landowner) Improving the stream’s ability to move water, filter pollutants, and support aquatic life (as a
channel owner and operator), and Stabilizing the stream channel in ways that maintain its ability to filter pollutants and support
aquatic life (as a channel owner and operator).
4.4.1 Tools for reducing nutrients and sediments in watershed runoff
Specific actions that the City has taken to address this issue include:
Prohibiting herbicide use on vegetated stream banks and buffers; Committing to a public education and outreach program that builds awareness about sources
of pollution, alternative products, safe disposal of wastes, and stream function and history;
I&M Plan for Kawa Stream WLA
18 June 2015
Implementing routine street sweeping; Placing more trash cans in public places; Regular inspections and cleaning of catch basins; Implementing new LID requirements for new developments; and Conducting the Kawa Stream Bank Improvements Planning Study.
4.4.2 Tools for establishing vegetated buffers adjacent to stream
The DDC Kawa Stream Bank Improvements Planning Study was completed in early 2014. The first phase of design is currently underway and may include the following elements, as deemed appropriate:
Restoration of riparian vegetation to stabilize the stream banks; and Prohibiting the use of herbicides along the stream banks and in the stream.
4.4.3 Tools for stabilizing the stream channel and improving the stream’s ability to move water, filter pollutants, and support aquatic life
The City DFM currently maintains the portion of Kawa Stream and bank area between Kaneohe Bay Drive and Mokulele Drive as follows:
Clearing alien grasses from channel; Removing water-consuming alien vegetation; Planting trees along banks to provide partial shade; Removing built-up sediments within the stream channel; Conducting educational stream clean-ups; Establishing a “citizen’s watch” to prevent illegal dumping; and Constructing low flow channels in sections with concrete beds.
The specific activities noted above are part of the City’s standard practices and procedures but have not been included in the calculations to quantify TSS, TN, or TP load reductions. As more information becomes available on each of the specific activities, the City may determine a methodology to account for pollutant load reduction associated with these practices going forward.
4.5 Permanent BMP
It is not anticipated that permanent BMPs will be required to meet the TSS or nutrient load reductions; however, if it becomes necessary to further reduce pollutant loads, the City will identify potential permanent BMP options which may include installing catch basin inserts in several strategic locations. The decision to implement permanent BMPs will be made after the results of FY17 debris collection data is compiled and analyzed. If it is required, a revised I&M Plan will be submitted to the DOH by the end of FY18. Additional details on the implementation timeline are provided in Section 5.0.
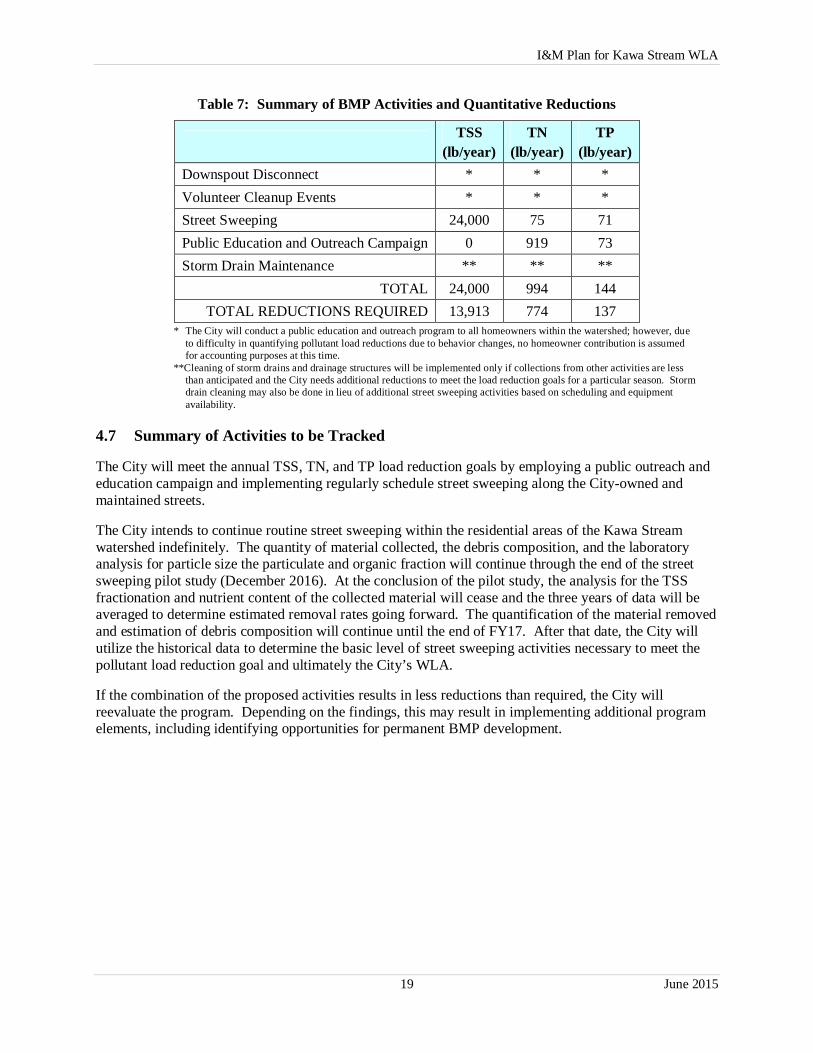
4.6 Summary of BMP Activities
The following table summarizes the estimated effectiveness of the various BMP activities to be implemented by the City.
I&M Plan for Kawa Stream WLA
19 June 2015
Table 7: Summary of BMP Activities and Quantitative Reductions
TSS (lb/year)
TN (lb/year)
TP (lb/year)
Downspout Disconnect * * * Volunteer Cleanup Events * * * Street Sweeping 24,000 75 71 Public Education and Outreach Campaign 0 919 73 Storm Drain Maintenance ** ** **
TOTAL 24,000 994 144 TOTAL REDUCTIONS REQUIRED 13,913 774 137
* The City will conduct a public education and outreach program to all homeowners within the watershed; however, due to difficulty in quantifying pollutant load reductions due to behavior changes, no homeowner contribution is assumed for accounting purposes at this time.
**Cleaning of storm drains and drainage structures will be implemented only if collections from other activities are less than anticipated and the City needs additional reductions to meet the load reduction goals for a particular season. Storm drain cleaning may also be done in lieu of additional street sweeping activities based on scheduling and equipment availability.
4.7 Summary of Activities to be Tracked
The City will meet the annual TSS, TN, and TP load reduction goals by employing a public outreach and education campaign and implementing regularly schedule street sweeping along the City-owned and maintained streets.
The City intends to continue routine street sweeping within the residential areas of the Kawa Stream watershed indefinitely. The quantity of material collected, the debris composition, and the laboratory analysis for particle size the particulate and organic fraction will continue through the end of the street sweeping pilot study (December 2016). At the conclusion of the pilot study, the analysis for the TSS fractionation and nutrient content of the collected material will cease and the three years of data will be averaged to determine estimated removal rates going forward. The quantification of the material removed and estimation of debris composition will continue until the end of FY17. After that date, the City will utilize the historical data to determine the basic level of street sweeping activities necessary to meet the pollutant load reduction goal and ultimately the City’s WLA.
If the combination of the proposed activities results in less reductions than required, the City will reevaluate the program. Depending on the findings, this may result in implementing additional program elements, including identifying opportunities for permanent BMP development.
I&M Plan for Kawa Stream WLA
20 June 2015
This page is intentionally left blank
I&M Plan for Kawa Stream WLA
21 June 2015
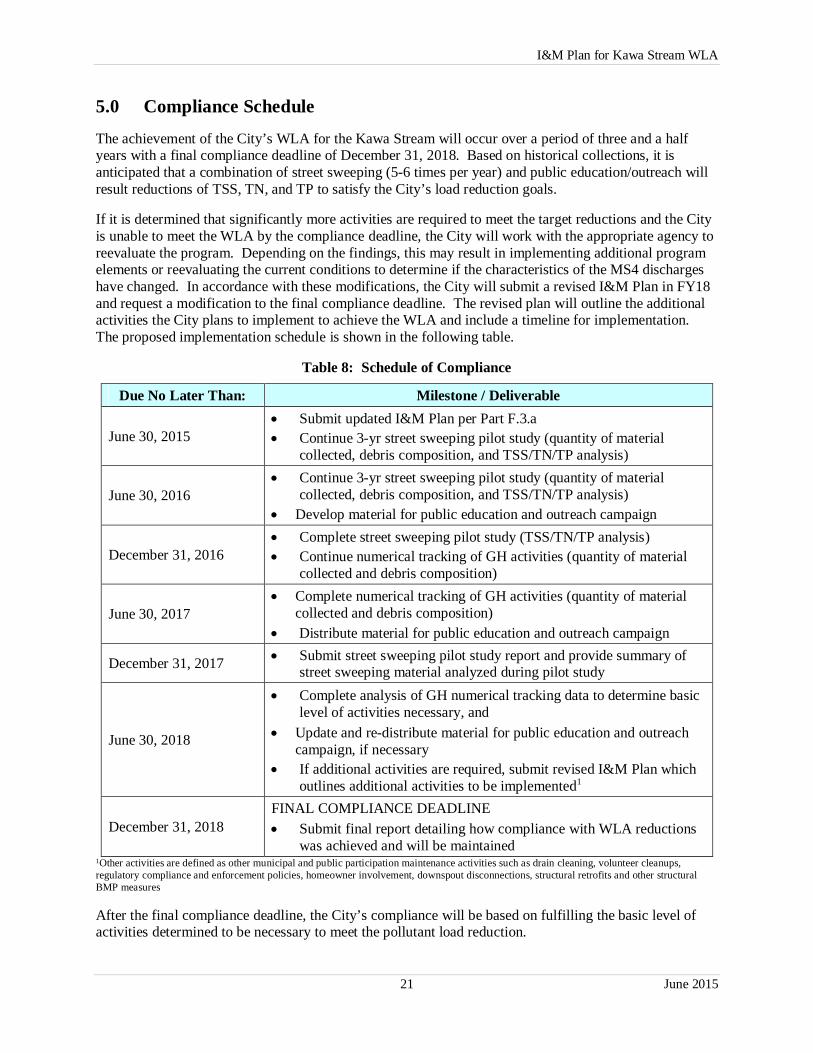
5.0 Compliance Schedule
The achievement of the City’s WLA for the Kawa Stream will occur over a period of three and a half years with a final compliance deadline of December 31, 2018. Based on historical collections, it is anticipated that a combination of street sweeping (5-6 times per year) and public education/outreach will result reductions of TSS, TN, and TP to satisfy the City’s load reduction goals.
If it is determined that significantly more activities are required to meet the target reductions and the City is unable to meet the WLA by the compliance deadline, the City will work with the appropriate agency to reevaluate the program. Depending on the findings, this may result in implementing additional program elements or reevaluating the current conditions to determine if the characteristics of the MS4 discharges have changed. In accordance with these modifications, the City will submit a revised I&M Plan in FY18 and request a modification to the final compliance deadline. The revised plan will outline the additional activities the City plans to implement to achieve the WLA and include a timeline for implementation. The proposed implementation schedule is shown in the following table.
Table 8: Schedule of Compliance
Due No Later Than: Milestone / Deliverable
June 30, 2015 Submit updated I&M Plan per Part F.3.a Continue 3-yr street sweeping pilot study (quantity of material
collected, debris composition, and TSS/TN/TP analysis)
June 30, 2016 Continue 3-yr street sweeping pilot study (quantity of material
collected, debris composition, and TSS/TN/TP analysis) Develop material for public education and outreach campaign
December 31, 2016 Complete street sweeping pilot study (TSS/TN/TP analysis) Continue numerical tracking of GH activities (quantity of material
collected and debris composition)
June 30, 2017 Complete numerical tracking of GH activities (quantity of material
collected and debris composition) Distribute material for public education and outreach campaign
December 31, 2017 Submit street sweeping pilot study report and provide summary of street sweeping material analyzed during pilot study
June 30, 2018
Complete analysis of GH numerical tracking data to determine basic level of activities necessary, and
Update and re-distribute material for public education and outreach campaign, if necessary
If additional activities are required, submit revised I&M Plan which outlines additional activities to be implemented1
December 31, 2018 FINAL COMPLIANCE DEADLINE Submit final report detailing how compliance with WLA reductions
was achieved and will be maintained 1Other activities are defined as other municipal and public participation maintenance activities such as drain cleaning, volunteer cleanups, regulatory compliance and enforcement policies, homeowner involvement, downspout disconnections, structural retrofits and other structural BMP measures
After the final compliance deadline, the City’s compliance will be based on fulfilling the basic level of activities determined to be necessary to meet the pollutant load reduction.
I&M Plan for Kawa Stream WLA
22 June 2015
Ultimately, it is the City’s goal to contribute to good stewardship of the land and ensure that water quality in and around the island of Oahu is safe and useable for all intended purposes. These activities are proposed to aid in achieving this goal.

I&M Plan for Kawa Stream WLA
23 June 2015
6.0 References
Center for Watershed Protection, “National Pollutant Removal Performance Database,” Version 3, September 2007.
Center for Watershed Protection, “New York State Stormwater Management Design Manual,” Appendix A, August 2010.
Chesapeake Stormwater Network, “Nutrient Accounting Methods to Document Local Stormwater Load Reductions in the Chesapeake Bay Watershed”, CSN Technical Bulletin No. 9, August 15, 2011.
City and County of Honolulu, Department of Environmental Services.
City and County of Honolulu, Department of Environmental Services, “National Pollutant Discharge Elimination System (NPDES) Municipal Separate Storm Sewer System (MS4) Permit No. HI S000002,” February 16, 2015.
City and County of Honolulu, Department of Facility Maintenance.
Crumpacker, Andrea L. and Steve Butkus, “Approaches to Defining TMDL Margins of Safety”, Weston Solutions, Inc., Water Environmental Federation, 2009.
Guo, Qizhong (George), “Correlation of Total Suspended Solids (TSS) and Suspended Sediment Concentration (SSC) Test Methods”, Prepared for New Jersey Department of Environmental Protection, November 2006.
Oceanit Laboratories, Inc., AECOS, Inc., and State of Hawaii, Department of Health, Environmental Planning Office, “Total Maximum Daily Loads of Total Suspended Solids, Nitrogen, and Phosphorus for Kawa Stream, Kaneohe, Hawaii”, March 2002.
State of Hawaii, Department of Health, “An Ecosystem Approach to Water Quality Standards”, 1977.
State of Hawaii, Department of Health, “Hawaii Administrative Rules, Title 11, Chapter 55,” May 27, 2009.
State of Hawaii, Department of Health, Environmental Planning Office, “How to Reduce Pollutant Loads and Improve Water Quality in Kawa Stream (Kaneohe, Oahu), A Total Maximum Daily Load Implementation Plan for Watershed Health”, October 2002.
State of Hawaii, Department of Health, Environmental Planning Office, “Allocations of Total Maximum Daily Loads of Total Suspended Solids, Nitrogen, and Phosphorus for Kawa Stream, Kaneohe, Hawaii”, June 2005.
www.epa.gov/osw/conserve/smm/wastewise/pubs/conversions.pdf
www.prh.noaa.gov/
www.water.epa.gov/lawsregs/lawsguidance/cwa/tmdl/TMDL-ch3.cfm

I&M Plan for Kawa Stream WLA
24 June 2015
This page is intentionally left blank

APPENDIX A:
CITY AND COUNTY OF HONOLULU DEPARTMENT OF ENVIRONMENTAL SERVICES DOWNSPOUT DISCONNECTION FIELD SURVEY
(2013)


45084004
45048093
45055026
45029013
45029010
45048011
45048016
45048025
4504808845048014
45029049
45029002
45051001
45051014
45051009
45029018
45051003
45051013
45029021
45051010
45029019
45029023
45051008
45051012
45055048
45048085
45029016
45055027
45048084
45029047
45051036
45029029
45029031
45055046
45052055
45084043
45051075
4505107045051086
45029008
4505107245051084
45048076
45051087
45029082
45051071
45048065
45059029
45051085
45029001
45084045
45048072
45052056
45055006
45029004
45029009
45051065
450290444502904345029037
45048077
45029080
45048071
45051078
45084053
45029041
45048073
45055008
45051074
45048090
45029081
45029028
45055005
45051062
45051059
45048082
4505206145051088
45029050
45051063
45029091
45029055
45051040
45048074
45029034
45055002
45029057
45051045
45051027
45052057
45051061
45051025
45051055
4504805945051043
45051066
45029063
45051024
45051026
45059006
45051049
45052062
45048070
45084054
45029065
45029060
45051080
45051042
45029068
45029072
45029062
45048062
45059004
45048029
45059003
45052023
45048052
45084078
45059002
45048031
45084079
4508407745084076
45055025
45084075
45052058
45084044
45048048
KULAULI ST
MAKA
LANI
ST
KANEOHE BAY DR
PUOH
ALA S
T
HILINAI ST
IHILANI ST
PUA INIA ST
WAIAW
I ST
PUA A
LOWA
LO S
T
WAIN
ANA S
T
ONEKAI ST
IOLE ST
WENA ST
PUAAE RD MOKU
LELE
DR
PUA M
AKAH
ALA S
T
MELI PL
LANI
POLA
PL
POPO
KI ST
PUULUNA PL
KAHOWAA PL
HOENE PL
PIKOILOA PL
MOKULELE PL
0 200 400 600 800100Feet
DetailedMap Area
OAHU
LegendKawa Stream TMDL WatershedRoofs gutters with direct connection to storm drainage systemDisconnected roof gutters that drain to impervious surfacesCCH MS4 Coverage Area
¯

This page is intentionally left blank.

45060045
45084004
45070016
45043063
45048093
45089058
45089059
45048011
45067051
45065015
45065012
45048016
45048025
45048005
4504808845048014
45067034
45048022
45043025
45043028
45043026
45043024
45043020
45043011
45043021
4504303045043018
45044035
45051014
45063001
45051009
45044034
45051003
45051013
45051010
45051008
45051012
45067005
45067014
45067007
45061015
45043061
45060029
45048085
45060026
45067049
4506003045089012
45043062
45062031
45060014
4506107845067013
45048084
45067008
4507004645070030
45067010
45043073
45084043
45070027
45070029
45070004
45060044
45067040
45067015
45062037
4506004845070032
45067004
45067041
4506203845089024
45070034
45051001
45070013
45060023
45089064
45061056 45067030
45089073
45067012
45070023
45089010
45084029
45067037
45067055
45089029
45062047
45061079
45084008
45089071
45048065
45070003
45084045
45065044
4506702345067031
45048072
45061070
45084023
45065017
45065083
45065021
45048071
45061101
45062049
45084053
4506604345067052
45067048
45065003
45048090
45089034
45084020
45061084
45061075
45070050
45060011
45084044
45060037
45067063
45070008
45084011
45060015
45089004
45089038
45061077
45061100
45084038
45060049
45070044
45062043
45062046
45048082
45084024
45061038
45065084
45061062
45048052
45060007
45065007
45084010
45067059
45065085
45060012
45060060
45061066
45061073
45060016
45048073
45060010
45084013
45062030
45084036
45061003
45070009
45060036
45051045
45084034
45060003
45067025
45051027
45060034
45067026
4506005345061009
45061088
45070026
45060006
45089007
45051025
45051055
45089006
45065005
45070041
45061082
45060038
45062027
45061006
45061074
45061013
45061085
45051024
45089003
45089061
45063009
45067062
45062002
45061023
45051026
45065081
45061026
45060052
45067058
45089035
45065086
45062028
45061050
45062021
45070019
45061024
45062014
45067044
45060057
45048048
45060024
45048003
45062022
45051049
45061087
45062012
45061022
45048070
45060059
4506103045060022
45061053
45048031
45089040
45065010
45061025
45070020
45062023
45070024
45061052
45061049
45065040
45060020
45067032
45061046
45043067
45084027
45084018
45067002
45051043
45062013
45089027
45065039
45062034
45084054
45084026
4504802945048030
45043014
45089037
45048074
45089055
45084077
45084078
4508407645084075
45065047
45084079
45043014
450480774504807645051042
45043072
45048059
450660064506300845062005
45048049
45044002
45051059 4504806245051078
45043044 45062032
45089044
NAMOKU ST
MOKU
LELE
DR
KENELA ST
KOA KAHIKO ST
KANEOHE BAY DR
PUALI ST
POPO
KI ST
IHILANI ST
PAHIKAUA ST
AUMOKU ST
IOLE ST
MEALELE ST
PUAAE RD
NAKULUAI ST
MAKA
LANI
ST
DUNCAN DR
MEAKAUA ST
KAM HWY AKIMALA ST
NAKULUAI PL
PAKIKO PL
MIKIHILINA ST
PAHIK
OLI P
L
POPOKI PL
POUHANUU PL
NAMOKU PL
MOKULELE PL
NUKUMOMI PL
AKIMALA PL
0 200 400 600 800100Feet
DetailedMap Area
OAHU
LegendKawa Stream TMDL WatershedRoofs gutters with direct connection to storm drainage systemDisconnected roof gutters that drain to impervious surfacesCCH MS4 Coverage Area
¯

This page is intentionally left blank.
45103001
4510300545103005
45043063
45103008
4509202445092025
45092026 45092012
45089055
45089059
45089058
45107014
45063044
45066050
45067051
45067034
4509201945092020
45043025
45043028
45043026
45092023
45043024
45043020
45043011
45043021
4504303045043018
4504401945044016
4504401745044040
4504402245044021
45092006
4509300645092005
45106013
45044002
45093005
45063005
45089054
4504403445044035
45066035
4504307345063001
45063041
45043072
45063004
45092028
4509200245063031
45092027
45106014
45043061
45092047
45092044
45067049
45043062
4509204145092048
45066014
45062031
45089066
45089029
45106012
45093017
45092086
45093014
45106026
45107013
45092021
45092085
45092003
45089067
45092042
4509205045063045
45067040
45062037
45067004
45067041
45062038
45066029
45089024
45092064
4506602645066017
45092043
45092073
45089064
45061056 45067030
45066016
45089073
45092058
45066012
45067055
45092065
45066011
45067037
45106017
45107015
45089052
45107007
45062047
45089071
45067005
45092063
45092070
4506702345067031
45092067
45092056
45063046
45063013
45092054
45061101
45062049
4506605845063036
4506604345067052
45067048
45066056
45089034
45093015
45063026
45063028
45089044
45061084
4506302545066037
45089053
45060011
45089027
45067063
45089038
45063049
45061100
45107009
45063062
45092072
45062043
45092079
45060015
45089051
45062046
45092068
45061062
45060007
45063033
45066023
45067059
45061066
45092039
4506001645060010
45092053
45062030
45060003
45043044
45067025
45092059
45066032
45067026
45062032
45063051
45089049
45061088
45066025
45060006
45063009
45062027
45092055
45044039
45061085
45089043
45089061
45106006
45092009
45092077
45067062
45062002
45063020
45066022
45067058
45063072
45092036
45089035
45062028
45062021
45062014
45067044
45066006
45062022
45061087
45062012
45061050
45061053
45089040
45092031
45062023
45061052
45063008
45066053
45060020
45062034
45063069
4506301845063019
45062005
45067032
45089047
45043067
45063057
45063068
45067002
45062013
45106011
45089022
45063061
45106025
45066061
45043014
45060012
45089037
4510603045106028
45093018
45107003
451070124510701145107010
45106020
4510603745106034
45107004
45061049
45106032 45106029
45107008
45089015
45043014
45106031
45106022
4510600345106002
45060014 45060022
45106036
45107022
45106004
4510702145107019
45067007
4510701845107020
45061082
45093022
45093002
4506701045060024 45067015
MOKULELE DR
KAM HWY
NAMOKU ST
AKIMALA ST
PUALI ST
PUAHUULA PL
OHAHA ST
NAKULUAI ST
DUNCAN DRMEALELE ST
KUMAKUA PL
KENELA ST
LELEUA PL
PAILAKA PL
KOA KAHIKO ST
UALANI PL
NAKULUAI PL
NIHINA PL
KUU HOME PL
NALIIKO PL
KONALE PL
LELEUA WAY
WALIWALI PL
OHAHA PLAKIMALA PL
NOWEO PL
KOA KAHIKO ST
0 200 400 600 800100Feet
DetailedMap Area
OAHU
LegendKawa Stream TMDL WatershedRoofs gutters with direct connection to storm drainage systemDisconnected roof gutters that drain to impervious surfacesCCH MS4 Coverage Area
¯

This page is intentionally left blank.
45103001
4510300545103005
45103008
4509202445092025
45093026
45092026 45092012
45107036
45107014
45063044
45107039
4509201945092020
45092023
45093002
4504401645044017
45044040
45044022
45092006
45093006
45093010
45092005
45106013
45093005
45063005
4509300945066035
45063041
45092028
4509200245063031
45092027
45106014
45092047
4509204445093012
450440214509204145092048
45066014
45107015
45106012
45093017
45092086
45093014
45106026
45093018
45107013
45093022
45092021
45092085
45092003
45092042
4509205045063045
45107037
45066029
45092064
4506602645066017
45092043
45092073
45066016
45092058
45066012
45092065
45066011
45106017
45089052
45107007
45092063
45092070
45092067
45092056
45063046
45063013
45092054
4506605845063036
45066056 45093015
45063026
45063028
4506302545066037
45107045
45063049
45090086
45107009
45063062
45092072
45092079
45089051
45092068
45063033
45066023
45090085
45092039
45092053
45090082
45092059
4506603245063051
45089049
45066025
45092055
45044039
45106006
45092009
45092077
45063020
45066022
45106020
45092036
45092031
45066053 4509008345063069
45063018
45063019
450890474508905445063004
45063057
45063068
45106011
45063061
45089066
45106025
45066061
45107028
4510603045106028
45107003
4510701245107011
45107077
45107067
45107010
4510603745106034
45107004
45107042
45106032 45106029
45107023
45107019
45107029
45089053
45107066
45043044
45107008
45107021
45107079
45107027
45107047
45063072
45107018
45106031
45106022
45106003
45107071
45107024
4510706445107065
45107044
4510707645107080
45043063
45107046
45107022
45107056
45107075
45106002
4510702045107017
45107043
45089067
45107058
45107072
4510706045107059
45107054
45107062
45107055
45106036
45107063
45106004
45107035
45044002 4509007845066050
45044019
MOKULELE DR
KAM HWY
LELEUA PL
OHAHA ST
NAMOKU ST
LIPALU ST
NAKULUAI ST
AKIMALA STPUAHUULA PL
KUMAKUA PL
PAILAKA PL KOA KAHIKO ST
NIHINA PL
MAHINUI RD
LELEUA LP
KUAUA WAY
NALIIKO PL
KONALE PL
LELEUA WAY
OPUHEA PL
WALIWALI PL
OHAHA PL
KOIAWE WAY
LIPALU PL
NOWEO PL
0 200 400 600 800100Feet
DetailedMap Area
OAHU
LegendKawa Stream TMDL WatershedRoofs gutters with direct connection to storm drainage systemDisconnected roof gutters that drain to impervious surfacesCCH MS4 Coverage Area
¯

This page is intentionally left blank.

45084004
45046004
45046024
45046018
45046006
45048093
45100025
45100034
45100017
45064022
45100027
45100028
45100037
45100022
45064019
45048041
45048011
45065015
45065012
45048016
45048025
45048005
4504808845048014
45048022
45046009
45100031
45064023
45064027
45100010
45046021
45046019
45064028
45100011
45101025
4510001345100012
45101028
45100035
45100046
4510003045100033
45100039
45046023
45100016
45046002
45100043
45100038
4510002045100021
45100019
45048085
45100029
4510000645100001
45100008
45100005
45065070
45048084
45100009
4507004645070030
45065061
45100007
45084043
45070027
45101029
45100049
45070029
45070032
45048076
45084008
45048065
45065039
45084045
45065044
45048072
45101034
45065017
45100004
45065083
45048077
45065021
45065036
45100051
45048071
45048073
45048048
45048090
4506504045065031
45084044
4506503345084011
45065066
45048047
4506506745065053
45101039
45065034
45070044
45048037
45048082
45065084
45100052
45048052
45084010 45065085
45065055
45048074
45101040
45084013
45101035
45065064
45065024
45048059
45065054
45100050
45048049
45101033
45065023
45048063
45048042
45065081
45065086
45101036
45070019
45048003
45048070
45048031
45070020
45065065
45101038
45048062
45065029
4504802945048030
4506504745070026 4506501045070041
45101024
4506507245070023 45065073
45059002
4506400345064009
KANEOHE BAY DR
NAMO
KU ST
KEANA RD
POPO
KI ST
MOKU
LELE
DR
IOLE ST
PUAAE RD
IOLE
PL
POPOKI PL
MALULANI ST
NOHONANI PL
MIHA ST
IKENAKAI ST
HIKIW
ALE S
T
MOAKAKA PL
MIMO PLKULAULI S
T
PAHIKAUA ST
PAKIKO PL
MOAKAKA WAY
NEEMUA PL
MOKULELE PL
NEEPU PL
NEEPAPA PL
0 200 400 600 800100Feet
DetailedMap Area
OAHU
LegendKawa Stream TMDL WatershedRoofs gutters with direct connection to storm drainage systemDisconnected roof gutters that drain to impervious surfacesCCH MS4 Coverage Area
¯

This page is intentionally left blank.
45103005
45070016
45090020
4509007845089055
45089059
45089058
45100034
45100025
45064022
45064017
45100028
45064002
45064019
45100027
45090032
45090018
45089013
45066050
45067051
45090011
45065015
45065012
45067034
45090016
45048005
45064027
45100031
45064023
45093010
45064028
45063005
45089054
4509004445090045
4509300945066035
45063001
45090053
45064003
45100030
45100035
45063004
45064011
45100033
4506401245064009
45067005
4509200245063031
45064013
45067014
45067007
45061015
45064014
45100029
45092047
45092044
45067049
45093012
45089012
4509204145092048
45066014
45061078
45065070
45067013
45065075
45089066
45089029
45067008
45093017
4507004645070030
45093014
45067010
45065061
45093018
45090052
45070027
45046021
45089067
45092042
45070029
45092050
45070004
45090031
45067040
45067015
45065076
45090041
45070032
45067004
45067041
45066029
45089024
4507003445070013
4506602645066017
45092043
45092073
45089064
45067030
45066016
45089073
45067012
45070023
45066012
45067055
45092065
45066011
45089010
45067037
45090029
45090058
45090030
45090063
45089052
45062047
45061079
45090027
45084008
45089071
45090038
45065039
45092070
45070003
45065044
4506702345067031
45090066
45061070
45084023
45092067
45065017
45065083
45090047
45065036
45063013
4506204945089016
45066058
45090034
4506604345067052
45067048
45066056
45065003
45089034
45093015
45065040
45084020
45065047
45063026
45063028
45089044
45061084
4506302545066037
45089042
45061075
45070050
45089015
45065031
45089022
45089053
45089027
45065033
45067063
45070008
45084011
45065066
45089004
45065067
45090075
45065053
45089038
45061077
45090086
45089002
45092072
45065034
45070044
45062043
45090037
45092079
45089051
45062046
45084024
45090004
45065084
45092068
45065007
45084010
45089001
45090049
45063033
45090085
45067059
45065085
45065055
45065021
45061066
45090071
45061073
45092039
45090040
4508401345084036
45070009
45090082
45084034
45067025
45065064
45065071
45066032
45067026
45065073
45089049
45061088
45066025
45070026
45089007
45090069
45065054
45089006
45065005
45070041
45061082
45063009
45062027
45065072
45061074
45061013
45061085
45089043
45089003
45089061
45090064
45092077
45067062
45062002
45065081
45063020
45067058
45089035
45092003
45065086
45062028
45062021
45070019
45090010
45062014
45067044
45066006
45048003
45062022
45061087
45062012
45090015
45061022
45089040
45065010
45070020
45062023
45090046
45070024
45061049
45063008
45065065
45066053 45090083
45090014
45061023
45063018
45063019
45062005
45067032
45089047
45061046
45084027
45084018
45067002
45062013
45084026
45090035
45089037
45061050
45092064
45063036
45062030
45066023
4504802245084029 4510003745065023 4506502945065024
45103005
45063051
4509302245103005
45084038
45061009
45046019
45061024
45084044
45062038
45062031
45092053
NAMO
KU ST
MOKULELE DR
NAKULUAI ST
LEHU
UILA
ST
LUPO
ST
MIKIHILINA ST
PAHIKAUA ST
AWELE PL
KEANA RD
KENELA ST
PUALI ST
HIKIW
ALE
ST
MEALELE ST
POPOKI ST
POPOKI PL
AKIMALA ST
KOA KAHIKO ST
NAKULUAI PL
PAKIKO PL
PAHIK
OLI P
L
POUHANUU PL
NAMOKU PL
NALIIKO PL
NUKUMOMI PL
NEEPU PL
AKIMALA PL
HIKIWALE PL
LEHUUILA PL
NOWEO PL
0 200 400 600 800100Feet
DetailedMap Area
OAHU
LegendKawa Stream TMDL WatershedRoofs gutters with direct connection to storm drainage systemDisconnected roof gutters that drain to impervious surfacesCCH MS4 Coverage Area
¯
This page is intentionally left blank.