i0fithq0flfiffiff0fl jffftq0fl ffα fiλth a−fl.th≥ffi−...
TRANSCRIPT

Fall 2015International Journal of the A
cademic Business W
orldVolum
e 9 Issue 2
Fall 2015 Volume 9 Issue 2
International Journal of the Academic Business World
CONTENTS
Testing Major Factors for Reducing Obstacles to Product Innovation Success
Tor Guimaraes Marcelo Seido Nagano amp Curtis Armstrong 11
Acceptance of Change Exploring the Relationship among Psychometric Constructs and Employee Resistance
Brian Dunican amp Ric Keaster 27
The Origin and Construct of Cloud ComputingNozar Daylami 39
Optimal Portfolios and the R Programming LanguageJames A Turner 47
INTERNATIONAL JOURNAL OF THE ACADEMIC BUSINESS WORLD
JW PRESS
MARTIN TENNESSEE
Copyright copy2015 JW Press
All rights reserved No part of this publication may be reproduced stored in a retrieval system or transmitted in any form or by any means electronic mechanical photocopying recording or otherwise without the prior written permission of the publisher
Published by
JW Press
PO Box 49
Martin Tennessee 38237
Printed in the United States of America
Reviewer Country State Region Affiliation
Ahmadi Ali United States KY Morehead State UniversityAkdere Mesut United States WI University of Wisconsin-MilwaukeeAlkadi Ghassan United States LA Southeastern Louisiana UniversityAllen Gerald L United States IL Southern Illinois Workforce Investment BoardAllison Jerry United States OK University of Central OklahomaAltman Brian United States WI University of Wisconsin-MilwaukeeAnderson Paul United States CA Azusa Pacific UniversityAnitsal Ismet United States TN Tennessee Technological UniversityAnitsal M Meral United States TN Tennessee Technological UniversityArney Janna B United States TX The University of Texas at BrownsvilleAwadzi Winston United States DE Delaware State UniversityBain Lisa Z United States RI Rhode Island CollegeBarksdale W Kevin United States TN Grand Canyon UniversityBarrios Marcelo Bernardo Argentina EDDE-Escuela de Direccioacuten de EmpresasBartlett Michelle E United States SC Clemson UniversityBeaghan James United States WA Central Washington UniversityBello Roberto Canada Alberta University of LethbridgeBenson Ella United States VA Cambridge CollegeBenson Joy A United States WI University of Wisconsin-Green BayBeqiri Mirjeta United States WA Gonzaga UniversityBerry Rik United States AR University of Arkansas at Fort SmithBeyer Calvin United States GA Argosy UniversityBlankenship Joseph C United States WV Fairmont State UniversityBoswell Katherine T United States TN Middle Tennessee State UniversityBridges Gary United States TX The University of Texas at San AntonioBrown-Jackson Kim L United States The National Graduate SchoolBuchman Thomas A United States CO University of Colorado at BoulderBurchell Jodine M United States TN Walden UniversityBurrell Darrell Norman United States VA Virginia International UniversityBurton Sharon L United States DE The National Graduate SchoolBush Richard United States MI Lawrence Technological UniversityByrd Jane United States AL University of MobileCaines W Royce United States SC Southern Wesleyan UniversityCano Cynthia M United States GA Augusta State UniversityCano Cynthia Rodriguez United States GA Georgia College amp State UniversityCarey Catherine United States KY Western Kentucky UniversityCarlson Rosemary United States KY Morehead State UniversityCase Mark United States KY Eastern Kentucky UniversityCassell Macgorine United States WV Fairmont State UniversityCassell Macgorine United States WV Fairmont State UniversityCaudill Jason G United States TN American College of Education
Board of Reviewers
Editor
Dr Edd R Joyner EddJoynerAWoICorg
Reviewer Country State Region Affiliation
Hadani Michael United States NY Long Island University - CW Post CampusHadaya Pierre CanadaHale Georgia United States AR University of Arkansas at Fort SmithHaley Mary Lewis United States TN Cumberland UniversityHallock Daniel United States AL University of North AlabamaHanke Steven United States IN Indiana University-Purdue UniversityHaque MD Mahbubul United States NY SUNY Empire State CollegeHarper Betty S United States TN Middle Tennessee State UniversityHarper Brenda United States WV American Public UniversityHarper J Phillip United States TN Middle Tennessee State UniversityHarris Kenneth J United States IN Indiana University SoutheastHarris Ranida Boonthanom United States IN Indiana University SoutheastHashim Gy R Malaysia Selangor Universiti Teknologi MARAHasty Bryan United States OH Air Force Institute of TechnologyHayrapetyan Levon United States TX Houston Baptist UniversityHedgepeth Oliver United States AK University of Alaska AnchorageHenderson Brook United States CO Colorado Technical UniversityHicks Joyce United States IN Saint Maryrsquos CollegeHilary Iwu United States KY Morehead State UniversityHills Stacey United States UT Utah State UniversityHillyer Jene United States KS Washburn UniversityHinton-Hudson Veronica United States KY University of LouisvilleHoadley Ellen United States MD Loyola College in MarylandHodgdon Christopher D United States VT University of VermontHollman Kenneth W United States TN Middle Tennessee State UniversityHoughton Joe Ireland Dublin University College DublinHu Tao United States TN King CollegeIslam Muhammad M United States WV Concord UniversityIwu Hilary O United States KY Morehead State UniversityIyengar Jaganathan United States NC North Carolina Central UniversityIyer Uma J United States TN Austin Peay State UniversityJack Kristen United States MI Grand Valley State UniversityJackson Steven R United States MS University of Southern MississippiJagoda Kalinga Canada Alberta Mount Royal CollegeJennings Alegra United States NY Sullivan County Community CollegeJerles Joseph F United States TN Austin Peay State UniversityJohnson Cooper United States MS Delta State UniversityJohnston Timothy C United States TN Murray State UniversityJones Irma S United States TX The University of Texas at BrownsvilleJoyner Edd R United States TN Academic Business WorldJustice Patricia United States Montage Education TechnologyKaya Halil United States KY Eastern Kentucky UniversityKeller Gary F United States WI Cardinal Stritch UniversityKennedy R Bryan United States AL Athens State UniversityKent Tom United States SC College of CharlestonKephart Pam United States IN University of Saint FrancisKilburn Ashley P United States TN University of Tennessee at MartinKilburn Brandon United States TN University of Tennessee at MartinKilgore Ron United States TN University of Tennessee at MartinKing David United States TN Tennessee State UniversityKing Maryon F United States IL Southern Illinois University Carbondale
Reviewer Country State Region Affiliation
Cezair Joan United States NC Fayetteville State UniversityChan Tom United States NH Southern New Hampshire UniversityChang Chun-Lan Australia Queensland The University of QueenslandChen Fang Canada Manitoba University of ManitobaChen Steve United States KY Morehead State UniversityClayden SJ (Steve) United States AZ University of PhoenixCochran Loretta F United States AR Arkansas Tech UniversityCoelho Alfredo Manuel France UMR MOISA-Agro MontpellierCollins J Stephanie United States NH Southern New Hampshire UniversityCosby-Simmons Dana United States KY Western Kentucky UniversityCox Betty United States TN University of Tennessee at MartinCox Susie S United States LA McNeese State UniversityCunningham Bob United States LA Grambling State UniversityDawson Maurice United States CO Jones International UniversityDeng Ping United States MO Maryville University Saint LouisDennis Bryan United States ID Idaho State UniversityDeschoolmeester Dirk Belgium Vlerick Leuven Gent Management SchoolDi Hui United States LA Louisiana Tech UniversityDurden Kay United States TN University of Tennessee at MartinDwyer Rocky Canada Alberta Athabasca UniversityEl-Kaissy Mohamed United States AZ University of PhoenixEppler Dianne United States AL Troy StateEssary Michael United States AL Athens State UniversityEtezady Noory Iran Nova Southeastern UniversityEthridge Brandy United States OR Social Science Public Policy and Health ResearcherFallshaw Eveline M Australia RMIT UniversityFausnaugh Carolyn J United States FL Florida Institute of TechnologyFay Jack United States KS Pittsburg State UniversityFestervand Troy A United States TN Middle Tennessee State UniversityFinch Aikyna United States CO Strayer UniversityFinlay Nikki United States GA Clayton College and State UniversityFlanagan Patrick United States NY St Johnrsquos UniversityFleet Greg Canada New Brunswick University of New Brunswick in Saint JohnFontana Avanti Indonesia University of IndonesiaFoster Renee United States MS Delta State UniversityFry Jane United States TX University of Houston-VictoriaGarlick John United States NC Fayetteville State UniversityGarrison Chlotia United States SC Winthrop UniversityGarsombke Thomas United States SC Claflin UniversityGates Denise United States CO DampD SolutionsGautier Nancy United States AL University of MobileGifondorwa Daniel United States NM Eastern New Mexico UniversityGlickman Leslie B United States AZ University of PhoenixGoodrich Peter United States RI Providence CollegeGrant Jim United Arab Emirates American University of SharjahGreenberg Penelope S United States PA Widener UniversityGreer Timothy H United States TN Middle Tennessee State UniversityGriffin Richard United States TN University of Tennessee at MartinGrizzell Brian C United States Online Walden UniversityGulledge Dexter E United States AR University of Arkansas at MonticelloGupta Pramila Australia Victoria
Reviewer Country State Region Affiliation
Newport Stephanie United States TN Austin Peay State UniversityNichols Charles ldquoRandyrdquo United States KY Mid-Continent UniverssityNinassi Susanne United States VA Marymount UniversityNixon Judy C United States TN University of Tennessee at ChattanoogaOguhebe Festus United States MS Alcorn State UniversityOkafor Collins E United States TX Texas AampM International UniversityOrsquoKeefe Robert D United States IL DePaul UniversityOnwujuba-Dike Christie United States IN University of Saint FrancisOtero Rafael United States TX The University of Texas at BrownsvilleOwens Valerie United States SC Anderson CollegePacker James United States AR Henderson State UniversityPalmer David K United States NE University of Nebraska at KearneyPatton Barba L United States TX University of Houston-VictoriaPayne Alina R United States CAPentildea Leticia E United States WI University of Wisconsin-La CrossePetkova Olga United States CT Central Connecticut State UniversityPetrova Krassie New Zealand Auckland University of TechnologyPhillips Antoinette S United States LA Southeastern Louisiana UniversityPittarese Tony United States TN East Tennessee State UniversityPotter Paula United States KY Western Kentucky UniversityPowers Richard United States KY Eastern Kentucky UniversityPresby Leonard United States NJ William Paterson UniversityRedman Arnold United States TN University of Tennessee at MartinRegimbal Elizabeth E United States WI Cardinal Stritch UniversityReichert Carolyn United States TX The University of Texas at DallasRen Louie United States TX University of Houston-VictoriaRiley Glenda United States IN Arkansas Tech UniversityRim Hong United States PA Shippensburg UniversityRoach Joy United States KY Murray State UniversityRobinson Martha D United States TN The University of MemphisRood A Scott United States MI Grand Valley State UniversityRoumi Ebrahim Canada New Brunswick University of New BrunswickRoush Melvin United States KS Pittsburg State UniversityRussell-Richerzhagen Laura United States AL Faulkner UniversitySanders Tom J United States AL University of MontevalloSands John United States WA Western Washington UniversitySarosa Samiaji Indonesia Atma Jaya Yogyakarta UniversitySarwar Chaudhary Imran Pakistan Creative ResearcherSchaeffer Donna M United States VA Marymount UniversitySchechtman Greg United States OH Air Force Institute of TechnologySchindler Terry United States IN University of IndianapolisSchmidt Buffie United States GA Augusta State UniversitySchuldt Barbara United States LA Southeastern Louisiana UniversitySelvy Patricia United States KY Bellarmine UniversityService Robert W United States AL Samford UniversityShao Chris United States TX Midwestern State UniversityShipley Sherry United States IN Trine UniversityShores Melanie L United States AL University of Alabama at BirminghamSiegel Philip United States GA Augusta State UniversitySimpson Eithel United States OK Southwestern Oklahoma State UniversitySingh Navin Kumar United States AZ Northern Arizona University
Reviewer Country State Region Affiliation
Kitous Bernhard FranceKluge Annette Switzerland St Gallen University of St GallenKorb Leslie United States NJ Georgian Court UniversityKorte Leon United States SD University of South DakotaKorzaan Melinda L United States TN Middle Tennessee State UniversityKray Gloria Matthews United States AZ University of PhoenixKuforiji John United States AL Tuskegee UniversityLamb Kim United States OH Stautzenberger CollegeLatif Ehsan Canada British Columbia University College of the CaribooLee Jong-Sung United States TN Middle Tennessee State UniversityLee Minwoo United States KY Western Kentucky UniversityLeonard Jennifer United States MT Montana State University-BillingsLeonard Joe United States OH Miami UniversityLeupold Christopher R United States NC Elon UniversityLim Chi Lo United States MO Northwest Missouri State UniversityLin Hong United States TX University of Houston-DowntownLindstrom Peter Switzerland University of St GallenLong Jamye United States MS Delta State UniversityLowhorn Greg United States FL Pensacola Christian CollegeLyons Paul United States MD Frostburg State UniversityMarquis Gerald United States TN Tennessee State UniversityMason David DM New ZealandMathews Rachel United States VA Longwood UniversityMavengere Nicholas Blessing Finland University of TampereMayo Cynthia R United States DE Delaware State UniversityMcDonough Darlene M United States St Bonaventure UniversityMcGowan Richard J United States IN Butler UniversityMcKechnie Donelda S United Arab Emirates American University of SharjahMcKenzie Brian United States CA California State University East BayMcManis Bruce United States LA Nicholls State UniversityMcNeese Rose United States MS University of Southern MississippiMcNelis Kevin United States NM New Mexico State UniversityMedina Carmen I Figueroa Puerto Rico PR University of Puerto Rico MayaguezMello Jeffrey A United States FL Barry UniversityMello Jim United States CT University of HartfordMeyer Timothy P United States WI University of Wisconsin-Green BayMitchell Jennie United States IN Saint Mary-of-the-Woods CollegeMlitwa Nhlanhla South AfricaMollica Kelly United States TN The University of MemphisMoodie Douglas R United States GA Kennesaw State UniversityMoore Bradley United States AL University of West AlabamaMoore Gregory A United States TN Austin Peay State UniversityMoore Paula H United States TN University of Tennessee at MartinMoraes dos Santos Andreacute Brazil Universidade do Vale do ItajaiacuteMorrison Bree United States FL Bethune-Cookman CollegeMosley Alisha United States MS Jackson State UniversityMosquera Inty Saez Cuba Villa Clara Universidad Central ldquoMarta Abreurdquo de Las VillasMotii Brian United States AL University of MontevalloMouhammed Adil United States IL University of Illinois at SpringfieldNegbenebor Anthony United States NC Gardner-Webb UniversityNeumann Hillar United States SD Northern State University
Reviewer Country State Region Affiliation
Zeng Tao Canada Ontario Wilfrid Laurier UniversityZhou Xiyu (Thomas) United States AK University of Alaska FairbanksZiems Wendy United States OH Stautzenberger College
Reviewer Country State Region Affiliation
Smatrakalev Georgi United States FL Florida Atlantic UniversitySmith Allen E United States FL Florida Atlantic UniversitySmith JR United States MS Jackson State UniversitySmith Nellie United States MS Rust CollegeSmith W Robert United States MS University of Southern MississippiSobieralski Kathleen L United States MD University of Maryland University CollegeSoheili-Mehr Amir H Canada Ontario University of TorontoSridharan Uma V United States SC Lander UniversitySt Pierre Armand Canada Alberta Athabasca UniversitySteerey Lorrie United States MT Montana State University-BillingsStokes Len United States NY Siena CollegeStone Karen United States NH Southern New Hampshire UniversityStover Kristie United States VA Marymount UniversityStuart Randy United States GA Kennesaw State UniversityStumb Paul C United States TN Cumberland UniversitySwisshelm Beverly Ann United States TN Cumberland UniversityTalbott Laura United States AL University of Alabama at BirminghamTanguma Jesuacutes United States TX The University of Texas-Pan AmericanTanigawa Utako United States AR Itec International LLCTerrell Robert United States TN Carson-Newman CollegeTerry Kathleen Y United States FL Saint Leo UniversityTheodore John D United States FL Warner UniversityThompson Sherwood United States KYThrockmorton Bruce United States TN Tennessee Technological UniversityTotten Jeffrey United States LA McNeese State UniversityTracy Daniel L United States SD University of South DakotaTran Hang Thi United States TN Middle Tennessee State UniversityTrebby James P United States WI Marquette UniversityTrzcinka Sheila Marie United States IN Indiana University NorthwestUdemgba A Benedict United States MS Alcorn State UniversityUdemgba Benny United States MS Alcorn State UniversityUjah Nacasius United States TX Texas AampM International UniversityUrda Julie Inited States RI Rhode Island CollegeValle Matthew ldquoMattrdquo United States NC Elon Universityvan der Klooster Marie Louise Australia Victoria Deakin UniversityVehorn Charles United States VA Radford UniversityVoss Richard Steven United States AL Troy UniversityVoss Roger Alan United States TX Epicor Software CorporationWade Keith United States FL Webber International UniversityWahid Abu United States TN Tennessee State UniversityWalter Carla Stalling United States MO Missouri Southern State UniversityWalters Joanne United States WI University of Wisconsin-MilwaukeeWanbaugh Teresa United States LA Louisiana CollegeWarner Janice United States Georgian Court UniversityWasmer DJ United States IN Saint Mary-of-the-Woods CollegeWatson John G United States NY St Bonaventure UniversityWilliams Darryl United States TX Walden UniversityWilliams Melissa United States GA Augusta State UniversityWilson Antoinette United States WI University of Wisconsin-MilwaukeeZahaf Mehdi Canada Ontario Lakehead UniversityZaremba Alan United States MA Northeastern University
The JW Press Family of Academic Journals
Journal of Learning in Higher Education (JLHE) ISSN 1936-346X (print)
Each university and accrediting body says that teaching is at the forefront of their mission Yet the attention given to discipline oriented research speaks other-wise Devoted to establishing a platform for showcasing learning-centered articles JLHE encourages the submission of manuscripts from all disciplines The top learning-centered articles presented at ABW conferences each year will be automatically published in the next issue of JLHE JLHE is listed in Cabellrsquos Directory of Publishing Opportunities in Educational Psychology and Administration indexed by EBSCO and under consideration for indexing by Scopus
Individuals interested in submitting manuscripts directly to JLHE should review information at httpjwpresscomJLHEJLHEhtm
Journal of Academic Administration in Higher Education (JAAHE) ISSN 1936-3478 (print)
JAAHE is a journal devoted to establishing a platform for showcasing articles related to academic administration in higher education JAAHE encourages the submission of manuscripts from all disciplines The best articles presented at ABW conferences each year that deal with the subject of administration of academic units will be automatically published in the next issue of JAAHE JAAHE is listed in Cabellrsquos Directory of Publishing Opportunities in Educational Psychology and Administration indexed by EBSCO and under consideration for indexing by Scopus
Individuals interested in submitting manuscripts directly to JAAHE should review information on their site at httpjwpresscomJAAHEJAAHEhtm
International Journal of the Academic Business World (IJABW) ISSN 1942-6089 (print) ISSN 1942-6097 (online)
IJABW is a new journal devoted to providing a venue for the distribution discussion and documentation of the art and science of business A cornerstone of the philosophy that drives IJABW is that we all can learn from the research practices and techniques found in disciplines other than our own The Information Systems researcher can share with and learn from a researcher in the Finance Department or even the Psychology Department
We actively seek the submission of manuscripts pertaining to any of the traditional areas of business (accounting economics finance information systems management marketing etc) as well as any of the related disciplines While we eagerly accept submissions in any of these disciplines we give extra consideration to manuscripts that cross discipline boundaries or document the transfer of research findings from academe to business practice International Journal of the Academic Business World is listed in Cabellrsquos Directory of Publishing Opportunities in Business indexed by EBSCO and under consideration for indexing by Scopus
Individuals interested in submitting manuscripts directly to IJABW should review information on their site at httpjwpresscomIJABWIJABWhtm
International Journal of the Academic Business World 11
INTRODUCTION
Product Innovation (PI) is the first step in the overall pro-cess of product life cycle management as presented by Parry etal (2009) It should be viewed as a critical step having a major impact on a firmrsquos competitive position (Slack et al 2006 Cooper and Chew 1996) It is well understood that PI is not a simple event but a process requiring that it be managed as such Tidd et al (2008) proposed that the PI management process involves searching for a strategic approach for innovation and the challenge of its manage-ment developing mechanisms and structures of effective implementation and developing an organizational context which supports innovation and constructing effective ex-ternal interfaces It is also widely accepted that the process is related to managerial action actions directed by clear strategies objectives and vision disciplined by systemati-cally collecting information and action that renews the or-
ganization now and again by changes (Tushman and An-derson 1997)
At the company operational level many authors focused on specific PI sub-processes as critical to success Cooper and Edgett (2008) considered the monitoring of consump-tion tendencies important in the early stages of product innovation followed by the importance of capturing ideas from external sources Matta (2008) proposed dynamic allocation of mobilized resources between activated proj-ects Cooper (2009) focused on the implementation stage and proposes the use of stage gates cross-functional teams the involvement of suppliers and the use of project man-agement tools Blindenbach-Driessen and Van Den Ende (2010) and Adams et al (2006) focused on evaluating re-sults in learning from past projects proposing the impor-tance of evaluation metrics for project success the use of discussion sessions and the registering of lessons learned
Testing Major Factors for Reducing Obstacles to Product Innovation Success
Dr Tor GuimaraesJesse E Owen Chair
Tennessee Technological University Cookeville Tennessee 38505 USA
Dr Marcelo Seido Nagano School of Engineering at Satildeo Carlos
University of Satildeo Paulo BrazilDr Curtis Armstrong
Decision Science and Management ChairProfessor
Tennessee Tech University Cookeville TN 38505
ABSTRACT The literature on strategic leadership competitive intelligence management of technology and specific charac-teristics of the companyrsquos change process propose their importance in successfully implementing business innovation While these factors may indeed be important to enhance company competitiveness the existing literature contains practically no empirical evidence supporting their relationship to reducing the many problems companies encounter implementing product innovation (PI) A field test was designed with the primary objective of empirically testing the theoretical model addressing which factors if managed appropriately will help reduce the obstacles to PI in practice A questionnaire was developed pilot tested and used to collect data from 47 product innovation managers The results support the theoretical importance of strategic leadership competitive intelligence management of technology and specific characteristics of the companyrsquos change process to reducing the problemsobstacles to successful PI The items used for measuring the main constructs provide further insights into how managers should go about developing these areas within their organizations
Based on the results recommendations are made to practitioners and researchers in this important area
Tor Guimaraes Marcelo Seido Nagano amp Curtis Armstrong Testing Major Factors for Reducing Obstacles to Product Innovation Success
12 International Journal of the Academic Business World 13Fall 2015 (Volume 9 Issue 2)
Therefore despite the technical obstacles inherent in the innovation process most of the failures are due to the way it is managed (Tidd et al 2008)
At the company strategic level the literature on strate-gic leadership competitive intelligence management of technology and specific characteristics of the companyrsquos change process propose their importance in successfully implementing business innovation While these factors may indeed be important to enhance company competi-tiveness the existing literature contains practically no em-pirical evidence supporting their relationship to reducing the many problems companies encounter implementing product innovation (PI) While most authors would agree that the change process has to bear certain characteris-tics another large body of literature deal with the many factors important to innovation success or failure from a broader perspective Many researchers have looked to im-provements in strategic leadership as critical to develop-ing an organization environment conducive to innovation (Waldman et al 2001 Williams 2004) To help define and prioritize important problems and opportunities to the organization many have proposed Competitive Intel-ligence (CI) programs as important to company success (Tarraf amp Molz 2006 duToit 2003 Vedder amp Guynes 2002 Guimaraes amp Armstrong 1998) Further effective Management of Technology (MOT) is thought to be a critical requirement for successfully implementing most modern business changes (Beattie amp Fleck 2005) While these propositions are exceedingly important the existing literature needs more empirical evidence supporting them
While the constructs being studied are well established much can be done for empirically testing the proposed rela-tionships among them Particularly useful might be testing these factors in terms of their effects in reducing the obsta-clesproblems for increasing the likelihood of PI successful implementation This field test was specifically undertaken to meet that goal
THEORETICAL BACKGROUND AND PROPOSED HYPOTHESES
In this section we define the theoretical model proposed in this study the major constructs involved and the hy-potheses to be tested
Dependent Variable Obstacles Encountered In Product Innovation
There is a large collection of studies addressing the or-ganization obstacles (problems) to successful product innovation For example Galia and Legros (2004) and Segarra-Blasco et al (2008) address these problems with the objective of developing a better understanding and sustain public policy proposals Table 1 summarizes the main problems in product innovation that researchers have reported managers encounter in practice and their respective primary literature sources Please note that various authors address specific obstacles in product in-novation ie Galia and Legros (2004) focus on the lack of information about the market the relevant technolo-
gies and the consumer himself herself Cooper (2009) focuses on the difficulty in turning good ideas into actual products while Adams et al (2006) focus is on the dif-ficulty of measuring results and innovation performance
On the other hand the practitioner and academic litera-ture also proposes (Guimaraes 2008 2011) that to man-age change effectively and to reduce potential problems to their innovation efforts organizations need to
1 Be in touch with their markets customers com-petitors new products etc
2 Have adaptive leadership which promotes in-novation
3 Manage technology effectively in supporting the necessary changes and
4 Follow some basic prescriptions while imple-menting the change process
Each one of these are correspondingly represented by the independent variables in this study These are separately defined below each followed by the hypothesis represent-ing the expected inverse relation to PI problems encoun-tered in practice This section in turn will be followed by a description of the methodology used in this study the results and the conclusions and recommendations
Independent Variable Company Competitive Intelligence
The evolution of competitive intelligence has been discussed widely (Calof and Wright 2008 Nemutanzhela amp Iyamu 2011) Competitive intelligence (CI) is a tool that provides a competitive advantage to enterprises
and helps decision-makers (Fleisher amp Wright 2009 Haataja 2011) There are many definitions of CI in the literature (Weiss amp Naylor 2010) and none has achieved worldwide acceptance (Roitner 2008) Haddadi Dousset and Berrada (2010) conclude that the lack of a universally accepted definition of CI makes it a field with unstable borders CI is frequently confused with industrial espionage (Colakoglu 2011)
The importance of competitive intelligence as a key asset is increasingly recognized by managers as useful to keep in touch with what is going on in their markets (Guimaraes 2011 Tarraf amp Molz 2006 Swartz 2005 duToit 2003 Vedder amp Guynes 2002 Darling 1996) With the increase in business competition company survival and success is now determined by its rate of learning If it is faster than external changes the organization will experience long term success (Darling 1996) Ironically even though as much as 68 of US companies have an organized approach to providing information to decision makers (Westervelt 1996) acccording to Ettorre (1995) probably less than 10 percent of American corporations managed the CI process well and effectively integrated the information into their strategic plans in the past According to Fuld and Company (2013) competitive intelligence is a function within large corporations around the globe that serve to track and analyse the competition provide early warning to management as well as report to management on both opportunities and threats both tactical and strategic It is a function that delivers analyses and conducts strategic exercises such as war games and longer term scenario assessments
The antecedents and consequences of competitive intelligence dissemination has been studied by Maltz amp Kohli (1996) Competitor Analysis (CA) was proposed
Table 1Encountered ProblemsObstacles In Product Innovation Source References
Difficulty dealing with uncertainty and risk Stringer(2000) Sharma (1999)Lack of market information Galia and Legros (2004)Lack of information about technology Galia and Legros (2004)Lack of information about the consumer Galia and Legros (2004)Difficulty generating truly new ideas Nemeth (1997)Difficulty evaluatingselecting the best ideas Sharma (1999)Difficulty connecting the portfolio of projects to strategic objectives Cooper Edgett and Kleinschmidt (2001)Difficulty turning selected good ideas into innovative products Cooper (2009)Difficulty measuring results and performance in innovation Adams et al (2006)Lack of qualified staff Galia and Legros (2004)Difficulty orchestratingco-ordinating the various areas for innovation Thamhain (2003)
Strategic
Transactional Leadership
Competitive Intelligence
Problems Encountered in Product Innovation
Innovation Process Used
Strategic Charismatic Leadership
Management of Technology
Figure 1 The Research Model
Tor Guimaraes Marcelo Seido Nagano amp Curtis Armstrong Testing Major Factors for Reducing Obstacles to Product Innovation Success
14 International Journal of the Academic Business World 15Fall 2015 (Volume 9 Issue 2)
by Ghoshal amp Westney (1991) and other approaches useful for companies to collect information from competitors were addressed by Heil amp Robertson (1991) The importance of organization intelligence to financial performance was also demonstrated many years ago Companies with well-established CI programs on the average showed earnings per share of $124 compared to those without CI programs which lost 7 cents (King 1997)
Over time the importance of CI has grown steadily in Asia and in Europe where companies with intelligence budgets of more the $2 million or more did not exist five years ago but today represent 2-3 percent of all intelligence budgets Further in North America programs that spend more than one-million dollars increased from approximately 5-percent of all corporate intelligence program budgets to nearly 10-percent of all budgets (Fuld and Company 2013) Despite its importance and steady adoption all over the world (Pellissier amp Nenzhelele 2013) CI is no panacea and has its prerequisites (Nemutanzhela amp Iyamu 2011)
The literature contains many examples of benefits that can be derived from CI Among these are improved competi-tive edge (Fuld and Company 2013 Pellissier amp Nenzhe-lele 2013 Editors 2004 duToit 2003 McCune 1996 Sawka 1996 Westervelt 1996) and improved overall company performance (Davison 2001 Guimaraes amp Armstrong 1998 Babbar amp Rai 1993) two essential company goals that can be brought about with effective application of competitive intelligence More specific benefits of CI include uncovering business opportunities and problems that will enable proactive strategies (Ellis 1993 Westervelt 1996) providing the basis for continu-ous improvement (Babbar amp Rai 1993) shedding light on competitor strategies (Harkleroad 1993 Westervelt 1996) improving speed to markets and supporting rapid globalization (Baatz 1994 Ettorre 1995) improving the likelihood of company survival (Westervelt 1996) in-creasing business volume (Darling 1996) providing bet-ter customer assessment (Darling 1996) and aiding in the understanding of external influences (Sawka 1996) Benefits such as these provide the basis for firms to better understand the potential impact of the proposed changes and the means by which they can be infused into the com-panyrsquos fabric Based on the above discussion we propose the following hypothesis
H1 Company CI effectiveness is inversely related to problems encountered in product innovation
Independent Variable Strategic Leadership
There is a substantial body of knowledge proposing the im-portance of effective leadership as an ingredient to success-
ful organization change (Guimaraes 2011 Waldman et al 2001) There are many types of leadership (ie formalinformal based on specific skills social status etc) arising from the circumstances in which leadersfollowers find themselves However for the purposes of this study the relevant construct is company strategic leadership Pawar amp Eastman (1997) proposed transactional strategic lead-ership as the one to be operational within an existing or-ganizational system or culture instead of trying to change it It attempts to satisfy the current needs of followers by focusing on exchanges and contingent reward behavior It pays close attention to exceptions or irregularities and takes action to make corrections (Bass 1985 Burns 1978) Conceptually similar to the cultural maintenance form of leadership described by Trice amp Beyer (1993) transactional leadership acts to strengthen existing organization process-es structures strategies and culture
The second form of strategic leadership is transforma-tional or ldquocharismaticrdquo leadership (Pawar amp Eastman 1997) According to Waldman et al (2001) the leader articulates ldquoa vision and sense of mission showing de-termination and communicating high performance ex-pectationsrdquo (p135) The followers reply with confidence in the leader and strong admiration or respect Also they identify with the leaderrsquos vision and with the organiza-tion itself creating a high level of collective cohesion This cohesion and the leaderrsquos expressions of confidence in the followersrsquo ability to attain the vision produce in turn a heightened sense of self-efficacy (Podsakoff et al 1990) Further charismatic leaders are likely to show persistence and enthusiasm in pursuing goals and be demanding of others through the communication of high performance expectations (Kanter 1983 Trice amp Beyer 1993) There is evidence that charismatic leadership at the top executive level is important for company performance (Day amp Lord 1988 Hambrick amp Finkelstein 1987 Yukl 1998) Katz amp Kahn (1978) argued that while charismatic leadership may be more relevant to situations where organization change is important both transactional and transforma-tional (charismatic) leadership are potentially important at the strategic level that it is particularly important as a means of mobilizing an organization to meet the demands of its environment Bass (1985) viewed transactional and charismatic leadership as being somewhat complementary in that both could be displayed by the same individual leader Similarly Trice amp Beyer (1993) acknowledged that both maintenance- and innovation-oriented leader-ship could be shown by a given leader over time Based on the above discussion both types of strategic leadership are tested and we propose
H2 Strategic transactional leadership is inversely re-lated to problems encountered in product innova-tion and
H3 Strategic charismatic leadership is inversely re-lated to problems encountered in product innova-tion
Independent Variable Management of Technology (MOT) To Support Business Change
As business competitiveness increases many business or-ganizations have used technology for redesigning business processes provide new products and services and improve the organization work environment Many authors have proposed the importance of a wide variety of technologies to support business innovation (Li-Hua amp Khalil 2006 Khalil amp Ezzat 2005) Computer Telephony Integration has been touted as a powerful tool to improve the rela-tionship with customers (McCarthy 1996) The effects of computer technology on organization design intelligence and decision making have long been of interest to research-ers (Huber 1990) The use of computers for data mining and warehousing is seen as essential for decision support (Anonymous 1995) Friedenberg amp Rice (1994) and Gui-maraes et al (1997) have proposed Expert Systems as viable implementation vehicles for business change because they are effective in capturing and distributing knowledge and knowledge processing capability across an organization The list of technologies available to support the necessary business changes is endless For business changes requiring technology without effective MOT the change implemen-tation processes would be severely hindered and in many cases rendered impossible Based on the above discussion the following is proposed
H4 MOT effectiveness is inversely related to problems encountered in product innovation
Independent Variable Important Characteristics of the Change Process
For improving the success rate of changes in organizations the literature (Guimaraes amp Armstrong 1998 Guimaraes 2011) proposes several pre-requisites for the process used for implementing change i e conformity to company objectives employee and department participation in the change process customer input reasonably balancing risk taking with cost benefit analysis monitoring progress and communication regarding the change process In other words how change is implemented is an important deter-minant of success Specifically as proposed by Guimaraes amp Armstrong (1998) the important characteristics of the change process enumerated above are expected to influence the companyrsquos ability to change its products Thus we have H5 The extent to which the change process bears the de-sirable characteristics will be inversely related to problems encountered in product innovation
STUDY METHODOLOGY
This section provides an overview of the field-test procedure used and a brief description of the sample supporting this study A description of how the variables were measured the data analysis procedures and the discussion of the study results are presented later
The Data Collection Process
This field test used a questionnaire to collect the relevant data from a convenience sample of 47 product development managers from 32 organizations with global business operations headquartered in the United States The questionnaire was developed based on a survey of the literature and it was tested for readability and content relevancy and completeness in relation to the study objectives This testing was conducted through several meetings and phone conversations with four managers presently directly involved in new product development The questionnaire had a cover letter describing the purpose of the study and providing instructions for the respondents nevertheless the data was collected mostly through personal interviews with the respondents Many of the participants are known personally to the researchers from seminars in product and business process innovation and some are known to have considerable knowledge and experience about their respective companyrsquos policies processes and activities in product innovation
Sample Description
The companies represented in the sample range widely in terms of their industry sector and size Forty two percent of the firms identified their primary business as manu-facturing with the remaining companies distributed fairly evenly across the sectors of communications (11) health care (6) retail (8) banking and finance (11) and other (22) In terms of gross revenues twenty nine percent of the firms were two hundred million dollars in annual sales or less forty six percent were between two hundred million and 800 million dollars and the remain-ing twenty five percent were above 800 million dollars Twenty six percent of the respondent identified that their number of employees were 500 or less thirty nine percent of the companies employed between 500 and 1000 peo-ple and the remaining companies (35) had more than 1000 employees
Construct Measurement
The measuring scale and components for each major vari-able in this study are presented next As discussed earlier the major constructs and their subcomponents have been
Tor Guimaraes Marcelo Seido Nagano amp Curtis Armstrong Testing Major Factors for Reducing Obstacles to Product Innovation Success
16 International Journal of the Academic Business World 17Fall 2015 (Volume 9 Issue 2)
collected from the existing literature have been validated and used by prior studies and provided the theoretical framework for the model empirically tested here
Obstacles Encountered in Product Innovation were collected from the literature as referenced in Table 1 Respondents were asked to ldquoPlease rate the difficulty of the following product innovation problems your company actually encountered over the last three years in comparison with the closest competing organizations you are aware ofrdquo The list of 11 items to be rated includes
1 Dealing with uncertainty and risk 2 Lack of market information 3 Lack of information about technology 4 Lack of information about consumers 5 Difficulty to generate truly new ideas 6 Difficulty to evaluate and select best ideas 7 Difficulty to connect the portfolio of projects to
strategic objectives 8 Difficult to turn selected good ideas into innova-
tive products 9 Difficult to measure results and performance in
innovation 10 Lack of qualified staff and 11 Difficulty orchestratingco-ordinating the vari-
ous areas for innovation This was done using a seven-point Likert-type scale ranging from 1 to 7
1 extremely lower than average 2 much lower 3 somewhat lower 4 average 5 somewhat higher than average 6 much higher and 7 extremely higher
The ratings for these items were averaged to produce a single measure for ldquoproblemsobstacles encounteredrdquo
Strategic Leadership represents the ability of the top management team to provide leadership when the orga-nizational environment requires change Environments perceived as highly uncertain (requiring major changes) tend to be perceived as risky where wrong decisions could be costly Such environments probably generate a high de-gree of stress Charismatic leadership would tend to reduce
stress and generate confidence and perhaps show how un-certainty can be turned into a vision of opportunity and success (Bass 1985) While charismatic leadership may be more relevant to situations where organization change is of major importance both transactional and transformation-al (charismatic) leadership are potentially important at the strategic level Further Bass (1985) viewed transactional and charismatic leadership as being somewhat complemen-tary in that both could be displayed by the same individual leader The same items proposed by Waldman et al (2001) were used to measure the two types of strategic leadership It was assessed by asking the respondents to rate the extent to which their top managers in general exhibit the particu-lar behavior when compared to managers of main compet-ing organizations
Transactional leadership
1 Takes actions if mistakes are made 2 Points out what people will receive if they do
what needs to be done 3 Reinforces the link between achieving goals and
obtaining rewards 4 Focuses attention on irregularities exceptions or
deviations from what is expected 5 Rewards good work
Charismatic leadership
1 Shows determination when accomplishing goals 2 I have complete confidence in them 3 Makes people feel good to be around them 4 Communicates high performance expectations 5 Generates respect 6 Transmits a sense of mission7 Provides a vision of what lies ahead
Characteristics of the Change Process is defined as the degree to which companies promote ldquodesiredrdquo change process activities It was assessed by asking the respondents to rate the importance or focus that the company places on ten areas of change process characteristics These consisted of all significant changes must conform to company objectives all affected departments participate in the change process individual employee input is considered important customers input is considered important business partners input is considered important ability to balance risk taking with costbenefit clearly defined measures to monitor progress change objectives and progress are clearly communicated responding quickly to required change and responding effectively to required change The same seven-point Likert-type scale was used
and the overall rating of characteristics of the change process for each firm was determined as the average of the ten areas
MOT Effectiveness in Supporting Business Change is the extent to which the companyrsquos needs for technology while implementing business change have been met It was measured by asking the respondents to rate this for the overall company and in four specific areas technology leadership in the industry knowledge of how to get the best technology effectiveness with which technology has been used over the years and effectiveness in using technology in comparison with main competitors The respondents were asked to use the same seven point scale described above The measure for MOT effectiveness in supporting business activities is the average of the ratings for these four items
Construct Validity
Several precautions were taken to ensure the validity of the measures used Many of the recommendations by Carmines amp Zeller (1979) were followed To ensure content validity a thorough survey of the relevant literature was undertaken to understand the important aspects of each major variable and its components and not neglect important dimensions of any variable To further reduce the possibility of any non-random error the main source of invalidity (Carmines amp Zeller 1979 p 15) a group of practitioners from different companies with extensive experience in managing PI reviewed the questionnaire for validity (measuring the phenomena intended) completeness (including all relevant items) and readability (making it unlikely that subjects will misinterpret a particular question) Some questions were reworded to improve readability otherwise the items composing each major variable remained as derived from the literature
As proposed by Carmines amp Zeller (1979) ldquoconstruct validation focuses on the extent to which a measure performs in accordance with theoretical expectationsrdquo (p27) To ensure construct validity the theoretical
relationships between the constructs should have been previously established and these relationships hopefully have been empirically supported by different studies over time As discussed earlier the theoretical underpinnings of this study are relatively well established with most of the items in each construct having been addressed before by several authors Second order factor analyses on the two types of strategic leadership (transactional and charismatic leadership) have been performed by prior studies (Guimaraes 2008 Guimaraes 2011) using larger sample sizes and the results indicated that they can be combined into a single factor as done in this study
Data Analysis Procedures
The relatively small sample size (n = 47) requires the use of simple but robust statistical analysis Pearsonrsquos correla-tion coefficients were used to statistically test the possible relationship between the main constructs T-tests and Chi-square statistics for cross-tabulations were used to test the hypotheses Responses from each manager regarding the main constructs were classified into two groups above and below the mean to produce the cross-tabulation tables
RESULTS
Table 2 lists the Pearsonrsquos correlation coefficients and the means and standard deviations for the six major research variables On the average the companies in the sample are thought to be performing slightly above average in the areas of competitive intelligence both components of strategic leadership management of technology and specific characteristics of the companyrsquos change process On the other hand on average the companies in the sample tend to be ldquosomewhat highrdquo in terms of encountering the obstacles to product innovation identified in this study It is also notable that the relatively large standard deviations (mostly above 10) indicate significant differences in performance from company to company One possible explanation for the ldquosomewhat highrdquo average regarding the identification
Table 2 Correlations Between Major Variables
Major Variables Mean StdDev 1 2 3 4 5
1 PI Problems Encountered 47 0832 Competitive Intelligence 42 112 -233 Transactional Leadership 45 098 -20 NS4 Charismatic Leadership 41 122 -35 36 NS5 Management of Technology 44 107 -26 NS 18 136 Change Process Features 43 098 -33 27 14 23 15
Tor Guimaraes Marcelo Seido Nagano amp Curtis Armstrong Testing Major Factors for Reducing Obstacles to Product Innovation Success
18 International Journal of the Academic Business World 19Fall 2015 (Volume 9 Issue 2)
of obstacles to product innovation may be that the industry seminars attended by the product managers may have raised their own performance expectations and problem awareness
Hypothesis H1 proposes that a companyrsquos performance in Competitive Intelligence (CI) is inversely related to prob-lems encountered in product innovation Table 3 shows the results of the cross-tabulations for these two major vari-ables
In Table 3 the number of observations falling in each table cell corroborates that companies performing above average in the performance of CI tend to be below average in terms of encountering problems during product innovation The same inverse relationship tends to hold for companies performing below average in CI thus encountering more difficulty in product innovation About half as many (8 versus 15) organizations report encountering above average product innovation problems when they are performing above average in CI However this also shows that higher than average overall performing in CI is apparently no guarantee that a company will also not encounter above average problems in product innovation On the other
hand below average performance in CI shows a threefold (6 versus 18) increase in higher than average encounters with product innovation problems
As shown in Table 4 t-tests were used to further test the significance of this relationship between the company
performance in CI and product innovation problems encountered Respondents in the two groups above and below the average performance in CI are compared in aggregate and along each of the product innovation problems identified in the literature The results clearly demonstrate that compared to below average firms companies with above average performance in CI have encountered product innovation problems at a significantly lower level on many of the product innovation problems identified Based on the above results we find strong support for hypothesis one
Results from Hypothesis Two Testing
Hypothesis two proposes that performance in overall company Strategic Transactional Leadership is inversely related to problems encountered in product innovation This was tested in a similar manner as for hypothesis one respondents were placed in two groups based on their above or below average ratings in Strategic Leadership Table 5 shows the results of the cross-tabulations between the two major constructs Sixteen of the 24 companies that were below average Transactional Leadership performance are above average in terms of encountering product innovation problems On the other hand some companies (13) with a below average Transactional Leadership performance somehow were able to avoid having above average encoun-
ters with product innovation problems Further above av-erage Transaction Leadership in 6 organizations has not precluded them from encountering above average product innovation problems
As shown in Table 6 t-tests were used to further test the significance of the relationship between a companyrsquos higher or lower than average Transactional Leadership and specific product innovation problems encountered The two groups are compared in aggregate and along each of the product innovation problems identified in the lit-
Table 4 T-Tests for Performance in Competitive Intelligence and
Each Product Innovation Problem Encountered
Aggregated Variable and Individual Items
Competitive Intelligence
Below Average Performance
Competitive Intelligence
Above Average Performance
p-Value
Problems encountered in product innovation 47 41 003Difficult to deal with uncertainty and risk 51 45 002Lack of market information 53 35 000Lack of information about technology 47 36 001Lack of information about the consumer 52 37 001Difficult to generate truly new ideas 45 43 Not Significant
Difficult to evaluate and select the best ideas 46 48 Not Significant
Difficulty to connect the portfolio of projects to strategic objectives
49 43 Not Significant
Difficult to turn selected good ideas into innovative prod-ucts
43 44 Not Significant
Difficult to measure results and performance in innova-tion
48 40 001
Lack of qualified staff 45 39 002Difficult to orchestrate and co-ordinate the various areas for innovation
40 38 Not Significant
means plt05 means plt 01
Table 5 Cross-Tabulations of
Transactional Leadership and Product Innovation Problems
(Hypothesis 2)Product Innovation
Problems EncounteredBelow
AverageAbove
Average
Transactional Leadership
Below Average 8 16
Above Average 13 6
Chi-square = 52 (p = 002)
Table 6 T-Tests for Transactional Leadership and
Each Product Innovation Problem Encountered
Aggregated Variable and Individual Items
Transactional Leadership
Below Average Performance
Transactional Leadership
Above Average Performance
p-Value
Problems encountered in product innovation 47 42 004Difficult to deal with uncertainty and risk 53 44 001Lack of market information 44 42 Not SignificantLack of information about technology 47 43 Not SignificantLack of information about the consumer 43 39 Not SignificantDifficult to generate truly new ideas 45 42 Not Significant Difficult to evaluate and select the best ideas 46 44 Not Significant Difficulty to connect the portfolio of projects to strategic objec-tives
50 41 001
Difficult to turn selected good ideas into innovative products 51 44 001Difficult to measure results and performance in innovation 49 42 001Lack of qualified staff 46 43 Not SignificantDifficult to orchestrate and co-ordinate the various areas for in-novation
47 35 001
Table 3 Cross-Tabulation of Performance in
Competitive Intelligence and PI Problems (Hypothesis 1)
Product Innovation Problems Encountered
Below Average
Above Average
Performance in Competitive
Intelligence
Below Average 6 18
Above Average 15 8
Chi-square = 768 (p = 000)
Tor Guimaraes Marcelo Seido Nagano amp Curtis Armstrong Testing Major Factors for Reducing Obstacles to Product Innovation Success
20 International Journal of the Academic Business World 21Fall 2015 (Volume 9 Issue 2)
erature The results clearly demonstrate that compared to below average firms companies with higher than aver-age Transactional Leadership have encountered product innovation problems at a significantly lower level along many of the product innovation problems identified The above results corroborates hypothesis two
Results from Hypothesis Three Testing
Hypothesis three proposes that firms having strong char-ismatic leadership is inversely related to encountering problems in product innovation This has been tested in a similar fashion as hypotheses 1 and 2 Table 7 shows the results of the cross-tabulations for belowabove average company resources availability and belowabove average encounters with product innovation problems Similar to the cross-tabulations used for testing the hypotheses addressing the other major constructs the results in this case confirm expectations and should be interpreted ac-cordingly
As shown in Table 8 t-tests were again used to further test the significance of this relationship between Charismatic Leadership and specific product innovation problems en-countered The results clearly demonstrate that compared to below average firms companies with above average Charismatic Leadership have encountered product inno-vation problems at a significantly lower level along many
of the product innovation problems identified While the small sample size has resulted in several non-significant comparisons in no case the comparison contradicted the general hypothesis Based on the above results we also find strong support for hypothesis three
Results from Hypothesis Four Testing
Tested in similar fashion hypothesis four proposes that having effective management of technology is inversely
related to encountering problems in product innovation Table 9 shows the results of the cross-tabulations for be-lowabove average management of technology effective-ness and belowabove average encounters with product in-novation problems Similar to the cross-tabulations used for testing the hypotheses addressing the other major con-structs the results in this case confirm expectations and should be interpreted accordingly
As shown in Table 10 t-tests were again used to further test the significance of this relationship between the company MOT effectiveness and specific product inno-vation problems encountered The results clearly demon-strate that compared to below average firms companies with above average MOT performance have encountered product innovation problems at a significantly lower level along many of the product innovation problems identi-fied Based on the above results we also find strong sup-port for hypothesis four
Results from Hypothesis Five Testing
Hypothesis five proposes that having a product change process with the desirable characteristics is inversely related to encountering problems in product innovation This has been tested the same way Table 11 shows the results
of the cross-tabulations for belowabove average product change process and belowabove average encounters with specific product innovation problems The results in this case confirm expectations and should be interpreted accordingly
As shown in Table 12 t-tests were again used to further test the significance of this relationship between the product change process and specific product innovation problems encountered C to below average firms companies with
Table 8 T-Tests for Charismatic Leadership and
Each Product Innovation Problem Encountered
Aggregated Variable and Individual Items
Charismatic Leadership
p-ValueBelow
AverageAbove
Average
Problems encountered in product innovation 50 39 001
Difficult to deal with uncertainty and risk 52 41 001Lack of market information 49 42 001Lack of information about technology 50 40 002Lack of information about the consumer 47 38 001Difficult to generate truly new ideas 48 38 001Difficult to evaluate and select the best ideas 51 41 001Difficulty to connect the portfolio of projects to strategic objectives 52 38 001Difficult to turn selected good ideas into innovative products 51 43 001Difficult to measure results and performance in innovation 47 37 001Lack of qualified staff 52 36 001Difficult to orchestrate and co-ordinate the various areas for innovation 50 35 001
Table 10 T-Tests for Management of Technology and
Each Product Innovation Problem Encountered
Aggregated Variable and Individual Items
Management of Technology
p-ValueBelow
AverageAbove
Average
Problems encountered in product innovation46 40 003
Difficult to deal with uncertainty and risk 48 34 001Lack of market information 46 35 001Lack of information about technology 52 36 000Lack of information about the consumer 43 41 Not SignificantDifficult to generate truly new ideas 47 40 Not SignificantDifficult to evaluate and select the best ideas 43 42 Not SignificantDifficulty to connect the portfolio of projects to strategic objectives 45 43 Not SignificantDifficult to turn selected good ideas into innovative products 46 41 004Difficult to measure results and performance in innovation 48 42 003Lack of qualified staff 47 44 Not Significant
Difficult to orchestrate and co-ordinate the various areas for innovation 43 41 Not Significant
Table 7 Cross-Tabulations of
Charismatic Leadership and Product Innovation Problems
(Hypothesis 3)Product Innovation
Problems EncounteredBelow
AverageAbove
Average
Charismatic Leadership
Below Average 7 15
Above Average 16 9
Chi-square = 48 (p = 003)
Table 9 Cross-Tabulations of
Management of Technology and Product Innovation Problems
(Hypothesis 4)Product Innovation
Problems EncounteredBelow
AverageAbove
Average
M a n a g e me nt of Technology
Below Average 9 14
Above Average 18 8
Chi-square = 45 (p = 003)
Tor Guimaraes Marcelo Seido Nagano amp Curtis Armstrong Testing Major Factors for Reducing Obstacles to Product Innovation Success
22 International Journal of the Academic Business World 23Fall 2015 (Volume 9 Issue 2)
more relevant within an existing organization environment instead of one attempting to implement changes Katz amp Kahn (1978) argued that charismatic leadership may be more relevant where organization change is important but that both types of strategic leadership are potentially important Our results indicate that indeed for more successful (less problems encountered) product innovation both types of leadership are important
Regarding CI there are also some major implications from this study results To improve their CI programs managers need to consider the collection of market intelligence based on the six areas addressed in this study the traditional industry competitors emerging competitors traditional customer needs and wants non-traditional customer needs and wants relationships with business partners and new product or service development The importance of any one of these areas may be relatively higher or lower and in some cases some of these sources may be irrelevant depending on the companyrsquos specific industry sector line of business products and processes being considered Good performance in these areas whenever applicable to the companyrsquos industry sector and lines of business are likely to reduce problems encountered which in turn is likely to lead to more product innovation
To improve technology management which is found to be useful reducing product innovation problems managers must look at company performance in terms of its technology leadership position in its main industry sectors knowledge of how to get the best technology available effective use of specific technologies and benchmarking the use of specific technologies against the companyrsquos main competitors or best-in-class target organizations An important requirement to accomplish these objectives is the clear definition of the more important technologies necessary to support and enhance the companyrsquos products Another important requirement is management recognition that the implementation of each of the various technologies deemed important to the organization are dependent on specific success factors The success factors for the various technologies have been identified and discussed elsewhere (Guimaraes Igbaria amp Lu 1992 Guimaraes amp Igbaria 1997 Yoon Guimaraes amp Clevenson 1998 Yoon Guimaraes amp Clevenson 1995 Yoon Guimaraes amp OrsquoNeal 1995 Udo amp Guimaraes 1994) and are considered beyond the scope of this paper
Last top managers must ensure that their companysrsquo product change process bear the desirable characteristics studied here all significant changes must conform to company objectives all affected departments participate in the change process individual employee input is considered important customers input is considered important business partners input is considered important managers
above average performance in product change process have encountered product innovation problems at a significantly lower level along many of the product innovation problems identified Based on the above results hypothesis five is corroborated
DISCUSSION MANAGERIAL RECOMMENDATIONS AND
FURTHER RESEARCH
Despite the relatively small sample size the results provide strong evidence regarding the importance of strategic leadership competitive intelligence management of
technology and specific characteristics of the companyrsquos change process to the success of product innovation Given the importance of effectively implementing business innovation in these days of hyper competitiveness it behooves top managers to do whatever they can to improve their companysrsquo performance in the areas of strategic leadership competitive intelligence management of technology and characteristics of the process used to reduce problems encountered with the product innovation process so vital to company performance
In the area of strategic leadership several implications can be derived from this study Charismatic leadership (showing determination while accomplishing goals inspiring confidence making people feel good around you communicating expectations for high performance generating respect transmitting a sense of mission and providing a vision of what lies ahead) is on average and as a whole relatively scarce in industry today and judging by its nature it should be difficult to develop Nevertheless managers must try particularly in high clockspeed industry sectors (Guimaraes et al 2002) requiring continuous innovation Also apparently important for successful product innovation transactional leadership (taking action if mistakes are made pointing out what people will receive if they do what needs to be done reinforcing the link between achieving goals and obtaining rewards focusing attention on deviations from what is expected and rewarding good work) by its nature should be easier to develop Pawar amp Eastman (1997) proposed that transactional leadership is
ability to balance risk taking with costbenefit the existence of clearly defined measures to monitor progress that change objectives and progress are clearly communicated and that the product innovation teams respond quickly and effectively to required change These guidelines must be widely disseminated and enforced by project managers and employees involved in product changes
The primary objective of this research has three interrelated components 1) to identify and assess the variety of problems encountered by companies while performing the vital process of product innovation 2) to identify and assess the major factors proposed in the literature as necessary to increase the likelihood of success in product innovation and 3) to test if these literature proposed success factors for product innovation also show a positive impact by reducing the problems associated with the product innovation process in practice Thus it is safe to assume that the measures for each of the major constructs studied here derived from a large number of separate studies represent an important contribution to future researchers and practicing product innovation managers aiming to improve their company effectiveness in this critical area
During the process of conducting this research informal discussions with several of the product development managers made abundantly clear that over time success in product development can only be achieved by a complex combination of many factors stemming from three major areas humanorganizational technological and market knowledge elements This multidimensional requirement for success as well as an intrinsic presence of risk and the need to find tangible and intangible resources is a huge challenge for product innovation management in general As the results from this study indicated all the major factors addressed here are important but do not by themselves ensure successful product innovation It seems to be rather analogous to a case where basic components must be in combination transformed into improved products which provide greater value to the market place
STUDY LIMITATIONS AND OPPORTUNITIES FOR FURTHER RESEARCH
Based on an extensive survey of the relevant literature this study is a first attempt at empirically testing the im-portance of strategic leadership competitive intelligence management of technology and specific characteristics of the companyrsquos change process for the success of product in-novation The theoretical model proposed here addresses five major determinants of how to reduce obstaclesprob-lems for successful PI based on the existing literature There might be other important factors for reducing the PI prob-lems defined in this study Given the importance of the
Table 12 T-Tests for Change Process Features and
Each Product Innovation Problem Encountered
Aggregated Variable and Individual ItemsChange Process Features
p-ValueBelow Average
Above Average
Problems encountered in product innovation 49 40 001Difficult to deal with uncertainty and risk 51 42 001Lack of market information 49 40 001Lack of information about technology 50 41 001Lack of information about the consumer 48 37 001Difficult to generate truly new ideas 47 40 001Difficult to evaluate and select the best ideas 52 43 001Difficulty to connect the portfolio of projects to strategic objectives 49 38 001Difficult to turn selected good ideas into innovative products 50 43 001Difficult to measure results and performance in innovation 48 39 001Lack of qualified staff 47 37 001Difficult to orchestrate and co-ordinate the various areas for innovation 52 41 001
Table 11 Cross-Tabulations of
Change Process Features and Product Innovation Problems
(Hypothesis 5)Product Innovation
Problems EncounteredBelow
AverageAbove
Average
C h a n g e P r o c e s s Features
Below Average 8 15
Above Average 17 9
Chi-square = 46 (p = 003)
Tor Guimaraes Marcelo Seido Nagano amp Curtis Armstrong Testing Major Factors for Reducing Obstacles to Product Innovation Success
24 International Journal of the Academic Business World 25Fall 2015 (Volume 9 Issue 2)
topic future research should strive to identify and include these potential factors in an expanded theoretical model
Another opportunity for future research stems from the fact that even though the relatively small sample in this study has shown very encouraging statistically significant results larger sample sizes will be much more convincing Therefore we strongly recommend new research projects with larger sample sizes capable of supporting multivariate analyses expanded theoretical models and enable the assessment of more complex relationships among the important constructs addressed in this study Perhaps the use of a path analytic modeling technique would be applicable in this case The results should provide valuable information on the extent to which strategic leadership can positively influence the effective use of technology and CI programs for companies to improve their business competitiveness while ensuring that the change process follow prescribed guidelines suggested in this study
Finally a third area of future research opportunity deals with the integration and expansion of theoretical mod-els relating the many determinants of success in product innovation to include the new construct of ldquoobstacles to product innovationrdquo as a likely moderating variable in these theoretical models Combined these three areas of research opportunity should support a host of research studies important not only to the academic community but also to product innovation managers
REFERENCES
Adams R Bessant J amp Phelps J (2006) Innovation management measurement A review International Journal of Management Reviews 8(1) 21-47
Anonymous (1995) Data mining a new weapon for com-petitive advantage Software Quarterly 2 (4) 15-19
Baatz E B (1994 Sept 15) The quest for corporate smarts CIO 48-58
Babbar S amp Rai A (1993) Competitive intelligence for international business Long Range Planning 263103-113
Bass BM (1985) Leadership and Performance beyond Expectations New York Free Press
Beattie JS amp Fleck J (2005) New perspectives on stra-tegic technology management in small high-tech com-panies Proceedings from IEEE International 2005 Engineering Management Conference
Blindenbach-Driessen F amp Van Den Ende J (2010) In-novation management practices compared the exam-ple of project-based firms Journal of Product Innova-tion Management 6(3) 33-53
Burns J M (1978) Leadership New York Harper amp Row
Calof JL amp Wright S (2008) Guest Editorial Com-petitive intelligence a practitioner academic and inter-disciplinary perspective European Journal of Market-ing 42(78) 717-730
Carmines E amp Zeller R (1979) Reliability and Validity Assessment Beverly Hills CA Sage
Colakoglu T (2011) The problematic of competitive intelligence How to evaluate and develop competi-tive intelligence Procedia ndash Social and Behavioral Sci-ences 24(1) 1615ndash1623 httpdxdoiorg101016jsbspro201109075
Cooper RG (2009) How companies are reinventing their idea-to-launch methodologies Research Technol-ogy Management 52(2) 47-57
Cooper RG and Chew MB (1996) Control tomor-rowrsquos costs through todayrsquos designs Harvard Business Review January-February 88-98
Cooper R amp Edgett S (2008) Ideation for product in-novation what are the best methods PDMA visions magazine 1(1) 12-17 httpwwwstage-gatecomknowledgephp
Cooper R Edgett S amp Kleinschmidt E (2001) Portfo-lio management for new product development results of an industry practices study RampD Management 31(4) 361-380
Darling M S (1996) Building the knowledge organiza-tion Business Quarterly 61(2) 61-66
Davison L (2001) Measuring competitive intelligence effectiveness Insights from the advertising industry Competitive Intelligence Review 12 (4) 25-38
Day DV amp Lord RG (1988) Executive leadership and organizational performance suggestions for a new theory and methodology Journal of Management 14 4593-464
du Toit A (2003) Competitive intelligence in the knowl-edge economy What is in it for South African manu-facturing enterprises International Journal of Infor-mation Management 23 111-120
Editors (2004 MarchApril) Competitive intelligence and records managers The Information Management Journal 4
Ellis J R (1993) Proactive competitive intelligence Us-ing competitive scenarios to exploit new opportunities Competitive Intelligence Review 4(1) 13-24
Ettorre B (1995) Managing competitive intelligence Management Review 84(10) 15-19
Fleisher CS amp Wright S (2009) Examining differences in competitive intelligence practice China Japan and the West Thunderbird International Business Review 51(3) 249ndash261 httpdxdoiorg101002tie20263
Friedenberg R amp Rice A (1994 August 3) Knowledge re-engineering as a BPR strategy Working Notes of the AAAI-94 Workshop on Artificial Intelligence in Business Process Reengineering Seattle WA pp 21-26
Fuld amp Company (2013) Certain industries invest heavi-ly in watching their competition Fuld Insights-Global Benchmarking Project Update March 2013
Galia F amp Legros D (2004) Complementarities be-tween obstacles to innovation evidence from France Research Policy 33 1185ndash1199
Ghoshal S amp Westney D E (1991 Jan) Organizing competitor analysis systems International Journal of the Academic Business World 2(1) pp 35-44
Guimaraes T (2011) Industry Clockspeedrsquos Impact on Business Innovation Success Factors European Journal of Innovation Management 14(3) 322-344
Guimaraes N amp Armstrong C (1998) Exploring the relation between competitive intelligence IS support and business change Competitive Intelligence Review 9(3) 45-54
Guimaraes T Cook D amp Natarajan N (2002) Explor-ing the importance of business clockspeed as a modera-tor for determinants of supplier network performance Decision Sciences 33(4) 629-644
Guimaraes N amp Igbaria M (1997) Clientserver sys-tem success Exploring the human side Decision Sci-ences 28(4) 851-876
Guimaraes N Igbaria M amp Lu M (1992) Determi-nants of DSS success An integrated model Decision Sciences 23(2) 409-430
Guimaraes T Yoon Y amp Clevenson A (1997) Empiri-cally testing ES success factors in business process reen-gineering International Journal of Production Econom-ics 50 245-259
Haataja J (2011) Social media as a source of competitive intelligence in a pharmaceutical corporation Masterrsquos thesis School of Science Aalto University
Haddadi AE Dousset B amp Berrada I (2010) Xplor EveryWhere ndash The Competitive Intelligence Sys-tem for Mobile in IEEE Xplorereg retrieved 25 March
2015 from httpieeexploreieeeorgstampstampjsptp=amparnumber=5945635
Hambrick DC amp Finkelstein S (1987) Managerial Discretion A Bridge between Polar Views of Organi-zational Discretion In LL Cummings amp BM Staw (Eds) Research in Organizational Behavior Green-wich CT JAI Press 9 369-406
Harkleroad D (1993) Sustainable growth rate analysis Evaluating worldwide competitorsrsquo ability to grow profitability Competitive Intelligence Review 4(23) 36-45
Heil O amp Robertson T S (1991 Sep) Toward a theory of competitive market signaling A research agenda Strategic Management Journal 12(6) 403-418
Huber G P (1990 Jan) A theory of the effects of ad-vanced information technologies on organizational design intelligence and decision making Academy of Management Review 15(1) 47-71
Kanter RM (1983) The Change Masters New York Si-mon amp Schuster
Katz D amp Kahn RL (1978) The Social Psychology of Organizations (2nd ed) New York Wiley
Khalil TM amp Ezzat HA (2005) Management of technology and responsive policies in a new economy International Journal of Technology Management 32(12) 88
King M (1997 March 10) Corporations take snooping mainstream Indianapolis Business Journal 17(2) 1-4
Li-Hua R amp Khalil TM (2006) Technology manage-ment in China A global perspective and challenging issues Journal of Technology Management in China 1(1) 9
Maltz E amp Kohli A K (1996 Feb) Market intelligence dissemination across functional boundaries Journal of Marketing Research 33(1) 47-61
Mata RS (2008) Inovaccedilatildeo tecnoloacutegica em multinacio-nais brasileiras estudo multicaso sobre gestatildeo do port-folio de projetos de novos produtos 192p Dissertaccedilatildeo (Mestrado) ndash Faculdade de Economia Administraccedilatildeo e Contabilidade de Ribeiratildeo Preto Universidade de Satildeo Paulo Ribeiratildeo Preto
McCarthy V (1996) CTI lets you coddle customers at lower cost Datamation 42(13) 46-49
McCune J C (1996) Checking out the competition Be-yond Computing 5(2) 24-29
Nemeth C (1997) Managing innovation when less is more California Management Review 40(1) 59-74
Tor Guimaraes Marcelo Seido Nagano amp Curtis Armstrong
26 Fall 2015 (Volume 9 Issue 2)
Nemutanzhela P amp Iyamu T (2011) The impact of competitive intelligence on products and services in-novation in organizations International Journal of Advanced Computer Science and Applications 2(11) 38-44
Parry ME Song M De Weerd-Nederhof PC amp Viss-cher K (2009) The impact of NPD strategy product strategy and NPD processes on perceived cycle time Journal of Product Innovation Management 26 (6) 627-639
Pawar BS amp Eastman KK (1997) The nature and implications of contextual influences on transforma-tional leadership A conceptual examination Academy of Management Review 22 80-109
Pellissier R amp Nenzhelele TE (2013) Towards a univer-sal definition of competitive intelligence SA Journal of Information management 15(2) Art 559 7 pages httpdxdoiorg104102sajimv15i2559 Retrieved 31 March 15
Podsakoff PM MacKenzie SB Moorman RH amp Fetter R (1990) Transformational leader behaviors and their effects on followersrsquo trust in leader satisfac-tion and organizational citizenship behaviors Leader-ship Quarterly 1107-142
Roitner A (2008) Competitive intelligence in Austria An empirical study Masterrsquos dissertation University of Vienna
Sawka K A (1996) Demystifying business intelligence Management Review 85(10) 47-51
Segarra-Blasco A Garcia-Quevedo J amp Teruel-Carrizo-sa M (2008) Barriers to innovation and public policy in Catalonia The International Entrepreneurship and Management Journal 4(4) 431-451
Sharma A (1999) Central dilemmas of managing inno-vation in large firms California Management Review 3941(3) 46-164
Slack N Chambers S Johnston R and Betts A (2006) Operations and Process Management Princi-ples and Practice for Strategic Impact 2nd ed Prentice Hall Harlow
Stringer R (2000) How to manage radical innovation California Management Review 42(4) 70-88
Swartz N (2005) Competitive intelligence underuti-lized Information Management 39(3)
Tarraf P amp Molz R (2006) Competitive Intelligence at Small Enterprises SAM Advanced Management Journal l 71 (4) 24-34
Thamhain HJ (2003) Managing innovative RampD teams RampD Management 33(3) 297-311
Tidd J Bessant J amp Pavitt K (2008) Gestatildeo da inova-ccedilatildeo 3ed Satildeo Paulo Artmed
Trice HM amp Beyer JM (1993) The Cultures of Work Organizations Englewood Cliffs JN Prentice-Hall
Tushman M amp Anderson P (1997) Managing Strategic Innovation and Change Oxford University Press Ox-ford 3-23
Udo G amp Guimaraes N (1994) Empirically assessing factors related to DSS benefits European Journal of In-formation Systems 3(3) 218-227
Vedder RG amp Guynes CS (2002) CIOsrsquo Perspectives on competitive intelligence Information Systems Man-agement 19(4) 49-56
Waldman DA Ramirez GG House RJ amp Puranam P (2001) Does leadership matter CEO leadership at-tributes and profitability under conditions of perceived environmental uncertainty Academy of Management Journal 44(1) 134-143
Weiss A amp Naylor E (2010) Competitive intelli-gence How independent information professionals American Society for Information Science and Tech-nology 37(1) 30ndash34 httpdxdoiorg101002bult20101720370114
Westervelt R (1996) Gaining an edge Competitive in-telligence takes off Chemical Week 158(25) 29-31
Williams SD (2004) Personality attitude and leader influences on divergent thinking and creativity in or-ganizations European Journal of Innovation Manage-ment 7(3) 187-204
Yoon Y Guimaraes T amp Clevenson A (1995) Under-standing the factors important to expert systems suc-cess Technology Management 2(3) 1-14
Yoon Y Guimaraes T amp Clevenson A (1998) Explor-ing ES success factors for BPR Journal of Engineering and Technology Management 15 179-199
Yoon Y Guimaraes T amp OrsquoNeal Q (1995) Exploring the factors associated with expert systems success MIS Quarterly 19(1) 83-106
Yukl GA (1998) Leadership in Organizations (4th ed) Englewood Cliffs NJ Prentice-Hall
International Journal of the Academic Business World 27
INTRODUCTION
Nothing stays the same part of the human condition involves adjusting to change Yet human resistance to change is both intense and natural Perhaps examples of this resistance occur in employeesrsquo personal lives or arise as they approach new ideas or changes at work Through a myriad of changes characterized by global demands unpredictable environments the onset of technologi-cal advances and operational developments managing change and resistance has become a way of life for many organizations (Judge Thoresen Pucik amp Welbourne
1999) Organizations must depend on capable leader-ship to guide them through these unprecedented times The evolution of change requires employees at all levels to embrace new techniques of working by promoting dif-ferent mindsets (Kets de Vries Ramo amp Korotov 2009) Gondo Patterson and Palacios (2013) suggested that some organizations fail to adapt to change and prepare their leadership and employees for a more uncertain fu-ture Yet their study summarized that successful change involves support of formulated strategies and the facilita-tion of change recipients being mindful during change ef-forts In the face of intense global competition it is criti-
Acceptance of Change Exploring the Relationship among
Psychometric Constructs and Employee Resistance
Brian Dunican EdDWestern Kentucky University
1906 College Heights BoulevardBowling Green KY 42101
Ric Keaster PhD Western Kentucky University
1906 College Heights BoulevardBowling Green KY 42101
ABSTRACTChange is inevitable and can influence numerous events inside and outside an organization The contrasting at-titudes of acceptance and resistance to change are an increasingly interesting topic in todayrsquos global ever-changing and competitive environment Discovering the behavioral origins of employeesrsquo reactions to change is an integral part of understanding the way in which individual mindset may play a role in coping with organizational change and resistance This body of knowledge may give organizations insight for creating a competitive advantage over their counterparts
Conceivably it can be argued that some researchers view change as a process of gradual adaptation that is largely in-fluenced by people in organizations who react to internal and external pressures while others view it as an emergent event due to environmental selections (Demers 2007) Through both concepts successful navigation through change events relies on the manner in which humans respond to these occasions
The current study employed a descriptive non-experimental correlational design to examine individualsrsquo self-rating of their level of mindfulness tolerance of ambiguity and resistance to change in four industries located in Kentucky The quantitative study sought to identify the strengths of the relationship of the chosen variables using validated instruments ndash Langerrsquos (Pirson Langer Bodner amp Zilcha-Mano 2012) Langer Mindfulness Scale (LMS14) Bud-nerrsquos (1962) Tolerance of Ambiguity Scale (TOA) and Oregrsquos (2003) Resistance to Change Scale (RTC) Regression models were utilized to evaluate multivariate relationships among the variables Based on the findings in the current study the results indicated that no differences lie between group comparisons of organizational or demographic fac-tors when examining the relationship among the elements of mindfulness tolerance of ambiguity and resistance to change Bivariate correlations yielded both strong positive and negative relationships among the three scales assessed by salary (exempt and non-exempt) employees located across the different industries (p lt 01)
Brian Dunican amp Ric Keaster Acceptance of Change Exploring the Relationship among Psychometric Constructs and Employee Resistance
28 International Journal of the Academic Business World 29Fall 2015 (Volume 9 Issue 2)
cal for organizations to have the dexterity to accept new changes and adapt to survive (Gondo et al 2013 Jacobs 2005) Discovering the behavioral origins of employee re-actions to change is an integral part of understanding the recipe for flexibility longevity and organizational success Researchers have separately alluded to varying degrees of social psychological constructsmdashparticularly elements of mindfulness and tolerance of ambiguitymdashand their influ-ence on individualsrsquo attitudes toward change and resis-tance (Banning 2003 Langer 1993)
BACKGROUND
By its nature change in organizations is inherently stress-ful causing increased anxiety among employees at each level of the organization This environment of uncertain-ty can threaten the balance of control often distracting organizations from obtaining the stability needed to sur-vive and adapt to change Researchers have analyzed sev-eral techniques for strengthening the idea of overcoming uncertainty Carson and Langer (2006) stated ldquoActively thinking about paradoxes increase onersquos ability to toler-ate ambiguity and decreases the anxiety associated with uncertainty In a separate study Weinstein Brown and Ryan (2009) contended that increased mindfulness in individuals promoted greater attention and awareness in situations (organizational change for example) perceived as stressful or threatening
Leaders throughout organizations must possess the skills and cognitive experience to manage varying degrees of uncertainty and balance the levels of tolerance within their organizations (Lane amp Klenke 2004) This notion is reinforced by Topping (2002) in that change implies uncertainty and uncertainty can drive individuals to feel afraid uncomfortable threatened anxious and as a result resistant to change On the contrary acknowl-edging uncertainty can lead to the exploration for clarity and challenges of the status quo (Geller 2002) A rapidly growing amount of literature is available on mindfulness which insinuates how this construct could aid in navigat-ing through areas of uncertainty (Brown amp Ryan 2004 Lane amp Klenke 2004 Langer 1993 Weinstein et al 2009) Brown and Ryanrsquos (2004) multifaceted definition of mindfulness recognized it as ldquoa phenomenon with functional import for outcomes as diverse as physical health psychological well-being work and sports perfor-mance and relationshipsrdquo (p 242)
The process of conforming to change or an innovation may seem difficult for individuals within organizations yet examples exist in which individuals adapt very easily and seem to flourish within this environment Judge et al (1999) explained that organizational change has been predominately conducted at a middle range or macro
level rather than at the micro individual level Changes in organizations are not always clear even for the leaders Through the vagueness of change innovative organiza-tions deliberately take actions to avoid misinterpretations and to improve the process (Limerick Passfield amp Cun-nington 1994) ldquoAs organizational structures become less hierarchical and more fluid and amorphous tolerance for ambiguity and uncertainty is likely to emerge as a quality that differentiates effective from ineffective leadersrdquo ac-cording to Lane and Klenke (as cited in Ehrlich Meindl amp Viellieu 1990 p 69) As organizations are naturally subject to uncertainties the concept of increasing employ-eesrsquo abilities to deal with ambiguous situations may lead to more success or important gains in knowledge about organizations
Resistance to Change
The literature presents an enduring consensus on the premise that it is human nature to resist change and ele-ments related to the process of change (Coch amp French 1948 Conner 1992 Oreg 2003 OrsquoToole 1995 Zander 1950) This notion of natural resistance is supported by Kotter (1995) as he described change as the force of shift-ing conditions within the human communities Contest-ed by Dent and Goldberg (1999) the phrase resistance to change should be reevaluated under a more conventional definition Although the researchers supported the belief that resistance is natural their views have challenged the idea of the way in which individuals resist change Blindly supporting the belief that one can resist change may be counterproductive and may direct the focus of organiza-tions away from the actual issues The idea of contradict-ing this belief opens the possibilities that inefficiencies in the process of change and its impact on individuals should be acknowledged and explored (Mabin Forgeson amp Green 2001) As a whole regardless of the process resistance to change is driven at the individual level and is leveraged by organizations to foster change (Conner 1992 Judson 1991)
Employees of organizations may withdraw from the fear of ideas they do not fully understand or act rebellious to-ward seemingly unclear decisions made by management without proper cause Ideally change within organiza-tions should be straightforward clear and concise prior to implementation More often this is not the case for individuals who implement the groundwork or for those who are being impacted by the change (Judson 1991) Al-ternately studies have demonstrated that some employees with a higher tolerance of ambiguity are more susceptible to change and may even thrive within this environment (Oreg 2003) As a whole organizations have struggled with implementing new ideas changing their culture and
reacting to market demands nevertheless many are will-ing to change to remain competitive
Dent and Goldberg (1999) found that at the individual level resistance to change can arise from those whose jobs are directly impacted and can cause a rippling effect through the organization Fundamentally individuals are creatures of habit and are annoyed by pressures in organi-zations that force employees to choose a different behavior or accept a reward system that may not seem beneficial However they are willing to change their behaviors when their beliefs of the benefits of the change outweigh the benefits in their current environment (Armenakis amp Be-deian 1999) In other words attitude toward the change affects onersquos willingness to consider and even implement the change
ATTITUDES AND CHANGE
Some change efforts within organizations are successful some are not Kotter (1995) monitored approximately 100 companies over a decade to observe the fundamental changes made in fluctuating business environments The research included examples of successes examples of fail-ures and illustrations of companies that remained stag-nant as they suffered through misguided steps Outlined by Kotter (1995) successful changes within companies encompassed eight steps (a) creating a sense of urgency (b) forming a guiding coalition (c) creating a compel-ling vision (d) communicating the vision for buy-in (e) empowering and acting on the vision (f) creating quick wins (g) increasing credibility through small wins and (h) linking success to new approaches In an earlier ap-proach Judson (1991) proposed five steps to enhance the process of change by engaging employeesrsquo active participa-tion through (a) analyzing and planning the change (b) communicating the plan for change (c) gaining buy-in and acceptance (d) changing the status quo to the desired state and (e) institutionalizing the new state of change Through these steps the common link described for suc-cessful changes involved employeesrsquo comprehension of the change and their personal adaptation to the new way of thinking and working
Iverson (1996) supported the concept that organizational change could be easier when employees have higher per-sonal commitments through healthy professional rela-tionships positive employee morale job satisfaction and positive recognition Moreover employees who have a sol-id desire to perform well and are willing to embrace new challenges even in the absence of clarity also understand the importance of change within organizations Further-more Gaumlrtner (2013) reinforced the concept that employ-eesrsquo attitudes and perceived flexibility toward change were influenced through a subset of mindfulness Although it
is not a new term mindfulness supports the concepts at-tributed to attention awareness engagement and being comfortable with new ideas that may impact areas within an individualrsquos control (Langer 1993)
The Problem Defined
With the continuous expansion of globalization and the rising unpredictability of consumer demands economic pressures and technological advancements organiza-tions have been required to change to remain competi-tive Change is inevitable The organizations that master agility and are adaptive to the ever-changing environment will possess the recipe to emerge triumphant over their competitors In reality every organization must change yet the process is not always smooth or effective Hypo-thetically within the organizational structure there are individuals who visualize the change others who develop and organize the change and those who implement and perform the change (Isabella 1990) At times roles of in-dividuals may overlap due to the size of the organization and the responsibilities entailed within each role Directly or indirectly everyone throughout the organization is im-pacted by the change perhaps some individuals are able to cope with change better than others A study of the relat-ed factors of mindfulness and tolerance of ambiguity may lead to insights about individualsrsquo resistance to change
Defining the Problem of Resistance
Resistance to change refers to adverse human forces that impact the processes of change Kotter (1995) empha-sized that organizational resistance is often helped along through the mismanagement of change and by ignoring its impact on the processes Maurer (2009) suggested that resistance will happen often due to failures from previ-ous change implementations Lewin (1947) one of the most influential early researchers of change realized that change was not an event but rather a living process He conceptualized the process of change through a model composed of three steps unfreezing change and refreez-ing His initial step introduces the idea of resistance in-dividuals must give up something before accepting some-thing new Though simple his ideas have been expanded upon by numerous researchers and have been developed into various theories of change Zander a close colleague of Lewin defined resistance to change as ldquobehavior which is intended to protect an individual from the effects of real or imagined changerdquo (as cited by Dent amp Goldberg 1999 p 34)
Mabin et al (2001) found that seemingly rebellious em-ployees manifest their fears of change due to uncertainty In addition perceived resistance may be disguised through
Brian Dunican amp Ric Keaster Acceptance of Change Exploring the Relationship among Psychometric Constructs and Employee Resistance
30 International Journal of the Academic Business World 31Fall 2015 (Volume 9 Issue 2)
the camouflage of untimely surprises past resentment ad-ditional job duties or the exposure of personal vulnera-bilities In isolated cases changes within the organization may cause a true threat to safety quality cost or the com-panyrsquos reputation Ignoring the symptoms of resistance within the change process could have disastrous results Judson (1991) agreed that resistance to change is not the fundamental problem but a symptom hiding basic under-lying circumstances He also developed a continuum of reactions to change ranging from indifference (no resis-tance) to active even aggressive resistance
Research has validated the importance of evaluating the reactions and the attitudes of individuals toward organi-zational change and their desire to succeed (Judge et al 1999 Oreg 2006) Developed and validated by Oreg (2003) the Resistance to Change scale has been widely used and accepted by academic works to measure an indi-vidualrsquos disposition toward resistance to change Further-more Oreg outlined four subscales as an exploratory anal-ysis to categorize an individualrsquos reaction to resist change (a) routine seeking (b) emotional reaction to impose change (c) cognitive rigidity and (d) short-term focus Supportive research (cited in Oreg 2003) has found the factors of openness to change tolerance of ambiguity and risk aversion as predictors for managers coping with the stress of change within their organizations An exhaustive amount of research has been conducted on the broad topic of resistance to change yet little is known on the relation-ship of how the psychological constructs of mindfulness and tolerance of ambiguity influence resistance to change within organizations Early researchers such as Coch and French (1948) viewed resistance to change as an obstacle of contention during the process of changes within organiza-tions One of their studies conducted in a sewing factory revealed that employees retaliated against change through acts of aggression controlling restrictions of throughput high turnover rates increased complaints and reports of dissatisfaction with management In line with earlier studies the use of the term resistance to change gained popularity beginning in the 1950s following Lewinrsquos (1947 1951) works related to field theory and social sci-ences Resistance to change is commonly accredited to the unfreezing stage of Lewinrsquos (1951) change model (Ar-menakis amp Bedeian 1999) Naturally portrayed as a nega-tive barrier to change resistance to change is frequently defined using Lewinrsquos physical science-related terminol-ogy as a restraining force to maintain the current state of equilibrium (Dent amp Goldberg 1999) Since that time resistance to change has been widely acknowledged and associated with the process of change organizational de-velopment and change theories and models Other schol-ars have conceptualized resistance to change as an emo-tional reaction rather than a behavioral response As an
example Argyris and Schon (1978) suggested resistance in terms of defensive routines and frustration during the process of change Kanter (1985) supported this notion describing feelings of uncertainty and loss of control for individuals facing change In other terms of defining re-sistance Lawrence (1954) used an analogy to compare re-sistance to change as pain within the human body that is used as a signal to communicate that something is wrong ldquoThe resistance like the pain does not tell what is wrong but only that something is wrong And it makes no more sense to try to overcome such resistance than it does to take a pain killer without diagnosing the bodily ailmentrdquo (p 56) This analogy highlighted the parallels between re-sistance and overcoming it through a practicable solution
Mindfulness
Mindfulness is a concept in educational psychology that has been primarily defined by Dr Ellen Langer a so-cial psychology professor at Harvard University Langer (1993) defined mindfulness as ldquoan open creative proba-bilistic state of mind in which the individual might be led to finding differences among things thought similar and similarities among things thought differentrdquo (p 44) Langer (1997) further explained three characteristics of mindfulness ldquo(a) continuous creation of new categories (b) openness to new information and (c) having an im-plicit awareness of more than one perspectiverdquo (p 4) The Mindfulness Scale validated by Pirson et al (2012) oper-ationalizes the construct and identifies the four subscales of novelty-seeking engagement novelty-producing and flexibility to explain the broad psychometric construct Brown and Ryan (2003) defined mindfulness as ldquoa quali-ty of consciousness that is characterized by clarity and viv-idness of current experience and thus stands in contrast to the mindlessrdquo (p 823) Different from Langerrsquos definition that evaluates dispositional differences in reflective con-sciousness behavioral routines over time Ryan and Brown focused on the presence or absence of attention to and the awareness of events occurring in the present moment For the purpose of the current study the ideas of mindfulness were presented through the literature of Langer Further-more mindfulness is believed to play an important role in disengaging individuals from automatic thoughts habits and unhealthy behavior patterns and may contribute to well-being and happiness in a direct way (Brown amp Ryan 2003)
Tolerance of Ambiguity
Tolerance of ambiguity describes an individualrsquos behavior in unclear or insecure situations and how one reacts to the lack of clarity or uncertainty (Banning 2003) Devel-oped by Frenkel-Brunswik (1948) tolerance of ambigu-
ity has gained attention from researchers over the past 60 years Frenkel-Brunswik was one of the first to present a comprehensive analysis of ambiguity and was influenced by earlier works of Germany psychologist Erich Jaensch Frenkel-Brunswik described tolerance of ambiguity as an ldquoemotional and perceptual personality variablerdquo (cited in Furnham amp Ribchester 1995 p 180)
Budner (1962) later defined tolerance for ambiguity as ldquothe tendency to perceive ambiguous situations as desir-ablerdquo and intolerance for ambiguity as ldquothe tendency to perceive ambiguous situations as sources of threatrdquo (p 29) Budner developed the Tolerance of Ambiguity Scale to further interpret the complex concept of ambiguity and individualsrsquo responses to it Through the development of the Tolerance of Ambiguity Scale three subscales (ie novelty complexity insolubility) emerged to provide in-sight into the more abstract larger construct A decade later Norton (1975) defined tolerance of ambiguity as the degree to which an individual is cognitively willing to tolerate uncertainty vagueness or nebulous information and is able to act upon the knowledge
Employees resist change at all levels of the organization Although some individuals openly accept change many do not Determining the varying degrees of each psycho-metric construct on resistance along with their combi-nation toward resistance to change may reveal common areas of opportunity related to organizational change The following general research question is offered How are the psychometric constructs of mindfulness and toler-ance for ambiguity related to resistance to change within organizations
Empirical Studies and Questions
Numerous studies have alluded to resistance to change some have focused on the individuals (eg Bovey amp Hede 2001 Coghlan 1993 Ford Ford amp McNamara 2002) while others have explored organizations (eg Arm-bruster Bikfalvi Kinkel amp Lay 2008 Coch amp French 1948 Greenwood amp Hinings 1996 Lawrence 1954 Stanley Meyer amp Topolnytsky 2005) Van Dam Oreg and Schyns (2008) stated ldquoA review of the past empirical research reveals that resistance to change has been concep-tualized in three ways as a cognitive state as an emotion as a behavioral intentionrdquo (p 316) As an emotion some studies have revealed that employees who display nega-tive perceptions toward organizational change may have an overall negative outlook on change thus perpetuat-ing resistance (Armenakis Harris amp Mossholder 1993 Stanley et al 2005) Extreme measures of resistance to organizational change have been displayed in other stud-ies through sabotage slowdowns and strikes (Armenakis et al 1993) Universally resistance to change has been
recognized to have a significant impact on the outcomes of organizational change yet individuals within the or-ganization are perceived to be the major blockage or im-pediment (Mabin et al 2001) Based on the literature concerning the analysis of change empirical studies have identified a wide range of factorsmdashnamely organization-al managerial behavioral and individualmdashthat promote or impede resistance in organizations
Organizations are faced with the challenges of changing and responding to current and future trends at an un-precedented rate in todayrsquos global environment (Burke 2014) Twenty-five years ago Offermann and Gowing (1990) found that American organizations alone had spent over a record 210 billion dollars to prepare leaders to thrive in organizational change In addition to money an immeasurable amount of time and energy have been dedicated to nurturing leadership and key individuals to navigate others through this complex but important pro-cess Nonetheless the blueprint is far from perfect The readiness of individuals within the organization to plan and implement proactive measures may determine the or-ganizationrsquos competitiveness The current study examines the factors of mindfulness and tolerance of ambiguity and how they relate to individualsrsquo perceptions of resistance to change The specific research questions are the following
1 How do demographic factors of the respondents and the organizational factors under which they work relate to the psychometric scales of Mind-fulness and Tolerance of Ambiguity and their influence on Resistance to Change
2 After controlling for demographic factors how does psychometric mindset (Sub-constructs of Mindfulness and Tolerance of Ambiguity) influence individual Resistance to Change (a) Routine seeking (b) Emotional reaction (c) Short-term focus (d) Cognitive rigidity
3 What is the degree of relationship among these measures of Mindfulness and Tolerance of Am-biguity
4 The following model characterizes the current study
Highlights of the Methodology
When considering the measurement of the perceptions of resistance to change within organizations various meth-ods have been utilized to illustrate relationships among different constructs (Oreg 2003 Oreg Vakola amp Ar-menakis 2011) In the current quantitative non-exper-
Brian Dunican amp Ric Keaster Acceptance of Change Exploring the Relationship among Psychometric Constructs and Employee Resistance
32 International Journal of the Academic Business World 33Fall 2015 (Volume 9 Issue 2)
imental study data were collected from three validated instruments ndash Langerrsquos (Bodner amp Langer 2001) Langer Mindfulness Scale (LMS) Budnerrsquos (1962) Tolerance of Ambiguity Scale (TOA) and Oregrsquos (2003) Resistance to Change (RTC) scale Regression models were used to assess the univariate relationships among the constructs Additionally descriptive statistics were used to include the mean median mode standard deviation and other selected variables A multiple linear regression analysis determined the relationship between factors of mindful-ness and tolerance of ambiguity and their influence of resistance to change Bivariate correlations were used to compute the psychometric scores from each instrument and resistance to change ratings to test the significance of the relationships between each subscale Overall statisti-cal analyses were conducted in multiple phases to investi-
gate the relationship between the individual psychomet-ric traits and resistance for salary exempt and non-exempt employees in industrial sites located in Kentucky
Participants in the Study
The population represented a microcosm of several indus-tries in the manufacturing sector within the proximity of Warren County The data collected were based on a con-venient sample A total of 65 participants volunteered to complete an electronic survey that was designed to capture complete responses to a total of 48 questions Participants were not allowed to proceed to the next page of the survey unless all questions on the current page were completed Three participants did not complete the survey and their responses were not included in the end results From the
population of 183 salaried (exempt and nonexempt) em-ployees 65 surveys were officially returned constituting a response rate of 36 Managerial-type jobs dominated 36 of the sample population followed by roles in tech-nical support which reflected 169 Six categories of job types and an ldquoOtherrdquo category were used for the respon-dents
Scoring Method for Each Scale
Resistance to Change Scale
Oregrsquos (2003) Resistance to Change Scale is comprised of 17 items with four subscales ndash routine seeking emo-tional reaction short-term focus and cognitive rigidity Each subscale relates to the extent to which individuals seek routines react to emotions during change encom-pass short-term focus during change and the frequency to which individuals change their minds The overall range of the scale including the subscales is scored between 1 and 6 with 1 representing the least level of resistance In-dividuals scoring higher on the overall scale or subscales indicate a higher resistance to change
Langer Mindfulness Scale
The Langer Mindfulness Scale (Pirson et al 2012) con-tains 14 items and is composed of three subscales ndash novelty seeking engagement and novelty producing The 7-point scale is scored such that higher scores indicate a greater level of awareness toward thinking High scores for novel-ty producing insinuate one would perceive new situations as opportunities to learn new information Individuals with high scores for engagement are more susceptible to noticing details within their environment as opposed to others Higher novelty producing scores indicate that individuals are likely more creative and predisposed to generating new ideas when faced with new information
Tolerance of Ambiguity Scale
Budnerrsquos (1962) Tolerance of Ambiguity Scale is a 16-item scale with ratings ranging from 1 to 7 1 represents strong disagreement indicating a greater tolerance for ambiguity It is important to note that higher scores relate to greater intolerances for ambiguity All results were re-ported at the aggregate level
RESULTS
Statistical data analyses were performed on survey data comprised of the following three instruments Langer Mindfulness Scale (LMS14) Tolerance of Ambigu-
ity Scale (TOA) and Resistance to Change (RTC) scale Findings were reported from the analyses of data col-lected from 65 participants responding to the Qualtrics Web-based survey In particular analyses were conducted through bi-variant correlation analyses (also known as Pearsonrsquos r) independent t-tests and Cronbachrsquos alpha The strengths of the relationships were predicated on Co-henrsquos (1988) interpretation Coefficient values between 10 and 29 were considered small or weak those between 30 and 49 were considered moderate and those between 50 and 10 were considered large or strong
Analysis of Each Research Question
The first research question explored the relationship of de-mographic and organizational factors to the psychomet-ric scales of Mindfulness and Tolerance of Ambiguity and their influence on Resistance to Change Descriptive sta-tistics reflected both demographic and organizational fac-tors ndash gender education years at the company and direct reportsmdashfor the 65 employees who participated in the current study The distributions of variables were distrib-uted evenly between only two variables years at the com-pany and direct reports Other demographic variables including ethnicity and age were recorded A statistical analysis was not conducted due to the uneven distribution of the variables Of the 65 participants 59 were Caucasian and the remaining 6 were minorities The ages of the par-ticipants ranged from 28 years to 65 years Additionally frequency distributions and data analyses were not con-ducted for individual sites to protect anonymity All re-sults were reported at the aggregate level and included the following categories for the participating industries Cup Manufacturing Personal Care Manufacturing Con-struction and Rubber to Metal Bonding Manufacturing
Gender Male and Female
Although more than twice as many males than females participated in the current study independent t-tests were conducted to determine whether differences existed be-tween the mean scores of the scales and subscales for male and female employees No statistically significant differ-ences were found between the outcome of the psychomet-ric constructs (Mindfulness and Tolerance of Ambiguity) and Resistance to Change except on one subscale Cogni-tive rigidity revealed a statistical difference between the scores of males (n = 45 M = 381 SD = 063) and females (n = 20 M = 336 SD = 086) t (63) = 234 p = 05 α = 05
Figure 1 Logic model for hypothesized relationships among
Psychometric Constructs Demographic Controls and Degree of Resistance to Change
INDEPENDENT VARIABLES
Degree of Resistance
Demographic Factors
-----
Age Gender
Ethnicity Education
____________
Organizational Factors
----- Years at Current Company Type of Current Position
Type of Industry or Category Number of Direct Reports
Resistance to Change -----
Routine Seeking Emotional Reaction Short-term Focus
Cognitive Rigidity
Tolerance of Ambiguity
----- Novelty
Complexity Insolubility
Mindfulness -----
Novelty Seeking Engagement
Novelty Producing
Brian Dunican amp Ric Keaster Acceptance of Change Exploring the Relationship among Psychometric Constructs and Employee Resistance
34 International Journal of the Academic Business World 35Fall 2015 (Volume 9 Issue 2)
Education
Due to the imbalanced distributions of participants sta-tistical analysis for Education was not performed The frequency distribution reflected that 5231 (34) of the participants possessed a four-year degree 1231 (8) ob-tained a masterrsquos degree or higher 2615 (17) possessed a two-year degree or some college while the reaming 923 (6) were high school graduates
Direct Reports and No Direct Reports
An individual variances t-test was conducted and failed to reveal a statistically reliable difference between the mean scores of salaried employees without direct reports and salaried employees with direct reports As an example scores from routine seeking a subscale of resistance to change were not significantly different between employ-ees without direct reports (n = 32 M = 312 SD = 096) and employees with direct reports (n = 33 M = 291 SD = 085) t (65) = 093 p = 037
Years at the Company
A one-way analysis of variance (ANOVA) was calculated on participantsrsquo ratings of the psychometric constructs and resistance to change as a comparison to the number of years at the company Comparisons indicated no sta-tistically significant differences were presented between groups of 0 to 4 years 5 to 10 years 11 to 20 years and 21 years and greater As an example on novelty-seeking a subscale of the Langer Mindfulness Scale the analysis was not significant between the four groups F(3 61) = 31 p = 82
The second research question used bivariate correlations to determine the strength of the relationships between the psychometric constructs (Mindfulness and Tolerance of Ambiguity) and Resistance to Change including the four subscales All of the Pearson correlations were significant across each of the findings with the exception of the LMS scale and Cognitive Rigidity of Resistance to Change subscale r(65) = -225 p = 072 The overall LMS scales reflected a strong negative relationship r(65) = -530 p lt 001 with the RTC scale The TOA scale revealed a mod-
Table 1 Descriptive Statistics and Correlations among Responses of Tolerance of
Ambiguity Scale Langer Mindfulness Scale and Subscales and Resistance to Change and Subscales
Scales LMS_NS LMS_NP LMS_E TOA_ Tot RTC_RS RTC_ER RTC_STF RTC_CR
LMS_NS (77)
LMS_NP 76 (72)
LMS_E 49 51 (69)
TOA_Tot -48 -53 -32 (72)
RTC_RS -51 -50 -41 65 (85)
RTC_ER -36 -37 -36 41 71 (88)
RTC_STF -53 -47 -38 60 77 80 (90)
RTC_CR -28 -26 -04 44 51 45 41 (86)
of Items 5 5 4 16 5 4 4 4
Mean 598 504 556 376 342 285 367 322
SD 071 94 102 71 110 104 73 81Note N = 65 Cronbachrsquos alpha reliabilities for each dimensionconstruct are listed in parentheses on diagonal Cronbachrsquos Alpha measures indicated a high internal consistency among the items reflected in each scale p lt 05 level (two-tailed) p lt 01 level (two-tailed)
Table 2 Descriptive Statistics and Correlations among Responses of the Total Tolerance of
Ambiguity Scale Langer Mindfulness Scale and Resistance to ChangeLMS_Tot Mean TOA_Tot Mean RTC_Tot Mean
LMS_MeanTotal (86)
TOA_Meantotal -53 (72)
RTC_Meantotal -53 62 (93)Number of items 14 16 17Mean 552 376 301Standard Deviation 75 71 91Note N = 65 Cronbachrsquos alpha reliabilities for each dimensionconstruct are listed in parentheses on diagonal No subscales for Tolerance of Ambiguity were referenced in research Cronbachrsquos Alpha measures indicated a high internal consistency among the items reflected in each scale p lt 05 level (two-tailed) p lt 01 level (two-tailed)
Table 3 Descriptive Statistics and Correlations among Responses Related to Operational and
Demographic Factors Tolerance of Ambiguity Scale Langer Mindfulness Scale and Sub-scales and Resistance to Change and Subscales
ME
AN
SD AG
E
YR
SWR
K
DR
RPT
S
TO
A_M
LMS_
M
LMS_
NS
LMS_
NP
LMS_
E
RT
C_M
RT
C_R
S
RT
C_E
R
RT
C_S
TF
RT
C_C
R
AGE 4571 782 100YRSWRK 1283 943 52 100DRRPTS 1005 2162 -18 01 100TOA_M 376 71 15 11 -02 100LMS_M 552 75 -07 -07 10 -53 100LMS_NS 598 71 -12 -12 04 -48 87 100LMS_NP 504 94 -05 01 18 -53 90 76 100LMS_E 556 102 -01 -10 01 -32 78 49 51 100RTC_M 322 81 -14 -10 -08 62 -53 -51 -48 -37 100RTC_RS 301 91 -13 -07 -04 65 -55 -51 -50 -41 90 100RTC_ER 342 110 -23 -17 -07 41 -43 -36 -37 -36 90 71 100RTC_STF 285 104 -05 00 -06 60 -54 -53 -47 -38 91 77 80 100RTC_CR 367 73 -07 -08 -14 44 -23 -28 -26 -04 65 51 45 41 100
Note N = 65 The correlation coefficient ranges from -1 to +1 with -1 indicating a perfect negative correlation +1 indicating a perfect positive correlation and 0 indicating no correlation
Brian Dunican amp Ric Keaster Acceptance of Change Exploring the Relationship among Psychometric Constructs and Employee Resistance
36 International Journal of the Academic Business World 37Fall 2015 (Volume 9 Issue 2)
erate positive correlation r(65) = 624 p lt001 Further bivariate analyses for LMS explored the strength of the re-lationships between the subscales of the Langer Mindful-ness Scale and the subscales of the Resistance to Change scales The correlational analysis was statistically signifi-cant between all variables except Engagement of the LMS and Cognitive Rigidity of RTC r(63) = -35 p = 781 concluding that the variables were unrelated
The last research question explored the degree of the re-lationship between Mindfulness and Tolerance of Am-biguity Bivariate analyses were used to correlate the re-lationship between the two psychometric constructs The correlations revealed a significantly strong negative rela-tionship between the total mean score of the LMS and the total mean score of the TOA r(63) = -53 p lt 01 The mean scores for each of the LMS subscales compared to the total mean of the TOA showed the following Nov-elty-seeking and TOA r(63) = -48 p lt 01 Novelty-pro-ducing and TOA r(63) = -53 p lt 01 and Engagement and TOA r(63) = -32 p lt 01 It is important to note that higher scores on the Tolerance of Ambiguity scale indicate a greater intolerance of ambiguity Tables 1 and 2 display a descriptive analysis and correlations for each of the scales and subscales The correlations between vari-ables are presented in Table 3
LIMITATIONS OF THE STUDY
Research inherently contains limitations The current study is no exception First the nature of measuring psy-chometrics is subjective Since psychometrics studies mea-sure the way in which individuals think and act (Norton 1975) influences of the organizationrsquos environment could affect individualsrsquo responses to questions Additionally external variables at the time of data collection not related to the study itself can skew the responses and influence the outcomes Other views of limitation rest on the gen-eralizability of the results which may be limited for the following reasons (a) the unit of analysis is at the indi-vidual level (b) data were collected from a limited num-ber of operations within the state of Kentucky through convenience sampling and (c) individual biases that may be introduced at the time of testing
The unit of analysis for data collection rests at the indi-vidual level rather than the group level due to the acces-sibility of the employees Although the survey collection method allows for comparison with larger groups it lim-its the opportunity to explore issues in depth therefore assumptions are made for individuals in similar groups Next the data collected represents limited industries in the state of Kentucky restricting the number of partici-pants and the ability to generalize outcomes to other in-dustries different than those outlined in the current study
Last respondentsrsquo values interests and beliefs regarding the online self-administered surveys may introduce biases unknown by the researcher As a consequence of these limitations and the collection of data during one point in time the results are generalizable only to the groups or populations that are similar to those in the current study
SUMMARY AND CONCLUSION
Change within organizations is inevitable That real-ity will remain constant in organizationsmdashand in onersquos personal and professional life (Conner 1992) The way in which one chooses to cope with change could be a decid-ing factor of success failure or choosing to remain the samemdashwhich in organizations tends to equate with fail-ure particularly if change means simply improving Resis-tance is a natural reaction to change and is part of the hu-man psyche Research and literature support this notion of human nature to resist change and elements related to the process of change (Coch amp French 1948 Conner 1992 Oreg 2003 OrsquoToole 1995 Zander 1950) It is possible that a greater understanding of mindfulness and tolerance of ambiguity could increase the possibilities of new ideas to drive lower resistance to change The current study explored the two psychometric constructs of mind-fulness and tolerance of ambiguity and their relationship to resistance to change within industrial settings Bivari-ate correlations yielded both strong positive and negative correlations among the three scales assessed by salaried employees located across different industries The Langer Mindfulness Scale Budnerrsquos Tolerance of Ambiguity Scale and Oregrsquos Resistance to Change scale were attrib-uted to the foundation of the current study The results contributed to the practical and theoretical significance of individualsrsquo responses to change through the measure-ment of the aforementioned constructs To the extent the findings in the current research could be extrapolated to other industries or organizations a final suggestion should be noted When considering future directions for research related to probing psychometric constructs and resistance to change the current study may have relevance across different nationalities and cultures The elements of change will continue to challenge the fabric of organiza-tions while the internal and external pressures of rising costs variations in supply and demand relentless compe-tition and developing technology test the resolve for sur-vival The readiness of individuals within organizations and their ability to challenge perceptions of change and resistance may determine their competitiveness and ulti-mately their success
REFERENCES
Argyris C amp Schon D (1978) Organizational learning A theory of action research Reading MA Addison-Wesley
Armbruster H Bikfalvi A Kinkel S amp Lay G (2008) Organizational innovation The challenge of measur-ing non-technical innovation in large-scale surveys Technovation 28(10) 644-657
Armenakis A A amp Bedeian A G (1999) Organiza-tional change A review of theory and research in the 1990s Journal of Management 25 293-315
Armenakis A A Harris S G amp Mossholder K W (1993) Creating readiness for organizational-change Human Relations 46(6) 681-703
Banning K C (2003) The effect of the case method on tolerance for ambiguity Journal of Management Edu-cation 27 556-567
Bodner T E amp Langer E J (2001 June) Individual differences in mindfulness The MindfulnessMind-lessness Scale Poster presented at the 13th annual American Psychological Society Conference Toronto Ontario Canada
Bovey W H amp Hede A (2001) Resistance to organisa-tional change The role of defence mechanisms Journal of Managerial Psychology 16(7) 534-548
Brown K W amp Ryan R M (2003) The benefits of be-ing present Mindfulness and its role in psychological well-being Journal of Personality and Social Psychol-ogy 84 822-848 doi1010370022-3514844822
Brown K W amp Ryan R M (2004) Perils and promise in defining and measuring mindfulness Observations from experience Clinical Psychology Science and Practice 11(3) 242-248 doi101093clipsybph078
Budner S (1962) Intolerance of ambiguity as a personal-ity variable Journal of Personality 30 29-59
Burke W W (2014) Organizational change theory and practice Thousand Oaks CA Sage Publications Inc
Carson S H amp Langer E J (2006) Mindfulness and self-acceptance Journal of Rational-emotive and Cog-nitive-behavior Therapy 24(1) 29-43
Coch L amp French J (1948) Overcoming resistance to change Human Relations 1 512-532
Coghlan D (1993) A person-centred approach to deal-ing with resistance to change Leadership amp Organi-zation Development Journal 14(4) 10-14
Cohen J (1988) Statistical power analysis for the behav-ioral sciences Hillsdale NJ Lawrence Erlbaum Associates
Conner D R (1992) Managing at the speed of change How resilient managers succeed and prosper where others fail New York Random House
Demers C (2007) Organizational change theories Thousand Oaks CA Sage Publications Inc
Dent E B amp Goldberg S G (1999) Resistance to change A limiting perspective Journal of
Ehrlich S B Meindl J R amp Viellieu B (1990) The charismatic appeal of a transformational leader An empirical case study of a small high-technology con-tractor The Leadership Quarterly 1(4) 229-247
Ford J D Ford L W amp McNamara R T (2002) Re-sistance and the background conversations of change Journal of Organizational Change Management 15(2) 105-121
Frenkel-Brunswik E (1948) Tolerance toward ambigu-ity as a personality variable American Psychologist 3 268-269
Furnham A amp Ribchester T (1995) Tolerance of am-biguity A review of the concept its measurement and applications Current Psychology 14 179-199
Gaumlrtner C (2013) Enhancing readiness for change by enhancing mindfulness Journal of Change Manage-ment 13 52-68
Geller E S (2002) Leadership to overcome resistance to change It takes more than consequence control Jour-nal of Organizational Behavior Management 22(3) 29-49
Gondo M Patterson K W amp Palacios S (2013) Mind-fulness and the development of a readiness for change Journal of Change Management 13(1) 36-51
Greenwood R amp Hinings C R (1996) Understanding radical organizational change Bringing together the old and the new institutionalism Academy of Manage-ment Review 21 1022-1054
Isabella L (1990) Evolving interpretations as a change unfolds How managers construe key organization-al events Academy of Management Journal 33 7-41
Iverson R D (1996) Employee acceptance of organiza-tional change The role of organizational commitment International Journal of Human Resource Manage-ment 7 122-149
Jacobs P (2005) Five steps to thriving in times of un-certainty Harvard Management Update 10(12) 3-5
Brian Dunican amp Ric Keaster
38 Fall 2015 (Volume 9 Issue 2)
Retrieved from httphbrorgproductfive-steps-to-thriving-in-times-of-uncertaintyanU0512A-PDF-ENG
Judge T A Thoresen C J Pucik V amp Welbourne T M (1999) Managerial coping with organization-al change A dispositional perspective Journal of Ap-plied Psychology 84 107-122
Judson A (1991) Changing behavior in organizations Minimizing resistance to change Cambridge MA Basil Blackwell
Kanter R M (1985) Supporting innovation and ven-ture development in established companies Journal of Business Venturing 1 47-60
Kets de Vries M F R Ramo L amp Korotov K (2009) Organizational culture leadership change and stress INSEAD Working Papers Collection 10 2-26 Re-trieved from httpwwwinseadedufacultyresearchresearchdoccfmdid=41924
Kotter J P (1995) Leading change Why transformation efforts fail Harvard Business Review 73(2) 59-67
Lane M S amp Klenke K (2004) The ambiguity toler-ance interface A modified social cognitive model for leading under uncertainty Journal of Leadership amp Organizational Studies 10(3) 69-81
Langer E J (1993) A mindful education Educational Psychologist 28 43-50
Langer E J (1997) The power of mindful learning Read-ing MA Addison-Wesley
Lawrence P R (1954) How to deal with resistance to change Harvard Business Review 32(3) 49-57 Retrieved from httpedsaebscohostcomlib-srvwkueduehostpdfviewerpdfviewervid=6ampsid =699bab3d-bcec-40d9-ac69-a42c853d72bc40sessionmgr4004amphid=4108
Lewin K (1947) Frontiers in group dynamics II Chan-nels of group life social planning and action research Human Relations 1(2) 143-153
Lewin K (1951) Field theory in social science Selected theoretical papers New York Harper amp Row
Limerick D Passfield R amp Cunnington B (1994) Transformational change Towards an action learning organization The Learning Organization 1(2) 29-40
Mabin V J Forgeson S amp Green L (2001) Harness-ing resistance Using the theory of constraints to assist change management Journal of European Industrial Training 25(234) 168-191
Maurer R (2009) Introduction to change without mi-graines Omaha NE Maurer and Associates Re-trieved from httpextensionmissouriedustaffsde-teams DocumentsChangeW-outMigrarainespdf
Norton R W (1975) Measurement of ambiguity toler-ance Journal of Personality Assessment 39 607-619
Offermann L R amp Gowing M K (1990) Organiza-tions of the future Changes and challenges Ameri-can Psychologist 45(2) 95-108 doi10370003-066X45295
Oreg S (2003) Resistance to change Developing an in-dividual differences measure Journal of Applied Psy-chology 88 680-693
Oreg S (2006) Personality context and resistance to organizational change European Journal of Work and Organizational Psychology 15 73-101
Oreg S Vakola M amp Armenakis A (2011) Change re-cipientsrsquo reactions to organizational change A 60-year review of quantitative studies The Journal of Applied Behavioral Science 47 461-524
OrsquoToole J (1995) Leading change The argument for val-ues-based leadership Boston MA Ballentine Books
Pirson M Langer E J Bodner T amp Zilcha-Mano S (2012) The development and validation of the Langer Mindfulness Scale-Enabling a socio-cognitive perspec-tive of mindfulness in organizational contexts Ford-ham University School of Business Research Paper Re-trieved from httpdxdoiorg102139ssrn2158921
Stanley D J Meyer J P amp Topolnytsky L (2005) Employee cynicism and resistance to organizational change Journal of Business and Psychology 19(4) 429-459
Topping P (2002) Managerial leadership New York McGraw Hill Professional
Van Dam K Oreg S amp Schyns B (2008) Daily work contexts and resistance to organisational change The role of leader-member exchange development climate and change process characteristics Applied Psycholo-gy An International Review 57 313-334 doi101111j1464-0597200700311x
Weinstein N Brown K W amp Ryan R M (2009) A multi-method examination of the effects of mindful-ness on stress attribution coping and emotional well-being Journal of Research in Personality 43 374-385
Zander A F (1950) Resistance to change Its analysis and prevention Advanced Management 4(5) 9-11
International Journal of the Academic Business World 39
INTRODUCTION
Cloud computing is one of the most talked about infor-mation technology topics these days 7 24 Early literature review reveals an endemic confusion of what cloud com-puting is does and what it stands for We posit that the cloud metaphor 3 20 fosters a confusion that persists even today
The goal of this research paper is to look back and make historical sense of cloud computing We try to find the lineage of cloud computing where the phrase cloud com-puting came from who came up with the term and how it found currency in the IT community We trace cloud computing to early timesharing and Application Service Provider (ASP) in the last decade and posit a future of utility computing
Additionally we try to shed light on the current state of cloud computing provide a comprehensive definition of the term and its main building blocks
CLOUD COMPUTING IN THE ACADEMIC LITERATURE
A metaphor
In an article by Ian Foster and Steven Tuecke 3 the authors start by describing the well-known elephant fable where a group of blind people are asked to describe an elephant and not surprisingly each provides a different view
The cloud is a metaphor for the Internet Itrsquos a rebranding of the Internet that is why there is a raging debate By vir-tue of a metaphor itrsquos open to different interpretations 20
Confusion and Frustration
The word ldquocloudrdquo in cloud computing informs very little and it may even misinform ldquoI hated it but I finally gave inrdquo says Carl Bass President and CEO of Autodesk He adds ldquoI didnrsquot think the term helped explain anything to people who didnrsquot already know what it isrdquo20
Giving the lsquocloudrsquo name to the old concept of large shared distributed systems is misleading 4 p 26
Larry Ellison Oraclersquos CEO ldquoThe interesting thing about cloud computing is that wersquove redefined cloud computing everything that we already dohellipI donrsquot understand what we would do differently in light of cloud computing other than change the wording of some of our adsrdquo 1 p 50
In an article in Harvard Business Review (HBR) 22 the author asks a rhetorical question ldquoWhat the heck does it mean to have a lsquocloudrsquo It means that the functions you want like storage communications and applications donrsquot need to live on the device you have in front of you You can get them on demand from the networkrdquo We should ask the question ldquoin a typical non-cloud IS en-vironment do we really have the stated functions on the device in front of usrdquo
Cloud Computing is often confused with Utility Com-puting but they are not the samemdashrather the latter forms part of the former 2
No Definition
Realizing the elephantine nature of cloud computing there is a reluctance to define it Question How would you define cloud computing Answer Cloud computing
The Origin and Construct of Cloud Computing
Nozar Daylami PhD Adjunct Professor
School of Management Information System and Technology Program
California Lutheran University Thousand Oaks CA 91360
ABSTRACTCloud computing is one of the most talked about information technology topics these days A literature review reveals an endemic confusion of what cloud computing stands for This paper tries to shed light on why the term is so confusing We try to find where the phrase cloud computing came from and how it found currency in the IT community We trace cloud computing to early timesharing and Application Service Provider (ASP) in the last decade and posit a future of utility computing This paper also provides a comprehensive definition of the term and its main building blocks
Nozar Daylami The Origin and Construct of Cloud Computing
40 International Journal of the Academic Business World 41Fall 2015 (Volume 9 Issue 2)
is not so much a definition of a single term as it is a trend in service delivery taking place today 3 p 52
An Old Concept
Cloud computing is an old concept it ldquois a throwback to the mainframe model of computingrdquo 19 p 78 Clearly cloud computing is simply remote computing 4 p 26
Internet or Network Computing
Cloud computing as a term for Internet-based computing service was launched by industry giants Google Ama-zon etc in late 2006 24 ldquoIt is the movement of applica-tion services onto the Internet and the increased use of the Internethelliprdquo
The Earliest Publications
In the first article on Cloud Computing in the Communi-cations of ACM 9 it is referred to as ldquothe compute cloudrdquo and is deemed synonymous with ldquoon-demand comput-ing software as a service or the Internet as a platformrdquo Though these other naming conventions are self-explana-tory cloud computing is not
The cloud computing is understood as a shift of the ge-ography of computing It begs the question if it is about moving delivery of a wide variety of information services onto to the Internet why donrsquot we call it ldquoInternet Com-putingrdquo
The first time cloud computing showed up in a HBR pub-lication was in a digital article in April 2008 14 The au-thor states that the move to cloud computing would be disruptive to incumbent players of shrink-wrapped gam-ing software assuming his readers understand what cloud computing entails
A BRIEF HISTORY OF COMPUTING
In the early days of computers they were big and expen-sive So sharing this big expensive gadget was a normal practice Most organizations did not usually own this big machine but those who did had to share it across an en-terprise That was the era of timesharing
However as computers got cheaper and more afford-able every company every department and then finally every person decided to have their own computer How-ever standalone computers are of limited use So we networked them first locally in a Local Area Network (LAN) environment and then far and wide Wide Area
Network (WAN) Then we networked the network and the World Wide Web was born
At the same time in a different parallel universe some-thing else was happening In the early years no commer-cial off-the-shelf software (COTS) was available Every organization had to write its own software program So if you wanted to computerize your accounting general led-ger payables and receivables or run your inventory you had to write your own applications
Buying off-the-shelf applications was also considered ldquooutsourcingrdquo Why Because you were having others do the work for your organization which was supposed to be doing this work for itself So over the years most appli-cation development have been outsourced to burgeoning software companies such as IBM Oracle and SAP
OUTSOURCING AND ASP
In a general sense IS outsourcing is nothing newmdashit has always been considered an option for IT solutions 11 Electronic Data Systems was handling data processing services for Frito-Lay and Blue Cross as early as 1963 IS outsourcing soon became widely known as the second of a three-phase outsourcing phenomenonmdashtraditional out-sourcing being the first phase and application outsourcing being the third 6
In the early years of the last decade xSPs service provid-ers of all stripes were leading into a new generation of IT where it really did not matter where the applications reside as long as we had access to accomplish what we wanted 247 However back then an Application Service Provider (ASP) was thought by some to be another re-incarnation of the old ldquotimesharingrdquo leveraging network technologies 22
However the understanding of an evolving net-centric computing was already there In their book published in 2002 aptly titled NetSourcing authors Kern Lacity and Willcocks 7 define a computing framework and services stack thatrsquos similar to Cloud Computing The authors state ldquoWe selected the term ldquoNetsourcingrdquo as the over-arching name because the common element of any xSP is the delivery of a product or service over a networkrdquo (p 3) The ldquonetworkrdquo however is now synonymous with the ldquoInternetrdquo
Today cloud computing is about getting the job done in whatever way shape or form that may be required Orga-nizations and individuals need the utility of computing and where it comes from by and large is of no concern As early as 1961 Professor John McCarthy predicted that computation may someday be organized as a public utility ldquoEach subscriber needs to pay only for the capac-
ity he actually uses but he has access to all programming languages characteristics of a very large system hellip Certain subscribers might offer services to other subscribers hellip The computer utility could become the basis of a new and im-portant industry 8 McCarthyrsquos notion of ldquoutility comput-ingrdquo is here right nowmdashthat is ldquocloud computingrdquo
This point is confirmed by others 1 p 51 ldquoThe data center hardware and software is what we consider a cloud When a cloud is made available in a pay-as-you-go manner to the general public we call it utility computingrdquo
CLOUD COMPUTING ORIGIN OF THE PHRASE
Coinage of the term ldquocloud computingrdquo has been traced to two individuals who at the time they came up with this term worked for Compaq Computer George Favaloro a Compaq marketing executive and Sean OrsquoSullivan the founder of the now defunct business NetCentric 20
A Compaq internal document marked as confiden-tial dated November 14 1996 and provided by Sean OrsquoSullivan contemplates a Cloud Computing ldquostrat-egyrdquo10
But the creation of this term did not find currency for another decade Many believe the first use of ldquocloud com-
putingrdquo in its modern context occurred on August 9 2006 when then Google CEO Eric Schmidt introduced the term at an industry conference ldquoWhatrsquos interesting [now] is that there is an emergent new modelrdquo Schmidt said ldquoI donrsquot think people have really understood how big this opportunity really is It starts with the premise that the data services and architecture should be on servers We call it cloud computingmdashthey should be in a ldquocloudrdquo somewhererdquo 19
CLOUD COMPUTING DEFINITION
The National Institute of Standards and Technology (NIST SP 800-145) defines Cloud Computing in the fol-lowing way ldquoCloud computing is a model for enabling convenient on-demand network access to a shared pool of configurable computing resources (eg networks serv-ers storage applications and services) that can be rapidly provisioned and released with minimal management ef-fort or service provider interaction This cloud model is composed of five essential characteristics three service models and four deployment modelsrdquo 17
The following diagram places all the pieces together in a visual form
The Conceptual Reference Model
Cloud Computing Reference Architecture NIST Special Publication 500-292
Nozar Daylami The Origin and Construct of Cloud Computing
42 International Journal of the Academic Business World 43Fall 2015 (Volume 9 Issue 2)
Cloud Computing Reference Architecture NIST Special Publication 500-292
NIST Special Publication 500-292 states that ldquothe defini-tion is widely accepted as a valuable contribution toward providing a clear understanding of cloud computing tech-nologies and cloud services It provides a simple and un-ambiguous taxonomy of three service models available to cloud consumers cloud software as a service (SaaS) cloud platform as a service (PaaS) and cloud infrastructure as a service (IaaS) It also summarizes four deployment mod-els describing how the computing infrastructure that delivers these services can be shared private cloud com-munity cloud public cloud and hybrid cloudrdquo 18 Finally the NIST definition also provides a unifying view of five essential characteristics that all cloud services exhibit on-demand self-service broad network access resource pool-ing rapid elasticity and measured service 18
This publication further states that ldquoThese services and their delivery are at the core of cloud computing In the cloud computing model the primary focus is a more eco-
nomic method of providing higher quality and faster ser-vices at a lower cost to the usersrdquo
The Cloud Security Alliance 21 provides a more transpar-ent narrative of what Cloud Computing is ldquoa model for enabling ubiquitous convenient on-demand network access to [a] shared pool of configurable computing re-sources [it] has the potential to enhance collaboration agility scaling and availability and provides opportunity for cost-reduction the model envisages a world where components can be rapidly orchestrated provisioned implemented and decommissioned scaled up or down to provide an on-demand utility-like modelrdquo
A SPATIAL VIEW OF CLOUD COMPUTING
The NIST Computing Reference Architecture is a flat depiction of the cloud computing model A three dimen-sional view of the model by Craig-Wood 2 is a spatial de-piction Here you can see the three dimensions of cloud computing that renders the elephant fable
Computing Services Framework
Infrastructure as a Service (IaaS) As the word ldquoinfra-structurerdquo implies this is the most basic of services Cus-tomers can buy processing storage and network services and then build their own systems on top of this infra-structure A pioneer in the IaaS field is Amazon with its Amazon Elastic Compute Cloud (EC2)
However most big names in the IT field from Micro-soft (Azure) to Google (App Engine) provide IaaS Here customers are not renting specific servers hard drives and network switches or any particular equipment but instead they are utilizing the infrastructure that is most certainly simulated by virtualization software allowing multiple customers to be served by the same array of physi-cal devices IaaS provides the raw power of computingmdashstorage included
Cloud Computing would not be possible without virtu-alization Virtualization is the ability to make a virtual machine (VM) act like a physical computer Just like a physical computer with its own processor operating sys-tem and storage each VM has its own components too The benefit of virtualization though is that you can put much more than only one VM even with different oper-ating systems on the same server Doing so dramatically increases each serverrsquos potential for serving clientsrsquo on-demand needs (8)
Platform as a Service (PaaS) The next level up is where vendors provide not only the raw powermdashthe infrastruc-turemdashbut preconfigured systems running operating sys-tems databases and platforms (programming languages) for building applications For example Microsoftrsquos Azure service provides preconfigured computers running Win-dows and SQL Server And Salesforcecom has Forcecom as its own custom application development platform
In practice the boundary between IaaS and PaaS is not always clear Because IaaS providers most often provide other services such as operating systems database or ap-plication development platform that fall in the PaaS cat-egory In its purest form IaaS can be considered as virtual machines (raw processing power and storage) that can be scaled up and down as you need
Software as a Service (SaaS) Another higher layer is where vendors provide full applications running on cloud infrastructuremdashtheir own or rented from the likes of Amazon Salesforcecom has long been considered one of the most successful SaaS provider Salesforececom CRM was one of the early entrants into the market Salesforcecom prides itself on being a pioneer in Cloud Computing
At Salesforcecom itrsquos all about the Cloud However in their collateral literature dated circa 1993-94 you wonrsquot find any mention of the word ldquocloudrdquo
CLOUD COMPUTING CONCERNS
In survey after survey security is listed as the top concern of Cloud Computing However Cloud Security Alliance (CSA) the industry group that provides security guide-lines and education states that ldquosecurity controls for the cloud computing are for in most part no different than the security controls in any IT environment hellip[however] cloud computing may present different risks to an organi-zation than traditional IT solutionsrdquo 21 p 21
CIOs or CEOs for that matter may feel safer when they ldquoownrdquo versus ldquorentrdquo their IT assets However when you deploy your assets on the Internet for which you eventu-ally will have little choice you will inherit a set of vulner-abilities that are not all that different from the Cloudrsquos Ownership has its own set of financial risks in the form of capital expenditures (CAPEX) that need to be budgeted and spent up front Compare that risk with the far smaller risk of renting (OPEX) which by and large can be dis-continued if needed
Cloud computing technology does not require the use of public networks If your data is too strategically critical and sensitive to be deployed on the Internet you could instead deploy a private cloud that is strictly for your or-ganization Obviously a Private Cloud is more expensive and it needs trained staff However a private cloud lets an organization benefit from cloud technology without the risk of possible public disclosure of its data
Another alternative could be a community cloudmdasha pri-vate cloud that is shared by several organizations for spe-cific needs For example a group of hospitals might create a community cloud to hold patientrsquos medical records
CONCLUSION
Cloud Computing is here to stay and grow Clouds are more versatile than traditional IT networks on many di-mensions They are far more convenient to deploy they have far more potential for collaboration and they are far more scalable than traditional IT ever was The delivery of services is provisioned on global telecommunication net-works that these days have morphed into the Internet And when they mature they will provide a computing utility when and where it is needed
Cloud computing model (adapted from Craig-Wood)
Nozar Daylami The Origin and Construct of Cloud Computing
44 International Journal of the Academic Business World 45Fall 2015 (Volume 9 Issue 2)
BIBLIOGRAPHY
1 Armburst M et al A View of Cloud Computing Communications of the ACM Vol 53 No 4 pages 50-58
2 Craig-Wood K Definition of Cloud Computing incorporating NIST and G-Cloud views httpswwwkatescommentcomdefinition-of-cloud-com-puting-nist-g-cloud Access date April 26 2015
3 Creeger M CTO Roundtable Cloud Computing Communications of the ACM Vol 52 No 8 pages 50-56
4 Cusumano M Cloud Computing and SaaS as New Computing Platforms Communications of the ACM Vol 53 No 4 pages 27-29
5 Foster Ian and Tuecke Steven Describing the Ele-phant The Different Faces of IT as Service wwwac-mqueuecom JulyAugust 2005 pages 26-34 httpdeliveryacmorg10114510900001080874p26-fosterpdf ip=99100108167ampid=1080874ampacc=OPENampkey=4D4702B0C3E38B352E4D4702B0C3E38B352E4D9421298D07BF362E6D218144511F3437ampCFID=505172814ampCFTOKEN=56369758amp__acm__=1429816554_402a40f1d60056fb68e8ccf3fdd96201 accessed April 23 2015
6 Kern Thomas Lacity Mary Cecelia Willcocks Leslie P Netsourcing Renting Business Applica-tions and Services Over a Network Prentice Hall 2002
7 Knoblauch A Deconstructing Cloud Smashwords Edition (Kindle Version) First Edition August 2013
8 Garfinkel Simon (2011 Oct 3) The Cloud Imperative MIT Technology Review httpwwwtechnologyreviewcomnews425623the-cloud-imperative
9 Hayes B Cloud Computing Communications of the ACM Vol 51 No 7 pages 9-11
10 Internet Solution Division Strategy for Cloud Com-puting Compaq Computer Corporation (1996) httpwwwtechnologyreviewcomsitesdefaultfileslegacycompaq_cst_1996_0pdf
11 Lacity M C Hirschheim R Information Systems Outsourcing Myths Metaphors and Realities New York John Wiley amp Sons 1993
12 McAfee A The Year the Cloud Rolled In httpshbrorg2010122010-the-year-the-cloud-rolled Access date April 23 2015
13 McAfee A What Every CEO Needs to Know About the Cloud httpshbrorg201111what-every-ceo-needs-to-know-about-the-cloud Access date April 23 2015
14 McGrath R Whorsquos Disrupting the Gaming Indus-try httpshbrorg200804whos-disrupting-the-gaming-ind Access date April 23 2015
15 Mell P Grance T The NIST Definition of Cloud Computing National Institute of Standards and Technology httpcsrcnistgovpublicationsnist-pubs800-145SP800-145pdf
16 Neumann P Risks and Myths of Cloud Comput-ing and Cloud Storage Communications of the ACM Vol 57 No 10 pages 25-27 The NIST Defi-nition of Cloud Computing httpcsrcnistgovpublicationsnistpubs800-145SP800-145pdf
17 NIST Definition of Cloud Computing httpcsrcnistgovpublicationsnistpubs800-145SP800-145pdf
18 NIST Cloud Computing Reference Architecture National Institute of Standards and Technology Special Publication 500-292 httpwwwnistgovcustomcfget_pdfcfmpub_id=909505
19 Nanavati M Colp P Aiello W and Warfield A Cloud Security A Gathering Storm Communica-tions of the ACM Vol 57 No 8 pages 70-79
20 Regalado Antonio (2011 Oct 31) Who coined cloud computing MIT Technology Review httpwwwtechnologyreviewcomnews425970who-coined-cloud-computing
21 Security Guidance for Critical Areas of Focus in Cloud Computing V30 Cloud Security Alliance httpscloudsecurityallianceorgguidancecsagu-idev30pd
22 Seviokla J Does Cisco Have Its Head in the Clouds httpshbrorg200903does-cisco-have-its-head-in-th Access date April 23 2015
23 Walsh K R Analyzing the Application ASP Concept Technologies Economies and Strategies Communications of ACM Vol 46 No 8 pages 103-107
24 Yang H Tate Mary A Descriptive Literature Review and Classification of Cloud Computing Re-search Communications of Association of Informa-tion Systems Vol 31 2012
Nozar Daylami
46 Fall 2015 (Volume 9 Issue 2)
This page intentionally blank
International Journal of the Academic Business World 47
INTRODUCTION
In their paper ldquoSAS and the Efficient Portfoliordquo Thomp-son and El-houbi (2012) develop a SAS program to calcu-late portfolio weights for efficient stock portfolios Their program improves on existing public domain SAS pro-grams of this type by allowing for portfolios with a rela-tively large number of securities Thompson and El-houbi also claim that their SAS program is an improvement over the Excel programs used to calculate portfolio weights which are sometimes included in investment textbooks They note that users concur that their program is easier to use than those Excel programs which either limit the number of securities that can be included in a portfolio require ldquocorrectionsrdquo or ldquoadjustmentsrdquo to overcome some quirks in the Excel Solver routine or require multiple user interventions
The Thompson and El-houbi program is certainly more elegant and user friendly than the equivalent Excel pro-grams and will provide those with access to the SAS pro-gramming language a valuable tool for learning portfolio management The disadvantage of a SAS program how-ever is that many students will not have easy access to the SAS programming language Students at smaller univer-sities may not have any access to SAS while students at many larger universities may only be able to access SAS at a computer lab on campus
In this paper I modify the Thompson and El-houbi SAS program for use in the open-source R programming lan-guage which is available free of charge for anyone with access to the internet Using the R language program to compute portfolio weights for efficient portfolios main-tains the elegance of the Thompson and El-houbi SAS
program while overcoming the disadvantage of limited SAS availability In addition I extend the Thompson and El-houbi program by making use of a quadratic program-ming package available in R to provide a program that can accommodate short-sale restrictions and position limits
THE R PROGRAMMING LANGUAGE
R is a free programming language for statistical analysis and graphics and runs on many UNIX platforms and on Windows and MacOS It is available under the terms of the Free Software Foundationrsquos GNU General Public License R was developed initially by Robert Gentleman and Ross Ihaka both of the University of Auckland (New Zealand) and is based on the S programming language developed at Bell Labs by John Chambers Since its initial development the popularity of R has grown considerably largely because of its ease of use and because of the avail-ability of many add-on packages that allow users to tackle very sophisticated projects
The base R package may be downloaded at httpcranusr-projectorg That web page also provides links to sources of information about R and basic user manuals There are also many books and manuals now available for purchase that offer information on both basic and special-ized uses of the language In fact Vance (2009) suggests that the growing popularity of the R language at univer-sities language could even result in noticeably lower de-mand for SAS
THE MARKOWITZ PORTFOLIO PROBLEM
As Markowitz (1952) notes an investor following the ldquoex-pected returns-variance of returns rulerdquo will choose an ef-
Optimal Portfolios and the R Programming Language
James A TurnerAssistant Professor of Finance
School of Accounting amp TaxationWeber State University
Ogden UT 84408
ABSTRACTThis paper develops a program in the freely available open-source R programming language to calculate weights for optimal stock portfolios The program retains the advantages the Thompson and El-houbi (2012) SAS program has over similar programs in Excel but avoids the potential problem of limited access to SAS that some students and researchers may face The R program also extends the Thompson and El-houbi program by including the ability to accommodate short-sale restrictions and position limits
James A Turner Optimal Portfolios and the R Programming Language
48 International Journal of the Academic Business World 49Fall 2015 (Volume 9 Issue 2)
ficient portfolio that is a portfolio with maximum ex-pected return for a given variance or one with minimum variance for a given expected return The minimum vari-ance formulation of the portfolio choice problem there-fore requires that the investor choose portfolio weights to minimize the variance of a portfolio with a given expected return The problem also requires that all money be in-vested (which means that the portfolio weights must sum to one) In matrix notation the optimization problem is
where w the choice variable is a k times 1 vector of the weights invested in the k securities in the portfolio V is the port-folio variance-covariance matrix and R is a 2 times k matrix whose first row is a vector of ones and whose second row contains the expected returns of each security in the port-folio M is a 2 times 1 vector whose first element is one (corre-sponding to the constraint that the portfolio weights sum to one) and whose second element is the chosen portfo-lio expected return For now there are no restrictions on short sales so some portfolio weights may be negative
The Lagrangian for the problem is
( ) L w Vw M Rwλprime prime= + minus
where λ is a 2 times 1 vector containing the Lagrangian multi-pliers The first-order conditions for a minimum (which are also sufficient conditions in this case) are
Solving the first-order conditions for w and λ yields
( )( )
11 1
112
w V R RV R M
RV R Mλ
minusminus minus
minusminus
prime prime=
prime=
Thompson and El-houbi following Stephens (1998) let 1 H RV Rminus prime= so that
1 1
1
2
w V R H MH Mλ
minus minus
minus
prime=
=
Stephens (1998 p 36) shows how the elements of the H matrix may be used ldquoto fix any meanvariance point on the efficient frontierrdquo
Min st
w VwRw M
prime
=
2 0
0
L Vw RwL M Rw
λ
λ
part prime= minus =partpart
= minus =part
THE BASIC R PORTFOLIO OPTIMIZATION PROGRAM
The R programming language lends itself very easily to matrix manipulation and matrix computation removing much of the difficulty in solving the standard Markowitz portfolio problem The following R program calculates the portfolio weights for an efficient portfolio using stock return data to estimate expected returns and the variance-covariance matrix The user must specify the desired port-folio expected return The program can accommodate portfolios up to about 50 stocks Beyond that number precision limitations of the R language may make the variance-covariance matrix ldquocomputationally singularrdquo and unable to be inverted
The first step in the program is to read in the return data R can input data from many file types but in the present example the data are stored in a comma-delimited Excel file called ldquoReturnscsvrdquo which contains stock return data In this case the Excel file includes a header row labeling each column of returns with identifying information but no row names The program first reads in the data and then determines the number of securities (number of col-umns in the matrix) as shown on the facing page
ADDING SHORT-SALE CONSTRAINTS AND POSITION LIMITS
The above formulation of the portfolio choice problem places no restrictions on short sales and does not accom-modate position limits In reality individual investors and some fund managers may face requirements prohibit-ing short sales Fund managers may also face requirements that either limit the amount that may be invested in one security or sector or instead that a minimum percentage of funds be invested in a certain security or sector Dai Lin and Liu (2011) list several examples of real-world po-sition limits such as a requirement that a small-cap mutu-al fund invest at least a minimum percentage of its funds in small-company stocks In mathematical terms these short-sale restrictions and position limits can be expressed as a series of inequality constraints While reformulating the portfolio choice problem to add inequality constraints is not difficult doing so makes actually solving the prob-lem considerably more difficult
With short-sale restrictions and position limits the port-folio choice problem becomes
0
Min st
w VwRw MSw w
prime
=ge
where w is still the choice variable S is an m times k matrix that defines both the short-sale constraints on the k se-curities in the portfolio and m minus k other restrictions If there are short-sale constraints but no other restrictions the S matrix is simply a k times k identity matrix which when multiplied by the vector w results in the requirement that
0 iw ige forall If there are other restrictions the sub-matrix of S consisting of the first k rows and k columns of S is an identity matrix and the other restrictions are specified by suitable choices of the elements of the remaining rows of S For example suppose there is a position limit placing a maximum of p on the percentage invested in the sev-enth security so that 7 w ple Since the constraints in the optimization problem above have been expressed as non-negativity constraints this position limit must instead take the form 7 w pminus ge minus The row of S corresponding to
the position limit will consist entirely of zeros except for the seventh element which will be minus1 and corresponding element of the w0 vector would be p
Introducing other forms of position limits simply requires adding the appropriate rows to the S matrix For example if there is a requirement that the total percentage invested in the first and third securities equal or exceed a certain percentage q then one row of S should be [1 0 1 0 0]and the corresponding element of the w0 vector would be q If there is instead a requirement that the total percentage invested in the first and third securities not exceed a cer-tain amount q the required row of S would be [-1 0 -1 0 0] and the corresponding element of the w0 vector would be minusq Other restrictions may be specified similarly For problems that include position limits each of the first k el-
The BASIC R Portfolio Optimation Program
Returns ltminus readtable(ldquoReturnscsvrdquo header = TRUE sep = ldquordquo)Rmat ltminus asmatrix(Returns) Converts the data to matrix formk ltminus ncol(Rmat) Number of columns (number of securities in the portfolio) Now the program calculates the estimate of the variance-covariance matrix (V) the M vector and the R matrix which includes the estimate of the expected returns
V ltminus var(Rmat) Calculates the sample variance-covariance matrix which is used as the estimate of the variance-covariance matrix
Erp ltminus 001 Sets the desired expected portfolio return The user can change this value as desired
M ltminus rbind(1 Erp) Ones ltminus rep(1 k) Ravg ltminus colMeans(Rmat)
Defines the M matrix including the required portfolio return Defines a 1 x k matrix of ones Calculates average returns by column giving a 1 x k matrix of estimated expected returns
R ltminus rbind(Ones Ravg) Combines Ones and Ravg into the 2 x k matrix R Finally the program calculates the portfolio weights and the portfolio variance
VINV ltminus solve(V) Calculates the inverse of the estimated variance-covariance matrixH ltminus RVINVt(R) Calculates the H matrixHINV ltminus solve(H) Calculates the inverse of Hw lt- VINVt(R)HINVM Calculates the portfolio weightsPvar lt- t(w)Vw Calculates the portfolio variance The following commands display the results of the calculations
print(w) Prints the elements of the w vectorprint(Pvar) Prints the variance of the portfolio formed using the weights w
James A Turner Optimal Portfolios and the R Programming Language
50 International Journal of the Academic Business World 51Fall 2015 (Volume 9 Issue 2)
ements of the w0 vector will be zero corresponding to the non-negativity constraints and the remaining elements will equal the percentages associated with the position limits entered as positive or negative numbers depend-ing on whether the position limits establish minimums or maximums
The Lagrangian for this problem is
( ) ( )0 L w Vw M Rw w Swλ microprime prime prime= + minus + minus
where λ is a 2 times 1 vector containing the Lagrangian multi-pliers on the equality constraints and micro is an m times 1 vector of the Lagrangian multipliers on the k short-sale constraints and the m ndash k position limits The first-order necessary con-ditions for this problem are the Kuhn-Tucker conditions
( )0 0
2 0
0
0 0 and 0
L Vw R SwL M Rw
L w Sw w Sw
λ micro
λ
micro micromicro
part prime prime= minus minus =partpart
= minus =partpart prime= minus le ge minus =part
The final set of conditions are known as the complementa-ry slackness conditions since if an element of partLpartμ does not equal zero (ie if the required condition is slack) then the corresponding element of micro must equal zero and vice versa Because of the complementary slackness conditions in order to find a solution to the optimization problem each condition must be checked individually to deter-mine the possible solutions If there are more than a very few constraints finding the candidate solutions manually becomes extremely tedious
Fortunately it is possible to use numerical methods to solve this type of non-linear programming program This is where the strength of the R programming language be-comes very evident The R language provides access to an extensive number of add-on packages developed by R us-ers around the world In particular there are several pack-ages that implement numerical methods to find solutions to optimization problems with inequality constraints Perhaps the package that most easily lends itself to solv-ing the current problem is the ldquoquadprogrdquo package Ac-cording to the documentation included with the pack-age the quadprog routine ldquoimplements the dual method of Goldfarb and Idnani (1982 1983) for solving qua-dratic programming problems of the form min(d΄b+frac12b΄Db)) with the constraints Aʹbgtb₀rdquo For the optimization problem currently under consideration the d vector will be a zero vector the b vector will be the w vec-tor of portfolio weights the D matrix will be the variance-
covariance matrix V and the matrix A΄ will equal a matrix formed by combining the R matrix and the S matrix such that A΄= [R
S ]and A = [ R΄ S΄] Since the V matrix is symmetric the term frac12b΄Db = frac12w΄Vw is a quadratic form Also because the d vector is a zero vector the presence of the frac12 term in the quadratic form does not change the value of the solution to the current portfolio optimization problem That is the weights that minimize frac12w΄Vw sub-ject to the constraints will also minimize w΄Vw subject to the constraints
THE R PORTFOLIO OPTIMIZATION PROGRAM WITH PACKAGE ldquoQUADPROGrdquo
The ldquoQuadprogrdquo package is one of many add-in packages available to R users To use add-in packages in R the user must first download and install the chosen package This is done through the ldquoPackagesrdquo command in the menu bar of the console window Selecting the ldquoInstall package(s)rdquo command from the drop-down box will bring up a list of download locations After selecting a download location the user selects the package(s) to download and install Finally once the selected package is downloaded and in-stalled it must be loaded for use in the current R session which is done by choosing ldquoPackagesrdquo command on the menu bar and then choosing the ldquoLoad packagerdquo com-mand from the drop-down box A list of available packag-es will then appear and the user should select the desired package in this case the ldquoquadprogrdquo package Once the quadprog package is loaded the following program will solve the portfolio problem with short-sale restrictions and position limits
In the present example the short-sale constraint requires that all elements of the w vector be non-negative In addi-tion there are three position limits The first position lim-it requires that no more than 5 of total funds be invested in the seventh security The second position limit requires that no more than a total of 40 of available funds be in-vested in the first and third securities The third position limit requires that total of at least 30 of available funds be invested in the second and fourth securities
The program will make use of the M matrix and the vari-ance-covariance matrix V from the earlier program so those variables must be saved by the user or the following program must be run after running the previous program and before exiting R The new program first sets the posi-tion limits as shown on the facing page
The output of the ldquosolveQPrdquo function includes the values of w and the Lagrangian multipliers for each constraint If the value of a Lagrangian multiplier is zero the constraint associated with that multiplier is not binding otherwise the constraint is binding Though checking the values of
the Lagrangian multipliers allows the user to determine which constraints are binding quite easily the functionrsquos output also includes a listing of the binding constraints by index number
The R Portfolio Optimization Program with Package ldquoQuadprogrdquo
npl ltminus 3 Sets the number of position limits The user sets this value
plmat ltminus matrix (rep(0 nplk) nrow=npl ncol=k) Initializes the matrix that will be used to define the position limit(s)
plmat[17] = -1 Places the required elements into the proper places in the lmat[21] = plmat[23] = -1 position limits matrix In this example the first position
plmat[32] = plmat[34] = 1 limit will set a maximum on the total percentage invested in the seventh security The second position limit will set a maximum on the total percentage invested in the first and third securities The third position limit will set a minimum on the total percentage invested in the second and fourth securities
pl ltminus c(-005 -04 03) Sets the values of the position limits The value the user enters should be positive if the position limit specifies a inimum and should be negative if the position limit specifies a maximum
Next the inequality constraints are placed in matrix form
S ltminus rbind(diag(k) plmat) Defines the S matrix
w0 ltminus c(rep(0 k) pl) Creates a vector whose elements are the values of the inequality constraints
Next the arguments required by the solveQP function that solves the programming problem are defined and the programming problem is solved
dvec ltminus rep(0 k) Defines the d vector which is a necessary input for the quadprog package For portfolio optimization problems the elements of the d vector will all be zeros
Amat ltminus colbind(t(R) t(S)) Forms the Amat matrix
bvec ltminus c(M w0) Joins the M matrix and the w0 matrix to form the bvec vector
ICSol ltminus solveQP(V dvec Amat bvec meq=2) Solves the quadratic programming problem The argument meq specifies that the first two constraints are equality constraints In this example the equality constraints are that the weights sum to one and that the portfolio expected return equal a specified amount
print(c(ICSol[1] 2ICSol[[2]] ICSol[5] ICSol[6])) Prints selected output from the solve QP function the weights the portfolio variance the values of the Lagrangian multipliers and the index numbers of the binding constraints
James A Turner Optimal Portfolios and the R Programming Language
52 International Journal of the Academic Business World 53Fall 2015 (Volume 9 Issue 2)
CONCLUSION
This paper provides an R language program to calculate portfolio weights for efficient portfolios The program can also accommodate short-sale constraints and position limits Users must choose the desired portfolio expected return and must specify any other constraints A strong advantage of the program is that because the R program-ming language is freely available to anyone with access to the internet students and others who wish to use the pro-gram will be able to do so easily
REFERENCES
Dai Min Hanqing Jin and Hong Liu 2011 Illiquidity position limits and optimal investment for mutual funds Journal of Economic Theory 146 1598ndash1630
Goldfarb D and A Idnani 1982 Dual and primal-dual methods for solving strictly convex quadratic pro-grams In Hennart J P (ed) Numerical Analysis Springer-Verlag Berlin pages 77ndash91
Goldfarb D and A Idnani 1983 A numerically stable dual method for solving strictly convex quadratic pro-grams Mathematical Programming 27 1ndash33
Ihaka Ross A free software project Retrieved May 7 2013 from httpcranr-projectorgdochtmlinter-face98-paperpaper_2html
Markowitz Harry 1952 Portfolio selection Journal of Finance 7 77ndash91
Stephens Alan 1998 Markowitz and the spreadsheet Journal of Financial Education 35ndash43
Thompson Thomas H and Ashraf El-houbi 2012 SAS and the efficient portfolio International Research Jour-nal of Applied Finance 3 315ndash327
Turlach Berwin A 2013 quadprog Functions to solve quadratic programming problems R pack-age version 15-5 httpCRANR-projectorgpackage=quadprog (S original by Berwin A Turlach R port by Andreas Weingessel)
Vance Ashlee 2009 Data analysts captivated by Rrsquos power The New York Times Retrieved May 1 2013 from httpwwwnytimescom20090107tech nolog y busi ness-computi ng 0 7prog ra m htmlpagewanted=allamp_r=0
What is R Retrieved May 7 2013 from httpwwwr-projectorgabouthtml
APPENDIX 1 DATA
The data used in the R program come from the CRSP monthly stock file and consist of 60 months of return data from January 2008 to December 2012 The stocks in the 10-stock portfolio are the first 10 stocks in the CRSP monthly file (listed by PERMNO) for which 60 continuous months of returns are available The stocks in the 50-stock portfolio are the first 50 stocks for which 60 continuous months of returns are available Table 1 below lists the PERMNOS current company name and current ticker of the included stocks as well as the exchange where the stock trades
Table 1 Stocks in the Portfolio
NO PERMNO CURRENT COMPANY NAME TICKER EXCHANGE1 10001 GAS NATURAL INC EGAS AMEX2 10002 BANCTRUST FINANCIAL GROUP INC BTFG NASDAQ3 10025 A E P INDUSTRIES INC AEPI NASDAQ4 10026 J amp J SNACK FOODS CORP JJSF NASDAQ5 10032 PLEXUS CORP PLXS NASDAQ6 10044 ROCKY MOUNTAIN CHOCOLATE FAC INC RMCF NASDAQ7 10051 HANGER INC HGR NYSE8 10065 ADAMS EXPRESS CO ADX NYSE9 10100 AMERICAN LEARNING CORP NY ALRN NASDAQ
Table 1 Stocks in the Portfolio
NO PERMNO CURRENT COMPANY NAME TICKER EXCHANGE10 10104 ORACLE CORP ORCL NASDAQ11 10107 MICROSOFT CORP MSFT NASDAQ12 10138 T ROWE PRICE GROUP INC TROW NASDAQ13 10145 HONEYWELL INTERNATIONAL INC HON NYSE14 10147 E M C CORP MA EMC NYSE15 10180 AKORN INC AKRX NASDAQ16 10182 TECH DATA CORP TECD NASDAQ17 10200 REPLIGEN CORP RGEN NASDAQ18 10207 ROYCE FOCUS TRUST INC FUND NASDAQ19 10225 BEAM INC BEAM NYSE20 10232 ELMIRA SAVINGS BANK NY ESBK NASDAQ21 10239 BALDWIN amp LYONS INC BWINB NASDAQ22 10252 INDEPENDENT BANK CORP MA INDB NASDAQ23 10253 DOCUMENT SECURITY SYSTEMS INC DSS AMEX24 10257 D L H HOLDINGS CORP DLHC NASDAQ25 10258 CELLDEX THERAPEUTICS INC CLDX NASDAQ26 10259 SIGMA DESIGNS INC SIGM NASDAQ27 10294 HAVERTY FURNITURE COS INC HVT NYSE28 10297 NEW HAMPSHIRE THRIFT BNCSHRS INC NHTB NASDAQ29 10299 LINEAR TECHNOLOGY CORP LLTC NASDAQ30 10302 CYPRESS SEMICONDUCTOR CORP CY NASDAQ31 10308 TOMPKINS FINANCIAL CORP TMP AMEX32 10318 BALCHEM CORP BCPC NASDAQ33 10333 XOMA CORP XOMA NASDAQ34 10355 DAILY JOURNAL CORP DJCO NASDAQ35 10363 A M A G PHARMACEUTICALS INC AMAG NASDAQ36 10375 T C F FINANCIAL CORP TCB NYSE37 10382 ASTEC INDUSTRIES INC ASTE NASDAQ38 10395 NAVIGATORS GROUP INC NAVG NASDAQ39 10397 WERNER ENTERPRISES INC WERN NASDAQ40 10421 SKYWEST INC SKYW NASDAQ41 10443 PATRIOT TRANSPORTATION HLDG INC PATR NASDAQ42 10463 RESEARCH FRONTIERS INC REFR NASDAQ43 10501 AMERICAN WOODMARK CORP AMWD NASDAQ44 10507 MEDICAL ACTION INDS INC MDCI NASDAQ45 10514 TRANS WORLD ENTERTAINMENT CORP TWMC NASDAQ46 10516 ARCHER DANIELS MIDLAND CO ADM NYSE47 10517 AARONS INC AAN NYSE48 10530 MERIDIAN BIOSCIENCE INC VIVO NASDAQ49 10547 CLEARFIELD INC CLFD NASDAQ50 10550 PRO DEX INC COLO PDEX NASDAQ
James A Turner Optimal Portfolios and the R Programming Language
54 International Journal of the Academic Business World 55Fall 2015 (Volume 9 Issue 2)
APPENDIX 3 RESULTS FOR THE 10-STOCK PORTFOLIO
Results for the 10-stock portfolio with a monthly expect-ed return of 1 are shown at the top of the facing page First shown is the variance-covariance matrix (V) fol-lowed by its inverse (V-1)
Table 2 shows the return averages of each stock and the calculated portfolio weights both for the portfolio with no short-sale constraints or position limits and the port-folio with short-sale constraints and three position limits (1) a requirement that the percentage invested in the sev-enth security not exceed 5 (2) a requirement that the
total percentage invested in the first and the third securi-ties not exceed 40 and (3) a requirement that the total percentage invested in the second and fourth securities be at least 30 Note that when short-sale constraints and position limits are imposed there may no longer be a port-folio that meets all the constraints that is the feasible set may be null In that case the R program will return an error message stating that the constraints are inconsistent
Table 3 lists the inequality constraints and the associ-ated Lagrangian multipliers along with an indication of whether the constraint is binding In this example the constraint that there be a minimum of 30 invested in the second and fourth securities is not binding
APPENDIX 2 COPY OF THE FULL PROGRAM
The full program is shown below without comments Users can easily copy the program that is between the solid lines and paste it into the R Editor window It will probably be necessary for each user to change the name of the data file in the readtable command Also the user can change the portfolio expected return and the number type and value of the inequality constraints as desired
Returns ltminus readtable(ldquoReturnscsvrdquo header = TRUE sep = ldquordquo) Rmat ltminus asmatrix(Returns) k ltminus ncol(Rmat) V ltminus var(Rmat) Erp ltminus 001 M ltminus rbind(1 Erp) Ones ltminus rep(1 k) Ravg ltminus colMeans(Rmat) R ltminus rbind(Ones Ravg) VINV ltminus solve(V) H ltminus RVINVt(R) HINV ltminus solve(H) w lt- VINVt(R)HINVM Pvar lt- t(w)Vw print(w) print(Pvar) npl ltminus 3 plmat ltminus matrix (rep(0 nplk) nrow=npl ncol=k) plmat[17] = -1 plmat[21] = plmat[23] = -1 plmat[32] = plmat[34] = 1 pl ltminus c(-005 -04 03)S ltminus rbind(diag(k) plmat) w0 ltminus c(rep(0 k) pl) dvec ltminus rep(0 k) Amat ltminus cbind(t(R) t(S)) bvec ltminus c(M w0) ICSol ltminus solveQP(V dvec Amat bvec meq=2) print(c(ICSol[1] 2ICSol[[2]] ICSol[5] ICSol[6]))
1
2867001 161224 279311 153314 408660 148438 131874 246057 83608 740152
161224 321169 23967 251277 39387 55190 33449 107899 36378 39718
279311 23967 991158 109233 189872 100249 22208 119
V minus
minus minus minus
minus minus minus minus
minus minus minus minus
=
6782 41342 198294
153314 251277 109233 2757210 319797 03010 139907 969199 56520 416534
408660 39387 189872 319797 977494 325171 247388 1098965 26657 04097
148438 55190 100249 03010 325171 1
minus minus minus minus minus
minus minus minus minus minus minus
minus 644368 311333 1803329 91576 428583
131874 33449 22208 139907 247388 311333 1093506 426730 100681 162364
246057 107899 1196782 969199 1098965 1803329 426730 11640904 233195 3789283
8360
minus minus
minus minus minus minus minus minus minus
minus minus minus minus minus minus
8 36378 41342 56520 26657 91576 100681 233195 138635 73382
740152 39718 198294 416534 04097 428583 162364 3789283 73382 3685519
minus minus
minus minus minus minus minus minus
00046 00019 00002 00006 00035 00004 00011 00008 00018 00019
00019 00364 00013 00037 00002 00004 00003 00001 00100 00007
00002 00013 00161 00024 00076 00035 00013 00041 00038 00033
00006 0
V
minus minus minus minus
minus minus minus minus
minus minus
=
0037 00024 00058 00051 00010 00016 00021 00028 00029
00035 00002 00076 00051 00217 00009 00048 00052 00024 00064
00004 00004 00035 00010 00009 00087 00018 00022 00027 00012
00011 00003 00013 000
minus
minus minus
minus minus minus
16 00048 00018 00113 00013 00055 00018
00008 00001 00041 00021 00052 00022 00013 00033 00003 00034
00018 00100 00038 00028 00024 00027 00055 00003 00850 00020
00019 00007 00033 00029 00064 00
minus
minus minus minus minus minus minus minus minus
012 00018 00034 00020 00068minus
Table 2 Average Returns and Weights for the Ten-
Stock Portfolios
Stock No Permno
Average Returns
Weights (SS
Allowed)IC Weights
(No SS 3 PLs)
1 10001 00064 03817 034062 10002 -00054 00311 004063 10025 00183 00908 005944 10026 00156 02525 026255 10032 00095 -01410 000006 10044 00012 00649 013797 10051 00206 01000 005008 10065 00018 01933 004929 10100 00270 00422 0056810 10104 00104 -00155 00031
Table 3 Constraints and Lagrangian Multipliers
Constraint Lagrangian Multiplier
Constraint Binding
Portfolio weights sum to one 00015 Yes
Portfolio expected return equals 1 00443 Yes
w1 ge 0 00000 No w2 ge 0 00000 No
w3 ge 0 00000 No
w4 ge 0 00000 No
w5 ge 0 00015 Yes
w6 ge 0 00000 No
w7 ge 0 00000 No
w8 ge 0 00000 No
w9 ge 0 00000 No
w10ge 0 00000 No
w7 le 005 00003 Yes
w1 + w3 le 04 00002 Yes
w2 + w4 ge 03 00000 No
James A Turner Optimal Portfolios and the R Programming Language
56 International Journal of the Academic Business World 57Fall 2015 (Volume 9 Issue 2)
The portfolio variances are
No short-sale constraints 0001607 Short-sale constraints and three position limits 0001856
APPENDIX 4 RESULTS FOR THE 50-STOCK PORTFOLIO
Results for the 50-stock portfolio with a monthly ex-pected return of 1 are shown in Table 4 below The first table shows the return averages of each stock and the cal-culated portfolio weights both for the portfolio with no short-sale constraints or position limits and the portfolio with short-sale constraints and three position limits (1) a requirement that the percentage invested in the seventh security not exceed 5 (2) a requirement that the total percentage invested in the first and the third securities not exceed 40 and (3) a requirement that the total percent-age invested in the second and fourth securities be at least 30
Table 5 shows the Lagrangian multipliers on the equal-ity constraints and the position limit constraints To save space for the 50-stock portfolio the Lagrangian multi-pliers on the short-sale constraints are not listed Simply checking Table 4 to see if the weight on a particular stock is zero gives an almost certain indication of which short-sale constraints are binding In this example both the constraint that there be no more than 5 invested in the seventh security and the constraint that there be no more than a total of 40 invested in the first and third securi-ties are not binding
Table 4 Average Returns and Weights for the
50-Stock PortfoliosStock
No Permno Average Returns
Weights SS Allowed
IC Weights No SS 3 PLs
1 10001 00064 01934 013072 10002 -00054 -00179 003673 10025 00183 -00189 000004 10026 00156 02873 026335 10032 00095 00503 000006 10044 00012 -00185 000007 10051 00206 -00136 002288 10065 00018 10920 000009 10100 00270 00306 00423
10 10104 00104 01467 0000011 10107 -00001 -02023 00000
Table 4 Average Returns and Weights for the
50-Stock PortfoliosStock
No Permno Average Returns
Weights SS Allowed
IC Weights No SS 3 PLs
12 10138 00085 -05619 0000013 10145 00065 -03910 0000014 10147 00088 -02693 0000015 10180 00290 -00290 0000016 10182 00076 01181 0000017 10200 00082 01409 0040918 10207 00020 -01551 0000019 10225 00098 00285 0000020 10232 00159 -00021 0000021 10239 00051 01624 0000022 10252 00084 00955 0000023 10253 00058 00121 0000024 10257 -00008 -00236 0000025 10258 00196 -00157 0000026 10259 -00300 -01339 0000027 10294 00179 -00414 0000028 10297 00061 01854 0146729 10299 00074 00826 0000030 10302 00165 00201 0000031 10308 00073 01255 0014132 10318 00194 -01389 0000033 10333 -00203 -00205 0000034 10355 00299 -00545 0036035 10363 -00151 -00167 0000036 10375 00010 -00495 0000037 10382 00046 00267 0000038 10395 -00022 00886 0042339 10397 00134 01296 0084940 10421 -00036 -01045 0000041 10443 00021 01389 0000042 10463 00013 00417 0000043 10501 00176 -00458 0000044 10507 -00228 -00397 0000045 10514 00100 00731 0007846 10516 -00034 -00148 0119247 10517 00208 00629 0000048 10530 00005 00032 0000049 10547 00418 00032 0012550 10550 -00028 00397 00000
The portfolio variances are
No short-sale constraints 000002997 Short-sale constraints and three position limits 000111119
Table 5 Constraints and Lagrangian Multipliers
Constraint Lagrangian Multiplier Constraint Binding
Portfolio weights sum to one 0000503 YesPortfolio expected return equals 1 0031954 Yes
w7 le 005 0000000 Now1 + w3 le 04 0000000 Now2 + w4 ge 03 0000963 Yes
James A Turner
58 Fall 2015 (Volume 9 Issue 2)
This page intentionally blank
JOINT CONFERENCE May 25th 26th and 27th 2016 in
Nashville TN
Academic Business World International Conference
(ABWICorg)
The aim of Academic Business World is to promote inclusiveness in research by offering a forum for the discussion of research in early stages as well as re-search that may differ from lsquotraditionalrsquo paradigms We wish our conferences to have a reputation for providing a peer-reviewed venue that is open to the full range of researchers in business as well as reference disciplines within the social sciences
Business Disciplines
We encourage the submission of manuscripts presentation outlines and ab-stracts pertaining to any business or related discipline topic We believe that all disciplines are interrelated and that looking at our disciplines and how they relate to each other is preferable to focusing only on our individual lsquosilos of knowledgersquo The ideal presentation would cross discipline borders so as to be more relevant than a topic only of interest to a small subset of a single disci-pline Of course single domain topics are needed as well
International Conference on Learning and Administration in
Higher Education (ICLAHEorg)
All too often learning takes a back seat to discipline related research The In-ternational Conference on Learning and Administration in Higher Educa-tion seeks to focus exclusively on all aspects of learning and administration in higher education We wish to bring together a wide variety of individuals from all countries and all disciplines for the purpose of exchanging experi-ences ideas and research findings in the processes involved in learning and administration in the academic environment of higher education
We encourage the submission of manuscripts presentation outlines and ab-stracts in either of the following areas
Learning
We encourage the submission of manuscripts pertaining to pedagogical top-ics We believe that much of the learning process is not discipline specific and that we can all benefit from looking at research and practices outside our own discipline The ideal submission would take a general focus on learning rather than a discipline-specific perspective For example instead of focusing on ldquoMotivating Students in Group Projects in Marketing Managementrdquo you might broaden the perspective to ldquoMotivating Students in Group Projects in Upper Division Coursesrdquo or simply ldquoMotivating Students in Group Projectsrdquo The objective here is to share your work with the larger audience
Academic Administration
We encourage the submission of manuscripts pertaining to the administra-tion of academic units in colleges and universities We believe that many of the challenges facing academic departments are not discipline specific and that learning how different departments address these challenges will be ben-eficial The ideal paper would provide information that many administrators would find useful regardless of their own disciplines
- Testing Major Factors for Reducing Obstacles to Product Innovation Success
-
- Dr Tor Guimaraes
- Dr Marcelo Seido Nagano
- Dr Curtis Armstrong
-
- Acceptance of Change Exploring the Relationship among Psychometric Constructs and Employee Resistance
-
- Brian Dunican EdD
- Ric Keaster PhD
-
- The Origin and Construct of Cloud Computing
-
- Nozar Daylami PhD
-
- Optimal Portfolios and the R Programming Language
-
- James A Turner
-

Reviewer Country State Region Affiliation
Newport Stephanie United States TN Austin Peay State UniversityNichols Charles ldquoRandyrdquo United States KY Mid-Continent UniverssityNinassi Susanne United States VA Marymount UniversityNixon Judy C United States TN University of Tennessee at ChattanoogaOguhebe Festus United States MS Alcorn State UniversityOkafor Collins E United States TX Texas AampM International UniversityOrsquoKeefe Robert D United States IL DePaul UniversityOnwujuba-Dike Christie United States IN University of Saint FrancisOtero Rafael United States TX The University of Texas at BrownsvilleOwens Valerie United States SC Anderson CollegePacker James United States AR Henderson State UniversityPalmer David K United States NE University of Nebraska at KearneyPatton Barba L United States TX University of Houston-VictoriaPayne Alina R United States CAPentildea Leticia E United States WI University of Wisconsin-La CrossePetkova Olga United States CT Central Connecticut State UniversityPetrova Krassie New Zealand Auckland University of TechnologyPhillips Antoinette S United States LA Southeastern Louisiana UniversityPittarese Tony United States TN East Tennessee State UniversityPotter Paula United States KY Western Kentucky UniversityPowers Richard United States KY Eastern Kentucky UniversityPresby Leonard United States NJ William Paterson UniversityRedman Arnold United States TN University of Tennessee at MartinRegimbal Elizabeth E United States WI Cardinal Stritch UniversityReichert Carolyn United States TX The University of Texas at DallasRen Louie United States TX University of Houston-VictoriaRiley Glenda United States IN Arkansas Tech UniversityRim Hong United States PA Shippensburg UniversityRoach Joy United States KY Murray State UniversityRobinson Martha D United States TN The University of MemphisRood A Scott United States MI Grand Valley State UniversityRoumi Ebrahim Canada New Brunswick University of New BrunswickRoush Melvin United States KS Pittsburg State UniversityRussell-Richerzhagen Laura United States AL Faulkner UniversitySanders Tom J United States AL University of MontevalloSands John United States WA Western Washington UniversitySarosa Samiaji Indonesia Atma Jaya Yogyakarta UniversitySarwar Chaudhary Imran Pakistan Creative ResearcherSchaeffer Donna M United States VA Marymount UniversitySchechtman Greg United States OH Air Force Institute of TechnologySchindler Terry United States IN University of IndianapolisSchmidt Buffie United States GA Augusta State UniversitySchuldt Barbara United States LA Southeastern Louisiana UniversitySelvy Patricia United States KY Bellarmine UniversityService Robert W United States AL Samford UniversityShao Chris United States TX Midwestern State UniversityShipley Sherry United States IN Trine UniversityShores Melanie L United States AL University of Alabama at BirminghamSiegel Philip United States GA Augusta State UniversitySimpson Eithel United States OK Southwestern Oklahoma State UniversitySingh Navin Kumar United States AZ Northern Arizona University
Reviewer Country State Region Affiliation
Kitous Bernhard FranceKluge Annette Switzerland St Gallen University of St GallenKorb Leslie United States NJ Georgian Court UniversityKorte Leon United States SD University of South DakotaKorzaan Melinda L United States TN Middle Tennessee State UniversityKray Gloria Matthews United States AZ University of PhoenixKuforiji John United States AL Tuskegee UniversityLamb Kim United States OH Stautzenberger CollegeLatif Ehsan Canada British Columbia University College of the CaribooLee Jong-Sung United States TN Middle Tennessee State UniversityLee Minwoo United States KY Western Kentucky UniversityLeonard Jennifer United States MT Montana State University-BillingsLeonard Joe United States OH Miami UniversityLeupold Christopher R United States NC Elon UniversityLim Chi Lo United States MO Northwest Missouri State UniversityLin Hong United States TX University of Houston-DowntownLindstrom Peter Switzerland University of St GallenLong Jamye United States MS Delta State UniversityLowhorn Greg United States FL Pensacola Christian CollegeLyons Paul United States MD Frostburg State UniversityMarquis Gerald United States TN Tennessee State UniversityMason David DM New ZealandMathews Rachel United States VA Longwood UniversityMavengere Nicholas Blessing Finland University of TampereMayo Cynthia R United States DE Delaware State UniversityMcDonough Darlene M United States St Bonaventure UniversityMcGowan Richard J United States IN Butler UniversityMcKechnie Donelda S United Arab Emirates American University of SharjahMcKenzie Brian United States CA California State University East BayMcManis Bruce United States LA Nicholls State UniversityMcNeese Rose United States MS University of Southern MississippiMcNelis Kevin United States NM New Mexico State UniversityMedina Carmen I Figueroa Puerto Rico PR University of Puerto Rico MayaguezMello Jeffrey A United States FL Barry UniversityMello Jim United States CT University of HartfordMeyer Timothy P United States WI University of Wisconsin-Green BayMitchell Jennie United States IN Saint Mary-of-the-Woods CollegeMlitwa Nhlanhla South AfricaMollica Kelly United States TN The University of MemphisMoodie Douglas R United States GA Kennesaw State UniversityMoore Bradley United States AL University of West AlabamaMoore Gregory A United States TN Austin Peay State UniversityMoore Paula H United States TN University of Tennessee at MartinMoraes dos Santos Andreacute Brazil Universidade do Vale do ItajaiacuteMorrison Bree United States FL Bethune-Cookman CollegeMosley Alisha United States MS Jackson State UniversityMosquera Inty Saez Cuba Villa Clara Universidad Central ldquoMarta Abreurdquo de Las VillasMotii Brian United States AL University of MontevalloMouhammed Adil United States IL University of Illinois at SpringfieldNegbenebor Anthony United States NC Gardner-Webb UniversityNeumann Hillar United States SD Northern State University
Reviewer Country State Region Affiliation
Zeng Tao Canada Ontario Wilfrid Laurier UniversityZhou Xiyu (Thomas) United States AK University of Alaska FairbanksZiems Wendy United States OH Stautzenberger College
Reviewer Country State Region Affiliation
Smatrakalev Georgi United States FL Florida Atlantic UniversitySmith Allen E United States FL Florida Atlantic UniversitySmith JR United States MS Jackson State UniversitySmith Nellie United States MS Rust CollegeSmith W Robert United States MS University of Southern MississippiSobieralski Kathleen L United States MD University of Maryland University CollegeSoheili-Mehr Amir H Canada Ontario University of TorontoSridharan Uma V United States SC Lander UniversitySt Pierre Armand Canada Alberta Athabasca UniversitySteerey Lorrie United States MT Montana State University-BillingsStokes Len United States NY Siena CollegeStone Karen United States NH Southern New Hampshire UniversityStover Kristie United States VA Marymount UniversityStuart Randy United States GA Kennesaw State UniversityStumb Paul C United States TN Cumberland UniversitySwisshelm Beverly Ann United States TN Cumberland UniversityTalbott Laura United States AL University of Alabama at BirminghamTanguma Jesuacutes United States TX The University of Texas-Pan AmericanTanigawa Utako United States AR Itec International LLCTerrell Robert United States TN Carson-Newman CollegeTerry Kathleen Y United States FL Saint Leo UniversityTheodore John D United States FL Warner UniversityThompson Sherwood United States KYThrockmorton Bruce United States TN Tennessee Technological UniversityTotten Jeffrey United States LA McNeese State UniversityTracy Daniel L United States SD University of South DakotaTran Hang Thi United States TN Middle Tennessee State UniversityTrebby James P United States WI Marquette UniversityTrzcinka Sheila Marie United States IN Indiana University NorthwestUdemgba A Benedict United States MS Alcorn State UniversityUdemgba Benny United States MS Alcorn State UniversityUjah Nacasius United States TX Texas AampM International UniversityUrda Julie Inited States RI Rhode Island CollegeValle Matthew ldquoMattrdquo United States NC Elon Universityvan der Klooster Marie Louise Australia Victoria Deakin UniversityVehorn Charles United States VA Radford UniversityVoss Richard Steven United States AL Troy UniversityVoss Roger Alan United States TX Epicor Software CorporationWade Keith United States FL Webber International UniversityWahid Abu United States TN Tennessee State UniversityWalter Carla Stalling United States MO Missouri Southern State UniversityWalters Joanne United States WI University of Wisconsin-MilwaukeeWanbaugh Teresa United States LA Louisiana CollegeWarner Janice United States Georgian Court UniversityWasmer DJ United States IN Saint Mary-of-the-Woods CollegeWatson John G United States NY St Bonaventure UniversityWilliams Darryl United States TX Walden UniversityWilliams Melissa United States GA Augusta State UniversityWilson Antoinette United States WI University of Wisconsin-MilwaukeeZahaf Mehdi Canada Ontario Lakehead UniversityZaremba Alan United States MA Northeastern University
The JW Press Family of Academic Journals
Journal of Learning in Higher Education (JLHE) ISSN 1936-346X (print)
Each university and accrediting body says that teaching is at the forefront of their mission Yet the attention given to discipline oriented research speaks other-wise Devoted to establishing a platform for showcasing learning-centered articles JLHE encourages the submission of manuscripts from all disciplines The top learning-centered articles presented at ABW conferences each year will be automatically published in the next issue of JLHE JLHE is listed in Cabellrsquos Directory of Publishing Opportunities in Educational Psychology and Administration indexed by EBSCO and under consideration for indexing by Scopus
Individuals interested in submitting manuscripts directly to JLHE should review information at httpjwpresscomJLHEJLHEhtm
Journal of Academic Administration in Higher Education (JAAHE) ISSN 1936-3478 (print)
JAAHE is a journal devoted to establishing a platform for showcasing articles related to academic administration in higher education JAAHE encourages the submission of manuscripts from all disciplines The best articles presented at ABW conferences each year that deal with the subject of administration of academic units will be automatically published in the next issue of JAAHE JAAHE is listed in Cabellrsquos Directory of Publishing Opportunities in Educational Psychology and Administration indexed by EBSCO and under consideration for indexing by Scopus
Individuals interested in submitting manuscripts directly to JAAHE should review information on their site at httpjwpresscomJAAHEJAAHEhtm
International Journal of the Academic Business World (IJABW) ISSN 1942-6089 (print) ISSN 1942-6097 (online)
IJABW is a new journal devoted to providing a venue for the distribution discussion and documentation of the art and science of business A cornerstone of the philosophy that drives IJABW is that we all can learn from the research practices and techniques found in disciplines other than our own The Information Systems researcher can share with and learn from a researcher in the Finance Department or even the Psychology Department
We actively seek the submission of manuscripts pertaining to any of the traditional areas of business (accounting economics finance information systems management marketing etc) as well as any of the related disciplines While we eagerly accept submissions in any of these disciplines we give extra consideration to manuscripts that cross discipline boundaries or document the transfer of research findings from academe to business practice International Journal of the Academic Business World is listed in Cabellrsquos Directory of Publishing Opportunities in Business indexed by EBSCO and under consideration for indexing by Scopus
Individuals interested in submitting manuscripts directly to IJABW should review information on their site at httpjwpresscomIJABWIJABWhtm
International Journal of the Academic Business World 11
INTRODUCTION
Product Innovation (PI) is the first step in the overall pro-cess of product life cycle management as presented by Parry etal (2009) It should be viewed as a critical step having a major impact on a firmrsquos competitive position (Slack et al 2006 Cooper and Chew 1996) It is well understood that PI is not a simple event but a process requiring that it be managed as such Tidd et al (2008) proposed that the PI management process involves searching for a strategic approach for innovation and the challenge of its manage-ment developing mechanisms and structures of effective implementation and developing an organizational context which supports innovation and constructing effective ex-ternal interfaces It is also widely accepted that the process is related to managerial action actions directed by clear strategies objectives and vision disciplined by systemati-cally collecting information and action that renews the or-
ganization now and again by changes (Tushman and An-derson 1997)
At the company operational level many authors focused on specific PI sub-processes as critical to success Cooper and Edgett (2008) considered the monitoring of consump-tion tendencies important in the early stages of product innovation followed by the importance of capturing ideas from external sources Matta (2008) proposed dynamic allocation of mobilized resources between activated proj-ects Cooper (2009) focused on the implementation stage and proposes the use of stage gates cross-functional teams the involvement of suppliers and the use of project man-agement tools Blindenbach-Driessen and Van Den Ende (2010) and Adams et al (2006) focused on evaluating re-sults in learning from past projects proposing the impor-tance of evaluation metrics for project success the use of discussion sessions and the registering of lessons learned
Testing Major Factors for Reducing Obstacles to Product Innovation Success
Dr Tor GuimaraesJesse E Owen Chair
Tennessee Technological University Cookeville Tennessee 38505 USA
Dr Marcelo Seido Nagano School of Engineering at Satildeo Carlos
University of Satildeo Paulo BrazilDr Curtis Armstrong
Decision Science and Management ChairProfessor
Tennessee Tech University Cookeville TN 38505
ABSTRACT The literature on strategic leadership competitive intelligence management of technology and specific charac-teristics of the companyrsquos change process propose their importance in successfully implementing business innovation While these factors may indeed be important to enhance company competitiveness the existing literature contains practically no empirical evidence supporting their relationship to reducing the many problems companies encounter implementing product innovation (PI) A field test was designed with the primary objective of empirically testing the theoretical model addressing which factors if managed appropriately will help reduce the obstacles to PI in practice A questionnaire was developed pilot tested and used to collect data from 47 product innovation managers The results support the theoretical importance of strategic leadership competitive intelligence management of technology and specific characteristics of the companyrsquos change process to reducing the problemsobstacles to successful PI The items used for measuring the main constructs provide further insights into how managers should go about developing these areas within their organizations
Based on the results recommendations are made to practitioners and researchers in this important area
Tor Guimaraes Marcelo Seido Nagano amp Curtis Armstrong Testing Major Factors for Reducing Obstacles to Product Innovation Success
12 International Journal of the Academic Business World 13Fall 2015 (Volume 9 Issue 2)
Therefore despite the technical obstacles inherent in the innovation process most of the failures are due to the way it is managed (Tidd et al 2008)
At the company strategic level the literature on strate-gic leadership competitive intelligence management of technology and specific characteristics of the companyrsquos change process propose their importance in successfully implementing business innovation While these factors may indeed be important to enhance company competi-tiveness the existing literature contains practically no em-pirical evidence supporting their relationship to reducing the many problems companies encounter implementing product innovation (PI) While most authors would agree that the change process has to bear certain characteris-tics another large body of literature deal with the many factors important to innovation success or failure from a broader perspective Many researchers have looked to im-provements in strategic leadership as critical to develop-ing an organization environment conducive to innovation (Waldman et al 2001 Williams 2004) To help define and prioritize important problems and opportunities to the organization many have proposed Competitive Intel-ligence (CI) programs as important to company success (Tarraf amp Molz 2006 duToit 2003 Vedder amp Guynes 2002 Guimaraes amp Armstrong 1998) Further effective Management of Technology (MOT) is thought to be a critical requirement for successfully implementing most modern business changes (Beattie amp Fleck 2005) While these propositions are exceedingly important the existing literature needs more empirical evidence supporting them
While the constructs being studied are well established much can be done for empirically testing the proposed rela-tionships among them Particularly useful might be testing these factors in terms of their effects in reducing the obsta-clesproblems for increasing the likelihood of PI successful implementation This field test was specifically undertaken to meet that goal
THEORETICAL BACKGROUND AND PROPOSED HYPOTHESES
In this section we define the theoretical model proposed in this study the major constructs involved and the hy-potheses to be tested
Dependent Variable Obstacles Encountered In Product Innovation
There is a large collection of studies addressing the or-ganization obstacles (problems) to successful product innovation For example Galia and Legros (2004) and Segarra-Blasco et al (2008) address these problems with the objective of developing a better understanding and sustain public policy proposals Table 1 summarizes the main problems in product innovation that researchers have reported managers encounter in practice and their respective primary literature sources Please note that various authors address specific obstacles in product in-novation ie Galia and Legros (2004) focus on the lack of information about the market the relevant technolo-
gies and the consumer himself herself Cooper (2009) focuses on the difficulty in turning good ideas into actual products while Adams et al (2006) focus is on the dif-ficulty of measuring results and innovation performance
On the other hand the practitioner and academic litera-ture also proposes (Guimaraes 2008 2011) that to man-age change effectively and to reduce potential problems to their innovation efforts organizations need to
1 Be in touch with their markets customers com-petitors new products etc
2 Have adaptive leadership which promotes in-novation
3 Manage technology effectively in supporting the necessary changes and
4 Follow some basic prescriptions while imple-menting the change process
Each one of these are correspondingly represented by the independent variables in this study These are separately defined below each followed by the hypothesis represent-ing the expected inverse relation to PI problems encoun-tered in practice This section in turn will be followed by a description of the methodology used in this study the results and the conclusions and recommendations
Independent Variable Company Competitive Intelligence
The evolution of competitive intelligence has been discussed widely (Calof and Wright 2008 Nemutanzhela amp Iyamu 2011) Competitive intelligence (CI) is a tool that provides a competitive advantage to enterprises
and helps decision-makers (Fleisher amp Wright 2009 Haataja 2011) There are many definitions of CI in the literature (Weiss amp Naylor 2010) and none has achieved worldwide acceptance (Roitner 2008) Haddadi Dousset and Berrada (2010) conclude that the lack of a universally accepted definition of CI makes it a field with unstable borders CI is frequently confused with industrial espionage (Colakoglu 2011)
The importance of competitive intelligence as a key asset is increasingly recognized by managers as useful to keep in touch with what is going on in their markets (Guimaraes 2011 Tarraf amp Molz 2006 Swartz 2005 duToit 2003 Vedder amp Guynes 2002 Darling 1996) With the increase in business competition company survival and success is now determined by its rate of learning If it is faster than external changes the organization will experience long term success (Darling 1996) Ironically even though as much as 68 of US companies have an organized approach to providing information to decision makers (Westervelt 1996) acccording to Ettorre (1995) probably less than 10 percent of American corporations managed the CI process well and effectively integrated the information into their strategic plans in the past According to Fuld and Company (2013) competitive intelligence is a function within large corporations around the globe that serve to track and analyse the competition provide early warning to management as well as report to management on both opportunities and threats both tactical and strategic It is a function that delivers analyses and conducts strategic exercises such as war games and longer term scenario assessments
The antecedents and consequences of competitive intelligence dissemination has been studied by Maltz amp Kohli (1996) Competitor Analysis (CA) was proposed
Table 1Encountered ProblemsObstacles In Product Innovation Source References
Difficulty dealing with uncertainty and risk Stringer(2000) Sharma (1999)Lack of market information Galia and Legros (2004)Lack of information about technology Galia and Legros (2004)Lack of information about the consumer Galia and Legros (2004)Difficulty generating truly new ideas Nemeth (1997)Difficulty evaluatingselecting the best ideas Sharma (1999)Difficulty connecting the portfolio of projects to strategic objectives Cooper Edgett and Kleinschmidt (2001)Difficulty turning selected good ideas into innovative products Cooper (2009)Difficulty measuring results and performance in innovation Adams et al (2006)Lack of qualified staff Galia and Legros (2004)Difficulty orchestratingco-ordinating the various areas for innovation Thamhain (2003)
Strategic
Transactional Leadership
Competitive Intelligence
Problems Encountered in Product Innovation
Innovation Process Used
Strategic Charismatic Leadership
Management of Technology
Figure 1 The Research Model
Tor Guimaraes Marcelo Seido Nagano amp Curtis Armstrong Testing Major Factors for Reducing Obstacles to Product Innovation Success
14 International Journal of the Academic Business World 15Fall 2015 (Volume 9 Issue 2)
by Ghoshal amp Westney (1991) and other approaches useful for companies to collect information from competitors were addressed by Heil amp Robertson (1991) The importance of organization intelligence to financial performance was also demonstrated many years ago Companies with well-established CI programs on the average showed earnings per share of $124 compared to those without CI programs which lost 7 cents (King 1997)
Over time the importance of CI has grown steadily in Asia and in Europe where companies with intelligence budgets of more the $2 million or more did not exist five years ago but today represent 2-3 percent of all intelligence budgets Further in North America programs that spend more than one-million dollars increased from approximately 5-percent of all corporate intelligence program budgets to nearly 10-percent of all budgets (Fuld and Company 2013) Despite its importance and steady adoption all over the world (Pellissier amp Nenzhelele 2013) CI is no panacea and has its prerequisites (Nemutanzhela amp Iyamu 2011)
The literature contains many examples of benefits that can be derived from CI Among these are improved competi-tive edge (Fuld and Company 2013 Pellissier amp Nenzhe-lele 2013 Editors 2004 duToit 2003 McCune 1996 Sawka 1996 Westervelt 1996) and improved overall company performance (Davison 2001 Guimaraes amp Armstrong 1998 Babbar amp Rai 1993) two essential company goals that can be brought about with effective application of competitive intelligence More specific benefits of CI include uncovering business opportunities and problems that will enable proactive strategies (Ellis 1993 Westervelt 1996) providing the basis for continu-ous improvement (Babbar amp Rai 1993) shedding light on competitor strategies (Harkleroad 1993 Westervelt 1996) improving speed to markets and supporting rapid globalization (Baatz 1994 Ettorre 1995) improving the likelihood of company survival (Westervelt 1996) in-creasing business volume (Darling 1996) providing bet-ter customer assessment (Darling 1996) and aiding in the understanding of external influences (Sawka 1996) Benefits such as these provide the basis for firms to better understand the potential impact of the proposed changes and the means by which they can be infused into the com-panyrsquos fabric Based on the above discussion we propose the following hypothesis
H1 Company CI effectiveness is inversely related to problems encountered in product innovation
Independent Variable Strategic Leadership
There is a substantial body of knowledge proposing the im-portance of effective leadership as an ingredient to success-
ful organization change (Guimaraes 2011 Waldman et al 2001) There are many types of leadership (ie formalinformal based on specific skills social status etc) arising from the circumstances in which leadersfollowers find themselves However for the purposes of this study the relevant construct is company strategic leadership Pawar amp Eastman (1997) proposed transactional strategic lead-ership as the one to be operational within an existing or-ganizational system or culture instead of trying to change it It attempts to satisfy the current needs of followers by focusing on exchanges and contingent reward behavior It pays close attention to exceptions or irregularities and takes action to make corrections (Bass 1985 Burns 1978) Conceptually similar to the cultural maintenance form of leadership described by Trice amp Beyer (1993) transactional leadership acts to strengthen existing organization process-es structures strategies and culture
The second form of strategic leadership is transforma-tional or ldquocharismaticrdquo leadership (Pawar amp Eastman 1997) According to Waldman et al (2001) the leader articulates ldquoa vision and sense of mission showing de-termination and communicating high performance ex-pectationsrdquo (p135) The followers reply with confidence in the leader and strong admiration or respect Also they identify with the leaderrsquos vision and with the organiza-tion itself creating a high level of collective cohesion This cohesion and the leaderrsquos expressions of confidence in the followersrsquo ability to attain the vision produce in turn a heightened sense of self-efficacy (Podsakoff et al 1990) Further charismatic leaders are likely to show persistence and enthusiasm in pursuing goals and be demanding of others through the communication of high performance expectations (Kanter 1983 Trice amp Beyer 1993) There is evidence that charismatic leadership at the top executive level is important for company performance (Day amp Lord 1988 Hambrick amp Finkelstein 1987 Yukl 1998) Katz amp Kahn (1978) argued that while charismatic leadership may be more relevant to situations where organization change is important both transactional and transforma-tional (charismatic) leadership are potentially important at the strategic level that it is particularly important as a means of mobilizing an organization to meet the demands of its environment Bass (1985) viewed transactional and charismatic leadership as being somewhat complementary in that both could be displayed by the same individual leader Similarly Trice amp Beyer (1993) acknowledged that both maintenance- and innovation-oriented leader-ship could be shown by a given leader over time Based on the above discussion both types of strategic leadership are tested and we propose
H2 Strategic transactional leadership is inversely re-lated to problems encountered in product innova-tion and
H3 Strategic charismatic leadership is inversely re-lated to problems encountered in product innova-tion
Independent Variable Management of Technology (MOT) To Support Business Change
As business competitiveness increases many business or-ganizations have used technology for redesigning business processes provide new products and services and improve the organization work environment Many authors have proposed the importance of a wide variety of technologies to support business innovation (Li-Hua amp Khalil 2006 Khalil amp Ezzat 2005) Computer Telephony Integration has been touted as a powerful tool to improve the rela-tionship with customers (McCarthy 1996) The effects of computer technology on organization design intelligence and decision making have long been of interest to research-ers (Huber 1990) The use of computers for data mining and warehousing is seen as essential for decision support (Anonymous 1995) Friedenberg amp Rice (1994) and Gui-maraes et al (1997) have proposed Expert Systems as viable implementation vehicles for business change because they are effective in capturing and distributing knowledge and knowledge processing capability across an organization The list of technologies available to support the necessary business changes is endless For business changes requiring technology without effective MOT the change implemen-tation processes would be severely hindered and in many cases rendered impossible Based on the above discussion the following is proposed
H4 MOT effectiveness is inversely related to problems encountered in product innovation
Independent Variable Important Characteristics of the Change Process
For improving the success rate of changes in organizations the literature (Guimaraes amp Armstrong 1998 Guimaraes 2011) proposes several pre-requisites for the process used for implementing change i e conformity to company objectives employee and department participation in the change process customer input reasonably balancing risk taking with cost benefit analysis monitoring progress and communication regarding the change process In other words how change is implemented is an important deter-minant of success Specifically as proposed by Guimaraes amp Armstrong (1998) the important characteristics of the change process enumerated above are expected to influence the companyrsquos ability to change its products Thus we have H5 The extent to which the change process bears the de-sirable characteristics will be inversely related to problems encountered in product innovation
STUDY METHODOLOGY
This section provides an overview of the field-test procedure used and a brief description of the sample supporting this study A description of how the variables were measured the data analysis procedures and the discussion of the study results are presented later
The Data Collection Process
This field test used a questionnaire to collect the relevant data from a convenience sample of 47 product development managers from 32 organizations with global business operations headquartered in the United States The questionnaire was developed based on a survey of the literature and it was tested for readability and content relevancy and completeness in relation to the study objectives This testing was conducted through several meetings and phone conversations with four managers presently directly involved in new product development The questionnaire had a cover letter describing the purpose of the study and providing instructions for the respondents nevertheless the data was collected mostly through personal interviews with the respondents Many of the participants are known personally to the researchers from seminars in product and business process innovation and some are known to have considerable knowledge and experience about their respective companyrsquos policies processes and activities in product innovation
Sample Description
The companies represented in the sample range widely in terms of their industry sector and size Forty two percent of the firms identified their primary business as manu-facturing with the remaining companies distributed fairly evenly across the sectors of communications (11) health care (6) retail (8) banking and finance (11) and other (22) In terms of gross revenues twenty nine percent of the firms were two hundred million dollars in annual sales or less forty six percent were between two hundred million and 800 million dollars and the remain-ing twenty five percent were above 800 million dollars Twenty six percent of the respondent identified that their number of employees were 500 or less thirty nine percent of the companies employed between 500 and 1000 peo-ple and the remaining companies (35) had more than 1000 employees
Construct Measurement
The measuring scale and components for each major vari-able in this study are presented next As discussed earlier the major constructs and their subcomponents have been
Tor Guimaraes Marcelo Seido Nagano amp Curtis Armstrong Testing Major Factors for Reducing Obstacles to Product Innovation Success
16 International Journal of the Academic Business World 17Fall 2015 (Volume 9 Issue 2)
collected from the existing literature have been validated and used by prior studies and provided the theoretical framework for the model empirically tested here
Obstacles Encountered in Product Innovation were collected from the literature as referenced in Table 1 Respondents were asked to ldquoPlease rate the difficulty of the following product innovation problems your company actually encountered over the last three years in comparison with the closest competing organizations you are aware ofrdquo The list of 11 items to be rated includes
1 Dealing with uncertainty and risk 2 Lack of market information 3 Lack of information about technology 4 Lack of information about consumers 5 Difficulty to generate truly new ideas 6 Difficulty to evaluate and select best ideas 7 Difficulty to connect the portfolio of projects to
strategic objectives 8 Difficult to turn selected good ideas into innova-
tive products 9 Difficult to measure results and performance in
innovation 10 Lack of qualified staff and 11 Difficulty orchestratingco-ordinating the vari-
ous areas for innovation This was done using a seven-point Likert-type scale ranging from 1 to 7
1 extremely lower than average 2 much lower 3 somewhat lower 4 average 5 somewhat higher than average 6 much higher and 7 extremely higher
The ratings for these items were averaged to produce a single measure for ldquoproblemsobstacles encounteredrdquo
Strategic Leadership represents the ability of the top management team to provide leadership when the orga-nizational environment requires change Environments perceived as highly uncertain (requiring major changes) tend to be perceived as risky where wrong decisions could be costly Such environments probably generate a high de-gree of stress Charismatic leadership would tend to reduce
stress and generate confidence and perhaps show how un-certainty can be turned into a vision of opportunity and success (Bass 1985) While charismatic leadership may be more relevant to situations where organization change is of major importance both transactional and transformation-al (charismatic) leadership are potentially important at the strategic level Further Bass (1985) viewed transactional and charismatic leadership as being somewhat complemen-tary in that both could be displayed by the same individual leader The same items proposed by Waldman et al (2001) were used to measure the two types of strategic leadership It was assessed by asking the respondents to rate the extent to which their top managers in general exhibit the particu-lar behavior when compared to managers of main compet-ing organizations
Transactional leadership
1 Takes actions if mistakes are made 2 Points out what people will receive if they do
what needs to be done 3 Reinforces the link between achieving goals and
obtaining rewards 4 Focuses attention on irregularities exceptions or
deviations from what is expected 5 Rewards good work
Charismatic leadership
1 Shows determination when accomplishing goals 2 I have complete confidence in them 3 Makes people feel good to be around them 4 Communicates high performance expectations 5 Generates respect 6 Transmits a sense of mission7 Provides a vision of what lies ahead
Characteristics of the Change Process is defined as the degree to which companies promote ldquodesiredrdquo change process activities It was assessed by asking the respondents to rate the importance or focus that the company places on ten areas of change process characteristics These consisted of all significant changes must conform to company objectives all affected departments participate in the change process individual employee input is considered important customers input is considered important business partners input is considered important ability to balance risk taking with costbenefit clearly defined measures to monitor progress change objectives and progress are clearly communicated responding quickly to required change and responding effectively to required change The same seven-point Likert-type scale was used
and the overall rating of characteristics of the change process for each firm was determined as the average of the ten areas
MOT Effectiveness in Supporting Business Change is the extent to which the companyrsquos needs for technology while implementing business change have been met It was measured by asking the respondents to rate this for the overall company and in four specific areas technology leadership in the industry knowledge of how to get the best technology effectiveness with which technology has been used over the years and effectiveness in using technology in comparison with main competitors The respondents were asked to use the same seven point scale described above The measure for MOT effectiveness in supporting business activities is the average of the ratings for these four items
Construct Validity
Several precautions were taken to ensure the validity of the measures used Many of the recommendations by Carmines amp Zeller (1979) were followed To ensure content validity a thorough survey of the relevant literature was undertaken to understand the important aspects of each major variable and its components and not neglect important dimensions of any variable To further reduce the possibility of any non-random error the main source of invalidity (Carmines amp Zeller 1979 p 15) a group of practitioners from different companies with extensive experience in managing PI reviewed the questionnaire for validity (measuring the phenomena intended) completeness (including all relevant items) and readability (making it unlikely that subjects will misinterpret a particular question) Some questions were reworded to improve readability otherwise the items composing each major variable remained as derived from the literature
As proposed by Carmines amp Zeller (1979) ldquoconstruct validation focuses on the extent to which a measure performs in accordance with theoretical expectationsrdquo (p27) To ensure construct validity the theoretical
relationships between the constructs should have been previously established and these relationships hopefully have been empirically supported by different studies over time As discussed earlier the theoretical underpinnings of this study are relatively well established with most of the items in each construct having been addressed before by several authors Second order factor analyses on the two types of strategic leadership (transactional and charismatic leadership) have been performed by prior studies (Guimaraes 2008 Guimaraes 2011) using larger sample sizes and the results indicated that they can be combined into a single factor as done in this study
Data Analysis Procedures
The relatively small sample size (n = 47) requires the use of simple but robust statistical analysis Pearsonrsquos correla-tion coefficients were used to statistically test the possible relationship between the main constructs T-tests and Chi-square statistics for cross-tabulations were used to test the hypotheses Responses from each manager regarding the main constructs were classified into two groups above and below the mean to produce the cross-tabulation tables
RESULTS
Table 2 lists the Pearsonrsquos correlation coefficients and the means and standard deviations for the six major research variables On the average the companies in the sample are thought to be performing slightly above average in the areas of competitive intelligence both components of strategic leadership management of technology and specific characteristics of the companyrsquos change process On the other hand on average the companies in the sample tend to be ldquosomewhat highrdquo in terms of encountering the obstacles to product innovation identified in this study It is also notable that the relatively large standard deviations (mostly above 10) indicate significant differences in performance from company to company One possible explanation for the ldquosomewhat highrdquo average regarding the identification
Table 2 Correlations Between Major Variables
Major Variables Mean StdDev 1 2 3 4 5
1 PI Problems Encountered 47 0832 Competitive Intelligence 42 112 -233 Transactional Leadership 45 098 -20 NS4 Charismatic Leadership 41 122 -35 36 NS5 Management of Technology 44 107 -26 NS 18 136 Change Process Features 43 098 -33 27 14 23 15
Tor Guimaraes Marcelo Seido Nagano amp Curtis Armstrong Testing Major Factors for Reducing Obstacles to Product Innovation Success
18 International Journal of the Academic Business World 19Fall 2015 (Volume 9 Issue 2)
of obstacles to product innovation may be that the industry seminars attended by the product managers may have raised their own performance expectations and problem awareness
Hypothesis H1 proposes that a companyrsquos performance in Competitive Intelligence (CI) is inversely related to prob-lems encountered in product innovation Table 3 shows the results of the cross-tabulations for these two major vari-ables
In Table 3 the number of observations falling in each table cell corroborates that companies performing above average in the performance of CI tend to be below average in terms of encountering problems during product innovation The same inverse relationship tends to hold for companies performing below average in CI thus encountering more difficulty in product innovation About half as many (8 versus 15) organizations report encountering above average product innovation problems when they are performing above average in CI However this also shows that higher than average overall performing in CI is apparently no guarantee that a company will also not encounter above average problems in product innovation On the other
hand below average performance in CI shows a threefold (6 versus 18) increase in higher than average encounters with product innovation problems
As shown in Table 4 t-tests were used to further test the significance of this relationship between the company
performance in CI and product innovation problems encountered Respondents in the two groups above and below the average performance in CI are compared in aggregate and along each of the product innovation problems identified in the literature The results clearly demonstrate that compared to below average firms companies with above average performance in CI have encountered product innovation problems at a significantly lower level on many of the product innovation problems identified Based on the above results we find strong support for hypothesis one
Results from Hypothesis Two Testing
Hypothesis two proposes that performance in overall company Strategic Transactional Leadership is inversely related to problems encountered in product innovation This was tested in a similar manner as for hypothesis one respondents were placed in two groups based on their above or below average ratings in Strategic Leadership Table 5 shows the results of the cross-tabulations between the two major constructs Sixteen of the 24 companies that were below average Transactional Leadership performance are above average in terms of encountering product innovation problems On the other hand some companies (13) with a below average Transactional Leadership performance somehow were able to avoid having above average encoun-
ters with product innovation problems Further above av-erage Transaction Leadership in 6 organizations has not precluded them from encountering above average product innovation problems
As shown in Table 6 t-tests were used to further test the significance of the relationship between a companyrsquos higher or lower than average Transactional Leadership and specific product innovation problems encountered The two groups are compared in aggregate and along each of the product innovation problems identified in the lit-
Table 4 T-Tests for Performance in Competitive Intelligence and
Each Product Innovation Problem Encountered
Aggregated Variable and Individual Items
Competitive Intelligence
Below Average Performance
Competitive Intelligence
Above Average Performance
p-Value
Problems encountered in product innovation 47 41 003Difficult to deal with uncertainty and risk 51 45 002Lack of market information 53 35 000Lack of information about technology 47 36 001Lack of information about the consumer 52 37 001Difficult to generate truly new ideas 45 43 Not Significant
Difficult to evaluate and select the best ideas 46 48 Not Significant
Difficulty to connect the portfolio of projects to strategic objectives
49 43 Not Significant
Difficult to turn selected good ideas into innovative prod-ucts
43 44 Not Significant
Difficult to measure results and performance in innova-tion
48 40 001
Lack of qualified staff 45 39 002Difficult to orchestrate and co-ordinate the various areas for innovation
40 38 Not Significant
means plt05 means plt 01
Table 5 Cross-Tabulations of
Transactional Leadership and Product Innovation Problems
(Hypothesis 2)Product Innovation
Problems EncounteredBelow
AverageAbove
Average
Transactional Leadership
Below Average 8 16
Above Average 13 6
Chi-square = 52 (p = 002)
Table 6 T-Tests for Transactional Leadership and
Each Product Innovation Problem Encountered
Aggregated Variable and Individual Items
Transactional Leadership
Below Average Performance
Transactional Leadership
Above Average Performance
p-Value
Problems encountered in product innovation 47 42 004Difficult to deal with uncertainty and risk 53 44 001Lack of market information 44 42 Not SignificantLack of information about technology 47 43 Not SignificantLack of information about the consumer 43 39 Not SignificantDifficult to generate truly new ideas 45 42 Not Significant Difficult to evaluate and select the best ideas 46 44 Not Significant Difficulty to connect the portfolio of projects to strategic objec-tives
50 41 001
Difficult to turn selected good ideas into innovative products 51 44 001Difficult to measure results and performance in innovation 49 42 001Lack of qualified staff 46 43 Not SignificantDifficult to orchestrate and co-ordinate the various areas for in-novation
47 35 001
Table 3 Cross-Tabulation of Performance in
Competitive Intelligence and PI Problems (Hypothesis 1)
Product Innovation Problems Encountered
Below Average
Above Average
Performance in Competitive
Intelligence
Below Average 6 18
Above Average 15 8
Chi-square = 768 (p = 000)
Tor Guimaraes Marcelo Seido Nagano amp Curtis Armstrong Testing Major Factors for Reducing Obstacles to Product Innovation Success
20 International Journal of the Academic Business World 21Fall 2015 (Volume 9 Issue 2)
erature The results clearly demonstrate that compared to below average firms companies with higher than aver-age Transactional Leadership have encountered product innovation problems at a significantly lower level along many of the product innovation problems identified The above results corroborates hypothesis two
Results from Hypothesis Three Testing
Hypothesis three proposes that firms having strong char-ismatic leadership is inversely related to encountering problems in product innovation This has been tested in a similar fashion as hypotheses 1 and 2 Table 7 shows the results of the cross-tabulations for belowabove average company resources availability and belowabove average encounters with product innovation problems Similar to the cross-tabulations used for testing the hypotheses addressing the other major constructs the results in this case confirm expectations and should be interpreted ac-cordingly
As shown in Table 8 t-tests were again used to further test the significance of this relationship between Charismatic Leadership and specific product innovation problems en-countered The results clearly demonstrate that compared to below average firms companies with above average Charismatic Leadership have encountered product inno-vation problems at a significantly lower level along many
of the product innovation problems identified While the small sample size has resulted in several non-significant comparisons in no case the comparison contradicted the general hypothesis Based on the above results we also find strong support for hypothesis three
Results from Hypothesis Four Testing
Tested in similar fashion hypothesis four proposes that having effective management of technology is inversely
related to encountering problems in product innovation Table 9 shows the results of the cross-tabulations for be-lowabove average management of technology effective-ness and belowabove average encounters with product in-novation problems Similar to the cross-tabulations used for testing the hypotheses addressing the other major con-structs the results in this case confirm expectations and should be interpreted accordingly
As shown in Table 10 t-tests were again used to further test the significance of this relationship between the company MOT effectiveness and specific product inno-vation problems encountered The results clearly demon-strate that compared to below average firms companies with above average MOT performance have encountered product innovation problems at a significantly lower level along many of the product innovation problems identi-fied Based on the above results we also find strong sup-port for hypothesis four
Results from Hypothesis Five Testing
Hypothesis five proposes that having a product change process with the desirable characteristics is inversely related to encountering problems in product innovation This has been tested the same way Table 11 shows the results
of the cross-tabulations for belowabove average product change process and belowabove average encounters with specific product innovation problems The results in this case confirm expectations and should be interpreted accordingly
As shown in Table 12 t-tests were again used to further test the significance of this relationship between the product change process and specific product innovation problems encountered C to below average firms companies with
Table 8 T-Tests for Charismatic Leadership and
Each Product Innovation Problem Encountered
Aggregated Variable and Individual Items
Charismatic Leadership
p-ValueBelow
AverageAbove
Average
Problems encountered in product innovation 50 39 001
Difficult to deal with uncertainty and risk 52 41 001Lack of market information 49 42 001Lack of information about technology 50 40 002Lack of information about the consumer 47 38 001Difficult to generate truly new ideas 48 38 001Difficult to evaluate and select the best ideas 51 41 001Difficulty to connect the portfolio of projects to strategic objectives 52 38 001Difficult to turn selected good ideas into innovative products 51 43 001Difficult to measure results and performance in innovation 47 37 001Lack of qualified staff 52 36 001Difficult to orchestrate and co-ordinate the various areas for innovation 50 35 001
Table 10 T-Tests for Management of Technology and
Each Product Innovation Problem Encountered
Aggregated Variable and Individual Items
Management of Technology
p-ValueBelow
AverageAbove
Average
Problems encountered in product innovation46 40 003
Difficult to deal with uncertainty and risk 48 34 001Lack of market information 46 35 001Lack of information about technology 52 36 000Lack of information about the consumer 43 41 Not SignificantDifficult to generate truly new ideas 47 40 Not SignificantDifficult to evaluate and select the best ideas 43 42 Not SignificantDifficulty to connect the portfolio of projects to strategic objectives 45 43 Not SignificantDifficult to turn selected good ideas into innovative products 46 41 004Difficult to measure results and performance in innovation 48 42 003Lack of qualified staff 47 44 Not Significant
Difficult to orchestrate and co-ordinate the various areas for innovation 43 41 Not Significant
Table 7 Cross-Tabulations of
Charismatic Leadership and Product Innovation Problems
(Hypothesis 3)Product Innovation
Problems EncounteredBelow
AverageAbove
Average
Charismatic Leadership
Below Average 7 15
Above Average 16 9
Chi-square = 48 (p = 003)
Table 9 Cross-Tabulations of
Management of Technology and Product Innovation Problems
(Hypothesis 4)Product Innovation
Problems EncounteredBelow
AverageAbove
Average
M a n a g e me nt of Technology
Below Average 9 14
Above Average 18 8
Chi-square = 45 (p = 003)
Tor Guimaraes Marcelo Seido Nagano amp Curtis Armstrong Testing Major Factors for Reducing Obstacles to Product Innovation Success
22 International Journal of the Academic Business World 23Fall 2015 (Volume 9 Issue 2)
more relevant within an existing organization environment instead of one attempting to implement changes Katz amp Kahn (1978) argued that charismatic leadership may be more relevant where organization change is important but that both types of strategic leadership are potentially important Our results indicate that indeed for more successful (less problems encountered) product innovation both types of leadership are important
Regarding CI there are also some major implications from this study results To improve their CI programs managers need to consider the collection of market intelligence based on the six areas addressed in this study the traditional industry competitors emerging competitors traditional customer needs and wants non-traditional customer needs and wants relationships with business partners and new product or service development The importance of any one of these areas may be relatively higher or lower and in some cases some of these sources may be irrelevant depending on the companyrsquos specific industry sector line of business products and processes being considered Good performance in these areas whenever applicable to the companyrsquos industry sector and lines of business are likely to reduce problems encountered which in turn is likely to lead to more product innovation
To improve technology management which is found to be useful reducing product innovation problems managers must look at company performance in terms of its technology leadership position in its main industry sectors knowledge of how to get the best technology available effective use of specific technologies and benchmarking the use of specific technologies against the companyrsquos main competitors or best-in-class target organizations An important requirement to accomplish these objectives is the clear definition of the more important technologies necessary to support and enhance the companyrsquos products Another important requirement is management recognition that the implementation of each of the various technologies deemed important to the organization are dependent on specific success factors The success factors for the various technologies have been identified and discussed elsewhere (Guimaraes Igbaria amp Lu 1992 Guimaraes amp Igbaria 1997 Yoon Guimaraes amp Clevenson 1998 Yoon Guimaraes amp Clevenson 1995 Yoon Guimaraes amp OrsquoNeal 1995 Udo amp Guimaraes 1994) and are considered beyond the scope of this paper
Last top managers must ensure that their companysrsquo product change process bear the desirable characteristics studied here all significant changes must conform to company objectives all affected departments participate in the change process individual employee input is considered important customers input is considered important business partners input is considered important managers
above average performance in product change process have encountered product innovation problems at a significantly lower level along many of the product innovation problems identified Based on the above results hypothesis five is corroborated
DISCUSSION MANAGERIAL RECOMMENDATIONS AND
FURTHER RESEARCH
Despite the relatively small sample size the results provide strong evidence regarding the importance of strategic leadership competitive intelligence management of
technology and specific characteristics of the companyrsquos change process to the success of product innovation Given the importance of effectively implementing business innovation in these days of hyper competitiveness it behooves top managers to do whatever they can to improve their companysrsquo performance in the areas of strategic leadership competitive intelligence management of technology and characteristics of the process used to reduce problems encountered with the product innovation process so vital to company performance
In the area of strategic leadership several implications can be derived from this study Charismatic leadership (showing determination while accomplishing goals inspiring confidence making people feel good around you communicating expectations for high performance generating respect transmitting a sense of mission and providing a vision of what lies ahead) is on average and as a whole relatively scarce in industry today and judging by its nature it should be difficult to develop Nevertheless managers must try particularly in high clockspeed industry sectors (Guimaraes et al 2002) requiring continuous innovation Also apparently important for successful product innovation transactional leadership (taking action if mistakes are made pointing out what people will receive if they do what needs to be done reinforcing the link between achieving goals and obtaining rewards focusing attention on deviations from what is expected and rewarding good work) by its nature should be easier to develop Pawar amp Eastman (1997) proposed that transactional leadership is
ability to balance risk taking with costbenefit the existence of clearly defined measures to monitor progress that change objectives and progress are clearly communicated and that the product innovation teams respond quickly and effectively to required change These guidelines must be widely disseminated and enforced by project managers and employees involved in product changes
The primary objective of this research has three interrelated components 1) to identify and assess the variety of problems encountered by companies while performing the vital process of product innovation 2) to identify and assess the major factors proposed in the literature as necessary to increase the likelihood of success in product innovation and 3) to test if these literature proposed success factors for product innovation also show a positive impact by reducing the problems associated with the product innovation process in practice Thus it is safe to assume that the measures for each of the major constructs studied here derived from a large number of separate studies represent an important contribution to future researchers and practicing product innovation managers aiming to improve their company effectiveness in this critical area
During the process of conducting this research informal discussions with several of the product development managers made abundantly clear that over time success in product development can only be achieved by a complex combination of many factors stemming from three major areas humanorganizational technological and market knowledge elements This multidimensional requirement for success as well as an intrinsic presence of risk and the need to find tangible and intangible resources is a huge challenge for product innovation management in general As the results from this study indicated all the major factors addressed here are important but do not by themselves ensure successful product innovation It seems to be rather analogous to a case where basic components must be in combination transformed into improved products which provide greater value to the market place
STUDY LIMITATIONS AND OPPORTUNITIES FOR FURTHER RESEARCH
Based on an extensive survey of the relevant literature this study is a first attempt at empirically testing the im-portance of strategic leadership competitive intelligence management of technology and specific characteristics of the companyrsquos change process for the success of product in-novation The theoretical model proposed here addresses five major determinants of how to reduce obstaclesprob-lems for successful PI based on the existing literature There might be other important factors for reducing the PI prob-lems defined in this study Given the importance of the
Table 12 T-Tests for Change Process Features and
Each Product Innovation Problem Encountered
Aggregated Variable and Individual ItemsChange Process Features
p-ValueBelow Average
Above Average
Problems encountered in product innovation 49 40 001Difficult to deal with uncertainty and risk 51 42 001Lack of market information 49 40 001Lack of information about technology 50 41 001Lack of information about the consumer 48 37 001Difficult to generate truly new ideas 47 40 001Difficult to evaluate and select the best ideas 52 43 001Difficulty to connect the portfolio of projects to strategic objectives 49 38 001Difficult to turn selected good ideas into innovative products 50 43 001Difficult to measure results and performance in innovation 48 39 001Lack of qualified staff 47 37 001Difficult to orchestrate and co-ordinate the various areas for innovation 52 41 001
Table 11 Cross-Tabulations of
Change Process Features and Product Innovation Problems
(Hypothesis 5)Product Innovation
Problems EncounteredBelow
AverageAbove
Average
C h a n g e P r o c e s s Features
Below Average 8 15
Above Average 17 9
Chi-square = 46 (p = 003)
Tor Guimaraes Marcelo Seido Nagano amp Curtis Armstrong Testing Major Factors for Reducing Obstacles to Product Innovation Success
24 International Journal of the Academic Business World 25Fall 2015 (Volume 9 Issue 2)
topic future research should strive to identify and include these potential factors in an expanded theoretical model
Another opportunity for future research stems from the fact that even though the relatively small sample in this study has shown very encouraging statistically significant results larger sample sizes will be much more convincing Therefore we strongly recommend new research projects with larger sample sizes capable of supporting multivariate analyses expanded theoretical models and enable the assessment of more complex relationships among the important constructs addressed in this study Perhaps the use of a path analytic modeling technique would be applicable in this case The results should provide valuable information on the extent to which strategic leadership can positively influence the effective use of technology and CI programs for companies to improve their business competitiveness while ensuring that the change process follow prescribed guidelines suggested in this study
Finally a third area of future research opportunity deals with the integration and expansion of theoretical mod-els relating the many determinants of success in product innovation to include the new construct of ldquoobstacles to product innovationrdquo as a likely moderating variable in these theoretical models Combined these three areas of research opportunity should support a host of research studies important not only to the academic community but also to product innovation managers
REFERENCES
Adams R Bessant J amp Phelps J (2006) Innovation management measurement A review International Journal of Management Reviews 8(1) 21-47
Anonymous (1995) Data mining a new weapon for com-petitive advantage Software Quarterly 2 (4) 15-19
Baatz E B (1994 Sept 15) The quest for corporate smarts CIO 48-58
Babbar S amp Rai A (1993) Competitive intelligence for international business Long Range Planning 263103-113
Bass BM (1985) Leadership and Performance beyond Expectations New York Free Press
Beattie JS amp Fleck J (2005) New perspectives on stra-tegic technology management in small high-tech com-panies Proceedings from IEEE International 2005 Engineering Management Conference
Blindenbach-Driessen F amp Van Den Ende J (2010) In-novation management practices compared the exam-ple of project-based firms Journal of Product Innova-tion Management 6(3) 33-53
Burns J M (1978) Leadership New York Harper amp Row
Calof JL amp Wright S (2008) Guest Editorial Com-petitive intelligence a practitioner academic and inter-disciplinary perspective European Journal of Market-ing 42(78) 717-730
Carmines E amp Zeller R (1979) Reliability and Validity Assessment Beverly Hills CA Sage
Colakoglu T (2011) The problematic of competitive intelligence How to evaluate and develop competi-tive intelligence Procedia ndash Social and Behavioral Sci-ences 24(1) 1615ndash1623 httpdxdoiorg101016jsbspro201109075
Cooper RG (2009) How companies are reinventing their idea-to-launch methodologies Research Technol-ogy Management 52(2) 47-57
Cooper RG and Chew MB (1996) Control tomor-rowrsquos costs through todayrsquos designs Harvard Business Review January-February 88-98
Cooper R amp Edgett S (2008) Ideation for product in-novation what are the best methods PDMA visions magazine 1(1) 12-17 httpwwwstage-gatecomknowledgephp
Cooper R Edgett S amp Kleinschmidt E (2001) Portfo-lio management for new product development results of an industry practices study RampD Management 31(4) 361-380
Darling M S (1996) Building the knowledge organiza-tion Business Quarterly 61(2) 61-66
Davison L (2001) Measuring competitive intelligence effectiveness Insights from the advertising industry Competitive Intelligence Review 12 (4) 25-38
Day DV amp Lord RG (1988) Executive leadership and organizational performance suggestions for a new theory and methodology Journal of Management 14 4593-464
du Toit A (2003) Competitive intelligence in the knowl-edge economy What is in it for South African manu-facturing enterprises International Journal of Infor-mation Management 23 111-120
Editors (2004 MarchApril) Competitive intelligence and records managers The Information Management Journal 4
Ellis J R (1993) Proactive competitive intelligence Us-ing competitive scenarios to exploit new opportunities Competitive Intelligence Review 4(1) 13-24
Ettorre B (1995) Managing competitive intelligence Management Review 84(10) 15-19
Fleisher CS amp Wright S (2009) Examining differences in competitive intelligence practice China Japan and the West Thunderbird International Business Review 51(3) 249ndash261 httpdxdoiorg101002tie20263
Friedenberg R amp Rice A (1994 August 3) Knowledge re-engineering as a BPR strategy Working Notes of the AAAI-94 Workshop on Artificial Intelligence in Business Process Reengineering Seattle WA pp 21-26
Fuld amp Company (2013) Certain industries invest heavi-ly in watching their competition Fuld Insights-Global Benchmarking Project Update March 2013
Galia F amp Legros D (2004) Complementarities be-tween obstacles to innovation evidence from France Research Policy 33 1185ndash1199
Ghoshal S amp Westney D E (1991 Jan) Organizing competitor analysis systems International Journal of the Academic Business World 2(1) pp 35-44
Guimaraes T (2011) Industry Clockspeedrsquos Impact on Business Innovation Success Factors European Journal of Innovation Management 14(3) 322-344
Guimaraes N amp Armstrong C (1998) Exploring the relation between competitive intelligence IS support and business change Competitive Intelligence Review 9(3) 45-54
Guimaraes T Cook D amp Natarajan N (2002) Explor-ing the importance of business clockspeed as a modera-tor for determinants of supplier network performance Decision Sciences 33(4) 629-644
Guimaraes N amp Igbaria M (1997) Clientserver sys-tem success Exploring the human side Decision Sci-ences 28(4) 851-876
Guimaraes N Igbaria M amp Lu M (1992) Determi-nants of DSS success An integrated model Decision Sciences 23(2) 409-430
Guimaraes T Yoon Y amp Clevenson A (1997) Empiri-cally testing ES success factors in business process reen-gineering International Journal of Production Econom-ics 50 245-259
Haataja J (2011) Social media as a source of competitive intelligence in a pharmaceutical corporation Masterrsquos thesis School of Science Aalto University
Haddadi AE Dousset B amp Berrada I (2010) Xplor EveryWhere ndash The Competitive Intelligence Sys-tem for Mobile in IEEE Xplorereg retrieved 25 March
2015 from httpieeexploreieeeorgstampstampjsptp=amparnumber=5945635
Hambrick DC amp Finkelstein S (1987) Managerial Discretion A Bridge between Polar Views of Organi-zational Discretion In LL Cummings amp BM Staw (Eds) Research in Organizational Behavior Green-wich CT JAI Press 9 369-406
Harkleroad D (1993) Sustainable growth rate analysis Evaluating worldwide competitorsrsquo ability to grow profitability Competitive Intelligence Review 4(23) 36-45
Heil O amp Robertson T S (1991 Sep) Toward a theory of competitive market signaling A research agenda Strategic Management Journal 12(6) 403-418
Huber G P (1990 Jan) A theory of the effects of ad-vanced information technologies on organizational design intelligence and decision making Academy of Management Review 15(1) 47-71
Kanter RM (1983) The Change Masters New York Si-mon amp Schuster
Katz D amp Kahn RL (1978) The Social Psychology of Organizations (2nd ed) New York Wiley
Khalil TM amp Ezzat HA (2005) Management of technology and responsive policies in a new economy International Journal of Technology Management 32(12) 88
King M (1997 March 10) Corporations take snooping mainstream Indianapolis Business Journal 17(2) 1-4
Li-Hua R amp Khalil TM (2006) Technology manage-ment in China A global perspective and challenging issues Journal of Technology Management in China 1(1) 9
Maltz E amp Kohli A K (1996 Feb) Market intelligence dissemination across functional boundaries Journal of Marketing Research 33(1) 47-61
Mata RS (2008) Inovaccedilatildeo tecnoloacutegica em multinacio-nais brasileiras estudo multicaso sobre gestatildeo do port-folio de projetos de novos produtos 192p Dissertaccedilatildeo (Mestrado) ndash Faculdade de Economia Administraccedilatildeo e Contabilidade de Ribeiratildeo Preto Universidade de Satildeo Paulo Ribeiratildeo Preto
McCarthy V (1996) CTI lets you coddle customers at lower cost Datamation 42(13) 46-49
McCune J C (1996) Checking out the competition Be-yond Computing 5(2) 24-29
Nemeth C (1997) Managing innovation when less is more California Management Review 40(1) 59-74
Tor Guimaraes Marcelo Seido Nagano amp Curtis Armstrong
26 Fall 2015 (Volume 9 Issue 2)
Nemutanzhela P amp Iyamu T (2011) The impact of competitive intelligence on products and services in-novation in organizations International Journal of Advanced Computer Science and Applications 2(11) 38-44
Parry ME Song M De Weerd-Nederhof PC amp Viss-cher K (2009) The impact of NPD strategy product strategy and NPD processes on perceived cycle time Journal of Product Innovation Management 26 (6) 627-639
Pawar BS amp Eastman KK (1997) The nature and implications of contextual influences on transforma-tional leadership A conceptual examination Academy of Management Review 22 80-109
Pellissier R amp Nenzhelele TE (2013) Towards a univer-sal definition of competitive intelligence SA Journal of Information management 15(2) Art 559 7 pages httpdxdoiorg104102sajimv15i2559 Retrieved 31 March 15
Podsakoff PM MacKenzie SB Moorman RH amp Fetter R (1990) Transformational leader behaviors and their effects on followersrsquo trust in leader satisfac-tion and organizational citizenship behaviors Leader-ship Quarterly 1107-142
Roitner A (2008) Competitive intelligence in Austria An empirical study Masterrsquos dissertation University of Vienna
Sawka K A (1996) Demystifying business intelligence Management Review 85(10) 47-51
Segarra-Blasco A Garcia-Quevedo J amp Teruel-Carrizo-sa M (2008) Barriers to innovation and public policy in Catalonia The International Entrepreneurship and Management Journal 4(4) 431-451
Sharma A (1999) Central dilemmas of managing inno-vation in large firms California Management Review 3941(3) 46-164
Slack N Chambers S Johnston R and Betts A (2006) Operations and Process Management Princi-ples and Practice for Strategic Impact 2nd ed Prentice Hall Harlow
Stringer R (2000) How to manage radical innovation California Management Review 42(4) 70-88
Swartz N (2005) Competitive intelligence underuti-lized Information Management 39(3)
Tarraf P amp Molz R (2006) Competitive Intelligence at Small Enterprises SAM Advanced Management Journal l 71 (4) 24-34
Thamhain HJ (2003) Managing innovative RampD teams RampD Management 33(3) 297-311
Tidd J Bessant J amp Pavitt K (2008) Gestatildeo da inova-ccedilatildeo 3ed Satildeo Paulo Artmed
Trice HM amp Beyer JM (1993) The Cultures of Work Organizations Englewood Cliffs JN Prentice-Hall
Tushman M amp Anderson P (1997) Managing Strategic Innovation and Change Oxford University Press Ox-ford 3-23
Udo G amp Guimaraes N (1994) Empirically assessing factors related to DSS benefits European Journal of In-formation Systems 3(3) 218-227
Vedder RG amp Guynes CS (2002) CIOsrsquo Perspectives on competitive intelligence Information Systems Man-agement 19(4) 49-56
Waldman DA Ramirez GG House RJ amp Puranam P (2001) Does leadership matter CEO leadership at-tributes and profitability under conditions of perceived environmental uncertainty Academy of Management Journal 44(1) 134-143
Weiss A amp Naylor E (2010) Competitive intelli-gence How independent information professionals American Society for Information Science and Tech-nology 37(1) 30ndash34 httpdxdoiorg101002bult20101720370114
Westervelt R (1996) Gaining an edge Competitive in-telligence takes off Chemical Week 158(25) 29-31
Williams SD (2004) Personality attitude and leader influences on divergent thinking and creativity in or-ganizations European Journal of Innovation Manage-ment 7(3) 187-204
Yoon Y Guimaraes T amp Clevenson A (1995) Under-standing the factors important to expert systems suc-cess Technology Management 2(3) 1-14
Yoon Y Guimaraes T amp Clevenson A (1998) Explor-ing ES success factors for BPR Journal of Engineering and Technology Management 15 179-199
Yoon Y Guimaraes T amp OrsquoNeal Q (1995) Exploring the factors associated with expert systems success MIS Quarterly 19(1) 83-106
Yukl GA (1998) Leadership in Organizations (4th ed) Englewood Cliffs NJ Prentice-Hall
International Journal of the Academic Business World 27
INTRODUCTION
Nothing stays the same part of the human condition involves adjusting to change Yet human resistance to change is both intense and natural Perhaps examples of this resistance occur in employeesrsquo personal lives or arise as they approach new ideas or changes at work Through a myriad of changes characterized by global demands unpredictable environments the onset of technologi-cal advances and operational developments managing change and resistance has become a way of life for many organizations (Judge Thoresen Pucik amp Welbourne
1999) Organizations must depend on capable leader-ship to guide them through these unprecedented times The evolution of change requires employees at all levels to embrace new techniques of working by promoting dif-ferent mindsets (Kets de Vries Ramo amp Korotov 2009) Gondo Patterson and Palacios (2013) suggested that some organizations fail to adapt to change and prepare their leadership and employees for a more uncertain fu-ture Yet their study summarized that successful change involves support of formulated strategies and the facilita-tion of change recipients being mindful during change ef-forts In the face of intense global competition it is criti-
Acceptance of Change Exploring the Relationship among
Psychometric Constructs and Employee Resistance
Brian Dunican EdDWestern Kentucky University
1906 College Heights BoulevardBowling Green KY 42101
Ric Keaster PhD Western Kentucky University
1906 College Heights BoulevardBowling Green KY 42101
ABSTRACTChange is inevitable and can influence numerous events inside and outside an organization The contrasting at-titudes of acceptance and resistance to change are an increasingly interesting topic in todayrsquos global ever-changing and competitive environment Discovering the behavioral origins of employeesrsquo reactions to change is an integral part of understanding the way in which individual mindset may play a role in coping with organizational change and resistance This body of knowledge may give organizations insight for creating a competitive advantage over their counterparts
Conceivably it can be argued that some researchers view change as a process of gradual adaptation that is largely in-fluenced by people in organizations who react to internal and external pressures while others view it as an emergent event due to environmental selections (Demers 2007) Through both concepts successful navigation through change events relies on the manner in which humans respond to these occasions
The current study employed a descriptive non-experimental correlational design to examine individualsrsquo self-rating of their level of mindfulness tolerance of ambiguity and resistance to change in four industries located in Kentucky The quantitative study sought to identify the strengths of the relationship of the chosen variables using validated instruments ndash Langerrsquos (Pirson Langer Bodner amp Zilcha-Mano 2012) Langer Mindfulness Scale (LMS14) Bud-nerrsquos (1962) Tolerance of Ambiguity Scale (TOA) and Oregrsquos (2003) Resistance to Change Scale (RTC) Regression models were utilized to evaluate multivariate relationships among the variables Based on the findings in the current study the results indicated that no differences lie between group comparisons of organizational or demographic fac-tors when examining the relationship among the elements of mindfulness tolerance of ambiguity and resistance to change Bivariate correlations yielded both strong positive and negative relationships among the three scales assessed by salary (exempt and non-exempt) employees located across the different industries (p lt 01)
Brian Dunican amp Ric Keaster Acceptance of Change Exploring the Relationship among Psychometric Constructs and Employee Resistance
28 International Journal of the Academic Business World 29Fall 2015 (Volume 9 Issue 2)
cal for organizations to have the dexterity to accept new changes and adapt to survive (Gondo et al 2013 Jacobs 2005) Discovering the behavioral origins of employee re-actions to change is an integral part of understanding the recipe for flexibility longevity and organizational success Researchers have separately alluded to varying degrees of social psychological constructsmdashparticularly elements of mindfulness and tolerance of ambiguitymdashand their influ-ence on individualsrsquo attitudes toward change and resis-tance (Banning 2003 Langer 1993)
BACKGROUND
By its nature change in organizations is inherently stress-ful causing increased anxiety among employees at each level of the organization This environment of uncertain-ty can threaten the balance of control often distracting organizations from obtaining the stability needed to sur-vive and adapt to change Researchers have analyzed sev-eral techniques for strengthening the idea of overcoming uncertainty Carson and Langer (2006) stated ldquoActively thinking about paradoxes increase onersquos ability to toler-ate ambiguity and decreases the anxiety associated with uncertainty In a separate study Weinstein Brown and Ryan (2009) contended that increased mindfulness in individuals promoted greater attention and awareness in situations (organizational change for example) perceived as stressful or threatening
Leaders throughout organizations must possess the skills and cognitive experience to manage varying degrees of uncertainty and balance the levels of tolerance within their organizations (Lane amp Klenke 2004) This notion is reinforced by Topping (2002) in that change implies uncertainty and uncertainty can drive individuals to feel afraid uncomfortable threatened anxious and as a result resistant to change On the contrary acknowl-edging uncertainty can lead to the exploration for clarity and challenges of the status quo (Geller 2002) A rapidly growing amount of literature is available on mindfulness which insinuates how this construct could aid in navigat-ing through areas of uncertainty (Brown amp Ryan 2004 Lane amp Klenke 2004 Langer 1993 Weinstein et al 2009) Brown and Ryanrsquos (2004) multifaceted definition of mindfulness recognized it as ldquoa phenomenon with functional import for outcomes as diverse as physical health psychological well-being work and sports perfor-mance and relationshipsrdquo (p 242)
The process of conforming to change or an innovation may seem difficult for individuals within organizations yet examples exist in which individuals adapt very easily and seem to flourish within this environment Judge et al (1999) explained that organizational change has been predominately conducted at a middle range or macro
level rather than at the micro individual level Changes in organizations are not always clear even for the leaders Through the vagueness of change innovative organiza-tions deliberately take actions to avoid misinterpretations and to improve the process (Limerick Passfield amp Cun-nington 1994) ldquoAs organizational structures become less hierarchical and more fluid and amorphous tolerance for ambiguity and uncertainty is likely to emerge as a quality that differentiates effective from ineffective leadersrdquo ac-cording to Lane and Klenke (as cited in Ehrlich Meindl amp Viellieu 1990 p 69) As organizations are naturally subject to uncertainties the concept of increasing employ-eesrsquo abilities to deal with ambiguous situations may lead to more success or important gains in knowledge about organizations
Resistance to Change
The literature presents an enduring consensus on the premise that it is human nature to resist change and ele-ments related to the process of change (Coch amp French 1948 Conner 1992 Oreg 2003 OrsquoToole 1995 Zander 1950) This notion of natural resistance is supported by Kotter (1995) as he described change as the force of shift-ing conditions within the human communities Contest-ed by Dent and Goldberg (1999) the phrase resistance to change should be reevaluated under a more conventional definition Although the researchers supported the belief that resistance is natural their views have challenged the idea of the way in which individuals resist change Blindly supporting the belief that one can resist change may be counterproductive and may direct the focus of organiza-tions away from the actual issues The idea of contradict-ing this belief opens the possibilities that inefficiencies in the process of change and its impact on individuals should be acknowledged and explored (Mabin Forgeson amp Green 2001) As a whole regardless of the process resistance to change is driven at the individual level and is leveraged by organizations to foster change (Conner 1992 Judson 1991)
Employees of organizations may withdraw from the fear of ideas they do not fully understand or act rebellious to-ward seemingly unclear decisions made by management without proper cause Ideally change within organiza-tions should be straightforward clear and concise prior to implementation More often this is not the case for individuals who implement the groundwork or for those who are being impacted by the change (Judson 1991) Al-ternately studies have demonstrated that some employees with a higher tolerance of ambiguity are more susceptible to change and may even thrive within this environment (Oreg 2003) As a whole organizations have struggled with implementing new ideas changing their culture and
reacting to market demands nevertheless many are will-ing to change to remain competitive
Dent and Goldberg (1999) found that at the individual level resistance to change can arise from those whose jobs are directly impacted and can cause a rippling effect through the organization Fundamentally individuals are creatures of habit and are annoyed by pressures in organi-zations that force employees to choose a different behavior or accept a reward system that may not seem beneficial However they are willing to change their behaviors when their beliefs of the benefits of the change outweigh the benefits in their current environment (Armenakis amp Be-deian 1999) In other words attitude toward the change affects onersquos willingness to consider and even implement the change
ATTITUDES AND CHANGE
Some change efforts within organizations are successful some are not Kotter (1995) monitored approximately 100 companies over a decade to observe the fundamental changes made in fluctuating business environments The research included examples of successes examples of fail-ures and illustrations of companies that remained stag-nant as they suffered through misguided steps Outlined by Kotter (1995) successful changes within companies encompassed eight steps (a) creating a sense of urgency (b) forming a guiding coalition (c) creating a compel-ling vision (d) communicating the vision for buy-in (e) empowering and acting on the vision (f) creating quick wins (g) increasing credibility through small wins and (h) linking success to new approaches In an earlier ap-proach Judson (1991) proposed five steps to enhance the process of change by engaging employeesrsquo active participa-tion through (a) analyzing and planning the change (b) communicating the plan for change (c) gaining buy-in and acceptance (d) changing the status quo to the desired state and (e) institutionalizing the new state of change Through these steps the common link described for suc-cessful changes involved employeesrsquo comprehension of the change and their personal adaptation to the new way of thinking and working
Iverson (1996) supported the concept that organizational change could be easier when employees have higher per-sonal commitments through healthy professional rela-tionships positive employee morale job satisfaction and positive recognition Moreover employees who have a sol-id desire to perform well and are willing to embrace new challenges even in the absence of clarity also understand the importance of change within organizations Further-more Gaumlrtner (2013) reinforced the concept that employ-eesrsquo attitudes and perceived flexibility toward change were influenced through a subset of mindfulness Although it
is not a new term mindfulness supports the concepts at-tributed to attention awareness engagement and being comfortable with new ideas that may impact areas within an individualrsquos control (Langer 1993)
The Problem Defined
With the continuous expansion of globalization and the rising unpredictability of consumer demands economic pressures and technological advancements organiza-tions have been required to change to remain competi-tive Change is inevitable The organizations that master agility and are adaptive to the ever-changing environment will possess the recipe to emerge triumphant over their competitors In reality every organization must change yet the process is not always smooth or effective Hypo-thetically within the organizational structure there are individuals who visualize the change others who develop and organize the change and those who implement and perform the change (Isabella 1990) At times roles of in-dividuals may overlap due to the size of the organization and the responsibilities entailed within each role Directly or indirectly everyone throughout the organization is im-pacted by the change perhaps some individuals are able to cope with change better than others A study of the relat-ed factors of mindfulness and tolerance of ambiguity may lead to insights about individualsrsquo resistance to change
Defining the Problem of Resistance
Resistance to change refers to adverse human forces that impact the processes of change Kotter (1995) empha-sized that organizational resistance is often helped along through the mismanagement of change and by ignoring its impact on the processes Maurer (2009) suggested that resistance will happen often due to failures from previ-ous change implementations Lewin (1947) one of the most influential early researchers of change realized that change was not an event but rather a living process He conceptualized the process of change through a model composed of three steps unfreezing change and refreez-ing His initial step introduces the idea of resistance in-dividuals must give up something before accepting some-thing new Though simple his ideas have been expanded upon by numerous researchers and have been developed into various theories of change Zander a close colleague of Lewin defined resistance to change as ldquobehavior which is intended to protect an individual from the effects of real or imagined changerdquo (as cited by Dent amp Goldberg 1999 p 34)
Mabin et al (2001) found that seemingly rebellious em-ployees manifest their fears of change due to uncertainty In addition perceived resistance may be disguised through
Brian Dunican amp Ric Keaster Acceptance of Change Exploring the Relationship among Psychometric Constructs and Employee Resistance
30 International Journal of the Academic Business World 31Fall 2015 (Volume 9 Issue 2)
the camouflage of untimely surprises past resentment ad-ditional job duties or the exposure of personal vulnera-bilities In isolated cases changes within the organization may cause a true threat to safety quality cost or the com-panyrsquos reputation Ignoring the symptoms of resistance within the change process could have disastrous results Judson (1991) agreed that resistance to change is not the fundamental problem but a symptom hiding basic under-lying circumstances He also developed a continuum of reactions to change ranging from indifference (no resis-tance) to active even aggressive resistance
Research has validated the importance of evaluating the reactions and the attitudes of individuals toward organi-zational change and their desire to succeed (Judge et al 1999 Oreg 2006) Developed and validated by Oreg (2003) the Resistance to Change scale has been widely used and accepted by academic works to measure an indi-vidualrsquos disposition toward resistance to change Further-more Oreg outlined four subscales as an exploratory anal-ysis to categorize an individualrsquos reaction to resist change (a) routine seeking (b) emotional reaction to impose change (c) cognitive rigidity and (d) short-term focus Supportive research (cited in Oreg 2003) has found the factors of openness to change tolerance of ambiguity and risk aversion as predictors for managers coping with the stress of change within their organizations An exhaustive amount of research has been conducted on the broad topic of resistance to change yet little is known on the relation-ship of how the psychological constructs of mindfulness and tolerance of ambiguity influence resistance to change within organizations Early researchers such as Coch and French (1948) viewed resistance to change as an obstacle of contention during the process of changes within organiza-tions One of their studies conducted in a sewing factory revealed that employees retaliated against change through acts of aggression controlling restrictions of throughput high turnover rates increased complaints and reports of dissatisfaction with management In line with earlier studies the use of the term resistance to change gained popularity beginning in the 1950s following Lewinrsquos (1947 1951) works related to field theory and social sci-ences Resistance to change is commonly accredited to the unfreezing stage of Lewinrsquos (1951) change model (Ar-menakis amp Bedeian 1999) Naturally portrayed as a nega-tive barrier to change resistance to change is frequently defined using Lewinrsquos physical science-related terminol-ogy as a restraining force to maintain the current state of equilibrium (Dent amp Goldberg 1999) Since that time resistance to change has been widely acknowledged and associated with the process of change organizational de-velopment and change theories and models Other schol-ars have conceptualized resistance to change as an emo-tional reaction rather than a behavioral response As an
example Argyris and Schon (1978) suggested resistance in terms of defensive routines and frustration during the process of change Kanter (1985) supported this notion describing feelings of uncertainty and loss of control for individuals facing change In other terms of defining re-sistance Lawrence (1954) used an analogy to compare re-sistance to change as pain within the human body that is used as a signal to communicate that something is wrong ldquoThe resistance like the pain does not tell what is wrong but only that something is wrong And it makes no more sense to try to overcome such resistance than it does to take a pain killer without diagnosing the bodily ailmentrdquo (p 56) This analogy highlighted the parallels between re-sistance and overcoming it through a practicable solution
Mindfulness
Mindfulness is a concept in educational psychology that has been primarily defined by Dr Ellen Langer a so-cial psychology professor at Harvard University Langer (1993) defined mindfulness as ldquoan open creative proba-bilistic state of mind in which the individual might be led to finding differences among things thought similar and similarities among things thought differentrdquo (p 44) Langer (1997) further explained three characteristics of mindfulness ldquo(a) continuous creation of new categories (b) openness to new information and (c) having an im-plicit awareness of more than one perspectiverdquo (p 4) The Mindfulness Scale validated by Pirson et al (2012) oper-ationalizes the construct and identifies the four subscales of novelty-seeking engagement novelty-producing and flexibility to explain the broad psychometric construct Brown and Ryan (2003) defined mindfulness as ldquoa quali-ty of consciousness that is characterized by clarity and viv-idness of current experience and thus stands in contrast to the mindlessrdquo (p 823) Different from Langerrsquos definition that evaluates dispositional differences in reflective con-sciousness behavioral routines over time Ryan and Brown focused on the presence or absence of attention to and the awareness of events occurring in the present moment For the purpose of the current study the ideas of mindfulness were presented through the literature of Langer Further-more mindfulness is believed to play an important role in disengaging individuals from automatic thoughts habits and unhealthy behavior patterns and may contribute to well-being and happiness in a direct way (Brown amp Ryan 2003)
Tolerance of Ambiguity
Tolerance of ambiguity describes an individualrsquos behavior in unclear or insecure situations and how one reacts to the lack of clarity or uncertainty (Banning 2003) Devel-oped by Frenkel-Brunswik (1948) tolerance of ambigu-
ity has gained attention from researchers over the past 60 years Frenkel-Brunswik was one of the first to present a comprehensive analysis of ambiguity and was influenced by earlier works of Germany psychologist Erich Jaensch Frenkel-Brunswik described tolerance of ambiguity as an ldquoemotional and perceptual personality variablerdquo (cited in Furnham amp Ribchester 1995 p 180)
Budner (1962) later defined tolerance for ambiguity as ldquothe tendency to perceive ambiguous situations as desir-ablerdquo and intolerance for ambiguity as ldquothe tendency to perceive ambiguous situations as sources of threatrdquo (p 29) Budner developed the Tolerance of Ambiguity Scale to further interpret the complex concept of ambiguity and individualsrsquo responses to it Through the development of the Tolerance of Ambiguity Scale three subscales (ie novelty complexity insolubility) emerged to provide in-sight into the more abstract larger construct A decade later Norton (1975) defined tolerance of ambiguity as the degree to which an individual is cognitively willing to tolerate uncertainty vagueness or nebulous information and is able to act upon the knowledge
Employees resist change at all levels of the organization Although some individuals openly accept change many do not Determining the varying degrees of each psycho-metric construct on resistance along with their combi-nation toward resistance to change may reveal common areas of opportunity related to organizational change The following general research question is offered How are the psychometric constructs of mindfulness and toler-ance for ambiguity related to resistance to change within organizations
Empirical Studies and Questions
Numerous studies have alluded to resistance to change some have focused on the individuals (eg Bovey amp Hede 2001 Coghlan 1993 Ford Ford amp McNamara 2002) while others have explored organizations (eg Arm-bruster Bikfalvi Kinkel amp Lay 2008 Coch amp French 1948 Greenwood amp Hinings 1996 Lawrence 1954 Stanley Meyer amp Topolnytsky 2005) Van Dam Oreg and Schyns (2008) stated ldquoA review of the past empirical research reveals that resistance to change has been concep-tualized in three ways as a cognitive state as an emotion as a behavioral intentionrdquo (p 316) As an emotion some studies have revealed that employees who display nega-tive perceptions toward organizational change may have an overall negative outlook on change thus perpetuat-ing resistance (Armenakis Harris amp Mossholder 1993 Stanley et al 2005) Extreme measures of resistance to organizational change have been displayed in other stud-ies through sabotage slowdowns and strikes (Armenakis et al 1993) Universally resistance to change has been
recognized to have a significant impact on the outcomes of organizational change yet individuals within the or-ganization are perceived to be the major blockage or im-pediment (Mabin et al 2001) Based on the literature concerning the analysis of change empirical studies have identified a wide range of factorsmdashnamely organization-al managerial behavioral and individualmdashthat promote or impede resistance in organizations
Organizations are faced with the challenges of changing and responding to current and future trends at an un-precedented rate in todayrsquos global environment (Burke 2014) Twenty-five years ago Offermann and Gowing (1990) found that American organizations alone had spent over a record 210 billion dollars to prepare leaders to thrive in organizational change In addition to money an immeasurable amount of time and energy have been dedicated to nurturing leadership and key individuals to navigate others through this complex but important pro-cess Nonetheless the blueprint is far from perfect The readiness of individuals within the organization to plan and implement proactive measures may determine the or-ganizationrsquos competitiveness The current study examines the factors of mindfulness and tolerance of ambiguity and how they relate to individualsrsquo perceptions of resistance to change The specific research questions are the following
1 How do demographic factors of the respondents and the organizational factors under which they work relate to the psychometric scales of Mind-fulness and Tolerance of Ambiguity and their influence on Resistance to Change
2 After controlling for demographic factors how does psychometric mindset (Sub-constructs of Mindfulness and Tolerance of Ambiguity) influence individual Resistance to Change (a) Routine seeking (b) Emotional reaction (c) Short-term focus (d) Cognitive rigidity
3 What is the degree of relationship among these measures of Mindfulness and Tolerance of Am-biguity
4 The following model characterizes the current study
Highlights of the Methodology
When considering the measurement of the perceptions of resistance to change within organizations various meth-ods have been utilized to illustrate relationships among different constructs (Oreg 2003 Oreg Vakola amp Ar-menakis 2011) In the current quantitative non-exper-
Brian Dunican amp Ric Keaster Acceptance of Change Exploring the Relationship among Psychometric Constructs and Employee Resistance
32 International Journal of the Academic Business World 33Fall 2015 (Volume 9 Issue 2)
imental study data were collected from three validated instruments ndash Langerrsquos (Bodner amp Langer 2001) Langer Mindfulness Scale (LMS) Budnerrsquos (1962) Tolerance of Ambiguity Scale (TOA) and Oregrsquos (2003) Resistance to Change (RTC) scale Regression models were used to assess the univariate relationships among the constructs Additionally descriptive statistics were used to include the mean median mode standard deviation and other selected variables A multiple linear regression analysis determined the relationship between factors of mindful-ness and tolerance of ambiguity and their influence of resistance to change Bivariate correlations were used to compute the psychometric scores from each instrument and resistance to change ratings to test the significance of the relationships between each subscale Overall statisti-cal analyses were conducted in multiple phases to investi-
gate the relationship between the individual psychomet-ric traits and resistance for salary exempt and non-exempt employees in industrial sites located in Kentucky
Participants in the Study
The population represented a microcosm of several indus-tries in the manufacturing sector within the proximity of Warren County The data collected were based on a con-venient sample A total of 65 participants volunteered to complete an electronic survey that was designed to capture complete responses to a total of 48 questions Participants were not allowed to proceed to the next page of the survey unless all questions on the current page were completed Three participants did not complete the survey and their responses were not included in the end results From the
population of 183 salaried (exempt and nonexempt) em-ployees 65 surveys were officially returned constituting a response rate of 36 Managerial-type jobs dominated 36 of the sample population followed by roles in tech-nical support which reflected 169 Six categories of job types and an ldquoOtherrdquo category were used for the respon-dents
Scoring Method for Each Scale
Resistance to Change Scale
Oregrsquos (2003) Resistance to Change Scale is comprised of 17 items with four subscales ndash routine seeking emo-tional reaction short-term focus and cognitive rigidity Each subscale relates to the extent to which individuals seek routines react to emotions during change encom-pass short-term focus during change and the frequency to which individuals change their minds The overall range of the scale including the subscales is scored between 1 and 6 with 1 representing the least level of resistance In-dividuals scoring higher on the overall scale or subscales indicate a higher resistance to change
Langer Mindfulness Scale
The Langer Mindfulness Scale (Pirson et al 2012) con-tains 14 items and is composed of three subscales ndash novelty seeking engagement and novelty producing The 7-point scale is scored such that higher scores indicate a greater level of awareness toward thinking High scores for novel-ty producing insinuate one would perceive new situations as opportunities to learn new information Individuals with high scores for engagement are more susceptible to noticing details within their environment as opposed to others Higher novelty producing scores indicate that individuals are likely more creative and predisposed to generating new ideas when faced with new information
Tolerance of Ambiguity Scale
Budnerrsquos (1962) Tolerance of Ambiguity Scale is a 16-item scale with ratings ranging from 1 to 7 1 represents strong disagreement indicating a greater tolerance for ambiguity It is important to note that higher scores relate to greater intolerances for ambiguity All results were re-ported at the aggregate level
RESULTS
Statistical data analyses were performed on survey data comprised of the following three instruments Langer Mindfulness Scale (LMS14) Tolerance of Ambigu-
ity Scale (TOA) and Resistance to Change (RTC) scale Findings were reported from the analyses of data col-lected from 65 participants responding to the Qualtrics Web-based survey In particular analyses were conducted through bi-variant correlation analyses (also known as Pearsonrsquos r) independent t-tests and Cronbachrsquos alpha The strengths of the relationships were predicated on Co-henrsquos (1988) interpretation Coefficient values between 10 and 29 were considered small or weak those between 30 and 49 were considered moderate and those between 50 and 10 were considered large or strong
Analysis of Each Research Question
The first research question explored the relationship of de-mographic and organizational factors to the psychomet-ric scales of Mindfulness and Tolerance of Ambiguity and their influence on Resistance to Change Descriptive sta-tistics reflected both demographic and organizational fac-tors ndash gender education years at the company and direct reportsmdashfor the 65 employees who participated in the current study The distributions of variables were distrib-uted evenly between only two variables years at the com-pany and direct reports Other demographic variables including ethnicity and age were recorded A statistical analysis was not conducted due to the uneven distribution of the variables Of the 65 participants 59 were Caucasian and the remaining 6 were minorities The ages of the par-ticipants ranged from 28 years to 65 years Additionally frequency distributions and data analyses were not con-ducted for individual sites to protect anonymity All re-sults were reported at the aggregate level and included the following categories for the participating industries Cup Manufacturing Personal Care Manufacturing Con-struction and Rubber to Metal Bonding Manufacturing
Gender Male and Female
Although more than twice as many males than females participated in the current study independent t-tests were conducted to determine whether differences existed be-tween the mean scores of the scales and subscales for male and female employees No statistically significant differ-ences were found between the outcome of the psychomet-ric constructs (Mindfulness and Tolerance of Ambiguity) and Resistance to Change except on one subscale Cogni-tive rigidity revealed a statistical difference between the scores of males (n = 45 M = 381 SD = 063) and females (n = 20 M = 336 SD = 086) t (63) = 234 p = 05 α = 05
Figure 1 Logic model for hypothesized relationships among
Psychometric Constructs Demographic Controls and Degree of Resistance to Change
INDEPENDENT VARIABLES
Degree of Resistance
Demographic Factors
-----
Age Gender
Ethnicity Education
____________
Organizational Factors
----- Years at Current Company Type of Current Position
Type of Industry or Category Number of Direct Reports
Resistance to Change -----
Routine Seeking Emotional Reaction Short-term Focus
Cognitive Rigidity
Tolerance of Ambiguity
----- Novelty
Complexity Insolubility
Mindfulness -----
Novelty Seeking Engagement
Novelty Producing
Brian Dunican amp Ric Keaster Acceptance of Change Exploring the Relationship among Psychometric Constructs and Employee Resistance
34 International Journal of the Academic Business World 35Fall 2015 (Volume 9 Issue 2)
Education
Due to the imbalanced distributions of participants sta-tistical analysis for Education was not performed The frequency distribution reflected that 5231 (34) of the participants possessed a four-year degree 1231 (8) ob-tained a masterrsquos degree or higher 2615 (17) possessed a two-year degree or some college while the reaming 923 (6) were high school graduates
Direct Reports and No Direct Reports
An individual variances t-test was conducted and failed to reveal a statistically reliable difference between the mean scores of salaried employees without direct reports and salaried employees with direct reports As an example scores from routine seeking a subscale of resistance to change were not significantly different between employ-ees without direct reports (n = 32 M = 312 SD = 096) and employees with direct reports (n = 33 M = 291 SD = 085) t (65) = 093 p = 037
Years at the Company
A one-way analysis of variance (ANOVA) was calculated on participantsrsquo ratings of the psychometric constructs and resistance to change as a comparison to the number of years at the company Comparisons indicated no sta-tistically significant differences were presented between groups of 0 to 4 years 5 to 10 years 11 to 20 years and 21 years and greater As an example on novelty-seeking a subscale of the Langer Mindfulness Scale the analysis was not significant between the four groups F(3 61) = 31 p = 82
The second research question used bivariate correlations to determine the strength of the relationships between the psychometric constructs (Mindfulness and Tolerance of Ambiguity) and Resistance to Change including the four subscales All of the Pearson correlations were significant across each of the findings with the exception of the LMS scale and Cognitive Rigidity of Resistance to Change subscale r(65) = -225 p = 072 The overall LMS scales reflected a strong negative relationship r(65) = -530 p lt 001 with the RTC scale The TOA scale revealed a mod-
Table 1 Descriptive Statistics and Correlations among Responses of Tolerance of
Ambiguity Scale Langer Mindfulness Scale and Subscales and Resistance to Change and Subscales
Scales LMS_NS LMS_NP LMS_E TOA_ Tot RTC_RS RTC_ER RTC_STF RTC_CR
LMS_NS (77)
LMS_NP 76 (72)
LMS_E 49 51 (69)
TOA_Tot -48 -53 -32 (72)
RTC_RS -51 -50 -41 65 (85)
RTC_ER -36 -37 -36 41 71 (88)
RTC_STF -53 -47 -38 60 77 80 (90)
RTC_CR -28 -26 -04 44 51 45 41 (86)
of Items 5 5 4 16 5 4 4 4
Mean 598 504 556 376 342 285 367 322
SD 071 94 102 71 110 104 73 81Note N = 65 Cronbachrsquos alpha reliabilities for each dimensionconstruct are listed in parentheses on diagonal Cronbachrsquos Alpha measures indicated a high internal consistency among the items reflected in each scale p lt 05 level (two-tailed) p lt 01 level (two-tailed)
Table 2 Descriptive Statistics and Correlations among Responses of the Total Tolerance of
Ambiguity Scale Langer Mindfulness Scale and Resistance to ChangeLMS_Tot Mean TOA_Tot Mean RTC_Tot Mean
LMS_MeanTotal (86)
TOA_Meantotal -53 (72)
RTC_Meantotal -53 62 (93)Number of items 14 16 17Mean 552 376 301Standard Deviation 75 71 91Note N = 65 Cronbachrsquos alpha reliabilities for each dimensionconstruct are listed in parentheses on diagonal No subscales for Tolerance of Ambiguity were referenced in research Cronbachrsquos Alpha measures indicated a high internal consistency among the items reflected in each scale p lt 05 level (two-tailed) p lt 01 level (two-tailed)
Table 3 Descriptive Statistics and Correlations among Responses Related to Operational and
Demographic Factors Tolerance of Ambiguity Scale Langer Mindfulness Scale and Sub-scales and Resistance to Change and Subscales
ME
AN
SD AG
E
YR
SWR
K
DR
RPT
S
TO
A_M
LMS_
M
LMS_
NS
LMS_
NP
LMS_
E
RT
C_M
RT
C_R
S
RT
C_E
R
RT
C_S
TF
RT
C_C
R
AGE 4571 782 100YRSWRK 1283 943 52 100DRRPTS 1005 2162 -18 01 100TOA_M 376 71 15 11 -02 100LMS_M 552 75 -07 -07 10 -53 100LMS_NS 598 71 -12 -12 04 -48 87 100LMS_NP 504 94 -05 01 18 -53 90 76 100LMS_E 556 102 -01 -10 01 -32 78 49 51 100RTC_M 322 81 -14 -10 -08 62 -53 -51 -48 -37 100RTC_RS 301 91 -13 -07 -04 65 -55 -51 -50 -41 90 100RTC_ER 342 110 -23 -17 -07 41 -43 -36 -37 -36 90 71 100RTC_STF 285 104 -05 00 -06 60 -54 -53 -47 -38 91 77 80 100RTC_CR 367 73 -07 -08 -14 44 -23 -28 -26 -04 65 51 45 41 100
Note N = 65 The correlation coefficient ranges from -1 to +1 with -1 indicating a perfect negative correlation +1 indicating a perfect positive correlation and 0 indicating no correlation
Brian Dunican amp Ric Keaster Acceptance of Change Exploring the Relationship among Psychometric Constructs and Employee Resistance
36 International Journal of the Academic Business World 37Fall 2015 (Volume 9 Issue 2)
erate positive correlation r(65) = 624 p lt001 Further bivariate analyses for LMS explored the strength of the re-lationships between the subscales of the Langer Mindful-ness Scale and the subscales of the Resistance to Change scales The correlational analysis was statistically signifi-cant between all variables except Engagement of the LMS and Cognitive Rigidity of RTC r(63) = -35 p = 781 concluding that the variables were unrelated
The last research question explored the degree of the re-lationship between Mindfulness and Tolerance of Am-biguity Bivariate analyses were used to correlate the re-lationship between the two psychometric constructs The correlations revealed a significantly strong negative rela-tionship between the total mean score of the LMS and the total mean score of the TOA r(63) = -53 p lt 01 The mean scores for each of the LMS subscales compared to the total mean of the TOA showed the following Nov-elty-seeking and TOA r(63) = -48 p lt 01 Novelty-pro-ducing and TOA r(63) = -53 p lt 01 and Engagement and TOA r(63) = -32 p lt 01 It is important to note that higher scores on the Tolerance of Ambiguity scale indicate a greater intolerance of ambiguity Tables 1 and 2 display a descriptive analysis and correlations for each of the scales and subscales The correlations between vari-ables are presented in Table 3
LIMITATIONS OF THE STUDY
Research inherently contains limitations The current study is no exception First the nature of measuring psy-chometrics is subjective Since psychometrics studies mea-sure the way in which individuals think and act (Norton 1975) influences of the organizationrsquos environment could affect individualsrsquo responses to questions Additionally external variables at the time of data collection not related to the study itself can skew the responses and influence the outcomes Other views of limitation rest on the gen-eralizability of the results which may be limited for the following reasons (a) the unit of analysis is at the indi-vidual level (b) data were collected from a limited num-ber of operations within the state of Kentucky through convenience sampling and (c) individual biases that may be introduced at the time of testing
The unit of analysis for data collection rests at the indi-vidual level rather than the group level due to the acces-sibility of the employees Although the survey collection method allows for comparison with larger groups it lim-its the opportunity to explore issues in depth therefore assumptions are made for individuals in similar groups Next the data collected represents limited industries in the state of Kentucky restricting the number of partici-pants and the ability to generalize outcomes to other in-dustries different than those outlined in the current study
Last respondentsrsquo values interests and beliefs regarding the online self-administered surveys may introduce biases unknown by the researcher As a consequence of these limitations and the collection of data during one point in time the results are generalizable only to the groups or populations that are similar to those in the current study
SUMMARY AND CONCLUSION
Change within organizations is inevitable That real-ity will remain constant in organizationsmdashand in onersquos personal and professional life (Conner 1992) The way in which one chooses to cope with change could be a decid-ing factor of success failure or choosing to remain the samemdashwhich in organizations tends to equate with fail-ure particularly if change means simply improving Resis-tance is a natural reaction to change and is part of the hu-man psyche Research and literature support this notion of human nature to resist change and elements related to the process of change (Coch amp French 1948 Conner 1992 Oreg 2003 OrsquoToole 1995 Zander 1950) It is possible that a greater understanding of mindfulness and tolerance of ambiguity could increase the possibilities of new ideas to drive lower resistance to change The current study explored the two psychometric constructs of mind-fulness and tolerance of ambiguity and their relationship to resistance to change within industrial settings Bivari-ate correlations yielded both strong positive and negative correlations among the three scales assessed by salaried employees located across different industries The Langer Mindfulness Scale Budnerrsquos Tolerance of Ambiguity Scale and Oregrsquos Resistance to Change scale were attrib-uted to the foundation of the current study The results contributed to the practical and theoretical significance of individualsrsquo responses to change through the measure-ment of the aforementioned constructs To the extent the findings in the current research could be extrapolated to other industries or organizations a final suggestion should be noted When considering future directions for research related to probing psychometric constructs and resistance to change the current study may have relevance across different nationalities and cultures The elements of change will continue to challenge the fabric of organiza-tions while the internal and external pressures of rising costs variations in supply and demand relentless compe-tition and developing technology test the resolve for sur-vival The readiness of individuals within organizations and their ability to challenge perceptions of change and resistance may determine their competitiveness and ulti-mately their success
REFERENCES
Argyris C amp Schon D (1978) Organizational learning A theory of action research Reading MA Addison-Wesley
Armbruster H Bikfalvi A Kinkel S amp Lay G (2008) Organizational innovation The challenge of measur-ing non-technical innovation in large-scale surveys Technovation 28(10) 644-657
Armenakis A A amp Bedeian A G (1999) Organiza-tional change A review of theory and research in the 1990s Journal of Management 25 293-315
Armenakis A A Harris S G amp Mossholder K W (1993) Creating readiness for organizational-change Human Relations 46(6) 681-703
Banning K C (2003) The effect of the case method on tolerance for ambiguity Journal of Management Edu-cation 27 556-567
Bodner T E amp Langer E J (2001 June) Individual differences in mindfulness The MindfulnessMind-lessness Scale Poster presented at the 13th annual American Psychological Society Conference Toronto Ontario Canada
Bovey W H amp Hede A (2001) Resistance to organisa-tional change The role of defence mechanisms Journal of Managerial Psychology 16(7) 534-548
Brown K W amp Ryan R M (2003) The benefits of be-ing present Mindfulness and its role in psychological well-being Journal of Personality and Social Psychol-ogy 84 822-848 doi1010370022-3514844822
Brown K W amp Ryan R M (2004) Perils and promise in defining and measuring mindfulness Observations from experience Clinical Psychology Science and Practice 11(3) 242-248 doi101093clipsybph078
Budner S (1962) Intolerance of ambiguity as a personal-ity variable Journal of Personality 30 29-59
Burke W W (2014) Organizational change theory and practice Thousand Oaks CA Sage Publications Inc
Carson S H amp Langer E J (2006) Mindfulness and self-acceptance Journal of Rational-emotive and Cog-nitive-behavior Therapy 24(1) 29-43
Coch L amp French J (1948) Overcoming resistance to change Human Relations 1 512-532
Coghlan D (1993) A person-centred approach to deal-ing with resistance to change Leadership amp Organi-zation Development Journal 14(4) 10-14
Cohen J (1988) Statistical power analysis for the behav-ioral sciences Hillsdale NJ Lawrence Erlbaum Associates
Conner D R (1992) Managing at the speed of change How resilient managers succeed and prosper where others fail New York Random House
Demers C (2007) Organizational change theories Thousand Oaks CA Sage Publications Inc
Dent E B amp Goldberg S G (1999) Resistance to change A limiting perspective Journal of
Ehrlich S B Meindl J R amp Viellieu B (1990) The charismatic appeal of a transformational leader An empirical case study of a small high-technology con-tractor The Leadership Quarterly 1(4) 229-247
Ford J D Ford L W amp McNamara R T (2002) Re-sistance and the background conversations of change Journal of Organizational Change Management 15(2) 105-121
Frenkel-Brunswik E (1948) Tolerance toward ambigu-ity as a personality variable American Psychologist 3 268-269
Furnham A amp Ribchester T (1995) Tolerance of am-biguity A review of the concept its measurement and applications Current Psychology 14 179-199
Gaumlrtner C (2013) Enhancing readiness for change by enhancing mindfulness Journal of Change Manage-ment 13 52-68
Geller E S (2002) Leadership to overcome resistance to change It takes more than consequence control Jour-nal of Organizational Behavior Management 22(3) 29-49
Gondo M Patterson K W amp Palacios S (2013) Mind-fulness and the development of a readiness for change Journal of Change Management 13(1) 36-51
Greenwood R amp Hinings C R (1996) Understanding radical organizational change Bringing together the old and the new institutionalism Academy of Manage-ment Review 21 1022-1054
Isabella L (1990) Evolving interpretations as a change unfolds How managers construe key organization-al events Academy of Management Journal 33 7-41
Iverson R D (1996) Employee acceptance of organiza-tional change The role of organizational commitment International Journal of Human Resource Manage-ment 7 122-149
Jacobs P (2005) Five steps to thriving in times of un-certainty Harvard Management Update 10(12) 3-5
Brian Dunican amp Ric Keaster
38 Fall 2015 (Volume 9 Issue 2)
Retrieved from httphbrorgproductfive-steps-to-thriving-in-times-of-uncertaintyanU0512A-PDF-ENG
Judge T A Thoresen C J Pucik V amp Welbourne T M (1999) Managerial coping with organization-al change A dispositional perspective Journal of Ap-plied Psychology 84 107-122
Judson A (1991) Changing behavior in organizations Minimizing resistance to change Cambridge MA Basil Blackwell
Kanter R M (1985) Supporting innovation and ven-ture development in established companies Journal of Business Venturing 1 47-60
Kets de Vries M F R Ramo L amp Korotov K (2009) Organizational culture leadership change and stress INSEAD Working Papers Collection 10 2-26 Re-trieved from httpwwwinseadedufacultyresearchresearchdoccfmdid=41924
Kotter J P (1995) Leading change Why transformation efforts fail Harvard Business Review 73(2) 59-67
Lane M S amp Klenke K (2004) The ambiguity toler-ance interface A modified social cognitive model for leading under uncertainty Journal of Leadership amp Organizational Studies 10(3) 69-81
Langer E J (1993) A mindful education Educational Psychologist 28 43-50
Langer E J (1997) The power of mindful learning Read-ing MA Addison-Wesley
Lawrence P R (1954) How to deal with resistance to change Harvard Business Review 32(3) 49-57 Retrieved from httpedsaebscohostcomlib-srvwkueduehostpdfviewerpdfviewervid=6ampsid =699bab3d-bcec-40d9-ac69-a42c853d72bc40sessionmgr4004amphid=4108
Lewin K (1947) Frontiers in group dynamics II Chan-nels of group life social planning and action research Human Relations 1(2) 143-153
Lewin K (1951) Field theory in social science Selected theoretical papers New York Harper amp Row
Limerick D Passfield R amp Cunnington B (1994) Transformational change Towards an action learning organization The Learning Organization 1(2) 29-40
Mabin V J Forgeson S amp Green L (2001) Harness-ing resistance Using the theory of constraints to assist change management Journal of European Industrial Training 25(234) 168-191
Maurer R (2009) Introduction to change without mi-graines Omaha NE Maurer and Associates Re-trieved from httpextensionmissouriedustaffsde-teams DocumentsChangeW-outMigrarainespdf
Norton R W (1975) Measurement of ambiguity toler-ance Journal of Personality Assessment 39 607-619
Offermann L R amp Gowing M K (1990) Organiza-tions of the future Changes and challenges Ameri-can Psychologist 45(2) 95-108 doi10370003-066X45295
Oreg S (2003) Resistance to change Developing an in-dividual differences measure Journal of Applied Psy-chology 88 680-693
Oreg S (2006) Personality context and resistance to organizational change European Journal of Work and Organizational Psychology 15 73-101
Oreg S Vakola M amp Armenakis A (2011) Change re-cipientsrsquo reactions to organizational change A 60-year review of quantitative studies The Journal of Applied Behavioral Science 47 461-524
OrsquoToole J (1995) Leading change The argument for val-ues-based leadership Boston MA Ballentine Books
Pirson M Langer E J Bodner T amp Zilcha-Mano S (2012) The development and validation of the Langer Mindfulness Scale-Enabling a socio-cognitive perspec-tive of mindfulness in organizational contexts Ford-ham University School of Business Research Paper Re-trieved from httpdxdoiorg102139ssrn2158921
Stanley D J Meyer J P amp Topolnytsky L (2005) Employee cynicism and resistance to organizational change Journal of Business and Psychology 19(4) 429-459
Topping P (2002) Managerial leadership New York McGraw Hill Professional
Van Dam K Oreg S amp Schyns B (2008) Daily work contexts and resistance to organisational change The role of leader-member exchange development climate and change process characteristics Applied Psycholo-gy An International Review 57 313-334 doi101111j1464-0597200700311x
Weinstein N Brown K W amp Ryan R M (2009) A multi-method examination of the effects of mindful-ness on stress attribution coping and emotional well-being Journal of Research in Personality 43 374-385
Zander A F (1950) Resistance to change Its analysis and prevention Advanced Management 4(5) 9-11
International Journal of the Academic Business World 39
INTRODUCTION
Cloud computing is one of the most talked about infor-mation technology topics these days 7 24 Early literature review reveals an endemic confusion of what cloud com-puting is does and what it stands for We posit that the cloud metaphor 3 20 fosters a confusion that persists even today
The goal of this research paper is to look back and make historical sense of cloud computing We try to find the lineage of cloud computing where the phrase cloud com-puting came from who came up with the term and how it found currency in the IT community We trace cloud computing to early timesharing and Application Service Provider (ASP) in the last decade and posit a future of utility computing
Additionally we try to shed light on the current state of cloud computing provide a comprehensive definition of the term and its main building blocks
CLOUD COMPUTING IN THE ACADEMIC LITERATURE
A metaphor
In an article by Ian Foster and Steven Tuecke 3 the authors start by describing the well-known elephant fable where a group of blind people are asked to describe an elephant and not surprisingly each provides a different view
The cloud is a metaphor for the Internet Itrsquos a rebranding of the Internet that is why there is a raging debate By vir-tue of a metaphor itrsquos open to different interpretations 20
Confusion and Frustration
The word ldquocloudrdquo in cloud computing informs very little and it may even misinform ldquoI hated it but I finally gave inrdquo says Carl Bass President and CEO of Autodesk He adds ldquoI didnrsquot think the term helped explain anything to people who didnrsquot already know what it isrdquo20
Giving the lsquocloudrsquo name to the old concept of large shared distributed systems is misleading 4 p 26
Larry Ellison Oraclersquos CEO ldquoThe interesting thing about cloud computing is that wersquove redefined cloud computing everything that we already dohellipI donrsquot understand what we would do differently in light of cloud computing other than change the wording of some of our adsrdquo 1 p 50
In an article in Harvard Business Review (HBR) 22 the author asks a rhetorical question ldquoWhat the heck does it mean to have a lsquocloudrsquo It means that the functions you want like storage communications and applications donrsquot need to live on the device you have in front of you You can get them on demand from the networkrdquo We should ask the question ldquoin a typical non-cloud IS en-vironment do we really have the stated functions on the device in front of usrdquo
Cloud Computing is often confused with Utility Com-puting but they are not the samemdashrather the latter forms part of the former 2
No Definition
Realizing the elephantine nature of cloud computing there is a reluctance to define it Question How would you define cloud computing Answer Cloud computing
The Origin and Construct of Cloud Computing
Nozar Daylami PhD Adjunct Professor
School of Management Information System and Technology Program
California Lutheran University Thousand Oaks CA 91360
ABSTRACTCloud computing is one of the most talked about information technology topics these days A literature review reveals an endemic confusion of what cloud computing stands for This paper tries to shed light on why the term is so confusing We try to find where the phrase cloud computing came from and how it found currency in the IT community We trace cloud computing to early timesharing and Application Service Provider (ASP) in the last decade and posit a future of utility computing This paper also provides a comprehensive definition of the term and its main building blocks
Nozar Daylami The Origin and Construct of Cloud Computing
40 International Journal of the Academic Business World 41Fall 2015 (Volume 9 Issue 2)
is not so much a definition of a single term as it is a trend in service delivery taking place today 3 p 52
An Old Concept
Cloud computing is an old concept it ldquois a throwback to the mainframe model of computingrdquo 19 p 78 Clearly cloud computing is simply remote computing 4 p 26
Internet or Network Computing
Cloud computing as a term for Internet-based computing service was launched by industry giants Google Ama-zon etc in late 2006 24 ldquoIt is the movement of applica-tion services onto the Internet and the increased use of the Internethelliprdquo
The Earliest Publications
In the first article on Cloud Computing in the Communi-cations of ACM 9 it is referred to as ldquothe compute cloudrdquo and is deemed synonymous with ldquoon-demand comput-ing software as a service or the Internet as a platformrdquo Though these other naming conventions are self-explana-tory cloud computing is not
The cloud computing is understood as a shift of the ge-ography of computing It begs the question if it is about moving delivery of a wide variety of information services onto to the Internet why donrsquot we call it ldquoInternet Com-putingrdquo
The first time cloud computing showed up in a HBR pub-lication was in a digital article in April 2008 14 The au-thor states that the move to cloud computing would be disruptive to incumbent players of shrink-wrapped gam-ing software assuming his readers understand what cloud computing entails
A BRIEF HISTORY OF COMPUTING
In the early days of computers they were big and expen-sive So sharing this big expensive gadget was a normal practice Most organizations did not usually own this big machine but those who did had to share it across an en-terprise That was the era of timesharing
However as computers got cheaper and more afford-able every company every department and then finally every person decided to have their own computer How-ever standalone computers are of limited use So we networked them first locally in a Local Area Network (LAN) environment and then far and wide Wide Area
Network (WAN) Then we networked the network and the World Wide Web was born
At the same time in a different parallel universe some-thing else was happening In the early years no commer-cial off-the-shelf software (COTS) was available Every organization had to write its own software program So if you wanted to computerize your accounting general led-ger payables and receivables or run your inventory you had to write your own applications
Buying off-the-shelf applications was also considered ldquooutsourcingrdquo Why Because you were having others do the work for your organization which was supposed to be doing this work for itself So over the years most appli-cation development have been outsourced to burgeoning software companies such as IBM Oracle and SAP
OUTSOURCING AND ASP
In a general sense IS outsourcing is nothing newmdashit has always been considered an option for IT solutions 11 Electronic Data Systems was handling data processing services for Frito-Lay and Blue Cross as early as 1963 IS outsourcing soon became widely known as the second of a three-phase outsourcing phenomenonmdashtraditional out-sourcing being the first phase and application outsourcing being the third 6
In the early years of the last decade xSPs service provid-ers of all stripes were leading into a new generation of IT where it really did not matter where the applications reside as long as we had access to accomplish what we wanted 247 However back then an Application Service Provider (ASP) was thought by some to be another re-incarnation of the old ldquotimesharingrdquo leveraging network technologies 22
However the understanding of an evolving net-centric computing was already there In their book published in 2002 aptly titled NetSourcing authors Kern Lacity and Willcocks 7 define a computing framework and services stack thatrsquos similar to Cloud Computing The authors state ldquoWe selected the term ldquoNetsourcingrdquo as the over-arching name because the common element of any xSP is the delivery of a product or service over a networkrdquo (p 3) The ldquonetworkrdquo however is now synonymous with the ldquoInternetrdquo
Today cloud computing is about getting the job done in whatever way shape or form that may be required Orga-nizations and individuals need the utility of computing and where it comes from by and large is of no concern As early as 1961 Professor John McCarthy predicted that computation may someday be organized as a public utility ldquoEach subscriber needs to pay only for the capac-
ity he actually uses but he has access to all programming languages characteristics of a very large system hellip Certain subscribers might offer services to other subscribers hellip The computer utility could become the basis of a new and im-portant industry 8 McCarthyrsquos notion of ldquoutility comput-ingrdquo is here right nowmdashthat is ldquocloud computingrdquo
This point is confirmed by others 1 p 51 ldquoThe data center hardware and software is what we consider a cloud When a cloud is made available in a pay-as-you-go manner to the general public we call it utility computingrdquo
CLOUD COMPUTING ORIGIN OF THE PHRASE
Coinage of the term ldquocloud computingrdquo has been traced to two individuals who at the time they came up with this term worked for Compaq Computer George Favaloro a Compaq marketing executive and Sean OrsquoSullivan the founder of the now defunct business NetCentric 20
A Compaq internal document marked as confiden-tial dated November 14 1996 and provided by Sean OrsquoSullivan contemplates a Cloud Computing ldquostrat-egyrdquo10
But the creation of this term did not find currency for another decade Many believe the first use of ldquocloud com-
putingrdquo in its modern context occurred on August 9 2006 when then Google CEO Eric Schmidt introduced the term at an industry conference ldquoWhatrsquos interesting [now] is that there is an emergent new modelrdquo Schmidt said ldquoI donrsquot think people have really understood how big this opportunity really is It starts with the premise that the data services and architecture should be on servers We call it cloud computingmdashthey should be in a ldquocloudrdquo somewhererdquo 19
CLOUD COMPUTING DEFINITION
The National Institute of Standards and Technology (NIST SP 800-145) defines Cloud Computing in the fol-lowing way ldquoCloud computing is a model for enabling convenient on-demand network access to a shared pool of configurable computing resources (eg networks serv-ers storage applications and services) that can be rapidly provisioned and released with minimal management ef-fort or service provider interaction This cloud model is composed of five essential characteristics three service models and four deployment modelsrdquo 17
The following diagram places all the pieces together in a visual form
The Conceptual Reference Model
Cloud Computing Reference Architecture NIST Special Publication 500-292
Nozar Daylami The Origin and Construct of Cloud Computing
42 International Journal of the Academic Business World 43Fall 2015 (Volume 9 Issue 2)
Cloud Computing Reference Architecture NIST Special Publication 500-292
NIST Special Publication 500-292 states that ldquothe defini-tion is widely accepted as a valuable contribution toward providing a clear understanding of cloud computing tech-nologies and cloud services It provides a simple and un-ambiguous taxonomy of three service models available to cloud consumers cloud software as a service (SaaS) cloud platform as a service (PaaS) and cloud infrastructure as a service (IaaS) It also summarizes four deployment mod-els describing how the computing infrastructure that delivers these services can be shared private cloud com-munity cloud public cloud and hybrid cloudrdquo 18 Finally the NIST definition also provides a unifying view of five essential characteristics that all cloud services exhibit on-demand self-service broad network access resource pool-ing rapid elasticity and measured service 18
This publication further states that ldquoThese services and their delivery are at the core of cloud computing In the cloud computing model the primary focus is a more eco-
nomic method of providing higher quality and faster ser-vices at a lower cost to the usersrdquo
The Cloud Security Alliance 21 provides a more transpar-ent narrative of what Cloud Computing is ldquoa model for enabling ubiquitous convenient on-demand network access to [a] shared pool of configurable computing re-sources [it] has the potential to enhance collaboration agility scaling and availability and provides opportunity for cost-reduction the model envisages a world where components can be rapidly orchestrated provisioned implemented and decommissioned scaled up or down to provide an on-demand utility-like modelrdquo
A SPATIAL VIEW OF CLOUD COMPUTING
The NIST Computing Reference Architecture is a flat depiction of the cloud computing model A three dimen-sional view of the model by Craig-Wood 2 is a spatial de-piction Here you can see the three dimensions of cloud computing that renders the elephant fable
Computing Services Framework
Infrastructure as a Service (IaaS) As the word ldquoinfra-structurerdquo implies this is the most basic of services Cus-tomers can buy processing storage and network services and then build their own systems on top of this infra-structure A pioneer in the IaaS field is Amazon with its Amazon Elastic Compute Cloud (EC2)
However most big names in the IT field from Micro-soft (Azure) to Google (App Engine) provide IaaS Here customers are not renting specific servers hard drives and network switches or any particular equipment but instead they are utilizing the infrastructure that is most certainly simulated by virtualization software allowing multiple customers to be served by the same array of physi-cal devices IaaS provides the raw power of computingmdashstorage included
Cloud Computing would not be possible without virtu-alization Virtualization is the ability to make a virtual machine (VM) act like a physical computer Just like a physical computer with its own processor operating sys-tem and storage each VM has its own components too The benefit of virtualization though is that you can put much more than only one VM even with different oper-ating systems on the same server Doing so dramatically increases each serverrsquos potential for serving clientsrsquo on-demand needs (8)
Platform as a Service (PaaS) The next level up is where vendors provide not only the raw powermdashthe infrastruc-turemdashbut preconfigured systems running operating sys-tems databases and platforms (programming languages) for building applications For example Microsoftrsquos Azure service provides preconfigured computers running Win-dows and SQL Server And Salesforcecom has Forcecom as its own custom application development platform
In practice the boundary between IaaS and PaaS is not always clear Because IaaS providers most often provide other services such as operating systems database or ap-plication development platform that fall in the PaaS cat-egory In its purest form IaaS can be considered as virtual machines (raw processing power and storage) that can be scaled up and down as you need
Software as a Service (SaaS) Another higher layer is where vendors provide full applications running on cloud infrastructuremdashtheir own or rented from the likes of Amazon Salesforcecom has long been considered one of the most successful SaaS provider Salesforececom CRM was one of the early entrants into the market Salesforcecom prides itself on being a pioneer in Cloud Computing
At Salesforcecom itrsquos all about the Cloud However in their collateral literature dated circa 1993-94 you wonrsquot find any mention of the word ldquocloudrdquo
CLOUD COMPUTING CONCERNS
In survey after survey security is listed as the top concern of Cloud Computing However Cloud Security Alliance (CSA) the industry group that provides security guide-lines and education states that ldquosecurity controls for the cloud computing are for in most part no different than the security controls in any IT environment hellip[however] cloud computing may present different risks to an organi-zation than traditional IT solutionsrdquo 21 p 21
CIOs or CEOs for that matter may feel safer when they ldquoownrdquo versus ldquorentrdquo their IT assets However when you deploy your assets on the Internet for which you eventu-ally will have little choice you will inherit a set of vulner-abilities that are not all that different from the Cloudrsquos Ownership has its own set of financial risks in the form of capital expenditures (CAPEX) that need to be budgeted and spent up front Compare that risk with the far smaller risk of renting (OPEX) which by and large can be dis-continued if needed
Cloud computing technology does not require the use of public networks If your data is too strategically critical and sensitive to be deployed on the Internet you could instead deploy a private cloud that is strictly for your or-ganization Obviously a Private Cloud is more expensive and it needs trained staff However a private cloud lets an organization benefit from cloud technology without the risk of possible public disclosure of its data
Another alternative could be a community cloudmdasha pri-vate cloud that is shared by several organizations for spe-cific needs For example a group of hospitals might create a community cloud to hold patientrsquos medical records
CONCLUSION
Cloud Computing is here to stay and grow Clouds are more versatile than traditional IT networks on many di-mensions They are far more convenient to deploy they have far more potential for collaboration and they are far more scalable than traditional IT ever was The delivery of services is provisioned on global telecommunication net-works that these days have morphed into the Internet And when they mature they will provide a computing utility when and where it is needed
Cloud computing model (adapted from Craig-Wood)
Nozar Daylami The Origin and Construct of Cloud Computing
44 International Journal of the Academic Business World 45Fall 2015 (Volume 9 Issue 2)
BIBLIOGRAPHY
1 Armburst M et al A View of Cloud Computing Communications of the ACM Vol 53 No 4 pages 50-58
2 Craig-Wood K Definition of Cloud Computing incorporating NIST and G-Cloud views httpswwwkatescommentcomdefinition-of-cloud-com-puting-nist-g-cloud Access date April 26 2015
3 Creeger M CTO Roundtable Cloud Computing Communications of the ACM Vol 52 No 8 pages 50-56
4 Cusumano M Cloud Computing and SaaS as New Computing Platforms Communications of the ACM Vol 53 No 4 pages 27-29
5 Foster Ian and Tuecke Steven Describing the Ele-phant The Different Faces of IT as Service wwwac-mqueuecom JulyAugust 2005 pages 26-34 httpdeliveryacmorg10114510900001080874p26-fosterpdf ip=99100108167ampid=1080874ampacc=OPENampkey=4D4702B0C3E38B352E4D4702B0C3E38B352E4D9421298D07BF362E6D218144511F3437ampCFID=505172814ampCFTOKEN=56369758amp__acm__=1429816554_402a40f1d60056fb68e8ccf3fdd96201 accessed April 23 2015
6 Kern Thomas Lacity Mary Cecelia Willcocks Leslie P Netsourcing Renting Business Applica-tions and Services Over a Network Prentice Hall 2002
7 Knoblauch A Deconstructing Cloud Smashwords Edition (Kindle Version) First Edition August 2013
8 Garfinkel Simon (2011 Oct 3) The Cloud Imperative MIT Technology Review httpwwwtechnologyreviewcomnews425623the-cloud-imperative
9 Hayes B Cloud Computing Communications of the ACM Vol 51 No 7 pages 9-11
10 Internet Solution Division Strategy for Cloud Com-puting Compaq Computer Corporation (1996) httpwwwtechnologyreviewcomsitesdefaultfileslegacycompaq_cst_1996_0pdf
11 Lacity M C Hirschheim R Information Systems Outsourcing Myths Metaphors and Realities New York John Wiley amp Sons 1993
12 McAfee A The Year the Cloud Rolled In httpshbrorg2010122010-the-year-the-cloud-rolled Access date April 23 2015
13 McAfee A What Every CEO Needs to Know About the Cloud httpshbrorg201111what-every-ceo-needs-to-know-about-the-cloud Access date April 23 2015
14 McGrath R Whorsquos Disrupting the Gaming Indus-try httpshbrorg200804whos-disrupting-the-gaming-ind Access date April 23 2015
15 Mell P Grance T The NIST Definition of Cloud Computing National Institute of Standards and Technology httpcsrcnistgovpublicationsnist-pubs800-145SP800-145pdf
16 Neumann P Risks and Myths of Cloud Comput-ing and Cloud Storage Communications of the ACM Vol 57 No 10 pages 25-27 The NIST Defi-nition of Cloud Computing httpcsrcnistgovpublicationsnistpubs800-145SP800-145pdf
17 NIST Definition of Cloud Computing httpcsrcnistgovpublicationsnistpubs800-145SP800-145pdf
18 NIST Cloud Computing Reference Architecture National Institute of Standards and Technology Special Publication 500-292 httpwwwnistgovcustomcfget_pdfcfmpub_id=909505
19 Nanavati M Colp P Aiello W and Warfield A Cloud Security A Gathering Storm Communica-tions of the ACM Vol 57 No 8 pages 70-79
20 Regalado Antonio (2011 Oct 31) Who coined cloud computing MIT Technology Review httpwwwtechnologyreviewcomnews425970who-coined-cloud-computing
21 Security Guidance for Critical Areas of Focus in Cloud Computing V30 Cloud Security Alliance httpscloudsecurityallianceorgguidancecsagu-idev30pd
22 Seviokla J Does Cisco Have Its Head in the Clouds httpshbrorg200903does-cisco-have-its-head-in-th Access date April 23 2015
23 Walsh K R Analyzing the Application ASP Concept Technologies Economies and Strategies Communications of ACM Vol 46 No 8 pages 103-107
24 Yang H Tate Mary A Descriptive Literature Review and Classification of Cloud Computing Re-search Communications of Association of Informa-tion Systems Vol 31 2012
Nozar Daylami
46 Fall 2015 (Volume 9 Issue 2)
This page intentionally blank
International Journal of the Academic Business World 47
INTRODUCTION
In their paper ldquoSAS and the Efficient Portfoliordquo Thomp-son and El-houbi (2012) develop a SAS program to calcu-late portfolio weights for efficient stock portfolios Their program improves on existing public domain SAS pro-grams of this type by allowing for portfolios with a rela-tively large number of securities Thompson and El-houbi also claim that their SAS program is an improvement over the Excel programs used to calculate portfolio weights which are sometimes included in investment textbooks They note that users concur that their program is easier to use than those Excel programs which either limit the number of securities that can be included in a portfolio require ldquocorrectionsrdquo or ldquoadjustmentsrdquo to overcome some quirks in the Excel Solver routine or require multiple user interventions
The Thompson and El-houbi program is certainly more elegant and user friendly than the equivalent Excel pro-grams and will provide those with access to the SAS pro-gramming language a valuable tool for learning portfolio management The disadvantage of a SAS program how-ever is that many students will not have easy access to the SAS programming language Students at smaller univer-sities may not have any access to SAS while students at many larger universities may only be able to access SAS at a computer lab on campus
In this paper I modify the Thompson and El-houbi SAS program for use in the open-source R programming lan-guage which is available free of charge for anyone with access to the internet Using the R language program to compute portfolio weights for efficient portfolios main-tains the elegance of the Thompson and El-houbi SAS
program while overcoming the disadvantage of limited SAS availability In addition I extend the Thompson and El-houbi program by making use of a quadratic program-ming package available in R to provide a program that can accommodate short-sale restrictions and position limits
THE R PROGRAMMING LANGUAGE
R is a free programming language for statistical analysis and graphics and runs on many UNIX platforms and on Windows and MacOS It is available under the terms of the Free Software Foundationrsquos GNU General Public License R was developed initially by Robert Gentleman and Ross Ihaka both of the University of Auckland (New Zealand) and is based on the S programming language developed at Bell Labs by John Chambers Since its initial development the popularity of R has grown considerably largely because of its ease of use and because of the avail-ability of many add-on packages that allow users to tackle very sophisticated projects
The base R package may be downloaded at httpcranusr-projectorg That web page also provides links to sources of information about R and basic user manuals There are also many books and manuals now available for purchase that offer information on both basic and special-ized uses of the language In fact Vance (2009) suggests that the growing popularity of the R language at univer-sities language could even result in noticeably lower de-mand for SAS
THE MARKOWITZ PORTFOLIO PROBLEM
As Markowitz (1952) notes an investor following the ldquoex-pected returns-variance of returns rulerdquo will choose an ef-
Optimal Portfolios and the R Programming Language
James A TurnerAssistant Professor of Finance
School of Accounting amp TaxationWeber State University
Ogden UT 84408
ABSTRACTThis paper develops a program in the freely available open-source R programming language to calculate weights for optimal stock portfolios The program retains the advantages the Thompson and El-houbi (2012) SAS program has over similar programs in Excel but avoids the potential problem of limited access to SAS that some students and researchers may face The R program also extends the Thompson and El-houbi program by including the ability to accommodate short-sale restrictions and position limits
James A Turner Optimal Portfolios and the R Programming Language
48 International Journal of the Academic Business World 49Fall 2015 (Volume 9 Issue 2)
ficient portfolio that is a portfolio with maximum ex-pected return for a given variance or one with minimum variance for a given expected return The minimum vari-ance formulation of the portfolio choice problem there-fore requires that the investor choose portfolio weights to minimize the variance of a portfolio with a given expected return The problem also requires that all money be in-vested (which means that the portfolio weights must sum to one) In matrix notation the optimization problem is
where w the choice variable is a k times 1 vector of the weights invested in the k securities in the portfolio V is the port-folio variance-covariance matrix and R is a 2 times k matrix whose first row is a vector of ones and whose second row contains the expected returns of each security in the port-folio M is a 2 times 1 vector whose first element is one (corre-sponding to the constraint that the portfolio weights sum to one) and whose second element is the chosen portfo-lio expected return For now there are no restrictions on short sales so some portfolio weights may be negative
The Lagrangian for the problem is
( ) L w Vw M Rwλprime prime= + minus
where λ is a 2 times 1 vector containing the Lagrangian multi-pliers The first-order conditions for a minimum (which are also sufficient conditions in this case) are
Solving the first-order conditions for w and λ yields
( )( )
11 1
112
w V R RV R M
RV R Mλ
minusminus minus
minusminus
prime prime=
prime=
Thompson and El-houbi following Stephens (1998) let 1 H RV Rminus prime= so that
1 1
1
2
w V R H MH Mλ
minus minus
minus
prime=
=
Stephens (1998 p 36) shows how the elements of the H matrix may be used ldquoto fix any meanvariance point on the efficient frontierrdquo
Min st
w VwRw M
prime
=
2 0
0
L Vw RwL M Rw
λ
λ
part prime= minus =partpart
= minus =part
THE BASIC R PORTFOLIO OPTIMIZATION PROGRAM
The R programming language lends itself very easily to matrix manipulation and matrix computation removing much of the difficulty in solving the standard Markowitz portfolio problem The following R program calculates the portfolio weights for an efficient portfolio using stock return data to estimate expected returns and the variance-covariance matrix The user must specify the desired port-folio expected return The program can accommodate portfolios up to about 50 stocks Beyond that number precision limitations of the R language may make the variance-covariance matrix ldquocomputationally singularrdquo and unable to be inverted
The first step in the program is to read in the return data R can input data from many file types but in the present example the data are stored in a comma-delimited Excel file called ldquoReturnscsvrdquo which contains stock return data In this case the Excel file includes a header row labeling each column of returns with identifying information but no row names The program first reads in the data and then determines the number of securities (number of col-umns in the matrix) as shown on the facing page
ADDING SHORT-SALE CONSTRAINTS AND POSITION LIMITS
The above formulation of the portfolio choice problem places no restrictions on short sales and does not accom-modate position limits In reality individual investors and some fund managers may face requirements prohibit-ing short sales Fund managers may also face requirements that either limit the amount that may be invested in one security or sector or instead that a minimum percentage of funds be invested in a certain security or sector Dai Lin and Liu (2011) list several examples of real-world po-sition limits such as a requirement that a small-cap mutu-al fund invest at least a minimum percentage of its funds in small-company stocks In mathematical terms these short-sale restrictions and position limits can be expressed as a series of inequality constraints While reformulating the portfolio choice problem to add inequality constraints is not difficult doing so makes actually solving the prob-lem considerably more difficult
With short-sale restrictions and position limits the port-folio choice problem becomes
0
Min st
w VwRw MSw w
prime
=ge
where w is still the choice variable S is an m times k matrix that defines both the short-sale constraints on the k se-curities in the portfolio and m minus k other restrictions If there are short-sale constraints but no other restrictions the S matrix is simply a k times k identity matrix which when multiplied by the vector w results in the requirement that
0 iw ige forall If there are other restrictions the sub-matrix of S consisting of the first k rows and k columns of S is an identity matrix and the other restrictions are specified by suitable choices of the elements of the remaining rows of S For example suppose there is a position limit placing a maximum of p on the percentage invested in the sev-enth security so that 7 w ple Since the constraints in the optimization problem above have been expressed as non-negativity constraints this position limit must instead take the form 7 w pminus ge minus The row of S corresponding to
the position limit will consist entirely of zeros except for the seventh element which will be minus1 and corresponding element of the w0 vector would be p
Introducing other forms of position limits simply requires adding the appropriate rows to the S matrix For example if there is a requirement that the total percentage invested in the first and third securities equal or exceed a certain percentage q then one row of S should be [1 0 1 0 0]and the corresponding element of the w0 vector would be q If there is instead a requirement that the total percentage invested in the first and third securities not exceed a cer-tain amount q the required row of S would be [-1 0 -1 0 0] and the corresponding element of the w0 vector would be minusq Other restrictions may be specified similarly For problems that include position limits each of the first k el-
The BASIC R Portfolio Optimation Program
Returns ltminus readtable(ldquoReturnscsvrdquo header = TRUE sep = ldquordquo)Rmat ltminus asmatrix(Returns) Converts the data to matrix formk ltminus ncol(Rmat) Number of columns (number of securities in the portfolio) Now the program calculates the estimate of the variance-covariance matrix (V) the M vector and the R matrix which includes the estimate of the expected returns
V ltminus var(Rmat) Calculates the sample variance-covariance matrix which is used as the estimate of the variance-covariance matrix
Erp ltminus 001 Sets the desired expected portfolio return The user can change this value as desired
M ltminus rbind(1 Erp) Ones ltminus rep(1 k) Ravg ltminus colMeans(Rmat)
Defines the M matrix including the required portfolio return Defines a 1 x k matrix of ones Calculates average returns by column giving a 1 x k matrix of estimated expected returns
R ltminus rbind(Ones Ravg) Combines Ones and Ravg into the 2 x k matrix R Finally the program calculates the portfolio weights and the portfolio variance
VINV ltminus solve(V) Calculates the inverse of the estimated variance-covariance matrixH ltminus RVINVt(R) Calculates the H matrixHINV ltminus solve(H) Calculates the inverse of Hw lt- VINVt(R)HINVM Calculates the portfolio weightsPvar lt- t(w)Vw Calculates the portfolio variance The following commands display the results of the calculations
print(w) Prints the elements of the w vectorprint(Pvar) Prints the variance of the portfolio formed using the weights w
James A Turner Optimal Portfolios and the R Programming Language
50 International Journal of the Academic Business World 51Fall 2015 (Volume 9 Issue 2)
ements of the w0 vector will be zero corresponding to the non-negativity constraints and the remaining elements will equal the percentages associated with the position limits entered as positive or negative numbers depend-ing on whether the position limits establish minimums or maximums
The Lagrangian for this problem is
( ) ( )0 L w Vw M Rw w Swλ microprime prime prime= + minus + minus
where λ is a 2 times 1 vector containing the Lagrangian multi-pliers on the equality constraints and micro is an m times 1 vector of the Lagrangian multipliers on the k short-sale constraints and the m ndash k position limits The first-order necessary con-ditions for this problem are the Kuhn-Tucker conditions
( )0 0
2 0
0
0 0 and 0
L Vw R SwL M Rw
L w Sw w Sw
λ micro
λ
micro micromicro
part prime prime= minus minus =partpart
= minus =partpart prime= minus le ge minus =part
The final set of conditions are known as the complementa-ry slackness conditions since if an element of partLpartμ does not equal zero (ie if the required condition is slack) then the corresponding element of micro must equal zero and vice versa Because of the complementary slackness conditions in order to find a solution to the optimization problem each condition must be checked individually to deter-mine the possible solutions If there are more than a very few constraints finding the candidate solutions manually becomes extremely tedious
Fortunately it is possible to use numerical methods to solve this type of non-linear programming program This is where the strength of the R programming language be-comes very evident The R language provides access to an extensive number of add-on packages developed by R us-ers around the world In particular there are several pack-ages that implement numerical methods to find solutions to optimization problems with inequality constraints Perhaps the package that most easily lends itself to solv-ing the current problem is the ldquoquadprogrdquo package Ac-cording to the documentation included with the pack-age the quadprog routine ldquoimplements the dual method of Goldfarb and Idnani (1982 1983) for solving qua-dratic programming problems of the form min(d΄b+frac12b΄Db)) with the constraints Aʹbgtb₀rdquo For the optimization problem currently under consideration the d vector will be a zero vector the b vector will be the w vec-tor of portfolio weights the D matrix will be the variance-
covariance matrix V and the matrix A΄ will equal a matrix formed by combining the R matrix and the S matrix such that A΄= [R
S ]and A = [ R΄ S΄] Since the V matrix is symmetric the term frac12b΄Db = frac12w΄Vw is a quadratic form Also because the d vector is a zero vector the presence of the frac12 term in the quadratic form does not change the value of the solution to the current portfolio optimization problem That is the weights that minimize frac12w΄Vw sub-ject to the constraints will also minimize w΄Vw subject to the constraints
THE R PORTFOLIO OPTIMIZATION PROGRAM WITH PACKAGE ldquoQUADPROGrdquo
The ldquoQuadprogrdquo package is one of many add-in packages available to R users To use add-in packages in R the user must first download and install the chosen package This is done through the ldquoPackagesrdquo command in the menu bar of the console window Selecting the ldquoInstall package(s)rdquo command from the drop-down box will bring up a list of download locations After selecting a download location the user selects the package(s) to download and install Finally once the selected package is downloaded and in-stalled it must be loaded for use in the current R session which is done by choosing ldquoPackagesrdquo command on the menu bar and then choosing the ldquoLoad packagerdquo com-mand from the drop-down box A list of available packag-es will then appear and the user should select the desired package in this case the ldquoquadprogrdquo package Once the quadprog package is loaded the following program will solve the portfolio problem with short-sale restrictions and position limits
In the present example the short-sale constraint requires that all elements of the w vector be non-negative In addi-tion there are three position limits The first position lim-it requires that no more than 5 of total funds be invested in the seventh security The second position limit requires that no more than a total of 40 of available funds be in-vested in the first and third securities The third position limit requires that total of at least 30 of available funds be invested in the second and fourth securities
The program will make use of the M matrix and the vari-ance-covariance matrix V from the earlier program so those variables must be saved by the user or the following program must be run after running the previous program and before exiting R The new program first sets the posi-tion limits as shown on the facing page
The output of the ldquosolveQPrdquo function includes the values of w and the Lagrangian multipliers for each constraint If the value of a Lagrangian multiplier is zero the constraint associated with that multiplier is not binding otherwise the constraint is binding Though checking the values of
the Lagrangian multipliers allows the user to determine which constraints are binding quite easily the functionrsquos output also includes a listing of the binding constraints by index number
The R Portfolio Optimization Program with Package ldquoQuadprogrdquo
npl ltminus 3 Sets the number of position limits The user sets this value
plmat ltminus matrix (rep(0 nplk) nrow=npl ncol=k) Initializes the matrix that will be used to define the position limit(s)
plmat[17] = -1 Places the required elements into the proper places in the lmat[21] = plmat[23] = -1 position limits matrix In this example the first position
plmat[32] = plmat[34] = 1 limit will set a maximum on the total percentage invested in the seventh security The second position limit will set a maximum on the total percentage invested in the first and third securities The third position limit will set a minimum on the total percentage invested in the second and fourth securities
pl ltminus c(-005 -04 03) Sets the values of the position limits The value the user enters should be positive if the position limit specifies a inimum and should be negative if the position limit specifies a maximum
Next the inequality constraints are placed in matrix form
S ltminus rbind(diag(k) plmat) Defines the S matrix
w0 ltminus c(rep(0 k) pl) Creates a vector whose elements are the values of the inequality constraints
Next the arguments required by the solveQP function that solves the programming problem are defined and the programming problem is solved
dvec ltminus rep(0 k) Defines the d vector which is a necessary input for the quadprog package For portfolio optimization problems the elements of the d vector will all be zeros
Amat ltminus colbind(t(R) t(S)) Forms the Amat matrix
bvec ltminus c(M w0) Joins the M matrix and the w0 matrix to form the bvec vector
ICSol ltminus solveQP(V dvec Amat bvec meq=2) Solves the quadratic programming problem The argument meq specifies that the first two constraints are equality constraints In this example the equality constraints are that the weights sum to one and that the portfolio expected return equal a specified amount
print(c(ICSol[1] 2ICSol[[2]] ICSol[5] ICSol[6])) Prints selected output from the solve QP function the weights the portfolio variance the values of the Lagrangian multipliers and the index numbers of the binding constraints
James A Turner Optimal Portfolios and the R Programming Language
52 International Journal of the Academic Business World 53Fall 2015 (Volume 9 Issue 2)
CONCLUSION
This paper provides an R language program to calculate portfolio weights for efficient portfolios The program can also accommodate short-sale constraints and position limits Users must choose the desired portfolio expected return and must specify any other constraints A strong advantage of the program is that because the R program-ming language is freely available to anyone with access to the internet students and others who wish to use the pro-gram will be able to do so easily
REFERENCES
Dai Min Hanqing Jin and Hong Liu 2011 Illiquidity position limits and optimal investment for mutual funds Journal of Economic Theory 146 1598ndash1630
Goldfarb D and A Idnani 1982 Dual and primal-dual methods for solving strictly convex quadratic pro-grams In Hennart J P (ed) Numerical Analysis Springer-Verlag Berlin pages 77ndash91
Goldfarb D and A Idnani 1983 A numerically stable dual method for solving strictly convex quadratic pro-grams Mathematical Programming 27 1ndash33
Ihaka Ross A free software project Retrieved May 7 2013 from httpcranr-projectorgdochtmlinter-face98-paperpaper_2html
Markowitz Harry 1952 Portfolio selection Journal of Finance 7 77ndash91
Stephens Alan 1998 Markowitz and the spreadsheet Journal of Financial Education 35ndash43
Thompson Thomas H and Ashraf El-houbi 2012 SAS and the efficient portfolio International Research Jour-nal of Applied Finance 3 315ndash327
Turlach Berwin A 2013 quadprog Functions to solve quadratic programming problems R pack-age version 15-5 httpCRANR-projectorgpackage=quadprog (S original by Berwin A Turlach R port by Andreas Weingessel)
Vance Ashlee 2009 Data analysts captivated by Rrsquos power The New York Times Retrieved May 1 2013 from httpwwwnytimescom20090107tech nolog y busi ness-computi ng 0 7prog ra m htmlpagewanted=allamp_r=0
What is R Retrieved May 7 2013 from httpwwwr-projectorgabouthtml
APPENDIX 1 DATA
The data used in the R program come from the CRSP monthly stock file and consist of 60 months of return data from January 2008 to December 2012 The stocks in the 10-stock portfolio are the first 10 stocks in the CRSP monthly file (listed by PERMNO) for which 60 continuous months of returns are available The stocks in the 50-stock portfolio are the first 50 stocks for which 60 continuous months of returns are available Table 1 below lists the PERMNOS current company name and current ticker of the included stocks as well as the exchange where the stock trades
Table 1 Stocks in the Portfolio
NO PERMNO CURRENT COMPANY NAME TICKER EXCHANGE1 10001 GAS NATURAL INC EGAS AMEX2 10002 BANCTRUST FINANCIAL GROUP INC BTFG NASDAQ3 10025 A E P INDUSTRIES INC AEPI NASDAQ4 10026 J amp J SNACK FOODS CORP JJSF NASDAQ5 10032 PLEXUS CORP PLXS NASDAQ6 10044 ROCKY MOUNTAIN CHOCOLATE FAC INC RMCF NASDAQ7 10051 HANGER INC HGR NYSE8 10065 ADAMS EXPRESS CO ADX NYSE9 10100 AMERICAN LEARNING CORP NY ALRN NASDAQ
Table 1 Stocks in the Portfolio
NO PERMNO CURRENT COMPANY NAME TICKER EXCHANGE10 10104 ORACLE CORP ORCL NASDAQ11 10107 MICROSOFT CORP MSFT NASDAQ12 10138 T ROWE PRICE GROUP INC TROW NASDAQ13 10145 HONEYWELL INTERNATIONAL INC HON NYSE14 10147 E M C CORP MA EMC NYSE15 10180 AKORN INC AKRX NASDAQ16 10182 TECH DATA CORP TECD NASDAQ17 10200 REPLIGEN CORP RGEN NASDAQ18 10207 ROYCE FOCUS TRUST INC FUND NASDAQ19 10225 BEAM INC BEAM NYSE20 10232 ELMIRA SAVINGS BANK NY ESBK NASDAQ21 10239 BALDWIN amp LYONS INC BWINB NASDAQ22 10252 INDEPENDENT BANK CORP MA INDB NASDAQ23 10253 DOCUMENT SECURITY SYSTEMS INC DSS AMEX24 10257 D L H HOLDINGS CORP DLHC NASDAQ25 10258 CELLDEX THERAPEUTICS INC CLDX NASDAQ26 10259 SIGMA DESIGNS INC SIGM NASDAQ27 10294 HAVERTY FURNITURE COS INC HVT NYSE28 10297 NEW HAMPSHIRE THRIFT BNCSHRS INC NHTB NASDAQ29 10299 LINEAR TECHNOLOGY CORP LLTC NASDAQ30 10302 CYPRESS SEMICONDUCTOR CORP CY NASDAQ31 10308 TOMPKINS FINANCIAL CORP TMP AMEX32 10318 BALCHEM CORP BCPC NASDAQ33 10333 XOMA CORP XOMA NASDAQ34 10355 DAILY JOURNAL CORP DJCO NASDAQ35 10363 A M A G PHARMACEUTICALS INC AMAG NASDAQ36 10375 T C F FINANCIAL CORP TCB NYSE37 10382 ASTEC INDUSTRIES INC ASTE NASDAQ38 10395 NAVIGATORS GROUP INC NAVG NASDAQ39 10397 WERNER ENTERPRISES INC WERN NASDAQ40 10421 SKYWEST INC SKYW NASDAQ41 10443 PATRIOT TRANSPORTATION HLDG INC PATR NASDAQ42 10463 RESEARCH FRONTIERS INC REFR NASDAQ43 10501 AMERICAN WOODMARK CORP AMWD NASDAQ44 10507 MEDICAL ACTION INDS INC MDCI NASDAQ45 10514 TRANS WORLD ENTERTAINMENT CORP TWMC NASDAQ46 10516 ARCHER DANIELS MIDLAND CO ADM NYSE47 10517 AARONS INC AAN NYSE48 10530 MERIDIAN BIOSCIENCE INC VIVO NASDAQ49 10547 CLEARFIELD INC CLFD NASDAQ50 10550 PRO DEX INC COLO PDEX NASDAQ
James A Turner Optimal Portfolios and the R Programming Language
54 International Journal of the Academic Business World 55Fall 2015 (Volume 9 Issue 2)
APPENDIX 3 RESULTS FOR THE 10-STOCK PORTFOLIO
Results for the 10-stock portfolio with a monthly expect-ed return of 1 are shown at the top of the facing page First shown is the variance-covariance matrix (V) fol-lowed by its inverse (V-1)
Table 2 shows the return averages of each stock and the calculated portfolio weights both for the portfolio with no short-sale constraints or position limits and the port-folio with short-sale constraints and three position limits (1) a requirement that the percentage invested in the sev-enth security not exceed 5 (2) a requirement that the
total percentage invested in the first and the third securi-ties not exceed 40 and (3) a requirement that the total percentage invested in the second and fourth securities be at least 30 Note that when short-sale constraints and position limits are imposed there may no longer be a port-folio that meets all the constraints that is the feasible set may be null In that case the R program will return an error message stating that the constraints are inconsistent
Table 3 lists the inequality constraints and the associ-ated Lagrangian multipliers along with an indication of whether the constraint is binding In this example the constraint that there be a minimum of 30 invested in the second and fourth securities is not binding
APPENDIX 2 COPY OF THE FULL PROGRAM
The full program is shown below without comments Users can easily copy the program that is between the solid lines and paste it into the R Editor window It will probably be necessary for each user to change the name of the data file in the readtable command Also the user can change the portfolio expected return and the number type and value of the inequality constraints as desired
Returns ltminus readtable(ldquoReturnscsvrdquo header = TRUE sep = ldquordquo) Rmat ltminus asmatrix(Returns) k ltminus ncol(Rmat) V ltminus var(Rmat) Erp ltminus 001 M ltminus rbind(1 Erp) Ones ltminus rep(1 k) Ravg ltminus colMeans(Rmat) R ltminus rbind(Ones Ravg) VINV ltminus solve(V) H ltminus RVINVt(R) HINV ltminus solve(H) w lt- VINVt(R)HINVM Pvar lt- t(w)Vw print(w) print(Pvar) npl ltminus 3 plmat ltminus matrix (rep(0 nplk) nrow=npl ncol=k) plmat[17] = -1 plmat[21] = plmat[23] = -1 plmat[32] = plmat[34] = 1 pl ltminus c(-005 -04 03)S ltminus rbind(diag(k) plmat) w0 ltminus c(rep(0 k) pl) dvec ltminus rep(0 k) Amat ltminus cbind(t(R) t(S)) bvec ltminus c(M w0) ICSol ltminus solveQP(V dvec Amat bvec meq=2) print(c(ICSol[1] 2ICSol[[2]] ICSol[5] ICSol[6]))
1
2867001 161224 279311 153314 408660 148438 131874 246057 83608 740152
161224 321169 23967 251277 39387 55190 33449 107899 36378 39718
279311 23967 991158 109233 189872 100249 22208 119
V minus
minus minus minus
minus minus minus minus
minus minus minus minus
=
6782 41342 198294
153314 251277 109233 2757210 319797 03010 139907 969199 56520 416534
408660 39387 189872 319797 977494 325171 247388 1098965 26657 04097
148438 55190 100249 03010 325171 1
minus minus minus minus minus
minus minus minus minus minus minus
minus 644368 311333 1803329 91576 428583
131874 33449 22208 139907 247388 311333 1093506 426730 100681 162364
246057 107899 1196782 969199 1098965 1803329 426730 11640904 233195 3789283
8360
minus minus
minus minus minus minus minus minus minus
minus minus minus minus minus minus
8 36378 41342 56520 26657 91576 100681 233195 138635 73382
740152 39718 198294 416534 04097 428583 162364 3789283 73382 3685519
minus minus
minus minus minus minus minus minus
00046 00019 00002 00006 00035 00004 00011 00008 00018 00019
00019 00364 00013 00037 00002 00004 00003 00001 00100 00007
00002 00013 00161 00024 00076 00035 00013 00041 00038 00033
00006 0
V
minus minus minus minus
minus minus minus minus
minus minus
=
0037 00024 00058 00051 00010 00016 00021 00028 00029
00035 00002 00076 00051 00217 00009 00048 00052 00024 00064
00004 00004 00035 00010 00009 00087 00018 00022 00027 00012
00011 00003 00013 000
minus
minus minus
minus minus minus
16 00048 00018 00113 00013 00055 00018
00008 00001 00041 00021 00052 00022 00013 00033 00003 00034
00018 00100 00038 00028 00024 00027 00055 00003 00850 00020
00019 00007 00033 00029 00064 00
minus
minus minus minus minus minus minus minus minus
012 00018 00034 00020 00068minus
Table 2 Average Returns and Weights for the Ten-
Stock Portfolios
Stock No Permno
Average Returns
Weights (SS
Allowed)IC Weights
(No SS 3 PLs)
1 10001 00064 03817 034062 10002 -00054 00311 004063 10025 00183 00908 005944 10026 00156 02525 026255 10032 00095 -01410 000006 10044 00012 00649 013797 10051 00206 01000 005008 10065 00018 01933 004929 10100 00270 00422 0056810 10104 00104 -00155 00031
Table 3 Constraints and Lagrangian Multipliers
Constraint Lagrangian Multiplier
Constraint Binding
Portfolio weights sum to one 00015 Yes
Portfolio expected return equals 1 00443 Yes
w1 ge 0 00000 No w2 ge 0 00000 No
w3 ge 0 00000 No
w4 ge 0 00000 No
w5 ge 0 00015 Yes
w6 ge 0 00000 No
w7 ge 0 00000 No
w8 ge 0 00000 No
w9 ge 0 00000 No
w10ge 0 00000 No
w7 le 005 00003 Yes
w1 + w3 le 04 00002 Yes
w2 + w4 ge 03 00000 No
James A Turner Optimal Portfolios and the R Programming Language
56 International Journal of the Academic Business World 57Fall 2015 (Volume 9 Issue 2)
The portfolio variances are
No short-sale constraints 0001607 Short-sale constraints and three position limits 0001856
APPENDIX 4 RESULTS FOR THE 50-STOCK PORTFOLIO
Results for the 50-stock portfolio with a monthly ex-pected return of 1 are shown in Table 4 below The first table shows the return averages of each stock and the cal-culated portfolio weights both for the portfolio with no short-sale constraints or position limits and the portfolio with short-sale constraints and three position limits (1) a requirement that the percentage invested in the seventh security not exceed 5 (2) a requirement that the total percentage invested in the first and the third securities not exceed 40 and (3) a requirement that the total percent-age invested in the second and fourth securities be at least 30
Table 5 shows the Lagrangian multipliers on the equal-ity constraints and the position limit constraints To save space for the 50-stock portfolio the Lagrangian multi-pliers on the short-sale constraints are not listed Simply checking Table 4 to see if the weight on a particular stock is zero gives an almost certain indication of which short-sale constraints are binding In this example both the constraint that there be no more than 5 invested in the seventh security and the constraint that there be no more than a total of 40 invested in the first and third securi-ties are not binding
Table 4 Average Returns and Weights for the
50-Stock PortfoliosStock
No Permno Average Returns
Weights SS Allowed
IC Weights No SS 3 PLs
1 10001 00064 01934 013072 10002 -00054 -00179 003673 10025 00183 -00189 000004 10026 00156 02873 026335 10032 00095 00503 000006 10044 00012 -00185 000007 10051 00206 -00136 002288 10065 00018 10920 000009 10100 00270 00306 00423
10 10104 00104 01467 0000011 10107 -00001 -02023 00000
Table 4 Average Returns and Weights for the
50-Stock PortfoliosStock
No Permno Average Returns
Weights SS Allowed
IC Weights No SS 3 PLs
12 10138 00085 -05619 0000013 10145 00065 -03910 0000014 10147 00088 -02693 0000015 10180 00290 -00290 0000016 10182 00076 01181 0000017 10200 00082 01409 0040918 10207 00020 -01551 0000019 10225 00098 00285 0000020 10232 00159 -00021 0000021 10239 00051 01624 0000022 10252 00084 00955 0000023 10253 00058 00121 0000024 10257 -00008 -00236 0000025 10258 00196 -00157 0000026 10259 -00300 -01339 0000027 10294 00179 -00414 0000028 10297 00061 01854 0146729 10299 00074 00826 0000030 10302 00165 00201 0000031 10308 00073 01255 0014132 10318 00194 -01389 0000033 10333 -00203 -00205 0000034 10355 00299 -00545 0036035 10363 -00151 -00167 0000036 10375 00010 -00495 0000037 10382 00046 00267 0000038 10395 -00022 00886 0042339 10397 00134 01296 0084940 10421 -00036 -01045 0000041 10443 00021 01389 0000042 10463 00013 00417 0000043 10501 00176 -00458 0000044 10507 -00228 -00397 0000045 10514 00100 00731 0007846 10516 -00034 -00148 0119247 10517 00208 00629 0000048 10530 00005 00032 0000049 10547 00418 00032 0012550 10550 -00028 00397 00000
The portfolio variances are
No short-sale constraints 000002997 Short-sale constraints and three position limits 000111119
Table 5 Constraints and Lagrangian Multipliers
Constraint Lagrangian Multiplier Constraint Binding
Portfolio weights sum to one 0000503 YesPortfolio expected return equals 1 0031954 Yes
w7 le 005 0000000 Now1 + w3 le 04 0000000 Now2 + w4 ge 03 0000963 Yes
James A Turner
58 Fall 2015 (Volume 9 Issue 2)
This page intentionally blank
JOINT CONFERENCE May 25th 26th and 27th 2016 in
Nashville TN
Academic Business World International Conference
(ABWICorg)
The aim of Academic Business World is to promote inclusiveness in research by offering a forum for the discussion of research in early stages as well as re-search that may differ from lsquotraditionalrsquo paradigms We wish our conferences to have a reputation for providing a peer-reviewed venue that is open to the full range of researchers in business as well as reference disciplines within the social sciences
Business Disciplines
We encourage the submission of manuscripts presentation outlines and ab-stracts pertaining to any business or related discipline topic We believe that all disciplines are interrelated and that looking at our disciplines and how they relate to each other is preferable to focusing only on our individual lsquosilos of knowledgersquo The ideal presentation would cross discipline borders so as to be more relevant than a topic only of interest to a small subset of a single disci-pline Of course single domain topics are needed as well
International Conference on Learning and Administration in
Higher Education (ICLAHEorg)
All too often learning takes a back seat to discipline related research The In-ternational Conference on Learning and Administration in Higher Educa-tion seeks to focus exclusively on all aspects of learning and administration in higher education We wish to bring together a wide variety of individuals from all countries and all disciplines for the purpose of exchanging experi-ences ideas and research findings in the processes involved in learning and administration in the academic environment of higher education
We encourage the submission of manuscripts presentation outlines and ab-stracts in either of the following areas
Learning
We encourage the submission of manuscripts pertaining to pedagogical top-ics We believe that much of the learning process is not discipline specific and that we can all benefit from looking at research and practices outside our own discipline The ideal submission would take a general focus on learning rather than a discipline-specific perspective For example instead of focusing on ldquoMotivating Students in Group Projects in Marketing Managementrdquo you might broaden the perspective to ldquoMotivating Students in Group Projects in Upper Division Coursesrdquo or simply ldquoMotivating Students in Group Projectsrdquo The objective here is to share your work with the larger audience
Academic Administration
We encourage the submission of manuscripts pertaining to the administra-tion of academic units in colleges and universities We believe that many of the challenges facing academic departments are not discipline specific and that learning how different departments address these challenges will be ben-eficial The ideal paper would provide information that many administrators would find useful regardless of their own disciplines
- Testing Major Factors for Reducing Obstacles to Product Innovation Success
-
- Dr Tor Guimaraes
- Dr Marcelo Seido Nagano
- Dr Curtis Armstrong
-
- Acceptance of Change Exploring the Relationship among Psychometric Constructs and Employee Resistance
-
- Brian Dunican EdD
- Ric Keaster PhD
-
- The Origin and Construct of Cloud Computing
-
- Nozar Daylami PhD
-
- Optimal Portfolios and the R Programming Language
-
- James A Turner
-
Reviewer Country State Region Affiliation
Zeng Tao Canada Ontario Wilfrid Laurier UniversityZhou Xiyu (Thomas) United States AK University of Alaska FairbanksZiems Wendy United States OH Stautzenberger College
Reviewer Country State Region Affiliation
Smatrakalev Georgi United States FL Florida Atlantic UniversitySmith Allen E United States FL Florida Atlantic UniversitySmith JR United States MS Jackson State UniversitySmith Nellie United States MS Rust CollegeSmith W Robert United States MS University of Southern MississippiSobieralski Kathleen L United States MD University of Maryland University CollegeSoheili-Mehr Amir H Canada Ontario University of TorontoSridharan Uma V United States SC Lander UniversitySt Pierre Armand Canada Alberta Athabasca UniversitySteerey Lorrie United States MT Montana State University-BillingsStokes Len United States NY Siena CollegeStone Karen United States NH Southern New Hampshire UniversityStover Kristie United States VA Marymount UniversityStuart Randy United States GA Kennesaw State UniversityStumb Paul C United States TN Cumberland UniversitySwisshelm Beverly Ann United States TN Cumberland UniversityTalbott Laura United States AL University of Alabama at BirminghamTanguma Jesuacutes United States TX The University of Texas-Pan AmericanTanigawa Utako United States AR Itec International LLCTerrell Robert United States TN Carson-Newman CollegeTerry Kathleen Y United States FL Saint Leo UniversityTheodore John D United States FL Warner UniversityThompson Sherwood United States KYThrockmorton Bruce United States TN Tennessee Technological UniversityTotten Jeffrey United States LA McNeese State UniversityTracy Daniel L United States SD University of South DakotaTran Hang Thi United States TN Middle Tennessee State UniversityTrebby James P United States WI Marquette UniversityTrzcinka Sheila Marie United States IN Indiana University NorthwestUdemgba A Benedict United States MS Alcorn State UniversityUdemgba Benny United States MS Alcorn State UniversityUjah Nacasius United States TX Texas AampM International UniversityUrda Julie Inited States RI Rhode Island CollegeValle Matthew ldquoMattrdquo United States NC Elon Universityvan der Klooster Marie Louise Australia Victoria Deakin UniversityVehorn Charles United States VA Radford UniversityVoss Richard Steven United States AL Troy UniversityVoss Roger Alan United States TX Epicor Software CorporationWade Keith United States FL Webber International UniversityWahid Abu United States TN Tennessee State UniversityWalter Carla Stalling United States MO Missouri Southern State UniversityWalters Joanne United States WI University of Wisconsin-MilwaukeeWanbaugh Teresa United States LA Louisiana CollegeWarner Janice United States Georgian Court UniversityWasmer DJ United States IN Saint Mary-of-the-Woods CollegeWatson John G United States NY St Bonaventure UniversityWilliams Darryl United States TX Walden UniversityWilliams Melissa United States GA Augusta State UniversityWilson Antoinette United States WI University of Wisconsin-MilwaukeeZahaf Mehdi Canada Ontario Lakehead UniversityZaremba Alan United States MA Northeastern University
The JW Press Family of Academic Journals
Journal of Learning in Higher Education (JLHE) ISSN 1936-346X (print)
Each university and accrediting body says that teaching is at the forefront of their mission Yet the attention given to discipline oriented research speaks other-wise Devoted to establishing a platform for showcasing learning-centered articles JLHE encourages the submission of manuscripts from all disciplines The top learning-centered articles presented at ABW conferences each year will be automatically published in the next issue of JLHE JLHE is listed in Cabellrsquos Directory of Publishing Opportunities in Educational Psychology and Administration indexed by EBSCO and under consideration for indexing by Scopus
Individuals interested in submitting manuscripts directly to JLHE should review information at httpjwpresscomJLHEJLHEhtm
Journal of Academic Administration in Higher Education (JAAHE) ISSN 1936-3478 (print)
JAAHE is a journal devoted to establishing a platform for showcasing articles related to academic administration in higher education JAAHE encourages the submission of manuscripts from all disciplines The best articles presented at ABW conferences each year that deal with the subject of administration of academic units will be automatically published in the next issue of JAAHE JAAHE is listed in Cabellrsquos Directory of Publishing Opportunities in Educational Psychology and Administration indexed by EBSCO and under consideration for indexing by Scopus
Individuals interested in submitting manuscripts directly to JAAHE should review information on their site at httpjwpresscomJAAHEJAAHEhtm
International Journal of the Academic Business World (IJABW) ISSN 1942-6089 (print) ISSN 1942-6097 (online)
IJABW is a new journal devoted to providing a venue for the distribution discussion and documentation of the art and science of business A cornerstone of the philosophy that drives IJABW is that we all can learn from the research practices and techniques found in disciplines other than our own The Information Systems researcher can share with and learn from a researcher in the Finance Department or even the Psychology Department
We actively seek the submission of manuscripts pertaining to any of the traditional areas of business (accounting economics finance information systems management marketing etc) as well as any of the related disciplines While we eagerly accept submissions in any of these disciplines we give extra consideration to manuscripts that cross discipline boundaries or document the transfer of research findings from academe to business practice International Journal of the Academic Business World is listed in Cabellrsquos Directory of Publishing Opportunities in Business indexed by EBSCO and under consideration for indexing by Scopus
Individuals interested in submitting manuscripts directly to IJABW should review information on their site at httpjwpresscomIJABWIJABWhtm
International Journal of the Academic Business World 11
INTRODUCTION
Product Innovation (PI) is the first step in the overall pro-cess of product life cycle management as presented by Parry etal (2009) It should be viewed as a critical step having a major impact on a firmrsquos competitive position (Slack et al 2006 Cooper and Chew 1996) It is well understood that PI is not a simple event but a process requiring that it be managed as such Tidd et al (2008) proposed that the PI management process involves searching for a strategic approach for innovation and the challenge of its manage-ment developing mechanisms and structures of effective implementation and developing an organizational context which supports innovation and constructing effective ex-ternal interfaces It is also widely accepted that the process is related to managerial action actions directed by clear strategies objectives and vision disciplined by systemati-cally collecting information and action that renews the or-
ganization now and again by changes (Tushman and An-derson 1997)
At the company operational level many authors focused on specific PI sub-processes as critical to success Cooper and Edgett (2008) considered the monitoring of consump-tion tendencies important in the early stages of product innovation followed by the importance of capturing ideas from external sources Matta (2008) proposed dynamic allocation of mobilized resources between activated proj-ects Cooper (2009) focused on the implementation stage and proposes the use of stage gates cross-functional teams the involvement of suppliers and the use of project man-agement tools Blindenbach-Driessen and Van Den Ende (2010) and Adams et al (2006) focused on evaluating re-sults in learning from past projects proposing the impor-tance of evaluation metrics for project success the use of discussion sessions and the registering of lessons learned
Testing Major Factors for Reducing Obstacles to Product Innovation Success
Dr Tor GuimaraesJesse E Owen Chair
Tennessee Technological University Cookeville Tennessee 38505 USA
Dr Marcelo Seido Nagano School of Engineering at Satildeo Carlos
University of Satildeo Paulo BrazilDr Curtis Armstrong
Decision Science and Management ChairProfessor
Tennessee Tech University Cookeville TN 38505
ABSTRACT The literature on strategic leadership competitive intelligence management of technology and specific charac-teristics of the companyrsquos change process propose their importance in successfully implementing business innovation While these factors may indeed be important to enhance company competitiveness the existing literature contains practically no empirical evidence supporting their relationship to reducing the many problems companies encounter implementing product innovation (PI) A field test was designed with the primary objective of empirically testing the theoretical model addressing which factors if managed appropriately will help reduce the obstacles to PI in practice A questionnaire was developed pilot tested and used to collect data from 47 product innovation managers The results support the theoretical importance of strategic leadership competitive intelligence management of technology and specific characteristics of the companyrsquos change process to reducing the problemsobstacles to successful PI The items used for measuring the main constructs provide further insights into how managers should go about developing these areas within their organizations
Based on the results recommendations are made to practitioners and researchers in this important area
Tor Guimaraes Marcelo Seido Nagano amp Curtis Armstrong Testing Major Factors for Reducing Obstacles to Product Innovation Success
12 International Journal of the Academic Business World 13Fall 2015 (Volume 9 Issue 2)
Therefore despite the technical obstacles inherent in the innovation process most of the failures are due to the way it is managed (Tidd et al 2008)
At the company strategic level the literature on strate-gic leadership competitive intelligence management of technology and specific characteristics of the companyrsquos change process propose their importance in successfully implementing business innovation While these factors may indeed be important to enhance company competi-tiveness the existing literature contains practically no em-pirical evidence supporting their relationship to reducing the many problems companies encounter implementing product innovation (PI) While most authors would agree that the change process has to bear certain characteris-tics another large body of literature deal with the many factors important to innovation success or failure from a broader perspective Many researchers have looked to im-provements in strategic leadership as critical to develop-ing an organization environment conducive to innovation (Waldman et al 2001 Williams 2004) To help define and prioritize important problems and opportunities to the organization many have proposed Competitive Intel-ligence (CI) programs as important to company success (Tarraf amp Molz 2006 duToit 2003 Vedder amp Guynes 2002 Guimaraes amp Armstrong 1998) Further effective Management of Technology (MOT) is thought to be a critical requirement for successfully implementing most modern business changes (Beattie amp Fleck 2005) While these propositions are exceedingly important the existing literature needs more empirical evidence supporting them
While the constructs being studied are well established much can be done for empirically testing the proposed rela-tionships among them Particularly useful might be testing these factors in terms of their effects in reducing the obsta-clesproblems for increasing the likelihood of PI successful implementation This field test was specifically undertaken to meet that goal
THEORETICAL BACKGROUND AND PROPOSED HYPOTHESES
In this section we define the theoretical model proposed in this study the major constructs involved and the hy-potheses to be tested
Dependent Variable Obstacles Encountered In Product Innovation
There is a large collection of studies addressing the or-ganization obstacles (problems) to successful product innovation For example Galia and Legros (2004) and Segarra-Blasco et al (2008) address these problems with the objective of developing a better understanding and sustain public policy proposals Table 1 summarizes the main problems in product innovation that researchers have reported managers encounter in practice and their respective primary literature sources Please note that various authors address specific obstacles in product in-novation ie Galia and Legros (2004) focus on the lack of information about the market the relevant technolo-
gies and the consumer himself herself Cooper (2009) focuses on the difficulty in turning good ideas into actual products while Adams et al (2006) focus is on the dif-ficulty of measuring results and innovation performance
On the other hand the practitioner and academic litera-ture also proposes (Guimaraes 2008 2011) that to man-age change effectively and to reduce potential problems to their innovation efforts organizations need to
1 Be in touch with their markets customers com-petitors new products etc
2 Have adaptive leadership which promotes in-novation
3 Manage technology effectively in supporting the necessary changes and
4 Follow some basic prescriptions while imple-menting the change process
Each one of these are correspondingly represented by the independent variables in this study These are separately defined below each followed by the hypothesis represent-ing the expected inverse relation to PI problems encoun-tered in practice This section in turn will be followed by a description of the methodology used in this study the results and the conclusions and recommendations
Independent Variable Company Competitive Intelligence
The evolution of competitive intelligence has been discussed widely (Calof and Wright 2008 Nemutanzhela amp Iyamu 2011) Competitive intelligence (CI) is a tool that provides a competitive advantage to enterprises
and helps decision-makers (Fleisher amp Wright 2009 Haataja 2011) There are many definitions of CI in the literature (Weiss amp Naylor 2010) and none has achieved worldwide acceptance (Roitner 2008) Haddadi Dousset and Berrada (2010) conclude that the lack of a universally accepted definition of CI makes it a field with unstable borders CI is frequently confused with industrial espionage (Colakoglu 2011)
The importance of competitive intelligence as a key asset is increasingly recognized by managers as useful to keep in touch with what is going on in their markets (Guimaraes 2011 Tarraf amp Molz 2006 Swartz 2005 duToit 2003 Vedder amp Guynes 2002 Darling 1996) With the increase in business competition company survival and success is now determined by its rate of learning If it is faster than external changes the organization will experience long term success (Darling 1996) Ironically even though as much as 68 of US companies have an organized approach to providing information to decision makers (Westervelt 1996) acccording to Ettorre (1995) probably less than 10 percent of American corporations managed the CI process well and effectively integrated the information into their strategic plans in the past According to Fuld and Company (2013) competitive intelligence is a function within large corporations around the globe that serve to track and analyse the competition provide early warning to management as well as report to management on both opportunities and threats both tactical and strategic It is a function that delivers analyses and conducts strategic exercises such as war games and longer term scenario assessments
The antecedents and consequences of competitive intelligence dissemination has been studied by Maltz amp Kohli (1996) Competitor Analysis (CA) was proposed
Table 1Encountered ProblemsObstacles In Product Innovation Source References
Difficulty dealing with uncertainty and risk Stringer(2000) Sharma (1999)Lack of market information Galia and Legros (2004)Lack of information about technology Galia and Legros (2004)Lack of information about the consumer Galia and Legros (2004)Difficulty generating truly new ideas Nemeth (1997)Difficulty evaluatingselecting the best ideas Sharma (1999)Difficulty connecting the portfolio of projects to strategic objectives Cooper Edgett and Kleinschmidt (2001)Difficulty turning selected good ideas into innovative products Cooper (2009)Difficulty measuring results and performance in innovation Adams et al (2006)Lack of qualified staff Galia and Legros (2004)Difficulty orchestratingco-ordinating the various areas for innovation Thamhain (2003)
Strategic
Transactional Leadership
Competitive Intelligence
Problems Encountered in Product Innovation
Innovation Process Used
Strategic Charismatic Leadership
Management of Technology
Figure 1 The Research Model
Tor Guimaraes Marcelo Seido Nagano amp Curtis Armstrong Testing Major Factors for Reducing Obstacles to Product Innovation Success
14 International Journal of the Academic Business World 15Fall 2015 (Volume 9 Issue 2)
by Ghoshal amp Westney (1991) and other approaches useful for companies to collect information from competitors were addressed by Heil amp Robertson (1991) The importance of organization intelligence to financial performance was also demonstrated many years ago Companies with well-established CI programs on the average showed earnings per share of $124 compared to those without CI programs which lost 7 cents (King 1997)
Over time the importance of CI has grown steadily in Asia and in Europe where companies with intelligence budgets of more the $2 million or more did not exist five years ago but today represent 2-3 percent of all intelligence budgets Further in North America programs that spend more than one-million dollars increased from approximately 5-percent of all corporate intelligence program budgets to nearly 10-percent of all budgets (Fuld and Company 2013) Despite its importance and steady adoption all over the world (Pellissier amp Nenzhelele 2013) CI is no panacea and has its prerequisites (Nemutanzhela amp Iyamu 2011)
The literature contains many examples of benefits that can be derived from CI Among these are improved competi-tive edge (Fuld and Company 2013 Pellissier amp Nenzhe-lele 2013 Editors 2004 duToit 2003 McCune 1996 Sawka 1996 Westervelt 1996) and improved overall company performance (Davison 2001 Guimaraes amp Armstrong 1998 Babbar amp Rai 1993) two essential company goals that can be brought about with effective application of competitive intelligence More specific benefits of CI include uncovering business opportunities and problems that will enable proactive strategies (Ellis 1993 Westervelt 1996) providing the basis for continu-ous improvement (Babbar amp Rai 1993) shedding light on competitor strategies (Harkleroad 1993 Westervelt 1996) improving speed to markets and supporting rapid globalization (Baatz 1994 Ettorre 1995) improving the likelihood of company survival (Westervelt 1996) in-creasing business volume (Darling 1996) providing bet-ter customer assessment (Darling 1996) and aiding in the understanding of external influences (Sawka 1996) Benefits such as these provide the basis for firms to better understand the potential impact of the proposed changes and the means by which they can be infused into the com-panyrsquos fabric Based on the above discussion we propose the following hypothesis
H1 Company CI effectiveness is inversely related to problems encountered in product innovation
Independent Variable Strategic Leadership
There is a substantial body of knowledge proposing the im-portance of effective leadership as an ingredient to success-
ful organization change (Guimaraes 2011 Waldman et al 2001) There are many types of leadership (ie formalinformal based on specific skills social status etc) arising from the circumstances in which leadersfollowers find themselves However for the purposes of this study the relevant construct is company strategic leadership Pawar amp Eastman (1997) proposed transactional strategic lead-ership as the one to be operational within an existing or-ganizational system or culture instead of trying to change it It attempts to satisfy the current needs of followers by focusing on exchanges and contingent reward behavior It pays close attention to exceptions or irregularities and takes action to make corrections (Bass 1985 Burns 1978) Conceptually similar to the cultural maintenance form of leadership described by Trice amp Beyer (1993) transactional leadership acts to strengthen existing organization process-es structures strategies and culture
The second form of strategic leadership is transforma-tional or ldquocharismaticrdquo leadership (Pawar amp Eastman 1997) According to Waldman et al (2001) the leader articulates ldquoa vision and sense of mission showing de-termination and communicating high performance ex-pectationsrdquo (p135) The followers reply with confidence in the leader and strong admiration or respect Also they identify with the leaderrsquos vision and with the organiza-tion itself creating a high level of collective cohesion This cohesion and the leaderrsquos expressions of confidence in the followersrsquo ability to attain the vision produce in turn a heightened sense of self-efficacy (Podsakoff et al 1990) Further charismatic leaders are likely to show persistence and enthusiasm in pursuing goals and be demanding of others through the communication of high performance expectations (Kanter 1983 Trice amp Beyer 1993) There is evidence that charismatic leadership at the top executive level is important for company performance (Day amp Lord 1988 Hambrick amp Finkelstein 1987 Yukl 1998) Katz amp Kahn (1978) argued that while charismatic leadership may be more relevant to situations where organization change is important both transactional and transforma-tional (charismatic) leadership are potentially important at the strategic level that it is particularly important as a means of mobilizing an organization to meet the demands of its environment Bass (1985) viewed transactional and charismatic leadership as being somewhat complementary in that both could be displayed by the same individual leader Similarly Trice amp Beyer (1993) acknowledged that both maintenance- and innovation-oriented leader-ship could be shown by a given leader over time Based on the above discussion both types of strategic leadership are tested and we propose
H2 Strategic transactional leadership is inversely re-lated to problems encountered in product innova-tion and
H3 Strategic charismatic leadership is inversely re-lated to problems encountered in product innova-tion
Independent Variable Management of Technology (MOT) To Support Business Change
As business competitiveness increases many business or-ganizations have used technology for redesigning business processes provide new products and services and improve the organization work environment Many authors have proposed the importance of a wide variety of technologies to support business innovation (Li-Hua amp Khalil 2006 Khalil amp Ezzat 2005) Computer Telephony Integration has been touted as a powerful tool to improve the rela-tionship with customers (McCarthy 1996) The effects of computer technology on organization design intelligence and decision making have long been of interest to research-ers (Huber 1990) The use of computers for data mining and warehousing is seen as essential for decision support (Anonymous 1995) Friedenberg amp Rice (1994) and Gui-maraes et al (1997) have proposed Expert Systems as viable implementation vehicles for business change because they are effective in capturing and distributing knowledge and knowledge processing capability across an organization The list of technologies available to support the necessary business changes is endless For business changes requiring technology without effective MOT the change implemen-tation processes would be severely hindered and in many cases rendered impossible Based on the above discussion the following is proposed
H4 MOT effectiveness is inversely related to problems encountered in product innovation
Independent Variable Important Characteristics of the Change Process
For improving the success rate of changes in organizations the literature (Guimaraes amp Armstrong 1998 Guimaraes 2011) proposes several pre-requisites for the process used for implementing change i e conformity to company objectives employee and department participation in the change process customer input reasonably balancing risk taking with cost benefit analysis monitoring progress and communication regarding the change process In other words how change is implemented is an important deter-minant of success Specifically as proposed by Guimaraes amp Armstrong (1998) the important characteristics of the change process enumerated above are expected to influence the companyrsquos ability to change its products Thus we have H5 The extent to which the change process bears the de-sirable characteristics will be inversely related to problems encountered in product innovation
STUDY METHODOLOGY
This section provides an overview of the field-test procedure used and a brief description of the sample supporting this study A description of how the variables were measured the data analysis procedures and the discussion of the study results are presented later
The Data Collection Process
This field test used a questionnaire to collect the relevant data from a convenience sample of 47 product development managers from 32 organizations with global business operations headquartered in the United States The questionnaire was developed based on a survey of the literature and it was tested for readability and content relevancy and completeness in relation to the study objectives This testing was conducted through several meetings and phone conversations with four managers presently directly involved in new product development The questionnaire had a cover letter describing the purpose of the study and providing instructions for the respondents nevertheless the data was collected mostly through personal interviews with the respondents Many of the participants are known personally to the researchers from seminars in product and business process innovation and some are known to have considerable knowledge and experience about their respective companyrsquos policies processes and activities in product innovation
Sample Description
The companies represented in the sample range widely in terms of their industry sector and size Forty two percent of the firms identified their primary business as manu-facturing with the remaining companies distributed fairly evenly across the sectors of communications (11) health care (6) retail (8) banking and finance (11) and other (22) In terms of gross revenues twenty nine percent of the firms were two hundred million dollars in annual sales or less forty six percent were between two hundred million and 800 million dollars and the remain-ing twenty five percent were above 800 million dollars Twenty six percent of the respondent identified that their number of employees were 500 or less thirty nine percent of the companies employed between 500 and 1000 peo-ple and the remaining companies (35) had more than 1000 employees
Construct Measurement
The measuring scale and components for each major vari-able in this study are presented next As discussed earlier the major constructs and their subcomponents have been
Tor Guimaraes Marcelo Seido Nagano amp Curtis Armstrong Testing Major Factors for Reducing Obstacles to Product Innovation Success
16 International Journal of the Academic Business World 17Fall 2015 (Volume 9 Issue 2)
collected from the existing literature have been validated and used by prior studies and provided the theoretical framework for the model empirically tested here
Obstacles Encountered in Product Innovation were collected from the literature as referenced in Table 1 Respondents were asked to ldquoPlease rate the difficulty of the following product innovation problems your company actually encountered over the last three years in comparison with the closest competing organizations you are aware ofrdquo The list of 11 items to be rated includes
1 Dealing with uncertainty and risk 2 Lack of market information 3 Lack of information about technology 4 Lack of information about consumers 5 Difficulty to generate truly new ideas 6 Difficulty to evaluate and select best ideas 7 Difficulty to connect the portfolio of projects to
strategic objectives 8 Difficult to turn selected good ideas into innova-
tive products 9 Difficult to measure results and performance in
innovation 10 Lack of qualified staff and 11 Difficulty orchestratingco-ordinating the vari-
ous areas for innovation This was done using a seven-point Likert-type scale ranging from 1 to 7
1 extremely lower than average 2 much lower 3 somewhat lower 4 average 5 somewhat higher than average 6 much higher and 7 extremely higher
The ratings for these items were averaged to produce a single measure for ldquoproblemsobstacles encounteredrdquo
Strategic Leadership represents the ability of the top management team to provide leadership when the orga-nizational environment requires change Environments perceived as highly uncertain (requiring major changes) tend to be perceived as risky where wrong decisions could be costly Such environments probably generate a high de-gree of stress Charismatic leadership would tend to reduce
stress and generate confidence and perhaps show how un-certainty can be turned into a vision of opportunity and success (Bass 1985) While charismatic leadership may be more relevant to situations where organization change is of major importance both transactional and transformation-al (charismatic) leadership are potentially important at the strategic level Further Bass (1985) viewed transactional and charismatic leadership as being somewhat complemen-tary in that both could be displayed by the same individual leader The same items proposed by Waldman et al (2001) were used to measure the two types of strategic leadership It was assessed by asking the respondents to rate the extent to which their top managers in general exhibit the particu-lar behavior when compared to managers of main compet-ing organizations
Transactional leadership
1 Takes actions if mistakes are made 2 Points out what people will receive if they do
what needs to be done 3 Reinforces the link between achieving goals and
obtaining rewards 4 Focuses attention on irregularities exceptions or
deviations from what is expected 5 Rewards good work
Charismatic leadership
1 Shows determination when accomplishing goals 2 I have complete confidence in them 3 Makes people feel good to be around them 4 Communicates high performance expectations 5 Generates respect 6 Transmits a sense of mission7 Provides a vision of what lies ahead
Characteristics of the Change Process is defined as the degree to which companies promote ldquodesiredrdquo change process activities It was assessed by asking the respondents to rate the importance or focus that the company places on ten areas of change process characteristics These consisted of all significant changes must conform to company objectives all affected departments participate in the change process individual employee input is considered important customers input is considered important business partners input is considered important ability to balance risk taking with costbenefit clearly defined measures to monitor progress change objectives and progress are clearly communicated responding quickly to required change and responding effectively to required change The same seven-point Likert-type scale was used
and the overall rating of characteristics of the change process for each firm was determined as the average of the ten areas
MOT Effectiveness in Supporting Business Change is the extent to which the companyrsquos needs for technology while implementing business change have been met It was measured by asking the respondents to rate this for the overall company and in four specific areas technology leadership in the industry knowledge of how to get the best technology effectiveness with which technology has been used over the years and effectiveness in using technology in comparison with main competitors The respondents were asked to use the same seven point scale described above The measure for MOT effectiveness in supporting business activities is the average of the ratings for these four items
Construct Validity
Several precautions were taken to ensure the validity of the measures used Many of the recommendations by Carmines amp Zeller (1979) were followed To ensure content validity a thorough survey of the relevant literature was undertaken to understand the important aspects of each major variable and its components and not neglect important dimensions of any variable To further reduce the possibility of any non-random error the main source of invalidity (Carmines amp Zeller 1979 p 15) a group of practitioners from different companies with extensive experience in managing PI reviewed the questionnaire for validity (measuring the phenomena intended) completeness (including all relevant items) and readability (making it unlikely that subjects will misinterpret a particular question) Some questions were reworded to improve readability otherwise the items composing each major variable remained as derived from the literature
As proposed by Carmines amp Zeller (1979) ldquoconstruct validation focuses on the extent to which a measure performs in accordance with theoretical expectationsrdquo (p27) To ensure construct validity the theoretical
relationships between the constructs should have been previously established and these relationships hopefully have been empirically supported by different studies over time As discussed earlier the theoretical underpinnings of this study are relatively well established with most of the items in each construct having been addressed before by several authors Second order factor analyses on the two types of strategic leadership (transactional and charismatic leadership) have been performed by prior studies (Guimaraes 2008 Guimaraes 2011) using larger sample sizes and the results indicated that they can be combined into a single factor as done in this study
Data Analysis Procedures
The relatively small sample size (n = 47) requires the use of simple but robust statistical analysis Pearsonrsquos correla-tion coefficients were used to statistically test the possible relationship between the main constructs T-tests and Chi-square statistics for cross-tabulations were used to test the hypotheses Responses from each manager regarding the main constructs were classified into two groups above and below the mean to produce the cross-tabulation tables
RESULTS
Table 2 lists the Pearsonrsquos correlation coefficients and the means and standard deviations for the six major research variables On the average the companies in the sample are thought to be performing slightly above average in the areas of competitive intelligence both components of strategic leadership management of technology and specific characteristics of the companyrsquos change process On the other hand on average the companies in the sample tend to be ldquosomewhat highrdquo in terms of encountering the obstacles to product innovation identified in this study It is also notable that the relatively large standard deviations (mostly above 10) indicate significant differences in performance from company to company One possible explanation for the ldquosomewhat highrdquo average regarding the identification
Table 2 Correlations Between Major Variables
Major Variables Mean StdDev 1 2 3 4 5
1 PI Problems Encountered 47 0832 Competitive Intelligence 42 112 -233 Transactional Leadership 45 098 -20 NS4 Charismatic Leadership 41 122 -35 36 NS5 Management of Technology 44 107 -26 NS 18 136 Change Process Features 43 098 -33 27 14 23 15
Tor Guimaraes Marcelo Seido Nagano amp Curtis Armstrong Testing Major Factors for Reducing Obstacles to Product Innovation Success
18 International Journal of the Academic Business World 19Fall 2015 (Volume 9 Issue 2)
of obstacles to product innovation may be that the industry seminars attended by the product managers may have raised their own performance expectations and problem awareness
Hypothesis H1 proposes that a companyrsquos performance in Competitive Intelligence (CI) is inversely related to prob-lems encountered in product innovation Table 3 shows the results of the cross-tabulations for these two major vari-ables
In Table 3 the number of observations falling in each table cell corroborates that companies performing above average in the performance of CI tend to be below average in terms of encountering problems during product innovation The same inverse relationship tends to hold for companies performing below average in CI thus encountering more difficulty in product innovation About half as many (8 versus 15) organizations report encountering above average product innovation problems when they are performing above average in CI However this also shows that higher than average overall performing in CI is apparently no guarantee that a company will also not encounter above average problems in product innovation On the other
hand below average performance in CI shows a threefold (6 versus 18) increase in higher than average encounters with product innovation problems
As shown in Table 4 t-tests were used to further test the significance of this relationship between the company
performance in CI and product innovation problems encountered Respondents in the two groups above and below the average performance in CI are compared in aggregate and along each of the product innovation problems identified in the literature The results clearly demonstrate that compared to below average firms companies with above average performance in CI have encountered product innovation problems at a significantly lower level on many of the product innovation problems identified Based on the above results we find strong support for hypothesis one
Results from Hypothesis Two Testing
Hypothesis two proposes that performance in overall company Strategic Transactional Leadership is inversely related to problems encountered in product innovation This was tested in a similar manner as for hypothesis one respondents were placed in two groups based on their above or below average ratings in Strategic Leadership Table 5 shows the results of the cross-tabulations between the two major constructs Sixteen of the 24 companies that were below average Transactional Leadership performance are above average in terms of encountering product innovation problems On the other hand some companies (13) with a below average Transactional Leadership performance somehow were able to avoid having above average encoun-
ters with product innovation problems Further above av-erage Transaction Leadership in 6 organizations has not precluded them from encountering above average product innovation problems
As shown in Table 6 t-tests were used to further test the significance of the relationship between a companyrsquos higher or lower than average Transactional Leadership and specific product innovation problems encountered The two groups are compared in aggregate and along each of the product innovation problems identified in the lit-
Table 4 T-Tests for Performance in Competitive Intelligence and
Each Product Innovation Problem Encountered
Aggregated Variable and Individual Items
Competitive Intelligence
Below Average Performance
Competitive Intelligence
Above Average Performance
p-Value
Problems encountered in product innovation 47 41 003Difficult to deal with uncertainty and risk 51 45 002Lack of market information 53 35 000Lack of information about technology 47 36 001Lack of information about the consumer 52 37 001Difficult to generate truly new ideas 45 43 Not Significant
Difficult to evaluate and select the best ideas 46 48 Not Significant
Difficulty to connect the portfolio of projects to strategic objectives
49 43 Not Significant
Difficult to turn selected good ideas into innovative prod-ucts
43 44 Not Significant
Difficult to measure results and performance in innova-tion
48 40 001
Lack of qualified staff 45 39 002Difficult to orchestrate and co-ordinate the various areas for innovation
40 38 Not Significant
means plt05 means plt 01
Table 5 Cross-Tabulations of
Transactional Leadership and Product Innovation Problems
(Hypothesis 2)Product Innovation
Problems EncounteredBelow
AverageAbove
Average
Transactional Leadership
Below Average 8 16
Above Average 13 6
Chi-square = 52 (p = 002)
Table 6 T-Tests for Transactional Leadership and
Each Product Innovation Problem Encountered
Aggregated Variable and Individual Items
Transactional Leadership
Below Average Performance
Transactional Leadership
Above Average Performance
p-Value
Problems encountered in product innovation 47 42 004Difficult to deal with uncertainty and risk 53 44 001Lack of market information 44 42 Not SignificantLack of information about technology 47 43 Not SignificantLack of information about the consumer 43 39 Not SignificantDifficult to generate truly new ideas 45 42 Not Significant Difficult to evaluate and select the best ideas 46 44 Not Significant Difficulty to connect the portfolio of projects to strategic objec-tives
50 41 001
Difficult to turn selected good ideas into innovative products 51 44 001Difficult to measure results and performance in innovation 49 42 001Lack of qualified staff 46 43 Not SignificantDifficult to orchestrate and co-ordinate the various areas for in-novation
47 35 001
Table 3 Cross-Tabulation of Performance in
Competitive Intelligence and PI Problems (Hypothesis 1)
Product Innovation Problems Encountered
Below Average
Above Average
Performance in Competitive
Intelligence
Below Average 6 18
Above Average 15 8
Chi-square = 768 (p = 000)
Tor Guimaraes Marcelo Seido Nagano amp Curtis Armstrong Testing Major Factors for Reducing Obstacles to Product Innovation Success
20 International Journal of the Academic Business World 21Fall 2015 (Volume 9 Issue 2)
erature The results clearly demonstrate that compared to below average firms companies with higher than aver-age Transactional Leadership have encountered product innovation problems at a significantly lower level along many of the product innovation problems identified The above results corroborates hypothesis two
Results from Hypothesis Three Testing
Hypothesis three proposes that firms having strong char-ismatic leadership is inversely related to encountering problems in product innovation This has been tested in a similar fashion as hypotheses 1 and 2 Table 7 shows the results of the cross-tabulations for belowabove average company resources availability and belowabove average encounters with product innovation problems Similar to the cross-tabulations used for testing the hypotheses addressing the other major constructs the results in this case confirm expectations and should be interpreted ac-cordingly
As shown in Table 8 t-tests were again used to further test the significance of this relationship between Charismatic Leadership and specific product innovation problems en-countered The results clearly demonstrate that compared to below average firms companies with above average Charismatic Leadership have encountered product inno-vation problems at a significantly lower level along many
of the product innovation problems identified While the small sample size has resulted in several non-significant comparisons in no case the comparison contradicted the general hypothesis Based on the above results we also find strong support for hypothesis three
Results from Hypothesis Four Testing
Tested in similar fashion hypothesis four proposes that having effective management of technology is inversely
related to encountering problems in product innovation Table 9 shows the results of the cross-tabulations for be-lowabove average management of technology effective-ness and belowabove average encounters with product in-novation problems Similar to the cross-tabulations used for testing the hypotheses addressing the other major con-structs the results in this case confirm expectations and should be interpreted accordingly
As shown in Table 10 t-tests were again used to further test the significance of this relationship between the company MOT effectiveness and specific product inno-vation problems encountered The results clearly demon-strate that compared to below average firms companies with above average MOT performance have encountered product innovation problems at a significantly lower level along many of the product innovation problems identi-fied Based on the above results we also find strong sup-port for hypothesis four
Results from Hypothesis Five Testing
Hypothesis five proposes that having a product change process with the desirable characteristics is inversely related to encountering problems in product innovation This has been tested the same way Table 11 shows the results
of the cross-tabulations for belowabove average product change process and belowabove average encounters with specific product innovation problems The results in this case confirm expectations and should be interpreted accordingly
As shown in Table 12 t-tests were again used to further test the significance of this relationship between the product change process and specific product innovation problems encountered C to below average firms companies with
Table 8 T-Tests for Charismatic Leadership and
Each Product Innovation Problem Encountered
Aggregated Variable and Individual Items
Charismatic Leadership
p-ValueBelow
AverageAbove
Average
Problems encountered in product innovation 50 39 001
Difficult to deal with uncertainty and risk 52 41 001Lack of market information 49 42 001Lack of information about technology 50 40 002Lack of information about the consumer 47 38 001Difficult to generate truly new ideas 48 38 001Difficult to evaluate and select the best ideas 51 41 001Difficulty to connect the portfolio of projects to strategic objectives 52 38 001Difficult to turn selected good ideas into innovative products 51 43 001Difficult to measure results and performance in innovation 47 37 001Lack of qualified staff 52 36 001Difficult to orchestrate and co-ordinate the various areas for innovation 50 35 001
Table 10 T-Tests for Management of Technology and
Each Product Innovation Problem Encountered
Aggregated Variable and Individual Items
Management of Technology
p-ValueBelow
AverageAbove
Average
Problems encountered in product innovation46 40 003
Difficult to deal with uncertainty and risk 48 34 001Lack of market information 46 35 001Lack of information about technology 52 36 000Lack of information about the consumer 43 41 Not SignificantDifficult to generate truly new ideas 47 40 Not SignificantDifficult to evaluate and select the best ideas 43 42 Not SignificantDifficulty to connect the portfolio of projects to strategic objectives 45 43 Not SignificantDifficult to turn selected good ideas into innovative products 46 41 004Difficult to measure results and performance in innovation 48 42 003Lack of qualified staff 47 44 Not Significant
Difficult to orchestrate and co-ordinate the various areas for innovation 43 41 Not Significant
Table 7 Cross-Tabulations of
Charismatic Leadership and Product Innovation Problems
(Hypothesis 3)Product Innovation
Problems EncounteredBelow
AverageAbove
Average
Charismatic Leadership
Below Average 7 15
Above Average 16 9
Chi-square = 48 (p = 003)
Table 9 Cross-Tabulations of
Management of Technology and Product Innovation Problems
(Hypothesis 4)Product Innovation
Problems EncounteredBelow
AverageAbove
Average
M a n a g e me nt of Technology
Below Average 9 14
Above Average 18 8
Chi-square = 45 (p = 003)
Tor Guimaraes Marcelo Seido Nagano amp Curtis Armstrong Testing Major Factors for Reducing Obstacles to Product Innovation Success
22 International Journal of the Academic Business World 23Fall 2015 (Volume 9 Issue 2)
more relevant within an existing organization environment instead of one attempting to implement changes Katz amp Kahn (1978) argued that charismatic leadership may be more relevant where organization change is important but that both types of strategic leadership are potentially important Our results indicate that indeed for more successful (less problems encountered) product innovation both types of leadership are important
Regarding CI there are also some major implications from this study results To improve their CI programs managers need to consider the collection of market intelligence based on the six areas addressed in this study the traditional industry competitors emerging competitors traditional customer needs and wants non-traditional customer needs and wants relationships with business partners and new product or service development The importance of any one of these areas may be relatively higher or lower and in some cases some of these sources may be irrelevant depending on the companyrsquos specific industry sector line of business products and processes being considered Good performance in these areas whenever applicable to the companyrsquos industry sector and lines of business are likely to reduce problems encountered which in turn is likely to lead to more product innovation
To improve technology management which is found to be useful reducing product innovation problems managers must look at company performance in terms of its technology leadership position in its main industry sectors knowledge of how to get the best technology available effective use of specific technologies and benchmarking the use of specific technologies against the companyrsquos main competitors or best-in-class target organizations An important requirement to accomplish these objectives is the clear definition of the more important technologies necessary to support and enhance the companyrsquos products Another important requirement is management recognition that the implementation of each of the various technologies deemed important to the organization are dependent on specific success factors The success factors for the various technologies have been identified and discussed elsewhere (Guimaraes Igbaria amp Lu 1992 Guimaraes amp Igbaria 1997 Yoon Guimaraes amp Clevenson 1998 Yoon Guimaraes amp Clevenson 1995 Yoon Guimaraes amp OrsquoNeal 1995 Udo amp Guimaraes 1994) and are considered beyond the scope of this paper
Last top managers must ensure that their companysrsquo product change process bear the desirable characteristics studied here all significant changes must conform to company objectives all affected departments participate in the change process individual employee input is considered important customers input is considered important business partners input is considered important managers
above average performance in product change process have encountered product innovation problems at a significantly lower level along many of the product innovation problems identified Based on the above results hypothesis five is corroborated
DISCUSSION MANAGERIAL RECOMMENDATIONS AND
FURTHER RESEARCH
Despite the relatively small sample size the results provide strong evidence regarding the importance of strategic leadership competitive intelligence management of
technology and specific characteristics of the companyrsquos change process to the success of product innovation Given the importance of effectively implementing business innovation in these days of hyper competitiveness it behooves top managers to do whatever they can to improve their companysrsquo performance in the areas of strategic leadership competitive intelligence management of technology and characteristics of the process used to reduce problems encountered with the product innovation process so vital to company performance
In the area of strategic leadership several implications can be derived from this study Charismatic leadership (showing determination while accomplishing goals inspiring confidence making people feel good around you communicating expectations for high performance generating respect transmitting a sense of mission and providing a vision of what lies ahead) is on average and as a whole relatively scarce in industry today and judging by its nature it should be difficult to develop Nevertheless managers must try particularly in high clockspeed industry sectors (Guimaraes et al 2002) requiring continuous innovation Also apparently important for successful product innovation transactional leadership (taking action if mistakes are made pointing out what people will receive if they do what needs to be done reinforcing the link between achieving goals and obtaining rewards focusing attention on deviations from what is expected and rewarding good work) by its nature should be easier to develop Pawar amp Eastman (1997) proposed that transactional leadership is
ability to balance risk taking with costbenefit the existence of clearly defined measures to monitor progress that change objectives and progress are clearly communicated and that the product innovation teams respond quickly and effectively to required change These guidelines must be widely disseminated and enforced by project managers and employees involved in product changes
The primary objective of this research has three interrelated components 1) to identify and assess the variety of problems encountered by companies while performing the vital process of product innovation 2) to identify and assess the major factors proposed in the literature as necessary to increase the likelihood of success in product innovation and 3) to test if these literature proposed success factors for product innovation also show a positive impact by reducing the problems associated with the product innovation process in practice Thus it is safe to assume that the measures for each of the major constructs studied here derived from a large number of separate studies represent an important contribution to future researchers and practicing product innovation managers aiming to improve their company effectiveness in this critical area
During the process of conducting this research informal discussions with several of the product development managers made abundantly clear that over time success in product development can only be achieved by a complex combination of many factors stemming from three major areas humanorganizational technological and market knowledge elements This multidimensional requirement for success as well as an intrinsic presence of risk and the need to find tangible and intangible resources is a huge challenge for product innovation management in general As the results from this study indicated all the major factors addressed here are important but do not by themselves ensure successful product innovation It seems to be rather analogous to a case where basic components must be in combination transformed into improved products which provide greater value to the market place
STUDY LIMITATIONS AND OPPORTUNITIES FOR FURTHER RESEARCH
Based on an extensive survey of the relevant literature this study is a first attempt at empirically testing the im-portance of strategic leadership competitive intelligence management of technology and specific characteristics of the companyrsquos change process for the success of product in-novation The theoretical model proposed here addresses five major determinants of how to reduce obstaclesprob-lems for successful PI based on the existing literature There might be other important factors for reducing the PI prob-lems defined in this study Given the importance of the
Table 12 T-Tests for Change Process Features and
Each Product Innovation Problem Encountered
Aggregated Variable and Individual ItemsChange Process Features
p-ValueBelow Average
Above Average
Problems encountered in product innovation 49 40 001Difficult to deal with uncertainty and risk 51 42 001Lack of market information 49 40 001Lack of information about technology 50 41 001Lack of information about the consumer 48 37 001Difficult to generate truly new ideas 47 40 001Difficult to evaluate and select the best ideas 52 43 001Difficulty to connect the portfolio of projects to strategic objectives 49 38 001Difficult to turn selected good ideas into innovative products 50 43 001Difficult to measure results and performance in innovation 48 39 001Lack of qualified staff 47 37 001Difficult to orchestrate and co-ordinate the various areas for innovation 52 41 001
Table 11 Cross-Tabulations of
Change Process Features and Product Innovation Problems
(Hypothesis 5)Product Innovation
Problems EncounteredBelow
AverageAbove
Average
C h a n g e P r o c e s s Features
Below Average 8 15
Above Average 17 9
Chi-square = 46 (p = 003)
Tor Guimaraes Marcelo Seido Nagano amp Curtis Armstrong Testing Major Factors for Reducing Obstacles to Product Innovation Success
24 International Journal of the Academic Business World 25Fall 2015 (Volume 9 Issue 2)
topic future research should strive to identify and include these potential factors in an expanded theoretical model
Another opportunity for future research stems from the fact that even though the relatively small sample in this study has shown very encouraging statistically significant results larger sample sizes will be much more convincing Therefore we strongly recommend new research projects with larger sample sizes capable of supporting multivariate analyses expanded theoretical models and enable the assessment of more complex relationships among the important constructs addressed in this study Perhaps the use of a path analytic modeling technique would be applicable in this case The results should provide valuable information on the extent to which strategic leadership can positively influence the effective use of technology and CI programs for companies to improve their business competitiveness while ensuring that the change process follow prescribed guidelines suggested in this study
Finally a third area of future research opportunity deals with the integration and expansion of theoretical mod-els relating the many determinants of success in product innovation to include the new construct of ldquoobstacles to product innovationrdquo as a likely moderating variable in these theoretical models Combined these three areas of research opportunity should support a host of research studies important not only to the academic community but also to product innovation managers
REFERENCES
Adams R Bessant J amp Phelps J (2006) Innovation management measurement A review International Journal of Management Reviews 8(1) 21-47
Anonymous (1995) Data mining a new weapon for com-petitive advantage Software Quarterly 2 (4) 15-19
Baatz E B (1994 Sept 15) The quest for corporate smarts CIO 48-58
Babbar S amp Rai A (1993) Competitive intelligence for international business Long Range Planning 263103-113
Bass BM (1985) Leadership and Performance beyond Expectations New York Free Press
Beattie JS amp Fleck J (2005) New perspectives on stra-tegic technology management in small high-tech com-panies Proceedings from IEEE International 2005 Engineering Management Conference
Blindenbach-Driessen F amp Van Den Ende J (2010) In-novation management practices compared the exam-ple of project-based firms Journal of Product Innova-tion Management 6(3) 33-53
Burns J M (1978) Leadership New York Harper amp Row
Calof JL amp Wright S (2008) Guest Editorial Com-petitive intelligence a practitioner academic and inter-disciplinary perspective European Journal of Market-ing 42(78) 717-730
Carmines E amp Zeller R (1979) Reliability and Validity Assessment Beverly Hills CA Sage
Colakoglu T (2011) The problematic of competitive intelligence How to evaluate and develop competi-tive intelligence Procedia ndash Social and Behavioral Sci-ences 24(1) 1615ndash1623 httpdxdoiorg101016jsbspro201109075
Cooper RG (2009) How companies are reinventing their idea-to-launch methodologies Research Technol-ogy Management 52(2) 47-57
Cooper RG and Chew MB (1996) Control tomor-rowrsquos costs through todayrsquos designs Harvard Business Review January-February 88-98
Cooper R amp Edgett S (2008) Ideation for product in-novation what are the best methods PDMA visions magazine 1(1) 12-17 httpwwwstage-gatecomknowledgephp
Cooper R Edgett S amp Kleinschmidt E (2001) Portfo-lio management for new product development results of an industry practices study RampD Management 31(4) 361-380
Darling M S (1996) Building the knowledge organiza-tion Business Quarterly 61(2) 61-66
Davison L (2001) Measuring competitive intelligence effectiveness Insights from the advertising industry Competitive Intelligence Review 12 (4) 25-38
Day DV amp Lord RG (1988) Executive leadership and organizational performance suggestions for a new theory and methodology Journal of Management 14 4593-464
du Toit A (2003) Competitive intelligence in the knowl-edge economy What is in it for South African manu-facturing enterprises International Journal of Infor-mation Management 23 111-120
Editors (2004 MarchApril) Competitive intelligence and records managers The Information Management Journal 4
Ellis J R (1993) Proactive competitive intelligence Us-ing competitive scenarios to exploit new opportunities Competitive Intelligence Review 4(1) 13-24
Ettorre B (1995) Managing competitive intelligence Management Review 84(10) 15-19
Fleisher CS amp Wright S (2009) Examining differences in competitive intelligence practice China Japan and the West Thunderbird International Business Review 51(3) 249ndash261 httpdxdoiorg101002tie20263
Friedenberg R amp Rice A (1994 August 3) Knowledge re-engineering as a BPR strategy Working Notes of the AAAI-94 Workshop on Artificial Intelligence in Business Process Reengineering Seattle WA pp 21-26
Fuld amp Company (2013) Certain industries invest heavi-ly in watching their competition Fuld Insights-Global Benchmarking Project Update March 2013
Galia F amp Legros D (2004) Complementarities be-tween obstacles to innovation evidence from France Research Policy 33 1185ndash1199
Ghoshal S amp Westney D E (1991 Jan) Organizing competitor analysis systems International Journal of the Academic Business World 2(1) pp 35-44
Guimaraes T (2011) Industry Clockspeedrsquos Impact on Business Innovation Success Factors European Journal of Innovation Management 14(3) 322-344
Guimaraes N amp Armstrong C (1998) Exploring the relation between competitive intelligence IS support and business change Competitive Intelligence Review 9(3) 45-54
Guimaraes T Cook D amp Natarajan N (2002) Explor-ing the importance of business clockspeed as a modera-tor for determinants of supplier network performance Decision Sciences 33(4) 629-644
Guimaraes N amp Igbaria M (1997) Clientserver sys-tem success Exploring the human side Decision Sci-ences 28(4) 851-876
Guimaraes N Igbaria M amp Lu M (1992) Determi-nants of DSS success An integrated model Decision Sciences 23(2) 409-430
Guimaraes T Yoon Y amp Clevenson A (1997) Empiri-cally testing ES success factors in business process reen-gineering International Journal of Production Econom-ics 50 245-259
Haataja J (2011) Social media as a source of competitive intelligence in a pharmaceutical corporation Masterrsquos thesis School of Science Aalto University
Haddadi AE Dousset B amp Berrada I (2010) Xplor EveryWhere ndash The Competitive Intelligence Sys-tem for Mobile in IEEE Xplorereg retrieved 25 March
2015 from httpieeexploreieeeorgstampstampjsptp=amparnumber=5945635
Hambrick DC amp Finkelstein S (1987) Managerial Discretion A Bridge between Polar Views of Organi-zational Discretion In LL Cummings amp BM Staw (Eds) Research in Organizational Behavior Green-wich CT JAI Press 9 369-406
Harkleroad D (1993) Sustainable growth rate analysis Evaluating worldwide competitorsrsquo ability to grow profitability Competitive Intelligence Review 4(23) 36-45
Heil O amp Robertson T S (1991 Sep) Toward a theory of competitive market signaling A research agenda Strategic Management Journal 12(6) 403-418
Huber G P (1990 Jan) A theory of the effects of ad-vanced information technologies on organizational design intelligence and decision making Academy of Management Review 15(1) 47-71
Kanter RM (1983) The Change Masters New York Si-mon amp Schuster
Katz D amp Kahn RL (1978) The Social Psychology of Organizations (2nd ed) New York Wiley
Khalil TM amp Ezzat HA (2005) Management of technology and responsive policies in a new economy International Journal of Technology Management 32(12) 88
King M (1997 March 10) Corporations take snooping mainstream Indianapolis Business Journal 17(2) 1-4
Li-Hua R amp Khalil TM (2006) Technology manage-ment in China A global perspective and challenging issues Journal of Technology Management in China 1(1) 9
Maltz E amp Kohli A K (1996 Feb) Market intelligence dissemination across functional boundaries Journal of Marketing Research 33(1) 47-61
Mata RS (2008) Inovaccedilatildeo tecnoloacutegica em multinacio-nais brasileiras estudo multicaso sobre gestatildeo do port-folio de projetos de novos produtos 192p Dissertaccedilatildeo (Mestrado) ndash Faculdade de Economia Administraccedilatildeo e Contabilidade de Ribeiratildeo Preto Universidade de Satildeo Paulo Ribeiratildeo Preto
McCarthy V (1996) CTI lets you coddle customers at lower cost Datamation 42(13) 46-49
McCune J C (1996) Checking out the competition Be-yond Computing 5(2) 24-29
Nemeth C (1997) Managing innovation when less is more California Management Review 40(1) 59-74
Tor Guimaraes Marcelo Seido Nagano amp Curtis Armstrong
26 Fall 2015 (Volume 9 Issue 2)
Nemutanzhela P amp Iyamu T (2011) The impact of competitive intelligence on products and services in-novation in organizations International Journal of Advanced Computer Science and Applications 2(11) 38-44
Parry ME Song M De Weerd-Nederhof PC amp Viss-cher K (2009) The impact of NPD strategy product strategy and NPD processes on perceived cycle time Journal of Product Innovation Management 26 (6) 627-639
Pawar BS amp Eastman KK (1997) The nature and implications of contextual influences on transforma-tional leadership A conceptual examination Academy of Management Review 22 80-109
Pellissier R amp Nenzhelele TE (2013) Towards a univer-sal definition of competitive intelligence SA Journal of Information management 15(2) Art 559 7 pages httpdxdoiorg104102sajimv15i2559 Retrieved 31 March 15
Podsakoff PM MacKenzie SB Moorman RH amp Fetter R (1990) Transformational leader behaviors and their effects on followersrsquo trust in leader satisfac-tion and organizational citizenship behaviors Leader-ship Quarterly 1107-142
Roitner A (2008) Competitive intelligence in Austria An empirical study Masterrsquos dissertation University of Vienna
Sawka K A (1996) Demystifying business intelligence Management Review 85(10) 47-51
Segarra-Blasco A Garcia-Quevedo J amp Teruel-Carrizo-sa M (2008) Barriers to innovation and public policy in Catalonia The International Entrepreneurship and Management Journal 4(4) 431-451
Sharma A (1999) Central dilemmas of managing inno-vation in large firms California Management Review 3941(3) 46-164
Slack N Chambers S Johnston R and Betts A (2006) Operations and Process Management Princi-ples and Practice for Strategic Impact 2nd ed Prentice Hall Harlow
Stringer R (2000) How to manage radical innovation California Management Review 42(4) 70-88
Swartz N (2005) Competitive intelligence underuti-lized Information Management 39(3)
Tarraf P amp Molz R (2006) Competitive Intelligence at Small Enterprises SAM Advanced Management Journal l 71 (4) 24-34
Thamhain HJ (2003) Managing innovative RampD teams RampD Management 33(3) 297-311
Tidd J Bessant J amp Pavitt K (2008) Gestatildeo da inova-ccedilatildeo 3ed Satildeo Paulo Artmed
Trice HM amp Beyer JM (1993) The Cultures of Work Organizations Englewood Cliffs JN Prentice-Hall
Tushman M amp Anderson P (1997) Managing Strategic Innovation and Change Oxford University Press Ox-ford 3-23
Udo G amp Guimaraes N (1994) Empirically assessing factors related to DSS benefits European Journal of In-formation Systems 3(3) 218-227
Vedder RG amp Guynes CS (2002) CIOsrsquo Perspectives on competitive intelligence Information Systems Man-agement 19(4) 49-56
Waldman DA Ramirez GG House RJ amp Puranam P (2001) Does leadership matter CEO leadership at-tributes and profitability under conditions of perceived environmental uncertainty Academy of Management Journal 44(1) 134-143
Weiss A amp Naylor E (2010) Competitive intelli-gence How independent information professionals American Society for Information Science and Tech-nology 37(1) 30ndash34 httpdxdoiorg101002bult20101720370114
Westervelt R (1996) Gaining an edge Competitive in-telligence takes off Chemical Week 158(25) 29-31
Williams SD (2004) Personality attitude and leader influences on divergent thinking and creativity in or-ganizations European Journal of Innovation Manage-ment 7(3) 187-204
Yoon Y Guimaraes T amp Clevenson A (1995) Under-standing the factors important to expert systems suc-cess Technology Management 2(3) 1-14
Yoon Y Guimaraes T amp Clevenson A (1998) Explor-ing ES success factors for BPR Journal of Engineering and Technology Management 15 179-199
Yoon Y Guimaraes T amp OrsquoNeal Q (1995) Exploring the factors associated with expert systems success MIS Quarterly 19(1) 83-106
Yukl GA (1998) Leadership in Organizations (4th ed) Englewood Cliffs NJ Prentice-Hall
International Journal of the Academic Business World 27
INTRODUCTION
Nothing stays the same part of the human condition involves adjusting to change Yet human resistance to change is both intense and natural Perhaps examples of this resistance occur in employeesrsquo personal lives or arise as they approach new ideas or changes at work Through a myriad of changes characterized by global demands unpredictable environments the onset of technologi-cal advances and operational developments managing change and resistance has become a way of life for many organizations (Judge Thoresen Pucik amp Welbourne
1999) Organizations must depend on capable leader-ship to guide them through these unprecedented times The evolution of change requires employees at all levels to embrace new techniques of working by promoting dif-ferent mindsets (Kets de Vries Ramo amp Korotov 2009) Gondo Patterson and Palacios (2013) suggested that some organizations fail to adapt to change and prepare their leadership and employees for a more uncertain fu-ture Yet their study summarized that successful change involves support of formulated strategies and the facilita-tion of change recipients being mindful during change ef-forts In the face of intense global competition it is criti-
Acceptance of Change Exploring the Relationship among
Psychometric Constructs and Employee Resistance
Brian Dunican EdDWestern Kentucky University
1906 College Heights BoulevardBowling Green KY 42101
Ric Keaster PhD Western Kentucky University
1906 College Heights BoulevardBowling Green KY 42101
ABSTRACTChange is inevitable and can influence numerous events inside and outside an organization The contrasting at-titudes of acceptance and resistance to change are an increasingly interesting topic in todayrsquos global ever-changing and competitive environment Discovering the behavioral origins of employeesrsquo reactions to change is an integral part of understanding the way in which individual mindset may play a role in coping with organizational change and resistance This body of knowledge may give organizations insight for creating a competitive advantage over their counterparts
Conceivably it can be argued that some researchers view change as a process of gradual adaptation that is largely in-fluenced by people in organizations who react to internal and external pressures while others view it as an emergent event due to environmental selections (Demers 2007) Through both concepts successful navigation through change events relies on the manner in which humans respond to these occasions
The current study employed a descriptive non-experimental correlational design to examine individualsrsquo self-rating of their level of mindfulness tolerance of ambiguity and resistance to change in four industries located in Kentucky The quantitative study sought to identify the strengths of the relationship of the chosen variables using validated instruments ndash Langerrsquos (Pirson Langer Bodner amp Zilcha-Mano 2012) Langer Mindfulness Scale (LMS14) Bud-nerrsquos (1962) Tolerance of Ambiguity Scale (TOA) and Oregrsquos (2003) Resistance to Change Scale (RTC) Regression models were utilized to evaluate multivariate relationships among the variables Based on the findings in the current study the results indicated that no differences lie between group comparisons of organizational or demographic fac-tors when examining the relationship among the elements of mindfulness tolerance of ambiguity and resistance to change Bivariate correlations yielded both strong positive and negative relationships among the three scales assessed by salary (exempt and non-exempt) employees located across the different industries (p lt 01)
Brian Dunican amp Ric Keaster Acceptance of Change Exploring the Relationship among Psychometric Constructs and Employee Resistance
28 International Journal of the Academic Business World 29Fall 2015 (Volume 9 Issue 2)
cal for organizations to have the dexterity to accept new changes and adapt to survive (Gondo et al 2013 Jacobs 2005) Discovering the behavioral origins of employee re-actions to change is an integral part of understanding the recipe for flexibility longevity and organizational success Researchers have separately alluded to varying degrees of social psychological constructsmdashparticularly elements of mindfulness and tolerance of ambiguitymdashand their influ-ence on individualsrsquo attitudes toward change and resis-tance (Banning 2003 Langer 1993)
BACKGROUND
By its nature change in organizations is inherently stress-ful causing increased anxiety among employees at each level of the organization This environment of uncertain-ty can threaten the balance of control often distracting organizations from obtaining the stability needed to sur-vive and adapt to change Researchers have analyzed sev-eral techniques for strengthening the idea of overcoming uncertainty Carson and Langer (2006) stated ldquoActively thinking about paradoxes increase onersquos ability to toler-ate ambiguity and decreases the anxiety associated with uncertainty In a separate study Weinstein Brown and Ryan (2009) contended that increased mindfulness in individuals promoted greater attention and awareness in situations (organizational change for example) perceived as stressful or threatening
Leaders throughout organizations must possess the skills and cognitive experience to manage varying degrees of uncertainty and balance the levels of tolerance within their organizations (Lane amp Klenke 2004) This notion is reinforced by Topping (2002) in that change implies uncertainty and uncertainty can drive individuals to feel afraid uncomfortable threatened anxious and as a result resistant to change On the contrary acknowl-edging uncertainty can lead to the exploration for clarity and challenges of the status quo (Geller 2002) A rapidly growing amount of literature is available on mindfulness which insinuates how this construct could aid in navigat-ing through areas of uncertainty (Brown amp Ryan 2004 Lane amp Klenke 2004 Langer 1993 Weinstein et al 2009) Brown and Ryanrsquos (2004) multifaceted definition of mindfulness recognized it as ldquoa phenomenon with functional import for outcomes as diverse as physical health psychological well-being work and sports perfor-mance and relationshipsrdquo (p 242)
The process of conforming to change or an innovation may seem difficult for individuals within organizations yet examples exist in which individuals adapt very easily and seem to flourish within this environment Judge et al (1999) explained that organizational change has been predominately conducted at a middle range or macro
level rather than at the micro individual level Changes in organizations are not always clear even for the leaders Through the vagueness of change innovative organiza-tions deliberately take actions to avoid misinterpretations and to improve the process (Limerick Passfield amp Cun-nington 1994) ldquoAs organizational structures become less hierarchical and more fluid and amorphous tolerance for ambiguity and uncertainty is likely to emerge as a quality that differentiates effective from ineffective leadersrdquo ac-cording to Lane and Klenke (as cited in Ehrlich Meindl amp Viellieu 1990 p 69) As organizations are naturally subject to uncertainties the concept of increasing employ-eesrsquo abilities to deal with ambiguous situations may lead to more success or important gains in knowledge about organizations
Resistance to Change
The literature presents an enduring consensus on the premise that it is human nature to resist change and ele-ments related to the process of change (Coch amp French 1948 Conner 1992 Oreg 2003 OrsquoToole 1995 Zander 1950) This notion of natural resistance is supported by Kotter (1995) as he described change as the force of shift-ing conditions within the human communities Contest-ed by Dent and Goldberg (1999) the phrase resistance to change should be reevaluated under a more conventional definition Although the researchers supported the belief that resistance is natural their views have challenged the idea of the way in which individuals resist change Blindly supporting the belief that one can resist change may be counterproductive and may direct the focus of organiza-tions away from the actual issues The idea of contradict-ing this belief opens the possibilities that inefficiencies in the process of change and its impact on individuals should be acknowledged and explored (Mabin Forgeson amp Green 2001) As a whole regardless of the process resistance to change is driven at the individual level and is leveraged by organizations to foster change (Conner 1992 Judson 1991)
Employees of organizations may withdraw from the fear of ideas they do not fully understand or act rebellious to-ward seemingly unclear decisions made by management without proper cause Ideally change within organiza-tions should be straightforward clear and concise prior to implementation More often this is not the case for individuals who implement the groundwork or for those who are being impacted by the change (Judson 1991) Al-ternately studies have demonstrated that some employees with a higher tolerance of ambiguity are more susceptible to change and may even thrive within this environment (Oreg 2003) As a whole organizations have struggled with implementing new ideas changing their culture and
reacting to market demands nevertheless many are will-ing to change to remain competitive
Dent and Goldberg (1999) found that at the individual level resistance to change can arise from those whose jobs are directly impacted and can cause a rippling effect through the organization Fundamentally individuals are creatures of habit and are annoyed by pressures in organi-zations that force employees to choose a different behavior or accept a reward system that may not seem beneficial However they are willing to change their behaviors when their beliefs of the benefits of the change outweigh the benefits in their current environment (Armenakis amp Be-deian 1999) In other words attitude toward the change affects onersquos willingness to consider and even implement the change
ATTITUDES AND CHANGE
Some change efforts within organizations are successful some are not Kotter (1995) monitored approximately 100 companies over a decade to observe the fundamental changes made in fluctuating business environments The research included examples of successes examples of fail-ures and illustrations of companies that remained stag-nant as they suffered through misguided steps Outlined by Kotter (1995) successful changes within companies encompassed eight steps (a) creating a sense of urgency (b) forming a guiding coalition (c) creating a compel-ling vision (d) communicating the vision for buy-in (e) empowering and acting on the vision (f) creating quick wins (g) increasing credibility through small wins and (h) linking success to new approaches In an earlier ap-proach Judson (1991) proposed five steps to enhance the process of change by engaging employeesrsquo active participa-tion through (a) analyzing and planning the change (b) communicating the plan for change (c) gaining buy-in and acceptance (d) changing the status quo to the desired state and (e) institutionalizing the new state of change Through these steps the common link described for suc-cessful changes involved employeesrsquo comprehension of the change and their personal adaptation to the new way of thinking and working
Iverson (1996) supported the concept that organizational change could be easier when employees have higher per-sonal commitments through healthy professional rela-tionships positive employee morale job satisfaction and positive recognition Moreover employees who have a sol-id desire to perform well and are willing to embrace new challenges even in the absence of clarity also understand the importance of change within organizations Further-more Gaumlrtner (2013) reinforced the concept that employ-eesrsquo attitudes and perceived flexibility toward change were influenced through a subset of mindfulness Although it
is not a new term mindfulness supports the concepts at-tributed to attention awareness engagement and being comfortable with new ideas that may impact areas within an individualrsquos control (Langer 1993)
The Problem Defined
With the continuous expansion of globalization and the rising unpredictability of consumer demands economic pressures and technological advancements organiza-tions have been required to change to remain competi-tive Change is inevitable The organizations that master agility and are adaptive to the ever-changing environment will possess the recipe to emerge triumphant over their competitors In reality every organization must change yet the process is not always smooth or effective Hypo-thetically within the organizational structure there are individuals who visualize the change others who develop and organize the change and those who implement and perform the change (Isabella 1990) At times roles of in-dividuals may overlap due to the size of the organization and the responsibilities entailed within each role Directly or indirectly everyone throughout the organization is im-pacted by the change perhaps some individuals are able to cope with change better than others A study of the relat-ed factors of mindfulness and tolerance of ambiguity may lead to insights about individualsrsquo resistance to change
Defining the Problem of Resistance
Resistance to change refers to adverse human forces that impact the processes of change Kotter (1995) empha-sized that organizational resistance is often helped along through the mismanagement of change and by ignoring its impact on the processes Maurer (2009) suggested that resistance will happen often due to failures from previ-ous change implementations Lewin (1947) one of the most influential early researchers of change realized that change was not an event but rather a living process He conceptualized the process of change through a model composed of three steps unfreezing change and refreez-ing His initial step introduces the idea of resistance in-dividuals must give up something before accepting some-thing new Though simple his ideas have been expanded upon by numerous researchers and have been developed into various theories of change Zander a close colleague of Lewin defined resistance to change as ldquobehavior which is intended to protect an individual from the effects of real or imagined changerdquo (as cited by Dent amp Goldberg 1999 p 34)
Mabin et al (2001) found that seemingly rebellious em-ployees manifest their fears of change due to uncertainty In addition perceived resistance may be disguised through
Brian Dunican amp Ric Keaster Acceptance of Change Exploring the Relationship among Psychometric Constructs and Employee Resistance
30 International Journal of the Academic Business World 31Fall 2015 (Volume 9 Issue 2)
the camouflage of untimely surprises past resentment ad-ditional job duties or the exposure of personal vulnera-bilities In isolated cases changes within the organization may cause a true threat to safety quality cost or the com-panyrsquos reputation Ignoring the symptoms of resistance within the change process could have disastrous results Judson (1991) agreed that resistance to change is not the fundamental problem but a symptom hiding basic under-lying circumstances He also developed a continuum of reactions to change ranging from indifference (no resis-tance) to active even aggressive resistance
Research has validated the importance of evaluating the reactions and the attitudes of individuals toward organi-zational change and their desire to succeed (Judge et al 1999 Oreg 2006) Developed and validated by Oreg (2003) the Resistance to Change scale has been widely used and accepted by academic works to measure an indi-vidualrsquos disposition toward resistance to change Further-more Oreg outlined four subscales as an exploratory anal-ysis to categorize an individualrsquos reaction to resist change (a) routine seeking (b) emotional reaction to impose change (c) cognitive rigidity and (d) short-term focus Supportive research (cited in Oreg 2003) has found the factors of openness to change tolerance of ambiguity and risk aversion as predictors for managers coping with the stress of change within their organizations An exhaustive amount of research has been conducted on the broad topic of resistance to change yet little is known on the relation-ship of how the psychological constructs of mindfulness and tolerance of ambiguity influence resistance to change within organizations Early researchers such as Coch and French (1948) viewed resistance to change as an obstacle of contention during the process of changes within organiza-tions One of their studies conducted in a sewing factory revealed that employees retaliated against change through acts of aggression controlling restrictions of throughput high turnover rates increased complaints and reports of dissatisfaction with management In line with earlier studies the use of the term resistance to change gained popularity beginning in the 1950s following Lewinrsquos (1947 1951) works related to field theory and social sci-ences Resistance to change is commonly accredited to the unfreezing stage of Lewinrsquos (1951) change model (Ar-menakis amp Bedeian 1999) Naturally portrayed as a nega-tive barrier to change resistance to change is frequently defined using Lewinrsquos physical science-related terminol-ogy as a restraining force to maintain the current state of equilibrium (Dent amp Goldberg 1999) Since that time resistance to change has been widely acknowledged and associated with the process of change organizational de-velopment and change theories and models Other schol-ars have conceptualized resistance to change as an emo-tional reaction rather than a behavioral response As an
example Argyris and Schon (1978) suggested resistance in terms of defensive routines and frustration during the process of change Kanter (1985) supported this notion describing feelings of uncertainty and loss of control for individuals facing change In other terms of defining re-sistance Lawrence (1954) used an analogy to compare re-sistance to change as pain within the human body that is used as a signal to communicate that something is wrong ldquoThe resistance like the pain does not tell what is wrong but only that something is wrong And it makes no more sense to try to overcome such resistance than it does to take a pain killer without diagnosing the bodily ailmentrdquo (p 56) This analogy highlighted the parallels between re-sistance and overcoming it through a practicable solution
Mindfulness
Mindfulness is a concept in educational psychology that has been primarily defined by Dr Ellen Langer a so-cial psychology professor at Harvard University Langer (1993) defined mindfulness as ldquoan open creative proba-bilistic state of mind in which the individual might be led to finding differences among things thought similar and similarities among things thought differentrdquo (p 44) Langer (1997) further explained three characteristics of mindfulness ldquo(a) continuous creation of new categories (b) openness to new information and (c) having an im-plicit awareness of more than one perspectiverdquo (p 4) The Mindfulness Scale validated by Pirson et al (2012) oper-ationalizes the construct and identifies the four subscales of novelty-seeking engagement novelty-producing and flexibility to explain the broad psychometric construct Brown and Ryan (2003) defined mindfulness as ldquoa quali-ty of consciousness that is characterized by clarity and viv-idness of current experience and thus stands in contrast to the mindlessrdquo (p 823) Different from Langerrsquos definition that evaluates dispositional differences in reflective con-sciousness behavioral routines over time Ryan and Brown focused on the presence or absence of attention to and the awareness of events occurring in the present moment For the purpose of the current study the ideas of mindfulness were presented through the literature of Langer Further-more mindfulness is believed to play an important role in disengaging individuals from automatic thoughts habits and unhealthy behavior patterns and may contribute to well-being and happiness in a direct way (Brown amp Ryan 2003)
Tolerance of Ambiguity
Tolerance of ambiguity describes an individualrsquos behavior in unclear or insecure situations and how one reacts to the lack of clarity or uncertainty (Banning 2003) Devel-oped by Frenkel-Brunswik (1948) tolerance of ambigu-
ity has gained attention from researchers over the past 60 years Frenkel-Brunswik was one of the first to present a comprehensive analysis of ambiguity and was influenced by earlier works of Germany psychologist Erich Jaensch Frenkel-Brunswik described tolerance of ambiguity as an ldquoemotional and perceptual personality variablerdquo (cited in Furnham amp Ribchester 1995 p 180)
Budner (1962) later defined tolerance for ambiguity as ldquothe tendency to perceive ambiguous situations as desir-ablerdquo and intolerance for ambiguity as ldquothe tendency to perceive ambiguous situations as sources of threatrdquo (p 29) Budner developed the Tolerance of Ambiguity Scale to further interpret the complex concept of ambiguity and individualsrsquo responses to it Through the development of the Tolerance of Ambiguity Scale three subscales (ie novelty complexity insolubility) emerged to provide in-sight into the more abstract larger construct A decade later Norton (1975) defined tolerance of ambiguity as the degree to which an individual is cognitively willing to tolerate uncertainty vagueness or nebulous information and is able to act upon the knowledge
Employees resist change at all levels of the organization Although some individuals openly accept change many do not Determining the varying degrees of each psycho-metric construct on resistance along with their combi-nation toward resistance to change may reveal common areas of opportunity related to organizational change The following general research question is offered How are the psychometric constructs of mindfulness and toler-ance for ambiguity related to resistance to change within organizations
Empirical Studies and Questions
Numerous studies have alluded to resistance to change some have focused on the individuals (eg Bovey amp Hede 2001 Coghlan 1993 Ford Ford amp McNamara 2002) while others have explored organizations (eg Arm-bruster Bikfalvi Kinkel amp Lay 2008 Coch amp French 1948 Greenwood amp Hinings 1996 Lawrence 1954 Stanley Meyer amp Topolnytsky 2005) Van Dam Oreg and Schyns (2008) stated ldquoA review of the past empirical research reveals that resistance to change has been concep-tualized in three ways as a cognitive state as an emotion as a behavioral intentionrdquo (p 316) As an emotion some studies have revealed that employees who display nega-tive perceptions toward organizational change may have an overall negative outlook on change thus perpetuat-ing resistance (Armenakis Harris amp Mossholder 1993 Stanley et al 2005) Extreme measures of resistance to organizational change have been displayed in other stud-ies through sabotage slowdowns and strikes (Armenakis et al 1993) Universally resistance to change has been
recognized to have a significant impact on the outcomes of organizational change yet individuals within the or-ganization are perceived to be the major blockage or im-pediment (Mabin et al 2001) Based on the literature concerning the analysis of change empirical studies have identified a wide range of factorsmdashnamely organization-al managerial behavioral and individualmdashthat promote or impede resistance in organizations
Organizations are faced with the challenges of changing and responding to current and future trends at an un-precedented rate in todayrsquos global environment (Burke 2014) Twenty-five years ago Offermann and Gowing (1990) found that American organizations alone had spent over a record 210 billion dollars to prepare leaders to thrive in organizational change In addition to money an immeasurable amount of time and energy have been dedicated to nurturing leadership and key individuals to navigate others through this complex but important pro-cess Nonetheless the blueprint is far from perfect The readiness of individuals within the organization to plan and implement proactive measures may determine the or-ganizationrsquos competitiveness The current study examines the factors of mindfulness and tolerance of ambiguity and how they relate to individualsrsquo perceptions of resistance to change The specific research questions are the following
1 How do demographic factors of the respondents and the organizational factors under which they work relate to the psychometric scales of Mind-fulness and Tolerance of Ambiguity and their influence on Resistance to Change
2 After controlling for demographic factors how does psychometric mindset (Sub-constructs of Mindfulness and Tolerance of Ambiguity) influence individual Resistance to Change (a) Routine seeking (b) Emotional reaction (c) Short-term focus (d) Cognitive rigidity
3 What is the degree of relationship among these measures of Mindfulness and Tolerance of Am-biguity
4 The following model characterizes the current study
Highlights of the Methodology
When considering the measurement of the perceptions of resistance to change within organizations various meth-ods have been utilized to illustrate relationships among different constructs (Oreg 2003 Oreg Vakola amp Ar-menakis 2011) In the current quantitative non-exper-
Brian Dunican amp Ric Keaster Acceptance of Change Exploring the Relationship among Psychometric Constructs and Employee Resistance
32 International Journal of the Academic Business World 33Fall 2015 (Volume 9 Issue 2)
imental study data were collected from three validated instruments ndash Langerrsquos (Bodner amp Langer 2001) Langer Mindfulness Scale (LMS) Budnerrsquos (1962) Tolerance of Ambiguity Scale (TOA) and Oregrsquos (2003) Resistance to Change (RTC) scale Regression models were used to assess the univariate relationships among the constructs Additionally descriptive statistics were used to include the mean median mode standard deviation and other selected variables A multiple linear regression analysis determined the relationship between factors of mindful-ness and tolerance of ambiguity and their influence of resistance to change Bivariate correlations were used to compute the psychometric scores from each instrument and resistance to change ratings to test the significance of the relationships between each subscale Overall statisti-cal analyses were conducted in multiple phases to investi-
gate the relationship between the individual psychomet-ric traits and resistance for salary exempt and non-exempt employees in industrial sites located in Kentucky
Participants in the Study
The population represented a microcosm of several indus-tries in the manufacturing sector within the proximity of Warren County The data collected were based on a con-venient sample A total of 65 participants volunteered to complete an electronic survey that was designed to capture complete responses to a total of 48 questions Participants were not allowed to proceed to the next page of the survey unless all questions on the current page were completed Three participants did not complete the survey and their responses were not included in the end results From the
population of 183 salaried (exempt and nonexempt) em-ployees 65 surveys were officially returned constituting a response rate of 36 Managerial-type jobs dominated 36 of the sample population followed by roles in tech-nical support which reflected 169 Six categories of job types and an ldquoOtherrdquo category were used for the respon-dents
Scoring Method for Each Scale
Resistance to Change Scale
Oregrsquos (2003) Resistance to Change Scale is comprised of 17 items with four subscales ndash routine seeking emo-tional reaction short-term focus and cognitive rigidity Each subscale relates to the extent to which individuals seek routines react to emotions during change encom-pass short-term focus during change and the frequency to which individuals change their minds The overall range of the scale including the subscales is scored between 1 and 6 with 1 representing the least level of resistance In-dividuals scoring higher on the overall scale or subscales indicate a higher resistance to change
Langer Mindfulness Scale
The Langer Mindfulness Scale (Pirson et al 2012) con-tains 14 items and is composed of three subscales ndash novelty seeking engagement and novelty producing The 7-point scale is scored such that higher scores indicate a greater level of awareness toward thinking High scores for novel-ty producing insinuate one would perceive new situations as opportunities to learn new information Individuals with high scores for engagement are more susceptible to noticing details within their environment as opposed to others Higher novelty producing scores indicate that individuals are likely more creative and predisposed to generating new ideas when faced with new information
Tolerance of Ambiguity Scale
Budnerrsquos (1962) Tolerance of Ambiguity Scale is a 16-item scale with ratings ranging from 1 to 7 1 represents strong disagreement indicating a greater tolerance for ambiguity It is important to note that higher scores relate to greater intolerances for ambiguity All results were re-ported at the aggregate level
RESULTS
Statistical data analyses were performed on survey data comprised of the following three instruments Langer Mindfulness Scale (LMS14) Tolerance of Ambigu-
ity Scale (TOA) and Resistance to Change (RTC) scale Findings were reported from the analyses of data col-lected from 65 participants responding to the Qualtrics Web-based survey In particular analyses were conducted through bi-variant correlation analyses (also known as Pearsonrsquos r) independent t-tests and Cronbachrsquos alpha The strengths of the relationships were predicated on Co-henrsquos (1988) interpretation Coefficient values between 10 and 29 were considered small or weak those between 30 and 49 were considered moderate and those between 50 and 10 were considered large or strong
Analysis of Each Research Question
The first research question explored the relationship of de-mographic and organizational factors to the psychomet-ric scales of Mindfulness and Tolerance of Ambiguity and their influence on Resistance to Change Descriptive sta-tistics reflected both demographic and organizational fac-tors ndash gender education years at the company and direct reportsmdashfor the 65 employees who participated in the current study The distributions of variables were distrib-uted evenly between only two variables years at the com-pany and direct reports Other demographic variables including ethnicity and age were recorded A statistical analysis was not conducted due to the uneven distribution of the variables Of the 65 participants 59 were Caucasian and the remaining 6 were minorities The ages of the par-ticipants ranged from 28 years to 65 years Additionally frequency distributions and data analyses were not con-ducted for individual sites to protect anonymity All re-sults were reported at the aggregate level and included the following categories for the participating industries Cup Manufacturing Personal Care Manufacturing Con-struction and Rubber to Metal Bonding Manufacturing
Gender Male and Female
Although more than twice as many males than females participated in the current study independent t-tests were conducted to determine whether differences existed be-tween the mean scores of the scales and subscales for male and female employees No statistically significant differ-ences were found between the outcome of the psychomet-ric constructs (Mindfulness and Tolerance of Ambiguity) and Resistance to Change except on one subscale Cogni-tive rigidity revealed a statistical difference between the scores of males (n = 45 M = 381 SD = 063) and females (n = 20 M = 336 SD = 086) t (63) = 234 p = 05 α = 05
Figure 1 Logic model for hypothesized relationships among
Psychometric Constructs Demographic Controls and Degree of Resistance to Change
INDEPENDENT VARIABLES
Degree of Resistance
Demographic Factors
-----
Age Gender
Ethnicity Education
____________
Organizational Factors
----- Years at Current Company Type of Current Position
Type of Industry or Category Number of Direct Reports
Resistance to Change -----
Routine Seeking Emotional Reaction Short-term Focus
Cognitive Rigidity
Tolerance of Ambiguity
----- Novelty
Complexity Insolubility
Mindfulness -----
Novelty Seeking Engagement
Novelty Producing
Brian Dunican amp Ric Keaster Acceptance of Change Exploring the Relationship among Psychometric Constructs and Employee Resistance
34 International Journal of the Academic Business World 35Fall 2015 (Volume 9 Issue 2)
Education
Due to the imbalanced distributions of participants sta-tistical analysis for Education was not performed The frequency distribution reflected that 5231 (34) of the participants possessed a four-year degree 1231 (8) ob-tained a masterrsquos degree or higher 2615 (17) possessed a two-year degree or some college while the reaming 923 (6) were high school graduates
Direct Reports and No Direct Reports
An individual variances t-test was conducted and failed to reveal a statistically reliable difference between the mean scores of salaried employees without direct reports and salaried employees with direct reports As an example scores from routine seeking a subscale of resistance to change were not significantly different between employ-ees without direct reports (n = 32 M = 312 SD = 096) and employees with direct reports (n = 33 M = 291 SD = 085) t (65) = 093 p = 037
Years at the Company
A one-way analysis of variance (ANOVA) was calculated on participantsrsquo ratings of the psychometric constructs and resistance to change as a comparison to the number of years at the company Comparisons indicated no sta-tistically significant differences were presented between groups of 0 to 4 years 5 to 10 years 11 to 20 years and 21 years and greater As an example on novelty-seeking a subscale of the Langer Mindfulness Scale the analysis was not significant between the four groups F(3 61) = 31 p = 82
The second research question used bivariate correlations to determine the strength of the relationships between the psychometric constructs (Mindfulness and Tolerance of Ambiguity) and Resistance to Change including the four subscales All of the Pearson correlations were significant across each of the findings with the exception of the LMS scale and Cognitive Rigidity of Resistance to Change subscale r(65) = -225 p = 072 The overall LMS scales reflected a strong negative relationship r(65) = -530 p lt 001 with the RTC scale The TOA scale revealed a mod-
Table 1 Descriptive Statistics and Correlations among Responses of Tolerance of
Ambiguity Scale Langer Mindfulness Scale and Subscales and Resistance to Change and Subscales
Scales LMS_NS LMS_NP LMS_E TOA_ Tot RTC_RS RTC_ER RTC_STF RTC_CR
LMS_NS (77)
LMS_NP 76 (72)
LMS_E 49 51 (69)
TOA_Tot -48 -53 -32 (72)
RTC_RS -51 -50 -41 65 (85)
RTC_ER -36 -37 -36 41 71 (88)
RTC_STF -53 -47 -38 60 77 80 (90)
RTC_CR -28 -26 -04 44 51 45 41 (86)
of Items 5 5 4 16 5 4 4 4
Mean 598 504 556 376 342 285 367 322
SD 071 94 102 71 110 104 73 81Note N = 65 Cronbachrsquos alpha reliabilities for each dimensionconstruct are listed in parentheses on diagonal Cronbachrsquos Alpha measures indicated a high internal consistency among the items reflected in each scale p lt 05 level (two-tailed) p lt 01 level (two-tailed)
Table 2 Descriptive Statistics and Correlations among Responses of the Total Tolerance of
Ambiguity Scale Langer Mindfulness Scale and Resistance to ChangeLMS_Tot Mean TOA_Tot Mean RTC_Tot Mean
LMS_MeanTotal (86)
TOA_Meantotal -53 (72)
RTC_Meantotal -53 62 (93)Number of items 14 16 17Mean 552 376 301Standard Deviation 75 71 91Note N = 65 Cronbachrsquos alpha reliabilities for each dimensionconstruct are listed in parentheses on diagonal No subscales for Tolerance of Ambiguity were referenced in research Cronbachrsquos Alpha measures indicated a high internal consistency among the items reflected in each scale p lt 05 level (two-tailed) p lt 01 level (two-tailed)
Table 3 Descriptive Statistics and Correlations among Responses Related to Operational and
Demographic Factors Tolerance of Ambiguity Scale Langer Mindfulness Scale and Sub-scales and Resistance to Change and Subscales
ME
AN
SD AG
E
YR
SWR
K
DR
RPT
S
TO
A_M
LMS_
M
LMS_
NS
LMS_
NP
LMS_
E
RT
C_M
RT
C_R
S
RT
C_E
R
RT
C_S
TF
RT
C_C
R
AGE 4571 782 100YRSWRK 1283 943 52 100DRRPTS 1005 2162 -18 01 100TOA_M 376 71 15 11 -02 100LMS_M 552 75 -07 -07 10 -53 100LMS_NS 598 71 -12 -12 04 -48 87 100LMS_NP 504 94 -05 01 18 -53 90 76 100LMS_E 556 102 -01 -10 01 -32 78 49 51 100RTC_M 322 81 -14 -10 -08 62 -53 -51 -48 -37 100RTC_RS 301 91 -13 -07 -04 65 -55 -51 -50 -41 90 100RTC_ER 342 110 -23 -17 -07 41 -43 -36 -37 -36 90 71 100RTC_STF 285 104 -05 00 -06 60 -54 -53 -47 -38 91 77 80 100RTC_CR 367 73 -07 -08 -14 44 -23 -28 -26 -04 65 51 45 41 100
Note N = 65 The correlation coefficient ranges from -1 to +1 with -1 indicating a perfect negative correlation +1 indicating a perfect positive correlation and 0 indicating no correlation
Brian Dunican amp Ric Keaster Acceptance of Change Exploring the Relationship among Psychometric Constructs and Employee Resistance
36 International Journal of the Academic Business World 37Fall 2015 (Volume 9 Issue 2)
erate positive correlation r(65) = 624 p lt001 Further bivariate analyses for LMS explored the strength of the re-lationships between the subscales of the Langer Mindful-ness Scale and the subscales of the Resistance to Change scales The correlational analysis was statistically signifi-cant between all variables except Engagement of the LMS and Cognitive Rigidity of RTC r(63) = -35 p = 781 concluding that the variables were unrelated
The last research question explored the degree of the re-lationship between Mindfulness and Tolerance of Am-biguity Bivariate analyses were used to correlate the re-lationship between the two psychometric constructs The correlations revealed a significantly strong negative rela-tionship between the total mean score of the LMS and the total mean score of the TOA r(63) = -53 p lt 01 The mean scores for each of the LMS subscales compared to the total mean of the TOA showed the following Nov-elty-seeking and TOA r(63) = -48 p lt 01 Novelty-pro-ducing and TOA r(63) = -53 p lt 01 and Engagement and TOA r(63) = -32 p lt 01 It is important to note that higher scores on the Tolerance of Ambiguity scale indicate a greater intolerance of ambiguity Tables 1 and 2 display a descriptive analysis and correlations for each of the scales and subscales The correlations between vari-ables are presented in Table 3
LIMITATIONS OF THE STUDY
Research inherently contains limitations The current study is no exception First the nature of measuring psy-chometrics is subjective Since psychometrics studies mea-sure the way in which individuals think and act (Norton 1975) influences of the organizationrsquos environment could affect individualsrsquo responses to questions Additionally external variables at the time of data collection not related to the study itself can skew the responses and influence the outcomes Other views of limitation rest on the gen-eralizability of the results which may be limited for the following reasons (a) the unit of analysis is at the indi-vidual level (b) data were collected from a limited num-ber of operations within the state of Kentucky through convenience sampling and (c) individual biases that may be introduced at the time of testing
The unit of analysis for data collection rests at the indi-vidual level rather than the group level due to the acces-sibility of the employees Although the survey collection method allows for comparison with larger groups it lim-its the opportunity to explore issues in depth therefore assumptions are made for individuals in similar groups Next the data collected represents limited industries in the state of Kentucky restricting the number of partici-pants and the ability to generalize outcomes to other in-dustries different than those outlined in the current study
Last respondentsrsquo values interests and beliefs regarding the online self-administered surveys may introduce biases unknown by the researcher As a consequence of these limitations and the collection of data during one point in time the results are generalizable only to the groups or populations that are similar to those in the current study
SUMMARY AND CONCLUSION
Change within organizations is inevitable That real-ity will remain constant in organizationsmdashand in onersquos personal and professional life (Conner 1992) The way in which one chooses to cope with change could be a decid-ing factor of success failure or choosing to remain the samemdashwhich in organizations tends to equate with fail-ure particularly if change means simply improving Resis-tance is a natural reaction to change and is part of the hu-man psyche Research and literature support this notion of human nature to resist change and elements related to the process of change (Coch amp French 1948 Conner 1992 Oreg 2003 OrsquoToole 1995 Zander 1950) It is possible that a greater understanding of mindfulness and tolerance of ambiguity could increase the possibilities of new ideas to drive lower resistance to change The current study explored the two psychometric constructs of mind-fulness and tolerance of ambiguity and their relationship to resistance to change within industrial settings Bivari-ate correlations yielded both strong positive and negative correlations among the three scales assessed by salaried employees located across different industries The Langer Mindfulness Scale Budnerrsquos Tolerance of Ambiguity Scale and Oregrsquos Resistance to Change scale were attrib-uted to the foundation of the current study The results contributed to the practical and theoretical significance of individualsrsquo responses to change through the measure-ment of the aforementioned constructs To the extent the findings in the current research could be extrapolated to other industries or organizations a final suggestion should be noted When considering future directions for research related to probing psychometric constructs and resistance to change the current study may have relevance across different nationalities and cultures The elements of change will continue to challenge the fabric of organiza-tions while the internal and external pressures of rising costs variations in supply and demand relentless compe-tition and developing technology test the resolve for sur-vival The readiness of individuals within organizations and their ability to challenge perceptions of change and resistance may determine their competitiveness and ulti-mately their success
REFERENCES
Argyris C amp Schon D (1978) Organizational learning A theory of action research Reading MA Addison-Wesley
Armbruster H Bikfalvi A Kinkel S amp Lay G (2008) Organizational innovation The challenge of measur-ing non-technical innovation in large-scale surveys Technovation 28(10) 644-657
Armenakis A A amp Bedeian A G (1999) Organiza-tional change A review of theory and research in the 1990s Journal of Management 25 293-315
Armenakis A A Harris S G amp Mossholder K W (1993) Creating readiness for organizational-change Human Relations 46(6) 681-703
Banning K C (2003) The effect of the case method on tolerance for ambiguity Journal of Management Edu-cation 27 556-567
Bodner T E amp Langer E J (2001 June) Individual differences in mindfulness The MindfulnessMind-lessness Scale Poster presented at the 13th annual American Psychological Society Conference Toronto Ontario Canada
Bovey W H amp Hede A (2001) Resistance to organisa-tional change The role of defence mechanisms Journal of Managerial Psychology 16(7) 534-548
Brown K W amp Ryan R M (2003) The benefits of be-ing present Mindfulness and its role in psychological well-being Journal of Personality and Social Psychol-ogy 84 822-848 doi1010370022-3514844822
Brown K W amp Ryan R M (2004) Perils and promise in defining and measuring mindfulness Observations from experience Clinical Psychology Science and Practice 11(3) 242-248 doi101093clipsybph078
Budner S (1962) Intolerance of ambiguity as a personal-ity variable Journal of Personality 30 29-59
Burke W W (2014) Organizational change theory and practice Thousand Oaks CA Sage Publications Inc
Carson S H amp Langer E J (2006) Mindfulness and self-acceptance Journal of Rational-emotive and Cog-nitive-behavior Therapy 24(1) 29-43
Coch L amp French J (1948) Overcoming resistance to change Human Relations 1 512-532
Coghlan D (1993) A person-centred approach to deal-ing with resistance to change Leadership amp Organi-zation Development Journal 14(4) 10-14
Cohen J (1988) Statistical power analysis for the behav-ioral sciences Hillsdale NJ Lawrence Erlbaum Associates
Conner D R (1992) Managing at the speed of change How resilient managers succeed and prosper where others fail New York Random House
Demers C (2007) Organizational change theories Thousand Oaks CA Sage Publications Inc
Dent E B amp Goldberg S G (1999) Resistance to change A limiting perspective Journal of
Ehrlich S B Meindl J R amp Viellieu B (1990) The charismatic appeal of a transformational leader An empirical case study of a small high-technology con-tractor The Leadership Quarterly 1(4) 229-247
Ford J D Ford L W amp McNamara R T (2002) Re-sistance and the background conversations of change Journal of Organizational Change Management 15(2) 105-121
Frenkel-Brunswik E (1948) Tolerance toward ambigu-ity as a personality variable American Psychologist 3 268-269
Furnham A amp Ribchester T (1995) Tolerance of am-biguity A review of the concept its measurement and applications Current Psychology 14 179-199
Gaumlrtner C (2013) Enhancing readiness for change by enhancing mindfulness Journal of Change Manage-ment 13 52-68
Geller E S (2002) Leadership to overcome resistance to change It takes more than consequence control Jour-nal of Organizational Behavior Management 22(3) 29-49
Gondo M Patterson K W amp Palacios S (2013) Mind-fulness and the development of a readiness for change Journal of Change Management 13(1) 36-51
Greenwood R amp Hinings C R (1996) Understanding radical organizational change Bringing together the old and the new institutionalism Academy of Manage-ment Review 21 1022-1054
Isabella L (1990) Evolving interpretations as a change unfolds How managers construe key organization-al events Academy of Management Journal 33 7-41
Iverson R D (1996) Employee acceptance of organiza-tional change The role of organizational commitment International Journal of Human Resource Manage-ment 7 122-149
Jacobs P (2005) Five steps to thriving in times of un-certainty Harvard Management Update 10(12) 3-5
Brian Dunican amp Ric Keaster
38 Fall 2015 (Volume 9 Issue 2)
Retrieved from httphbrorgproductfive-steps-to-thriving-in-times-of-uncertaintyanU0512A-PDF-ENG
Judge T A Thoresen C J Pucik V amp Welbourne T M (1999) Managerial coping with organization-al change A dispositional perspective Journal of Ap-plied Psychology 84 107-122
Judson A (1991) Changing behavior in organizations Minimizing resistance to change Cambridge MA Basil Blackwell
Kanter R M (1985) Supporting innovation and ven-ture development in established companies Journal of Business Venturing 1 47-60
Kets de Vries M F R Ramo L amp Korotov K (2009) Organizational culture leadership change and stress INSEAD Working Papers Collection 10 2-26 Re-trieved from httpwwwinseadedufacultyresearchresearchdoccfmdid=41924
Kotter J P (1995) Leading change Why transformation efforts fail Harvard Business Review 73(2) 59-67
Lane M S amp Klenke K (2004) The ambiguity toler-ance interface A modified social cognitive model for leading under uncertainty Journal of Leadership amp Organizational Studies 10(3) 69-81
Langer E J (1993) A mindful education Educational Psychologist 28 43-50
Langer E J (1997) The power of mindful learning Read-ing MA Addison-Wesley
Lawrence P R (1954) How to deal with resistance to change Harvard Business Review 32(3) 49-57 Retrieved from httpedsaebscohostcomlib-srvwkueduehostpdfviewerpdfviewervid=6ampsid =699bab3d-bcec-40d9-ac69-a42c853d72bc40sessionmgr4004amphid=4108
Lewin K (1947) Frontiers in group dynamics II Chan-nels of group life social planning and action research Human Relations 1(2) 143-153
Lewin K (1951) Field theory in social science Selected theoretical papers New York Harper amp Row
Limerick D Passfield R amp Cunnington B (1994) Transformational change Towards an action learning organization The Learning Organization 1(2) 29-40
Mabin V J Forgeson S amp Green L (2001) Harness-ing resistance Using the theory of constraints to assist change management Journal of European Industrial Training 25(234) 168-191
Maurer R (2009) Introduction to change without mi-graines Omaha NE Maurer and Associates Re-trieved from httpextensionmissouriedustaffsde-teams DocumentsChangeW-outMigrarainespdf
Norton R W (1975) Measurement of ambiguity toler-ance Journal of Personality Assessment 39 607-619
Offermann L R amp Gowing M K (1990) Organiza-tions of the future Changes and challenges Ameri-can Psychologist 45(2) 95-108 doi10370003-066X45295
Oreg S (2003) Resistance to change Developing an in-dividual differences measure Journal of Applied Psy-chology 88 680-693
Oreg S (2006) Personality context and resistance to organizational change European Journal of Work and Organizational Psychology 15 73-101
Oreg S Vakola M amp Armenakis A (2011) Change re-cipientsrsquo reactions to organizational change A 60-year review of quantitative studies The Journal of Applied Behavioral Science 47 461-524
OrsquoToole J (1995) Leading change The argument for val-ues-based leadership Boston MA Ballentine Books
Pirson M Langer E J Bodner T amp Zilcha-Mano S (2012) The development and validation of the Langer Mindfulness Scale-Enabling a socio-cognitive perspec-tive of mindfulness in organizational contexts Ford-ham University School of Business Research Paper Re-trieved from httpdxdoiorg102139ssrn2158921
Stanley D J Meyer J P amp Topolnytsky L (2005) Employee cynicism and resistance to organizational change Journal of Business and Psychology 19(4) 429-459
Topping P (2002) Managerial leadership New York McGraw Hill Professional
Van Dam K Oreg S amp Schyns B (2008) Daily work contexts and resistance to organisational change The role of leader-member exchange development climate and change process characteristics Applied Psycholo-gy An International Review 57 313-334 doi101111j1464-0597200700311x
Weinstein N Brown K W amp Ryan R M (2009) A multi-method examination of the effects of mindful-ness on stress attribution coping and emotional well-being Journal of Research in Personality 43 374-385
Zander A F (1950) Resistance to change Its analysis and prevention Advanced Management 4(5) 9-11
International Journal of the Academic Business World 39
INTRODUCTION
Cloud computing is one of the most talked about infor-mation technology topics these days 7 24 Early literature review reveals an endemic confusion of what cloud com-puting is does and what it stands for We posit that the cloud metaphor 3 20 fosters a confusion that persists even today
The goal of this research paper is to look back and make historical sense of cloud computing We try to find the lineage of cloud computing where the phrase cloud com-puting came from who came up with the term and how it found currency in the IT community We trace cloud computing to early timesharing and Application Service Provider (ASP) in the last decade and posit a future of utility computing
Additionally we try to shed light on the current state of cloud computing provide a comprehensive definition of the term and its main building blocks
CLOUD COMPUTING IN THE ACADEMIC LITERATURE
A metaphor
In an article by Ian Foster and Steven Tuecke 3 the authors start by describing the well-known elephant fable where a group of blind people are asked to describe an elephant and not surprisingly each provides a different view
The cloud is a metaphor for the Internet Itrsquos a rebranding of the Internet that is why there is a raging debate By vir-tue of a metaphor itrsquos open to different interpretations 20
Confusion and Frustration
The word ldquocloudrdquo in cloud computing informs very little and it may even misinform ldquoI hated it but I finally gave inrdquo says Carl Bass President and CEO of Autodesk He adds ldquoI didnrsquot think the term helped explain anything to people who didnrsquot already know what it isrdquo20
Giving the lsquocloudrsquo name to the old concept of large shared distributed systems is misleading 4 p 26
Larry Ellison Oraclersquos CEO ldquoThe interesting thing about cloud computing is that wersquove redefined cloud computing everything that we already dohellipI donrsquot understand what we would do differently in light of cloud computing other than change the wording of some of our adsrdquo 1 p 50
In an article in Harvard Business Review (HBR) 22 the author asks a rhetorical question ldquoWhat the heck does it mean to have a lsquocloudrsquo It means that the functions you want like storage communications and applications donrsquot need to live on the device you have in front of you You can get them on demand from the networkrdquo We should ask the question ldquoin a typical non-cloud IS en-vironment do we really have the stated functions on the device in front of usrdquo
Cloud Computing is often confused with Utility Com-puting but they are not the samemdashrather the latter forms part of the former 2
No Definition
Realizing the elephantine nature of cloud computing there is a reluctance to define it Question How would you define cloud computing Answer Cloud computing
The Origin and Construct of Cloud Computing
Nozar Daylami PhD Adjunct Professor
School of Management Information System and Technology Program
California Lutheran University Thousand Oaks CA 91360
ABSTRACTCloud computing is one of the most talked about information technology topics these days A literature review reveals an endemic confusion of what cloud computing stands for This paper tries to shed light on why the term is so confusing We try to find where the phrase cloud computing came from and how it found currency in the IT community We trace cloud computing to early timesharing and Application Service Provider (ASP) in the last decade and posit a future of utility computing This paper also provides a comprehensive definition of the term and its main building blocks
Nozar Daylami The Origin and Construct of Cloud Computing
40 International Journal of the Academic Business World 41Fall 2015 (Volume 9 Issue 2)
is not so much a definition of a single term as it is a trend in service delivery taking place today 3 p 52
An Old Concept
Cloud computing is an old concept it ldquois a throwback to the mainframe model of computingrdquo 19 p 78 Clearly cloud computing is simply remote computing 4 p 26
Internet or Network Computing
Cloud computing as a term for Internet-based computing service was launched by industry giants Google Ama-zon etc in late 2006 24 ldquoIt is the movement of applica-tion services onto the Internet and the increased use of the Internethelliprdquo
The Earliest Publications
In the first article on Cloud Computing in the Communi-cations of ACM 9 it is referred to as ldquothe compute cloudrdquo and is deemed synonymous with ldquoon-demand comput-ing software as a service or the Internet as a platformrdquo Though these other naming conventions are self-explana-tory cloud computing is not
The cloud computing is understood as a shift of the ge-ography of computing It begs the question if it is about moving delivery of a wide variety of information services onto to the Internet why donrsquot we call it ldquoInternet Com-putingrdquo
The first time cloud computing showed up in a HBR pub-lication was in a digital article in April 2008 14 The au-thor states that the move to cloud computing would be disruptive to incumbent players of shrink-wrapped gam-ing software assuming his readers understand what cloud computing entails
A BRIEF HISTORY OF COMPUTING
In the early days of computers they were big and expen-sive So sharing this big expensive gadget was a normal practice Most organizations did not usually own this big machine but those who did had to share it across an en-terprise That was the era of timesharing
However as computers got cheaper and more afford-able every company every department and then finally every person decided to have their own computer How-ever standalone computers are of limited use So we networked them first locally in a Local Area Network (LAN) environment and then far and wide Wide Area
Network (WAN) Then we networked the network and the World Wide Web was born
At the same time in a different parallel universe some-thing else was happening In the early years no commer-cial off-the-shelf software (COTS) was available Every organization had to write its own software program So if you wanted to computerize your accounting general led-ger payables and receivables or run your inventory you had to write your own applications
Buying off-the-shelf applications was also considered ldquooutsourcingrdquo Why Because you were having others do the work for your organization which was supposed to be doing this work for itself So over the years most appli-cation development have been outsourced to burgeoning software companies such as IBM Oracle and SAP
OUTSOURCING AND ASP
In a general sense IS outsourcing is nothing newmdashit has always been considered an option for IT solutions 11 Electronic Data Systems was handling data processing services for Frito-Lay and Blue Cross as early as 1963 IS outsourcing soon became widely known as the second of a three-phase outsourcing phenomenonmdashtraditional out-sourcing being the first phase and application outsourcing being the third 6
In the early years of the last decade xSPs service provid-ers of all stripes were leading into a new generation of IT where it really did not matter where the applications reside as long as we had access to accomplish what we wanted 247 However back then an Application Service Provider (ASP) was thought by some to be another re-incarnation of the old ldquotimesharingrdquo leveraging network technologies 22
However the understanding of an evolving net-centric computing was already there In their book published in 2002 aptly titled NetSourcing authors Kern Lacity and Willcocks 7 define a computing framework and services stack thatrsquos similar to Cloud Computing The authors state ldquoWe selected the term ldquoNetsourcingrdquo as the over-arching name because the common element of any xSP is the delivery of a product or service over a networkrdquo (p 3) The ldquonetworkrdquo however is now synonymous with the ldquoInternetrdquo
Today cloud computing is about getting the job done in whatever way shape or form that may be required Orga-nizations and individuals need the utility of computing and where it comes from by and large is of no concern As early as 1961 Professor John McCarthy predicted that computation may someday be organized as a public utility ldquoEach subscriber needs to pay only for the capac-
ity he actually uses but he has access to all programming languages characteristics of a very large system hellip Certain subscribers might offer services to other subscribers hellip The computer utility could become the basis of a new and im-portant industry 8 McCarthyrsquos notion of ldquoutility comput-ingrdquo is here right nowmdashthat is ldquocloud computingrdquo
This point is confirmed by others 1 p 51 ldquoThe data center hardware and software is what we consider a cloud When a cloud is made available in a pay-as-you-go manner to the general public we call it utility computingrdquo
CLOUD COMPUTING ORIGIN OF THE PHRASE
Coinage of the term ldquocloud computingrdquo has been traced to two individuals who at the time they came up with this term worked for Compaq Computer George Favaloro a Compaq marketing executive and Sean OrsquoSullivan the founder of the now defunct business NetCentric 20
A Compaq internal document marked as confiden-tial dated November 14 1996 and provided by Sean OrsquoSullivan contemplates a Cloud Computing ldquostrat-egyrdquo10
But the creation of this term did not find currency for another decade Many believe the first use of ldquocloud com-
putingrdquo in its modern context occurred on August 9 2006 when then Google CEO Eric Schmidt introduced the term at an industry conference ldquoWhatrsquos interesting [now] is that there is an emergent new modelrdquo Schmidt said ldquoI donrsquot think people have really understood how big this opportunity really is It starts with the premise that the data services and architecture should be on servers We call it cloud computingmdashthey should be in a ldquocloudrdquo somewhererdquo 19
CLOUD COMPUTING DEFINITION
The National Institute of Standards and Technology (NIST SP 800-145) defines Cloud Computing in the fol-lowing way ldquoCloud computing is a model for enabling convenient on-demand network access to a shared pool of configurable computing resources (eg networks serv-ers storage applications and services) that can be rapidly provisioned and released with minimal management ef-fort or service provider interaction This cloud model is composed of five essential characteristics three service models and four deployment modelsrdquo 17
The following diagram places all the pieces together in a visual form
The Conceptual Reference Model
Cloud Computing Reference Architecture NIST Special Publication 500-292
Nozar Daylami The Origin and Construct of Cloud Computing
42 International Journal of the Academic Business World 43Fall 2015 (Volume 9 Issue 2)
Cloud Computing Reference Architecture NIST Special Publication 500-292
NIST Special Publication 500-292 states that ldquothe defini-tion is widely accepted as a valuable contribution toward providing a clear understanding of cloud computing tech-nologies and cloud services It provides a simple and un-ambiguous taxonomy of three service models available to cloud consumers cloud software as a service (SaaS) cloud platform as a service (PaaS) and cloud infrastructure as a service (IaaS) It also summarizes four deployment mod-els describing how the computing infrastructure that delivers these services can be shared private cloud com-munity cloud public cloud and hybrid cloudrdquo 18 Finally the NIST definition also provides a unifying view of five essential characteristics that all cloud services exhibit on-demand self-service broad network access resource pool-ing rapid elasticity and measured service 18
This publication further states that ldquoThese services and their delivery are at the core of cloud computing In the cloud computing model the primary focus is a more eco-
nomic method of providing higher quality and faster ser-vices at a lower cost to the usersrdquo
The Cloud Security Alliance 21 provides a more transpar-ent narrative of what Cloud Computing is ldquoa model for enabling ubiquitous convenient on-demand network access to [a] shared pool of configurable computing re-sources [it] has the potential to enhance collaboration agility scaling and availability and provides opportunity for cost-reduction the model envisages a world where components can be rapidly orchestrated provisioned implemented and decommissioned scaled up or down to provide an on-demand utility-like modelrdquo
A SPATIAL VIEW OF CLOUD COMPUTING
The NIST Computing Reference Architecture is a flat depiction of the cloud computing model A three dimen-sional view of the model by Craig-Wood 2 is a spatial de-piction Here you can see the three dimensions of cloud computing that renders the elephant fable
Computing Services Framework
Infrastructure as a Service (IaaS) As the word ldquoinfra-structurerdquo implies this is the most basic of services Cus-tomers can buy processing storage and network services and then build their own systems on top of this infra-structure A pioneer in the IaaS field is Amazon with its Amazon Elastic Compute Cloud (EC2)
However most big names in the IT field from Micro-soft (Azure) to Google (App Engine) provide IaaS Here customers are not renting specific servers hard drives and network switches or any particular equipment but instead they are utilizing the infrastructure that is most certainly simulated by virtualization software allowing multiple customers to be served by the same array of physi-cal devices IaaS provides the raw power of computingmdashstorage included
Cloud Computing would not be possible without virtu-alization Virtualization is the ability to make a virtual machine (VM) act like a physical computer Just like a physical computer with its own processor operating sys-tem and storage each VM has its own components too The benefit of virtualization though is that you can put much more than only one VM even with different oper-ating systems on the same server Doing so dramatically increases each serverrsquos potential for serving clientsrsquo on-demand needs (8)
Platform as a Service (PaaS) The next level up is where vendors provide not only the raw powermdashthe infrastruc-turemdashbut preconfigured systems running operating sys-tems databases and platforms (programming languages) for building applications For example Microsoftrsquos Azure service provides preconfigured computers running Win-dows and SQL Server And Salesforcecom has Forcecom as its own custom application development platform
In practice the boundary between IaaS and PaaS is not always clear Because IaaS providers most often provide other services such as operating systems database or ap-plication development platform that fall in the PaaS cat-egory In its purest form IaaS can be considered as virtual machines (raw processing power and storage) that can be scaled up and down as you need
Software as a Service (SaaS) Another higher layer is where vendors provide full applications running on cloud infrastructuremdashtheir own or rented from the likes of Amazon Salesforcecom has long been considered one of the most successful SaaS provider Salesforececom CRM was one of the early entrants into the market Salesforcecom prides itself on being a pioneer in Cloud Computing
At Salesforcecom itrsquos all about the Cloud However in their collateral literature dated circa 1993-94 you wonrsquot find any mention of the word ldquocloudrdquo
CLOUD COMPUTING CONCERNS
In survey after survey security is listed as the top concern of Cloud Computing However Cloud Security Alliance (CSA) the industry group that provides security guide-lines and education states that ldquosecurity controls for the cloud computing are for in most part no different than the security controls in any IT environment hellip[however] cloud computing may present different risks to an organi-zation than traditional IT solutionsrdquo 21 p 21
CIOs or CEOs for that matter may feel safer when they ldquoownrdquo versus ldquorentrdquo their IT assets However when you deploy your assets on the Internet for which you eventu-ally will have little choice you will inherit a set of vulner-abilities that are not all that different from the Cloudrsquos Ownership has its own set of financial risks in the form of capital expenditures (CAPEX) that need to be budgeted and spent up front Compare that risk with the far smaller risk of renting (OPEX) which by and large can be dis-continued if needed
Cloud computing technology does not require the use of public networks If your data is too strategically critical and sensitive to be deployed on the Internet you could instead deploy a private cloud that is strictly for your or-ganization Obviously a Private Cloud is more expensive and it needs trained staff However a private cloud lets an organization benefit from cloud technology without the risk of possible public disclosure of its data
Another alternative could be a community cloudmdasha pri-vate cloud that is shared by several organizations for spe-cific needs For example a group of hospitals might create a community cloud to hold patientrsquos medical records
CONCLUSION
Cloud Computing is here to stay and grow Clouds are more versatile than traditional IT networks on many di-mensions They are far more convenient to deploy they have far more potential for collaboration and they are far more scalable than traditional IT ever was The delivery of services is provisioned on global telecommunication net-works that these days have morphed into the Internet And when they mature they will provide a computing utility when and where it is needed
Cloud computing model (adapted from Craig-Wood)
Nozar Daylami The Origin and Construct of Cloud Computing
44 International Journal of the Academic Business World 45Fall 2015 (Volume 9 Issue 2)
BIBLIOGRAPHY
1 Armburst M et al A View of Cloud Computing Communications of the ACM Vol 53 No 4 pages 50-58
2 Craig-Wood K Definition of Cloud Computing incorporating NIST and G-Cloud views httpswwwkatescommentcomdefinition-of-cloud-com-puting-nist-g-cloud Access date April 26 2015
3 Creeger M CTO Roundtable Cloud Computing Communications of the ACM Vol 52 No 8 pages 50-56
4 Cusumano M Cloud Computing and SaaS as New Computing Platforms Communications of the ACM Vol 53 No 4 pages 27-29
5 Foster Ian and Tuecke Steven Describing the Ele-phant The Different Faces of IT as Service wwwac-mqueuecom JulyAugust 2005 pages 26-34 httpdeliveryacmorg10114510900001080874p26-fosterpdf ip=99100108167ampid=1080874ampacc=OPENampkey=4D4702B0C3E38B352E4D4702B0C3E38B352E4D9421298D07BF362E6D218144511F3437ampCFID=505172814ampCFTOKEN=56369758amp__acm__=1429816554_402a40f1d60056fb68e8ccf3fdd96201 accessed April 23 2015
6 Kern Thomas Lacity Mary Cecelia Willcocks Leslie P Netsourcing Renting Business Applica-tions and Services Over a Network Prentice Hall 2002
7 Knoblauch A Deconstructing Cloud Smashwords Edition (Kindle Version) First Edition August 2013
8 Garfinkel Simon (2011 Oct 3) The Cloud Imperative MIT Technology Review httpwwwtechnologyreviewcomnews425623the-cloud-imperative
9 Hayes B Cloud Computing Communications of the ACM Vol 51 No 7 pages 9-11
10 Internet Solution Division Strategy for Cloud Com-puting Compaq Computer Corporation (1996) httpwwwtechnologyreviewcomsitesdefaultfileslegacycompaq_cst_1996_0pdf
11 Lacity M C Hirschheim R Information Systems Outsourcing Myths Metaphors and Realities New York John Wiley amp Sons 1993
12 McAfee A The Year the Cloud Rolled In httpshbrorg2010122010-the-year-the-cloud-rolled Access date April 23 2015
13 McAfee A What Every CEO Needs to Know About the Cloud httpshbrorg201111what-every-ceo-needs-to-know-about-the-cloud Access date April 23 2015
14 McGrath R Whorsquos Disrupting the Gaming Indus-try httpshbrorg200804whos-disrupting-the-gaming-ind Access date April 23 2015
15 Mell P Grance T The NIST Definition of Cloud Computing National Institute of Standards and Technology httpcsrcnistgovpublicationsnist-pubs800-145SP800-145pdf
16 Neumann P Risks and Myths of Cloud Comput-ing and Cloud Storage Communications of the ACM Vol 57 No 10 pages 25-27 The NIST Defi-nition of Cloud Computing httpcsrcnistgovpublicationsnistpubs800-145SP800-145pdf
17 NIST Definition of Cloud Computing httpcsrcnistgovpublicationsnistpubs800-145SP800-145pdf
18 NIST Cloud Computing Reference Architecture National Institute of Standards and Technology Special Publication 500-292 httpwwwnistgovcustomcfget_pdfcfmpub_id=909505
19 Nanavati M Colp P Aiello W and Warfield A Cloud Security A Gathering Storm Communica-tions of the ACM Vol 57 No 8 pages 70-79
20 Regalado Antonio (2011 Oct 31) Who coined cloud computing MIT Technology Review httpwwwtechnologyreviewcomnews425970who-coined-cloud-computing
21 Security Guidance for Critical Areas of Focus in Cloud Computing V30 Cloud Security Alliance httpscloudsecurityallianceorgguidancecsagu-idev30pd
22 Seviokla J Does Cisco Have Its Head in the Clouds httpshbrorg200903does-cisco-have-its-head-in-th Access date April 23 2015
23 Walsh K R Analyzing the Application ASP Concept Technologies Economies and Strategies Communications of ACM Vol 46 No 8 pages 103-107
24 Yang H Tate Mary A Descriptive Literature Review and Classification of Cloud Computing Re-search Communications of Association of Informa-tion Systems Vol 31 2012
Nozar Daylami
46 Fall 2015 (Volume 9 Issue 2)
This page intentionally blank
International Journal of the Academic Business World 47
INTRODUCTION
In their paper ldquoSAS and the Efficient Portfoliordquo Thomp-son and El-houbi (2012) develop a SAS program to calcu-late portfolio weights for efficient stock portfolios Their program improves on existing public domain SAS pro-grams of this type by allowing for portfolios with a rela-tively large number of securities Thompson and El-houbi also claim that their SAS program is an improvement over the Excel programs used to calculate portfolio weights which are sometimes included in investment textbooks They note that users concur that their program is easier to use than those Excel programs which either limit the number of securities that can be included in a portfolio require ldquocorrectionsrdquo or ldquoadjustmentsrdquo to overcome some quirks in the Excel Solver routine or require multiple user interventions
The Thompson and El-houbi program is certainly more elegant and user friendly than the equivalent Excel pro-grams and will provide those with access to the SAS pro-gramming language a valuable tool for learning portfolio management The disadvantage of a SAS program how-ever is that many students will not have easy access to the SAS programming language Students at smaller univer-sities may not have any access to SAS while students at many larger universities may only be able to access SAS at a computer lab on campus
In this paper I modify the Thompson and El-houbi SAS program for use in the open-source R programming lan-guage which is available free of charge for anyone with access to the internet Using the R language program to compute portfolio weights for efficient portfolios main-tains the elegance of the Thompson and El-houbi SAS
program while overcoming the disadvantage of limited SAS availability In addition I extend the Thompson and El-houbi program by making use of a quadratic program-ming package available in R to provide a program that can accommodate short-sale restrictions and position limits
THE R PROGRAMMING LANGUAGE
R is a free programming language for statistical analysis and graphics and runs on many UNIX platforms and on Windows and MacOS It is available under the terms of the Free Software Foundationrsquos GNU General Public License R was developed initially by Robert Gentleman and Ross Ihaka both of the University of Auckland (New Zealand) and is based on the S programming language developed at Bell Labs by John Chambers Since its initial development the popularity of R has grown considerably largely because of its ease of use and because of the avail-ability of many add-on packages that allow users to tackle very sophisticated projects
The base R package may be downloaded at httpcranusr-projectorg That web page also provides links to sources of information about R and basic user manuals There are also many books and manuals now available for purchase that offer information on both basic and special-ized uses of the language In fact Vance (2009) suggests that the growing popularity of the R language at univer-sities language could even result in noticeably lower de-mand for SAS
THE MARKOWITZ PORTFOLIO PROBLEM
As Markowitz (1952) notes an investor following the ldquoex-pected returns-variance of returns rulerdquo will choose an ef-
Optimal Portfolios and the R Programming Language
James A TurnerAssistant Professor of Finance
School of Accounting amp TaxationWeber State University
Ogden UT 84408
ABSTRACTThis paper develops a program in the freely available open-source R programming language to calculate weights for optimal stock portfolios The program retains the advantages the Thompson and El-houbi (2012) SAS program has over similar programs in Excel but avoids the potential problem of limited access to SAS that some students and researchers may face The R program also extends the Thompson and El-houbi program by including the ability to accommodate short-sale restrictions and position limits
James A Turner Optimal Portfolios and the R Programming Language
48 International Journal of the Academic Business World 49Fall 2015 (Volume 9 Issue 2)
ficient portfolio that is a portfolio with maximum ex-pected return for a given variance or one with minimum variance for a given expected return The minimum vari-ance formulation of the portfolio choice problem there-fore requires that the investor choose portfolio weights to minimize the variance of a portfolio with a given expected return The problem also requires that all money be in-vested (which means that the portfolio weights must sum to one) In matrix notation the optimization problem is
where w the choice variable is a k times 1 vector of the weights invested in the k securities in the portfolio V is the port-folio variance-covariance matrix and R is a 2 times k matrix whose first row is a vector of ones and whose second row contains the expected returns of each security in the port-folio M is a 2 times 1 vector whose first element is one (corre-sponding to the constraint that the portfolio weights sum to one) and whose second element is the chosen portfo-lio expected return For now there are no restrictions on short sales so some portfolio weights may be negative
The Lagrangian for the problem is
( ) L w Vw M Rwλprime prime= + minus
where λ is a 2 times 1 vector containing the Lagrangian multi-pliers The first-order conditions for a minimum (which are also sufficient conditions in this case) are
Solving the first-order conditions for w and λ yields
( )( )
11 1
112
w V R RV R M
RV R Mλ
minusminus minus
minusminus
prime prime=
prime=
Thompson and El-houbi following Stephens (1998) let 1 H RV Rminus prime= so that
1 1
1
2
w V R H MH Mλ
minus minus
minus
prime=
=
Stephens (1998 p 36) shows how the elements of the H matrix may be used ldquoto fix any meanvariance point on the efficient frontierrdquo
Min st
w VwRw M
prime
=
2 0
0
L Vw RwL M Rw
λ
λ
part prime= minus =partpart
= minus =part
THE BASIC R PORTFOLIO OPTIMIZATION PROGRAM
The R programming language lends itself very easily to matrix manipulation and matrix computation removing much of the difficulty in solving the standard Markowitz portfolio problem The following R program calculates the portfolio weights for an efficient portfolio using stock return data to estimate expected returns and the variance-covariance matrix The user must specify the desired port-folio expected return The program can accommodate portfolios up to about 50 stocks Beyond that number precision limitations of the R language may make the variance-covariance matrix ldquocomputationally singularrdquo and unable to be inverted
The first step in the program is to read in the return data R can input data from many file types but in the present example the data are stored in a comma-delimited Excel file called ldquoReturnscsvrdquo which contains stock return data In this case the Excel file includes a header row labeling each column of returns with identifying information but no row names The program first reads in the data and then determines the number of securities (number of col-umns in the matrix) as shown on the facing page
ADDING SHORT-SALE CONSTRAINTS AND POSITION LIMITS
The above formulation of the portfolio choice problem places no restrictions on short sales and does not accom-modate position limits In reality individual investors and some fund managers may face requirements prohibit-ing short sales Fund managers may also face requirements that either limit the amount that may be invested in one security or sector or instead that a minimum percentage of funds be invested in a certain security or sector Dai Lin and Liu (2011) list several examples of real-world po-sition limits such as a requirement that a small-cap mutu-al fund invest at least a minimum percentage of its funds in small-company stocks In mathematical terms these short-sale restrictions and position limits can be expressed as a series of inequality constraints While reformulating the portfolio choice problem to add inequality constraints is not difficult doing so makes actually solving the prob-lem considerably more difficult
With short-sale restrictions and position limits the port-folio choice problem becomes
0
Min st
w VwRw MSw w
prime
=ge
where w is still the choice variable S is an m times k matrix that defines both the short-sale constraints on the k se-curities in the portfolio and m minus k other restrictions If there are short-sale constraints but no other restrictions the S matrix is simply a k times k identity matrix which when multiplied by the vector w results in the requirement that
0 iw ige forall If there are other restrictions the sub-matrix of S consisting of the first k rows and k columns of S is an identity matrix and the other restrictions are specified by suitable choices of the elements of the remaining rows of S For example suppose there is a position limit placing a maximum of p on the percentage invested in the sev-enth security so that 7 w ple Since the constraints in the optimization problem above have been expressed as non-negativity constraints this position limit must instead take the form 7 w pminus ge minus The row of S corresponding to
the position limit will consist entirely of zeros except for the seventh element which will be minus1 and corresponding element of the w0 vector would be p
Introducing other forms of position limits simply requires adding the appropriate rows to the S matrix For example if there is a requirement that the total percentage invested in the first and third securities equal or exceed a certain percentage q then one row of S should be [1 0 1 0 0]and the corresponding element of the w0 vector would be q If there is instead a requirement that the total percentage invested in the first and third securities not exceed a cer-tain amount q the required row of S would be [-1 0 -1 0 0] and the corresponding element of the w0 vector would be minusq Other restrictions may be specified similarly For problems that include position limits each of the first k el-
The BASIC R Portfolio Optimation Program
Returns ltminus readtable(ldquoReturnscsvrdquo header = TRUE sep = ldquordquo)Rmat ltminus asmatrix(Returns) Converts the data to matrix formk ltminus ncol(Rmat) Number of columns (number of securities in the portfolio) Now the program calculates the estimate of the variance-covariance matrix (V) the M vector and the R matrix which includes the estimate of the expected returns
V ltminus var(Rmat) Calculates the sample variance-covariance matrix which is used as the estimate of the variance-covariance matrix
Erp ltminus 001 Sets the desired expected portfolio return The user can change this value as desired
M ltminus rbind(1 Erp) Ones ltminus rep(1 k) Ravg ltminus colMeans(Rmat)
Defines the M matrix including the required portfolio return Defines a 1 x k matrix of ones Calculates average returns by column giving a 1 x k matrix of estimated expected returns
R ltminus rbind(Ones Ravg) Combines Ones and Ravg into the 2 x k matrix R Finally the program calculates the portfolio weights and the portfolio variance
VINV ltminus solve(V) Calculates the inverse of the estimated variance-covariance matrixH ltminus RVINVt(R) Calculates the H matrixHINV ltminus solve(H) Calculates the inverse of Hw lt- VINVt(R)HINVM Calculates the portfolio weightsPvar lt- t(w)Vw Calculates the portfolio variance The following commands display the results of the calculations
print(w) Prints the elements of the w vectorprint(Pvar) Prints the variance of the portfolio formed using the weights w
James A Turner Optimal Portfolios and the R Programming Language
50 International Journal of the Academic Business World 51Fall 2015 (Volume 9 Issue 2)
ements of the w0 vector will be zero corresponding to the non-negativity constraints and the remaining elements will equal the percentages associated with the position limits entered as positive or negative numbers depend-ing on whether the position limits establish minimums or maximums
The Lagrangian for this problem is
( ) ( )0 L w Vw M Rw w Swλ microprime prime prime= + minus + minus
where λ is a 2 times 1 vector containing the Lagrangian multi-pliers on the equality constraints and micro is an m times 1 vector of the Lagrangian multipliers on the k short-sale constraints and the m ndash k position limits The first-order necessary con-ditions for this problem are the Kuhn-Tucker conditions
( )0 0
2 0
0
0 0 and 0
L Vw R SwL M Rw
L w Sw w Sw
λ micro
λ
micro micromicro
part prime prime= minus minus =partpart
= minus =partpart prime= minus le ge minus =part
The final set of conditions are known as the complementa-ry slackness conditions since if an element of partLpartμ does not equal zero (ie if the required condition is slack) then the corresponding element of micro must equal zero and vice versa Because of the complementary slackness conditions in order to find a solution to the optimization problem each condition must be checked individually to deter-mine the possible solutions If there are more than a very few constraints finding the candidate solutions manually becomes extremely tedious
Fortunately it is possible to use numerical methods to solve this type of non-linear programming program This is where the strength of the R programming language be-comes very evident The R language provides access to an extensive number of add-on packages developed by R us-ers around the world In particular there are several pack-ages that implement numerical methods to find solutions to optimization problems with inequality constraints Perhaps the package that most easily lends itself to solv-ing the current problem is the ldquoquadprogrdquo package Ac-cording to the documentation included with the pack-age the quadprog routine ldquoimplements the dual method of Goldfarb and Idnani (1982 1983) for solving qua-dratic programming problems of the form min(d΄b+frac12b΄Db)) with the constraints Aʹbgtb₀rdquo For the optimization problem currently under consideration the d vector will be a zero vector the b vector will be the w vec-tor of portfolio weights the D matrix will be the variance-
covariance matrix V and the matrix A΄ will equal a matrix formed by combining the R matrix and the S matrix such that A΄= [R
S ]and A = [ R΄ S΄] Since the V matrix is symmetric the term frac12b΄Db = frac12w΄Vw is a quadratic form Also because the d vector is a zero vector the presence of the frac12 term in the quadratic form does not change the value of the solution to the current portfolio optimization problem That is the weights that minimize frac12w΄Vw sub-ject to the constraints will also minimize w΄Vw subject to the constraints
THE R PORTFOLIO OPTIMIZATION PROGRAM WITH PACKAGE ldquoQUADPROGrdquo
The ldquoQuadprogrdquo package is one of many add-in packages available to R users To use add-in packages in R the user must first download and install the chosen package This is done through the ldquoPackagesrdquo command in the menu bar of the console window Selecting the ldquoInstall package(s)rdquo command from the drop-down box will bring up a list of download locations After selecting a download location the user selects the package(s) to download and install Finally once the selected package is downloaded and in-stalled it must be loaded for use in the current R session which is done by choosing ldquoPackagesrdquo command on the menu bar and then choosing the ldquoLoad packagerdquo com-mand from the drop-down box A list of available packag-es will then appear and the user should select the desired package in this case the ldquoquadprogrdquo package Once the quadprog package is loaded the following program will solve the portfolio problem with short-sale restrictions and position limits
In the present example the short-sale constraint requires that all elements of the w vector be non-negative In addi-tion there are three position limits The first position lim-it requires that no more than 5 of total funds be invested in the seventh security The second position limit requires that no more than a total of 40 of available funds be in-vested in the first and third securities The third position limit requires that total of at least 30 of available funds be invested in the second and fourth securities
The program will make use of the M matrix and the vari-ance-covariance matrix V from the earlier program so those variables must be saved by the user or the following program must be run after running the previous program and before exiting R The new program first sets the posi-tion limits as shown on the facing page
The output of the ldquosolveQPrdquo function includes the values of w and the Lagrangian multipliers for each constraint If the value of a Lagrangian multiplier is zero the constraint associated with that multiplier is not binding otherwise the constraint is binding Though checking the values of
the Lagrangian multipliers allows the user to determine which constraints are binding quite easily the functionrsquos output also includes a listing of the binding constraints by index number
The R Portfolio Optimization Program with Package ldquoQuadprogrdquo
npl ltminus 3 Sets the number of position limits The user sets this value
plmat ltminus matrix (rep(0 nplk) nrow=npl ncol=k) Initializes the matrix that will be used to define the position limit(s)
plmat[17] = -1 Places the required elements into the proper places in the lmat[21] = plmat[23] = -1 position limits matrix In this example the first position
plmat[32] = plmat[34] = 1 limit will set a maximum on the total percentage invested in the seventh security The second position limit will set a maximum on the total percentage invested in the first and third securities The third position limit will set a minimum on the total percentage invested in the second and fourth securities
pl ltminus c(-005 -04 03) Sets the values of the position limits The value the user enters should be positive if the position limit specifies a inimum and should be negative if the position limit specifies a maximum
Next the inequality constraints are placed in matrix form
S ltminus rbind(diag(k) plmat) Defines the S matrix
w0 ltminus c(rep(0 k) pl) Creates a vector whose elements are the values of the inequality constraints
Next the arguments required by the solveQP function that solves the programming problem are defined and the programming problem is solved
dvec ltminus rep(0 k) Defines the d vector which is a necessary input for the quadprog package For portfolio optimization problems the elements of the d vector will all be zeros
Amat ltminus colbind(t(R) t(S)) Forms the Amat matrix
bvec ltminus c(M w0) Joins the M matrix and the w0 matrix to form the bvec vector
ICSol ltminus solveQP(V dvec Amat bvec meq=2) Solves the quadratic programming problem The argument meq specifies that the first two constraints are equality constraints In this example the equality constraints are that the weights sum to one and that the portfolio expected return equal a specified amount
print(c(ICSol[1] 2ICSol[[2]] ICSol[5] ICSol[6])) Prints selected output from the solve QP function the weights the portfolio variance the values of the Lagrangian multipliers and the index numbers of the binding constraints
James A Turner Optimal Portfolios and the R Programming Language
52 International Journal of the Academic Business World 53Fall 2015 (Volume 9 Issue 2)
CONCLUSION
This paper provides an R language program to calculate portfolio weights for efficient portfolios The program can also accommodate short-sale constraints and position limits Users must choose the desired portfolio expected return and must specify any other constraints A strong advantage of the program is that because the R program-ming language is freely available to anyone with access to the internet students and others who wish to use the pro-gram will be able to do so easily
REFERENCES
Dai Min Hanqing Jin and Hong Liu 2011 Illiquidity position limits and optimal investment for mutual funds Journal of Economic Theory 146 1598ndash1630
Goldfarb D and A Idnani 1982 Dual and primal-dual methods for solving strictly convex quadratic pro-grams In Hennart J P (ed) Numerical Analysis Springer-Verlag Berlin pages 77ndash91
Goldfarb D and A Idnani 1983 A numerically stable dual method for solving strictly convex quadratic pro-grams Mathematical Programming 27 1ndash33
Ihaka Ross A free software project Retrieved May 7 2013 from httpcranr-projectorgdochtmlinter-face98-paperpaper_2html
Markowitz Harry 1952 Portfolio selection Journal of Finance 7 77ndash91
Stephens Alan 1998 Markowitz and the spreadsheet Journal of Financial Education 35ndash43
Thompson Thomas H and Ashraf El-houbi 2012 SAS and the efficient portfolio International Research Jour-nal of Applied Finance 3 315ndash327
Turlach Berwin A 2013 quadprog Functions to solve quadratic programming problems R pack-age version 15-5 httpCRANR-projectorgpackage=quadprog (S original by Berwin A Turlach R port by Andreas Weingessel)
Vance Ashlee 2009 Data analysts captivated by Rrsquos power The New York Times Retrieved May 1 2013 from httpwwwnytimescom20090107tech nolog y busi ness-computi ng 0 7prog ra m htmlpagewanted=allamp_r=0
What is R Retrieved May 7 2013 from httpwwwr-projectorgabouthtml
APPENDIX 1 DATA
The data used in the R program come from the CRSP monthly stock file and consist of 60 months of return data from January 2008 to December 2012 The stocks in the 10-stock portfolio are the first 10 stocks in the CRSP monthly file (listed by PERMNO) for which 60 continuous months of returns are available The stocks in the 50-stock portfolio are the first 50 stocks for which 60 continuous months of returns are available Table 1 below lists the PERMNOS current company name and current ticker of the included stocks as well as the exchange where the stock trades
Table 1 Stocks in the Portfolio
NO PERMNO CURRENT COMPANY NAME TICKER EXCHANGE1 10001 GAS NATURAL INC EGAS AMEX2 10002 BANCTRUST FINANCIAL GROUP INC BTFG NASDAQ3 10025 A E P INDUSTRIES INC AEPI NASDAQ4 10026 J amp J SNACK FOODS CORP JJSF NASDAQ5 10032 PLEXUS CORP PLXS NASDAQ6 10044 ROCKY MOUNTAIN CHOCOLATE FAC INC RMCF NASDAQ7 10051 HANGER INC HGR NYSE8 10065 ADAMS EXPRESS CO ADX NYSE9 10100 AMERICAN LEARNING CORP NY ALRN NASDAQ
Table 1 Stocks in the Portfolio
NO PERMNO CURRENT COMPANY NAME TICKER EXCHANGE10 10104 ORACLE CORP ORCL NASDAQ11 10107 MICROSOFT CORP MSFT NASDAQ12 10138 T ROWE PRICE GROUP INC TROW NASDAQ13 10145 HONEYWELL INTERNATIONAL INC HON NYSE14 10147 E M C CORP MA EMC NYSE15 10180 AKORN INC AKRX NASDAQ16 10182 TECH DATA CORP TECD NASDAQ17 10200 REPLIGEN CORP RGEN NASDAQ18 10207 ROYCE FOCUS TRUST INC FUND NASDAQ19 10225 BEAM INC BEAM NYSE20 10232 ELMIRA SAVINGS BANK NY ESBK NASDAQ21 10239 BALDWIN amp LYONS INC BWINB NASDAQ22 10252 INDEPENDENT BANK CORP MA INDB NASDAQ23 10253 DOCUMENT SECURITY SYSTEMS INC DSS AMEX24 10257 D L H HOLDINGS CORP DLHC NASDAQ25 10258 CELLDEX THERAPEUTICS INC CLDX NASDAQ26 10259 SIGMA DESIGNS INC SIGM NASDAQ27 10294 HAVERTY FURNITURE COS INC HVT NYSE28 10297 NEW HAMPSHIRE THRIFT BNCSHRS INC NHTB NASDAQ29 10299 LINEAR TECHNOLOGY CORP LLTC NASDAQ30 10302 CYPRESS SEMICONDUCTOR CORP CY NASDAQ31 10308 TOMPKINS FINANCIAL CORP TMP AMEX32 10318 BALCHEM CORP BCPC NASDAQ33 10333 XOMA CORP XOMA NASDAQ34 10355 DAILY JOURNAL CORP DJCO NASDAQ35 10363 A M A G PHARMACEUTICALS INC AMAG NASDAQ36 10375 T C F FINANCIAL CORP TCB NYSE37 10382 ASTEC INDUSTRIES INC ASTE NASDAQ38 10395 NAVIGATORS GROUP INC NAVG NASDAQ39 10397 WERNER ENTERPRISES INC WERN NASDAQ40 10421 SKYWEST INC SKYW NASDAQ41 10443 PATRIOT TRANSPORTATION HLDG INC PATR NASDAQ42 10463 RESEARCH FRONTIERS INC REFR NASDAQ43 10501 AMERICAN WOODMARK CORP AMWD NASDAQ44 10507 MEDICAL ACTION INDS INC MDCI NASDAQ45 10514 TRANS WORLD ENTERTAINMENT CORP TWMC NASDAQ46 10516 ARCHER DANIELS MIDLAND CO ADM NYSE47 10517 AARONS INC AAN NYSE48 10530 MERIDIAN BIOSCIENCE INC VIVO NASDAQ49 10547 CLEARFIELD INC CLFD NASDAQ50 10550 PRO DEX INC COLO PDEX NASDAQ
James A Turner Optimal Portfolios and the R Programming Language
54 International Journal of the Academic Business World 55Fall 2015 (Volume 9 Issue 2)
APPENDIX 3 RESULTS FOR THE 10-STOCK PORTFOLIO
Results for the 10-stock portfolio with a monthly expect-ed return of 1 are shown at the top of the facing page First shown is the variance-covariance matrix (V) fol-lowed by its inverse (V-1)
Table 2 shows the return averages of each stock and the calculated portfolio weights both for the portfolio with no short-sale constraints or position limits and the port-folio with short-sale constraints and three position limits (1) a requirement that the percentage invested in the sev-enth security not exceed 5 (2) a requirement that the
total percentage invested in the first and the third securi-ties not exceed 40 and (3) a requirement that the total percentage invested in the second and fourth securities be at least 30 Note that when short-sale constraints and position limits are imposed there may no longer be a port-folio that meets all the constraints that is the feasible set may be null In that case the R program will return an error message stating that the constraints are inconsistent
Table 3 lists the inequality constraints and the associ-ated Lagrangian multipliers along with an indication of whether the constraint is binding In this example the constraint that there be a minimum of 30 invested in the second and fourth securities is not binding
APPENDIX 2 COPY OF THE FULL PROGRAM
The full program is shown below without comments Users can easily copy the program that is between the solid lines and paste it into the R Editor window It will probably be necessary for each user to change the name of the data file in the readtable command Also the user can change the portfolio expected return and the number type and value of the inequality constraints as desired
Returns ltminus readtable(ldquoReturnscsvrdquo header = TRUE sep = ldquordquo) Rmat ltminus asmatrix(Returns) k ltminus ncol(Rmat) V ltminus var(Rmat) Erp ltminus 001 M ltminus rbind(1 Erp) Ones ltminus rep(1 k) Ravg ltminus colMeans(Rmat) R ltminus rbind(Ones Ravg) VINV ltminus solve(V) H ltminus RVINVt(R) HINV ltminus solve(H) w lt- VINVt(R)HINVM Pvar lt- t(w)Vw print(w) print(Pvar) npl ltminus 3 plmat ltminus matrix (rep(0 nplk) nrow=npl ncol=k) plmat[17] = -1 plmat[21] = plmat[23] = -1 plmat[32] = plmat[34] = 1 pl ltminus c(-005 -04 03)S ltminus rbind(diag(k) plmat) w0 ltminus c(rep(0 k) pl) dvec ltminus rep(0 k) Amat ltminus cbind(t(R) t(S)) bvec ltminus c(M w0) ICSol ltminus solveQP(V dvec Amat bvec meq=2) print(c(ICSol[1] 2ICSol[[2]] ICSol[5] ICSol[6]))
1
2867001 161224 279311 153314 408660 148438 131874 246057 83608 740152
161224 321169 23967 251277 39387 55190 33449 107899 36378 39718
279311 23967 991158 109233 189872 100249 22208 119
V minus
minus minus minus
minus minus minus minus
minus minus minus minus
=
6782 41342 198294
153314 251277 109233 2757210 319797 03010 139907 969199 56520 416534
408660 39387 189872 319797 977494 325171 247388 1098965 26657 04097
148438 55190 100249 03010 325171 1
minus minus minus minus minus
minus minus minus minus minus minus
minus 644368 311333 1803329 91576 428583
131874 33449 22208 139907 247388 311333 1093506 426730 100681 162364
246057 107899 1196782 969199 1098965 1803329 426730 11640904 233195 3789283
8360
minus minus
minus minus minus minus minus minus minus
minus minus minus minus minus minus
8 36378 41342 56520 26657 91576 100681 233195 138635 73382
740152 39718 198294 416534 04097 428583 162364 3789283 73382 3685519
minus minus
minus minus minus minus minus minus
00046 00019 00002 00006 00035 00004 00011 00008 00018 00019
00019 00364 00013 00037 00002 00004 00003 00001 00100 00007
00002 00013 00161 00024 00076 00035 00013 00041 00038 00033
00006 0
V
minus minus minus minus
minus minus minus minus
minus minus
=
0037 00024 00058 00051 00010 00016 00021 00028 00029
00035 00002 00076 00051 00217 00009 00048 00052 00024 00064
00004 00004 00035 00010 00009 00087 00018 00022 00027 00012
00011 00003 00013 000
minus
minus minus
minus minus minus
16 00048 00018 00113 00013 00055 00018
00008 00001 00041 00021 00052 00022 00013 00033 00003 00034
00018 00100 00038 00028 00024 00027 00055 00003 00850 00020
00019 00007 00033 00029 00064 00
minus
minus minus minus minus minus minus minus minus
012 00018 00034 00020 00068minus
Table 2 Average Returns and Weights for the Ten-
Stock Portfolios
Stock No Permno
Average Returns
Weights (SS
Allowed)IC Weights
(No SS 3 PLs)
1 10001 00064 03817 034062 10002 -00054 00311 004063 10025 00183 00908 005944 10026 00156 02525 026255 10032 00095 -01410 000006 10044 00012 00649 013797 10051 00206 01000 005008 10065 00018 01933 004929 10100 00270 00422 0056810 10104 00104 -00155 00031
Table 3 Constraints and Lagrangian Multipliers
Constraint Lagrangian Multiplier
Constraint Binding
Portfolio weights sum to one 00015 Yes
Portfolio expected return equals 1 00443 Yes
w1 ge 0 00000 No w2 ge 0 00000 No
w3 ge 0 00000 No
w4 ge 0 00000 No
w5 ge 0 00015 Yes
w6 ge 0 00000 No
w7 ge 0 00000 No
w8 ge 0 00000 No
w9 ge 0 00000 No
w10ge 0 00000 No
w7 le 005 00003 Yes
w1 + w3 le 04 00002 Yes
w2 + w4 ge 03 00000 No
James A Turner Optimal Portfolios and the R Programming Language
56 International Journal of the Academic Business World 57Fall 2015 (Volume 9 Issue 2)
The portfolio variances are
No short-sale constraints 0001607 Short-sale constraints and three position limits 0001856
APPENDIX 4 RESULTS FOR THE 50-STOCK PORTFOLIO
Results for the 50-stock portfolio with a monthly ex-pected return of 1 are shown in Table 4 below The first table shows the return averages of each stock and the cal-culated portfolio weights both for the portfolio with no short-sale constraints or position limits and the portfolio with short-sale constraints and three position limits (1) a requirement that the percentage invested in the seventh security not exceed 5 (2) a requirement that the total percentage invested in the first and the third securities not exceed 40 and (3) a requirement that the total percent-age invested in the second and fourth securities be at least 30
Table 5 shows the Lagrangian multipliers on the equal-ity constraints and the position limit constraints To save space for the 50-stock portfolio the Lagrangian multi-pliers on the short-sale constraints are not listed Simply checking Table 4 to see if the weight on a particular stock is zero gives an almost certain indication of which short-sale constraints are binding In this example both the constraint that there be no more than 5 invested in the seventh security and the constraint that there be no more than a total of 40 invested in the first and third securi-ties are not binding
Table 4 Average Returns and Weights for the
50-Stock PortfoliosStock
No Permno Average Returns
Weights SS Allowed
IC Weights No SS 3 PLs
1 10001 00064 01934 013072 10002 -00054 -00179 003673 10025 00183 -00189 000004 10026 00156 02873 026335 10032 00095 00503 000006 10044 00012 -00185 000007 10051 00206 -00136 002288 10065 00018 10920 000009 10100 00270 00306 00423
10 10104 00104 01467 0000011 10107 -00001 -02023 00000
Table 4 Average Returns and Weights for the
50-Stock PortfoliosStock
No Permno Average Returns
Weights SS Allowed
IC Weights No SS 3 PLs
12 10138 00085 -05619 0000013 10145 00065 -03910 0000014 10147 00088 -02693 0000015 10180 00290 -00290 0000016 10182 00076 01181 0000017 10200 00082 01409 0040918 10207 00020 -01551 0000019 10225 00098 00285 0000020 10232 00159 -00021 0000021 10239 00051 01624 0000022 10252 00084 00955 0000023 10253 00058 00121 0000024 10257 -00008 -00236 0000025 10258 00196 -00157 0000026 10259 -00300 -01339 0000027 10294 00179 -00414 0000028 10297 00061 01854 0146729 10299 00074 00826 0000030 10302 00165 00201 0000031 10308 00073 01255 0014132 10318 00194 -01389 0000033 10333 -00203 -00205 0000034 10355 00299 -00545 0036035 10363 -00151 -00167 0000036 10375 00010 -00495 0000037 10382 00046 00267 0000038 10395 -00022 00886 0042339 10397 00134 01296 0084940 10421 -00036 -01045 0000041 10443 00021 01389 0000042 10463 00013 00417 0000043 10501 00176 -00458 0000044 10507 -00228 -00397 0000045 10514 00100 00731 0007846 10516 -00034 -00148 0119247 10517 00208 00629 0000048 10530 00005 00032 0000049 10547 00418 00032 0012550 10550 -00028 00397 00000
The portfolio variances are
No short-sale constraints 000002997 Short-sale constraints and three position limits 000111119
Table 5 Constraints and Lagrangian Multipliers
Constraint Lagrangian Multiplier Constraint Binding
Portfolio weights sum to one 0000503 YesPortfolio expected return equals 1 0031954 Yes
w7 le 005 0000000 Now1 + w3 le 04 0000000 Now2 + w4 ge 03 0000963 Yes
James A Turner
58 Fall 2015 (Volume 9 Issue 2)
This page intentionally blank
JOINT CONFERENCE May 25th 26th and 27th 2016 in
Nashville TN
Academic Business World International Conference
(ABWICorg)
The aim of Academic Business World is to promote inclusiveness in research by offering a forum for the discussion of research in early stages as well as re-search that may differ from lsquotraditionalrsquo paradigms We wish our conferences to have a reputation for providing a peer-reviewed venue that is open to the full range of researchers in business as well as reference disciplines within the social sciences
Business Disciplines
We encourage the submission of manuscripts presentation outlines and ab-stracts pertaining to any business or related discipline topic We believe that all disciplines are interrelated and that looking at our disciplines and how they relate to each other is preferable to focusing only on our individual lsquosilos of knowledgersquo The ideal presentation would cross discipline borders so as to be more relevant than a topic only of interest to a small subset of a single disci-pline Of course single domain topics are needed as well
International Conference on Learning and Administration in
Higher Education (ICLAHEorg)
All too often learning takes a back seat to discipline related research The In-ternational Conference on Learning and Administration in Higher Educa-tion seeks to focus exclusively on all aspects of learning and administration in higher education We wish to bring together a wide variety of individuals from all countries and all disciplines for the purpose of exchanging experi-ences ideas and research findings in the processes involved in learning and administration in the academic environment of higher education
We encourage the submission of manuscripts presentation outlines and ab-stracts in either of the following areas
Learning
We encourage the submission of manuscripts pertaining to pedagogical top-ics We believe that much of the learning process is not discipline specific and that we can all benefit from looking at research and practices outside our own discipline The ideal submission would take a general focus on learning rather than a discipline-specific perspective For example instead of focusing on ldquoMotivating Students in Group Projects in Marketing Managementrdquo you might broaden the perspective to ldquoMotivating Students in Group Projects in Upper Division Coursesrdquo or simply ldquoMotivating Students in Group Projectsrdquo The objective here is to share your work with the larger audience
Academic Administration
We encourage the submission of manuscripts pertaining to the administra-tion of academic units in colleges and universities We believe that many of the challenges facing academic departments are not discipline specific and that learning how different departments address these challenges will be ben-eficial The ideal paper would provide information that many administrators would find useful regardless of their own disciplines
- Testing Major Factors for Reducing Obstacles to Product Innovation Success
-
- Dr Tor Guimaraes
- Dr Marcelo Seido Nagano
- Dr Curtis Armstrong
-
- Acceptance of Change Exploring the Relationship among Psychometric Constructs and Employee Resistance
-
- Brian Dunican EdD
- Ric Keaster PhD
-
- The Origin and Construct of Cloud Computing
-
- Nozar Daylami PhD
-
- Optimal Portfolios and the R Programming Language
-
- James A Turner
-
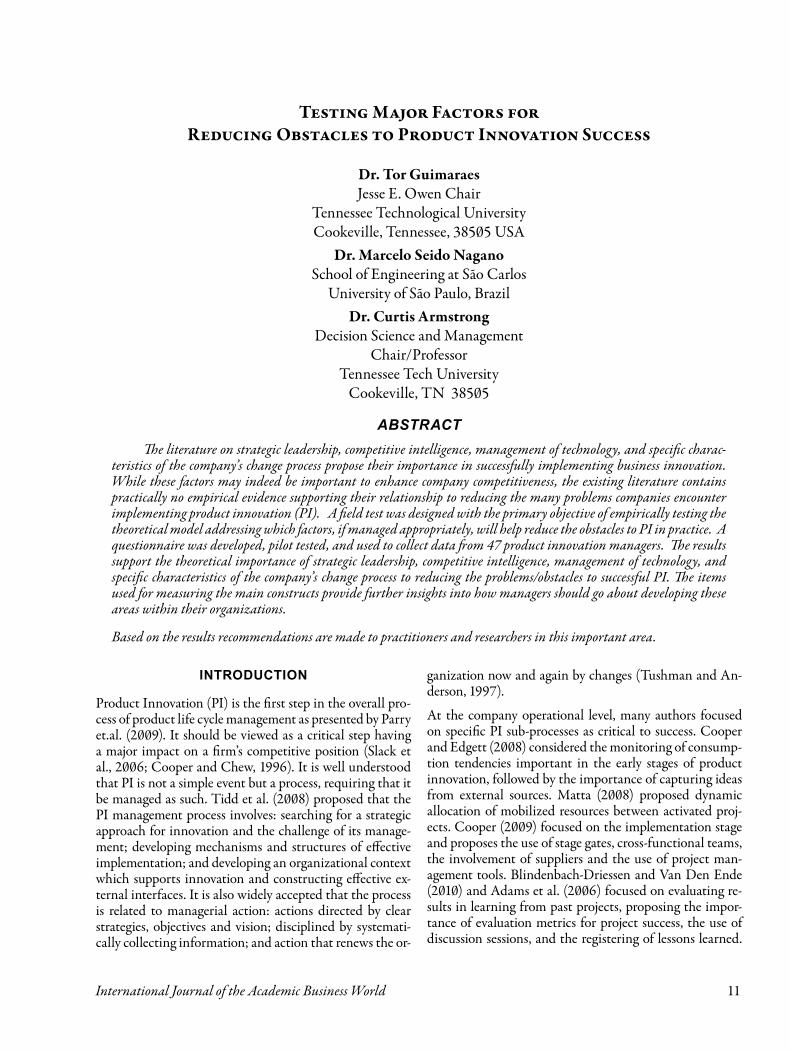
Tor Guimaraes Marcelo Seido Nagano amp Curtis Armstrong Testing Major Factors for Reducing Obstacles to Product Innovation Success
14 International Journal of the Academic Business World 15Fall 2015 (Volume 9 Issue 2)
by Ghoshal amp Westney (1991) and other approaches useful for companies to collect information from competitors were addressed by Heil amp Robertson (1991) The importance of organization intelligence to financial performance was also demonstrated many years ago Companies with well-established CI programs on the average showed earnings per share of $124 compared to those without CI programs which lost 7 cents (King 1997)
Over time the importance of CI has grown steadily in Asia and in Europe where companies with intelligence budgets of more the $2 million or more did not exist five years ago but today represent 2-3 percent of all intelligence budgets Further in North America programs that spend more than one-million dollars increased from approximately 5-percent of all corporate intelligence program budgets to nearly 10-percent of all budgets (Fuld and Company 2013) Despite its importance and steady adoption all over the world (Pellissier amp Nenzhelele 2013) CI is no panacea and has its prerequisites (Nemutanzhela amp Iyamu 2011)
The literature contains many examples of benefits that can be derived from CI Among these are improved competi-tive edge (Fuld and Company 2013 Pellissier amp Nenzhe-lele 2013 Editors 2004 duToit 2003 McCune 1996 Sawka 1996 Westervelt 1996) and improved overall company performance (Davison 2001 Guimaraes amp Armstrong 1998 Babbar amp Rai 1993) two essential company goals that can be brought about with effective application of competitive intelligence More specific benefits of CI include uncovering business opportunities and problems that will enable proactive strategies (Ellis 1993 Westervelt 1996) providing the basis for continu-ous improvement (Babbar amp Rai 1993) shedding light on competitor strategies (Harkleroad 1993 Westervelt 1996) improving speed to markets and supporting rapid globalization (Baatz 1994 Ettorre 1995) improving the likelihood of company survival (Westervelt 1996) in-creasing business volume (Darling 1996) providing bet-ter customer assessment (Darling 1996) and aiding in the understanding of external influences (Sawka 1996) Benefits such as these provide the basis for firms to better understand the potential impact of the proposed changes and the means by which they can be infused into the com-panyrsquos fabric Based on the above discussion we propose the following hypothesis
H1 Company CI effectiveness is inversely related to problems encountered in product innovation
Independent Variable Strategic Leadership
There is a substantial body of knowledge proposing the im-portance of effective leadership as an ingredient to success-
ful organization change (Guimaraes 2011 Waldman et al 2001) There are many types of leadership (ie formalinformal based on specific skills social status etc) arising from the circumstances in which leadersfollowers find themselves However for the purposes of this study the relevant construct is company strategic leadership Pawar amp Eastman (1997) proposed transactional strategic lead-ership as the one to be operational within an existing or-ganizational system or culture instead of trying to change it It attempts to satisfy the current needs of followers by focusing on exchanges and contingent reward behavior It pays close attention to exceptions or irregularities and takes action to make corrections (Bass 1985 Burns 1978) Conceptually similar to the cultural maintenance form of leadership described by Trice amp Beyer (1993) transactional leadership acts to strengthen existing organization process-es structures strategies and culture
The second form of strategic leadership is transforma-tional or ldquocharismaticrdquo leadership (Pawar amp Eastman 1997) According to Waldman et al (2001) the leader articulates ldquoa vision and sense of mission showing de-termination and communicating high performance ex-pectationsrdquo (p135) The followers reply with confidence in the leader and strong admiration or respect Also they identify with the leaderrsquos vision and with the organiza-tion itself creating a high level of collective cohesion This cohesion and the leaderrsquos expressions of confidence in the followersrsquo ability to attain the vision produce in turn a heightened sense of self-efficacy (Podsakoff et al 1990) Further charismatic leaders are likely to show persistence and enthusiasm in pursuing goals and be demanding of others through the communication of high performance expectations (Kanter 1983 Trice amp Beyer 1993) There is evidence that charismatic leadership at the top executive level is important for company performance (Day amp Lord 1988 Hambrick amp Finkelstein 1987 Yukl 1998) Katz amp Kahn (1978) argued that while charismatic leadership may be more relevant to situations where organization change is important both transactional and transforma-tional (charismatic) leadership are potentially important at the strategic level that it is particularly important as a means of mobilizing an organization to meet the demands of its environment Bass (1985) viewed transactional and charismatic leadership as being somewhat complementary in that both could be displayed by the same individual leader Similarly Trice amp Beyer (1993) acknowledged that both maintenance- and innovation-oriented leader-ship could be shown by a given leader over time Based on the above discussion both types of strategic leadership are tested and we propose
H2 Strategic transactional leadership is inversely re-lated to problems encountered in product innova-tion and
H3 Strategic charismatic leadership is inversely re-lated to problems encountered in product innova-tion
Independent Variable Management of Technology (MOT) To Support Business Change
As business competitiveness increases many business or-ganizations have used technology for redesigning business processes provide new products and services and improve the organization work environment Many authors have proposed the importance of a wide variety of technologies to support business innovation (Li-Hua amp Khalil 2006 Khalil amp Ezzat 2005) Computer Telephony Integration has been touted as a powerful tool to improve the rela-tionship with customers (McCarthy 1996) The effects of computer technology on organization design intelligence and decision making have long been of interest to research-ers (Huber 1990) The use of computers for data mining and warehousing is seen as essential for decision support (Anonymous 1995) Friedenberg amp Rice (1994) and Gui-maraes et al (1997) have proposed Expert Systems as viable implementation vehicles for business change because they are effective in capturing and distributing knowledge and knowledge processing capability across an organization The list of technologies available to support the necessary business changes is endless For business changes requiring technology without effective MOT the change implemen-tation processes would be severely hindered and in many cases rendered impossible Based on the above discussion the following is proposed
H4 MOT effectiveness is inversely related to problems encountered in product innovation
Independent Variable Important Characteristics of the Change Process
For improving the success rate of changes in organizations the literature (Guimaraes amp Armstrong 1998 Guimaraes 2011) proposes several pre-requisites for the process used for implementing change i e conformity to company objectives employee and department participation in the change process customer input reasonably balancing risk taking with cost benefit analysis monitoring progress and communication regarding the change process In other words how change is implemented is an important deter-minant of success Specifically as proposed by Guimaraes amp Armstrong (1998) the important characteristics of the change process enumerated above are expected to influence the companyrsquos ability to change its products Thus we have H5 The extent to which the change process bears the de-sirable characteristics will be inversely related to problems encountered in product innovation
STUDY METHODOLOGY
This section provides an overview of the field-test procedure used and a brief description of the sample supporting this study A description of how the variables were measured the data analysis procedures and the discussion of the study results are presented later
The Data Collection Process
This field test used a questionnaire to collect the relevant data from a convenience sample of 47 product development managers from 32 organizations with global business operations headquartered in the United States The questionnaire was developed based on a survey of the literature and it was tested for readability and content relevancy and completeness in relation to the study objectives This testing was conducted through several meetings and phone conversations with four managers presently directly involved in new product development The questionnaire had a cover letter describing the purpose of the study and providing instructions for the respondents nevertheless the data was collected mostly through personal interviews with the respondents Many of the participants are known personally to the researchers from seminars in product and business process innovation and some are known to have considerable knowledge and experience about their respective companyrsquos policies processes and activities in product innovation
Sample Description
The companies represented in the sample range widely in terms of their industry sector and size Forty two percent of the firms identified their primary business as manu-facturing with the remaining companies distributed fairly evenly across the sectors of communications (11) health care (6) retail (8) banking and finance (11) and other (22) In terms of gross revenues twenty nine percent of the firms were two hundred million dollars in annual sales or less forty six percent were between two hundred million and 800 million dollars and the remain-ing twenty five percent were above 800 million dollars Twenty six percent of the respondent identified that their number of employees were 500 or less thirty nine percent of the companies employed between 500 and 1000 peo-ple and the remaining companies (35) had more than 1000 employees
Construct Measurement
The measuring scale and components for each major vari-able in this study are presented next As discussed earlier the major constructs and their subcomponents have been
Tor Guimaraes Marcelo Seido Nagano amp Curtis Armstrong Testing Major Factors for Reducing Obstacles to Product Innovation Success
16 International Journal of the Academic Business World 17Fall 2015 (Volume 9 Issue 2)
collected from the existing literature have been validated and used by prior studies and provided the theoretical framework for the model empirically tested here
Obstacles Encountered in Product Innovation were collected from the literature as referenced in Table 1 Respondents were asked to ldquoPlease rate the difficulty of the following product innovation problems your company actually encountered over the last three years in comparison with the closest competing organizations you are aware ofrdquo The list of 11 items to be rated includes
1 Dealing with uncertainty and risk 2 Lack of market information 3 Lack of information about technology 4 Lack of information about consumers 5 Difficulty to generate truly new ideas 6 Difficulty to evaluate and select best ideas 7 Difficulty to connect the portfolio of projects to
strategic objectives 8 Difficult to turn selected good ideas into innova-
tive products 9 Difficult to measure results and performance in
innovation 10 Lack of qualified staff and 11 Difficulty orchestratingco-ordinating the vari-
ous areas for innovation This was done using a seven-point Likert-type scale ranging from 1 to 7
1 extremely lower than average 2 much lower 3 somewhat lower 4 average 5 somewhat higher than average 6 much higher and 7 extremely higher
The ratings for these items were averaged to produce a single measure for ldquoproblemsobstacles encounteredrdquo
Strategic Leadership represents the ability of the top management team to provide leadership when the orga-nizational environment requires change Environments perceived as highly uncertain (requiring major changes) tend to be perceived as risky where wrong decisions could be costly Such environments probably generate a high de-gree of stress Charismatic leadership would tend to reduce
stress and generate confidence and perhaps show how un-certainty can be turned into a vision of opportunity and success (Bass 1985) While charismatic leadership may be more relevant to situations where organization change is of major importance both transactional and transformation-al (charismatic) leadership are potentially important at the strategic level Further Bass (1985) viewed transactional and charismatic leadership as being somewhat complemen-tary in that both could be displayed by the same individual leader The same items proposed by Waldman et al (2001) were used to measure the two types of strategic leadership It was assessed by asking the respondents to rate the extent to which their top managers in general exhibit the particu-lar behavior when compared to managers of main compet-ing organizations
Transactional leadership
1 Takes actions if mistakes are made 2 Points out what people will receive if they do
what needs to be done 3 Reinforces the link between achieving goals and
obtaining rewards 4 Focuses attention on irregularities exceptions or
deviations from what is expected 5 Rewards good work
Charismatic leadership
1 Shows determination when accomplishing goals 2 I have complete confidence in them 3 Makes people feel good to be around them 4 Communicates high performance expectations 5 Generates respect 6 Transmits a sense of mission7 Provides a vision of what lies ahead
Characteristics of the Change Process is defined as the degree to which companies promote ldquodesiredrdquo change process activities It was assessed by asking the respondents to rate the importance or focus that the company places on ten areas of change process characteristics These consisted of all significant changes must conform to company objectives all affected departments participate in the change process individual employee input is considered important customers input is considered important business partners input is considered important ability to balance risk taking with costbenefit clearly defined measures to monitor progress change objectives and progress are clearly communicated responding quickly to required change and responding effectively to required change The same seven-point Likert-type scale was used
and the overall rating of characteristics of the change process for each firm was determined as the average of the ten areas
MOT Effectiveness in Supporting Business Change is the extent to which the companyrsquos needs for technology while implementing business change have been met It was measured by asking the respondents to rate this for the overall company and in four specific areas technology leadership in the industry knowledge of how to get the best technology effectiveness with which technology has been used over the years and effectiveness in using technology in comparison with main competitors The respondents were asked to use the same seven point scale described above The measure for MOT effectiveness in supporting business activities is the average of the ratings for these four items
Construct Validity
Several precautions were taken to ensure the validity of the measures used Many of the recommendations by Carmines amp Zeller (1979) were followed To ensure content validity a thorough survey of the relevant literature was undertaken to understand the important aspects of each major variable and its components and not neglect important dimensions of any variable To further reduce the possibility of any non-random error the main source of invalidity (Carmines amp Zeller 1979 p 15) a group of practitioners from different companies with extensive experience in managing PI reviewed the questionnaire for validity (measuring the phenomena intended) completeness (including all relevant items) and readability (making it unlikely that subjects will misinterpret a particular question) Some questions were reworded to improve readability otherwise the items composing each major variable remained as derived from the literature
As proposed by Carmines amp Zeller (1979) ldquoconstruct validation focuses on the extent to which a measure performs in accordance with theoretical expectationsrdquo (p27) To ensure construct validity the theoretical
relationships between the constructs should have been previously established and these relationships hopefully have been empirically supported by different studies over time As discussed earlier the theoretical underpinnings of this study are relatively well established with most of the items in each construct having been addressed before by several authors Second order factor analyses on the two types of strategic leadership (transactional and charismatic leadership) have been performed by prior studies (Guimaraes 2008 Guimaraes 2011) using larger sample sizes and the results indicated that they can be combined into a single factor as done in this study
Data Analysis Procedures
The relatively small sample size (n = 47) requires the use of simple but robust statistical analysis Pearsonrsquos correla-tion coefficients were used to statistically test the possible relationship between the main constructs T-tests and Chi-square statistics for cross-tabulations were used to test the hypotheses Responses from each manager regarding the main constructs were classified into two groups above and below the mean to produce the cross-tabulation tables
RESULTS
Table 2 lists the Pearsonrsquos correlation coefficients and the means and standard deviations for the six major research variables On the average the companies in the sample are thought to be performing slightly above average in the areas of competitive intelligence both components of strategic leadership management of technology and specific characteristics of the companyrsquos change process On the other hand on average the companies in the sample tend to be ldquosomewhat highrdquo in terms of encountering the obstacles to product innovation identified in this study It is also notable that the relatively large standard deviations (mostly above 10) indicate significant differences in performance from company to company One possible explanation for the ldquosomewhat highrdquo average regarding the identification
Table 2 Correlations Between Major Variables
Major Variables Mean StdDev 1 2 3 4 5
1 PI Problems Encountered 47 0832 Competitive Intelligence 42 112 -233 Transactional Leadership 45 098 -20 NS4 Charismatic Leadership 41 122 -35 36 NS5 Management of Technology 44 107 -26 NS 18 136 Change Process Features 43 098 -33 27 14 23 15
Tor Guimaraes Marcelo Seido Nagano amp Curtis Armstrong Testing Major Factors for Reducing Obstacles to Product Innovation Success
18 International Journal of the Academic Business World 19Fall 2015 (Volume 9 Issue 2)
of obstacles to product innovation may be that the industry seminars attended by the product managers may have raised their own performance expectations and problem awareness
Hypothesis H1 proposes that a companyrsquos performance in Competitive Intelligence (CI) is inversely related to prob-lems encountered in product innovation Table 3 shows the results of the cross-tabulations for these two major vari-ables
In Table 3 the number of observations falling in each table cell corroborates that companies performing above average in the performance of CI tend to be below average in terms of encountering problems during product innovation The same inverse relationship tends to hold for companies performing below average in CI thus encountering more difficulty in product innovation About half as many (8 versus 15) organizations report encountering above average product innovation problems when they are performing above average in CI However this also shows that higher than average overall performing in CI is apparently no guarantee that a company will also not encounter above average problems in product innovation On the other
hand below average performance in CI shows a threefold (6 versus 18) increase in higher than average encounters with product innovation problems
As shown in Table 4 t-tests were used to further test the significance of this relationship between the company
performance in CI and product innovation problems encountered Respondents in the two groups above and below the average performance in CI are compared in aggregate and along each of the product innovation problems identified in the literature The results clearly demonstrate that compared to below average firms companies with above average performance in CI have encountered product innovation problems at a significantly lower level on many of the product innovation problems identified Based on the above results we find strong support for hypothesis one
Results from Hypothesis Two Testing
Hypothesis two proposes that performance in overall company Strategic Transactional Leadership is inversely related to problems encountered in product innovation This was tested in a similar manner as for hypothesis one respondents were placed in two groups based on their above or below average ratings in Strategic Leadership Table 5 shows the results of the cross-tabulations between the two major constructs Sixteen of the 24 companies that were below average Transactional Leadership performance are above average in terms of encountering product innovation problems On the other hand some companies (13) with a below average Transactional Leadership performance somehow were able to avoid having above average encoun-
ters with product innovation problems Further above av-erage Transaction Leadership in 6 organizations has not precluded them from encountering above average product innovation problems
As shown in Table 6 t-tests were used to further test the significance of the relationship between a companyrsquos higher or lower than average Transactional Leadership and specific product innovation problems encountered The two groups are compared in aggregate and along each of the product innovation problems identified in the lit-
Table 4 T-Tests for Performance in Competitive Intelligence and
Each Product Innovation Problem Encountered
Aggregated Variable and Individual Items
Competitive Intelligence
Below Average Performance
Competitive Intelligence
Above Average Performance
p-Value
Problems encountered in product innovation 47 41 003Difficult to deal with uncertainty and risk 51 45 002Lack of market information 53 35 000Lack of information about technology 47 36 001Lack of information about the consumer 52 37 001Difficult to generate truly new ideas 45 43 Not Significant
Difficult to evaluate and select the best ideas 46 48 Not Significant
Difficulty to connect the portfolio of projects to strategic objectives
49 43 Not Significant
Difficult to turn selected good ideas into innovative prod-ucts
43 44 Not Significant
Difficult to measure results and performance in innova-tion
48 40 001
Lack of qualified staff 45 39 002Difficult to orchestrate and co-ordinate the various areas for innovation
40 38 Not Significant
means plt05 means plt 01
Table 5 Cross-Tabulations of
Transactional Leadership and Product Innovation Problems
(Hypothesis 2)Product Innovation
Problems EncounteredBelow
AverageAbove
Average
Transactional Leadership
Below Average 8 16
Above Average 13 6
Chi-square = 52 (p = 002)
Table 6 T-Tests for Transactional Leadership and
Each Product Innovation Problem Encountered
Aggregated Variable and Individual Items
Transactional Leadership
Below Average Performance
Transactional Leadership
Above Average Performance
p-Value
Problems encountered in product innovation 47 42 004Difficult to deal with uncertainty and risk 53 44 001Lack of market information 44 42 Not SignificantLack of information about technology 47 43 Not SignificantLack of information about the consumer 43 39 Not SignificantDifficult to generate truly new ideas 45 42 Not Significant Difficult to evaluate and select the best ideas 46 44 Not Significant Difficulty to connect the portfolio of projects to strategic objec-tives
50 41 001
Difficult to turn selected good ideas into innovative products 51 44 001Difficult to measure results and performance in innovation 49 42 001Lack of qualified staff 46 43 Not SignificantDifficult to orchestrate and co-ordinate the various areas for in-novation
47 35 001
Table 3 Cross-Tabulation of Performance in
Competitive Intelligence and PI Problems (Hypothesis 1)
Product Innovation Problems Encountered
Below Average
Above Average
Performance in Competitive
Intelligence
Below Average 6 18
Above Average 15 8
Chi-square = 768 (p = 000)
Tor Guimaraes Marcelo Seido Nagano amp Curtis Armstrong Testing Major Factors for Reducing Obstacles to Product Innovation Success
20 International Journal of the Academic Business World 21Fall 2015 (Volume 9 Issue 2)
erature The results clearly demonstrate that compared to below average firms companies with higher than aver-age Transactional Leadership have encountered product innovation problems at a significantly lower level along many of the product innovation problems identified The above results corroborates hypothesis two
Results from Hypothesis Three Testing
Hypothesis three proposes that firms having strong char-ismatic leadership is inversely related to encountering problems in product innovation This has been tested in a similar fashion as hypotheses 1 and 2 Table 7 shows the results of the cross-tabulations for belowabove average company resources availability and belowabove average encounters with product innovation problems Similar to the cross-tabulations used for testing the hypotheses addressing the other major constructs the results in this case confirm expectations and should be interpreted ac-cordingly
As shown in Table 8 t-tests were again used to further test the significance of this relationship between Charismatic Leadership and specific product innovation problems en-countered The results clearly demonstrate that compared to below average firms companies with above average Charismatic Leadership have encountered product inno-vation problems at a significantly lower level along many
of the product innovation problems identified While the small sample size has resulted in several non-significant comparisons in no case the comparison contradicted the general hypothesis Based on the above results we also find strong support for hypothesis three
Results from Hypothesis Four Testing
Tested in similar fashion hypothesis four proposes that having effective management of technology is inversely
related to encountering problems in product innovation Table 9 shows the results of the cross-tabulations for be-lowabove average management of technology effective-ness and belowabove average encounters with product in-novation problems Similar to the cross-tabulations used for testing the hypotheses addressing the other major con-structs the results in this case confirm expectations and should be interpreted accordingly
As shown in Table 10 t-tests were again used to further test the significance of this relationship between the company MOT effectiveness and specific product inno-vation problems encountered The results clearly demon-strate that compared to below average firms companies with above average MOT performance have encountered product innovation problems at a significantly lower level along many of the product innovation problems identi-fied Based on the above results we also find strong sup-port for hypothesis four
Results from Hypothesis Five Testing
Hypothesis five proposes that having a product change process with the desirable characteristics is inversely related to encountering problems in product innovation This has been tested the same way Table 11 shows the results
of the cross-tabulations for belowabove average product change process and belowabove average encounters with specific product innovation problems The results in this case confirm expectations and should be interpreted accordingly
As shown in Table 12 t-tests were again used to further test the significance of this relationship between the product change process and specific product innovation problems encountered C to below average firms companies with
Table 8 T-Tests for Charismatic Leadership and
Each Product Innovation Problem Encountered
Aggregated Variable and Individual Items
Charismatic Leadership
p-ValueBelow
AverageAbove
Average
Problems encountered in product innovation 50 39 001
Difficult to deal with uncertainty and risk 52 41 001Lack of market information 49 42 001Lack of information about technology 50 40 002Lack of information about the consumer 47 38 001Difficult to generate truly new ideas 48 38 001Difficult to evaluate and select the best ideas 51 41 001Difficulty to connect the portfolio of projects to strategic objectives 52 38 001Difficult to turn selected good ideas into innovative products 51 43 001Difficult to measure results and performance in innovation 47 37 001Lack of qualified staff 52 36 001Difficult to orchestrate and co-ordinate the various areas for innovation 50 35 001
Table 10 T-Tests for Management of Technology and
Each Product Innovation Problem Encountered
Aggregated Variable and Individual Items
Management of Technology
p-ValueBelow
AverageAbove
Average
Problems encountered in product innovation46 40 003
Difficult to deal with uncertainty and risk 48 34 001Lack of market information 46 35 001Lack of information about technology 52 36 000Lack of information about the consumer 43 41 Not SignificantDifficult to generate truly new ideas 47 40 Not SignificantDifficult to evaluate and select the best ideas 43 42 Not SignificantDifficulty to connect the portfolio of projects to strategic objectives 45 43 Not SignificantDifficult to turn selected good ideas into innovative products 46 41 004Difficult to measure results and performance in innovation 48 42 003Lack of qualified staff 47 44 Not Significant
Difficult to orchestrate and co-ordinate the various areas for innovation 43 41 Not Significant
Table 7 Cross-Tabulations of
Charismatic Leadership and Product Innovation Problems
(Hypothesis 3)Product Innovation
Problems EncounteredBelow
AverageAbove
Average
Charismatic Leadership
Below Average 7 15
Above Average 16 9
Chi-square = 48 (p = 003)
Table 9 Cross-Tabulations of
Management of Technology and Product Innovation Problems
(Hypothesis 4)Product Innovation
Problems EncounteredBelow
AverageAbove
Average
M a n a g e me nt of Technology
Below Average 9 14
Above Average 18 8
Chi-square = 45 (p = 003)
Tor Guimaraes Marcelo Seido Nagano amp Curtis Armstrong Testing Major Factors for Reducing Obstacles to Product Innovation Success
22 International Journal of the Academic Business World 23Fall 2015 (Volume 9 Issue 2)
more relevant within an existing organization environment instead of one attempting to implement changes Katz amp Kahn (1978) argued that charismatic leadership may be more relevant where organization change is important but that both types of strategic leadership are potentially important Our results indicate that indeed for more successful (less problems encountered) product innovation both types of leadership are important
Regarding CI there are also some major implications from this study results To improve their CI programs managers need to consider the collection of market intelligence based on the six areas addressed in this study the traditional industry competitors emerging competitors traditional customer needs and wants non-traditional customer needs and wants relationships with business partners and new product or service development The importance of any one of these areas may be relatively higher or lower and in some cases some of these sources may be irrelevant depending on the companyrsquos specific industry sector line of business products and processes being considered Good performance in these areas whenever applicable to the companyrsquos industry sector and lines of business are likely to reduce problems encountered which in turn is likely to lead to more product innovation
To improve technology management which is found to be useful reducing product innovation problems managers must look at company performance in terms of its technology leadership position in its main industry sectors knowledge of how to get the best technology available effective use of specific technologies and benchmarking the use of specific technologies against the companyrsquos main competitors or best-in-class target organizations An important requirement to accomplish these objectives is the clear definition of the more important technologies necessary to support and enhance the companyrsquos products Another important requirement is management recognition that the implementation of each of the various technologies deemed important to the organization are dependent on specific success factors The success factors for the various technologies have been identified and discussed elsewhere (Guimaraes Igbaria amp Lu 1992 Guimaraes amp Igbaria 1997 Yoon Guimaraes amp Clevenson 1998 Yoon Guimaraes amp Clevenson 1995 Yoon Guimaraes amp OrsquoNeal 1995 Udo amp Guimaraes 1994) and are considered beyond the scope of this paper
Last top managers must ensure that their companysrsquo product change process bear the desirable characteristics studied here all significant changes must conform to company objectives all affected departments participate in the change process individual employee input is considered important customers input is considered important business partners input is considered important managers
above average performance in product change process have encountered product innovation problems at a significantly lower level along many of the product innovation problems identified Based on the above results hypothesis five is corroborated
DISCUSSION MANAGERIAL RECOMMENDATIONS AND
FURTHER RESEARCH
Despite the relatively small sample size the results provide strong evidence regarding the importance of strategic leadership competitive intelligence management of
technology and specific characteristics of the companyrsquos change process to the success of product innovation Given the importance of effectively implementing business innovation in these days of hyper competitiveness it behooves top managers to do whatever they can to improve their companysrsquo performance in the areas of strategic leadership competitive intelligence management of technology and characteristics of the process used to reduce problems encountered with the product innovation process so vital to company performance
In the area of strategic leadership several implications can be derived from this study Charismatic leadership (showing determination while accomplishing goals inspiring confidence making people feel good around you communicating expectations for high performance generating respect transmitting a sense of mission and providing a vision of what lies ahead) is on average and as a whole relatively scarce in industry today and judging by its nature it should be difficult to develop Nevertheless managers must try particularly in high clockspeed industry sectors (Guimaraes et al 2002) requiring continuous innovation Also apparently important for successful product innovation transactional leadership (taking action if mistakes are made pointing out what people will receive if they do what needs to be done reinforcing the link between achieving goals and obtaining rewards focusing attention on deviations from what is expected and rewarding good work) by its nature should be easier to develop Pawar amp Eastman (1997) proposed that transactional leadership is
ability to balance risk taking with costbenefit the existence of clearly defined measures to monitor progress that change objectives and progress are clearly communicated and that the product innovation teams respond quickly and effectively to required change These guidelines must be widely disseminated and enforced by project managers and employees involved in product changes
The primary objective of this research has three interrelated components 1) to identify and assess the variety of problems encountered by companies while performing the vital process of product innovation 2) to identify and assess the major factors proposed in the literature as necessary to increase the likelihood of success in product innovation and 3) to test if these literature proposed success factors for product innovation also show a positive impact by reducing the problems associated with the product innovation process in practice Thus it is safe to assume that the measures for each of the major constructs studied here derived from a large number of separate studies represent an important contribution to future researchers and practicing product innovation managers aiming to improve their company effectiveness in this critical area
During the process of conducting this research informal discussions with several of the product development managers made abundantly clear that over time success in product development can only be achieved by a complex combination of many factors stemming from three major areas humanorganizational technological and market knowledge elements This multidimensional requirement for success as well as an intrinsic presence of risk and the need to find tangible and intangible resources is a huge challenge for product innovation management in general As the results from this study indicated all the major factors addressed here are important but do not by themselves ensure successful product innovation It seems to be rather analogous to a case where basic components must be in combination transformed into improved products which provide greater value to the market place
STUDY LIMITATIONS AND OPPORTUNITIES FOR FURTHER RESEARCH
Based on an extensive survey of the relevant literature this study is a first attempt at empirically testing the im-portance of strategic leadership competitive intelligence management of technology and specific characteristics of the companyrsquos change process for the success of product in-novation The theoretical model proposed here addresses five major determinants of how to reduce obstaclesprob-lems for successful PI based on the existing literature There might be other important factors for reducing the PI prob-lems defined in this study Given the importance of the
Table 12 T-Tests for Change Process Features and
Each Product Innovation Problem Encountered
Aggregated Variable and Individual ItemsChange Process Features
p-ValueBelow Average
Above Average
Problems encountered in product innovation 49 40 001Difficult to deal with uncertainty and risk 51 42 001Lack of market information 49 40 001Lack of information about technology 50 41 001Lack of information about the consumer 48 37 001Difficult to generate truly new ideas 47 40 001Difficult to evaluate and select the best ideas 52 43 001Difficulty to connect the portfolio of projects to strategic objectives 49 38 001Difficult to turn selected good ideas into innovative products 50 43 001Difficult to measure results and performance in innovation 48 39 001Lack of qualified staff 47 37 001Difficult to orchestrate and co-ordinate the various areas for innovation 52 41 001
Table 11 Cross-Tabulations of
Change Process Features and Product Innovation Problems
(Hypothesis 5)Product Innovation
Problems EncounteredBelow
AverageAbove
Average
C h a n g e P r o c e s s Features
Below Average 8 15
Above Average 17 9
Chi-square = 46 (p = 003)
Tor Guimaraes Marcelo Seido Nagano amp Curtis Armstrong Testing Major Factors for Reducing Obstacles to Product Innovation Success
24 International Journal of the Academic Business World 25Fall 2015 (Volume 9 Issue 2)
topic future research should strive to identify and include these potential factors in an expanded theoretical model
Another opportunity for future research stems from the fact that even though the relatively small sample in this study has shown very encouraging statistically significant results larger sample sizes will be much more convincing Therefore we strongly recommend new research projects with larger sample sizes capable of supporting multivariate analyses expanded theoretical models and enable the assessment of more complex relationships among the important constructs addressed in this study Perhaps the use of a path analytic modeling technique would be applicable in this case The results should provide valuable information on the extent to which strategic leadership can positively influence the effective use of technology and CI programs for companies to improve their business competitiveness while ensuring that the change process follow prescribed guidelines suggested in this study
Finally a third area of future research opportunity deals with the integration and expansion of theoretical mod-els relating the many determinants of success in product innovation to include the new construct of ldquoobstacles to product innovationrdquo as a likely moderating variable in these theoretical models Combined these three areas of research opportunity should support a host of research studies important not only to the academic community but also to product innovation managers
REFERENCES
Adams R Bessant J amp Phelps J (2006) Innovation management measurement A review International Journal of Management Reviews 8(1) 21-47
Anonymous (1995) Data mining a new weapon for com-petitive advantage Software Quarterly 2 (4) 15-19
Baatz E B (1994 Sept 15) The quest for corporate smarts CIO 48-58
Babbar S amp Rai A (1993) Competitive intelligence for international business Long Range Planning 263103-113
Bass BM (1985) Leadership and Performance beyond Expectations New York Free Press
Beattie JS amp Fleck J (2005) New perspectives on stra-tegic technology management in small high-tech com-panies Proceedings from IEEE International 2005 Engineering Management Conference
Blindenbach-Driessen F amp Van Den Ende J (2010) In-novation management practices compared the exam-ple of project-based firms Journal of Product Innova-tion Management 6(3) 33-53
Burns J M (1978) Leadership New York Harper amp Row
Calof JL amp Wright S (2008) Guest Editorial Com-petitive intelligence a practitioner academic and inter-disciplinary perspective European Journal of Market-ing 42(78) 717-730
Carmines E amp Zeller R (1979) Reliability and Validity Assessment Beverly Hills CA Sage
Colakoglu T (2011) The problematic of competitive intelligence How to evaluate and develop competi-tive intelligence Procedia ndash Social and Behavioral Sci-ences 24(1) 1615ndash1623 httpdxdoiorg101016jsbspro201109075
Cooper RG (2009) How companies are reinventing their idea-to-launch methodologies Research Technol-ogy Management 52(2) 47-57
Cooper RG and Chew MB (1996) Control tomor-rowrsquos costs through todayrsquos designs Harvard Business Review January-February 88-98
Cooper R amp Edgett S (2008) Ideation for product in-novation what are the best methods PDMA visions magazine 1(1) 12-17 httpwwwstage-gatecomknowledgephp
Cooper R Edgett S amp Kleinschmidt E (2001) Portfo-lio management for new product development results of an industry practices study RampD Management 31(4) 361-380
Darling M S (1996) Building the knowledge organiza-tion Business Quarterly 61(2) 61-66
Davison L (2001) Measuring competitive intelligence effectiveness Insights from the advertising industry Competitive Intelligence Review 12 (4) 25-38
Day DV amp Lord RG (1988) Executive leadership and organizational performance suggestions for a new theory and methodology Journal of Management 14 4593-464
du Toit A (2003) Competitive intelligence in the knowl-edge economy What is in it for South African manu-facturing enterprises International Journal of Infor-mation Management 23 111-120
Editors (2004 MarchApril) Competitive intelligence and records managers The Information Management Journal 4
Ellis J R (1993) Proactive competitive intelligence Us-ing competitive scenarios to exploit new opportunities Competitive Intelligence Review 4(1) 13-24
Ettorre B (1995) Managing competitive intelligence Management Review 84(10) 15-19
Fleisher CS amp Wright S (2009) Examining differences in competitive intelligence practice China Japan and the West Thunderbird International Business Review 51(3) 249ndash261 httpdxdoiorg101002tie20263
Friedenberg R amp Rice A (1994 August 3) Knowledge re-engineering as a BPR strategy Working Notes of the AAAI-94 Workshop on Artificial Intelligence in Business Process Reengineering Seattle WA pp 21-26
Fuld amp Company (2013) Certain industries invest heavi-ly in watching their competition Fuld Insights-Global Benchmarking Project Update March 2013
Galia F amp Legros D (2004) Complementarities be-tween obstacles to innovation evidence from France Research Policy 33 1185ndash1199
Ghoshal S amp Westney D E (1991 Jan) Organizing competitor analysis systems International Journal of the Academic Business World 2(1) pp 35-44
Guimaraes T (2011) Industry Clockspeedrsquos Impact on Business Innovation Success Factors European Journal of Innovation Management 14(3) 322-344
Guimaraes N amp Armstrong C (1998) Exploring the relation between competitive intelligence IS support and business change Competitive Intelligence Review 9(3) 45-54
Guimaraes T Cook D amp Natarajan N (2002) Explor-ing the importance of business clockspeed as a modera-tor for determinants of supplier network performance Decision Sciences 33(4) 629-644
Guimaraes N amp Igbaria M (1997) Clientserver sys-tem success Exploring the human side Decision Sci-ences 28(4) 851-876
Guimaraes N Igbaria M amp Lu M (1992) Determi-nants of DSS success An integrated model Decision Sciences 23(2) 409-430
Guimaraes T Yoon Y amp Clevenson A (1997) Empiri-cally testing ES success factors in business process reen-gineering International Journal of Production Econom-ics 50 245-259
Haataja J (2011) Social media as a source of competitive intelligence in a pharmaceutical corporation Masterrsquos thesis School of Science Aalto University
Haddadi AE Dousset B amp Berrada I (2010) Xplor EveryWhere ndash The Competitive Intelligence Sys-tem for Mobile in IEEE Xplorereg retrieved 25 March
2015 from httpieeexploreieeeorgstampstampjsptp=amparnumber=5945635
Hambrick DC amp Finkelstein S (1987) Managerial Discretion A Bridge between Polar Views of Organi-zational Discretion In LL Cummings amp BM Staw (Eds) Research in Organizational Behavior Green-wich CT JAI Press 9 369-406
Harkleroad D (1993) Sustainable growth rate analysis Evaluating worldwide competitorsrsquo ability to grow profitability Competitive Intelligence Review 4(23) 36-45
Heil O amp Robertson T S (1991 Sep) Toward a theory of competitive market signaling A research agenda Strategic Management Journal 12(6) 403-418
Huber G P (1990 Jan) A theory of the effects of ad-vanced information technologies on organizational design intelligence and decision making Academy of Management Review 15(1) 47-71
Kanter RM (1983) The Change Masters New York Si-mon amp Schuster
Katz D amp Kahn RL (1978) The Social Psychology of Organizations (2nd ed) New York Wiley
Khalil TM amp Ezzat HA (2005) Management of technology and responsive policies in a new economy International Journal of Technology Management 32(12) 88
King M (1997 March 10) Corporations take snooping mainstream Indianapolis Business Journal 17(2) 1-4
Li-Hua R amp Khalil TM (2006) Technology manage-ment in China A global perspective and challenging issues Journal of Technology Management in China 1(1) 9
Maltz E amp Kohli A K (1996 Feb) Market intelligence dissemination across functional boundaries Journal of Marketing Research 33(1) 47-61
Mata RS (2008) Inovaccedilatildeo tecnoloacutegica em multinacio-nais brasileiras estudo multicaso sobre gestatildeo do port-folio de projetos de novos produtos 192p Dissertaccedilatildeo (Mestrado) ndash Faculdade de Economia Administraccedilatildeo e Contabilidade de Ribeiratildeo Preto Universidade de Satildeo Paulo Ribeiratildeo Preto
McCarthy V (1996) CTI lets you coddle customers at lower cost Datamation 42(13) 46-49
McCune J C (1996) Checking out the competition Be-yond Computing 5(2) 24-29
Nemeth C (1997) Managing innovation when less is more California Management Review 40(1) 59-74
Tor Guimaraes Marcelo Seido Nagano amp Curtis Armstrong
26 Fall 2015 (Volume 9 Issue 2)
Nemutanzhela P amp Iyamu T (2011) The impact of competitive intelligence on products and services in-novation in organizations International Journal of Advanced Computer Science and Applications 2(11) 38-44
Parry ME Song M De Weerd-Nederhof PC amp Viss-cher K (2009) The impact of NPD strategy product strategy and NPD processes on perceived cycle time Journal of Product Innovation Management 26 (6) 627-639
Pawar BS amp Eastman KK (1997) The nature and implications of contextual influences on transforma-tional leadership A conceptual examination Academy of Management Review 22 80-109
Pellissier R amp Nenzhelele TE (2013) Towards a univer-sal definition of competitive intelligence SA Journal of Information management 15(2) Art 559 7 pages httpdxdoiorg104102sajimv15i2559 Retrieved 31 March 15
Podsakoff PM MacKenzie SB Moorman RH amp Fetter R (1990) Transformational leader behaviors and their effects on followersrsquo trust in leader satisfac-tion and organizational citizenship behaviors Leader-ship Quarterly 1107-142
Roitner A (2008) Competitive intelligence in Austria An empirical study Masterrsquos dissertation University of Vienna
Sawka K A (1996) Demystifying business intelligence Management Review 85(10) 47-51
Segarra-Blasco A Garcia-Quevedo J amp Teruel-Carrizo-sa M (2008) Barriers to innovation and public policy in Catalonia The International Entrepreneurship and Management Journal 4(4) 431-451
Sharma A (1999) Central dilemmas of managing inno-vation in large firms California Management Review 3941(3) 46-164
Slack N Chambers S Johnston R and Betts A (2006) Operations and Process Management Princi-ples and Practice for Strategic Impact 2nd ed Prentice Hall Harlow
Stringer R (2000) How to manage radical innovation California Management Review 42(4) 70-88
Swartz N (2005) Competitive intelligence underuti-lized Information Management 39(3)
Tarraf P amp Molz R (2006) Competitive Intelligence at Small Enterprises SAM Advanced Management Journal l 71 (4) 24-34
Thamhain HJ (2003) Managing innovative RampD teams RampD Management 33(3) 297-311
Tidd J Bessant J amp Pavitt K (2008) Gestatildeo da inova-ccedilatildeo 3ed Satildeo Paulo Artmed
Trice HM amp Beyer JM (1993) The Cultures of Work Organizations Englewood Cliffs JN Prentice-Hall
Tushman M amp Anderson P (1997) Managing Strategic Innovation and Change Oxford University Press Ox-ford 3-23
Udo G amp Guimaraes N (1994) Empirically assessing factors related to DSS benefits European Journal of In-formation Systems 3(3) 218-227
Vedder RG amp Guynes CS (2002) CIOsrsquo Perspectives on competitive intelligence Information Systems Man-agement 19(4) 49-56
Waldman DA Ramirez GG House RJ amp Puranam P (2001) Does leadership matter CEO leadership at-tributes and profitability under conditions of perceived environmental uncertainty Academy of Management Journal 44(1) 134-143
Weiss A amp Naylor E (2010) Competitive intelli-gence How independent information professionals American Society for Information Science and Tech-nology 37(1) 30ndash34 httpdxdoiorg101002bult20101720370114
Westervelt R (1996) Gaining an edge Competitive in-telligence takes off Chemical Week 158(25) 29-31
Williams SD (2004) Personality attitude and leader influences on divergent thinking and creativity in or-ganizations European Journal of Innovation Manage-ment 7(3) 187-204
Yoon Y Guimaraes T amp Clevenson A (1995) Under-standing the factors important to expert systems suc-cess Technology Management 2(3) 1-14
Yoon Y Guimaraes T amp Clevenson A (1998) Explor-ing ES success factors for BPR Journal of Engineering and Technology Management 15 179-199
Yoon Y Guimaraes T amp OrsquoNeal Q (1995) Exploring the factors associated with expert systems success MIS Quarterly 19(1) 83-106
Yukl GA (1998) Leadership in Organizations (4th ed) Englewood Cliffs NJ Prentice-Hall
International Journal of the Academic Business World 27
INTRODUCTION
Nothing stays the same part of the human condition involves adjusting to change Yet human resistance to change is both intense and natural Perhaps examples of this resistance occur in employeesrsquo personal lives or arise as they approach new ideas or changes at work Through a myriad of changes characterized by global demands unpredictable environments the onset of technologi-cal advances and operational developments managing change and resistance has become a way of life for many organizations (Judge Thoresen Pucik amp Welbourne
1999) Organizations must depend on capable leader-ship to guide them through these unprecedented times The evolution of change requires employees at all levels to embrace new techniques of working by promoting dif-ferent mindsets (Kets de Vries Ramo amp Korotov 2009) Gondo Patterson and Palacios (2013) suggested that some organizations fail to adapt to change and prepare their leadership and employees for a more uncertain fu-ture Yet their study summarized that successful change involves support of formulated strategies and the facilita-tion of change recipients being mindful during change ef-forts In the face of intense global competition it is criti-
Acceptance of Change Exploring the Relationship among
Psychometric Constructs and Employee Resistance
Brian Dunican EdDWestern Kentucky University
1906 College Heights BoulevardBowling Green KY 42101
Ric Keaster PhD Western Kentucky University
1906 College Heights BoulevardBowling Green KY 42101
ABSTRACTChange is inevitable and can influence numerous events inside and outside an organization The contrasting at-titudes of acceptance and resistance to change are an increasingly interesting topic in todayrsquos global ever-changing and competitive environment Discovering the behavioral origins of employeesrsquo reactions to change is an integral part of understanding the way in which individual mindset may play a role in coping with organizational change and resistance This body of knowledge may give organizations insight for creating a competitive advantage over their counterparts
Conceivably it can be argued that some researchers view change as a process of gradual adaptation that is largely in-fluenced by people in organizations who react to internal and external pressures while others view it as an emergent event due to environmental selections (Demers 2007) Through both concepts successful navigation through change events relies on the manner in which humans respond to these occasions
The current study employed a descriptive non-experimental correlational design to examine individualsrsquo self-rating of their level of mindfulness tolerance of ambiguity and resistance to change in four industries located in Kentucky The quantitative study sought to identify the strengths of the relationship of the chosen variables using validated instruments ndash Langerrsquos (Pirson Langer Bodner amp Zilcha-Mano 2012) Langer Mindfulness Scale (LMS14) Bud-nerrsquos (1962) Tolerance of Ambiguity Scale (TOA) and Oregrsquos (2003) Resistance to Change Scale (RTC) Regression models were utilized to evaluate multivariate relationships among the variables Based on the findings in the current study the results indicated that no differences lie between group comparisons of organizational or demographic fac-tors when examining the relationship among the elements of mindfulness tolerance of ambiguity and resistance to change Bivariate correlations yielded both strong positive and negative relationships among the three scales assessed by salary (exempt and non-exempt) employees located across the different industries (p lt 01)
Brian Dunican amp Ric Keaster Acceptance of Change Exploring the Relationship among Psychometric Constructs and Employee Resistance
28 International Journal of the Academic Business World 29Fall 2015 (Volume 9 Issue 2)
cal for organizations to have the dexterity to accept new changes and adapt to survive (Gondo et al 2013 Jacobs 2005) Discovering the behavioral origins of employee re-actions to change is an integral part of understanding the recipe for flexibility longevity and organizational success Researchers have separately alluded to varying degrees of social psychological constructsmdashparticularly elements of mindfulness and tolerance of ambiguitymdashand their influ-ence on individualsrsquo attitudes toward change and resis-tance (Banning 2003 Langer 1993)
BACKGROUND
By its nature change in organizations is inherently stress-ful causing increased anxiety among employees at each level of the organization This environment of uncertain-ty can threaten the balance of control often distracting organizations from obtaining the stability needed to sur-vive and adapt to change Researchers have analyzed sev-eral techniques for strengthening the idea of overcoming uncertainty Carson and Langer (2006) stated ldquoActively thinking about paradoxes increase onersquos ability to toler-ate ambiguity and decreases the anxiety associated with uncertainty In a separate study Weinstein Brown and Ryan (2009) contended that increased mindfulness in individuals promoted greater attention and awareness in situations (organizational change for example) perceived as stressful or threatening
Leaders throughout organizations must possess the skills and cognitive experience to manage varying degrees of uncertainty and balance the levels of tolerance within their organizations (Lane amp Klenke 2004) This notion is reinforced by Topping (2002) in that change implies uncertainty and uncertainty can drive individuals to feel afraid uncomfortable threatened anxious and as a result resistant to change On the contrary acknowl-edging uncertainty can lead to the exploration for clarity and challenges of the status quo (Geller 2002) A rapidly growing amount of literature is available on mindfulness which insinuates how this construct could aid in navigat-ing through areas of uncertainty (Brown amp Ryan 2004 Lane amp Klenke 2004 Langer 1993 Weinstein et al 2009) Brown and Ryanrsquos (2004) multifaceted definition of mindfulness recognized it as ldquoa phenomenon with functional import for outcomes as diverse as physical health psychological well-being work and sports perfor-mance and relationshipsrdquo (p 242)
The process of conforming to change or an innovation may seem difficult for individuals within organizations yet examples exist in which individuals adapt very easily and seem to flourish within this environment Judge et al (1999) explained that organizational change has been predominately conducted at a middle range or macro
level rather than at the micro individual level Changes in organizations are not always clear even for the leaders Through the vagueness of change innovative organiza-tions deliberately take actions to avoid misinterpretations and to improve the process (Limerick Passfield amp Cun-nington 1994) ldquoAs organizational structures become less hierarchical and more fluid and amorphous tolerance for ambiguity and uncertainty is likely to emerge as a quality that differentiates effective from ineffective leadersrdquo ac-cording to Lane and Klenke (as cited in Ehrlich Meindl amp Viellieu 1990 p 69) As organizations are naturally subject to uncertainties the concept of increasing employ-eesrsquo abilities to deal with ambiguous situations may lead to more success or important gains in knowledge about organizations
Resistance to Change
The literature presents an enduring consensus on the premise that it is human nature to resist change and ele-ments related to the process of change (Coch amp French 1948 Conner 1992 Oreg 2003 OrsquoToole 1995 Zander 1950) This notion of natural resistance is supported by Kotter (1995) as he described change as the force of shift-ing conditions within the human communities Contest-ed by Dent and Goldberg (1999) the phrase resistance to change should be reevaluated under a more conventional definition Although the researchers supported the belief that resistance is natural their views have challenged the idea of the way in which individuals resist change Blindly supporting the belief that one can resist change may be counterproductive and may direct the focus of organiza-tions away from the actual issues The idea of contradict-ing this belief opens the possibilities that inefficiencies in the process of change and its impact on individuals should be acknowledged and explored (Mabin Forgeson amp Green 2001) As a whole regardless of the process resistance to change is driven at the individual level and is leveraged by organizations to foster change (Conner 1992 Judson 1991)
Employees of organizations may withdraw from the fear of ideas they do not fully understand or act rebellious to-ward seemingly unclear decisions made by management without proper cause Ideally change within organiza-tions should be straightforward clear and concise prior to implementation More often this is not the case for individuals who implement the groundwork or for those who are being impacted by the change (Judson 1991) Al-ternately studies have demonstrated that some employees with a higher tolerance of ambiguity are more susceptible to change and may even thrive within this environment (Oreg 2003) As a whole organizations have struggled with implementing new ideas changing their culture and
reacting to market demands nevertheless many are will-ing to change to remain competitive
Dent and Goldberg (1999) found that at the individual level resistance to change can arise from those whose jobs are directly impacted and can cause a rippling effect through the organization Fundamentally individuals are creatures of habit and are annoyed by pressures in organi-zations that force employees to choose a different behavior or accept a reward system that may not seem beneficial However they are willing to change their behaviors when their beliefs of the benefits of the change outweigh the benefits in their current environment (Armenakis amp Be-deian 1999) In other words attitude toward the change affects onersquos willingness to consider and even implement the change
ATTITUDES AND CHANGE
Some change efforts within organizations are successful some are not Kotter (1995) monitored approximately 100 companies over a decade to observe the fundamental changes made in fluctuating business environments The research included examples of successes examples of fail-ures and illustrations of companies that remained stag-nant as they suffered through misguided steps Outlined by Kotter (1995) successful changes within companies encompassed eight steps (a) creating a sense of urgency (b) forming a guiding coalition (c) creating a compel-ling vision (d) communicating the vision for buy-in (e) empowering and acting on the vision (f) creating quick wins (g) increasing credibility through small wins and (h) linking success to new approaches In an earlier ap-proach Judson (1991) proposed five steps to enhance the process of change by engaging employeesrsquo active participa-tion through (a) analyzing and planning the change (b) communicating the plan for change (c) gaining buy-in and acceptance (d) changing the status quo to the desired state and (e) institutionalizing the new state of change Through these steps the common link described for suc-cessful changes involved employeesrsquo comprehension of the change and their personal adaptation to the new way of thinking and working
Iverson (1996) supported the concept that organizational change could be easier when employees have higher per-sonal commitments through healthy professional rela-tionships positive employee morale job satisfaction and positive recognition Moreover employees who have a sol-id desire to perform well and are willing to embrace new challenges even in the absence of clarity also understand the importance of change within organizations Further-more Gaumlrtner (2013) reinforced the concept that employ-eesrsquo attitudes and perceived flexibility toward change were influenced through a subset of mindfulness Although it
is not a new term mindfulness supports the concepts at-tributed to attention awareness engagement and being comfortable with new ideas that may impact areas within an individualrsquos control (Langer 1993)
The Problem Defined
With the continuous expansion of globalization and the rising unpredictability of consumer demands economic pressures and technological advancements organiza-tions have been required to change to remain competi-tive Change is inevitable The organizations that master agility and are adaptive to the ever-changing environment will possess the recipe to emerge triumphant over their competitors In reality every organization must change yet the process is not always smooth or effective Hypo-thetically within the organizational structure there are individuals who visualize the change others who develop and organize the change and those who implement and perform the change (Isabella 1990) At times roles of in-dividuals may overlap due to the size of the organization and the responsibilities entailed within each role Directly or indirectly everyone throughout the organization is im-pacted by the change perhaps some individuals are able to cope with change better than others A study of the relat-ed factors of mindfulness and tolerance of ambiguity may lead to insights about individualsrsquo resistance to change
Defining the Problem of Resistance
Resistance to change refers to adverse human forces that impact the processes of change Kotter (1995) empha-sized that organizational resistance is often helped along through the mismanagement of change and by ignoring its impact on the processes Maurer (2009) suggested that resistance will happen often due to failures from previ-ous change implementations Lewin (1947) one of the most influential early researchers of change realized that change was not an event but rather a living process He conceptualized the process of change through a model composed of three steps unfreezing change and refreez-ing His initial step introduces the idea of resistance in-dividuals must give up something before accepting some-thing new Though simple his ideas have been expanded upon by numerous researchers and have been developed into various theories of change Zander a close colleague of Lewin defined resistance to change as ldquobehavior which is intended to protect an individual from the effects of real or imagined changerdquo (as cited by Dent amp Goldberg 1999 p 34)
Mabin et al (2001) found that seemingly rebellious em-ployees manifest their fears of change due to uncertainty In addition perceived resistance may be disguised through
Brian Dunican amp Ric Keaster Acceptance of Change Exploring the Relationship among Psychometric Constructs and Employee Resistance
30 International Journal of the Academic Business World 31Fall 2015 (Volume 9 Issue 2)
the camouflage of untimely surprises past resentment ad-ditional job duties or the exposure of personal vulnera-bilities In isolated cases changes within the organization may cause a true threat to safety quality cost or the com-panyrsquos reputation Ignoring the symptoms of resistance within the change process could have disastrous results Judson (1991) agreed that resistance to change is not the fundamental problem but a symptom hiding basic under-lying circumstances He also developed a continuum of reactions to change ranging from indifference (no resis-tance) to active even aggressive resistance
Research has validated the importance of evaluating the reactions and the attitudes of individuals toward organi-zational change and their desire to succeed (Judge et al 1999 Oreg 2006) Developed and validated by Oreg (2003) the Resistance to Change scale has been widely used and accepted by academic works to measure an indi-vidualrsquos disposition toward resistance to change Further-more Oreg outlined four subscales as an exploratory anal-ysis to categorize an individualrsquos reaction to resist change (a) routine seeking (b) emotional reaction to impose change (c) cognitive rigidity and (d) short-term focus Supportive research (cited in Oreg 2003) has found the factors of openness to change tolerance of ambiguity and risk aversion as predictors for managers coping with the stress of change within their organizations An exhaustive amount of research has been conducted on the broad topic of resistance to change yet little is known on the relation-ship of how the psychological constructs of mindfulness and tolerance of ambiguity influence resistance to change within organizations Early researchers such as Coch and French (1948) viewed resistance to change as an obstacle of contention during the process of changes within organiza-tions One of their studies conducted in a sewing factory revealed that employees retaliated against change through acts of aggression controlling restrictions of throughput high turnover rates increased complaints and reports of dissatisfaction with management In line with earlier studies the use of the term resistance to change gained popularity beginning in the 1950s following Lewinrsquos (1947 1951) works related to field theory and social sci-ences Resistance to change is commonly accredited to the unfreezing stage of Lewinrsquos (1951) change model (Ar-menakis amp Bedeian 1999) Naturally portrayed as a nega-tive barrier to change resistance to change is frequently defined using Lewinrsquos physical science-related terminol-ogy as a restraining force to maintain the current state of equilibrium (Dent amp Goldberg 1999) Since that time resistance to change has been widely acknowledged and associated with the process of change organizational de-velopment and change theories and models Other schol-ars have conceptualized resistance to change as an emo-tional reaction rather than a behavioral response As an
example Argyris and Schon (1978) suggested resistance in terms of defensive routines and frustration during the process of change Kanter (1985) supported this notion describing feelings of uncertainty and loss of control for individuals facing change In other terms of defining re-sistance Lawrence (1954) used an analogy to compare re-sistance to change as pain within the human body that is used as a signal to communicate that something is wrong ldquoThe resistance like the pain does not tell what is wrong but only that something is wrong And it makes no more sense to try to overcome such resistance than it does to take a pain killer without diagnosing the bodily ailmentrdquo (p 56) This analogy highlighted the parallels between re-sistance and overcoming it through a practicable solution
Mindfulness
Mindfulness is a concept in educational psychology that has been primarily defined by Dr Ellen Langer a so-cial psychology professor at Harvard University Langer (1993) defined mindfulness as ldquoan open creative proba-bilistic state of mind in which the individual might be led to finding differences among things thought similar and similarities among things thought differentrdquo (p 44) Langer (1997) further explained three characteristics of mindfulness ldquo(a) continuous creation of new categories (b) openness to new information and (c) having an im-plicit awareness of more than one perspectiverdquo (p 4) The Mindfulness Scale validated by Pirson et al (2012) oper-ationalizes the construct and identifies the four subscales of novelty-seeking engagement novelty-producing and flexibility to explain the broad psychometric construct Brown and Ryan (2003) defined mindfulness as ldquoa quali-ty of consciousness that is characterized by clarity and viv-idness of current experience and thus stands in contrast to the mindlessrdquo (p 823) Different from Langerrsquos definition that evaluates dispositional differences in reflective con-sciousness behavioral routines over time Ryan and Brown focused on the presence or absence of attention to and the awareness of events occurring in the present moment For the purpose of the current study the ideas of mindfulness were presented through the literature of Langer Further-more mindfulness is believed to play an important role in disengaging individuals from automatic thoughts habits and unhealthy behavior patterns and may contribute to well-being and happiness in a direct way (Brown amp Ryan 2003)
Tolerance of Ambiguity
Tolerance of ambiguity describes an individualrsquos behavior in unclear or insecure situations and how one reacts to the lack of clarity or uncertainty (Banning 2003) Devel-oped by Frenkel-Brunswik (1948) tolerance of ambigu-
ity has gained attention from researchers over the past 60 years Frenkel-Brunswik was one of the first to present a comprehensive analysis of ambiguity and was influenced by earlier works of Germany psychologist Erich Jaensch Frenkel-Brunswik described tolerance of ambiguity as an ldquoemotional and perceptual personality variablerdquo (cited in Furnham amp Ribchester 1995 p 180)
Budner (1962) later defined tolerance for ambiguity as ldquothe tendency to perceive ambiguous situations as desir-ablerdquo and intolerance for ambiguity as ldquothe tendency to perceive ambiguous situations as sources of threatrdquo (p 29) Budner developed the Tolerance of Ambiguity Scale to further interpret the complex concept of ambiguity and individualsrsquo responses to it Through the development of the Tolerance of Ambiguity Scale three subscales (ie novelty complexity insolubility) emerged to provide in-sight into the more abstract larger construct A decade later Norton (1975) defined tolerance of ambiguity as the degree to which an individual is cognitively willing to tolerate uncertainty vagueness or nebulous information and is able to act upon the knowledge
Employees resist change at all levels of the organization Although some individuals openly accept change many do not Determining the varying degrees of each psycho-metric construct on resistance along with their combi-nation toward resistance to change may reveal common areas of opportunity related to organizational change The following general research question is offered How are the psychometric constructs of mindfulness and toler-ance for ambiguity related to resistance to change within organizations
Empirical Studies and Questions
Numerous studies have alluded to resistance to change some have focused on the individuals (eg Bovey amp Hede 2001 Coghlan 1993 Ford Ford amp McNamara 2002) while others have explored organizations (eg Arm-bruster Bikfalvi Kinkel amp Lay 2008 Coch amp French 1948 Greenwood amp Hinings 1996 Lawrence 1954 Stanley Meyer amp Topolnytsky 2005) Van Dam Oreg and Schyns (2008) stated ldquoA review of the past empirical research reveals that resistance to change has been concep-tualized in three ways as a cognitive state as an emotion as a behavioral intentionrdquo (p 316) As an emotion some studies have revealed that employees who display nega-tive perceptions toward organizational change may have an overall negative outlook on change thus perpetuat-ing resistance (Armenakis Harris amp Mossholder 1993 Stanley et al 2005) Extreme measures of resistance to organizational change have been displayed in other stud-ies through sabotage slowdowns and strikes (Armenakis et al 1993) Universally resistance to change has been
recognized to have a significant impact on the outcomes of organizational change yet individuals within the or-ganization are perceived to be the major blockage or im-pediment (Mabin et al 2001) Based on the literature concerning the analysis of change empirical studies have identified a wide range of factorsmdashnamely organization-al managerial behavioral and individualmdashthat promote or impede resistance in organizations
Organizations are faced with the challenges of changing and responding to current and future trends at an un-precedented rate in todayrsquos global environment (Burke 2014) Twenty-five years ago Offermann and Gowing (1990) found that American organizations alone had spent over a record 210 billion dollars to prepare leaders to thrive in organizational change In addition to money an immeasurable amount of time and energy have been dedicated to nurturing leadership and key individuals to navigate others through this complex but important pro-cess Nonetheless the blueprint is far from perfect The readiness of individuals within the organization to plan and implement proactive measures may determine the or-ganizationrsquos competitiveness The current study examines the factors of mindfulness and tolerance of ambiguity and how they relate to individualsrsquo perceptions of resistance to change The specific research questions are the following
1 How do demographic factors of the respondents and the organizational factors under which they work relate to the psychometric scales of Mind-fulness and Tolerance of Ambiguity and their influence on Resistance to Change
2 After controlling for demographic factors how does psychometric mindset (Sub-constructs of Mindfulness and Tolerance of Ambiguity) influence individual Resistance to Change (a) Routine seeking (b) Emotional reaction (c) Short-term focus (d) Cognitive rigidity
3 What is the degree of relationship among these measures of Mindfulness and Tolerance of Am-biguity
4 The following model characterizes the current study
Highlights of the Methodology
When considering the measurement of the perceptions of resistance to change within organizations various meth-ods have been utilized to illustrate relationships among different constructs (Oreg 2003 Oreg Vakola amp Ar-menakis 2011) In the current quantitative non-exper-
Brian Dunican amp Ric Keaster Acceptance of Change Exploring the Relationship among Psychometric Constructs and Employee Resistance
32 International Journal of the Academic Business World 33Fall 2015 (Volume 9 Issue 2)
imental study data were collected from three validated instruments ndash Langerrsquos (Bodner amp Langer 2001) Langer Mindfulness Scale (LMS) Budnerrsquos (1962) Tolerance of Ambiguity Scale (TOA) and Oregrsquos (2003) Resistance to Change (RTC) scale Regression models were used to assess the univariate relationships among the constructs Additionally descriptive statistics were used to include the mean median mode standard deviation and other selected variables A multiple linear regression analysis determined the relationship between factors of mindful-ness and tolerance of ambiguity and their influence of resistance to change Bivariate correlations were used to compute the psychometric scores from each instrument and resistance to change ratings to test the significance of the relationships between each subscale Overall statisti-cal analyses were conducted in multiple phases to investi-
gate the relationship between the individual psychomet-ric traits and resistance for salary exempt and non-exempt employees in industrial sites located in Kentucky
Participants in the Study
The population represented a microcosm of several indus-tries in the manufacturing sector within the proximity of Warren County The data collected were based on a con-venient sample A total of 65 participants volunteered to complete an electronic survey that was designed to capture complete responses to a total of 48 questions Participants were not allowed to proceed to the next page of the survey unless all questions on the current page were completed Three participants did not complete the survey and their responses were not included in the end results From the
population of 183 salaried (exempt and nonexempt) em-ployees 65 surveys were officially returned constituting a response rate of 36 Managerial-type jobs dominated 36 of the sample population followed by roles in tech-nical support which reflected 169 Six categories of job types and an ldquoOtherrdquo category were used for the respon-dents
Scoring Method for Each Scale
Resistance to Change Scale
Oregrsquos (2003) Resistance to Change Scale is comprised of 17 items with four subscales ndash routine seeking emo-tional reaction short-term focus and cognitive rigidity Each subscale relates to the extent to which individuals seek routines react to emotions during change encom-pass short-term focus during change and the frequency to which individuals change their minds The overall range of the scale including the subscales is scored between 1 and 6 with 1 representing the least level of resistance In-dividuals scoring higher on the overall scale or subscales indicate a higher resistance to change
Langer Mindfulness Scale
The Langer Mindfulness Scale (Pirson et al 2012) con-tains 14 items and is composed of three subscales ndash novelty seeking engagement and novelty producing The 7-point scale is scored such that higher scores indicate a greater level of awareness toward thinking High scores for novel-ty producing insinuate one would perceive new situations as opportunities to learn new information Individuals with high scores for engagement are more susceptible to noticing details within their environment as opposed to others Higher novelty producing scores indicate that individuals are likely more creative and predisposed to generating new ideas when faced with new information
Tolerance of Ambiguity Scale
Budnerrsquos (1962) Tolerance of Ambiguity Scale is a 16-item scale with ratings ranging from 1 to 7 1 represents strong disagreement indicating a greater tolerance for ambiguity It is important to note that higher scores relate to greater intolerances for ambiguity All results were re-ported at the aggregate level
RESULTS
Statistical data analyses were performed on survey data comprised of the following three instruments Langer Mindfulness Scale (LMS14) Tolerance of Ambigu-
ity Scale (TOA) and Resistance to Change (RTC) scale Findings were reported from the analyses of data col-lected from 65 participants responding to the Qualtrics Web-based survey In particular analyses were conducted through bi-variant correlation analyses (also known as Pearsonrsquos r) independent t-tests and Cronbachrsquos alpha The strengths of the relationships were predicated on Co-henrsquos (1988) interpretation Coefficient values between 10 and 29 were considered small or weak those between 30 and 49 were considered moderate and those between 50 and 10 were considered large or strong
Analysis of Each Research Question
The first research question explored the relationship of de-mographic and organizational factors to the psychomet-ric scales of Mindfulness and Tolerance of Ambiguity and their influence on Resistance to Change Descriptive sta-tistics reflected both demographic and organizational fac-tors ndash gender education years at the company and direct reportsmdashfor the 65 employees who participated in the current study The distributions of variables were distrib-uted evenly between only two variables years at the com-pany and direct reports Other demographic variables including ethnicity and age were recorded A statistical analysis was not conducted due to the uneven distribution of the variables Of the 65 participants 59 were Caucasian and the remaining 6 were minorities The ages of the par-ticipants ranged from 28 years to 65 years Additionally frequency distributions and data analyses were not con-ducted for individual sites to protect anonymity All re-sults were reported at the aggregate level and included the following categories for the participating industries Cup Manufacturing Personal Care Manufacturing Con-struction and Rubber to Metal Bonding Manufacturing
Gender Male and Female
Although more than twice as many males than females participated in the current study independent t-tests were conducted to determine whether differences existed be-tween the mean scores of the scales and subscales for male and female employees No statistically significant differ-ences were found between the outcome of the psychomet-ric constructs (Mindfulness and Tolerance of Ambiguity) and Resistance to Change except on one subscale Cogni-tive rigidity revealed a statistical difference between the scores of males (n = 45 M = 381 SD = 063) and females (n = 20 M = 336 SD = 086) t (63) = 234 p = 05 α = 05
Figure 1 Logic model for hypothesized relationships among
Psychometric Constructs Demographic Controls and Degree of Resistance to Change
INDEPENDENT VARIABLES
Degree of Resistance
Demographic Factors
-----
Age Gender
Ethnicity Education
____________
Organizational Factors
----- Years at Current Company Type of Current Position
Type of Industry or Category Number of Direct Reports
Resistance to Change -----
Routine Seeking Emotional Reaction Short-term Focus
Cognitive Rigidity
Tolerance of Ambiguity
----- Novelty
Complexity Insolubility
Mindfulness -----
Novelty Seeking Engagement
Novelty Producing
Brian Dunican amp Ric Keaster Acceptance of Change Exploring the Relationship among Psychometric Constructs and Employee Resistance
34 International Journal of the Academic Business World 35Fall 2015 (Volume 9 Issue 2)
Education
Due to the imbalanced distributions of participants sta-tistical analysis for Education was not performed The frequency distribution reflected that 5231 (34) of the participants possessed a four-year degree 1231 (8) ob-tained a masterrsquos degree or higher 2615 (17) possessed a two-year degree or some college while the reaming 923 (6) were high school graduates
Direct Reports and No Direct Reports
An individual variances t-test was conducted and failed to reveal a statistically reliable difference between the mean scores of salaried employees without direct reports and salaried employees with direct reports As an example scores from routine seeking a subscale of resistance to change were not significantly different between employ-ees without direct reports (n = 32 M = 312 SD = 096) and employees with direct reports (n = 33 M = 291 SD = 085) t (65) = 093 p = 037
Years at the Company
A one-way analysis of variance (ANOVA) was calculated on participantsrsquo ratings of the psychometric constructs and resistance to change as a comparison to the number of years at the company Comparisons indicated no sta-tistically significant differences were presented between groups of 0 to 4 years 5 to 10 years 11 to 20 years and 21 years and greater As an example on novelty-seeking a subscale of the Langer Mindfulness Scale the analysis was not significant between the four groups F(3 61) = 31 p = 82
The second research question used bivariate correlations to determine the strength of the relationships between the psychometric constructs (Mindfulness and Tolerance of Ambiguity) and Resistance to Change including the four subscales All of the Pearson correlations were significant across each of the findings with the exception of the LMS scale and Cognitive Rigidity of Resistance to Change subscale r(65) = -225 p = 072 The overall LMS scales reflected a strong negative relationship r(65) = -530 p lt 001 with the RTC scale The TOA scale revealed a mod-
Table 1 Descriptive Statistics and Correlations among Responses of Tolerance of
Ambiguity Scale Langer Mindfulness Scale and Subscales and Resistance to Change and Subscales
Scales LMS_NS LMS_NP LMS_E TOA_ Tot RTC_RS RTC_ER RTC_STF RTC_CR
LMS_NS (77)
LMS_NP 76 (72)
LMS_E 49 51 (69)
TOA_Tot -48 -53 -32 (72)
RTC_RS -51 -50 -41 65 (85)
RTC_ER -36 -37 -36 41 71 (88)
RTC_STF -53 -47 -38 60 77 80 (90)
RTC_CR -28 -26 -04 44 51 45 41 (86)
of Items 5 5 4 16 5 4 4 4
Mean 598 504 556 376 342 285 367 322
SD 071 94 102 71 110 104 73 81Note N = 65 Cronbachrsquos alpha reliabilities for each dimensionconstruct are listed in parentheses on diagonal Cronbachrsquos Alpha measures indicated a high internal consistency among the items reflected in each scale p lt 05 level (two-tailed) p lt 01 level (two-tailed)
Table 2 Descriptive Statistics and Correlations among Responses of the Total Tolerance of
Ambiguity Scale Langer Mindfulness Scale and Resistance to ChangeLMS_Tot Mean TOA_Tot Mean RTC_Tot Mean
LMS_MeanTotal (86)
TOA_Meantotal -53 (72)
RTC_Meantotal -53 62 (93)Number of items 14 16 17Mean 552 376 301Standard Deviation 75 71 91Note N = 65 Cronbachrsquos alpha reliabilities for each dimensionconstruct are listed in parentheses on diagonal No subscales for Tolerance of Ambiguity were referenced in research Cronbachrsquos Alpha measures indicated a high internal consistency among the items reflected in each scale p lt 05 level (two-tailed) p lt 01 level (two-tailed)
Table 3 Descriptive Statistics and Correlations among Responses Related to Operational and
Demographic Factors Tolerance of Ambiguity Scale Langer Mindfulness Scale and Sub-scales and Resistance to Change and Subscales
ME
AN
SD AG
E
YR
SWR
K
DR
RPT
S
TO
A_M
LMS_
M
LMS_
NS
LMS_
NP
LMS_
E
RT
C_M
RT
C_R
S
RT
C_E
R
RT
C_S
TF
RT
C_C
R
AGE 4571 782 100YRSWRK 1283 943 52 100DRRPTS 1005 2162 -18 01 100TOA_M 376 71 15 11 -02 100LMS_M 552 75 -07 -07 10 -53 100LMS_NS 598 71 -12 -12 04 -48 87 100LMS_NP 504 94 -05 01 18 -53 90 76 100LMS_E 556 102 -01 -10 01 -32 78 49 51 100RTC_M 322 81 -14 -10 -08 62 -53 -51 -48 -37 100RTC_RS 301 91 -13 -07 -04 65 -55 -51 -50 -41 90 100RTC_ER 342 110 -23 -17 -07 41 -43 -36 -37 -36 90 71 100RTC_STF 285 104 -05 00 -06 60 -54 -53 -47 -38 91 77 80 100RTC_CR 367 73 -07 -08 -14 44 -23 -28 -26 -04 65 51 45 41 100
Note N = 65 The correlation coefficient ranges from -1 to +1 with -1 indicating a perfect negative correlation +1 indicating a perfect positive correlation and 0 indicating no correlation
Brian Dunican amp Ric Keaster Acceptance of Change Exploring the Relationship among Psychometric Constructs and Employee Resistance
36 International Journal of the Academic Business World 37Fall 2015 (Volume 9 Issue 2)
erate positive correlation r(65) = 624 p lt001 Further bivariate analyses for LMS explored the strength of the re-lationships between the subscales of the Langer Mindful-ness Scale and the subscales of the Resistance to Change scales The correlational analysis was statistically signifi-cant between all variables except Engagement of the LMS and Cognitive Rigidity of RTC r(63) = -35 p = 781 concluding that the variables were unrelated
The last research question explored the degree of the re-lationship between Mindfulness and Tolerance of Am-biguity Bivariate analyses were used to correlate the re-lationship between the two psychometric constructs The correlations revealed a significantly strong negative rela-tionship between the total mean score of the LMS and the total mean score of the TOA r(63) = -53 p lt 01 The mean scores for each of the LMS subscales compared to the total mean of the TOA showed the following Nov-elty-seeking and TOA r(63) = -48 p lt 01 Novelty-pro-ducing and TOA r(63) = -53 p lt 01 and Engagement and TOA r(63) = -32 p lt 01 It is important to note that higher scores on the Tolerance of Ambiguity scale indicate a greater intolerance of ambiguity Tables 1 and 2 display a descriptive analysis and correlations for each of the scales and subscales The correlations between vari-ables are presented in Table 3
LIMITATIONS OF THE STUDY
Research inherently contains limitations The current study is no exception First the nature of measuring psy-chometrics is subjective Since psychometrics studies mea-sure the way in which individuals think and act (Norton 1975) influences of the organizationrsquos environment could affect individualsrsquo responses to questions Additionally external variables at the time of data collection not related to the study itself can skew the responses and influence the outcomes Other views of limitation rest on the gen-eralizability of the results which may be limited for the following reasons (a) the unit of analysis is at the indi-vidual level (b) data were collected from a limited num-ber of operations within the state of Kentucky through convenience sampling and (c) individual biases that may be introduced at the time of testing
The unit of analysis for data collection rests at the indi-vidual level rather than the group level due to the acces-sibility of the employees Although the survey collection method allows for comparison with larger groups it lim-its the opportunity to explore issues in depth therefore assumptions are made for individuals in similar groups Next the data collected represents limited industries in the state of Kentucky restricting the number of partici-pants and the ability to generalize outcomes to other in-dustries different than those outlined in the current study
Last respondentsrsquo values interests and beliefs regarding the online self-administered surveys may introduce biases unknown by the researcher As a consequence of these limitations and the collection of data during one point in time the results are generalizable only to the groups or populations that are similar to those in the current study
SUMMARY AND CONCLUSION
Change within organizations is inevitable That real-ity will remain constant in organizationsmdashand in onersquos personal and professional life (Conner 1992) The way in which one chooses to cope with change could be a decid-ing factor of success failure or choosing to remain the samemdashwhich in organizations tends to equate with fail-ure particularly if change means simply improving Resis-tance is a natural reaction to change and is part of the hu-man psyche Research and literature support this notion of human nature to resist change and elements related to the process of change (Coch amp French 1948 Conner 1992 Oreg 2003 OrsquoToole 1995 Zander 1950) It is possible that a greater understanding of mindfulness and tolerance of ambiguity could increase the possibilities of new ideas to drive lower resistance to change The current study explored the two psychometric constructs of mind-fulness and tolerance of ambiguity and their relationship to resistance to change within industrial settings Bivari-ate correlations yielded both strong positive and negative correlations among the three scales assessed by salaried employees located across different industries The Langer Mindfulness Scale Budnerrsquos Tolerance of Ambiguity Scale and Oregrsquos Resistance to Change scale were attrib-uted to the foundation of the current study The results contributed to the practical and theoretical significance of individualsrsquo responses to change through the measure-ment of the aforementioned constructs To the extent the findings in the current research could be extrapolated to other industries or organizations a final suggestion should be noted When considering future directions for research related to probing psychometric constructs and resistance to change the current study may have relevance across different nationalities and cultures The elements of change will continue to challenge the fabric of organiza-tions while the internal and external pressures of rising costs variations in supply and demand relentless compe-tition and developing technology test the resolve for sur-vival The readiness of individuals within organizations and their ability to challenge perceptions of change and resistance may determine their competitiveness and ulti-mately their success
REFERENCES
Argyris C amp Schon D (1978) Organizational learning A theory of action research Reading MA Addison-Wesley
Armbruster H Bikfalvi A Kinkel S amp Lay G (2008) Organizational innovation The challenge of measur-ing non-technical innovation in large-scale surveys Technovation 28(10) 644-657
Armenakis A A amp Bedeian A G (1999) Organiza-tional change A review of theory and research in the 1990s Journal of Management 25 293-315
Armenakis A A Harris S G amp Mossholder K W (1993) Creating readiness for organizational-change Human Relations 46(6) 681-703
Banning K C (2003) The effect of the case method on tolerance for ambiguity Journal of Management Edu-cation 27 556-567
Bodner T E amp Langer E J (2001 June) Individual differences in mindfulness The MindfulnessMind-lessness Scale Poster presented at the 13th annual American Psychological Society Conference Toronto Ontario Canada
Bovey W H amp Hede A (2001) Resistance to organisa-tional change The role of defence mechanisms Journal of Managerial Psychology 16(7) 534-548
Brown K W amp Ryan R M (2003) The benefits of be-ing present Mindfulness and its role in psychological well-being Journal of Personality and Social Psychol-ogy 84 822-848 doi1010370022-3514844822
Brown K W amp Ryan R M (2004) Perils and promise in defining and measuring mindfulness Observations from experience Clinical Psychology Science and Practice 11(3) 242-248 doi101093clipsybph078
Budner S (1962) Intolerance of ambiguity as a personal-ity variable Journal of Personality 30 29-59
Burke W W (2014) Organizational change theory and practice Thousand Oaks CA Sage Publications Inc
Carson S H amp Langer E J (2006) Mindfulness and self-acceptance Journal of Rational-emotive and Cog-nitive-behavior Therapy 24(1) 29-43
Coch L amp French J (1948) Overcoming resistance to change Human Relations 1 512-532
Coghlan D (1993) A person-centred approach to deal-ing with resistance to change Leadership amp Organi-zation Development Journal 14(4) 10-14
Cohen J (1988) Statistical power analysis for the behav-ioral sciences Hillsdale NJ Lawrence Erlbaum Associates
Conner D R (1992) Managing at the speed of change How resilient managers succeed and prosper where others fail New York Random House
Demers C (2007) Organizational change theories Thousand Oaks CA Sage Publications Inc
Dent E B amp Goldberg S G (1999) Resistance to change A limiting perspective Journal of
Ehrlich S B Meindl J R amp Viellieu B (1990) The charismatic appeal of a transformational leader An empirical case study of a small high-technology con-tractor The Leadership Quarterly 1(4) 229-247
Ford J D Ford L W amp McNamara R T (2002) Re-sistance and the background conversations of change Journal of Organizational Change Management 15(2) 105-121
Frenkel-Brunswik E (1948) Tolerance toward ambigu-ity as a personality variable American Psychologist 3 268-269
Furnham A amp Ribchester T (1995) Tolerance of am-biguity A review of the concept its measurement and applications Current Psychology 14 179-199
Gaumlrtner C (2013) Enhancing readiness for change by enhancing mindfulness Journal of Change Manage-ment 13 52-68
Geller E S (2002) Leadership to overcome resistance to change It takes more than consequence control Jour-nal of Organizational Behavior Management 22(3) 29-49
Gondo M Patterson K W amp Palacios S (2013) Mind-fulness and the development of a readiness for change Journal of Change Management 13(1) 36-51
Greenwood R amp Hinings C R (1996) Understanding radical organizational change Bringing together the old and the new institutionalism Academy of Manage-ment Review 21 1022-1054
Isabella L (1990) Evolving interpretations as a change unfolds How managers construe key organization-al events Academy of Management Journal 33 7-41
Iverson R D (1996) Employee acceptance of organiza-tional change The role of organizational commitment International Journal of Human Resource Manage-ment 7 122-149
Jacobs P (2005) Five steps to thriving in times of un-certainty Harvard Management Update 10(12) 3-5
Brian Dunican amp Ric Keaster
38 Fall 2015 (Volume 9 Issue 2)
Retrieved from httphbrorgproductfive-steps-to-thriving-in-times-of-uncertaintyanU0512A-PDF-ENG
Judge T A Thoresen C J Pucik V amp Welbourne T M (1999) Managerial coping with organization-al change A dispositional perspective Journal of Ap-plied Psychology 84 107-122
Judson A (1991) Changing behavior in organizations Minimizing resistance to change Cambridge MA Basil Blackwell
Kanter R M (1985) Supporting innovation and ven-ture development in established companies Journal of Business Venturing 1 47-60
Kets de Vries M F R Ramo L amp Korotov K (2009) Organizational culture leadership change and stress INSEAD Working Papers Collection 10 2-26 Re-trieved from httpwwwinseadedufacultyresearchresearchdoccfmdid=41924
Kotter J P (1995) Leading change Why transformation efforts fail Harvard Business Review 73(2) 59-67
Lane M S amp Klenke K (2004) The ambiguity toler-ance interface A modified social cognitive model for leading under uncertainty Journal of Leadership amp Organizational Studies 10(3) 69-81
Langer E J (1993) A mindful education Educational Psychologist 28 43-50
Langer E J (1997) The power of mindful learning Read-ing MA Addison-Wesley
Lawrence P R (1954) How to deal with resistance to change Harvard Business Review 32(3) 49-57 Retrieved from httpedsaebscohostcomlib-srvwkueduehostpdfviewerpdfviewervid=6ampsid =699bab3d-bcec-40d9-ac69-a42c853d72bc40sessionmgr4004amphid=4108
Lewin K (1947) Frontiers in group dynamics II Chan-nels of group life social planning and action research Human Relations 1(2) 143-153
Lewin K (1951) Field theory in social science Selected theoretical papers New York Harper amp Row
Limerick D Passfield R amp Cunnington B (1994) Transformational change Towards an action learning organization The Learning Organization 1(2) 29-40
Mabin V J Forgeson S amp Green L (2001) Harness-ing resistance Using the theory of constraints to assist change management Journal of European Industrial Training 25(234) 168-191
Maurer R (2009) Introduction to change without mi-graines Omaha NE Maurer and Associates Re-trieved from httpextensionmissouriedustaffsde-teams DocumentsChangeW-outMigrarainespdf
Norton R W (1975) Measurement of ambiguity toler-ance Journal of Personality Assessment 39 607-619
Offermann L R amp Gowing M K (1990) Organiza-tions of the future Changes and challenges Ameri-can Psychologist 45(2) 95-108 doi10370003-066X45295
Oreg S (2003) Resistance to change Developing an in-dividual differences measure Journal of Applied Psy-chology 88 680-693
Oreg S (2006) Personality context and resistance to organizational change European Journal of Work and Organizational Psychology 15 73-101
Oreg S Vakola M amp Armenakis A (2011) Change re-cipientsrsquo reactions to organizational change A 60-year review of quantitative studies The Journal of Applied Behavioral Science 47 461-524
OrsquoToole J (1995) Leading change The argument for val-ues-based leadership Boston MA Ballentine Books
Pirson M Langer E J Bodner T amp Zilcha-Mano S (2012) The development and validation of the Langer Mindfulness Scale-Enabling a socio-cognitive perspec-tive of mindfulness in organizational contexts Ford-ham University School of Business Research Paper Re-trieved from httpdxdoiorg102139ssrn2158921
Stanley D J Meyer J P amp Topolnytsky L (2005) Employee cynicism and resistance to organizational change Journal of Business and Psychology 19(4) 429-459
Topping P (2002) Managerial leadership New York McGraw Hill Professional
Van Dam K Oreg S amp Schyns B (2008) Daily work contexts and resistance to organisational change The role of leader-member exchange development climate and change process characteristics Applied Psycholo-gy An International Review 57 313-334 doi101111j1464-0597200700311x
Weinstein N Brown K W amp Ryan R M (2009) A multi-method examination of the effects of mindful-ness on stress attribution coping and emotional well-being Journal of Research in Personality 43 374-385
Zander A F (1950) Resistance to change Its analysis and prevention Advanced Management 4(5) 9-11
International Journal of the Academic Business World 39
INTRODUCTION
Cloud computing is one of the most talked about infor-mation technology topics these days 7 24 Early literature review reveals an endemic confusion of what cloud com-puting is does and what it stands for We posit that the cloud metaphor 3 20 fosters a confusion that persists even today
The goal of this research paper is to look back and make historical sense of cloud computing We try to find the lineage of cloud computing where the phrase cloud com-puting came from who came up with the term and how it found currency in the IT community We trace cloud computing to early timesharing and Application Service Provider (ASP) in the last decade and posit a future of utility computing
Additionally we try to shed light on the current state of cloud computing provide a comprehensive definition of the term and its main building blocks
CLOUD COMPUTING IN THE ACADEMIC LITERATURE
A metaphor
In an article by Ian Foster and Steven Tuecke 3 the authors start by describing the well-known elephant fable where a group of blind people are asked to describe an elephant and not surprisingly each provides a different view
The cloud is a metaphor for the Internet Itrsquos a rebranding of the Internet that is why there is a raging debate By vir-tue of a metaphor itrsquos open to different interpretations 20
Confusion and Frustration
The word ldquocloudrdquo in cloud computing informs very little and it may even misinform ldquoI hated it but I finally gave inrdquo says Carl Bass President and CEO of Autodesk He adds ldquoI didnrsquot think the term helped explain anything to people who didnrsquot already know what it isrdquo20
Giving the lsquocloudrsquo name to the old concept of large shared distributed systems is misleading 4 p 26
Larry Ellison Oraclersquos CEO ldquoThe interesting thing about cloud computing is that wersquove redefined cloud computing everything that we already dohellipI donrsquot understand what we would do differently in light of cloud computing other than change the wording of some of our adsrdquo 1 p 50
In an article in Harvard Business Review (HBR) 22 the author asks a rhetorical question ldquoWhat the heck does it mean to have a lsquocloudrsquo It means that the functions you want like storage communications and applications donrsquot need to live on the device you have in front of you You can get them on demand from the networkrdquo We should ask the question ldquoin a typical non-cloud IS en-vironment do we really have the stated functions on the device in front of usrdquo
Cloud Computing is often confused with Utility Com-puting but they are not the samemdashrather the latter forms part of the former 2
No Definition
Realizing the elephantine nature of cloud computing there is a reluctance to define it Question How would you define cloud computing Answer Cloud computing
The Origin and Construct of Cloud Computing
Nozar Daylami PhD Adjunct Professor
School of Management Information System and Technology Program
California Lutheran University Thousand Oaks CA 91360
ABSTRACTCloud computing is one of the most talked about information technology topics these days A literature review reveals an endemic confusion of what cloud computing stands for This paper tries to shed light on why the term is so confusing We try to find where the phrase cloud computing came from and how it found currency in the IT community We trace cloud computing to early timesharing and Application Service Provider (ASP) in the last decade and posit a future of utility computing This paper also provides a comprehensive definition of the term and its main building blocks
Nozar Daylami The Origin and Construct of Cloud Computing
40 International Journal of the Academic Business World 41Fall 2015 (Volume 9 Issue 2)
is not so much a definition of a single term as it is a trend in service delivery taking place today 3 p 52
An Old Concept
Cloud computing is an old concept it ldquois a throwback to the mainframe model of computingrdquo 19 p 78 Clearly cloud computing is simply remote computing 4 p 26
Internet or Network Computing
Cloud computing as a term for Internet-based computing service was launched by industry giants Google Ama-zon etc in late 2006 24 ldquoIt is the movement of applica-tion services onto the Internet and the increased use of the Internethelliprdquo
The Earliest Publications
In the first article on Cloud Computing in the Communi-cations of ACM 9 it is referred to as ldquothe compute cloudrdquo and is deemed synonymous with ldquoon-demand comput-ing software as a service or the Internet as a platformrdquo Though these other naming conventions are self-explana-tory cloud computing is not
The cloud computing is understood as a shift of the ge-ography of computing It begs the question if it is about moving delivery of a wide variety of information services onto to the Internet why donrsquot we call it ldquoInternet Com-putingrdquo
The first time cloud computing showed up in a HBR pub-lication was in a digital article in April 2008 14 The au-thor states that the move to cloud computing would be disruptive to incumbent players of shrink-wrapped gam-ing software assuming his readers understand what cloud computing entails
A BRIEF HISTORY OF COMPUTING
In the early days of computers they were big and expen-sive So sharing this big expensive gadget was a normal practice Most organizations did not usually own this big machine but those who did had to share it across an en-terprise That was the era of timesharing
However as computers got cheaper and more afford-able every company every department and then finally every person decided to have their own computer How-ever standalone computers are of limited use So we networked them first locally in a Local Area Network (LAN) environment and then far and wide Wide Area
Network (WAN) Then we networked the network and the World Wide Web was born
At the same time in a different parallel universe some-thing else was happening In the early years no commer-cial off-the-shelf software (COTS) was available Every organization had to write its own software program So if you wanted to computerize your accounting general led-ger payables and receivables or run your inventory you had to write your own applications
Buying off-the-shelf applications was also considered ldquooutsourcingrdquo Why Because you were having others do the work for your organization which was supposed to be doing this work for itself So over the years most appli-cation development have been outsourced to burgeoning software companies such as IBM Oracle and SAP
OUTSOURCING AND ASP
In a general sense IS outsourcing is nothing newmdashit has always been considered an option for IT solutions 11 Electronic Data Systems was handling data processing services for Frito-Lay and Blue Cross as early as 1963 IS outsourcing soon became widely known as the second of a three-phase outsourcing phenomenonmdashtraditional out-sourcing being the first phase and application outsourcing being the third 6
In the early years of the last decade xSPs service provid-ers of all stripes were leading into a new generation of IT where it really did not matter where the applications reside as long as we had access to accomplish what we wanted 247 However back then an Application Service Provider (ASP) was thought by some to be another re-incarnation of the old ldquotimesharingrdquo leveraging network technologies 22
However the understanding of an evolving net-centric computing was already there In their book published in 2002 aptly titled NetSourcing authors Kern Lacity and Willcocks 7 define a computing framework and services stack thatrsquos similar to Cloud Computing The authors state ldquoWe selected the term ldquoNetsourcingrdquo as the over-arching name because the common element of any xSP is the delivery of a product or service over a networkrdquo (p 3) The ldquonetworkrdquo however is now synonymous with the ldquoInternetrdquo
Today cloud computing is about getting the job done in whatever way shape or form that may be required Orga-nizations and individuals need the utility of computing and where it comes from by and large is of no concern As early as 1961 Professor John McCarthy predicted that computation may someday be organized as a public utility ldquoEach subscriber needs to pay only for the capac-
ity he actually uses but he has access to all programming languages characteristics of a very large system hellip Certain subscribers might offer services to other subscribers hellip The computer utility could become the basis of a new and im-portant industry 8 McCarthyrsquos notion of ldquoutility comput-ingrdquo is here right nowmdashthat is ldquocloud computingrdquo
This point is confirmed by others 1 p 51 ldquoThe data center hardware and software is what we consider a cloud When a cloud is made available in a pay-as-you-go manner to the general public we call it utility computingrdquo
CLOUD COMPUTING ORIGIN OF THE PHRASE
Coinage of the term ldquocloud computingrdquo has been traced to two individuals who at the time they came up with this term worked for Compaq Computer George Favaloro a Compaq marketing executive and Sean OrsquoSullivan the founder of the now defunct business NetCentric 20
A Compaq internal document marked as confiden-tial dated November 14 1996 and provided by Sean OrsquoSullivan contemplates a Cloud Computing ldquostrat-egyrdquo10
But the creation of this term did not find currency for another decade Many believe the first use of ldquocloud com-
putingrdquo in its modern context occurred on August 9 2006 when then Google CEO Eric Schmidt introduced the term at an industry conference ldquoWhatrsquos interesting [now] is that there is an emergent new modelrdquo Schmidt said ldquoI donrsquot think people have really understood how big this opportunity really is It starts with the premise that the data services and architecture should be on servers We call it cloud computingmdashthey should be in a ldquocloudrdquo somewhererdquo 19
CLOUD COMPUTING DEFINITION
The National Institute of Standards and Technology (NIST SP 800-145) defines Cloud Computing in the fol-lowing way ldquoCloud computing is a model for enabling convenient on-demand network access to a shared pool of configurable computing resources (eg networks serv-ers storage applications and services) that can be rapidly provisioned and released with minimal management ef-fort or service provider interaction This cloud model is composed of five essential characteristics three service models and four deployment modelsrdquo 17
The following diagram places all the pieces together in a visual form
The Conceptual Reference Model
Cloud Computing Reference Architecture NIST Special Publication 500-292
Nozar Daylami The Origin and Construct of Cloud Computing
42 International Journal of the Academic Business World 43Fall 2015 (Volume 9 Issue 2)
Cloud Computing Reference Architecture NIST Special Publication 500-292
NIST Special Publication 500-292 states that ldquothe defini-tion is widely accepted as a valuable contribution toward providing a clear understanding of cloud computing tech-nologies and cloud services It provides a simple and un-ambiguous taxonomy of three service models available to cloud consumers cloud software as a service (SaaS) cloud platform as a service (PaaS) and cloud infrastructure as a service (IaaS) It also summarizes four deployment mod-els describing how the computing infrastructure that delivers these services can be shared private cloud com-munity cloud public cloud and hybrid cloudrdquo 18 Finally the NIST definition also provides a unifying view of five essential characteristics that all cloud services exhibit on-demand self-service broad network access resource pool-ing rapid elasticity and measured service 18
This publication further states that ldquoThese services and their delivery are at the core of cloud computing In the cloud computing model the primary focus is a more eco-
nomic method of providing higher quality and faster ser-vices at a lower cost to the usersrdquo
The Cloud Security Alliance 21 provides a more transpar-ent narrative of what Cloud Computing is ldquoa model for enabling ubiquitous convenient on-demand network access to [a] shared pool of configurable computing re-sources [it] has the potential to enhance collaboration agility scaling and availability and provides opportunity for cost-reduction the model envisages a world where components can be rapidly orchestrated provisioned implemented and decommissioned scaled up or down to provide an on-demand utility-like modelrdquo
A SPATIAL VIEW OF CLOUD COMPUTING
The NIST Computing Reference Architecture is a flat depiction of the cloud computing model A three dimen-sional view of the model by Craig-Wood 2 is a spatial de-piction Here you can see the three dimensions of cloud computing that renders the elephant fable
Computing Services Framework
Infrastructure as a Service (IaaS) As the word ldquoinfra-structurerdquo implies this is the most basic of services Cus-tomers can buy processing storage and network services and then build their own systems on top of this infra-structure A pioneer in the IaaS field is Amazon with its Amazon Elastic Compute Cloud (EC2)
However most big names in the IT field from Micro-soft (Azure) to Google (App Engine) provide IaaS Here customers are not renting specific servers hard drives and network switches or any particular equipment but instead they are utilizing the infrastructure that is most certainly simulated by virtualization software allowing multiple customers to be served by the same array of physi-cal devices IaaS provides the raw power of computingmdashstorage included
Cloud Computing would not be possible without virtu-alization Virtualization is the ability to make a virtual machine (VM) act like a physical computer Just like a physical computer with its own processor operating sys-tem and storage each VM has its own components too The benefit of virtualization though is that you can put much more than only one VM even with different oper-ating systems on the same server Doing so dramatically increases each serverrsquos potential for serving clientsrsquo on-demand needs (8)
Platform as a Service (PaaS) The next level up is where vendors provide not only the raw powermdashthe infrastruc-turemdashbut preconfigured systems running operating sys-tems databases and platforms (programming languages) for building applications For example Microsoftrsquos Azure service provides preconfigured computers running Win-dows and SQL Server And Salesforcecom has Forcecom as its own custom application development platform
In practice the boundary between IaaS and PaaS is not always clear Because IaaS providers most often provide other services such as operating systems database or ap-plication development platform that fall in the PaaS cat-egory In its purest form IaaS can be considered as virtual machines (raw processing power and storage) that can be scaled up and down as you need
Software as a Service (SaaS) Another higher layer is where vendors provide full applications running on cloud infrastructuremdashtheir own or rented from the likes of Amazon Salesforcecom has long been considered one of the most successful SaaS provider Salesforececom CRM was one of the early entrants into the market Salesforcecom prides itself on being a pioneer in Cloud Computing
At Salesforcecom itrsquos all about the Cloud However in their collateral literature dated circa 1993-94 you wonrsquot find any mention of the word ldquocloudrdquo
CLOUD COMPUTING CONCERNS
In survey after survey security is listed as the top concern of Cloud Computing However Cloud Security Alliance (CSA) the industry group that provides security guide-lines and education states that ldquosecurity controls for the cloud computing are for in most part no different than the security controls in any IT environment hellip[however] cloud computing may present different risks to an organi-zation than traditional IT solutionsrdquo 21 p 21
CIOs or CEOs for that matter may feel safer when they ldquoownrdquo versus ldquorentrdquo their IT assets However when you deploy your assets on the Internet for which you eventu-ally will have little choice you will inherit a set of vulner-abilities that are not all that different from the Cloudrsquos Ownership has its own set of financial risks in the form of capital expenditures (CAPEX) that need to be budgeted and spent up front Compare that risk with the far smaller risk of renting (OPEX) which by and large can be dis-continued if needed
Cloud computing technology does not require the use of public networks If your data is too strategically critical and sensitive to be deployed on the Internet you could instead deploy a private cloud that is strictly for your or-ganization Obviously a Private Cloud is more expensive and it needs trained staff However a private cloud lets an organization benefit from cloud technology without the risk of possible public disclosure of its data
Another alternative could be a community cloudmdasha pri-vate cloud that is shared by several organizations for spe-cific needs For example a group of hospitals might create a community cloud to hold patientrsquos medical records
CONCLUSION
Cloud Computing is here to stay and grow Clouds are more versatile than traditional IT networks on many di-mensions They are far more convenient to deploy they have far more potential for collaboration and they are far more scalable than traditional IT ever was The delivery of services is provisioned on global telecommunication net-works that these days have morphed into the Internet And when they mature they will provide a computing utility when and where it is needed
Cloud computing model (adapted from Craig-Wood)
Nozar Daylami The Origin and Construct of Cloud Computing
44 International Journal of the Academic Business World 45Fall 2015 (Volume 9 Issue 2)
BIBLIOGRAPHY
1 Armburst M et al A View of Cloud Computing Communications of the ACM Vol 53 No 4 pages 50-58
2 Craig-Wood K Definition of Cloud Computing incorporating NIST and G-Cloud views httpswwwkatescommentcomdefinition-of-cloud-com-puting-nist-g-cloud Access date April 26 2015
3 Creeger M CTO Roundtable Cloud Computing Communications of the ACM Vol 52 No 8 pages 50-56
4 Cusumano M Cloud Computing and SaaS as New Computing Platforms Communications of the ACM Vol 53 No 4 pages 27-29
5 Foster Ian and Tuecke Steven Describing the Ele-phant The Different Faces of IT as Service wwwac-mqueuecom JulyAugust 2005 pages 26-34 httpdeliveryacmorg10114510900001080874p26-fosterpdf ip=99100108167ampid=1080874ampacc=OPENampkey=4D4702B0C3E38B352E4D4702B0C3E38B352E4D9421298D07BF362E6D218144511F3437ampCFID=505172814ampCFTOKEN=56369758amp__acm__=1429816554_402a40f1d60056fb68e8ccf3fdd96201 accessed April 23 2015
6 Kern Thomas Lacity Mary Cecelia Willcocks Leslie P Netsourcing Renting Business Applica-tions and Services Over a Network Prentice Hall 2002
7 Knoblauch A Deconstructing Cloud Smashwords Edition (Kindle Version) First Edition August 2013
8 Garfinkel Simon (2011 Oct 3) The Cloud Imperative MIT Technology Review httpwwwtechnologyreviewcomnews425623the-cloud-imperative
9 Hayes B Cloud Computing Communications of the ACM Vol 51 No 7 pages 9-11
10 Internet Solution Division Strategy for Cloud Com-puting Compaq Computer Corporation (1996) httpwwwtechnologyreviewcomsitesdefaultfileslegacycompaq_cst_1996_0pdf
11 Lacity M C Hirschheim R Information Systems Outsourcing Myths Metaphors and Realities New York John Wiley amp Sons 1993
12 McAfee A The Year the Cloud Rolled In httpshbrorg2010122010-the-year-the-cloud-rolled Access date April 23 2015
13 McAfee A What Every CEO Needs to Know About the Cloud httpshbrorg201111what-every-ceo-needs-to-know-about-the-cloud Access date April 23 2015
14 McGrath R Whorsquos Disrupting the Gaming Indus-try httpshbrorg200804whos-disrupting-the-gaming-ind Access date April 23 2015
15 Mell P Grance T The NIST Definition of Cloud Computing National Institute of Standards and Technology httpcsrcnistgovpublicationsnist-pubs800-145SP800-145pdf
16 Neumann P Risks and Myths of Cloud Comput-ing and Cloud Storage Communications of the ACM Vol 57 No 10 pages 25-27 The NIST Defi-nition of Cloud Computing httpcsrcnistgovpublicationsnistpubs800-145SP800-145pdf
17 NIST Definition of Cloud Computing httpcsrcnistgovpublicationsnistpubs800-145SP800-145pdf
18 NIST Cloud Computing Reference Architecture National Institute of Standards and Technology Special Publication 500-292 httpwwwnistgovcustomcfget_pdfcfmpub_id=909505
19 Nanavati M Colp P Aiello W and Warfield A Cloud Security A Gathering Storm Communica-tions of the ACM Vol 57 No 8 pages 70-79
20 Regalado Antonio (2011 Oct 31) Who coined cloud computing MIT Technology Review httpwwwtechnologyreviewcomnews425970who-coined-cloud-computing
21 Security Guidance for Critical Areas of Focus in Cloud Computing V30 Cloud Security Alliance httpscloudsecurityallianceorgguidancecsagu-idev30pd
22 Seviokla J Does Cisco Have Its Head in the Clouds httpshbrorg200903does-cisco-have-its-head-in-th Access date April 23 2015
23 Walsh K R Analyzing the Application ASP Concept Technologies Economies and Strategies Communications of ACM Vol 46 No 8 pages 103-107
24 Yang H Tate Mary A Descriptive Literature Review and Classification of Cloud Computing Re-search Communications of Association of Informa-tion Systems Vol 31 2012
Nozar Daylami
46 Fall 2015 (Volume 9 Issue 2)
This page intentionally blank
International Journal of the Academic Business World 47
INTRODUCTION
In their paper ldquoSAS and the Efficient Portfoliordquo Thomp-son and El-houbi (2012) develop a SAS program to calcu-late portfolio weights for efficient stock portfolios Their program improves on existing public domain SAS pro-grams of this type by allowing for portfolios with a rela-tively large number of securities Thompson and El-houbi also claim that their SAS program is an improvement over the Excel programs used to calculate portfolio weights which are sometimes included in investment textbooks They note that users concur that their program is easier to use than those Excel programs which either limit the number of securities that can be included in a portfolio require ldquocorrectionsrdquo or ldquoadjustmentsrdquo to overcome some quirks in the Excel Solver routine or require multiple user interventions
The Thompson and El-houbi program is certainly more elegant and user friendly than the equivalent Excel pro-grams and will provide those with access to the SAS pro-gramming language a valuable tool for learning portfolio management The disadvantage of a SAS program how-ever is that many students will not have easy access to the SAS programming language Students at smaller univer-sities may not have any access to SAS while students at many larger universities may only be able to access SAS at a computer lab on campus
In this paper I modify the Thompson and El-houbi SAS program for use in the open-source R programming lan-guage which is available free of charge for anyone with access to the internet Using the R language program to compute portfolio weights for efficient portfolios main-tains the elegance of the Thompson and El-houbi SAS
program while overcoming the disadvantage of limited SAS availability In addition I extend the Thompson and El-houbi program by making use of a quadratic program-ming package available in R to provide a program that can accommodate short-sale restrictions and position limits
THE R PROGRAMMING LANGUAGE
R is a free programming language for statistical analysis and graphics and runs on many UNIX platforms and on Windows and MacOS It is available under the terms of the Free Software Foundationrsquos GNU General Public License R was developed initially by Robert Gentleman and Ross Ihaka both of the University of Auckland (New Zealand) and is based on the S programming language developed at Bell Labs by John Chambers Since its initial development the popularity of R has grown considerably largely because of its ease of use and because of the avail-ability of many add-on packages that allow users to tackle very sophisticated projects
The base R package may be downloaded at httpcranusr-projectorg That web page also provides links to sources of information about R and basic user manuals There are also many books and manuals now available for purchase that offer information on both basic and special-ized uses of the language In fact Vance (2009) suggests that the growing popularity of the R language at univer-sities language could even result in noticeably lower de-mand for SAS
THE MARKOWITZ PORTFOLIO PROBLEM
As Markowitz (1952) notes an investor following the ldquoex-pected returns-variance of returns rulerdquo will choose an ef-
Optimal Portfolios and the R Programming Language
James A TurnerAssistant Professor of Finance
School of Accounting amp TaxationWeber State University
Ogden UT 84408
ABSTRACTThis paper develops a program in the freely available open-source R programming language to calculate weights for optimal stock portfolios The program retains the advantages the Thompson and El-houbi (2012) SAS program has over similar programs in Excel but avoids the potential problem of limited access to SAS that some students and researchers may face The R program also extends the Thompson and El-houbi program by including the ability to accommodate short-sale restrictions and position limits
James A Turner Optimal Portfolios and the R Programming Language
48 International Journal of the Academic Business World 49Fall 2015 (Volume 9 Issue 2)
ficient portfolio that is a portfolio with maximum ex-pected return for a given variance or one with minimum variance for a given expected return The minimum vari-ance formulation of the portfolio choice problem there-fore requires that the investor choose portfolio weights to minimize the variance of a portfolio with a given expected return The problem also requires that all money be in-vested (which means that the portfolio weights must sum to one) In matrix notation the optimization problem is
where w the choice variable is a k times 1 vector of the weights invested in the k securities in the portfolio V is the port-folio variance-covariance matrix and R is a 2 times k matrix whose first row is a vector of ones and whose second row contains the expected returns of each security in the port-folio M is a 2 times 1 vector whose first element is one (corre-sponding to the constraint that the portfolio weights sum to one) and whose second element is the chosen portfo-lio expected return For now there are no restrictions on short sales so some portfolio weights may be negative
The Lagrangian for the problem is
( ) L w Vw M Rwλprime prime= + minus
where λ is a 2 times 1 vector containing the Lagrangian multi-pliers The first-order conditions for a minimum (which are also sufficient conditions in this case) are
Solving the first-order conditions for w and λ yields
( )( )
11 1
112
w V R RV R M
RV R Mλ
minusminus minus
minusminus
prime prime=
prime=
Thompson and El-houbi following Stephens (1998) let 1 H RV Rminus prime= so that
1 1
1
2
w V R H MH Mλ
minus minus
minus
prime=
=
Stephens (1998 p 36) shows how the elements of the H matrix may be used ldquoto fix any meanvariance point on the efficient frontierrdquo
Min st
w VwRw M
prime
=
2 0
0
L Vw RwL M Rw
λ
λ
part prime= minus =partpart
= minus =part
THE BASIC R PORTFOLIO OPTIMIZATION PROGRAM
The R programming language lends itself very easily to matrix manipulation and matrix computation removing much of the difficulty in solving the standard Markowitz portfolio problem The following R program calculates the portfolio weights for an efficient portfolio using stock return data to estimate expected returns and the variance-covariance matrix The user must specify the desired port-folio expected return The program can accommodate portfolios up to about 50 stocks Beyond that number precision limitations of the R language may make the variance-covariance matrix ldquocomputationally singularrdquo and unable to be inverted
The first step in the program is to read in the return data R can input data from many file types but in the present example the data are stored in a comma-delimited Excel file called ldquoReturnscsvrdquo which contains stock return data In this case the Excel file includes a header row labeling each column of returns with identifying information but no row names The program first reads in the data and then determines the number of securities (number of col-umns in the matrix) as shown on the facing page
ADDING SHORT-SALE CONSTRAINTS AND POSITION LIMITS
The above formulation of the portfolio choice problem places no restrictions on short sales and does not accom-modate position limits In reality individual investors and some fund managers may face requirements prohibit-ing short sales Fund managers may also face requirements that either limit the amount that may be invested in one security or sector or instead that a minimum percentage of funds be invested in a certain security or sector Dai Lin and Liu (2011) list several examples of real-world po-sition limits such as a requirement that a small-cap mutu-al fund invest at least a minimum percentage of its funds in small-company stocks In mathematical terms these short-sale restrictions and position limits can be expressed as a series of inequality constraints While reformulating the portfolio choice problem to add inequality constraints is not difficult doing so makes actually solving the prob-lem considerably more difficult
With short-sale restrictions and position limits the port-folio choice problem becomes
0
Min st
w VwRw MSw w
prime
=ge
where w is still the choice variable S is an m times k matrix that defines both the short-sale constraints on the k se-curities in the portfolio and m minus k other restrictions If there are short-sale constraints but no other restrictions the S matrix is simply a k times k identity matrix which when multiplied by the vector w results in the requirement that
0 iw ige forall If there are other restrictions the sub-matrix of S consisting of the first k rows and k columns of S is an identity matrix and the other restrictions are specified by suitable choices of the elements of the remaining rows of S For example suppose there is a position limit placing a maximum of p on the percentage invested in the sev-enth security so that 7 w ple Since the constraints in the optimization problem above have been expressed as non-negativity constraints this position limit must instead take the form 7 w pminus ge minus The row of S corresponding to
the position limit will consist entirely of zeros except for the seventh element which will be minus1 and corresponding element of the w0 vector would be p
Introducing other forms of position limits simply requires adding the appropriate rows to the S matrix For example if there is a requirement that the total percentage invested in the first and third securities equal or exceed a certain percentage q then one row of S should be [1 0 1 0 0]and the corresponding element of the w0 vector would be q If there is instead a requirement that the total percentage invested in the first and third securities not exceed a cer-tain amount q the required row of S would be [-1 0 -1 0 0] and the corresponding element of the w0 vector would be minusq Other restrictions may be specified similarly For problems that include position limits each of the first k el-
The BASIC R Portfolio Optimation Program
Returns ltminus readtable(ldquoReturnscsvrdquo header = TRUE sep = ldquordquo)Rmat ltminus asmatrix(Returns) Converts the data to matrix formk ltminus ncol(Rmat) Number of columns (number of securities in the portfolio) Now the program calculates the estimate of the variance-covariance matrix (V) the M vector and the R matrix which includes the estimate of the expected returns
V ltminus var(Rmat) Calculates the sample variance-covariance matrix which is used as the estimate of the variance-covariance matrix
Erp ltminus 001 Sets the desired expected portfolio return The user can change this value as desired
M ltminus rbind(1 Erp) Ones ltminus rep(1 k) Ravg ltminus colMeans(Rmat)
Defines the M matrix including the required portfolio return Defines a 1 x k matrix of ones Calculates average returns by column giving a 1 x k matrix of estimated expected returns
R ltminus rbind(Ones Ravg) Combines Ones and Ravg into the 2 x k matrix R Finally the program calculates the portfolio weights and the portfolio variance
VINV ltminus solve(V) Calculates the inverse of the estimated variance-covariance matrixH ltminus RVINVt(R) Calculates the H matrixHINV ltminus solve(H) Calculates the inverse of Hw lt- VINVt(R)HINVM Calculates the portfolio weightsPvar lt- t(w)Vw Calculates the portfolio variance The following commands display the results of the calculations
print(w) Prints the elements of the w vectorprint(Pvar) Prints the variance of the portfolio formed using the weights w
James A Turner Optimal Portfolios and the R Programming Language
50 International Journal of the Academic Business World 51Fall 2015 (Volume 9 Issue 2)
ements of the w0 vector will be zero corresponding to the non-negativity constraints and the remaining elements will equal the percentages associated with the position limits entered as positive or negative numbers depend-ing on whether the position limits establish minimums or maximums
The Lagrangian for this problem is
( ) ( )0 L w Vw M Rw w Swλ microprime prime prime= + minus + minus
where λ is a 2 times 1 vector containing the Lagrangian multi-pliers on the equality constraints and micro is an m times 1 vector of the Lagrangian multipliers on the k short-sale constraints and the m ndash k position limits The first-order necessary con-ditions for this problem are the Kuhn-Tucker conditions
( )0 0
2 0
0
0 0 and 0
L Vw R SwL M Rw
L w Sw w Sw
λ micro
λ
micro micromicro
part prime prime= minus minus =partpart
= minus =partpart prime= minus le ge minus =part
The final set of conditions are known as the complementa-ry slackness conditions since if an element of partLpartμ does not equal zero (ie if the required condition is slack) then the corresponding element of micro must equal zero and vice versa Because of the complementary slackness conditions in order to find a solution to the optimization problem each condition must be checked individually to deter-mine the possible solutions If there are more than a very few constraints finding the candidate solutions manually becomes extremely tedious
Fortunately it is possible to use numerical methods to solve this type of non-linear programming program This is where the strength of the R programming language be-comes very evident The R language provides access to an extensive number of add-on packages developed by R us-ers around the world In particular there are several pack-ages that implement numerical methods to find solutions to optimization problems with inequality constraints Perhaps the package that most easily lends itself to solv-ing the current problem is the ldquoquadprogrdquo package Ac-cording to the documentation included with the pack-age the quadprog routine ldquoimplements the dual method of Goldfarb and Idnani (1982 1983) for solving qua-dratic programming problems of the form min(d΄b+frac12b΄Db)) with the constraints Aʹbgtb₀rdquo For the optimization problem currently under consideration the d vector will be a zero vector the b vector will be the w vec-tor of portfolio weights the D matrix will be the variance-
covariance matrix V and the matrix A΄ will equal a matrix formed by combining the R matrix and the S matrix such that A΄= [R
S ]and A = [ R΄ S΄] Since the V matrix is symmetric the term frac12b΄Db = frac12w΄Vw is a quadratic form Also because the d vector is a zero vector the presence of the frac12 term in the quadratic form does not change the value of the solution to the current portfolio optimization problem That is the weights that minimize frac12w΄Vw sub-ject to the constraints will also minimize w΄Vw subject to the constraints
THE R PORTFOLIO OPTIMIZATION PROGRAM WITH PACKAGE ldquoQUADPROGrdquo
The ldquoQuadprogrdquo package is one of many add-in packages available to R users To use add-in packages in R the user must first download and install the chosen package This is done through the ldquoPackagesrdquo command in the menu bar of the console window Selecting the ldquoInstall package(s)rdquo command from the drop-down box will bring up a list of download locations After selecting a download location the user selects the package(s) to download and install Finally once the selected package is downloaded and in-stalled it must be loaded for use in the current R session which is done by choosing ldquoPackagesrdquo command on the menu bar and then choosing the ldquoLoad packagerdquo com-mand from the drop-down box A list of available packag-es will then appear and the user should select the desired package in this case the ldquoquadprogrdquo package Once the quadprog package is loaded the following program will solve the portfolio problem with short-sale restrictions and position limits
In the present example the short-sale constraint requires that all elements of the w vector be non-negative In addi-tion there are three position limits The first position lim-it requires that no more than 5 of total funds be invested in the seventh security The second position limit requires that no more than a total of 40 of available funds be in-vested in the first and third securities The third position limit requires that total of at least 30 of available funds be invested in the second and fourth securities
The program will make use of the M matrix and the vari-ance-covariance matrix V from the earlier program so those variables must be saved by the user or the following program must be run after running the previous program and before exiting R The new program first sets the posi-tion limits as shown on the facing page
The output of the ldquosolveQPrdquo function includes the values of w and the Lagrangian multipliers for each constraint If the value of a Lagrangian multiplier is zero the constraint associated with that multiplier is not binding otherwise the constraint is binding Though checking the values of
the Lagrangian multipliers allows the user to determine which constraints are binding quite easily the functionrsquos output also includes a listing of the binding constraints by index number
The R Portfolio Optimization Program with Package ldquoQuadprogrdquo
npl ltminus 3 Sets the number of position limits The user sets this value
plmat ltminus matrix (rep(0 nplk) nrow=npl ncol=k) Initializes the matrix that will be used to define the position limit(s)
plmat[17] = -1 Places the required elements into the proper places in the lmat[21] = plmat[23] = -1 position limits matrix In this example the first position
plmat[32] = plmat[34] = 1 limit will set a maximum on the total percentage invested in the seventh security The second position limit will set a maximum on the total percentage invested in the first and third securities The third position limit will set a minimum on the total percentage invested in the second and fourth securities
pl ltminus c(-005 -04 03) Sets the values of the position limits The value the user enters should be positive if the position limit specifies a inimum and should be negative if the position limit specifies a maximum
Next the inequality constraints are placed in matrix form
S ltminus rbind(diag(k) plmat) Defines the S matrix
w0 ltminus c(rep(0 k) pl) Creates a vector whose elements are the values of the inequality constraints
Next the arguments required by the solveQP function that solves the programming problem are defined and the programming problem is solved
dvec ltminus rep(0 k) Defines the d vector which is a necessary input for the quadprog package For portfolio optimization problems the elements of the d vector will all be zeros
Amat ltminus colbind(t(R) t(S)) Forms the Amat matrix
bvec ltminus c(M w0) Joins the M matrix and the w0 matrix to form the bvec vector
ICSol ltminus solveQP(V dvec Amat bvec meq=2) Solves the quadratic programming problem The argument meq specifies that the first two constraints are equality constraints In this example the equality constraints are that the weights sum to one and that the portfolio expected return equal a specified amount
print(c(ICSol[1] 2ICSol[[2]] ICSol[5] ICSol[6])) Prints selected output from the solve QP function the weights the portfolio variance the values of the Lagrangian multipliers and the index numbers of the binding constraints
James A Turner Optimal Portfolios and the R Programming Language
52 International Journal of the Academic Business World 53Fall 2015 (Volume 9 Issue 2)
CONCLUSION
This paper provides an R language program to calculate portfolio weights for efficient portfolios The program can also accommodate short-sale constraints and position limits Users must choose the desired portfolio expected return and must specify any other constraints A strong advantage of the program is that because the R program-ming language is freely available to anyone with access to the internet students and others who wish to use the pro-gram will be able to do so easily
REFERENCES
Dai Min Hanqing Jin and Hong Liu 2011 Illiquidity position limits and optimal investment for mutual funds Journal of Economic Theory 146 1598ndash1630
Goldfarb D and A Idnani 1982 Dual and primal-dual methods for solving strictly convex quadratic pro-grams In Hennart J P (ed) Numerical Analysis Springer-Verlag Berlin pages 77ndash91
Goldfarb D and A Idnani 1983 A numerically stable dual method for solving strictly convex quadratic pro-grams Mathematical Programming 27 1ndash33
Ihaka Ross A free software project Retrieved May 7 2013 from httpcranr-projectorgdochtmlinter-face98-paperpaper_2html
Markowitz Harry 1952 Portfolio selection Journal of Finance 7 77ndash91
Stephens Alan 1998 Markowitz and the spreadsheet Journal of Financial Education 35ndash43
Thompson Thomas H and Ashraf El-houbi 2012 SAS and the efficient portfolio International Research Jour-nal of Applied Finance 3 315ndash327
Turlach Berwin A 2013 quadprog Functions to solve quadratic programming problems R pack-age version 15-5 httpCRANR-projectorgpackage=quadprog (S original by Berwin A Turlach R port by Andreas Weingessel)
Vance Ashlee 2009 Data analysts captivated by Rrsquos power The New York Times Retrieved May 1 2013 from httpwwwnytimescom20090107tech nolog y busi ness-computi ng 0 7prog ra m htmlpagewanted=allamp_r=0
What is R Retrieved May 7 2013 from httpwwwr-projectorgabouthtml
APPENDIX 1 DATA
The data used in the R program come from the CRSP monthly stock file and consist of 60 months of return data from January 2008 to December 2012 The stocks in the 10-stock portfolio are the first 10 stocks in the CRSP monthly file (listed by PERMNO) for which 60 continuous months of returns are available The stocks in the 50-stock portfolio are the first 50 stocks for which 60 continuous months of returns are available Table 1 below lists the PERMNOS current company name and current ticker of the included stocks as well as the exchange where the stock trades
Table 1 Stocks in the Portfolio
NO PERMNO CURRENT COMPANY NAME TICKER EXCHANGE1 10001 GAS NATURAL INC EGAS AMEX2 10002 BANCTRUST FINANCIAL GROUP INC BTFG NASDAQ3 10025 A E P INDUSTRIES INC AEPI NASDAQ4 10026 J amp J SNACK FOODS CORP JJSF NASDAQ5 10032 PLEXUS CORP PLXS NASDAQ6 10044 ROCKY MOUNTAIN CHOCOLATE FAC INC RMCF NASDAQ7 10051 HANGER INC HGR NYSE8 10065 ADAMS EXPRESS CO ADX NYSE9 10100 AMERICAN LEARNING CORP NY ALRN NASDAQ
Table 1 Stocks in the Portfolio
NO PERMNO CURRENT COMPANY NAME TICKER EXCHANGE10 10104 ORACLE CORP ORCL NASDAQ11 10107 MICROSOFT CORP MSFT NASDAQ12 10138 T ROWE PRICE GROUP INC TROW NASDAQ13 10145 HONEYWELL INTERNATIONAL INC HON NYSE14 10147 E M C CORP MA EMC NYSE15 10180 AKORN INC AKRX NASDAQ16 10182 TECH DATA CORP TECD NASDAQ17 10200 REPLIGEN CORP RGEN NASDAQ18 10207 ROYCE FOCUS TRUST INC FUND NASDAQ19 10225 BEAM INC BEAM NYSE20 10232 ELMIRA SAVINGS BANK NY ESBK NASDAQ21 10239 BALDWIN amp LYONS INC BWINB NASDAQ22 10252 INDEPENDENT BANK CORP MA INDB NASDAQ23 10253 DOCUMENT SECURITY SYSTEMS INC DSS AMEX24 10257 D L H HOLDINGS CORP DLHC NASDAQ25 10258 CELLDEX THERAPEUTICS INC CLDX NASDAQ26 10259 SIGMA DESIGNS INC SIGM NASDAQ27 10294 HAVERTY FURNITURE COS INC HVT NYSE28 10297 NEW HAMPSHIRE THRIFT BNCSHRS INC NHTB NASDAQ29 10299 LINEAR TECHNOLOGY CORP LLTC NASDAQ30 10302 CYPRESS SEMICONDUCTOR CORP CY NASDAQ31 10308 TOMPKINS FINANCIAL CORP TMP AMEX32 10318 BALCHEM CORP BCPC NASDAQ33 10333 XOMA CORP XOMA NASDAQ34 10355 DAILY JOURNAL CORP DJCO NASDAQ35 10363 A M A G PHARMACEUTICALS INC AMAG NASDAQ36 10375 T C F FINANCIAL CORP TCB NYSE37 10382 ASTEC INDUSTRIES INC ASTE NASDAQ38 10395 NAVIGATORS GROUP INC NAVG NASDAQ39 10397 WERNER ENTERPRISES INC WERN NASDAQ40 10421 SKYWEST INC SKYW NASDAQ41 10443 PATRIOT TRANSPORTATION HLDG INC PATR NASDAQ42 10463 RESEARCH FRONTIERS INC REFR NASDAQ43 10501 AMERICAN WOODMARK CORP AMWD NASDAQ44 10507 MEDICAL ACTION INDS INC MDCI NASDAQ45 10514 TRANS WORLD ENTERTAINMENT CORP TWMC NASDAQ46 10516 ARCHER DANIELS MIDLAND CO ADM NYSE47 10517 AARONS INC AAN NYSE48 10530 MERIDIAN BIOSCIENCE INC VIVO NASDAQ49 10547 CLEARFIELD INC CLFD NASDAQ50 10550 PRO DEX INC COLO PDEX NASDAQ
James A Turner Optimal Portfolios and the R Programming Language
54 International Journal of the Academic Business World 55Fall 2015 (Volume 9 Issue 2)
APPENDIX 3 RESULTS FOR THE 10-STOCK PORTFOLIO
Results for the 10-stock portfolio with a monthly expect-ed return of 1 are shown at the top of the facing page First shown is the variance-covariance matrix (V) fol-lowed by its inverse (V-1)
Table 2 shows the return averages of each stock and the calculated portfolio weights both for the portfolio with no short-sale constraints or position limits and the port-folio with short-sale constraints and three position limits (1) a requirement that the percentage invested in the sev-enth security not exceed 5 (2) a requirement that the
total percentage invested in the first and the third securi-ties not exceed 40 and (3) a requirement that the total percentage invested in the second and fourth securities be at least 30 Note that when short-sale constraints and position limits are imposed there may no longer be a port-folio that meets all the constraints that is the feasible set may be null In that case the R program will return an error message stating that the constraints are inconsistent
Table 3 lists the inequality constraints and the associ-ated Lagrangian multipliers along with an indication of whether the constraint is binding In this example the constraint that there be a minimum of 30 invested in the second and fourth securities is not binding
APPENDIX 2 COPY OF THE FULL PROGRAM
The full program is shown below without comments Users can easily copy the program that is between the solid lines and paste it into the R Editor window It will probably be necessary for each user to change the name of the data file in the readtable command Also the user can change the portfolio expected return and the number type and value of the inequality constraints as desired
Returns ltminus readtable(ldquoReturnscsvrdquo header = TRUE sep = ldquordquo) Rmat ltminus asmatrix(Returns) k ltminus ncol(Rmat) V ltminus var(Rmat) Erp ltminus 001 M ltminus rbind(1 Erp) Ones ltminus rep(1 k) Ravg ltminus colMeans(Rmat) R ltminus rbind(Ones Ravg) VINV ltminus solve(V) H ltminus RVINVt(R) HINV ltminus solve(H) w lt- VINVt(R)HINVM Pvar lt- t(w)Vw print(w) print(Pvar) npl ltminus 3 plmat ltminus matrix (rep(0 nplk) nrow=npl ncol=k) plmat[17] = -1 plmat[21] = plmat[23] = -1 plmat[32] = plmat[34] = 1 pl ltminus c(-005 -04 03)S ltminus rbind(diag(k) plmat) w0 ltminus c(rep(0 k) pl) dvec ltminus rep(0 k) Amat ltminus cbind(t(R) t(S)) bvec ltminus c(M w0) ICSol ltminus solveQP(V dvec Amat bvec meq=2) print(c(ICSol[1] 2ICSol[[2]] ICSol[5] ICSol[6]))
1
2867001 161224 279311 153314 408660 148438 131874 246057 83608 740152
161224 321169 23967 251277 39387 55190 33449 107899 36378 39718
279311 23967 991158 109233 189872 100249 22208 119
V minus
minus minus minus
minus minus minus minus
minus minus minus minus
=
6782 41342 198294
153314 251277 109233 2757210 319797 03010 139907 969199 56520 416534
408660 39387 189872 319797 977494 325171 247388 1098965 26657 04097
148438 55190 100249 03010 325171 1
minus minus minus minus minus
minus minus minus minus minus minus
minus 644368 311333 1803329 91576 428583
131874 33449 22208 139907 247388 311333 1093506 426730 100681 162364
246057 107899 1196782 969199 1098965 1803329 426730 11640904 233195 3789283
8360
minus minus
minus minus minus minus minus minus minus
minus minus minus minus minus minus
8 36378 41342 56520 26657 91576 100681 233195 138635 73382
740152 39718 198294 416534 04097 428583 162364 3789283 73382 3685519
minus minus
minus minus minus minus minus minus
00046 00019 00002 00006 00035 00004 00011 00008 00018 00019
00019 00364 00013 00037 00002 00004 00003 00001 00100 00007
00002 00013 00161 00024 00076 00035 00013 00041 00038 00033
00006 0
V
minus minus minus minus
minus minus minus minus
minus minus
=
0037 00024 00058 00051 00010 00016 00021 00028 00029
00035 00002 00076 00051 00217 00009 00048 00052 00024 00064
00004 00004 00035 00010 00009 00087 00018 00022 00027 00012
00011 00003 00013 000
minus
minus minus
minus minus minus
16 00048 00018 00113 00013 00055 00018
00008 00001 00041 00021 00052 00022 00013 00033 00003 00034
00018 00100 00038 00028 00024 00027 00055 00003 00850 00020
00019 00007 00033 00029 00064 00
minus
minus minus minus minus minus minus minus minus
012 00018 00034 00020 00068minus
Table 2 Average Returns and Weights for the Ten-
Stock Portfolios
Stock No Permno
Average Returns
Weights (SS
Allowed)IC Weights
(No SS 3 PLs)
1 10001 00064 03817 034062 10002 -00054 00311 004063 10025 00183 00908 005944 10026 00156 02525 026255 10032 00095 -01410 000006 10044 00012 00649 013797 10051 00206 01000 005008 10065 00018 01933 004929 10100 00270 00422 0056810 10104 00104 -00155 00031
Table 3 Constraints and Lagrangian Multipliers
Constraint Lagrangian Multiplier
Constraint Binding
Portfolio weights sum to one 00015 Yes
Portfolio expected return equals 1 00443 Yes
w1 ge 0 00000 No w2 ge 0 00000 No
w3 ge 0 00000 No
w4 ge 0 00000 No
w5 ge 0 00015 Yes
w6 ge 0 00000 No
w7 ge 0 00000 No
w8 ge 0 00000 No
w9 ge 0 00000 No
w10ge 0 00000 No
w7 le 005 00003 Yes
w1 + w3 le 04 00002 Yes
w2 + w4 ge 03 00000 No
James A Turner Optimal Portfolios and the R Programming Language
56 International Journal of the Academic Business World 57Fall 2015 (Volume 9 Issue 2)
The portfolio variances are
No short-sale constraints 0001607 Short-sale constraints and three position limits 0001856
APPENDIX 4 RESULTS FOR THE 50-STOCK PORTFOLIO
Results for the 50-stock portfolio with a monthly ex-pected return of 1 are shown in Table 4 below The first table shows the return averages of each stock and the cal-culated portfolio weights both for the portfolio with no short-sale constraints or position limits and the portfolio with short-sale constraints and three position limits (1) a requirement that the percentage invested in the seventh security not exceed 5 (2) a requirement that the total percentage invested in the first and the third securities not exceed 40 and (3) a requirement that the total percent-age invested in the second and fourth securities be at least 30
Table 5 shows the Lagrangian multipliers on the equal-ity constraints and the position limit constraints To save space for the 50-stock portfolio the Lagrangian multi-pliers on the short-sale constraints are not listed Simply checking Table 4 to see if the weight on a particular stock is zero gives an almost certain indication of which short-sale constraints are binding In this example both the constraint that there be no more than 5 invested in the seventh security and the constraint that there be no more than a total of 40 invested in the first and third securi-ties are not binding
Table 4 Average Returns and Weights for the
50-Stock PortfoliosStock
No Permno Average Returns
Weights SS Allowed
IC Weights No SS 3 PLs
1 10001 00064 01934 013072 10002 -00054 -00179 003673 10025 00183 -00189 000004 10026 00156 02873 026335 10032 00095 00503 000006 10044 00012 -00185 000007 10051 00206 -00136 002288 10065 00018 10920 000009 10100 00270 00306 00423
10 10104 00104 01467 0000011 10107 -00001 -02023 00000
Table 4 Average Returns and Weights for the
50-Stock PortfoliosStock
No Permno Average Returns
Weights SS Allowed
IC Weights No SS 3 PLs
12 10138 00085 -05619 0000013 10145 00065 -03910 0000014 10147 00088 -02693 0000015 10180 00290 -00290 0000016 10182 00076 01181 0000017 10200 00082 01409 0040918 10207 00020 -01551 0000019 10225 00098 00285 0000020 10232 00159 -00021 0000021 10239 00051 01624 0000022 10252 00084 00955 0000023 10253 00058 00121 0000024 10257 -00008 -00236 0000025 10258 00196 -00157 0000026 10259 -00300 -01339 0000027 10294 00179 -00414 0000028 10297 00061 01854 0146729 10299 00074 00826 0000030 10302 00165 00201 0000031 10308 00073 01255 0014132 10318 00194 -01389 0000033 10333 -00203 -00205 0000034 10355 00299 -00545 0036035 10363 -00151 -00167 0000036 10375 00010 -00495 0000037 10382 00046 00267 0000038 10395 -00022 00886 0042339 10397 00134 01296 0084940 10421 -00036 -01045 0000041 10443 00021 01389 0000042 10463 00013 00417 0000043 10501 00176 -00458 0000044 10507 -00228 -00397 0000045 10514 00100 00731 0007846 10516 -00034 -00148 0119247 10517 00208 00629 0000048 10530 00005 00032 0000049 10547 00418 00032 0012550 10550 -00028 00397 00000
The portfolio variances are
No short-sale constraints 000002997 Short-sale constraints and three position limits 000111119
Table 5 Constraints and Lagrangian Multipliers
Constraint Lagrangian Multiplier Constraint Binding
Portfolio weights sum to one 0000503 YesPortfolio expected return equals 1 0031954 Yes
w7 le 005 0000000 Now1 + w3 le 04 0000000 Now2 + w4 ge 03 0000963 Yes
James A Turner
58 Fall 2015 (Volume 9 Issue 2)
This page intentionally blank
JOINT CONFERENCE May 25th 26th and 27th 2016 in
Nashville TN
Academic Business World International Conference
(ABWICorg)
The aim of Academic Business World is to promote inclusiveness in research by offering a forum for the discussion of research in early stages as well as re-search that may differ from lsquotraditionalrsquo paradigms We wish our conferences to have a reputation for providing a peer-reviewed venue that is open to the full range of researchers in business as well as reference disciplines within the social sciences
Business Disciplines
We encourage the submission of manuscripts presentation outlines and ab-stracts pertaining to any business or related discipline topic We believe that all disciplines are interrelated and that looking at our disciplines and how they relate to each other is preferable to focusing only on our individual lsquosilos of knowledgersquo The ideal presentation would cross discipline borders so as to be more relevant than a topic only of interest to a small subset of a single disci-pline Of course single domain topics are needed as well
International Conference on Learning and Administration in
Higher Education (ICLAHEorg)
All too often learning takes a back seat to discipline related research The In-ternational Conference on Learning and Administration in Higher Educa-tion seeks to focus exclusively on all aspects of learning and administration in higher education We wish to bring together a wide variety of individuals from all countries and all disciplines for the purpose of exchanging experi-ences ideas and research findings in the processes involved in learning and administration in the academic environment of higher education
We encourage the submission of manuscripts presentation outlines and ab-stracts in either of the following areas
Learning
We encourage the submission of manuscripts pertaining to pedagogical top-ics We believe that much of the learning process is not discipline specific and that we can all benefit from looking at research and practices outside our own discipline The ideal submission would take a general focus on learning rather than a discipline-specific perspective For example instead of focusing on ldquoMotivating Students in Group Projects in Marketing Managementrdquo you might broaden the perspective to ldquoMotivating Students in Group Projects in Upper Division Coursesrdquo or simply ldquoMotivating Students in Group Projectsrdquo The objective here is to share your work with the larger audience
Academic Administration
We encourage the submission of manuscripts pertaining to the administra-tion of academic units in colleges and universities We believe that many of the challenges facing academic departments are not discipline specific and that learning how different departments address these challenges will be ben-eficial The ideal paper would provide information that many administrators would find useful regardless of their own disciplines
- Testing Major Factors for Reducing Obstacles to Product Innovation Success
-
- Dr Tor Guimaraes
- Dr Marcelo Seido Nagano
- Dr Curtis Armstrong
-
- Acceptance of Change Exploring the Relationship among Psychometric Constructs and Employee Resistance
-
- Brian Dunican EdD
- Ric Keaster PhD
-
- The Origin and Construct of Cloud Computing
-
- Nozar Daylami PhD
-
- Optimal Portfolios and the R Programming Language
-
- James A Turner
-
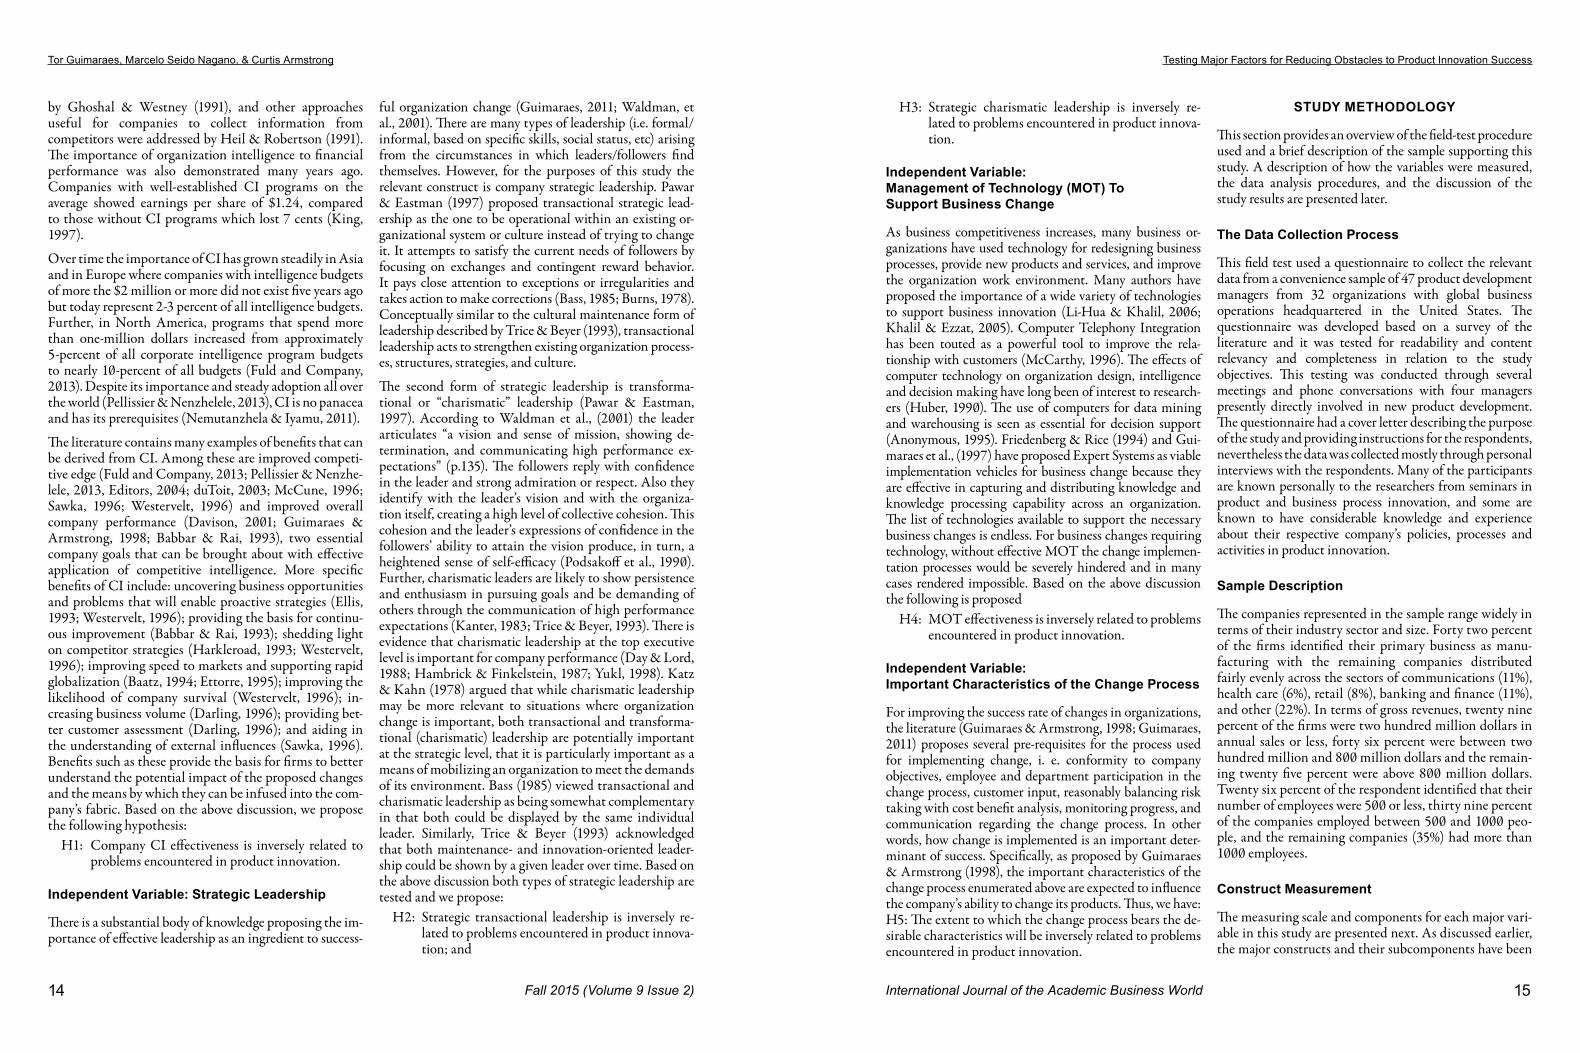
Tor Guimaraes Marcelo Seido Nagano amp Curtis Armstrong Testing Major Factors for Reducing Obstacles to Product Innovation Success
16 International Journal of the Academic Business World 17Fall 2015 (Volume 9 Issue 2)
collected from the existing literature have been validated and used by prior studies and provided the theoretical framework for the model empirically tested here
Obstacles Encountered in Product Innovation were collected from the literature as referenced in Table 1 Respondents were asked to ldquoPlease rate the difficulty of the following product innovation problems your company actually encountered over the last three years in comparison with the closest competing organizations you are aware ofrdquo The list of 11 items to be rated includes
1 Dealing with uncertainty and risk 2 Lack of market information 3 Lack of information about technology 4 Lack of information about consumers 5 Difficulty to generate truly new ideas 6 Difficulty to evaluate and select best ideas 7 Difficulty to connect the portfolio of projects to
strategic objectives 8 Difficult to turn selected good ideas into innova-
tive products 9 Difficult to measure results and performance in
innovation 10 Lack of qualified staff and 11 Difficulty orchestratingco-ordinating the vari-
ous areas for innovation This was done using a seven-point Likert-type scale ranging from 1 to 7
1 extremely lower than average 2 much lower 3 somewhat lower 4 average 5 somewhat higher than average 6 much higher and 7 extremely higher
The ratings for these items were averaged to produce a single measure for ldquoproblemsobstacles encounteredrdquo
Strategic Leadership represents the ability of the top management team to provide leadership when the orga-nizational environment requires change Environments perceived as highly uncertain (requiring major changes) tend to be perceived as risky where wrong decisions could be costly Such environments probably generate a high de-gree of stress Charismatic leadership would tend to reduce
stress and generate confidence and perhaps show how un-certainty can be turned into a vision of opportunity and success (Bass 1985) While charismatic leadership may be more relevant to situations where organization change is of major importance both transactional and transformation-al (charismatic) leadership are potentially important at the strategic level Further Bass (1985) viewed transactional and charismatic leadership as being somewhat complemen-tary in that both could be displayed by the same individual leader The same items proposed by Waldman et al (2001) were used to measure the two types of strategic leadership It was assessed by asking the respondents to rate the extent to which their top managers in general exhibit the particu-lar behavior when compared to managers of main compet-ing organizations
Transactional leadership
1 Takes actions if mistakes are made 2 Points out what people will receive if they do
what needs to be done 3 Reinforces the link between achieving goals and
obtaining rewards 4 Focuses attention on irregularities exceptions or
deviations from what is expected 5 Rewards good work
Charismatic leadership
1 Shows determination when accomplishing goals 2 I have complete confidence in them 3 Makes people feel good to be around them 4 Communicates high performance expectations 5 Generates respect 6 Transmits a sense of mission7 Provides a vision of what lies ahead
Characteristics of the Change Process is defined as the degree to which companies promote ldquodesiredrdquo change process activities It was assessed by asking the respondents to rate the importance or focus that the company places on ten areas of change process characteristics These consisted of all significant changes must conform to company objectives all affected departments participate in the change process individual employee input is considered important customers input is considered important business partners input is considered important ability to balance risk taking with costbenefit clearly defined measures to monitor progress change objectives and progress are clearly communicated responding quickly to required change and responding effectively to required change The same seven-point Likert-type scale was used
and the overall rating of characteristics of the change process for each firm was determined as the average of the ten areas
MOT Effectiveness in Supporting Business Change is the extent to which the companyrsquos needs for technology while implementing business change have been met It was measured by asking the respondents to rate this for the overall company and in four specific areas technology leadership in the industry knowledge of how to get the best technology effectiveness with which technology has been used over the years and effectiveness in using technology in comparison with main competitors The respondents were asked to use the same seven point scale described above The measure for MOT effectiveness in supporting business activities is the average of the ratings for these four items
Construct Validity
Several precautions were taken to ensure the validity of the measures used Many of the recommendations by Carmines amp Zeller (1979) were followed To ensure content validity a thorough survey of the relevant literature was undertaken to understand the important aspects of each major variable and its components and not neglect important dimensions of any variable To further reduce the possibility of any non-random error the main source of invalidity (Carmines amp Zeller 1979 p 15) a group of practitioners from different companies with extensive experience in managing PI reviewed the questionnaire for validity (measuring the phenomena intended) completeness (including all relevant items) and readability (making it unlikely that subjects will misinterpret a particular question) Some questions were reworded to improve readability otherwise the items composing each major variable remained as derived from the literature
As proposed by Carmines amp Zeller (1979) ldquoconstruct validation focuses on the extent to which a measure performs in accordance with theoretical expectationsrdquo (p27) To ensure construct validity the theoretical
relationships between the constructs should have been previously established and these relationships hopefully have been empirically supported by different studies over time As discussed earlier the theoretical underpinnings of this study are relatively well established with most of the items in each construct having been addressed before by several authors Second order factor analyses on the two types of strategic leadership (transactional and charismatic leadership) have been performed by prior studies (Guimaraes 2008 Guimaraes 2011) using larger sample sizes and the results indicated that they can be combined into a single factor as done in this study
Data Analysis Procedures
The relatively small sample size (n = 47) requires the use of simple but robust statistical analysis Pearsonrsquos correla-tion coefficients were used to statistically test the possible relationship between the main constructs T-tests and Chi-square statistics for cross-tabulations were used to test the hypotheses Responses from each manager regarding the main constructs were classified into two groups above and below the mean to produce the cross-tabulation tables
RESULTS
Table 2 lists the Pearsonrsquos correlation coefficients and the means and standard deviations for the six major research variables On the average the companies in the sample are thought to be performing slightly above average in the areas of competitive intelligence both components of strategic leadership management of technology and specific characteristics of the companyrsquos change process On the other hand on average the companies in the sample tend to be ldquosomewhat highrdquo in terms of encountering the obstacles to product innovation identified in this study It is also notable that the relatively large standard deviations (mostly above 10) indicate significant differences in performance from company to company One possible explanation for the ldquosomewhat highrdquo average regarding the identification
Table 2 Correlations Between Major Variables
Major Variables Mean StdDev 1 2 3 4 5
1 PI Problems Encountered 47 0832 Competitive Intelligence 42 112 -233 Transactional Leadership 45 098 -20 NS4 Charismatic Leadership 41 122 -35 36 NS5 Management of Technology 44 107 -26 NS 18 136 Change Process Features 43 098 -33 27 14 23 15
Tor Guimaraes Marcelo Seido Nagano amp Curtis Armstrong Testing Major Factors for Reducing Obstacles to Product Innovation Success
18 International Journal of the Academic Business World 19Fall 2015 (Volume 9 Issue 2)
of obstacles to product innovation may be that the industry seminars attended by the product managers may have raised their own performance expectations and problem awareness
Hypothesis H1 proposes that a companyrsquos performance in Competitive Intelligence (CI) is inversely related to prob-lems encountered in product innovation Table 3 shows the results of the cross-tabulations for these two major vari-ables
In Table 3 the number of observations falling in each table cell corroborates that companies performing above average in the performance of CI tend to be below average in terms of encountering problems during product innovation The same inverse relationship tends to hold for companies performing below average in CI thus encountering more difficulty in product innovation About half as many (8 versus 15) organizations report encountering above average product innovation problems when they are performing above average in CI However this also shows that higher than average overall performing in CI is apparently no guarantee that a company will also not encounter above average problems in product innovation On the other
hand below average performance in CI shows a threefold (6 versus 18) increase in higher than average encounters with product innovation problems
As shown in Table 4 t-tests were used to further test the significance of this relationship between the company
performance in CI and product innovation problems encountered Respondents in the two groups above and below the average performance in CI are compared in aggregate and along each of the product innovation problems identified in the literature The results clearly demonstrate that compared to below average firms companies with above average performance in CI have encountered product innovation problems at a significantly lower level on many of the product innovation problems identified Based on the above results we find strong support for hypothesis one
Results from Hypothesis Two Testing
Hypothesis two proposes that performance in overall company Strategic Transactional Leadership is inversely related to problems encountered in product innovation This was tested in a similar manner as for hypothesis one respondents were placed in two groups based on their above or below average ratings in Strategic Leadership Table 5 shows the results of the cross-tabulations between the two major constructs Sixteen of the 24 companies that were below average Transactional Leadership performance are above average in terms of encountering product innovation problems On the other hand some companies (13) with a below average Transactional Leadership performance somehow were able to avoid having above average encoun-
ters with product innovation problems Further above av-erage Transaction Leadership in 6 organizations has not precluded them from encountering above average product innovation problems
As shown in Table 6 t-tests were used to further test the significance of the relationship between a companyrsquos higher or lower than average Transactional Leadership and specific product innovation problems encountered The two groups are compared in aggregate and along each of the product innovation problems identified in the lit-
Table 4 T-Tests for Performance in Competitive Intelligence and
Each Product Innovation Problem Encountered
Aggregated Variable and Individual Items
Competitive Intelligence
Below Average Performance
Competitive Intelligence
Above Average Performance
p-Value
Problems encountered in product innovation 47 41 003Difficult to deal with uncertainty and risk 51 45 002Lack of market information 53 35 000Lack of information about technology 47 36 001Lack of information about the consumer 52 37 001Difficult to generate truly new ideas 45 43 Not Significant
Difficult to evaluate and select the best ideas 46 48 Not Significant
Difficulty to connect the portfolio of projects to strategic objectives
49 43 Not Significant
Difficult to turn selected good ideas into innovative prod-ucts
43 44 Not Significant
Difficult to measure results and performance in innova-tion
48 40 001
Lack of qualified staff 45 39 002Difficult to orchestrate and co-ordinate the various areas for innovation
40 38 Not Significant
means plt05 means plt 01
Table 5 Cross-Tabulations of
Transactional Leadership and Product Innovation Problems
(Hypothesis 2)Product Innovation
Problems EncounteredBelow
AverageAbove
Average
Transactional Leadership
Below Average 8 16
Above Average 13 6
Chi-square = 52 (p = 002)
Table 6 T-Tests for Transactional Leadership and
Each Product Innovation Problem Encountered
Aggregated Variable and Individual Items
Transactional Leadership
Below Average Performance
Transactional Leadership
Above Average Performance
p-Value
Problems encountered in product innovation 47 42 004Difficult to deal with uncertainty and risk 53 44 001Lack of market information 44 42 Not SignificantLack of information about technology 47 43 Not SignificantLack of information about the consumer 43 39 Not SignificantDifficult to generate truly new ideas 45 42 Not Significant Difficult to evaluate and select the best ideas 46 44 Not Significant Difficulty to connect the portfolio of projects to strategic objec-tives
50 41 001
Difficult to turn selected good ideas into innovative products 51 44 001Difficult to measure results and performance in innovation 49 42 001Lack of qualified staff 46 43 Not SignificantDifficult to orchestrate and co-ordinate the various areas for in-novation
47 35 001
Table 3 Cross-Tabulation of Performance in
Competitive Intelligence and PI Problems (Hypothesis 1)
Product Innovation Problems Encountered
Below Average
Above Average
Performance in Competitive
Intelligence
Below Average 6 18
Above Average 15 8
Chi-square = 768 (p = 000)
Tor Guimaraes Marcelo Seido Nagano amp Curtis Armstrong Testing Major Factors for Reducing Obstacles to Product Innovation Success
20 International Journal of the Academic Business World 21Fall 2015 (Volume 9 Issue 2)
erature The results clearly demonstrate that compared to below average firms companies with higher than aver-age Transactional Leadership have encountered product innovation problems at a significantly lower level along many of the product innovation problems identified The above results corroborates hypothesis two
Results from Hypothesis Three Testing
Hypothesis three proposes that firms having strong char-ismatic leadership is inversely related to encountering problems in product innovation This has been tested in a similar fashion as hypotheses 1 and 2 Table 7 shows the results of the cross-tabulations for belowabove average company resources availability and belowabove average encounters with product innovation problems Similar to the cross-tabulations used for testing the hypotheses addressing the other major constructs the results in this case confirm expectations and should be interpreted ac-cordingly
As shown in Table 8 t-tests were again used to further test the significance of this relationship between Charismatic Leadership and specific product innovation problems en-countered The results clearly demonstrate that compared to below average firms companies with above average Charismatic Leadership have encountered product inno-vation problems at a significantly lower level along many
of the product innovation problems identified While the small sample size has resulted in several non-significant comparisons in no case the comparison contradicted the general hypothesis Based on the above results we also find strong support for hypothesis three
Results from Hypothesis Four Testing
Tested in similar fashion hypothesis four proposes that having effective management of technology is inversely
related to encountering problems in product innovation Table 9 shows the results of the cross-tabulations for be-lowabove average management of technology effective-ness and belowabove average encounters with product in-novation problems Similar to the cross-tabulations used for testing the hypotheses addressing the other major con-structs the results in this case confirm expectations and should be interpreted accordingly
As shown in Table 10 t-tests were again used to further test the significance of this relationship between the company MOT effectiveness and specific product inno-vation problems encountered The results clearly demon-strate that compared to below average firms companies with above average MOT performance have encountered product innovation problems at a significantly lower level along many of the product innovation problems identi-fied Based on the above results we also find strong sup-port for hypothesis four
Results from Hypothesis Five Testing
Hypothesis five proposes that having a product change process with the desirable characteristics is inversely related to encountering problems in product innovation This has been tested the same way Table 11 shows the results
of the cross-tabulations for belowabove average product change process and belowabove average encounters with specific product innovation problems The results in this case confirm expectations and should be interpreted accordingly
As shown in Table 12 t-tests were again used to further test the significance of this relationship between the product change process and specific product innovation problems encountered C to below average firms companies with
Table 8 T-Tests for Charismatic Leadership and
Each Product Innovation Problem Encountered
Aggregated Variable and Individual Items
Charismatic Leadership
p-ValueBelow
AverageAbove
Average
Problems encountered in product innovation 50 39 001
Difficult to deal with uncertainty and risk 52 41 001Lack of market information 49 42 001Lack of information about technology 50 40 002Lack of information about the consumer 47 38 001Difficult to generate truly new ideas 48 38 001Difficult to evaluate and select the best ideas 51 41 001Difficulty to connect the portfolio of projects to strategic objectives 52 38 001Difficult to turn selected good ideas into innovative products 51 43 001Difficult to measure results and performance in innovation 47 37 001Lack of qualified staff 52 36 001Difficult to orchestrate and co-ordinate the various areas for innovation 50 35 001
Table 10 T-Tests for Management of Technology and
Each Product Innovation Problem Encountered
Aggregated Variable and Individual Items
Management of Technology
p-ValueBelow
AverageAbove
Average
Problems encountered in product innovation46 40 003
Difficult to deal with uncertainty and risk 48 34 001Lack of market information 46 35 001Lack of information about technology 52 36 000Lack of information about the consumer 43 41 Not SignificantDifficult to generate truly new ideas 47 40 Not SignificantDifficult to evaluate and select the best ideas 43 42 Not SignificantDifficulty to connect the portfolio of projects to strategic objectives 45 43 Not SignificantDifficult to turn selected good ideas into innovative products 46 41 004Difficult to measure results and performance in innovation 48 42 003Lack of qualified staff 47 44 Not Significant
Difficult to orchestrate and co-ordinate the various areas for innovation 43 41 Not Significant
Table 7 Cross-Tabulations of
Charismatic Leadership and Product Innovation Problems
(Hypothesis 3)Product Innovation
Problems EncounteredBelow
AverageAbove
Average
Charismatic Leadership
Below Average 7 15
Above Average 16 9
Chi-square = 48 (p = 003)
Table 9 Cross-Tabulations of
Management of Technology and Product Innovation Problems
(Hypothesis 4)Product Innovation
Problems EncounteredBelow
AverageAbove
Average
M a n a g e me nt of Technology
Below Average 9 14
Above Average 18 8
Chi-square = 45 (p = 003)
Tor Guimaraes Marcelo Seido Nagano amp Curtis Armstrong Testing Major Factors for Reducing Obstacles to Product Innovation Success
22 International Journal of the Academic Business World 23Fall 2015 (Volume 9 Issue 2)
more relevant within an existing organization environment instead of one attempting to implement changes Katz amp Kahn (1978) argued that charismatic leadership may be more relevant where organization change is important but that both types of strategic leadership are potentially important Our results indicate that indeed for more successful (less problems encountered) product innovation both types of leadership are important
Regarding CI there are also some major implications from this study results To improve their CI programs managers need to consider the collection of market intelligence based on the six areas addressed in this study the traditional industry competitors emerging competitors traditional customer needs and wants non-traditional customer needs and wants relationships with business partners and new product or service development The importance of any one of these areas may be relatively higher or lower and in some cases some of these sources may be irrelevant depending on the companyrsquos specific industry sector line of business products and processes being considered Good performance in these areas whenever applicable to the companyrsquos industry sector and lines of business are likely to reduce problems encountered which in turn is likely to lead to more product innovation
To improve technology management which is found to be useful reducing product innovation problems managers must look at company performance in terms of its technology leadership position in its main industry sectors knowledge of how to get the best technology available effective use of specific technologies and benchmarking the use of specific technologies against the companyrsquos main competitors or best-in-class target organizations An important requirement to accomplish these objectives is the clear definition of the more important technologies necessary to support and enhance the companyrsquos products Another important requirement is management recognition that the implementation of each of the various technologies deemed important to the organization are dependent on specific success factors The success factors for the various technologies have been identified and discussed elsewhere (Guimaraes Igbaria amp Lu 1992 Guimaraes amp Igbaria 1997 Yoon Guimaraes amp Clevenson 1998 Yoon Guimaraes amp Clevenson 1995 Yoon Guimaraes amp OrsquoNeal 1995 Udo amp Guimaraes 1994) and are considered beyond the scope of this paper
Last top managers must ensure that their companysrsquo product change process bear the desirable characteristics studied here all significant changes must conform to company objectives all affected departments participate in the change process individual employee input is considered important customers input is considered important business partners input is considered important managers
above average performance in product change process have encountered product innovation problems at a significantly lower level along many of the product innovation problems identified Based on the above results hypothesis five is corroborated
DISCUSSION MANAGERIAL RECOMMENDATIONS AND
FURTHER RESEARCH
Despite the relatively small sample size the results provide strong evidence regarding the importance of strategic leadership competitive intelligence management of
technology and specific characteristics of the companyrsquos change process to the success of product innovation Given the importance of effectively implementing business innovation in these days of hyper competitiveness it behooves top managers to do whatever they can to improve their companysrsquo performance in the areas of strategic leadership competitive intelligence management of technology and characteristics of the process used to reduce problems encountered with the product innovation process so vital to company performance
In the area of strategic leadership several implications can be derived from this study Charismatic leadership (showing determination while accomplishing goals inspiring confidence making people feel good around you communicating expectations for high performance generating respect transmitting a sense of mission and providing a vision of what lies ahead) is on average and as a whole relatively scarce in industry today and judging by its nature it should be difficult to develop Nevertheless managers must try particularly in high clockspeed industry sectors (Guimaraes et al 2002) requiring continuous innovation Also apparently important for successful product innovation transactional leadership (taking action if mistakes are made pointing out what people will receive if they do what needs to be done reinforcing the link between achieving goals and obtaining rewards focusing attention on deviations from what is expected and rewarding good work) by its nature should be easier to develop Pawar amp Eastman (1997) proposed that transactional leadership is
ability to balance risk taking with costbenefit the existence of clearly defined measures to monitor progress that change objectives and progress are clearly communicated and that the product innovation teams respond quickly and effectively to required change These guidelines must be widely disseminated and enforced by project managers and employees involved in product changes
The primary objective of this research has three interrelated components 1) to identify and assess the variety of problems encountered by companies while performing the vital process of product innovation 2) to identify and assess the major factors proposed in the literature as necessary to increase the likelihood of success in product innovation and 3) to test if these literature proposed success factors for product innovation also show a positive impact by reducing the problems associated with the product innovation process in practice Thus it is safe to assume that the measures for each of the major constructs studied here derived from a large number of separate studies represent an important contribution to future researchers and practicing product innovation managers aiming to improve their company effectiveness in this critical area
During the process of conducting this research informal discussions with several of the product development managers made abundantly clear that over time success in product development can only be achieved by a complex combination of many factors stemming from three major areas humanorganizational technological and market knowledge elements This multidimensional requirement for success as well as an intrinsic presence of risk and the need to find tangible and intangible resources is a huge challenge for product innovation management in general As the results from this study indicated all the major factors addressed here are important but do not by themselves ensure successful product innovation It seems to be rather analogous to a case where basic components must be in combination transformed into improved products which provide greater value to the market place
STUDY LIMITATIONS AND OPPORTUNITIES FOR FURTHER RESEARCH
Based on an extensive survey of the relevant literature this study is a first attempt at empirically testing the im-portance of strategic leadership competitive intelligence management of technology and specific characteristics of the companyrsquos change process for the success of product in-novation The theoretical model proposed here addresses five major determinants of how to reduce obstaclesprob-lems for successful PI based on the existing literature There might be other important factors for reducing the PI prob-lems defined in this study Given the importance of the
Table 12 T-Tests for Change Process Features and
Each Product Innovation Problem Encountered
Aggregated Variable and Individual ItemsChange Process Features
p-ValueBelow Average
Above Average
Problems encountered in product innovation 49 40 001Difficult to deal with uncertainty and risk 51 42 001Lack of market information 49 40 001Lack of information about technology 50 41 001Lack of information about the consumer 48 37 001Difficult to generate truly new ideas 47 40 001Difficult to evaluate and select the best ideas 52 43 001Difficulty to connect the portfolio of projects to strategic objectives 49 38 001Difficult to turn selected good ideas into innovative products 50 43 001Difficult to measure results and performance in innovation 48 39 001Lack of qualified staff 47 37 001Difficult to orchestrate and co-ordinate the various areas for innovation 52 41 001
Table 11 Cross-Tabulations of
Change Process Features and Product Innovation Problems
(Hypothesis 5)Product Innovation
Problems EncounteredBelow
AverageAbove
Average
C h a n g e P r o c e s s Features
Below Average 8 15
Above Average 17 9
Chi-square = 46 (p = 003)
Tor Guimaraes Marcelo Seido Nagano amp Curtis Armstrong Testing Major Factors for Reducing Obstacles to Product Innovation Success
24 International Journal of the Academic Business World 25Fall 2015 (Volume 9 Issue 2)
topic future research should strive to identify and include these potential factors in an expanded theoretical model
Another opportunity for future research stems from the fact that even though the relatively small sample in this study has shown very encouraging statistically significant results larger sample sizes will be much more convincing Therefore we strongly recommend new research projects with larger sample sizes capable of supporting multivariate analyses expanded theoretical models and enable the assessment of more complex relationships among the important constructs addressed in this study Perhaps the use of a path analytic modeling technique would be applicable in this case The results should provide valuable information on the extent to which strategic leadership can positively influence the effective use of technology and CI programs for companies to improve their business competitiveness while ensuring that the change process follow prescribed guidelines suggested in this study
Finally a third area of future research opportunity deals with the integration and expansion of theoretical mod-els relating the many determinants of success in product innovation to include the new construct of ldquoobstacles to product innovationrdquo as a likely moderating variable in these theoretical models Combined these three areas of research opportunity should support a host of research studies important not only to the academic community but also to product innovation managers
REFERENCES
Adams R Bessant J amp Phelps J (2006) Innovation management measurement A review International Journal of Management Reviews 8(1) 21-47
Anonymous (1995) Data mining a new weapon for com-petitive advantage Software Quarterly 2 (4) 15-19
Baatz E B (1994 Sept 15) The quest for corporate smarts CIO 48-58
Babbar S amp Rai A (1993) Competitive intelligence for international business Long Range Planning 263103-113
Bass BM (1985) Leadership and Performance beyond Expectations New York Free Press
Beattie JS amp Fleck J (2005) New perspectives on stra-tegic technology management in small high-tech com-panies Proceedings from IEEE International 2005 Engineering Management Conference
Blindenbach-Driessen F amp Van Den Ende J (2010) In-novation management practices compared the exam-ple of project-based firms Journal of Product Innova-tion Management 6(3) 33-53
Burns J M (1978) Leadership New York Harper amp Row
Calof JL amp Wright S (2008) Guest Editorial Com-petitive intelligence a practitioner academic and inter-disciplinary perspective European Journal of Market-ing 42(78) 717-730
Carmines E amp Zeller R (1979) Reliability and Validity Assessment Beverly Hills CA Sage
Colakoglu T (2011) The problematic of competitive intelligence How to evaluate and develop competi-tive intelligence Procedia ndash Social and Behavioral Sci-ences 24(1) 1615ndash1623 httpdxdoiorg101016jsbspro201109075
Cooper RG (2009) How companies are reinventing their idea-to-launch methodologies Research Technol-ogy Management 52(2) 47-57
Cooper RG and Chew MB (1996) Control tomor-rowrsquos costs through todayrsquos designs Harvard Business Review January-February 88-98
Cooper R amp Edgett S (2008) Ideation for product in-novation what are the best methods PDMA visions magazine 1(1) 12-17 httpwwwstage-gatecomknowledgephp
Cooper R Edgett S amp Kleinschmidt E (2001) Portfo-lio management for new product development results of an industry practices study RampD Management 31(4) 361-380
Darling M S (1996) Building the knowledge organiza-tion Business Quarterly 61(2) 61-66
Davison L (2001) Measuring competitive intelligence effectiveness Insights from the advertising industry Competitive Intelligence Review 12 (4) 25-38
Day DV amp Lord RG (1988) Executive leadership and organizational performance suggestions for a new theory and methodology Journal of Management 14 4593-464
du Toit A (2003) Competitive intelligence in the knowl-edge economy What is in it for South African manu-facturing enterprises International Journal of Infor-mation Management 23 111-120
Editors (2004 MarchApril) Competitive intelligence and records managers The Information Management Journal 4
Ellis J R (1993) Proactive competitive intelligence Us-ing competitive scenarios to exploit new opportunities Competitive Intelligence Review 4(1) 13-24
Ettorre B (1995) Managing competitive intelligence Management Review 84(10) 15-19
Fleisher CS amp Wright S (2009) Examining differences in competitive intelligence practice China Japan and the West Thunderbird International Business Review 51(3) 249ndash261 httpdxdoiorg101002tie20263
Friedenberg R amp Rice A (1994 August 3) Knowledge re-engineering as a BPR strategy Working Notes of the AAAI-94 Workshop on Artificial Intelligence in Business Process Reengineering Seattle WA pp 21-26
Fuld amp Company (2013) Certain industries invest heavi-ly in watching their competition Fuld Insights-Global Benchmarking Project Update March 2013
Galia F amp Legros D (2004) Complementarities be-tween obstacles to innovation evidence from France Research Policy 33 1185ndash1199
Ghoshal S amp Westney D E (1991 Jan) Organizing competitor analysis systems International Journal of the Academic Business World 2(1) pp 35-44
Guimaraes T (2011) Industry Clockspeedrsquos Impact on Business Innovation Success Factors European Journal of Innovation Management 14(3) 322-344
Guimaraes N amp Armstrong C (1998) Exploring the relation between competitive intelligence IS support and business change Competitive Intelligence Review 9(3) 45-54
Guimaraes T Cook D amp Natarajan N (2002) Explor-ing the importance of business clockspeed as a modera-tor for determinants of supplier network performance Decision Sciences 33(4) 629-644
Guimaraes N amp Igbaria M (1997) Clientserver sys-tem success Exploring the human side Decision Sci-ences 28(4) 851-876
Guimaraes N Igbaria M amp Lu M (1992) Determi-nants of DSS success An integrated model Decision Sciences 23(2) 409-430
Guimaraes T Yoon Y amp Clevenson A (1997) Empiri-cally testing ES success factors in business process reen-gineering International Journal of Production Econom-ics 50 245-259
Haataja J (2011) Social media as a source of competitive intelligence in a pharmaceutical corporation Masterrsquos thesis School of Science Aalto University
Haddadi AE Dousset B amp Berrada I (2010) Xplor EveryWhere ndash The Competitive Intelligence Sys-tem for Mobile in IEEE Xplorereg retrieved 25 March
2015 from httpieeexploreieeeorgstampstampjsptp=amparnumber=5945635
Hambrick DC amp Finkelstein S (1987) Managerial Discretion A Bridge between Polar Views of Organi-zational Discretion In LL Cummings amp BM Staw (Eds) Research in Organizational Behavior Green-wich CT JAI Press 9 369-406
Harkleroad D (1993) Sustainable growth rate analysis Evaluating worldwide competitorsrsquo ability to grow profitability Competitive Intelligence Review 4(23) 36-45
Heil O amp Robertson T S (1991 Sep) Toward a theory of competitive market signaling A research agenda Strategic Management Journal 12(6) 403-418
Huber G P (1990 Jan) A theory of the effects of ad-vanced information technologies on organizational design intelligence and decision making Academy of Management Review 15(1) 47-71
Kanter RM (1983) The Change Masters New York Si-mon amp Schuster
Katz D amp Kahn RL (1978) The Social Psychology of Organizations (2nd ed) New York Wiley
Khalil TM amp Ezzat HA (2005) Management of technology and responsive policies in a new economy International Journal of Technology Management 32(12) 88
King M (1997 March 10) Corporations take snooping mainstream Indianapolis Business Journal 17(2) 1-4
Li-Hua R amp Khalil TM (2006) Technology manage-ment in China A global perspective and challenging issues Journal of Technology Management in China 1(1) 9
Maltz E amp Kohli A K (1996 Feb) Market intelligence dissemination across functional boundaries Journal of Marketing Research 33(1) 47-61
Mata RS (2008) Inovaccedilatildeo tecnoloacutegica em multinacio-nais brasileiras estudo multicaso sobre gestatildeo do port-folio de projetos de novos produtos 192p Dissertaccedilatildeo (Mestrado) ndash Faculdade de Economia Administraccedilatildeo e Contabilidade de Ribeiratildeo Preto Universidade de Satildeo Paulo Ribeiratildeo Preto
McCarthy V (1996) CTI lets you coddle customers at lower cost Datamation 42(13) 46-49
McCune J C (1996) Checking out the competition Be-yond Computing 5(2) 24-29
Nemeth C (1997) Managing innovation when less is more California Management Review 40(1) 59-74
Tor Guimaraes Marcelo Seido Nagano amp Curtis Armstrong
26 Fall 2015 (Volume 9 Issue 2)
Nemutanzhela P amp Iyamu T (2011) The impact of competitive intelligence on products and services in-novation in organizations International Journal of Advanced Computer Science and Applications 2(11) 38-44
Parry ME Song M De Weerd-Nederhof PC amp Viss-cher K (2009) The impact of NPD strategy product strategy and NPD processes on perceived cycle time Journal of Product Innovation Management 26 (6) 627-639
Pawar BS amp Eastman KK (1997) The nature and implications of contextual influences on transforma-tional leadership A conceptual examination Academy of Management Review 22 80-109
Pellissier R amp Nenzhelele TE (2013) Towards a univer-sal definition of competitive intelligence SA Journal of Information management 15(2) Art 559 7 pages httpdxdoiorg104102sajimv15i2559 Retrieved 31 March 15
Podsakoff PM MacKenzie SB Moorman RH amp Fetter R (1990) Transformational leader behaviors and their effects on followersrsquo trust in leader satisfac-tion and organizational citizenship behaviors Leader-ship Quarterly 1107-142
Roitner A (2008) Competitive intelligence in Austria An empirical study Masterrsquos dissertation University of Vienna
Sawka K A (1996) Demystifying business intelligence Management Review 85(10) 47-51
Segarra-Blasco A Garcia-Quevedo J amp Teruel-Carrizo-sa M (2008) Barriers to innovation and public policy in Catalonia The International Entrepreneurship and Management Journal 4(4) 431-451
Sharma A (1999) Central dilemmas of managing inno-vation in large firms California Management Review 3941(3) 46-164
Slack N Chambers S Johnston R and Betts A (2006) Operations and Process Management Princi-ples and Practice for Strategic Impact 2nd ed Prentice Hall Harlow
Stringer R (2000) How to manage radical innovation California Management Review 42(4) 70-88
Swartz N (2005) Competitive intelligence underuti-lized Information Management 39(3)
Tarraf P amp Molz R (2006) Competitive Intelligence at Small Enterprises SAM Advanced Management Journal l 71 (4) 24-34
Thamhain HJ (2003) Managing innovative RampD teams RampD Management 33(3) 297-311
Tidd J Bessant J amp Pavitt K (2008) Gestatildeo da inova-ccedilatildeo 3ed Satildeo Paulo Artmed
Trice HM amp Beyer JM (1993) The Cultures of Work Organizations Englewood Cliffs JN Prentice-Hall
Tushman M amp Anderson P (1997) Managing Strategic Innovation and Change Oxford University Press Ox-ford 3-23
Udo G amp Guimaraes N (1994) Empirically assessing factors related to DSS benefits European Journal of In-formation Systems 3(3) 218-227
Vedder RG amp Guynes CS (2002) CIOsrsquo Perspectives on competitive intelligence Information Systems Man-agement 19(4) 49-56
Waldman DA Ramirez GG House RJ amp Puranam P (2001) Does leadership matter CEO leadership at-tributes and profitability under conditions of perceived environmental uncertainty Academy of Management Journal 44(1) 134-143
Weiss A amp Naylor E (2010) Competitive intelli-gence How independent information professionals American Society for Information Science and Tech-nology 37(1) 30ndash34 httpdxdoiorg101002bult20101720370114
Westervelt R (1996) Gaining an edge Competitive in-telligence takes off Chemical Week 158(25) 29-31
Williams SD (2004) Personality attitude and leader influences on divergent thinking and creativity in or-ganizations European Journal of Innovation Manage-ment 7(3) 187-204
Yoon Y Guimaraes T amp Clevenson A (1995) Under-standing the factors important to expert systems suc-cess Technology Management 2(3) 1-14
Yoon Y Guimaraes T amp Clevenson A (1998) Explor-ing ES success factors for BPR Journal of Engineering and Technology Management 15 179-199
Yoon Y Guimaraes T amp OrsquoNeal Q (1995) Exploring the factors associated with expert systems success MIS Quarterly 19(1) 83-106
Yukl GA (1998) Leadership in Organizations (4th ed) Englewood Cliffs NJ Prentice-Hall
International Journal of the Academic Business World 27
INTRODUCTION
Nothing stays the same part of the human condition involves adjusting to change Yet human resistance to change is both intense and natural Perhaps examples of this resistance occur in employeesrsquo personal lives or arise as they approach new ideas or changes at work Through a myriad of changes characterized by global demands unpredictable environments the onset of technologi-cal advances and operational developments managing change and resistance has become a way of life for many organizations (Judge Thoresen Pucik amp Welbourne
1999) Organizations must depend on capable leader-ship to guide them through these unprecedented times The evolution of change requires employees at all levels to embrace new techniques of working by promoting dif-ferent mindsets (Kets de Vries Ramo amp Korotov 2009) Gondo Patterson and Palacios (2013) suggested that some organizations fail to adapt to change and prepare their leadership and employees for a more uncertain fu-ture Yet their study summarized that successful change involves support of formulated strategies and the facilita-tion of change recipients being mindful during change ef-forts In the face of intense global competition it is criti-
Acceptance of Change Exploring the Relationship among
Psychometric Constructs and Employee Resistance
Brian Dunican EdDWestern Kentucky University
1906 College Heights BoulevardBowling Green KY 42101
Ric Keaster PhD Western Kentucky University
1906 College Heights BoulevardBowling Green KY 42101
ABSTRACTChange is inevitable and can influence numerous events inside and outside an organization The contrasting at-titudes of acceptance and resistance to change are an increasingly interesting topic in todayrsquos global ever-changing and competitive environment Discovering the behavioral origins of employeesrsquo reactions to change is an integral part of understanding the way in which individual mindset may play a role in coping with organizational change and resistance This body of knowledge may give organizations insight for creating a competitive advantage over their counterparts
Conceivably it can be argued that some researchers view change as a process of gradual adaptation that is largely in-fluenced by people in organizations who react to internal and external pressures while others view it as an emergent event due to environmental selections (Demers 2007) Through both concepts successful navigation through change events relies on the manner in which humans respond to these occasions
The current study employed a descriptive non-experimental correlational design to examine individualsrsquo self-rating of their level of mindfulness tolerance of ambiguity and resistance to change in four industries located in Kentucky The quantitative study sought to identify the strengths of the relationship of the chosen variables using validated instruments ndash Langerrsquos (Pirson Langer Bodner amp Zilcha-Mano 2012) Langer Mindfulness Scale (LMS14) Bud-nerrsquos (1962) Tolerance of Ambiguity Scale (TOA) and Oregrsquos (2003) Resistance to Change Scale (RTC) Regression models were utilized to evaluate multivariate relationships among the variables Based on the findings in the current study the results indicated that no differences lie between group comparisons of organizational or demographic fac-tors when examining the relationship among the elements of mindfulness tolerance of ambiguity and resistance to change Bivariate correlations yielded both strong positive and negative relationships among the three scales assessed by salary (exempt and non-exempt) employees located across the different industries (p lt 01)
Brian Dunican amp Ric Keaster Acceptance of Change Exploring the Relationship among Psychometric Constructs and Employee Resistance
28 International Journal of the Academic Business World 29Fall 2015 (Volume 9 Issue 2)
cal for organizations to have the dexterity to accept new changes and adapt to survive (Gondo et al 2013 Jacobs 2005) Discovering the behavioral origins of employee re-actions to change is an integral part of understanding the recipe for flexibility longevity and organizational success Researchers have separately alluded to varying degrees of social psychological constructsmdashparticularly elements of mindfulness and tolerance of ambiguitymdashand their influ-ence on individualsrsquo attitudes toward change and resis-tance (Banning 2003 Langer 1993)
BACKGROUND
By its nature change in organizations is inherently stress-ful causing increased anxiety among employees at each level of the organization This environment of uncertain-ty can threaten the balance of control often distracting organizations from obtaining the stability needed to sur-vive and adapt to change Researchers have analyzed sev-eral techniques for strengthening the idea of overcoming uncertainty Carson and Langer (2006) stated ldquoActively thinking about paradoxes increase onersquos ability to toler-ate ambiguity and decreases the anxiety associated with uncertainty In a separate study Weinstein Brown and Ryan (2009) contended that increased mindfulness in individuals promoted greater attention and awareness in situations (organizational change for example) perceived as stressful or threatening
Leaders throughout organizations must possess the skills and cognitive experience to manage varying degrees of uncertainty and balance the levels of tolerance within their organizations (Lane amp Klenke 2004) This notion is reinforced by Topping (2002) in that change implies uncertainty and uncertainty can drive individuals to feel afraid uncomfortable threatened anxious and as a result resistant to change On the contrary acknowl-edging uncertainty can lead to the exploration for clarity and challenges of the status quo (Geller 2002) A rapidly growing amount of literature is available on mindfulness which insinuates how this construct could aid in navigat-ing through areas of uncertainty (Brown amp Ryan 2004 Lane amp Klenke 2004 Langer 1993 Weinstein et al 2009) Brown and Ryanrsquos (2004) multifaceted definition of mindfulness recognized it as ldquoa phenomenon with functional import for outcomes as diverse as physical health psychological well-being work and sports perfor-mance and relationshipsrdquo (p 242)
The process of conforming to change or an innovation may seem difficult for individuals within organizations yet examples exist in which individuals adapt very easily and seem to flourish within this environment Judge et al (1999) explained that organizational change has been predominately conducted at a middle range or macro
level rather than at the micro individual level Changes in organizations are not always clear even for the leaders Through the vagueness of change innovative organiza-tions deliberately take actions to avoid misinterpretations and to improve the process (Limerick Passfield amp Cun-nington 1994) ldquoAs organizational structures become less hierarchical and more fluid and amorphous tolerance for ambiguity and uncertainty is likely to emerge as a quality that differentiates effective from ineffective leadersrdquo ac-cording to Lane and Klenke (as cited in Ehrlich Meindl amp Viellieu 1990 p 69) As organizations are naturally subject to uncertainties the concept of increasing employ-eesrsquo abilities to deal with ambiguous situations may lead to more success or important gains in knowledge about organizations
Resistance to Change
The literature presents an enduring consensus on the premise that it is human nature to resist change and ele-ments related to the process of change (Coch amp French 1948 Conner 1992 Oreg 2003 OrsquoToole 1995 Zander 1950) This notion of natural resistance is supported by Kotter (1995) as he described change as the force of shift-ing conditions within the human communities Contest-ed by Dent and Goldberg (1999) the phrase resistance to change should be reevaluated under a more conventional definition Although the researchers supported the belief that resistance is natural their views have challenged the idea of the way in which individuals resist change Blindly supporting the belief that one can resist change may be counterproductive and may direct the focus of organiza-tions away from the actual issues The idea of contradict-ing this belief opens the possibilities that inefficiencies in the process of change and its impact on individuals should be acknowledged and explored (Mabin Forgeson amp Green 2001) As a whole regardless of the process resistance to change is driven at the individual level and is leveraged by organizations to foster change (Conner 1992 Judson 1991)
Employees of organizations may withdraw from the fear of ideas they do not fully understand or act rebellious to-ward seemingly unclear decisions made by management without proper cause Ideally change within organiza-tions should be straightforward clear and concise prior to implementation More often this is not the case for individuals who implement the groundwork or for those who are being impacted by the change (Judson 1991) Al-ternately studies have demonstrated that some employees with a higher tolerance of ambiguity are more susceptible to change and may even thrive within this environment (Oreg 2003) As a whole organizations have struggled with implementing new ideas changing their culture and
reacting to market demands nevertheless many are will-ing to change to remain competitive
Dent and Goldberg (1999) found that at the individual level resistance to change can arise from those whose jobs are directly impacted and can cause a rippling effect through the organization Fundamentally individuals are creatures of habit and are annoyed by pressures in organi-zations that force employees to choose a different behavior or accept a reward system that may not seem beneficial However they are willing to change their behaviors when their beliefs of the benefits of the change outweigh the benefits in their current environment (Armenakis amp Be-deian 1999) In other words attitude toward the change affects onersquos willingness to consider and even implement the change
ATTITUDES AND CHANGE
Some change efforts within organizations are successful some are not Kotter (1995) monitored approximately 100 companies over a decade to observe the fundamental changes made in fluctuating business environments The research included examples of successes examples of fail-ures and illustrations of companies that remained stag-nant as they suffered through misguided steps Outlined by Kotter (1995) successful changes within companies encompassed eight steps (a) creating a sense of urgency (b) forming a guiding coalition (c) creating a compel-ling vision (d) communicating the vision for buy-in (e) empowering and acting on the vision (f) creating quick wins (g) increasing credibility through small wins and (h) linking success to new approaches In an earlier ap-proach Judson (1991) proposed five steps to enhance the process of change by engaging employeesrsquo active participa-tion through (a) analyzing and planning the change (b) communicating the plan for change (c) gaining buy-in and acceptance (d) changing the status quo to the desired state and (e) institutionalizing the new state of change Through these steps the common link described for suc-cessful changes involved employeesrsquo comprehension of the change and their personal adaptation to the new way of thinking and working
Iverson (1996) supported the concept that organizational change could be easier when employees have higher per-sonal commitments through healthy professional rela-tionships positive employee morale job satisfaction and positive recognition Moreover employees who have a sol-id desire to perform well and are willing to embrace new challenges even in the absence of clarity also understand the importance of change within organizations Further-more Gaumlrtner (2013) reinforced the concept that employ-eesrsquo attitudes and perceived flexibility toward change were influenced through a subset of mindfulness Although it
is not a new term mindfulness supports the concepts at-tributed to attention awareness engagement and being comfortable with new ideas that may impact areas within an individualrsquos control (Langer 1993)
The Problem Defined
With the continuous expansion of globalization and the rising unpredictability of consumer demands economic pressures and technological advancements organiza-tions have been required to change to remain competi-tive Change is inevitable The organizations that master agility and are adaptive to the ever-changing environment will possess the recipe to emerge triumphant over their competitors In reality every organization must change yet the process is not always smooth or effective Hypo-thetically within the organizational structure there are individuals who visualize the change others who develop and organize the change and those who implement and perform the change (Isabella 1990) At times roles of in-dividuals may overlap due to the size of the organization and the responsibilities entailed within each role Directly or indirectly everyone throughout the organization is im-pacted by the change perhaps some individuals are able to cope with change better than others A study of the relat-ed factors of mindfulness and tolerance of ambiguity may lead to insights about individualsrsquo resistance to change
Defining the Problem of Resistance
Resistance to change refers to adverse human forces that impact the processes of change Kotter (1995) empha-sized that organizational resistance is often helped along through the mismanagement of change and by ignoring its impact on the processes Maurer (2009) suggested that resistance will happen often due to failures from previ-ous change implementations Lewin (1947) one of the most influential early researchers of change realized that change was not an event but rather a living process He conceptualized the process of change through a model composed of three steps unfreezing change and refreez-ing His initial step introduces the idea of resistance in-dividuals must give up something before accepting some-thing new Though simple his ideas have been expanded upon by numerous researchers and have been developed into various theories of change Zander a close colleague of Lewin defined resistance to change as ldquobehavior which is intended to protect an individual from the effects of real or imagined changerdquo (as cited by Dent amp Goldberg 1999 p 34)
Mabin et al (2001) found that seemingly rebellious em-ployees manifest their fears of change due to uncertainty In addition perceived resistance may be disguised through
Brian Dunican amp Ric Keaster Acceptance of Change Exploring the Relationship among Psychometric Constructs and Employee Resistance
30 International Journal of the Academic Business World 31Fall 2015 (Volume 9 Issue 2)
the camouflage of untimely surprises past resentment ad-ditional job duties or the exposure of personal vulnera-bilities In isolated cases changes within the organization may cause a true threat to safety quality cost or the com-panyrsquos reputation Ignoring the symptoms of resistance within the change process could have disastrous results Judson (1991) agreed that resistance to change is not the fundamental problem but a symptom hiding basic under-lying circumstances He also developed a continuum of reactions to change ranging from indifference (no resis-tance) to active even aggressive resistance
Research has validated the importance of evaluating the reactions and the attitudes of individuals toward organi-zational change and their desire to succeed (Judge et al 1999 Oreg 2006) Developed and validated by Oreg (2003) the Resistance to Change scale has been widely used and accepted by academic works to measure an indi-vidualrsquos disposition toward resistance to change Further-more Oreg outlined four subscales as an exploratory anal-ysis to categorize an individualrsquos reaction to resist change (a) routine seeking (b) emotional reaction to impose change (c) cognitive rigidity and (d) short-term focus Supportive research (cited in Oreg 2003) has found the factors of openness to change tolerance of ambiguity and risk aversion as predictors for managers coping with the stress of change within their organizations An exhaustive amount of research has been conducted on the broad topic of resistance to change yet little is known on the relation-ship of how the psychological constructs of mindfulness and tolerance of ambiguity influence resistance to change within organizations Early researchers such as Coch and French (1948) viewed resistance to change as an obstacle of contention during the process of changes within organiza-tions One of their studies conducted in a sewing factory revealed that employees retaliated against change through acts of aggression controlling restrictions of throughput high turnover rates increased complaints and reports of dissatisfaction with management In line with earlier studies the use of the term resistance to change gained popularity beginning in the 1950s following Lewinrsquos (1947 1951) works related to field theory and social sci-ences Resistance to change is commonly accredited to the unfreezing stage of Lewinrsquos (1951) change model (Ar-menakis amp Bedeian 1999) Naturally portrayed as a nega-tive barrier to change resistance to change is frequently defined using Lewinrsquos physical science-related terminol-ogy as a restraining force to maintain the current state of equilibrium (Dent amp Goldberg 1999) Since that time resistance to change has been widely acknowledged and associated with the process of change organizational de-velopment and change theories and models Other schol-ars have conceptualized resistance to change as an emo-tional reaction rather than a behavioral response As an
example Argyris and Schon (1978) suggested resistance in terms of defensive routines and frustration during the process of change Kanter (1985) supported this notion describing feelings of uncertainty and loss of control for individuals facing change In other terms of defining re-sistance Lawrence (1954) used an analogy to compare re-sistance to change as pain within the human body that is used as a signal to communicate that something is wrong ldquoThe resistance like the pain does not tell what is wrong but only that something is wrong And it makes no more sense to try to overcome such resistance than it does to take a pain killer without diagnosing the bodily ailmentrdquo (p 56) This analogy highlighted the parallels between re-sistance and overcoming it through a practicable solution
Mindfulness
Mindfulness is a concept in educational psychology that has been primarily defined by Dr Ellen Langer a so-cial psychology professor at Harvard University Langer (1993) defined mindfulness as ldquoan open creative proba-bilistic state of mind in which the individual might be led to finding differences among things thought similar and similarities among things thought differentrdquo (p 44) Langer (1997) further explained three characteristics of mindfulness ldquo(a) continuous creation of new categories (b) openness to new information and (c) having an im-plicit awareness of more than one perspectiverdquo (p 4) The Mindfulness Scale validated by Pirson et al (2012) oper-ationalizes the construct and identifies the four subscales of novelty-seeking engagement novelty-producing and flexibility to explain the broad psychometric construct Brown and Ryan (2003) defined mindfulness as ldquoa quali-ty of consciousness that is characterized by clarity and viv-idness of current experience and thus stands in contrast to the mindlessrdquo (p 823) Different from Langerrsquos definition that evaluates dispositional differences in reflective con-sciousness behavioral routines over time Ryan and Brown focused on the presence or absence of attention to and the awareness of events occurring in the present moment For the purpose of the current study the ideas of mindfulness were presented through the literature of Langer Further-more mindfulness is believed to play an important role in disengaging individuals from automatic thoughts habits and unhealthy behavior patterns and may contribute to well-being and happiness in a direct way (Brown amp Ryan 2003)
Tolerance of Ambiguity
Tolerance of ambiguity describes an individualrsquos behavior in unclear or insecure situations and how one reacts to the lack of clarity or uncertainty (Banning 2003) Devel-oped by Frenkel-Brunswik (1948) tolerance of ambigu-
ity has gained attention from researchers over the past 60 years Frenkel-Brunswik was one of the first to present a comprehensive analysis of ambiguity and was influenced by earlier works of Germany psychologist Erich Jaensch Frenkel-Brunswik described tolerance of ambiguity as an ldquoemotional and perceptual personality variablerdquo (cited in Furnham amp Ribchester 1995 p 180)
Budner (1962) later defined tolerance for ambiguity as ldquothe tendency to perceive ambiguous situations as desir-ablerdquo and intolerance for ambiguity as ldquothe tendency to perceive ambiguous situations as sources of threatrdquo (p 29) Budner developed the Tolerance of Ambiguity Scale to further interpret the complex concept of ambiguity and individualsrsquo responses to it Through the development of the Tolerance of Ambiguity Scale three subscales (ie novelty complexity insolubility) emerged to provide in-sight into the more abstract larger construct A decade later Norton (1975) defined tolerance of ambiguity as the degree to which an individual is cognitively willing to tolerate uncertainty vagueness or nebulous information and is able to act upon the knowledge
Employees resist change at all levels of the organization Although some individuals openly accept change many do not Determining the varying degrees of each psycho-metric construct on resistance along with their combi-nation toward resistance to change may reveal common areas of opportunity related to organizational change The following general research question is offered How are the psychometric constructs of mindfulness and toler-ance for ambiguity related to resistance to change within organizations
Empirical Studies and Questions
Numerous studies have alluded to resistance to change some have focused on the individuals (eg Bovey amp Hede 2001 Coghlan 1993 Ford Ford amp McNamara 2002) while others have explored organizations (eg Arm-bruster Bikfalvi Kinkel amp Lay 2008 Coch amp French 1948 Greenwood amp Hinings 1996 Lawrence 1954 Stanley Meyer amp Topolnytsky 2005) Van Dam Oreg and Schyns (2008) stated ldquoA review of the past empirical research reveals that resistance to change has been concep-tualized in three ways as a cognitive state as an emotion as a behavioral intentionrdquo (p 316) As an emotion some studies have revealed that employees who display nega-tive perceptions toward organizational change may have an overall negative outlook on change thus perpetuat-ing resistance (Armenakis Harris amp Mossholder 1993 Stanley et al 2005) Extreme measures of resistance to organizational change have been displayed in other stud-ies through sabotage slowdowns and strikes (Armenakis et al 1993) Universally resistance to change has been
recognized to have a significant impact on the outcomes of organizational change yet individuals within the or-ganization are perceived to be the major blockage or im-pediment (Mabin et al 2001) Based on the literature concerning the analysis of change empirical studies have identified a wide range of factorsmdashnamely organization-al managerial behavioral and individualmdashthat promote or impede resistance in organizations
Organizations are faced with the challenges of changing and responding to current and future trends at an un-precedented rate in todayrsquos global environment (Burke 2014) Twenty-five years ago Offermann and Gowing (1990) found that American organizations alone had spent over a record 210 billion dollars to prepare leaders to thrive in organizational change In addition to money an immeasurable amount of time and energy have been dedicated to nurturing leadership and key individuals to navigate others through this complex but important pro-cess Nonetheless the blueprint is far from perfect The readiness of individuals within the organization to plan and implement proactive measures may determine the or-ganizationrsquos competitiveness The current study examines the factors of mindfulness and tolerance of ambiguity and how they relate to individualsrsquo perceptions of resistance to change The specific research questions are the following
1 How do demographic factors of the respondents and the organizational factors under which they work relate to the psychometric scales of Mind-fulness and Tolerance of Ambiguity and their influence on Resistance to Change
2 After controlling for demographic factors how does psychometric mindset (Sub-constructs of Mindfulness and Tolerance of Ambiguity) influence individual Resistance to Change (a) Routine seeking (b) Emotional reaction (c) Short-term focus (d) Cognitive rigidity
3 What is the degree of relationship among these measures of Mindfulness and Tolerance of Am-biguity
4 The following model characterizes the current study
Highlights of the Methodology
When considering the measurement of the perceptions of resistance to change within organizations various meth-ods have been utilized to illustrate relationships among different constructs (Oreg 2003 Oreg Vakola amp Ar-menakis 2011) In the current quantitative non-exper-
Brian Dunican amp Ric Keaster Acceptance of Change Exploring the Relationship among Psychometric Constructs and Employee Resistance
32 International Journal of the Academic Business World 33Fall 2015 (Volume 9 Issue 2)
imental study data were collected from three validated instruments ndash Langerrsquos (Bodner amp Langer 2001) Langer Mindfulness Scale (LMS) Budnerrsquos (1962) Tolerance of Ambiguity Scale (TOA) and Oregrsquos (2003) Resistance to Change (RTC) scale Regression models were used to assess the univariate relationships among the constructs Additionally descriptive statistics were used to include the mean median mode standard deviation and other selected variables A multiple linear regression analysis determined the relationship between factors of mindful-ness and tolerance of ambiguity and their influence of resistance to change Bivariate correlations were used to compute the psychometric scores from each instrument and resistance to change ratings to test the significance of the relationships between each subscale Overall statisti-cal analyses were conducted in multiple phases to investi-
gate the relationship between the individual psychomet-ric traits and resistance for salary exempt and non-exempt employees in industrial sites located in Kentucky
Participants in the Study
The population represented a microcosm of several indus-tries in the manufacturing sector within the proximity of Warren County The data collected were based on a con-venient sample A total of 65 participants volunteered to complete an electronic survey that was designed to capture complete responses to a total of 48 questions Participants were not allowed to proceed to the next page of the survey unless all questions on the current page were completed Three participants did not complete the survey and their responses were not included in the end results From the
population of 183 salaried (exempt and nonexempt) em-ployees 65 surveys were officially returned constituting a response rate of 36 Managerial-type jobs dominated 36 of the sample population followed by roles in tech-nical support which reflected 169 Six categories of job types and an ldquoOtherrdquo category were used for the respon-dents
Scoring Method for Each Scale
Resistance to Change Scale
Oregrsquos (2003) Resistance to Change Scale is comprised of 17 items with four subscales ndash routine seeking emo-tional reaction short-term focus and cognitive rigidity Each subscale relates to the extent to which individuals seek routines react to emotions during change encom-pass short-term focus during change and the frequency to which individuals change their minds The overall range of the scale including the subscales is scored between 1 and 6 with 1 representing the least level of resistance In-dividuals scoring higher on the overall scale or subscales indicate a higher resistance to change
Langer Mindfulness Scale
The Langer Mindfulness Scale (Pirson et al 2012) con-tains 14 items and is composed of three subscales ndash novelty seeking engagement and novelty producing The 7-point scale is scored such that higher scores indicate a greater level of awareness toward thinking High scores for novel-ty producing insinuate one would perceive new situations as opportunities to learn new information Individuals with high scores for engagement are more susceptible to noticing details within their environment as opposed to others Higher novelty producing scores indicate that individuals are likely more creative and predisposed to generating new ideas when faced with new information
Tolerance of Ambiguity Scale
Budnerrsquos (1962) Tolerance of Ambiguity Scale is a 16-item scale with ratings ranging from 1 to 7 1 represents strong disagreement indicating a greater tolerance for ambiguity It is important to note that higher scores relate to greater intolerances for ambiguity All results were re-ported at the aggregate level
RESULTS
Statistical data analyses were performed on survey data comprised of the following three instruments Langer Mindfulness Scale (LMS14) Tolerance of Ambigu-
ity Scale (TOA) and Resistance to Change (RTC) scale Findings were reported from the analyses of data col-lected from 65 participants responding to the Qualtrics Web-based survey In particular analyses were conducted through bi-variant correlation analyses (also known as Pearsonrsquos r) independent t-tests and Cronbachrsquos alpha The strengths of the relationships were predicated on Co-henrsquos (1988) interpretation Coefficient values between 10 and 29 were considered small or weak those between 30 and 49 were considered moderate and those between 50 and 10 were considered large or strong
Analysis of Each Research Question
The first research question explored the relationship of de-mographic and organizational factors to the psychomet-ric scales of Mindfulness and Tolerance of Ambiguity and their influence on Resistance to Change Descriptive sta-tistics reflected both demographic and organizational fac-tors ndash gender education years at the company and direct reportsmdashfor the 65 employees who participated in the current study The distributions of variables were distrib-uted evenly between only two variables years at the com-pany and direct reports Other demographic variables including ethnicity and age were recorded A statistical analysis was not conducted due to the uneven distribution of the variables Of the 65 participants 59 were Caucasian and the remaining 6 were minorities The ages of the par-ticipants ranged from 28 years to 65 years Additionally frequency distributions and data analyses were not con-ducted for individual sites to protect anonymity All re-sults were reported at the aggregate level and included the following categories for the participating industries Cup Manufacturing Personal Care Manufacturing Con-struction and Rubber to Metal Bonding Manufacturing
Gender Male and Female
Although more than twice as many males than females participated in the current study independent t-tests were conducted to determine whether differences existed be-tween the mean scores of the scales and subscales for male and female employees No statistically significant differ-ences were found between the outcome of the psychomet-ric constructs (Mindfulness and Tolerance of Ambiguity) and Resistance to Change except on one subscale Cogni-tive rigidity revealed a statistical difference between the scores of males (n = 45 M = 381 SD = 063) and females (n = 20 M = 336 SD = 086) t (63) = 234 p = 05 α = 05
Figure 1 Logic model for hypothesized relationships among
Psychometric Constructs Demographic Controls and Degree of Resistance to Change
INDEPENDENT VARIABLES
Degree of Resistance
Demographic Factors
-----
Age Gender
Ethnicity Education
____________
Organizational Factors
----- Years at Current Company Type of Current Position
Type of Industry or Category Number of Direct Reports
Resistance to Change -----
Routine Seeking Emotional Reaction Short-term Focus
Cognitive Rigidity
Tolerance of Ambiguity
----- Novelty
Complexity Insolubility
Mindfulness -----
Novelty Seeking Engagement
Novelty Producing
Brian Dunican amp Ric Keaster Acceptance of Change Exploring the Relationship among Psychometric Constructs and Employee Resistance
34 International Journal of the Academic Business World 35Fall 2015 (Volume 9 Issue 2)
Education
Due to the imbalanced distributions of participants sta-tistical analysis for Education was not performed The frequency distribution reflected that 5231 (34) of the participants possessed a four-year degree 1231 (8) ob-tained a masterrsquos degree or higher 2615 (17) possessed a two-year degree or some college while the reaming 923 (6) were high school graduates
Direct Reports and No Direct Reports
An individual variances t-test was conducted and failed to reveal a statistically reliable difference between the mean scores of salaried employees without direct reports and salaried employees with direct reports As an example scores from routine seeking a subscale of resistance to change were not significantly different between employ-ees without direct reports (n = 32 M = 312 SD = 096) and employees with direct reports (n = 33 M = 291 SD = 085) t (65) = 093 p = 037
Years at the Company
A one-way analysis of variance (ANOVA) was calculated on participantsrsquo ratings of the psychometric constructs and resistance to change as a comparison to the number of years at the company Comparisons indicated no sta-tistically significant differences were presented between groups of 0 to 4 years 5 to 10 years 11 to 20 years and 21 years and greater As an example on novelty-seeking a subscale of the Langer Mindfulness Scale the analysis was not significant between the four groups F(3 61) = 31 p = 82
The second research question used bivariate correlations to determine the strength of the relationships between the psychometric constructs (Mindfulness and Tolerance of Ambiguity) and Resistance to Change including the four subscales All of the Pearson correlations were significant across each of the findings with the exception of the LMS scale and Cognitive Rigidity of Resistance to Change subscale r(65) = -225 p = 072 The overall LMS scales reflected a strong negative relationship r(65) = -530 p lt 001 with the RTC scale The TOA scale revealed a mod-
Table 1 Descriptive Statistics and Correlations among Responses of Tolerance of
Ambiguity Scale Langer Mindfulness Scale and Subscales and Resistance to Change and Subscales
Scales LMS_NS LMS_NP LMS_E TOA_ Tot RTC_RS RTC_ER RTC_STF RTC_CR
LMS_NS (77)
LMS_NP 76 (72)
LMS_E 49 51 (69)
TOA_Tot -48 -53 -32 (72)
RTC_RS -51 -50 -41 65 (85)
RTC_ER -36 -37 -36 41 71 (88)
RTC_STF -53 -47 -38 60 77 80 (90)
RTC_CR -28 -26 -04 44 51 45 41 (86)
of Items 5 5 4 16 5 4 4 4
Mean 598 504 556 376 342 285 367 322
SD 071 94 102 71 110 104 73 81Note N = 65 Cronbachrsquos alpha reliabilities for each dimensionconstruct are listed in parentheses on diagonal Cronbachrsquos Alpha measures indicated a high internal consistency among the items reflected in each scale p lt 05 level (two-tailed) p lt 01 level (two-tailed)
Table 2 Descriptive Statistics and Correlations among Responses of the Total Tolerance of
Ambiguity Scale Langer Mindfulness Scale and Resistance to ChangeLMS_Tot Mean TOA_Tot Mean RTC_Tot Mean
LMS_MeanTotal (86)
TOA_Meantotal -53 (72)
RTC_Meantotal -53 62 (93)Number of items 14 16 17Mean 552 376 301Standard Deviation 75 71 91Note N = 65 Cronbachrsquos alpha reliabilities for each dimensionconstruct are listed in parentheses on diagonal No subscales for Tolerance of Ambiguity were referenced in research Cronbachrsquos Alpha measures indicated a high internal consistency among the items reflected in each scale p lt 05 level (two-tailed) p lt 01 level (two-tailed)
Table 3 Descriptive Statistics and Correlations among Responses Related to Operational and
Demographic Factors Tolerance of Ambiguity Scale Langer Mindfulness Scale and Sub-scales and Resistance to Change and Subscales
ME
AN
SD AG
E
YR
SWR
K
DR
RPT
S
TO
A_M
LMS_
M
LMS_
NS
LMS_
NP
LMS_
E
RT
C_M
RT
C_R
S
RT
C_E
R
RT
C_S
TF
RT
C_C
R
AGE 4571 782 100YRSWRK 1283 943 52 100DRRPTS 1005 2162 -18 01 100TOA_M 376 71 15 11 -02 100LMS_M 552 75 -07 -07 10 -53 100LMS_NS 598 71 -12 -12 04 -48 87 100LMS_NP 504 94 -05 01 18 -53 90 76 100LMS_E 556 102 -01 -10 01 -32 78 49 51 100RTC_M 322 81 -14 -10 -08 62 -53 -51 -48 -37 100RTC_RS 301 91 -13 -07 -04 65 -55 -51 -50 -41 90 100RTC_ER 342 110 -23 -17 -07 41 -43 -36 -37 -36 90 71 100RTC_STF 285 104 -05 00 -06 60 -54 -53 -47 -38 91 77 80 100RTC_CR 367 73 -07 -08 -14 44 -23 -28 -26 -04 65 51 45 41 100
Note N = 65 The correlation coefficient ranges from -1 to +1 with -1 indicating a perfect negative correlation +1 indicating a perfect positive correlation and 0 indicating no correlation
Brian Dunican amp Ric Keaster Acceptance of Change Exploring the Relationship among Psychometric Constructs and Employee Resistance
36 International Journal of the Academic Business World 37Fall 2015 (Volume 9 Issue 2)
erate positive correlation r(65) = 624 p lt001 Further bivariate analyses for LMS explored the strength of the re-lationships between the subscales of the Langer Mindful-ness Scale and the subscales of the Resistance to Change scales The correlational analysis was statistically signifi-cant between all variables except Engagement of the LMS and Cognitive Rigidity of RTC r(63) = -35 p = 781 concluding that the variables were unrelated
The last research question explored the degree of the re-lationship between Mindfulness and Tolerance of Am-biguity Bivariate analyses were used to correlate the re-lationship between the two psychometric constructs The correlations revealed a significantly strong negative rela-tionship between the total mean score of the LMS and the total mean score of the TOA r(63) = -53 p lt 01 The mean scores for each of the LMS subscales compared to the total mean of the TOA showed the following Nov-elty-seeking and TOA r(63) = -48 p lt 01 Novelty-pro-ducing and TOA r(63) = -53 p lt 01 and Engagement and TOA r(63) = -32 p lt 01 It is important to note that higher scores on the Tolerance of Ambiguity scale indicate a greater intolerance of ambiguity Tables 1 and 2 display a descriptive analysis and correlations for each of the scales and subscales The correlations between vari-ables are presented in Table 3
LIMITATIONS OF THE STUDY
Research inherently contains limitations The current study is no exception First the nature of measuring psy-chometrics is subjective Since psychometrics studies mea-sure the way in which individuals think and act (Norton 1975) influences of the organizationrsquos environment could affect individualsrsquo responses to questions Additionally external variables at the time of data collection not related to the study itself can skew the responses and influence the outcomes Other views of limitation rest on the gen-eralizability of the results which may be limited for the following reasons (a) the unit of analysis is at the indi-vidual level (b) data were collected from a limited num-ber of operations within the state of Kentucky through convenience sampling and (c) individual biases that may be introduced at the time of testing
The unit of analysis for data collection rests at the indi-vidual level rather than the group level due to the acces-sibility of the employees Although the survey collection method allows for comparison with larger groups it lim-its the opportunity to explore issues in depth therefore assumptions are made for individuals in similar groups Next the data collected represents limited industries in the state of Kentucky restricting the number of partici-pants and the ability to generalize outcomes to other in-dustries different than those outlined in the current study
Last respondentsrsquo values interests and beliefs regarding the online self-administered surveys may introduce biases unknown by the researcher As a consequence of these limitations and the collection of data during one point in time the results are generalizable only to the groups or populations that are similar to those in the current study
SUMMARY AND CONCLUSION
Change within organizations is inevitable That real-ity will remain constant in organizationsmdashand in onersquos personal and professional life (Conner 1992) The way in which one chooses to cope with change could be a decid-ing factor of success failure or choosing to remain the samemdashwhich in organizations tends to equate with fail-ure particularly if change means simply improving Resis-tance is a natural reaction to change and is part of the hu-man psyche Research and literature support this notion of human nature to resist change and elements related to the process of change (Coch amp French 1948 Conner 1992 Oreg 2003 OrsquoToole 1995 Zander 1950) It is possible that a greater understanding of mindfulness and tolerance of ambiguity could increase the possibilities of new ideas to drive lower resistance to change The current study explored the two psychometric constructs of mind-fulness and tolerance of ambiguity and their relationship to resistance to change within industrial settings Bivari-ate correlations yielded both strong positive and negative correlations among the three scales assessed by salaried employees located across different industries The Langer Mindfulness Scale Budnerrsquos Tolerance of Ambiguity Scale and Oregrsquos Resistance to Change scale were attrib-uted to the foundation of the current study The results contributed to the practical and theoretical significance of individualsrsquo responses to change through the measure-ment of the aforementioned constructs To the extent the findings in the current research could be extrapolated to other industries or organizations a final suggestion should be noted When considering future directions for research related to probing psychometric constructs and resistance to change the current study may have relevance across different nationalities and cultures The elements of change will continue to challenge the fabric of organiza-tions while the internal and external pressures of rising costs variations in supply and demand relentless compe-tition and developing technology test the resolve for sur-vival The readiness of individuals within organizations and their ability to challenge perceptions of change and resistance may determine their competitiveness and ulti-mately their success
REFERENCES
Argyris C amp Schon D (1978) Organizational learning A theory of action research Reading MA Addison-Wesley
Armbruster H Bikfalvi A Kinkel S amp Lay G (2008) Organizational innovation The challenge of measur-ing non-technical innovation in large-scale surveys Technovation 28(10) 644-657
Armenakis A A amp Bedeian A G (1999) Organiza-tional change A review of theory and research in the 1990s Journal of Management 25 293-315
Armenakis A A Harris S G amp Mossholder K W (1993) Creating readiness for organizational-change Human Relations 46(6) 681-703
Banning K C (2003) The effect of the case method on tolerance for ambiguity Journal of Management Edu-cation 27 556-567
Bodner T E amp Langer E J (2001 June) Individual differences in mindfulness The MindfulnessMind-lessness Scale Poster presented at the 13th annual American Psychological Society Conference Toronto Ontario Canada
Bovey W H amp Hede A (2001) Resistance to organisa-tional change The role of defence mechanisms Journal of Managerial Psychology 16(7) 534-548
Brown K W amp Ryan R M (2003) The benefits of be-ing present Mindfulness and its role in psychological well-being Journal of Personality and Social Psychol-ogy 84 822-848 doi1010370022-3514844822
Brown K W amp Ryan R M (2004) Perils and promise in defining and measuring mindfulness Observations from experience Clinical Psychology Science and Practice 11(3) 242-248 doi101093clipsybph078
Budner S (1962) Intolerance of ambiguity as a personal-ity variable Journal of Personality 30 29-59
Burke W W (2014) Organizational change theory and practice Thousand Oaks CA Sage Publications Inc
Carson S H amp Langer E J (2006) Mindfulness and self-acceptance Journal of Rational-emotive and Cog-nitive-behavior Therapy 24(1) 29-43
Coch L amp French J (1948) Overcoming resistance to change Human Relations 1 512-532
Coghlan D (1993) A person-centred approach to deal-ing with resistance to change Leadership amp Organi-zation Development Journal 14(4) 10-14
Cohen J (1988) Statistical power analysis for the behav-ioral sciences Hillsdale NJ Lawrence Erlbaum Associates
Conner D R (1992) Managing at the speed of change How resilient managers succeed and prosper where others fail New York Random House
Demers C (2007) Organizational change theories Thousand Oaks CA Sage Publications Inc
Dent E B amp Goldberg S G (1999) Resistance to change A limiting perspective Journal of
Ehrlich S B Meindl J R amp Viellieu B (1990) The charismatic appeal of a transformational leader An empirical case study of a small high-technology con-tractor The Leadership Quarterly 1(4) 229-247
Ford J D Ford L W amp McNamara R T (2002) Re-sistance and the background conversations of change Journal of Organizational Change Management 15(2) 105-121
Frenkel-Brunswik E (1948) Tolerance toward ambigu-ity as a personality variable American Psychologist 3 268-269
Furnham A amp Ribchester T (1995) Tolerance of am-biguity A review of the concept its measurement and applications Current Psychology 14 179-199
Gaumlrtner C (2013) Enhancing readiness for change by enhancing mindfulness Journal of Change Manage-ment 13 52-68
Geller E S (2002) Leadership to overcome resistance to change It takes more than consequence control Jour-nal of Organizational Behavior Management 22(3) 29-49
Gondo M Patterson K W amp Palacios S (2013) Mind-fulness and the development of a readiness for change Journal of Change Management 13(1) 36-51
Greenwood R amp Hinings C R (1996) Understanding radical organizational change Bringing together the old and the new institutionalism Academy of Manage-ment Review 21 1022-1054
Isabella L (1990) Evolving interpretations as a change unfolds How managers construe key organization-al events Academy of Management Journal 33 7-41
Iverson R D (1996) Employee acceptance of organiza-tional change The role of organizational commitment International Journal of Human Resource Manage-ment 7 122-149
Jacobs P (2005) Five steps to thriving in times of un-certainty Harvard Management Update 10(12) 3-5
Brian Dunican amp Ric Keaster
38 Fall 2015 (Volume 9 Issue 2)
Retrieved from httphbrorgproductfive-steps-to-thriving-in-times-of-uncertaintyanU0512A-PDF-ENG
Judge T A Thoresen C J Pucik V amp Welbourne T M (1999) Managerial coping with organization-al change A dispositional perspective Journal of Ap-plied Psychology 84 107-122
Judson A (1991) Changing behavior in organizations Minimizing resistance to change Cambridge MA Basil Blackwell
Kanter R M (1985) Supporting innovation and ven-ture development in established companies Journal of Business Venturing 1 47-60
Kets de Vries M F R Ramo L amp Korotov K (2009) Organizational culture leadership change and stress INSEAD Working Papers Collection 10 2-26 Re-trieved from httpwwwinseadedufacultyresearchresearchdoccfmdid=41924
Kotter J P (1995) Leading change Why transformation efforts fail Harvard Business Review 73(2) 59-67
Lane M S amp Klenke K (2004) The ambiguity toler-ance interface A modified social cognitive model for leading under uncertainty Journal of Leadership amp Organizational Studies 10(3) 69-81
Langer E J (1993) A mindful education Educational Psychologist 28 43-50
Langer E J (1997) The power of mindful learning Read-ing MA Addison-Wesley
Lawrence P R (1954) How to deal with resistance to change Harvard Business Review 32(3) 49-57 Retrieved from httpedsaebscohostcomlib-srvwkueduehostpdfviewerpdfviewervid=6ampsid =699bab3d-bcec-40d9-ac69-a42c853d72bc40sessionmgr4004amphid=4108
Lewin K (1947) Frontiers in group dynamics II Chan-nels of group life social planning and action research Human Relations 1(2) 143-153
Lewin K (1951) Field theory in social science Selected theoretical papers New York Harper amp Row
Limerick D Passfield R amp Cunnington B (1994) Transformational change Towards an action learning organization The Learning Organization 1(2) 29-40
Mabin V J Forgeson S amp Green L (2001) Harness-ing resistance Using the theory of constraints to assist change management Journal of European Industrial Training 25(234) 168-191
Maurer R (2009) Introduction to change without mi-graines Omaha NE Maurer and Associates Re-trieved from httpextensionmissouriedustaffsde-teams DocumentsChangeW-outMigrarainespdf
Norton R W (1975) Measurement of ambiguity toler-ance Journal of Personality Assessment 39 607-619
Offermann L R amp Gowing M K (1990) Organiza-tions of the future Changes and challenges Ameri-can Psychologist 45(2) 95-108 doi10370003-066X45295
Oreg S (2003) Resistance to change Developing an in-dividual differences measure Journal of Applied Psy-chology 88 680-693
Oreg S (2006) Personality context and resistance to organizational change European Journal of Work and Organizational Psychology 15 73-101
Oreg S Vakola M amp Armenakis A (2011) Change re-cipientsrsquo reactions to organizational change A 60-year review of quantitative studies The Journal of Applied Behavioral Science 47 461-524
OrsquoToole J (1995) Leading change The argument for val-ues-based leadership Boston MA Ballentine Books
Pirson M Langer E J Bodner T amp Zilcha-Mano S (2012) The development and validation of the Langer Mindfulness Scale-Enabling a socio-cognitive perspec-tive of mindfulness in organizational contexts Ford-ham University School of Business Research Paper Re-trieved from httpdxdoiorg102139ssrn2158921
Stanley D J Meyer J P amp Topolnytsky L (2005) Employee cynicism and resistance to organizational change Journal of Business and Psychology 19(4) 429-459
Topping P (2002) Managerial leadership New York McGraw Hill Professional
Van Dam K Oreg S amp Schyns B (2008) Daily work contexts and resistance to organisational change The role of leader-member exchange development climate and change process characteristics Applied Psycholo-gy An International Review 57 313-334 doi101111j1464-0597200700311x
Weinstein N Brown K W amp Ryan R M (2009) A multi-method examination of the effects of mindful-ness on stress attribution coping and emotional well-being Journal of Research in Personality 43 374-385
Zander A F (1950) Resistance to change Its analysis and prevention Advanced Management 4(5) 9-11
International Journal of the Academic Business World 39
INTRODUCTION
Cloud computing is one of the most talked about infor-mation technology topics these days 7 24 Early literature review reveals an endemic confusion of what cloud com-puting is does and what it stands for We posit that the cloud metaphor 3 20 fosters a confusion that persists even today
The goal of this research paper is to look back and make historical sense of cloud computing We try to find the lineage of cloud computing where the phrase cloud com-puting came from who came up with the term and how it found currency in the IT community We trace cloud computing to early timesharing and Application Service Provider (ASP) in the last decade and posit a future of utility computing
Additionally we try to shed light on the current state of cloud computing provide a comprehensive definition of the term and its main building blocks
CLOUD COMPUTING IN THE ACADEMIC LITERATURE
A metaphor
In an article by Ian Foster and Steven Tuecke 3 the authors start by describing the well-known elephant fable where a group of blind people are asked to describe an elephant and not surprisingly each provides a different view
The cloud is a metaphor for the Internet Itrsquos a rebranding of the Internet that is why there is a raging debate By vir-tue of a metaphor itrsquos open to different interpretations 20
Confusion and Frustration
The word ldquocloudrdquo in cloud computing informs very little and it may even misinform ldquoI hated it but I finally gave inrdquo says Carl Bass President and CEO of Autodesk He adds ldquoI didnrsquot think the term helped explain anything to people who didnrsquot already know what it isrdquo20
Giving the lsquocloudrsquo name to the old concept of large shared distributed systems is misleading 4 p 26
Larry Ellison Oraclersquos CEO ldquoThe interesting thing about cloud computing is that wersquove redefined cloud computing everything that we already dohellipI donrsquot understand what we would do differently in light of cloud computing other than change the wording of some of our adsrdquo 1 p 50
In an article in Harvard Business Review (HBR) 22 the author asks a rhetorical question ldquoWhat the heck does it mean to have a lsquocloudrsquo It means that the functions you want like storage communications and applications donrsquot need to live on the device you have in front of you You can get them on demand from the networkrdquo We should ask the question ldquoin a typical non-cloud IS en-vironment do we really have the stated functions on the device in front of usrdquo
Cloud Computing is often confused with Utility Com-puting but they are not the samemdashrather the latter forms part of the former 2
No Definition
Realizing the elephantine nature of cloud computing there is a reluctance to define it Question How would you define cloud computing Answer Cloud computing
The Origin and Construct of Cloud Computing
Nozar Daylami PhD Adjunct Professor
School of Management Information System and Technology Program
California Lutheran University Thousand Oaks CA 91360
ABSTRACTCloud computing is one of the most talked about information technology topics these days A literature review reveals an endemic confusion of what cloud computing stands for This paper tries to shed light on why the term is so confusing We try to find where the phrase cloud computing came from and how it found currency in the IT community We trace cloud computing to early timesharing and Application Service Provider (ASP) in the last decade and posit a future of utility computing This paper also provides a comprehensive definition of the term and its main building blocks
Nozar Daylami The Origin and Construct of Cloud Computing
40 International Journal of the Academic Business World 41Fall 2015 (Volume 9 Issue 2)
is not so much a definition of a single term as it is a trend in service delivery taking place today 3 p 52
An Old Concept
Cloud computing is an old concept it ldquois a throwback to the mainframe model of computingrdquo 19 p 78 Clearly cloud computing is simply remote computing 4 p 26
Internet or Network Computing
Cloud computing as a term for Internet-based computing service was launched by industry giants Google Ama-zon etc in late 2006 24 ldquoIt is the movement of applica-tion services onto the Internet and the increased use of the Internethelliprdquo
The Earliest Publications
In the first article on Cloud Computing in the Communi-cations of ACM 9 it is referred to as ldquothe compute cloudrdquo and is deemed synonymous with ldquoon-demand comput-ing software as a service or the Internet as a platformrdquo Though these other naming conventions are self-explana-tory cloud computing is not
The cloud computing is understood as a shift of the ge-ography of computing It begs the question if it is about moving delivery of a wide variety of information services onto to the Internet why donrsquot we call it ldquoInternet Com-putingrdquo
The first time cloud computing showed up in a HBR pub-lication was in a digital article in April 2008 14 The au-thor states that the move to cloud computing would be disruptive to incumbent players of shrink-wrapped gam-ing software assuming his readers understand what cloud computing entails
A BRIEF HISTORY OF COMPUTING
In the early days of computers they were big and expen-sive So sharing this big expensive gadget was a normal practice Most organizations did not usually own this big machine but those who did had to share it across an en-terprise That was the era of timesharing
However as computers got cheaper and more afford-able every company every department and then finally every person decided to have their own computer How-ever standalone computers are of limited use So we networked them first locally in a Local Area Network (LAN) environment and then far and wide Wide Area
Network (WAN) Then we networked the network and the World Wide Web was born
At the same time in a different parallel universe some-thing else was happening In the early years no commer-cial off-the-shelf software (COTS) was available Every organization had to write its own software program So if you wanted to computerize your accounting general led-ger payables and receivables or run your inventory you had to write your own applications
Buying off-the-shelf applications was also considered ldquooutsourcingrdquo Why Because you were having others do the work for your organization which was supposed to be doing this work for itself So over the years most appli-cation development have been outsourced to burgeoning software companies such as IBM Oracle and SAP
OUTSOURCING AND ASP
In a general sense IS outsourcing is nothing newmdashit has always been considered an option for IT solutions 11 Electronic Data Systems was handling data processing services for Frito-Lay and Blue Cross as early as 1963 IS outsourcing soon became widely known as the second of a three-phase outsourcing phenomenonmdashtraditional out-sourcing being the first phase and application outsourcing being the third 6
In the early years of the last decade xSPs service provid-ers of all stripes were leading into a new generation of IT where it really did not matter where the applications reside as long as we had access to accomplish what we wanted 247 However back then an Application Service Provider (ASP) was thought by some to be another re-incarnation of the old ldquotimesharingrdquo leveraging network technologies 22
However the understanding of an evolving net-centric computing was already there In their book published in 2002 aptly titled NetSourcing authors Kern Lacity and Willcocks 7 define a computing framework and services stack thatrsquos similar to Cloud Computing The authors state ldquoWe selected the term ldquoNetsourcingrdquo as the over-arching name because the common element of any xSP is the delivery of a product or service over a networkrdquo (p 3) The ldquonetworkrdquo however is now synonymous with the ldquoInternetrdquo
Today cloud computing is about getting the job done in whatever way shape or form that may be required Orga-nizations and individuals need the utility of computing and where it comes from by and large is of no concern As early as 1961 Professor John McCarthy predicted that computation may someday be organized as a public utility ldquoEach subscriber needs to pay only for the capac-
ity he actually uses but he has access to all programming languages characteristics of a very large system hellip Certain subscribers might offer services to other subscribers hellip The computer utility could become the basis of a new and im-portant industry 8 McCarthyrsquos notion of ldquoutility comput-ingrdquo is here right nowmdashthat is ldquocloud computingrdquo
This point is confirmed by others 1 p 51 ldquoThe data center hardware and software is what we consider a cloud When a cloud is made available in a pay-as-you-go manner to the general public we call it utility computingrdquo
CLOUD COMPUTING ORIGIN OF THE PHRASE
Coinage of the term ldquocloud computingrdquo has been traced to two individuals who at the time they came up with this term worked for Compaq Computer George Favaloro a Compaq marketing executive and Sean OrsquoSullivan the founder of the now defunct business NetCentric 20
A Compaq internal document marked as confiden-tial dated November 14 1996 and provided by Sean OrsquoSullivan contemplates a Cloud Computing ldquostrat-egyrdquo10
But the creation of this term did not find currency for another decade Many believe the first use of ldquocloud com-
putingrdquo in its modern context occurred on August 9 2006 when then Google CEO Eric Schmidt introduced the term at an industry conference ldquoWhatrsquos interesting [now] is that there is an emergent new modelrdquo Schmidt said ldquoI donrsquot think people have really understood how big this opportunity really is It starts with the premise that the data services and architecture should be on servers We call it cloud computingmdashthey should be in a ldquocloudrdquo somewhererdquo 19
CLOUD COMPUTING DEFINITION
The National Institute of Standards and Technology (NIST SP 800-145) defines Cloud Computing in the fol-lowing way ldquoCloud computing is a model for enabling convenient on-demand network access to a shared pool of configurable computing resources (eg networks serv-ers storage applications and services) that can be rapidly provisioned and released with minimal management ef-fort or service provider interaction This cloud model is composed of five essential characteristics three service models and four deployment modelsrdquo 17
The following diagram places all the pieces together in a visual form
The Conceptual Reference Model
Cloud Computing Reference Architecture NIST Special Publication 500-292
Nozar Daylami The Origin and Construct of Cloud Computing
42 International Journal of the Academic Business World 43Fall 2015 (Volume 9 Issue 2)
Cloud Computing Reference Architecture NIST Special Publication 500-292
NIST Special Publication 500-292 states that ldquothe defini-tion is widely accepted as a valuable contribution toward providing a clear understanding of cloud computing tech-nologies and cloud services It provides a simple and un-ambiguous taxonomy of three service models available to cloud consumers cloud software as a service (SaaS) cloud platform as a service (PaaS) and cloud infrastructure as a service (IaaS) It also summarizes four deployment mod-els describing how the computing infrastructure that delivers these services can be shared private cloud com-munity cloud public cloud and hybrid cloudrdquo 18 Finally the NIST definition also provides a unifying view of five essential characteristics that all cloud services exhibit on-demand self-service broad network access resource pool-ing rapid elasticity and measured service 18
This publication further states that ldquoThese services and their delivery are at the core of cloud computing In the cloud computing model the primary focus is a more eco-
nomic method of providing higher quality and faster ser-vices at a lower cost to the usersrdquo
The Cloud Security Alliance 21 provides a more transpar-ent narrative of what Cloud Computing is ldquoa model for enabling ubiquitous convenient on-demand network access to [a] shared pool of configurable computing re-sources [it] has the potential to enhance collaboration agility scaling and availability and provides opportunity for cost-reduction the model envisages a world where components can be rapidly orchestrated provisioned implemented and decommissioned scaled up or down to provide an on-demand utility-like modelrdquo
A SPATIAL VIEW OF CLOUD COMPUTING
The NIST Computing Reference Architecture is a flat depiction of the cloud computing model A three dimen-sional view of the model by Craig-Wood 2 is a spatial de-piction Here you can see the three dimensions of cloud computing that renders the elephant fable
Computing Services Framework
Infrastructure as a Service (IaaS) As the word ldquoinfra-structurerdquo implies this is the most basic of services Cus-tomers can buy processing storage and network services and then build their own systems on top of this infra-structure A pioneer in the IaaS field is Amazon with its Amazon Elastic Compute Cloud (EC2)
However most big names in the IT field from Micro-soft (Azure) to Google (App Engine) provide IaaS Here customers are not renting specific servers hard drives and network switches or any particular equipment but instead they are utilizing the infrastructure that is most certainly simulated by virtualization software allowing multiple customers to be served by the same array of physi-cal devices IaaS provides the raw power of computingmdashstorage included
Cloud Computing would not be possible without virtu-alization Virtualization is the ability to make a virtual machine (VM) act like a physical computer Just like a physical computer with its own processor operating sys-tem and storage each VM has its own components too The benefit of virtualization though is that you can put much more than only one VM even with different oper-ating systems on the same server Doing so dramatically increases each serverrsquos potential for serving clientsrsquo on-demand needs (8)
Platform as a Service (PaaS) The next level up is where vendors provide not only the raw powermdashthe infrastruc-turemdashbut preconfigured systems running operating sys-tems databases and platforms (programming languages) for building applications For example Microsoftrsquos Azure service provides preconfigured computers running Win-dows and SQL Server And Salesforcecom has Forcecom as its own custom application development platform
In practice the boundary between IaaS and PaaS is not always clear Because IaaS providers most often provide other services such as operating systems database or ap-plication development platform that fall in the PaaS cat-egory In its purest form IaaS can be considered as virtual machines (raw processing power and storage) that can be scaled up and down as you need
Software as a Service (SaaS) Another higher layer is where vendors provide full applications running on cloud infrastructuremdashtheir own or rented from the likes of Amazon Salesforcecom has long been considered one of the most successful SaaS provider Salesforececom CRM was one of the early entrants into the market Salesforcecom prides itself on being a pioneer in Cloud Computing
At Salesforcecom itrsquos all about the Cloud However in their collateral literature dated circa 1993-94 you wonrsquot find any mention of the word ldquocloudrdquo
CLOUD COMPUTING CONCERNS
In survey after survey security is listed as the top concern of Cloud Computing However Cloud Security Alliance (CSA) the industry group that provides security guide-lines and education states that ldquosecurity controls for the cloud computing are for in most part no different than the security controls in any IT environment hellip[however] cloud computing may present different risks to an organi-zation than traditional IT solutionsrdquo 21 p 21
CIOs or CEOs for that matter may feel safer when they ldquoownrdquo versus ldquorentrdquo their IT assets However when you deploy your assets on the Internet for which you eventu-ally will have little choice you will inherit a set of vulner-abilities that are not all that different from the Cloudrsquos Ownership has its own set of financial risks in the form of capital expenditures (CAPEX) that need to be budgeted and spent up front Compare that risk with the far smaller risk of renting (OPEX) which by and large can be dis-continued if needed
Cloud computing technology does not require the use of public networks If your data is too strategically critical and sensitive to be deployed on the Internet you could instead deploy a private cloud that is strictly for your or-ganization Obviously a Private Cloud is more expensive and it needs trained staff However a private cloud lets an organization benefit from cloud technology without the risk of possible public disclosure of its data
Another alternative could be a community cloudmdasha pri-vate cloud that is shared by several organizations for spe-cific needs For example a group of hospitals might create a community cloud to hold patientrsquos medical records
CONCLUSION
Cloud Computing is here to stay and grow Clouds are more versatile than traditional IT networks on many di-mensions They are far more convenient to deploy they have far more potential for collaboration and they are far more scalable than traditional IT ever was The delivery of services is provisioned on global telecommunication net-works that these days have morphed into the Internet And when they mature they will provide a computing utility when and where it is needed
Cloud computing model (adapted from Craig-Wood)
Nozar Daylami The Origin and Construct of Cloud Computing
44 International Journal of the Academic Business World 45Fall 2015 (Volume 9 Issue 2)
BIBLIOGRAPHY
1 Armburst M et al A View of Cloud Computing Communications of the ACM Vol 53 No 4 pages 50-58
2 Craig-Wood K Definition of Cloud Computing incorporating NIST and G-Cloud views httpswwwkatescommentcomdefinition-of-cloud-com-puting-nist-g-cloud Access date April 26 2015
3 Creeger M CTO Roundtable Cloud Computing Communications of the ACM Vol 52 No 8 pages 50-56
4 Cusumano M Cloud Computing and SaaS as New Computing Platforms Communications of the ACM Vol 53 No 4 pages 27-29
5 Foster Ian and Tuecke Steven Describing the Ele-phant The Different Faces of IT as Service wwwac-mqueuecom JulyAugust 2005 pages 26-34 httpdeliveryacmorg10114510900001080874p26-fosterpdf ip=99100108167ampid=1080874ampacc=OPENampkey=4D4702B0C3E38B352E4D4702B0C3E38B352E4D9421298D07BF362E6D218144511F3437ampCFID=505172814ampCFTOKEN=56369758amp__acm__=1429816554_402a40f1d60056fb68e8ccf3fdd96201 accessed April 23 2015
6 Kern Thomas Lacity Mary Cecelia Willcocks Leslie P Netsourcing Renting Business Applica-tions and Services Over a Network Prentice Hall 2002
7 Knoblauch A Deconstructing Cloud Smashwords Edition (Kindle Version) First Edition August 2013
8 Garfinkel Simon (2011 Oct 3) The Cloud Imperative MIT Technology Review httpwwwtechnologyreviewcomnews425623the-cloud-imperative
9 Hayes B Cloud Computing Communications of the ACM Vol 51 No 7 pages 9-11
10 Internet Solution Division Strategy for Cloud Com-puting Compaq Computer Corporation (1996) httpwwwtechnologyreviewcomsitesdefaultfileslegacycompaq_cst_1996_0pdf
11 Lacity M C Hirschheim R Information Systems Outsourcing Myths Metaphors and Realities New York John Wiley amp Sons 1993
12 McAfee A The Year the Cloud Rolled In httpshbrorg2010122010-the-year-the-cloud-rolled Access date April 23 2015
13 McAfee A What Every CEO Needs to Know About the Cloud httpshbrorg201111what-every-ceo-needs-to-know-about-the-cloud Access date April 23 2015
14 McGrath R Whorsquos Disrupting the Gaming Indus-try httpshbrorg200804whos-disrupting-the-gaming-ind Access date April 23 2015
15 Mell P Grance T The NIST Definition of Cloud Computing National Institute of Standards and Technology httpcsrcnistgovpublicationsnist-pubs800-145SP800-145pdf
16 Neumann P Risks and Myths of Cloud Comput-ing and Cloud Storage Communications of the ACM Vol 57 No 10 pages 25-27 The NIST Defi-nition of Cloud Computing httpcsrcnistgovpublicationsnistpubs800-145SP800-145pdf
17 NIST Definition of Cloud Computing httpcsrcnistgovpublicationsnistpubs800-145SP800-145pdf
18 NIST Cloud Computing Reference Architecture National Institute of Standards and Technology Special Publication 500-292 httpwwwnistgovcustomcfget_pdfcfmpub_id=909505
19 Nanavati M Colp P Aiello W and Warfield A Cloud Security A Gathering Storm Communica-tions of the ACM Vol 57 No 8 pages 70-79
20 Regalado Antonio (2011 Oct 31) Who coined cloud computing MIT Technology Review httpwwwtechnologyreviewcomnews425970who-coined-cloud-computing
21 Security Guidance for Critical Areas of Focus in Cloud Computing V30 Cloud Security Alliance httpscloudsecurityallianceorgguidancecsagu-idev30pd
22 Seviokla J Does Cisco Have Its Head in the Clouds httpshbrorg200903does-cisco-have-its-head-in-th Access date April 23 2015
23 Walsh K R Analyzing the Application ASP Concept Technologies Economies and Strategies Communications of ACM Vol 46 No 8 pages 103-107
24 Yang H Tate Mary A Descriptive Literature Review and Classification of Cloud Computing Re-search Communications of Association of Informa-tion Systems Vol 31 2012
Nozar Daylami
46 Fall 2015 (Volume 9 Issue 2)
This page intentionally blank
International Journal of the Academic Business World 47
INTRODUCTION
In their paper ldquoSAS and the Efficient Portfoliordquo Thomp-son and El-houbi (2012) develop a SAS program to calcu-late portfolio weights for efficient stock portfolios Their program improves on existing public domain SAS pro-grams of this type by allowing for portfolios with a rela-tively large number of securities Thompson and El-houbi also claim that their SAS program is an improvement over the Excel programs used to calculate portfolio weights which are sometimes included in investment textbooks They note that users concur that their program is easier to use than those Excel programs which either limit the number of securities that can be included in a portfolio require ldquocorrectionsrdquo or ldquoadjustmentsrdquo to overcome some quirks in the Excel Solver routine or require multiple user interventions
The Thompson and El-houbi program is certainly more elegant and user friendly than the equivalent Excel pro-grams and will provide those with access to the SAS pro-gramming language a valuable tool for learning portfolio management The disadvantage of a SAS program how-ever is that many students will not have easy access to the SAS programming language Students at smaller univer-sities may not have any access to SAS while students at many larger universities may only be able to access SAS at a computer lab on campus
In this paper I modify the Thompson and El-houbi SAS program for use in the open-source R programming lan-guage which is available free of charge for anyone with access to the internet Using the R language program to compute portfolio weights for efficient portfolios main-tains the elegance of the Thompson and El-houbi SAS
program while overcoming the disadvantage of limited SAS availability In addition I extend the Thompson and El-houbi program by making use of a quadratic program-ming package available in R to provide a program that can accommodate short-sale restrictions and position limits
THE R PROGRAMMING LANGUAGE
R is a free programming language for statistical analysis and graphics and runs on many UNIX platforms and on Windows and MacOS It is available under the terms of the Free Software Foundationrsquos GNU General Public License R was developed initially by Robert Gentleman and Ross Ihaka both of the University of Auckland (New Zealand) and is based on the S programming language developed at Bell Labs by John Chambers Since its initial development the popularity of R has grown considerably largely because of its ease of use and because of the avail-ability of many add-on packages that allow users to tackle very sophisticated projects
The base R package may be downloaded at httpcranusr-projectorg That web page also provides links to sources of information about R and basic user manuals There are also many books and manuals now available for purchase that offer information on both basic and special-ized uses of the language In fact Vance (2009) suggests that the growing popularity of the R language at univer-sities language could even result in noticeably lower de-mand for SAS
THE MARKOWITZ PORTFOLIO PROBLEM
As Markowitz (1952) notes an investor following the ldquoex-pected returns-variance of returns rulerdquo will choose an ef-
Optimal Portfolios and the R Programming Language
James A TurnerAssistant Professor of Finance
School of Accounting amp TaxationWeber State University
Ogden UT 84408
ABSTRACTThis paper develops a program in the freely available open-source R programming language to calculate weights for optimal stock portfolios The program retains the advantages the Thompson and El-houbi (2012) SAS program has over similar programs in Excel but avoids the potential problem of limited access to SAS that some students and researchers may face The R program also extends the Thompson and El-houbi program by including the ability to accommodate short-sale restrictions and position limits
James A Turner Optimal Portfolios and the R Programming Language
48 International Journal of the Academic Business World 49Fall 2015 (Volume 9 Issue 2)
ficient portfolio that is a portfolio with maximum ex-pected return for a given variance or one with minimum variance for a given expected return The minimum vari-ance formulation of the portfolio choice problem there-fore requires that the investor choose portfolio weights to minimize the variance of a portfolio with a given expected return The problem also requires that all money be in-vested (which means that the portfolio weights must sum to one) In matrix notation the optimization problem is
where w the choice variable is a k times 1 vector of the weights invested in the k securities in the portfolio V is the port-folio variance-covariance matrix and R is a 2 times k matrix whose first row is a vector of ones and whose second row contains the expected returns of each security in the port-folio M is a 2 times 1 vector whose first element is one (corre-sponding to the constraint that the portfolio weights sum to one) and whose second element is the chosen portfo-lio expected return For now there are no restrictions on short sales so some portfolio weights may be negative
The Lagrangian for the problem is
( ) L w Vw M Rwλprime prime= + minus
where λ is a 2 times 1 vector containing the Lagrangian multi-pliers The first-order conditions for a minimum (which are also sufficient conditions in this case) are
Solving the first-order conditions for w and λ yields
( )( )
11 1
112
w V R RV R M
RV R Mλ
minusminus minus
minusminus
prime prime=
prime=
Thompson and El-houbi following Stephens (1998) let 1 H RV Rminus prime= so that
1 1
1
2
w V R H MH Mλ
minus minus
minus
prime=
=
Stephens (1998 p 36) shows how the elements of the H matrix may be used ldquoto fix any meanvariance point on the efficient frontierrdquo
Min st
w VwRw M
prime
=
2 0
0
L Vw RwL M Rw
λ
λ
part prime= minus =partpart
= minus =part
THE BASIC R PORTFOLIO OPTIMIZATION PROGRAM
The R programming language lends itself very easily to matrix manipulation and matrix computation removing much of the difficulty in solving the standard Markowitz portfolio problem The following R program calculates the portfolio weights for an efficient portfolio using stock return data to estimate expected returns and the variance-covariance matrix The user must specify the desired port-folio expected return The program can accommodate portfolios up to about 50 stocks Beyond that number precision limitations of the R language may make the variance-covariance matrix ldquocomputationally singularrdquo and unable to be inverted
The first step in the program is to read in the return data R can input data from many file types but in the present example the data are stored in a comma-delimited Excel file called ldquoReturnscsvrdquo which contains stock return data In this case the Excel file includes a header row labeling each column of returns with identifying information but no row names The program first reads in the data and then determines the number of securities (number of col-umns in the matrix) as shown on the facing page
ADDING SHORT-SALE CONSTRAINTS AND POSITION LIMITS
The above formulation of the portfolio choice problem places no restrictions on short sales and does not accom-modate position limits In reality individual investors and some fund managers may face requirements prohibit-ing short sales Fund managers may also face requirements that either limit the amount that may be invested in one security or sector or instead that a minimum percentage of funds be invested in a certain security or sector Dai Lin and Liu (2011) list several examples of real-world po-sition limits such as a requirement that a small-cap mutu-al fund invest at least a minimum percentage of its funds in small-company stocks In mathematical terms these short-sale restrictions and position limits can be expressed as a series of inequality constraints While reformulating the portfolio choice problem to add inequality constraints is not difficult doing so makes actually solving the prob-lem considerably more difficult
With short-sale restrictions and position limits the port-folio choice problem becomes
0
Min st
w VwRw MSw w
prime
=ge
where w is still the choice variable S is an m times k matrix that defines both the short-sale constraints on the k se-curities in the portfolio and m minus k other restrictions If there are short-sale constraints but no other restrictions the S matrix is simply a k times k identity matrix which when multiplied by the vector w results in the requirement that
0 iw ige forall If there are other restrictions the sub-matrix of S consisting of the first k rows and k columns of S is an identity matrix and the other restrictions are specified by suitable choices of the elements of the remaining rows of S For example suppose there is a position limit placing a maximum of p on the percentage invested in the sev-enth security so that 7 w ple Since the constraints in the optimization problem above have been expressed as non-negativity constraints this position limit must instead take the form 7 w pminus ge minus The row of S corresponding to
the position limit will consist entirely of zeros except for the seventh element which will be minus1 and corresponding element of the w0 vector would be p
Introducing other forms of position limits simply requires adding the appropriate rows to the S matrix For example if there is a requirement that the total percentage invested in the first and third securities equal or exceed a certain percentage q then one row of S should be [1 0 1 0 0]and the corresponding element of the w0 vector would be q If there is instead a requirement that the total percentage invested in the first and third securities not exceed a cer-tain amount q the required row of S would be [-1 0 -1 0 0] and the corresponding element of the w0 vector would be minusq Other restrictions may be specified similarly For problems that include position limits each of the first k el-
The BASIC R Portfolio Optimation Program
Returns ltminus readtable(ldquoReturnscsvrdquo header = TRUE sep = ldquordquo)Rmat ltminus asmatrix(Returns) Converts the data to matrix formk ltminus ncol(Rmat) Number of columns (number of securities in the portfolio) Now the program calculates the estimate of the variance-covariance matrix (V) the M vector and the R matrix which includes the estimate of the expected returns
V ltminus var(Rmat) Calculates the sample variance-covariance matrix which is used as the estimate of the variance-covariance matrix
Erp ltminus 001 Sets the desired expected portfolio return The user can change this value as desired
M ltminus rbind(1 Erp) Ones ltminus rep(1 k) Ravg ltminus colMeans(Rmat)
Defines the M matrix including the required portfolio return Defines a 1 x k matrix of ones Calculates average returns by column giving a 1 x k matrix of estimated expected returns
R ltminus rbind(Ones Ravg) Combines Ones and Ravg into the 2 x k matrix R Finally the program calculates the portfolio weights and the portfolio variance
VINV ltminus solve(V) Calculates the inverse of the estimated variance-covariance matrixH ltminus RVINVt(R) Calculates the H matrixHINV ltminus solve(H) Calculates the inverse of Hw lt- VINVt(R)HINVM Calculates the portfolio weightsPvar lt- t(w)Vw Calculates the portfolio variance The following commands display the results of the calculations
print(w) Prints the elements of the w vectorprint(Pvar) Prints the variance of the portfolio formed using the weights w
James A Turner Optimal Portfolios and the R Programming Language
50 International Journal of the Academic Business World 51Fall 2015 (Volume 9 Issue 2)
ements of the w0 vector will be zero corresponding to the non-negativity constraints and the remaining elements will equal the percentages associated with the position limits entered as positive or negative numbers depend-ing on whether the position limits establish minimums or maximums
The Lagrangian for this problem is
( ) ( )0 L w Vw M Rw w Swλ microprime prime prime= + minus + minus
where λ is a 2 times 1 vector containing the Lagrangian multi-pliers on the equality constraints and micro is an m times 1 vector of the Lagrangian multipliers on the k short-sale constraints and the m ndash k position limits The first-order necessary con-ditions for this problem are the Kuhn-Tucker conditions
( )0 0
2 0
0
0 0 and 0
L Vw R SwL M Rw
L w Sw w Sw
λ micro
λ
micro micromicro
part prime prime= minus minus =partpart
= minus =partpart prime= minus le ge minus =part
The final set of conditions are known as the complementa-ry slackness conditions since if an element of partLpartμ does not equal zero (ie if the required condition is slack) then the corresponding element of micro must equal zero and vice versa Because of the complementary slackness conditions in order to find a solution to the optimization problem each condition must be checked individually to deter-mine the possible solutions If there are more than a very few constraints finding the candidate solutions manually becomes extremely tedious
Fortunately it is possible to use numerical methods to solve this type of non-linear programming program This is where the strength of the R programming language be-comes very evident The R language provides access to an extensive number of add-on packages developed by R us-ers around the world In particular there are several pack-ages that implement numerical methods to find solutions to optimization problems with inequality constraints Perhaps the package that most easily lends itself to solv-ing the current problem is the ldquoquadprogrdquo package Ac-cording to the documentation included with the pack-age the quadprog routine ldquoimplements the dual method of Goldfarb and Idnani (1982 1983) for solving qua-dratic programming problems of the form min(d΄b+frac12b΄Db)) with the constraints Aʹbgtb₀rdquo For the optimization problem currently under consideration the d vector will be a zero vector the b vector will be the w vec-tor of portfolio weights the D matrix will be the variance-
covariance matrix V and the matrix A΄ will equal a matrix formed by combining the R matrix and the S matrix such that A΄= [R
S ]and A = [ R΄ S΄] Since the V matrix is symmetric the term frac12b΄Db = frac12w΄Vw is a quadratic form Also because the d vector is a zero vector the presence of the frac12 term in the quadratic form does not change the value of the solution to the current portfolio optimization problem That is the weights that minimize frac12w΄Vw sub-ject to the constraints will also minimize w΄Vw subject to the constraints
THE R PORTFOLIO OPTIMIZATION PROGRAM WITH PACKAGE ldquoQUADPROGrdquo
The ldquoQuadprogrdquo package is one of many add-in packages available to R users To use add-in packages in R the user must first download and install the chosen package This is done through the ldquoPackagesrdquo command in the menu bar of the console window Selecting the ldquoInstall package(s)rdquo command from the drop-down box will bring up a list of download locations After selecting a download location the user selects the package(s) to download and install Finally once the selected package is downloaded and in-stalled it must be loaded for use in the current R session which is done by choosing ldquoPackagesrdquo command on the menu bar and then choosing the ldquoLoad packagerdquo com-mand from the drop-down box A list of available packag-es will then appear and the user should select the desired package in this case the ldquoquadprogrdquo package Once the quadprog package is loaded the following program will solve the portfolio problem with short-sale restrictions and position limits
In the present example the short-sale constraint requires that all elements of the w vector be non-negative In addi-tion there are three position limits The first position lim-it requires that no more than 5 of total funds be invested in the seventh security The second position limit requires that no more than a total of 40 of available funds be in-vested in the first and third securities The third position limit requires that total of at least 30 of available funds be invested in the second and fourth securities
The program will make use of the M matrix and the vari-ance-covariance matrix V from the earlier program so those variables must be saved by the user or the following program must be run after running the previous program and before exiting R The new program first sets the posi-tion limits as shown on the facing page
The output of the ldquosolveQPrdquo function includes the values of w and the Lagrangian multipliers for each constraint If the value of a Lagrangian multiplier is zero the constraint associated with that multiplier is not binding otherwise the constraint is binding Though checking the values of
the Lagrangian multipliers allows the user to determine which constraints are binding quite easily the functionrsquos output also includes a listing of the binding constraints by index number
The R Portfolio Optimization Program with Package ldquoQuadprogrdquo
npl ltminus 3 Sets the number of position limits The user sets this value
plmat ltminus matrix (rep(0 nplk) nrow=npl ncol=k) Initializes the matrix that will be used to define the position limit(s)
plmat[17] = -1 Places the required elements into the proper places in the lmat[21] = plmat[23] = -1 position limits matrix In this example the first position
plmat[32] = plmat[34] = 1 limit will set a maximum on the total percentage invested in the seventh security The second position limit will set a maximum on the total percentage invested in the first and third securities The third position limit will set a minimum on the total percentage invested in the second and fourth securities
pl ltminus c(-005 -04 03) Sets the values of the position limits The value the user enters should be positive if the position limit specifies a inimum and should be negative if the position limit specifies a maximum
Next the inequality constraints are placed in matrix form
S ltminus rbind(diag(k) plmat) Defines the S matrix
w0 ltminus c(rep(0 k) pl) Creates a vector whose elements are the values of the inequality constraints
Next the arguments required by the solveQP function that solves the programming problem are defined and the programming problem is solved
dvec ltminus rep(0 k) Defines the d vector which is a necessary input for the quadprog package For portfolio optimization problems the elements of the d vector will all be zeros
Amat ltminus colbind(t(R) t(S)) Forms the Amat matrix
bvec ltminus c(M w0) Joins the M matrix and the w0 matrix to form the bvec vector
ICSol ltminus solveQP(V dvec Amat bvec meq=2) Solves the quadratic programming problem The argument meq specifies that the first two constraints are equality constraints In this example the equality constraints are that the weights sum to one and that the portfolio expected return equal a specified amount
print(c(ICSol[1] 2ICSol[[2]] ICSol[5] ICSol[6])) Prints selected output from the solve QP function the weights the portfolio variance the values of the Lagrangian multipliers and the index numbers of the binding constraints
James A Turner Optimal Portfolios and the R Programming Language
52 International Journal of the Academic Business World 53Fall 2015 (Volume 9 Issue 2)
CONCLUSION
This paper provides an R language program to calculate portfolio weights for efficient portfolios The program can also accommodate short-sale constraints and position limits Users must choose the desired portfolio expected return and must specify any other constraints A strong advantage of the program is that because the R program-ming language is freely available to anyone with access to the internet students and others who wish to use the pro-gram will be able to do so easily
REFERENCES
Dai Min Hanqing Jin and Hong Liu 2011 Illiquidity position limits and optimal investment for mutual funds Journal of Economic Theory 146 1598ndash1630
Goldfarb D and A Idnani 1982 Dual and primal-dual methods for solving strictly convex quadratic pro-grams In Hennart J P (ed) Numerical Analysis Springer-Verlag Berlin pages 77ndash91
Goldfarb D and A Idnani 1983 A numerically stable dual method for solving strictly convex quadratic pro-grams Mathematical Programming 27 1ndash33
Ihaka Ross A free software project Retrieved May 7 2013 from httpcranr-projectorgdochtmlinter-face98-paperpaper_2html
Markowitz Harry 1952 Portfolio selection Journal of Finance 7 77ndash91
Stephens Alan 1998 Markowitz and the spreadsheet Journal of Financial Education 35ndash43
Thompson Thomas H and Ashraf El-houbi 2012 SAS and the efficient portfolio International Research Jour-nal of Applied Finance 3 315ndash327
Turlach Berwin A 2013 quadprog Functions to solve quadratic programming problems R pack-age version 15-5 httpCRANR-projectorgpackage=quadprog (S original by Berwin A Turlach R port by Andreas Weingessel)
Vance Ashlee 2009 Data analysts captivated by Rrsquos power The New York Times Retrieved May 1 2013 from httpwwwnytimescom20090107tech nolog y busi ness-computi ng 0 7prog ra m htmlpagewanted=allamp_r=0
What is R Retrieved May 7 2013 from httpwwwr-projectorgabouthtml
APPENDIX 1 DATA
The data used in the R program come from the CRSP monthly stock file and consist of 60 months of return data from January 2008 to December 2012 The stocks in the 10-stock portfolio are the first 10 stocks in the CRSP monthly file (listed by PERMNO) for which 60 continuous months of returns are available The stocks in the 50-stock portfolio are the first 50 stocks for which 60 continuous months of returns are available Table 1 below lists the PERMNOS current company name and current ticker of the included stocks as well as the exchange where the stock trades
Table 1 Stocks in the Portfolio
NO PERMNO CURRENT COMPANY NAME TICKER EXCHANGE1 10001 GAS NATURAL INC EGAS AMEX2 10002 BANCTRUST FINANCIAL GROUP INC BTFG NASDAQ3 10025 A E P INDUSTRIES INC AEPI NASDAQ4 10026 J amp J SNACK FOODS CORP JJSF NASDAQ5 10032 PLEXUS CORP PLXS NASDAQ6 10044 ROCKY MOUNTAIN CHOCOLATE FAC INC RMCF NASDAQ7 10051 HANGER INC HGR NYSE8 10065 ADAMS EXPRESS CO ADX NYSE9 10100 AMERICAN LEARNING CORP NY ALRN NASDAQ
Table 1 Stocks in the Portfolio
NO PERMNO CURRENT COMPANY NAME TICKER EXCHANGE10 10104 ORACLE CORP ORCL NASDAQ11 10107 MICROSOFT CORP MSFT NASDAQ12 10138 T ROWE PRICE GROUP INC TROW NASDAQ13 10145 HONEYWELL INTERNATIONAL INC HON NYSE14 10147 E M C CORP MA EMC NYSE15 10180 AKORN INC AKRX NASDAQ16 10182 TECH DATA CORP TECD NASDAQ17 10200 REPLIGEN CORP RGEN NASDAQ18 10207 ROYCE FOCUS TRUST INC FUND NASDAQ19 10225 BEAM INC BEAM NYSE20 10232 ELMIRA SAVINGS BANK NY ESBK NASDAQ21 10239 BALDWIN amp LYONS INC BWINB NASDAQ22 10252 INDEPENDENT BANK CORP MA INDB NASDAQ23 10253 DOCUMENT SECURITY SYSTEMS INC DSS AMEX24 10257 D L H HOLDINGS CORP DLHC NASDAQ25 10258 CELLDEX THERAPEUTICS INC CLDX NASDAQ26 10259 SIGMA DESIGNS INC SIGM NASDAQ27 10294 HAVERTY FURNITURE COS INC HVT NYSE28 10297 NEW HAMPSHIRE THRIFT BNCSHRS INC NHTB NASDAQ29 10299 LINEAR TECHNOLOGY CORP LLTC NASDAQ30 10302 CYPRESS SEMICONDUCTOR CORP CY NASDAQ31 10308 TOMPKINS FINANCIAL CORP TMP AMEX32 10318 BALCHEM CORP BCPC NASDAQ33 10333 XOMA CORP XOMA NASDAQ34 10355 DAILY JOURNAL CORP DJCO NASDAQ35 10363 A M A G PHARMACEUTICALS INC AMAG NASDAQ36 10375 T C F FINANCIAL CORP TCB NYSE37 10382 ASTEC INDUSTRIES INC ASTE NASDAQ38 10395 NAVIGATORS GROUP INC NAVG NASDAQ39 10397 WERNER ENTERPRISES INC WERN NASDAQ40 10421 SKYWEST INC SKYW NASDAQ41 10443 PATRIOT TRANSPORTATION HLDG INC PATR NASDAQ42 10463 RESEARCH FRONTIERS INC REFR NASDAQ43 10501 AMERICAN WOODMARK CORP AMWD NASDAQ44 10507 MEDICAL ACTION INDS INC MDCI NASDAQ45 10514 TRANS WORLD ENTERTAINMENT CORP TWMC NASDAQ46 10516 ARCHER DANIELS MIDLAND CO ADM NYSE47 10517 AARONS INC AAN NYSE48 10530 MERIDIAN BIOSCIENCE INC VIVO NASDAQ49 10547 CLEARFIELD INC CLFD NASDAQ50 10550 PRO DEX INC COLO PDEX NASDAQ
James A Turner Optimal Portfolios and the R Programming Language
54 International Journal of the Academic Business World 55Fall 2015 (Volume 9 Issue 2)
APPENDIX 3 RESULTS FOR THE 10-STOCK PORTFOLIO
Results for the 10-stock portfolio with a monthly expect-ed return of 1 are shown at the top of the facing page First shown is the variance-covariance matrix (V) fol-lowed by its inverse (V-1)
Table 2 shows the return averages of each stock and the calculated portfolio weights both for the portfolio with no short-sale constraints or position limits and the port-folio with short-sale constraints and three position limits (1) a requirement that the percentage invested in the sev-enth security not exceed 5 (2) a requirement that the
total percentage invested in the first and the third securi-ties not exceed 40 and (3) a requirement that the total percentage invested in the second and fourth securities be at least 30 Note that when short-sale constraints and position limits are imposed there may no longer be a port-folio that meets all the constraints that is the feasible set may be null In that case the R program will return an error message stating that the constraints are inconsistent
Table 3 lists the inequality constraints and the associ-ated Lagrangian multipliers along with an indication of whether the constraint is binding In this example the constraint that there be a minimum of 30 invested in the second and fourth securities is not binding
APPENDIX 2 COPY OF THE FULL PROGRAM
The full program is shown below without comments Users can easily copy the program that is between the solid lines and paste it into the R Editor window It will probably be necessary for each user to change the name of the data file in the readtable command Also the user can change the portfolio expected return and the number type and value of the inequality constraints as desired
Returns ltminus readtable(ldquoReturnscsvrdquo header = TRUE sep = ldquordquo) Rmat ltminus asmatrix(Returns) k ltminus ncol(Rmat) V ltminus var(Rmat) Erp ltminus 001 M ltminus rbind(1 Erp) Ones ltminus rep(1 k) Ravg ltminus colMeans(Rmat) R ltminus rbind(Ones Ravg) VINV ltminus solve(V) H ltminus RVINVt(R) HINV ltminus solve(H) w lt- VINVt(R)HINVM Pvar lt- t(w)Vw print(w) print(Pvar) npl ltminus 3 plmat ltminus matrix (rep(0 nplk) nrow=npl ncol=k) plmat[17] = -1 plmat[21] = plmat[23] = -1 plmat[32] = plmat[34] = 1 pl ltminus c(-005 -04 03)S ltminus rbind(diag(k) plmat) w0 ltminus c(rep(0 k) pl) dvec ltminus rep(0 k) Amat ltminus cbind(t(R) t(S)) bvec ltminus c(M w0) ICSol ltminus solveQP(V dvec Amat bvec meq=2) print(c(ICSol[1] 2ICSol[[2]] ICSol[5] ICSol[6]))
1
2867001 161224 279311 153314 408660 148438 131874 246057 83608 740152
161224 321169 23967 251277 39387 55190 33449 107899 36378 39718
279311 23967 991158 109233 189872 100249 22208 119
V minus
minus minus minus
minus minus minus minus
minus minus minus minus
=
6782 41342 198294
153314 251277 109233 2757210 319797 03010 139907 969199 56520 416534
408660 39387 189872 319797 977494 325171 247388 1098965 26657 04097
148438 55190 100249 03010 325171 1
minus minus minus minus minus
minus minus minus minus minus minus
minus 644368 311333 1803329 91576 428583
131874 33449 22208 139907 247388 311333 1093506 426730 100681 162364
246057 107899 1196782 969199 1098965 1803329 426730 11640904 233195 3789283
8360
minus minus
minus minus minus minus minus minus minus
minus minus minus minus minus minus
8 36378 41342 56520 26657 91576 100681 233195 138635 73382
740152 39718 198294 416534 04097 428583 162364 3789283 73382 3685519
minus minus
minus minus minus minus minus minus
00046 00019 00002 00006 00035 00004 00011 00008 00018 00019
00019 00364 00013 00037 00002 00004 00003 00001 00100 00007
00002 00013 00161 00024 00076 00035 00013 00041 00038 00033
00006 0
V
minus minus minus minus
minus minus minus minus
minus minus
=
0037 00024 00058 00051 00010 00016 00021 00028 00029
00035 00002 00076 00051 00217 00009 00048 00052 00024 00064
00004 00004 00035 00010 00009 00087 00018 00022 00027 00012
00011 00003 00013 000
minus
minus minus
minus minus minus
16 00048 00018 00113 00013 00055 00018
00008 00001 00041 00021 00052 00022 00013 00033 00003 00034
00018 00100 00038 00028 00024 00027 00055 00003 00850 00020
00019 00007 00033 00029 00064 00
minus
minus minus minus minus minus minus minus minus
012 00018 00034 00020 00068minus
Table 2 Average Returns and Weights for the Ten-
Stock Portfolios
Stock No Permno
Average Returns
Weights (SS
Allowed)IC Weights
(No SS 3 PLs)
1 10001 00064 03817 034062 10002 -00054 00311 004063 10025 00183 00908 005944 10026 00156 02525 026255 10032 00095 -01410 000006 10044 00012 00649 013797 10051 00206 01000 005008 10065 00018 01933 004929 10100 00270 00422 0056810 10104 00104 -00155 00031
Table 3 Constraints and Lagrangian Multipliers
Constraint Lagrangian Multiplier
Constraint Binding
Portfolio weights sum to one 00015 Yes
Portfolio expected return equals 1 00443 Yes
w1 ge 0 00000 No w2 ge 0 00000 No
w3 ge 0 00000 No
w4 ge 0 00000 No
w5 ge 0 00015 Yes
w6 ge 0 00000 No
w7 ge 0 00000 No
w8 ge 0 00000 No
w9 ge 0 00000 No
w10ge 0 00000 No
w7 le 005 00003 Yes
w1 + w3 le 04 00002 Yes
w2 + w4 ge 03 00000 No
James A Turner Optimal Portfolios and the R Programming Language
56 International Journal of the Academic Business World 57Fall 2015 (Volume 9 Issue 2)
The portfolio variances are
No short-sale constraints 0001607 Short-sale constraints and three position limits 0001856
APPENDIX 4 RESULTS FOR THE 50-STOCK PORTFOLIO
Results for the 50-stock portfolio with a monthly ex-pected return of 1 are shown in Table 4 below The first table shows the return averages of each stock and the cal-culated portfolio weights both for the portfolio with no short-sale constraints or position limits and the portfolio with short-sale constraints and three position limits (1) a requirement that the percentage invested in the seventh security not exceed 5 (2) a requirement that the total percentage invested in the first and the third securities not exceed 40 and (3) a requirement that the total percent-age invested in the second and fourth securities be at least 30
Table 5 shows the Lagrangian multipliers on the equal-ity constraints and the position limit constraints To save space for the 50-stock portfolio the Lagrangian multi-pliers on the short-sale constraints are not listed Simply checking Table 4 to see if the weight on a particular stock is zero gives an almost certain indication of which short-sale constraints are binding In this example both the constraint that there be no more than 5 invested in the seventh security and the constraint that there be no more than a total of 40 invested in the first and third securi-ties are not binding
Table 4 Average Returns and Weights for the
50-Stock PortfoliosStock
No Permno Average Returns
Weights SS Allowed
IC Weights No SS 3 PLs
1 10001 00064 01934 013072 10002 -00054 -00179 003673 10025 00183 -00189 000004 10026 00156 02873 026335 10032 00095 00503 000006 10044 00012 -00185 000007 10051 00206 -00136 002288 10065 00018 10920 000009 10100 00270 00306 00423
10 10104 00104 01467 0000011 10107 -00001 -02023 00000
Table 4 Average Returns and Weights for the
50-Stock PortfoliosStock
No Permno Average Returns
Weights SS Allowed
IC Weights No SS 3 PLs
12 10138 00085 -05619 0000013 10145 00065 -03910 0000014 10147 00088 -02693 0000015 10180 00290 -00290 0000016 10182 00076 01181 0000017 10200 00082 01409 0040918 10207 00020 -01551 0000019 10225 00098 00285 0000020 10232 00159 -00021 0000021 10239 00051 01624 0000022 10252 00084 00955 0000023 10253 00058 00121 0000024 10257 -00008 -00236 0000025 10258 00196 -00157 0000026 10259 -00300 -01339 0000027 10294 00179 -00414 0000028 10297 00061 01854 0146729 10299 00074 00826 0000030 10302 00165 00201 0000031 10308 00073 01255 0014132 10318 00194 -01389 0000033 10333 -00203 -00205 0000034 10355 00299 -00545 0036035 10363 -00151 -00167 0000036 10375 00010 -00495 0000037 10382 00046 00267 0000038 10395 -00022 00886 0042339 10397 00134 01296 0084940 10421 -00036 -01045 0000041 10443 00021 01389 0000042 10463 00013 00417 0000043 10501 00176 -00458 0000044 10507 -00228 -00397 0000045 10514 00100 00731 0007846 10516 -00034 -00148 0119247 10517 00208 00629 0000048 10530 00005 00032 0000049 10547 00418 00032 0012550 10550 -00028 00397 00000
The portfolio variances are
No short-sale constraints 000002997 Short-sale constraints and three position limits 000111119
Table 5 Constraints and Lagrangian Multipliers
Constraint Lagrangian Multiplier Constraint Binding
Portfolio weights sum to one 0000503 YesPortfolio expected return equals 1 0031954 Yes
w7 le 005 0000000 Now1 + w3 le 04 0000000 Now2 + w4 ge 03 0000963 Yes
James A Turner
58 Fall 2015 (Volume 9 Issue 2)
This page intentionally blank
JOINT CONFERENCE May 25th 26th and 27th 2016 in
Nashville TN
Academic Business World International Conference
(ABWICorg)
The aim of Academic Business World is to promote inclusiveness in research by offering a forum for the discussion of research in early stages as well as re-search that may differ from lsquotraditionalrsquo paradigms We wish our conferences to have a reputation for providing a peer-reviewed venue that is open to the full range of researchers in business as well as reference disciplines within the social sciences
Business Disciplines
We encourage the submission of manuscripts presentation outlines and ab-stracts pertaining to any business or related discipline topic We believe that all disciplines are interrelated and that looking at our disciplines and how they relate to each other is preferable to focusing only on our individual lsquosilos of knowledgersquo The ideal presentation would cross discipline borders so as to be more relevant than a topic only of interest to a small subset of a single disci-pline Of course single domain topics are needed as well
International Conference on Learning and Administration in
Higher Education (ICLAHEorg)
All too often learning takes a back seat to discipline related research The In-ternational Conference on Learning and Administration in Higher Educa-tion seeks to focus exclusively on all aspects of learning and administration in higher education We wish to bring together a wide variety of individuals from all countries and all disciplines for the purpose of exchanging experi-ences ideas and research findings in the processes involved in learning and administration in the academic environment of higher education
We encourage the submission of manuscripts presentation outlines and ab-stracts in either of the following areas
Learning
We encourage the submission of manuscripts pertaining to pedagogical top-ics We believe that much of the learning process is not discipline specific and that we can all benefit from looking at research and practices outside our own discipline The ideal submission would take a general focus on learning rather than a discipline-specific perspective For example instead of focusing on ldquoMotivating Students in Group Projects in Marketing Managementrdquo you might broaden the perspective to ldquoMotivating Students in Group Projects in Upper Division Coursesrdquo or simply ldquoMotivating Students in Group Projectsrdquo The objective here is to share your work with the larger audience
Academic Administration
We encourage the submission of manuscripts pertaining to the administra-tion of academic units in colleges and universities We believe that many of the challenges facing academic departments are not discipline specific and that learning how different departments address these challenges will be ben-eficial The ideal paper would provide information that many administrators would find useful regardless of their own disciplines
- Testing Major Factors for Reducing Obstacles to Product Innovation Success
-
- Dr Tor Guimaraes
- Dr Marcelo Seido Nagano
- Dr Curtis Armstrong
-
- Acceptance of Change Exploring the Relationship among Psychometric Constructs and Employee Resistance
-
- Brian Dunican EdD
- Ric Keaster PhD
-
- The Origin and Construct of Cloud Computing
-
- Nozar Daylami PhD
-
- Optimal Portfolios and the R Programming Language
-
- James A Turner
-
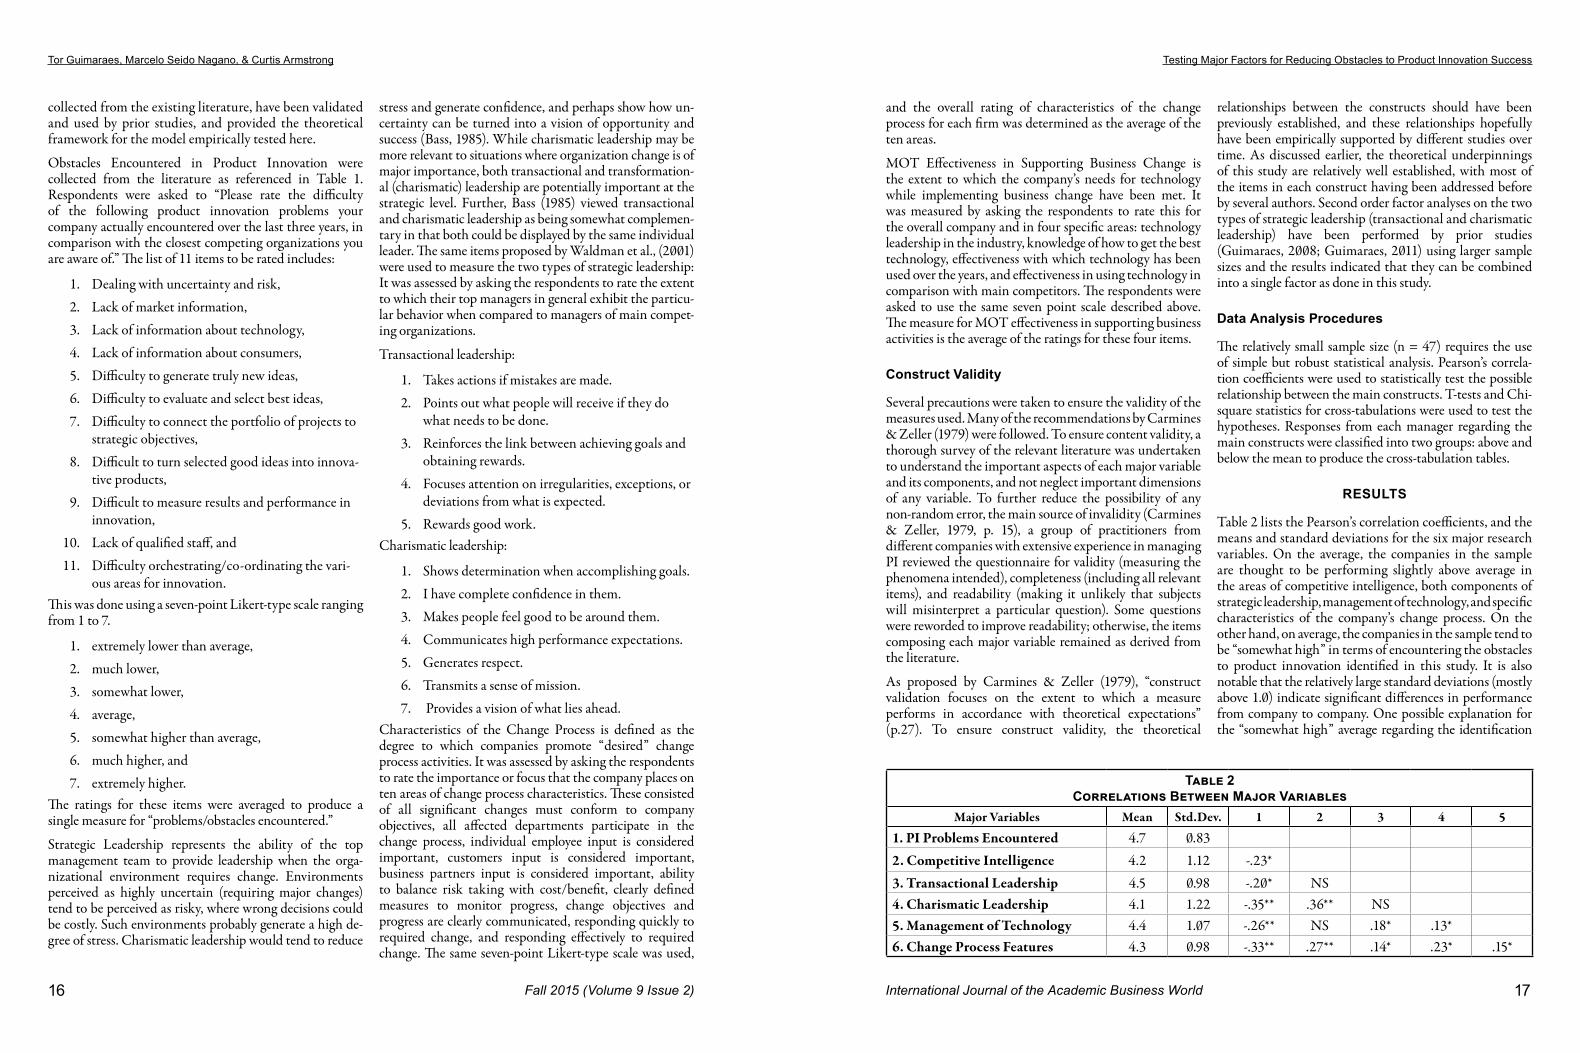
Tor Guimaraes Marcelo Seido Nagano amp Curtis Armstrong Testing Major Factors for Reducing Obstacles to Product Innovation Success
20 International Journal of the Academic Business World 21Fall 2015 (Volume 9 Issue 2)
erature The results clearly demonstrate that compared to below average firms companies with higher than aver-age Transactional Leadership have encountered product innovation problems at a significantly lower level along many of the product innovation problems identified The above results corroborates hypothesis two
Results from Hypothesis Three Testing
Hypothesis three proposes that firms having strong char-ismatic leadership is inversely related to encountering problems in product innovation This has been tested in a similar fashion as hypotheses 1 and 2 Table 7 shows the results of the cross-tabulations for belowabove average company resources availability and belowabove average encounters with product innovation problems Similar to the cross-tabulations used for testing the hypotheses addressing the other major constructs the results in this case confirm expectations and should be interpreted ac-cordingly
As shown in Table 8 t-tests were again used to further test the significance of this relationship between Charismatic Leadership and specific product innovation problems en-countered The results clearly demonstrate that compared to below average firms companies with above average Charismatic Leadership have encountered product inno-vation problems at a significantly lower level along many
of the product innovation problems identified While the small sample size has resulted in several non-significant comparisons in no case the comparison contradicted the general hypothesis Based on the above results we also find strong support for hypothesis three
Results from Hypothesis Four Testing
Tested in similar fashion hypothesis four proposes that having effective management of technology is inversely
related to encountering problems in product innovation Table 9 shows the results of the cross-tabulations for be-lowabove average management of technology effective-ness and belowabove average encounters with product in-novation problems Similar to the cross-tabulations used for testing the hypotheses addressing the other major con-structs the results in this case confirm expectations and should be interpreted accordingly
As shown in Table 10 t-tests were again used to further test the significance of this relationship between the company MOT effectiveness and specific product inno-vation problems encountered The results clearly demon-strate that compared to below average firms companies with above average MOT performance have encountered product innovation problems at a significantly lower level along many of the product innovation problems identi-fied Based on the above results we also find strong sup-port for hypothesis four
Results from Hypothesis Five Testing
Hypothesis five proposes that having a product change process with the desirable characteristics is inversely related to encountering problems in product innovation This has been tested the same way Table 11 shows the results
of the cross-tabulations for belowabove average product change process and belowabove average encounters with specific product innovation problems The results in this case confirm expectations and should be interpreted accordingly
As shown in Table 12 t-tests were again used to further test the significance of this relationship between the product change process and specific product innovation problems encountered C to below average firms companies with
Table 8 T-Tests for Charismatic Leadership and
Each Product Innovation Problem Encountered
Aggregated Variable and Individual Items
Charismatic Leadership
p-ValueBelow
AverageAbove
Average
Problems encountered in product innovation 50 39 001
Difficult to deal with uncertainty and risk 52 41 001Lack of market information 49 42 001Lack of information about technology 50 40 002Lack of information about the consumer 47 38 001Difficult to generate truly new ideas 48 38 001Difficult to evaluate and select the best ideas 51 41 001Difficulty to connect the portfolio of projects to strategic objectives 52 38 001Difficult to turn selected good ideas into innovative products 51 43 001Difficult to measure results and performance in innovation 47 37 001Lack of qualified staff 52 36 001Difficult to orchestrate and co-ordinate the various areas for innovation 50 35 001
Table 10 T-Tests for Management of Technology and
Each Product Innovation Problem Encountered
Aggregated Variable and Individual Items
Management of Technology
p-ValueBelow
AverageAbove
Average
Problems encountered in product innovation46 40 003
Difficult to deal with uncertainty and risk 48 34 001Lack of market information 46 35 001Lack of information about technology 52 36 000Lack of information about the consumer 43 41 Not SignificantDifficult to generate truly new ideas 47 40 Not SignificantDifficult to evaluate and select the best ideas 43 42 Not SignificantDifficulty to connect the portfolio of projects to strategic objectives 45 43 Not SignificantDifficult to turn selected good ideas into innovative products 46 41 004Difficult to measure results and performance in innovation 48 42 003Lack of qualified staff 47 44 Not Significant
Difficult to orchestrate and co-ordinate the various areas for innovation 43 41 Not Significant
Table 7 Cross-Tabulations of
Charismatic Leadership and Product Innovation Problems
(Hypothesis 3)Product Innovation
Problems EncounteredBelow
AverageAbove
Average
Charismatic Leadership
Below Average 7 15
Above Average 16 9
Chi-square = 48 (p = 003)
Table 9 Cross-Tabulations of
Management of Technology and Product Innovation Problems
(Hypothesis 4)Product Innovation
Problems EncounteredBelow
AverageAbove
Average
M a n a g e me nt of Technology
Below Average 9 14
Above Average 18 8
Chi-square = 45 (p = 003)
Tor Guimaraes Marcelo Seido Nagano amp Curtis Armstrong Testing Major Factors for Reducing Obstacles to Product Innovation Success
22 International Journal of the Academic Business World 23Fall 2015 (Volume 9 Issue 2)
more relevant within an existing organization environment instead of one attempting to implement changes Katz amp Kahn (1978) argued that charismatic leadership may be more relevant where organization change is important but that both types of strategic leadership are potentially important Our results indicate that indeed for more successful (less problems encountered) product innovation both types of leadership are important
Regarding CI there are also some major implications from this study results To improve their CI programs managers need to consider the collection of market intelligence based on the six areas addressed in this study the traditional industry competitors emerging competitors traditional customer needs and wants non-traditional customer needs and wants relationships with business partners and new product or service development The importance of any one of these areas may be relatively higher or lower and in some cases some of these sources may be irrelevant depending on the companyrsquos specific industry sector line of business products and processes being considered Good performance in these areas whenever applicable to the companyrsquos industry sector and lines of business are likely to reduce problems encountered which in turn is likely to lead to more product innovation
To improve technology management which is found to be useful reducing product innovation problems managers must look at company performance in terms of its technology leadership position in its main industry sectors knowledge of how to get the best technology available effective use of specific technologies and benchmarking the use of specific technologies against the companyrsquos main competitors or best-in-class target organizations An important requirement to accomplish these objectives is the clear definition of the more important technologies necessary to support and enhance the companyrsquos products Another important requirement is management recognition that the implementation of each of the various technologies deemed important to the organization are dependent on specific success factors The success factors for the various technologies have been identified and discussed elsewhere (Guimaraes Igbaria amp Lu 1992 Guimaraes amp Igbaria 1997 Yoon Guimaraes amp Clevenson 1998 Yoon Guimaraes amp Clevenson 1995 Yoon Guimaraes amp OrsquoNeal 1995 Udo amp Guimaraes 1994) and are considered beyond the scope of this paper
Last top managers must ensure that their companysrsquo product change process bear the desirable characteristics studied here all significant changes must conform to company objectives all affected departments participate in the change process individual employee input is considered important customers input is considered important business partners input is considered important managers
above average performance in product change process have encountered product innovation problems at a significantly lower level along many of the product innovation problems identified Based on the above results hypothesis five is corroborated
DISCUSSION MANAGERIAL RECOMMENDATIONS AND
FURTHER RESEARCH
Despite the relatively small sample size the results provide strong evidence regarding the importance of strategic leadership competitive intelligence management of
technology and specific characteristics of the companyrsquos change process to the success of product innovation Given the importance of effectively implementing business innovation in these days of hyper competitiveness it behooves top managers to do whatever they can to improve their companysrsquo performance in the areas of strategic leadership competitive intelligence management of technology and characteristics of the process used to reduce problems encountered with the product innovation process so vital to company performance
In the area of strategic leadership several implications can be derived from this study Charismatic leadership (showing determination while accomplishing goals inspiring confidence making people feel good around you communicating expectations for high performance generating respect transmitting a sense of mission and providing a vision of what lies ahead) is on average and as a whole relatively scarce in industry today and judging by its nature it should be difficult to develop Nevertheless managers must try particularly in high clockspeed industry sectors (Guimaraes et al 2002) requiring continuous innovation Also apparently important for successful product innovation transactional leadership (taking action if mistakes are made pointing out what people will receive if they do what needs to be done reinforcing the link between achieving goals and obtaining rewards focusing attention on deviations from what is expected and rewarding good work) by its nature should be easier to develop Pawar amp Eastman (1997) proposed that transactional leadership is
ability to balance risk taking with costbenefit the existence of clearly defined measures to monitor progress that change objectives and progress are clearly communicated and that the product innovation teams respond quickly and effectively to required change These guidelines must be widely disseminated and enforced by project managers and employees involved in product changes
The primary objective of this research has three interrelated components 1) to identify and assess the variety of problems encountered by companies while performing the vital process of product innovation 2) to identify and assess the major factors proposed in the literature as necessary to increase the likelihood of success in product innovation and 3) to test if these literature proposed success factors for product innovation also show a positive impact by reducing the problems associated with the product innovation process in practice Thus it is safe to assume that the measures for each of the major constructs studied here derived from a large number of separate studies represent an important contribution to future researchers and practicing product innovation managers aiming to improve their company effectiveness in this critical area
During the process of conducting this research informal discussions with several of the product development managers made abundantly clear that over time success in product development can only be achieved by a complex combination of many factors stemming from three major areas humanorganizational technological and market knowledge elements This multidimensional requirement for success as well as an intrinsic presence of risk and the need to find tangible and intangible resources is a huge challenge for product innovation management in general As the results from this study indicated all the major factors addressed here are important but do not by themselves ensure successful product innovation It seems to be rather analogous to a case where basic components must be in combination transformed into improved products which provide greater value to the market place
STUDY LIMITATIONS AND OPPORTUNITIES FOR FURTHER RESEARCH
Based on an extensive survey of the relevant literature this study is a first attempt at empirically testing the im-portance of strategic leadership competitive intelligence management of technology and specific characteristics of the companyrsquos change process for the success of product in-novation The theoretical model proposed here addresses five major determinants of how to reduce obstaclesprob-lems for successful PI based on the existing literature There might be other important factors for reducing the PI prob-lems defined in this study Given the importance of the
Table 12 T-Tests for Change Process Features and
Each Product Innovation Problem Encountered
Aggregated Variable and Individual ItemsChange Process Features
p-ValueBelow Average
Above Average
Problems encountered in product innovation 49 40 001Difficult to deal with uncertainty and risk 51 42 001Lack of market information 49 40 001Lack of information about technology 50 41 001Lack of information about the consumer 48 37 001Difficult to generate truly new ideas 47 40 001Difficult to evaluate and select the best ideas 52 43 001Difficulty to connect the portfolio of projects to strategic objectives 49 38 001Difficult to turn selected good ideas into innovative products 50 43 001Difficult to measure results and performance in innovation 48 39 001Lack of qualified staff 47 37 001Difficult to orchestrate and co-ordinate the various areas for innovation 52 41 001
Table 11 Cross-Tabulations of
Change Process Features and Product Innovation Problems
(Hypothesis 5)Product Innovation
Problems EncounteredBelow
AverageAbove
Average
C h a n g e P r o c e s s Features
Below Average 8 15
Above Average 17 9
Chi-square = 46 (p = 003)
Tor Guimaraes Marcelo Seido Nagano amp Curtis Armstrong Testing Major Factors for Reducing Obstacles to Product Innovation Success
24 International Journal of the Academic Business World 25Fall 2015 (Volume 9 Issue 2)
topic future research should strive to identify and include these potential factors in an expanded theoretical model
Another opportunity for future research stems from the fact that even though the relatively small sample in this study has shown very encouraging statistically significant results larger sample sizes will be much more convincing Therefore we strongly recommend new research projects with larger sample sizes capable of supporting multivariate analyses expanded theoretical models and enable the assessment of more complex relationships among the important constructs addressed in this study Perhaps the use of a path analytic modeling technique would be applicable in this case The results should provide valuable information on the extent to which strategic leadership can positively influence the effective use of technology and CI programs for companies to improve their business competitiveness while ensuring that the change process follow prescribed guidelines suggested in this study
Finally a third area of future research opportunity deals with the integration and expansion of theoretical mod-els relating the many determinants of success in product innovation to include the new construct of ldquoobstacles to product innovationrdquo as a likely moderating variable in these theoretical models Combined these three areas of research opportunity should support a host of research studies important not only to the academic community but also to product innovation managers
REFERENCES
Adams R Bessant J amp Phelps J (2006) Innovation management measurement A review International Journal of Management Reviews 8(1) 21-47
Anonymous (1995) Data mining a new weapon for com-petitive advantage Software Quarterly 2 (4) 15-19
Baatz E B (1994 Sept 15) The quest for corporate smarts CIO 48-58
Babbar S amp Rai A (1993) Competitive intelligence for international business Long Range Planning 263103-113
Bass BM (1985) Leadership and Performance beyond Expectations New York Free Press
Beattie JS amp Fleck J (2005) New perspectives on stra-tegic technology management in small high-tech com-panies Proceedings from IEEE International 2005 Engineering Management Conference
Blindenbach-Driessen F amp Van Den Ende J (2010) In-novation management practices compared the exam-ple of project-based firms Journal of Product Innova-tion Management 6(3) 33-53
Burns J M (1978) Leadership New York Harper amp Row
Calof JL amp Wright S (2008) Guest Editorial Com-petitive intelligence a practitioner academic and inter-disciplinary perspective European Journal of Market-ing 42(78) 717-730
Carmines E amp Zeller R (1979) Reliability and Validity Assessment Beverly Hills CA Sage
Colakoglu T (2011) The problematic of competitive intelligence How to evaluate and develop competi-tive intelligence Procedia ndash Social and Behavioral Sci-ences 24(1) 1615ndash1623 httpdxdoiorg101016jsbspro201109075
Cooper RG (2009) How companies are reinventing their idea-to-launch methodologies Research Technol-ogy Management 52(2) 47-57
Cooper RG and Chew MB (1996) Control tomor-rowrsquos costs through todayrsquos designs Harvard Business Review January-February 88-98
Cooper R amp Edgett S (2008) Ideation for product in-novation what are the best methods PDMA visions magazine 1(1) 12-17 httpwwwstage-gatecomknowledgephp
Cooper R Edgett S amp Kleinschmidt E (2001) Portfo-lio management for new product development results of an industry practices study RampD Management 31(4) 361-380
Darling M S (1996) Building the knowledge organiza-tion Business Quarterly 61(2) 61-66
Davison L (2001) Measuring competitive intelligence effectiveness Insights from the advertising industry Competitive Intelligence Review 12 (4) 25-38
Day DV amp Lord RG (1988) Executive leadership and organizational performance suggestions for a new theory and methodology Journal of Management 14 4593-464
du Toit A (2003) Competitive intelligence in the knowl-edge economy What is in it for South African manu-facturing enterprises International Journal of Infor-mation Management 23 111-120
Editors (2004 MarchApril) Competitive intelligence and records managers The Information Management Journal 4
Ellis J R (1993) Proactive competitive intelligence Us-ing competitive scenarios to exploit new opportunities Competitive Intelligence Review 4(1) 13-24
Ettorre B (1995) Managing competitive intelligence Management Review 84(10) 15-19
Fleisher CS amp Wright S (2009) Examining differences in competitive intelligence practice China Japan and the West Thunderbird International Business Review 51(3) 249ndash261 httpdxdoiorg101002tie20263
Friedenberg R amp Rice A (1994 August 3) Knowledge re-engineering as a BPR strategy Working Notes of the AAAI-94 Workshop on Artificial Intelligence in Business Process Reengineering Seattle WA pp 21-26
Fuld amp Company (2013) Certain industries invest heavi-ly in watching their competition Fuld Insights-Global Benchmarking Project Update March 2013
Galia F amp Legros D (2004) Complementarities be-tween obstacles to innovation evidence from France Research Policy 33 1185ndash1199
Ghoshal S amp Westney D E (1991 Jan) Organizing competitor analysis systems International Journal of the Academic Business World 2(1) pp 35-44
Guimaraes T (2011) Industry Clockspeedrsquos Impact on Business Innovation Success Factors European Journal of Innovation Management 14(3) 322-344
Guimaraes N amp Armstrong C (1998) Exploring the relation between competitive intelligence IS support and business change Competitive Intelligence Review 9(3) 45-54
Guimaraes T Cook D amp Natarajan N (2002) Explor-ing the importance of business clockspeed as a modera-tor for determinants of supplier network performance Decision Sciences 33(4) 629-644
Guimaraes N amp Igbaria M (1997) Clientserver sys-tem success Exploring the human side Decision Sci-ences 28(4) 851-876
Guimaraes N Igbaria M amp Lu M (1992) Determi-nants of DSS success An integrated model Decision Sciences 23(2) 409-430
Guimaraes T Yoon Y amp Clevenson A (1997) Empiri-cally testing ES success factors in business process reen-gineering International Journal of Production Econom-ics 50 245-259
Haataja J (2011) Social media as a source of competitive intelligence in a pharmaceutical corporation Masterrsquos thesis School of Science Aalto University
Haddadi AE Dousset B amp Berrada I (2010) Xplor EveryWhere ndash The Competitive Intelligence Sys-tem for Mobile in IEEE Xplorereg retrieved 25 March
2015 from httpieeexploreieeeorgstampstampjsptp=amparnumber=5945635
Hambrick DC amp Finkelstein S (1987) Managerial Discretion A Bridge between Polar Views of Organi-zational Discretion In LL Cummings amp BM Staw (Eds) Research in Organizational Behavior Green-wich CT JAI Press 9 369-406
Harkleroad D (1993) Sustainable growth rate analysis Evaluating worldwide competitorsrsquo ability to grow profitability Competitive Intelligence Review 4(23) 36-45
Heil O amp Robertson T S (1991 Sep) Toward a theory of competitive market signaling A research agenda Strategic Management Journal 12(6) 403-418
Huber G P (1990 Jan) A theory of the effects of ad-vanced information technologies on organizational design intelligence and decision making Academy of Management Review 15(1) 47-71
Kanter RM (1983) The Change Masters New York Si-mon amp Schuster
Katz D amp Kahn RL (1978) The Social Psychology of Organizations (2nd ed) New York Wiley
Khalil TM amp Ezzat HA (2005) Management of technology and responsive policies in a new economy International Journal of Technology Management 32(12) 88
King M (1997 March 10) Corporations take snooping mainstream Indianapolis Business Journal 17(2) 1-4
Li-Hua R amp Khalil TM (2006) Technology manage-ment in China A global perspective and challenging issues Journal of Technology Management in China 1(1) 9
Maltz E amp Kohli A K (1996 Feb) Market intelligence dissemination across functional boundaries Journal of Marketing Research 33(1) 47-61
Mata RS (2008) Inovaccedilatildeo tecnoloacutegica em multinacio-nais brasileiras estudo multicaso sobre gestatildeo do port-folio de projetos de novos produtos 192p Dissertaccedilatildeo (Mestrado) ndash Faculdade de Economia Administraccedilatildeo e Contabilidade de Ribeiratildeo Preto Universidade de Satildeo Paulo Ribeiratildeo Preto
McCarthy V (1996) CTI lets you coddle customers at lower cost Datamation 42(13) 46-49
McCune J C (1996) Checking out the competition Be-yond Computing 5(2) 24-29
Nemeth C (1997) Managing innovation when less is more California Management Review 40(1) 59-74
Tor Guimaraes Marcelo Seido Nagano amp Curtis Armstrong
26 Fall 2015 (Volume 9 Issue 2)
Nemutanzhela P amp Iyamu T (2011) The impact of competitive intelligence on products and services in-novation in organizations International Journal of Advanced Computer Science and Applications 2(11) 38-44
Parry ME Song M De Weerd-Nederhof PC amp Viss-cher K (2009) The impact of NPD strategy product strategy and NPD processes on perceived cycle time Journal of Product Innovation Management 26 (6) 627-639
Pawar BS amp Eastman KK (1997) The nature and implications of contextual influences on transforma-tional leadership A conceptual examination Academy of Management Review 22 80-109
Pellissier R amp Nenzhelele TE (2013) Towards a univer-sal definition of competitive intelligence SA Journal of Information management 15(2) Art 559 7 pages httpdxdoiorg104102sajimv15i2559 Retrieved 31 March 15
Podsakoff PM MacKenzie SB Moorman RH amp Fetter R (1990) Transformational leader behaviors and their effects on followersrsquo trust in leader satisfac-tion and organizational citizenship behaviors Leader-ship Quarterly 1107-142
Roitner A (2008) Competitive intelligence in Austria An empirical study Masterrsquos dissertation University of Vienna
Sawka K A (1996) Demystifying business intelligence Management Review 85(10) 47-51
Segarra-Blasco A Garcia-Quevedo J amp Teruel-Carrizo-sa M (2008) Barriers to innovation and public policy in Catalonia The International Entrepreneurship and Management Journal 4(4) 431-451
Sharma A (1999) Central dilemmas of managing inno-vation in large firms California Management Review 3941(3) 46-164
Slack N Chambers S Johnston R and Betts A (2006) Operations and Process Management Princi-ples and Practice for Strategic Impact 2nd ed Prentice Hall Harlow
Stringer R (2000) How to manage radical innovation California Management Review 42(4) 70-88
Swartz N (2005) Competitive intelligence underuti-lized Information Management 39(3)
Tarraf P amp Molz R (2006) Competitive Intelligence at Small Enterprises SAM Advanced Management Journal l 71 (4) 24-34
Thamhain HJ (2003) Managing innovative RampD teams RampD Management 33(3) 297-311
Tidd J Bessant J amp Pavitt K (2008) Gestatildeo da inova-ccedilatildeo 3ed Satildeo Paulo Artmed
Trice HM amp Beyer JM (1993) The Cultures of Work Organizations Englewood Cliffs JN Prentice-Hall
Tushman M amp Anderson P (1997) Managing Strategic Innovation and Change Oxford University Press Ox-ford 3-23
Udo G amp Guimaraes N (1994) Empirically assessing factors related to DSS benefits European Journal of In-formation Systems 3(3) 218-227
Vedder RG amp Guynes CS (2002) CIOsrsquo Perspectives on competitive intelligence Information Systems Man-agement 19(4) 49-56
Waldman DA Ramirez GG House RJ amp Puranam P (2001) Does leadership matter CEO leadership at-tributes and profitability under conditions of perceived environmental uncertainty Academy of Management Journal 44(1) 134-143
Weiss A amp Naylor E (2010) Competitive intelli-gence How independent information professionals American Society for Information Science and Tech-nology 37(1) 30ndash34 httpdxdoiorg101002bult20101720370114
Westervelt R (1996) Gaining an edge Competitive in-telligence takes off Chemical Week 158(25) 29-31
Williams SD (2004) Personality attitude and leader influences on divergent thinking and creativity in or-ganizations European Journal of Innovation Manage-ment 7(3) 187-204
Yoon Y Guimaraes T amp Clevenson A (1995) Under-standing the factors important to expert systems suc-cess Technology Management 2(3) 1-14
Yoon Y Guimaraes T amp Clevenson A (1998) Explor-ing ES success factors for BPR Journal of Engineering and Technology Management 15 179-199
Yoon Y Guimaraes T amp OrsquoNeal Q (1995) Exploring the factors associated with expert systems success MIS Quarterly 19(1) 83-106
Yukl GA (1998) Leadership in Organizations (4th ed) Englewood Cliffs NJ Prentice-Hall
International Journal of the Academic Business World 27
INTRODUCTION
Nothing stays the same part of the human condition involves adjusting to change Yet human resistance to change is both intense and natural Perhaps examples of this resistance occur in employeesrsquo personal lives or arise as they approach new ideas or changes at work Through a myriad of changes characterized by global demands unpredictable environments the onset of technologi-cal advances and operational developments managing change and resistance has become a way of life for many organizations (Judge Thoresen Pucik amp Welbourne
1999) Organizations must depend on capable leader-ship to guide them through these unprecedented times The evolution of change requires employees at all levels to embrace new techniques of working by promoting dif-ferent mindsets (Kets de Vries Ramo amp Korotov 2009) Gondo Patterson and Palacios (2013) suggested that some organizations fail to adapt to change and prepare their leadership and employees for a more uncertain fu-ture Yet their study summarized that successful change involves support of formulated strategies and the facilita-tion of change recipients being mindful during change ef-forts In the face of intense global competition it is criti-
Acceptance of Change Exploring the Relationship among
Psychometric Constructs and Employee Resistance
Brian Dunican EdDWestern Kentucky University
1906 College Heights BoulevardBowling Green KY 42101
Ric Keaster PhD Western Kentucky University
1906 College Heights BoulevardBowling Green KY 42101
ABSTRACTChange is inevitable and can influence numerous events inside and outside an organization The contrasting at-titudes of acceptance and resistance to change are an increasingly interesting topic in todayrsquos global ever-changing and competitive environment Discovering the behavioral origins of employeesrsquo reactions to change is an integral part of understanding the way in which individual mindset may play a role in coping with organizational change and resistance This body of knowledge may give organizations insight for creating a competitive advantage over their counterparts
Conceivably it can be argued that some researchers view change as a process of gradual adaptation that is largely in-fluenced by people in organizations who react to internal and external pressures while others view it as an emergent event due to environmental selections (Demers 2007) Through both concepts successful navigation through change events relies on the manner in which humans respond to these occasions
The current study employed a descriptive non-experimental correlational design to examine individualsrsquo self-rating of their level of mindfulness tolerance of ambiguity and resistance to change in four industries located in Kentucky The quantitative study sought to identify the strengths of the relationship of the chosen variables using validated instruments ndash Langerrsquos (Pirson Langer Bodner amp Zilcha-Mano 2012) Langer Mindfulness Scale (LMS14) Bud-nerrsquos (1962) Tolerance of Ambiguity Scale (TOA) and Oregrsquos (2003) Resistance to Change Scale (RTC) Regression models were utilized to evaluate multivariate relationships among the variables Based on the findings in the current study the results indicated that no differences lie between group comparisons of organizational or demographic fac-tors when examining the relationship among the elements of mindfulness tolerance of ambiguity and resistance to change Bivariate correlations yielded both strong positive and negative relationships among the three scales assessed by salary (exempt and non-exempt) employees located across the different industries (p lt 01)
Brian Dunican amp Ric Keaster Acceptance of Change Exploring the Relationship among Psychometric Constructs and Employee Resistance
28 International Journal of the Academic Business World 29Fall 2015 (Volume 9 Issue 2)
cal for organizations to have the dexterity to accept new changes and adapt to survive (Gondo et al 2013 Jacobs 2005) Discovering the behavioral origins of employee re-actions to change is an integral part of understanding the recipe for flexibility longevity and organizational success Researchers have separately alluded to varying degrees of social psychological constructsmdashparticularly elements of mindfulness and tolerance of ambiguitymdashand their influ-ence on individualsrsquo attitudes toward change and resis-tance (Banning 2003 Langer 1993)
BACKGROUND
By its nature change in organizations is inherently stress-ful causing increased anxiety among employees at each level of the organization This environment of uncertain-ty can threaten the balance of control often distracting organizations from obtaining the stability needed to sur-vive and adapt to change Researchers have analyzed sev-eral techniques for strengthening the idea of overcoming uncertainty Carson and Langer (2006) stated ldquoActively thinking about paradoxes increase onersquos ability to toler-ate ambiguity and decreases the anxiety associated with uncertainty In a separate study Weinstein Brown and Ryan (2009) contended that increased mindfulness in individuals promoted greater attention and awareness in situations (organizational change for example) perceived as stressful or threatening
Leaders throughout organizations must possess the skills and cognitive experience to manage varying degrees of uncertainty and balance the levels of tolerance within their organizations (Lane amp Klenke 2004) This notion is reinforced by Topping (2002) in that change implies uncertainty and uncertainty can drive individuals to feel afraid uncomfortable threatened anxious and as a result resistant to change On the contrary acknowl-edging uncertainty can lead to the exploration for clarity and challenges of the status quo (Geller 2002) A rapidly growing amount of literature is available on mindfulness which insinuates how this construct could aid in navigat-ing through areas of uncertainty (Brown amp Ryan 2004 Lane amp Klenke 2004 Langer 1993 Weinstein et al 2009) Brown and Ryanrsquos (2004) multifaceted definition of mindfulness recognized it as ldquoa phenomenon with functional import for outcomes as diverse as physical health psychological well-being work and sports perfor-mance and relationshipsrdquo (p 242)
The process of conforming to change or an innovation may seem difficult for individuals within organizations yet examples exist in which individuals adapt very easily and seem to flourish within this environment Judge et al (1999) explained that organizational change has been predominately conducted at a middle range or macro
level rather than at the micro individual level Changes in organizations are not always clear even for the leaders Through the vagueness of change innovative organiza-tions deliberately take actions to avoid misinterpretations and to improve the process (Limerick Passfield amp Cun-nington 1994) ldquoAs organizational structures become less hierarchical and more fluid and amorphous tolerance for ambiguity and uncertainty is likely to emerge as a quality that differentiates effective from ineffective leadersrdquo ac-cording to Lane and Klenke (as cited in Ehrlich Meindl amp Viellieu 1990 p 69) As organizations are naturally subject to uncertainties the concept of increasing employ-eesrsquo abilities to deal with ambiguous situations may lead to more success or important gains in knowledge about organizations
Resistance to Change
The literature presents an enduring consensus on the premise that it is human nature to resist change and ele-ments related to the process of change (Coch amp French 1948 Conner 1992 Oreg 2003 OrsquoToole 1995 Zander 1950) This notion of natural resistance is supported by Kotter (1995) as he described change as the force of shift-ing conditions within the human communities Contest-ed by Dent and Goldberg (1999) the phrase resistance to change should be reevaluated under a more conventional definition Although the researchers supported the belief that resistance is natural their views have challenged the idea of the way in which individuals resist change Blindly supporting the belief that one can resist change may be counterproductive and may direct the focus of organiza-tions away from the actual issues The idea of contradict-ing this belief opens the possibilities that inefficiencies in the process of change and its impact on individuals should be acknowledged and explored (Mabin Forgeson amp Green 2001) As a whole regardless of the process resistance to change is driven at the individual level and is leveraged by organizations to foster change (Conner 1992 Judson 1991)
Employees of organizations may withdraw from the fear of ideas they do not fully understand or act rebellious to-ward seemingly unclear decisions made by management without proper cause Ideally change within organiza-tions should be straightforward clear and concise prior to implementation More often this is not the case for individuals who implement the groundwork or for those who are being impacted by the change (Judson 1991) Al-ternately studies have demonstrated that some employees with a higher tolerance of ambiguity are more susceptible to change and may even thrive within this environment (Oreg 2003) As a whole organizations have struggled with implementing new ideas changing their culture and
reacting to market demands nevertheless many are will-ing to change to remain competitive
Dent and Goldberg (1999) found that at the individual level resistance to change can arise from those whose jobs are directly impacted and can cause a rippling effect through the organization Fundamentally individuals are creatures of habit and are annoyed by pressures in organi-zations that force employees to choose a different behavior or accept a reward system that may not seem beneficial However they are willing to change their behaviors when their beliefs of the benefits of the change outweigh the benefits in their current environment (Armenakis amp Be-deian 1999) In other words attitude toward the change affects onersquos willingness to consider and even implement the change
ATTITUDES AND CHANGE
Some change efforts within organizations are successful some are not Kotter (1995) monitored approximately 100 companies over a decade to observe the fundamental changes made in fluctuating business environments The research included examples of successes examples of fail-ures and illustrations of companies that remained stag-nant as they suffered through misguided steps Outlined by Kotter (1995) successful changes within companies encompassed eight steps (a) creating a sense of urgency (b) forming a guiding coalition (c) creating a compel-ling vision (d) communicating the vision for buy-in (e) empowering and acting on the vision (f) creating quick wins (g) increasing credibility through small wins and (h) linking success to new approaches In an earlier ap-proach Judson (1991) proposed five steps to enhance the process of change by engaging employeesrsquo active participa-tion through (a) analyzing and planning the change (b) communicating the plan for change (c) gaining buy-in and acceptance (d) changing the status quo to the desired state and (e) institutionalizing the new state of change Through these steps the common link described for suc-cessful changes involved employeesrsquo comprehension of the change and their personal adaptation to the new way of thinking and working
Iverson (1996) supported the concept that organizational change could be easier when employees have higher per-sonal commitments through healthy professional rela-tionships positive employee morale job satisfaction and positive recognition Moreover employees who have a sol-id desire to perform well and are willing to embrace new challenges even in the absence of clarity also understand the importance of change within organizations Further-more Gaumlrtner (2013) reinforced the concept that employ-eesrsquo attitudes and perceived flexibility toward change were influenced through a subset of mindfulness Although it
is not a new term mindfulness supports the concepts at-tributed to attention awareness engagement and being comfortable with new ideas that may impact areas within an individualrsquos control (Langer 1993)
The Problem Defined
With the continuous expansion of globalization and the rising unpredictability of consumer demands economic pressures and technological advancements organiza-tions have been required to change to remain competi-tive Change is inevitable The organizations that master agility and are adaptive to the ever-changing environment will possess the recipe to emerge triumphant over their competitors In reality every organization must change yet the process is not always smooth or effective Hypo-thetically within the organizational structure there are individuals who visualize the change others who develop and organize the change and those who implement and perform the change (Isabella 1990) At times roles of in-dividuals may overlap due to the size of the organization and the responsibilities entailed within each role Directly or indirectly everyone throughout the organization is im-pacted by the change perhaps some individuals are able to cope with change better than others A study of the relat-ed factors of mindfulness and tolerance of ambiguity may lead to insights about individualsrsquo resistance to change
Defining the Problem of Resistance
Resistance to change refers to adverse human forces that impact the processes of change Kotter (1995) empha-sized that organizational resistance is often helped along through the mismanagement of change and by ignoring its impact on the processes Maurer (2009) suggested that resistance will happen often due to failures from previ-ous change implementations Lewin (1947) one of the most influential early researchers of change realized that change was not an event but rather a living process He conceptualized the process of change through a model composed of three steps unfreezing change and refreez-ing His initial step introduces the idea of resistance in-dividuals must give up something before accepting some-thing new Though simple his ideas have been expanded upon by numerous researchers and have been developed into various theories of change Zander a close colleague of Lewin defined resistance to change as ldquobehavior which is intended to protect an individual from the effects of real or imagined changerdquo (as cited by Dent amp Goldberg 1999 p 34)
Mabin et al (2001) found that seemingly rebellious em-ployees manifest their fears of change due to uncertainty In addition perceived resistance may be disguised through
Brian Dunican amp Ric Keaster Acceptance of Change Exploring the Relationship among Psychometric Constructs and Employee Resistance
30 International Journal of the Academic Business World 31Fall 2015 (Volume 9 Issue 2)
the camouflage of untimely surprises past resentment ad-ditional job duties or the exposure of personal vulnera-bilities In isolated cases changes within the organization may cause a true threat to safety quality cost or the com-panyrsquos reputation Ignoring the symptoms of resistance within the change process could have disastrous results Judson (1991) agreed that resistance to change is not the fundamental problem but a symptom hiding basic under-lying circumstances He also developed a continuum of reactions to change ranging from indifference (no resis-tance) to active even aggressive resistance
Research has validated the importance of evaluating the reactions and the attitudes of individuals toward organi-zational change and their desire to succeed (Judge et al 1999 Oreg 2006) Developed and validated by Oreg (2003) the Resistance to Change scale has been widely used and accepted by academic works to measure an indi-vidualrsquos disposition toward resistance to change Further-more Oreg outlined four subscales as an exploratory anal-ysis to categorize an individualrsquos reaction to resist change (a) routine seeking (b) emotional reaction to impose change (c) cognitive rigidity and (d) short-term focus Supportive research (cited in Oreg 2003) has found the factors of openness to change tolerance of ambiguity and risk aversion as predictors for managers coping with the stress of change within their organizations An exhaustive amount of research has been conducted on the broad topic of resistance to change yet little is known on the relation-ship of how the psychological constructs of mindfulness and tolerance of ambiguity influence resistance to change within organizations Early researchers such as Coch and French (1948) viewed resistance to change as an obstacle of contention during the process of changes within organiza-tions One of their studies conducted in a sewing factory revealed that employees retaliated against change through acts of aggression controlling restrictions of throughput high turnover rates increased complaints and reports of dissatisfaction with management In line with earlier studies the use of the term resistance to change gained popularity beginning in the 1950s following Lewinrsquos (1947 1951) works related to field theory and social sci-ences Resistance to change is commonly accredited to the unfreezing stage of Lewinrsquos (1951) change model (Ar-menakis amp Bedeian 1999) Naturally portrayed as a nega-tive barrier to change resistance to change is frequently defined using Lewinrsquos physical science-related terminol-ogy as a restraining force to maintain the current state of equilibrium (Dent amp Goldberg 1999) Since that time resistance to change has been widely acknowledged and associated with the process of change organizational de-velopment and change theories and models Other schol-ars have conceptualized resistance to change as an emo-tional reaction rather than a behavioral response As an
example Argyris and Schon (1978) suggested resistance in terms of defensive routines and frustration during the process of change Kanter (1985) supported this notion describing feelings of uncertainty and loss of control for individuals facing change In other terms of defining re-sistance Lawrence (1954) used an analogy to compare re-sistance to change as pain within the human body that is used as a signal to communicate that something is wrong ldquoThe resistance like the pain does not tell what is wrong but only that something is wrong And it makes no more sense to try to overcome such resistance than it does to take a pain killer without diagnosing the bodily ailmentrdquo (p 56) This analogy highlighted the parallels between re-sistance and overcoming it through a practicable solution
Mindfulness
Mindfulness is a concept in educational psychology that has been primarily defined by Dr Ellen Langer a so-cial psychology professor at Harvard University Langer (1993) defined mindfulness as ldquoan open creative proba-bilistic state of mind in which the individual might be led to finding differences among things thought similar and similarities among things thought differentrdquo (p 44) Langer (1997) further explained three characteristics of mindfulness ldquo(a) continuous creation of new categories (b) openness to new information and (c) having an im-plicit awareness of more than one perspectiverdquo (p 4) The Mindfulness Scale validated by Pirson et al (2012) oper-ationalizes the construct and identifies the four subscales of novelty-seeking engagement novelty-producing and flexibility to explain the broad psychometric construct Brown and Ryan (2003) defined mindfulness as ldquoa quali-ty of consciousness that is characterized by clarity and viv-idness of current experience and thus stands in contrast to the mindlessrdquo (p 823) Different from Langerrsquos definition that evaluates dispositional differences in reflective con-sciousness behavioral routines over time Ryan and Brown focused on the presence or absence of attention to and the awareness of events occurring in the present moment For the purpose of the current study the ideas of mindfulness were presented through the literature of Langer Further-more mindfulness is believed to play an important role in disengaging individuals from automatic thoughts habits and unhealthy behavior patterns and may contribute to well-being and happiness in a direct way (Brown amp Ryan 2003)
Tolerance of Ambiguity
Tolerance of ambiguity describes an individualrsquos behavior in unclear or insecure situations and how one reacts to the lack of clarity or uncertainty (Banning 2003) Devel-oped by Frenkel-Brunswik (1948) tolerance of ambigu-
ity has gained attention from researchers over the past 60 years Frenkel-Brunswik was one of the first to present a comprehensive analysis of ambiguity and was influenced by earlier works of Germany psychologist Erich Jaensch Frenkel-Brunswik described tolerance of ambiguity as an ldquoemotional and perceptual personality variablerdquo (cited in Furnham amp Ribchester 1995 p 180)
Budner (1962) later defined tolerance for ambiguity as ldquothe tendency to perceive ambiguous situations as desir-ablerdquo and intolerance for ambiguity as ldquothe tendency to perceive ambiguous situations as sources of threatrdquo (p 29) Budner developed the Tolerance of Ambiguity Scale to further interpret the complex concept of ambiguity and individualsrsquo responses to it Through the development of the Tolerance of Ambiguity Scale three subscales (ie novelty complexity insolubility) emerged to provide in-sight into the more abstract larger construct A decade later Norton (1975) defined tolerance of ambiguity as the degree to which an individual is cognitively willing to tolerate uncertainty vagueness or nebulous information and is able to act upon the knowledge
Employees resist change at all levels of the organization Although some individuals openly accept change many do not Determining the varying degrees of each psycho-metric construct on resistance along with their combi-nation toward resistance to change may reveal common areas of opportunity related to organizational change The following general research question is offered How are the psychometric constructs of mindfulness and toler-ance for ambiguity related to resistance to change within organizations
Empirical Studies and Questions
Numerous studies have alluded to resistance to change some have focused on the individuals (eg Bovey amp Hede 2001 Coghlan 1993 Ford Ford amp McNamara 2002) while others have explored organizations (eg Arm-bruster Bikfalvi Kinkel amp Lay 2008 Coch amp French 1948 Greenwood amp Hinings 1996 Lawrence 1954 Stanley Meyer amp Topolnytsky 2005) Van Dam Oreg and Schyns (2008) stated ldquoA review of the past empirical research reveals that resistance to change has been concep-tualized in three ways as a cognitive state as an emotion as a behavioral intentionrdquo (p 316) As an emotion some studies have revealed that employees who display nega-tive perceptions toward organizational change may have an overall negative outlook on change thus perpetuat-ing resistance (Armenakis Harris amp Mossholder 1993 Stanley et al 2005) Extreme measures of resistance to organizational change have been displayed in other stud-ies through sabotage slowdowns and strikes (Armenakis et al 1993) Universally resistance to change has been
recognized to have a significant impact on the outcomes of organizational change yet individuals within the or-ganization are perceived to be the major blockage or im-pediment (Mabin et al 2001) Based on the literature concerning the analysis of change empirical studies have identified a wide range of factorsmdashnamely organization-al managerial behavioral and individualmdashthat promote or impede resistance in organizations
Organizations are faced with the challenges of changing and responding to current and future trends at an un-precedented rate in todayrsquos global environment (Burke 2014) Twenty-five years ago Offermann and Gowing (1990) found that American organizations alone had spent over a record 210 billion dollars to prepare leaders to thrive in organizational change In addition to money an immeasurable amount of time and energy have been dedicated to nurturing leadership and key individuals to navigate others through this complex but important pro-cess Nonetheless the blueprint is far from perfect The readiness of individuals within the organization to plan and implement proactive measures may determine the or-ganizationrsquos competitiveness The current study examines the factors of mindfulness and tolerance of ambiguity and how they relate to individualsrsquo perceptions of resistance to change The specific research questions are the following
1 How do demographic factors of the respondents and the organizational factors under which they work relate to the psychometric scales of Mind-fulness and Tolerance of Ambiguity and their influence on Resistance to Change
2 After controlling for demographic factors how does psychometric mindset (Sub-constructs of Mindfulness and Tolerance of Ambiguity) influence individual Resistance to Change (a) Routine seeking (b) Emotional reaction (c) Short-term focus (d) Cognitive rigidity
3 What is the degree of relationship among these measures of Mindfulness and Tolerance of Am-biguity
4 The following model characterizes the current study
Highlights of the Methodology
When considering the measurement of the perceptions of resistance to change within organizations various meth-ods have been utilized to illustrate relationships among different constructs (Oreg 2003 Oreg Vakola amp Ar-menakis 2011) In the current quantitative non-exper-
Brian Dunican amp Ric Keaster Acceptance of Change Exploring the Relationship among Psychometric Constructs and Employee Resistance
32 International Journal of the Academic Business World 33Fall 2015 (Volume 9 Issue 2)
imental study data were collected from three validated instruments ndash Langerrsquos (Bodner amp Langer 2001) Langer Mindfulness Scale (LMS) Budnerrsquos (1962) Tolerance of Ambiguity Scale (TOA) and Oregrsquos (2003) Resistance to Change (RTC) scale Regression models were used to assess the univariate relationships among the constructs Additionally descriptive statistics were used to include the mean median mode standard deviation and other selected variables A multiple linear regression analysis determined the relationship between factors of mindful-ness and tolerance of ambiguity and their influence of resistance to change Bivariate correlations were used to compute the psychometric scores from each instrument and resistance to change ratings to test the significance of the relationships between each subscale Overall statisti-cal analyses were conducted in multiple phases to investi-
gate the relationship between the individual psychomet-ric traits and resistance for salary exempt and non-exempt employees in industrial sites located in Kentucky
Participants in the Study
The population represented a microcosm of several indus-tries in the manufacturing sector within the proximity of Warren County The data collected were based on a con-venient sample A total of 65 participants volunteered to complete an electronic survey that was designed to capture complete responses to a total of 48 questions Participants were not allowed to proceed to the next page of the survey unless all questions on the current page were completed Three participants did not complete the survey and their responses were not included in the end results From the
population of 183 salaried (exempt and nonexempt) em-ployees 65 surveys were officially returned constituting a response rate of 36 Managerial-type jobs dominated 36 of the sample population followed by roles in tech-nical support which reflected 169 Six categories of job types and an ldquoOtherrdquo category were used for the respon-dents
Scoring Method for Each Scale
Resistance to Change Scale
Oregrsquos (2003) Resistance to Change Scale is comprised of 17 items with four subscales ndash routine seeking emo-tional reaction short-term focus and cognitive rigidity Each subscale relates to the extent to which individuals seek routines react to emotions during change encom-pass short-term focus during change and the frequency to which individuals change their minds The overall range of the scale including the subscales is scored between 1 and 6 with 1 representing the least level of resistance In-dividuals scoring higher on the overall scale or subscales indicate a higher resistance to change
Langer Mindfulness Scale
The Langer Mindfulness Scale (Pirson et al 2012) con-tains 14 items and is composed of three subscales ndash novelty seeking engagement and novelty producing The 7-point scale is scored such that higher scores indicate a greater level of awareness toward thinking High scores for novel-ty producing insinuate one would perceive new situations as opportunities to learn new information Individuals with high scores for engagement are more susceptible to noticing details within their environment as opposed to others Higher novelty producing scores indicate that individuals are likely more creative and predisposed to generating new ideas when faced with new information
Tolerance of Ambiguity Scale
Budnerrsquos (1962) Tolerance of Ambiguity Scale is a 16-item scale with ratings ranging from 1 to 7 1 represents strong disagreement indicating a greater tolerance for ambiguity It is important to note that higher scores relate to greater intolerances for ambiguity All results were re-ported at the aggregate level
RESULTS
Statistical data analyses were performed on survey data comprised of the following three instruments Langer Mindfulness Scale (LMS14) Tolerance of Ambigu-
ity Scale (TOA) and Resistance to Change (RTC) scale Findings were reported from the analyses of data col-lected from 65 participants responding to the Qualtrics Web-based survey In particular analyses were conducted through bi-variant correlation analyses (also known as Pearsonrsquos r) independent t-tests and Cronbachrsquos alpha The strengths of the relationships were predicated on Co-henrsquos (1988) interpretation Coefficient values between 10 and 29 were considered small or weak those between 30 and 49 were considered moderate and those between 50 and 10 were considered large or strong
Analysis of Each Research Question
The first research question explored the relationship of de-mographic and organizational factors to the psychomet-ric scales of Mindfulness and Tolerance of Ambiguity and their influence on Resistance to Change Descriptive sta-tistics reflected both demographic and organizational fac-tors ndash gender education years at the company and direct reportsmdashfor the 65 employees who participated in the current study The distributions of variables were distrib-uted evenly between only two variables years at the com-pany and direct reports Other demographic variables including ethnicity and age were recorded A statistical analysis was not conducted due to the uneven distribution of the variables Of the 65 participants 59 were Caucasian and the remaining 6 were minorities The ages of the par-ticipants ranged from 28 years to 65 years Additionally frequency distributions and data analyses were not con-ducted for individual sites to protect anonymity All re-sults were reported at the aggregate level and included the following categories for the participating industries Cup Manufacturing Personal Care Manufacturing Con-struction and Rubber to Metal Bonding Manufacturing
Gender Male and Female
Although more than twice as many males than females participated in the current study independent t-tests were conducted to determine whether differences existed be-tween the mean scores of the scales and subscales for male and female employees No statistically significant differ-ences were found between the outcome of the psychomet-ric constructs (Mindfulness and Tolerance of Ambiguity) and Resistance to Change except on one subscale Cogni-tive rigidity revealed a statistical difference between the scores of males (n = 45 M = 381 SD = 063) and females (n = 20 M = 336 SD = 086) t (63) = 234 p = 05 α = 05
Figure 1 Logic model for hypothesized relationships among
Psychometric Constructs Demographic Controls and Degree of Resistance to Change
INDEPENDENT VARIABLES
Degree of Resistance
Demographic Factors
-----
Age Gender
Ethnicity Education
____________
Organizational Factors
----- Years at Current Company Type of Current Position
Type of Industry or Category Number of Direct Reports
Resistance to Change -----
Routine Seeking Emotional Reaction Short-term Focus
Cognitive Rigidity
Tolerance of Ambiguity
----- Novelty
Complexity Insolubility
Mindfulness -----
Novelty Seeking Engagement
Novelty Producing
Brian Dunican amp Ric Keaster Acceptance of Change Exploring the Relationship among Psychometric Constructs and Employee Resistance
34 International Journal of the Academic Business World 35Fall 2015 (Volume 9 Issue 2)
Education
Due to the imbalanced distributions of participants sta-tistical analysis for Education was not performed The frequency distribution reflected that 5231 (34) of the participants possessed a four-year degree 1231 (8) ob-tained a masterrsquos degree or higher 2615 (17) possessed a two-year degree or some college while the reaming 923 (6) were high school graduates
Direct Reports and No Direct Reports
An individual variances t-test was conducted and failed to reveal a statistically reliable difference between the mean scores of salaried employees without direct reports and salaried employees with direct reports As an example scores from routine seeking a subscale of resistance to change were not significantly different between employ-ees without direct reports (n = 32 M = 312 SD = 096) and employees with direct reports (n = 33 M = 291 SD = 085) t (65) = 093 p = 037
Years at the Company
A one-way analysis of variance (ANOVA) was calculated on participantsrsquo ratings of the psychometric constructs and resistance to change as a comparison to the number of years at the company Comparisons indicated no sta-tistically significant differences were presented between groups of 0 to 4 years 5 to 10 years 11 to 20 years and 21 years and greater As an example on novelty-seeking a subscale of the Langer Mindfulness Scale the analysis was not significant between the four groups F(3 61) = 31 p = 82
The second research question used bivariate correlations to determine the strength of the relationships between the psychometric constructs (Mindfulness and Tolerance of Ambiguity) and Resistance to Change including the four subscales All of the Pearson correlations were significant across each of the findings with the exception of the LMS scale and Cognitive Rigidity of Resistance to Change subscale r(65) = -225 p = 072 The overall LMS scales reflected a strong negative relationship r(65) = -530 p lt 001 with the RTC scale The TOA scale revealed a mod-
Table 1 Descriptive Statistics and Correlations among Responses of Tolerance of
Ambiguity Scale Langer Mindfulness Scale and Subscales and Resistance to Change and Subscales
Scales LMS_NS LMS_NP LMS_E TOA_ Tot RTC_RS RTC_ER RTC_STF RTC_CR
LMS_NS (77)
LMS_NP 76 (72)
LMS_E 49 51 (69)
TOA_Tot -48 -53 -32 (72)
RTC_RS -51 -50 -41 65 (85)
RTC_ER -36 -37 -36 41 71 (88)
RTC_STF -53 -47 -38 60 77 80 (90)
RTC_CR -28 -26 -04 44 51 45 41 (86)
of Items 5 5 4 16 5 4 4 4
Mean 598 504 556 376 342 285 367 322
SD 071 94 102 71 110 104 73 81Note N = 65 Cronbachrsquos alpha reliabilities for each dimensionconstruct are listed in parentheses on diagonal Cronbachrsquos Alpha measures indicated a high internal consistency among the items reflected in each scale p lt 05 level (two-tailed) p lt 01 level (two-tailed)
Table 2 Descriptive Statistics and Correlations among Responses of the Total Tolerance of
Ambiguity Scale Langer Mindfulness Scale and Resistance to ChangeLMS_Tot Mean TOA_Tot Mean RTC_Tot Mean
LMS_MeanTotal (86)
TOA_Meantotal -53 (72)
RTC_Meantotal -53 62 (93)Number of items 14 16 17Mean 552 376 301Standard Deviation 75 71 91Note N = 65 Cronbachrsquos alpha reliabilities for each dimensionconstruct are listed in parentheses on diagonal No subscales for Tolerance of Ambiguity were referenced in research Cronbachrsquos Alpha measures indicated a high internal consistency among the items reflected in each scale p lt 05 level (two-tailed) p lt 01 level (two-tailed)
Table 3 Descriptive Statistics and Correlations among Responses Related to Operational and
Demographic Factors Tolerance of Ambiguity Scale Langer Mindfulness Scale and Sub-scales and Resistance to Change and Subscales
ME
AN
SD AG
E
YR
SWR
K
DR
RPT
S
TO
A_M
LMS_
M
LMS_
NS
LMS_
NP
LMS_
E
RT
C_M
RT
C_R
S
RT
C_E
R
RT
C_S
TF
RT
C_C
R
AGE 4571 782 100YRSWRK 1283 943 52 100DRRPTS 1005 2162 -18 01 100TOA_M 376 71 15 11 -02 100LMS_M 552 75 -07 -07 10 -53 100LMS_NS 598 71 -12 -12 04 -48 87 100LMS_NP 504 94 -05 01 18 -53 90 76 100LMS_E 556 102 -01 -10 01 -32 78 49 51 100RTC_M 322 81 -14 -10 -08 62 -53 -51 -48 -37 100RTC_RS 301 91 -13 -07 -04 65 -55 -51 -50 -41 90 100RTC_ER 342 110 -23 -17 -07 41 -43 -36 -37 -36 90 71 100RTC_STF 285 104 -05 00 -06 60 -54 -53 -47 -38 91 77 80 100RTC_CR 367 73 -07 -08 -14 44 -23 -28 -26 -04 65 51 45 41 100
Note N = 65 The correlation coefficient ranges from -1 to +1 with -1 indicating a perfect negative correlation +1 indicating a perfect positive correlation and 0 indicating no correlation
Brian Dunican amp Ric Keaster Acceptance of Change Exploring the Relationship among Psychometric Constructs and Employee Resistance
36 International Journal of the Academic Business World 37Fall 2015 (Volume 9 Issue 2)
erate positive correlation r(65) = 624 p lt001 Further bivariate analyses for LMS explored the strength of the re-lationships between the subscales of the Langer Mindful-ness Scale and the subscales of the Resistance to Change scales The correlational analysis was statistically signifi-cant between all variables except Engagement of the LMS and Cognitive Rigidity of RTC r(63) = -35 p = 781 concluding that the variables were unrelated
The last research question explored the degree of the re-lationship between Mindfulness and Tolerance of Am-biguity Bivariate analyses were used to correlate the re-lationship between the two psychometric constructs The correlations revealed a significantly strong negative rela-tionship between the total mean score of the LMS and the total mean score of the TOA r(63) = -53 p lt 01 The mean scores for each of the LMS subscales compared to the total mean of the TOA showed the following Nov-elty-seeking and TOA r(63) = -48 p lt 01 Novelty-pro-ducing and TOA r(63) = -53 p lt 01 and Engagement and TOA r(63) = -32 p lt 01 It is important to note that higher scores on the Tolerance of Ambiguity scale indicate a greater intolerance of ambiguity Tables 1 and 2 display a descriptive analysis and correlations for each of the scales and subscales The correlations between vari-ables are presented in Table 3
LIMITATIONS OF THE STUDY
Research inherently contains limitations The current study is no exception First the nature of measuring psy-chometrics is subjective Since psychometrics studies mea-sure the way in which individuals think and act (Norton 1975) influences of the organizationrsquos environment could affect individualsrsquo responses to questions Additionally external variables at the time of data collection not related to the study itself can skew the responses and influence the outcomes Other views of limitation rest on the gen-eralizability of the results which may be limited for the following reasons (a) the unit of analysis is at the indi-vidual level (b) data were collected from a limited num-ber of operations within the state of Kentucky through convenience sampling and (c) individual biases that may be introduced at the time of testing
The unit of analysis for data collection rests at the indi-vidual level rather than the group level due to the acces-sibility of the employees Although the survey collection method allows for comparison with larger groups it lim-its the opportunity to explore issues in depth therefore assumptions are made for individuals in similar groups Next the data collected represents limited industries in the state of Kentucky restricting the number of partici-pants and the ability to generalize outcomes to other in-dustries different than those outlined in the current study
Last respondentsrsquo values interests and beliefs regarding the online self-administered surveys may introduce biases unknown by the researcher As a consequence of these limitations and the collection of data during one point in time the results are generalizable only to the groups or populations that are similar to those in the current study
SUMMARY AND CONCLUSION
Change within organizations is inevitable That real-ity will remain constant in organizationsmdashand in onersquos personal and professional life (Conner 1992) The way in which one chooses to cope with change could be a decid-ing factor of success failure or choosing to remain the samemdashwhich in organizations tends to equate with fail-ure particularly if change means simply improving Resis-tance is a natural reaction to change and is part of the hu-man psyche Research and literature support this notion of human nature to resist change and elements related to the process of change (Coch amp French 1948 Conner 1992 Oreg 2003 OrsquoToole 1995 Zander 1950) It is possible that a greater understanding of mindfulness and tolerance of ambiguity could increase the possibilities of new ideas to drive lower resistance to change The current study explored the two psychometric constructs of mind-fulness and tolerance of ambiguity and their relationship to resistance to change within industrial settings Bivari-ate correlations yielded both strong positive and negative correlations among the three scales assessed by salaried employees located across different industries The Langer Mindfulness Scale Budnerrsquos Tolerance of Ambiguity Scale and Oregrsquos Resistance to Change scale were attrib-uted to the foundation of the current study The results contributed to the practical and theoretical significance of individualsrsquo responses to change through the measure-ment of the aforementioned constructs To the extent the findings in the current research could be extrapolated to other industries or organizations a final suggestion should be noted When considering future directions for research related to probing psychometric constructs and resistance to change the current study may have relevance across different nationalities and cultures The elements of change will continue to challenge the fabric of organiza-tions while the internal and external pressures of rising costs variations in supply and demand relentless compe-tition and developing technology test the resolve for sur-vival The readiness of individuals within organizations and their ability to challenge perceptions of change and resistance may determine their competitiveness and ulti-mately their success
REFERENCES
Argyris C amp Schon D (1978) Organizational learning A theory of action research Reading MA Addison-Wesley
Armbruster H Bikfalvi A Kinkel S amp Lay G (2008) Organizational innovation The challenge of measur-ing non-technical innovation in large-scale surveys Technovation 28(10) 644-657
Armenakis A A amp Bedeian A G (1999) Organiza-tional change A review of theory and research in the 1990s Journal of Management 25 293-315
Armenakis A A Harris S G amp Mossholder K W (1993) Creating readiness for organizational-change Human Relations 46(6) 681-703
Banning K C (2003) The effect of the case method on tolerance for ambiguity Journal of Management Edu-cation 27 556-567
Bodner T E amp Langer E J (2001 June) Individual differences in mindfulness The MindfulnessMind-lessness Scale Poster presented at the 13th annual American Psychological Society Conference Toronto Ontario Canada
Bovey W H amp Hede A (2001) Resistance to organisa-tional change The role of defence mechanisms Journal of Managerial Psychology 16(7) 534-548
Brown K W amp Ryan R M (2003) The benefits of be-ing present Mindfulness and its role in psychological well-being Journal of Personality and Social Psychol-ogy 84 822-848 doi1010370022-3514844822
Brown K W amp Ryan R M (2004) Perils and promise in defining and measuring mindfulness Observations from experience Clinical Psychology Science and Practice 11(3) 242-248 doi101093clipsybph078
Budner S (1962) Intolerance of ambiguity as a personal-ity variable Journal of Personality 30 29-59
Burke W W (2014) Organizational change theory and practice Thousand Oaks CA Sage Publications Inc
Carson S H amp Langer E J (2006) Mindfulness and self-acceptance Journal of Rational-emotive and Cog-nitive-behavior Therapy 24(1) 29-43
Coch L amp French J (1948) Overcoming resistance to change Human Relations 1 512-532
Coghlan D (1993) A person-centred approach to deal-ing with resistance to change Leadership amp Organi-zation Development Journal 14(4) 10-14
Cohen J (1988) Statistical power analysis for the behav-ioral sciences Hillsdale NJ Lawrence Erlbaum Associates
Conner D R (1992) Managing at the speed of change How resilient managers succeed and prosper where others fail New York Random House
Demers C (2007) Organizational change theories Thousand Oaks CA Sage Publications Inc
Dent E B amp Goldberg S G (1999) Resistance to change A limiting perspective Journal of
Ehrlich S B Meindl J R amp Viellieu B (1990) The charismatic appeal of a transformational leader An empirical case study of a small high-technology con-tractor The Leadership Quarterly 1(4) 229-247
Ford J D Ford L W amp McNamara R T (2002) Re-sistance and the background conversations of change Journal of Organizational Change Management 15(2) 105-121
Frenkel-Brunswik E (1948) Tolerance toward ambigu-ity as a personality variable American Psychologist 3 268-269
Furnham A amp Ribchester T (1995) Tolerance of am-biguity A review of the concept its measurement and applications Current Psychology 14 179-199
Gaumlrtner C (2013) Enhancing readiness for change by enhancing mindfulness Journal of Change Manage-ment 13 52-68
Geller E S (2002) Leadership to overcome resistance to change It takes more than consequence control Jour-nal of Organizational Behavior Management 22(3) 29-49
Gondo M Patterson K W amp Palacios S (2013) Mind-fulness and the development of a readiness for change Journal of Change Management 13(1) 36-51
Greenwood R amp Hinings C R (1996) Understanding radical organizational change Bringing together the old and the new institutionalism Academy of Manage-ment Review 21 1022-1054
Isabella L (1990) Evolving interpretations as a change unfolds How managers construe key organization-al events Academy of Management Journal 33 7-41
Iverson R D (1996) Employee acceptance of organiza-tional change The role of organizational commitment International Journal of Human Resource Manage-ment 7 122-149
Jacobs P (2005) Five steps to thriving in times of un-certainty Harvard Management Update 10(12) 3-5
Brian Dunican amp Ric Keaster
38 Fall 2015 (Volume 9 Issue 2)
Retrieved from httphbrorgproductfive-steps-to-thriving-in-times-of-uncertaintyanU0512A-PDF-ENG
Judge T A Thoresen C J Pucik V amp Welbourne T M (1999) Managerial coping with organization-al change A dispositional perspective Journal of Ap-plied Psychology 84 107-122
Judson A (1991) Changing behavior in organizations Minimizing resistance to change Cambridge MA Basil Blackwell
Kanter R M (1985) Supporting innovation and ven-ture development in established companies Journal of Business Venturing 1 47-60
Kets de Vries M F R Ramo L amp Korotov K (2009) Organizational culture leadership change and stress INSEAD Working Papers Collection 10 2-26 Re-trieved from httpwwwinseadedufacultyresearchresearchdoccfmdid=41924
Kotter J P (1995) Leading change Why transformation efforts fail Harvard Business Review 73(2) 59-67
Lane M S amp Klenke K (2004) The ambiguity toler-ance interface A modified social cognitive model for leading under uncertainty Journal of Leadership amp Organizational Studies 10(3) 69-81
Langer E J (1993) A mindful education Educational Psychologist 28 43-50
Langer E J (1997) The power of mindful learning Read-ing MA Addison-Wesley
Lawrence P R (1954) How to deal with resistance to change Harvard Business Review 32(3) 49-57 Retrieved from httpedsaebscohostcomlib-srvwkueduehostpdfviewerpdfviewervid=6ampsid =699bab3d-bcec-40d9-ac69-a42c853d72bc40sessionmgr4004amphid=4108
Lewin K (1947) Frontiers in group dynamics II Chan-nels of group life social planning and action research Human Relations 1(2) 143-153
Lewin K (1951) Field theory in social science Selected theoretical papers New York Harper amp Row
Limerick D Passfield R amp Cunnington B (1994) Transformational change Towards an action learning organization The Learning Organization 1(2) 29-40
Mabin V J Forgeson S amp Green L (2001) Harness-ing resistance Using the theory of constraints to assist change management Journal of European Industrial Training 25(234) 168-191
Maurer R (2009) Introduction to change without mi-graines Omaha NE Maurer and Associates Re-trieved from httpextensionmissouriedustaffsde-teams DocumentsChangeW-outMigrarainespdf
Norton R W (1975) Measurement of ambiguity toler-ance Journal of Personality Assessment 39 607-619
Offermann L R amp Gowing M K (1990) Organiza-tions of the future Changes and challenges Ameri-can Psychologist 45(2) 95-108 doi10370003-066X45295
Oreg S (2003) Resistance to change Developing an in-dividual differences measure Journal of Applied Psy-chology 88 680-693
Oreg S (2006) Personality context and resistance to organizational change European Journal of Work and Organizational Psychology 15 73-101
Oreg S Vakola M amp Armenakis A (2011) Change re-cipientsrsquo reactions to organizational change A 60-year review of quantitative studies The Journal of Applied Behavioral Science 47 461-524
OrsquoToole J (1995) Leading change The argument for val-ues-based leadership Boston MA Ballentine Books
Pirson M Langer E J Bodner T amp Zilcha-Mano S (2012) The development and validation of the Langer Mindfulness Scale-Enabling a socio-cognitive perspec-tive of mindfulness in organizational contexts Ford-ham University School of Business Research Paper Re-trieved from httpdxdoiorg102139ssrn2158921
Stanley D J Meyer J P amp Topolnytsky L (2005) Employee cynicism and resistance to organizational change Journal of Business and Psychology 19(4) 429-459
Topping P (2002) Managerial leadership New York McGraw Hill Professional
Van Dam K Oreg S amp Schyns B (2008) Daily work contexts and resistance to organisational change The role of leader-member exchange development climate and change process characteristics Applied Psycholo-gy An International Review 57 313-334 doi101111j1464-0597200700311x
Weinstein N Brown K W amp Ryan R M (2009) A multi-method examination of the effects of mindful-ness on stress attribution coping and emotional well-being Journal of Research in Personality 43 374-385
Zander A F (1950) Resistance to change Its analysis and prevention Advanced Management 4(5) 9-11
International Journal of the Academic Business World 39
INTRODUCTION
Cloud computing is one of the most talked about infor-mation technology topics these days 7 24 Early literature review reveals an endemic confusion of what cloud com-puting is does and what it stands for We posit that the cloud metaphor 3 20 fosters a confusion that persists even today
The goal of this research paper is to look back and make historical sense of cloud computing We try to find the lineage of cloud computing where the phrase cloud com-puting came from who came up with the term and how it found currency in the IT community We trace cloud computing to early timesharing and Application Service Provider (ASP) in the last decade and posit a future of utility computing
Additionally we try to shed light on the current state of cloud computing provide a comprehensive definition of the term and its main building blocks
CLOUD COMPUTING IN THE ACADEMIC LITERATURE
A metaphor
In an article by Ian Foster and Steven Tuecke 3 the authors start by describing the well-known elephant fable where a group of blind people are asked to describe an elephant and not surprisingly each provides a different view
The cloud is a metaphor for the Internet Itrsquos a rebranding of the Internet that is why there is a raging debate By vir-tue of a metaphor itrsquos open to different interpretations 20
Confusion and Frustration
The word ldquocloudrdquo in cloud computing informs very little and it may even misinform ldquoI hated it but I finally gave inrdquo says Carl Bass President and CEO of Autodesk He adds ldquoI didnrsquot think the term helped explain anything to people who didnrsquot already know what it isrdquo20
Giving the lsquocloudrsquo name to the old concept of large shared distributed systems is misleading 4 p 26
Larry Ellison Oraclersquos CEO ldquoThe interesting thing about cloud computing is that wersquove redefined cloud computing everything that we already dohellipI donrsquot understand what we would do differently in light of cloud computing other than change the wording of some of our adsrdquo 1 p 50
In an article in Harvard Business Review (HBR) 22 the author asks a rhetorical question ldquoWhat the heck does it mean to have a lsquocloudrsquo It means that the functions you want like storage communications and applications donrsquot need to live on the device you have in front of you You can get them on demand from the networkrdquo We should ask the question ldquoin a typical non-cloud IS en-vironment do we really have the stated functions on the device in front of usrdquo
Cloud Computing is often confused with Utility Com-puting but they are not the samemdashrather the latter forms part of the former 2
No Definition
Realizing the elephantine nature of cloud computing there is a reluctance to define it Question How would you define cloud computing Answer Cloud computing
The Origin and Construct of Cloud Computing
Nozar Daylami PhD Adjunct Professor
School of Management Information System and Technology Program
California Lutheran University Thousand Oaks CA 91360
ABSTRACTCloud computing is one of the most talked about information technology topics these days A literature review reveals an endemic confusion of what cloud computing stands for This paper tries to shed light on why the term is so confusing We try to find where the phrase cloud computing came from and how it found currency in the IT community We trace cloud computing to early timesharing and Application Service Provider (ASP) in the last decade and posit a future of utility computing This paper also provides a comprehensive definition of the term and its main building blocks
Nozar Daylami The Origin and Construct of Cloud Computing
40 International Journal of the Academic Business World 41Fall 2015 (Volume 9 Issue 2)
is not so much a definition of a single term as it is a trend in service delivery taking place today 3 p 52
An Old Concept
Cloud computing is an old concept it ldquois a throwback to the mainframe model of computingrdquo 19 p 78 Clearly cloud computing is simply remote computing 4 p 26
Internet or Network Computing
Cloud computing as a term for Internet-based computing service was launched by industry giants Google Ama-zon etc in late 2006 24 ldquoIt is the movement of applica-tion services onto the Internet and the increased use of the Internethelliprdquo
The Earliest Publications
In the first article on Cloud Computing in the Communi-cations of ACM 9 it is referred to as ldquothe compute cloudrdquo and is deemed synonymous with ldquoon-demand comput-ing software as a service or the Internet as a platformrdquo Though these other naming conventions are self-explana-tory cloud computing is not
The cloud computing is understood as a shift of the ge-ography of computing It begs the question if it is about moving delivery of a wide variety of information services onto to the Internet why donrsquot we call it ldquoInternet Com-putingrdquo
The first time cloud computing showed up in a HBR pub-lication was in a digital article in April 2008 14 The au-thor states that the move to cloud computing would be disruptive to incumbent players of shrink-wrapped gam-ing software assuming his readers understand what cloud computing entails
A BRIEF HISTORY OF COMPUTING
In the early days of computers they were big and expen-sive So sharing this big expensive gadget was a normal practice Most organizations did not usually own this big machine but those who did had to share it across an en-terprise That was the era of timesharing
However as computers got cheaper and more afford-able every company every department and then finally every person decided to have their own computer How-ever standalone computers are of limited use So we networked them first locally in a Local Area Network (LAN) environment and then far and wide Wide Area
Network (WAN) Then we networked the network and the World Wide Web was born
At the same time in a different parallel universe some-thing else was happening In the early years no commer-cial off-the-shelf software (COTS) was available Every organization had to write its own software program So if you wanted to computerize your accounting general led-ger payables and receivables or run your inventory you had to write your own applications
Buying off-the-shelf applications was also considered ldquooutsourcingrdquo Why Because you were having others do the work for your organization which was supposed to be doing this work for itself So over the years most appli-cation development have been outsourced to burgeoning software companies such as IBM Oracle and SAP
OUTSOURCING AND ASP
In a general sense IS outsourcing is nothing newmdashit has always been considered an option for IT solutions 11 Electronic Data Systems was handling data processing services for Frito-Lay and Blue Cross as early as 1963 IS outsourcing soon became widely known as the second of a three-phase outsourcing phenomenonmdashtraditional out-sourcing being the first phase and application outsourcing being the third 6
In the early years of the last decade xSPs service provid-ers of all stripes were leading into a new generation of IT where it really did not matter where the applications reside as long as we had access to accomplish what we wanted 247 However back then an Application Service Provider (ASP) was thought by some to be another re-incarnation of the old ldquotimesharingrdquo leveraging network technologies 22
However the understanding of an evolving net-centric computing was already there In their book published in 2002 aptly titled NetSourcing authors Kern Lacity and Willcocks 7 define a computing framework and services stack thatrsquos similar to Cloud Computing The authors state ldquoWe selected the term ldquoNetsourcingrdquo as the over-arching name because the common element of any xSP is the delivery of a product or service over a networkrdquo (p 3) The ldquonetworkrdquo however is now synonymous with the ldquoInternetrdquo
Today cloud computing is about getting the job done in whatever way shape or form that may be required Orga-nizations and individuals need the utility of computing and where it comes from by and large is of no concern As early as 1961 Professor John McCarthy predicted that computation may someday be organized as a public utility ldquoEach subscriber needs to pay only for the capac-
ity he actually uses but he has access to all programming languages characteristics of a very large system hellip Certain subscribers might offer services to other subscribers hellip The computer utility could become the basis of a new and im-portant industry 8 McCarthyrsquos notion of ldquoutility comput-ingrdquo is here right nowmdashthat is ldquocloud computingrdquo
This point is confirmed by others 1 p 51 ldquoThe data center hardware and software is what we consider a cloud When a cloud is made available in a pay-as-you-go manner to the general public we call it utility computingrdquo
CLOUD COMPUTING ORIGIN OF THE PHRASE
Coinage of the term ldquocloud computingrdquo has been traced to two individuals who at the time they came up with this term worked for Compaq Computer George Favaloro a Compaq marketing executive and Sean OrsquoSullivan the founder of the now defunct business NetCentric 20
A Compaq internal document marked as confiden-tial dated November 14 1996 and provided by Sean OrsquoSullivan contemplates a Cloud Computing ldquostrat-egyrdquo10
But the creation of this term did not find currency for another decade Many believe the first use of ldquocloud com-
putingrdquo in its modern context occurred on August 9 2006 when then Google CEO Eric Schmidt introduced the term at an industry conference ldquoWhatrsquos interesting [now] is that there is an emergent new modelrdquo Schmidt said ldquoI donrsquot think people have really understood how big this opportunity really is It starts with the premise that the data services and architecture should be on servers We call it cloud computingmdashthey should be in a ldquocloudrdquo somewhererdquo 19
CLOUD COMPUTING DEFINITION
The National Institute of Standards and Technology (NIST SP 800-145) defines Cloud Computing in the fol-lowing way ldquoCloud computing is a model for enabling convenient on-demand network access to a shared pool of configurable computing resources (eg networks serv-ers storage applications and services) that can be rapidly provisioned and released with minimal management ef-fort or service provider interaction This cloud model is composed of five essential characteristics three service models and four deployment modelsrdquo 17
The following diagram places all the pieces together in a visual form
The Conceptual Reference Model
Cloud Computing Reference Architecture NIST Special Publication 500-292
Nozar Daylami The Origin and Construct of Cloud Computing
42 International Journal of the Academic Business World 43Fall 2015 (Volume 9 Issue 2)
Cloud Computing Reference Architecture NIST Special Publication 500-292
NIST Special Publication 500-292 states that ldquothe defini-tion is widely accepted as a valuable contribution toward providing a clear understanding of cloud computing tech-nologies and cloud services It provides a simple and un-ambiguous taxonomy of three service models available to cloud consumers cloud software as a service (SaaS) cloud platform as a service (PaaS) and cloud infrastructure as a service (IaaS) It also summarizes four deployment mod-els describing how the computing infrastructure that delivers these services can be shared private cloud com-munity cloud public cloud and hybrid cloudrdquo 18 Finally the NIST definition also provides a unifying view of five essential characteristics that all cloud services exhibit on-demand self-service broad network access resource pool-ing rapid elasticity and measured service 18
This publication further states that ldquoThese services and their delivery are at the core of cloud computing In the cloud computing model the primary focus is a more eco-
nomic method of providing higher quality and faster ser-vices at a lower cost to the usersrdquo
The Cloud Security Alliance 21 provides a more transpar-ent narrative of what Cloud Computing is ldquoa model for enabling ubiquitous convenient on-demand network access to [a] shared pool of configurable computing re-sources [it] has the potential to enhance collaboration agility scaling and availability and provides opportunity for cost-reduction the model envisages a world where components can be rapidly orchestrated provisioned implemented and decommissioned scaled up or down to provide an on-demand utility-like modelrdquo
A SPATIAL VIEW OF CLOUD COMPUTING
The NIST Computing Reference Architecture is a flat depiction of the cloud computing model A three dimen-sional view of the model by Craig-Wood 2 is a spatial de-piction Here you can see the three dimensions of cloud computing that renders the elephant fable
Computing Services Framework
Infrastructure as a Service (IaaS) As the word ldquoinfra-structurerdquo implies this is the most basic of services Cus-tomers can buy processing storage and network services and then build their own systems on top of this infra-structure A pioneer in the IaaS field is Amazon with its Amazon Elastic Compute Cloud (EC2)
However most big names in the IT field from Micro-soft (Azure) to Google (App Engine) provide IaaS Here customers are not renting specific servers hard drives and network switches or any particular equipment but instead they are utilizing the infrastructure that is most certainly simulated by virtualization software allowing multiple customers to be served by the same array of physi-cal devices IaaS provides the raw power of computingmdashstorage included
Cloud Computing would not be possible without virtu-alization Virtualization is the ability to make a virtual machine (VM) act like a physical computer Just like a physical computer with its own processor operating sys-tem and storage each VM has its own components too The benefit of virtualization though is that you can put much more than only one VM even with different oper-ating systems on the same server Doing so dramatically increases each serverrsquos potential for serving clientsrsquo on-demand needs (8)
Platform as a Service (PaaS) The next level up is where vendors provide not only the raw powermdashthe infrastruc-turemdashbut preconfigured systems running operating sys-tems databases and platforms (programming languages) for building applications For example Microsoftrsquos Azure service provides preconfigured computers running Win-dows and SQL Server And Salesforcecom has Forcecom as its own custom application development platform
In practice the boundary between IaaS and PaaS is not always clear Because IaaS providers most often provide other services such as operating systems database or ap-plication development platform that fall in the PaaS cat-egory In its purest form IaaS can be considered as virtual machines (raw processing power and storage) that can be scaled up and down as you need
Software as a Service (SaaS) Another higher layer is where vendors provide full applications running on cloud infrastructuremdashtheir own or rented from the likes of Amazon Salesforcecom has long been considered one of the most successful SaaS provider Salesforececom CRM was one of the early entrants into the market Salesforcecom prides itself on being a pioneer in Cloud Computing
At Salesforcecom itrsquos all about the Cloud However in their collateral literature dated circa 1993-94 you wonrsquot find any mention of the word ldquocloudrdquo
CLOUD COMPUTING CONCERNS
In survey after survey security is listed as the top concern of Cloud Computing However Cloud Security Alliance (CSA) the industry group that provides security guide-lines and education states that ldquosecurity controls for the cloud computing are for in most part no different than the security controls in any IT environment hellip[however] cloud computing may present different risks to an organi-zation than traditional IT solutionsrdquo 21 p 21
CIOs or CEOs for that matter may feel safer when they ldquoownrdquo versus ldquorentrdquo their IT assets However when you deploy your assets on the Internet for which you eventu-ally will have little choice you will inherit a set of vulner-abilities that are not all that different from the Cloudrsquos Ownership has its own set of financial risks in the form of capital expenditures (CAPEX) that need to be budgeted and spent up front Compare that risk with the far smaller risk of renting (OPEX) which by and large can be dis-continued if needed
Cloud computing technology does not require the use of public networks If your data is too strategically critical and sensitive to be deployed on the Internet you could instead deploy a private cloud that is strictly for your or-ganization Obviously a Private Cloud is more expensive and it needs trained staff However a private cloud lets an organization benefit from cloud technology without the risk of possible public disclosure of its data
Another alternative could be a community cloudmdasha pri-vate cloud that is shared by several organizations for spe-cific needs For example a group of hospitals might create a community cloud to hold patientrsquos medical records
CONCLUSION
Cloud Computing is here to stay and grow Clouds are more versatile than traditional IT networks on many di-mensions They are far more convenient to deploy they have far more potential for collaboration and they are far more scalable than traditional IT ever was The delivery of services is provisioned on global telecommunication net-works that these days have morphed into the Internet And when they mature they will provide a computing utility when and where it is needed
Cloud computing model (adapted from Craig-Wood)
Nozar Daylami The Origin and Construct of Cloud Computing
44 International Journal of the Academic Business World 45Fall 2015 (Volume 9 Issue 2)
BIBLIOGRAPHY
1 Armburst M et al A View of Cloud Computing Communications of the ACM Vol 53 No 4 pages 50-58
2 Craig-Wood K Definition of Cloud Computing incorporating NIST and G-Cloud views httpswwwkatescommentcomdefinition-of-cloud-com-puting-nist-g-cloud Access date April 26 2015
3 Creeger M CTO Roundtable Cloud Computing Communications of the ACM Vol 52 No 8 pages 50-56
4 Cusumano M Cloud Computing and SaaS as New Computing Platforms Communications of the ACM Vol 53 No 4 pages 27-29
5 Foster Ian and Tuecke Steven Describing the Ele-phant The Different Faces of IT as Service wwwac-mqueuecom JulyAugust 2005 pages 26-34 httpdeliveryacmorg10114510900001080874p26-fosterpdf ip=99100108167ampid=1080874ampacc=OPENampkey=4D4702B0C3E38B352E4D4702B0C3E38B352E4D9421298D07BF362E6D218144511F3437ampCFID=505172814ampCFTOKEN=56369758amp__acm__=1429816554_402a40f1d60056fb68e8ccf3fdd96201 accessed April 23 2015
6 Kern Thomas Lacity Mary Cecelia Willcocks Leslie P Netsourcing Renting Business Applica-tions and Services Over a Network Prentice Hall 2002
7 Knoblauch A Deconstructing Cloud Smashwords Edition (Kindle Version) First Edition August 2013
8 Garfinkel Simon (2011 Oct 3) The Cloud Imperative MIT Technology Review httpwwwtechnologyreviewcomnews425623the-cloud-imperative
9 Hayes B Cloud Computing Communications of the ACM Vol 51 No 7 pages 9-11
10 Internet Solution Division Strategy for Cloud Com-puting Compaq Computer Corporation (1996) httpwwwtechnologyreviewcomsitesdefaultfileslegacycompaq_cst_1996_0pdf
11 Lacity M C Hirschheim R Information Systems Outsourcing Myths Metaphors and Realities New York John Wiley amp Sons 1993
12 McAfee A The Year the Cloud Rolled In httpshbrorg2010122010-the-year-the-cloud-rolled Access date April 23 2015
13 McAfee A What Every CEO Needs to Know About the Cloud httpshbrorg201111what-every-ceo-needs-to-know-about-the-cloud Access date April 23 2015
14 McGrath R Whorsquos Disrupting the Gaming Indus-try httpshbrorg200804whos-disrupting-the-gaming-ind Access date April 23 2015
15 Mell P Grance T The NIST Definition of Cloud Computing National Institute of Standards and Technology httpcsrcnistgovpublicationsnist-pubs800-145SP800-145pdf
16 Neumann P Risks and Myths of Cloud Comput-ing and Cloud Storage Communications of the ACM Vol 57 No 10 pages 25-27 The NIST Defi-nition of Cloud Computing httpcsrcnistgovpublicationsnistpubs800-145SP800-145pdf
17 NIST Definition of Cloud Computing httpcsrcnistgovpublicationsnistpubs800-145SP800-145pdf
18 NIST Cloud Computing Reference Architecture National Institute of Standards and Technology Special Publication 500-292 httpwwwnistgovcustomcfget_pdfcfmpub_id=909505
19 Nanavati M Colp P Aiello W and Warfield A Cloud Security A Gathering Storm Communica-tions of the ACM Vol 57 No 8 pages 70-79
20 Regalado Antonio (2011 Oct 31) Who coined cloud computing MIT Technology Review httpwwwtechnologyreviewcomnews425970who-coined-cloud-computing
21 Security Guidance for Critical Areas of Focus in Cloud Computing V30 Cloud Security Alliance httpscloudsecurityallianceorgguidancecsagu-idev30pd
22 Seviokla J Does Cisco Have Its Head in the Clouds httpshbrorg200903does-cisco-have-its-head-in-th Access date April 23 2015
23 Walsh K R Analyzing the Application ASP Concept Technologies Economies and Strategies Communications of ACM Vol 46 No 8 pages 103-107
24 Yang H Tate Mary A Descriptive Literature Review and Classification of Cloud Computing Re-search Communications of Association of Informa-tion Systems Vol 31 2012
Nozar Daylami
46 Fall 2015 (Volume 9 Issue 2)
This page intentionally blank
International Journal of the Academic Business World 47
INTRODUCTION
In their paper ldquoSAS and the Efficient Portfoliordquo Thomp-son and El-houbi (2012) develop a SAS program to calcu-late portfolio weights for efficient stock portfolios Their program improves on existing public domain SAS pro-grams of this type by allowing for portfolios with a rela-tively large number of securities Thompson and El-houbi also claim that their SAS program is an improvement over the Excel programs used to calculate portfolio weights which are sometimes included in investment textbooks They note that users concur that their program is easier to use than those Excel programs which either limit the number of securities that can be included in a portfolio require ldquocorrectionsrdquo or ldquoadjustmentsrdquo to overcome some quirks in the Excel Solver routine or require multiple user interventions
The Thompson and El-houbi program is certainly more elegant and user friendly than the equivalent Excel pro-grams and will provide those with access to the SAS pro-gramming language a valuable tool for learning portfolio management The disadvantage of a SAS program how-ever is that many students will not have easy access to the SAS programming language Students at smaller univer-sities may not have any access to SAS while students at many larger universities may only be able to access SAS at a computer lab on campus
In this paper I modify the Thompson and El-houbi SAS program for use in the open-source R programming lan-guage which is available free of charge for anyone with access to the internet Using the R language program to compute portfolio weights for efficient portfolios main-tains the elegance of the Thompson and El-houbi SAS
program while overcoming the disadvantage of limited SAS availability In addition I extend the Thompson and El-houbi program by making use of a quadratic program-ming package available in R to provide a program that can accommodate short-sale restrictions and position limits
THE R PROGRAMMING LANGUAGE
R is a free programming language for statistical analysis and graphics and runs on many UNIX platforms and on Windows and MacOS It is available under the terms of the Free Software Foundationrsquos GNU General Public License R was developed initially by Robert Gentleman and Ross Ihaka both of the University of Auckland (New Zealand) and is based on the S programming language developed at Bell Labs by John Chambers Since its initial development the popularity of R has grown considerably largely because of its ease of use and because of the avail-ability of many add-on packages that allow users to tackle very sophisticated projects
The base R package may be downloaded at httpcranusr-projectorg That web page also provides links to sources of information about R and basic user manuals There are also many books and manuals now available for purchase that offer information on both basic and special-ized uses of the language In fact Vance (2009) suggests that the growing popularity of the R language at univer-sities language could even result in noticeably lower de-mand for SAS
THE MARKOWITZ PORTFOLIO PROBLEM
As Markowitz (1952) notes an investor following the ldquoex-pected returns-variance of returns rulerdquo will choose an ef-
Optimal Portfolios and the R Programming Language
James A TurnerAssistant Professor of Finance
School of Accounting amp TaxationWeber State University
Ogden UT 84408
ABSTRACTThis paper develops a program in the freely available open-source R programming language to calculate weights for optimal stock portfolios The program retains the advantages the Thompson and El-houbi (2012) SAS program has over similar programs in Excel but avoids the potential problem of limited access to SAS that some students and researchers may face The R program also extends the Thompson and El-houbi program by including the ability to accommodate short-sale restrictions and position limits
James A Turner Optimal Portfolios and the R Programming Language
48 International Journal of the Academic Business World 49Fall 2015 (Volume 9 Issue 2)
ficient portfolio that is a portfolio with maximum ex-pected return for a given variance or one with minimum variance for a given expected return The minimum vari-ance formulation of the portfolio choice problem there-fore requires that the investor choose portfolio weights to minimize the variance of a portfolio with a given expected return The problem also requires that all money be in-vested (which means that the portfolio weights must sum to one) In matrix notation the optimization problem is
where w the choice variable is a k times 1 vector of the weights invested in the k securities in the portfolio V is the port-folio variance-covariance matrix and R is a 2 times k matrix whose first row is a vector of ones and whose second row contains the expected returns of each security in the port-folio M is a 2 times 1 vector whose first element is one (corre-sponding to the constraint that the portfolio weights sum to one) and whose second element is the chosen portfo-lio expected return For now there are no restrictions on short sales so some portfolio weights may be negative
The Lagrangian for the problem is
( ) L w Vw M Rwλprime prime= + minus
where λ is a 2 times 1 vector containing the Lagrangian multi-pliers The first-order conditions for a minimum (which are also sufficient conditions in this case) are
Solving the first-order conditions for w and λ yields
( )( )
11 1
112
w V R RV R M
RV R Mλ
minusminus minus
minusminus
prime prime=
prime=
Thompson and El-houbi following Stephens (1998) let 1 H RV Rminus prime= so that
1 1
1
2
w V R H MH Mλ
minus minus
minus
prime=
=
Stephens (1998 p 36) shows how the elements of the H matrix may be used ldquoto fix any meanvariance point on the efficient frontierrdquo
Min st
w VwRw M
prime
=
2 0
0
L Vw RwL M Rw
λ
λ
part prime= minus =partpart
= minus =part
THE BASIC R PORTFOLIO OPTIMIZATION PROGRAM
The R programming language lends itself very easily to matrix manipulation and matrix computation removing much of the difficulty in solving the standard Markowitz portfolio problem The following R program calculates the portfolio weights for an efficient portfolio using stock return data to estimate expected returns and the variance-covariance matrix The user must specify the desired port-folio expected return The program can accommodate portfolios up to about 50 stocks Beyond that number precision limitations of the R language may make the variance-covariance matrix ldquocomputationally singularrdquo and unable to be inverted
The first step in the program is to read in the return data R can input data from many file types but in the present example the data are stored in a comma-delimited Excel file called ldquoReturnscsvrdquo which contains stock return data In this case the Excel file includes a header row labeling each column of returns with identifying information but no row names The program first reads in the data and then determines the number of securities (number of col-umns in the matrix) as shown on the facing page
ADDING SHORT-SALE CONSTRAINTS AND POSITION LIMITS
The above formulation of the portfolio choice problem places no restrictions on short sales and does not accom-modate position limits In reality individual investors and some fund managers may face requirements prohibit-ing short sales Fund managers may also face requirements that either limit the amount that may be invested in one security or sector or instead that a minimum percentage of funds be invested in a certain security or sector Dai Lin and Liu (2011) list several examples of real-world po-sition limits such as a requirement that a small-cap mutu-al fund invest at least a minimum percentage of its funds in small-company stocks In mathematical terms these short-sale restrictions and position limits can be expressed as a series of inequality constraints While reformulating the portfolio choice problem to add inequality constraints is not difficult doing so makes actually solving the prob-lem considerably more difficult
With short-sale restrictions and position limits the port-folio choice problem becomes
0
Min st
w VwRw MSw w
prime
=ge
where w is still the choice variable S is an m times k matrix that defines both the short-sale constraints on the k se-curities in the portfolio and m minus k other restrictions If there are short-sale constraints but no other restrictions the S matrix is simply a k times k identity matrix which when multiplied by the vector w results in the requirement that
0 iw ige forall If there are other restrictions the sub-matrix of S consisting of the first k rows and k columns of S is an identity matrix and the other restrictions are specified by suitable choices of the elements of the remaining rows of S For example suppose there is a position limit placing a maximum of p on the percentage invested in the sev-enth security so that 7 w ple Since the constraints in the optimization problem above have been expressed as non-negativity constraints this position limit must instead take the form 7 w pminus ge minus The row of S corresponding to
the position limit will consist entirely of zeros except for the seventh element which will be minus1 and corresponding element of the w0 vector would be p
Introducing other forms of position limits simply requires adding the appropriate rows to the S matrix For example if there is a requirement that the total percentage invested in the first and third securities equal or exceed a certain percentage q then one row of S should be [1 0 1 0 0]and the corresponding element of the w0 vector would be q If there is instead a requirement that the total percentage invested in the first and third securities not exceed a cer-tain amount q the required row of S would be [-1 0 -1 0 0] and the corresponding element of the w0 vector would be minusq Other restrictions may be specified similarly For problems that include position limits each of the first k el-
The BASIC R Portfolio Optimation Program
Returns ltminus readtable(ldquoReturnscsvrdquo header = TRUE sep = ldquordquo)Rmat ltminus asmatrix(Returns) Converts the data to matrix formk ltminus ncol(Rmat) Number of columns (number of securities in the portfolio) Now the program calculates the estimate of the variance-covariance matrix (V) the M vector and the R matrix which includes the estimate of the expected returns
V ltminus var(Rmat) Calculates the sample variance-covariance matrix which is used as the estimate of the variance-covariance matrix
Erp ltminus 001 Sets the desired expected portfolio return The user can change this value as desired
M ltminus rbind(1 Erp) Ones ltminus rep(1 k) Ravg ltminus colMeans(Rmat)
Defines the M matrix including the required portfolio return Defines a 1 x k matrix of ones Calculates average returns by column giving a 1 x k matrix of estimated expected returns
R ltminus rbind(Ones Ravg) Combines Ones and Ravg into the 2 x k matrix R Finally the program calculates the portfolio weights and the portfolio variance
VINV ltminus solve(V) Calculates the inverse of the estimated variance-covariance matrixH ltminus RVINVt(R) Calculates the H matrixHINV ltminus solve(H) Calculates the inverse of Hw lt- VINVt(R)HINVM Calculates the portfolio weightsPvar lt- t(w)Vw Calculates the portfolio variance The following commands display the results of the calculations
print(w) Prints the elements of the w vectorprint(Pvar) Prints the variance of the portfolio formed using the weights w
James A Turner Optimal Portfolios and the R Programming Language
50 International Journal of the Academic Business World 51Fall 2015 (Volume 9 Issue 2)
ements of the w0 vector will be zero corresponding to the non-negativity constraints and the remaining elements will equal the percentages associated with the position limits entered as positive or negative numbers depend-ing on whether the position limits establish minimums or maximums
The Lagrangian for this problem is
( ) ( )0 L w Vw M Rw w Swλ microprime prime prime= + minus + minus
where λ is a 2 times 1 vector containing the Lagrangian multi-pliers on the equality constraints and micro is an m times 1 vector of the Lagrangian multipliers on the k short-sale constraints and the m ndash k position limits The first-order necessary con-ditions for this problem are the Kuhn-Tucker conditions
( )0 0
2 0
0
0 0 and 0
L Vw R SwL M Rw
L w Sw w Sw
λ micro
λ
micro micromicro
part prime prime= minus minus =partpart
= minus =partpart prime= minus le ge minus =part
The final set of conditions are known as the complementa-ry slackness conditions since if an element of partLpartμ does not equal zero (ie if the required condition is slack) then the corresponding element of micro must equal zero and vice versa Because of the complementary slackness conditions in order to find a solution to the optimization problem each condition must be checked individually to deter-mine the possible solutions If there are more than a very few constraints finding the candidate solutions manually becomes extremely tedious
Fortunately it is possible to use numerical methods to solve this type of non-linear programming program This is where the strength of the R programming language be-comes very evident The R language provides access to an extensive number of add-on packages developed by R us-ers around the world In particular there are several pack-ages that implement numerical methods to find solutions to optimization problems with inequality constraints Perhaps the package that most easily lends itself to solv-ing the current problem is the ldquoquadprogrdquo package Ac-cording to the documentation included with the pack-age the quadprog routine ldquoimplements the dual method of Goldfarb and Idnani (1982 1983) for solving qua-dratic programming problems of the form min(d΄b+frac12b΄Db)) with the constraints Aʹbgtb₀rdquo For the optimization problem currently under consideration the d vector will be a zero vector the b vector will be the w vec-tor of portfolio weights the D matrix will be the variance-
covariance matrix V and the matrix A΄ will equal a matrix formed by combining the R matrix and the S matrix such that A΄= [R
S ]and A = [ R΄ S΄] Since the V matrix is symmetric the term frac12b΄Db = frac12w΄Vw is a quadratic form Also because the d vector is a zero vector the presence of the frac12 term in the quadratic form does not change the value of the solution to the current portfolio optimization problem That is the weights that minimize frac12w΄Vw sub-ject to the constraints will also minimize w΄Vw subject to the constraints
THE R PORTFOLIO OPTIMIZATION PROGRAM WITH PACKAGE ldquoQUADPROGrdquo
The ldquoQuadprogrdquo package is one of many add-in packages available to R users To use add-in packages in R the user must first download and install the chosen package This is done through the ldquoPackagesrdquo command in the menu bar of the console window Selecting the ldquoInstall package(s)rdquo command from the drop-down box will bring up a list of download locations After selecting a download location the user selects the package(s) to download and install Finally once the selected package is downloaded and in-stalled it must be loaded for use in the current R session which is done by choosing ldquoPackagesrdquo command on the menu bar and then choosing the ldquoLoad packagerdquo com-mand from the drop-down box A list of available packag-es will then appear and the user should select the desired package in this case the ldquoquadprogrdquo package Once the quadprog package is loaded the following program will solve the portfolio problem with short-sale restrictions and position limits
In the present example the short-sale constraint requires that all elements of the w vector be non-negative In addi-tion there are three position limits The first position lim-it requires that no more than 5 of total funds be invested in the seventh security The second position limit requires that no more than a total of 40 of available funds be in-vested in the first and third securities The third position limit requires that total of at least 30 of available funds be invested in the second and fourth securities
The program will make use of the M matrix and the vari-ance-covariance matrix V from the earlier program so those variables must be saved by the user or the following program must be run after running the previous program and before exiting R The new program first sets the posi-tion limits as shown on the facing page
The output of the ldquosolveQPrdquo function includes the values of w and the Lagrangian multipliers for each constraint If the value of a Lagrangian multiplier is zero the constraint associated with that multiplier is not binding otherwise the constraint is binding Though checking the values of
the Lagrangian multipliers allows the user to determine which constraints are binding quite easily the functionrsquos output also includes a listing of the binding constraints by index number
The R Portfolio Optimization Program with Package ldquoQuadprogrdquo
npl ltminus 3 Sets the number of position limits The user sets this value
plmat ltminus matrix (rep(0 nplk) nrow=npl ncol=k) Initializes the matrix that will be used to define the position limit(s)
plmat[17] = -1 Places the required elements into the proper places in the lmat[21] = plmat[23] = -1 position limits matrix In this example the first position
plmat[32] = plmat[34] = 1 limit will set a maximum on the total percentage invested in the seventh security The second position limit will set a maximum on the total percentage invested in the first and third securities The third position limit will set a minimum on the total percentage invested in the second and fourth securities
pl ltminus c(-005 -04 03) Sets the values of the position limits The value the user enters should be positive if the position limit specifies a inimum and should be negative if the position limit specifies a maximum
Next the inequality constraints are placed in matrix form
S ltminus rbind(diag(k) plmat) Defines the S matrix
w0 ltminus c(rep(0 k) pl) Creates a vector whose elements are the values of the inequality constraints
Next the arguments required by the solveQP function that solves the programming problem are defined and the programming problem is solved
dvec ltminus rep(0 k) Defines the d vector which is a necessary input for the quadprog package For portfolio optimization problems the elements of the d vector will all be zeros
Amat ltminus colbind(t(R) t(S)) Forms the Amat matrix
bvec ltminus c(M w0) Joins the M matrix and the w0 matrix to form the bvec vector
ICSol ltminus solveQP(V dvec Amat bvec meq=2) Solves the quadratic programming problem The argument meq specifies that the first two constraints are equality constraints In this example the equality constraints are that the weights sum to one and that the portfolio expected return equal a specified amount
print(c(ICSol[1] 2ICSol[[2]] ICSol[5] ICSol[6])) Prints selected output from the solve QP function the weights the portfolio variance the values of the Lagrangian multipliers and the index numbers of the binding constraints
James A Turner Optimal Portfolios and the R Programming Language
52 International Journal of the Academic Business World 53Fall 2015 (Volume 9 Issue 2)
CONCLUSION
This paper provides an R language program to calculate portfolio weights for efficient portfolios The program can also accommodate short-sale constraints and position limits Users must choose the desired portfolio expected return and must specify any other constraints A strong advantage of the program is that because the R program-ming language is freely available to anyone with access to the internet students and others who wish to use the pro-gram will be able to do so easily
REFERENCES
Dai Min Hanqing Jin and Hong Liu 2011 Illiquidity position limits and optimal investment for mutual funds Journal of Economic Theory 146 1598ndash1630
Goldfarb D and A Idnani 1982 Dual and primal-dual methods for solving strictly convex quadratic pro-grams In Hennart J P (ed) Numerical Analysis Springer-Verlag Berlin pages 77ndash91
Goldfarb D and A Idnani 1983 A numerically stable dual method for solving strictly convex quadratic pro-grams Mathematical Programming 27 1ndash33
Ihaka Ross A free software project Retrieved May 7 2013 from httpcranr-projectorgdochtmlinter-face98-paperpaper_2html
Markowitz Harry 1952 Portfolio selection Journal of Finance 7 77ndash91
Stephens Alan 1998 Markowitz and the spreadsheet Journal of Financial Education 35ndash43
Thompson Thomas H and Ashraf El-houbi 2012 SAS and the efficient portfolio International Research Jour-nal of Applied Finance 3 315ndash327
Turlach Berwin A 2013 quadprog Functions to solve quadratic programming problems R pack-age version 15-5 httpCRANR-projectorgpackage=quadprog (S original by Berwin A Turlach R port by Andreas Weingessel)
Vance Ashlee 2009 Data analysts captivated by Rrsquos power The New York Times Retrieved May 1 2013 from httpwwwnytimescom20090107tech nolog y busi ness-computi ng 0 7prog ra m htmlpagewanted=allamp_r=0
What is R Retrieved May 7 2013 from httpwwwr-projectorgabouthtml
APPENDIX 1 DATA
The data used in the R program come from the CRSP monthly stock file and consist of 60 months of return data from January 2008 to December 2012 The stocks in the 10-stock portfolio are the first 10 stocks in the CRSP monthly file (listed by PERMNO) for which 60 continuous months of returns are available The stocks in the 50-stock portfolio are the first 50 stocks for which 60 continuous months of returns are available Table 1 below lists the PERMNOS current company name and current ticker of the included stocks as well as the exchange where the stock trades
Table 1 Stocks in the Portfolio
NO PERMNO CURRENT COMPANY NAME TICKER EXCHANGE1 10001 GAS NATURAL INC EGAS AMEX2 10002 BANCTRUST FINANCIAL GROUP INC BTFG NASDAQ3 10025 A E P INDUSTRIES INC AEPI NASDAQ4 10026 J amp J SNACK FOODS CORP JJSF NASDAQ5 10032 PLEXUS CORP PLXS NASDAQ6 10044 ROCKY MOUNTAIN CHOCOLATE FAC INC RMCF NASDAQ7 10051 HANGER INC HGR NYSE8 10065 ADAMS EXPRESS CO ADX NYSE9 10100 AMERICAN LEARNING CORP NY ALRN NASDAQ
Table 1 Stocks in the Portfolio
NO PERMNO CURRENT COMPANY NAME TICKER EXCHANGE10 10104 ORACLE CORP ORCL NASDAQ11 10107 MICROSOFT CORP MSFT NASDAQ12 10138 T ROWE PRICE GROUP INC TROW NASDAQ13 10145 HONEYWELL INTERNATIONAL INC HON NYSE14 10147 E M C CORP MA EMC NYSE15 10180 AKORN INC AKRX NASDAQ16 10182 TECH DATA CORP TECD NASDAQ17 10200 REPLIGEN CORP RGEN NASDAQ18 10207 ROYCE FOCUS TRUST INC FUND NASDAQ19 10225 BEAM INC BEAM NYSE20 10232 ELMIRA SAVINGS BANK NY ESBK NASDAQ21 10239 BALDWIN amp LYONS INC BWINB NASDAQ22 10252 INDEPENDENT BANK CORP MA INDB NASDAQ23 10253 DOCUMENT SECURITY SYSTEMS INC DSS AMEX24 10257 D L H HOLDINGS CORP DLHC NASDAQ25 10258 CELLDEX THERAPEUTICS INC CLDX NASDAQ26 10259 SIGMA DESIGNS INC SIGM NASDAQ27 10294 HAVERTY FURNITURE COS INC HVT NYSE28 10297 NEW HAMPSHIRE THRIFT BNCSHRS INC NHTB NASDAQ29 10299 LINEAR TECHNOLOGY CORP LLTC NASDAQ30 10302 CYPRESS SEMICONDUCTOR CORP CY NASDAQ31 10308 TOMPKINS FINANCIAL CORP TMP AMEX32 10318 BALCHEM CORP BCPC NASDAQ33 10333 XOMA CORP XOMA NASDAQ34 10355 DAILY JOURNAL CORP DJCO NASDAQ35 10363 A M A G PHARMACEUTICALS INC AMAG NASDAQ36 10375 T C F FINANCIAL CORP TCB NYSE37 10382 ASTEC INDUSTRIES INC ASTE NASDAQ38 10395 NAVIGATORS GROUP INC NAVG NASDAQ39 10397 WERNER ENTERPRISES INC WERN NASDAQ40 10421 SKYWEST INC SKYW NASDAQ41 10443 PATRIOT TRANSPORTATION HLDG INC PATR NASDAQ42 10463 RESEARCH FRONTIERS INC REFR NASDAQ43 10501 AMERICAN WOODMARK CORP AMWD NASDAQ44 10507 MEDICAL ACTION INDS INC MDCI NASDAQ45 10514 TRANS WORLD ENTERTAINMENT CORP TWMC NASDAQ46 10516 ARCHER DANIELS MIDLAND CO ADM NYSE47 10517 AARONS INC AAN NYSE48 10530 MERIDIAN BIOSCIENCE INC VIVO NASDAQ49 10547 CLEARFIELD INC CLFD NASDAQ50 10550 PRO DEX INC COLO PDEX NASDAQ
James A Turner Optimal Portfolios and the R Programming Language
54 International Journal of the Academic Business World 55Fall 2015 (Volume 9 Issue 2)
APPENDIX 3 RESULTS FOR THE 10-STOCK PORTFOLIO
Results for the 10-stock portfolio with a monthly expect-ed return of 1 are shown at the top of the facing page First shown is the variance-covariance matrix (V) fol-lowed by its inverse (V-1)
Table 2 shows the return averages of each stock and the calculated portfolio weights both for the portfolio with no short-sale constraints or position limits and the port-folio with short-sale constraints and three position limits (1) a requirement that the percentage invested in the sev-enth security not exceed 5 (2) a requirement that the
total percentage invested in the first and the third securi-ties not exceed 40 and (3) a requirement that the total percentage invested in the second and fourth securities be at least 30 Note that when short-sale constraints and position limits are imposed there may no longer be a port-folio that meets all the constraints that is the feasible set may be null In that case the R program will return an error message stating that the constraints are inconsistent
Table 3 lists the inequality constraints and the associ-ated Lagrangian multipliers along with an indication of whether the constraint is binding In this example the constraint that there be a minimum of 30 invested in the second and fourth securities is not binding
APPENDIX 2 COPY OF THE FULL PROGRAM
The full program is shown below without comments Users can easily copy the program that is between the solid lines and paste it into the R Editor window It will probably be necessary for each user to change the name of the data file in the readtable command Also the user can change the portfolio expected return and the number type and value of the inequality constraints as desired
Returns ltminus readtable(ldquoReturnscsvrdquo header = TRUE sep = ldquordquo) Rmat ltminus asmatrix(Returns) k ltminus ncol(Rmat) V ltminus var(Rmat) Erp ltminus 001 M ltminus rbind(1 Erp) Ones ltminus rep(1 k) Ravg ltminus colMeans(Rmat) R ltminus rbind(Ones Ravg) VINV ltminus solve(V) H ltminus RVINVt(R) HINV ltminus solve(H) w lt- VINVt(R)HINVM Pvar lt- t(w)Vw print(w) print(Pvar) npl ltminus 3 plmat ltminus matrix (rep(0 nplk) nrow=npl ncol=k) plmat[17] = -1 plmat[21] = plmat[23] = -1 plmat[32] = plmat[34] = 1 pl ltminus c(-005 -04 03)S ltminus rbind(diag(k) plmat) w0 ltminus c(rep(0 k) pl) dvec ltminus rep(0 k) Amat ltminus cbind(t(R) t(S)) bvec ltminus c(M w0) ICSol ltminus solveQP(V dvec Amat bvec meq=2) print(c(ICSol[1] 2ICSol[[2]] ICSol[5] ICSol[6]))
1
2867001 161224 279311 153314 408660 148438 131874 246057 83608 740152
161224 321169 23967 251277 39387 55190 33449 107899 36378 39718
279311 23967 991158 109233 189872 100249 22208 119
V minus
minus minus minus
minus minus minus minus
minus minus minus minus
=
6782 41342 198294
153314 251277 109233 2757210 319797 03010 139907 969199 56520 416534
408660 39387 189872 319797 977494 325171 247388 1098965 26657 04097
148438 55190 100249 03010 325171 1
minus minus minus minus minus
minus minus minus minus minus minus
minus 644368 311333 1803329 91576 428583
131874 33449 22208 139907 247388 311333 1093506 426730 100681 162364
246057 107899 1196782 969199 1098965 1803329 426730 11640904 233195 3789283
8360
minus minus
minus minus minus minus minus minus minus
minus minus minus minus minus minus
8 36378 41342 56520 26657 91576 100681 233195 138635 73382
740152 39718 198294 416534 04097 428583 162364 3789283 73382 3685519
minus minus
minus minus minus minus minus minus
00046 00019 00002 00006 00035 00004 00011 00008 00018 00019
00019 00364 00013 00037 00002 00004 00003 00001 00100 00007
00002 00013 00161 00024 00076 00035 00013 00041 00038 00033
00006 0
V
minus minus minus minus
minus minus minus minus
minus minus
=
0037 00024 00058 00051 00010 00016 00021 00028 00029
00035 00002 00076 00051 00217 00009 00048 00052 00024 00064
00004 00004 00035 00010 00009 00087 00018 00022 00027 00012
00011 00003 00013 000
minus
minus minus
minus minus minus
16 00048 00018 00113 00013 00055 00018
00008 00001 00041 00021 00052 00022 00013 00033 00003 00034
00018 00100 00038 00028 00024 00027 00055 00003 00850 00020
00019 00007 00033 00029 00064 00
minus
minus minus minus minus minus minus minus minus
012 00018 00034 00020 00068minus
Table 2 Average Returns and Weights for the Ten-
Stock Portfolios
Stock No Permno
Average Returns
Weights (SS
Allowed)IC Weights
(No SS 3 PLs)
1 10001 00064 03817 034062 10002 -00054 00311 004063 10025 00183 00908 005944 10026 00156 02525 026255 10032 00095 -01410 000006 10044 00012 00649 013797 10051 00206 01000 005008 10065 00018 01933 004929 10100 00270 00422 0056810 10104 00104 -00155 00031
Table 3 Constraints and Lagrangian Multipliers
Constraint Lagrangian Multiplier
Constraint Binding
Portfolio weights sum to one 00015 Yes
Portfolio expected return equals 1 00443 Yes
w1 ge 0 00000 No w2 ge 0 00000 No
w3 ge 0 00000 No
w4 ge 0 00000 No
w5 ge 0 00015 Yes
w6 ge 0 00000 No
w7 ge 0 00000 No
w8 ge 0 00000 No
w9 ge 0 00000 No
w10ge 0 00000 No
w7 le 005 00003 Yes
w1 + w3 le 04 00002 Yes
w2 + w4 ge 03 00000 No
James A Turner Optimal Portfolios and the R Programming Language
56 International Journal of the Academic Business World 57Fall 2015 (Volume 9 Issue 2)
The portfolio variances are
No short-sale constraints 0001607 Short-sale constraints and three position limits 0001856
APPENDIX 4 RESULTS FOR THE 50-STOCK PORTFOLIO
Results for the 50-stock portfolio with a monthly ex-pected return of 1 are shown in Table 4 below The first table shows the return averages of each stock and the cal-culated portfolio weights both for the portfolio with no short-sale constraints or position limits and the portfolio with short-sale constraints and three position limits (1) a requirement that the percentage invested in the seventh security not exceed 5 (2) a requirement that the total percentage invested in the first and the third securities not exceed 40 and (3) a requirement that the total percent-age invested in the second and fourth securities be at least 30
Table 5 shows the Lagrangian multipliers on the equal-ity constraints and the position limit constraints To save space for the 50-stock portfolio the Lagrangian multi-pliers on the short-sale constraints are not listed Simply checking Table 4 to see if the weight on a particular stock is zero gives an almost certain indication of which short-sale constraints are binding In this example both the constraint that there be no more than 5 invested in the seventh security and the constraint that there be no more than a total of 40 invested in the first and third securi-ties are not binding
Table 4 Average Returns and Weights for the
50-Stock PortfoliosStock
No Permno Average Returns
Weights SS Allowed
IC Weights No SS 3 PLs
1 10001 00064 01934 013072 10002 -00054 -00179 003673 10025 00183 -00189 000004 10026 00156 02873 026335 10032 00095 00503 000006 10044 00012 -00185 000007 10051 00206 -00136 002288 10065 00018 10920 000009 10100 00270 00306 00423
10 10104 00104 01467 0000011 10107 -00001 -02023 00000
Table 4 Average Returns and Weights for the
50-Stock PortfoliosStock
No Permno Average Returns
Weights SS Allowed
IC Weights No SS 3 PLs
12 10138 00085 -05619 0000013 10145 00065 -03910 0000014 10147 00088 -02693 0000015 10180 00290 -00290 0000016 10182 00076 01181 0000017 10200 00082 01409 0040918 10207 00020 -01551 0000019 10225 00098 00285 0000020 10232 00159 -00021 0000021 10239 00051 01624 0000022 10252 00084 00955 0000023 10253 00058 00121 0000024 10257 -00008 -00236 0000025 10258 00196 -00157 0000026 10259 -00300 -01339 0000027 10294 00179 -00414 0000028 10297 00061 01854 0146729 10299 00074 00826 0000030 10302 00165 00201 0000031 10308 00073 01255 0014132 10318 00194 -01389 0000033 10333 -00203 -00205 0000034 10355 00299 -00545 0036035 10363 -00151 -00167 0000036 10375 00010 -00495 0000037 10382 00046 00267 0000038 10395 -00022 00886 0042339 10397 00134 01296 0084940 10421 -00036 -01045 0000041 10443 00021 01389 0000042 10463 00013 00417 0000043 10501 00176 -00458 0000044 10507 -00228 -00397 0000045 10514 00100 00731 0007846 10516 -00034 -00148 0119247 10517 00208 00629 0000048 10530 00005 00032 0000049 10547 00418 00032 0012550 10550 -00028 00397 00000
The portfolio variances are
No short-sale constraints 000002997 Short-sale constraints and three position limits 000111119
Table 5 Constraints and Lagrangian Multipliers
Constraint Lagrangian Multiplier Constraint Binding
Portfolio weights sum to one 0000503 YesPortfolio expected return equals 1 0031954 Yes
w7 le 005 0000000 Now1 + w3 le 04 0000000 Now2 + w4 ge 03 0000963 Yes
James A Turner
58 Fall 2015 (Volume 9 Issue 2)
This page intentionally blank
JOINT CONFERENCE May 25th 26th and 27th 2016 in
Nashville TN
Academic Business World International Conference
(ABWICorg)
The aim of Academic Business World is to promote inclusiveness in research by offering a forum for the discussion of research in early stages as well as re-search that may differ from lsquotraditionalrsquo paradigms We wish our conferences to have a reputation for providing a peer-reviewed venue that is open to the full range of researchers in business as well as reference disciplines within the social sciences
Business Disciplines
We encourage the submission of manuscripts presentation outlines and ab-stracts pertaining to any business or related discipline topic We believe that all disciplines are interrelated and that looking at our disciplines and how they relate to each other is preferable to focusing only on our individual lsquosilos of knowledgersquo The ideal presentation would cross discipline borders so as to be more relevant than a topic only of interest to a small subset of a single disci-pline Of course single domain topics are needed as well
International Conference on Learning and Administration in
Higher Education (ICLAHEorg)
All too often learning takes a back seat to discipline related research The In-ternational Conference on Learning and Administration in Higher Educa-tion seeks to focus exclusively on all aspects of learning and administration in higher education We wish to bring together a wide variety of individuals from all countries and all disciplines for the purpose of exchanging experi-ences ideas and research findings in the processes involved in learning and administration in the academic environment of higher education
We encourage the submission of manuscripts presentation outlines and ab-stracts in either of the following areas
Learning
We encourage the submission of manuscripts pertaining to pedagogical top-ics We believe that much of the learning process is not discipline specific and that we can all benefit from looking at research and practices outside our own discipline The ideal submission would take a general focus on learning rather than a discipline-specific perspective For example instead of focusing on ldquoMotivating Students in Group Projects in Marketing Managementrdquo you might broaden the perspective to ldquoMotivating Students in Group Projects in Upper Division Coursesrdquo or simply ldquoMotivating Students in Group Projectsrdquo The objective here is to share your work with the larger audience
Academic Administration
We encourage the submission of manuscripts pertaining to the administra-tion of academic units in colleges and universities We believe that many of the challenges facing academic departments are not discipline specific and that learning how different departments address these challenges will be ben-eficial The ideal paper would provide information that many administrators would find useful regardless of their own disciplines
- Testing Major Factors for Reducing Obstacles to Product Innovation Success
-
- Dr Tor Guimaraes
- Dr Marcelo Seido Nagano
- Dr Curtis Armstrong
-
- Acceptance of Change Exploring the Relationship among Psychometric Constructs and Employee Resistance
-
- Brian Dunican EdD
- Ric Keaster PhD
-
- The Origin and Construct of Cloud Computing
-
- Nozar Daylami PhD
-
- Optimal Portfolios and the R Programming Language
-
- James A Turner
-
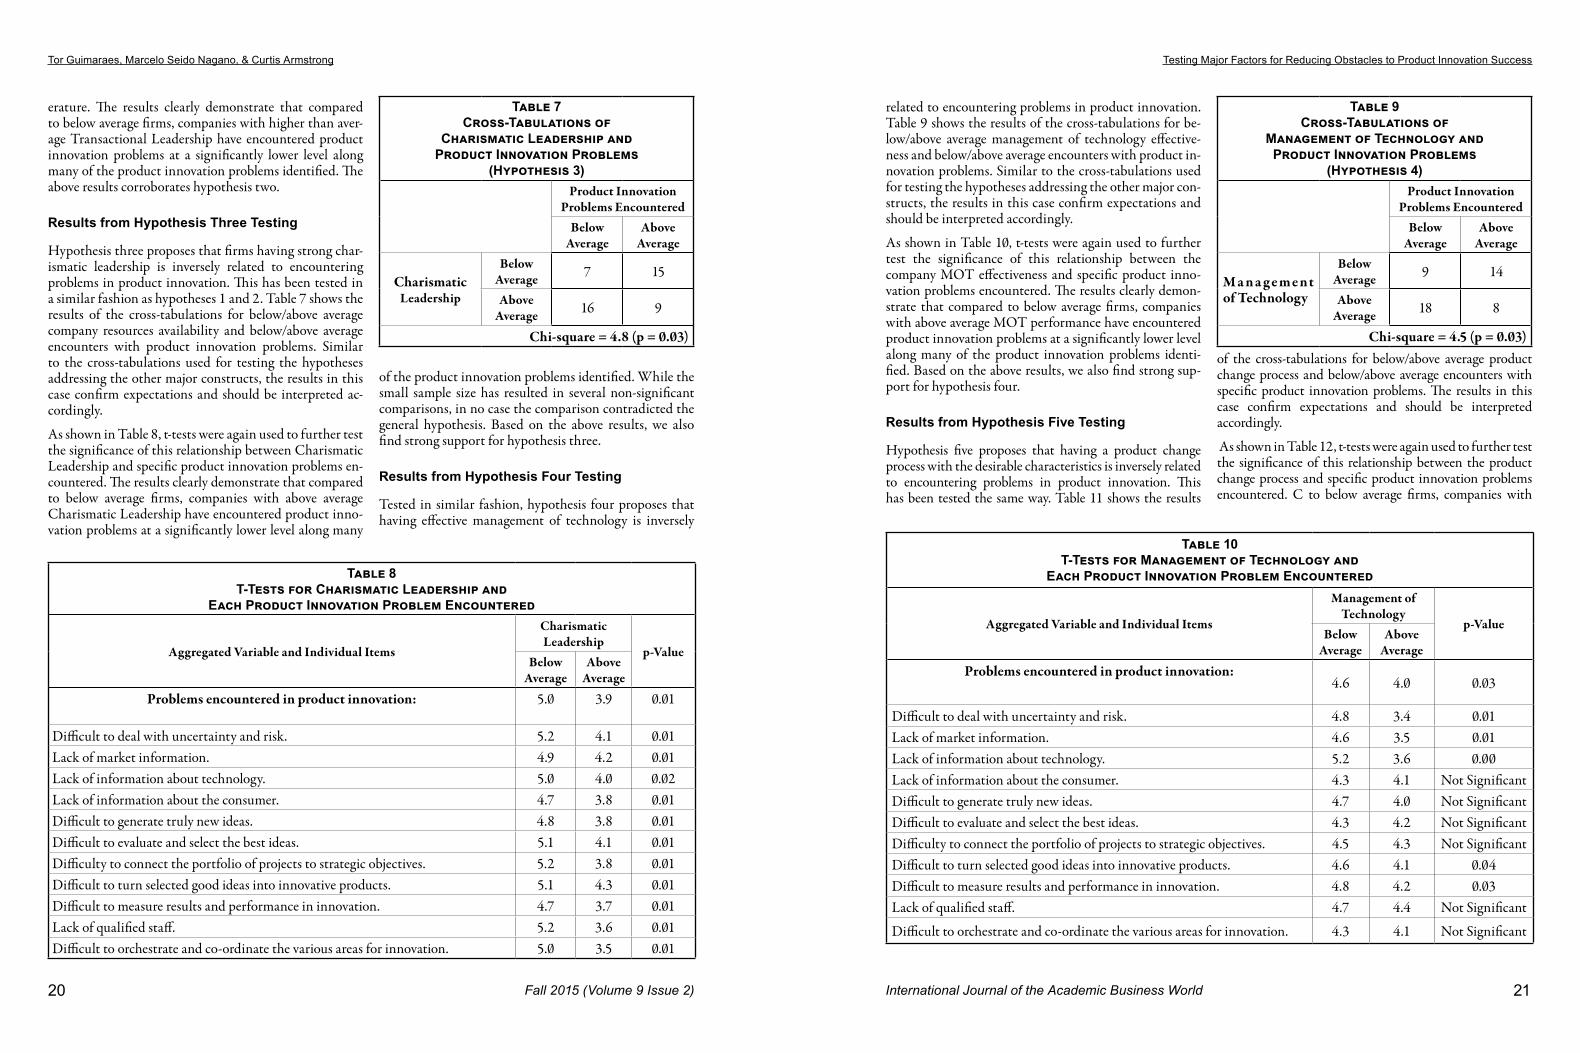
Tor Guimaraes Marcelo Seido Nagano amp Curtis Armstrong Testing Major Factors for Reducing Obstacles to Product Innovation Success
24 International Journal of the Academic Business World 25Fall 2015 (Volume 9 Issue 2)
topic future research should strive to identify and include these potential factors in an expanded theoretical model
Another opportunity for future research stems from the fact that even though the relatively small sample in this study has shown very encouraging statistically significant results larger sample sizes will be much more convincing Therefore we strongly recommend new research projects with larger sample sizes capable of supporting multivariate analyses expanded theoretical models and enable the assessment of more complex relationships among the important constructs addressed in this study Perhaps the use of a path analytic modeling technique would be applicable in this case The results should provide valuable information on the extent to which strategic leadership can positively influence the effective use of technology and CI programs for companies to improve their business competitiveness while ensuring that the change process follow prescribed guidelines suggested in this study
Finally a third area of future research opportunity deals with the integration and expansion of theoretical mod-els relating the many determinants of success in product innovation to include the new construct of ldquoobstacles to product innovationrdquo as a likely moderating variable in these theoretical models Combined these three areas of research opportunity should support a host of research studies important not only to the academic community but also to product innovation managers
REFERENCES
Adams R Bessant J amp Phelps J (2006) Innovation management measurement A review International Journal of Management Reviews 8(1) 21-47
Anonymous (1995) Data mining a new weapon for com-petitive advantage Software Quarterly 2 (4) 15-19
Baatz E B (1994 Sept 15) The quest for corporate smarts CIO 48-58
Babbar S amp Rai A (1993) Competitive intelligence for international business Long Range Planning 263103-113
Bass BM (1985) Leadership and Performance beyond Expectations New York Free Press
Beattie JS amp Fleck J (2005) New perspectives on stra-tegic technology management in small high-tech com-panies Proceedings from IEEE International 2005 Engineering Management Conference
Blindenbach-Driessen F amp Van Den Ende J (2010) In-novation management practices compared the exam-ple of project-based firms Journal of Product Innova-tion Management 6(3) 33-53
Burns J M (1978) Leadership New York Harper amp Row
Calof JL amp Wright S (2008) Guest Editorial Com-petitive intelligence a practitioner academic and inter-disciplinary perspective European Journal of Market-ing 42(78) 717-730
Carmines E amp Zeller R (1979) Reliability and Validity Assessment Beverly Hills CA Sage
Colakoglu T (2011) The problematic of competitive intelligence How to evaluate and develop competi-tive intelligence Procedia ndash Social and Behavioral Sci-ences 24(1) 1615ndash1623 httpdxdoiorg101016jsbspro201109075
Cooper RG (2009) How companies are reinventing their idea-to-launch methodologies Research Technol-ogy Management 52(2) 47-57
Cooper RG and Chew MB (1996) Control tomor-rowrsquos costs through todayrsquos designs Harvard Business Review January-February 88-98
Cooper R amp Edgett S (2008) Ideation for product in-novation what are the best methods PDMA visions magazine 1(1) 12-17 httpwwwstage-gatecomknowledgephp
Cooper R Edgett S amp Kleinschmidt E (2001) Portfo-lio management for new product development results of an industry practices study RampD Management 31(4) 361-380
Darling M S (1996) Building the knowledge organiza-tion Business Quarterly 61(2) 61-66
Davison L (2001) Measuring competitive intelligence effectiveness Insights from the advertising industry Competitive Intelligence Review 12 (4) 25-38
Day DV amp Lord RG (1988) Executive leadership and organizational performance suggestions for a new theory and methodology Journal of Management 14 4593-464
du Toit A (2003) Competitive intelligence in the knowl-edge economy What is in it for South African manu-facturing enterprises International Journal of Infor-mation Management 23 111-120
Editors (2004 MarchApril) Competitive intelligence and records managers The Information Management Journal 4
Ellis J R (1993) Proactive competitive intelligence Us-ing competitive scenarios to exploit new opportunities Competitive Intelligence Review 4(1) 13-24
Ettorre B (1995) Managing competitive intelligence Management Review 84(10) 15-19
Fleisher CS amp Wright S (2009) Examining differences in competitive intelligence practice China Japan and the West Thunderbird International Business Review 51(3) 249ndash261 httpdxdoiorg101002tie20263
Friedenberg R amp Rice A (1994 August 3) Knowledge re-engineering as a BPR strategy Working Notes of the AAAI-94 Workshop on Artificial Intelligence in Business Process Reengineering Seattle WA pp 21-26
Fuld amp Company (2013) Certain industries invest heavi-ly in watching their competition Fuld Insights-Global Benchmarking Project Update March 2013
Galia F amp Legros D (2004) Complementarities be-tween obstacles to innovation evidence from France Research Policy 33 1185ndash1199
Ghoshal S amp Westney D E (1991 Jan) Organizing competitor analysis systems International Journal of the Academic Business World 2(1) pp 35-44
Guimaraes T (2011) Industry Clockspeedrsquos Impact on Business Innovation Success Factors European Journal of Innovation Management 14(3) 322-344
Guimaraes N amp Armstrong C (1998) Exploring the relation between competitive intelligence IS support and business change Competitive Intelligence Review 9(3) 45-54
Guimaraes T Cook D amp Natarajan N (2002) Explor-ing the importance of business clockspeed as a modera-tor for determinants of supplier network performance Decision Sciences 33(4) 629-644
Guimaraes N amp Igbaria M (1997) Clientserver sys-tem success Exploring the human side Decision Sci-ences 28(4) 851-876
Guimaraes N Igbaria M amp Lu M (1992) Determi-nants of DSS success An integrated model Decision Sciences 23(2) 409-430
Guimaraes T Yoon Y amp Clevenson A (1997) Empiri-cally testing ES success factors in business process reen-gineering International Journal of Production Econom-ics 50 245-259
Haataja J (2011) Social media as a source of competitive intelligence in a pharmaceutical corporation Masterrsquos thesis School of Science Aalto University
Haddadi AE Dousset B amp Berrada I (2010) Xplor EveryWhere ndash The Competitive Intelligence Sys-tem for Mobile in IEEE Xplorereg retrieved 25 March
2015 from httpieeexploreieeeorgstampstampjsptp=amparnumber=5945635
Hambrick DC amp Finkelstein S (1987) Managerial Discretion A Bridge between Polar Views of Organi-zational Discretion In LL Cummings amp BM Staw (Eds) Research in Organizational Behavior Green-wich CT JAI Press 9 369-406
Harkleroad D (1993) Sustainable growth rate analysis Evaluating worldwide competitorsrsquo ability to grow profitability Competitive Intelligence Review 4(23) 36-45
Heil O amp Robertson T S (1991 Sep) Toward a theory of competitive market signaling A research agenda Strategic Management Journal 12(6) 403-418
Huber G P (1990 Jan) A theory of the effects of ad-vanced information technologies on organizational design intelligence and decision making Academy of Management Review 15(1) 47-71
Kanter RM (1983) The Change Masters New York Si-mon amp Schuster
Katz D amp Kahn RL (1978) The Social Psychology of Organizations (2nd ed) New York Wiley
Khalil TM amp Ezzat HA (2005) Management of technology and responsive policies in a new economy International Journal of Technology Management 32(12) 88
King M (1997 March 10) Corporations take snooping mainstream Indianapolis Business Journal 17(2) 1-4
Li-Hua R amp Khalil TM (2006) Technology manage-ment in China A global perspective and challenging issues Journal of Technology Management in China 1(1) 9
Maltz E amp Kohli A K (1996 Feb) Market intelligence dissemination across functional boundaries Journal of Marketing Research 33(1) 47-61
Mata RS (2008) Inovaccedilatildeo tecnoloacutegica em multinacio-nais brasileiras estudo multicaso sobre gestatildeo do port-folio de projetos de novos produtos 192p Dissertaccedilatildeo (Mestrado) ndash Faculdade de Economia Administraccedilatildeo e Contabilidade de Ribeiratildeo Preto Universidade de Satildeo Paulo Ribeiratildeo Preto
McCarthy V (1996) CTI lets you coddle customers at lower cost Datamation 42(13) 46-49
McCune J C (1996) Checking out the competition Be-yond Computing 5(2) 24-29
Nemeth C (1997) Managing innovation when less is more California Management Review 40(1) 59-74
Tor Guimaraes Marcelo Seido Nagano amp Curtis Armstrong
26 Fall 2015 (Volume 9 Issue 2)
Nemutanzhela P amp Iyamu T (2011) The impact of competitive intelligence on products and services in-novation in organizations International Journal of Advanced Computer Science and Applications 2(11) 38-44
Parry ME Song M De Weerd-Nederhof PC amp Viss-cher K (2009) The impact of NPD strategy product strategy and NPD processes on perceived cycle time Journal of Product Innovation Management 26 (6) 627-639
Pawar BS amp Eastman KK (1997) The nature and implications of contextual influences on transforma-tional leadership A conceptual examination Academy of Management Review 22 80-109
Pellissier R amp Nenzhelele TE (2013) Towards a univer-sal definition of competitive intelligence SA Journal of Information management 15(2) Art 559 7 pages httpdxdoiorg104102sajimv15i2559 Retrieved 31 March 15
Podsakoff PM MacKenzie SB Moorman RH amp Fetter R (1990) Transformational leader behaviors and their effects on followersrsquo trust in leader satisfac-tion and organizational citizenship behaviors Leader-ship Quarterly 1107-142
Roitner A (2008) Competitive intelligence in Austria An empirical study Masterrsquos dissertation University of Vienna
Sawka K A (1996) Demystifying business intelligence Management Review 85(10) 47-51
Segarra-Blasco A Garcia-Quevedo J amp Teruel-Carrizo-sa M (2008) Barriers to innovation and public policy in Catalonia The International Entrepreneurship and Management Journal 4(4) 431-451
Sharma A (1999) Central dilemmas of managing inno-vation in large firms California Management Review 3941(3) 46-164
Slack N Chambers S Johnston R and Betts A (2006) Operations and Process Management Princi-ples and Practice for Strategic Impact 2nd ed Prentice Hall Harlow
Stringer R (2000) How to manage radical innovation California Management Review 42(4) 70-88
Swartz N (2005) Competitive intelligence underuti-lized Information Management 39(3)
Tarraf P amp Molz R (2006) Competitive Intelligence at Small Enterprises SAM Advanced Management Journal l 71 (4) 24-34
Thamhain HJ (2003) Managing innovative RampD teams RampD Management 33(3) 297-311
Tidd J Bessant J amp Pavitt K (2008) Gestatildeo da inova-ccedilatildeo 3ed Satildeo Paulo Artmed
Trice HM amp Beyer JM (1993) The Cultures of Work Organizations Englewood Cliffs JN Prentice-Hall
Tushman M amp Anderson P (1997) Managing Strategic Innovation and Change Oxford University Press Ox-ford 3-23
Udo G amp Guimaraes N (1994) Empirically assessing factors related to DSS benefits European Journal of In-formation Systems 3(3) 218-227
Vedder RG amp Guynes CS (2002) CIOsrsquo Perspectives on competitive intelligence Information Systems Man-agement 19(4) 49-56
Waldman DA Ramirez GG House RJ amp Puranam P (2001) Does leadership matter CEO leadership at-tributes and profitability under conditions of perceived environmental uncertainty Academy of Management Journal 44(1) 134-143
Weiss A amp Naylor E (2010) Competitive intelli-gence How independent information professionals American Society for Information Science and Tech-nology 37(1) 30ndash34 httpdxdoiorg101002bult20101720370114
Westervelt R (1996) Gaining an edge Competitive in-telligence takes off Chemical Week 158(25) 29-31
Williams SD (2004) Personality attitude and leader influences on divergent thinking and creativity in or-ganizations European Journal of Innovation Manage-ment 7(3) 187-204
Yoon Y Guimaraes T amp Clevenson A (1995) Under-standing the factors important to expert systems suc-cess Technology Management 2(3) 1-14
Yoon Y Guimaraes T amp Clevenson A (1998) Explor-ing ES success factors for BPR Journal of Engineering and Technology Management 15 179-199
Yoon Y Guimaraes T amp OrsquoNeal Q (1995) Exploring the factors associated with expert systems success MIS Quarterly 19(1) 83-106
Yukl GA (1998) Leadership in Organizations (4th ed) Englewood Cliffs NJ Prentice-Hall
International Journal of the Academic Business World 27
INTRODUCTION
Nothing stays the same part of the human condition involves adjusting to change Yet human resistance to change is both intense and natural Perhaps examples of this resistance occur in employeesrsquo personal lives or arise as they approach new ideas or changes at work Through a myriad of changes characterized by global demands unpredictable environments the onset of technologi-cal advances and operational developments managing change and resistance has become a way of life for many organizations (Judge Thoresen Pucik amp Welbourne
1999) Organizations must depend on capable leader-ship to guide them through these unprecedented times The evolution of change requires employees at all levels to embrace new techniques of working by promoting dif-ferent mindsets (Kets de Vries Ramo amp Korotov 2009) Gondo Patterson and Palacios (2013) suggested that some organizations fail to adapt to change and prepare their leadership and employees for a more uncertain fu-ture Yet their study summarized that successful change involves support of formulated strategies and the facilita-tion of change recipients being mindful during change ef-forts In the face of intense global competition it is criti-
Acceptance of Change Exploring the Relationship among
Psychometric Constructs and Employee Resistance
Brian Dunican EdDWestern Kentucky University
1906 College Heights BoulevardBowling Green KY 42101
Ric Keaster PhD Western Kentucky University
1906 College Heights BoulevardBowling Green KY 42101
ABSTRACTChange is inevitable and can influence numerous events inside and outside an organization The contrasting at-titudes of acceptance and resistance to change are an increasingly interesting topic in todayrsquos global ever-changing and competitive environment Discovering the behavioral origins of employeesrsquo reactions to change is an integral part of understanding the way in which individual mindset may play a role in coping with organizational change and resistance This body of knowledge may give organizations insight for creating a competitive advantage over their counterparts
Conceivably it can be argued that some researchers view change as a process of gradual adaptation that is largely in-fluenced by people in organizations who react to internal and external pressures while others view it as an emergent event due to environmental selections (Demers 2007) Through both concepts successful navigation through change events relies on the manner in which humans respond to these occasions
The current study employed a descriptive non-experimental correlational design to examine individualsrsquo self-rating of their level of mindfulness tolerance of ambiguity and resistance to change in four industries located in Kentucky The quantitative study sought to identify the strengths of the relationship of the chosen variables using validated instruments ndash Langerrsquos (Pirson Langer Bodner amp Zilcha-Mano 2012) Langer Mindfulness Scale (LMS14) Bud-nerrsquos (1962) Tolerance of Ambiguity Scale (TOA) and Oregrsquos (2003) Resistance to Change Scale (RTC) Regression models were utilized to evaluate multivariate relationships among the variables Based on the findings in the current study the results indicated that no differences lie between group comparisons of organizational or demographic fac-tors when examining the relationship among the elements of mindfulness tolerance of ambiguity and resistance to change Bivariate correlations yielded both strong positive and negative relationships among the three scales assessed by salary (exempt and non-exempt) employees located across the different industries (p lt 01)
Brian Dunican amp Ric Keaster Acceptance of Change Exploring the Relationship among Psychometric Constructs and Employee Resistance
28 International Journal of the Academic Business World 29Fall 2015 (Volume 9 Issue 2)
cal for organizations to have the dexterity to accept new changes and adapt to survive (Gondo et al 2013 Jacobs 2005) Discovering the behavioral origins of employee re-actions to change is an integral part of understanding the recipe for flexibility longevity and organizational success Researchers have separately alluded to varying degrees of social psychological constructsmdashparticularly elements of mindfulness and tolerance of ambiguitymdashand their influ-ence on individualsrsquo attitudes toward change and resis-tance (Banning 2003 Langer 1993)
BACKGROUND
By its nature change in organizations is inherently stress-ful causing increased anxiety among employees at each level of the organization This environment of uncertain-ty can threaten the balance of control often distracting organizations from obtaining the stability needed to sur-vive and adapt to change Researchers have analyzed sev-eral techniques for strengthening the idea of overcoming uncertainty Carson and Langer (2006) stated ldquoActively thinking about paradoxes increase onersquos ability to toler-ate ambiguity and decreases the anxiety associated with uncertainty In a separate study Weinstein Brown and Ryan (2009) contended that increased mindfulness in individuals promoted greater attention and awareness in situations (organizational change for example) perceived as stressful or threatening
Leaders throughout organizations must possess the skills and cognitive experience to manage varying degrees of uncertainty and balance the levels of tolerance within their organizations (Lane amp Klenke 2004) This notion is reinforced by Topping (2002) in that change implies uncertainty and uncertainty can drive individuals to feel afraid uncomfortable threatened anxious and as a result resistant to change On the contrary acknowl-edging uncertainty can lead to the exploration for clarity and challenges of the status quo (Geller 2002) A rapidly growing amount of literature is available on mindfulness which insinuates how this construct could aid in navigat-ing through areas of uncertainty (Brown amp Ryan 2004 Lane amp Klenke 2004 Langer 1993 Weinstein et al 2009) Brown and Ryanrsquos (2004) multifaceted definition of mindfulness recognized it as ldquoa phenomenon with functional import for outcomes as diverse as physical health psychological well-being work and sports perfor-mance and relationshipsrdquo (p 242)
The process of conforming to change or an innovation may seem difficult for individuals within organizations yet examples exist in which individuals adapt very easily and seem to flourish within this environment Judge et al (1999) explained that organizational change has been predominately conducted at a middle range or macro
level rather than at the micro individual level Changes in organizations are not always clear even for the leaders Through the vagueness of change innovative organiza-tions deliberately take actions to avoid misinterpretations and to improve the process (Limerick Passfield amp Cun-nington 1994) ldquoAs organizational structures become less hierarchical and more fluid and amorphous tolerance for ambiguity and uncertainty is likely to emerge as a quality that differentiates effective from ineffective leadersrdquo ac-cording to Lane and Klenke (as cited in Ehrlich Meindl amp Viellieu 1990 p 69) As organizations are naturally subject to uncertainties the concept of increasing employ-eesrsquo abilities to deal with ambiguous situations may lead to more success or important gains in knowledge about organizations
Resistance to Change
The literature presents an enduring consensus on the premise that it is human nature to resist change and ele-ments related to the process of change (Coch amp French 1948 Conner 1992 Oreg 2003 OrsquoToole 1995 Zander 1950) This notion of natural resistance is supported by Kotter (1995) as he described change as the force of shift-ing conditions within the human communities Contest-ed by Dent and Goldberg (1999) the phrase resistance to change should be reevaluated under a more conventional definition Although the researchers supported the belief that resistance is natural their views have challenged the idea of the way in which individuals resist change Blindly supporting the belief that one can resist change may be counterproductive and may direct the focus of organiza-tions away from the actual issues The idea of contradict-ing this belief opens the possibilities that inefficiencies in the process of change and its impact on individuals should be acknowledged and explored (Mabin Forgeson amp Green 2001) As a whole regardless of the process resistance to change is driven at the individual level and is leveraged by organizations to foster change (Conner 1992 Judson 1991)
Employees of organizations may withdraw from the fear of ideas they do not fully understand or act rebellious to-ward seemingly unclear decisions made by management without proper cause Ideally change within organiza-tions should be straightforward clear and concise prior to implementation More often this is not the case for individuals who implement the groundwork or for those who are being impacted by the change (Judson 1991) Al-ternately studies have demonstrated that some employees with a higher tolerance of ambiguity are more susceptible to change and may even thrive within this environment (Oreg 2003) As a whole organizations have struggled with implementing new ideas changing their culture and
reacting to market demands nevertheless many are will-ing to change to remain competitive
Dent and Goldberg (1999) found that at the individual level resistance to change can arise from those whose jobs are directly impacted and can cause a rippling effect through the organization Fundamentally individuals are creatures of habit and are annoyed by pressures in organi-zations that force employees to choose a different behavior or accept a reward system that may not seem beneficial However they are willing to change their behaviors when their beliefs of the benefits of the change outweigh the benefits in their current environment (Armenakis amp Be-deian 1999) In other words attitude toward the change affects onersquos willingness to consider and even implement the change
ATTITUDES AND CHANGE
Some change efforts within organizations are successful some are not Kotter (1995) monitored approximately 100 companies over a decade to observe the fundamental changes made in fluctuating business environments The research included examples of successes examples of fail-ures and illustrations of companies that remained stag-nant as they suffered through misguided steps Outlined by Kotter (1995) successful changes within companies encompassed eight steps (a) creating a sense of urgency (b) forming a guiding coalition (c) creating a compel-ling vision (d) communicating the vision for buy-in (e) empowering and acting on the vision (f) creating quick wins (g) increasing credibility through small wins and (h) linking success to new approaches In an earlier ap-proach Judson (1991) proposed five steps to enhance the process of change by engaging employeesrsquo active participa-tion through (a) analyzing and planning the change (b) communicating the plan for change (c) gaining buy-in and acceptance (d) changing the status quo to the desired state and (e) institutionalizing the new state of change Through these steps the common link described for suc-cessful changes involved employeesrsquo comprehension of the change and their personal adaptation to the new way of thinking and working
Iverson (1996) supported the concept that organizational change could be easier when employees have higher per-sonal commitments through healthy professional rela-tionships positive employee morale job satisfaction and positive recognition Moreover employees who have a sol-id desire to perform well and are willing to embrace new challenges even in the absence of clarity also understand the importance of change within organizations Further-more Gaumlrtner (2013) reinforced the concept that employ-eesrsquo attitudes and perceived flexibility toward change were influenced through a subset of mindfulness Although it
is not a new term mindfulness supports the concepts at-tributed to attention awareness engagement and being comfortable with new ideas that may impact areas within an individualrsquos control (Langer 1993)
The Problem Defined
With the continuous expansion of globalization and the rising unpredictability of consumer demands economic pressures and technological advancements organiza-tions have been required to change to remain competi-tive Change is inevitable The organizations that master agility and are adaptive to the ever-changing environment will possess the recipe to emerge triumphant over their competitors In reality every organization must change yet the process is not always smooth or effective Hypo-thetically within the organizational structure there are individuals who visualize the change others who develop and organize the change and those who implement and perform the change (Isabella 1990) At times roles of in-dividuals may overlap due to the size of the organization and the responsibilities entailed within each role Directly or indirectly everyone throughout the organization is im-pacted by the change perhaps some individuals are able to cope with change better than others A study of the relat-ed factors of mindfulness and tolerance of ambiguity may lead to insights about individualsrsquo resistance to change
Defining the Problem of Resistance
Resistance to change refers to adverse human forces that impact the processes of change Kotter (1995) empha-sized that organizational resistance is often helped along through the mismanagement of change and by ignoring its impact on the processes Maurer (2009) suggested that resistance will happen often due to failures from previ-ous change implementations Lewin (1947) one of the most influential early researchers of change realized that change was not an event but rather a living process He conceptualized the process of change through a model composed of three steps unfreezing change and refreez-ing His initial step introduces the idea of resistance in-dividuals must give up something before accepting some-thing new Though simple his ideas have been expanded upon by numerous researchers and have been developed into various theories of change Zander a close colleague of Lewin defined resistance to change as ldquobehavior which is intended to protect an individual from the effects of real or imagined changerdquo (as cited by Dent amp Goldberg 1999 p 34)
Mabin et al (2001) found that seemingly rebellious em-ployees manifest their fears of change due to uncertainty In addition perceived resistance may be disguised through
Brian Dunican amp Ric Keaster Acceptance of Change Exploring the Relationship among Psychometric Constructs and Employee Resistance
30 International Journal of the Academic Business World 31Fall 2015 (Volume 9 Issue 2)
the camouflage of untimely surprises past resentment ad-ditional job duties or the exposure of personal vulnera-bilities In isolated cases changes within the organization may cause a true threat to safety quality cost or the com-panyrsquos reputation Ignoring the symptoms of resistance within the change process could have disastrous results Judson (1991) agreed that resistance to change is not the fundamental problem but a symptom hiding basic under-lying circumstances He also developed a continuum of reactions to change ranging from indifference (no resis-tance) to active even aggressive resistance
Research has validated the importance of evaluating the reactions and the attitudes of individuals toward organi-zational change and their desire to succeed (Judge et al 1999 Oreg 2006) Developed and validated by Oreg (2003) the Resistance to Change scale has been widely used and accepted by academic works to measure an indi-vidualrsquos disposition toward resistance to change Further-more Oreg outlined four subscales as an exploratory anal-ysis to categorize an individualrsquos reaction to resist change (a) routine seeking (b) emotional reaction to impose change (c) cognitive rigidity and (d) short-term focus Supportive research (cited in Oreg 2003) has found the factors of openness to change tolerance of ambiguity and risk aversion as predictors for managers coping with the stress of change within their organizations An exhaustive amount of research has been conducted on the broad topic of resistance to change yet little is known on the relation-ship of how the psychological constructs of mindfulness and tolerance of ambiguity influence resistance to change within organizations Early researchers such as Coch and French (1948) viewed resistance to change as an obstacle of contention during the process of changes within organiza-tions One of their studies conducted in a sewing factory revealed that employees retaliated against change through acts of aggression controlling restrictions of throughput high turnover rates increased complaints and reports of dissatisfaction with management In line with earlier studies the use of the term resistance to change gained popularity beginning in the 1950s following Lewinrsquos (1947 1951) works related to field theory and social sci-ences Resistance to change is commonly accredited to the unfreezing stage of Lewinrsquos (1951) change model (Ar-menakis amp Bedeian 1999) Naturally portrayed as a nega-tive barrier to change resistance to change is frequently defined using Lewinrsquos physical science-related terminol-ogy as a restraining force to maintain the current state of equilibrium (Dent amp Goldberg 1999) Since that time resistance to change has been widely acknowledged and associated with the process of change organizational de-velopment and change theories and models Other schol-ars have conceptualized resistance to change as an emo-tional reaction rather than a behavioral response As an
example Argyris and Schon (1978) suggested resistance in terms of defensive routines and frustration during the process of change Kanter (1985) supported this notion describing feelings of uncertainty and loss of control for individuals facing change In other terms of defining re-sistance Lawrence (1954) used an analogy to compare re-sistance to change as pain within the human body that is used as a signal to communicate that something is wrong ldquoThe resistance like the pain does not tell what is wrong but only that something is wrong And it makes no more sense to try to overcome such resistance than it does to take a pain killer without diagnosing the bodily ailmentrdquo (p 56) This analogy highlighted the parallels between re-sistance and overcoming it through a practicable solution
Mindfulness
Mindfulness is a concept in educational psychology that has been primarily defined by Dr Ellen Langer a so-cial psychology professor at Harvard University Langer (1993) defined mindfulness as ldquoan open creative proba-bilistic state of mind in which the individual might be led to finding differences among things thought similar and similarities among things thought differentrdquo (p 44) Langer (1997) further explained three characteristics of mindfulness ldquo(a) continuous creation of new categories (b) openness to new information and (c) having an im-plicit awareness of more than one perspectiverdquo (p 4) The Mindfulness Scale validated by Pirson et al (2012) oper-ationalizes the construct and identifies the four subscales of novelty-seeking engagement novelty-producing and flexibility to explain the broad psychometric construct Brown and Ryan (2003) defined mindfulness as ldquoa quali-ty of consciousness that is characterized by clarity and viv-idness of current experience and thus stands in contrast to the mindlessrdquo (p 823) Different from Langerrsquos definition that evaluates dispositional differences in reflective con-sciousness behavioral routines over time Ryan and Brown focused on the presence or absence of attention to and the awareness of events occurring in the present moment For the purpose of the current study the ideas of mindfulness were presented through the literature of Langer Further-more mindfulness is believed to play an important role in disengaging individuals from automatic thoughts habits and unhealthy behavior patterns and may contribute to well-being and happiness in a direct way (Brown amp Ryan 2003)
Tolerance of Ambiguity
Tolerance of ambiguity describes an individualrsquos behavior in unclear or insecure situations and how one reacts to the lack of clarity or uncertainty (Banning 2003) Devel-oped by Frenkel-Brunswik (1948) tolerance of ambigu-
ity has gained attention from researchers over the past 60 years Frenkel-Brunswik was one of the first to present a comprehensive analysis of ambiguity and was influenced by earlier works of Germany psychologist Erich Jaensch Frenkel-Brunswik described tolerance of ambiguity as an ldquoemotional and perceptual personality variablerdquo (cited in Furnham amp Ribchester 1995 p 180)
Budner (1962) later defined tolerance for ambiguity as ldquothe tendency to perceive ambiguous situations as desir-ablerdquo and intolerance for ambiguity as ldquothe tendency to perceive ambiguous situations as sources of threatrdquo (p 29) Budner developed the Tolerance of Ambiguity Scale to further interpret the complex concept of ambiguity and individualsrsquo responses to it Through the development of the Tolerance of Ambiguity Scale three subscales (ie novelty complexity insolubility) emerged to provide in-sight into the more abstract larger construct A decade later Norton (1975) defined tolerance of ambiguity as the degree to which an individual is cognitively willing to tolerate uncertainty vagueness or nebulous information and is able to act upon the knowledge
Employees resist change at all levels of the organization Although some individuals openly accept change many do not Determining the varying degrees of each psycho-metric construct on resistance along with their combi-nation toward resistance to change may reveal common areas of opportunity related to organizational change The following general research question is offered How are the psychometric constructs of mindfulness and toler-ance for ambiguity related to resistance to change within organizations
Empirical Studies and Questions
Numerous studies have alluded to resistance to change some have focused on the individuals (eg Bovey amp Hede 2001 Coghlan 1993 Ford Ford amp McNamara 2002) while others have explored organizations (eg Arm-bruster Bikfalvi Kinkel amp Lay 2008 Coch amp French 1948 Greenwood amp Hinings 1996 Lawrence 1954 Stanley Meyer amp Topolnytsky 2005) Van Dam Oreg and Schyns (2008) stated ldquoA review of the past empirical research reveals that resistance to change has been concep-tualized in three ways as a cognitive state as an emotion as a behavioral intentionrdquo (p 316) As an emotion some studies have revealed that employees who display nega-tive perceptions toward organizational change may have an overall negative outlook on change thus perpetuat-ing resistance (Armenakis Harris amp Mossholder 1993 Stanley et al 2005) Extreme measures of resistance to organizational change have been displayed in other stud-ies through sabotage slowdowns and strikes (Armenakis et al 1993) Universally resistance to change has been
recognized to have a significant impact on the outcomes of organizational change yet individuals within the or-ganization are perceived to be the major blockage or im-pediment (Mabin et al 2001) Based on the literature concerning the analysis of change empirical studies have identified a wide range of factorsmdashnamely organization-al managerial behavioral and individualmdashthat promote or impede resistance in organizations
Organizations are faced with the challenges of changing and responding to current and future trends at an un-precedented rate in todayrsquos global environment (Burke 2014) Twenty-five years ago Offermann and Gowing (1990) found that American organizations alone had spent over a record 210 billion dollars to prepare leaders to thrive in organizational change In addition to money an immeasurable amount of time and energy have been dedicated to nurturing leadership and key individuals to navigate others through this complex but important pro-cess Nonetheless the blueprint is far from perfect The readiness of individuals within the organization to plan and implement proactive measures may determine the or-ganizationrsquos competitiveness The current study examines the factors of mindfulness and tolerance of ambiguity and how they relate to individualsrsquo perceptions of resistance to change The specific research questions are the following
1 How do demographic factors of the respondents and the organizational factors under which they work relate to the psychometric scales of Mind-fulness and Tolerance of Ambiguity and their influence on Resistance to Change
2 After controlling for demographic factors how does psychometric mindset (Sub-constructs of Mindfulness and Tolerance of Ambiguity) influence individual Resistance to Change (a) Routine seeking (b) Emotional reaction (c) Short-term focus (d) Cognitive rigidity
3 What is the degree of relationship among these measures of Mindfulness and Tolerance of Am-biguity
4 The following model characterizes the current study
Highlights of the Methodology
When considering the measurement of the perceptions of resistance to change within organizations various meth-ods have been utilized to illustrate relationships among different constructs (Oreg 2003 Oreg Vakola amp Ar-menakis 2011) In the current quantitative non-exper-
Brian Dunican amp Ric Keaster Acceptance of Change Exploring the Relationship among Psychometric Constructs and Employee Resistance
32 International Journal of the Academic Business World 33Fall 2015 (Volume 9 Issue 2)
imental study data were collected from three validated instruments ndash Langerrsquos (Bodner amp Langer 2001) Langer Mindfulness Scale (LMS) Budnerrsquos (1962) Tolerance of Ambiguity Scale (TOA) and Oregrsquos (2003) Resistance to Change (RTC) scale Regression models were used to assess the univariate relationships among the constructs Additionally descriptive statistics were used to include the mean median mode standard deviation and other selected variables A multiple linear regression analysis determined the relationship between factors of mindful-ness and tolerance of ambiguity and their influence of resistance to change Bivariate correlations were used to compute the psychometric scores from each instrument and resistance to change ratings to test the significance of the relationships between each subscale Overall statisti-cal analyses were conducted in multiple phases to investi-
gate the relationship between the individual psychomet-ric traits and resistance for salary exempt and non-exempt employees in industrial sites located in Kentucky
Participants in the Study
The population represented a microcosm of several indus-tries in the manufacturing sector within the proximity of Warren County The data collected were based on a con-venient sample A total of 65 participants volunteered to complete an electronic survey that was designed to capture complete responses to a total of 48 questions Participants were not allowed to proceed to the next page of the survey unless all questions on the current page were completed Three participants did not complete the survey and their responses were not included in the end results From the
population of 183 salaried (exempt and nonexempt) em-ployees 65 surveys were officially returned constituting a response rate of 36 Managerial-type jobs dominated 36 of the sample population followed by roles in tech-nical support which reflected 169 Six categories of job types and an ldquoOtherrdquo category were used for the respon-dents
Scoring Method for Each Scale
Resistance to Change Scale
Oregrsquos (2003) Resistance to Change Scale is comprised of 17 items with four subscales ndash routine seeking emo-tional reaction short-term focus and cognitive rigidity Each subscale relates to the extent to which individuals seek routines react to emotions during change encom-pass short-term focus during change and the frequency to which individuals change their minds The overall range of the scale including the subscales is scored between 1 and 6 with 1 representing the least level of resistance In-dividuals scoring higher on the overall scale or subscales indicate a higher resistance to change
Langer Mindfulness Scale
The Langer Mindfulness Scale (Pirson et al 2012) con-tains 14 items and is composed of three subscales ndash novelty seeking engagement and novelty producing The 7-point scale is scored such that higher scores indicate a greater level of awareness toward thinking High scores for novel-ty producing insinuate one would perceive new situations as opportunities to learn new information Individuals with high scores for engagement are more susceptible to noticing details within their environment as opposed to others Higher novelty producing scores indicate that individuals are likely more creative and predisposed to generating new ideas when faced with new information
Tolerance of Ambiguity Scale
Budnerrsquos (1962) Tolerance of Ambiguity Scale is a 16-item scale with ratings ranging from 1 to 7 1 represents strong disagreement indicating a greater tolerance for ambiguity It is important to note that higher scores relate to greater intolerances for ambiguity All results were re-ported at the aggregate level
RESULTS
Statistical data analyses were performed on survey data comprised of the following three instruments Langer Mindfulness Scale (LMS14) Tolerance of Ambigu-
ity Scale (TOA) and Resistance to Change (RTC) scale Findings were reported from the analyses of data col-lected from 65 participants responding to the Qualtrics Web-based survey In particular analyses were conducted through bi-variant correlation analyses (also known as Pearsonrsquos r) independent t-tests and Cronbachrsquos alpha The strengths of the relationships were predicated on Co-henrsquos (1988) interpretation Coefficient values between 10 and 29 were considered small or weak those between 30 and 49 were considered moderate and those between 50 and 10 were considered large or strong
Analysis of Each Research Question
The first research question explored the relationship of de-mographic and organizational factors to the psychomet-ric scales of Mindfulness and Tolerance of Ambiguity and their influence on Resistance to Change Descriptive sta-tistics reflected both demographic and organizational fac-tors ndash gender education years at the company and direct reportsmdashfor the 65 employees who participated in the current study The distributions of variables were distrib-uted evenly between only two variables years at the com-pany and direct reports Other demographic variables including ethnicity and age were recorded A statistical analysis was not conducted due to the uneven distribution of the variables Of the 65 participants 59 were Caucasian and the remaining 6 were minorities The ages of the par-ticipants ranged from 28 years to 65 years Additionally frequency distributions and data analyses were not con-ducted for individual sites to protect anonymity All re-sults were reported at the aggregate level and included the following categories for the participating industries Cup Manufacturing Personal Care Manufacturing Con-struction and Rubber to Metal Bonding Manufacturing
Gender Male and Female
Although more than twice as many males than females participated in the current study independent t-tests were conducted to determine whether differences existed be-tween the mean scores of the scales and subscales for male and female employees No statistically significant differ-ences were found between the outcome of the psychomet-ric constructs (Mindfulness and Tolerance of Ambiguity) and Resistance to Change except on one subscale Cogni-tive rigidity revealed a statistical difference between the scores of males (n = 45 M = 381 SD = 063) and females (n = 20 M = 336 SD = 086) t (63) = 234 p = 05 α = 05
Figure 1 Logic model for hypothesized relationships among
Psychometric Constructs Demographic Controls and Degree of Resistance to Change
INDEPENDENT VARIABLES
Degree of Resistance
Demographic Factors
-----
Age Gender
Ethnicity Education
____________
Organizational Factors
----- Years at Current Company Type of Current Position
Type of Industry or Category Number of Direct Reports
Resistance to Change -----
Routine Seeking Emotional Reaction Short-term Focus
Cognitive Rigidity
Tolerance of Ambiguity
----- Novelty
Complexity Insolubility
Mindfulness -----
Novelty Seeking Engagement
Novelty Producing
Brian Dunican amp Ric Keaster Acceptance of Change Exploring the Relationship among Psychometric Constructs and Employee Resistance
34 International Journal of the Academic Business World 35Fall 2015 (Volume 9 Issue 2)
Education
Due to the imbalanced distributions of participants sta-tistical analysis for Education was not performed The frequency distribution reflected that 5231 (34) of the participants possessed a four-year degree 1231 (8) ob-tained a masterrsquos degree or higher 2615 (17) possessed a two-year degree or some college while the reaming 923 (6) were high school graduates
Direct Reports and No Direct Reports
An individual variances t-test was conducted and failed to reveal a statistically reliable difference between the mean scores of salaried employees without direct reports and salaried employees with direct reports As an example scores from routine seeking a subscale of resistance to change were not significantly different between employ-ees without direct reports (n = 32 M = 312 SD = 096) and employees with direct reports (n = 33 M = 291 SD = 085) t (65) = 093 p = 037
Years at the Company
A one-way analysis of variance (ANOVA) was calculated on participantsrsquo ratings of the psychometric constructs and resistance to change as a comparison to the number of years at the company Comparisons indicated no sta-tistically significant differences were presented between groups of 0 to 4 years 5 to 10 years 11 to 20 years and 21 years and greater As an example on novelty-seeking a subscale of the Langer Mindfulness Scale the analysis was not significant between the four groups F(3 61) = 31 p = 82
The second research question used bivariate correlations to determine the strength of the relationships between the psychometric constructs (Mindfulness and Tolerance of Ambiguity) and Resistance to Change including the four subscales All of the Pearson correlations were significant across each of the findings with the exception of the LMS scale and Cognitive Rigidity of Resistance to Change subscale r(65) = -225 p = 072 The overall LMS scales reflected a strong negative relationship r(65) = -530 p lt 001 with the RTC scale The TOA scale revealed a mod-
Table 1 Descriptive Statistics and Correlations among Responses of Tolerance of
Ambiguity Scale Langer Mindfulness Scale and Subscales and Resistance to Change and Subscales
Scales LMS_NS LMS_NP LMS_E TOA_ Tot RTC_RS RTC_ER RTC_STF RTC_CR
LMS_NS (77)
LMS_NP 76 (72)
LMS_E 49 51 (69)
TOA_Tot -48 -53 -32 (72)
RTC_RS -51 -50 -41 65 (85)
RTC_ER -36 -37 -36 41 71 (88)
RTC_STF -53 -47 -38 60 77 80 (90)
RTC_CR -28 -26 -04 44 51 45 41 (86)
of Items 5 5 4 16 5 4 4 4
Mean 598 504 556 376 342 285 367 322
SD 071 94 102 71 110 104 73 81Note N = 65 Cronbachrsquos alpha reliabilities for each dimensionconstruct are listed in parentheses on diagonal Cronbachrsquos Alpha measures indicated a high internal consistency among the items reflected in each scale p lt 05 level (two-tailed) p lt 01 level (two-tailed)
Table 2 Descriptive Statistics and Correlations among Responses of the Total Tolerance of
Ambiguity Scale Langer Mindfulness Scale and Resistance to ChangeLMS_Tot Mean TOA_Tot Mean RTC_Tot Mean
LMS_MeanTotal (86)
TOA_Meantotal -53 (72)
RTC_Meantotal -53 62 (93)Number of items 14 16 17Mean 552 376 301Standard Deviation 75 71 91Note N = 65 Cronbachrsquos alpha reliabilities for each dimensionconstruct are listed in parentheses on diagonal No subscales for Tolerance of Ambiguity were referenced in research Cronbachrsquos Alpha measures indicated a high internal consistency among the items reflected in each scale p lt 05 level (two-tailed) p lt 01 level (two-tailed)
Table 3 Descriptive Statistics and Correlations among Responses Related to Operational and
Demographic Factors Tolerance of Ambiguity Scale Langer Mindfulness Scale and Sub-scales and Resistance to Change and Subscales
ME
AN
SD AG
E
YR
SWR
K
DR
RPT
S
TO
A_M
LMS_
M
LMS_
NS
LMS_
NP
LMS_
E
RT
C_M
RT
C_R
S
RT
C_E
R
RT
C_S
TF
RT
C_C
R
AGE 4571 782 100YRSWRK 1283 943 52 100DRRPTS 1005 2162 -18 01 100TOA_M 376 71 15 11 -02 100LMS_M 552 75 -07 -07 10 -53 100LMS_NS 598 71 -12 -12 04 -48 87 100LMS_NP 504 94 -05 01 18 -53 90 76 100LMS_E 556 102 -01 -10 01 -32 78 49 51 100RTC_M 322 81 -14 -10 -08 62 -53 -51 -48 -37 100RTC_RS 301 91 -13 -07 -04 65 -55 -51 -50 -41 90 100RTC_ER 342 110 -23 -17 -07 41 -43 -36 -37 -36 90 71 100RTC_STF 285 104 -05 00 -06 60 -54 -53 -47 -38 91 77 80 100RTC_CR 367 73 -07 -08 -14 44 -23 -28 -26 -04 65 51 45 41 100
Note N = 65 The correlation coefficient ranges from -1 to +1 with -1 indicating a perfect negative correlation +1 indicating a perfect positive correlation and 0 indicating no correlation
Brian Dunican amp Ric Keaster Acceptance of Change Exploring the Relationship among Psychometric Constructs and Employee Resistance
36 International Journal of the Academic Business World 37Fall 2015 (Volume 9 Issue 2)
erate positive correlation r(65) = 624 p lt001 Further bivariate analyses for LMS explored the strength of the re-lationships between the subscales of the Langer Mindful-ness Scale and the subscales of the Resistance to Change scales The correlational analysis was statistically signifi-cant between all variables except Engagement of the LMS and Cognitive Rigidity of RTC r(63) = -35 p = 781 concluding that the variables were unrelated
The last research question explored the degree of the re-lationship between Mindfulness and Tolerance of Am-biguity Bivariate analyses were used to correlate the re-lationship between the two psychometric constructs The correlations revealed a significantly strong negative rela-tionship between the total mean score of the LMS and the total mean score of the TOA r(63) = -53 p lt 01 The mean scores for each of the LMS subscales compared to the total mean of the TOA showed the following Nov-elty-seeking and TOA r(63) = -48 p lt 01 Novelty-pro-ducing and TOA r(63) = -53 p lt 01 and Engagement and TOA r(63) = -32 p lt 01 It is important to note that higher scores on the Tolerance of Ambiguity scale indicate a greater intolerance of ambiguity Tables 1 and 2 display a descriptive analysis and correlations for each of the scales and subscales The correlations between vari-ables are presented in Table 3
LIMITATIONS OF THE STUDY
Research inherently contains limitations The current study is no exception First the nature of measuring psy-chometrics is subjective Since psychometrics studies mea-sure the way in which individuals think and act (Norton 1975) influences of the organizationrsquos environment could affect individualsrsquo responses to questions Additionally external variables at the time of data collection not related to the study itself can skew the responses and influence the outcomes Other views of limitation rest on the gen-eralizability of the results which may be limited for the following reasons (a) the unit of analysis is at the indi-vidual level (b) data were collected from a limited num-ber of operations within the state of Kentucky through convenience sampling and (c) individual biases that may be introduced at the time of testing
The unit of analysis for data collection rests at the indi-vidual level rather than the group level due to the acces-sibility of the employees Although the survey collection method allows for comparison with larger groups it lim-its the opportunity to explore issues in depth therefore assumptions are made for individuals in similar groups Next the data collected represents limited industries in the state of Kentucky restricting the number of partici-pants and the ability to generalize outcomes to other in-dustries different than those outlined in the current study
Last respondentsrsquo values interests and beliefs regarding the online self-administered surveys may introduce biases unknown by the researcher As a consequence of these limitations and the collection of data during one point in time the results are generalizable only to the groups or populations that are similar to those in the current study
SUMMARY AND CONCLUSION
Change within organizations is inevitable That real-ity will remain constant in organizationsmdashand in onersquos personal and professional life (Conner 1992) The way in which one chooses to cope with change could be a decid-ing factor of success failure or choosing to remain the samemdashwhich in organizations tends to equate with fail-ure particularly if change means simply improving Resis-tance is a natural reaction to change and is part of the hu-man psyche Research and literature support this notion of human nature to resist change and elements related to the process of change (Coch amp French 1948 Conner 1992 Oreg 2003 OrsquoToole 1995 Zander 1950) It is possible that a greater understanding of mindfulness and tolerance of ambiguity could increase the possibilities of new ideas to drive lower resistance to change The current study explored the two psychometric constructs of mind-fulness and tolerance of ambiguity and their relationship to resistance to change within industrial settings Bivari-ate correlations yielded both strong positive and negative correlations among the three scales assessed by salaried employees located across different industries The Langer Mindfulness Scale Budnerrsquos Tolerance of Ambiguity Scale and Oregrsquos Resistance to Change scale were attrib-uted to the foundation of the current study The results contributed to the practical and theoretical significance of individualsrsquo responses to change through the measure-ment of the aforementioned constructs To the extent the findings in the current research could be extrapolated to other industries or organizations a final suggestion should be noted When considering future directions for research related to probing psychometric constructs and resistance to change the current study may have relevance across different nationalities and cultures The elements of change will continue to challenge the fabric of organiza-tions while the internal and external pressures of rising costs variations in supply and demand relentless compe-tition and developing technology test the resolve for sur-vival The readiness of individuals within organizations and their ability to challenge perceptions of change and resistance may determine their competitiveness and ulti-mately their success
REFERENCES
Argyris C amp Schon D (1978) Organizational learning A theory of action research Reading MA Addison-Wesley
Armbruster H Bikfalvi A Kinkel S amp Lay G (2008) Organizational innovation The challenge of measur-ing non-technical innovation in large-scale surveys Technovation 28(10) 644-657
Armenakis A A amp Bedeian A G (1999) Organiza-tional change A review of theory and research in the 1990s Journal of Management 25 293-315
Armenakis A A Harris S G amp Mossholder K W (1993) Creating readiness for organizational-change Human Relations 46(6) 681-703
Banning K C (2003) The effect of the case method on tolerance for ambiguity Journal of Management Edu-cation 27 556-567
Bodner T E amp Langer E J (2001 June) Individual differences in mindfulness The MindfulnessMind-lessness Scale Poster presented at the 13th annual American Psychological Society Conference Toronto Ontario Canada
Bovey W H amp Hede A (2001) Resistance to organisa-tional change The role of defence mechanisms Journal of Managerial Psychology 16(7) 534-548
Brown K W amp Ryan R M (2003) The benefits of be-ing present Mindfulness and its role in psychological well-being Journal of Personality and Social Psychol-ogy 84 822-848 doi1010370022-3514844822
Brown K W amp Ryan R M (2004) Perils and promise in defining and measuring mindfulness Observations from experience Clinical Psychology Science and Practice 11(3) 242-248 doi101093clipsybph078
Budner S (1962) Intolerance of ambiguity as a personal-ity variable Journal of Personality 30 29-59
Burke W W (2014) Organizational change theory and practice Thousand Oaks CA Sage Publications Inc
Carson S H amp Langer E J (2006) Mindfulness and self-acceptance Journal of Rational-emotive and Cog-nitive-behavior Therapy 24(1) 29-43
Coch L amp French J (1948) Overcoming resistance to change Human Relations 1 512-532
Coghlan D (1993) A person-centred approach to deal-ing with resistance to change Leadership amp Organi-zation Development Journal 14(4) 10-14
Cohen J (1988) Statistical power analysis for the behav-ioral sciences Hillsdale NJ Lawrence Erlbaum Associates
Conner D R (1992) Managing at the speed of change How resilient managers succeed and prosper where others fail New York Random House
Demers C (2007) Organizational change theories Thousand Oaks CA Sage Publications Inc
Dent E B amp Goldberg S G (1999) Resistance to change A limiting perspective Journal of
Ehrlich S B Meindl J R amp Viellieu B (1990) The charismatic appeal of a transformational leader An empirical case study of a small high-technology con-tractor The Leadership Quarterly 1(4) 229-247
Ford J D Ford L W amp McNamara R T (2002) Re-sistance and the background conversations of change Journal of Organizational Change Management 15(2) 105-121
Frenkel-Brunswik E (1948) Tolerance toward ambigu-ity as a personality variable American Psychologist 3 268-269
Furnham A amp Ribchester T (1995) Tolerance of am-biguity A review of the concept its measurement and applications Current Psychology 14 179-199
Gaumlrtner C (2013) Enhancing readiness for change by enhancing mindfulness Journal of Change Manage-ment 13 52-68
Geller E S (2002) Leadership to overcome resistance to change It takes more than consequence control Jour-nal of Organizational Behavior Management 22(3) 29-49
Gondo M Patterson K W amp Palacios S (2013) Mind-fulness and the development of a readiness for change Journal of Change Management 13(1) 36-51
Greenwood R amp Hinings C R (1996) Understanding radical organizational change Bringing together the old and the new institutionalism Academy of Manage-ment Review 21 1022-1054
Isabella L (1990) Evolving interpretations as a change unfolds How managers construe key organization-al events Academy of Management Journal 33 7-41
Iverson R D (1996) Employee acceptance of organiza-tional change The role of organizational commitment International Journal of Human Resource Manage-ment 7 122-149
Jacobs P (2005) Five steps to thriving in times of un-certainty Harvard Management Update 10(12) 3-5
Brian Dunican amp Ric Keaster
38 Fall 2015 (Volume 9 Issue 2)
Retrieved from httphbrorgproductfive-steps-to-thriving-in-times-of-uncertaintyanU0512A-PDF-ENG
Judge T A Thoresen C J Pucik V amp Welbourne T M (1999) Managerial coping with organization-al change A dispositional perspective Journal of Ap-plied Psychology 84 107-122
Judson A (1991) Changing behavior in organizations Minimizing resistance to change Cambridge MA Basil Blackwell
Kanter R M (1985) Supporting innovation and ven-ture development in established companies Journal of Business Venturing 1 47-60
Kets de Vries M F R Ramo L amp Korotov K (2009) Organizational culture leadership change and stress INSEAD Working Papers Collection 10 2-26 Re-trieved from httpwwwinseadedufacultyresearchresearchdoccfmdid=41924
Kotter J P (1995) Leading change Why transformation efforts fail Harvard Business Review 73(2) 59-67
Lane M S amp Klenke K (2004) The ambiguity toler-ance interface A modified social cognitive model for leading under uncertainty Journal of Leadership amp Organizational Studies 10(3) 69-81
Langer E J (1993) A mindful education Educational Psychologist 28 43-50
Langer E J (1997) The power of mindful learning Read-ing MA Addison-Wesley
Lawrence P R (1954) How to deal with resistance to change Harvard Business Review 32(3) 49-57 Retrieved from httpedsaebscohostcomlib-srvwkueduehostpdfviewerpdfviewervid=6ampsid =699bab3d-bcec-40d9-ac69-a42c853d72bc40sessionmgr4004amphid=4108
Lewin K (1947) Frontiers in group dynamics II Chan-nels of group life social planning and action research Human Relations 1(2) 143-153
Lewin K (1951) Field theory in social science Selected theoretical papers New York Harper amp Row
Limerick D Passfield R amp Cunnington B (1994) Transformational change Towards an action learning organization The Learning Organization 1(2) 29-40
Mabin V J Forgeson S amp Green L (2001) Harness-ing resistance Using the theory of constraints to assist change management Journal of European Industrial Training 25(234) 168-191
Maurer R (2009) Introduction to change without mi-graines Omaha NE Maurer and Associates Re-trieved from httpextensionmissouriedustaffsde-teams DocumentsChangeW-outMigrarainespdf
Norton R W (1975) Measurement of ambiguity toler-ance Journal of Personality Assessment 39 607-619
Offermann L R amp Gowing M K (1990) Organiza-tions of the future Changes and challenges Ameri-can Psychologist 45(2) 95-108 doi10370003-066X45295
Oreg S (2003) Resistance to change Developing an in-dividual differences measure Journal of Applied Psy-chology 88 680-693
Oreg S (2006) Personality context and resistance to organizational change European Journal of Work and Organizational Psychology 15 73-101
Oreg S Vakola M amp Armenakis A (2011) Change re-cipientsrsquo reactions to organizational change A 60-year review of quantitative studies The Journal of Applied Behavioral Science 47 461-524
OrsquoToole J (1995) Leading change The argument for val-ues-based leadership Boston MA Ballentine Books
Pirson M Langer E J Bodner T amp Zilcha-Mano S (2012) The development and validation of the Langer Mindfulness Scale-Enabling a socio-cognitive perspec-tive of mindfulness in organizational contexts Ford-ham University School of Business Research Paper Re-trieved from httpdxdoiorg102139ssrn2158921
Stanley D J Meyer J P amp Topolnytsky L (2005) Employee cynicism and resistance to organizational change Journal of Business and Psychology 19(4) 429-459
Topping P (2002) Managerial leadership New York McGraw Hill Professional
Van Dam K Oreg S amp Schyns B (2008) Daily work contexts and resistance to organisational change The role of leader-member exchange development climate and change process characteristics Applied Psycholo-gy An International Review 57 313-334 doi101111j1464-0597200700311x
Weinstein N Brown K W amp Ryan R M (2009) A multi-method examination of the effects of mindful-ness on stress attribution coping and emotional well-being Journal of Research in Personality 43 374-385
Zander A F (1950) Resistance to change Its analysis and prevention Advanced Management 4(5) 9-11
International Journal of the Academic Business World 39
INTRODUCTION
Cloud computing is one of the most talked about infor-mation technology topics these days 7 24 Early literature review reveals an endemic confusion of what cloud com-puting is does and what it stands for We posit that the cloud metaphor 3 20 fosters a confusion that persists even today
The goal of this research paper is to look back and make historical sense of cloud computing We try to find the lineage of cloud computing where the phrase cloud com-puting came from who came up with the term and how it found currency in the IT community We trace cloud computing to early timesharing and Application Service Provider (ASP) in the last decade and posit a future of utility computing
Additionally we try to shed light on the current state of cloud computing provide a comprehensive definition of the term and its main building blocks
CLOUD COMPUTING IN THE ACADEMIC LITERATURE
A metaphor
In an article by Ian Foster and Steven Tuecke 3 the authors start by describing the well-known elephant fable where a group of blind people are asked to describe an elephant and not surprisingly each provides a different view
The cloud is a metaphor for the Internet Itrsquos a rebranding of the Internet that is why there is a raging debate By vir-tue of a metaphor itrsquos open to different interpretations 20
Confusion and Frustration
The word ldquocloudrdquo in cloud computing informs very little and it may even misinform ldquoI hated it but I finally gave inrdquo says Carl Bass President and CEO of Autodesk He adds ldquoI didnrsquot think the term helped explain anything to people who didnrsquot already know what it isrdquo20
Giving the lsquocloudrsquo name to the old concept of large shared distributed systems is misleading 4 p 26
Larry Ellison Oraclersquos CEO ldquoThe interesting thing about cloud computing is that wersquove redefined cloud computing everything that we already dohellipI donrsquot understand what we would do differently in light of cloud computing other than change the wording of some of our adsrdquo 1 p 50
In an article in Harvard Business Review (HBR) 22 the author asks a rhetorical question ldquoWhat the heck does it mean to have a lsquocloudrsquo It means that the functions you want like storage communications and applications donrsquot need to live on the device you have in front of you You can get them on demand from the networkrdquo We should ask the question ldquoin a typical non-cloud IS en-vironment do we really have the stated functions on the device in front of usrdquo
Cloud Computing is often confused with Utility Com-puting but they are not the samemdashrather the latter forms part of the former 2
No Definition
Realizing the elephantine nature of cloud computing there is a reluctance to define it Question How would you define cloud computing Answer Cloud computing
The Origin and Construct of Cloud Computing
Nozar Daylami PhD Adjunct Professor
School of Management Information System and Technology Program
California Lutheran University Thousand Oaks CA 91360
ABSTRACTCloud computing is one of the most talked about information technology topics these days A literature review reveals an endemic confusion of what cloud computing stands for This paper tries to shed light on why the term is so confusing We try to find where the phrase cloud computing came from and how it found currency in the IT community We trace cloud computing to early timesharing and Application Service Provider (ASP) in the last decade and posit a future of utility computing This paper also provides a comprehensive definition of the term and its main building blocks
Nozar Daylami The Origin and Construct of Cloud Computing
40 International Journal of the Academic Business World 41Fall 2015 (Volume 9 Issue 2)
is not so much a definition of a single term as it is a trend in service delivery taking place today 3 p 52
An Old Concept
Cloud computing is an old concept it ldquois a throwback to the mainframe model of computingrdquo 19 p 78 Clearly cloud computing is simply remote computing 4 p 26
Internet or Network Computing
Cloud computing as a term for Internet-based computing service was launched by industry giants Google Ama-zon etc in late 2006 24 ldquoIt is the movement of applica-tion services onto the Internet and the increased use of the Internethelliprdquo
The Earliest Publications
In the first article on Cloud Computing in the Communi-cations of ACM 9 it is referred to as ldquothe compute cloudrdquo and is deemed synonymous with ldquoon-demand comput-ing software as a service or the Internet as a platformrdquo Though these other naming conventions are self-explana-tory cloud computing is not
The cloud computing is understood as a shift of the ge-ography of computing It begs the question if it is about moving delivery of a wide variety of information services onto to the Internet why donrsquot we call it ldquoInternet Com-putingrdquo
The first time cloud computing showed up in a HBR pub-lication was in a digital article in April 2008 14 The au-thor states that the move to cloud computing would be disruptive to incumbent players of shrink-wrapped gam-ing software assuming his readers understand what cloud computing entails
A BRIEF HISTORY OF COMPUTING
In the early days of computers they were big and expen-sive So sharing this big expensive gadget was a normal practice Most organizations did not usually own this big machine but those who did had to share it across an en-terprise That was the era of timesharing
However as computers got cheaper and more afford-able every company every department and then finally every person decided to have their own computer How-ever standalone computers are of limited use So we networked them first locally in a Local Area Network (LAN) environment and then far and wide Wide Area
Network (WAN) Then we networked the network and the World Wide Web was born
At the same time in a different parallel universe some-thing else was happening In the early years no commer-cial off-the-shelf software (COTS) was available Every organization had to write its own software program So if you wanted to computerize your accounting general led-ger payables and receivables or run your inventory you had to write your own applications
Buying off-the-shelf applications was also considered ldquooutsourcingrdquo Why Because you were having others do the work for your organization which was supposed to be doing this work for itself So over the years most appli-cation development have been outsourced to burgeoning software companies such as IBM Oracle and SAP
OUTSOURCING AND ASP
In a general sense IS outsourcing is nothing newmdashit has always been considered an option for IT solutions 11 Electronic Data Systems was handling data processing services for Frito-Lay and Blue Cross as early as 1963 IS outsourcing soon became widely known as the second of a three-phase outsourcing phenomenonmdashtraditional out-sourcing being the first phase and application outsourcing being the third 6
In the early years of the last decade xSPs service provid-ers of all stripes were leading into a new generation of IT where it really did not matter where the applications reside as long as we had access to accomplish what we wanted 247 However back then an Application Service Provider (ASP) was thought by some to be another re-incarnation of the old ldquotimesharingrdquo leveraging network technologies 22
However the understanding of an evolving net-centric computing was already there In their book published in 2002 aptly titled NetSourcing authors Kern Lacity and Willcocks 7 define a computing framework and services stack thatrsquos similar to Cloud Computing The authors state ldquoWe selected the term ldquoNetsourcingrdquo as the over-arching name because the common element of any xSP is the delivery of a product or service over a networkrdquo (p 3) The ldquonetworkrdquo however is now synonymous with the ldquoInternetrdquo
Today cloud computing is about getting the job done in whatever way shape or form that may be required Orga-nizations and individuals need the utility of computing and where it comes from by and large is of no concern As early as 1961 Professor John McCarthy predicted that computation may someday be organized as a public utility ldquoEach subscriber needs to pay only for the capac-
ity he actually uses but he has access to all programming languages characteristics of a very large system hellip Certain subscribers might offer services to other subscribers hellip The computer utility could become the basis of a new and im-portant industry 8 McCarthyrsquos notion of ldquoutility comput-ingrdquo is here right nowmdashthat is ldquocloud computingrdquo
This point is confirmed by others 1 p 51 ldquoThe data center hardware and software is what we consider a cloud When a cloud is made available in a pay-as-you-go manner to the general public we call it utility computingrdquo
CLOUD COMPUTING ORIGIN OF THE PHRASE
Coinage of the term ldquocloud computingrdquo has been traced to two individuals who at the time they came up with this term worked for Compaq Computer George Favaloro a Compaq marketing executive and Sean OrsquoSullivan the founder of the now defunct business NetCentric 20
A Compaq internal document marked as confiden-tial dated November 14 1996 and provided by Sean OrsquoSullivan contemplates a Cloud Computing ldquostrat-egyrdquo10
But the creation of this term did not find currency for another decade Many believe the first use of ldquocloud com-
putingrdquo in its modern context occurred on August 9 2006 when then Google CEO Eric Schmidt introduced the term at an industry conference ldquoWhatrsquos interesting [now] is that there is an emergent new modelrdquo Schmidt said ldquoI donrsquot think people have really understood how big this opportunity really is It starts with the premise that the data services and architecture should be on servers We call it cloud computingmdashthey should be in a ldquocloudrdquo somewhererdquo 19
CLOUD COMPUTING DEFINITION
The National Institute of Standards and Technology (NIST SP 800-145) defines Cloud Computing in the fol-lowing way ldquoCloud computing is a model for enabling convenient on-demand network access to a shared pool of configurable computing resources (eg networks serv-ers storage applications and services) that can be rapidly provisioned and released with minimal management ef-fort or service provider interaction This cloud model is composed of five essential characteristics three service models and four deployment modelsrdquo 17
The following diagram places all the pieces together in a visual form
The Conceptual Reference Model
Cloud Computing Reference Architecture NIST Special Publication 500-292
Nozar Daylami The Origin and Construct of Cloud Computing
42 International Journal of the Academic Business World 43Fall 2015 (Volume 9 Issue 2)
Cloud Computing Reference Architecture NIST Special Publication 500-292
NIST Special Publication 500-292 states that ldquothe defini-tion is widely accepted as a valuable contribution toward providing a clear understanding of cloud computing tech-nologies and cloud services It provides a simple and un-ambiguous taxonomy of three service models available to cloud consumers cloud software as a service (SaaS) cloud platform as a service (PaaS) and cloud infrastructure as a service (IaaS) It also summarizes four deployment mod-els describing how the computing infrastructure that delivers these services can be shared private cloud com-munity cloud public cloud and hybrid cloudrdquo 18 Finally the NIST definition also provides a unifying view of five essential characteristics that all cloud services exhibit on-demand self-service broad network access resource pool-ing rapid elasticity and measured service 18
This publication further states that ldquoThese services and their delivery are at the core of cloud computing In the cloud computing model the primary focus is a more eco-
nomic method of providing higher quality and faster ser-vices at a lower cost to the usersrdquo
The Cloud Security Alliance 21 provides a more transpar-ent narrative of what Cloud Computing is ldquoa model for enabling ubiquitous convenient on-demand network access to [a] shared pool of configurable computing re-sources [it] has the potential to enhance collaboration agility scaling and availability and provides opportunity for cost-reduction the model envisages a world where components can be rapidly orchestrated provisioned implemented and decommissioned scaled up or down to provide an on-demand utility-like modelrdquo
A SPATIAL VIEW OF CLOUD COMPUTING
The NIST Computing Reference Architecture is a flat depiction of the cloud computing model A three dimen-sional view of the model by Craig-Wood 2 is a spatial de-piction Here you can see the three dimensions of cloud computing that renders the elephant fable
Computing Services Framework
Infrastructure as a Service (IaaS) As the word ldquoinfra-structurerdquo implies this is the most basic of services Cus-tomers can buy processing storage and network services and then build their own systems on top of this infra-structure A pioneer in the IaaS field is Amazon with its Amazon Elastic Compute Cloud (EC2)
However most big names in the IT field from Micro-soft (Azure) to Google (App Engine) provide IaaS Here customers are not renting specific servers hard drives and network switches or any particular equipment but instead they are utilizing the infrastructure that is most certainly simulated by virtualization software allowing multiple customers to be served by the same array of physi-cal devices IaaS provides the raw power of computingmdashstorage included
Cloud Computing would not be possible without virtu-alization Virtualization is the ability to make a virtual machine (VM) act like a physical computer Just like a physical computer with its own processor operating sys-tem and storage each VM has its own components too The benefit of virtualization though is that you can put much more than only one VM even with different oper-ating systems on the same server Doing so dramatically increases each serverrsquos potential for serving clientsrsquo on-demand needs (8)
Platform as a Service (PaaS) The next level up is where vendors provide not only the raw powermdashthe infrastruc-turemdashbut preconfigured systems running operating sys-tems databases and platforms (programming languages) for building applications For example Microsoftrsquos Azure service provides preconfigured computers running Win-dows and SQL Server And Salesforcecom has Forcecom as its own custom application development platform
In practice the boundary between IaaS and PaaS is not always clear Because IaaS providers most often provide other services such as operating systems database or ap-plication development platform that fall in the PaaS cat-egory In its purest form IaaS can be considered as virtual machines (raw processing power and storage) that can be scaled up and down as you need
Software as a Service (SaaS) Another higher layer is where vendors provide full applications running on cloud infrastructuremdashtheir own or rented from the likes of Amazon Salesforcecom has long been considered one of the most successful SaaS provider Salesforececom CRM was one of the early entrants into the market Salesforcecom prides itself on being a pioneer in Cloud Computing
At Salesforcecom itrsquos all about the Cloud However in their collateral literature dated circa 1993-94 you wonrsquot find any mention of the word ldquocloudrdquo
CLOUD COMPUTING CONCERNS
In survey after survey security is listed as the top concern of Cloud Computing However Cloud Security Alliance (CSA) the industry group that provides security guide-lines and education states that ldquosecurity controls for the cloud computing are for in most part no different than the security controls in any IT environment hellip[however] cloud computing may present different risks to an organi-zation than traditional IT solutionsrdquo 21 p 21
CIOs or CEOs for that matter may feel safer when they ldquoownrdquo versus ldquorentrdquo their IT assets However when you deploy your assets on the Internet for which you eventu-ally will have little choice you will inherit a set of vulner-abilities that are not all that different from the Cloudrsquos Ownership has its own set of financial risks in the form of capital expenditures (CAPEX) that need to be budgeted and spent up front Compare that risk with the far smaller risk of renting (OPEX) which by and large can be dis-continued if needed
Cloud computing technology does not require the use of public networks If your data is too strategically critical and sensitive to be deployed on the Internet you could instead deploy a private cloud that is strictly for your or-ganization Obviously a Private Cloud is more expensive and it needs trained staff However a private cloud lets an organization benefit from cloud technology without the risk of possible public disclosure of its data
Another alternative could be a community cloudmdasha pri-vate cloud that is shared by several organizations for spe-cific needs For example a group of hospitals might create a community cloud to hold patientrsquos medical records
CONCLUSION
Cloud Computing is here to stay and grow Clouds are more versatile than traditional IT networks on many di-mensions They are far more convenient to deploy they have far more potential for collaboration and they are far more scalable than traditional IT ever was The delivery of services is provisioned on global telecommunication net-works that these days have morphed into the Internet And when they mature they will provide a computing utility when and where it is needed
Cloud computing model (adapted from Craig-Wood)
Nozar Daylami The Origin and Construct of Cloud Computing
44 International Journal of the Academic Business World 45Fall 2015 (Volume 9 Issue 2)
BIBLIOGRAPHY
1 Armburst M et al A View of Cloud Computing Communications of the ACM Vol 53 No 4 pages 50-58
2 Craig-Wood K Definition of Cloud Computing incorporating NIST and G-Cloud views httpswwwkatescommentcomdefinition-of-cloud-com-puting-nist-g-cloud Access date April 26 2015
3 Creeger M CTO Roundtable Cloud Computing Communications of the ACM Vol 52 No 8 pages 50-56
4 Cusumano M Cloud Computing and SaaS as New Computing Platforms Communications of the ACM Vol 53 No 4 pages 27-29
5 Foster Ian and Tuecke Steven Describing the Ele-phant The Different Faces of IT as Service wwwac-mqueuecom JulyAugust 2005 pages 26-34 httpdeliveryacmorg10114510900001080874p26-fosterpdf ip=99100108167ampid=1080874ampacc=OPENampkey=4D4702B0C3E38B352E4D4702B0C3E38B352E4D9421298D07BF362E6D218144511F3437ampCFID=505172814ampCFTOKEN=56369758amp__acm__=1429816554_402a40f1d60056fb68e8ccf3fdd96201 accessed April 23 2015
6 Kern Thomas Lacity Mary Cecelia Willcocks Leslie P Netsourcing Renting Business Applica-tions and Services Over a Network Prentice Hall 2002
7 Knoblauch A Deconstructing Cloud Smashwords Edition (Kindle Version) First Edition August 2013
8 Garfinkel Simon (2011 Oct 3) The Cloud Imperative MIT Technology Review httpwwwtechnologyreviewcomnews425623the-cloud-imperative
9 Hayes B Cloud Computing Communications of the ACM Vol 51 No 7 pages 9-11
10 Internet Solution Division Strategy for Cloud Com-puting Compaq Computer Corporation (1996) httpwwwtechnologyreviewcomsitesdefaultfileslegacycompaq_cst_1996_0pdf
11 Lacity M C Hirschheim R Information Systems Outsourcing Myths Metaphors and Realities New York John Wiley amp Sons 1993
12 McAfee A The Year the Cloud Rolled In httpshbrorg2010122010-the-year-the-cloud-rolled Access date April 23 2015
13 McAfee A What Every CEO Needs to Know About the Cloud httpshbrorg201111what-every-ceo-needs-to-know-about-the-cloud Access date April 23 2015
14 McGrath R Whorsquos Disrupting the Gaming Indus-try httpshbrorg200804whos-disrupting-the-gaming-ind Access date April 23 2015
15 Mell P Grance T The NIST Definition of Cloud Computing National Institute of Standards and Technology httpcsrcnistgovpublicationsnist-pubs800-145SP800-145pdf
16 Neumann P Risks and Myths of Cloud Comput-ing and Cloud Storage Communications of the ACM Vol 57 No 10 pages 25-27 The NIST Defi-nition of Cloud Computing httpcsrcnistgovpublicationsnistpubs800-145SP800-145pdf
17 NIST Definition of Cloud Computing httpcsrcnistgovpublicationsnistpubs800-145SP800-145pdf
18 NIST Cloud Computing Reference Architecture National Institute of Standards and Technology Special Publication 500-292 httpwwwnistgovcustomcfget_pdfcfmpub_id=909505
19 Nanavati M Colp P Aiello W and Warfield A Cloud Security A Gathering Storm Communica-tions of the ACM Vol 57 No 8 pages 70-79
20 Regalado Antonio (2011 Oct 31) Who coined cloud computing MIT Technology Review httpwwwtechnologyreviewcomnews425970who-coined-cloud-computing
21 Security Guidance for Critical Areas of Focus in Cloud Computing V30 Cloud Security Alliance httpscloudsecurityallianceorgguidancecsagu-idev30pd
22 Seviokla J Does Cisco Have Its Head in the Clouds httpshbrorg200903does-cisco-have-its-head-in-th Access date April 23 2015
23 Walsh K R Analyzing the Application ASP Concept Technologies Economies and Strategies Communications of ACM Vol 46 No 8 pages 103-107
24 Yang H Tate Mary A Descriptive Literature Review and Classification of Cloud Computing Re-search Communications of Association of Informa-tion Systems Vol 31 2012
Nozar Daylami
46 Fall 2015 (Volume 9 Issue 2)
This page intentionally blank
International Journal of the Academic Business World 47
INTRODUCTION
In their paper ldquoSAS and the Efficient Portfoliordquo Thomp-son and El-houbi (2012) develop a SAS program to calcu-late portfolio weights for efficient stock portfolios Their program improves on existing public domain SAS pro-grams of this type by allowing for portfolios with a rela-tively large number of securities Thompson and El-houbi also claim that their SAS program is an improvement over the Excel programs used to calculate portfolio weights which are sometimes included in investment textbooks They note that users concur that their program is easier to use than those Excel programs which either limit the number of securities that can be included in a portfolio require ldquocorrectionsrdquo or ldquoadjustmentsrdquo to overcome some quirks in the Excel Solver routine or require multiple user interventions
The Thompson and El-houbi program is certainly more elegant and user friendly than the equivalent Excel pro-grams and will provide those with access to the SAS pro-gramming language a valuable tool for learning portfolio management The disadvantage of a SAS program how-ever is that many students will not have easy access to the SAS programming language Students at smaller univer-sities may not have any access to SAS while students at many larger universities may only be able to access SAS at a computer lab on campus
In this paper I modify the Thompson and El-houbi SAS program for use in the open-source R programming lan-guage which is available free of charge for anyone with access to the internet Using the R language program to compute portfolio weights for efficient portfolios main-tains the elegance of the Thompson and El-houbi SAS
program while overcoming the disadvantage of limited SAS availability In addition I extend the Thompson and El-houbi program by making use of a quadratic program-ming package available in R to provide a program that can accommodate short-sale restrictions and position limits
THE R PROGRAMMING LANGUAGE
R is a free programming language for statistical analysis and graphics and runs on many UNIX platforms and on Windows and MacOS It is available under the terms of the Free Software Foundationrsquos GNU General Public License R was developed initially by Robert Gentleman and Ross Ihaka both of the University of Auckland (New Zealand) and is based on the S programming language developed at Bell Labs by John Chambers Since its initial development the popularity of R has grown considerably largely because of its ease of use and because of the avail-ability of many add-on packages that allow users to tackle very sophisticated projects
The base R package may be downloaded at httpcranusr-projectorg That web page also provides links to sources of information about R and basic user manuals There are also many books and manuals now available for purchase that offer information on both basic and special-ized uses of the language In fact Vance (2009) suggests that the growing popularity of the R language at univer-sities language could even result in noticeably lower de-mand for SAS
THE MARKOWITZ PORTFOLIO PROBLEM
As Markowitz (1952) notes an investor following the ldquoex-pected returns-variance of returns rulerdquo will choose an ef-
Optimal Portfolios and the R Programming Language
James A TurnerAssistant Professor of Finance
School of Accounting amp TaxationWeber State University
Ogden UT 84408
ABSTRACTThis paper develops a program in the freely available open-source R programming language to calculate weights for optimal stock portfolios The program retains the advantages the Thompson and El-houbi (2012) SAS program has over similar programs in Excel but avoids the potential problem of limited access to SAS that some students and researchers may face The R program also extends the Thompson and El-houbi program by including the ability to accommodate short-sale restrictions and position limits
James A Turner Optimal Portfolios and the R Programming Language
48 International Journal of the Academic Business World 49Fall 2015 (Volume 9 Issue 2)
ficient portfolio that is a portfolio with maximum ex-pected return for a given variance or one with minimum variance for a given expected return The minimum vari-ance formulation of the portfolio choice problem there-fore requires that the investor choose portfolio weights to minimize the variance of a portfolio with a given expected return The problem also requires that all money be in-vested (which means that the portfolio weights must sum to one) In matrix notation the optimization problem is
where w the choice variable is a k times 1 vector of the weights invested in the k securities in the portfolio V is the port-folio variance-covariance matrix and R is a 2 times k matrix whose first row is a vector of ones and whose second row contains the expected returns of each security in the port-folio M is a 2 times 1 vector whose first element is one (corre-sponding to the constraint that the portfolio weights sum to one) and whose second element is the chosen portfo-lio expected return For now there are no restrictions on short sales so some portfolio weights may be negative
The Lagrangian for the problem is
( ) L w Vw M Rwλprime prime= + minus
where λ is a 2 times 1 vector containing the Lagrangian multi-pliers The first-order conditions for a minimum (which are also sufficient conditions in this case) are
Solving the first-order conditions for w and λ yields
( )( )
11 1
112
w V R RV R M
RV R Mλ
minusminus minus
minusminus
prime prime=
prime=
Thompson and El-houbi following Stephens (1998) let 1 H RV Rminus prime= so that
1 1
1
2
w V R H MH Mλ
minus minus
minus
prime=
=
Stephens (1998 p 36) shows how the elements of the H matrix may be used ldquoto fix any meanvariance point on the efficient frontierrdquo
Min st
w VwRw M
prime
=
2 0
0
L Vw RwL M Rw
λ
λ
part prime= minus =partpart
= minus =part
THE BASIC R PORTFOLIO OPTIMIZATION PROGRAM
The R programming language lends itself very easily to matrix manipulation and matrix computation removing much of the difficulty in solving the standard Markowitz portfolio problem The following R program calculates the portfolio weights for an efficient portfolio using stock return data to estimate expected returns and the variance-covariance matrix The user must specify the desired port-folio expected return The program can accommodate portfolios up to about 50 stocks Beyond that number precision limitations of the R language may make the variance-covariance matrix ldquocomputationally singularrdquo and unable to be inverted
The first step in the program is to read in the return data R can input data from many file types but in the present example the data are stored in a comma-delimited Excel file called ldquoReturnscsvrdquo which contains stock return data In this case the Excel file includes a header row labeling each column of returns with identifying information but no row names The program first reads in the data and then determines the number of securities (number of col-umns in the matrix) as shown on the facing page
ADDING SHORT-SALE CONSTRAINTS AND POSITION LIMITS
The above formulation of the portfolio choice problem places no restrictions on short sales and does not accom-modate position limits In reality individual investors and some fund managers may face requirements prohibit-ing short sales Fund managers may also face requirements that either limit the amount that may be invested in one security or sector or instead that a minimum percentage of funds be invested in a certain security or sector Dai Lin and Liu (2011) list several examples of real-world po-sition limits such as a requirement that a small-cap mutu-al fund invest at least a minimum percentage of its funds in small-company stocks In mathematical terms these short-sale restrictions and position limits can be expressed as a series of inequality constraints While reformulating the portfolio choice problem to add inequality constraints is not difficult doing so makes actually solving the prob-lem considerably more difficult
With short-sale restrictions and position limits the port-folio choice problem becomes
0
Min st
w VwRw MSw w
prime
=ge
where w is still the choice variable S is an m times k matrix that defines both the short-sale constraints on the k se-curities in the portfolio and m minus k other restrictions If there are short-sale constraints but no other restrictions the S matrix is simply a k times k identity matrix which when multiplied by the vector w results in the requirement that
0 iw ige forall If there are other restrictions the sub-matrix of S consisting of the first k rows and k columns of S is an identity matrix and the other restrictions are specified by suitable choices of the elements of the remaining rows of S For example suppose there is a position limit placing a maximum of p on the percentage invested in the sev-enth security so that 7 w ple Since the constraints in the optimization problem above have been expressed as non-negativity constraints this position limit must instead take the form 7 w pminus ge minus The row of S corresponding to
the position limit will consist entirely of zeros except for the seventh element which will be minus1 and corresponding element of the w0 vector would be p
Introducing other forms of position limits simply requires adding the appropriate rows to the S matrix For example if there is a requirement that the total percentage invested in the first and third securities equal or exceed a certain percentage q then one row of S should be [1 0 1 0 0]and the corresponding element of the w0 vector would be q If there is instead a requirement that the total percentage invested in the first and third securities not exceed a cer-tain amount q the required row of S would be [-1 0 -1 0 0] and the corresponding element of the w0 vector would be minusq Other restrictions may be specified similarly For problems that include position limits each of the first k el-
The BASIC R Portfolio Optimation Program
Returns ltminus readtable(ldquoReturnscsvrdquo header = TRUE sep = ldquordquo)Rmat ltminus asmatrix(Returns) Converts the data to matrix formk ltminus ncol(Rmat) Number of columns (number of securities in the portfolio) Now the program calculates the estimate of the variance-covariance matrix (V) the M vector and the R matrix which includes the estimate of the expected returns
V ltminus var(Rmat) Calculates the sample variance-covariance matrix which is used as the estimate of the variance-covariance matrix
Erp ltminus 001 Sets the desired expected portfolio return The user can change this value as desired
M ltminus rbind(1 Erp) Ones ltminus rep(1 k) Ravg ltminus colMeans(Rmat)
Defines the M matrix including the required portfolio return Defines a 1 x k matrix of ones Calculates average returns by column giving a 1 x k matrix of estimated expected returns
R ltminus rbind(Ones Ravg) Combines Ones and Ravg into the 2 x k matrix R Finally the program calculates the portfolio weights and the portfolio variance
VINV ltminus solve(V) Calculates the inverse of the estimated variance-covariance matrixH ltminus RVINVt(R) Calculates the H matrixHINV ltminus solve(H) Calculates the inverse of Hw lt- VINVt(R)HINVM Calculates the portfolio weightsPvar lt- t(w)Vw Calculates the portfolio variance The following commands display the results of the calculations
print(w) Prints the elements of the w vectorprint(Pvar) Prints the variance of the portfolio formed using the weights w
James A Turner Optimal Portfolios and the R Programming Language
50 International Journal of the Academic Business World 51Fall 2015 (Volume 9 Issue 2)
ements of the w0 vector will be zero corresponding to the non-negativity constraints and the remaining elements will equal the percentages associated with the position limits entered as positive or negative numbers depend-ing on whether the position limits establish minimums or maximums
The Lagrangian for this problem is
( ) ( )0 L w Vw M Rw w Swλ microprime prime prime= + minus + minus
where λ is a 2 times 1 vector containing the Lagrangian multi-pliers on the equality constraints and micro is an m times 1 vector of the Lagrangian multipliers on the k short-sale constraints and the m ndash k position limits The first-order necessary con-ditions for this problem are the Kuhn-Tucker conditions
( )0 0
2 0
0
0 0 and 0
L Vw R SwL M Rw
L w Sw w Sw
λ micro
λ
micro micromicro
part prime prime= minus minus =partpart
= minus =partpart prime= minus le ge minus =part
The final set of conditions are known as the complementa-ry slackness conditions since if an element of partLpartμ does not equal zero (ie if the required condition is slack) then the corresponding element of micro must equal zero and vice versa Because of the complementary slackness conditions in order to find a solution to the optimization problem each condition must be checked individually to deter-mine the possible solutions If there are more than a very few constraints finding the candidate solutions manually becomes extremely tedious
Fortunately it is possible to use numerical methods to solve this type of non-linear programming program This is where the strength of the R programming language be-comes very evident The R language provides access to an extensive number of add-on packages developed by R us-ers around the world In particular there are several pack-ages that implement numerical methods to find solutions to optimization problems with inequality constraints Perhaps the package that most easily lends itself to solv-ing the current problem is the ldquoquadprogrdquo package Ac-cording to the documentation included with the pack-age the quadprog routine ldquoimplements the dual method of Goldfarb and Idnani (1982 1983) for solving qua-dratic programming problems of the form min(d΄b+frac12b΄Db)) with the constraints Aʹbgtb₀rdquo For the optimization problem currently under consideration the d vector will be a zero vector the b vector will be the w vec-tor of portfolio weights the D matrix will be the variance-
covariance matrix V and the matrix A΄ will equal a matrix formed by combining the R matrix and the S matrix such that A΄= [R
S ]and A = [ R΄ S΄] Since the V matrix is symmetric the term frac12b΄Db = frac12w΄Vw is a quadratic form Also because the d vector is a zero vector the presence of the frac12 term in the quadratic form does not change the value of the solution to the current portfolio optimization problem That is the weights that minimize frac12w΄Vw sub-ject to the constraints will also minimize w΄Vw subject to the constraints
THE R PORTFOLIO OPTIMIZATION PROGRAM WITH PACKAGE ldquoQUADPROGrdquo
The ldquoQuadprogrdquo package is one of many add-in packages available to R users To use add-in packages in R the user must first download and install the chosen package This is done through the ldquoPackagesrdquo command in the menu bar of the console window Selecting the ldquoInstall package(s)rdquo command from the drop-down box will bring up a list of download locations After selecting a download location the user selects the package(s) to download and install Finally once the selected package is downloaded and in-stalled it must be loaded for use in the current R session which is done by choosing ldquoPackagesrdquo command on the menu bar and then choosing the ldquoLoad packagerdquo com-mand from the drop-down box A list of available packag-es will then appear and the user should select the desired package in this case the ldquoquadprogrdquo package Once the quadprog package is loaded the following program will solve the portfolio problem with short-sale restrictions and position limits
In the present example the short-sale constraint requires that all elements of the w vector be non-negative In addi-tion there are three position limits The first position lim-it requires that no more than 5 of total funds be invested in the seventh security The second position limit requires that no more than a total of 40 of available funds be in-vested in the first and third securities The third position limit requires that total of at least 30 of available funds be invested in the second and fourth securities
The program will make use of the M matrix and the vari-ance-covariance matrix V from the earlier program so those variables must be saved by the user or the following program must be run after running the previous program and before exiting R The new program first sets the posi-tion limits as shown on the facing page
The output of the ldquosolveQPrdquo function includes the values of w and the Lagrangian multipliers for each constraint If the value of a Lagrangian multiplier is zero the constraint associated with that multiplier is not binding otherwise the constraint is binding Though checking the values of
the Lagrangian multipliers allows the user to determine which constraints are binding quite easily the functionrsquos output also includes a listing of the binding constraints by index number
The R Portfolio Optimization Program with Package ldquoQuadprogrdquo
npl ltminus 3 Sets the number of position limits The user sets this value
plmat ltminus matrix (rep(0 nplk) nrow=npl ncol=k) Initializes the matrix that will be used to define the position limit(s)
plmat[17] = -1 Places the required elements into the proper places in the lmat[21] = plmat[23] = -1 position limits matrix In this example the first position
plmat[32] = plmat[34] = 1 limit will set a maximum on the total percentage invested in the seventh security The second position limit will set a maximum on the total percentage invested in the first and third securities The third position limit will set a minimum on the total percentage invested in the second and fourth securities
pl ltminus c(-005 -04 03) Sets the values of the position limits The value the user enters should be positive if the position limit specifies a inimum and should be negative if the position limit specifies a maximum
Next the inequality constraints are placed in matrix form
S ltminus rbind(diag(k) plmat) Defines the S matrix
w0 ltminus c(rep(0 k) pl) Creates a vector whose elements are the values of the inequality constraints
Next the arguments required by the solveQP function that solves the programming problem are defined and the programming problem is solved
dvec ltminus rep(0 k) Defines the d vector which is a necessary input for the quadprog package For portfolio optimization problems the elements of the d vector will all be zeros
Amat ltminus colbind(t(R) t(S)) Forms the Amat matrix
bvec ltminus c(M w0) Joins the M matrix and the w0 matrix to form the bvec vector
ICSol ltminus solveQP(V dvec Amat bvec meq=2) Solves the quadratic programming problem The argument meq specifies that the first two constraints are equality constraints In this example the equality constraints are that the weights sum to one and that the portfolio expected return equal a specified amount
print(c(ICSol[1] 2ICSol[[2]] ICSol[5] ICSol[6])) Prints selected output from the solve QP function the weights the portfolio variance the values of the Lagrangian multipliers and the index numbers of the binding constraints
James A Turner Optimal Portfolios and the R Programming Language
52 International Journal of the Academic Business World 53Fall 2015 (Volume 9 Issue 2)
CONCLUSION
This paper provides an R language program to calculate portfolio weights for efficient portfolios The program can also accommodate short-sale constraints and position limits Users must choose the desired portfolio expected return and must specify any other constraints A strong advantage of the program is that because the R program-ming language is freely available to anyone with access to the internet students and others who wish to use the pro-gram will be able to do so easily
REFERENCES
Dai Min Hanqing Jin and Hong Liu 2011 Illiquidity position limits and optimal investment for mutual funds Journal of Economic Theory 146 1598ndash1630
Goldfarb D and A Idnani 1982 Dual and primal-dual methods for solving strictly convex quadratic pro-grams In Hennart J P (ed) Numerical Analysis Springer-Verlag Berlin pages 77ndash91
Goldfarb D and A Idnani 1983 A numerically stable dual method for solving strictly convex quadratic pro-grams Mathematical Programming 27 1ndash33
Ihaka Ross A free software project Retrieved May 7 2013 from httpcranr-projectorgdochtmlinter-face98-paperpaper_2html
Markowitz Harry 1952 Portfolio selection Journal of Finance 7 77ndash91
Stephens Alan 1998 Markowitz and the spreadsheet Journal of Financial Education 35ndash43
Thompson Thomas H and Ashraf El-houbi 2012 SAS and the efficient portfolio International Research Jour-nal of Applied Finance 3 315ndash327
Turlach Berwin A 2013 quadprog Functions to solve quadratic programming problems R pack-age version 15-5 httpCRANR-projectorgpackage=quadprog (S original by Berwin A Turlach R port by Andreas Weingessel)
Vance Ashlee 2009 Data analysts captivated by Rrsquos power The New York Times Retrieved May 1 2013 from httpwwwnytimescom20090107tech nolog y busi ness-computi ng 0 7prog ra m htmlpagewanted=allamp_r=0
What is R Retrieved May 7 2013 from httpwwwr-projectorgabouthtml
APPENDIX 1 DATA
The data used in the R program come from the CRSP monthly stock file and consist of 60 months of return data from January 2008 to December 2012 The stocks in the 10-stock portfolio are the first 10 stocks in the CRSP monthly file (listed by PERMNO) for which 60 continuous months of returns are available The stocks in the 50-stock portfolio are the first 50 stocks for which 60 continuous months of returns are available Table 1 below lists the PERMNOS current company name and current ticker of the included stocks as well as the exchange where the stock trades
Table 1 Stocks in the Portfolio
NO PERMNO CURRENT COMPANY NAME TICKER EXCHANGE1 10001 GAS NATURAL INC EGAS AMEX2 10002 BANCTRUST FINANCIAL GROUP INC BTFG NASDAQ3 10025 A E P INDUSTRIES INC AEPI NASDAQ4 10026 J amp J SNACK FOODS CORP JJSF NASDAQ5 10032 PLEXUS CORP PLXS NASDAQ6 10044 ROCKY MOUNTAIN CHOCOLATE FAC INC RMCF NASDAQ7 10051 HANGER INC HGR NYSE8 10065 ADAMS EXPRESS CO ADX NYSE9 10100 AMERICAN LEARNING CORP NY ALRN NASDAQ
Table 1 Stocks in the Portfolio
NO PERMNO CURRENT COMPANY NAME TICKER EXCHANGE10 10104 ORACLE CORP ORCL NASDAQ11 10107 MICROSOFT CORP MSFT NASDAQ12 10138 T ROWE PRICE GROUP INC TROW NASDAQ13 10145 HONEYWELL INTERNATIONAL INC HON NYSE14 10147 E M C CORP MA EMC NYSE15 10180 AKORN INC AKRX NASDAQ16 10182 TECH DATA CORP TECD NASDAQ17 10200 REPLIGEN CORP RGEN NASDAQ18 10207 ROYCE FOCUS TRUST INC FUND NASDAQ19 10225 BEAM INC BEAM NYSE20 10232 ELMIRA SAVINGS BANK NY ESBK NASDAQ21 10239 BALDWIN amp LYONS INC BWINB NASDAQ22 10252 INDEPENDENT BANK CORP MA INDB NASDAQ23 10253 DOCUMENT SECURITY SYSTEMS INC DSS AMEX24 10257 D L H HOLDINGS CORP DLHC NASDAQ25 10258 CELLDEX THERAPEUTICS INC CLDX NASDAQ26 10259 SIGMA DESIGNS INC SIGM NASDAQ27 10294 HAVERTY FURNITURE COS INC HVT NYSE28 10297 NEW HAMPSHIRE THRIFT BNCSHRS INC NHTB NASDAQ29 10299 LINEAR TECHNOLOGY CORP LLTC NASDAQ30 10302 CYPRESS SEMICONDUCTOR CORP CY NASDAQ31 10308 TOMPKINS FINANCIAL CORP TMP AMEX32 10318 BALCHEM CORP BCPC NASDAQ33 10333 XOMA CORP XOMA NASDAQ34 10355 DAILY JOURNAL CORP DJCO NASDAQ35 10363 A M A G PHARMACEUTICALS INC AMAG NASDAQ36 10375 T C F FINANCIAL CORP TCB NYSE37 10382 ASTEC INDUSTRIES INC ASTE NASDAQ38 10395 NAVIGATORS GROUP INC NAVG NASDAQ39 10397 WERNER ENTERPRISES INC WERN NASDAQ40 10421 SKYWEST INC SKYW NASDAQ41 10443 PATRIOT TRANSPORTATION HLDG INC PATR NASDAQ42 10463 RESEARCH FRONTIERS INC REFR NASDAQ43 10501 AMERICAN WOODMARK CORP AMWD NASDAQ44 10507 MEDICAL ACTION INDS INC MDCI NASDAQ45 10514 TRANS WORLD ENTERTAINMENT CORP TWMC NASDAQ46 10516 ARCHER DANIELS MIDLAND CO ADM NYSE47 10517 AARONS INC AAN NYSE48 10530 MERIDIAN BIOSCIENCE INC VIVO NASDAQ49 10547 CLEARFIELD INC CLFD NASDAQ50 10550 PRO DEX INC COLO PDEX NASDAQ
James A Turner Optimal Portfolios and the R Programming Language
54 International Journal of the Academic Business World 55Fall 2015 (Volume 9 Issue 2)
APPENDIX 3 RESULTS FOR THE 10-STOCK PORTFOLIO
Results for the 10-stock portfolio with a monthly expect-ed return of 1 are shown at the top of the facing page First shown is the variance-covariance matrix (V) fol-lowed by its inverse (V-1)
Table 2 shows the return averages of each stock and the calculated portfolio weights both for the portfolio with no short-sale constraints or position limits and the port-folio with short-sale constraints and three position limits (1) a requirement that the percentage invested in the sev-enth security not exceed 5 (2) a requirement that the
total percentage invested in the first and the third securi-ties not exceed 40 and (3) a requirement that the total percentage invested in the second and fourth securities be at least 30 Note that when short-sale constraints and position limits are imposed there may no longer be a port-folio that meets all the constraints that is the feasible set may be null In that case the R program will return an error message stating that the constraints are inconsistent
Table 3 lists the inequality constraints and the associ-ated Lagrangian multipliers along with an indication of whether the constraint is binding In this example the constraint that there be a minimum of 30 invested in the second and fourth securities is not binding
APPENDIX 2 COPY OF THE FULL PROGRAM
The full program is shown below without comments Users can easily copy the program that is between the solid lines and paste it into the R Editor window It will probably be necessary for each user to change the name of the data file in the readtable command Also the user can change the portfolio expected return and the number type and value of the inequality constraints as desired
Returns ltminus readtable(ldquoReturnscsvrdquo header = TRUE sep = ldquordquo) Rmat ltminus asmatrix(Returns) k ltminus ncol(Rmat) V ltminus var(Rmat) Erp ltminus 001 M ltminus rbind(1 Erp) Ones ltminus rep(1 k) Ravg ltminus colMeans(Rmat) R ltminus rbind(Ones Ravg) VINV ltminus solve(V) H ltminus RVINVt(R) HINV ltminus solve(H) w lt- VINVt(R)HINVM Pvar lt- t(w)Vw print(w) print(Pvar) npl ltminus 3 plmat ltminus matrix (rep(0 nplk) nrow=npl ncol=k) plmat[17] = -1 plmat[21] = plmat[23] = -1 plmat[32] = plmat[34] = 1 pl ltminus c(-005 -04 03)S ltminus rbind(diag(k) plmat) w0 ltminus c(rep(0 k) pl) dvec ltminus rep(0 k) Amat ltminus cbind(t(R) t(S)) bvec ltminus c(M w0) ICSol ltminus solveQP(V dvec Amat bvec meq=2) print(c(ICSol[1] 2ICSol[[2]] ICSol[5] ICSol[6]))
1
2867001 161224 279311 153314 408660 148438 131874 246057 83608 740152
161224 321169 23967 251277 39387 55190 33449 107899 36378 39718
279311 23967 991158 109233 189872 100249 22208 119
V minus
minus minus minus
minus minus minus minus
minus minus minus minus
=
6782 41342 198294
153314 251277 109233 2757210 319797 03010 139907 969199 56520 416534
408660 39387 189872 319797 977494 325171 247388 1098965 26657 04097
148438 55190 100249 03010 325171 1
minus minus minus minus minus
minus minus minus minus minus minus
minus 644368 311333 1803329 91576 428583
131874 33449 22208 139907 247388 311333 1093506 426730 100681 162364
246057 107899 1196782 969199 1098965 1803329 426730 11640904 233195 3789283
8360
minus minus
minus minus minus minus minus minus minus
minus minus minus minus minus minus
8 36378 41342 56520 26657 91576 100681 233195 138635 73382
740152 39718 198294 416534 04097 428583 162364 3789283 73382 3685519
minus minus
minus minus minus minus minus minus
00046 00019 00002 00006 00035 00004 00011 00008 00018 00019
00019 00364 00013 00037 00002 00004 00003 00001 00100 00007
00002 00013 00161 00024 00076 00035 00013 00041 00038 00033
00006 0
V
minus minus minus minus
minus minus minus minus
minus minus
=
0037 00024 00058 00051 00010 00016 00021 00028 00029
00035 00002 00076 00051 00217 00009 00048 00052 00024 00064
00004 00004 00035 00010 00009 00087 00018 00022 00027 00012
00011 00003 00013 000
minus
minus minus
minus minus minus
16 00048 00018 00113 00013 00055 00018
00008 00001 00041 00021 00052 00022 00013 00033 00003 00034
00018 00100 00038 00028 00024 00027 00055 00003 00850 00020
00019 00007 00033 00029 00064 00
minus
minus minus minus minus minus minus minus minus
012 00018 00034 00020 00068minus
Table 2 Average Returns and Weights for the Ten-
Stock Portfolios
Stock No Permno
Average Returns
Weights (SS
Allowed)IC Weights
(No SS 3 PLs)
1 10001 00064 03817 034062 10002 -00054 00311 004063 10025 00183 00908 005944 10026 00156 02525 026255 10032 00095 -01410 000006 10044 00012 00649 013797 10051 00206 01000 005008 10065 00018 01933 004929 10100 00270 00422 0056810 10104 00104 -00155 00031
Table 3 Constraints and Lagrangian Multipliers
Constraint Lagrangian Multiplier
Constraint Binding
Portfolio weights sum to one 00015 Yes
Portfolio expected return equals 1 00443 Yes
w1 ge 0 00000 No w2 ge 0 00000 No
w3 ge 0 00000 No
w4 ge 0 00000 No
w5 ge 0 00015 Yes
w6 ge 0 00000 No
w7 ge 0 00000 No
w8 ge 0 00000 No
w9 ge 0 00000 No
w10ge 0 00000 No
w7 le 005 00003 Yes
w1 + w3 le 04 00002 Yes
w2 + w4 ge 03 00000 No
James A Turner Optimal Portfolios and the R Programming Language
56 International Journal of the Academic Business World 57Fall 2015 (Volume 9 Issue 2)
The portfolio variances are
No short-sale constraints 0001607 Short-sale constraints and three position limits 0001856
APPENDIX 4 RESULTS FOR THE 50-STOCK PORTFOLIO
Results for the 50-stock portfolio with a monthly ex-pected return of 1 are shown in Table 4 below The first table shows the return averages of each stock and the cal-culated portfolio weights both for the portfolio with no short-sale constraints or position limits and the portfolio with short-sale constraints and three position limits (1) a requirement that the percentage invested in the seventh security not exceed 5 (2) a requirement that the total percentage invested in the first and the third securities not exceed 40 and (3) a requirement that the total percent-age invested in the second and fourth securities be at least 30
Table 5 shows the Lagrangian multipliers on the equal-ity constraints and the position limit constraints To save space for the 50-stock portfolio the Lagrangian multi-pliers on the short-sale constraints are not listed Simply checking Table 4 to see if the weight on a particular stock is zero gives an almost certain indication of which short-sale constraints are binding In this example both the constraint that there be no more than 5 invested in the seventh security and the constraint that there be no more than a total of 40 invested in the first and third securi-ties are not binding
Table 4 Average Returns and Weights for the
50-Stock PortfoliosStock
No Permno Average Returns
Weights SS Allowed
IC Weights No SS 3 PLs
1 10001 00064 01934 013072 10002 -00054 -00179 003673 10025 00183 -00189 000004 10026 00156 02873 026335 10032 00095 00503 000006 10044 00012 -00185 000007 10051 00206 -00136 002288 10065 00018 10920 000009 10100 00270 00306 00423
10 10104 00104 01467 0000011 10107 -00001 -02023 00000
Table 4 Average Returns and Weights for the
50-Stock PortfoliosStock
No Permno Average Returns
Weights SS Allowed
IC Weights No SS 3 PLs
12 10138 00085 -05619 0000013 10145 00065 -03910 0000014 10147 00088 -02693 0000015 10180 00290 -00290 0000016 10182 00076 01181 0000017 10200 00082 01409 0040918 10207 00020 -01551 0000019 10225 00098 00285 0000020 10232 00159 -00021 0000021 10239 00051 01624 0000022 10252 00084 00955 0000023 10253 00058 00121 0000024 10257 -00008 -00236 0000025 10258 00196 -00157 0000026 10259 -00300 -01339 0000027 10294 00179 -00414 0000028 10297 00061 01854 0146729 10299 00074 00826 0000030 10302 00165 00201 0000031 10308 00073 01255 0014132 10318 00194 -01389 0000033 10333 -00203 -00205 0000034 10355 00299 -00545 0036035 10363 -00151 -00167 0000036 10375 00010 -00495 0000037 10382 00046 00267 0000038 10395 -00022 00886 0042339 10397 00134 01296 0084940 10421 -00036 -01045 0000041 10443 00021 01389 0000042 10463 00013 00417 0000043 10501 00176 -00458 0000044 10507 -00228 -00397 0000045 10514 00100 00731 0007846 10516 -00034 -00148 0119247 10517 00208 00629 0000048 10530 00005 00032 0000049 10547 00418 00032 0012550 10550 -00028 00397 00000
The portfolio variances are
No short-sale constraints 000002997 Short-sale constraints and three position limits 000111119
Table 5 Constraints and Lagrangian Multipliers
Constraint Lagrangian Multiplier Constraint Binding
Portfolio weights sum to one 0000503 YesPortfolio expected return equals 1 0031954 Yes
w7 le 005 0000000 Now1 + w3 le 04 0000000 Now2 + w4 ge 03 0000963 Yes
James A Turner
58 Fall 2015 (Volume 9 Issue 2)
This page intentionally blank
JOINT CONFERENCE May 25th 26th and 27th 2016 in
Nashville TN
Academic Business World International Conference
(ABWICorg)
The aim of Academic Business World is to promote inclusiveness in research by offering a forum for the discussion of research in early stages as well as re-search that may differ from lsquotraditionalrsquo paradigms We wish our conferences to have a reputation for providing a peer-reviewed venue that is open to the full range of researchers in business as well as reference disciplines within the social sciences
Business Disciplines
We encourage the submission of manuscripts presentation outlines and ab-stracts pertaining to any business or related discipline topic We believe that all disciplines are interrelated and that looking at our disciplines and how they relate to each other is preferable to focusing only on our individual lsquosilos of knowledgersquo The ideal presentation would cross discipline borders so as to be more relevant than a topic only of interest to a small subset of a single disci-pline Of course single domain topics are needed as well
International Conference on Learning and Administration in
Higher Education (ICLAHEorg)
All too often learning takes a back seat to discipline related research The In-ternational Conference on Learning and Administration in Higher Educa-tion seeks to focus exclusively on all aspects of learning and administration in higher education We wish to bring together a wide variety of individuals from all countries and all disciplines for the purpose of exchanging experi-ences ideas and research findings in the processes involved in learning and administration in the academic environment of higher education
We encourage the submission of manuscripts presentation outlines and ab-stracts in either of the following areas
Learning
We encourage the submission of manuscripts pertaining to pedagogical top-ics We believe that much of the learning process is not discipline specific and that we can all benefit from looking at research and practices outside our own discipline The ideal submission would take a general focus on learning rather than a discipline-specific perspective For example instead of focusing on ldquoMotivating Students in Group Projects in Marketing Managementrdquo you might broaden the perspective to ldquoMotivating Students in Group Projects in Upper Division Coursesrdquo or simply ldquoMotivating Students in Group Projectsrdquo The objective here is to share your work with the larger audience
Academic Administration
We encourage the submission of manuscripts pertaining to the administra-tion of academic units in colleges and universities We believe that many of the challenges facing academic departments are not discipline specific and that learning how different departments address these challenges will be ben-eficial The ideal paper would provide information that many administrators would find useful regardless of their own disciplines
- Testing Major Factors for Reducing Obstacles to Product Innovation Success
-
- Dr Tor Guimaraes
- Dr Marcelo Seido Nagano
- Dr Curtis Armstrong
-
- Acceptance of Change Exploring the Relationship among Psychometric Constructs and Employee Resistance
-
- Brian Dunican EdD
- Ric Keaster PhD
-
- The Origin and Construct of Cloud Computing
-
- Nozar Daylami PhD
-
- Optimal Portfolios and the R Programming Language
-
- James A Turner
-
Brian Dunican amp Ric Keaster Acceptance of Change Exploring the Relationship among Psychometric Constructs and Employee Resistance
30 International Journal of the Academic Business World 31Fall 2015 (Volume 9 Issue 2)
the camouflage of untimely surprises past resentment ad-ditional job duties or the exposure of personal vulnera-bilities In isolated cases changes within the organization may cause a true threat to safety quality cost or the com-panyrsquos reputation Ignoring the symptoms of resistance within the change process could have disastrous results Judson (1991) agreed that resistance to change is not the fundamental problem but a symptom hiding basic under-lying circumstances He also developed a continuum of reactions to change ranging from indifference (no resis-tance) to active even aggressive resistance
Research has validated the importance of evaluating the reactions and the attitudes of individuals toward organi-zational change and their desire to succeed (Judge et al 1999 Oreg 2006) Developed and validated by Oreg (2003) the Resistance to Change scale has been widely used and accepted by academic works to measure an indi-vidualrsquos disposition toward resistance to change Further-more Oreg outlined four subscales as an exploratory anal-ysis to categorize an individualrsquos reaction to resist change (a) routine seeking (b) emotional reaction to impose change (c) cognitive rigidity and (d) short-term focus Supportive research (cited in Oreg 2003) has found the factors of openness to change tolerance of ambiguity and risk aversion as predictors for managers coping with the stress of change within their organizations An exhaustive amount of research has been conducted on the broad topic of resistance to change yet little is known on the relation-ship of how the psychological constructs of mindfulness and tolerance of ambiguity influence resistance to change within organizations Early researchers such as Coch and French (1948) viewed resistance to change as an obstacle of contention during the process of changes within organiza-tions One of their studies conducted in a sewing factory revealed that employees retaliated against change through acts of aggression controlling restrictions of throughput high turnover rates increased complaints and reports of dissatisfaction with management In line with earlier studies the use of the term resistance to change gained popularity beginning in the 1950s following Lewinrsquos (1947 1951) works related to field theory and social sci-ences Resistance to change is commonly accredited to the unfreezing stage of Lewinrsquos (1951) change model (Ar-menakis amp Bedeian 1999) Naturally portrayed as a nega-tive barrier to change resistance to change is frequently defined using Lewinrsquos physical science-related terminol-ogy as a restraining force to maintain the current state of equilibrium (Dent amp Goldberg 1999) Since that time resistance to change has been widely acknowledged and associated with the process of change organizational de-velopment and change theories and models Other schol-ars have conceptualized resistance to change as an emo-tional reaction rather than a behavioral response As an
example Argyris and Schon (1978) suggested resistance in terms of defensive routines and frustration during the process of change Kanter (1985) supported this notion describing feelings of uncertainty and loss of control for individuals facing change In other terms of defining re-sistance Lawrence (1954) used an analogy to compare re-sistance to change as pain within the human body that is used as a signal to communicate that something is wrong ldquoThe resistance like the pain does not tell what is wrong but only that something is wrong And it makes no more sense to try to overcome such resistance than it does to take a pain killer without diagnosing the bodily ailmentrdquo (p 56) This analogy highlighted the parallels between re-sistance and overcoming it through a practicable solution
Mindfulness
Mindfulness is a concept in educational psychology that has been primarily defined by Dr Ellen Langer a so-cial psychology professor at Harvard University Langer (1993) defined mindfulness as ldquoan open creative proba-bilistic state of mind in which the individual might be led to finding differences among things thought similar and similarities among things thought differentrdquo (p 44) Langer (1997) further explained three characteristics of mindfulness ldquo(a) continuous creation of new categories (b) openness to new information and (c) having an im-plicit awareness of more than one perspectiverdquo (p 4) The Mindfulness Scale validated by Pirson et al (2012) oper-ationalizes the construct and identifies the four subscales of novelty-seeking engagement novelty-producing and flexibility to explain the broad psychometric construct Brown and Ryan (2003) defined mindfulness as ldquoa quali-ty of consciousness that is characterized by clarity and viv-idness of current experience and thus stands in contrast to the mindlessrdquo (p 823) Different from Langerrsquos definition that evaluates dispositional differences in reflective con-sciousness behavioral routines over time Ryan and Brown focused on the presence or absence of attention to and the awareness of events occurring in the present moment For the purpose of the current study the ideas of mindfulness were presented through the literature of Langer Further-more mindfulness is believed to play an important role in disengaging individuals from automatic thoughts habits and unhealthy behavior patterns and may contribute to well-being and happiness in a direct way (Brown amp Ryan 2003)
Tolerance of Ambiguity
Tolerance of ambiguity describes an individualrsquos behavior in unclear or insecure situations and how one reacts to the lack of clarity or uncertainty (Banning 2003) Devel-oped by Frenkel-Brunswik (1948) tolerance of ambigu-
ity has gained attention from researchers over the past 60 years Frenkel-Brunswik was one of the first to present a comprehensive analysis of ambiguity and was influenced by earlier works of Germany psychologist Erich Jaensch Frenkel-Brunswik described tolerance of ambiguity as an ldquoemotional and perceptual personality variablerdquo (cited in Furnham amp Ribchester 1995 p 180)
Budner (1962) later defined tolerance for ambiguity as ldquothe tendency to perceive ambiguous situations as desir-ablerdquo and intolerance for ambiguity as ldquothe tendency to perceive ambiguous situations as sources of threatrdquo (p 29) Budner developed the Tolerance of Ambiguity Scale to further interpret the complex concept of ambiguity and individualsrsquo responses to it Through the development of the Tolerance of Ambiguity Scale three subscales (ie novelty complexity insolubility) emerged to provide in-sight into the more abstract larger construct A decade later Norton (1975) defined tolerance of ambiguity as the degree to which an individual is cognitively willing to tolerate uncertainty vagueness or nebulous information and is able to act upon the knowledge
Employees resist change at all levels of the organization Although some individuals openly accept change many do not Determining the varying degrees of each psycho-metric construct on resistance along with their combi-nation toward resistance to change may reveal common areas of opportunity related to organizational change The following general research question is offered How are the psychometric constructs of mindfulness and toler-ance for ambiguity related to resistance to change within organizations
Empirical Studies and Questions
Numerous studies have alluded to resistance to change some have focused on the individuals (eg Bovey amp Hede 2001 Coghlan 1993 Ford Ford amp McNamara 2002) while others have explored organizations (eg Arm-bruster Bikfalvi Kinkel amp Lay 2008 Coch amp French 1948 Greenwood amp Hinings 1996 Lawrence 1954 Stanley Meyer amp Topolnytsky 2005) Van Dam Oreg and Schyns (2008) stated ldquoA review of the past empirical research reveals that resistance to change has been concep-tualized in three ways as a cognitive state as an emotion as a behavioral intentionrdquo (p 316) As an emotion some studies have revealed that employees who display nega-tive perceptions toward organizational change may have an overall negative outlook on change thus perpetuat-ing resistance (Armenakis Harris amp Mossholder 1993 Stanley et al 2005) Extreme measures of resistance to organizational change have been displayed in other stud-ies through sabotage slowdowns and strikes (Armenakis et al 1993) Universally resistance to change has been
recognized to have a significant impact on the outcomes of organizational change yet individuals within the or-ganization are perceived to be the major blockage or im-pediment (Mabin et al 2001) Based on the literature concerning the analysis of change empirical studies have identified a wide range of factorsmdashnamely organization-al managerial behavioral and individualmdashthat promote or impede resistance in organizations
Organizations are faced with the challenges of changing and responding to current and future trends at an un-precedented rate in todayrsquos global environment (Burke 2014) Twenty-five years ago Offermann and Gowing (1990) found that American organizations alone had spent over a record 210 billion dollars to prepare leaders to thrive in organizational change In addition to money an immeasurable amount of time and energy have been dedicated to nurturing leadership and key individuals to navigate others through this complex but important pro-cess Nonetheless the blueprint is far from perfect The readiness of individuals within the organization to plan and implement proactive measures may determine the or-ganizationrsquos competitiveness The current study examines the factors of mindfulness and tolerance of ambiguity and how they relate to individualsrsquo perceptions of resistance to change The specific research questions are the following
1 How do demographic factors of the respondents and the organizational factors under which they work relate to the psychometric scales of Mind-fulness and Tolerance of Ambiguity and their influence on Resistance to Change
2 After controlling for demographic factors how does psychometric mindset (Sub-constructs of Mindfulness and Tolerance of Ambiguity) influence individual Resistance to Change (a) Routine seeking (b) Emotional reaction (c) Short-term focus (d) Cognitive rigidity
3 What is the degree of relationship among these measures of Mindfulness and Tolerance of Am-biguity
4 The following model characterizes the current study
Highlights of the Methodology
When considering the measurement of the perceptions of resistance to change within organizations various meth-ods have been utilized to illustrate relationships among different constructs (Oreg 2003 Oreg Vakola amp Ar-menakis 2011) In the current quantitative non-exper-
Brian Dunican amp Ric Keaster Acceptance of Change Exploring the Relationship among Psychometric Constructs and Employee Resistance
32 International Journal of the Academic Business World 33Fall 2015 (Volume 9 Issue 2)
imental study data were collected from three validated instruments ndash Langerrsquos (Bodner amp Langer 2001) Langer Mindfulness Scale (LMS) Budnerrsquos (1962) Tolerance of Ambiguity Scale (TOA) and Oregrsquos (2003) Resistance to Change (RTC) scale Regression models were used to assess the univariate relationships among the constructs Additionally descriptive statistics were used to include the mean median mode standard deviation and other selected variables A multiple linear regression analysis determined the relationship between factors of mindful-ness and tolerance of ambiguity and their influence of resistance to change Bivariate correlations were used to compute the psychometric scores from each instrument and resistance to change ratings to test the significance of the relationships between each subscale Overall statisti-cal analyses were conducted in multiple phases to investi-
gate the relationship between the individual psychomet-ric traits and resistance for salary exempt and non-exempt employees in industrial sites located in Kentucky
Participants in the Study
The population represented a microcosm of several indus-tries in the manufacturing sector within the proximity of Warren County The data collected were based on a con-venient sample A total of 65 participants volunteered to complete an electronic survey that was designed to capture complete responses to a total of 48 questions Participants were not allowed to proceed to the next page of the survey unless all questions on the current page were completed Three participants did not complete the survey and their responses were not included in the end results From the
population of 183 salaried (exempt and nonexempt) em-ployees 65 surveys were officially returned constituting a response rate of 36 Managerial-type jobs dominated 36 of the sample population followed by roles in tech-nical support which reflected 169 Six categories of job types and an ldquoOtherrdquo category were used for the respon-dents
Scoring Method for Each Scale
Resistance to Change Scale
Oregrsquos (2003) Resistance to Change Scale is comprised of 17 items with four subscales ndash routine seeking emo-tional reaction short-term focus and cognitive rigidity Each subscale relates to the extent to which individuals seek routines react to emotions during change encom-pass short-term focus during change and the frequency to which individuals change their minds The overall range of the scale including the subscales is scored between 1 and 6 with 1 representing the least level of resistance In-dividuals scoring higher on the overall scale or subscales indicate a higher resistance to change
Langer Mindfulness Scale
The Langer Mindfulness Scale (Pirson et al 2012) con-tains 14 items and is composed of three subscales ndash novelty seeking engagement and novelty producing The 7-point scale is scored such that higher scores indicate a greater level of awareness toward thinking High scores for novel-ty producing insinuate one would perceive new situations as opportunities to learn new information Individuals with high scores for engagement are more susceptible to noticing details within their environment as opposed to others Higher novelty producing scores indicate that individuals are likely more creative and predisposed to generating new ideas when faced with new information
Tolerance of Ambiguity Scale
Budnerrsquos (1962) Tolerance of Ambiguity Scale is a 16-item scale with ratings ranging from 1 to 7 1 represents strong disagreement indicating a greater tolerance for ambiguity It is important to note that higher scores relate to greater intolerances for ambiguity All results were re-ported at the aggregate level
RESULTS
Statistical data analyses were performed on survey data comprised of the following three instruments Langer Mindfulness Scale (LMS14) Tolerance of Ambigu-
ity Scale (TOA) and Resistance to Change (RTC) scale Findings were reported from the analyses of data col-lected from 65 participants responding to the Qualtrics Web-based survey In particular analyses were conducted through bi-variant correlation analyses (also known as Pearsonrsquos r) independent t-tests and Cronbachrsquos alpha The strengths of the relationships were predicated on Co-henrsquos (1988) interpretation Coefficient values between 10 and 29 were considered small or weak those between 30 and 49 were considered moderate and those between 50 and 10 were considered large or strong
Analysis of Each Research Question
The first research question explored the relationship of de-mographic and organizational factors to the psychomet-ric scales of Mindfulness and Tolerance of Ambiguity and their influence on Resistance to Change Descriptive sta-tistics reflected both demographic and organizational fac-tors ndash gender education years at the company and direct reportsmdashfor the 65 employees who participated in the current study The distributions of variables were distrib-uted evenly between only two variables years at the com-pany and direct reports Other demographic variables including ethnicity and age were recorded A statistical analysis was not conducted due to the uneven distribution of the variables Of the 65 participants 59 were Caucasian and the remaining 6 were minorities The ages of the par-ticipants ranged from 28 years to 65 years Additionally frequency distributions and data analyses were not con-ducted for individual sites to protect anonymity All re-sults were reported at the aggregate level and included the following categories for the participating industries Cup Manufacturing Personal Care Manufacturing Con-struction and Rubber to Metal Bonding Manufacturing
Gender Male and Female
Although more than twice as many males than females participated in the current study independent t-tests were conducted to determine whether differences existed be-tween the mean scores of the scales and subscales for male and female employees No statistically significant differ-ences were found between the outcome of the psychomet-ric constructs (Mindfulness and Tolerance of Ambiguity) and Resistance to Change except on one subscale Cogni-tive rigidity revealed a statistical difference between the scores of males (n = 45 M = 381 SD = 063) and females (n = 20 M = 336 SD = 086) t (63) = 234 p = 05 α = 05
Figure 1 Logic model for hypothesized relationships among
Psychometric Constructs Demographic Controls and Degree of Resistance to Change
INDEPENDENT VARIABLES
Degree of Resistance
Demographic Factors
-----
Age Gender
Ethnicity Education
____________
Organizational Factors
----- Years at Current Company Type of Current Position
Type of Industry or Category Number of Direct Reports
Resistance to Change -----
Routine Seeking Emotional Reaction Short-term Focus
Cognitive Rigidity
Tolerance of Ambiguity
----- Novelty
Complexity Insolubility
Mindfulness -----
Novelty Seeking Engagement
Novelty Producing
Brian Dunican amp Ric Keaster Acceptance of Change Exploring the Relationship among Psychometric Constructs and Employee Resistance
34 International Journal of the Academic Business World 35Fall 2015 (Volume 9 Issue 2)
Education
Due to the imbalanced distributions of participants sta-tistical analysis for Education was not performed The frequency distribution reflected that 5231 (34) of the participants possessed a four-year degree 1231 (8) ob-tained a masterrsquos degree or higher 2615 (17) possessed a two-year degree or some college while the reaming 923 (6) were high school graduates
Direct Reports and No Direct Reports
An individual variances t-test was conducted and failed to reveal a statistically reliable difference between the mean scores of salaried employees without direct reports and salaried employees with direct reports As an example scores from routine seeking a subscale of resistance to change were not significantly different between employ-ees without direct reports (n = 32 M = 312 SD = 096) and employees with direct reports (n = 33 M = 291 SD = 085) t (65) = 093 p = 037
Years at the Company
A one-way analysis of variance (ANOVA) was calculated on participantsrsquo ratings of the psychometric constructs and resistance to change as a comparison to the number of years at the company Comparisons indicated no sta-tistically significant differences were presented between groups of 0 to 4 years 5 to 10 years 11 to 20 years and 21 years and greater As an example on novelty-seeking a subscale of the Langer Mindfulness Scale the analysis was not significant between the four groups F(3 61) = 31 p = 82
The second research question used bivariate correlations to determine the strength of the relationships between the psychometric constructs (Mindfulness and Tolerance of Ambiguity) and Resistance to Change including the four subscales All of the Pearson correlations were significant across each of the findings with the exception of the LMS scale and Cognitive Rigidity of Resistance to Change subscale r(65) = -225 p = 072 The overall LMS scales reflected a strong negative relationship r(65) = -530 p lt 001 with the RTC scale The TOA scale revealed a mod-
Table 1 Descriptive Statistics and Correlations among Responses of Tolerance of
Ambiguity Scale Langer Mindfulness Scale and Subscales and Resistance to Change and Subscales
Scales LMS_NS LMS_NP LMS_E TOA_ Tot RTC_RS RTC_ER RTC_STF RTC_CR
LMS_NS (77)
LMS_NP 76 (72)
LMS_E 49 51 (69)
TOA_Tot -48 -53 -32 (72)
RTC_RS -51 -50 -41 65 (85)
RTC_ER -36 -37 -36 41 71 (88)
RTC_STF -53 -47 -38 60 77 80 (90)
RTC_CR -28 -26 -04 44 51 45 41 (86)
of Items 5 5 4 16 5 4 4 4
Mean 598 504 556 376 342 285 367 322
SD 071 94 102 71 110 104 73 81Note N = 65 Cronbachrsquos alpha reliabilities for each dimensionconstruct are listed in parentheses on diagonal Cronbachrsquos Alpha measures indicated a high internal consistency among the items reflected in each scale p lt 05 level (two-tailed) p lt 01 level (two-tailed)
Table 2 Descriptive Statistics and Correlations among Responses of the Total Tolerance of
Ambiguity Scale Langer Mindfulness Scale and Resistance to ChangeLMS_Tot Mean TOA_Tot Mean RTC_Tot Mean
LMS_MeanTotal (86)
TOA_Meantotal -53 (72)
RTC_Meantotal -53 62 (93)Number of items 14 16 17Mean 552 376 301Standard Deviation 75 71 91Note N = 65 Cronbachrsquos alpha reliabilities for each dimensionconstruct are listed in parentheses on diagonal No subscales for Tolerance of Ambiguity were referenced in research Cronbachrsquos Alpha measures indicated a high internal consistency among the items reflected in each scale p lt 05 level (two-tailed) p lt 01 level (two-tailed)
Table 3 Descriptive Statistics and Correlations among Responses Related to Operational and
Demographic Factors Tolerance of Ambiguity Scale Langer Mindfulness Scale and Sub-scales and Resistance to Change and Subscales
ME
AN
SD AG
E
YR
SWR
K
DR
RPT
S
TO
A_M
LMS_
M
LMS_
NS
LMS_
NP
LMS_
E
RT
C_M
RT
C_R
S
RT
C_E
R
RT
C_S
TF
RT
C_C
R
AGE 4571 782 100YRSWRK 1283 943 52 100DRRPTS 1005 2162 -18 01 100TOA_M 376 71 15 11 -02 100LMS_M 552 75 -07 -07 10 -53 100LMS_NS 598 71 -12 -12 04 -48 87 100LMS_NP 504 94 -05 01 18 -53 90 76 100LMS_E 556 102 -01 -10 01 -32 78 49 51 100RTC_M 322 81 -14 -10 -08 62 -53 -51 -48 -37 100RTC_RS 301 91 -13 -07 -04 65 -55 -51 -50 -41 90 100RTC_ER 342 110 -23 -17 -07 41 -43 -36 -37 -36 90 71 100RTC_STF 285 104 -05 00 -06 60 -54 -53 -47 -38 91 77 80 100RTC_CR 367 73 -07 -08 -14 44 -23 -28 -26 -04 65 51 45 41 100
Note N = 65 The correlation coefficient ranges from -1 to +1 with -1 indicating a perfect negative correlation +1 indicating a perfect positive correlation and 0 indicating no correlation
Brian Dunican amp Ric Keaster Acceptance of Change Exploring the Relationship among Psychometric Constructs and Employee Resistance
36 International Journal of the Academic Business World 37Fall 2015 (Volume 9 Issue 2)
erate positive correlation r(65) = 624 p lt001 Further bivariate analyses for LMS explored the strength of the re-lationships between the subscales of the Langer Mindful-ness Scale and the subscales of the Resistance to Change scales The correlational analysis was statistically signifi-cant between all variables except Engagement of the LMS and Cognitive Rigidity of RTC r(63) = -35 p = 781 concluding that the variables were unrelated
The last research question explored the degree of the re-lationship between Mindfulness and Tolerance of Am-biguity Bivariate analyses were used to correlate the re-lationship between the two psychometric constructs The correlations revealed a significantly strong negative rela-tionship between the total mean score of the LMS and the total mean score of the TOA r(63) = -53 p lt 01 The mean scores for each of the LMS subscales compared to the total mean of the TOA showed the following Nov-elty-seeking and TOA r(63) = -48 p lt 01 Novelty-pro-ducing and TOA r(63) = -53 p lt 01 and Engagement and TOA r(63) = -32 p lt 01 It is important to note that higher scores on the Tolerance of Ambiguity scale indicate a greater intolerance of ambiguity Tables 1 and 2 display a descriptive analysis and correlations for each of the scales and subscales The correlations between vari-ables are presented in Table 3
LIMITATIONS OF THE STUDY
Research inherently contains limitations The current study is no exception First the nature of measuring psy-chometrics is subjective Since psychometrics studies mea-sure the way in which individuals think and act (Norton 1975) influences of the organizationrsquos environment could affect individualsrsquo responses to questions Additionally external variables at the time of data collection not related to the study itself can skew the responses and influence the outcomes Other views of limitation rest on the gen-eralizability of the results which may be limited for the following reasons (a) the unit of analysis is at the indi-vidual level (b) data were collected from a limited num-ber of operations within the state of Kentucky through convenience sampling and (c) individual biases that may be introduced at the time of testing
The unit of analysis for data collection rests at the indi-vidual level rather than the group level due to the acces-sibility of the employees Although the survey collection method allows for comparison with larger groups it lim-its the opportunity to explore issues in depth therefore assumptions are made for individuals in similar groups Next the data collected represents limited industries in the state of Kentucky restricting the number of partici-pants and the ability to generalize outcomes to other in-dustries different than those outlined in the current study
Last respondentsrsquo values interests and beliefs regarding the online self-administered surveys may introduce biases unknown by the researcher As a consequence of these limitations and the collection of data during one point in time the results are generalizable only to the groups or populations that are similar to those in the current study
SUMMARY AND CONCLUSION
Change within organizations is inevitable That real-ity will remain constant in organizationsmdashand in onersquos personal and professional life (Conner 1992) The way in which one chooses to cope with change could be a decid-ing factor of success failure or choosing to remain the samemdashwhich in organizations tends to equate with fail-ure particularly if change means simply improving Resis-tance is a natural reaction to change and is part of the hu-man psyche Research and literature support this notion of human nature to resist change and elements related to the process of change (Coch amp French 1948 Conner 1992 Oreg 2003 OrsquoToole 1995 Zander 1950) It is possible that a greater understanding of mindfulness and tolerance of ambiguity could increase the possibilities of new ideas to drive lower resistance to change The current study explored the two psychometric constructs of mind-fulness and tolerance of ambiguity and their relationship to resistance to change within industrial settings Bivari-ate correlations yielded both strong positive and negative correlations among the three scales assessed by salaried employees located across different industries The Langer Mindfulness Scale Budnerrsquos Tolerance of Ambiguity Scale and Oregrsquos Resistance to Change scale were attrib-uted to the foundation of the current study The results contributed to the practical and theoretical significance of individualsrsquo responses to change through the measure-ment of the aforementioned constructs To the extent the findings in the current research could be extrapolated to other industries or organizations a final suggestion should be noted When considering future directions for research related to probing psychometric constructs and resistance to change the current study may have relevance across different nationalities and cultures The elements of change will continue to challenge the fabric of organiza-tions while the internal and external pressures of rising costs variations in supply and demand relentless compe-tition and developing technology test the resolve for sur-vival The readiness of individuals within organizations and their ability to challenge perceptions of change and resistance may determine their competitiveness and ulti-mately their success
REFERENCES
Argyris C amp Schon D (1978) Organizational learning A theory of action research Reading MA Addison-Wesley
Armbruster H Bikfalvi A Kinkel S amp Lay G (2008) Organizational innovation The challenge of measur-ing non-technical innovation in large-scale surveys Technovation 28(10) 644-657
Armenakis A A amp Bedeian A G (1999) Organiza-tional change A review of theory and research in the 1990s Journal of Management 25 293-315
Armenakis A A Harris S G amp Mossholder K W (1993) Creating readiness for organizational-change Human Relations 46(6) 681-703
Banning K C (2003) The effect of the case method on tolerance for ambiguity Journal of Management Edu-cation 27 556-567
Bodner T E amp Langer E J (2001 June) Individual differences in mindfulness The MindfulnessMind-lessness Scale Poster presented at the 13th annual American Psychological Society Conference Toronto Ontario Canada
Bovey W H amp Hede A (2001) Resistance to organisa-tional change The role of defence mechanisms Journal of Managerial Psychology 16(7) 534-548
Brown K W amp Ryan R M (2003) The benefits of be-ing present Mindfulness and its role in psychological well-being Journal of Personality and Social Psychol-ogy 84 822-848 doi1010370022-3514844822
Brown K W amp Ryan R M (2004) Perils and promise in defining and measuring mindfulness Observations from experience Clinical Psychology Science and Practice 11(3) 242-248 doi101093clipsybph078
Budner S (1962) Intolerance of ambiguity as a personal-ity variable Journal of Personality 30 29-59
Burke W W (2014) Organizational change theory and practice Thousand Oaks CA Sage Publications Inc
Carson S H amp Langer E J (2006) Mindfulness and self-acceptance Journal of Rational-emotive and Cog-nitive-behavior Therapy 24(1) 29-43
Coch L amp French J (1948) Overcoming resistance to change Human Relations 1 512-532
Coghlan D (1993) A person-centred approach to deal-ing with resistance to change Leadership amp Organi-zation Development Journal 14(4) 10-14
Cohen J (1988) Statistical power analysis for the behav-ioral sciences Hillsdale NJ Lawrence Erlbaum Associates
Conner D R (1992) Managing at the speed of change How resilient managers succeed and prosper where others fail New York Random House
Demers C (2007) Organizational change theories Thousand Oaks CA Sage Publications Inc
Dent E B amp Goldberg S G (1999) Resistance to change A limiting perspective Journal of
Ehrlich S B Meindl J R amp Viellieu B (1990) The charismatic appeal of a transformational leader An empirical case study of a small high-technology con-tractor The Leadership Quarterly 1(4) 229-247
Ford J D Ford L W amp McNamara R T (2002) Re-sistance and the background conversations of change Journal of Organizational Change Management 15(2) 105-121
Frenkel-Brunswik E (1948) Tolerance toward ambigu-ity as a personality variable American Psychologist 3 268-269
Furnham A amp Ribchester T (1995) Tolerance of am-biguity A review of the concept its measurement and applications Current Psychology 14 179-199
Gaumlrtner C (2013) Enhancing readiness for change by enhancing mindfulness Journal of Change Manage-ment 13 52-68
Geller E S (2002) Leadership to overcome resistance to change It takes more than consequence control Jour-nal of Organizational Behavior Management 22(3) 29-49
Gondo M Patterson K W amp Palacios S (2013) Mind-fulness and the development of a readiness for change Journal of Change Management 13(1) 36-51
Greenwood R amp Hinings C R (1996) Understanding radical organizational change Bringing together the old and the new institutionalism Academy of Manage-ment Review 21 1022-1054
Isabella L (1990) Evolving interpretations as a change unfolds How managers construe key organization-al events Academy of Management Journal 33 7-41
Iverson R D (1996) Employee acceptance of organiza-tional change The role of organizational commitment International Journal of Human Resource Manage-ment 7 122-149
Jacobs P (2005) Five steps to thriving in times of un-certainty Harvard Management Update 10(12) 3-5
Brian Dunican amp Ric Keaster
38 Fall 2015 (Volume 9 Issue 2)
Retrieved from httphbrorgproductfive-steps-to-thriving-in-times-of-uncertaintyanU0512A-PDF-ENG
Judge T A Thoresen C J Pucik V amp Welbourne T M (1999) Managerial coping with organization-al change A dispositional perspective Journal of Ap-plied Psychology 84 107-122
Judson A (1991) Changing behavior in organizations Minimizing resistance to change Cambridge MA Basil Blackwell
Kanter R M (1985) Supporting innovation and ven-ture development in established companies Journal of Business Venturing 1 47-60
Kets de Vries M F R Ramo L amp Korotov K (2009) Organizational culture leadership change and stress INSEAD Working Papers Collection 10 2-26 Re-trieved from httpwwwinseadedufacultyresearchresearchdoccfmdid=41924
Kotter J P (1995) Leading change Why transformation efforts fail Harvard Business Review 73(2) 59-67
Lane M S amp Klenke K (2004) The ambiguity toler-ance interface A modified social cognitive model for leading under uncertainty Journal of Leadership amp Organizational Studies 10(3) 69-81
Langer E J (1993) A mindful education Educational Psychologist 28 43-50
Langer E J (1997) The power of mindful learning Read-ing MA Addison-Wesley
Lawrence P R (1954) How to deal with resistance to change Harvard Business Review 32(3) 49-57 Retrieved from httpedsaebscohostcomlib-srvwkueduehostpdfviewerpdfviewervid=6ampsid =699bab3d-bcec-40d9-ac69-a42c853d72bc40sessionmgr4004amphid=4108
Lewin K (1947) Frontiers in group dynamics II Chan-nels of group life social planning and action research Human Relations 1(2) 143-153
Lewin K (1951) Field theory in social science Selected theoretical papers New York Harper amp Row
Limerick D Passfield R amp Cunnington B (1994) Transformational change Towards an action learning organization The Learning Organization 1(2) 29-40
Mabin V J Forgeson S amp Green L (2001) Harness-ing resistance Using the theory of constraints to assist change management Journal of European Industrial Training 25(234) 168-191
Maurer R (2009) Introduction to change without mi-graines Omaha NE Maurer and Associates Re-trieved from httpextensionmissouriedustaffsde-teams DocumentsChangeW-outMigrarainespdf
Norton R W (1975) Measurement of ambiguity toler-ance Journal of Personality Assessment 39 607-619
Offermann L R amp Gowing M K (1990) Organiza-tions of the future Changes and challenges Ameri-can Psychologist 45(2) 95-108 doi10370003-066X45295
Oreg S (2003) Resistance to change Developing an in-dividual differences measure Journal of Applied Psy-chology 88 680-693
Oreg S (2006) Personality context and resistance to organizational change European Journal of Work and Organizational Psychology 15 73-101
Oreg S Vakola M amp Armenakis A (2011) Change re-cipientsrsquo reactions to organizational change A 60-year review of quantitative studies The Journal of Applied Behavioral Science 47 461-524
OrsquoToole J (1995) Leading change The argument for val-ues-based leadership Boston MA Ballentine Books
Pirson M Langer E J Bodner T amp Zilcha-Mano S (2012) The development and validation of the Langer Mindfulness Scale-Enabling a socio-cognitive perspec-tive of mindfulness in organizational contexts Ford-ham University School of Business Research Paper Re-trieved from httpdxdoiorg102139ssrn2158921
Stanley D J Meyer J P amp Topolnytsky L (2005) Employee cynicism and resistance to organizational change Journal of Business and Psychology 19(4) 429-459
Topping P (2002) Managerial leadership New York McGraw Hill Professional
Van Dam K Oreg S amp Schyns B (2008) Daily work contexts and resistance to organisational change The role of leader-member exchange development climate and change process characteristics Applied Psycholo-gy An International Review 57 313-334 doi101111j1464-0597200700311x
Weinstein N Brown K W amp Ryan R M (2009) A multi-method examination of the effects of mindful-ness on stress attribution coping and emotional well-being Journal of Research in Personality 43 374-385
Zander A F (1950) Resistance to change Its analysis and prevention Advanced Management 4(5) 9-11
International Journal of the Academic Business World 39
INTRODUCTION
Cloud computing is one of the most talked about infor-mation technology topics these days 7 24 Early literature review reveals an endemic confusion of what cloud com-puting is does and what it stands for We posit that the cloud metaphor 3 20 fosters a confusion that persists even today
The goal of this research paper is to look back and make historical sense of cloud computing We try to find the lineage of cloud computing where the phrase cloud com-puting came from who came up with the term and how it found currency in the IT community We trace cloud computing to early timesharing and Application Service Provider (ASP) in the last decade and posit a future of utility computing
Additionally we try to shed light on the current state of cloud computing provide a comprehensive definition of the term and its main building blocks
CLOUD COMPUTING IN THE ACADEMIC LITERATURE
A metaphor
In an article by Ian Foster and Steven Tuecke 3 the authors start by describing the well-known elephant fable where a group of blind people are asked to describe an elephant and not surprisingly each provides a different view
The cloud is a metaphor for the Internet Itrsquos a rebranding of the Internet that is why there is a raging debate By vir-tue of a metaphor itrsquos open to different interpretations 20
Confusion and Frustration
The word ldquocloudrdquo in cloud computing informs very little and it may even misinform ldquoI hated it but I finally gave inrdquo says Carl Bass President and CEO of Autodesk He adds ldquoI didnrsquot think the term helped explain anything to people who didnrsquot already know what it isrdquo20
Giving the lsquocloudrsquo name to the old concept of large shared distributed systems is misleading 4 p 26
Larry Ellison Oraclersquos CEO ldquoThe interesting thing about cloud computing is that wersquove redefined cloud computing everything that we already dohellipI donrsquot understand what we would do differently in light of cloud computing other than change the wording of some of our adsrdquo 1 p 50
In an article in Harvard Business Review (HBR) 22 the author asks a rhetorical question ldquoWhat the heck does it mean to have a lsquocloudrsquo It means that the functions you want like storage communications and applications donrsquot need to live on the device you have in front of you You can get them on demand from the networkrdquo We should ask the question ldquoin a typical non-cloud IS en-vironment do we really have the stated functions on the device in front of usrdquo
Cloud Computing is often confused with Utility Com-puting but they are not the samemdashrather the latter forms part of the former 2
No Definition
Realizing the elephantine nature of cloud computing there is a reluctance to define it Question How would you define cloud computing Answer Cloud computing
The Origin and Construct of Cloud Computing
Nozar Daylami PhD Adjunct Professor
School of Management Information System and Technology Program
California Lutheran University Thousand Oaks CA 91360
ABSTRACTCloud computing is one of the most talked about information technology topics these days A literature review reveals an endemic confusion of what cloud computing stands for This paper tries to shed light on why the term is so confusing We try to find where the phrase cloud computing came from and how it found currency in the IT community We trace cloud computing to early timesharing and Application Service Provider (ASP) in the last decade and posit a future of utility computing This paper also provides a comprehensive definition of the term and its main building blocks
Nozar Daylami The Origin and Construct of Cloud Computing
40 International Journal of the Academic Business World 41Fall 2015 (Volume 9 Issue 2)
is not so much a definition of a single term as it is a trend in service delivery taking place today 3 p 52
An Old Concept
Cloud computing is an old concept it ldquois a throwback to the mainframe model of computingrdquo 19 p 78 Clearly cloud computing is simply remote computing 4 p 26
Internet or Network Computing
Cloud computing as a term for Internet-based computing service was launched by industry giants Google Ama-zon etc in late 2006 24 ldquoIt is the movement of applica-tion services onto the Internet and the increased use of the Internethelliprdquo
The Earliest Publications
In the first article on Cloud Computing in the Communi-cations of ACM 9 it is referred to as ldquothe compute cloudrdquo and is deemed synonymous with ldquoon-demand comput-ing software as a service or the Internet as a platformrdquo Though these other naming conventions are self-explana-tory cloud computing is not
The cloud computing is understood as a shift of the ge-ography of computing It begs the question if it is about moving delivery of a wide variety of information services onto to the Internet why donrsquot we call it ldquoInternet Com-putingrdquo
The first time cloud computing showed up in a HBR pub-lication was in a digital article in April 2008 14 The au-thor states that the move to cloud computing would be disruptive to incumbent players of shrink-wrapped gam-ing software assuming his readers understand what cloud computing entails
A BRIEF HISTORY OF COMPUTING
In the early days of computers they were big and expen-sive So sharing this big expensive gadget was a normal practice Most organizations did not usually own this big machine but those who did had to share it across an en-terprise That was the era of timesharing
However as computers got cheaper and more afford-able every company every department and then finally every person decided to have their own computer How-ever standalone computers are of limited use So we networked them first locally in a Local Area Network (LAN) environment and then far and wide Wide Area
Network (WAN) Then we networked the network and the World Wide Web was born
At the same time in a different parallel universe some-thing else was happening In the early years no commer-cial off-the-shelf software (COTS) was available Every organization had to write its own software program So if you wanted to computerize your accounting general led-ger payables and receivables or run your inventory you had to write your own applications
Buying off-the-shelf applications was also considered ldquooutsourcingrdquo Why Because you were having others do the work for your organization which was supposed to be doing this work for itself So over the years most appli-cation development have been outsourced to burgeoning software companies such as IBM Oracle and SAP
OUTSOURCING AND ASP
In a general sense IS outsourcing is nothing newmdashit has always been considered an option for IT solutions 11 Electronic Data Systems was handling data processing services for Frito-Lay and Blue Cross as early as 1963 IS outsourcing soon became widely known as the second of a three-phase outsourcing phenomenonmdashtraditional out-sourcing being the first phase and application outsourcing being the third 6
In the early years of the last decade xSPs service provid-ers of all stripes were leading into a new generation of IT where it really did not matter where the applications reside as long as we had access to accomplish what we wanted 247 However back then an Application Service Provider (ASP) was thought by some to be another re-incarnation of the old ldquotimesharingrdquo leveraging network technologies 22
However the understanding of an evolving net-centric computing was already there In their book published in 2002 aptly titled NetSourcing authors Kern Lacity and Willcocks 7 define a computing framework and services stack thatrsquos similar to Cloud Computing The authors state ldquoWe selected the term ldquoNetsourcingrdquo as the over-arching name because the common element of any xSP is the delivery of a product or service over a networkrdquo (p 3) The ldquonetworkrdquo however is now synonymous with the ldquoInternetrdquo
Today cloud computing is about getting the job done in whatever way shape or form that may be required Orga-nizations and individuals need the utility of computing and where it comes from by and large is of no concern As early as 1961 Professor John McCarthy predicted that computation may someday be organized as a public utility ldquoEach subscriber needs to pay only for the capac-
ity he actually uses but he has access to all programming languages characteristics of a very large system hellip Certain subscribers might offer services to other subscribers hellip The computer utility could become the basis of a new and im-portant industry 8 McCarthyrsquos notion of ldquoutility comput-ingrdquo is here right nowmdashthat is ldquocloud computingrdquo
This point is confirmed by others 1 p 51 ldquoThe data center hardware and software is what we consider a cloud When a cloud is made available in a pay-as-you-go manner to the general public we call it utility computingrdquo
CLOUD COMPUTING ORIGIN OF THE PHRASE
Coinage of the term ldquocloud computingrdquo has been traced to two individuals who at the time they came up with this term worked for Compaq Computer George Favaloro a Compaq marketing executive and Sean OrsquoSullivan the founder of the now defunct business NetCentric 20
A Compaq internal document marked as confiden-tial dated November 14 1996 and provided by Sean OrsquoSullivan contemplates a Cloud Computing ldquostrat-egyrdquo10
But the creation of this term did not find currency for another decade Many believe the first use of ldquocloud com-
putingrdquo in its modern context occurred on August 9 2006 when then Google CEO Eric Schmidt introduced the term at an industry conference ldquoWhatrsquos interesting [now] is that there is an emergent new modelrdquo Schmidt said ldquoI donrsquot think people have really understood how big this opportunity really is It starts with the premise that the data services and architecture should be on servers We call it cloud computingmdashthey should be in a ldquocloudrdquo somewhererdquo 19
CLOUD COMPUTING DEFINITION
The National Institute of Standards and Technology (NIST SP 800-145) defines Cloud Computing in the fol-lowing way ldquoCloud computing is a model for enabling convenient on-demand network access to a shared pool of configurable computing resources (eg networks serv-ers storage applications and services) that can be rapidly provisioned and released with minimal management ef-fort or service provider interaction This cloud model is composed of five essential characteristics three service models and four deployment modelsrdquo 17
The following diagram places all the pieces together in a visual form
The Conceptual Reference Model
Cloud Computing Reference Architecture NIST Special Publication 500-292
Nozar Daylami The Origin and Construct of Cloud Computing
42 International Journal of the Academic Business World 43Fall 2015 (Volume 9 Issue 2)
Cloud Computing Reference Architecture NIST Special Publication 500-292
NIST Special Publication 500-292 states that ldquothe defini-tion is widely accepted as a valuable contribution toward providing a clear understanding of cloud computing tech-nologies and cloud services It provides a simple and un-ambiguous taxonomy of three service models available to cloud consumers cloud software as a service (SaaS) cloud platform as a service (PaaS) and cloud infrastructure as a service (IaaS) It also summarizes four deployment mod-els describing how the computing infrastructure that delivers these services can be shared private cloud com-munity cloud public cloud and hybrid cloudrdquo 18 Finally the NIST definition also provides a unifying view of five essential characteristics that all cloud services exhibit on-demand self-service broad network access resource pool-ing rapid elasticity and measured service 18
This publication further states that ldquoThese services and their delivery are at the core of cloud computing In the cloud computing model the primary focus is a more eco-
nomic method of providing higher quality and faster ser-vices at a lower cost to the usersrdquo
The Cloud Security Alliance 21 provides a more transpar-ent narrative of what Cloud Computing is ldquoa model for enabling ubiquitous convenient on-demand network access to [a] shared pool of configurable computing re-sources [it] has the potential to enhance collaboration agility scaling and availability and provides opportunity for cost-reduction the model envisages a world where components can be rapidly orchestrated provisioned implemented and decommissioned scaled up or down to provide an on-demand utility-like modelrdquo
A SPATIAL VIEW OF CLOUD COMPUTING
The NIST Computing Reference Architecture is a flat depiction of the cloud computing model A three dimen-sional view of the model by Craig-Wood 2 is a spatial de-piction Here you can see the three dimensions of cloud computing that renders the elephant fable
Computing Services Framework
Infrastructure as a Service (IaaS) As the word ldquoinfra-structurerdquo implies this is the most basic of services Cus-tomers can buy processing storage and network services and then build their own systems on top of this infra-structure A pioneer in the IaaS field is Amazon with its Amazon Elastic Compute Cloud (EC2)
However most big names in the IT field from Micro-soft (Azure) to Google (App Engine) provide IaaS Here customers are not renting specific servers hard drives and network switches or any particular equipment but instead they are utilizing the infrastructure that is most certainly simulated by virtualization software allowing multiple customers to be served by the same array of physi-cal devices IaaS provides the raw power of computingmdashstorage included
Cloud Computing would not be possible without virtu-alization Virtualization is the ability to make a virtual machine (VM) act like a physical computer Just like a physical computer with its own processor operating sys-tem and storage each VM has its own components too The benefit of virtualization though is that you can put much more than only one VM even with different oper-ating systems on the same server Doing so dramatically increases each serverrsquos potential for serving clientsrsquo on-demand needs (8)
Platform as a Service (PaaS) The next level up is where vendors provide not only the raw powermdashthe infrastruc-turemdashbut preconfigured systems running operating sys-tems databases and platforms (programming languages) for building applications For example Microsoftrsquos Azure service provides preconfigured computers running Win-dows and SQL Server And Salesforcecom has Forcecom as its own custom application development platform
In practice the boundary between IaaS and PaaS is not always clear Because IaaS providers most often provide other services such as operating systems database or ap-plication development platform that fall in the PaaS cat-egory In its purest form IaaS can be considered as virtual machines (raw processing power and storage) that can be scaled up and down as you need
Software as a Service (SaaS) Another higher layer is where vendors provide full applications running on cloud infrastructuremdashtheir own or rented from the likes of Amazon Salesforcecom has long been considered one of the most successful SaaS provider Salesforececom CRM was one of the early entrants into the market Salesforcecom prides itself on being a pioneer in Cloud Computing
At Salesforcecom itrsquos all about the Cloud However in their collateral literature dated circa 1993-94 you wonrsquot find any mention of the word ldquocloudrdquo
CLOUD COMPUTING CONCERNS
In survey after survey security is listed as the top concern of Cloud Computing However Cloud Security Alliance (CSA) the industry group that provides security guide-lines and education states that ldquosecurity controls for the cloud computing are for in most part no different than the security controls in any IT environment hellip[however] cloud computing may present different risks to an organi-zation than traditional IT solutionsrdquo 21 p 21
CIOs or CEOs for that matter may feel safer when they ldquoownrdquo versus ldquorentrdquo their IT assets However when you deploy your assets on the Internet for which you eventu-ally will have little choice you will inherit a set of vulner-abilities that are not all that different from the Cloudrsquos Ownership has its own set of financial risks in the form of capital expenditures (CAPEX) that need to be budgeted and spent up front Compare that risk with the far smaller risk of renting (OPEX) which by and large can be dis-continued if needed
Cloud computing technology does not require the use of public networks If your data is too strategically critical and sensitive to be deployed on the Internet you could instead deploy a private cloud that is strictly for your or-ganization Obviously a Private Cloud is more expensive and it needs trained staff However a private cloud lets an organization benefit from cloud technology without the risk of possible public disclosure of its data
Another alternative could be a community cloudmdasha pri-vate cloud that is shared by several organizations for spe-cific needs For example a group of hospitals might create a community cloud to hold patientrsquos medical records
CONCLUSION
Cloud Computing is here to stay and grow Clouds are more versatile than traditional IT networks on many di-mensions They are far more convenient to deploy they have far more potential for collaboration and they are far more scalable than traditional IT ever was The delivery of services is provisioned on global telecommunication net-works that these days have morphed into the Internet And when they mature they will provide a computing utility when and where it is needed
Cloud computing model (adapted from Craig-Wood)
Nozar Daylami The Origin and Construct of Cloud Computing
44 International Journal of the Academic Business World 45Fall 2015 (Volume 9 Issue 2)
BIBLIOGRAPHY
1 Armburst M et al A View of Cloud Computing Communications of the ACM Vol 53 No 4 pages 50-58
2 Craig-Wood K Definition of Cloud Computing incorporating NIST and G-Cloud views httpswwwkatescommentcomdefinition-of-cloud-com-puting-nist-g-cloud Access date April 26 2015
3 Creeger M CTO Roundtable Cloud Computing Communications of the ACM Vol 52 No 8 pages 50-56
4 Cusumano M Cloud Computing and SaaS as New Computing Platforms Communications of the ACM Vol 53 No 4 pages 27-29
5 Foster Ian and Tuecke Steven Describing the Ele-phant The Different Faces of IT as Service wwwac-mqueuecom JulyAugust 2005 pages 26-34 httpdeliveryacmorg10114510900001080874p26-fosterpdf ip=99100108167ampid=1080874ampacc=OPENampkey=4D4702B0C3E38B352E4D4702B0C3E38B352E4D9421298D07BF362E6D218144511F3437ampCFID=505172814ampCFTOKEN=56369758amp__acm__=1429816554_402a40f1d60056fb68e8ccf3fdd96201 accessed April 23 2015
6 Kern Thomas Lacity Mary Cecelia Willcocks Leslie P Netsourcing Renting Business Applica-tions and Services Over a Network Prentice Hall 2002
7 Knoblauch A Deconstructing Cloud Smashwords Edition (Kindle Version) First Edition August 2013
8 Garfinkel Simon (2011 Oct 3) The Cloud Imperative MIT Technology Review httpwwwtechnologyreviewcomnews425623the-cloud-imperative
9 Hayes B Cloud Computing Communications of the ACM Vol 51 No 7 pages 9-11
10 Internet Solution Division Strategy for Cloud Com-puting Compaq Computer Corporation (1996) httpwwwtechnologyreviewcomsitesdefaultfileslegacycompaq_cst_1996_0pdf
11 Lacity M C Hirschheim R Information Systems Outsourcing Myths Metaphors and Realities New York John Wiley amp Sons 1993
12 McAfee A The Year the Cloud Rolled In httpshbrorg2010122010-the-year-the-cloud-rolled Access date April 23 2015
13 McAfee A What Every CEO Needs to Know About the Cloud httpshbrorg201111what-every-ceo-needs-to-know-about-the-cloud Access date April 23 2015
14 McGrath R Whorsquos Disrupting the Gaming Indus-try httpshbrorg200804whos-disrupting-the-gaming-ind Access date April 23 2015
15 Mell P Grance T The NIST Definition of Cloud Computing National Institute of Standards and Technology httpcsrcnistgovpublicationsnist-pubs800-145SP800-145pdf
16 Neumann P Risks and Myths of Cloud Comput-ing and Cloud Storage Communications of the ACM Vol 57 No 10 pages 25-27 The NIST Defi-nition of Cloud Computing httpcsrcnistgovpublicationsnistpubs800-145SP800-145pdf
17 NIST Definition of Cloud Computing httpcsrcnistgovpublicationsnistpubs800-145SP800-145pdf
18 NIST Cloud Computing Reference Architecture National Institute of Standards and Technology Special Publication 500-292 httpwwwnistgovcustomcfget_pdfcfmpub_id=909505
19 Nanavati M Colp P Aiello W and Warfield A Cloud Security A Gathering Storm Communica-tions of the ACM Vol 57 No 8 pages 70-79
20 Regalado Antonio (2011 Oct 31) Who coined cloud computing MIT Technology Review httpwwwtechnologyreviewcomnews425970who-coined-cloud-computing
21 Security Guidance for Critical Areas of Focus in Cloud Computing V30 Cloud Security Alliance httpscloudsecurityallianceorgguidancecsagu-idev30pd
22 Seviokla J Does Cisco Have Its Head in the Clouds httpshbrorg200903does-cisco-have-its-head-in-th Access date April 23 2015
23 Walsh K R Analyzing the Application ASP Concept Technologies Economies and Strategies Communications of ACM Vol 46 No 8 pages 103-107
24 Yang H Tate Mary A Descriptive Literature Review and Classification of Cloud Computing Re-search Communications of Association of Informa-tion Systems Vol 31 2012
Nozar Daylami
46 Fall 2015 (Volume 9 Issue 2)
This page intentionally blank
International Journal of the Academic Business World 47
INTRODUCTION
In their paper ldquoSAS and the Efficient Portfoliordquo Thomp-son and El-houbi (2012) develop a SAS program to calcu-late portfolio weights for efficient stock portfolios Their program improves on existing public domain SAS pro-grams of this type by allowing for portfolios with a rela-tively large number of securities Thompson and El-houbi also claim that their SAS program is an improvement over the Excel programs used to calculate portfolio weights which are sometimes included in investment textbooks They note that users concur that their program is easier to use than those Excel programs which either limit the number of securities that can be included in a portfolio require ldquocorrectionsrdquo or ldquoadjustmentsrdquo to overcome some quirks in the Excel Solver routine or require multiple user interventions
The Thompson and El-houbi program is certainly more elegant and user friendly than the equivalent Excel pro-grams and will provide those with access to the SAS pro-gramming language a valuable tool for learning portfolio management The disadvantage of a SAS program how-ever is that many students will not have easy access to the SAS programming language Students at smaller univer-sities may not have any access to SAS while students at many larger universities may only be able to access SAS at a computer lab on campus
In this paper I modify the Thompson and El-houbi SAS program for use in the open-source R programming lan-guage which is available free of charge for anyone with access to the internet Using the R language program to compute portfolio weights for efficient portfolios main-tains the elegance of the Thompson and El-houbi SAS
program while overcoming the disadvantage of limited SAS availability In addition I extend the Thompson and El-houbi program by making use of a quadratic program-ming package available in R to provide a program that can accommodate short-sale restrictions and position limits
THE R PROGRAMMING LANGUAGE
R is a free programming language for statistical analysis and graphics and runs on many UNIX platforms and on Windows and MacOS It is available under the terms of the Free Software Foundationrsquos GNU General Public License R was developed initially by Robert Gentleman and Ross Ihaka both of the University of Auckland (New Zealand) and is based on the S programming language developed at Bell Labs by John Chambers Since its initial development the popularity of R has grown considerably largely because of its ease of use and because of the avail-ability of many add-on packages that allow users to tackle very sophisticated projects
The base R package may be downloaded at httpcranusr-projectorg That web page also provides links to sources of information about R and basic user manuals There are also many books and manuals now available for purchase that offer information on both basic and special-ized uses of the language In fact Vance (2009) suggests that the growing popularity of the R language at univer-sities language could even result in noticeably lower de-mand for SAS
THE MARKOWITZ PORTFOLIO PROBLEM
As Markowitz (1952) notes an investor following the ldquoex-pected returns-variance of returns rulerdquo will choose an ef-
Optimal Portfolios and the R Programming Language
James A TurnerAssistant Professor of Finance
School of Accounting amp TaxationWeber State University
Ogden UT 84408
ABSTRACTThis paper develops a program in the freely available open-source R programming language to calculate weights for optimal stock portfolios The program retains the advantages the Thompson and El-houbi (2012) SAS program has over similar programs in Excel but avoids the potential problem of limited access to SAS that some students and researchers may face The R program also extends the Thompson and El-houbi program by including the ability to accommodate short-sale restrictions and position limits
James A Turner Optimal Portfolios and the R Programming Language
48 International Journal of the Academic Business World 49Fall 2015 (Volume 9 Issue 2)
ficient portfolio that is a portfolio with maximum ex-pected return for a given variance or one with minimum variance for a given expected return The minimum vari-ance formulation of the portfolio choice problem there-fore requires that the investor choose portfolio weights to minimize the variance of a portfolio with a given expected return The problem also requires that all money be in-vested (which means that the portfolio weights must sum to one) In matrix notation the optimization problem is
where w the choice variable is a k times 1 vector of the weights invested in the k securities in the portfolio V is the port-folio variance-covariance matrix and R is a 2 times k matrix whose first row is a vector of ones and whose second row contains the expected returns of each security in the port-folio M is a 2 times 1 vector whose first element is one (corre-sponding to the constraint that the portfolio weights sum to one) and whose second element is the chosen portfo-lio expected return For now there are no restrictions on short sales so some portfolio weights may be negative
The Lagrangian for the problem is
( ) L w Vw M Rwλprime prime= + minus
where λ is a 2 times 1 vector containing the Lagrangian multi-pliers The first-order conditions for a minimum (which are also sufficient conditions in this case) are
Solving the first-order conditions for w and λ yields
( )( )
11 1
112
w V R RV R M
RV R Mλ
minusminus minus
minusminus
prime prime=
prime=
Thompson and El-houbi following Stephens (1998) let 1 H RV Rminus prime= so that
1 1
1
2
w V R H MH Mλ
minus minus
minus
prime=
=
Stephens (1998 p 36) shows how the elements of the H matrix may be used ldquoto fix any meanvariance point on the efficient frontierrdquo
Min st
w VwRw M
prime
=
2 0
0
L Vw RwL M Rw
λ
λ
part prime= minus =partpart
= minus =part
THE BASIC R PORTFOLIO OPTIMIZATION PROGRAM
The R programming language lends itself very easily to matrix manipulation and matrix computation removing much of the difficulty in solving the standard Markowitz portfolio problem The following R program calculates the portfolio weights for an efficient portfolio using stock return data to estimate expected returns and the variance-covariance matrix The user must specify the desired port-folio expected return The program can accommodate portfolios up to about 50 stocks Beyond that number precision limitations of the R language may make the variance-covariance matrix ldquocomputationally singularrdquo and unable to be inverted
The first step in the program is to read in the return data R can input data from many file types but in the present example the data are stored in a comma-delimited Excel file called ldquoReturnscsvrdquo which contains stock return data In this case the Excel file includes a header row labeling each column of returns with identifying information but no row names The program first reads in the data and then determines the number of securities (number of col-umns in the matrix) as shown on the facing page
ADDING SHORT-SALE CONSTRAINTS AND POSITION LIMITS
The above formulation of the portfolio choice problem places no restrictions on short sales and does not accom-modate position limits In reality individual investors and some fund managers may face requirements prohibit-ing short sales Fund managers may also face requirements that either limit the amount that may be invested in one security or sector or instead that a minimum percentage of funds be invested in a certain security or sector Dai Lin and Liu (2011) list several examples of real-world po-sition limits such as a requirement that a small-cap mutu-al fund invest at least a minimum percentage of its funds in small-company stocks In mathematical terms these short-sale restrictions and position limits can be expressed as a series of inequality constraints While reformulating the portfolio choice problem to add inequality constraints is not difficult doing so makes actually solving the prob-lem considerably more difficult
With short-sale restrictions and position limits the port-folio choice problem becomes
0
Min st
w VwRw MSw w
prime
=ge
where w is still the choice variable S is an m times k matrix that defines both the short-sale constraints on the k se-curities in the portfolio and m minus k other restrictions If there are short-sale constraints but no other restrictions the S matrix is simply a k times k identity matrix which when multiplied by the vector w results in the requirement that
0 iw ige forall If there are other restrictions the sub-matrix of S consisting of the first k rows and k columns of S is an identity matrix and the other restrictions are specified by suitable choices of the elements of the remaining rows of S For example suppose there is a position limit placing a maximum of p on the percentage invested in the sev-enth security so that 7 w ple Since the constraints in the optimization problem above have been expressed as non-negativity constraints this position limit must instead take the form 7 w pminus ge minus The row of S corresponding to
the position limit will consist entirely of zeros except for the seventh element which will be minus1 and corresponding element of the w0 vector would be p
Introducing other forms of position limits simply requires adding the appropriate rows to the S matrix For example if there is a requirement that the total percentage invested in the first and third securities equal or exceed a certain percentage q then one row of S should be [1 0 1 0 0]and the corresponding element of the w0 vector would be q If there is instead a requirement that the total percentage invested in the first and third securities not exceed a cer-tain amount q the required row of S would be [-1 0 -1 0 0] and the corresponding element of the w0 vector would be minusq Other restrictions may be specified similarly For problems that include position limits each of the first k el-
The BASIC R Portfolio Optimation Program
Returns ltminus readtable(ldquoReturnscsvrdquo header = TRUE sep = ldquordquo)Rmat ltminus asmatrix(Returns) Converts the data to matrix formk ltminus ncol(Rmat) Number of columns (number of securities in the portfolio) Now the program calculates the estimate of the variance-covariance matrix (V) the M vector and the R matrix which includes the estimate of the expected returns
V ltminus var(Rmat) Calculates the sample variance-covariance matrix which is used as the estimate of the variance-covariance matrix
Erp ltminus 001 Sets the desired expected portfolio return The user can change this value as desired
M ltminus rbind(1 Erp) Ones ltminus rep(1 k) Ravg ltminus colMeans(Rmat)
Defines the M matrix including the required portfolio return Defines a 1 x k matrix of ones Calculates average returns by column giving a 1 x k matrix of estimated expected returns
R ltminus rbind(Ones Ravg) Combines Ones and Ravg into the 2 x k matrix R Finally the program calculates the portfolio weights and the portfolio variance
VINV ltminus solve(V) Calculates the inverse of the estimated variance-covariance matrixH ltminus RVINVt(R) Calculates the H matrixHINV ltminus solve(H) Calculates the inverse of Hw lt- VINVt(R)HINVM Calculates the portfolio weightsPvar lt- t(w)Vw Calculates the portfolio variance The following commands display the results of the calculations
print(w) Prints the elements of the w vectorprint(Pvar) Prints the variance of the portfolio formed using the weights w
James A Turner Optimal Portfolios and the R Programming Language
50 International Journal of the Academic Business World 51Fall 2015 (Volume 9 Issue 2)
ements of the w0 vector will be zero corresponding to the non-negativity constraints and the remaining elements will equal the percentages associated with the position limits entered as positive or negative numbers depend-ing on whether the position limits establish minimums or maximums
The Lagrangian for this problem is
( ) ( )0 L w Vw M Rw w Swλ microprime prime prime= + minus + minus
where λ is a 2 times 1 vector containing the Lagrangian multi-pliers on the equality constraints and micro is an m times 1 vector of the Lagrangian multipliers on the k short-sale constraints and the m ndash k position limits The first-order necessary con-ditions for this problem are the Kuhn-Tucker conditions
( )0 0
2 0
0
0 0 and 0
L Vw R SwL M Rw
L w Sw w Sw
λ micro
λ
micro micromicro
part prime prime= minus minus =partpart
= minus =partpart prime= minus le ge minus =part
The final set of conditions are known as the complementa-ry slackness conditions since if an element of partLpartμ does not equal zero (ie if the required condition is slack) then the corresponding element of micro must equal zero and vice versa Because of the complementary slackness conditions in order to find a solution to the optimization problem each condition must be checked individually to deter-mine the possible solutions If there are more than a very few constraints finding the candidate solutions manually becomes extremely tedious
Fortunately it is possible to use numerical methods to solve this type of non-linear programming program This is where the strength of the R programming language be-comes very evident The R language provides access to an extensive number of add-on packages developed by R us-ers around the world In particular there are several pack-ages that implement numerical methods to find solutions to optimization problems with inequality constraints Perhaps the package that most easily lends itself to solv-ing the current problem is the ldquoquadprogrdquo package Ac-cording to the documentation included with the pack-age the quadprog routine ldquoimplements the dual method of Goldfarb and Idnani (1982 1983) for solving qua-dratic programming problems of the form min(d΄b+frac12b΄Db)) with the constraints Aʹbgtb₀rdquo For the optimization problem currently under consideration the d vector will be a zero vector the b vector will be the w vec-tor of portfolio weights the D matrix will be the variance-
covariance matrix V and the matrix A΄ will equal a matrix formed by combining the R matrix and the S matrix such that A΄= [R
S ]and A = [ R΄ S΄] Since the V matrix is symmetric the term frac12b΄Db = frac12w΄Vw is a quadratic form Also because the d vector is a zero vector the presence of the frac12 term in the quadratic form does not change the value of the solution to the current portfolio optimization problem That is the weights that minimize frac12w΄Vw sub-ject to the constraints will also minimize w΄Vw subject to the constraints
THE R PORTFOLIO OPTIMIZATION PROGRAM WITH PACKAGE ldquoQUADPROGrdquo
The ldquoQuadprogrdquo package is one of many add-in packages available to R users To use add-in packages in R the user must first download and install the chosen package This is done through the ldquoPackagesrdquo command in the menu bar of the console window Selecting the ldquoInstall package(s)rdquo command from the drop-down box will bring up a list of download locations After selecting a download location the user selects the package(s) to download and install Finally once the selected package is downloaded and in-stalled it must be loaded for use in the current R session which is done by choosing ldquoPackagesrdquo command on the menu bar and then choosing the ldquoLoad packagerdquo com-mand from the drop-down box A list of available packag-es will then appear and the user should select the desired package in this case the ldquoquadprogrdquo package Once the quadprog package is loaded the following program will solve the portfolio problem with short-sale restrictions and position limits
In the present example the short-sale constraint requires that all elements of the w vector be non-negative In addi-tion there are three position limits The first position lim-it requires that no more than 5 of total funds be invested in the seventh security The second position limit requires that no more than a total of 40 of available funds be in-vested in the first and third securities The third position limit requires that total of at least 30 of available funds be invested in the second and fourth securities
The program will make use of the M matrix and the vari-ance-covariance matrix V from the earlier program so those variables must be saved by the user or the following program must be run after running the previous program and before exiting R The new program first sets the posi-tion limits as shown on the facing page
The output of the ldquosolveQPrdquo function includes the values of w and the Lagrangian multipliers for each constraint If the value of a Lagrangian multiplier is zero the constraint associated with that multiplier is not binding otherwise the constraint is binding Though checking the values of
the Lagrangian multipliers allows the user to determine which constraints are binding quite easily the functionrsquos output also includes a listing of the binding constraints by index number
The R Portfolio Optimization Program with Package ldquoQuadprogrdquo
npl ltminus 3 Sets the number of position limits The user sets this value
plmat ltminus matrix (rep(0 nplk) nrow=npl ncol=k) Initializes the matrix that will be used to define the position limit(s)
plmat[17] = -1 Places the required elements into the proper places in the lmat[21] = plmat[23] = -1 position limits matrix In this example the first position
plmat[32] = plmat[34] = 1 limit will set a maximum on the total percentage invested in the seventh security The second position limit will set a maximum on the total percentage invested in the first and third securities The third position limit will set a minimum on the total percentage invested in the second and fourth securities
pl ltminus c(-005 -04 03) Sets the values of the position limits The value the user enters should be positive if the position limit specifies a inimum and should be negative if the position limit specifies a maximum
Next the inequality constraints are placed in matrix form
S ltminus rbind(diag(k) plmat) Defines the S matrix
w0 ltminus c(rep(0 k) pl) Creates a vector whose elements are the values of the inequality constraints
Next the arguments required by the solveQP function that solves the programming problem are defined and the programming problem is solved
dvec ltminus rep(0 k) Defines the d vector which is a necessary input for the quadprog package For portfolio optimization problems the elements of the d vector will all be zeros
Amat ltminus colbind(t(R) t(S)) Forms the Amat matrix
bvec ltminus c(M w0) Joins the M matrix and the w0 matrix to form the bvec vector
ICSol ltminus solveQP(V dvec Amat bvec meq=2) Solves the quadratic programming problem The argument meq specifies that the first two constraints are equality constraints In this example the equality constraints are that the weights sum to one and that the portfolio expected return equal a specified amount
print(c(ICSol[1] 2ICSol[[2]] ICSol[5] ICSol[6])) Prints selected output from the solve QP function the weights the portfolio variance the values of the Lagrangian multipliers and the index numbers of the binding constraints
James A Turner Optimal Portfolios and the R Programming Language
52 International Journal of the Academic Business World 53Fall 2015 (Volume 9 Issue 2)
CONCLUSION
This paper provides an R language program to calculate portfolio weights for efficient portfolios The program can also accommodate short-sale constraints and position limits Users must choose the desired portfolio expected return and must specify any other constraints A strong advantage of the program is that because the R program-ming language is freely available to anyone with access to the internet students and others who wish to use the pro-gram will be able to do so easily
REFERENCES
Dai Min Hanqing Jin and Hong Liu 2011 Illiquidity position limits and optimal investment for mutual funds Journal of Economic Theory 146 1598ndash1630
Goldfarb D and A Idnani 1982 Dual and primal-dual methods for solving strictly convex quadratic pro-grams In Hennart J P (ed) Numerical Analysis Springer-Verlag Berlin pages 77ndash91
Goldfarb D and A Idnani 1983 A numerically stable dual method for solving strictly convex quadratic pro-grams Mathematical Programming 27 1ndash33
Ihaka Ross A free software project Retrieved May 7 2013 from httpcranr-projectorgdochtmlinter-face98-paperpaper_2html
Markowitz Harry 1952 Portfolio selection Journal of Finance 7 77ndash91
Stephens Alan 1998 Markowitz and the spreadsheet Journal of Financial Education 35ndash43
Thompson Thomas H and Ashraf El-houbi 2012 SAS and the efficient portfolio International Research Jour-nal of Applied Finance 3 315ndash327
Turlach Berwin A 2013 quadprog Functions to solve quadratic programming problems R pack-age version 15-5 httpCRANR-projectorgpackage=quadprog (S original by Berwin A Turlach R port by Andreas Weingessel)
Vance Ashlee 2009 Data analysts captivated by Rrsquos power The New York Times Retrieved May 1 2013 from httpwwwnytimescom20090107tech nolog y busi ness-computi ng 0 7prog ra m htmlpagewanted=allamp_r=0
What is R Retrieved May 7 2013 from httpwwwr-projectorgabouthtml
APPENDIX 1 DATA
The data used in the R program come from the CRSP monthly stock file and consist of 60 months of return data from January 2008 to December 2012 The stocks in the 10-stock portfolio are the first 10 stocks in the CRSP monthly file (listed by PERMNO) for which 60 continuous months of returns are available The stocks in the 50-stock portfolio are the first 50 stocks for which 60 continuous months of returns are available Table 1 below lists the PERMNOS current company name and current ticker of the included stocks as well as the exchange where the stock trades
Table 1 Stocks in the Portfolio
NO PERMNO CURRENT COMPANY NAME TICKER EXCHANGE1 10001 GAS NATURAL INC EGAS AMEX2 10002 BANCTRUST FINANCIAL GROUP INC BTFG NASDAQ3 10025 A E P INDUSTRIES INC AEPI NASDAQ4 10026 J amp J SNACK FOODS CORP JJSF NASDAQ5 10032 PLEXUS CORP PLXS NASDAQ6 10044 ROCKY MOUNTAIN CHOCOLATE FAC INC RMCF NASDAQ7 10051 HANGER INC HGR NYSE8 10065 ADAMS EXPRESS CO ADX NYSE9 10100 AMERICAN LEARNING CORP NY ALRN NASDAQ
Table 1 Stocks in the Portfolio
NO PERMNO CURRENT COMPANY NAME TICKER EXCHANGE10 10104 ORACLE CORP ORCL NASDAQ11 10107 MICROSOFT CORP MSFT NASDAQ12 10138 T ROWE PRICE GROUP INC TROW NASDAQ13 10145 HONEYWELL INTERNATIONAL INC HON NYSE14 10147 E M C CORP MA EMC NYSE15 10180 AKORN INC AKRX NASDAQ16 10182 TECH DATA CORP TECD NASDAQ17 10200 REPLIGEN CORP RGEN NASDAQ18 10207 ROYCE FOCUS TRUST INC FUND NASDAQ19 10225 BEAM INC BEAM NYSE20 10232 ELMIRA SAVINGS BANK NY ESBK NASDAQ21 10239 BALDWIN amp LYONS INC BWINB NASDAQ22 10252 INDEPENDENT BANK CORP MA INDB NASDAQ23 10253 DOCUMENT SECURITY SYSTEMS INC DSS AMEX24 10257 D L H HOLDINGS CORP DLHC NASDAQ25 10258 CELLDEX THERAPEUTICS INC CLDX NASDAQ26 10259 SIGMA DESIGNS INC SIGM NASDAQ27 10294 HAVERTY FURNITURE COS INC HVT NYSE28 10297 NEW HAMPSHIRE THRIFT BNCSHRS INC NHTB NASDAQ29 10299 LINEAR TECHNOLOGY CORP LLTC NASDAQ30 10302 CYPRESS SEMICONDUCTOR CORP CY NASDAQ31 10308 TOMPKINS FINANCIAL CORP TMP AMEX32 10318 BALCHEM CORP BCPC NASDAQ33 10333 XOMA CORP XOMA NASDAQ34 10355 DAILY JOURNAL CORP DJCO NASDAQ35 10363 A M A G PHARMACEUTICALS INC AMAG NASDAQ36 10375 T C F FINANCIAL CORP TCB NYSE37 10382 ASTEC INDUSTRIES INC ASTE NASDAQ38 10395 NAVIGATORS GROUP INC NAVG NASDAQ39 10397 WERNER ENTERPRISES INC WERN NASDAQ40 10421 SKYWEST INC SKYW NASDAQ41 10443 PATRIOT TRANSPORTATION HLDG INC PATR NASDAQ42 10463 RESEARCH FRONTIERS INC REFR NASDAQ43 10501 AMERICAN WOODMARK CORP AMWD NASDAQ44 10507 MEDICAL ACTION INDS INC MDCI NASDAQ45 10514 TRANS WORLD ENTERTAINMENT CORP TWMC NASDAQ46 10516 ARCHER DANIELS MIDLAND CO ADM NYSE47 10517 AARONS INC AAN NYSE48 10530 MERIDIAN BIOSCIENCE INC VIVO NASDAQ49 10547 CLEARFIELD INC CLFD NASDAQ50 10550 PRO DEX INC COLO PDEX NASDAQ
James A Turner Optimal Portfolios and the R Programming Language
54 International Journal of the Academic Business World 55Fall 2015 (Volume 9 Issue 2)
APPENDIX 3 RESULTS FOR THE 10-STOCK PORTFOLIO
Results for the 10-stock portfolio with a monthly expect-ed return of 1 are shown at the top of the facing page First shown is the variance-covariance matrix (V) fol-lowed by its inverse (V-1)
Table 2 shows the return averages of each stock and the calculated portfolio weights both for the portfolio with no short-sale constraints or position limits and the port-folio with short-sale constraints and three position limits (1) a requirement that the percentage invested in the sev-enth security not exceed 5 (2) a requirement that the
total percentage invested in the first and the third securi-ties not exceed 40 and (3) a requirement that the total percentage invested in the second and fourth securities be at least 30 Note that when short-sale constraints and position limits are imposed there may no longer be a port-folio that meets all the constraints that is the feasible set may be null In that case the R program will return an error message stating that the constraints are inconsistent
Table 3 lists the inequality constraints and the associ-ated Lagrangian multipliers along with an indication of whether the constraint is binding In this example the constraint that there be a minimum of 30 invested in the second and fourth securities is not binding
APPENDIX 2 COPY OF THE FULL PROGRAM
The full program is shown below without comments Users can easily copy the program that is between the solid lines and paste it into the R Editor window It will probably be necessary for each user to change the name of the data file in the readtable command Also the user can change the portfolio expected return and the number type and value of the inequality constraints as desired
Returns ltminus readtable(ldquoReturnscsvrdquo header = TRUE sep = ldquordquo) Rmat ltminus asmatrix(Returns) k ltminus ncol(Rmat) V ltminus var(Rmat) Erp ltminus 001 M ltminus rbind(1 Erp) Ones ltminus rep(1 k) Ravg ltminus colMeans(Rmat) R ltminus rbind(Ones Ravg) VINV ltminus solve(V) H ltminus RVINVt(R) HINV ltminus solve(H) w lt- VINVt(R)HINVM Pvar lt- t(w)Vw print(w) print(Pvar) npl ltminus 3 plmat ltminus matrix (rep(0 nplk) nrow=npl ncol=k) plmat[17] = -1 plmat[21] = plmat[23] = -1 plmat[32] = plmat[34] = 1 pl ltminus c(-005 -04 03)S ltminus rbind(diag(k) plmat) w0 ltminus c(rep(0 k) pl) dvec ltminus rep(0 k) Amat ltminus cbind(t(R) t(S)) bvec ltminus c(M w0) ICSol ltminus solveQP(V dvec Amat bvec meq=2) print(c(ICSol[1] 2ICSol[[2]] ICSol[5] ICSol[6]))
1
2867001 161224 279311 153314 408660 148438 131874 246057 83608 740152
161224 321169 23967 251277 39387 55190 33449 107899 36378 39718
279311 23967 991158 109233 189872 100249 22208 119
V minus
minus minus minus
minus minus minus minus
minus minus minus minus
=
6782 41342 198294
153314 251277 109233 2757210 319797 03010 139907 969199 56520 416534
408660 39387 189872 319797 977494 325171 247388 1098965 26657 04097
148438 55190 100249 03010 325171 1
minus minus minus minus minus
minus minus minus minus minus minus
minus 644368 311333 1803329 91576 428583
131874 33449 22208 139907 247388 311333 1093506 426730 100681 162364
246057 107899 1196782 969199 1098965 1803329 426730 11640904 233195 3789283
8360
minus minus
minus minus minus minus minus minus minus
minus minus minus minus minus minus
8 36378 41342 56520 26657 91576 100681 233195 138635 73382
740152 39718 198294 416534 04097 428583 162364 3789283 73382 3685519
minus minus
minus minus minus minus minus minus
00046 00019 00002 00006 00035 00004 00011 00008 00018 00019
00019 00364 00013 00037 00002 00004 00003 00001 00100 00007
00002 00013 00161 00024 00076 00035 00013 00041 00038 00033
00006 0
V
minus minus minus minus
minus minus minus minus
minus minus
=
0037 00024 00058 00051 00010 00016 00021 00028 00029
00035 00002 00076 00051 00217 00009 00048 00052 00024 00064
00004 00004 00035 00010 00009 00087 00018 00022 00027 00012
00011 00003 00013 000
minus
minus minus
minus minus minus
16 00048 00018 00113 00013 00055 00018
00008 00001 00041 00021 00052 00022 00013 00033 00003 00034
00018 00100 00038 00028 00024 00027 00055 00003 00850 00020
00019 00007 00033 00029 00064 00
minus
minus minus minus minus minus minus minus minus
012 00018 00034 00020 00068minus
Table 2 Average Returns and Weights for the Ten-
Stock Portfolios
Stock No Permno
Average Returns
Weights (SS
Allowed)IC Weights
(No SS 3 PLs)
1 10001 00064 03817 034062 10002 -00054 00311 004063 10025 00183 00908 005944 10026 00156 02525 026255 10032 00095 -01410 000006 10044 00012 00649 013797 10051 00206 01000 005008 10065 00018 01933 004929 10100 00270 00422 0056810 10104 00104 -00155 00031
Table 3 Constraints and Lagrangian Multipliers
Constraint Lagrangian Multiplier
Constraint Binding
Portfolio weights sum to one 00015 Yes
Portfolio expected return equals 1 00443 Yes
w1 ge 0 00000 No w2 ge 0 00000 No
w3 ge 0 00000 No
w4 ge 0 00000 No
w5 ge 0 00015 Yes
w6 ge 0 00000 No
w7 ge 0 00000 No
w8 ge 0 00000 No
w9 ge 0 00000 No
w10ge 0 00000 No
w7 le 005 00003 Yes
w1 + w3 le 04 00002 Yes
w2 + w4 ge 03 00000 No
James A Turner Optimal Portfolios and the R Programming Language
56 International Journal of the Academic Business World 57Fall 2015 (Volume 9 Issue 2)
The portfolio variances are
No short-sale constraints 0001607 Short-sale constraints and three position limits 0001856
APPENDIX 4 RESULTS FOR THE 50-STOCK PORTFOLIO
Results for the 50-stock portfolio with a monthly ex-pected return of 1 are shown in Table 4 below The first table shows the return averages of each stock and the cal-culated portfolio weights both for the portfolio with no short-sale constraints or position limits and the portfolio with short-sale constraints and three position limits (1) a requirement that the percentage invested in the seventh security not exceed 5 (2) a requirement that the total percentage invested in the first and the third securities not exceed 40 and (3) a requirement that the total percent-age invested in the second and fourth securities be at least 30
Table 5 shows the Lagrangian multipliers on the equal-ity constraints and the position limit constraints To save space for the 50-stock portfolio the Lagrangian multi-pliers on the short-sale constraints are not listed Simply checking Table 4 to see if the weight on a particular stock is zero gives an almost certain indication of which short-sale constraints are binding In this example both the constraint that there be no more than 5 invested in the seventh security and the constraint that there be no more than a total of 40 invested in the first and third securi-ties are not binding
Table 4 Average Returns and Weights for the
50-Stock PortfoliosStock
No Permno Average Returns
Weights SS Allowed
IC Weights No SS 3 PLs
1 10001 00064 01934 013072 10002 -00054 -00179 003673 10025 00183 -00189 000004 10026 00156 02873 026335 10032 00095 00503 000006 10044 00012 -00185 000007 10051 00206 -00136 002288 10065 00018 10920 000009 10100 00270 00306 00423
10 10104 00104 01467 0000011 10107 -00001 -02023 00000
Table 4 Average Returns and Weights for the
50-Stock PortfoliosStock
No Permno Average Returns
Weights SS Allowed
IC Weights No SS 3 PLs
12 10138 00085 -05619 0000013 10145 00065 -03910 0000014 10147 00088 -02693 0000015 10180 00290 -00290 0000016 10182 00076 01181 0000017 10200 00082 01409 0040918 10207 00020 -01551 0000019 10225 00098 00285 0000020 10232 00159 -00021 0000021 10239 00051 01624 0000022 10252 00084 00955 0000023 10253 00058 00121 0000024 10257 -00008 -00236 0000025 10258 00196 -00157 0000026 10259 -00300 -01339 0000027 10294 00179 -00414 0000028 10297 00061 01854 0146729 10299 00074 00826 0000030 10302 00165 00201 0000031 10308 00073 01255 0014132 10318 00194 -01389 0000033 10333 -00203 -00205 0000034 10355 00299 -00545 0036035 10363 -00151 -00167 0000036 10375 00010 -00495 0000037 10382 00046 00267 0000038 10395 -00022 00886 0042339 10397 00134 01296 0084940 10421 -00036 -01045 0000041 10443 00021 01389 0000042 10463 00013 00417 0000043 10501 00176 -00458 0000044 10507 -00228 -00397 0000045 10514 00100 00731 0007846 10516 -00034 -00148 0119247 10517 00208 00629 0000048 10530 00005 00032 0000049 10547 00418 00032 0012550 10550 -00028 00397 00000
The portfolio variances are
No short-sale constraints 000002997 Short-sale constraints and three position limits 000111119
Table 5 Constraints and Lagrangian Multipliers
Constraint Lagrangian Multiplier Constraint Binding
Portfolio weights sum to one 0000503 YesPortfolio expected return equals 1 0031954 Yes
w7 le 005 0000000 Now1 + w3 le 04 0000000 Now2 + w4 ge 03 0000963 Yes
James A Turner
58 Fall 2015 (Volume 9 Issue 2)
This page intentionally blank
JOINT CONFERENCE May 25th 26th and 27th 2016 in
Nashville TN
Academic Business World International Conference
(ABWICorg)
The aim of Academic Business World is to promote inclusiveness in research by offering a forum for the discussion of research in early stages as well as re-search that may differ from lsquotraditionalrsquo paradigms We wish our conferences to have a reputation for providing a peer-reviewed venue that is open to the full range of researchers in business as well as reference disciplines within the social sciences
Business Disciplines
We encourage the submission of manuscripts presentation outlines and ab-stracts pertaining to any business or related discipline topic We believe that all disciplines are interrelated and that looking at our disciplines and how they relate to each other is preferable to focusing only on our individual lsquosilos of knowledgersquo The ideal presentation would cross discipline borders so as to be more relevant than a topic only of interest to a small subset of a single disci-pline Of course single domain topics are needed as well
International Conference on Learning and Administration in
Higher Education (ICLAHEorg)
All too often learning takes a back seat to discipline related research The In-ternational Conference on Learning and Administration in Higher Educa-tion seeks to focus exclusively on all aspects of learning and administration in higher education We wish to bring together a wide variety of individuals from all countries and all disciplines for the purpose of exchanging experi-ences ideas and research findings in the processes involved in learning and administration in the academic environment of higher education
We encourage the submission of manuscripts presentation outlines and ab-stracts in either of the following areas
Learning
We encourage the submission of manuscripts pertaining to pedagogical top-ics We believe that much of the learning process is not discipline specific and that we can all benefit from looking at research and practices outside our own discipline The ideal submission would take a general focus on learning rather than a discipline-specific perspective For example instead of focusing on ldquoMotivating Students in Group Projects in Marketing Managementrdquo you might broaden the perspective to ldquoMotivating Students in Group Projects in Upper Division Coursesrdquo or simply ldquoMotivating Students in Group Projectsrdquo The objective here is to share your work with the larger audience
Academic Administration
We encourage the submission of manuscripts pertaining to the administra-tion of academic units in colleges and universities We believe that many of the challenges facing academic departments are not discipline specific and that learning how different departments address these challenges will be ben-eficial The ideal paper would provide information that many administrators would find useful regardless of their own disciplines
- Testing Major Factors for Reducing Obstacles to Product Innovation Success
-
- Dr Tor Guimaraes
- Dr Marcelo Seido Nagano
- Dr Curtis Armstrong
-
- Acceptance of Change Exploring the Relationship among Psychometric Constructs and Employee Resistance
-
- Brian Dunican EdD
- Ric Keaster PhD
-
- The Origin and Construct of Cloud Computing
-
- Nozar Daylami PhD
-
- Optimal Portfolios and the R Programming Language
-
- James A Turner
-

Brian Dunican amp Ric Keaster Acceptance of Change Exploring the Relationship among Psychometric Constructs and Employee Resistance
32 International Journal of the Academic Business World 33Fall 2015 (Volume 9 Issue 2)
imental study data were collected from three validated instruments ndash Langerrsquos (Bodner amp Langer 2001) Langer Mindfulness Scale (LMS) Budnerrsquos (1962) Tolerance of Ambiguity Scale (TOA) and Oregrsquos (2003) Resistance to Change (RTC) scale Regression models were used to assess the univariate relationships among the constructs Additionally descriptive statistics were used to include the mean median mode standard deviation and other selected variables A multiple linear regression analysis determined the relationship between factors of mindful-ness and tolerance of ambiguity and their influence of resistance to change Bivariate correlations were used to compute the psychometric scores from each instrument and resistance to change ratings to test the significance of the relationships between each subscale Overall statisti-cal analyses were conducted in multiple phases to investi-
gate the relationship between the individual psychomet-ric traits and resistance for salary exempt and non-exempt employees in industrial sites located in Kentucky
Participants in the Study
The population represented a microcosm of several indus-tries in the manufacturing sector within the proximity of Warren County The data collected were based on a con-venient sample A total of 65 participants volunteered to complete an electronic survey that was designed to capture complete responses to a total of 48 questions Participants were not allowed to proceed to the next page of the survey unless all questions on the current page were completed Three participants did not complete the survey and their responses were not included in the end results From the
population of 183 salaried (exempt and nonexempt) em-ployees 65 surveys were officially returned constituting a response rate of 36 Managerial-type jobs dominated 36 of the sample population followed by roles in tech-nical support which reflected 169 Six categories of job types and an ldquoOtherrdquo category were used for the respon-dents
Scoring Method for Each Scale
Resistance to Change Scale
Oregrsquos (2003) Resistance to Change Scale is comprised of 17 items with four subscales ndash routine seeking emo-tional reaction short-term focus and cognitive rigidity Each subscale relates to the extent to which individuals seek routines react to emotions during change encom-pass short-term focus during change and the frequency to which individuals change their minds The overall range of the scale including the subscales is scored between 1 and 6 with 1 representing the least level of resistance In-dividuals scoring higher on the overall scale or subscales indicate a higher resistance to change
Langer Mindfulness Scale
The Langer Mindfulness Scale (Pirson et al 2012) con-tains 14 items and is composed of three subscales ndash novelty seeking engagement and novelty producing The 7-point scale is scored such that higher scores indicate a greater level of awareness toward thinking High scores for novel-ty producing insinuate one would perceive new situations as opportunities to learn new information Individuals with high scores for engagement are more susceptible to noticing details within their environment as opposed to others Higher novelty producing scores indicate that individuals are likely more creative and predisposed to generating new ideas when faced with new information
Tolerance of Ambiguity Scale
Budnerrsquos (1962) Tolerance of Ambiguity Scale is a 16-item scale with ratings ranging from 1 to 7 1 represents strong disagreement indicating a greater tolerance for ambiguity It is important to note that higher scores relate to greater intolerances for ambiguity All results were re-ported at the aggregate level
RESULTS
Statistical data analyses were performed on survey data comprised of the following three instruments Langer Mindfulness Scale (LMS14) Tolerance of Ambigu-
ity Scale (TOA) and Resistance to Change (RTC) scale Findings were reported from the analyses of data col-lected from 65 participants responding to the Qualtrics Web-based survey In particular analyses were conducted through bi-variant correlation analyses (also known as Pearsonrsquos r) independent t-tests and Cronbachrsquos alpha The strengths of the relationships were predicated on Co-henrsquos (1988) interpretation Coefficient values between 10 and 29 were considered small or weak those between 30 and 49 were considered moderate and those between 50 and 10 were considered large or strong
Analysis of Each Research Question
The first research question explored the relationship of de-mographic and organizational factors to the psychomet-ric scales of Mindfulness and Tolerance of Ambiguity and their influence on Resistance to Change Descriptive sta-tistics reflected both demographic and organizational fac-tors ndash gender education years at the company and direct reportsmdashfor the 65 employees who participated in the current study The distributions of variables were distrib-uted evenly between only two variables years at the com-pany and direct reports Other demographic variables including ethnicity and age were recorded A statistical analysis was not conducted due to the uneven distribution of the variables Of the 65 participants 59 were Caucasian and the remaining 6 were minorities The ages of the par-ticipants ranged from 28 years to 65 years Additionally frequency distributions and data analyses were not con-ducted for individual sites to protect anonymity All re-sults were reported at the aggregate level and included the following categories for the participating industries Cup Manufacturing Personal Care Manufacturing Con-struction and Rubber to Metal Bonding Manufacturing
Gender Male and Female
Although more than twice as many males than females participated in the current study independent t-tests were conducted to determine whether differences existed be-tween the mean scores of the scales and subscales for male and female employees No statistically significant differ-ences were found between the outcome of the psychomet-ric constructs (Mindfulness and Tolerance of Ambiguity) and Resistance to Change except on one subscale Cogni-tive rigidity revealed a statistical difference between the scores of males (n = 45 M = 381 SD = 063) and females (n = 20 M = 336 SD = 086) t (63) = 234 p = 05 α = 05
Figure 1 Logic model for hypothesized relationships among
Psychometric Constructs Demographic Controls and Degree of Resistance to Change
INDEPENDENT VARIABLES
Degree of Resistance
Demographic Factors
-----
Age Gender
Ethnicity Education
____________
Organizational Factors
----- Years at Current Company Type of Current Position
Type of Industry or Category Number of Direct Reports
Resistance to Change -----
Routine Seeking Emotional Reaction Short-term Focus
Cognitive Rigidity
Tolerance of Ambiguity
----- Novelty
Complexity Insolubility
Mindfulness -----
Novelty Seeking Engagement
Novelty Producing
Brian Dunican amp Ric Keaster Acceptance of Change Exploring the Relationship among Psychometric Constructs and Employee Resistance
34 International Journal of the Academic Business World 35Fall 2015 (Volume 9 Issue 2)
Education
Due to the imbalanced distributions of participants sta-tistical analysis for Education was not performed The frequency distribution reflected that 5231 (34) of the participants possessed a four-year degree 1231 (8) ob-tained a masterrsquos degree or higher 2615 (17) possessed a two-year degree or some college while the reaming 923 (6) were high school graduates
Direct Reports and No Direct Reports
An individual variances t-test was conducted and failed to reveal a statistically reliable difference between the mean scores of salaried employees without direct reports and salaried employees with direct reports As an example scores from routine seeking a subscale of resistance to change were not significantly different between employ-ees without direct reports (n = 32 M = 312 SD = 096) and employees with direct reports (n = 33 M = 291 SD = 085) t (65) = 093 p = 037
Years at the Company
A one-way analysis of variance (ANOVA) was calculated on participantsrsquo ratings of the psychometric constructs and resistance to change as a comparison to the number of years at the company Comparisons indicated no sta-tistically significant differences were presented between groups of 0 to 4 years 5 to 10 years 11 to 20 years and 21 years and greater As an example on novelty-seeking a subscale of the Langer Mindfulness Scale the analysis was not significant between the four groups F(3 61) = 31 p = 82
The second research question used bivariate correlations to determine the strength of the relationships between the psychometric constructs (Mindfulness and Tolerance of Ambiguity) and Resistance to Change including the four subscales All of the Pearson correlations were significant across each of the findings with the exception of the LMS scale and Cognitive Rigidity of Resistance to Change subscale r(65) = -225 p = 072 The overall LMS scales reflected a strong negative relationship r(65) = -530 p lt 001 with the RTC scale The TOA scale revealed a mod-
Table 1 Descriptive Statistics and Correlations among Responses of Tolerance of
Ambiguity Scale Langer Mindfulness Scale and Subscales and Resistance to Change and Subscales
Scales LMS_NS LMS_NP LMS_E TOA_ Tot RTC_RS RTC_ER RTC_STF RTC_CR
LMS_NS (77)
LMS_NP 76 (72)
LMS_E 49 51 (69)
TOA_Tot -48 -53 -32 (72)
RTC_RS -51 -50 -41 65 (85)
RTC_ER -36 -37 -36 41 71 (88)
RTC_STF -53 -47 -38 60 77 80 (90)
RTC_CR -28 -26 -04 44 51 45 41 (86)
of Items 5 5 4 16 5 4 4 4
Mean 598 504 556 376 342 285 367 322
SD 071 94 102 71 110 104 73 81Note N = 65 Cronbachrsquos alpha reliabilities for each dimensionconstruct are listed in parentheses on diagonal Cronbachrsquos Alpha measures indicated a high internal consistency among the items reflected in each scale p lt 05 level (two-tailed) p lt 01 level (two-tailed)
Table 2 Descriptive Statistics and Correlations among Responses of the Total Tolerance of
Ambiguity Scale Langer Mindfulness Scale and Resistance to ChangeLMS_Tot Mean TOA_Tot Mean RTC_Tot Mean
LMS_MeanTotal (86)
TOA_Meantotal -53 (72)
RTC_Meantotal -53 62 (93)Number of items 14 16 17Mean 552 376 301Standard Deviation 75 71 91Note N = 65 Cronbachrsquos alpha reliabilities for each dimensionconstruct are listed in parentheses on diagonal No subscales for Tolerance of Ambiguity were referenced in research Cronbachrsquos Alpha measures indicated a high internal consistency among the items reflected in each scale p lt 05 level (two-tailed) p lt 01 level (two-tailed)
Table 3 Descriptive Statistics and Correlations among Responses Related to Operational and
Demographic Factors Tolerance of Ambiguity Scale Langer Mindfulness Scale and Sub-scales and Resistance to Change and Subscales
ME
AN
SD AG
E
YR
SWR
K
DR
RPT
S
TO
A_M
LMS_
M
LMS_
NS
LMS_
NP
LMS_
E
RT
C_M
RT
C_R
S
RT
C_E
R
RT
C_S
TF
RT
C_C
R
AGE 4571 782 100YRSWRK 1283 943 52 100DRRPTS 1005 2162 -18 01 100TOA_M 376 71 15 11 -02 100LMS_M 552 75 -07 -07 10 -53 100LMS_NS 598 71 -12 -12 04 -48 87 100LMS_NP 504 94 -05 01 18 -53 90 76 100LMS_E 556 102 -01 -10 01 -32 78 49 51 100RTC_M 322 81 -14 -10 -08 62 -53 -51 -48 -37 100RTC_RS 301 91 -13 -07 -04 65 -55 -51 -50 -41 90 100RTC_ER 342 110 -23 -17 -07 41 -43 -36 -37 -36 90 71 100RTC_STF 285 104 -05 00 -06 60 -54 -53 -47 -38 91 77 80 100RTC_CR 367 73 -07 -08 -14 44 -23 -28 -26 -04 65 51 45 41 100
Note N = 65 The correlation coefficient ranges from -1 to +1 with -1 indicating a perfect negative correlation +1 indicating a perfect positive correlation and 0 indicating no correlation
Brian Dunican amp Ric Keaster Acceptance of Change Exploring the Relationship among Psychometric Constructs and Employee Resistance
36 International Journal of the Academic Business World 37Fall 2015 (Volume 9 Issue 2)
erate positive correlation r(65) = 624 p lt001 Further bivariate analyses for LMS explored the strength of the re-lationships between the subscales of the Langer Mindful-ness Scale and the subscales of the Resistance to Change scales The correlational analysis was statistically signifi-cant between all variables except Engagement of the LMS and Cognitive Rigidity of RTC r(63) = -35 p = 781 concluding that the variables were unrelated
The last research question explored the degree of the re-lationship between Mindfulness and Tolerance of Am-biguity Bivariate analyses were used to correlate the re-lationship between the two psychometric constructs The correlations revealed a significantly strong negative rela-tionship between the total mean score of the LMS and the total mean score of the TOA r(63) = -53 p lt 01 The mean scores for each of the LMS subscales compared to the total mean of the TOA showed the following Nov-elty-seeking and TOA r(63) = -48 p lt 01 Novelty-pro-ducing and TOA r(63) = -53 p lt 01 and Engagement and TOA r(63) = -32 p lt 01 It is important to note that higher scores on the Tolerance of Ambiguity scale indicate a greater intolerance of ambiguity Tables 1 and 2 display a descriptive analysis and correlations for each of the scales and subscales The correlations between vari-ables are presented in Table 3
LIMITATIONS OF THE STUDY
Research inherently contains limitations The current study is no exception First the nature of measuring psy-chometrics is subjective Since psychometrics studies mea-sure the way in which individuals think and act (Norton 1975) influences of the organizationrsquos environment could affect individualsrsquo responses to questions Additionally external variables at the time of data collection not related to the study itself can skew the responses and influence the outcomes Other views of limitation rest on the gen-eralizability of the results which may be limited for the following reasons (a) the unit of analysis is at the indi-vidual level (b) data were collected from a limited num-ber of operations within the state of Kentucky through convenience sampling and (c) individual biases that may be introduced at the time of testing
The unit of analysis for data collection rests at the indi-vidual level rather than the group level due to the acces-sibility of the employees Although the survey collection method allows for comparison with larger groups it lim-its the opportunity to explore issues in depth therefore assumptions are made for individuals in similar groups Next the data collected represents limited industries in the state of Kentucky restricting the number of partici-pants and the ability to generalize outcomes to other in-dustries different than those outlined in the current study
Last respondentsrsquo values interests and beliefs regarding the online self-administered surveys may introduce biases unknown by the researcher As a consequence of these limitations and the collection of data during one point in time the results are generalizable only to the groups or populations that are similar to those in the current study
SUMMARY AND CONCLUSION
Change within organizations is inevitable That real-ity will remain constant in organizationsmdashand in onersquos personal and professional life (Conner 1992) The way in which one chooses to cope with change could be a decid-ing factor of success failure or choosing to remain the samemdashwhich in organizations tends to equate with fail-ure particularly if change means simply improving Resis-tance is a natural reaction to change and is part of the hu-man psyche Research and literature support this notion of human nature to resist change and elements related to the process of change (Coch amp French 1948 Conner 1992 Oreg 2003 OrsquoToole 1995 Zander 1950) It is possible that a greater understanding of mindfulness and tolerance of ambiguity could increase the possibilities of new ideas to drive lower resistance to change The current study explored the two psychometric constructs of mind-fulness and tolerance of ambiguity and their relationship to resistance to change within industrial settings Bivari-ate correlations yielded both strong positive and negative correlations among the three scales assessed by salaried employees located across different industries The Langer Mindfulness Scale Budnerrsquos Tolerance of Ambiguity Scale and Oregrsquos Resistance to Change scale were attrib-uted to the foundation of the current study The results contributed to the practical and theoretical significance of individualsrsquo responses to change through the measure-ment of the aforementioned constructs To the extent the findings in the current research could be extrapolated to other industries or organizations a final suggestion should be noted When considering future directions for research related to probing psychometric constructs and resistance to change the current study may have relevance across different nationalities and cultures The elements of change will continue to challenge the fabric of organiza-tions while the internal and external pressures of rising costs variations in supply and demand relentless compe-tition and developing technology test the resolve for sur-vival The readiness of individuals within organizations and their ability to challenge perceptions of change and resistance may determine their competitiveness and ulti-mately their success
REFERENCES
Argyris C amp Schon D (1978) Organizational learning A theory of action research Reading MA Addison-Wesley
Armbruster H Bikfalvi A Kinkel S amp Lay G (2008) Organizational innovation The challenge of measur-ing non-technical innovation in large-scale surveys Technovation 28(10) 644-657
Armenakis A A amp Bedeian A G (1999) Organiza-tional change A review of theory and research in the 1990s Journal of Management 25 293-315
Armenakis A A Harris S G amp Mossholder K W (1993) Creating readiness for organizational-change Human Relations 46(6) 681-703
Banning K C (2003) The effect of the case method on tolerance for ambiguity Journal of Management Edu-cation 27 556-567
Bodner T E amp Langer E J (2001 June) Individual differences in mindfulness The MindfulnessMind-lessness Scale Poster presented at the 13th annual American Psychological Society Conference Toronto Ontario Canada
Bovey W H amp Hede A (2001) Resistance to organisa-tional change The role of defence mechanisms Journal of Managerial Psychology 16(7) 534-548
Brown K W amp Ryan R M (2003) The benefits of be-ing present Mindfulness and its role in psychological well-being Journal of Personality and Social Psychol-ogy 84 822-848 doi1010370022-3514844822
Brown K W amp Ryan R M (2004) Perils and promise in defining and measuring mindfulness Observations from experience Clinical Psychology Science and Practice 11(3) 242-248 doi101093clipsybph078
Budner S (1962) Intolerance of ambiguity as a personal-ity variable Journal of Personality 30 29-59
Burke W W (2014) Organizational change theory and practice Thousand Oaks CA Sage Publications Inc
Carson S H amp Langer E J (2006) Mindfulness and self-acceptance Journal of Rational-emotive and Cog-nitive-behavior Therapy 24(1) 29-43
Coch L amp French J (1948) Overcoming resistance to change Human Relations 1 512-532
Coghlan D (1993) A person-centred approach to deal-ing with resistance to change Leadership amp Organi-zation Development Journal 14(4) 10-14
Cohen J (1988) Statistical power analysis for the behav-ioral sciences Hillsdale NJ Lawrence Erlbaum Associates
Conner D R (1992) Managing at the speed of change How resilient managers succeed and prosper where others fail New York Random House
Demers C (2007) Organizational change theories Thousand Oaks CA Sage Publications Inc
Dent E B amp Goldberg S G (1999) Resistance to change A limiting perspective Journal of
Ehrlich S B Meindl J R amp Viellieu B (1990) The charismatic appeal of a transformational leader An empirical case study of a small high-technology con-tractor The Leadership Quarterly 1(4) 229-247
Ford J D Ford L W amp McNamara R T (2002) Re-sistance and the background conversations of change Journal of Organizational Change Management 15(2) 105-121
Frenkel-Brunswik E (1948) Tolerance toward ambigu-ity as a personality variable American Psychologist 3 268-269
Furnham A amp Ribchester T (1995) Tolerance of am-biguity A review of the concept its measurement and applications Current Psychology 14 179-199
Gaumlrtner C (2013) Enhancing readiness for change by enhancing mindfulness Journal of Change Manage-ment 13 52-68
Geller E S (2002) Leadership to overcome resistance to change It takes more than consequence control Jour-nal of Organizational Behavior Management 22(3) 29-49
Gondo M Patterson K W amp Palacios S (2013) Mind-fulness and the development of a readiness for change Journal of Change Management 13(1) 36-51
Greenwood R amp Hinings C R (1996) Understanding radical organizational change Bringing together the old and the new institutionalism Academy of Manage-ment Review 21 1022-1054
Isabella L (1990) Evolving interpretations as a change unfolds How managers construe key organization-al events Academy of Management Journal 33 7-41
Iverson R D (1996) Employee acceptance of organiza-tional change The role of organizational commitment International Journal of Human Resource Manage-ment 7 122-149
Jacobs P (2005) Five steps to thriving in times of un-certainty Harvard Management Update 10(12) 3-5
Brian Dunican amp Ric Keaster
38 Fall 2015 (Volume 9 Issue 2)
Retrieved from httphbrorgproductfive-steps-to-thriving-in-times-of-uncertaintyanU0512A-PDF-ENG
Judge T A Thoresen C J Pucik V amp Welbourne T M (1999) Managerial coping with organization-al change A dispositional perspective Journal of Ap-plied Psychology 84 107-122
Judson A (1991) Changing behavior in organizations Minimizing resistance to change Cambridge MA Basil Blackwell
Kanter R M (1985) Supporting innovation and ven-ture development in established companies Journal of Business Venturing 1 47-60
Kets de Vries M F R Ramo L amp Korotov K (2009) Organizational culture leadership change and stress INSEAD Working Papers Collection 10 2-26 Re-trieved from httpwwwinseadedufacultyresearchresearchdoccfmdid=41924
Kotter J P (1995) Leading change Why transformation efforts fail Harvard Business Review 73(2) 59-67
Lane M S amp Klenke K (2004) The ambiguity toler-ance interface A modified social cognitive model for leading under uncertainty Journal of Leadership amp Organizational Studies 10(3) 69-81
Langer E J (1993) A mindful education Educational Psychologist 28 43-50
Langer E J (1997) The power of mindful learning Read-ing MA Addison-Wesley
Lawrence P R (1954) How to deal with resistance to change Harvard Business Review 32(3) 49-57 Retrieved from httpedsaebscohostcomlib-srvwkueduehostpdfviewerpdfviewervid=6ampsid =699bab3d-bcec-40d9-ac69-a42c853d72bc40sessionmgr4004amphid=4108
Lewin K (1947) Frontiers in group dynamics II Chan-nels of group life social planning and action research Human Relations 1(2) 143-153
Lewin K (1951) Field theory in social science Selected theoretical papers New York Harper amp Row
Limerick D Passfield R amp Cunnington B (1994) Transformational change Towards an action learning organization The Learning Organization 1(2) 29-40
Mabin V J Forgeson S amp Green L (2001) Harness-ing resistance Using the theory of constraints to assist change management Journal of European Industrial Training 25(234) 168-191
Maurer R (2009) Introduction to change without mi-graines Omaha NE Maurer and Associates Re-trieved from httpextensionmissouriedustaffsde-teams DocumentsChangeW-outMigrarainespdf
Norton R W (1975) Measurement of ambiguity toler-ance Journal of Personality Assessment 39 607-619
Offermann L R amp Gowing M K (1990) Organiza-tions of the future Changes and challenges Ameri-can Psychologist 45(2) 95-108 doi10370003-066X45295
Oreg S (2003) Resistance to change Developing an in-dividual differences measure Journal of Applied Psy-chology 88 680-693
Oreg S (2006) Personality context and resistance to organizational change European Journal of Work and Organizational Psychology 15 73-101
Oreg S Vakola M amp Armenakis A (2011) Change re-cipientsrsquo reactions to organizational change A 60-year review of quantitative studies The Journal of Applied Behavioral Science 47 461-524
OrsquoToole J (1995) Leading change The argument for val-ues-based leadership Boston MA Ballentine Books
Pirson M Langer E J Bodner T amp Zilcha-Mano S (2012) The development and validation of the Langer Mindfulness Scale-Enabling a socio-cognitive perspec-tive of mindfulness in organizational contexts Ford-ham University School of Business Research Paper Re-trieved from httpdxdoiorg102139ssrn2158921
Stanley D J Meyer J P amp Topolnytsky L (2005) Employee cynicism and resistance to organizational change Journal of Business and Psychology 19(4) 429-459
Topping P (2002) Managerial leadership New York McGraw Hill Professional
Van Dam K Oreg S amp Schyns B (2008) Daily work contexts and resistance to organisational change The role of leader-member exchange development climate and change process characteristics Applied Psycholo-gy An International Review 57 313-334 doi101111j1464-0597200700311x
Weinstein N Brown K W amp Ryan R M (2009) A multi-method examination of the effects of mindful-ness on stress attribution coping and emotional well-being Journal of Research in Personality 43 374-385
Zander A F (1950) Resistance to change Its analysis and prevention Advanced Management 4(5) 9-11
International Journal of the Academic Business World 39
INTRODUCTION
Cloud computing is one of the most talked about infor-mation technology topics these days 7 24 Early literature review reveals an endemic confusion of what cloud com-puting is does and what it stands for We posit that the cloud metaphor 3 20 fosters a confusion that persists even today
The goal of this research paper is to look back and make historical sense of cloud computing We try to find the lineage of cloud computing where the phrase cloud com-puting came from who came up with the term and how it found currency in the IT community We trace cloud computing to early timesharing and Application Service Provider (ASP) in the last decade and posit a future of utility computing
Additionally we try to shed light on the current state of cloud computing provide a comprehensive definition of the term and its main building blocks
CLOUD COMPUTING IN THE ACADEMIC LITERATURE
A metaphor
In an article by Ian Foster and Steven Tuecke 3 the authors start by describing the well-known elephant fable where a group of blind people are asked to describe an elephant and not surprisingly each provides a different view
The cloud is a metaphor for the Internet Itrsquos a rebranding of the Internet that is why there is a raging debate By vir-tue of a metaphor itrsquos open to different interpretations 20
Confusion and Frustration
The word ldquocloudrdquo in cloud computing informs very little and it may even misinform ldquoI hated it but I finally gave inrdquo says Carl Bass President and CEO of Autodesk He adds ldquoI didnrsquot think the term helped explain anything to people who didnrsquot already know what it isrdquo20
Giving the lsquocloudrsquo name to the old concept of large shared distributed systems is misleading 4 p 26
Larry Ellison Oraclersquos CEO ldquoThe interesting thing about cloud computing is that wersquove redefined cloud computing everything that we already dohellipI donrsquot understand what we would do differently in light of cloud computing other than change the wording of some of our adsrdquo 1 p 50
In an article in Harvard Business Review (HBR) 22 the author asks a rhetorical question ldquoWhat the heck does it mean to have a lsquocloudrsquo It means that the functions you want like storage communications and applications donrsquot need to live on the device you have in front of you You can get them on demand from the networkrdquo We should ask the question ldquoin a typical non-cloud IS en-vironment do we really have the stated functions on the device in front of usrdquo
Cloud Computing is often confused with Utility Com-puting but they are not the samemdashrather the latter forms part of the former 2
No Definition
Realizing the elephantine nature of cloud computing there is a reluctance to define it Question How would you define cloud computing Answer Cloud computing
The Origin and Construct of Cloud Computing
Nozar Daylami PhD Adjunct Professor
School of Management Information System and Technology Program
California Lutheran University Thousand Oaks CA 91360
ABSTRACTCloud computing is one of the most talked about information technology topics these days A literature review reveals an endemic confusion of what cloud computing stands for This paper tries to shed light on why the term is so confusing We try to find where the phrase cloud computing came from and how it found currency in the IT community We trace cloud computing to early timesharing and Application Service Provider (ASP) in the last decade and posit a future of utility computing This paper also provides a comprehensive definition of the term and its main building blocks
Nozar Daylami The Origin and Construct of Cloud Computing
40 International Journal of the Academic Business World 41Fall 2015 (Volume 9 Issue 2)
is not so much a definition of a single term as it is a trend in service delivery taking place today 3 p 52
An Old Concept
Cloud computing is an old concept it ldquois a throwback to the mainframe model of computingrdquo 19 p 78 Clearly cloud computing is simply remote computing 4 p 26
Internet or Network Computing
Cloud computing as a term for Internet-based computing service was launched by industry giants Google Ama-zon etc in late 2006 24 ldquoIt is the movement of applica-tion services onto the Internet and the increased use of the Internethelliprdquo
The Earliest Publications
In the first article on Cloud Computing in the Communi-cations of ACM 9 it is referred to as ldquothe compute cloudrdquo and is deemed synonymous with ldquoon-demand comput-ing software as a service or the Internet as a platformrdquo Though these other naming conventions are self-explana-tory cloud computing is not
The cloud computing is understood as a shift of the ge-ography of computing It begs the question if it is about moving delivery of a wide variety of information services onto to the Internet why donrsquot we call it ldquoInternet Com-putingrdquo
The first time cloud computing showed up in a HBR pub-lication was in a digital article in April 2008 14 The au-thor states that the move to cloud computing would be disruptive to incumbent players of shrink-wrapped gam-ing software assuming his readers understand what cloud computing entails
A BRIEF HISTORY OF COMPUTING
In the early days of computers they were big and expen-sive So sharing this big expensive gadget was a normal practice Most organizations did not usually own this big machine but those who did had to share it across an en-terprise That was the era of timesharing
However as computers got cheaper and more afford-able every company every department and then finally every person decided to have their own computer How-ever standalone computers are of limited use So we networked them first locally in a Local Area Network (LAN) environment and then far and wide Wide Area
Network (WAN) Then we networked the network and the World Wide Web was born
At the same time in a different parallel universe some-thing else was happening In the early years no commer-cial off-the-shelf software (COTS) was available Every organization had to write its own software program So if you wanted to computerize your accounting general led-ger payables and receivables or run your inventory you had to write your own applications
Buying off-the-shelf applications was also considered ldquooutsourcingrdquo Why Because you were having others do the work for your organization which was supposed to be doing this work for itself So over the years most appli-cation development have been outsourced to burgeoning software companies such as IBM Oracle and SAP
OUTSOURCING AND ASP
In a general sense IS outsourcing is nothing newmdashit has always been considered an option for IT solutions 11 Electronic Data Systems was handling data processing services for Frito-Lay and Blue Cross as early as 1963 IS outsourcing soon became widely known as the second of a three-phase outsourcing phenomenonmdashtraditional out-sourcing being the first phase and application outsourcing being the third 6
In the early years of the last decade xSPs service provid-ers of all stripes were leading into a new generation of IT where it really did not matter where the applications reside as long as we had access to accomplish what we wanted 247 However back then an Application Service Provider (ASP) was thought by some to be another re-incarnation of the old ldquotimesharingrdquo leveraging network technologies 22
However the understanding of an evolving net-centric computing was already there In their book published in 2002 aptly titled NetSourcing authors Kern Lacity and Willcocks 7 define a computing framework and services stack thatrsquos similar to Cloud Computing The authors state ldquoWe selected the term ldquoNetsourcingrdquo as the over-arching name because the common element of any xSP is the delivery of a product or service over a networkrdquo (p 3) The ldquonetworkrdquo however is now synonymous with the ldquoInternetrdquo
Today cloud computing is about getting the job done in whatever way shape or form that may be required Orga-nizations and individuals need the utility of computing and where it comes from by and large is of no concern As early as 1961 Professor John McCarthy predicted that computation may someday be organized as a public utility ldquoEach subscriber needs to pay only for the capac-
ity he actually uses but he has access to all programming languages characteristics of a very large system hellip Certain subscribers might offer services to other subscribers hellip The computer utility could become the basis of a new and im-portant industry 8 McCarthyrsquos notion of ldquoutility comput-ingrdquo is here right nowmdashthat is ldquocloud computingrdquo
This point is confirmed by others 1 p 51 ldquoThe data center hardware and software is what we consider a cloud When a cloud is made available in a pay-as-you-go manner to the general public we call it utility computingrdquo
CLOUD COMPUTING ORIGIN OF THE PHRASE
Coinage of the term ldquocloud computingrdquo has been traced to two individuals who at the time they came up with this term worked for Compaq Computer George Favaloro a Compaq marketing executive and Sean OrsquoSullivan the founder of the now defunct business NetCentric 20
A Compaq internal document marked as confiden-tial dated November 14 1996 and provided by Sean OrsquoSullivan contemplates a Cloud Computing ldquostrat-egyrdquo10
But the creation of this term did not find currency for another decade Many believe the first use of ldquocloud com-
putingrdquo in its modern context occurred on August 9 2006 when then Google CEO Eric Schmidt introduced the term at an industry conference ldquoWhatrsquos interesting [now] is that there is an emergent new modelrdquo Schmidt said ldquoI donrsquot think people have really understood how big this opportunity really is It starts with the premise that the data services and architecture should be on servers We call it cloud computingmdashthey should be in a ldquocloudrdquo somewhererdquo 19
CLOUD COMPUTING DEFINITION
The National Institute of Standards and Technology (NIST SP 800-145) defines Cloud Computing in the fol-lowing way ldquoCloud computing is a model for enabling convenient on-demand network access to a shared pool of configurable computing resources (eg networks serv-ers storage applications and services) that can be rapidly provisioned and released with minimal management ef-fort or service provider interaction This cloud model is composed of five essential characteristics three service models and four deployment modelsrdquo 17
The following diagram places all the pieces together in a visual form
The Conceptual Reference Model
Cloud Computing Reference Architecture NIST Special Publication 500-292
Nozar Daylami The Origin and Construct of Cloud Computing
42 International Journal of the Academic Business World 43Fall 2015 (Volume 9 Issue 2)
Cloud Computing Reference Architecture NIST Special Publication 500-292
NIST Special Publication 500-292 states that ldquothe defini-tion is widely accepted as a valuable contribution toward providing a clear understanding of cloud computing tech-nologies and cloud services It provides a simple and un-ambiguous taxonomy of three service models available to cloud consumers cloud software as a service (SaaS) cloud platform as a service (PaaS) and cloud infrastructure as a service (IaaS) It also summarizes four deployment mod-els describing how the computing infrastructure that delivers these services can be shared private cloud com-munity cloud public cloud and hybrid cloudrdquo 18 Finally the NIST definition also provides a unifying view of five essential characteristics that all cloud services exhibit on-demand self-service broad network access resource pool-ing rapid elasticity and measured service 18
This publication further states that ldquoThese services and their delivery are at the core of cloud computing In the cloud computing model the primary focus is a more eco-
nomic method of providing higher quality and faster ser-vices at a lower cost to the usersrdquo
The Cloud Security Alliance 21 provides a more transpar-ent narrative of what Cloud Computing is ldquoa model for enabling ubiquitous convenient on-demand network access to [a] shared pool of configurable computing re-sources [it] has the potential to enhance collaboration agility scaling and availability and provides opportunity for cost-reduction the model envisages a world where components can be rapidly orchestrated provisioned implemented and decommissioned scaled up or down to provide an on-demand utility-like modelrdquo
A SPATIAL VIEW OF CLOUD COMPUTING
The NIST Computing Reference Architecture is a flat depiction of the cloud computing model A three dimen-sional view of the model by Craig-Wood 2 is a spatial de-piction Here you can see the three dimensions of cloud computing that renders the elephant fable
Computing Services Framework
Infrastructure as a Service (IaaS) As the word ldquoinfra-structurerdquo implies this is the most basic of services Cus-tomers can buy processing storage and network services and then build their own systems on top of this infra-structure A pioneer in the IaaS field is Amazon with its Amazon Elastic Compute Cloud (EC2)
However most big names in the IT field from Micro-soft (Azure) to Google (App Engine) provide IaaS Here customers are not renting specific servers hard drives and network switches or any particular equipment but instead they are utilizing the infrastructure that is most certainly simulated by virtualization software allowing multiple customers to be served by the same array of physi-cal devices IaaS provides the raw power of computingmdashstorage included
Cloud Computing would not be possible without virtu-alization Virtualization is the ability to make a virtual machine (VM) act like a physical computer Just like a physical computer with its own processor operating sys-tem and storage each VM has its own components too The benefit of virtualization though is that you can put much more than only one VM even with different oper-ating systems on the same server Doing so dramatically increases each serverrsquos potential for serving clientsrsquo on-demand needs (8)
Platform as a Service (PaaS) The next level up is where vendors provide not only the raw powermdashthe infrastruc-turemdashbut preconfigured systems running operating sys-tems databases and platforms (programming languages) for building applications For example Microsoftrsquos Azure service provides preconfigured computers running Win-dows and SQL Server And Salesforcecom has Forcecom as its own custom application development platform
In practice the boundary between IaaS and PaaS is not always clear Because IaaS providers most often provide other services such as operating systems database or ap-plication development platform that fall in the PaaS cat-egory In its purest form IaaS can be considered as virtual machines (raw processing power and storage) that can be scaled up and down as you need
Software as a Service (SaaS) Another higher layer is where vendors provide full applications running on cloud infrastructuremdashtheir own or rented from the likes of Amazon Salesforcecom has long been considered one of the most successful SaaS provider Salesforececom CRM was one of the early entrants into the market Salesforcecom prides itself on being a pioneer in Cloud Computing
At Salesforcecom itrsquos all about the Cloud However in their collateral literature dated circa 1993-94 you wonrsquot find any mention of the word ldquocloudrdquo
CLOUD COMPUTING CONCERNS
In survey after survey security is listed as the top concern of Cloud Computing However Cloud Security Alliance (CSA) the industry group that provides security guide-lines and education states that ldquosecurity controls for the cloud computing are for in most part no different than the security controls in any IT environment hellip[however] cloud computing may present different risks to an organi-zation than traditional IT solutionsrdquo 21 p 21
CIOs or CEOs for that matter may feel safer when they ldquoownrdquo versus ldquorentrdquo their IT assets However when you deploy your assets on the Internet for which you eventu-ally will have little choice you will inherit a set of vulner-abilities that are not all that different from the Cloudrsquos Ownership has its own set of financial risks in the form of capital expenditures (CAPEX) that need to be budgeted and spent up front Compare that risk with the far smaller risk of renting (OPEX) which by and large can be dis-continued if needed
Cloud computing technology does not require the use of public networks If your data is too strategically critical and sensitive to be deployed on the Internet you could instead deploy a private cloud that is strictly for your or-ganization Obviously a Private Cloud is more expensive and it needs trained staff However a private cloud lets an organization benefit from cloud technology without the risk of possible public disclosure of its data
Another alternative could be a community cloudmdasha pri-vate cloud that is shared by several organizations for spe-cific needs For example a group of hospitals might create a community cloud to hold patientrsquos medical records
CONCLUSION
Cloud Computing is here to stay and grow Clouds are more versatile than traditional IT networks on many di-mensions They are far more convenient to deploy they have far more potential for collaboration and they are far more scalable than traditional IT ever was The delivery of services is provisioned on global telecommunication net-works that these days have morphed into the Internet And when they mature they will provide a computing utility when and where it is needed
Cloud computing model (adapted from Craig-Wood)
Nozar Daylami The Origin and Construct of Cloud Computing
44 International Journal of the Academic Business World 45Fall 2015 (Volume 9 Issue 2)
BIBLIOGRAPHY
1 Armburst M et al A View of Cloud Computing Communications of the ACM Vol 53 No 4 pages 50-58
2 Craig-Wood K Definition of Cloud Computing incorporating NIST and G-Cloud views httpswwwkatescommentcomdefinition-of-cloud-com-puting-nist-g-cloud Access date April 26 2015
3 Creeger M CTO Roundtable Cloud Computing Communications of the ACM Vol 52 No 8 pages 50-56
4 Cusumano M Cloud Computing and SaaS as New Computing Platforms Communications of the ACM Vol 53 No 4 pages 27-29
5 Foster Ian and Tuecke Steven Describing the Ele-phant The Different Faces of IT as Service wwwac-mqueuecom JulyAugust 2005 pages 26-34 httpdeliveryacmorg10114510900001080874p26-fosterpdf ip=99100108167ampid=1080874ampacc=OPENampkey=4D4702B0C3E38B352E4D4702B0C3E38B352E4D9421298D07BF362E6D218144511F3437ampCFID=505172814ampCFTOKEN=56369758amp__acm__=1429816554_402a40f1d60056fb68e8ccf3fdd96201 accessed April 23 2015
6 Kern Thomas Lacity Mary Cecelia Willcocks Leslie P Netsourcing Renting Business Applica-tions and Services Over a Network Prentice Hall 2002
7 Knoblauch A Deconstructing Cloud Smashwords Edition (Kindle Version) First Edition August 2013
8 Garfinkel Simon (2011 Oct 3) The Cloud Imperative MIT Technology Review httpwwwtechnologyreviewcomnews425623the-cloud-imperative
9 Hayes B Cloud Computing Communications of the ACM Vol 51 No 7 pages 9-11
10 Internet Solution Division Strategy for Cloud Com-puting Compaq Computer Corporation (1996) httpwwwtechnologyreviewcomsitesdefaultfileslegacycompaq_cst_1996_0pdf
11 Lacity M C Hirschheim R Information Systems Outsourcing Myths Metaphors and Realities New York John Wiley amp Sons 1993
12 McAfee A The Year the Cloud Rolled In httpshbrorg2010122010-the-year-the-cloud-rolled Access date April 23 2015
13 McAfee A What Every CEO Needs to Know About the Cloud httpshbrorg201111what-every-ceo-needs-to-know-about-the-cloud Access date April 23 2015
14 McGrath R Whorsquos Disrupting the Gaming Indus-try httpshbrorg200804whos-disrupting-the-gaming-ind Access date April 23 2015
15 Mell P Grance T The NIST Definition of Cloud Computing National Institute of Standards and Technology httpcsrcnistgovpublicationsnist-pubs800-145SP800-145pdf
16 Neumann P Risks and Myths of Cloud Comput-ing and Cloud Storage Communications of the ACM Vol 57 No 10 pages 25-27 The NIST Defi-nition of Cloud Computing httpcsrcnistgovpublicationsnistpubs800-145SP800-145pdf
17 NIST Definition of Cloud Computing httpcsrcnistgovpublicationsnistpubs800-145SP800-145pdf
18 NIST Cloud Computing Reference Architecture National Institute of Standards and Technology Special Publication 500-292 httpwwwnistgovcustomcfget_pdfcfmpub_id=909505
19 Nanavati M Colp P Aiello W and Warfield A Cloud Security A Gathering Storm Communica-tions of the ACM Vol 57 No 8 pages 70-79
20 Regalado Antonio (2011 Oct 31) Who coined cloud computing MIT Technology Review httpwwwtechnologyreviewcomnews425970who-coined-cloud-computing
21 Security Guidance for Critical Areas of Focus in Cloud Computing V30 Cloud Security Alliance httpscloudsecurityallianceorgguidancecsagu-idev30pd
22 Seviokla J Does Cisco Have Its Head in the Clouds httpshbrorg200903does-cisco-have-its-head-in-th Access date April 23 2015
23 Walsh K R Analyzing the Application ASP Concept Technologies Economies and Strategies Communications of ACM Vol 46 No 8 pages 103-107
24 Yang H Tate Mary A Descriptive Literature Review and Classification of Cloud Computing Re-search Communications of Association of Informa-tion Systems Vol 31 2012
Nozar Daylami
46 Fall 2015 (Volume 9 Issue 2)
This page intentionally blank
International Journal of the Academic Business World 47
INTRODUCTION
In their paper ldquoSAS and the Efficient Portfoliordquo Thomp-son and El-houbi (2012) develop a SAS program to calcu-late portfolio weights for efficient stock portfolios Their program improves on existing public domain SAS pro-grams of this type by allowing for portfolios with a rela-tively large number of securities Thompson and El-houbi also claim that their SAS program is an improvement over the Excel programs used to calculate portfolio weights which are sometimes included in investment textbooks They note that users concur that their program is easier to use than those Excel programs which either limit the number of securities that can be included in a portfolio require ldquocorrectionsrdquo or ldquoadjustmentsrdquo to overcome some quirks in the Excel Solver routine or require multiple user interventions
The Thompson and El-houbi program is certainly more elegant and user friendly than the equivalent Excel pro-grams and will provide those with access to the SAS pro-gramming language a valuable tool for learning portfolio management The disadvantage of a SAS program how-ever is that many students will not have easy access to the SAS programming language Students at smaller univer-sities may not have any access to SAS while students at many larger universities may only be able to access SAS at a computer lab on campus
In this paper I modify the Thompson and El-houbi SAS program for use in the open-source R programming lan-guage which is available free of charge for anyone with access to the internet Using the R language program to compute portfolio weights for efficient portfolios main-tains the elegance of the Thompson and El-houbi SAS
program while overcoming the disadvantage of limited SAS availability In addition I extend the Thompson and El-houbi program by making use of a quadratic program-ming package available in R to provide a program that can accommodate short-sale restrictions and position limits
THE R PROGRAMMING LANGUAGE
R is a free programming language for statistical analysis and graphics and runs on many UNIX platforms and on Windows and MacOS It is available under the terms of the Free Software Foundationrsquos GNU General Public License R was developed initially by Robert Gentleman and Ross Ihaka both of the University of Auckland (New Zealand) and is based on the S programming language developed at Bell Labs by John Chambers Since its initial development the popularity of R has grown considerably largely because of its ease of use and because of the avail-ability of many add-on packages that allow users to tackle very sophisticated projects
The base R package may be downloaded at httpcranusr-projectorg That web page also provides links to sources of information about R and basic user manuals There are also many books and manuals now available for purchase that offer information on both basic and special-ized uses of the language In fact Vance (2009) suggests that the growing popularity of the R language at univer-sities language could even result in noticeably lower de-mand for SAS
THE MARKOWITZ PORTFOLIO PROBLEM
As Markowitz (1952) notes an investor following the ldquoex-pected returns-variance of returns rulerdquo will choose an ef-
Optimal Portfolios and the R Programming Language
James A TurnerAssistant Professor of Finance
School of Accounting amp TaxationWeber State University
Ogden UT 84408
ABSTRACTThis paper develops a program in the freely available open-source R programming language to calculate weights for optimal stock portfolios The program retains the advantages the Thompson and El-houbi (2012) SAS program has over similar programs in Excel but avoids the potential problem of limited access to SAS that some students and researchers may face The R program also extends the Thompson and El-houbi program by including the ability to accommodate short-sale restrictions and position limits
James A Turner Optimal Portfolios and the R Programming Language
48 International Journal of the Academic Business World 49Fall 2015 (Volume 9 Issue 2)
ficient portfolio that is a portfolio with maximum ex-pected return for a given variance or one with minimum variance for a given expected return The minimum vari-ance formulation of the portfolio choice problem there-fore requires that the investor choose portfolio weights to minimize the variance of a portfolio with a given expected return The problem also requires that all money be in-vested (which means that the portfolio weights must sum to one) In matrix notation the optimization problem is
where w the choice variable is a k times 1 vector of the weights invested in the k securities in the portfolio V is the port-folio variance-covariance matrix and R is a 2 times k matrix whose first row is a vector of ones and whose second row contains the expected returns of each security in the port-folio M is a 2 times 1 vector whose first element is one (corre-sponding to the constraint that the portfolio weights sum to one) and whose second element is the chosen portfo-lio expected return For now there are no restrictions on short sales so some portfolio weights may be negative
The Lagrangian for the problem is
( ) L w Vw M Rwλprime prime= + minus
where λ is a 2 times 1 vector containing the Lagrangian multi-pliers The first-order conditions for a minimum (which are also sufficient conditions in this case) are
Solving the first-order conditions for w and λ yields
( )( )
11 1
112
w V R RV R M
RV R Mλ
minusminus minus
minusminus
prime prime=
prime=
Thompson and El-houbi following Stephens (1998) let 1 H RV Rminus prime= so that
1 1
1
2
w V R H MH Mλ
minus minus
minus
prime=
=
Stephens (1998 p 36) shows how the elements of the H matrix may be used ldquoto fix any meanvariance point on the efficient frontierrdquo
Min st
w VwRw M
prime
=
2 0
0
L Vw RwL M Rw
λ
λ
part prime= minus =partpart
= minus =part
THE BASIC R PORTFOLIO OPTIMIZATION PROGRAM
The R programming language lends itself very easily to matrix manipulation and matrix computation removing much of the difficulty in solving the standard Markowitz portfolio problem The following R program calculates the portfolio weights for an efficient portfolio using stock return data to estimate expected returns and the variance-covariance matrix The user must specify the desired port-folio expected return The program can accommodate portfolios up to about 50 stocks Beyond that number precision limitations of the R language may make the variance-covariance matrix ldquocomputationally singularrdquo and unable to be inverted
The first step in the program is to read in the return data R can input data from many file types but in the present example the data are stored in a comma-delimited Excel file called ldquoReturnscsvrdquo which contains stock return data In this case the Excel file includes a header row labeling each column of returns with identifying information but no row names The program first reads in the data and then determines the number of securities (number of col-umns in the matrix) as shown on the facing page
ADDING SHORT-SALE CONSTRAINTS AND POSITION LIMITS
The above formulation of the portfolio choice problem places no restrictions on short sales and does not accom-modate position limits In reality individual investors and some fund managers may face requirements prohibit-ing short sales Fund managers may also face requirements that either limit the amount that may be invested in one security or sector or instead that a minimum percentage of funds be invested in a certain security or sector Dai Lin and Liu (2011) list several examples of real-world po-sition limits such as a requirement that a small-cap mutu-al fund invest at least a minimum percentage of its funds in small-company stocks In mathematical terms these short-sale restrictions and position limits can be expressed as a series of inequality constraints While reformulating the portfolio choice problem to add inequality constraints is not difficult doing so makes actually solving the prob-lem considerably more difficult
With short-sale restrictions and position limits the port-folio choice problem becomes
0
Min st
w VwRw MSw w
prime
=ge
where w is still the choice variable S is an m times k matrix that defines both the short-sale constraints on the k se-curities in the portfolio and m minus k other restrictions If there are short-sale constraints but no other restrictions the S matrix is simply a k times k identity matrix which when multiplied by the vector w results in the requirement that
0 iw ige forall If there are other restrictions the sub-matrix of S consisting of the first k rows and k columns of S is an identity matrix and the other restrictions are specified by suitable choices of the elements of the remaining rows of S For example suppose there is a position limit placing a maximum of p on the percentage invested in the sev-enth security so that 7 w ple Since the constraints in the optimization problem above have been expressed as non-negativity constraints this position limit must instead take the form 7 w pminus ge minus The row of S corresponding to
the position limit will consist entirely of zeros except for the seventh element which will be minus1 and corresponding element of the w0 vector would be p
Introducing other forms of position limits simply requires adding the appropriate rows to the S matrix For example if there is a requirement that the total percentage invested in the first and third securities equal or exceed a certain percentage q then one row of S should be [1 0 1 0 0]and the corresponding element of the w0 vector would be q If there is instead a requirement that the total percentage invested in the first and third securities not exceed a cer-tain amount q the required row of S would be [-1 0 -1 0 0] and the corresponding element of the w0 vector would be minusq Other restrictions may be specified similarly For problems that include position limits each of the first k el-
The BASIC R Portfolio Optimation Program
Returns ltminus readtable(ldquoReturnscsvrdquo header = TRUE sep = ldquordquo)Rmat ltminus asmatrix(Returns) Converts the data to matrix formk ltminus ncol(Rmat) Number of columns (number of securities in the portfolio) Now the program calculates the estimate of the variance-covariance matrix (V) the M vector and the R matrix which includes the estimate of the expected returns
V ltminus var(Rmat) Calculates the sample variance-covariance matrix which is used as the estimate of the variance-covariance matrix
Erp ltminus 001 Sets the desired expected portfolio return The user can change this value as desired
M ltminus rbind(1 Erp) Ones ltminus rep(1 k) Ravg ltminus colMeans(Rmat)
Defines the M matrix including the required portfolio return Defines a 1 x k matrix of ones Calculates average returns by column giving a 1 x k matrix of estimated expected returns
R ltminus rbind(Ones Ravg) Combines Ones and Ravg into the 2 x k matrix R Finally the program calculates the portfolio weights and the portfolio variance
VINV ltminus solve(V) Calculates the inverse of the estimated variance-covariance matrixH ltminus RVINVt(R) Calculates the H matrixHINV ltminus solve(H) Calculates the inverse of Hw lt- VINVt(R)HINVM Calculates the portfolio weightsPvar lt- t(w)Vw Calculates the portfolio variance The following commands display the results of the calculations
print(w) Prints the elements of the w vectorprint(Pvar) Prints the variance of the portfolio formed using the weights w
James A Turner Optimal Portfolios and the R Programming Language
50 International Journal of the Academic Business World 51Fall 2015 (Volume 9 Issue 2)
ements of the w0 vector will be zero corresponding to the non-negativity constraints and the remaining elements will equal the percentages associated with the position limits entered as positive or negative numbers depend-ing on whether the position limits establish minimums or maximums
The Lagrangian for this problem is
( ) ( )0 L w Vw M Rw w Swλ microprime prime prime= + minus + minus
where λ is a 2 times 1 vector containing the Lagrangian multi-pliers on the equality constraints and micro is an m times 1 vector of the Lagrangian multipliers on the k short-sale constraints and the m ndash k position limits The first-order necessary con-ditions for this problem are the Kuhn-Tucker conditions
( )0 0
2 0
0
0 0 and 0
L Vw R SwL M Rw
L w Sw w Sw
λ micro
λ
micro micromicro
part prime prime= minus minus =partpart
= minus =partpart prime= minus le ge minus =part
The final set of conditions are known as the complementa-ry slackness conditions since if an element of partLpartμ does not equal zero (ie if the required condition is slack) then the corresponding element of micro must equal zero and vice versa Because of the complementary slackness conditions in order to find a solution to the optimization problem each condition must be checked individually to deter-mine the possible solutions If there are more than a very few constraints finding the candidate solutions manually becomes extremely tedious
Fortunately it is possible to use numerical methods to solve this type of non-linear programming program This is where the strength of the R programming language be-comes very evident The R language provides access to an extensive number of add-on packages developed by R us-ers around the world In particular there are several pack-ages that implement numerical methods to find solutions to optimization problems with inequality constraints Perhaps the package that most easily lends itself to solv-ing the current problem is the ldquoquadprogrdquo package Ac-cording to the documentation included with the pack-age the quadprog routine ldquoimplements the dual method of Goldfarb and Idnani (1982 1983) for solving qua-dratic programming problems of the form min(d΄b+frac12b΄Db)) with the constraints Aʹbgtb₀rdquo For the optimization problem currently under consideration the d vector will be a zero vector the b vector will be the w vec-tor of portfolio weights the D matrix will be the variance-
covariance matrix V and the matrix A΄ will equal a matrix formed by combining the R matrix and the S matrix such that A΄= [R
S ]and A = [ R΄ S΄] Since the V matrix is symmetric the term frac12b΄Db = frac12w΄Vw is a quadratic form Also because the d vector is a zero vector the presence of the frac12 term in the quadratic form does not change the value of the solution to the current portfolio optimization problem That is the weights that minimize frac12w΄Vw sub-ject to the constraints will also minimize w΄Vw subject to the constraints
THE R PORTFOLIO OPTIMIZATION PROGRAM WITH PACKAGE ldquoQUADPROGrdquo
The ldquoQuadprogrdquo package is one of many add-in packages available to R users To use add-in packages in R the user must first download and install the chosen package This is done through the ldquoPackagesrdquo command in the menu bar of the console window Selecting the ldquoInstall package(s)rdquo command from the drop-down box will bring up a list of download locations After selecting a download location the user selects the package(s) to download and install Finally once the selected package is downloaded and in-stalled it must be loaded for use in the current R session which is done by choosing ldquoPackagesrdquo command on the menu bar and then choosing the ldquoLoad packagerdquo com-mand from the drop-down box A list of available packag-es will then appear and the user should select the desired package in this case the ldquoquadprogrdquo package Once the quadprog package is loaded the following program will solve the portfolio problem with short-sale restrictions and position limits
In the present example the short-sale constraint requires that all elements of the w vector be non-negative In addi-tion there are three position limits The first position lim-it requires that no more than 5 of total funds be invested in the seventh security The second position limit requires that no more than a total of 40 of available funds be in-vested in the first and third securities The third position limit requires that total of at least 30 of available funds be invested in the second and fourth securities
The program will make use of the M matrix and the vari-ance-covariance matrix V from the earlier program so those variables must be saved by the user or the following program must be run after running the previous program and before exiting R The new program first sets the posi-tion limits as shown on the facing page
The output of the ldquosolveQPrdquo function includes the values of w and the Lagrangian multipliers for each constraint If the value of a Lagrangian multiplier is zero the constraint associated with that multiplier is not binding otherwise the constraint is binding Though checking the values of
the Lagrangian multipliers allows the user to determine which constraints are binding quite easily the functionrsquos output also includes a listing of the binding constraints by index number
The R Portfolio Optimization Program with Package ldquoQuadprogrdquo
npl ltminus 3 Sets the number of position limits The user sets this value
plmat ltminus matrix (rep(0 nplk) nrow=npl ncol=k) Initializes the matrix that will be used to define the position limit(s)
plmat[17] = -1 Places the required elements into the proper places in the lmat[21] = plmat[23] = -1 position limits matrix In this example the first position
plmat[32] = plmat[34] = 1 limit will set a maximum on the total percentage invested in the seventh security The second position limit will set a maximum on the total percentage invested in the first and third securities The third position limit will set a minimum on the total percentage invested in the second and fourth securities
pl ltminus c(-005 -04 03) Sets the values of the position limits The value the user enters should be positive if the position limit specifies a inimum and should be negative if the position limit specifies a maximum
Next the inequality constraints are placed in matrix form
S ltminus rbind(diag(k) plmat) Defines the S matrix
w0 ltminus c(rep(0 k) pl) Creates a vector whose elements are the values of the inequality constraints
Next the arguments required by the solveQP function that solves the programming problem are defined and the programming problem is solved
dvec ltminus rep(0 k) Defines the d vector which is a necessary input for the quadprog package For portfolio optimization problems the elements of the d vector will all be zeros
Amat ltminus colbind(t(R) t(S)) Forms the Amat matrix
bvec ltminus c(M w0) Joins the M matrix and the w0 matrix to form the bvec vector
ICSol ltminus solveQP(V dvec Amat bvec meq=2) Solves the quadratic programming problem The argument meq specifies that the first two constraints are equality constraints In this example the equality constraints are that the weights sum to one and that the portfolio expected return equal a specified amount
print(c(ICSol[1] 2ICSol[[2]] ICSol[5] ICSol[6])) Prints selected output from the solve QP function the weights the portfolio variance the values of the Lagrangian multipliers and the index numbers of the binding constraints
James A Turner Optimal Portfolios and the R Programming Language
52 International Journal of the Academic Business World 53Fall 2015 (Volume 9 Issue 2)
CONCLUSION
This paper provides an R language program to calculate portfolio weights for efficient portfolios The program can also accommodate short-sale constraints and position limits Users must choose the desired portfolio expected return and must specify any other constraints A strong advantage of the program is that because the R program-ming language is freely available to anyone with access to the internet students and others who wish to use the pro-gram will be able to do so easily
REFERENCES
Dai Min Hanqing Jin and Hong Liu 2011 Illiquidity position limits and optimal investment for mutual funds Journal of Economic Theory 146 1598ndash1630
Goldfarb D and A Idnani 1982 Dual and primal-dual methods for solving strictly convex quadratic pro-grams In Hennart J P (ed) Numerical Analysis Springer-Verlag Berlin pages 77ndash91
Goldfarb D and A Idnani 1983 A numerically stable dual method for solving strictly convex quadratic pro-grams Mathematical Programming 27 1ndash33
Ihaka Ross A free software project Retrieved May 7 2013 from httpcranr-projectorgdochtmlinter-face98-paperpaper_2html
Markowitz Harry 1952 Portfolio selection Journal of Finance 7 77ndash91
Stephens Alan 1998 Markowitz and the spreadsheet Journal of Financial Education 35ndash43
Thompson Thomas H and Ashraf El-houbi 2012 SAS and the efficient portfolio International Research Jour-nal of Applied Finance 3 315ndash327
Turlach Berwin A 2013 quadprog Functions to solve quadratic programming problems R pack-age version 15-5 httpCRANR-projectorgpackage=quadprog (S original by Berwin A Turlach R port by Andreas Weingessel)
Vance Ashlee 2009 Data analysts captivated by Rrsquos power The New York Times Retrieved May 1 2013 from httpwwwnytimescom20090107tech nolog y busi ness-computi ng 0 7prog ra m htmlpagewanted=allamp_r=0
What is R Retrieved May 7 2013 from httpwwwr-projectorgabouthtml
APPENDIX 1 DATA
The data used in the R program come from the CRSP monthly stock file and consist of 60 months of return data from January 2008 to December 2012 The stocks in the 10-stock portfolio are the first 10 stocks in the CRSP monthly file (listed by PERMNO) for which 60 continuous months of returns are available The stocks in the 50-stock portfolio are the first 50 stocks for which 60 continuous months of returns are available Table 1 below lists the PERMNOS current company name and current ticker of the included stocks as well as the exchange where the stock trades
Table 1 Stocks in the Portfolio
NO PERMNO CURRENT COMPANY NAME TICKER EXCHANGE1 10001 GAS NATURAL INC EGAS AMEX2 10002 BANCTRUST FINANCIAL GROUP INC BTFG NASDAQ3 10025 A E P INDUSTRIES INC AEPI NASDAQ4 10026 J amp J SNACK FOODS CORP JJSF NASDAQ5 10032 PLEXUS CORP PLXS NASDAQ6 10044 ROCKY MOUNTAIN CHOCOLATE FAC INC RMCF NASDAQ7 10051 HANGER INC HGR NYSE8 10065 ADAMS EXPRESS CO ADX NYSE9 10100 AMERICAN LEARNING CORP NY ALRN NASDAQ
Table 1 Stocks in the Portfolio
NO PERMNO CURRENT COMPANY NAME TICKER EXCHANGE10 10104 ORACLE CORP ORCL NASDAQ11 10107 MICROSOFT CORP MSFT NASDAQ12 10138 T ROWE PRICE GROUP INC TROW NASDAQ13 10145 HONEYWELL INTERNATIONAL INC HON NYSE14 10147 E M C CORP MA EMC NYSE15 10180 AKORN INC AKRX NASDAQ16 10182 TECH DATA CORP TECD NASDAQ17 10200 REPLIGEN CORP RGEN NASDAQ18 10207 ROYCE FOCUS TRUST INC FUND NASDAQ19 10225 BEAM INC BEAM NYSE20 10232 ELMIRA SAVINGS BANK NY ESBK NASDAQ21 10239 BALDWIN amp LYONS INC BWINB NASDAQ22 10252 INDEPENDENT BANK CORP MA INDB NASDAQ23 10253 DOCUMENT SECURITY SYSTEMS INC DSS AMEX24 10257 D L H HOLDINGS CORP DLHC NASDAQ25 10258 CELLDEX THERAPEUTICS INC CLDX NASDAQ26 10259 SIGMA DESIGNS INC SIGM NASDAQ27 10294 HAVERTY FURNITURE COS INC HVT NYSE28 10297 NEW HAMPSHIRE THRIFT BNCSHRS INC NHTB NASDAQ29 10299 LINEAR TECHNOLOGY CORP LLTC NASDAQ30 10302 CYPRESS SEMICONDUCTOR CORP CY NASDAQ31 10308 TOMPKINS FINANCIAL CORP TMP AMEX32 10318 BALCHEM CORP BCPC NASDAQ33 10333 XOMA CORP XOMA NASDAQ34 10355 DAILY JOURNAL CORP DJCO NASDAQ35 10363 A M A G PHARMACEUTICALS INC AMAG NASDAQ36 10375 T C F FINANCIAL CORP TCB NYSE37 10382 ASTEC INDUSTRIES INC ASTE NASDAQ38 10395 NAVIGATORS GROUP INC NAVG NASDAQ39 10397 WERNER ENTERPRISES INC WERN NASDAQ40 10421 SKYWEST INC SKYW NASDAQ41 10443 PATRIOT TRANSPORTATION HLDG INC PATR NASDAQ42 10463 RESEARCH FRONTIERS INC REFR NASDAQ43 10501 AMERICAN WOODMARK CORP AMWD NASDAQ44 10507 MEDICAL ACTION INDS INC MDCI NASDAQ45 10514 TRANS WORLD ENTERTAINMENT CORP TWMC NASDAQ46 10516 ARCHER DANIELS MIDLAND CO ADM NYSE47 10517 AARONS INC AAN NYSE48 10530 MERIDIAN BIOSCIENCE INC VIVO NASDAQ49 10547 CLEARFIELD INC CLFD NASDAQ50 10550 PRO DEX INC COLO PDEX NASDAQ
James A Turner Optimal Portfolios and the R Programming Language
54 International Journal of the Academic Business World 55Fall 2015 (Volume 9 Issue 2)
APPENDIX 3 RESULTS FOR THE 10-STOCK PORTFOLIO
Results for the 10-stock portfolio with a monthly expect-ed return of 1 are shown at the top of the facing page First shown is the variance-covariance matrix (V) fol-lowed by its inverse (V-1)
Table 2 shows the return averages of each stock and the calculated portfolio weights both for the portfolio with no short-sale constraints or position limits and the port-folio with short-sale constraints and three position limits (1) a requirement that the percentage invested in the sev-enth security not exceed 5 (2) a requirement that the
total percentage invested in the first and the third securi-ties not exceed 40 and (3) a requirement that the total percentage invested in the second and fourth securities be at least 30 Note that when short-sale constraints and position limits are imposed there may no longer be a port-folio that meets all the constraints that is the feasible set may be null In that case the R program will return an error message stating that the constraints are inconsistent
Table 3 lists the inequality constraints and the associ-ated Lagrangian multipliers along with an indication of whether the constraint is binding In this example the constraint that there be a minimum of 30 invested in the second and fourth securities is not binding
APPENDIX 2 COPY OF THE FULL PROGRAM
The full program is shown below without comments Users can easily copy the program that is between the solid lines and paste it into the R Editor window It will probably be necessary for each user to change the name of the data file in the readtable command Also the user can change the portfolio expected return and the number type and value of the inequality constraints as desired
Returns ltminus readtable(ldquoReturnscsvrdquo header = TRUE sep = ldquordquo) Rmat ltminus asmatrix(Returns) k ltminus ncol(Rmat) V ltminus var(Rmat) Erp ltminus 001 M ltminus rbind(1 Erp) Ones ltminus rep(1 k) Ravg ltminus colMeans(Rmat) R ltminus rbind(Ones Ravg) VINV ltminus solve(V) H ltminus RVINVt(R) HINV ltminus solve(H) w lt- VINVt(R)HINVM Pvar lt- t(w)Vw print(w) print(Pvar) npl ltminus 3 plmat ltminus matrix (rep(0 nplk) nrow=npl ncol=k) plmat[17] = -1 plmat[21] = plmat[23] = -1 plmat[32] = plmat[34] = 1 pl ltminus c(-005 -04 03)S ltminus rbind(diag(k) plmat) w0 ltminus c(rep(0 k) pl) dvec ltminus rep(0 k) Amat ltminus cbind(t(R) t(S)) bvec ltminus c(M w0) ICSol ltminus solveQP(V dvec Amat bvec meq=2) print(c(ICSol[1] 2ICSol[[2]] ICSol[5] ICSol[6]))
1
2867001 161224 279311 153314 408660 148438 131874 246057 83608 740152
161224 321169 23967 251277 39387 55190 33449 107899 36378 39718
279311 23967 991158 109233 189872 100249 22208 119
V minus
minus minus minus
minus minus minus minus
minus minus minus minus
=
6782 41342 198294
153314 251277 109233 2757210 319797 03010 139907 969199 56520 416534
408660 39387 189872 319797 977494 325171 247388 1098965 26657 04097
148438 55190 100249 03010 325171 1
minus minus minus minus minus
minus minus minus minus minus minus
minus 644368 311333 1803329 91576 428583
131874 33449 22208 139907 247388 311333 1093506 426730 100681 162364
246057 107899 1196782 969199 1098965 1803329 426730 11640904 233195 3789283
8360
minus minus
minus minus minus minus minus minus minus
minus minus minus minus minus minus
8 36378 41342 56520 26657 91576 100681 233195 138635 73382
740152 39718 198294 416534 04097 428583 162364 3789283 73382 3685519
minus minus
minus minus minus minus minus minus
00046 00019 00002 00006 00035 00004 00011 00008 00018 00019
00019 00364 00013 00037 00002 00004 00003 00001 00100 00007
00002 00013 00161 00024 00076 00035 00013 00041 00038 00033
00006 0
V
minus minus minus minus
minus minus minus minus
minus minus
=
0037 00024 00058 00051 00010 00016 00021 00028 00029
00035 00002 00076 00051 00217 00009 00048 00052 00024 00064
00004 00004 00035 00010 00009 00087 00018 00022 00027 00012
00011 00003 00013 000
minus
minus minus
minus minus minus
16 00048 00018 00113 00013 00055 00018
00008 00001 00041 00021 00052 00022 00013 00033 00003 00034
00018 00100 00038 00028 00024 00027 00055 00003 00850 00020
00019 00007 00033 00029 00064 00
minus
minus minus minus minus minus minus minus minus
012 00018 00034 00020 00068minus
Table 2 Average Returns and Weights for the Ten-
Stock Portfolios
Stock No Permno
Average Returns
Weights (SS
Allowed)IC Weights
(No SS 3 PLs)
1 10001 00064 03817 034062 10002 -00054 00311 004063 10025 00183 00908 005944 10026 00156 02525 026255 10032 00095 -01410 000006 10044 00012 00649 013797 10051 00206 01000 005008 10065 00018 01933 004929 10100 00270 00422 0056810 10104 00104 -00155 00031
Table 3 Constraints and Lagrangian Multipliers
Constraint Lagrangian Multiplier
Constraint Binding
Portfolio weights sum to one 00015 Yes
Portfolio expected return equals 1 00443 Yes
w1 ge 0 00000 No w2 ge 0 00000 No
w3 ge 0 00000 No
w4 ge 0 00000 No
w5 ge 0 00015 Yes
w6 ge 0 00000 No
w7 ge 0 00000 No
w8 ge 0 00000 No
w9 ge 0 00000 No
w10ge 0 00000 No
w7 le 005 00003 Yes
w1 + w3 le 04 00002 Yes
w2 + w4 ge 03 00000 No
James A Turner Optimal Portfolios and the R Programming Language
56 International Journal of the Academic Business World 57Fall 2015 (Volume 9 Issue 2)
The portfolio variances are
No short-sale constraints 0001607 Short-sale constraints and three position limits 0001856
APPENDIX 4 RESULTS FOR THE 50-STOCK PORTFOLIO
Results for the 50-stock portfolio with a monthly ex-pected return of 1 are shown in Table 4 below The first table shows the return averages of each stock and the cal-culated portfolio weights both for the portfolio with no short-sale constraints or position limits and the portfolio with short-sale constraints and three position limits (1) a requirement that the percentage invested in the seventh security not exceed 5 (2) a requirement that the total percentage invested in the first and the third securities not exceed 40 and (3) a requirement that the total percent-age invested in the second and fourth securities be at least 30
Table 5 shows the Lagrangian multipliers on the equal-ity constraints and the position limit constraints To save space for the 50-stock portfolio the Lagrangian multi-pliers on the short-sale constraints are not listed Simply checking Table 4 to see if the weight on a particular stock is zero gives an almost certain indication of which short-sale constraints are binding In this example both the constraint that there be no more than 5 invested in the seventh security and the constraint that there be no more than a total of 40 invested in the first and third securi-ties are not binding
Table 4 Average Returns and Weights for the
50-Stock PortfoliosStock
No Permno Average Returns
Weights SS Allowed
IC Weights No SS 3 PLs
1 10001 00064 01934 013072 10002 -00054 -00179 003673 10025 00183 -00189 000004 10026 00156 02873 026335 10032 00095 00503 000006 10044 00012 -00185 000007 10051 00206 -00136 002288 10065 00018 10920 000009 10100 00270 00306 00423
10 10104 00104 01467 0000011 10107 -00001 -02023 00000
Table 4 Average Returns and Weights for the
50-Stock PortfoliosStock
No Permno Average Returns
Weights SS Allowed
IC Weights No SS 3 PLs
12 10138 00085 -05619 0000013 10145 00065 -03910 0000014 10147 00088 -02693 0000015 10180 00290 -00290 0000016 10182 00076 01181 0000017 10200 00082 01409 0040918 10207 00020 -01551 0000019 10225 00098 00285 0000020 10232 00159 -00021 0000021 10239 00051 01624 0000022 10252 00084 00955 0000023 10253 00058 00121 0000024 10257 -00008 -00236 0000025 10258 00196 -00157 0000026 10259 -00300 -01339 0000027 10294 00179 -00414 0000028 10297 00061 01854 0146729 10299 00074 00826 0000030 10302 00165 00201 0000031 10308 00073 01255 0014132 10318 00194 -01389 0000033 10333 -00203 -00205 0000034 10355 00299 -00545 0036035 10363 -00151 -00167 0000036 10375 00010 -00495 0000037 10382 00046 00267 0000038 10395 -00022 00886 0042339 10397 00134 01296 0084940 10421 -00036 -01045 0000041 10443 00021 01389 0000042 10463 00013 00417 0000043 10501 00176 -00458 0000044 10507 -00228 -00397 0000045 10514 00100 00731 0007846 10516 -00034 -00148 0119247 10517 00208 00629 0000048 10530 00005 00032 0000049 10547 00418 00032 0012550 10550 -00028 00397 00000
The portfolio variances are
No short-sale constraints 000002997 Short-sale constraints and three position limits 000111119
Table 5 Constraints and Lagrangian Multipliers
Constraint Lagrangian Multiplier Constraint Binding
Portfolio weights sum to one 0000503 YesPortfolio expected return equals 1 0031954 Yes
w7 le 005 0000000 Now1 + w3 le 04 0000000 Now2 + w4 ge 03 0000963 Yes
James A Turner
58 Fall 2015 (Volume 9 Issue 2)
This page intentionally blank
JOINT CONFERENCE May 25th 26th and 27th 2016 in
Nashville TN
Academic Business World International Conference
(ABWICorg)
The aim of Academic Business World is to promote inclusiveness in research by offering a forum for the discussion of research in early stages as well as re-search that may differ from lsquotraditionalrsquo paradigms We wish our conferences to have a reputation for providing a peer-reviewed venue that is open to the full range of researchers in business as well as reference disciplines within the social sciences
Business Disciplines
We encourage the submission of manuscripts presentation outlines and ab-stracts pertaining to any business or related discipline topic We believe that all disciplines are interrelated and that looking at our disciplines and how they relate to each other is preferable to focusing only on our individual lsquosilos of knowledgersquo The ideal presentation would cross discipline borders so as to be more relevant than a topic only of interest to a small subset of a single disci-pline Of course single domain topics are needed as well
International Conference on Learning and Administration in
Higher Education (ICLAHEorg)
All too often learning takes a back seat to discipline related research The In-ternational Conference on Learning and Administration in Higher Educa-tion seeks to focus exclusively on all aspects of learning and administration in higher education We wish to bring together a wide variety of individuals from all countries and all disciplines for the purpose of exchanging experi-ences ideas and research findings in the processes involved in learning and administration in the academic environment of higher education
We encourage the submission of manuscripts presentation outlines and ab-stracts in either of the following areas
Learning
We encourage the submission of manuscripts pertaining to pedagogical top-ics We believe that much of the learning process is not discipline specific and that we can all benefit from looking at research and practices outside our own discipline The ideal submission would take a general focus on learning rather than a discipline-specific perspective For example instead of focusing on ldquoMotivating Students in Group Projects in Marketing Managementrdquo you might broaden the perspective to ldquoMotivating Students in Group Projects in Upper Division Coursesrdquo or simply ldquoMotivating Students in Group Projectsrdquo The objective here is to share your work with the larger audience
Academic Administration
We encourage the submission of manuscripts pertaining to the administra-tion of academic units in colleges and universities We believe that many of the challenges facing academic departments are not discipline specific and that learning how different departments address these challenges will be ben-eficial The ideal paper would provide information that many administrators would find useful regardless of their own disciplines
- Testing Major Factors for Reducing Obstacles to Product Innovation Success
-
- Dr Tor Guimaraes
- Dr Marcelo Seido Nagano
- Dr Curtis Armstrong
-
- Acceptance of Change Exploring the Relationship among Psychometric Constructs and Employee Resistance
-
- Brian Dunican EdD
- Ric Keaster PhD
-
- The Origin and Construct of Cloud Computing
-
- Nozar Daylami PhD
-
- Optimal Portfolios and the R Programming Language
-
- James A Turner
-
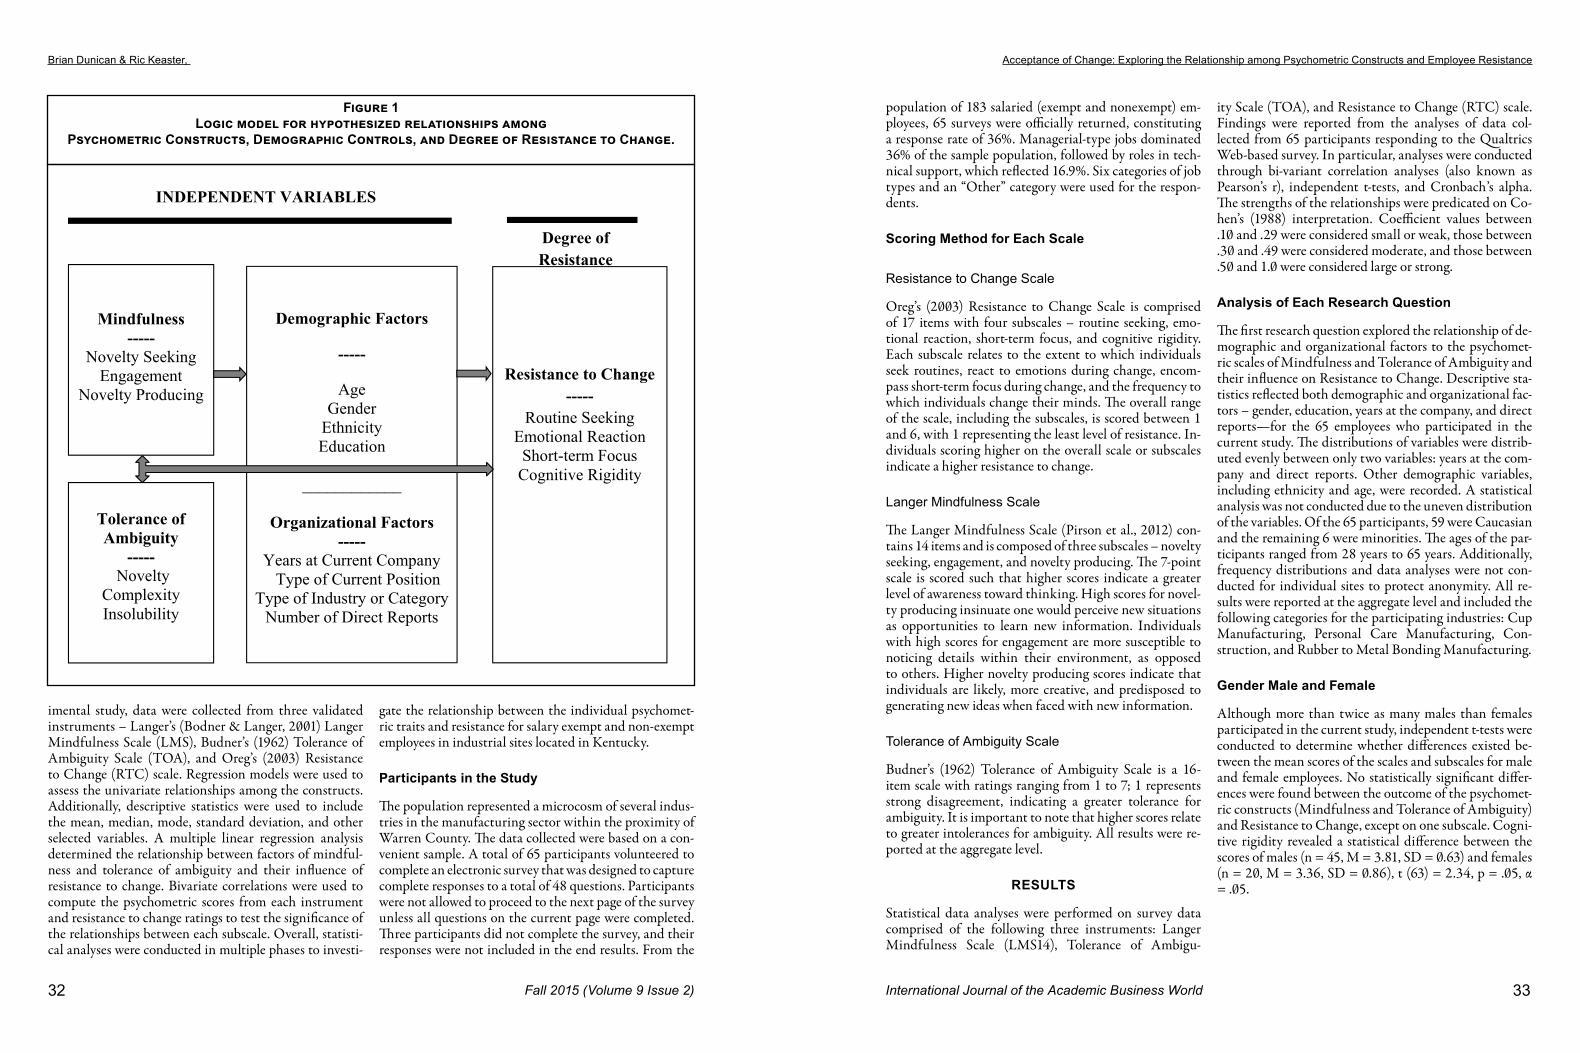
Brian Dunican amp Ric Keaster Acceptance of Change Exploring the Relationship among Psychometric Constructs and Employee Resistance
34 International Journal of the Academic Business World 35Fall 2015 (Volume 9 Issue 2)
Education
Due to the imbalanced distributions of participants sta-tistical analysis for Education was not performed The frequency distribution reflected that 5231 (34) of the participants possessed a four-year degree 1231 (8) ob-tained a masterrsquos degree or higher 2615 (17) possessed a two-year degree or some college while the reaming 923 (6) were high school graduates
Direct Reports and No Direct Reports
An individual variances t-test was conducted and failed to reveal a statistically reliable difference between the mean scores of salaried employees without direct reports and salaried employees with direct reports As an example scores from routine seeking a subscale of resistance to change were not significantly different between employ-ees without direct reports (n = 32 M = 312 SD = 096) and employees with direct reports (n = 33 M = 291 SD = 085) t (65) = 093 p = 037
Years at the Company
A one-way analysis of variance (ANOVA) was calculated on participantsrsquo ratings of the psychometric constructs and resistance to change as a comparison to the number of years at the company Comparisons indicated no sta-tistically significant differences were presented between groups of 0 to 4 years 5 to 10 years 11 to 20 years and 21 years and greater As an example on novelty-seeking a subscale of the Langer Mindfulness Scale the analysis was not significant between the four groups F(3 61) = 31 p = 82
The second research question used bivariate correlations to determine the strength of the relationships between the psychometric constructs (Mindfulness and Tolerance of Ambiguity) and Resistance to Change including the four subscales All of the Pearson correlations were significant across each of the findings with the exception of the LMS scale and Cognitive Rigidity of Resistance to Change subscale r(65) = -225 p = 072 The overall LMS scales reflected a strong negative relationship r(65) = -530 p lt 001 with the RTC scale The TOA scale revealed a mod-
Table 1 Descriptive Statistics and Correlations among Responses of Tolerance of
Ambiguity Scale Langer Mindfulness Scale and Subscales and Resistance to Change and Subscales
Scales LMS_NS LMS_NP LMS_E TOA_ Tot RTC_RS RTC_ER RTC_STF RTC_CR
LMS_NS (77)
LMS_NP 76 (72)
LMS_E 49 51 (69)
TOA_Tot -48 -53 -32 (72)
RTC_RS -51 -50 -41 65 (85)
RTC_ER -36 -37 -36 41 71 (88)
RTC_STF -53 -47 -38 60 77 80 (90)
RTC_CR -28 -26 -04 44 51 45 41 (86)
of Items 5 5 4 16 5 4 4 4
Mean 598 504 556 376 342 285 367 322
SD 071 94 102 71 110 104 73 81Note N = 65 Cronbachrsquos alpha reliabilities for each dimensionconstruct are listed in parentheses on diagonal Cronbachrsquos Alpha measures indicated a high internal consistency among the items reflected in each scale p lt 05 level (two-tailed) p lt 01 level (two-tailed)
Table 2 Descriptive Statistics and Correlations among Responses of the Total Tolerance of
Ambiguity Scale Langer Mindfulness Scale and Resistance to ChangeLMS_Tot Mean TOA_Tot Mean RTC_Tot Mean
LMS_MeanTotal (86)
TOA_Meantotal -53 (72)
RTC_Meantotal -53 62 (93)Number of items 14 16 17Mean 552 376 301Standard Deviation 75 71 91Note N = 65 Cronbachrsquos alpha reliabilities for each dimensionconstruct are listed in parentheses on diagonal No subscales for Tolerance of Ambiguity were referenced in research Cronbachrsquos Alpha measures indicated a high internal consistency among the items reflected in each scale p lt 05 level (two-tailed) p lt 01 level (two-tailed)
Table 3 Descriptive Statistics and Correlations among Responses Related to Operational and
Demographic Factors Tolerance of Ambiguity Scale Langer Mindfulness Scale and Sub-scales and Resistance to Change and Subscales
ME
AN
SD AG
E
YR
SWR
K
DR
RPT
S
TO
A_M
LMS_
M
LMS_
NS
LMS_
NP
LMS_
E
RT
C_M
RT
C_R
S
RT
C_E
R
RT
C_S
TF
RT
C_C
R
AGE 4571 782 100YRSWRK 1283 943 52 100DRRPTS 1005 2162 -18 01 100TOA_M 376 71 15 11 -02 100LMS_M 552 75 -07 -07 10 -53 100LMS_NS 598 71 -12 -12 04 -48 87 100LMS_NP 504 94 -05 01 18 -53 90 76 100LMS_E 556 102 -01 -10 01 -32 78 49 51 100RTC_M 322 81 -14 -10 -08 62 -53 -51 -48 -37 100RTC_RS 301 91 -13 -07 -04 65 -55 -51 -50 -41 90 100RTC_ER 342 110 -23 -17 -07 41 -43 -36 -37 -36 90 71 100RTC_STF 285 104 -05 00 -06 60 -54 -53 -47 -38 91 77 80 100RTC_CR 367 73 -07 -08 -14 44 -23 -28 -26 -04 65 51 45 41 100
Note N = 65 The correlation coefficient ranges from -1 to +1 with -1 indicating a perfect negative correlation +1 indicating a perfect positive correlation and 0 indicating no correlation
Brian Dunican amp Ric Keaster Acceptance of Change Exploring the Relationship among Psychometric Constructs and Employee Resistance
36 International Journal of the Academic Business World 37Fall 2015 (Volume 9 Issue 2)
erate positive correlation r(65) = 624 p lt001 Further bivariate analyses for LMS explored the strength of the re-lationships between the subscales of the Langer Mindful-ness Scale and the subscales of the Resistance to Change scales The correlational analysis was statistically signifi-cant between all variables except Engagement of the LMS and Cognitive Rigidity of RTC r(63) = -35 p = 781 concluding that the variables were unrelated
The last research question explored the degree of the re-lationship between Mindfulness and Tolerance of Am-biguity Bivariate analyses were used to correlate the re-lationship between the two psychometric constructs The correlations revealed a significantly strong negative rela-tionship between the total mean score of the LMS and the total mean score of the TOA r(63) = -53 p lt 01 The mean scores for each of the LMS subscales compared to the total mean of the TOA showed the following Nov-elty-seeking and TOA r(63) = -48 p lt 01 Novelty-pro-ducing and TOA r(63) = -53 p lt 01 and Engagement and TOA r(63) = -32 p lt 01 It is important to note that higher scores on the Tolerance of Ambiguity scale indicate a greater intolerance of ambiguity Tables 1 and 2 display a descriptive analysis and correlations for each of the scales and subscales The correlations between vari-ables are presented in Table 3
LIMITATIONS OF THE STUDY
Research inherently contains limitations The current study is no exception First the nature of measuring psy-chometrics is subjective Since psychometrics studies mea-sure the way in which individuals think and act (Norton 1975) influences of the organizationrsquos environment could affect individualsrsquo responses to questions Additionally external variables at the time of data collection not related to the study itself can skew the responses and influence the outcomes Other views of limitation rest on the gen-eralizability of the results which may be limited for the following reasons (a) the unit of analysis is at the indi-vidual level (b) data were collected from a limited num-ber of operations within the state of Kentucky through convenience sampling and (c) individual biases that may be introduced at the time of testing
The unit of analysis for data collection rests at the indi-vidual level rather than the group level due to the acces-sibility of the employees Although the survey collection method allows for comparison with larger groups it lim-its the opportunity to explore issues in depth therefore assumptions are made for individuals in similar groups Next the data collected represents limited industries in the state of Kentucky restricting the number of partici-pants and the ability to generalize outcomes to other in-dustries different than those outlined in the current study
Last respondentsrsquo values interests and beliefs regarding the online self-administered surveys may introduce biases unknown by the researcher As a consequence of these limitations and the collection of data during one point in time the results are generalizable only to the groups or populations that are similar to those in the current study
SUMMARY AND CONCLUSION
Change within organizations is inevitable That real-ity will remain constant in organizationsmdashand in onersquos personal and professional life (Conner 1992) The way in which one chooses to cope with change could be a decid-ing factor of success failure or choosing to remain the samemdashwhich in organizations tends to equate with fail-ure particularly if change means simply improving Resis-tance is a natural reaction to change and is part of the hu-man psyche Research and literature support this notion of human nature to resist change and elements related to the process of change (Coch amp French 1948 Conner 1992 Oreg 2003 OrsquoToole 1995 Zander 1950) It is possible that a greater understanding of mindfulness and tolerance of ambiguity could increase the possibilities of new ideas to drive lower resistance to change The current study explored the two psychometric constructs of mind-fulness and tolerance of ambiguity and their relationship to resistance to change within industrial settings Bivari-ate correlations yielded both strong positive and negative correlations among the three scales assessed by salaried employees located across different industries The Langer Mindfulness Scale Budnerrsquos Tolerance of Ambiguity Scale and Oregrsquos Resistance to Change scale were attrib-uted to the foundation of the current study The results contributed to the practical and theoretical significance of individualsrsquo responses to change through the measure-ment of the aforementioned constructs To the extent the findings in the current research could be extrapolated to other industries or organizations a final suggestion should be noted When considering future directions for research related to probing psychometric constructs and resistance to change the current study may have relevance across different nationalities and cultures The elements of change will continue to challenge the fabric of organiza-tions while the internal and external pressures of rising costs variations in supply and demand relentless compe-tition and developing technology test the resolve for sur-vival The readiness of individuals within organizations and their ability to challenge perceptions of change and resistance may determine their competitiveness and ulti-mately their success
REFERENCES
Argyris C amp Schon D (1978) Organizational learning A theory of action research Reading MA Addison-Wesley
Armbruster H Bikfalvi A Kinkel S amp Lay G (2008) Organizational innovation The challenge of measur-ing non-technical innovation in large-scale surveys Technovation 28(10) 644-657
Armenakis A A amp Bedeian A G (1999) Organiza-tional change A review of theory and research in the 1990s Journal of Management 25 293-315
Armenakis A A Harris S G amp Mossholder K W (1993) Creating readiness for organizational-change Human Relations 46(6) 681-703
Banning K C (2003) The effect of the case method on tolerance for ambiguity Journal of Management Edu-cation 27 556-567
Bodner T E amp Langer E J (2001 June) Individual differences in mindfulness The MindfulnessMind-lessness Scale Poster presented at the 13th annual American Psychological Society Conference Toronto Ontario Canada
Bovey W H amp Hede A (2001) Resistance to organisa-tional change The role of defence mechanisms Journal of Managerial Psychology 16(7) 534-548
Brown K W amp Ryan R M (2003) The benefits of be-ing present Mindfulness and its role in psychological well-being Journal of Personality and Social Psychol-ogy 84 822-848 doi1010370022-3514844822
Brown K W amp Ryan R M (2004) Perils and promise in defining and measuring mindfulness Observations from experience Clinical Psychology Science and Practice 11(3) 242-248 doi101093clipsybph078
Budner S (1962) Intolerance of ambiguity as a personal-ity variable Journal of Personality 30 29-59
Burke W W (2014) Organizational change theory and practice Thousand Oaks CA Sage Publications Inc
Carson S H amp Langer E J (2006) Mindfulness and self-acceptance Journal of Rational-emotive and Cog-nitive-behavior Therapy 24(1) 29-43
Coch L amp French J (1948) Overcoming resistance to change Human Relations 1 512-532
Coghlan D (1993) A person-centred approach to deal-ing with resistance to change Leadership amp Organi-zation Development Journal 14(4) 10-14
Cohen J (1988) Statistical power analysis for the behav-ioral sciences Hillsdale NJ Lawrence Erlbaum Associates
Conner D R (1992) Managing at the speed of change How resilient managers succeed and prosper where others fail New York Random House
Demers C (2007) Organizational change theories Thousand Oaks CA Sage Publications Inc
Dent E B amp Goldberg S G (1999) Resistance to change A limiting perspective Journal of
Ehrlich S B Meindl J R amp Viellieu B (1990) The charismatic appeal of a transformational leader An empirical case study of a small high-technology con-tractor The Leadership Quarterly 1(4) 229-247
Ford J D Ford L W amp McNamara R T (2002) Re-sistance and the background conversations of change Journal of Organizational Change Management 15(2) 105-121
Frenkel-Brunswik E (1948) Tolerance toward ambigu-ity as a personality variable American Psychologist 3 268-269
Furnham A amp Ribchester T (1995) Tolerance of am-biguity A review of the concept its measurement and applications Current Psychology 14 179-199
Gaumlrtner C (2013) Enhancing readiness for change by enhancing mindfulness Journal of Change Manage-ment 13 52-68
Geller E S (2002) Leadership to overcome resistance to change It takes more than consequence control Jour-nal of Organizational Behavior Management 22(3) 29-49
Gondo M Patterson K W amp Palacios S (2013) Mind-fulness and the development of a readiness for change Journal of Change Management 13(1) 36-51
Greenwood R amp Hinings C R (1996) Understanding radical organizational change Bringing together the old and the new institutionalism Academy of Manage-ment Review 21 1022-1054
Isabella L (1990) Evolving interpretations as a change unfolds How managers construe key organization-al events Academy of Management Journal 33 7-41
Iverson R D (1996) Employee acceptance of organiza-tional change The role of organizational commitment International Journal of Human Resource Manage-ment 7 122-149
Jacobs P (2005) Five steps to thriving in times of un-certainty Harvard Management Update 10(12) 3-5
Brian Dunican amp Ric Keaster
38 Fall 2015 (Volume 9 Issue 2)
Retrieved from httphbrorgproductfive-steps-to-thriving-in-times-of-uncertaintyanU0512A-PDF-ENG
Judge T A Thoresen C J Pucik V amp Welbourne T M (1999) Managerial coping with organization-al change A dispositional perspective Journal of Ap-plied Psychology 84 107-122
Judson A (1991) Changing behavior in organizations Minimizing resistance to change Cambridge MA Basil Blackwell
Kanter R M (1985) Supporting innovation and ven-ture development in established companies Journal of Business Venturing 1 47-60
Kets de Vries M F R Ramo L amp Korotov K (2009) Organizational culture leadership change and stress INSEAD Working Papers Collection 10 2-26 Re-trieved from httpwwwinseadedufacultyresearchresearchdoccfmdid=41924
Kotter J P (1995) Leading change Why transformation efforts fail Harvard Business Review 73(2) 59-67
Lane M S amp Klenke K (2004) The ambiguity toler-ance interface A modified social cognitive model for leading under uncertainty Journal of Leadership amp Organizational Studies 10(3) 69-81
Langer E J (1993) A mindful education Educational Psychologist 28 43-50
Langer E J (1997) The power of mindful learning Read-ing MA Addison-Wesley
Lawrence P R (1954) How to deal with resistance to change Harvard Business Review 32(3) 49-57 Retrieved from httpedsaebscohostcomlib-srvwkueduehostpdfviewerpdfviewervid=6ampsid =699bab3d-bcec-40d9-ac69-a42c853d72bc40sessionmgr4004amphid=4108
Lewin K (1947) Frontiers in group dynamics II Chan-nels of group life social planning and action research Human Relations 1(2) 143-153
Lewin K (1951) Field theory in social science Selected theoretical papers New York Harper amp Row
Limerick D Passfield R amp Cunnington B (1994) Transformational change Towards an action learning organization The Learning Organization 1(2) 29-40
Mabin V J Forgeson S amp Green L (2001) Harness-ing resistance Using the theory of constraints to assist change management Journal of European Industrial Training 25(234) 168-191
Maurer R (2009) Introduction to change without mi-graines Omaha NE Maurer and Associates Re-trieved from httpextensionmissouriedustaffsde-teams DocumentsChangeW-outMigrarainespdf
Norton R W (1975) Measurement of ambiguity toler-ance Journal of Personality Assessment 39 607-619
Offermann L R amp Gowing M K (1990) Organiza-tions of the future Changes and challenges Ameri-can Psychologist 45(2) 95-108 doi10370003-066X45295
Oreg S (2003) Resistance to change Developing an in-dividual differences measure Journal of Applied Psy-chology 88 680-693
Oreg S (2006) Personality context and resistance to organizational change European Journal of Work and Organizational Psychology 15 73-101
Oreg S Vakola M amp Armenakis A (2011) Change re-cipientsrsquo reactions to organizational change A 60-year review of quantitative studies The Journal of Applied Behavioral Science 47 461-524
OrsquoToole J (1995) Leading change The argument for val-ues-based leadership Boston MA Ballentine Books
Pirson M Langer E J Bodner T amp Zilcha-Mano S (2012) The development and validation of the Langer Mindfulness Scale-Enabling a socio-cognitive perspec-tive of mindfulness in organizational contexts Ford-ham University School of Business Research Paper Re-trieved from httpdxdoiorg102139ssrn2158921
Stanley D J Meyer J P amp Topolnytsky L (2005) Employee cynicism and resistance to organizational change Journal of Business and Psychology 19(4) 429-459
Topping P (2002) Managerial leadership New York McGraw Hill Professional
Van Dam K Oreg S amp Schyns B (2008) Daily work contexts and resistance to organisational change The role of leader-member exchange development climate and change process characteristics Applied Psycholo-gy An International Review 57 313-334 doi101111j1464-0597200700311x
Weinstein N Brown K W amp Ryan R M (2009) A multi-method examination of the effects of mindful-ness on stress attribution coping and emotional well-being Journal of Research in Personality 43 374-385
Zander A F (1950) Resistance to change Its analysis and prevention Advanced Management 4(5) 9-11
International Journal of the Academic Business World 39
INTRODUCTION
Cloud computing is one of the most talked about infor-mation technology topics these days 7 24 Early literature review reveals an endemic confusion of what cloud com-puting is does and what it stands for We posit that the cloud metaphor 3 20 fosters a confusion that persists even today
The goal of this research paper is to look back and make historical sense of cloud computing We try to find the lineage of cloud computing where the phrase cloud com-puting came from who came up with the term and how it found currency in the IT community We trace cloud computing to early timesharing and Application Service Provider (ASP) in the last decade and posit a future of utility computing
Additionally we try to shed light on the current state of cloud computing provide a comprehensive definition of the term and its main building blocks
CLOUD COMPUTING IN THE ACADEMIC LITERATURE
A metaphor
In an article by Ian Foster and Steven Tuecke 3 the authors start by describing the well-known elephant fable where a group of blind people are asked to describe an elephant and not surprisingly each provides a different view
The cloud is a metaphor for the Internet Itrsquos a rebranding of the Internet that is why there is a raging debate By vir-tue of a metaphor itrsquos open to different interpretations 20
Confusion and Frustration
The word ldquocloudrdquo in cloud computing informs very little and it may even misinform ldquoI hated it but I finally gave inrdquo says Carl Bass President and CEO of Autodesk He adds ldquoI didnrsquot think the term helped explain anything to people who didnrsquot already know what it isrdquo20
Giving the lsquocloudrsquo name to the old concept of large shared distributed systems is misleading 4 p 26
Larry Ellison Oraclersquos CEO ldquoThe interesting thing about cloud computing is that wersquove redefined cloud computing everything that we already dohellipI donrsquot understand what we would do differently in light of cloud computing other than change the wording of some of our adsrdquo 1 p 50
In an article in Harvard Business Review (HBR) 22 the author asks a rhetorical question ldquoWhat the heck does it mean to have a lsquocloudrsquo It means that the functions you want like storage communications and applications donrsquot need to live on the device you have in front of you You can get them on demand from the networkrdquo We should ask the question ldquoin a typical non-cloud IS en-vironment do we really have the stated functions on the device in front of usrdquo
Cloud Computing is often confused with Utility Com-puting but they are not the samemdashrather the latter forms part of the former 2
No Definition
Realizing the elephantine nature of cloud computing there is a reluctance to define it Question How would you define cloud computing Answer Cloud computing
The Origin and Construct of Cloud Computing
Nozar Daylami PhD Adjunct Professor
School of Management Information System and Technology Program
California Lutheran University Thousand Oaks CA 91360
ABSTRACTCloud computing is one of the most talked about information technology topics these days A literature review reveals an endemic confusion of what cloud computing stands for This paper tries to shed light on why the term is so confusing We try to find where the phrase cloud computing came from and how it found currency in the IT community We trace cloud computing to early timesharing and Application Service Provider (ASP) in the last decade and posit a future of utility computing This paper also provides a comprehensive definition of the term and its main building blocks
Nozar Daylami The Origin and Construct of Cloud Computing
40 International Journal of the Academic Business World 41Fall 2015 (Volume 9 Issue 2)
is not so much a definition of a single term as it is a trend in service delivery taking place today 3 p 52
An Old Concept
Cloud computing is an old concept it ldquois a throwback to the mainframe model of computingrdquo 19 p 78 Clearly cloud computing is simply remote computing 4 p 26
Internet or Network Computing
Cloud computing as a term for Internet-based computing service was launched by industry giants Google Ama-zon etc in late 2006 24 ldquoIt is the movement of applica-tion services onto the Internet and the increased use of the Internethelliprdquo
The Earliest Publications
In the first article on Cloud Computing in the Communi-cations of ACM 9 it is referred to as ldquothe compute cloudrdquo and is deemed synonymous with ldquoon-demand comput-ing software as a service or the Internet as a platformrdquo Though these other naming conventions are self-explana-tory cloud computing is not
The cloud computing is understood as a shift of the ge-ography of computing It begs the question if it is about moving delivery of a wide variety of information services onto to the Internet why donrsquot we call it ldquoInternet Com-putingrdquo
The first time cloud computing showed up in a HBR pub-lication was in a digital article in April 2008 14 The au-thor states that the move to cloud computing would be disruptive to incumbent players of shrink-wrapped gam-ing software assuming his readers understand what cloud computing entails
A BRIEF HISTORY OF COMPUTING
In the early days of computers they were big and expen-sive So sharing this big expensive gadget was a normal practice Most organizations did not usually own this big machine but those who did had to share it across an en-terprise That was the era of timesharing
However as computers got cheaper and more afford-able every company every department and then finally every person decided to have their own computer How-ever standalone computers are of limited use So we networked them first locally in a Local Area Network (LAN) environment and then far and wide Wide Area
Network (WAN) Then we networked the network and the World Wide Web was born
At the same time in a different parallel universe some-thing else was happening In the early years no commer-cial off-the-shelf software (COTS) was available Every organization had to write its own software program So if you wanted to computerize your accounting general led-ger payables and receivables or run your inventory you had to write your own applications
Buying off-the-shelf applications was also considered ldquooutsourcingrdquo Why Because you were having others do the work for your organization which was supposed to be doing this work for itself So over the years most appli-cation development have been outsourced to burgeoning software companies such as IBM Oracle and SAP
OUTSOURCING AND ASP
In a general sense IS outsourcing is nothing newmdashit has always been considered an option for IT solutions 11 Electronic Data Systems was handling data processing services for Frito-Lay and Blue Cross as early as 1963 IS outsourcing soon became widely known as the second of a three-phase outsourcing phenomenonmdashtraditional out-sourcing being the first phase and application outsourcing being the third 6
In the early years of the last decade xSPs service provid-ers of all stripes were leading into a new generation of IT where it really did not matter where the applications reside as long as we had access to accomplish what we wanted 247 However back then an Application Service Provider (ASP) was thought by some to be another re-incarnation of the old ldquotimesharingrdquo leveraging network technologies 22
However the understanding of an evolving net-centric computing was already there In their book published in 2002 aptly titled NetSourcing authors Kern Lacity and Willcocks 7 define a computing framework and services stack thatrsquos similar to Cloud Computing The authors state ldquoWe selected the term ldquoNetsourcingrdquo as the over-arching name because the common element of any xSP is the delivery of a product or service over a networkrdquo (p 3) The ldquonetworkrdquo however is now synonymous with the ldquoInternetrdquo
Today cloud computing is about getting the job done in whatever way shape or form that may be required Orga-nizations and individuals need the utility of computing and where it comes from by and large is of no concern As early as 1961 Professor John McCarthy predicted that computation may someday be organized as a public utility ldquoEach subscriber needs to pay only for the capac-
ity he actually uses but he has access to all programming languages characteristics of a very large system hellip Certain subscribers might offer services to other subscribers hellip The computer utility could become the basis of a new and im-portant industry 8 McCarthyrsquos notion of ldquoutility comput-ingrdquo is here right nowmdashthat is ldquocloud computingrdquo
This point is confirmed by others 1 p 51 ldquoThe data center hardware and software is what we consider a cloud When a cloud is made available in a pay-as-you-go manner to the general public we call it utility computingrdquo
CLOUD COMPUTING ORIGIN OF THE PHRASE
Coinage of the term ldquocloud computingrdquo has been traced to two individuals who at the time they came up with this term worked for Compaq Computer George Favaloro a Compaq marketing executive and Sean OrsquoSullivan the founder of the now defunct business NetCentric 20
A Compaq internal document marked as confiden-tial dated November 14 1996 and provided by Sean OrsquoSullivan contemplates a Cloud Computing ldquostrat-egyrdquo10
But the creation of this term did not find currency for another decade Many believe the first use of ldquocloud com-
putingrdquo in its modern context occurred on August 9 2006 when then Google CEO Eric Schmidt introduced the term at an industry conference ldquoWhatrsquos interesting [now] is that there is an emergent new modelrdquo Schmidt said ldquoI donrsquot think people have really understood how big this opportunity really is It starts with the premise that the data services and architecture should be on servers We call it cloud computingmdashthey should be in a ldquocloudrdquo somewhererdquo 19
CLOUD COMPUTING DEFINITION
The National Institute of Standards and Technology (NIST SP 800-145) defines Cloud Computing in the fol-lowing way ldquoCloud computing is a model for enabling convenient on-demand network access to a shared pool of configurable computing resources (eg networks serv-ers storage applications and services) that can be rapidly provisioned and released with minimal management ef-fort or service provider interaction This cloud model is composed of five essential characteristics three service models and four deployment modelsrdquo 17
The following diagram places all the pieces together in a visual form
The Conceptual Reference Model
Cloud Computing Reference Architecture NIST Special Publication 500-292
Nozar Daylami The Origin and Construct of Cloud Computing
42 International Journal of the Academic Business World 43Fall 2015 (Volume 9 Issue 2)
Cloud Computing Reference Architecture NIST Special Publication 500-292
NIST Special Publication 500-292 states that ldquothe defini-tion is widely accepted as a valuable contribution toward providing a clear understanding of cloud computing tech-nologies and cloud services It provides a simple and un-ambiguous taxonomy of three service models available to cloud consumers cloud software as a service (SaaS) cloud platform as a service (PaaS) and cloud infrastructure as a service (IaaS) It also summarizes four deployment mod-els describing how the computing infrastructure that delivers these services can be shared private cloud com-munity cloud public cloud and hybrid cloudrdquo 18 Finally the NIST definition also provides a unifying view of five essential characteristics that all cloud services exhibit on-demand self-service broad network access resource pool-ing rapid elasticity and measured service 18
This publication further states that ldquoThese services and their delivery are at the core of cloud computing In the cloud computing model the primary focus is a more eco-
nomic method of providing higher quality and faster ser-vices at a lower cost to the usersrdquo
The Cloud Security Alliance 21 provides a more transpar-ent narrative of what Cloud Computing is ldquoa model for enabling ubiquitous convenient on-demand network access to [a] shared pool of configurable computing re-sources [it] has the potential to enhance collaboration agility scaling and availability and provides opportunity for cost-reduction the model envisages a world where components can be rapidly orchestrated provisioned implemented and decommissioned scaled up or down to provide an on-demand utility-like modelrdquo
A SPATIAL VIEW OF CLOUD COMPUTING
The NIST Computing Reference Architecture is a flat depiction of the cloud computing model A three dimen-sional view of the model by Craig-Wood 2 is a spatial de-piction Here you can see the three dimensions of cloud computing that renders the elephant fable
Computing Services Framework
Infrastructure as a Service (IaaS) As the word ldquoinfra-structurerdquo implies this is the most basic of services Cus-tomers can buy processing storage and network services and then build their own systems on top of this infra-structure A pioneer in the IaaS field is Amazon with its Amazon Elastic Compute Cloud (EC2)
However most big names in the IT field from Micro-soft (Azure) to Google (App Engine) provide IaaS Here customers are not renting specific servers hard drives and network switches or any particular equipment but instead they are utilizing the infrastructure that is most certainly simulated by virtualization software allowing multiple customers to be served by the same array of physi-cal devices IaaS provides the raw power of computingmdashstorage included
Cloud Computing would not be possible without virtu-alization Virtualization is the ability to make a virtual machine (VM) act like a physical computer Just like a physical computer with its own processor operating sys-tem and storage each VM has its own components too The benefit of virtualization though is that you can put much more than only one VM even with different oper-ating systems on the same server Doing so dramatically increases each serverrsquos potential for serving clientsrsquo on-demand needs (8)
Platform as a Service (PaaS) The next level up is where vendors provide not only the raw powermdashthe infrastruc-turemdashbut preconfigured systems running operating sys-tems databases and platforms (programming languages) for building applications For example Microsoftrsquos Azure service provides preconfigured computers running Win-dows and SQL Server And Salesforcecom has Forcecom as its own custom application development platform
In practice the boundary between IaaS and PaaS is not always clear Because IaaS providers most often provide other services such as operating systems database or ap-plication development platform that fall in the PaaS cat-egory In its purest form IaaS can be considered as virtual machines (raw processing power and storage) that can be scaled up and down as you need
Software as a Service (SaaS) Another higher layer is where vendors provide full applications running on cloud infrastructuremdashtheir own or rented from the likes of Amazon Salesforcecom has long been considered one of the most successful SaaS provider Salesforececom CRM was one of the early entrants into the market Salesforcecom prides itself on being a pioneer in Cloud Computing
At Salesforcecom itrsquos all about the Cloud However in their collateral literature dated circa 1993-94 you wonrsquot find any mention of the word ldquocloudrdquo
CLOUD COMPUTING CONCERNS
In survey after survey security is listed as the top concern of Cloud Computing However Cloud Security Alliance (CSA) the industry group that provides security guide-lines and education states that ldquosecurity controls for the cloud computing are for in most part no different than the security controls in any IT environment hellip[however] cloud computing may present different risks to an organi-zation than traditional IT solutionsrdquo 21 p 21
CIOs or CEOs for that matter may feel safer when they ldquoownrdquo versus ldquorentrdquo their IT assets However when you deploy your assets on the Internet for which you eventu-ally will have little choice you will inherit a set of vulner-abilities that are not all that different from the Cloudrsquos Ownership has its own set of financial risks in the form of capital expenditures (CAPEX) that need to be budgeted and spent up front Compare that risk with the far smaller risk of renting (OPEX) which by and large can be dis-continued if needed
Cloud computing technology does not require the use of public networks If your data is too strategically critical and sensitive to be deployed on the Internet you could instead deploy a private cloud that is strictly for your or-ganization Obviously a Private Cloud is more expensive and it needs trained staff However a private cloud lets an organization benefit from cloud technology without the risk of possible public disclosure of its data
Another alternative could be a community cloudmdasha pri-vate cloud that is shared by several organizations for spe-cific needs For example a group of hospitals might create a community cloud to hold patientrsquos medical records
CONCLUSION
Cloud Computing is here to stay and grow Clouds are more versatile than traditional IT networks on many di-mensions They are far more convenient to deploy they have far more potential for collaboration and they are far more scalable than traditional IT ever was The delivery of services is provisioned on global telecommunication net-works that these days have morphed into the Internet And when they mature they will provide a computing utility when and where it is needed
Cloud computing model (adapted from Craig-Wood)
Nozar Daylami The Origin and Construct of Cloud Computing
44 International Journal of the Academic Business World 45Fall 2015 (Volume 9 Issue 2)
BIBLIOGRAPHY
1 Armburst M et al A View of Cloud Computing Communications of the ACM Vol 53 No 4 pages 50-58
2 Craig-Wood K Definition of Cloud Computing incorporating NIST and G-Cloud views httpswwwkatescommentcomdefinition-of-cloud-com-puting-nist-g-cloud Access date April 26 2015
3 Creeger M CTO Roundtable Cloud Computing Communications of the ACM Vol 52 No 8 pages 50-56
4 Cusumano M Cloud Computing and SaaS as New Computing Platforms Communications of the ACM Vol 53 No 4 pages 27-29
5 Foster Ian and Tuecke Steven Describing the Ele-phant The Different Faces of IT as Service wwwac-mqueuecom JulyAugust 2005 pages 26-34 httpdeliveryacmorg10114510900001080874p26-fosterpdf ip=99100108167ampid=1080874ampacc=OPENampkey=4D4702B0C3E38B352E4D4702B0C3E38B352E4D9421298D07BF362E6D218144511F3437ampCFID=505172814ampCFTOKEN=56369758amp__acm__=1429816554_402a40f1d60056fb68e8ccf3fdd96201 accessed April 23 2015
6 Kern Thomas Lacity Mary Cecelia Willcocks Leslie P Netsourcing Renting Business Applica-tions and Services Over a Network Prentice Hall 2002
7 Knoblauch A Deconstructing Cloud Smashwords Edition (Kindle Version) First Edition August 2013
8 Garfinkel Simon (2011 Oct 3) The Cloud Imperative MIT Technology Review httpwwwtechnologyreviewcomnews425623the-cloud-imperative
9 Hayes B Cloud Computing Communications of the ACM Vol 51 No 7 pages 9-11
10 Internet Solution Division Strategy for Cloud Com-puting Compaq Computer Corporation (1996) httpwwwtechnologyreviewcomsitesdefaultfileslegacycompaq_cst_1996_0pdf
11 Lacity M C Hirschheim R Information Systems Outsourcing Myths Metaphors and Realities New York John Wiley amp Sons 1993
12 McAfee A The Year the Cloud Rolled In httpshbrorg2010122010-the-year-the-cloud-rolled Access date April 23 2015
13 McAfee A What Every CEO Needs to Know About the Cloud httpshbrorg201111what-every-ceo-needs-to-know-about-the-cloud Access date April 23 2015
14 McGrath R Whorsquos Disrupting the Gaming Indus-try httpshbrorg200804whos-disrupting-the-gaming-ind Access date April 23 2015
15 Mell P Grance T The NIST Definition of Cloud Computing National Institute of Standards and Technology httpcsrcnistgovpublicationsnist-pubs800-145SP800-145pdf
16 Neumann P Risks and Myths of Cloud Comput-ing and Cloud Storage Communications of the ACM Vol 57 No 10 pages 25-27 The NIST Defi-nition of Cloud Computing httpcsrcnistgovpublicationsnistpubs800-145SP800-145pdf
17 NIST Definition of Cloud Computing httpcsrcnistgovpublicationsnistpubs800-145SP800-145pdf
18 NIST Cloud Computing Reference Architecture National Institute of Standards and Technology Special Publication 500-292 httpwwwnistgovcustomcfget_pdfcfmpub_id=909505
19 Nanavati M Colp P Aiello W and Warfield A Cloud Security A Gathering Storm Communica-tions of the ACM Vol 57 No 8 pages 70-79
20 Regalado Antonio (2011 Oct 31) Who coined cloud computing MIT Technology Review httpwwwtechnologyreviewcomnews425970who-coined-cloud-computing
21 Security Guidance for Critical Areas of Focus in Cloud Computing V30 Cloud Security Alliance httpscloudsecurityallianceorgguidancecsagu-idev30pd
22 Seviokla J Does Cisco Have Its Head in the Clouds httpshbrorg200903does-cisco-have-its-head-in-th Access date April 23 2015
23 Walsh K R Analyzing the Application ASP Concept Technologies Economies and Strategies Communications of ACM Vol 46 No 8 pages 103-107
24 Yang H Tate Mary A Descriptive Literature Review and Classification of Cloud Computing Re-search Communications of Association of Informa-tion Systems Vol 31 2012
Nozar Daylami
46 Fall 2015 (Volume 9 Issue 2)
This page intentionally blank
International Journal of the Academic Business World 47
INTRODUCTION
In their paper ldquoSAS and the Efficient Portfoliordquo Thomp-son and El-houbi (2012) develop a SAS program to calcu-late portfolio weights for efficient stock portfolios Their program improves on existing public domain SAS pro-grams of this type by allowing for portfolios with a rela-tively large number of securities Thompson and El-houbi also claim that their SAS program is an improvement over the Excel programs used to calculate portfolio weights which are sometimes included in investment textbooks They note that users concur that their program is easier to use than those Excel programs which either limit the number of securities that can be included in a portfolio require ldquocorrectionsrdquo or ldquoadjustmentsrdquo to overcome some quirks in the Excel Solver routine or require multiple user interventions
The Thompson and El-houbi program is certainly more elegant and user friendly than the equivalent Excel pro-grams and will provide those with access to the SAS pro-gramming language a valuable tool for learning portfolio management The disadvantage of a SAS program how-ever is that many students will not have easy access to the SAS programming language Students at smaller univer-sities may not have any access to SAS while students at many larger universities may only be able to access SAS at a computer lab on campus
In this paper I modify the Thompson and El-houbi SAS program for use in the open-source R programming lan-guage which is available free of charge for anyone with access to the internet Using the R language program to compute portfolio weights for efficient portfolios main-tains the elegance of the Thompson and El-houbi SAS
program while overcoming the disadvantage of limited SAS availability In addition I extend the Thompson and El-houbi program by making use of a quadratic program-ming package available in R to provide a program that can accommodate short-sale restrictions and position limits
THE R PROGRAMMING LANGUAGE
R is a free programming language for statistical analysis and graphics and runs on many UNIX platforms and on Windows and MacOS It is available under the terms of the Free Software Foundationrsquos GNU General Public License R was developed initially by Robert Gentleman and Ross Ihaka both of the University of Auckland (New Zealand) and is based on the S programming language developed at Bell Labs by John Chambers Since its initial development the popularity of R has grown considerably largely because of its ease of use and because of the avail-ability of many add-on packages that allow users to tackle very sophisticated projects
The base R package may be downloaded at httpcranusr-projectorg That web page also provides links to sources of information about R and basic user manuals There are also many books and manuals now available for purchase that offer information on both basic and special-ized uses of the language In fact Vance (2009) suggests that the growing popularity of the R language at univer-sities language could even result in noticeably lower de-mand for SAS
THE MARKOWITZ PORTFOLIO PROBLEM
As Markowitz (1952) notes an investor following the ldquoex-pected returns-variance of returns rulerdquo will choose an ef-
Optimal Portfolios and the R Programming Language
James A TurnerAssistant Professor of Finance
School of Accounting amp TaxationWeber State University
Ogden UT 84408
ABSTRACTThis paper develops a program in the freely available open-source R programming language to calculate weights for optimal stock portfolios The program retains the advantages the Thompson and El-houbi (2012) SAS program has over similar programs in Excel but avoids the potential problem of limited access to SAS that some students and researchers may face The R program also extends the Thompson and El-houbi program by including the ability to accommodate short-sale restrictions and position limits
James A Turner Optimal Portfolios and the R Programming Language
48 International Journal of the Academic Business World 49Fall 2015 (Volume 9 Issue 2)
ficient portfolio that is a portfolio with maximum ex-pected return for a given variance or one with minimum variance for a given expected return The minimum vari-ance formulation of the portfolio choice problem there-fore requires that the investor choose portfolio weights to minimize the variance of a portfolio with a given expected return The problem also requires that all money be in-vested (which means that the portfolio weights must sum to one) In matrix notation the optimization problem is
where w the choice variable is a k times 1 vector of the weights invested in the k securities in the portfolio V is the port-folio variance-covariance matrix and R is a 2 times k matrix whose first row is a vector of ones and whose second row contains the expected returns of each security in the port-folio M is a 2 times 1 vector whose first element is one (corre-sponding to the constraint that the portfolio weights sum to one) and whose second element is the chosen portfo-lio expected return For now there are no restrictions on short sales so some portfolio weights may be negative
The Lagrangian for the problem is
( ) L w Vw M Rwλprime prime= + minus
where λ is a 2 times 1 vector containing the Lagrangian multi-pliers The first-order conditions for a minimum (which are also sufficient conditions in this case) are
Solving the first-order conditions for w and λ yields
( )( )
11 1
112
w V R RV R M
RV R Mλ
minusminus minus
minusminus
prime prime=
prime=
Thompson and El-houbi following Stephens (1998) let 1 H RV Rminus prime= so that
1 1
1
2
w V R H MH Mλ
minus minus
minus
prime=
=
Stephens (1998 p 36) shows how the elements of the H matrix may be used ldquoto fix any meanvariance point on the efficient frontierrdquo
Min st
w VwRw M
prime
=
2 0
0
L Vw RwL M Rw
λ
λ
part prime= minus =partpart
= minus =part
THE BASIC R PORTFOLIO OPTIMIZATION PROGRAM
The R programming language lends itself very easily to matrix manipulation and matrix computation removing much of the difficulty in solving the standard Markowitz portfolio problem The following R program calculates the portfolio weights for an efficient portfolio using stock return data to estimate expected returns and the variance-covariance matrix The user must specify the desired port-folio expected return The program can accommodate portfolios up to about 50 stocks Beyond that number precision limitations of the R language may make the variance-covariance matrix ldquocomputationally singularrdquo and unable to be inverted
The first step in the program is to read in the return data R can input data from many file types but in the present example the data are stored in a comma-delimited Excel file called ldquoReturnscsvrdquo which contains stock return data In this case the Excel file includes a header row labeling each column of returns with identifying information but no row names The program first reads in the data and then determines the number of securities (number of col-umns in the matrix) as shown on the facing page
ADDING SHORT-SALE CONSTRAINTS AND POSITION LIMITS
The above formulation of the portfolio choice problem places no restrictions on short sales and does not accom-modate position limits In reality individual investors and some fund managers may face requirements prohibit-ing short sales Fund managers may also face requirements that either limit the amount that may be invested in one security or sector or instead that a minimum percentage of funds be invested in a certain security or sector Dai Lin and Liu (2011) list several examples of real-world po-sition limits such as a requirement that a small-cap mutu-al fund invest at least a minimum percentage of its funds in small-company stocks In mathematical terms these short-sale restrictions and position limits can be expressed as a series of inequality constraints While reformulating the portfolio choice problem to add inequality constraints is not difficult doing so makes actually solving the prob-lem considerably more difficult
With short-sale restrictions and position limits the port-folio choice problem becomes
0
Min st
w VwRw MSw w
prime
=ge
where w is still the choice variable S is an m times k matrix that defines both the short-sale constraints on the k se-curities in the portfolio and m minus k other restrictions If there are short-sale constraints but no other restrictions the S matrix is simply a k times k identity matrix which when multiplied by the vector w results in the requirement that
0 iw ige forall If there are other restrictions the sub-matrix of S consisting of the first k rows and k columns of S is an identity matrix and the other restrictions are specified by suitable choices of the elements of the remaining rows of S For example suppose there is a position limit placing a maximum of p on the percentage invested in the sev-enth security so that 7 w ple Since the constraints in the optimization problem above have been expressed as non-negativity constraints this position limit must instead take the form 7 w pminus ge minus The row of S corresponding to
the position limit will consist entirely of zeros except for the seventh element which will be minus1 and corresponding element of the w0 vector would be p
Introducing other forms of position limits simply requires adding the appropriate rows to the S matrix For example if there is a requirement that the total percentage invested in the first and third securities equal or exceed a certain percentage q then one row of S should be [1 0 1 0 0]and the corresponding element of the w0 vector would be q If there is instead a requirement that the total percentage invested in the first and third securities not exceed a cer-tain amount q the required row of S would be [-1 0 -1 0 0] and the corresponding element of the w0 vector would be minusq Other restrictions may be specified similarly For problems that include position limits each of the first k el-
The BASIC R Portfolio Optimation Program
Returns ltminus readtable(ldquoReturnscsvrdquo header = TRUE sep = ldquordquo)Rmat ltminus asmatrix(Returns) Converts the data to matrix formk ltminus ncol(Rmat) Number of columns (number of securities in the portfolio) Now the program calculates the estimate of the variance-covariance matrix (V) the M vector and the R matrix which includes the estimate of the expected returns
V ltminus var(Rmat) Calculates the sample variance-covariance matrix which is used as the estimate of the variance-covariance matrix
Erp ltminus 001 Sets the desired expected portfolio return The user can change this value as desired
M ltminus rbind(1 Erp) Ones ltminus rep(1 k) Ravg ltminus colMeans(Rmat)
Defines the M matrix including the required portfolio return Defines a 1 x k matrix of ones Calculates average returns by column giving a 1 x k matrix of estimated expected returns
R ltminus rbind(Ones Ravg) Combines Ones and Ravg into the 2 x k matrix R Finally the program calculates the portfolio weights and the portfolio variance
VINV ltminus solve(V) Calculates the inverse of the estimated variance-covariance matrixH ltminus RVINVt(R) Calculates the H matrixHINV ltminus solve(H) Calculates the inverse of Hw lt- VINVt(R)HINVM Calculates the portfolio weightsPvar lt- t(w)Vw Calculates the portfolio variance The following commands display the results of the calculations
print(w) Prints the elements of the w vectorprint(Pvar) Prints the variance of the portfolio formed using the weights w
James A Turner Optimal Portfolios and the R Programming Language
50 International Journal of the Academic Business World 51Fall 2015 (Volume 9 Issue 2)
ements of the w0 vector will be zero corresponding to the non-negativity constraints and the remaining elements will equal the percentages associated with the position limits entered as positive or negative numbers depend-ing on whether the position limits establish minimums or maximums
The Lagrangian for this problem is
( ) ( )0 L w Vw M Rw w Swλ microprime prime prime= + minus + minus
where λ is a 2 times 1 vector containing the Lagrangian multi-pliers on the equality constraints and micro is an m times 1 vector of the Lagrangian multipliers on the k short-sale constraints and the m ndash k position limits The first-order necessary con-ditions for this problem are the Kuhn-Tucker conditions
( )0 0
2 0
0
0 0 and 0
L Vw R SwL M Rw
L w Sw w Sw
λ micro
λ
micro micromicro
part prime prime= minus minus =partpart
= minus =partpart prime= minus le ge minus =part
The final set of conditions are known as the complementa-ry slackness conditions since if an element of partLpartμ does not equal zero (ie if the required condition is slack) then the corresponding element of micro must equal zero and vice versa Because of the complementary slackness conditions in order to find a solution to the optimization problem each condition must be checked individually to deter-mine the possible solutions If there are more than a very few constraints finding the candidate solutions manually becomes extremely tedious
Fortunately it is possible to use numerical methods to solve this type of non-linear programming program This is where the strength of the R programming language be-comes very evident The R language provides access to an extensive number of add-on packages developed by R us-ers around the world In particular there are several pack-ages that implement numerical methods to find solutions to optimization problems with inequality constraints Perhaps the package that most easily lends itself to solv-ing the current problem is the ldquoquadprogrdquo package Ac-cording to the documentation included with the pack-age the quadprog routine ldquoimplements the dual method of Goldfarb and Idnani (1982 1983) for solving qua-dratic programming problems of the form min(d΄b+frac12b΄Db)) with the constraints Aʹbgtb₀rdquo For the optimization problem currently under consideration the d vector will be a zero vector the b vector will be the w vec-tor of portfolio weights the D matrix will be the variance-
covariance matrix V and the matrix A΄ will equal a matrix formed by combining the R matrix and the S matrix such that A΄= [R
S ]and A = [ R΄ S΄] Since the V matrix is symmetric the term frac12b΄Db = frac12w΄Vw is a quadratic form Also because the d vector is a zero vector the presence of the frac12 term in the quadratic form does not change the value of the solution to the current portfolio optimization problem That is the weights that minimize frac12w΄Vw sub-ject to the constraints will also minimize w΄Vw subject to the constraints
THE R PORTFOLIO OPTIMIZATION PROGRAM WITH PACKAGE ldquoQUADPROGrdquo
The ldquoQuadprogrdquo package is one of many add-in packages available to R users To use add-in packages in R the user must first download and install the chosen package This is done through the ldquoPackagesrdquo command in the menu bar of the console window Selecting the ldquoInstall package(s)rdquo command from the drop-down box will bring up a list of download locations After selecting a download location the user selects the package(s) to download and install Finally once the selected package is downloaded and in-stalled it must be loaded for use in the current R session which is done by choosing ldquoPackagesrdquo command on the menu bar and then choosing the ldquoLoad packagerdquo com-mand from the drop-down box A list of available packag-es will then appear and the user should select the desired package in this case the ldquoquadprogrdquo package Once the quadprog package is loaded the following program will solve the portfolio problem with short-sale restrictions and position limits
In the present example the short-sale constraint requires that all elements of the w vector be non-negative In addi-tion there are three position limits The first position lim-it requires that no more than 5 of total funds be invested in the seventh security The second position limit requires that no more than a total of 40 of available funds be in-vested in the first and third securities The third position limit requires that total of at least 30 of available funds be invested in the second and fourth securities
The program will make use of the M matrix and the vari-ance-covariance matrix V from the earlier program so those variables must be saved by the user or the following program must be run after running the previous program and before exiting R The new program first sets the posi-tion limits as shown on the facing page
The output of the ldquosolveQPrdquo function includes the values of w and the Lagrangian multipliers for each constraint If the value of a Lagrangian multiplier is zero the constraint associated with that multiplier is not binding otherwise the constraint is binding Though checking the values of
the Lagrangian multipliers allows the user to determine which constraints are binding quite easily the functionrsquos output also includes a listing of the binding constraints by index number
The R Portfolio Optimization Program with Package ldquoQuadprogrdquo
npl ltminus 3 Sets the number of position limits The user sets this value
plmat ltminus matrix (rep(0 nplk) nrow=npl ncol=k) Initializes the matrix that will be used to define the position limit(s)
plmat[17] = -1 Places the required elements into the proper places in the lmat[21] = plmat[23] = -1 position limits matrix In this example the first position
plmat[32] = plmat[34] = 1 limit will set a maximum on the total percentage invested in the seventh security The second position limit will set a maximum on the total percentage invested in the first and third securities The third position limit will set a minimum on the total percentage invested in the second and fourth securities
pl ltminus c(-005 -04 03) Sets the values of the position limits The value the user enters should be positive if the position limit specifies a inimum and should be negative if the position limit specifies a maximum
Next the inequality constraints are placed in matrix form
S ltminus rbind(diag(k) plmat) Defines the S matrix
w0 ltminus c(rep(0 k) pl) Creates a vector whose elements are the values of the inequality constraints
Next the arguments required by the solveQP function that solves the programming problem are defined and the programming problem is solved
dvec ltminus rep(0 k) Defines the d vector which is a necessary input for the quadprog package For portfolio optimization problems the elements of the d vector will all be zeros
Amat ltminus colbind(t(R) t(S)) Forms the Amat matrix
bvec ltminus c(M w0) Joins the M matrix and the w0 matrix to form the bvec vector
ICSol ltminus solveQP(V dvec Amat bvec meq=2) Solves the quadratic programming problem The argument meq specifies that the first two constraints are equality constraints In this example the equality constraints are that the weights sum to one and that the portfolio expected return equal a specified amount
print(c(ICSol[1] 2ICSol[[2]] ICSol[5] ICSol[6])) Prints selected output from the solve QP function the weights the portfolio variance the values of the Lagrangian multipliers and the index numbers of the binding constraints
James A Turner Optimal Portfolios and the R Programming Language
52 International Journal of the Academic Business World 53Fall 2015 (Volume 9 Issue 2)
CONCLUSION
This paper provides an R language program to calculate portfolio weights for efficient portfolios The program can also accommodate short-sale constraints and position limits Users must choose the desired portfolio expected return and must specify any other constraints A strong advantage of the program is that because the R program-ming language is freely available to anyone with access to the internet students and others who wish to use the pro-gram will be able to do so easily
REFERENCES
Dai Min Hanqing Jin and Hong Liu 2011 Illiquidity position limits and optimal investment for mutual funds Journal of Economic Theory 146 1598ndash1630
Goldfarb D and A Idnani 1982 Dual and primal-dual methods for solving strictly convex quadratic pro-grams In Hennart J P (ed) Numerical Analysis Springer-Verlag Berlin pages 77ndash91
Goldfarb D and A Idnani 1983 A numerically stable dual method for solving strictly convex quadratic pro-grams Mathematical Programming 27 1ndash33
Ihaka Ross A free software project Retrieved May 7 2013 from httpcranr-projectorgdochtmlinter-face98-paperpaper_2html
Markowitz Harry 1952 Portfolio selection Journal of Finance 7 77ndash91
Stephens Alan 1998 Markowitz and the spreadsheet Journal of Financial Education 35ndash43
Thompson Thomas H and Ashraf El-houbi 2012 SAS and the efficient portfolio International Research Jour-nal of Applied Finance 3 315ndash327
Turlach Berwin A 2013 quadprog Functions to solve quadratic programming problems R pack-age version 15-5 httpCRANR-projectorgpackage=quadprog (S original by Berwin A Turlach R port by Andreas Weingessel)
Vance Ashlee 2009 Data analysts captivated by Rrsquos power The New York Times Retrieved May 1 2013 from httpwwwnytimescom20090107tech nolog y busi ness-computi ng 0 7prog ra m htmlpagewanted=allamp_r=0
What is R Retrieved May 7 2013 from httpwwwr-projectorgabouthtml
APPENDIX 1 DATA
The data used in the R program come from the CRSP monthly stock file and consist of 60 months of return data from January 2008 to December 2012 The stocks in the 10-stock portfolio are the first 10 stocks in the CRSP monthly file (listed by PERMNO) for which 60 continuous months of returns are available The stocks in the 50-stock portfolio are the first 50 stocks for which 60 continuous months of returns are available Table 1 below lists the PERMNOS current company name and current ticker of the included stocks as well as the exchange where the stock trades
Table 1 Stocks in the Portfolio
NO PERMNO CURRENT COMPANY NAME TICKER EXCHANGE1 10001 GAS NATURAL INC EGAS AMEX2 10002 BANCTRUST FINANCIAL GROUP INC BTFG NASDAQ3 10025 A E P INDUSTRIES INC AEPI NASDAQ4 10026 J amp J SNACK FOODS CORP JJSF NASDAQ5 10032 PLEXUS CORP PLXS NASDAQ6 10044 ROCKY MOUNTAIN CHOCOLATE FAC INC RMCF NASDAQ7 10051 HANGER INC HGR NYSE8 10065 ADAMS EXPRESS CO ADX NYSE9 10100 AMERICAN LEARNING CORP NY ALRN NASDAQ
Table 1 Stocks in the Portfolio
NO PERMNO CURRENT COMPANY NAME TICKER EXCHANGE10 10104 ORACLE CORP ORCL NASDAQ11 10107 MICROSOFT CORP MSFT NASDAQ12 10138 T ROWE PRICE GROUP INC TROW NASDAQ13 10145 HONEYWELL INTERNATIONAL INC HON NYSE14 10147 E M C CORP MA EMC NYSE15 10180 AKORN INC AKRX NASDAQ16 10182 TECH DATA CORP TECD NASDAQ17 10200 REPLIGEN CORP RGEN NASDAQ18 10207 ROYCE FOCUS TRUST INC FUND NASDAQ19 10225 BEAM INC BEAM NYSE20 10232 ELMIRA SAVINGS BANK NY ESBK NASDAQ21 10239 BALDWIN amp LYONS INC BWINB NASDAQ22 10252 INDEPENDENT BANK CORP MA INDB NASDAQ23 10253 DOCUMENT SECURITY SYSTEMS INC DSS AMEX24 10257 D L H HOLDINGS CORP DLHC NASDAQ25 10258 CELLDEX THERAPEUTICS INC CLDX NASDAQ26 10259 SIGMA DESIGNS INC SIGM NASDAQ27 10294 HAVERTY FURNITURE COS INC HVT NYSE28 10297 NEW HAMPSHIRE THRIFT BNCSHRS INC NHTB NASDAQ29 10299 LINEAR TECHNOLOGY CORP LLTC NASDAQ30 10302 CYPRESS SEMICONDUCTOR CORP CY NASDAQ31 10308 TOMPKINS FINANCIAL CORP TMP AMEX32 10318 BALCHEM CORP BCPC NASDAQ33 10333 XOMA CORP XOMA NASDAQ34 10355 DAILY JOURNAL CORP DJCO NASDAQ35 10363 A M A G PHARMACEUTICALS INC AMAG NASDAQ36 10375 T C F FINANCIAL CORP TCB NYSE37 10382 ASTEC INDUSTRIES INC ASTE NASDAQ38 10395 NAVIGATORS GROUP INC NAVG NASDAQ39 10397 WERNER ENTERPRISES INC WERN NASDAQ40 10421 SKYWEST INC SKYW NASDAQ41 10443 PATRIOT TRANSPORTATION HLDG INC PATR NASDAQ42 10463 RESEARCH FRONTIERS INC REFR NASDAQ43 10501 AMERICAN WOODMARK CORP AMWD NASDAQ44 10507 MEDICAL ACTION INDS INC MDCI NASDAQ45 10514 TRANS WORLD ENTERTAINMENT CORP TWMC NASDAQ46 10516 ARCHER DANIELS MIDLAND CO ADM NYSE47 10517 AARONS INC AAN NYSE48 10530 MERIDIAN BIOSCIENCE INC VIVO NASDAQ49 10547 CLEARFIELD INC CLFD NASDAQ50 10550 PRO DEX INC COLO PDEX NASDAQ
James A Turner Optimal Portfolios and the R Programming Language
54 International Journal of the Academic Business World 55Fall 2015 (Volume 9 Issue 2)
APPENDIX 3 RESULTS FOR THE 10-STOCK PORTFOLIO
Results for the 10-stock portfolio with a monthly expect-ed return of 1 are shown at the top of the facing page First shown is the variance-covariance matrix (V) fol-lowed by its inverse (V-1)
Table 2 shows the return averages of each stock and the calculated portfolio weights both for the portfolio with no short-sale constraints or position limits and the port-folio with short-sale constraints and three position limits (1) a requirement that the percentage invested in the sev-enth security not exceed 5 (2) a requirement that the
total percentage invested in the first and the third securi-ties not exceed 40 and (3) a requirement that the total percentage invested in the second and fourth securities be at least 30 Note that when short-sale constraints and position limits are imposed there may no longer be a port-folio that meets all the constraints that is the feasible set may be null In that case the R program will return an error message stating that the constraints are inconsistent
Table 3 lists the inequality constraints and the associ-ated Lagrangian multipliers along with an indication of whether the constraint is binding In this example the constraint that there be a minimum of 30 invested in the second and fourth securities is not binding
APPENDIX 2 COPY OF THE FULL PROGRAM
The full program is shown below without comments Users can easily copy the program that is between the solid lines and paste it into the R Editor window It will probably be necessary for each user to change the name of the data file in the readtable command Also the user can change the portfolio expected return and the number type and value of the inequality constraints as desired
Returns ltminus readtable(ldquoReturnscsvrdquo header = TRUE sep = ldquordquo) Rmat ltminus asmatrix(Returns) k ltminus ncol(Rmat) V ltminus var(Rmat) Erp ltminus 001 M ltminus rbind(1 Erp) Ones ltminus rep(1 k) Ravg ltminus colMeans(Rmat) R ltminus rbind(Ones Ravg) VINV ltminus solve(V) H ltminus RVINVt(R) HINV ltminus solve(H) w lt- VINVt(R)HINVM Pvar lt- t(w)Vw print(w) print(Pvar) npl ltminus 3 plmat ltminus matrix (rep(0 nplk) nrow=npl ncol=k) plmat[17] = -1 plmat[21] = plmat[23] = -1 plmat[32] = plmat[34] = 1 pl ltminus c(-005 -04 03)S ltminus rbind(diag(k) plmat) w0 ltminus c(rep(0 k) pl) dvec ltminus rep(0 k) Amat ltminus cbind(t(R) t(S)) bvec ltminus c(M w0) ICSol ltminus solveQP(V dvec Amat bvec meq=2) print(c(ICSol[1] 2ICSol[[2]] ICSol[5] ICSol[6]))
1
2867001 161224 279311 153314 408660 148438 131874 246057 83608 740152
161224 321169 23967 251277 39387 55190 33449 107899 36378 39718
279311 23967 991158 109233 189872 100249 22208 119
V minus
minus minus minus
minus minus minus minus
minus minus minus minus
=
6782 41342 198294
153314 251277 109233 2757210 319797 03010 139907 969199 56520 416534
408660 39387 189872 319797 977494 325171 247388 1098965 26657 04097
148438 55190 100249 03010 325171 1
minus minus minus minus minus
minus minus minus minus minus minus
minus 644368 311333 1803329 91576 428583
131874 33449 22208 139907 247388 311333 1093506 426730 100681 162364
246057 107899 1196782 969199 1098965 1803329 426730 11640904 233195 3789283
8360
minus minus
minus minus minus minus minus minus minus
minus minus minus minus minus minus
8 36378 41342 56520 26657 91576 100681 233195 138635 73382
740152 39718 198294 416534 04097 428583 162364 3789283 73382 3685519
minus minus
minus minus minus minus minus minus
00046 00019 00002 00006 00035 00004 00011 00008 00018 00019
00019 00364 00013 00037 00002 00004 00003 00001 00100 00007
00002 00013 00161 00024 00076 00035 00013 00041 00038 00033
00006 0
V
minus minus minus minus
minus minus minus minus
minus minus
=
0037 00024 00058 00051 00010 00016 00021 00028 00029
00035 00002 00076 00051 00217 00009 00048 00052 00024 00064
00004 00004 00035 00010 00009 00087 00018 00022 00027 00012
00011 00003 00013 000
minus
minus minus
minus minus minus
16 00048 00018 00113 00013 00055 00018
00008 00001 00041 00021 00052 00022 00013 00033 00003 00034
00018 00100 00038 00028 00024 00027 00055 00003 00850 00020
00019 00007 00033 00029 00064 00
minus
minus minus minus minus minus minus minus minus
012 00018 00034 00020 00068minus
Table 2 Average Returns and Weights for the Ten-
Stock Portfolios
Stock No Permno
Average Returns
Weights (SS
Allowed)IC Weights
(No SS 3 PLs)
1 10001 00064 03817 034062 10002 -00054 00311 004063 10025 00183 00908 005944 10026 00156 02525 026255 10032 00095 -01410 000006 10044 00012 00649 013797 10051 00206 01000 005008 10065 00018 01933 004929 10100 00270 00422 0056810 10104 00104 -00155 00031
Table 3 Constraints and Lagrangian Multipliers
Constraint Lagrangian Multiplier
Constraint Binding
Portfolio weights sum to one 00015 Yes
Portfolio expected return equals 1 00443 Yes
w1 ge 0 00000 No w2 ge 0 00000 No
w3 ge 0 00000 No
w4 ge 0 00000 No
w5 ge 0 00015 Yes
w6 ge 0 00000 No
w7 ge 0 00000 No
w8 ge 0 00000 No
w9 ge 0 00000 No
w10ge 0 00000 No
w7 le 005 00003 Yes
w1 + w3 le 04 00002 Yes
w2 + w4 ge 03 00000 No
James A Turner Optimal Portfolios and the R Programming Language
56 International Journal of the Academic Business World 57Fall 2015 (Volume 9 Issue 2)
The portfolio variances are
No short-sale constraints 0001607 Short-sale constraints and three position limits 0001856
APPENDIX 4 RESULTS FOR THE 50-STOCK PORTFOLIO
Results for the 50-stock portfolio with a monthly ex-pected return of 1 are shown in Table 4 below The first table shows the return averages of each stock and the cal-culated portfolio weights both for the portfolio with no short-sale constraints or position limits and the portfolio with short-sale constraints and three position limits (1) a requirement that the percentage invested in the seventh security not exceed 5 (2) a requirement that the total percentage invested in the first and the third securities not exceed 40 and (3) a requirement that the total percent-age invested in the second and fourth securities be at least 30
Table 5 shows the Lagrangian multipliers on the equal-ity constraints and the position limit constraints To save space for the 50-stock portfolio the Lagrangian multi-pliers on the short-sale constraints are not listed Simply checking Table 4 to see if the weight on a particular stock is zero gives an almost certain indication of which short-sale constraints are binding In this example both the constraint that there be no more than 5 invested in the seventh security and the constraint that there be no more than a total of 40 invested in the first and third securi-ties are not binding
Table 4 Average Returns and Weights for the
50-Stock PortfoliosStock
No Permno Average Returns
Weights SS Allowed
IC Weights No SS 3 PLs
1 10001 00064 01934 013072 10002 -00054 -00179 003673 10025 00183 -00189 000004 10026 00156 02873 026335 10032 00095 00503 000006 10044 00012 -00185 000007 10051 00206 -00136 002288 10065 00018 10920 000009 10100 00270 00306 00423
10 10104 00104 01467 0000011 10107 -00001 -02023 00000
Table 4 Average Returns and Weights for the
50-Stock PortfoliosStock
No Permno Average Returns
Weights SS Allowed
IC Weights No SS 3 PLs
12 10138 00085 -05619 0000013 10145 00065 -03910 0000014 10147 00088 -02693 0000015 10180 00290 -00290 0000016 10182 00076 01181 0000017 10200 00082 01409 0040918 10207 00020 -01551 0000019 10225 00098 00285 0000020 10232 00159 -00021 0000021 10239 00051 01624 0000022 10252 00084 00955 0000023 10253 00058 00121 0000024 10257 -00008 -00236 0000025 10258 00196 -00157 0000026 10259 -00300 -01339 0000027 10294 00179 -00414 0000028 10297 00061 01854 0146729 10299 00074 00826 0000030 10302 00165 00201 0000031 10308 00073 01255 0014132 10318 00194 -01389 0000033 10333 -00203 -00205 0000034 10355 00299 -00545 0036035 10363 -00151 -00167 0000036 10375 00010 -00495 0000037 10382 00046 00267 0000038 10395 -00022 00886 0042339 10397 00134 01296 0084940 10421 -00036 -01045 0000041 10443 00021 01389 0000042 10463 00013 00417 0000043 10501 00176 -00458 0000044 10507 -00228 -00397 0000045 10514 00100 00731 0007846 10516 -00034 -00148 0119247 10517 00208 00629 0000048 10530 00005 00032 0000049 10547 00418 00032 0012550 10550 -00028 00397 00000
The portfolio variances are
No short-sale constraints 000002997 Short-sale constraints and three position limits 000111119
Table 5 Constraints and Lagrangian Multipliers
Constraint Lagrangian Multiplier Constraint Binding
Portfolio weights sum to one 0000503 YesPortfolio expected return equals 1 0031954 Yes
w7 le 005 0000000 Now1 + w3 le 04 0000000 Now2 + w4 ge 03 0000963 Yes
James A Turner
58 Fall 2015 (Volume 9 Issue 2)
This page intentionally blank
JOINT CONFERENCE May 25th 26th and 27th 2016 in
Nashville TN
Academic Business World International Conference
(ABWICorg)
The aim of Academic Business World is to promote inclusiveness in research by offering a forum for the discussion of research in early stages as well as re-search that may differ from lsquotraditionalrsquo paradigms We wish our conferences to have a reputation for providing a peer-reviewed venue that is open to the full range of researchers in business as well as reference disciplines within the social sciences
Business Disciplines
We encourage the submission of manuscripts presentation outlines and ab-stracts pertaining to any business or related discipline topic We believe that all disciplines are interrelated and that looking at our disciplines and how they relate to each other is preferable to focusing only on our individual lsquosilos of knowledgersquo The ideal presentation would cross discipline borders so as to be more relevant than a topic only of interest to a small subset of a single disci-pline Of course single domain topics are needed as well
International Conference on Learning and Administration in
Higher Education (ICLAHEorg)
All too often learning takes a back seat to discipline related research The In-ternational Conference on Learning and Administration in Higher Educa-tion seeks to focus exclusively on all aspects of learning and administration in higher education We wish to bring together a wide variety of individuals from all countries and all disciplines for the purpose of exchanging experi-ences ideas and research findings in the processes involved in learning and administration in the academic environment of higher education
We encourage the submission of manuscripts presentation outlines and ab-stracts in either of the following areas
Learning
We encourage the submission of manuscripts pertaining to pedagogical top-ics We believe that much of the learning process is not discipline specific and that we can all benefit from looking at research and practices outside our own discipline The ideal submission would take a general focus on learning rather than a discipline-specific perspective For example instead of focusing on ldquoMotivating Students in Group Projects in Marketing Managementrdquo you might broaden the perspective to ldquoMotivating Students in Group Projects in Upper Division Coursesrdquo or simply ldquoMotivating Students in Group Projectsrdquo The objective here is to share your work with the larger audience
Academic Administration
We encourage the submission of manuscripts pertaining to the administra-tion of academic units in colleges and universities We believe that many of the challenges facing academic departments are not discipline specific and that learning how different departments address these challenges will be ben-eficial The ideal paper would provide information that many administrators would find useful regardless of their own disciplines
- Testing Major Factors for Reducing Obstacles to Product Innovation Success
-
- Dr Tor Guimaraes
- Dr Marcelo Seido Nagano
- Dr Curtis Armstrong
-
- Acceptance of Change Exploring the Relationship among Psychometric Constructs and Employee Resistance
-
- Brian Dunican EdD
- Ric Keaster PhD
-
- The Origin and Construct of Cloud Computing
-
- Nozar Daylami PhD
-
- Optimal Portfolios and the R Programming Language
-
- James A Turner
-
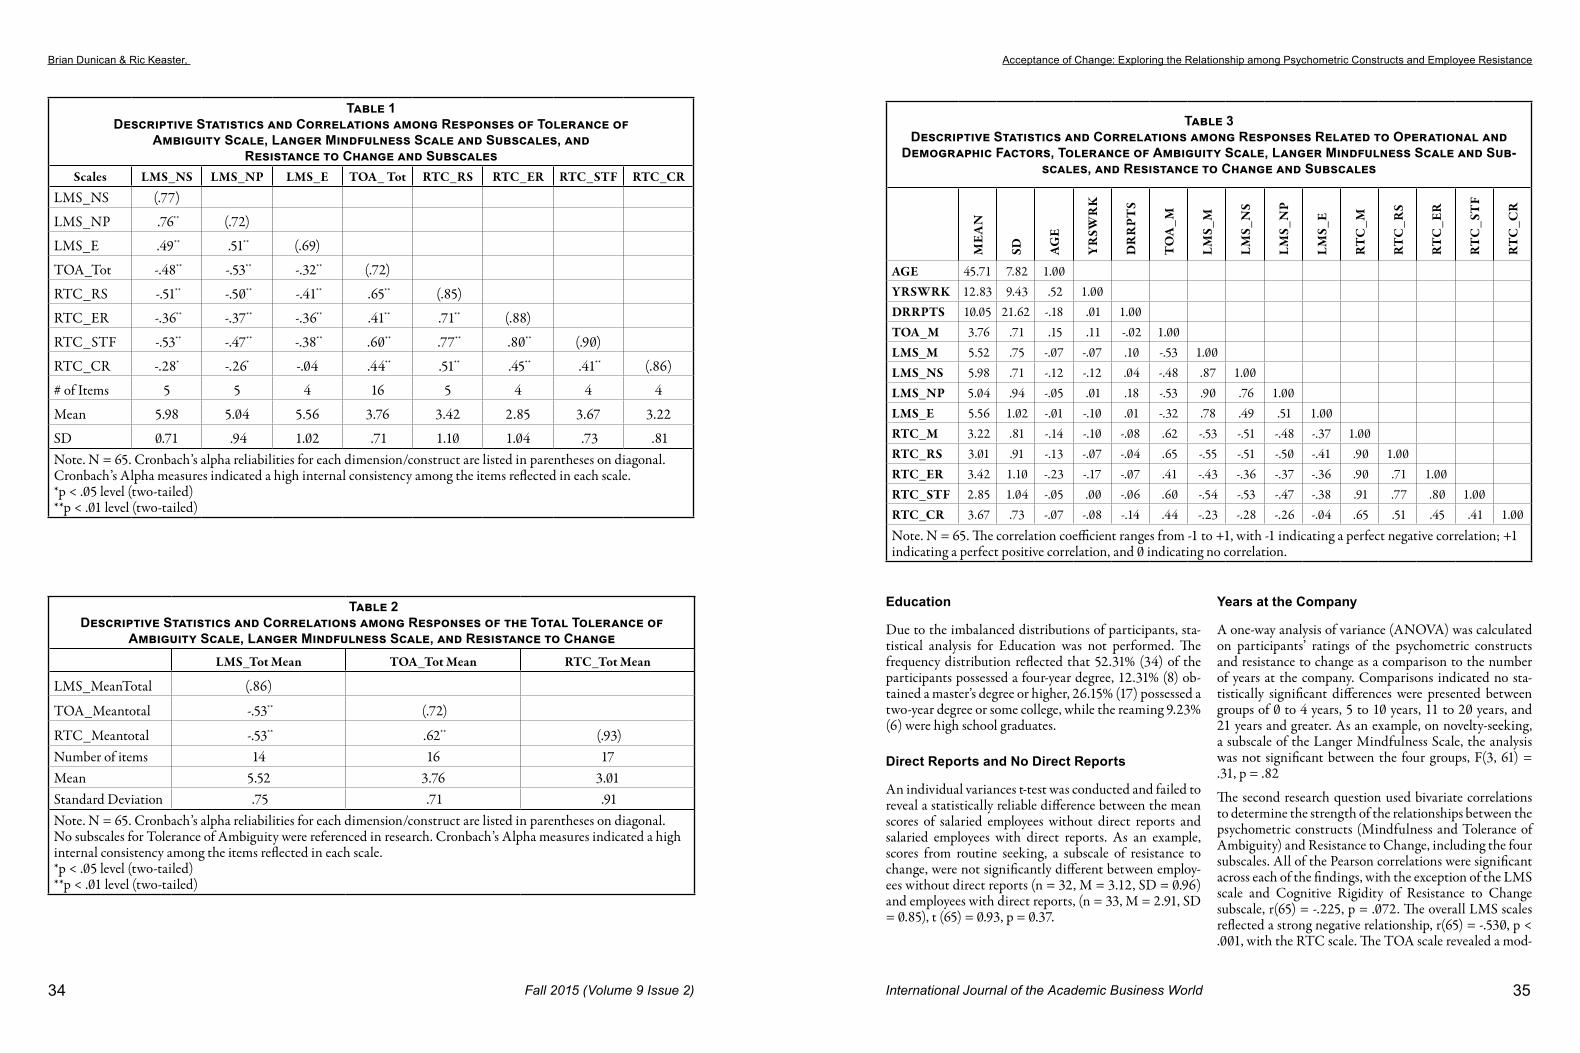
Brian Dunican amp Ric Keaster Acceptance of Change Exploring the Relationship among Psychometric Constructs and Employee Resistance
36 International Journal of the Academic Business World 37Fall 2015 (Volume 9 Issue 2)
erate positive correlation r(65) = 624 p lt001 Further bivariate analyses for LMS explored the strength of the re-lationships between the subscales of the Langer Mindful-ness Scale and the subscales of the Resistance to Change scales The correlational analysis was statistically signifi-cant between all variables except Engagement of the LMS and Cognitive Rigidity of RTC r(63) = -35 p = 781 concluding that the variables were unrelated
The last research question explored the degree of the re-lationship between Mindfulness and Tolerance of Am-biguity Bivariate analyses were used to correlate the re-lationship between the two psychometric constructs The correlations revealed a significantly strong negative rela-tionship between the total mean score of the LMS and the total mean score of the TOA r(63) = -53 p lt 01 The mean scores for each of the LMS subscales compared to the total mean of the TOA showed the following Nov-elty-seeking and TOA r(63) = -48 p lt 01 Novelty-pro-ducing and TOA r(63) = -53 p lt 01 and Engagement and TOA r(63) = -32 p lt 01 It is important to note that higher scores on the Tolerance of Ambiguity scale indicate a greater intolerance of ambiguity Tables 1 and 2 display a descriptive analysis and correlations for each of the scales and subscales The correlations between vari-ables are presented in Table 3
LIMITATIONS OF THE STUDY
Research inherently contains limitations The current study is no exception First the nature of measuring psy-chometrics is subjective Since psychometrics studies mea-sure the way in which individuals think and act (Norton 1975) influences of the organizationrsquos environment could affect individualsrsquo responses to questions Additionally external variables at the time of data collection not related to the study itself can skew the responses and influence the outcomes Other views of limitation rest on the gen-eralizability of the results which may be limited for the following reasons (a) the unit of analysis is at the indi-vidual level (b) data were collected from a limited num-ber of operations within the state of Kentucky through convenience sampling and (c) individual biases that may be introduced at the time of testing
The unit of analysis for data collection rests at the indi-vidual level rather than the group level due to the acces-sibility of the employees Although the survey collection method allows for comparison with larger groups it lim-its the opportunity to explore issues in depth therefore assumptions are made for individuals in similar groups Next the data collected represents limited industries in the state of Kentucky restricting the number of partici-pants and the ability to generalize outcomes to other in-dustries different than those outlined in the current study
Last respondentsrsquo values interests and beliefs regarding the online self-administered surveys may introduce biases unknown by the researcher As a consequence of these limitations and the collection of data during one point in time the results are generalizable only to the groups or populations that are similar to those in the current study
SUMMARY AND CONCLUSION
Change within organizations is inevitable That real-ity will remain constant in organizationsmdashand in onersquos personal and professional life (Conner 1992) The way in which one chooses to cope with change could be a decid-ing factor of success failure or choosing to remain the samemdashwhich in organizations tends to equate with fail-ure particularly if change means simply improving Resis-tance is a natural reaction to change and is part of the hu-man psyche Research and literature support this notion of human nature to resist change and elements related to the process of change (Coch amp French 1948 Conner 1992 Oreg 2003 OrsquoToole 1995 Zander 1950) It is possible that a greater understanding of mindfulness and tolerance of ambiguity could increase the possibilities of new ideas to drive lower resistance to change The current study explored the two psychometric constructs of mind-fulness and tolerance of ambiguity and their relationship to resistance to change within industrial settings Bivari-ate correlations yielded both strong positive and negative correlations among the three scales assessed by salaried employees located across different industries The Langer Mindfulness Scale Budnerrsquos Tolerance of Ambiguity Scale and Oregrsquos Resistance to Change scale were attrib-uted to the foundation of the current study The results contributed to the practical and theoretical significance of individualsrsquo responses to change through the measure-ment of the aforementioned constructs To the extent the findings in the current research could be extrapolated to other industries or organizations a final suggestion should be noted When considering future directions for research related to probing psychometric constructs and resistance to change the current study may have relevance across different nationalities and cultures The elements of change will continue to challenge the fabric of organiza-tions while the internal and external pressures of rising costs variations in supply and demand relentless compe-tition and developing technology test the resolve for sur-vival The readiness of individuals within organizations and their ability to challenge perceptions of change and resistance may determine their competitiveness and ulti-mately their success
REFERENCES
Argyris C amp Schon D (1978) Organizational learning A theory of action research Reading MA Addison-Wesley
Armbruster H Bikfalvi A Kinkel S amp Lay G (2008) Organizational innovation The challenge of measur-ing non-technical innovation in large-scale surveys Technovation 28(10) 644-657
Armenakis A A amp Bedeian A G (1999) Organiza-tional change A review of theory and research in the 1990s Journal of Management 25 293-315
Armenakis A A Harris S G amp Mossholder K W (1993) Creating readiness for organizational-change Human Relations 46(6) 681-703
Banning K C (2003) The effect of the case method on tolerance for ambiguity Journal of Management Edu-cation 27 556-567
Bodner T E amp Langer E J (2001 June) Individual differences in mindfulness The MindfulnessMind-lessness Scale Poster presented at the 13th annual American Psychological Society Conference Toronto Ontario Canada
Bovey W H amp Hede A (2001) Resistance to organisa-tional change The role of defence mechanisms Journal of Managerial Psychology 16(7) 534-548
Brown K W amp Ryan R M (2003) The benefits of be-ing present Mindfulness and its role in psychological well-being Journal of Personality and Social Psychol-ogy 84 822-848 doi1010370022-3514844822
Brown K W amp Ryan R M (2004) Perils and promise in defining and measuring mindfulness Observations from experience Clinical Psychology Science and Practice 11(3) 242-248 doi101093clipsybph078
Budner S (1962) Intolerance of ambiguity as a personal-ity variable Journal of Personality 30 29-59
Burke W W (2014) Organizational change theory and practice Thousand Oaks CA Sage Publications Inc
Carson S H amp Langer E J (2006) Mindfulness and self-acceptance Journal of Rational-emotive and Cog-nitive-behavior Therapy 24(1) 29-43
Coch L amp French J (1948) Overcoming resistance to change Human Relations 1 512-532
Coghlan D (1993) A person-centred approach to deal-ing with resistance to change Leadership amp Organi-zation Development Journal 14(4) 10-14
Cohen J (1988) Statistical power analysis for the behav-ioral sciences Hillsdale NJ Lawrence Erlbaum Associates
Conner D R (1992) Managing at the speed of change How resilient managers succeed and prosper where others fail New York Random House
Demers C (2007) Organizational change theories Thousand Oaks CA Sage Publications Inc
Dent E B amp Goldberg S G (1999) Resistance to change A limiting perspective Journal of
Ehrlich S B Meindl J R amp Viellieu B (1990) The charismatic appeal of a transformational leader An empirical case study of a small high-technology con-tractor The Leadership Quarterly 1(4) 229-247
Ford J D Ford L W amp McNamara R T (2002) Re-sistance and the background conversations of change Journal of Organizational Change Management 15(2) 105-121
Frenkel-Brunswik E (1948) Tolerance toward ambigu-ity as a personality variable American Psychologist 3 268-269
Furnham A amp Ribchester T (1995) Tolerance of am-biguity A review of the concept its measurement and applications Current Psychology 14 179-199
Gaumlrtner C (2013) Enhancing readiness for change by enhancing mindfulness Journal of Change Manage-ment 13 52-68
Geller E S (2002) Leadership to overcome resistance to change It takes more than consequence control Jour-nal of Organizational Behavior Management 22(3) 29-49
Gondo M Patterson K W amp Palacios S (2013) Mind-fulness and the development of a readiness for change Journal of Change Management 13(1) 36-51
Greenwood R amp Hinings C R (1996) Understanding radical organizational change Bringing together the old and the new institutionalism Academy of Manage-ment Review 21 1022-1054
Isabella L (1990) Evolving interpretations as a change unfolds How managers construe key organization-al events Academy of Management Journal 33 7-41
Iverson R D (1996) Employee acceptance of organiza-tional change The role of organizational commitment International Journal of Human Resource Manage-ment 7 122-149
Jacobs P (2005) Five steps to thriving in times of un-certainty Harvard Management Update 10(12) 3-5
Brian Dunican amp Ric Keaster
38 Fall 2015 (Volume 9 Issue 2)
Retrieved from httphbrorgproductfive-steps-to-thriving-in-times-of-uncertaintyanU0512A-PDF-ENG
Judge T A Thoresen C J Pucik V amp Welbourne T M (1999) Managerial coping with organization-al change A dispositional perspective Journal of Ap-plied Psychology 84 107-122
Judson A (1991) Changing behavior in organizations Minimizing resistance to change Cambridge MA Basil Blackwell
Kanter R M (1985) Supporting innovation and ven-ture development in established companies Journal of Business Venturing 1 47-60
Kets de Vries M F R Ramo L amp Korotov K (2009) Organizational culture leadership change and stress INSEAD Working Papers Collection 10 2-26 Re-trieved from httpwwwinseadedufacultyresearchresearchdoccfmdid=41924
Kotter J P (1995) Leading change Why transformation efforts fail Harvard Business Review 73(2) 59-67
Lane M S amp Klenke K (2004) The ambiguity toler-ance interface A modified social cognitive model for leading under uncertainty Journal of Leadership amp Organizational Studies 10(3) 69-81
Langer E J (1993) A mindful education Educational Psychologist 28 43-50
Langer E J (1997) The power of mindful learning Read-ing MA Addison-Wesley
Lawrence P R (1954) How to deal with resistance to change Harvard Business Review 32(3) 49-57 Retrieved from httpedsaebscohostcomlib-srvwkueduehostpdfviewerpdfviewervid=6ampsid =699bab3d-bcec-40d9-ac69-a42c853d72bc40sessionmgr4004amphid=4108
Lewin K (1947) Frontiers in group dynamics II Chan-nels of group life social planning and action research Human Relations 1(2) 143-153
Lewin K (1951) Field theory in social science Selected theoretical papers New York Harper amp Row
Limerick D Passfield R amp Cunnington B (1994) Transformational change Towards an action learning organization The Learning Organization 1(2) 29-40
Mabin V J Forgeson S amp Green L (2001) Harness-ing resistance Using the theory of constraints to assist change management Journal of European Industrial Training 25(234) 168-191
Maurer R (2009) Introduction to change without mi-graines Omaha NE Maurer and Associates Re-trieved from httpextensionmissouriedustaffsde-teams DocumentsChangeW-outMigrarainespdf
Norton R W (1975) Measurement of ambiguity toler-ance Journal of Personality Assessment 39 607-619
Offermann L R amp Gowing M K (1990) Organiza-tions of the future Changes and challenges Ameri-can Psychologist 45(2) 95-108 doi10370003-066X45295
Oreg S (2003) Resistance to change Developing an in-dividual differences measure Journal of Applied Psy-chology 88 680-693
Oreg S (2006) Personality context and resistance to organizational change European Journal of Work and Organizational Psychology 15 73-101
Oreg S Vakola M amp Armenakis A (2011) Change re-cipientsrsquo reactions to organizational change A 60-year review of quantitative studies The Journal of Applied Behavioral Science 47 461-524
OrsquoToole J (1995) Leading change The argument for val-ues-based leadership Boston MA Ballentine Books
Pirson M Langer E J Bodner T amp Zilcha-Mano S (2012) The development and validation of the Langer Mindfulness Scale-Enabling a socio-cognitive perspec-tive of mindfulness in organizational contexts Ford-ham University School of Business Research Paper Re-trieved from httpdxdoiorg102139ssrn2158921
Stanley D J Meyer J P amp Topolnytsky L (2005) Employee cynicism and resistance to organizational change Journal of Business and Psychology 19(4) 429-459
Topping P (2002) Managerial leadership New York McGraw Hill Professional
Van Dam K Oreg S amp Schyns B (2008) Daily work contexts and resistance to organisational change The role of leader-member exchange development climate and change process characteristics Applied Psycholo-gy An International Review 57 313-334 doi101111j1464-0597200700311x
Weinstein N Brown K W amp Ryan R M (2009) A multi-method examination of the effects of mindful-ness on stress attribution coping and emotional well-being Journal of Research in Personality 43 374-385
Zander A F (1950) Resistance to change Its analysis and prevention Advanced Management 4(5) 9-11
International Journal of the Academic Business World 39
INTRODUCTION
Cloud computing is one of the most talked about infor-mation technology topics these days 7 24 Early literature review reveals an endemic confusion of what cloud com-puting is does and what it stands for We posit that the cloud metaphor 3 20 fosters a confusion that persists even today
The goal of this research paper is to look back and make historical sense of cloud computing We try to find the lineage of cloud computing where the phrase cloud com-puting came from who came up with the term and how it found currency in the IT community We trace cloud computing to early timesharing and Application Service Provider (ASP) in the last decade and posit a future of utility computing
Additionally we try to shed light on the current state of cloud computing provide a comprehensive definition of the term and its main building blocks
CLOUD COMPUTING IN THE ACADEMIC LITERATURE
A metaphor
In an article by Ian Foster and Steven Tuecke 3 the authors start by describing the well-known elephant fable where a group of blind people are asked to describe an elephant and not surprisingly each provides a different view
The cloud is a metaphor for the Internet Itrsquos a rebranding of the Internet that is why there is a raging debate By vir-tue of a metaphor itrsquos open to different interpretations 20
Confusion and Frustration
The word ldquocloudrdquo in cloud computing informs very little and it may even misinform ldquoI hated it but I finally gave inrdquo says Carl Bass President and CEO of Autodesk He adds ldquoI didnrsquot think the term helped explain anything to people who didnrsquot already know what it isrdquo20
Giving the lsquocloudrsquo name to the old concept of large shared distributed systems is misleading 4 p 26
Larry Ellison Oraclersquos CEO ldquoThe interesting thing about cloud computing is that wersquove redefined cloud computing everything that we already dohellipI donrsquot understand what we would do differently in light of cloud computing other than change the wording of some of our adsrdquo 1 p 50
In an article in Harvard Business Review (HBR) 22 the author asks a rhetorical question ldquoWhat the heck does it mean to have a lsquocloudrsquo It means that the functions you want like storage communications and applications donrsquot need to live on the device you have in front of you You can get them on demand from the networkrdquo We should ask the question ldquoin a typical non-cloud IS en-vironment do we really have the stated functions on the device in front of usrdquo
Cloud Computing is often confused with Utility Com-puting but they are not the samemdashrather the latter forms part of the former 2
No Definition
Realizing the elephantine nature of cloud computing there is a reluctance to define it Question How would you define cloud computing Answer Cloud computing
The Origin and Construct of Cloud Computing
Nozar Daylami PhD Adjunct Professor
School of Management Information System and Technology Program
California Lutheran University Thousand Oaks CA 91360
ABSTRACTCloud computing is one of the most talked about information technology topics these days A literature review reveals an endemic confusion of what cloud computing stands for This paper tries to shed light on why the term is so confusing We try to find where the phrase cloud computing came from and how it found currency in the IT community We trace cloud computing to early timesharing and Application Service Provider (ASP) in the last decade and posit a future of utility computing This paper also provides a comprehensive definition of the term and its main building blocks
Nozar Daylami The Origin and Construct of Cloud Computing
40 International Journal of the Academic Business World 41Fall 2015 (Volume 9 Issue 2)
is not so much a definition of a single term as it is a trend in service delivery taking place today 3 p 52
An Old Concept
Cloud computing is an old concept it ldquois a throwback to the mainframe model of computingrdquo 19 p 78 Clearly cloud computing is simply remote computing 4 p 26
Internet or Network Computing
Cloud computing as a term for Internet-based computing service was launched by industry giants Google Ama-zon etc in late 2006 24 ldquoIt is the movement of applica-tion services onto the Internet and the increased use of the Internethelliprdquo
The Earliest Publications
In the first article on Cloud Computing in the Communi-cations of ACM 9 it is referred to as ldquothe compute cloudrdquo and is deemed synonymous with ldquoon-demand comput-ing software as a service or the Internet as a platformrdquo Though these other naming conventions are self-explana-tory cloud computing is not
The cloud computing is understood as a shift of the ge-ography of computing It begs the question if it is about moving delivery of a wide variety of information services onto to the Internet why donrsquot we call it ldquoInternet Com-putingrdquo
The first time cloud computing showed up in a HBR pub-lication was in a digital article in April 2008 14 The au-thor states that the move to cloud computing would be disruptive to incumbent players of shrink-wrapped gam-ing software assuming his readers understand what cloud computing entails
A BRIEF HISTORY OF COMPUTING
In the early days of computers they were big and expen-sive So sharing this big expensive gadget was a normal practice Most organizations did not usually own this big machine but those who did had to share it across an en-terprise That was the era of timesharing
However as computers got cheaper and more afford-able every company every department and then finally every person decided to have their own computer How-ever standalone computers are of limited use So we networked them first locally in a Local Area Network (LAN) environment and then far and wide Wide Area
Network (WAN) Then we networked the network and the World Wide Web was born
At the same time in a different parallel universe some-thing else was happening In the early years no commer-cial off-the-shelf software (COTS) was available Every organization had to write its own software program So if you wanted to computerize your accounting general led-ger payables and receivables or run your inventory you had to write your own applications
Buying off-the-shelf applications was also considered ldquooutsourcingrdquo Why Because you were having others do the work for your organization which was supposed to be doing this work for itself So over the years most appli-cation development have been outsourced to burgeoning software companies such as IBM Oracle and SAP
OUTSOURCING AND ASP
In a general sense IS outsourcing is nothing newmdashit has always been considered an option for IT solutions 11 Electronic Data Systems was handling data processing services for Frito-Lay and Blue Cross as early as 1963 IS outsourcing soon became widely known as the second of a three-phase outsourcing phenomenonmdashtraditional out-sourcing being the first phase and application outsourcing being the third 6
In the early years of the last decade xSPs service provid-ers of all stripes were leading into a new generation of IT where it really did not matter where the applications reside as long as we had access to accomplish what we wanted 247 However back then an Application Service Provider (ASP) was thought by some to be another re-incarnation of the old ldquotimesharingrdquo leveraging network technologies 22
However the understanding of an evolving net-centric computing was already there In their book published in 2002 aptly titled NetSourcing authors Kern Lacity and Willcocks 7 define a computing framework and services stack thatrsquos similar to Cloud Computing The authors state ldquoWe selected the term ldquoNetsourcingrdquo as the over-arching name because the common element of any xSP is the delivery of a product or service over a networkrdquo (p 3) The ldquonetworkrdquo however is now synonymous with the ldquoInternetrdquo
Today cloud computing is about getting the job done in whatever way shape or form that may be required Orga-nizations and individuals need the utility of computing and where it comes from by and large is of no concern As early as 1961 Professor John McCarthy predicted that computation may someday be organized as a public utility ldquoEach subscriber needs to pay only for the capac-
ity he actually uses but he has access to all programming languages characteristics of a very large system hellip Certain subscribers might offer services to other subscribers hellip The computer utility could become the basis of a new and im-portant industry 8 McCarthyrsquos notion of ldquoutility comput-ingrdquo is here right nowmdashthat is ldquocloud computingrdquo
This point is confirmed by others 1 p 51 ldquoThe data center hardware and software is what we consider a cloud When a cloud is made available in a pay-as-you-go manner to the general public we call it utility computingrdquo
CLOUD COMPUTING ORIGIN OF THE PHRASE
Coinage of the term ldquocloud computingrdquo has been traced to two individuals who at the time they came up with this term worked for Compaq Computer George Favaloro a Compaq marketing executive and Sean OrsquoSullivan the founder of the now defunct business NetCentric 20
A Compaq internal document marked as confiden-tial dated November 14 1996 and provided by Sean OrsquoSullivan contemplates a Cloud Computing ldquostrat-egyrdquo10
But the creation of this term did not find currency for another decade Many believe the first use of ldquocloud com-
putingrdquo in its modern context occurred on August 9 2006 when then Google CEO Eric Schmidt introduced the term at an industry conference ldquoWhatrsquos interesting [now] is that there is an emergent new modelrdquo Schmidt said ldquoI donrsquot think people have really understood how big this opportunity really is It starts with the premise that the data services and architecture should be on servers We call it cloud computingmdashthey should be in a ldquocloudrdquo somewhererdquo 19
CLOUD COMPUTING DEFINITION
The National Institute of Standards and Technology (NIST SP 800-145) defines Cloud Computing in the fol-lowing way ldquoCloud computing is a model for enabling convenient on-demand network access to a shared pool of configurable computing resources (eg networks serv-ers storage applications and services) that can be rapidly provisioned and released with minimal management ef-fort or service provider interaction This cloud model is composed of five essential characteristics three service models and four deployment modelsrdquo 17
The following diagram places all the pieces together in a visual form
The Conceptual Reference Model
Cloud Computing Reference Architecture NIST Special Publication 500-292
Nozar Daylami The Origin and Construct of Cloud Computing
42 International Journal of the Academic Business World 43Fall 2015 (Volume 9 Issue 2)
Cloud Computing Reference Architecture NIST Special Publication 500-292
NIST Special Publication 500-292 states that ldquothe defini-tion is widely accepted as a valuable contribution toward providing a clear understanding of cloud computing tech-nologies and cloud services It provides a simple and un-ambiguous taxonomy of three service models available to cloud consumers cloud software as a service (SaaS) cloud platform as a service (PaaS) and cloud infrastructure as a service (IaaS) It also summarizes four deployment mod-els describing how the computing infrastructure that delivers these services can be shared private cloud com-munity cloud public cloud and hybrid cloudrdquo 18 Finally the NIST definition also provides a unifying view of five essential characteristics that all cloud services exhibit on-demand self-service broad network access resource pool-ing rapid elasticity and measured service 18
This publication further states that ldquoThese services and their delivery are at the core of cloud computing In the cloud computing model the primary focus is a more eco-
nomic method of providing higher quality and faster ser-vices at a lower cost to the usersrdquo
The Cloud Security Alliance 21 provides a more transpar-ent narrative of what Cloud Computing is ldquoa model for enabling ubiquitous convenient on-demand network access to [a] shared pool of configurable computing re-sources [it] has the potential to enhance collaboration agility scaling and availability and provides opportunity for cost-reduction the model envisages a world where components can be rapidly orchestrated provisioned implemented and decommissioned scaled up or down to provide an on-demand utility-like modelrdquo
A SPATIAL VIEW OF CLOUD COMPUTING
The NIST Computing Reference Architecture is a flat depiction of the cloud computing model A three dimen-sional view of the model by Craig-Wood 2 is a spatial de-piction Here you can see the three dimensions of cloud computing that renders the elephant fable
Computing Services Framework
Infrastructure as a Service (IaaS) As the word ldquoinfra-structurerdquo implies this is the most basic of services Cus-tomers can buy processing storage and network services and then build their own systems on top of this infra-structure A pioneer in the IaaS field is Amazon with its Amazon Elastic Compute Cloud (EC2)
However most big names in the IT field from Micro-soft (Azure) to Google (App Engine) provide IaaS Here customers are not renting specific servers hard drives and network switches or any particular equipment but instead they are utilizing the infrastructure that is most certainly simulated by virtualization software allowing multiple customers to be served by the same array of physi-cal devices IaaS provides the raw power of computingmdashstorage included
Cloud Computing would not be possible without virtu-alization Virtualization is the ability to make a virtual machine (VM) act like a physical computer Just like a physical computer with its own processor operating sys-tem and storage each VM has its own components too The benefit of virtualization though is that you can put much more than only one VM even with different oper-ating systems on the same server Doing so dramatically increases each serverrsquos potential for serving clientsrsquo on-demand needs (8)
Platform as a Service (PaaS) The next level up is where vendors provide not only the raw powermdashthe infrastruc-turemdashbut preconfigured systems running operating sys-tems databases and platforms (programming languages) for building applications For example Microsoftrsquos Azure service provides preconfigured computers running Win-dows and SQL Server And Salesforcecom has Forcecom as its own custom application development platform
In practice the boundary between IaaS and PaaS is not always clear Because IaaS providers most often provide other services such as operating systems database or ap-plication development platform that fall in the PaaS cat-egory In its purest form IaaS can be considered as virtual machines (raw processing power and storage) that can be scaled up and down as you need
Software as a Service (SaaS) Another higher layer is where vendors provide full applications running on cloud infrastructuremdashtheir own or rented from the likes of Amazon Salesforcecom has long been considered one of the most successful SaaS provider Salesforececom CRM was one of the early entrants into the market Salesforcecom prides itself on being a pioneer in Cloud Computing
At Salesforcecom itrsquos all about the Cloud However in their collateral literature dated circa 1993-94 you wonrsquot find any mention of the word ldquocloudrdquo
CLOUD COMPUTING CONCERNS
In survey after survey security is listed as the top concern of Cloud Computing However Cloud Security Alliance (CSA) the industry group that provides security guide-lines and education states that ldquosecurity controls for the cloud computing are for in most part no different than the security controls in any IT environment hellip[however] cloud computing may present different risks to an organi-zation than traditional IT solutionsrdquo 21 p 21
CIOs or CEOs for that matter may feel safer when they ldquoownrdquo versus ldquorentrdquo their IT assets However when you deploy your assets on the Internet for which you eventu-ally will have little choice you will inherit a set of vulner-abilities that are not all that different from the Cloudrsquos Ownership has its own set of financial risks in the form of capital expenditures (CAPEX) that need to be budgeted and spent up front Compare that risk with the far smaller risk of renting (OPEX) which by and large can be dis-continued if needed
Cloud computing technology does not require the use of public networks If your data is too strategically critical and sensitive to be deployed on the Internet you could instead deploy a private cloud that is strictly for your or-ganization Obviously a Private Cloud is more expensive and it needs trained staff However a private cloud lets an organization benefit from cloud technology without the risk of possible public disclosure of its data
Another alternative could be a community cloudmdasha pri-vate cloud that is shared by several organizations for spe-cific needs For example a group of hospitals might create a community cloud to hold patientrsquos medical records
CONCLUSION
Cloud Computing is here to stay and grow Clouds are more versatile than traditional IT networks on many di-mensions They are far more convenient to deploy they have far more potential for collaboration and they are far more scalable than traditional IT ever was The delivery of services is provisioned on global telecommunication net-works that these days have morphed into the Internet And when they mature they will provide a computing utility when and where it is needed
Cloud computing model (adapted from Craig-Wood)
Nozar Daylami The Origin and Construct of Cloud Computing
44 International Journal of the Academic Business World 45Fall 2015 (Volume 9 Issue 2)
BIBLIOGRAPHY
1 Armburst M et al A View of Cloud Computing Communications of the ACM Vol 53 No 4 pages 50-58
2 Craig-Wood K Definition of Cloud Computing incorporating NIST and G-Cloud views httpswwwkatescommentcomdefinition-of-cloud-com-puting-nist-g-cloud Access date April 26 2015
3 Creeger M CTO Roundtable Cloud Computing Communications of the ACM Vol 52 No 8 pages 50-56
4 Cusumano M Cloud Computing and SaaS as New Computing Platforms Communications of the ACM Vol 53 No 4 pages 27-29
5 Foster Ian and Tuecke Steven Describing the Ele-phant The Different Faces of IT as Service wwwac-mqueuecom JulyAugust 2005 pages 26-34 httpdeliveryacmorg10114510900001080874p26-fosterpdf ip=99100108167ampid=1080874ampacc=OPENampkey=4D4702B0C3E38B352E4D4702B0C3E38B352E4D9421298D07BF362E6D218144511F3437ampCFID=505172814ampCFTOKEN=56369758amp__acm__=1429816554_402a40f1d60056fb68e8ccf3fdd96201 accessed April 23 2015
6 Kern Thomas Lacity Mary Cecelia Willcocks Leslie P Netsourcing Renting Business Applica-tions and Services Over a Network Prentice Hall 2002
7 Knoblauch A Deconstructing Cloud Smashwords Edition (Kindle Version) First Edition August 2013
8 Garfinkel Simon (2011 Oct 3) The Cloud Imperative MIT Technology Review httpwwwtechnologyreviewcomnews425623the-cloud-imperative
9 Hayes B Cloud Computing Communications of the ACM Vol 51 No 7 pages 9-11
10 Internet Solution Division Strategy for Cloud Com-puting Compaq Computer Corporation (1996) httpwwwtechnologyreviewcomsitesdefaultfileslegacycompaq_cst_1996_0pdf
11 Lacity M C Hirschheim R Information Systems Outsourcing Myths Metaphors and Realities New York John Wiley amp Sons 1993
12 McAfee A The Year the Cloud Rolled In httpshbrorg2010122010-the-year-the-cloud-rolled Access date April 23 2015
13 McAfee A What Every CEO Needs to Know About the Cloud httpshbrorg201111what-every-ceo-needs-to-know-about-the-cloud Access date April 23 2015
14 McGrath R Whorsquos Disrupting the Gaming Indus-try httpshbrorg200804whos-disrupting-the-gaming-ind Access date April 23 2015
15 Mell P Grance T The NIST Definition of Cloud Computing National Institute of Standards and Technology httpcsrcnistgovpublicationsnist-pubs800-145SP800-145pdf
16 Neumann P Risks and Myths of Cloud Comput-ing and Cloud Storage Communications of the ACM Vol 57 No 10 pages 25-27 The NIST Defi-nition of Cloud Computing httpcsrcnistgovpublicationsnistpubs800-145SP800-145pdf
17 NIST Definition of Cloud Computing httpcsrcnistgovpublicationsnistpubs800-145SP800-145pdf
18 NIST Cloud Computing Reference Architecture National Institute of Standards and Technology Special Publication 500-292 httpwwwnistgovcustomcfget_pdfcfmpub_id=909505
19 Nanavati M Colp P Aiello W and Warfield A Cloud Security A Gathering Storm Communica-tions of the ACM Vol 57 No 8 pages 70-79
20 Regalado Antonio (2011 Oct 31) Who coined cloud computing MIT Technology Review httpwwwtechnologyreviewcomnews425970who-coined-cloud-computing
21 Security Guidance for Critical Areas of Focus in Cloud Computing V30 Cloud Security Alliance httpscloudsecurityallianceorgguidancecsagu-idev30pd
22 Seviokla J Does Cisco Have Its Head in the Clouds httpshbrorg200903does-cisco-have-its-head-in-th Access date April 23 2015
23 Walsh K R Analyzing the Application ASP Concept Technologies Economies and Strategies Communications of ACM Vol 46 No 8 pages 103-107
24 Yang H Tate Mary A Descriptive Literature Review and Classification of Cloud Computing Re-search Communications of Association of Informa-tion Systems Vol 31 2012
Nozar Daylami
46 Fall 2015 (Volume 9 Issue 2)
This page intentionally blank
International Journal of the Academic Business World 47
INTRODUCTION
In their paper ldquoSAS and the Efficient Portfoliordquo Thomp-son and El-houbi (2012) develop a SAS program to calcu-late portfolio weights for efficient stock portfolios Their program improves on existing public domain SAS pro-grams of this type by allowing for portfolios with a rela-tively large number of securities Thompson and El-houbi also claim that their SAS program is an improvement over the Excel programs used to calculate portfolio weights which are sometimes included in investment textbooks They note that users concur that their program is easier to use than those Excel programs which either limit the number of securities that can be included in a portfolio require ldquocorrectionsrdquo or ldquoadjustmentsrdquo to overcome some quirks in the Excel Solver routine or require multiple user interventions
The Thompson and El-houbi program is certainly more elegant and user friendly than the equivalent Excel pro-grams and will provide those with access to the SAS pro-gramming language a valuable tool for learning portfolio management The disadvantage of a SAS program how-ever is that many students will not have easy access to the SAS programming language Students at smaller univer-sities may not have any access to SAS while students at many larger universities may only be able to access SAS at a computer lab on campus
In this paper I modify the Thompson and El-houbi SAS program for use in the open-source R programming lan-guage which is available free of charge for anyone with access to the internet Using the R language program to compute portfolio weights for efficient portfolios main-tains the elegance of the Thompson and El-houbi SAS
program while overcoming the disadvantage of limited SAS availability In addition I extend the Thompson and El-houbi program by making use of a quadratic program-ming package available in R to provide a program that can accommodate short-sale restrictions and position limits
THE R PROGRAMMING LANGUAGE
R is a free programming language for statistical analysis and graphics and runs on many UNIX platforms and on Windows and MacOS It is available under the terms of the Free Software Foundationrsquos GNU General Public License R was developed initially by Robert Gentleman and Ross Ihaka both of the University of Auckland (New Zealand) and is based on the S programming language developed at Bell Labs by John Chambers Since its initial development the popularity of R has grown considerably largely because of its ease of use and because of the avail-ability of many add-on packages that allow users to tackle very sophisticated projects
The base R package may be downloaded at httpcranusr-projectorg That web page also provides links to sources of information about R and basic user manuals There are also many books and manuals now available for purchase that offer information on both basic and special-ized uses of the language In fact Vance (2009) suggests that the growing popularity of the R language at univer-sities language could even result in noticeably lower de-mand for SAS
THE MARKOWITZ PORTFOLIO PROBLEM
As Markowitz (1952) notes an investor following the ldquoex-pected returns-variance of returns rulerdquo will choose an ef-
Optimal Portfolios and the R Programming Language
James A TurnerAssistant Professor of Finance
School of Accounting amp TaxationWeber State University
Ogden UT 84408
ABSTRACTThis paper develops a program in the freely available open-source R programming language to calculate weights for optimal stock portfolios The program retains the advantages the Thompson and El-houbi (2012) SAS program has over similar programs in Excel but avoids the potential problem of limited access to SAS that some students and researchers may face The R program also extends the Thompson and El-houbi program by including the ability to accommodate short-sale restrictions and position limits
James A Turner Optimal Portfolios and the R Programming Language
48 International Journal of the Academic Business World 49Fall 2015 (Volume 9 Issue 2)
ficient portfolio that is a portfolio with maximum ex-pected return for a given variance or one with minimum variance for a given expected return The minimum vari-ance formulation of the portfolio choice problem there-fore requires that the investor choose portfolio weights to minimize the variance of a portfolio with a given expected return The problem also requires that all money be in-vested (which means that the portfolio weights must sum to one) In matrix notation the optimization problem is
where w the choice variable is a k times 1 vector of the weights invested in the k securities in the portfolio V is the port-folio variance-covariance matrix and R is a 2 times k matrix whose first row is a vector of ones and whose second row contains the expected returns of each security in the port-folio M is a 2 times 1 vector whose first element is one (corre-sponding to the constraint that the portfolio weights sum to one) and whose second element is the chosen portfo-lio expected return For now there are no restrictions on short sales so some portfolio weights may be negative
The Lagrangian for the problem is
( ) L w Vw M Rwλprime prime= + minus
where λ is a 2 times 1 vector containing the Lagrangian multi-pliers The first-order conditions for a minimum (which are also sufficient conditions in this case) are
Solving the first-order conditions for w and λ yields
( )( )
11 1
112
w V R RV R M
RV R Mλ
minusminus minus
minusminus
prime prime=
prime=
Thompson and El-houbi following Stephens (1998) let 1 H RV Rminus prime= so that
1 1
1
2
w V R H MH Mλ
minus minus
minus
prime=
=
Stephens (1998 p 36) shows how the elements of the H matrix may be used ldquoto fix any meanvariance point on the efficient frontierrdquo
Min st
w VwRw M
prime
=
2 0
0
L Vw RwL M Rw
λ
λ
part prime= minus =partpart
= minus =part
THE BASIC R PORTFOLIO OPTIMIZATION PROGRAM
The R programming language lends itself very easily to matrix manipulation and matrix computation removing much of the difficulty in solving the standard Markowitz portfolio problem The following R program calculates the portfolio weights for an efficient portfolio using stock return data to estimate expected returns and the variance-covariance matrix The user must specify the desired port-folio expected return The program can accommodate portfolios up to about 50 stocks Beyond that number precision limitations of the R language may make the variance-covariance matrix ldquocomputationally singularrdquo and unable to be inverted
The first step in the program is to read in the return data R can input data from many file types but in the present example the data are stored in a comma-delimited Excel file called ldquoReturnscsvrdquo which contains stock return data In this case the Excel file includes a header row labeling each column of returns with identifying information but no row names The program first reads in the data and then determines the number of securities (number of col-umns in the matrix) as shown on the facing page
ADDING SHORT-SALE CONSTRAINTS AND POSITION LIMITS
The above formulation of the portfolio choice problem places no restrictions on short sales and does not accom-modate position limits In reality individual investors and some fund managers may face requirements prohibit-ing short sales Fund managers may also face requirements that either limit the amount that may be invested in one security or sector or instead that a minimum percentage of funds be invested in a certain security or sector Dai Lin and Liu (2011) list several examples of real-world po-sition limits such as a requirement that a small-cap mutu-al fund invest at least a minimum percentage of its funds in small-company stocks In mathematical terms these short-sale restrictions and position limits can be expressed as a series of inequality constraints While reformulating the portfolio choice problem to add inequality constraints is not difficult doing so makes actually solving the prob-lem considerably more difficult
With short-sale restrictions and position limits the port-folio choice problem becomes
0
Min st
w VwRw MSw w
prime
=ge
where w is still the choice variable S is an m times k matrix that defines both the short-sale constraints on the k se-curities in the portfolio and m minus k other restrictions If there are short-sale constraints but no other restrictions the S matrix is simply a k times k identity matrix which when multiplied by the vector w results in the requirement that
0 iw ige forall If there are other restrictions the sub-matrix of S consisting of the first k rows and k columns of S is an identity matrix and the other restrictions are specified by suitable choices of the elements of the remaining rows of S For example suppose there is a position limit placing a maximum of p on the percentage invested in the sev-enth security so that 7 w ple Since the constraints in the optimization problem above have been expressed as non-negativity constraints this position limit must instead take the form 7 w pminus ge minus The row of S corresponding to
the position limit will consist entirely of zeros except for the seventh element which will be minus1 and corresponding element of the w0 vector would be p
Introducing other forms of position limits simply requires adding the appropriate rows to the S matrix For example if there is a requirement that the total percentage invested in the first and third securities equal or exceed a certain percentage q then one row of S should be [1 0 1 0 0]and the corresponding element of the w0 vector would be q If there is instead a requirement that the total percentage invested in the first and third securities not exceed a cer-tain amount q the required row of S would be [-1 0 -1 0 0] and the corresponding element of the w0 vector would be minusq Other restrictions may be specified similarly For problems that include position limits each of the first k el-
The BASIC R Portfolio Optimation Program
Returns ltminus readtable(ldquoReturnscsvrdquo header = TRUE sep = ldquordquo)Rmat ltminus asmatrix(Returns) Converts the data to matrix formk ltminus ncol(Rmat) Number of columns (number of securities in the portfolio) Now the program calculates the estimate of the variance-covariance matrix (V) the M vector and the R matrix which includes the estimate of the expected returns
V ltminus var(Rmat) Calculates the sample variance-covariance matrix which is used as the estimate of the variance-covariance matrix
Erp ltminus 001 Sets the desired expected portfolio return The user can change this value as desired
M ltminus rbind(1 Erp) Ones ltminus rep(1 k) Ravg ltminus colMeans(Rmat)
Defines the M matrix including the required portfolio return Defines a 1 x k matrix of ones Calculates average returns by column giving a 1 x k matrix of estimated expected returns
R ltminus rbind(Ones Ravg) Combines Ones and Ravg into the 2 x k matrix R Finally the program calculates the portfolio weights and the portfolio variance
VINV ltminus solve(V) Calculates the inverse of the estimated variance-covariance matrixH ltminus RVINVt(R) Calculates the H matrixHINV ltminus solve(H) Calculates the inverse of Hw lt- VINVt(R)HINVM Calculates the portfolio weightsPvar lt- t(w)Vw Calculates the portfolio variance The following commands display the results of the calculations
print(w) Prints the elements of the w vectorprint(Pvar) Prints the variance of the portfolio formed using the weights w
James A Turner Optimal Portfolios and the R Programming Language
50 International Journal of the Academic Business World 51Fall 2015 (Volume 9 Issue 2)
ements of the w0 vector will be zero corresponding to the non-negativity constraints and the remaining elements will equal the percentages associated with the position limits entered as positive or negative numbers depend-ing on whether the position limits establish minimums or maximums
The Lagrangian for this problem is
( ) ( )0 L w Vw M Rw w Swλ microprime prime prime= + minus + minus
where λ is a 2 times 1 vector containing the Lagrangian multi-pliers on the equality constraints and micro is an m times 1 vector of the Lagrangian multipliers on the k short-sale constraints and the m ndash k position limits The first-order necessary con-ditions for this problem are the Kuhn-Tucker conditions
( )0 0
2 0
0
0 0 and 0
L Vw R SwL M Rw
L w Sw w Sw
λ micro
λ
micro micromicro
part prime prime= minus minus =partpart
= minus =partpart prime= minus le ge minus =part
The final set of conditions are known as the complementa-ry slackness conditions since if an element of partLpartμ does not equal zero (ie if the required condition is slack) then the corresponding element of micro must equal zero and vice versa Because of the complementary slackness conditions in order to find a solution to the optimization problem each condition must be checked individually to deter-mine the possible solutions If there are more than a very few constraints finding the candidate solutions manually becomes extremely tedious
Fortunately it is possible to use numerical methods to solve this type of non-linear programming program This is where the strength of the R programming language be-comes very evident The R language provides access to an extensive number of add-on packages developed by R us-ers around the world In particular there are several pack-ages that implement numerical methods to find solutions to optimization problems with inequality constraints Perhaps the package that most easily lends itself to solv-ing the current problem is the ldquoquadprogrdquo package Ac-cording to the documentation included with the pack-age the quadprog routine ldquoimplements the dual method of Goldfarb and Idnani (1982 1983) for solving qua-dratic programming problems of the form min(d΄b+frac12b΄Db)) with the constraints Aʹbgtb₀rdquo For the optimization problem currently under consideration the d vector will be a zero vector the b vector will be the w vec-tor of portfolio weights the D matrix will be the variance-
covariance matrix V and the matrix A΄ will equal a matrix formed by combining the R matrix and the S matrix such that A΄= [R
S ]and A = [ R΄ S΄] Since the V matrix is symmetric the term frac12b΄Db = frac12w΄Vw is a quadratic form Also because the d vector is a zero vector the presence of the frac12 term in the quadratic form does not change the value of the solution to the current portfolio optimization problem That is the weights that minimize frac12w΄Vw sub-ject to the constraints will also minimize w΄Vw subject to the constraints
THE R PORTFOLIO OPTIMIZATION PROGRAM WITH PACKAGE ldquoQUADPROGrdquo
The ldquoQuadprogrdquo package is one of many add-in packages available to R users To use add-in packages in R the user must first download and install the chosen package This is done through the ldquoPackagesrdquo command in the menu bar of the console window Selecting the ldquoInstall package(s)rdquo command from the drop-down box will bring up a list of download locations After selecting a download location the user selects the package(s) to download and install Finally once the selected package is downloaded and in-stalled it must be loaded for use in the current R session which is done by choosing ldquoPackagesrdquo command on the menu bar and then choosing the ldquoLoad packagerdquo com-mand from the drop-down box A list of available packag-es will then appear and the user should select the desired package in this case the ldquoquadprogrdquo package Once the quadprog package is loaded the following program will solve the portfolio problem with short-sale restrictions and position limits
In the present example the short-sale constraint requires that all elements of the w vector be non-negative In addi-tion there are three position limits The first position lim-it requires that no more than 5 of total funds be invested in the seventh security The second position limit requires that no more than a total of 40 of available funds be in-vested in the first and third securities The third position limit requires that total of at least 30 of available funds be invested in the second and fourth securities
The program will make use of the M matrix and the vari-ance-covariance matrix V from the earlier program so those variables must be saved by the user or the following program must be run after running the previous program and before exiting R The new program first sets the posi-tion limits as shown on the facing page
The output of the ldquosolveQPrdquo function includes the values of w and the Lagrangian multipliers for each constraint If the value of a Lagrangian multiplier is zero the constraint associated with that multiplier is not binding otherwise the constraint is binding Though checking the values of
the Lagrangian multipliers allows the user to determine which constraints are binding quite easily the functionrsquos output also includes a listing of the binding constraints by index number
The R Portfolio Optimization Program with Package ldquoQuadprogrdquo
npl ltminus 3 Sets the number of position limits The user sets this value
plmat ltminus matrix (rep(0 nplk) nrow=npl ncol=k) Initializes the matrix that will be used to define the position limit(s)
plmat[17] = -1 Places the required elements into the proper places in the lmat[21] = plmat[23] = -1 position limits matrix In this example the first position
plmat[32] = plmat[34] = 1 limit will set a maximum on the total percentage invested in the seventh security The second position limit will set a maximum on the total percentage invested in the first and third securities The third position limit will set a minimum on the total percentage invested in the second and fourth securities
pl ltminus c(-005 -04 03) Sets the values of the position limits The value the user enters should be positive if the position limit specifies a inimum and should be negative if the position limit specifies a maximum
Next the inequality constraints are placed in matrix form
S ltminus rbind(diag(k) plmat) Defines the S matrix
w0 ltminus c(rep(0 k) pl) Creates a vector whose elements are the values of the inequality constraints
Next the arguments required by the solveQP function that solves the programming problem are defined and the programming problem is solved
dvec ltminus rep(0 k) Defines the d vector which is a necessary input for the quadprog package For portfolio optimization problems the elements of the d vector will all be zeros
Amat ltminus colbind(t(R) t(S)) Forms the Amat matrix
bvec ltminus c(M w0) Joins the M matrix and the w0 matrix to form the bvec vector
ICSol ltminus solveQP(V dvec Amat bvec meq=2) Solves the quadratic programming problem The argument meq specifies that the first two constraints are equality constraints In this example the equality constraints are that the weights sum to one and that the portfolio expected return equal a specified amount
print(c(ICSol[1] 2ICSol[[2]] ICSol[5] ICSol[6])) Prints selected output from the solve QP function the weights the portfolio variance the values of the Lagrangian multipliers and the index numbers of the binding constraints
James A Turner Optimal Portfolios and the R Programming Language
52 International Journal of the Academic Business World 53Fall 2015 (Volume 9 Issue 2)
CONCLUSION
This paper provides an R language program to calculate portfolio weights for efficient portfolios The program can also accommodate short-sale constraints and position limits Users must choose the desired portfolio expected return and must specify any other constraints A strong advantage of the program is that because the R program-ming language is freely available to anyone with access to the internet students and others who wish to use the pro-gram will be able to do so easily
REFERENCES
Dai Min Hanqing Jin and Hong Liu 2011 Illiquidity position limits and optimal investment for mutual funds Journal of Economic Theory 146 1598ndash1630
Goldfarb D and A Idnani 1982 Dual and primal-dual methods for solving strictly convex quadratic pro-grams In Hennart J P (ed) Numerical Analysis Springer-Verlag Berlin pages 77ndash91
Goldfarb D and A Idnani 1983 A numerically stable dual method for solving strictly convex quadratic pro-grams Mathematical Programming 27 1ndash33
Ihaka Ross A free software project Retrieved May 7 2013 from httpcranr-projectorgdochtmlinter-face98-paperpaper_2html
Markowitz Harry 1952 Portfolio selection Journal of Finance 7 77ndash91
Stephens Alan 1998 Markowitz and the spreadsheet Journal of Financial Education 35ndash43
Thompson Thomas H and Ashraf El-houbi 2012 SAS and the efficient portfolio International Research Jour-nal of Applied Finance 3 315ndash327
Turlach Berwin A 2013 quadprog Functions to solve quadratic programming problems R pack-age version 15-5 httpCRANR-projectorgpackage=quadprog (S original by Berwin A Turlach R port by Andreas Weingessel)
Vance Ashlee 2009 Data analysts captivated by Rrsquos power The New York Times Retrieved May 1 2013 from httpwwwnytimescom20090107tech nolog y busi ness-computi ng 0 7prog ra m htmlpagewanted=allamp_r=0
What is R Retrieved May 7 2013 from httpwwwr-projectorgabouthtml
APPENDIX 1 DATA
The data used in the R program come from the CRSP monthly stock file and consist of 60 months of return data from January 2008 to December 2012 The stocks in the 10-stock portfolio are the first 10 stocks in the CRSP monthly file (listed by PERMNO) for which 60 continuous months of returns are available The stocks in the 50-stock portfolio are the first 50 stocks for which 60 continuous months of returns are available Table 1 below lists the PERMNOS current company name and current ticker of the included stocks as well as the exchange where the stock trades
Table 1 Stocks in the Portfolio
NO PERMNO CURRENT COMPANY NAME TICKER EXCHANGE1 10001 GAS NATURAL INC EGAS AMEX2 10002 BANCTRUST FINANCIAL GROUP INC BTFG NASDAQ3 10025 A E P INDUSTRIES INC AEPI NASDAQ4 10026 J amp J SNACK FOODS CORP JJSF NASDAQ5 10032 PLEXUS CORP PLXS NASDAQ6 10044 ROCKY MOUNTAIN CHOCOLATE FAC INC RMCF NASDAQ7 10051 HANGER INC HGR NYSE8 10065 ADAMS EXPRESS CO ADX NYSE9 10100 AMERICAN LEARNING CORP NY ALRN NASDAQ
Table 1 Stocks in the Portfolio
NO PERMNO CURRENT COMPANY NAME TICKER EXCHANGE10 10104 ORACLE CORP ORCL NASDAQ11 10107 MICROSOFT CORP MSFT NASDAQ12 10138 T ROWE PRICE GROUP INC TROW NASDAQ13 10145 HONEYWELL INTERNATIONAL INC HON NYSE14 10147 E M C CORP MA EMC NYSE15 10180 AKORN INC AKRX NASDAQ16 10182 TECH DATA CORP TECD NASDAQ17 10200 REPLIGEN CORP RGEN NASDAQ18 10207 ROYCE FOCUS TRUST INC FUND NASDAQ19 10225 BEAM INC BEAM NYSE20 10232 ELMIRA SAVINGS BANK NY ESBK NASDAQ21 10239 BALDWIN amp LYONS INC BWINB NASDAQ22 10252 INDEPENDENT BANK CORP MA INDB NASDAQ23 10253 DOCUMENT SECURITY SYSTEMS INC DSS AMEX24 10257 D L H HOLDINGS CORP DLHC NASDAQ25 10258 CELLDEX THERAPEUTICS INC CLDX NASDAQ26 10259 SIGMA DESIGNS INC SIGM NASDAQ27 10294 HAVERTY FURNITURE COS INC HVT NYSE28 10297 NEW HAMPSHIRE THRIFT BNCSHRS INC NHTB NASDAQ29 10299 LINEAR TECHNOLOGY CORP LLTC NASDAQ30 10302 CYPRESS SEMICONDUCTOR CORP CY NASDAQ31 10308 TOMPKINS FINANCIAL CORP TMP AMEX32 10318 BALCHEM CORP BCPC NASDAQ33 10333 XOMA CORP XOMA NASDAQ34 10355 DAILY JOURNAL CORP DJCO NASDAQ35 10363 A M A G PHARMACEUTICALS INC AMAG NASDAQ36 10375 T C F FINANCIAL CORP TCB NYSE37 10382 ASTEC INDUSTRIES INC ASTE NASDAQ38 10395 NAVIGATORS GROUP INC NAVG NASDAQ39 10397 WERNER ENTERPRISES INC WERN NASDAQ40 10421 SKYWEST INC SKYW NASDAQ41 10443 PATRIOT TRANSPORTATION HLDG INC PATR NASDAQ42 10463 RESEARCH FRONTIERS INC REFR NASDAQ43 10501 AMERICAN WOODMARK CORP AMWD NASDAQ44 10507 MEDICAL ACTION INDS INC MDCI NASDAQ45 10514 TRANS WORLD ENTERTAINMENT CORP TWMC NASDAQ46 10516 ARCHER DANIELS MIDLAND CO ADM NYSE47 10517 AARONS INC AAN NYSE48 10530 MERIDIAN BIOSCIENCE INC VIVO NASDAQ49 10547 CLEARFIELD INC CLFD NASDAQ50 10550 PRO DEX INC COLO PDEX NASDAQ
James A Turner Optimal Portfolios and the R Programming Language
54 International Journal of the Academic Business World 55Fall 2015 (Volume 9 Issue 2)
APPENDIX 3 RESULTS FOR THE 10-STOCK PORTFOLIO
Results for the 10-stock portfolio with a monthly expect-ed return of 1 are shown at the top of the facing page First shown is the variance-covariance matrix (V) fol-lowed by its inverse (V-1)
Table 2 shows the return averages of each stock and the calculated portfolio weights both for the portfolio with no short-sale constraints or position limits and the port-folio with short-sale constraints and three position limits (1) a requirement that the percentage invested in the sev-enth security not exceed 5 (2) a requirement that the
total percentage invested in the first and the third securi-ties not exceed 40 and (3) a requirement that the total percentage invested in the second and fourth securities be at least 30 Note that when short-sale constraints and position limits are imposed there may no longer be a port-folio that meets all the constraints that is the feasible set may be null In that case the R program will return an error message stating that the constraints are inconsistent
Table 3 lists the inequality constraints and the associ-ated Lagrangian multipliers along with an indication of whether the constraint is binding In this example the constraint that there be a minimum of 30 invested in the second and fourth securities is not binding
APPENDIX 2 COPY OF THE FULL PROGRAM
The full program is shown below without comments Users can easily copy the program that is between the solid lines and paste it into the R Editor window It will probably be necessary for each user to change the name of the data file in the readtable command Also the user can change the portfolio expected return and the number type and value of the inequality constraints as desired
Returns ltminus readtable(ldquoReturnscsvrdquo header = TRUE sep = ldquordquo) Rmat ltminus asmatrix(Returns) k ltminus ncol(Rmat) V ltminus var(Rmat) Erp ltminus 001 M ltminus rbind(1 Erp) Ones ltminus rep(1 k) Ravg ltminus colMeans(Rmat) R ltminus rbind(Ones Ravg) VINV ltminus solve(V) H ltminus RVINVt(R) HINV ltminus solve(H) w lt- VINVt(R)HINVM Pvar lt- t(w)Vw print(w) print(Pvar) npl ltminus 3 plmat ltminus matrix (rep(0 nplk) nrow=npl ncol=k) plmat[17] = -1 plmat[21] = plmat[23] = -1 plmat[32] = plmat[34] = 1 pl ltminus c(-005 -04 03)S ltminus rbind(diag(k) plmat) w0 ltminus c(rep(0 k) pl) dvec ltminus rep(0 k) Amat ltminus cbind(t(R) t(S)) bvec ltminus c(M w0) ICSol ltminus solveQP(V dvec Amat bvec meq=2) print(c(ICSol[1] 2ICSol[[2]] ICSol[5] ICSol[6]))
1
2867001 161224 279311 153314 408660 148438 131874 246057 83608 740152
161224 321169 23967 251277 39387 55190 33449 107899 36378 39718
279311 23967 991158 109233 189872 100249 22208 119
V minus
minus minus minus
minus minus minus minus
minus minus minus minus
=
6782 41342 198294
153314 251277 109233 2757210 319797 03010 139907 969199 56520 416534
408660 39387 189872 319797 977494 325171 247388 1098965 26657 04097
148438 55190 100249 03010 325171 1
minus minus minus minus minus
minus minus minus minus minus minus
minus 644368 311333 1803329 91576 428583
131874 33449 22208 139907 247388 311333 1093506 426730 100681 162364
246057 107899 1196782 969199 1098965 1803329 426730 11640904 233195 3789283
8360
minus minus
minus minus minus minus minus minus minus
minus minus minus minus minus minus
8 36378 41342 56520 26657 91576 100681 233195 138635 73382
740152 39718 198294 416534 04097 428583 162364 3789283 73382 3685519
minus minus
minus minus minus minus minus minus
00046 00019 00002 00006 00035 00004 00011 00008 00018 00019
00019 00364 00013 00037 00002 00004 00003 00001 00100 00007
00002 00013 00161 00024 00076 00035 00013 00041 00038 00033
00006 0
V
minus minus minus minus
minus minus minus minus
minus minus
=
0037 00024 00058 00051 00010 00016 00021 00028 00029
00035 00002 00076 00051 00217 00009 00048 00052 00024 00064
00004 00004 00035 00010 00009 00087 00018 00022 00027 00012
00011 00003 00013 000
minus
minus minus
minus minus minus
16 00048 00018 00113 00013 00055 00018
00008 00001 00041 00021 00052 00022 00013 00033 00003 00034
00018 00100 00038 00028 00024 00027 00055 00003 00850 00020
00019 00007 00033 00029 00064 00
minus
minus minus minus minus minus minus minus minus
012 00018 00034 00020 00068minus
Table 2 Average Returns and Weights for the Ten-
Stock Portfolios
Stock No Permno
Average Returns
Weights (SS
Allowed)IC Weights
(No SS 3 PLs)
1 10001 00064 03817 034062 10002 -00054 00311 004063 10025 00183 00908 005944 10026 00156 02525 026255 10032 00095 -01410 000006 10044 00012 00649 013797 10051 00206 01000 005008 10065 00018 01933 004929 10100 00270 00422 0056810 10104 00104 -00155 00031
Table 3 Constraints and Lagrangian Multipliers
Constraint Lagrangian Multiplier
Constraint Binding
Portfolio weights sum to one 00015 Yes
Portfolio expected return equals 1 00443 Yes
w1 ge 0 00000 No w2 ge 0 00000 No
w3 ge 0 00000 No
w4 ge 0 00000 No
w5 ge 0 00015 Yes
w6 ge 0 00000 No
w7 ge 0 00000 No
w8 ge 0 00000 No
w9 ge 0 00000 No
w10ge 0 00000 No
w7 le 005 00003 Yes
w1 + w3 le 04 00002 Yes
w2 + w4 ge 03 00000 No
James A Turner Optimal Portfolios and the R Programming Language
56 International Journal of the Academic Business World 57Fall 2015 (Volume 9 Issue 2)
The portfolio variances are
No short-sale constraints 0001607 Short-sale constraints and three position limits 0001856
APPENDIX 4 RESULTS FOR THE 50-STOCK PORTFOLIO
Results for the 50-stock portfolio with a monthly ex-pected return of 1 are shown in Table 4 below The first table shows the return averages of each stock and the cal-culated portfolio weights both for the portfolio with no short-sale constraints or position limits and the portfolio with short-sale constraints and three position limits (1) a requirement that the percentage invested in the seventh security not exceed 5 (2) a requirement that the total percentage invested in the first and the third securities not exceed 40 and (3) a requirement that the total percent-age invested in the second and fourth securities be at least 30
Table 5 shows the Lagrangian multipliers on the equal-ity constraints and the position limit constraints To save space for the 50-stock portfolio the Lagrangian multi-pliers on the short-sale constraints are not listed Simply checking Table 4 to see if the weight on a particular stock is zero gives an almost certain indication of which short-sale constraints are binding In this example both the constraint that there be no more than 5 invested in the seventh security and the constraint that there be no more than a total of 40 invested in the first and third securi-ties are not binding
Table 4 Average Returns and Weights for the
50-Stock PortfoliosStock
No Permno Average Returns
Weights SS Allowed
IC Weights No SS 3 PLs
1 10001 00064 01934 013072 10002 -00054 -00179 003673 10025 00183 -00189 000004 10026 00156 02873 026335 10032 00095 00503 000006 10044 00012 -00185 000007 10051 00206 -00136 002288 10065 00018 10920 000009 10100 00270 00306 00423
10 10104 00104 01467 0000011 10107 -00001 -02023 00000
Table 4 Average Returns and Weights for the
50-Stock PortfoliosStock
No Permno Average Returns
Weights SS Allowed
IC Weights No SS 3 PLs
12 10138 00085 -05619 0000013 10145 00065 -03910 0000014 10147 00088 -02693 0000015 10180 00290 -00290 0000016 10182 00076 01181 0000017 10200 00082 01409 0040918 10207 00020 -01551 0000019 10225 00098 00285 0000020 10232 00159 -00021 0000021 10239 00051 01624 0000022 10252 00084 00955 0000023 10253 00058 00121 0000024 10257 -00008 -00236 0000025 10258 00196 -00157 0000026 10259 -00300 -01339 0000027 10294 00179 -00414 0000028 10297 00061 01854 0146729 10299 00074 00826 0000030 10302 00165 00201 0000031 10308 00073 01255 0014132 10318 00194 -01389 0000033 10333 -00203 -00205 0000034 10355 00299 -00545 0036035 10363 -00151 -00167 0000036 10375 00010 -00495 0000037 10382 00046 00267 0000038 10395 -00022 00886 0042339 10397 00134 01296 0084940 10421 -00036 -01045 0000041 10443 00021 01389 0000042 10463 00013 00417 0000043 10501 00176 -00458 0000044 10507 -00228 -00397 0000045 10514 00100 00731 0007846 10516 -00034 -00148 0119247 10517 00208 00629 0000048 10530 00005 00032 0000049 10547 00418 00032 0012550 10550 -00028 00397 00000
The portfolio variances are
No short-sale constraints 000002997 Short-sale constraints and three position limits 000111119
Table 5 Constraints and Lagrangian Multipliers
Constraint Lagrangian Multiplier Constraint Binding
Portfolio weights sum to one 0000503 YesPortfolio expected return equals 1 0031954 Yes
w7 le 005 0000000 Now1 + w3 le 04 0000000 Now2 + w4 ge 03 0000963 Yes
James A Turner
58 Fall 2015 (Volume 9 Issue 2)
This page intentionally blank
JOINT CONFERENCE May 25th 26th and 27th 2016 in
Nashville TN
Academic Business World International Conference
(ABWICorg)
The aim of Academic Business World is to promote inclusiveness in research by offering a forum for the discussion of research in early stages as well as re-search that may differ from lsquotraditionalrsquo paradigms We wish our conferences to have a reputation for providing a peer-reviewed venue that is open to the full range of researchers in business as well as reference disciplines within the social sciences
Business Disciplines
We encourage the submission of manuscripts presentation outlines and ab-stracts pertaining to any business or related discipline topic We believe that all disciplines are interrelated and that looking at our disciplines and how they relate to each other is preferable to focusing only on our individual lsquosilos of knowledgersquo The ideal presentation would cross discipline borders so as to be more relevant than a topic only of interest to a small subset of a single disci-pline Of course single domain topics are needed as well
International Conference on Learning and Administration in
Higher Education (ICLAHEorg)
All too often learning takes a back seat to discipline related research The In-ternational Conference on Learning and Administration in Higher Educa-tion seeks to focus exclusively on all aspects of learning and administration in higher education We wish to bring together a wide variety of individuals from all countries and all disciplines for the purpose of exchanging experi-ences ideas and research findings in the processes involved in learning and administration in the academic environment of higher education
We encourage the submission of manuscripts presentation outlines and ab-stracts in either of the following areas
Learning
We encourage the submission of manuscripts pertaining to pedagogical top-ics We believe that much of the learning process is not discipline specific and that we can all benefit from looking at research and practices outside our own discipline The ideal submission would take a general focus on learning rather than a discipline-specific perspective For example instead of focusing on ldquoMotivating Students in Group Projects in Marketing Managementrdquo you might broaden the perspective to ldquoMotivating Students in Group Projects in Upper Division Coursesrdquo or simply ldquoMotivating Students in Group Projectsrdquo The objective here is to share your work with the larger audience
Academic Administration
We encourage the submission of manuscripts pertaining to the administra-tion of academic units in colleges and universities We believe that many of the challenges facing academic departments are not discipline specific and that learning how different departments address these challenges will be ben-eficial The ideal paper would provide information that many administrators would find useful regardless of their own disciplines
- Testing Major Factors for Reducing Obstacles to Product Innovation Success
-
- Dr Tor Guimaraes
- Dr Marcelo Seido Nagano
- Dr Curtis Armstrong
-
- Acceptance of Change Exploring the Relationship among Psychometric Constructs and Employee Resistance
-
- Brian Dunican EdD
- Ric Keaster PhD
-
- The Origin and Construct of Cloud Computing
-
- Nozar Daylami PhD
-
- Optimal Portfolios and the R Programming Language
-
- James A Turner
-

Nozar Daylami The Origin and Construct of Cloud Computing
44 International Journal of the Academic Business World 45Fall 2015 (Volume 9 Issue 2)
BIBLIOGRAPHY
1 Armburst M et al A View of Cloud Computing Communications of the ACM Vol 53 No 4 pages 50-58
2 Craig-Wood K Definition of Cloud Computing incorporating NIST and G-Cloud views httpswwwkatescommentcomdefinition-of-cloud-com-puting-nist-g-cloud Access date April 26 2015
3 Creeger M CTO Roundtable Cloud Computing Communications of the ACM Vol 52 No 8 pages 50-56
4 Cusumano M Cloud Computing and SaaS as New Computing Platforms Communications of the ACM Vol 53 No 4 pages 27-29
5 Foster Ian and Tuecke Steven Describing the Ele-phant The Different Faces of IT as Service wwwac-mqueuecom JulyAugust 2005 pages 26-34 httpdeliveryacmorg10114510900001080874p26-fosterpdf ip=99100108167ampid=1080874ampacc=OPENampkey=4D4702B0C3E38B352E4D4702B0C3E38B352E4D9421298D07BF362E6D218144511F3437ampCFID=505172814ampCFTOKEN=56369758amp__acm__=1429816554_402a40f1d60056fb68e8ccf3fdd96201 accessed April 23 2015
6 Kern Thomas Lacity Mary Cecelia Willcocks Leslie P Netsourcing Renting Business Applica-tions and Services Over a Network Prentice Hall 2002
7 Knoblauch A Deconstructing Cloud Smashwords Edition (Kindle Version) First Edition August 2013
8 Garfinkel Simon (2011 Oct 3) The Cloud Imperative MIT Technology Review httpwwwtechnologyreviewcomnews425623the-cloud-imperative
9 Hayes B Cloud Computing Communications of the ACM Vol 51 No 7 pages 9-11
10 Internet Solution Division Strategy for Cloud Com-puting Compaq Computer Corporation (1996) httpwwwtechnologyreviewcomsitesdefaultfileslegacycompaq_cst_1996_0pdf
11 Lacity M C Hirschheim R Information Systems Outsourcing Myths Metaphors and Realities New York John Wiley amp Sons 1993
12 McAfee A The Year the Cloud Rolled In httpshbrorg2010122010-the-year-the-cloud-rolled Access date April 23 2015
13 McAfee A What Every CEO Needs to Know About the Cloud httpshbrorg201111what-every-ceo-needs-to-know-about-the-cloud Access date April 23 2015
14 McGrath R Whorsquos Disrupting the Gaming Indus-try httpshbrorg200804whos-disrupting-the-gaming-ind Access date April 23 2015
15 Mell P Grance T The NIST Definition of Cloud Computing National Institute of Standards and Technology httpcsrcnistgovpublicationsnist-pubs800-145SP800-145pdf
16 Neumann P Risks and Myths of Cloud Comput-ing and Cloud Storage Communications of the ACM Vol 57 No 10 pages 25-27 The NIST Defi-nition of Cloud Computing httpcsrcnistgovpublicationsnistpubs800-145SP800-145pdf
17 NIST Definition of Cloud Computing httpcsrcnistgovpublicationsnistpubs800-145SP800-145pdf
18 NIST Cloud Computing Reference Architecture National Institute of Standards and Technology Special Publication 500-292 httpwwwnistgovcustomcfget_pdfcfmpub_id=909505
19 Nanavati M Colp P Aiello W and Warfield A Cloud Security A Gathering Storm Communica-tions of the ACM Vol 57 No 8 pages 70-79
20 Regalado Antonio (2011 Oct 31) Who coined cloud computing MIT Technology Review httpwwwtechnologyreviewcomnews425970who-coined-cloud-computing
21 Security Guidance for Critical Areas of Focus in Cloud Computing V30 Cloud Security Alliance httpscloudsecurityallianceorgguidancecsagu-idev30pd
22 Seviokla J Does Cisco Have Its Head in the Clouds httpshbrorg200903does-cisco-have-its-head-in-th Access date April 23 2015
23 Walsh K R Analyzing the Application ASP Concept Technologies Economies and Strategies Communications of ACM Vol 46 No 8 pages 103-107
24 Yang H Tate Mary A Descriptive Literature Review and Classification of Cloud Computing Re-search Communications of Association of Informa-tion Systems Vol 31 2012
Nozar Daylami
46 Fall 2015 (Volume 9 Issue 2)
This page intentionally blank
International Journal of the Academic Business World 47
INTRODUCTION
In their paper ldquoSAS and the Efficient Portfoliordquo Thomp-son and El-houbi (2012) develop a SAS program to calcu-late portfolio weights for efficient stock portfolios Their program improves on existing public domain SAS pro-grams of this type by allowing for portfolios with a rela-tively large number of securities Thompson and El-houbi also claim that their SAS program is an improvement over the Excel programs used to calculate portfolio weights which are sometimes included in investment textbooks They note that users concur that their program is easier to use than those Excel programs which either limit the number of securities that can be included in a portfolio require ldquocorrectionsrdquo or ldquoadjustmentsrdquo to overcome some quirks in the Excel Solver routine or require multiple user interventions
The Thompson and El-houbi program is certainly more elegant and user friendly than the equivalent Excel pro-grams and will provide those with access to the SAS pro-gramming language a valuable tool for learning portfolio management The disadvantage of a SAS program how-ever is that many students will not have easy access to the SAS programming language Students at smaller univer-sities may not have any access to SAS while students at many larger universities may only be able to access SAS at a computer lab on campus
In this paper I modify the Thompson and El-houbi SAS program for use in the open-source R programming lan-guage which is available free of charge for anyone with access to the internet Using the R language program to compute portfolio weights for efficient portfolios main-tains the elegance of the Thompson and El-houbi SAS
program while overcoming the disadvantage of limited SAS availability In addition I extend the Thompson and El-houbi program by making use of a quadratic program-ming package available in R to provide a program that can accommodate short-sale restrictions and position limits
THE R PROGRAMMING LANGUAGE
R is a free programming language for statistical analysis and graphics and runs on many UNIX platforms and on Windows and MacOS It is available under the terms of the Free Software Foundationrsquos GNU General Public License R was developed initially by Robert Gentleman and Ross Ihaka both of the University of Auckland (New Zealand) and is based on the S programming language developed at Bell Labs by John Chambers Since its initial development the popularity of R has grown considerably largely because of its ease of use and because of the avail-ability of many add-on packages that allow users to tackle very sophisticated projects
The base R package may be downloaded at httpcranusr-projectorg That web page also provides links to sources of information about R and basic user manuals There are also many books and manuals now available for purchase that offer information on both basic and special-ized uses of the language In fact Vance (2009) suggests that the growing popularity of the R language at univer-sities language could even result in noticeably lower de-mand for SAS
THE MARKOWITZ PORTFOLIO PROBLEM
As Markowitz (1952) notes an investor following the ldquoex-pected returns-variance of returns rulerdquo will choose an ef-
Optimal Portfolios and the R Programming Language
James A TurnerAssistant Professor of Finance
School of Accounting amp TaxationWeber State University
Ogden UT 84408
ABSTRACTThis paper develops a program in the freely available open-source R programming language to calculate weights for optimal stock portfolios The program retains the advantages the Thompson and El-houbi (2012) SAS program has over similar programs in Excel but avoids the potential problem of limited access to SAS that some students and researchers may face The R program also extends the Thompson and El-houbi program by including the ability to accommodate short-sale restrictions and position limits
James A Turner Optimal Portfolios and the R Programming Language
48 International Journal of the Academic Business World 49Fall 2015 (Volume 9 Issue 2)
ficient portfolio that is a portfolio with maximum ex-pected return for a given variance or one with minimum variance for a given expected return The minimum vari-ance formulation of the portfolio choice problem there-fore requires that the investor choose portfolio weights to minimize the variance of a portfolio with a given expected return The problem also requires that all money be in-vested (which means that the portfolio weights must sum to one) In matrix notation the optimization problem is
where w the choice variable is a k times 1 vector of the weights invested in the k securities in the portfolio V is the port-folio variance-covariance matrix and R is a 2 times k matrix whose first row is a vector of ones and whose second row contains the expected returns of each security in the port-folio M is a 2 times 1 vector whose first element is one (corre-sponding to the constraint that the portfolio weights sum to one) and whose second element is the chosen portfo-lio expected return For now there are no restrictions on short sales so some portfolio weights may be negative
The Lagrangian for the problem is
( ) L w Vw M Rwλprime prime= + minus
where λ is a 2 times 1 vector containing the Lagrangian multi-pliers The first-order conditions for a minimum (which are also sufficient conditions in this case) are
Solving the first-order conditions for w and λ yields
( )( )
11 1
112
w V R RV R M
RV R Mλ
minusminus minus
minusminus
prime prime=
prime=
Thompson and El-houbi following Stephens (1998) let 1 H RV Rminus prime= so that
1 1
1
2
w V R H MH Mλ
minus minus
minus
prime=
=
Stephens (1998 p 36) shows how the elements of the H matrix may be used ldquoto fix any meanvariance point on the efficient frontierrdquo
Min st
w VwRw M
prime
=
2 0
0
L Vw RwL M Rw
λ
λ
part prime= minus =partpart
= minus =part
THE BASIC R PORTFOLIO OPTIMIZATION PROGRAM
The R programming language lends itself very easily to matrix manipulation and matrix computation removing much of the difficulty in solving the standard Markowitz portfolio problem The following R program calculates the portfolio weights for an efficient portfolio using stock return data to estimate expected returns and the variance-covariance matrix The user must specify the desired port-folio expected return The program can accommodate portfolios up to about 50 stocks Beyond that number precision limitations of the R language may make the variance-covariance matrix ldquocomputationally singularrdquo and unable to be inverted
The first step in the program is to read in the return data R can input data from many file types but in the present example the data are stored in a comma-delimited Excel file called ldquoReturnscsvrdquo which contains stock return data In this case the Excel file includes a header row labeling each column of returns with identifying information but no row names The program first reads in the data and then determines the number of securities (number of col-umns in the matrix) as shown on the facing page
ADDING SHORT-SALE CONSTRAINTS AND POSITION LIMITS
The above formulation of the portfolio choice problem places no restrictions on short sales and does not accom-modate position limits In reality individual investors and some fund managers may face requirements prohibit-ing short sales Fund managers may also face requirements that either limit the amount that may be invested in one security or sector or instead that a minimum percentage of funds be invested in a certain security or sector Dai Lin and Liu (2011) list several examples of real-world po-sition limits such as a requirement that a small-cap mutu-al fund invest at least a minimum percentage of its funds in small-company stocks In mathematical terms these short-sale restrictions and position limits can be expressed as a series of inequality constraints While reformulating the portfolio choice problem to add inequality constraints is not difficult doing so makes actually solving the prob-lem considerably more difficult
With short-sale restrictions and position limits the port-folio choice problem becomes
0
Min st
w VwRw MSw w
prime
=ge
where w is still the choice variable S is an m times k matrix that defines both the short-sale constraints on the k se-curities in the portfolio and m minus k other restrictions If there are short-sale constraints but no other restrictions the S matrix is simply a k times k identity matrix which when multiplied by the vector w results in the requirement that
0 iw ige forall If there are other restrictions the sub-matrix of S consisting of the first k rows and k columns of S is an identity matrix and the other restrictions are specified by suitable choices of the elements of the remaining rows of S For example suppose there is a position limit placing a maximum of p on the percentage invested in the sev-enth security so that 7 w ple Since the constraints in the optimization problem above have been expressed as non-negativity constraints this position limit must instead take the form 7 w pminus ge minus The row of S corresponding to
the position limit will consist entirely of zeros except for the seventh element which will be minus1 and corresponding element of the w0 vector would be p
Introducing other forms of position limits simply requires adding the appropriate rows to the S matrix For example if there is a requirement that the total percentage invested in the first and third securities equal or exceed a certain percentage q then one row of S should be [1 0 1 0 0]and the corresponding element of the w0 vector would be q If there is instead a requirement that the total percentage invested in the first and third securities not exceed a cer-tain amount q the required row of S would be [-1 0 -1 0 0] and the corresponding element of the w0 vector would be minusq Other restrictions may be specified similarly For problems that include position limits each of the first k el-
The BASIC R Portfolio Optimation Program
Returns ltminus readtable(ldquoReturnscsvrdquo header = TRUE sep = ldquordquo)Rmat ltminus asmatrix(Returns) Converts the data to matrix formk ltminus ncol(Rmat) Number of columns (number of securities in the portfolio) Now the program calculates the estimate of the variance-covariance matrix (V) the M vector and the R matrix which includes the estimate of the expected returns
V ltminus var(Rmat) Calculates the sample variance-covariance matrix which is used as the estimate of the variance-covariance matrix
Erp ltminus 001 Sets the desired expected portfolio return The user can change this value as desired
M ltminus rbind(1 Erp) Ones ltminus rep(1 k) Ravg ltminus colMeans(Rmat)
Defines the M matrix including the required portfolio return Defines a 1 x k matrix of ones Calculates average returns by column giving a 1 x k matrix of estimated expected returns
R ltminus rbind(Ones Ravg) Combines Ones and Ravg into the 2 x k matrix R Finally the program calculates the portfolio weights and the portfolio variance
VINV ltminus solve(V) Calculates the inverse of the estimated variance-covariance matrixH ltminus RVINVt(R) Calculates the H matrixHINV ltminus solve(H) Calculates the inverse of Hw lt- VINVt(R)HINVM Calculates the portfolio weightsPvar lt- t(w)Vw Calculates the portfolio variance The following commands display the results of the calculations
print(w) Prints the elements of the w vectorprint(Pvar) Prints the variance of the portfolio formed using the weights w
James A Turner Optimal Portfolios and the R Programming Language
50 International Journal of the Academic Business World 51Fall 2015 (Volume 9 Issue 2)
ements of the w0 vector will be zero corresponding to the non-negativity constraints and the remaining elements will equal the percentages associated with the position limits entered as positive or negative numbers depend-ing on whether the position limits establish minimums or maximums
The Lagrangian for this problem is
( ) ( )0 L w Vw M Rw w Swλ microprime prime prime= + minus + minus
where λ is a 2 times 1 vector containing the Lagrangian multi-pliers on the equality constraints and micro is an m times 1 vector of the Lagrangian multipliers on the k short-sale constraints and the m ndash k position limits The first-order necessary con-ditions for this problem are the Kuhn-Tucker conditions
( )0 0
2 0
0
0 0 and 0
L Vw R SwL M Rw
L w Sw w Sw
λ micro
λ
micro micromicro
part prime prime= minus minus =partpart
= minus =partpart prime= minus le ge minus =part
The final set of conditions are known as the complementa-ry slackness conditions since if an element of partLpartμ does not equal zero (ie if the required condition is slack) then the corresponding element of micro must equal zero and vice versa Because of the complementary slackness conditions in order to find a solution to the optimization problem each condition must be checked individually to deter-mine the possible solutions If there are more than a very few constraints finding the candidate solutions manually becomes extremely tedious
Fortunately it is possible to use numerical methods to solve this type of non-linear programming program This is where the strength of the R programming language be-comes very evident The R language provides access to an extensive number of add-on packages developed by R us-ers around the world In particular there are several pack-ages that implement numerical methods to find solutions to optimization problems with inequality constraints Perhaps the package that most easily lends itself to solv-ing the current problem is the ldquoquadprogrdquo package Ac-cording to the documentation included with the pack-age the quadprog routine ldquoimplements the dual method of Goldfarb and Idnani (1982 1983) for solving qua-dratic programming problems of the form min(d΄b+frac12b΄Db)) with the constraints Aʹbgtb₀rdquo For the optimization problem currently under consideration the d vector will be a zero vector the b vector will be the w vec-tor of portfolio weights the D matrix will be the variance-
covariance matrix V and the matrix A΄ will equal a matrix formed by combining the R matrix and the S matrix such that A΄= [R
S ]and A = [ R΄ S΄] Since the V matrix is symmetric the term frac12b΄Db = frac12w΄Vw is a quadratic form Also because the d vector is a zero vector the presence of the frac12 term in the quadratic form does not change the value of the solution to the current portfolio optimization problem That is the weights that minimize frac12w΄Vw sub-ject to the constraints will also minimize w΄Vw subject to the constraints
THE R PORTFOLIO OPTIMIZATION PROGRAM WITH PACKAGE ldquoQUADPROGrdquo
The ldquoQuadprogrdquo package is one of many add-in packages available to R users To use add-in packages in R the user must first download and install the chosen package This is done through the ldquoPackagesrdquo command in the menu bar of the console window Selecting the ldquoInstall package(s)rdquo command from the drop-down box will bring up a list of download locations After selecting a download location the user selects the package(s) to download and install Finally once the selected package is downloaded and in-stalled it must be loaded for use in the current R session which is done by choosing ldquoPackagesrdquo command on the menu bar and then choosing the ldquoLoad packagerdquo com-mand from the drop-down box A list of available packag-es will then appear and the user should select the desired package in this case the ldquoquadprogrdquo package Once the quadprog package is loaded the following program will solve the portfolio problem with short-sale restrictions and position limits
In the present example the short-sale constraint requires that all elements of the w vector be non-negative In addi-tion there are three position limits The first position lim-it requires that no more than 5 of total funds be invested in the seventh security The second position limit requires that no more than a total of 40 of available funds be in-vested in the first and third securities The third position limit requires that total of at least 30 of available funds be invested in the second and fourth securities
The program will make use of the M matrix and the vari-ance-covariance matrix V from the earlier program so those variables must be saved by the user or the following program must be run after running the previous program and before exiting R The new program first sets the posi-tion limits as shown on the facing page
The output of the ldquosolveQPrdquo function includes the values of w and the Lagrangian multipliers for each constraint If the value of a Lagrangian multiplier is zero the constraint associated with that multiplier is not binding otherwise the constraint is binding Though checking the values of
the Lagrangian multipliers allows the user to determine which constraints are binding quite easily the functionrsquos output also includes a listing of the binding constraints by index number
The R Portfolio Optimization Program with Package ldquoQuadprogrdquo
npl ltminus 3 Sets the number of position limits The user sets this value
plmat ltminus matrix (rep(0 nplk) nrow=npl ncol=k) Initializes the matrix that will be used to define the position limit(s)
plmat[17] = -1 Places the required elements into the proper places in the lmat[21] = plmat[23] = -1 position limits matrix In this example the first position
plmat[32] = plmat[34] = 1 limit will set a maximum on the total percentage invested in the seventh security The second position limit will set a maximum on the total percentage invested in the first and third securities The third position limit will set a minimum on the total percentage invested in the second and fourth securities
pl ltminus c(-005 -04 03) Sets the values of the position limits The value the user enters should be positive if the position limit specifies a inimum and should be negative if the position limit specifies a maximum
Next the inequality constraints are placed in matrix form
S ltminus rbind(diag(k) plmat) Defines the S matrix
w0 ltminus c(rep(0 k) pl) Creates a vector whose elements are the values of the inequality constraints
Next the arguments required by the solveQP function that solves the programming problem are defined and the programming problem is solved
dvec ltminus rep(0 k) Defines the d vector which is a necessary input for the quadprog package For portfolio optimization problems the elements of the d vector will all be zeros
Amat ltminus colbind(t(R) t(S)) Forms the Amat matrix
bvec ltminus c(M w0) Joins the M matrix and the w0 matrix to form the bvec vector
ICSol ltminus solveQP(V dvec Amat bvec meq=2) Solves the quadratic programming problem The argument meq specifies that the first two constraints are equality constraints In this example the equality constraints are that the weights sum to one and that the portfolio expected return equal a specified amount
print(c(ICSol[1] 2ICSol[[2]] ICSol[5] ICSol[6])) Prints selected output from the solve QP function the weights the portfolio variance the values of the Lagrangian multipliers and the index numbers of the binding constraints
James A Turner Optimal Portfolios and the R Programming Language
52 International Journal of the Academic Business World 53Fall 2015 (Volume 9 Issue 2)
CONCLUSION
This paper provides an R language program to calculate portfolio weights for efficient portfolios The program can also accommodate short-sale constraints and position limits Users must choose the desired portfolio expected return and must specify any other constraints A strong advantage of the program is that because the R program-ming language is freely available to anyone with access to the internet students and others who wish to use the pro-gram will be able to do so easily
REFERENCES
Dai Min Hanqing Jin and Hong Liu 2011 Illiquidity position limits and optimal investment for mutual funds Journal of Economic Theory 146 1598ndash1630
Goldfarb D and A Idnani 1982 Dual and primal-dual methods for solving strictly convex quadratic pro-grams In Hennart J P (ed) Numerical Analysis Springer-Verlag Berlin pages 77ndash91
Goldfarb D and A Idnani 1983 A numerically stable dual method for solving strictly convex quadratic pro-grams Mathematical Programming 27 1ndash33
Ihaka Ross A free software project Retrieved May 7 2013 from httpcranr-projectorgdochtmlinter-face98-paperpaper_2html
Markowitz Harry 1952 Portfolio selection Journal of Finance 7 77ndash91
Stephens Alan 1998 Markowitz and the spreadsheet Journal of Financial Education 35ndash43
Thompson Thomas H and Ashraf El-houbi 2012 SAS and the efficient portfolio International Research Jour-nal of Applied Finance 3 315ndash327
Turlach Berwin A 2013 quadprog Functions to solve quadratic programming problems R pack-age version 15-5 httpCRANR-projectorgpackage=quadprog (S original by Berwin A Turlach R port by Andreas Weingessel)
Vance Ashlee 2009 Data analysts captivated by Rrsquos power The New York Times Retrieved May 1 2013 from httpwwwnytimescom20090107tech nolog y busi ness-computi ng 0 7prog ra m htmlpagewanted=allamp_r=0
What is R Retrieved May 7 2013 from httpwwwr-projectorgabouthtml
APPENDIX 1 DATA
The data used in the R program come from the CRSP monthly stock file and consist of 60 months of return data from January 2008 to December 2012 The stocks in the 10-stock portfolio are the first 10 stocks in the CRSP monthly file (listed by PERMNO) for which 60 continuous months of returns are available The stocks in the 50-stock portfolio are the first 50 stocks for which 60 continuous months of returns are available Table 1 below lists the PERMNOS current company name and current ticker of the included stocks as well as the exchange where the stock trades
Table 1 Stocks in the Portfolio
NO PERMNO CURRENT COMPANY NAME TICKER EXCHANGE1 10001 GAS NATURAL INC EGAS AMEX2 10002 BANCTRUST FINANCIAL GROUP INC BTFG NASDAQ3 10025 A E P INDUSTRIES INC AEPI NASDAQ4 10026 J amp J SNACK FOODS CORP JJSF NASDAQ5 10032 PLEXUS CORP PLXS NASDAQ6 10044 ROCKY MOUNTAIN CHOCOLATE FAC INC RMCF NASDAQ7 10051 HANGER INC HGR NYSE8 10065 ADAMS EXPRESS CO ADX NYSE9 10100 AMERICAN LEARNING CORP NY ALRN NASDAQ
Table 1 Stocks in the Portfolio
NO PERMNO CURRENT COMPANY NAME TICKER EXCHANGE10 10104 ORACLE CORP ORCL NASDAQ11 10107 MICROSOFT CORP MSFT NASDAQ12 10138 T ROWE PRICE GROUP INC TROW NASDAQ13 10145 HONEYWELL INTERNATIONAL INC HON NYSE14 10147 E M C CORP MA EMC NYSE15 10180 AKORN INC AKRX NASDAQ16 10182 TECH DATA CORP TECD NASDAQ17 10200 REPLIGEN CORP RGEN NASDAQ18 10207 ROYCE FOCUS TRUST INC FUND NASDAQ19 10225 BEAM INC BEAM NYSE20 10232 ELMIRA SAVINGS BANK NY ESBK NASDAQ21 10239 BALDWIN amp LYONS INC BWINB NASDAQ22 10252 INDEPENDENT BANK CORP MA INDB NASDAQ23 10253 DOCUMENT SECURITY SYSTEMS INC DSS AMEX24 10257 D L H HOLDINGS CORP DLHC NASDAQ25 10258 CELLDEX THERAPEUTICS INC CLDX NASDAQ26 10259 SIGMA DESIGNS INC SIGM NASDAQ27 10294 HAVERTY FURNITURE COS INC HVT NYSE28 10297 NEW HAMPSHIRE THRIFT BNCSHRS INC NHTB NASDAQ29 10299 LINEAR TECHNOLOGY CORP LLTC NASDAQ30 10302 CYPRESS SEMICONDUCTOR CORP CY NASDAQ31 10308 TOMPKINS FINANCIAL CORP TMP AMEX32 10318 BALCHEM CORP BCPC NASDAQ33 10333 XOMA CORP XOMA NASDAQ34 10355 DAILY JOURNAL CORP DJCO NASDAQ35 10363 A M A G PHARMACEUTICALS INC AMAG NASDAQ36 10375 T C F FINANCIAL CORP TCB NYSE37 10382 ASTEC INDUSTRIES INC ASTE NASDAQ38 10395 NAVIGATORS GROUP INC NAVG NASDAQ39 10397 WERNER ENTERPRISES INC WERN NASDAQ40 10421 SKYWEST INC SKYW NASDAQ41 10443 PATRIOT TRANSPORTATION HLDG INC PATR NASDAQ42 10463 RESEARCH FRONTIERS INC REFR NASDAQ43 10501 AMERICAN WOODMARK CORP AMWD NASDAQ44 10507 MEDICAL ACTION INDS INC MDCI NASDAQ45 10514 TRANS WORLD ENTERTAINMENT CORP TWMC NASDAQ46 10516 ARCHER DANIELS MIDLAND CO ADM NYSE47 10517 AARONS INC AAN NYSE48 10530 MERIDIAN BIOSCIENCE INC VIVO NASDAQ49 10547 CLEARFIELD INC CLFD NASDAQ50 10550 PRO DEX INC COLO PDEX NASDAQ
James A Turner Optimal Portfolios and the R Programming Language
54 International Journal of the Academic Business World 55Fall 2015 (Volume 9 Issue 2)
APPENDIX 3 RESULTS FOR THE 10-STOCK PORTFOLIO
Results for the 10-stock portfolio with a monthly expect-ed return of 1 are shown at the top of the facing page First shown is the variance-covariance matrix (V) fol-lowed by its inverse (V-1)
Table 2 shows the return averages of each stock and the calculated portfolio weights both for the portfolio with no short-sale constraints or position limits and the port-folio with short-sale constraints and three position limits (1) a requirement that the percentage invested in the sev-enth security not exceed 5 (2) a requirement that the
total percentage invested in the first and the third securi-ties not exceed 40 and (3) a requirement that the total percentage invested in the second and fourth securities be at least 30 Note that when short-sale constraints and position limits are imposed there may no longer be a port-folio that meets all the constraints that is the feasible set may be null In that case the R program will return an error message stating that the constraints are inconsistent
Table 3 lists the inequality constraints and the associ-ated Lagrangian multipliers along with an indication of whether the constraint is binding In this example the constraint that there be a minimum of 30 invested in the second and fourth securities is not binding
APPENDIX 2 COPY OF THE FULL PROGRAM
The full program is shown below without comments Users can easily copy the program that is between the solid lines and paste it into the R Editor window It will probably be necessary for each user to change the name of the data file in the readtable command Also the user can change the portfolio expected return and the number type and value of the inequality constraints as desired
Returns ltminus readtable(ldquoReturnscsvrdquo header = TRUE sep = ldquordquo) Rmat ltminus asmatrix(Returns) k ltminus ncol(Rmat) V ltminus var(Rmat) Erp ltminus 001 M ltminus rbind(1 Erp) Ones ltminus rep(1 k) Ravg ltminus colMeans(Rmat) R ltminus rbind(Ones Ravg) VINV ltminus solve(V) H ltminus RVINVt(R) HINV ltminus solve(H) w lt- VINVt(R)HINVM Pvar lt- t(w)Vw print(w) print(Pvar) npl ltminus 3 plmat ltminus matrix (rep(0 nplk) nrow=npl ncol=k) plmat[17] = -1 plmat[21] = plmat[23] = -1 plmat[32] = plmat[34] = 1 pl ltminus c(-005 -04 03)S ltminus rbind(diag(k) plmat) w0 ltminus c(rep(0 k) pl) dvec ltminus rep(0 k) Amat ltminus cbind(t(R) t(S)) bvec ltminus c(M w0) ICSol ltminus solveQP(V dvec Amat bvec meq=2) print(c(ICSol[1] 2ICSol[[2]] ICSol[5] ICSol[6]))
1
2867001 161224 279311 153314 408660 148438 131874 246057 83608 740152
161224 321169 23967 251277 39387 55190 33449 107899 36378 39718
279311 23967 991158 109233 189872 100249 22208 119
V minus
minus minus minus
minus minus minus minus
minus minus minus minus
=
6782 41342 198294
153314 251277 109233 2757210 319797 03010 139907 969199 56520 416534
408660 39387 189872 319797 977494 325171 247388 1098965 26657 04097
148438 55190 100249 03010 325171 1
minus minus minus minus minus
minus minus minus minus minus minus
minus 644368 311333 1803329 91576 428583
131874 33449 22208 139907 247388 311333 1093506 426730 100681 162364
246057 107899 1196782 969199 1098965 1803329 426730 11640904 233195 3789283
8360
minus minus
minus minus minus minus minus minus minus
minus minus minus minus minus minus
8 36378 41342 56520 26657 91576 100681 233195 138635 73382
740152 39718 198294 416534 04097 428583 162364 3789283 73382 3685519
minus minus
minus minus minus minus minus minus
00046 00019 00002 00006 00035 00004 00011 00008 00018 00019
00019 00364 00013 00037 00002 00004 00003 00001 00100 00007
00002 00013 00161 00024 00076 00035 00013 00041 00038 00033
00006 0
V
minus minus minus minus
minus minus minus minus
minus minus
=
0037 00024 00058 00051 00010 00016 00021 00028 00029
00035 00002 00076 00051 00217 00009 00048 00052 00024 00064
00004 00004 00035 00010 00009 00087 00018 00022 00027 00012
00011 00003 00013 000
minus
minus minus
minus minus minus
16 00048 00018 00113 00013 00055 00018
00008 00001 00041 00021 00052 00022 00013 00033 00003 00034
00018 00100 00038 00028 00024 00027 00055 00003 00850 00020
00019 00007 00033 00029 00064 00
minus
minus minus minus minus minus minus minus minus
012 00018 00034 00020 00068minus
Table 2 Average Returns and Weights for the Ten-
Stock Portfolios
Stock No Permno
Average Returns
Weights (SS
Allowed)IC Weights
(No SS 3 PLs)
1 10001 00064 03817 034062 10002 -00054 00311 004063 10025 00183 00908 005944 10026 00156 02525 026255 10032 00095 -01410 000006 10044 00012 00649 013797 10051 00206 01000 005008 10065 00018 01933 004929 10100 00270 00422 0056810 10104 00104 -00155 00031
Table 3 Constraints and Lagrangian Multipliers
Constraint Lagrangian Multiplier
Constraint Binding
Portfolio weights sum to one 00015 Yes
Portfolio expected return equals 1 00443 Yes
w1 ge 0 00000 No w2 ge 0 00000 No
w3 ge 0 00000 No
w4 ge 0 00000 No
w5 ge 0 00015 Yes
w6 ge 0 00000 No
w7 ge 0 00000 No
w8 ge 0 00000 No
w9 ge 0 00000 No
w10ge 0 00000 No
w7 le 005 00003 Yes
w1 + w3 le 04 00002 Yes
w2 + w4 ge 03 00000 No
James A Turner Optimal Portfolios and the R Programming Language
56 International Journal of the Academic Business World 57Fall 2015 (Volume 9 Issue 2)
The portfolio variances are
No short-sale constraints 0001607 Short-sale constraints and three position limits 0001856
APPENDIX 4 RESULTS FOR THE 50-STOCK PORTFOLIO
Results for the 50-stock portfolio with a monthly ex-pected return of 1 are shown in Table 4 below The first table shows the return averages of each stock and the cal-culated portfolio weights both for the portfolio with no short-sale constraints or position limits and the portfolio with short-sale constraints and three position limits (1) a requirement that the percentage invested in the seventh security not exceed 5 (2) a requirement that the total percentage invested in the first and the third securities not exceed 40 and (3) a requirement that the total percent-age invested in the second and fourth securities be at least 30
Table 5 shows the Lagrangian multipliers on the equal-ity constraints and the position limit constraints To save space for the 50-stock portfolio the Lagrangian multi-pliers on the short-sale constraints are not listed Simply checking Table 4 to see if the weight on a particular stock is zero gives an almost certain indication of which short-sale constraints are binding In this example both the constraint that there be no more than 5 invested in the seventh security and the constraint that there be no more than a total of 40 invested in the first and third securi-ties are not binding
Table 4 Average Returns and Weights for the
50-Stock PortfoliosStock
No Permno Average Returns
Weights SS Allowed
IC Weights No SS 3 PLs
1 10001 00064 01934 013072 10002 -00054 -00179 003673 10025 00183 -00189 000004 10026 00156 02873 026335 10032 00095 00503 000006 10044 00012 -00185 000007 10051 00206 -00136 002288 10065 00018 10920 000009 10100 00270 00306 00423
10 10104 00104 01467 0000011 10107 -00001 -02023 00000
Table 4 Average Returns and Weights for the
50-Stock PortfoliosStock
No Permno Average Returns
Weights SS Allowed
IC Weights No SS 3 PLs
12 10138 00085 -05619 0000013 10145 00065 -03910 0000014 10147 00088 -02693 0000015 10180 00290 -00290 0000016 10182 00076 01181 0000017 10200 00082 01409 0040918 10207 00020 -01551 0000019 10225 00098 00285 0000020 10232 00159 -00021 0000021 10239 00051 01624 0000022 10252 00084 00955 0000023 10253 00058 00121 0000024 10257 -00008 -00236 0000025 10258 00196 -00157 0000026 10259 -00300 -01339 0000027 10294 00179 -00414 0000028 10297 00061 01854 0146729 10299 00074 00826 0000030 10302 00165 00201 0000031 10308 00073 01255 0014132 10318 00194 -01389 0000033 10333 -00203 -00205 0000034 10355 00299 -00545 0036035 10363 -00151 -00167 0000036 10375 00010 -00495 0000037 10382 00046 00267 0000038 10395 -00022 00886 0042339 10397 00134 01296 0084940 10421 -00036 -01045 0000041 10443 00021 01389 0000042 10463 00013 00417 0000043 10501 00176 -00458 0000044 10507 -00228 -00397 0000045 10514 00100 00731 0007846 10516 -00034 -00148 0119247 10517 00208 00629 0000048 10530 00005 00032 0000049 10547 00418 00032 0012550 10550 -00028 00397 00000
The portfolio variances are
No short-sale constraints 000002997 Short-sale constraints and three position limits 000111119
Table 5 Constraints and Lagrangian Multipliers
Constraint Lagrangian Multiplier Constraint Binding
Portfolio weights sum to one 0000503 YesPortfolio expected return equals 1 0031954 Yes
w7 le 005 0000000 Now1 + w3 le 04 0000000 Now2 + w4 ge 03 0000963 Yes
James A Turner
58 Fall 2015 (Volume 9 Issue 2)
This page intentionally blank
JOINT CONFERENCE May 25th 26th and 27th 2016 in
Nashville TN
Academic Business World International Conference
(ABWICorg)
The aim of Academic Business World is to promote inclusiveness in research by offering a forum for the discussion of research in early stages as well as re-search that may differ from lsquotraditionalrsquo paradigms We wish our conferences to have a reputation for providing a peer-reviewed venue that is open to the full range of researchers in business as well as reference disciplines within the social sciences
Business Disciplines
We encourage the submission of manuscripts presentation outlines and ab-stracts pertaining to any business or related discipline topic We believe that all disciplines are interrelated and that looking at our disciplines and how they relate to each other is preferable to focusing only on our individual lsquosilos of knowledgersquo The ideal presentation would cross discipline borders so as to be more relevant than a topic only of interest to a small subset of a single disci-pline Of course single domain topics are needed as well
International Conference on Learning and Administration in
Higher Education (ICLAHEorg)
All too often learning takes a back seat to discipline related research The In-ternational Conference on Learning and Administration in Higher Educa-tion seeks to focus exclusively on all aspects of learning and administration in higher education We wish to bring together a wide variety of individuals from all countries and all disciplines for the purpose of exchanging experi-ences ideas and research findings in the processes involved in learning and administration in the academic environment of higher education
We encourage the submission of manuscripts presentation outlines and ab-stracts in either of the following areas
Learning
We encourage the submission of manuscripts pertaining to pedagogical top-ics We believe that much of the learning process is not discipline specific and that we can all benefit from looking at research and practices outside our own discipline The ideal submission would take a general focus on learning rather than a discipline-specific perspective For example instead of focusing on ldquoMotivating Students in Group Projects in Marketing Managementrdquo you might broaden the perspective to ldquoMotivating Students in Group Projects in Upper Division Coursesrdquo or simply ldquoMotivating Students in Group Projectsrdquo The objective here is to share your work with the larger audience
Academic Administration
We encourage the submission of manuscripts pertaining to the administra-tion of academic units in colleges and universities We believe that many of the challenges facing academic departments are not discipline specific and that learning how different departments address these challenges will be ben-eficial The ideal paper would provide information that many administrators would find useful regardless of their own disciplines
- Testing Major Factors for Reducing Obstacles to Product Innovation Success
-
- Dr Tor Guimaraes
- Dr Marcelo Seido Nagano
- Dr Curtis Armstrong
-
- Acceptance of Change Exploring the Relationship among Psychometric Constructs and Employee Resistance
-
- Brian Dunican EdD
- Ric Keaster PhD
-
- The Origin and Construct of Cloud Computing
-
- Nozar Daylami PhD
-
- Optimal Portfolios and the R Programming Language
-
- James A Turner
-
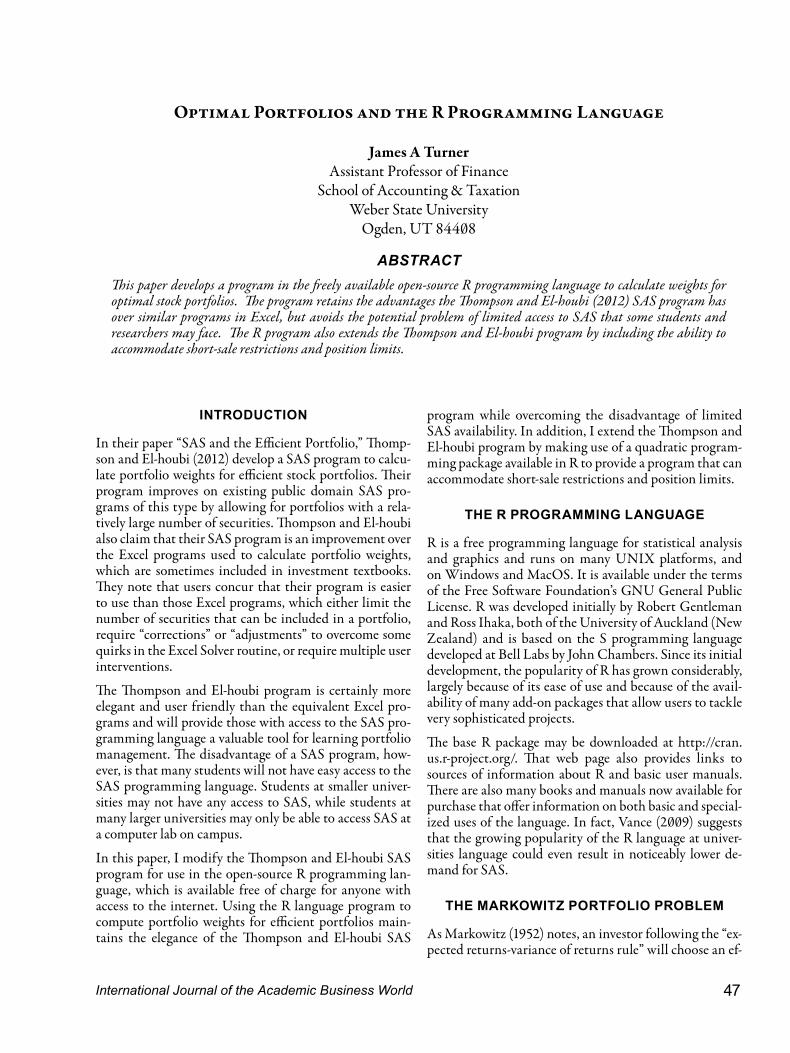
James A Turner Optimal Portfolios and the R Programming Language
48 International Journal of the Academic Business World 49Fall 2015 (Volume 9 Issue 2)
ficient portfolio that is a portfolio with maximum ex-pected return for a given variance or one with minimum variance for a given expected return The minimum vari-ance formulation of the portfolio choice problem there-fore requires that the investor choose portfolio weights to minimize the variance of a portfolio with a given expected return The problem also requires that all money be in-vested (which means that the portfolio weights must sum to one) In matrix notation the optimization problem is
where w the choice variable is a k times 1 vector of the weights invested in the k securities in the portfolio V is the port-folio variance-covariance matrix and R is a 2 times k matrix whose first row is a vector of ones and whose second row contains the expected returns of each security in the port-folio M is a 2 times 1 vector whose first element is one (corre-sponding to the constraint that the portfolio weights sum to one) and whose second element is the chosen portfo-lio expected return For now there are no restrictions on short sales so some portfolio weights may be negative
The Lagrangian for the problem is
( ) L w Vw M Rwλprime prime= + minus
where λ is a 2 times 1 vector containing the Lagrangian multi-pliers The first-order conditions for a minimum (which are also sufficient conditions in this case) are
Solving the first-order conditions for w and λ yields
( )( )
11 1
112
w V R RV R M
RV R Mλ
minusminus minus
minusminus
prime prime=
prime=
Thompson and El-houbi following Stephens (1998) let 1 H RV Rminus prime= so that
1 1
1
2
w V R H MH Mλ
minus minus
minus
prime=
=
Stephens (1998 p 36) shows how the elements of the H matrix may be used ldquoto fix any meanvariance point on the efficient frontierrdquo
Min st
w VwRw M
prime
=
2 0
0
L Vw RwL M Rw
λ
λ
part prime= minus =partpart
= minus =part
THE BASIC R PORTFOLIO OPTIMIZATION PROGRAM
The R programming language lends itself very easily to matrix manipulation and matrix computation removing much of the difficulty in solving the standard Markowitz portfolio problem The following R program calculates the portfolio weights for an efficient portfolio using stock return data to estimate expected returns and the variance-covariance matrix The user must specify the desired port-folio expected return The program can accommodate portfolios up to about 50 stocks Beyond that number precision limitations of the R language may make the variance-covariance matrix ldquocomputationally singularrdquo and unable to be inverted
The first step in the program is to read in the return data R can input data from many file types but in the present example the data are stored in a comma-delimited Excel file called ldquoReturnscsvrdquo which contains stock return data In this case the Excel file includes a header row labeling each column of returns with identifying information but no row names The program first reads in the data and then determines the number of securities (number of col-umns in the matrix) as shown on the facing page
ADDING SHORT-SALE CONSTRAINTS AND POSITION LIMITS
The above formulation of the portfolio choice problem places no restrictions on short sales and does not accom-modate position limits In reality individual investors and some fund managers may face requirements prohibit-ing short sales Fund managers may also face requirements that either limit the amount that may be invested in one security or sector or instead that a minimum percentage of funds be invested in a certain security or sector Dai Lin and Liu (2011) list several examples of real-world po-sition limits such as a requirement that a small-cap mutu-al fund invest at least a minimum percentage of its funds in small-company stocks In mathematical terms these short-sale restrictions and position limits can be expressed as a series of inequality constraints While reformulating the portfolio choice problem to add inequality constraints is not difficult doing so makes actually solving the prob-lem considerably more difficult
With short-sale restrictions and position limits the port-folio choice problem becomes
0
Min st
w VwRw MSw w
prime
=ge
where w is still the choice variable S is an m times k matrix that defines both the short-sale constraints on the k se-curities in the portfolio and m minus k other restrictions If there are short-sale constraints but no other restrictions the S matrix is simply a k times k identity matrix which when multiplied by the vector w results in the requirement that
0 iw ige forall If there are other restrictions the sub-matrix of S consisting of the first k rows and k columns of S is an identity matrix and the other restrictions are specified by suitable choices of the elements of the remaining rows of S For example suppose there is a position limit placing a maximum of p on the percentage invested in the sev-enth security so that 7 w ple Since the constraints in the optimization problem above have been expressed as non-negativity constraints this position limit must instead take the form 7 w pminus ge minus The row of S corresponding to
the position limit will consist entirely of zeros except for the seventh element which will be minus1 and corresponding element of the w0 vector would be p
Introducing other forms of position limits simply requires adding the appropriate rows to the S matrix For example if there is a requirement that the total percentage invested in the first and third securities equal or exceed a certain percentage q then one row of S should be [1 0 1 0 0]and the corresponding element of the w0 vector would be q If there is instead a requirement that the total percentage invested in the first and third securities not exceed a cer-tain amount q the required row of S would be [-1 0 -1 0 0] and the corresponding element of the w0 vector would be minusq Other restrictions may be specified similarly For problems that include position limits each of the first k el-
The BASIC R Portfolio Optimation Program
Returns ltminus readtable(ldquoReturnscsvrdquo header = TRUE sep = ldquordquo)Rmat ltminus asmatrix(Returns) Converts the data to matrix formk ltminus ncol(Rmat) Number of columns (number of securities in the portfolio) Now the program calculates the estimate of the variance-covariance matrix (V) the M vector and the R matrix which includes the estimate of the expected returns
V ltminus var(Rmat) Calculates the sample variance-covariance matrix which is used as the estimate of the variance-covariance matrix
Erp ltminus 001 Sets the desired expected portfolio return The user can change this value as desired
M ltminus rbind(1 Erp) Ones ltminus rep(1 k) Ravg ltminus colMeans(Rmat)
Defines the M matrix including the required portfolio return Defines a 1 x k matrix of ones Calculates average returns by column giving a 1 x k matrix of estimated expected returns
R ltminus rbind(Ones Ravg) Combines Ones and Ravg into the 2 x k matrix R Finally the program calculates the portfolio weights and the portfolio variance
VINV ltminus solve(V) Calculates the inverse of the estimated variance-covariance matrixH ltminus RVINVt(R) Calculates the H matrixHINV ltminus solve(H) Calculates the inverse of Hw lt- VINVt(R)HINVM Calculates the portfolio weightsPvar lt- t(w)Vw Calculates the portfolio variance The following commands display the results of the calculations
print(w) Prints the elements of the w vectorprint(Pvar) Prints the variance of the portfolio formed using the weights w
James A Turner Optimal Portfolios and the R Programming Language
50 International Journal of the Academic Business World 51Fall 2015 (Volume 9 Issue 2)
ements of the w0 vector will be zero corresponding to the non-negativity constraints and the remaining elements will equal the percentages associated with the position limits entered as positive or negative numbers depend-ing on whether the position limits establish minimums or maximums
The Lagrangian for this problem is
( ) ( )0 L w Vw M Rw w Swλ microprime prime prime= + minus + minus
where λ is a 2 times 1 vector containing the Lagrangian multi-pliers on the equality constraints and micro is an m times 1 vector of the Lagrangian multipliers on the k short-sale constraints and the m ndash k position limits The first-order necessary con-ditions for this problem are the Kuhn-Tucker conditions
( )0 0
2 0
0
0 0 and 0
L Vw R SwL M Rw
L w Sw w Sw
λ micro
λ
micro micromicro
part prime prime= minus minus =partpart
= minus =partpart prime= minus le ge minus =part
The final set of conditions are known as the complementa-ry slackness conditions since if an element of partLpartμ does not equal zero (ie if the required condition is slack) then the corresponding element of micro must equal zero and vice versa Because of the complementary slackness conditions in order to find a solution to the optimization problem each condition must be checked individually to deter-mine the possible solutions If there are more than a very few constraints finding the candidate solutions manually becomes extremely tedious
Fortunately it is possible to use numerical methods to solve this type of non-linear programming program This is where the strength of the R programming language be-comes very evident The R language provides access to an extensive number of add-on packages developed by R us-ers around the world In particular there are several pack-ages that implement numerical methods to find solutions to optimization problems with inequality constraints Perhaps the package that most easily lends itself to solv-ing the current problem is the ldquoquadprogrdquo package Ac-cording to the documentation included with the pack-age the quadprog routine ldquoimplements the dual method of Goldfarb and Idnani (1982 1983) for solving qua-dratic programming problems of the form min(d΄b+frac12b΄Db)) with the constraints Aʹbgtb₀rdquo For the optimization problem currently under consideration the d vector will be a zero vector the b vector will be the w vec-tor of portfolio weights the D matrix will be the variance-
covariance matrix V and the matrix A΄ will equal a matrix formed by combining the R matrix and the S matrix such that A΄= [R
S ]and A = [ R΄ S΄] Since the V matrix is symmetric the term frac12b΄Db = frac12w΄Vw is a quadratic form Also because the d vector is a zero vector the presence of the frac12 term in the quadratic form does not change the value of the solution to the current portfolio optimization problem That is the weights that minimize frac12w΄Vw sub-ject to the constraints will also minimize w΄Vw subject to the constraints
THE R PORTFOLIO OPTIMIZATION PROGRAM WITH PACKAGE ldquoQUADPROGrdquo
The ldquoQuadprogrdquo package is one of many add-in packages available to R users To use add-in packages in R the user must first download and install the chosen package This is done through the ldquoPackagesrdquo command in the menu bar of the console window Selecting the ldquoInstall package(s)rdquo command from the drop-down box will bring up a list of download locations After selecting a download location the user selects the package(s) to download and install Finally once the selected package is downloaded and in-stalled it must be loaded for use in the current R session which is done by choosing ldquoPackagesrdquo command on the menu bar and then choosing the ldquoLoad packagerdquo com-mand from the drop-down box A list of available packag-es will then appear and the user should select the desired package in this case the ldquoquadprogrdquo package Once the quadprog package is loaded the following program will solve the portfolio problem with short-sale restrictions and position limits
In the present example the short-sale constraint requires that all elements of the w vector be non-negative In addi-tion there are three position limits The first position lim-it requires that no more than 5 of total funds be invested in the seventh security The second position limit requires that no more than a total of 40 of available funds be in-vested in the first and third securities The third position limit requires that total of at least 30 of available funds be invested in the second and fourth securities
The program will make use of the M matrix and the vari-ance-covariance matrix V from the earlier program so those variables must be saved by the user or the following program must be run after running the previous program and before exiting R The new program first sets the posi-tion limits as shown on the facing page
The output of the ldquosolveQPrdquo function includes the values of w and the Lagrangian multipliers for each constraint If the value of a Lagrangian multiplier is zero the constraint associated with that multiplier is not binding otherwise the constraint is binding Though checking the values of
the Lagrangian multipliers allows the user to determine which constraints are binding quite easily the functionrsquos output also includes a listing of the binding constraints by index number
The R Portfolio Optimization Program with Package ldquoQuadprogrdquo
npl ltminus 3 Sets the number of position limits The user sets this value
plmat ltminus matrix (rep(0 nplk) nrow=npl ncol=k) Initializes the matrix that will be used to define the position limit(s)
plmat[17] = -1 Places the required elements into the proper places in the lmat[21] = plmat[23] = -1 position limits matrix In this example the first position
plmat[32] = plmat[34] = 1 limit will set a maximum on the total percentage invested in the seventh security The second position limit will set a maximum on the total percentage invested in the first and third securities The third position limit will set a minimum on the total percentage invested in the second and fourth securities
pl ltminus c(-005 -04 03) Sets the values of the position limits The value the user enters should be positive if the position limit specifies a inimum and should be negative if the position limit specifies a maximum
Next the inequality constraints are placed in matrix form
S ltminus rbind(diag(k) plmat) Defines the S matrix
w0 ltminus c(rep(0 k) pl) Creates a vector whose elements are the values of the inequality constraints
Next the arguments required by the solveQP function that solves the programming problem are defined and the programming problem is solved
dvec ltminus rep(0 k) Defines the d vector which is a necessary input for the quadprog package For portfolio optimization problems the elements of the d vector will all be zeros
Amat ltminus colbind(t(R) t(S)) Forms the Amat matrix
bvec ltminus c(M w0) Joins the M matrix and the w0 matrix to form the bvec vector
ICSol ltminus solveQP(V dvec Amat bvec meq=2) Solves the quadratic programming problem The argument meq specifies that the first two constraints are equality constraints In this example the equality constraints are that the weights sum to one and that the portfolio expected return equal a specified amount
print(c(ICSol[1] 2ICSol[[2]] ICSol[5] ICSol[6])) Prints selected output from the solve QP function the weights the portfolio variance the values of the Lagrangian multipliers and the index numbers of the binding constraints
James A Turner Optimal Portfolios and the R Programming Language
52 International Journal of the Academic Business World 53Fall 2015 (Volume 9 Issue 2)
CONCLUSION
This paper provides an R language program to calculate portfolio weights for efficient portfolios The program can also accommodate short-sale constraints and position limits Users must choose the desired portfolio expected return and must specify any other constraints A strong advantage of the program is that because the R program-ming language is freely available to anyone with access to the internet students and others who wish to use the pro-gram will be able to do so easily
REFERENCES
Dai Min Hanqing Jin and Hong Liu 2011 Illiquidity position limits and optimal investment for mutual funds Journal of Economic Theory 146 1598ndash1630
Goldfarb D and A Idnani 1982 Dual and primal-dual methods for solving strictly convex quadratic pro-grams In Hennart J P (ed) Numerical Analysis Springer-Verlag Berlin pages 77ndash91
Goldfarb D and A Idnani 1983 A numerically stable dual method for solving strictly convex quadratic pro-grams Mathematical Programming 27 1ndash33
Ihaka Ross A free software project Retrieved May 7 2013 from httpcranr-projectorgdochtmlinter-face98-paperpaper_2html
Markowitz Harry 1952 Portfolio selection Journal of Finance 7 77ndash91
Stephens Alan 1998 Markowitz and the spreadsheet Journal of Financial Education 35ndash43
Thompson Thomas H and Ashraf El-houbi 2012 SAS and the efficient portfolio International Research Jour-nal of Applied Finance 3 315ndash327
Turlach Berwin A 2013 quadprog Functions to solve quadratic programming problems R pack-age version 15-5 httpCRANR-projectorgpackage=quadprog (S original by Berwin A Turlach R port by Andreas Weingessel)
Vance Ashlee 2009 Data analysts captivated by Rrsquos power The New York Times Retrieved May 1 2013 from httpwwwnytimescom20090107tech nolog y busi ness-computi ng 0 7prog ra m htmlpagewanted=allamp_r=0
What is R Retrieved May 7 2013 from httpwwwr-projectorgabouthtml
APPENDIX 1 DATA
The data used in the R program come from the CRSP monthly stock file and consist of 60 months of return data from January 2008 to December 2012 The stocks in the 10-stock portfolio are the first 10 stocks in the CRSP monthly file (listed by PERMNO) for which 60 continuous months of returns are available The stocks in the 50-stock portfolio are the first 50 stocks for which 60 continuous months of returns are available Table 1 below lists the PERMNOS current company name and current ticker of the included stocks as well as the exchange where the stock trades
Table 1 Stocks in the Portfolio
NO PERMNO CURRENT COMPANY NAME TICKER EXCHANGE1 10001 GAS NATURAL INC EGAS AMEX2 10002 BANCTRUST FINANCIAL GROUP INC BTFG NASDAQ3 10025 A E P INDUSTRIES INC AEPI NASDAQ4 10026 J amp J SNACK FOODS CORP JJSF NASDAQ5 10032 PLEXUS CORP PLXS NASDAQ6 10044 ROCKY MOUNTAIN CHOCOLATE FAC INC RMCF NASDAQ7 10051 HANGER INC HGR NYSE8 10065 ADAMS EXPRESS CO ADX NYSE9 10100 AMERICAN LEARNING CORP NY ALRN NASDAQ
Table 1 Stocks in the Portfolio
NO PERMNO CURRENT COMPANY NAME TICKER EXCHANGE10 10104 ORACLE CORP ORCL NASDAQ11 10107 MICROSOFT CORP MSFT NASDAQ12 10138 T ROWE PRICE GROUP INC TROW NASDAQ13 10145 HONEYWELL INTERNATIONAL INC HON NYSE14 10147 E M C CORP MA EMC NYSE15 10180 AKORN INC AKRX NASDAQ16 10182 TECH DATA CORP TECD NASDAQ17 10200 REPLIGEN CORP RGEN NASDAQ18 10207 ROYCE FOCUS TRUST INC FUND NASDAQ19 10225 BEAM INC BEAM NYSE20 10232 ELMIRA SAVINGS BANK NY ESBK NASDAQ21 10239 BALDWIN amp LYONS INC BWINB NASDAQ22 10252 INDEPENDENT BANK CORP MA INDB NASDAQ23 10253 DOCUMENT SECURITY SYSTEMS INC DSS AMEX24 10257 D L H HOLDINGS CORP DLHC NASDAQ25 10258 CELLDEX THERAPEUTICS INC CLDX NASDAQ26 10259 SIGMA DESIGNS INC SIGM NASDAQ27 10294 HAVERTY FURNITURE COS INC HVT NYSE28 10297 NEW HAMPSHIRE THRIFT BNCSHRS INC NHTB NASDAQ29 10299 LINEAR TECHNOLOGY CORP LLTC NASDAQ30 10302 CYPRESS SEMICONDUCTOR CORP CY NASDAQ31 10308 TOMPKINS FINANCIAL CORP TMP AMEX32 10318 BALCHEM CORP BCPC NASDAQ33 10333 XOMA CORP XOMA NASDAQ34 10355 DAILY JOURNAL CORP DJCO NASDAQ35 10363 A M A G PHARMACEUTICALS INC AMAG NASDAQ36 10375 T C F FINANCIAL CORP TCB NYSE37 10382 ASTEC INDUSTRIES INC ASTE NASDAQ38 10395 NAVIGATORS GROUP INC NAVG NASDAQ39 10397 WERNER ENTERPRISES INC WERN NASDAQ40 10421 SKYWEST INC SKYW NASDAQ41 10443 PATRIOT TRANSPORTATION HLDG INC PATR NASDAQ42 10463 RESEARCH FRONTIERS INC REFR NASDAQ43 10501 AMERICAN WOODMARK CORP AMWD NASDAQ44 10507 MEDICAL ACTION INDS INC MDCI NASDAQ45 10514 TRANS WORLD ENTERTAINMENT CORP TWMC NASDAQ46 10516 ARCHER DANIELS MIDLAND CO ADM NYSE47 10517 AARONS INC AAN NYSE48 10530 MERIDIAN BIOSCIENCE INC VIVO NASDAQ49 10547 CLEARFIELD INC CLFD NASDAQ50 10550 PRO DEX INC COLO PDEX NASDAQ
James A Turner Optimal Portfolios and the R Programming Language
54 International Journal of the Academic Business World 55Fall 2015 (Volume 9 Issue 2)
APPENDIX 3 RESULTS FOR THE 10-STOCK PORTFOLIO
Results for the 10-stock portfolio with a monthly expect-ed return of 1 are shown at the top of the facing page First shown is the variance-covariance matrix (V) fol-lowed by its inverse (V-1)
Table 2 shows the return averages of each stock and the calculated portfolio weights both for the portfolio with no short-sale constraints or position limits and the port-folio with short-sale constraints and three position limits (1) a requirement that the percentage invested in the sev-enth security not exceed 5 (2) a requirement that the
total percentage invested in the first and the third securi-ties not exceed 40 and (3) a requirement that the total percentage invested in the second and fourth securities be at least 30 Note that when short-sale constraints and position limits are imposed there may no longer be a port-folio that meets all the constraints that is the feasible set may be null In that case the R program will return an error message stating that the constraints are inconsistent
Table 3 lists the inequality constraints and the associ-ated Lagrangian multipliers along with an indication of whether the constraint is binding In this example the constraint that there be a minimum of 30 invested in the second and fourth securities is not binding
APPENDIX 2 COPY OF THE FULL PROGRAM
The full program is shown below without comments Users can easily copy the program that is between the solid lines and paste it into the R Editor window It will probably be necessary for each user to change the name of the data file in the readtable command Also the user can change the portfolio expected return and the number type and value of the inequality constraints as desired
Returns ltminus readtable(ldquoReturnscsvrdquo header = TRUE sep = ldquordquo) Rmat ltminus asmatrix(Returns) k ltminus ncol(Rmat) V ltminus var(Rmat) Erp ltminus 001 M ltminus rbind(1 Erp) Ones ltminus rep(1 k) Ravg ltminus colMeans(Rmat) R ltminus rbind(Ones Ravg) VINV ltminus solve(V) H ltminus RVINVt(R) HINV ltminus solve(H) w lt- VINVt(R)HINVM Pvar lt- t(w)Vw print(w) print(Pvar) npl ltminus 3 plmat ltminus matrix (rep(0 nplk) nrow=npl ncol=k) plmat[17] = -1 plmat[21] = plmat[23] = -1 plmat[32] = plmat[34] = 1 pl ltminus c(-005 -04 03)S ltminus rbind(diag(k) plmat) w0 ltminus c(rep(0 k) pl) dvec ltminus rep(0 k) Amat ltminus cbind(t(R) t(S)) bvec ltminus c(M w0) ICSol ltminus solveQP(V dvec Amat bvec meq=2) print(c(ICSol[1] 2ICSol[[2]] ICSol[5] ICSol[6]))
1
2867001 161224 279311 153314 408660 148438 131874 246057 83608 740152
161224 321169 23967 251277 39387 55190 33449 107899 36378 39718
279311 23967 991158 109233 189872 100249 22208 119
V minus
minus minus minus
minus minus minus minus
minus minus minus minus
=
6782 41342 198294
153314 251277 109233 2757210 319797 03010 139907 969199 56520 416534
408660 39387 189872 319797 977494 325171 247388 1098965 26657 04097
148438 55190 100249 03010 325171 1
minus minus minus minus minus
minus minus minus minus minus minus
minus 644368 311333 1803329 91576 428583
131874 33449 22208 139907 247388 311333 1093506 426730 100681 162364
246057 107899 1196782 969199 1098965 1803329 426730 11640904 233195 3789283
8360
minus minus
minus minus minus minus minus minus minus
minus minus minus minus minus minus
8 36378 41342 56520 26657 91576 100681 233195 138635 73382
740152 39718 198294 416534 04097 428583 162364 3789283 73382 3685519
minus minus
minus minus minus minus minus minus
00046 00019 00002 00006 00035 00004 00011 00008 00018 00019
00019 00364 00013 00037 00002 00004 00003 00001 00100 00007
00002 00013 00161 00024 00076 00035 00013 00041 00038 00033
00006 0
V
minus minus minus minus
minus minus minus minus
minus minus
=
0037 00024 00058 00051 00010 00016 00021 00028 00029
00035 00002 00076 00051 00217 00009 00048 00052 00024 00064
00004 00004 00035 00010 00009 00087 00018 00022 00027 00012
00011 00003 00013 000
minus
minus minus
minus minus minus
16 00048 00018 00113 00013 00055 00018
00008 00001 00041 00021 00052 00022 00013 00033 00003 00034
00018 00100 00038 00028 00024 00027 00055 00003 00850 00020
00019 00007 00033 00029 00064 00
minus
minus minus minus minus minus minus minus minus
012 00018 00034 00020 00068minus
Table 2 Average Returns and Weights for the Ten-
Stock Portfolios
Stock No Permno
Average Returns
Weights (SS
Allowed)IC Weights
(No SS 3 PLs)
1 10001 00064 03817 034062 10002 -00054 00311 004063 10025 00183 00908 005944 10026 00156 02525 026255 10032 00095 -01410 000006 10044 00012 00649 013797 10051 00206 01000 005008 10065 00018 01933 004929 10100 00270 00422 0056810 10104 00104 -00155 00031
Table 3 Constraints and Lagrangian Multipliers
Constraint Lagrangian Multiplier
Constraint Binding
Portfolio weights sum to one 00015 Yes
Portfolio expected return equals 1 00443 Yes
w1 ge 0 00000 No w2 ge 0 00000 No
w3 ge 0 00000 No
w4 ge 0 00000 No
w5 ge 0 00015 Yes
w6 ge 0 00000 No
w7 ge 0 00000 No
w8 ge 0 00000 No
w9 ge 0 00000 No
w10ge 0 00000 No
w7 le 005 00003 Yes
w1 + w3 le 04 00002 Yes
w2 + w4 ge 03 00000 No
James A Turner Optimal Portfolios and the R Programming Language
56 International Journal of the Academic Business World 57Fall 2015 (Volume 9 Issue 2)
The portfolio variances are
No short-sale constraints 0001607 Short-sale constraints and three position limits 0001856
APPENDIX 4 RESULTS FOR THE 50-STOCK PORTFOLIO
Results for the 50-stock portfolio with a monthly ex-pected return of 1 are shown in Table 4 below The first table shows the return averages of each stock and the cal-culated portfolio weights both for the portfolio with no short-sale constraints or position limits and the portfolio with short-sale constraints and three position limits (1) a requirement that the percentage invested in the seventh security not exceed 5 (2) a requirement that the total percentage invested in the first and the third securities not exceed 40 and (3) a requirement that the total percent-age invested in the second and fourth securities be at least 30
Table 5 shows the Lagrangian multipliers on the equal-ity constraints and the position limit constraints To save space for the 50-stock portfolio the Lagrangian multi-pliers on the short-sale constraints are not listed Simply checking Table 4 to see if the weight on a particular stock is zero gives an almost certain indication of which short-sale constraints are binding In this example both the constraint that there be no more than 5 invested in the seventh security and the constraint that there be no more than a total of 40 invested in the first and third securi-ties are not binding
Table 4 Average Returns and Weights for the
50-Stock PortfoliosStock
No Permno Average Returns
Weights SS Allowed
IC Weights No SS 3 PLs
1 10001 00064 01934 013072 10002 -00054 -00179 003673 10025 00183 -00189 000004 10026 00156 02873 026335 10032 00095 00503 000006 10044 00012 -00185 000007 10051 00206 -00136 002288 10065 00018 10920 000009 10100 00270 00306 00423
10 10104 00104 01467 0000011 10107 -00001 -02023 00000
Table 4 Average Returns and Weights for the
50-Stock PortfoliosStock
No Permno Average Returns
Weights SS Allowed
IC Weights No SS 3 PLs
12 10138 00085 -05619 0000013 10145 00065 -03910 0000014 10147 00088 -02693 0000015 10180 00290 -00290 0000016 10182 00076 01181 0000017 10200 00082 01409 0040918 10207 00020 -01551 0000019 10225 00098 00285 0000020 10232 00159 -00021 0000021 10239 00051 01624 0000022 10252 00084 00955 0000023 10253 00058 00121 0000024 10257 -00008 -00236 0000025 10258 00196 -00157 0000026 10259 -00300 -01339 0000027 10294 00179 -00414 0000028 10297 00061 01854 0146729 10299 00074 00826 0000030 10302 00165 00201 0000031 10308 00073 01255 0014132 10318 00194 -01389 0000033 10333 -00203 -00205 0000034 10355 00299 -00545 0036035 10363 -00151 -00167 0000036 10375 00010 -00495 0000037 10382 00046 00267 0000038 10395 -00022 00886 0042339 10397 00134 01296 0084940 10421 -00036 -01045 0000041 10443 00021 01389 0000042 10463 00013 00417 0000043 10501 00176 -00458 0000044 10507 -00228 -00397 0000045 10514 00100 00731 0007846 10516 -00034 -00148 0119247 10517 00208 00629 0000048 10530 00005 00032 0000049 10547 00418 00032 0012550 10550 -00028 00397 00000
The portfolio variances are
No short-sale constraints 000002997 Short-sale constraints and three position limits 000111119
Table 5 Constraints and Lagrangian Multipliers
Constraint Lagrangian Multiplier Constraint Binding
Portfolio weights sum to one 0000503 YesPortfolio expected return equals 1 0031954 Yes
w7 le 005 0000000 Now1 + w3 le 04 0000000 Now2 + w4 ge 03 0000963 Yes
James A Turner
58 Fall 2015 (Volume 9 Issue 2)
This page intentionally blank
JOINT CONFERENCE May 25th 26th and 27th 2016 in
Nashville TN
Academic Business World International Conference
(ABWICorg)
The aim of Academic Business World is to promote inclusiveness in research by offering a forum for the discussion of research in early stages as well as re-search that may differ from lsquotraditionalrsquo paradigms We wish our conferences to have a reputation for providing a peer-reviewed venue that is open to the full range of researchers in business as well as reference disciplines within the social sciences
Business Disciplines
We encourage the submission of manuscripts presentation outlines and ab-stracts pertaining to any business or related discipline topic We believe that all disciplines are interrelated and that looking at our disciplines and how they relate to each other is preferable to focusing only on our individual lsquosilos of knowledgersquo The ideal presentation would cross discipline borders so as to be more relevant than a topic only of interest to a small subset of a single disci-pline Of course single domain topics are needed as well
International Conference on Learning and Administration in
Higher Education (ICLAHEorg)
All too often learning takes a back seat to discipline related research The In-ternational Conference on Learning and Administration in Higher Educa-tion seeks to focus exclusively on all aspects of learning and administration in higher education We wish to bring together a wide variety of individuals from all countries and all disciplines for the purpose of exchanging experi-ences ideas and research findings in the processes involved in learning and administration in the academic environment of higher education
We encourage the submission of manuscripts presentation outlines and ab-stracts in either of the following areas
Learning
We encourage the submission of manuscripts pertaining to pedagogical top-ics We believe that much of the learning process is not discipline specific and that we can all benefit from looking at research and practices outside our own discipline The ideal submission would take a general focus on learning rather than a discipline-specific perspective For example instead of focusing on ldquoMotivating Students in Group Projects in Marketing Managementrdquo you might broaden the perspective to ldquoMotivating Students in Group Projects in Upper Division Coursesrdquo or simply ldquoMotivating Students in Group Projectsrdquo The objective here is to share your work with the larger audience
Academic Administration
We encourage the submission of manuscripts pertaining to the administra-tion of academic units in colleges and universities We believe that many of the challenges facing academic departments are not discipline specific and that learning how different departments address these challenges will be ben-eficial The ideal paper would provide information that many administrators would find useful regardless of their own disciplines
- Testing Major Factors for Reducing Obstacles to Product Innovation Success
-
- Dr Tor Guimaraes
- Dr Marcelo Seido Nagano
- Dr Curtis Armstrong
-
- Acceptance of Change Exploring the Relationship among Psychometric Constructs and Employee Resistance
-
- Brian Dunican EdD
- Ric Keaster PhD
-
- The Origin and Construct of Cloud Computing
-
- Nozar Daylami PhD
-
- Optimal Portfolios and the R Programming Language
-
- James A Turner
-
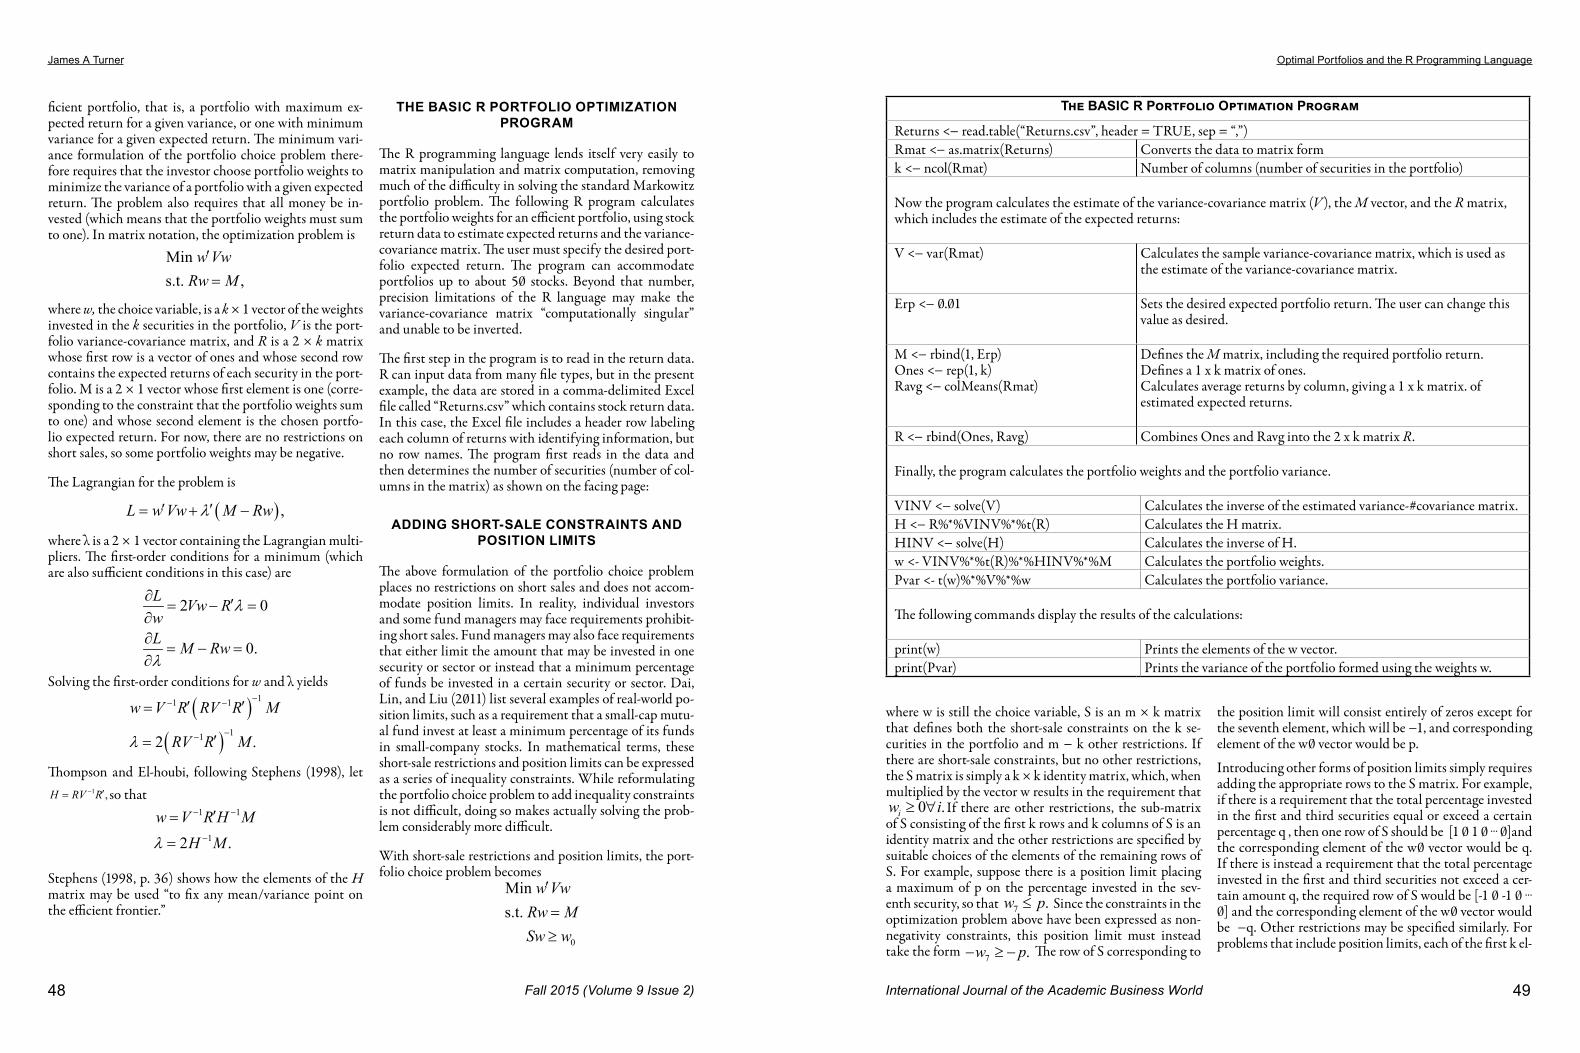
James A Turner Optimal Portfolios and the R Programming Language
52 International Journal of the Academic Business World 53Fall 2015 (Volume 9 Issue 2)
CONCLUSION
This paper provides an R language program to calculate portfolio weights for efficient portfolios The program can also accommodate short-sale constraints and position limits Users must choose the desired portfolio expected return and must specify any other constraints A strong advantage of the program is that because the R program-ming language is freely available to anyone with access to the internet students and others who wish to use the pro-gram will be able to do so easily
REFERENCES
Dai Min Hanqing Jin and Hong Liu 2011 Illiquidity position limits and optimal investment for mutual funds Journal of Economic Theory 146 1598ndash1630
Goldfarb D and A Idnani 1982 Dual and primal-dual methods for solving strictly convex quadratic pro-grams In Hennart J P (ed) Numerical Analysis Springer-Verlag Berlin pages 77ndash91
Goldfarb D and A Idnani 1983 A numerically stable dual method for solving strictly convex quadratic pro-grams Mathematical Programming 27 1ndash33
Ihaka Ross A free software project Retrieved May 7 2013 from httpcranr-projectorgdochtmlinter-face98-paperpaper_2html
Markowitz Harry 1952 Portfolio selection Journal of Finance 7 77ndash91
Stephens Alan 1998 Markowitz and the spreadsheet Journal of Financial Education 35ndash43
Thompson Thomas H and Ashraf El-houbi 2012 SAS and the efficient portfolio International Research Jour-nal of Applied Finance 3 315ndash327
Turlach Berwin A 2013 quadprog Functions to solve quadratic programming problems R pack-age version 15-5 httpCRANR-projectorgpackage=quadprog (S original by Berwin A Turlach R port by Andreas Weingessel)
Vance Ashlee 2009 Data analysts captivated by Rrsquos power The New York Times Retrieved May 1 2013 from httpwwwnytimescom20090107tech nolog y busi ness-computi ng 0 7prog ra m htmlpagewanted=allamp_r=0
What is R Retrieved May 7 2013 from httpwwwr-projectorgabouthtml
APPENDIX 1 DATA
The data used in the R program come from the CRSP monthly stock file and consist of 60 months of return data from January 2008 to December 2012 The stocks in the 10-stock portfolio are the first 10 stocks in the CRSP monthly file (listed by PERMNO) for which 60 continuous months of returns are available The stocks in the 50-stock portfolio are the first 50 stocks for which 60 continuous months of returns are available Table 1 below lists the PERMNOS current company name and current ticker of the included stocks as well as the exchange where the stock trades
Table 1 Stocks in the Portfolio
NO PERMNO CURRENT COMPANY NAME TICKER EXCHANGE1 10001 GAS NATURAL INC EGAS AMEX2 10002 BANCTRUST FINANCIAL GROUP INC BTFG NASDAQ3 10025 A E P INDUSTRIES INC AEPI NASDAQ4 10026 J amp J SNACK FOODS CORP JJSF NASDAQ5 10032 PLEXUS CORP PLXS NASDAQ6 10044 ROCKY MOUNTAIN CHOCOLATE FAC INC RMCF NASDAQ7 10051 HANGER INC HGR NYSE8 10065 ADAMS EXPRESS CO ADX NYSE9 10100 AMERICAN LEARNING CORP NY ALRN NASDAQ
Table 1 Stocks in the Portfolio
NO PERMNO CURRENT COMPANY NAME TICKER EXCHANGE10 10104 ORACLE CORP ORCL NASDAQ11 10107 MICROSOFT CORP MSFT NASDAQ12 10138 T ROWE PRICE GROUP INC TROW NASDAQ13 10145 HONEYWELL INTERNATIONAL INC HON NYSE14 10147 E M C CORP MA EMC NYSE15 10180 AKORN INC AKRX NASDAQ16 10182 TECH DATA CORP TECD NASDAQ17 10200 REPLIGEN CORP RGEN NASDAQ18 10207 ROYCE FOCUS TRUST INC FUND NASDAQ19 10225 BEAM INC BEAM NYSE20 10232 ELMIRA SAVINGS BANK NY ESBK NASDAQ21 10239 BALDWIN amp LYONS INC BWINB NASDAQ22 10252 INDEPENDENT BANK CORP MA INDB NASDAQ23 10253 DOCUMENT SECURITY SYSTEMS INC DSS AMEX24 10257 D L H HOLDINGS CORP DLHC NASDAQ25 10258 CELLDEX THERAPEUTICS INC CLDX NASDAQ26 10259 SIGMA DESIGNS INC SIGM NASDAQ27 10294 HAVERTY FURNITURE COS INC HVT NYSE28 10297 NEW HAMPSHIRE THRIFT BNCSHRS INC NHTB NASDAQ29 10299 LINEAR TECHNOLOGY CORP LLTC NASDAQ30 10302 CYPRESS SEMICONDUCTOR CORP CY NASDAQ31 10308 TOMPKINS FINANCIAL CORP TMP AMEX32 10318 BALCHEM CORP BCPC NASDAQ33 10333 XOMA CORP XOMA NASDAQ34 10355 DAILY JOURNAL CORP DJCO NASDAQ35 10363 A M A G PHARMACEUTICALS INC AMAG NASDAQ36 10375 T C F FINANCIAL CORP TCB NYSE37 10382 ASTEC INDUSTRIES INC ASTE NASDAQ38 10395 NAVIGATORS GROUP INC NAVG NASDAQ39 10397 WERNER ENTERPRISES INC WERN NASDAQ40 10421 SKYWEST INC SKYW NASDAQ41 10443 PATRIOT TRANSPORTATION HLDG INC PATR NASDAQ42 10463 RESEARCH FRONTIERS INC REFR NASDAQ43 10501 AMERICAN WOODMARK CORP AMWD NASDAQ44 10507 MEDICAL ACTION INDS INC MDCI NASDAQ45 10514 TRANS WORLD ENTERTAINMENT CORP TWMC NASDAQ46 10516 ARCHER DANIELS MIDLAND CO ADM NYSE47 10517 AARONS INC AAN NYSE48 10530 MERIDIAN BIOSCIENCE INC VIVO NASDAQ49 10547 CLEARFIELD INC CLFD NASDAQ50 10550 PRO DEX INC COLO PDEX NASDAQ
James A Turner Optimal Portfolios and the R Programming Language
54 International Journal of the Academic Business World 55Fall 2015 (Volume 9 Issue 2)
APPENDIX 3 RESULTS FOR THE 10-STOCK PORTFOLIO
Results for the 10-stock portfolio with a monthly expect-ed return of 1 are shown at the top of the facing page First shown is the variance-covariance matrix (V) fol-lowed by its inverse (V-1)
Table 2 shows the return averages of each stock and the calculated portfolio weights both for the portfolio with no short-sale constraints or position limits and the port-folio with short-sale constraints and three position limits (1) a requirement that the percentage invested in the sev-enth security not exceed 5 (2) a requirement that the
total percentage invested in the first and the third securi-ties not exceed 40 and (3) a requirement that the total percentage invested in the second and fourth securities be at least 30 Note that when short-sale constraints and position limits are imposed there may no longer be a port-folio that meets all the constraints that is the feasible set may be null In that case the R program will return an error message stating that the constraints are inconsistent
Table 3 lists the inequality constraints and the associ-ated Lagrangian multipliers along with an indication of whether the constraint is binding In this example the constraint that there be a minimum of 30 invested in the second and fourth securities is not binding
APPENDIX 2 COPY OF THE FULL PROGRAM
The full program is shown below without comments Users can easily copy the program that is between the solid lines and paste it into the R Editor window It will probably be necessary for each user to change the name of the data file in the readtable command Also the user can change the portfolio expected return and the number type and value of the inequality constraints as desired
Returns ltminus readtable(ldquoReturnscsvrdquo header = TRUE sep = ldquordquo) Rmat ltminus asmatrix(Returns) k ltminus ncol(Rmat) V ltminus var(Rmat) Erp ltminus 001 M ltminus rbind(1 Erp) Ones ltminus rep(1 k) Ravg ltminus colMeans(Rmat) R ltminus rbind(Ones Ravg) VINV ltminus solve(V) H ltminus RVINVt(R) HINV ltminus solve(H) w lt- VINVt(R)HINVM Pvar lt- t(w)Vw print(w) print(Pvar) npl ltminus 3 plmat ltminus matrix (rep(0 nplk) nrow=npl ncol=k) plmat[17] = -1 plmat[21] = plmat[23] = -1 plmat[32] = plmat[34] = 1 pl ltminus c(-005 -04 03)S ltminus rbind(diag(k) plmat) w0 ltminus c(rep(0 k) pl) dvec ltminus rep(0 k) Amat ltminus cbind(t(R) t(S)) bvec ltminus c(M w0) ICSol ltminus solveQP(V dvec Amat bvec meq=2) print(c(ICSol[1] 2ICSol[[2]] ICSol[5] ICSol[6]))
1
2867001 161224 279311 153314 408660 148438 131874 246057 83608 740152
161224 321169 23967 251277 39387 55190 33449 107899 36378 39718
279311 23967 991158 109233 189872 100249 22208 119
V minus
minus minus minus
minus minus minus minus
minus minus minus minus
=
6782 41342 198294
153314 251277 109233 2757210 319797 03010 139907 969199 56520 416534
408660 39387 189872 319797 977494 325171 247388 1098965 26657 04097
148438 55190 100249 03010 325171 1
minus minus minus minus minus
minus minus minus minus minus minus
minus 644368 311333 1803329 91576 428583
131874 33449 22208 139907 247388 311333 1093506 426730 100681 162364
246057 107899 1196782 969199 1098965 1803329 426730 11640904 233195 3789283
8360
minus minus
minus minus minus minus minus minus minus
minus minus minus minus minus minus
8 36378 41342 56520 26657 91576 100681 233195 138635 73382
740152 39718 198294 416534 04097 428583 162364 3789283 73382 3685519
minus minus
minus minus minus minus minus minus
00046 00019 00002 00006 00035 00004 00011 00008 00018 00019
00019 00364 00013 00037 00002 00004 00003 00001 00100 00007
00002 00013 00161 00024 00076 00035 00013 00041 00038 00033
00006 0
V
minus minus minus minus
minus minus minus minus
minus minus
=
0037 00024 00058 00051 00010 00016 00021 00028 00029
00035 00002 00076 00051 00217 00009 00048 00052 00024 00064
00004 00004 00035 00010 00009 00087 00018 00022 00027 00012
00011 00003 00013 000
minus
minus minus
minus minus minus
16 00048 00018 00113 00013 00055 00018
00008 00001 00041 00021 00052 00022 00013 00033 00003 00034
00018 00100 00038 00028 00024 00027 00055 00003 00850 00020
00019 00007 00033 00029 00064 00
minus
minus minus minus minus minus minus minus minus
012 00018 00034 00020 00068minus
Table 2 Average Returns and Weights for the Ten-
Stock Portfolios
Stock No Permno
Average Returns
Weights (SS
Allowed)IC Weights
(No SS 3 PLs)
1 10001 00064 03817 034062 10002 -00054 00311 004063 10025 00183 00908 005944 10026 00156 02525 026255 10032 00095 -01410 000006 10044 00012 00649 013797 10051 00206 01000 005008 10065 00018 01933 004929 10100 00270 00422 0056810 10104 00104 -00155 00031
Table 3 Constraints and Lagrangian Multipliers
Constraint Lagrangian Multiplier
Constraint Binding
Portfolio weights sum to one 00015 Yes
Portfolio expected return equals 1 00443 Yes
w1 ge 0 00000 No w2 ge 0 00000 No
w3 ge 0 00000 No
w4 ge 0 00000 No
w5 ge 0 00015 Yes
w6 ge 0 00000 No
w7 ge 0 00000 No
w8 ge 0 00000 No
w9 ge 0 00000 No
w10ge 0 00000 No
w7 le 005 00003 Yes
w1 + w3 le 04 00002 Yes
w2 + w4 ge 03 00000 No
James A Turner Optimal Portfolios and the R Programming Language
56 International Journal of the Academic Business World 57Fall 2015 (Volume 9 Issue 2)
The portfolio variances are
No short-sale constraints 0001607 Short-sale constraints and three position limits 0001856
APPENDIX 4 RESULTS FOR THE 50-STOCK PORTFOLIO
Results for the 50-stock portfolio with a monthly ex-pected return of 1 are shown in Table 4 below The first table shows the return averages of each stock and the cal-culated portfolio weights both for the portfolio with no short-sale constraints or position limits and the portfolio with short-sale constraints and three position limits (1) a requirement that the percentage invested in the seventh security not exceed 5 (2) a requirement that the total percentage invested in the first and the third securities not exceed 40 and (3) a requirement that the total percent-age invested in the second and fourth securities be at least 30
Table 5 shows the Lagrangian multipliers on the equal-ity constraints and the position limit constraints To save space for the 50-stock portfolio the Lagrangian multi-pliers on the short-sale constraints are not listed Simply checking Table 4 to see if the weight on a particular stock is zero gives an almost certain indication of which short-sale constraints are binding In this example both the constraint that there be no more than 5 invested in the seventh security and the constraint that there be no more than a total of 40 invested in the first and third securi-ties are not binding
Table 4 Average Returns and Weights for the
50-Stock PortfoliosStock
No Permno Average Returns
Weights SS Allowed
IC Weights No SS 3 PLs
1 10001 00064 01934 013072 10002 -00054 -00179 003673 10025 00183 -00189 000004 10026 00156 02873 026335 10032 00095 00503 000006 10044 00012 -00185 000007 10051 00206 -00136 002288 10065 00018 10920 000009 10100 00270 00306 00423
10 10104 00104 01467 0000011 10107 -00001 -02023 00000
Table 4 Average Returns and Weights for the
50-Stock PortfoliosStock
No Permno Average Returns
Weights SS Allowed
IC Weights No SS 3 PLs
12 10138 00085 -05619 0000013 10145 00065 -03910 0000014 10147 00088 -02693 0000015 10180 00290 -00290 0000016 10182 00076 01181 0000017 10200 00082 01409 0040918 10207 00020 -01551 0000019 10225 00098 00285 0000020 10232 00159 -00021 0000021 10239 00051 01624 0000022 10252 00084 00955 0000023 10253 00058 00121 0000024 10257 -00008 -00236 0000025 10258 00196 -00157 0000026 10259 -00300 -01339 0000027 10294 00179 -00414 0000028 10297 00061 01854 0146729 10299 00074 00826 0000030 10302 00165 00201 0000031 10308 00073 01255 0014132 10318 00194 -01389 0000033 10333 -00203 -00205 0000034 10355 00299 -00545 0036035 10363 -00151 -00167 0000036 10375 00010 -00495 0000037 10382 00046 00267 0000038 10395 -00022 00886 0042339 10397 00134 01296 0084940 10421 -00036 -01045 0000041 10443 00021 01389 0000042 10463 00013 00417 0000043 10501 00176 -00458 0000044 10507 -00228 -00397 0000045 10514 00100 00731 0007846 10516 -00034 -00148 0119247 10517 00208 00629 0000048 10530 00005 00032 0000049 10547 00418 00032 0012550 10550 -00028 00397 00000
The portfolio variances are
No short-sale constraints 000002997 Short-sale constraints and three position limits 000111119
Table 5 Constraints and Lagrangian Multipliers
Constraint Lagrangian Multiplier Constraint Binding
Portfolio weights sum to one 0000503 YesPortfolio expected return equals 1 0031954 Yes
w7 le 005 0000000 Now1 + w3 le 04 0000000 Now2 + w4 ge 03 0000963 Yes
James A Turner
58 Fall 2015 (Volume 9 Issue 2)
This page intentionally blank
JOINT CONFERENCE May 25th 26th and 27th 2016 in
Nashville TN
Academic Business World International Conference
(ABWICorg)
The aim of Academic Business World is to promote inclusiveness in research by offering a forum for the discussion of research in early stages as well as re-search that may differ from lsquotraditionalrsquo paradigms We wish our conferences to have a reputation for providing a peer-reviewed venue that is open to the full range of researchers in business as well as reference disciplines within the social sciences
Business Disciplines
We encourage the submission of manuscripts presentation outlines and ab-stracts pertaining to any business or related discipline topic We believe that all disciplines are interrelated and that looking at our disciplines and how they relate to each other is preferable to focusing only on our individual lsquosilos of knowledgersquo The ideal presentation would cross discipline borders so as to be more relevant than a topic only of interest to a small subset of a single disci-pline Of course single domain topics are needed as well
International Conference on Learning and Administration in
Higher Education (ICLAHEorg)
All too often learning takes a back seat to discipline related research The In-ternational Conference on Learning and Administration in Higher Educa-tion seeks to focus exclusively on all aspects of learning and administration in higher education We wish to bring together a wide variety of individuals from all countries and all disciplines for the purpose of exchanging experi-ences ideas and research findings in the processes involved in learning and administration in the academic environment of higher education
We encourage the submission of manuscripts presentation outlines and ab-stracts in either of the following areas
Learning
We encourage the submission of manuscripts pertaining to pedagogical top-ics We believe that much of the learning process is not discipline specific and that we can all benefit from looking at research and practices outside our own discipline The ideal submission would take a general focus on learning rather than a discipline-specific perspective For example instead of focusing on ldquoMotivating Students in Group Projects in Marketing Managementrdquo you might broaden the perspective to ldquoMotivating Students in Group Projects in Upper Division Coursesrdquo or simply ldquoMotivating Students in Group Projectsrdquo The objective here is to share your work with the larger audience
Academic Administration
We encourage the submission of manuscripts pertaining to the administra-tion of academic units in colleges and universities We believe that many of the challenges facing academic departments are not discipline specific and that learning how different departments address these challenges will be ben-eficial The ideal paper would provide information that many administrators would find useful regardless of their own disciplines
- Testing Major Factors for Reducing Obstacles to Product Innovation Success
-
- Dr Tor Guimaraes
- Dr Marcelo Seido Nagano
- Dr Curtis Armstrong
-
- Acceptance of Change Exploring the Relationship among Psychometric Constructs and Employee Resistance
-
- Brian Dunican EdD
- Ric Keaster PhD
-
- The Origin and Construct of Cloud Computing
-
- Nozar Daylami PhD
-
- Optimal Portfolios and the R Programming Language
-
- James A Turner
-
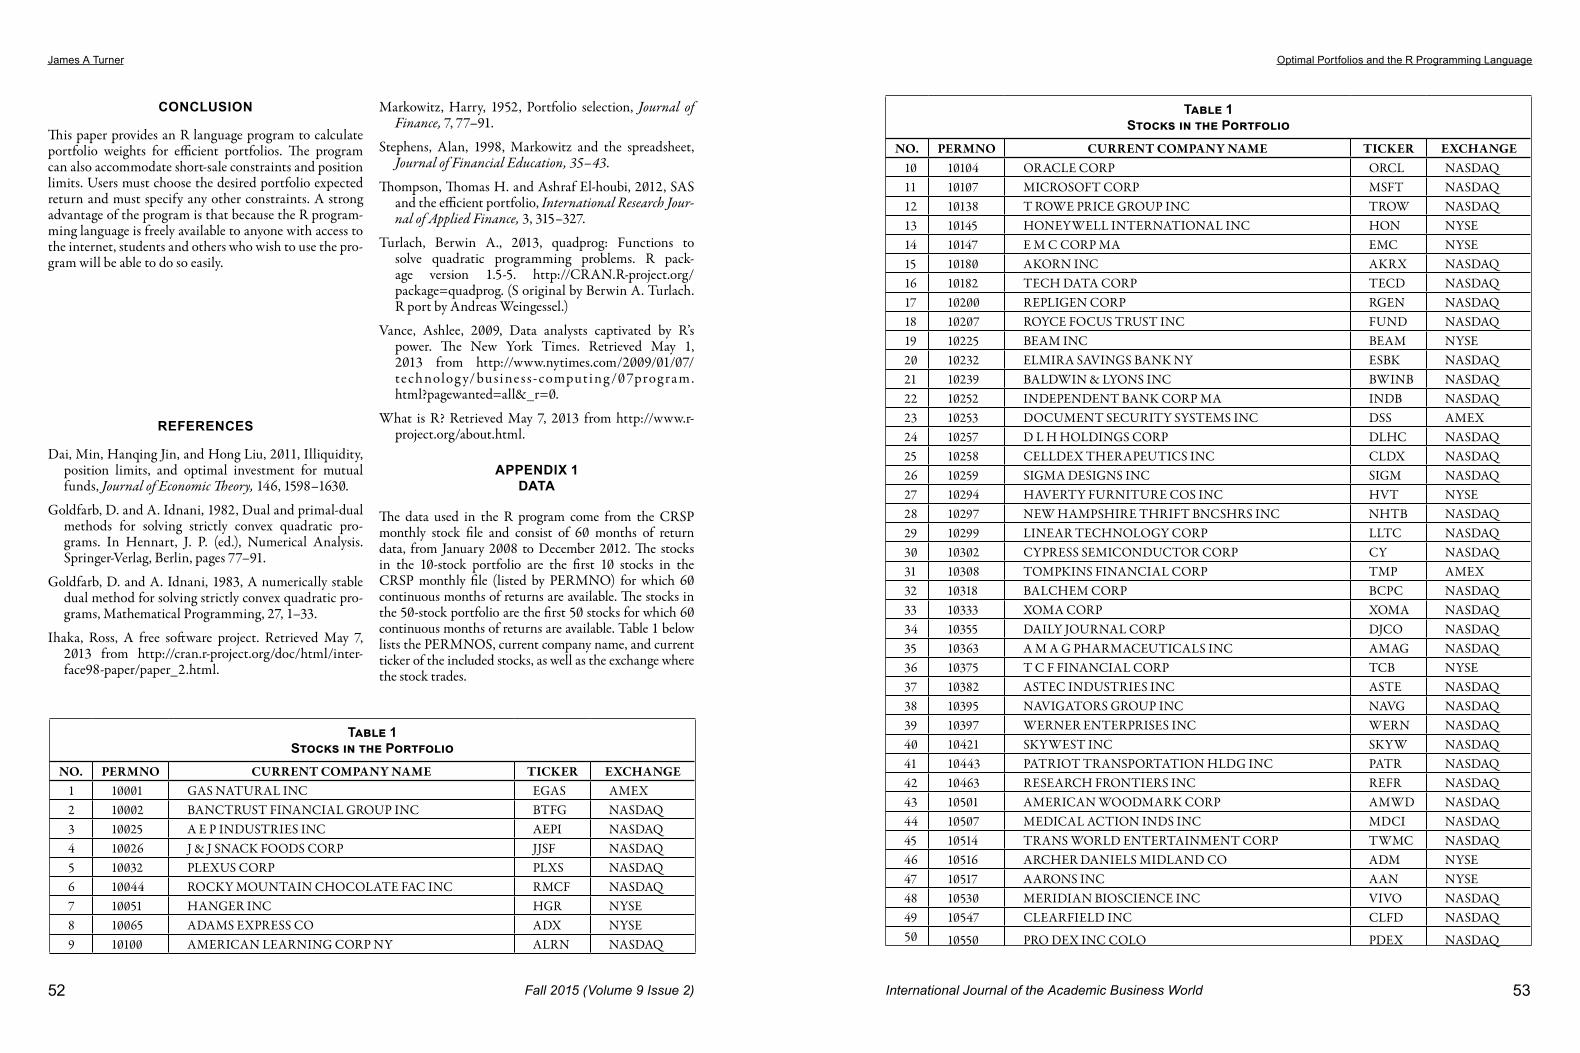
James A Turner Optimal Portfolios and the R Programming Language
56 International Journal of the Academic Business World 57Fall 2015 (Volume 9 Issue 2)
The portfolio variances are
No short-sale constraints 0001607 Short-sale constraints and three position limits 0001856
APPENDIX 4 RESULTS FOR THE 50-STOCK PORTFOLIO
Results for the 50-stock portfolio with a monthly ex-pected return of 1 are shown in Table 4 below The first table shows the return averages of each stock and the cal-culated portfolio weights both for the portfolio with no short-sale constraints or position limits and the portfolio with short-sale constraints and three position limits (1) a requirement that the percentage invested in the seventh security not exceed 5 (2) a requirement that the total percentage invested in the first and the third securities not exceed 40 and (3) a requirement that the total percent-age invested in the second and fourth securities be at least 30
Table 5 shows the Lagrangian multipliers on the equal-ity constraints and the position limit constraints To save space for the 50-stock portfolio the Lagrangian multi-pliers on the short-sale constraints are not listed Simply checking Table 4 to see if the weight on a particular stock is zero gives an almost certain indication of which short-sale constraints are binding In this example both the constraint that there be no more than 5 invested in the seventh security and the constraint that there be no more than a total of 40 invested in the first and third securi-ties are not binding
Table 4 Average Returns and Weights for the
50-Stock PortfoliosStock
No Permno Average Returns
Weights SS Allowed
IC Weights No SS 3 PLs
1 10001 00064 01934 013072 10002 -00054 -00179 003673 10025 00183 -00189 000004 10026 00156 02873 026335 10032 00095 00503 000006 10044 00012 -00185 000007 10051 00206 -00136 002288 10065 00018 10920 000009 10100 00270 00306 00423
10 10104 00104 01467 0000011 10107 -00001 -02023 00000
Table 4 Average Returns and Weights for the
50-Stock PortfoliosStock
No Permno Average Returns
Weights SS Allowed
IC Weights No SS 3 PLs
12 10138 00085 -05619 0000013 10145 00065 -03910 0000014 10147 00088 -02693 0000015 10180 00290 -00290 0000016 10182 00076 01181 0000017 10200 00082 01409 0040918 10207 00020 -01551 0000019 10225 00098 00285 0000020 10232 00159 -00021 0000021 10239 00051 01624 0000022 10252 00084 00955 0000023 10253 00058 00121 0000024 10257 -00008 -00236 0000025 10258 00196 -00157 0000026 10259 -00300 -01339 0000027 10294 00179 -00414 0000028 10297 00061 01854 0146729 10299 00074 00826 0000030 10302 00165 00201 0000031 10308 00073 01255 0014132 10318 00194 -01389 0000033 10333 -00203 -00205 0000034 10355 00299 -00545 0036035 10363 -00151 -00167 0000036 10375 00010 -00495 0000037 10382 00046 00267 0000038 10395 -00022 00886 0042339 10397 00134 01296 0084940 10421 -00036 -01045 0000041 10443 00021 01389 0000042 10463 00013 00417 0000043 10501 00176 -00458 0000044 10507 -00228 -00397 0000045 10514 00100 00731 0007846 10516 -00034 -00148 0119247 10517 00208 00629 0000048 10530 00005 00032 0000049 10547 00418 00032 0012550 10550 -00028 00397 00000
The portfolio variances are
No short-sale constraints 000002997 Short-sale constraints and three position limits 000111119
Table 5 Constraints and Lagrangian Multipliers
Constraint Lagrangian Multiplier Constraint Binding
Portfolio weights sum to one 0000503 YesPortfolio expected return equals 1 0031954 Yes
w7 le 005 0000000 Now1 + w3 le 04 0000000 Now2 + w4 ge 03 0000963 Yes
James A Turner
58 Fall 2015 (Volume 9 Issue 2)
This page intentionally blank
JOINT CONFERENCE May 25th 26th and 27th 2016 in
Nashville TN
Academic Business World International Conference
(ABWICorg)
The aim of Academic Business World is to promote inclusiveness in research by offering a forum for the discussion of research in early stages as well as re-search that may differ from lsquotraditionalrsquo paradigms We wish our conferences to have a reputation for providing a peer-reviewed venue that is open to the full range of researchers in business as well as reference disciplines within the social sciences
Business Disciplines
We encourage the submission of manuscripts presentation outlines and ab-stracts pertaining to any business or related discipline topic We believe that all disciplines are interrelated and that looking at our disciplines and how they relate to each other is preferable to focusing only on our individual lsquosilos of knowledgersquo The ideal presentation would cross discipline borders so as to be more relevant than a topic only of interest to a small subset of a single disci-pline Of course single domain topics are needed as well
International Conference on Learning and Administration in
Higher Education (ICLAHEorg)
All too often learning takes a back seat to discipline related research The In-ternational Conference on Learning and Administration in Higher Educa-tion seeks to focus exclusively on all aspects of learning and administration in higher education We wish to bring together a wide variety of individuals from all countries and all disciplines for the purpose of exchanging experi-ences ideas and research findings in the processes involved in learning and administration in the academic environment of higher education
We encourage the submission of manuscripts presentation outlines and ab-stracts in either of the following areas
Learning
We encourage the submission of manuscripts pertaining to pedagogical top-ics We believe that much of the learning process is not discipline specific and that we can all benefit from looking at research and practices outside our own discipline The ideal submission would take a general focus on learning rather than a discipline-specific perspective For example instead of focusing on ldquoMotivating Students in Group Projects in Marketing Managementrdquo you might broaden the perspective to ldquoMotivating Students in Group Projects in Upper Division Coursesrdquo or simply ldquoMotivating Students in Group Projectsrdquo The objective here is to share your work with the larger audience
Academic Administration
We encourage the submission of manuscripts pertaining to the administra-tion of academic units in colleges and universities We believe that many of the challenges facing academic departments are not discipline specific and that learning how different departments address these challenges will be ben-eficial The ideal paper would provide information that many administrators would find useful regardless of their own disciplines
- Testing Major Factors for Reducing Obstacles to Product Innovation Success
-
- Dr Tor Guimaraes
- Dr Marcelo Seido Nagano
- Dr Curtis Armstrong
-
- Acceptance of Change Exploring the Relationship among Psychometric Constructs and Employee Resistance
-
- Brian Dunican EdD
- Ric Keaster PhD
-
- The Origin and Construct of Cloud Computing
-
- Nozar Daylami PhD
-
- Optimal Portfolios and the R Programming Language
-
- James A Turner
-