i united of drive-to-tree, forest service rubber-tired fe
TRANSCRIPT
i
United States Department of Agriculture
Forest Service
Southern Forest Experiment Station
New Orleans, Louisiana
General Technical Report SO-45 August, 1983
Drive-To-Tree, Rubber-Tired Fe Buncher Produ
B. L. tanford and D. L. Sirois
SUMMARY
The increasing use of machines to fell trees has created a need for better understanding this process and what factors affect production. This report provides infomation on feller buncher activities and presents means for estimating production rates for rubber-tired drive-to-tree machines. Four types of machines were tested and were found to have different production rates. Total productive felling and bunching time per tree increased with increasing Dl3H and distance between trees and decreased with larger aecumaalations, During the .test the average production. per productive machine hour ranged from 109 to 214 trees per hour.

Drive-To-Tree, Rubber-Tired Feller Buncher Production Studies
ford m d D, L, Simis
INTRODUCTlON STUDY CONDITIONS
Considerable attention has been given to the ad- vantages of mechanized methods of felling trees. Machines that also put the trees in piles offer even more advantages. Skidders with hydraulic grapples work very efficiently behind these felling and bunch- ing machines. By having the trees in piles, grapple skidders generally spend less time accumulating a payload than a skidder with chokers whose operator must pull cable to singly located trees. At the loading deck the grapple skidder operator can drop his load very rapidly, often without loss of fomard motion. Grapple skidders can be used to pick up individual trees, but if the trees are small, the production rate is low with high cost per unit of production. Conse- quently, it is very desirable to have trees in piles matched to the capacity of the skidder, such as those that can be made by feller bunchers.
The, alternative to mechanized felling is manual felling using a chain saw, While most wood is pres- ently felled with chainsaws, operators willing to endure the physical strain are becoming scarce. Dur- ing the hot summer months, manual fellers must take frequent breaks in order to avoid heat exhaus- tion, Since felling is the first act of tree process- ing, it influences all subsequent activities such as skidding, delirnbing, and loading, so i t is the key productioa element of the system. Because of these problems, logging managers have become keenly interested in mechanized feller bunchers. They find that these machines fell trees faster than manual methods and are capable of maintaining these rates day after day, woods workers are also more inter- ested in operating a feller buncher than a chainsaw because of the reduced physical effort and protection from the weather by the cab. To benefit from the advantages of feller bunchers, i t is necessary to un-
In general, fsur categories of feller-bunchers can be identified: rubber-tired dsive-to-bee, crawler drive-do-tree, mbber-tired s&ng-to-tree, and crmles swing-to-tree, A ""dive-to-tree" or ""tee-to-tree" ma- chine moves to a tree, holds and cuts it, and moves to another tree or to a pile while carrying the fir& tree. In contrast, the '"wing-to-tree" or ""lmited area'haehines have a boom that connects the felling head to the carrier and allows the machine to reach out to a tree rather than driving to it. Typically, the swing-to-tree machine sets up where it can reach several trees, proceeds to cut each and puts them in a pile. The sab&visions of "crawler" and ""rubber- tired79efer to the mode of locomotion inherent to the carrier.
This study focused on fsur drive-to-tree, rubber- tired feller-bunchers working in a clearcutting pat- tern. The machines studied were working on coastal plains and lower piedmont sites in the states of Georgia, Florida, and Mississippi.
During a normal day's activity, a feller-buncher is involved in one of three categories of time: pro- ductive, down, or idle. Productive time is that time spent processing trees: i,e. moving, felling, and bunching. Down time includes both scheduled and unscheduled repair and maintenance on the machine, when it is not cutting wood. Service is considered part of scheduled maintenance. Idle time is when the machine is available for work but is not' doing so. In this report only the productive phase will be covered. Consequently, the reported rates contain no adjust- ment for down or idle times. To apply these produc- tive rates to predict daily machine performance, they must be reduced by the ratio of productive to sched- uled time. This ratio is commonly called the "utiliza- tion" mte.
derstand their production potentials and limitations. This report provides information on feller buneber Time Study Procedures
activities and presents means of estimating produc- Data for this report was collected during tho Lion rates, summer of 1978. Descriptions of the forms and pro-
B. 8;. Lanford i s Ass~ciade Professof;, Alabama AgricuiduraZ Experiment Station, Auburn University, AL, and D. L. Sirois is Research Engineer, Southern Forest Experiment Station, Forest Servic+USDA, Auburn, AL.

eedures are given in the Appendix. The field work '
involved three phases, First, after a feller buncher operator had been selected, the time study crew examined the cutting area for portions which avere reasonably uniform in species composition, stand density, and slope, No at-tempt was made to bias the operation away from the extremes; the only restraint on a study plot was that it represented only a single set of terrain conditions, However, any one plot could differ greatly from another, Plots were usually fifty feet wide by one to two hundred feet long depending on the hawesting pattern and cutting area. The long axis was selected in the direction that the machine would normally move during pmcessing. On a plot, each tree 2.5 inches and larger was tallied by XY coordinates, species, and diameter class a t breast height (DBH). Each tree was given a number which was written in large numerals on a key punch card that was stapled to i t in a position where the number could be read late from a distance. Typically, several plots would be set up prior to processing by the machine.
The second phase of the study involved the feller buncher cutting trees within the plot. The operator was instructed to cut in a normal manner within the customary merchantability limits, Most operations did not harvest smaller trees measured on the plots, The time study crew timed each elemental activity of the machine: i.e. the productive tirne elements of moving, position and shearing, dropping, and bunch maintenance. Moving included any traveling by the feller-bunches, either to a tree or to the bunch loca- tion. Position and shear was the cutting phase of the function and dropping was the tirne to release the trees from the shear head onto the pile. Bunch maintenance occurred when the machine adjusted the stems on the pile. Any other time elements, such as delays for machine maintenance or idle time, were recorded but will not be discussed in this report. During the timing, tree numbers of those felled were recorded along with other variables such as accumu- lation and bunch numbers.
third phase took place after the test; plot, was cut. A sample of felled trees were selected for volume determination. Measurements of total height, stump diameter, DBH, clear bole and diameter sf largest limb were taken on these trees.
Data Analysis
After the field data had been recorded and hand edited, the irlformaGion was key punched and stored on a magnetic disk for computer analysis, Since each field record of data islvolved only a single time ele- ment, it had to be sr-mnmarized into cycles, A feller huncher cycle was defined as the actions necessary
to create and deposit an acemulation of trees in a pile. For example, a cycle would start when the machine moved to the first tree to be cut. I t would cut that tree and perhaps one or two more before moving to a bunching location to drop the accumulated trees, The next cycle would begin when the machine moved to cut the next "first" tree. This would also end the first cycle, No time was lost during or between the cycles. Typically, the machine would put more than one accumulation on the same pile, Cycle summaries were expressed in. per tree measurements: moving tirne per tree, position and shear time per tree, average DBH, ete. Least squares regression analysis was the basic statistical tool employed to develop production estimates. Dummy variable techniques were used to handle noncontinuous variables, Lan- ford (1975) describes the general analysis procedure and the application of dummy variables.
Since i t was possible that time elements might be affected differently by the various descriptions of the work environment, each was analyzed separately before calculating a composite model for the total productive cycle time. Tree size, load size, and stand density measure were tested for each element of the cycle, as was the effect of different machines. DBH was used to indicate the tree size while the number, basal area, and volume of the accumulation described the load being handled by the machine. Stand den- sity measures were taken from the plot being cut and included trees, basal area, and volume per acre.
RESULTS
Table 1 displays the summarized time, production, and stand characteristics experienced during the study. F'or one feller buncher type, two machines with their operators were observed. On other types only one machine with its operator was timed. This means that the operator could have a significant effect on the production rate, In general, all machine,.' operator combinations were found to be different, All operators were expenertced crew members, thor- oughly familiar with their particular machine.
A sample observation was defined as an aecurnula- tion of stems held in the shear head that received only one drop dime, In, this G O D ~ ~ X ~ sample sizes ranged from 86 to 275 accumulations per machine type. Assuming that each observation was indepen- dent of the others, these samples developed means that varied from plus or minus 3 to II percent with 95 percent confidenee, Since each observation came from a cluster created by each plot and operator, machine eombimation, they were not necessarily in- dependenl;. Experknce has shown that this clustering may underestimate the true variability by 2 to 3 times (Lanfosd 1973). If so, the true sampling error

Table 1.-Summary statistics for four types o f feller bunchers time studied in the South
Feller buncher type1
R%achines visited
Accumulation summary Number Productive minutesldre
Average Range Coefficient of variation
DBH Average Range
Trees/accurnulation Average Range
Basal area (ft2) /accumulation Average Range
Volume (c.f.i.b) 2/accumulation Average Range
Stand summary Number of plots Trees/acre
Average Range
Basal area (f t2) /acre Average Range
Volume (cmnits) /acres Average Range
Average trees/lPMH4 Average cunits/PMH3
IMachine types: 1. Franklin 170 XLN with a Morbark 15 inch shear. 2. John Deere 544 with a Morbark 155 inch shear 3. John Deere 544 with a Rome 20 inch shear. 4. Hydro Ax 511 with a Morbark 20 inch shear.
2c.f.i.b. = cubic feet inside bark. T a r a s and Clark, 1974. 4P&IH =r productive naachise hour.
of the productive cycle times per tree could range from 9 to 33 percent with a 95 percent confidence limit, These statistics are prior to regression analysis.
Tree sizes ranged from 3 to 14 inches in DBH (elasses), Only pines were baweskd, In PPO case did the tree size exceed the shear design limits, Up to seven trees were accumulated per cycle bud averaged from 1-7 to 3.1, Average volume per accumulation ranged from 9.4 to 17.8 cubic feet inside bark ( e,f i b . ) ; however, maximum aceumaslatlons ranged from 20.4 to 47,8 c.f.i.b, I t would not "cake many ae- cumulations to make a full skidder payload if the average size accumulation was similar to the maxi- mums observed,
Stand summaries given in table 1 include only the trees that were of the sizes and species harvested. Since these were clearcut operations, only very small pines and hardwoods are excluded from the baly.
Average production sates sbowcd the four feller bunchers cutting from 1.8 to 3.6 trees per productive minute with volume rates from 3 to 16 cunits per productive machine hours (P33H).
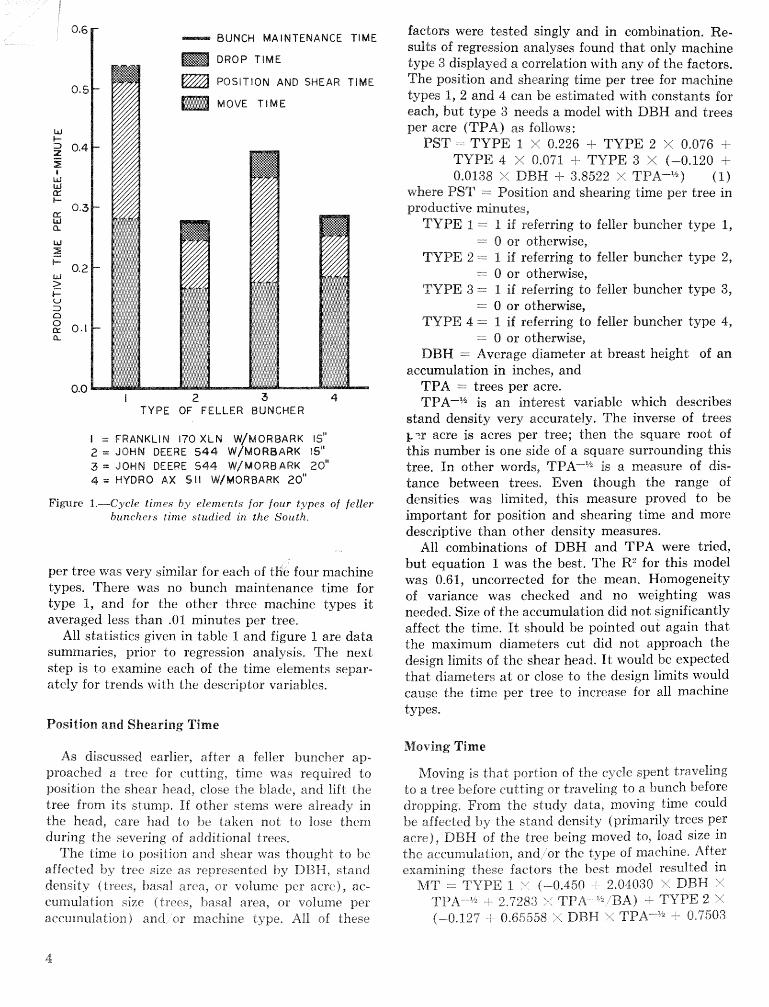
Figure I gives a brea"i.bc%o.n of Lime elements within cycles. For feller huncher type 1, 53 percent of its cycle was spent moving, where 66 percent was re- quired for type 4. Type 1 spent the most time posi- tioning and shearing, but as a percent of total cycle machine type 3 took the most, 44 percent. Drop time
"'" r BUNCH MAINTENANCE TlME
DROP TlME
POSITION AND SWEAR TlME
MOVE TlME
TYPE OF FELLER BUNGHER
I = FRANKLIN I 7 0 X L N WMQRBARK 15'' 2 = JOHN DEERE 544 W/MORBARK 15'' 3 = JOHN OEERE 544 WIMORBARK 20'' 4 = HYDRO A X S l l WIMORBARK 20"
Fie re I.-Cycle times by elemcnts for four types of feller brrnchers time studied in the South.
per tree was very similar for each of the four machine types. There was no bunch maintenance time for type I, and for the other three machine types it averaged less than .01 minutes per tree.
All statistics given in table 1 and figure 1 are data summaries, prior to regression analysis. The next step is to examine each of the time elements separ- ately for trends with the descriptor variables.
factors were tested singly and in combination. Re- sults of regression analyses found that only machine type 3 displayed a correlation with any of the factors. The position and shearing time per tree for machine types 1, 2 and 4 can be estimated with constants for each, but type 3 needs a model with DBH and trees per acre (TPA) as follows:
PSI" = TYPE 1 X 0,226 -J- TYPE 2 X 0,076 f TYPIC 4 X 0,071. J- TYPE 3 X (-0.120 -C 0,0138 >( DBH + 3,8522 ,< TPA-%..) (I)
where PST = Position and shearing time per tree in productive minudes,
TYPE I == 1 if referring to feller buncher type 1, = 0 or otherwise,
TYPE 2 -- 1 if referring to feller buncher type 2, = 0 or othemvise,
TYPE 3 - 1 if referring to feller buncher type 3, = O or othemise,
TYPE 4 .= 1 if referring to feller buncher type 4, -- 0 or othemise,
DBH == Average diameter a t breast height of an accumulation in inches, and
?"PA = trees per acre. ?'PA-" is an interest variable which describes
stand density very accurately. The inverse of trees = p r acre is acres per tree; then the square root of this number is one side of a square surrounding this tree. In other words, TPA-" is a measure of dis- tance between trees. Even though the range of densities was limited, this measure proved to be important for position and shearing time and more descriptive than other density measures.
All combinations of DBH and TPA were tried, but equation I was the best. The R2 for this model was 0.61, uncorrected for the mean. Homogeneity of variance was checked and no weighting was needed. Size of the accumulation did not significantly affect the time. I t should be pointed out again that the maximum diameters cut did not approach the design limits of the shear head. I t would be expected that diameters a t or close to the design limits would cause the time per tree to increase for all machine types.
Position and Shearing Time
As discussed earlier, after a feller buncher ap- proached a tree for cutting, time was required to position the shear heact, close the blade, and lift the tree from its si-unlp. If other stems were already in the head, care bad to IPG taken not to lose them during the severing of additional trees.
The time to position and shear was thought to be affected by t r c ~ size as rel=.rescnted by DBH, stand density {trees, basal area, or volume per acnl), ac- curnulalion size (trces, basal area, or volume per acctllnulation) and or machine iype, All of theire
&loving Time
AToving is that portion of the cycle spent traveling to a tree before cutting or traveling to a hunch before dropping. From the study data, moving time could be affected by the stand density (primarily trees per acre), DBH of the tree being moved to, load size in the accumulation, and or the type of machine. After examining these factors the 13~st model resulted in
MT TYPE 1 1' (-0.450 -- 2.0-1030 Y DBH X TPA-" -l 2.7283 >*, TfdA-""z BBA) 1- TYPE 2 (-0.12'7 - 0.65558 \, DBK \I TPA-'G- 0.7503

>( TPA-%iBA) i- TUPE 3 X (-0.127 4- 0.65558 X DBH X TPA-% -i- 0,7503 X TII"A-% /BA) -t- TUPE 4 X (0.053 t 0.21836 X DBH X TPA-% + 0.3015 X TPA-s/BA) (2)
where MT = move time per tree in productive rninutes and
BA .= basal area per accumulation in square feet. The regression coeacients for type 2 and type 3
are the same because the move times per tree of the two machines were not significantly different. This is not surprising since the basic shear carriers are the same for both types.
From equation (2) it can be seen that as DBH or distance between trees increases, the time to move increases per tree. Conversely, as the accumuXation size increases, the time per tree decreases, which is caused by the decreased move to drop times for more trees. The number of trees in the accumulation was tested and found to be significant if BA was not in- cluded, but BA explained more variation than trees per accumulation.
All cross products of DBH, TPA, and BA for dif- ferent machine types were tested and reduced to those found in equation (2). The R2 was 0.37, cor- rected for the mean, and weighting was not needed to correct for nonhomogeneity. For machine type 1, move time gets very close to zero for small sterns in high densities. Equation (2) will give slightly nega- tive times (less than 0.01 minute) in this range. This inconsistence should be ignored by calling the time zero if negatives occur.
Drop Time
Time spent dropping an accumulation was ana- lyzed for possible correlation with accumulation size, tree size, and/or type of machine. Only the accumu- lation size and machine type proved to affect drop- ping time per tree, The best model used the inverse of trees per accumulation to represent load size, but the inverse of basal area was quite similar in strength. The model with basal area was chosen because of its compatibility with previous models. Machine types 1, 2, and 3 were found to have similar drop times; only type 4 took significantly less time. The selected model had an R2 of 0.06. and is as follows,
DT =. 0.025 i- 0.00506/BA i- TUPE 4 X (-0.007) (3)
where DT = Drop time per tree in productive min- utes.
Bunch Maintenance Time
Bunch maintenance is that portion of the cycle spent straightening or adjusting the bunch of trees being created by the feller buncher. This activity is
often needed to properly prepare the bunch for sub- seqwnt skidding. Possible variables tlvhich could in- fluence hunch maintenance time were accumulation size, average tree size in the accumulation, or the type of machine involved, All these were tested singly and in combinations, and none were found significant. There were no bunch maintenance times for machine type 1, hut this was thought to be a random oc- currence, and that each operator would need to per- form t his activity oceassionally, The average bunch maintenance time per tree for the study was 0.003 productive minutes.
Total Productive Time
Two analytical techniques are available for com- bining cycle elements into a total productive time per tree estimate: One involves adding the estimation equations and constants developed from the analysis of separate time elements, and the other would be to calculate a regression for total productive time per tree, combining element times prior to calculating the regression. Since the same data goes into both approaches, the results should be the same. Dif- ferences in coefficients should only be from the pre- cision of the matrix inversion inheritant to the re- gression calculation program.
This second apprcach was taken and the following was calculated.
TPT = TYPE I X (-0.185 + 2.10427 X DBH (TPAwy2) i- 2.46696 X TPA-%/BA) + TYPE 2 X (-0.185 + ,05392 X DBH + .04628/BA) + TYPE 3 X (-0.172 -i- 1.20222 X DBH (TPA-%) + 1.19569 X TPAm%/BA) + TYPE 4 X (0.110 i- .29814 'X DBH (TPA-") + .38674 X TPA-@/BA) (4)
where TPT = Total productive time per tree in min- utes. R2 for this model was 0.91 uncorrected for the mean. All possible combinations of machine types, DBH, TPA, and BA were tried, but the most con- sistent model with the greatest significant variation
"
explanation was equation (4). While equation (4) is somewhat simpler than
summing equations (1) through (3) plus the bunch maintenance constant, the summing process was pre- ferred. This is because of the lack of stand density information for machine type 2. As can be seen in equation (4) there is no TPA variable for machine type 2, but from the analysis of moving time it is known that the moving time for machine type 2 was not different from that of type 3. By using the sum- ming of equations approach, the stand density effect can be shown for moving, the time element most affected by stand density. Tables 2 to 5 display the estimated total productive times calculated by the summing of equations method.

Table 2.-Total predtcctilje felling and bunching time per tree for mrzehr'ner type _I time studied in the South during clearcutting
DBH Trees per acre -
200 300 400 500 eoo
.............................................. inches mlnules------------------------------------------------------------ 4 .T8 .60 .50 .42 3 ' 7
.58 .44 -35 .30 .25 .51 .38 -31 .25 .22
6 1.07 .84 .70 .61 -54 .87 -67 .56 .48 -42
-80 .62 .5 1 .44 .38 8 1.35 1.07 -90 .79 .70
1.16 -91 .76 .66 .59 1.09 -86 .71 .62 -55
10 1.64 1.31 1.11 -97 .87 1.44 1.14 .97 .84 .75
1.38 1.09 .92 .80 .72 12 1.93 1.54 1.31 1.15 1.04
1.73 . 1.38 1.17 1.03 .92 1.67 1.33 1.12 .98 .88
Table 3.-Total productiue felling and bunching per tree for machine type 2 time studied in the South during clearcutting
DBH Trees per acre
200 300 400 500 600
inches .............................................. minutes------------------------------------------------------------ 4 .28 ,222 .19 .17 .16
.22 .18 .15 -13 .12 .20 .16 .14 .12 . l l
6 .37 .30 .26 .23 .21 .31 .25 -22 .19 .r7
-29 -24 .20 .18 .16 8 .46 .38 .32 .29 .26
.41 .33 -28 .25 .23 .39 .31 .27 .24 .22
10 -56 .45 .39 -35 .32 .50 -128 -35 .31 .28
.48 .39 .33 .30 .27 12 -65 .53 .46 .41 .37
.59 .48 -41 .37 .33 .57 .46 -40 .36 .32
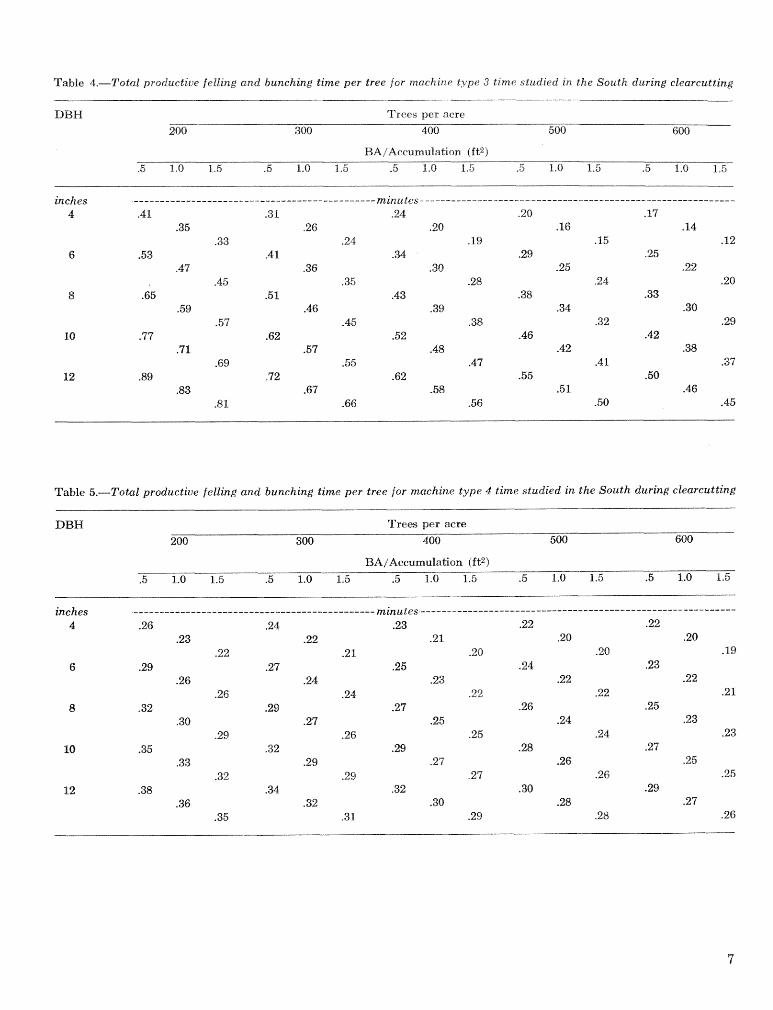
T&fe 4.-Total producdiue felling and bunching time per tree for machine type 3 time studied in the South during clearcutting
DBH Trees per acre
200 300 400 580 600
inches ---------------------------------------------- minules------------------------------------------------------------ 4 .41 .31 -24 .20 .17
.35 -26 .20 .16 .14 .33 .24 .19 -15 -12
6 -53 .4 1 -34 .29 .25 .47 .36 .30 -25 -22
'45 .35 -28 .24 .20 8 .65 -51 .43 .38 2-33
.59 .46 .39 -34 .30 .57 .45 .38 .32 .29
10 -77 .62 .52 -46 .42 .71 .57 .48 '42 .38
-69 .55 -47 .4 1 .37 12 .89 -72 -62 .55 .50
.83 .67 -58 .51 .46 .81 .fj6 .56 -50 -45
Table 5.-Total productive felling and bunching time per tree for machine type 4 time studied in the South during elearcutting
DBH Trees per acre
200 300 400 500 600
inches .............................................. minutes------------------------------------------------------------ 4 .26 .24 .23 .22 .22
.23 .22 .21 .20 .20 .22 .2 1 -20 -20 -19
6 -29 .27 .26 -24 .23 -26 .24 .23 .22 -22
.25 .24 .22 ,252 .21 8 -32 .29 .27 -26 .25
.30 .27 .25 .24 .23 -29 .26 .25 .24 -23
18 -35 .32 .29 .28 -27 .33 ,229 .27 .26 .25
.32 -29 .27 .26 .25 12 .38 .34 .32 -30 -29
.36 -32 '30 .28 .27 .35 '31 -29 .28 '26
SUMMARY AND CONCLUSIONS
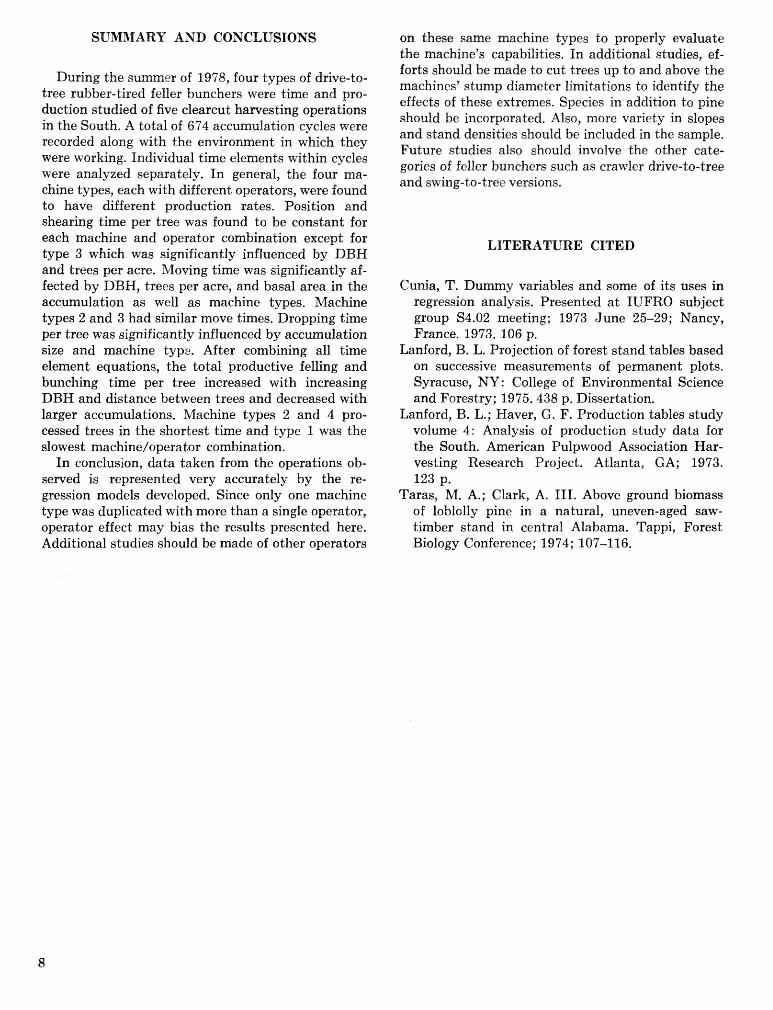
During the summer of 1978, four types of drive-to- tree rubber-tired feller bunchers were time and pro- duction studied of five clearcut hamesting operations in the South. A total of 674 accumulation cycles were recorded along with the environment in which they were working. Individual time elements within cycles were analyzed separately. In general, the four ma- chine types, each with different operators, were found to have different production rates. Position and shearing time per tree was found to be constant for each machine and operator combination except for type 3 which was significantly influenced by DBH and trees per acre. Moving time was significantly af- fected by DBH, trees per acre, and basal area in the accumulation as well as machine types. Machine types 2 and 3 had similar move times. Dropping time per tree was significantly influenced by accumulation size and machine type. After combining all time element equations, the total productive felling and bunching time per tree increased with increasing DBH and distance between trees and decreased with larger accumulations. Machine types 2 and 4 pro- cessed trees in the shortest time and type 1 was the slowest machine/operator combination,
In conclusion, data taken from the operations ob- served is represented very accurately by the re- gression models developed. Since only one machine type was duplicated with more than a single operator, operator effect may bias the results presented here. Additional studies should be made of other operators
on these same machine types to properly evaluate the machine" capabilities. In additional studies, ef- forts should be made to cut trees up to and above the machines' stump diameter limitations to identify the effects of these extremes. Species in addition to pine should be incorporated, Also, more variety in slopes and stand densities should be included in the sample, Future studies also should involve the other eate- gories of feller bunchers such as crawler drive-to-tree and swing-to-tree versions.
LITERATURE CITED
Cunia, T. Dummy variables and some of its uses in regression analysis. Presented a t IUFRO subject group S4.02 meeting; 1973 June 25-29; Nancy, France. 1973. 106 p.
Lanford, B. L. Projection of forest stand tables based on successive measurements of permanent plots. Syracuse, NU: College of Environmental Science and Forestry; 1975.438 p. Dissertation.
Lanford, B. L.; Haver, 6. F. Production tables study volume 4: Analysis of production study data for the South. American Pulpwood Association Har- vesting Research Project. Atlanta, GA; 1973. 123 p.
Taras, M. A.; Clark, A. 111. Above ground biomass of loblolly pine in a natural, uneven-aged saw- timber stand in central Alabama. Tappi, Forest Biology Conference; 1974; 107-1 16.

Appendix
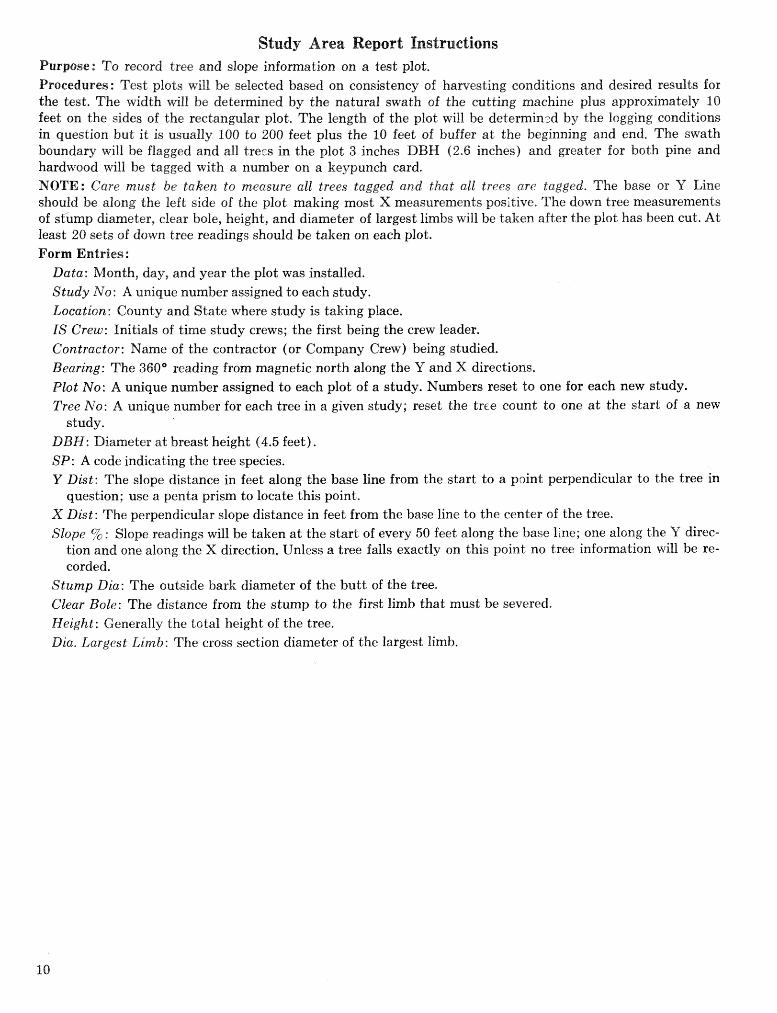
Study Area Report Instructions Purpose: To record tree and slope infomation on a test plot. Procedures: Test plots will be selected based on consistency of harvesting conditions and desired results for the test. The width wil be determined by the natuml swath of the cutting machine plus approximately 10 feet on the sides of the rectangular plot. The length of the plot will be determinzd by the logging conditions in question but it is usually 100 to 200 feet plus the 10 feet of buffer a t the beginning and end. The swath boundary will be flagged and all trecs in the plot 3 incbtss DBW (2.6 inches) and greater for both pine and hardwood will be tagged with a number on a keypunch card. NOTE: Care must be taken 2-0 measure all trees tngged and that all trees are tugged. The base or Y Line should be along the left side of the plot making most X measurements positive, The down tree measurements of stump diameter, elear bole, height, and diameter of largest limbs will be taken after the plot has been cut. At least 20 sets of down tree readings should be taken on each plot. Form Entries:
Data: Month, day, and year the plot was installed. Study No: A unique number assigned to each study. Location: County and State where study is taking place. IS Crew: Initials of time study crews; the first being the crew leader. Contractor: Name of the contractor (or Company Crew) being studied. Bearing: The 360" reading from magnetic north along the Y and X directions. Plot No: A unique number assigned to each plot of a study. Numbers reset to one for each new study. Tree Na: A unique number for each tree in a given study; reset the trce count to one a t the start of a new
study. DBH: Diameter a t breast height (4.5 feet). S P : A code indicating the tree species. Y Dist: The slope distance in feet along the base line from the start to a point perpendicular to the tree in
question; use a penta prism to locate this point. X Dist: The perpendicular slope distance in feet from the base line to the center of the tree. Slope % : Slope readings will be taken a t the start of every 50 feet along the base line; one along the Y direc-
tion and one along the X direction. Unless a tree falls exactly on this point no tree information will be re- corded.
Stump Dia: The outside bark diameter of the butt of the tree. Clear Bole: The distance from the stump to the first limb that must be severed. Height: Generally the total height of the tree, Llia. Largest Limb: The cross section diameter of the largest limb.

FOREST HARVESTING ANALSSIS RECORD
STUDY A R E A REPORT P d G E O F -
DATE PLOT NO. STUDY NO L O C A T I O N M 0 DGI Y R C O U N T Y S T A T E .
T S C R E W l N I I l A L S C O N T R A C T O R P L O T BEARINGS Y X
--L * .-L.+ - ,i 2 3 3 1 4 2 4 3
STUMP C L E n R
orn B O L E
U t r i H E I G H T C A R G F S T
L I M B Y DIST. X DIST,
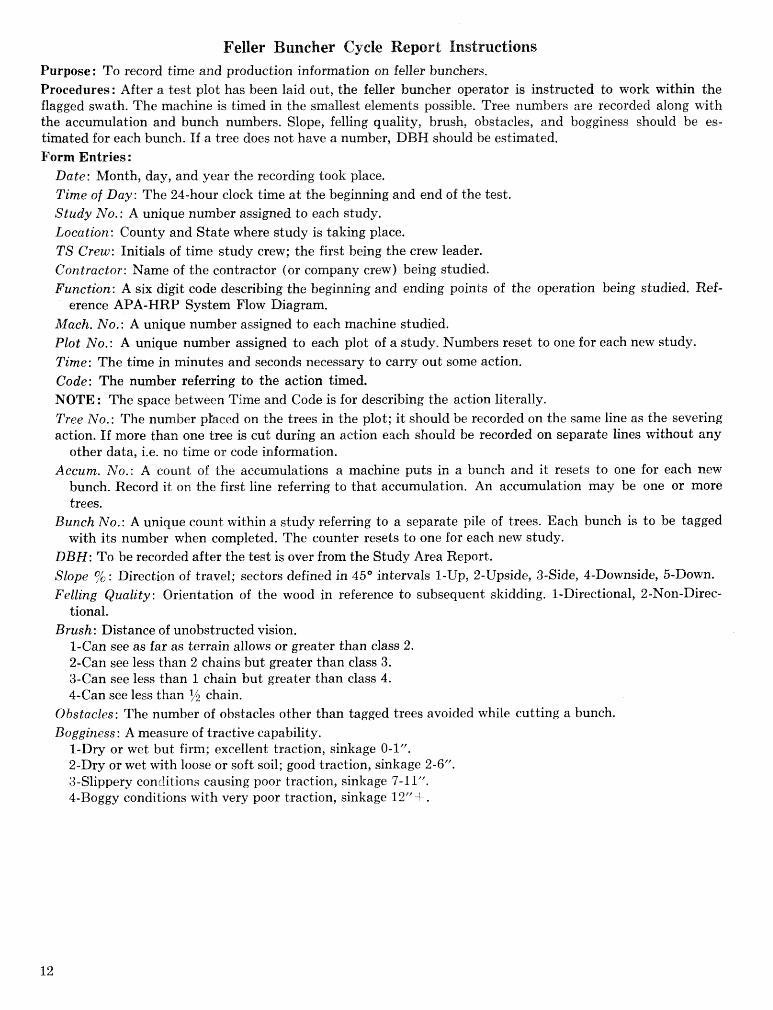
Feller Buncher Cycle Report Instructions Purpwe: To record time and production information on feller bunchers. Procedures: After a test plot has been laid out, the feller buncher operator is instructed to work within the flagged swath, The machine is timed in the smallest elements possible. Tree numbers are recorded along with the accumulation and bunch numbers. Slope, felling quality, brush, obstacles, and bagginess should be es- timated for each bunch. If a tree does not have a number, DBM should be estimated, Form Entries :
Date: Month, day, and year the recording took place, Time of Day: The 24-hour clock time a t the beginning and end of the test. Study No.: A unique number assigned to each study. Location: County and State where study is taking place. TS Crew: Initials of time study crew; the first being the crew leader. Contractor: Name of the contractor (or company crew) being studied. Function: A six digit code describing the beginning and ending points of the operation being studied. Ref-
erence APA-HRP System Flow Diagram. Mach. No.: A unique number assigned to each machine studied. Plot No.: A unique number assigned to each plot of a study. Numbers reset to one for each new study. Time: The time in minutes and seconds necessary to carry out some action. Code: The number referring to the action timed. NOTE : The space between Time and Code is for describing the action literally. Tree No. : The number ptaced on the trees in the plot; it should be recorded on the same line as the severing action. If more than one tree is cut during an action each should be recorded on separate lines without any
other data, i.e. no time or code information. Accum. No.: A count of the accumulations a machine puts in. a bunch and it resets to one for each new
bunch. Record it on the firsl; line referring to that accumulation. An accumulation may be one or more trees.
Bunch No.: A unique count within a study referring to a separate pile of trees. Each bunch is to be tagged with its number when completed. The counter resets to one for each new study.
DBH: To be recorded after the test is over from the Study Area Report. Slope % : Direction of travel; sectors defined in 45" intervals I-Up, 2-Upside, 3-Side, 4-Downside, 5-Down. Felling Quality: Orientation of the wood in reference to subsequent skidding. 1-Directional, 2-Non-Direc-
tional. Brush: Distance of unobstructed vision.
1-Can see as far as terrain allows or greater than class 2. 2-Can see less than 2 chains but greater than class 3. 3-Can see less than 1 chain but greater than class 4. 4-Can see less than $5 chain.
Obstacles: The number of obstacles other than tagged trees avoided while cutting a bunch. Bagginess: A measure of tractive capability.
1-Dry or wet but firm; excellent traction, sinkage 0-1". 2-Dry or wet with loose or soft soil; good traction, sinkage 2-6". 3-Slippery conditions causing poor traction, sinkage 7-1 1". 4-Boggy conditions with very poor traction, sinkage 12" 4- .
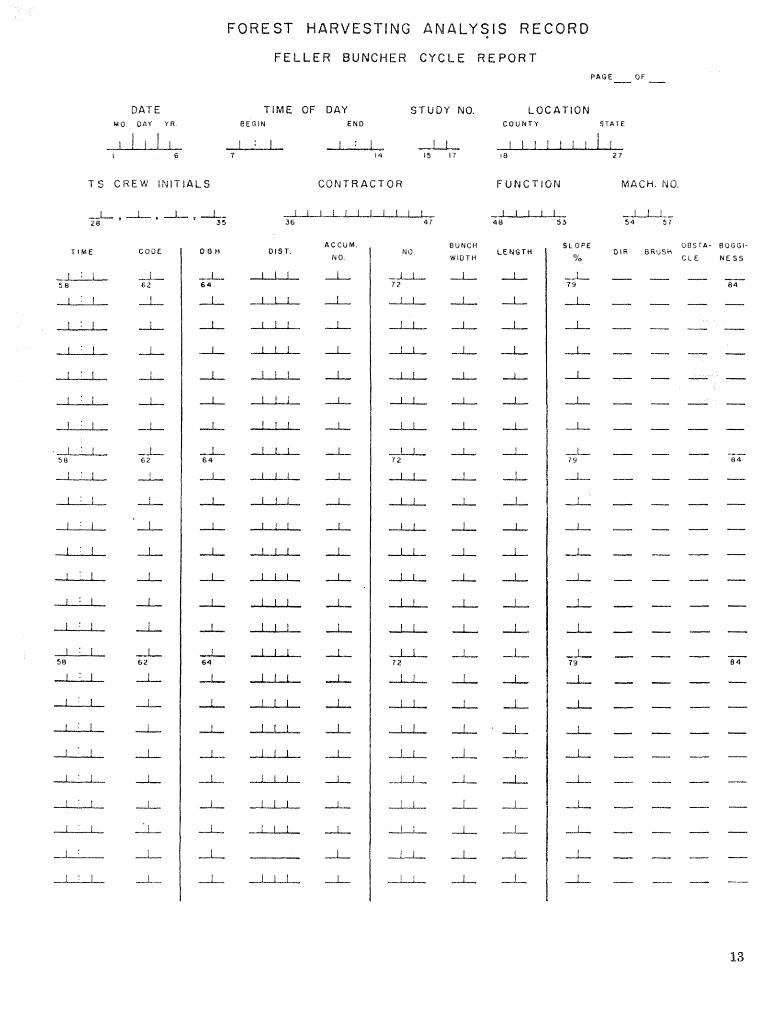
FOREST HARVESTING A N A L Y q I S R E C O R D
F E L L E R BUNGHER C Y C L E R E P O R T PAGE- OF -
DATE TIME OF DAY STUDY NO. L O C A T I O N MO D A I Y R B E G I N EM0 C O U N T Y S T A T E
T S C R E W INtT1ALS C O N T R A C T O R FUNCTION MACH. NO,
BUNCH
WIDTH LENGTH
_1
L
I._
1
L
S L O P E
X
ijL 1
1
L
I
-L 79
I A
O B S T d - B O G G I - D I R B R U S H
C C E N E S S
- - - - 6 4
- - - -

Equipment Specifications
Brand and Model of Carrier Horsepower Wheelbase Overall length Width Ground clearance Weigllt (fbs. ) Tire Size Hydraulic capacity
Brand and Model of Shear Tree capacity at stump
Accumulator arm Weight (lbs.) Shear cylinders
Number Size Flow capacity Pressure
Franklin 170 XL N 117 10' 0" 18' 3" 8' 7" 1' 7" 21,310 23.1 x 263 Logger Tandem pumps Steering 25 GE"M
@I750 psi LiftlTilt 45 GPkf
@2500 psi Morbark 15" 15" softwood & 13"
hardwood Yes 2300
2 5 ?hP' 35-40 GPM 2100-2600 psi
John Deere 544 94 (net flywheel) 7' 10yzw 21q6"' 7"4"
2y2fe 1'9,530 23.1 x 26 Logger Tandem pumps Steering 28.6 EPM
@2250 psi Lifti'Tilt 45.5 GPM @2250 psi
Morbask 15" 15" softwood & 13"
hardwood Yes 2300
2 5%" 35-40 GPM 2 100-2600 psi
John Beere 544 94 (net flywheel) 7'l1054" 21' Ci*' 7' 4" 1' ,y&?, 11,530 23.1 x 26 Logger Tandem pumps Steering 28.6 CPM
@2250 psi LifLiTiIt 45.5 CPM
@2250 psi Rome 20" 20'"
2 6" Unknown Unknown
Hydro Ax 511 117 9. 0" 19"" 80"" 1" 5" 17,530 23.1 x 26 Logger Tandem pumps Steering 196 GP&f
@I800 psi tift/Tilt 24 GP-M a2250 psi
Morbark 20" 2OfP
4 5 X t P 40-50 GPhl 2500-3800 psi
Lanford, 53. L.; Sirois, D. L, Drive-to-tree, rubber-tired feller buneher production studies. Gen. Tech. Rep. SO-45, New Orleans, LA: U,S, Department of Agriculture, Forest Ser- vice, Southern Forest Experiment Station; 198%. 14 pe
Presents time study methods rand equations for estimating production of rubber-tired feller bunehers during final hamrest of southern pine stands.
Additional keywords: Time study, feller buncher, harmvesting.