i. the ping river basin - world...
TRANSCRIPT

Final Report: Developing Watershed Management Organizations in Pilot Sub-Basins Page 1
I. The Ping River Basin
In order to help clarify the overall context of activities under this project, the first part of this report begins with an overview of the Ping River basin in the context of national and provincial patterns of economic growth and environmental change. The overview includes a brief introduction to some of the key natural resource management problems that are perceived as resulting from these changes, and major policy responses that have sought to address these problems. This is followed by a brief review of efforts that have sought to move toward development of basin and sub-basin level plans and organization in the Ping River Basin, including introduction of concepts related to natural and administrative hierarchies, and discussion of some key gaps and operational issues.
This sets the stage for subsequent parts of the report. The second part seeks to pursue in greater detail concepts, processes and data associated with surveying the diversity of Ping River sub-basins. These are then used to develop technical criteria and indicators for use in helping to select pilot sub-basins for the project. This approach is then compared with the actual pilot sub-basin se-lection process that occurred during implementation of the project. In its third part, the report seeks to build on theory and both international and local experience in developing an array of organiza-tional alternatives, and a process for developing sub-basin level management organizations in the Ping Basin. The fourth part of the report seeks to review progress in project implementation up to the time this report was written, and to identify some key lessons from experience under the pro-ject. The fifth and final part of the report seeks to draw on learning under this project to contribute to development of the agenda for further RSBO development in the Ping, and possibly other river basins of Thailand.
A. Contextual overview
This section provides a brief overview of patterns of economic and environmental change at several higher levels of the hierarchies within which Ping River sub-basins are nested. Particular initial focus is on spatial gradients of change, and on patterns of change over time during recent decades. The final two sub-sections turn the focus to national perceptions of watershed problems that have arisen in association with these patterns of change, and some of the major national government pol-icy responses that have followed, as well as to important changes in approaches to resource gov-ernance associated with broader change in Thai society.
1. National concern and response to environmental change
Thailand has demonstrated impressive economic growth for more than 40 years, and its resilience is being demonstrated through its recovery from the Asian economic crisis. The development strategy that has brought this growth and structural change to the Thai economy has long relied on intensification of agriculture, rapid industrialization, and expansion of mining, fisheries, and tour-ism. These processes have also involved the drawing down of natural assets such as forest, water, mineral ores, fisheries, and land resources. In order to help clarify these patterns in a visual mode, national economic growth in major sectors is depicted graphically in Figure 1-1, along with declin-ing forest cover. Public awareness of the growing negative impacts of economic development on environmental conditions and quality of life has increased rapidly during recent years. Greater integration into global information systems has helped strengthen environmental awareness and efforts to seek creative means to improve environmental sustainability, including emergence of advocacy oriented civil society institutions. At the same time, efforts to reform governance structures and processes in Thailand also seek to integrate environmental and natural resource management concerns. As a re-sult, deforestation, water scarcity and pollution, declining fish stocks, haphazard urbanization and air pollution have emerged as important issues of concern in the national public policy arena.

Page 2 Participatory Watershed Management for the Ping River Basin Project
Figure 1-1. Thailand’s economic growth and forest cover change, 1951 – 2003
Whole Kingdom
0
500
1,000
1,500
2,000
2,500
3,000
3,500
4,000
1951
1953
1955
1957
1959
1961
1963
1965
1967
1969
1971
1973
1975
1977
1979
1981
1983
1985
1987
1989
1991
1993
1995
1997
1999
2001
2003
Tota
l Rea
l GD
P - b
illio
ns o
f 198
8 B
aht
0
10
20
30
40
50
60
70
80
90
100
Perc
ent S
hare
of T
otal
Lan
d A
rea
cleared forest Agriculture-Forestry Manufacturing Trade Services Transport-communic govt-military other
Sources: economic data from NESDB; forest cover data from DNP (1961-2000) and various earlier historical estimates
forest
non-forest
Moreover, there is also growing awareness that much of the impact of problems associated with environmental change falls on the poor, whose livelihoods are disrupted and health is threatened. And as livelihood options of the poor become foreclosed, many are forced to turn to alternatives that are seen as causing further natural resource and environmental degradation. Recent establishment of the Ministry of Natural Resources and Environment (MoNRE) was in rec-ognition that rapid economic growth cannot be sustained if natural assets are not well maintained. Its mission to conserve, protect and rehabilitate natural resources and the environment are consis-tent with government objectives that include sustainable development and equitable growth. And, since the 1997 national constitution specifically entrusts the environment and natural resources of the nation to its people, and mandates their participation and involvement in environmental man-agement and conservation, the government is now seeking to delegate more responsibility to local communities, and encourage their participation in improving environmental quality. Among the range of environmental issues of growing concern, seasonal water availability and wa-ter quality are currently particularly high priorities for both the government and the general public. Serious floods and landslides have generated many headlines during recent years, while growing demand for dry season water and concern about water pollution from upstream agriculture and in-dustry are a common feature of increasing public anxiety and conflict in many local areas. Given the perceived importance of interrelationships among forest, water and land management to these issues, the government is seeking to develop a river basin management framework for encouraging, facilitating and supporting participatory multi-sectoral collaboration that can help to improve man-agement of natural resources and the environment, and to reduce rural poverty. Of the 25 officially delineated river basins of the country, the Ping Basin was selected as one of 3 initial basins for in-tensive development of this approach. It was selected both because of its strategic importance in relation to resources, livelihoods and rural poverty, and because of strong concern about impacts of deforestation, soil erosion, sedimentation, water use and pollution.
2. The Ping River Basin in the Chao Phraya River System The Ping River Basin is the largest of the eight river basins that together form the Chao Phraya river ‘system’. The Chao Phraya system covers about 30 percent of Thailand’s land area, and is home to about 40 percent of its total population. It also is said to employ more than three-fourths of its work force, and generate about two-thirds of Thailand’s GDP. Lower (southern) portions of the Chao Phraya system include the fertile Central Plains, often known as the major ‘rice bowl’ of

Final Report: Developing Watershed Management Organizations in Pilot Sub-Basins Page 3
Thailand’s agricultural production, most of the historically important centers of power and dynas-ties in the Siamese Kingdoms, as well as the huge primate urban-industrial mega-city of Bangkok – the current capital of political and governmental power, and the central hub of the nation’s growing and diversifying commercial, industrial and service sectors.
Figure 1-2. Ping River Basin in the Chao Phraya
Bangkok
Chiang Mai
With a catchment area of about 35,000 km2, the Ping River Basin covers about 22 percent of the larger Chao Phraya river system within which it is nested (Figure 1-2), and contributes about 24 percent of the system’s average annual runoff. During early days of opening to trade with western countries after the mid-nineteenth century, teak wood from northern Thailand’s forests became one of Siam’s primary export products, and logs were floated down the Ping River to be taxed and traded in downstream centers. Along with the Wang, Yom and Nan river basins, the Ping is one of the four ‘upper’ tributary river basins that merge together and become known as the Chao Phraya River at Nakhon Sawan. Together, these four tributary basins contribute more than 70 percent of the total average annual runoff that feeds the entire Chao Phraya river system and its highly complex system of downstream barrages and irrigation canals that have been an integral part of Siamese civilization and the Thai nation state. Thus, from the centers of political and economic power in the lower Chao Phraya, the four ‘upper’ river basins are viewed as areas to be protected from any activities that would threaten water-consuming downstream processes. In 1964, the largest dam in the Chao Phraya system was completed, after which the Ping River Ba-sin was conceptually and functionally split into lower and upper portions. The Bhumibol Dam has a live storage capacity of about 9.7 billion m3, compared to an average annual inflow of 6.6 billion m3 from a drainage basin of 26,400 km2, and it is equipped with a hydroelectric generation capacity of 713 MW managed by the Electrical Generation Authority of Thailand (EGAT). Protection and maintenance of the capacity of this strategically important irrigation, water control and electrical generation facility has become another major feature of efforts to manage water and watersheds, especially in ‘upper’ portions of the Ping River Basin.
3. Gradients of diversity in the Ping River Basin Overall, the Ping River Basin is part of a gradient of change that begins in Bangkok and passes through the lowlands of the Central Plains, before entering the Ping River Basin at Nakhon Sawan. It then proceeds through the lower North into major valleys of the upper North, before ending in mountainous upper sub-basins with very small areas where lowland traditions can be established. This gradient is physical in terms of terrain and its upstream direction, it is demographic in terms of population density, it is economic in terms of integration, and it is cultural and linguistic in terms of traditions, language, livelihoods and lifestyles. The ‘center-periphery’ character of this gradient is underscored by the concentration of rural poverty in uppermost sub-basins.
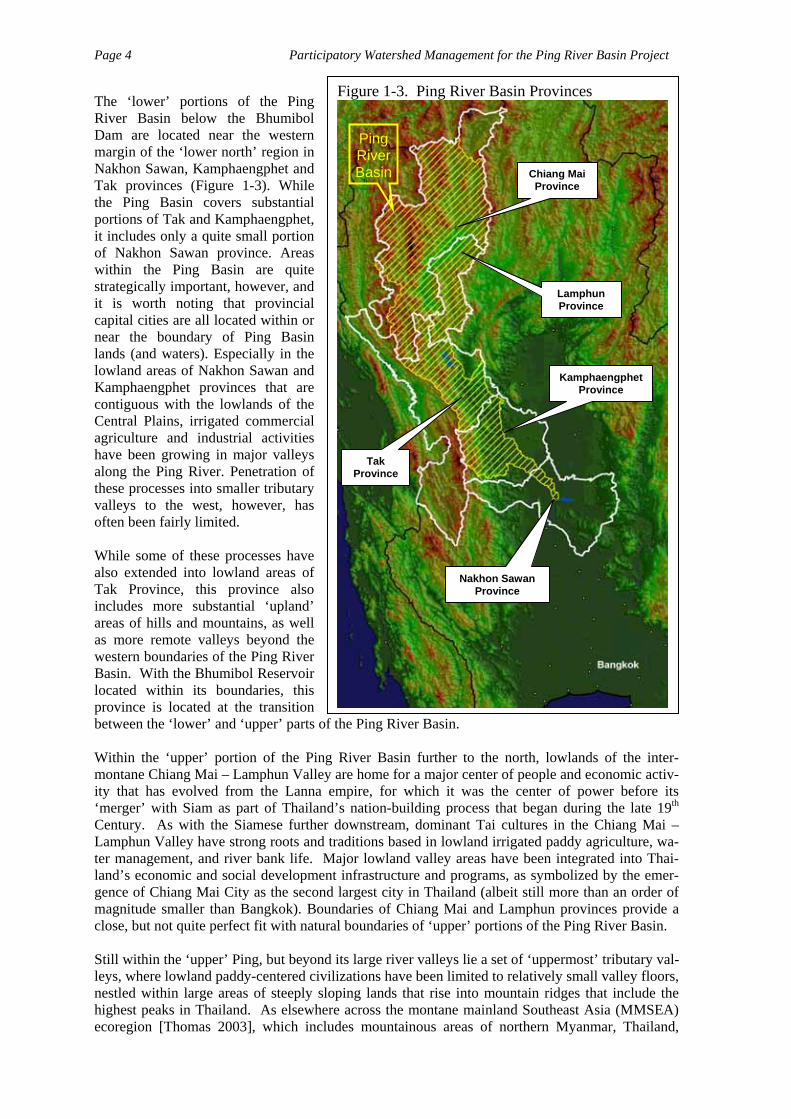
Page 4 Participatory Watershed Management for the Ping River Basin Project
Figure 1-3. Ping River Basin Provinces The ‘lower’ portions of the Ping River Basin below the Bhumibol Dam are located near the western margin of the ‘lower north’ region in Nakhon Sawan, Kamphaengphet and Tak provinces (Figure 1-3). While the Ping Basin covers substantial portions of Tak and Kamphaengphet, it includes only a quite small portion of Nakhon Sawan province. Areas within the Ping Basin are quite strategically important, however, and it is worth noting that provincial capital cities are all located within or near the boundary of Ping Basin lands (and waters). Especially in the lowland areas of Nakhon Sawan and Kamphaengphet provinces that are contiguous with the lowlands of the Central Plains, irrigated commercial agriculture and industrial activities have been growing in major valleys along the Ping River. Penetration of these processes into smaller tributary valleys to the west, however, has often been fairly limited.
Ping River Basin Chiang Mai
Province
Lamphun Province
Kamphaengphet Province
Tak Province
Nakhon Sawan Province
While some of these processes have also extended into lowland areas of Tak Province, this province also includes more substantial ‘upland’ areas of hills and mountains, as well as more remote valleys beyond the western boundaries of the Ping River Basin. With the Bhumibol Reservoir located within its boundaries, this province is located at the transition between the ‘lower’ and ‘upper’ parts of the Ping River Basin. Within the ‘upper’ portion of the Ping River Basin further to the north, lowlands of the inter-montane Chiang Mai – Lamphun Valley are home for a major center of people and economic activ-ity that has evolved from the Lanna empire, for which it was the center of power before its ‘merger’ with Siam as part of Thailand’s nation-building process that began during the late 19th Century. As with the Siamese further downstream, dominant Tai cultures in the Chiang Mai – Lamphun Valley have strong roots and traditions based in lowland irrigated paddy agriculture, wa-ter management, and river bank life. Major lowland valley areas have been integrated into Thai-land’s economic and social development infrastructure and programs, as symbolized by the emer-gence of Chiang Mai City as the second largest city in Thailand (albeit still more than an order of magnitude smaller than Bangkok). Boundaries of Chiang Mai and Lamphun provinces provide a close, but not quite perfect fit with natural boundaries of ‘upper’ portions of the Ping River Basin. Still within the ‘upper’ Ping, but beyond its large river valleys lie a set of ‘uppermost’ tributary val-leys, where lowland paddy-centered civilizations have been limited to relatively small valley floors, nestled within large areas of steeply sloping lands that rise into mountain ridges that include the highest peaks in Thailand. As elsewhere across the montane mainland Southeast Asia (MMSEA) ecoregion [Thomas 2003], which includes mountainous areas of northern Myanmar, Thailand,

Final Report: Developing Watershed Management Organizations in Pilot Sub-Basins Page 5
Laos, Vietnam, and southwest China, midland and highland zones in these ‘uppermost’ tributary areas are inhabited by a quite diverse range of ethnic groups employing various livelihood strate-gies and types of agroecosystem management practices. Some groups in midland zones of the Ping River Basin, such as the Lawa and at least some of the Karen, are believed to pre-date ethnic Thai groups in the area. Various others (especially highland groups) are seen as moving into Ping Basin areas during the last century, largely from China via Myanmar. Current day middle zone groups have traditions that employ combinations of paddy, rotational forest fallow agriculture, and pre-served forest patches in their local landscapes. Various highland groups began with ‘pioneer’-type shifting cultivation that included production of opium as a cash crop to provide food security in areas too high for then-existing rice technologies. Until recent years, mountain ethnic minority communities in Thailand were not considered part of mainstream society, they had no citizenship, and government administration treated them as a ‘wel-fare’ issue or as a target for opium crop substitution, shifting agriculture eradication, or in some cases resettlement programs. Any land use claims they may have are precluded by declaration of forest reserves that blanketed those areas, and are now being replaced by more stringent protected watershed and expanded national park and wildlife sanctuary status. These areas are home for most of the rural poor in the Ping River Basin, and their land use practices are now seen as threats to the sustainability of water resources and biodiversity. While this ‘center-periphery’ gradient has existed in the Ping River Basin for a substantial period of time, there is nothing static about conditions along this gradient. Major processes of change have already swept through the Ping River Basin into even its furthest reaches, and these processes are continuing to evolve rapidly. Perhaps the two strongest forces driving change at this point in time are grounded in economic and governance processes, and their growing links with change at international and global levels.
4. Economic change in Ping River Basin provinces Economic change has various faces as it passes through the gradient of conditions found along the Ping River Basin. It has already brought commercialization, capitalization and industrialization of agriculture in valley lowlands, which in tandem with opium crop substitution and road programs has begun reaching even formerly remote mountain areas. Timber stocks in the natural forests that remain primarily in upland areas, have already been largely logged out and sold. At the same time, a major tourism industry has emerged in some areas, and rapid growth associated with commerce, industry and service sectors is driving urbanization at strategic river valley locations. Government programs are emphasizing development of local entrepreneurship (such as OTOP) and local micro-finance mechanisms. This entire system, however, is now faced with questions about how eco-nomic activities can best adapt and restructure themselves in response to international free trade agreements, growing capacity of neighboring countries with lower costs of production, and percep-tions of a deteriorating natural resource base. In order to help clarify the patterns of economic change along the Ping River Basin gradient, Figure 1-4 contains graphical displays of economic change in the five Ping Basin provinces since 1981. Bar graphs on the left display economic change during a 20-year period by major sectors used in national accounts during this period. Values are expressed in constant 1988 baht in order to remove inflation effects. The relative scales of provincial economies are emphasized by using 5 billion baht grid lines on the value axis in all graphs. Pie charts on the right indicate estimated composition of provincial economies during 2004, using the new system of national accounts that helps provide more insight into components of provincial economies. These charts indicate quite clearly that economic patterns of change are by no means uniform. It is also important to note the degree to which overall economic growth rates are much lower than those seen at the national level, as displayed in Figure 1-1. At the same time, while effects of the Asian economic crisis are observable in provincial economic data, the relative degree of impact seen at this level is considerably less dramatic than at the national level.

Page 6 Participatory Watershed Management for the Ping River Basin Project
Figure 1-4. Real Gross Provincial Product (GPP) in Ping River Basin Provinces
Chiang Mai Real GPP, 1981- 2001
05,000
10,00015,00020,00025,00030,00035,00040,00045,00050,00055,000
1981 1982 1983 1984 1985 1986 1987 1988 1989 1990 1991 1992 1993 1994 1995 1996 1997 1998 1999 2000 2001p
Mill
ions
of c
onst
ant 1
988
Bt
Forestry-fisheries Agriculture Mining Manufacturing Wholesale & retail trade Services
We can also see variation in the overall economic development strategies of provinces along this gradient. In Nakhon Sawan, economic growth since 1981 has come largely from gradual expan-sion of industry and trade, whereas growth in Kamphaengphet has placed more emphasis on min-ing and quarries than on industry, at least until the recent surge in industrial investment that appears to have occurred since 2001 (as reflected in the pie chart on the right). Emphasis on mining has also been a major component in the economy of Tak province, although it has clearly passed through periods of boom and bust, and is now at a relatively low level; this is also the only prov-ince where forestry formed a visually evident portion of the economy, but its contribution has dropped since logging concessions were revoked in national forest lands. In the major inter-
Other
Chiang Mai2004
Education, Health, other
service12%Financial
services5%
Real Estate, Renting & Business
8%
Hotels & Restaurants
9%
Commercial trade & repair
18%
Transport & Communic
13%
Utilities4%
Construction7%
Manufacture 11%
Mining & Quarry
1%
Agriculture12%
Lamphun Real GPP, 1981- 2001
0
5,000
10,000
15,000
20,000
25,000
1981 1982 1983 1984 1985 1986 1987 1988 1989 1990 1991 1992 1993 1994 1995 1996 1997 1998 1999 2000 2001p
Mill
ions
of c
onst
ant 1
988
Bt
Forestry-fisheries Agriculture Mining Manufacturing Wholesale & retail trade Services Other
Lamphun2004
Agriculture7%
Mining & Quarry
1%
Manufacture74%
Construction2%
Utilities2%
Transport & Communic
2%Commercial
trade & repair6%
Hotels & Restaurants
0%Real Estate, Renting & Business
2% Financial services
1%Education,
Health, other service
3%
Tak Real GPP, 1981- 2001
0
5,000
10,000
15,000
1981 1982 1983 1984 1985 1986 1987 1988 1989 1990 1991 1992 1993 1994 1995 1996 1997 1998 1999 2000 2001p
Mill
ions
of c
onst
ant 1
988
Bt
Forestry-fisheries Agriculture Mining Manufacturing Wholesale & retail trade Services Other
Tak2004
Agriculture22%
Mining & Quarry
12%
Manufacture13%
Construction6%
Utilities3%
Transport & Communic
9%
Commercial trade & repair
15%
Hotels & Restaurants
1%
Real Estate, Renting & Business
7%
Financial services
3%
Education, Health, other
service9%
Kampaengphet Real GPP, 1981- 2001
0
5,000
10,000
15,000
20,000
1981 1982 1983 1984 1985 1986 1987 1988 1989 1990 1991 1992 1993 1994 1995 1996 1997 1998 1999 2000 2001p
Mill
ions
of c
onst
ant 1
988
Bt
Forestry-fisheries Agriculture Mining Manufacturing Wholesale & retail trade Services Other
Kampaengphet2004
Agriculture15%
Mining & Quarry
9%
Manufacture54%
Construction2%
Utilities1%
Transport & Communic
3%Commercial
trade & repair8%
Hotels & Restaurants
0%Real Estate, Renting & Business
3%Financial services
1%Education,
Health, other service
4%
Nakhon Sawan Real GPP, 1981- 2001
0
5,000
10,000
15,000
20,000
25,000
30,000
1981 1982 1983 1984 1985 1986 1987 1988 1989 1990 1991 1992 1993 1994 1995 1996 1997 1998 1999 2000 2001p
Mill
ions
of c
onst
ant 1
988
Bt
Forestry-fisheries Agriculture Mining Manufacturing Wholesale & retail trade Services Other
Nakhon Sawan2004
Agriculture24%
Mining & Quarry
1%
Manufacture22%
Construction3%
Utilities3%Transport &
Communic9%
Commercial trade & repair
19%
Hotels & Restaurants
1%
Real Estate, Renting & Business
6%
Financial services
4%
Education, Health, other
service8%
Data source: NESDB – based on old national income structure (bar charts) & new structure (pie charts)
Final Report: Developing Watershed Management Organizations in Pilot Sub-Basins Page 7
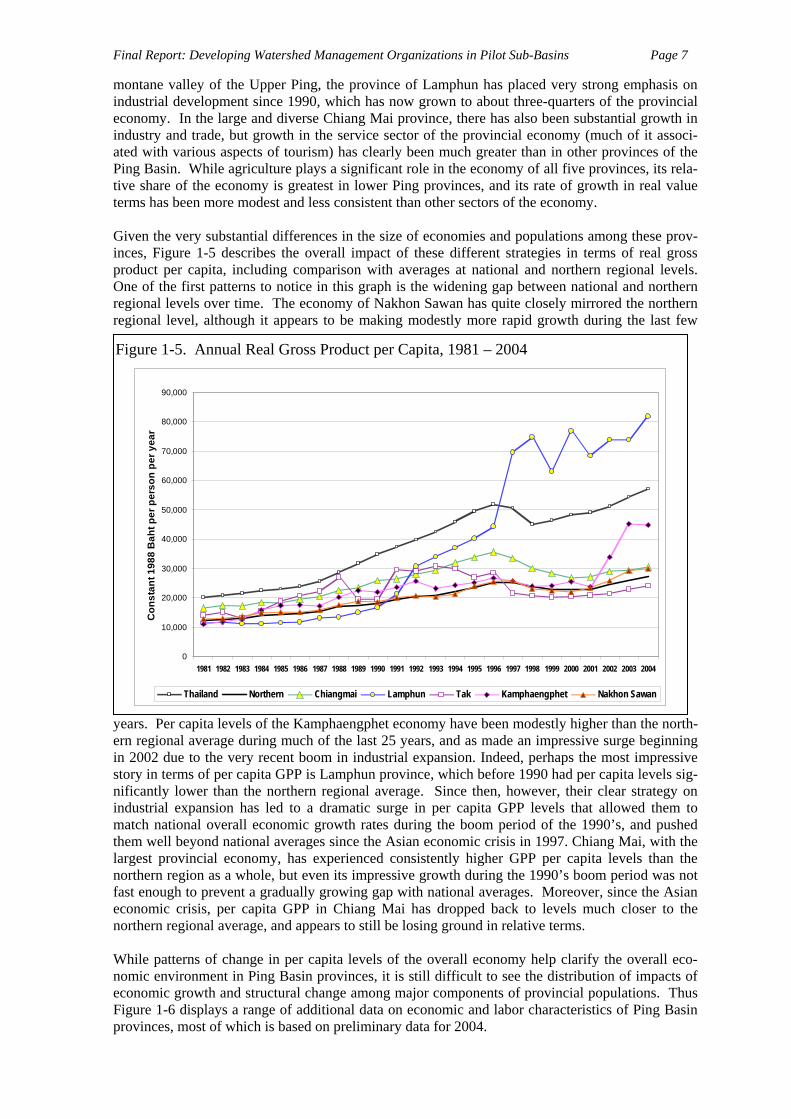
montane valley of the Upper Ping, the province of Lamphun has placed very strong emphasis on industrial development since 1990, which has now grown to about three-quarters of the provincial economy. In the large and diverse Chiang Mai province, there has also been substantial growth in industry and trade, but growth in the service sector of the provincial economy (much of it associ-ated with various aspects of tourism) has clearly been much greater than in other provinces of the Ping Basin. While agriculture plays a significant role in the economy of all five provinces, its rela-tive share of the economy is greatest in lower Ping provinces, and its rate of growth in real value terms has been more modest and less consistent than other sectors of the economy. Given the very substantial differences in the size of economies and populations among these prov-inces, Figure 1-5 describes the overall impact of these different strategies in terms of real gross product per capita, including comparison with averages at national and northern regional levels. One of the first patterns to notice in this graph is the widening gap between national and northern regional levels over time. The economy of Nakhon Sawan has quite closely mirrored the northern regional level, although it appears to be making modestly more rapid growth during the last few
years. Per capita levels of the Kamphaengphet economy have been modestly higher than the north-ern regional average during much of the last 25 years, and as made an impressive surge beginning in 2002 due to the very recent boom in industrial expansion. Indeed, perhaps the most impressive story in terms of per capita GPP is Lamphun province, which before 1990 had per capita levels sig-nificantly lower than the northern regional average. Since then, however, their clear strategy on industrial expansion has led to a dramatic surge in per capita GPP levels that allowed them to match national overall economic growth rates during the boom period of the 1990’s, and pushed them well beyond national averages since the Asian economic crisis in 1997. Chiang Mai, with the largest provincial economy, has experienced consistently higher GPP per capita levels than the northern region as a whole, but even its impressive growth during the 1990’s boom period was not fast enough to prevent a gradually growing gap with national averages. Moreover, since the Asian economic crisis, per capita GPP in Chiang Mai has dropped back to levels much closer to the northern regional average, and appears to still be losing ground in relative terms.
Figure 1-5. Annual Real Gross Product per Capita, 1981 – 2004
0
10,000
20,000
30,000
40,000
50,000
60,000
70,000
80,000
90,000
1981 1982 1983 1984 1985 1986 1987 1988 1989 1990 1991 1992 1993 1994 1995 1996 1997 1998 1999 2000 2001 2002 2003 2004
Con
stan
t 198
8 B
aht p
er p
erso
n pe
r yea
r
Thailand Northern Chiangmai Lamphun Tak Kamphaengphet Nakhon Sawan
While patterns of change in per capita levels of the overall economy help clarify the overall eco-nomic environment in Ping Basin provinces, it is still difficult to see the distribution of impacts of economic growth and structural change among major components of provincial populations. Thus Figure 1-6 displays a range of additional data on economic and labor characteristics of Ping Basin provinces, most of which is based on preliminary data for 2004.

Page 8 Participatory Watershed Management for the Ping River Basin Project
The relative overall labor intensity of agricultural production is evident. While the amount of wealth that agriculture contributes to provincial economies ranges from 10 to 25 percent, it share of the labor force is from 34 to 63 percent, resulting in much lower levels of economic output per worker than in non-agricultural sectors. Within the agricultural sector, distribution is generally somewhat more equitable than in non-agricultural sectors (except in the case of Tak province), as reflected in their Gini coefficients. That being said, the combination of low population growth rates, growing employment in non-agriculture sectors, and the constant to very modestly growing overall value of agricultural production, suggests that at least some components of the agricultural labor force are also increasing their per capita economic output. And, the fact that Gini coefficients within the agriculture sector are not as radically different from non-agriculture as one might suspect indicates differentiation within agriculture. Even at the provincial level, it is noteworthy that the
Figure 1-6. Current economic and labor characteristics of Ping Basin provinces
Nakhon Sawan
Kamphaeng-phet Tak Lamphun Chiang Mai
OVERALLLand Area total sq km 9,598 8,607 16,407 4,506 20,107Population total thou per 1,008 790 486 381 1,586
density per/sq km 105 92 30 84 79Gross Prov Product (GPP) mill Bt 56,800 56,414 22,824 49,305 97,994
per person thou Bt 56 71 47 130 62Labor total thou per 673 394 244 289 939
GPP/worker thou Bt 84 143 94 171 104Unemployed % total labor 1.3% 1.9% 2.3% 1.3% 5.2%Poor (2002) % pop 7.7% 0.7% 30.1% 6.5% 7.8%Poverty Line (2002) thou Bt 9,936 9,600 9,948 10,176 10,236
USD/day 0.68 0.66 0.68 0.70 0.70Inequality (2002) Gini coeffic 0.51 0.41 0.54 0.44 0.45
AGRICULTUREArea (2001) sq km 6,386 3,990 1,667 832 2,215
share % total 67% 46% 10% 18% 11%GPP share % total 24% 17% 24% 10% 14%Labor share % total 54% 63% 42% 35% 34%
GPP/worker thou Bt 37 38 54 50 45area/worker rai 11.0 10.1 10.1 5.2 4.4
Unemployed % agric labor 0.1% 1.3% 1.1% 0.8% 1.9%Inequality (2002) Gini coeffic 0.40 0.32 0.56 0.34 0.33
NON-AGRICULTUREGPP share % total 76% 83% 76% 90% 86%Labor share % total 46% 37% 58% 65% 66%
GPP/per thou Bt 141 320 123 235 135Unemployed % non-agr labor 2.8% 2.8% 3.2% 1.6% 6.9%Inequality (2002) Gini coeffic 0.50 0.43 0.48 0.43 0.43
Mining quarryingGPP share % total 1.0% 16% 5% 0.8% 0.7%Labor share % total 0.26% 0.07% 0.57% 0.21% 0.02%
Industry & handicraftsGPP share % total 21% 38% 14% 66% 10%Labor share % total 10% 8% 17% 30% 20%
ConstructionGPP share % total 3% 2% 6% 2% 7%Labor share % total 6% 5% 6% 6% 7%
Public utilitiesGPP share % total 1.5% 1.1% 2.7% 1.8% 2.0%Labor share % total 0.17% 0.09% 0.06% 0.14% 0.38%
Commerce & bankingGPP share % total 21% 11% 16% 8% 20%Labor share % total 14% 11% 12% 17% 15%
TransportationGPP share % total 5% 1.8% 4.3% 1.4% 8%Labor share % total 1.7% 1.5% 3.6% 0.9% 1.5%
Services, otherGPP share % total 22% 12% 26% 10% 38%Labor share % total 14% 12% 18% 12% 23%
< data 2004 except as noted >
sources: (1) economic & poverty data from NESDB datasets; (2) labor data from NSO datasets; (3) agricultural holding area from OAE datasets

Final Report: Developing Watershed Management Organizations in Pilot Sub-Basins Page 9
average value of agricultural production per worker is relatively high in Upper Ping Basin prov-inces, while the average area of farmland per worker is about one-half that of their counterparts in Lower Ping Basin provinces. Tak province again represents the transition, with high value and high land area per worker, together with relatively high distributional inequality. While non-agricultural sectors are clearly of growing importance in terms of both the economy and the labor force, the relative balance between contributions to the economy and to employment vary:
• Mining, public utilities and transportation appear to have a low labor intensity per unit of economic output. Thus, while they have generated significant levels of wealth in some provinces, their benefits are confined to a relatively small component of the population.
• The labor intensity of industrial output appears to be quite low in lower Ping provinces and Lamphun, but relatively high in Tak and Chiang Mai provinces. This is probably associ-ated with the relative importance of crafts and cottage industries in the latter two cases, where the relative share of industry in the provincial economy is also lowest. Overall, in those provinces where we have seen dramatic growth in industrial contributions to the pro-vincial economy, its impact on the economy is considerably greater than its impact on the overall provincial labor force.
• Construction, commerce and service sectors appear to have a relatively more balanced overall impact on both economic output and employment.
Overall, if we can assume that the relatively high GPP per worker in non-agriculture sectors (and especially in larger-scale industry) translates into similarly relatively high wage rates, there appears to be a strong incentive for further movement into the industrial sector. The same is true for the service and transportation sectors in some provinces. Incentives for trade and commerce, and espe-cially construction appear to be more modest, while the scale of employment opportunities are likely to be limiting in remaining sectors. More detail on the distribution of employment among sectors in more localized areas will be provided in the second part of this report under discussions of the stakeholder and institutional context of Ping sub-basins. Within the agriculture sector, we can also anticipate continuing strong incentives for movement into crops offering higher value per worker. A number of constraints, however, are likely to limit the rate and extent to which this occurs. In terms of current agricultural production, the following distributional aspects are particularly noteworthy:
• Paddy Rice. Lower Ping Basin provinces have extensive irrigated areas that produce mul-tiple crops of paddy rice. Irrigated areas also occur in the more limited lowlands of Tak, and expand again in the large inter-montane valley in Upper Ping Basin provinces, where traditional irrigation facilities have been reworked with ‘modern’ structures. In mountain-ous areas of Tak and Upper Ping provinces, much smaller pockets of paddy land are found in small valleys and areas where terrain allows, and especially main season paddy crops are often assisted by weir and canal structures long managed by traditional water management organizations (muang fai).
• Short-season Field Crops. The most extensively planted short field crop in the Ping River Basin is maize, most of which is sold for use in producing animal feed. There are also sub-stantial areas planted to various legumes, especially soybean, mungbean and groundnut. Various upland areas planted to legumes have been displaced by maize during recent years.
• Long-season Field Crops. Lower Ping Basin Provinces have extensive areas planted to long-season industrial crops, especially sugarcane and cassava. While sugarcane extends a bit into Tak Province, these crops become very rare in inter-montane valley and mountain areas of the Upper Ping Basin. While a bit of cotton appears in Tak, the main long-season field crop in mountain areas is upland rice, which occurs in areas where terrain does not al-low establishment of paddy fields. Especially in inter-montane valley areas, tobacco has also been an important crop,

Page 10 Participatory Watershed Management for the Ping River Basin Project
• Vegetables. Lower Ping Basin provinces have relatively little commercial production of vegetables, although there is some production of long bean, greens, chillis and eggplant in Kamphaengphet. Garlic production begins to appear in Tak, and expands in scale along with shallots and onions as one travels north into inter-montane valley areas, where pro-duction of greens, chillis, cucurbits, tomatoes, eggplant, sweet corn, tubers, and a variety of other minor crops add up to a substantial level of production. In hill and mountain areas, a range of more cool season vegetable crops also appears. Upper Ping Basin vegetables are produced for both domestic and export markets, although various important crops are now facing increasingly stiff competition from imports from China.
• Ornamentals. Although there are a few orchid farms and minor plantings of a few crops like jasmine in Kamphaengphet and Tak provinces, in Upper Ping provinces, production of roses, orchids, gladiolas, and various other flowers and ornamental plans becomes an im-portant activity for some areas and households.
• Fruits. Although a variety of fruits are grown in home gardens throughout the Ping Basin, commercial production at significant scales are first seen in terms of citrus production in Kamphaengphet. But it is not until Upper Ping Basin provinces that fruit tree production becomes a major enterprise. The largest is the major longan industry in the inter-montane Chiang Mai-Lamphun Valley, but there are also extensive plantings of mango, litchi, and a range of other crops often planted in mixed orchards. A substantial citrus industry has also begun in the far northwest corner of the Ping Basin, and it has been expanding during re-cent years. Strawberry production has also become important at higher elevations, and a range of sub-tropical and temperate fruits have expanded in some mountain areas with as-sistance from opium crop substitution and highland development programs.
• Other Trees. While few other industrial tree crops appear to be important in Nakhon Sa-wan, eucalyptus plantings appear in Kamphaengphet and extend northward into Tak, along with some minor areas of coconut. In Upper Basin provinces, mountain areas of Chiang Mai also include some plantings of coffee and tea, including both Chinese types of tea and ‘miang’ tea gardens that are traditionally planted into natural forests.
• Others. Of course there are is also a substantial range of herbals, medicinals, mushrooms, dyes, and various other types of products that are obtained either from natural forest sources or are being produced at various stages and levels of domestication. These can be seen more as ‘niche’ products, and mainstream government information systems are not willing or able to try to keep track of their production levels. There does, however, appear to be increasing levels of production as one moves north into the complex environments found in mountain areas of mid to upper Ping Basin provinces.
Livestock and wildlife are also important in the Ping Basin, as in other areas of Thailand. Some data that helps indicate distribution of livestock production for sale in Ping sub-basins will be pre-sented in the second part of this report.
5. Changing patterns of natural resource use The growth of these types of agricultural activities has left their ‘footprint’ on the land use patterns of Ping Basin provinces. In order to see how these patterns have changed during the last 20 years, Figure 1-7 shows the relative proportion of land in each province allocated to various major types of land use during 1986-2001. Two types of patterns are immediately evident in these data. The first relates to substantial differ-ences that correspond to the gradient of change that occurs from the lower to upper portions of the Ping Basin, while the second relates to change over time. Gradient Changes. In terms of difference along the lower-to-upper gradient in the Ping Basin, the most obvious is a dramatic increase in the proportion of land under forest cover. In Nakhon Sawan, about 90 percent of the total land area has been cleared. But to the north in Kamphaengphet prov-

Final Report: Developing Watershed Management Organizations in Pilot Sub-Basins Page 11
Figure 1-7. Land use in Ping Provinces, 1986 – 2001 ince forest cover increases to about 30 percent of the land area. In the transition province of Tak, forest cover rises to between 70 to 80 percent, and it is fairly similar in Chiang Mai province. Smaller Lamphun province retains only about 50 to 60 percent forest cover, but that relates to the relatively large proportion of its land that lies within the inter-montane Chiang Mai-Lamphun Valley.
Tak
0%10%20%30%40%50%60%70%80%90%
100%
1986 1987 1988 1989 1990 1991 1992 1993 1994 1995 1996 1997 1998 1999 2000 2001
Shar
e of t
otal
prov
ince
land
area
Residential Paddy Field crops Veg/ornmt Perennials Grass/idle/other Non-Agric Forest
Chiang Mai
0%10%20%30%40%50%60%70%80%90%
100%
1986 1987 1988 1989 1990 1991 1992 1993 1994 1995 1996 1997 1998 1999 2000 2001
Shar
e of t
otal
prov
ince
land
area
Residential Paddy Field crops Veg/ornmt Perennials Grass/idle/other Non-Agric Forest
Lamphun
0%10%20%30%40%50%60%70%80%90%
100%
1986 1987 1988 1989 1990 1991 1992 1993 1994 1995 1996 1997 1998 1999 2000 2001
Shar
e of t
otal
prov
ince
land
area
Residential Paddy Field crops Veg/ornmt Perennials Grass/idle/other Non-Agric Forest
The curious difference between forest cover data in 1999 and in 2000 is linked with a change in the type of remote sensing platform used to detect forest cover to a newer and higher resolution type of equipment. Of course, this also raises questions about the accuracy of pre-2000 forest cover data and the actual extent of land identified as cleared of forest but not within recognized farm land holdings. Analysts in the Ministry of Natural Resources and Environment are currently working to clarify this issue.
Kampaengphet
0%10%20%30%40%50%60%70%80%90%
100%
1986 1987 1988 1989 1990 1991 1992 1993 1994 1995 1996 1997 1998 1999 2000 2001
Shar
e of t
otal
prov
ince
land
area
Residential Paddy Field crops Veg/ornmt Perennials Grass/idle/other Non-Agric Forest
Nakhon Sawan
0%10%20%30%40%50%60%70%80%90%
100%
1986 1987 1988 1989 1990 1991 1992 1993 1994 1995 1996 1997 1998 1999 2000 2001
Shar
e of t
otal
prov
ince
land
area
Residential Paddy Field crops Veg/ornmt Perennials Grass/idle/other Non-Agric Forest
Source data: Office of Agricultural Economics
Another corresponding aspect of change along this gradient is the relative proportion of land in agricultural holdings of various types. Between 60 to 70 percent of land in Nakhon Sawan is accounted for as recognized types of private farm land holdings, and two-thirds of this area are in paddy fields, much of which is irrigated from water originating in upstream areas of the Ping and other river basins in the northern region that have all merged together by the time they reach Nakhon Sawan, where they collectively form the Chao Phraya River. As we move north to Kamphaengphet, the proportion of area in farm land holdings drops to about 40 to 50 percent of the total area, and only about half of the farm land is in paddy fields. This corresponds to the increasing relative importance of major upland crops, and especially sugarcane, cassava and maize. In the largely mountainous transition province of Tak, recognized farm holdings drop to less than 10 percent of total land area, with most of it in up-

Page 12 Participatory Watershed Management for the Ping River Basin Project
land fields. In the Upper Ping Basin provinces of Chiang Mai and Lamphun, recognized farm hold-ings increase to between 10 to 20 percent of total land area, much of which is in paddy, and most of which is located in the major inter-montane valley. Temporal Changes. Other than the curious ‘hiccup’ in forest cover data (already discussed above), the most obvious aspect of change during the last 20 years has been that the proportion of area in farm holdings has not increased in any of the 5 Ping Basin provinces. Indeed, it appears to have actually decreased in all provinces except Tak, where it was already at a very low level. And, this decrease in farm land holdings includes the proportion of area in paddy fields in all four provinces. Possible explanations for this pattern include (a) the previous expansion of paddy and upland fields into increasingly marginal areas that subsequently proved incapable of sustaining satisfactory lev-els of productivity; (b) stabilization of population growth and migration of members of the labor force from agriculture into other sectors of the economy; (c) expansion of urban and industrial ar-eas into farm lands surrounding the locations where urban industrial areas developed, which were almost universally in lowland areas with productive farm lands; and (d) shifts into more intensive multiple cropping systems in productive farm lands surrounding growing urban industrial centers. The second obvious pattern of change over time has involved shifts among components of farm land holdings, which are particularly evident in Upper Ping Basin provinces. The most obvious component of this change has been a shift from paddy land into perennial crops, which has oc-curred mainly in the major inter-montane valley of the Upper Ping Basin. This shift is primarily associated with expansion of fruit tree plantations, which includes longan, mango and mixed or-chard and perennial systems. Primary explanations for this process center on (a) the higher returns to land and labor offered by expanding access to domestic and international markets for these prod-ucts; (b) the relatively lower labor intensity of orchard production, which became important as la-bor migrated from agriculture into other sectors of the economy; and (c) simply the ‘bandwagon’ effect created by the previous factors in combination with promotion programs by public and pri-vate sectors, as well as by the lack of sufficiently attractive alternatives. While there has not been dramatic expansion of the total area in recognized farm land holdings dur-ing the last 20 years, these shifts among components of land use within farm land holdings has also been associated with changing demands for water resources. In earlier times, main season rice crops were the primary focus of lowland water demand, and a second crop of rice or other post-rice crops was a ‘luxury’ possible in areas that were particularly well located in terms of water re-sources. As production has shifted more into year-round intensive multiple cropping systems and perennial orchards, however, a dependable year-round supply of irrigation water moves from being a luxury into becoming a necessity. And especially as perennial fruit tree orchards have expanded into upland rainfed areas around the periphery of irrigated lowland areas, growers have learned that availability of irrigation water at critical times in the fruit production cycle are an extremely impor-tant element of the abundance, marketability and profitability of the crops produced. Thus, overall demands in the lowlands and surrounding upland areas for a reliable year-round supply of irrigation water have been growing. At the same time, year-round water demands are increasing for growing major urban and industrial centers located in the lowlands, as well as demands for water to irrigate golf courses, supply resorts and tourist facilities, and various other types of uses that emerge along with structural shifts in the economy. Moreover, often extremely high land values in expanding riverside urban centers has also brought strong incentives for encroachment into flood plains, drainage channels, canals and river banks, as well as pressure to build roads, bridges and various other structures that can impede water flows. These factors contribute to increased incidence and impacts of flooding during peak flow seasons. In order to help clarify the spatial patterns of many of these elements of change, which are becom-ing particularly complex in the Upper Ping Basin, Figure 1-8 presents a detailed map of agricultural and urban land use in the Chiang Mai and Lamphun portions of the Upper Ping River Basin. It has been prepared by Dr. Methi Ekasingh and his colleagues at the Chiang Mai University Multiple Cropping Centre, using the pilot provincial information systems they have recently developed for

Final Report: Developing Watershed Management Organizations in Pilot Sub-Basins Page 13
these provinces (along with Chiang Rai) under support from the Thailand Research Fund (TRF). Patterns in this figure indicate quite clearly why the World Agroforestry Centre (ICRAF) refers to mosaic agroforestry landscape patterns of land use in the region.
Figure 1-8. Detailed current agricultural land use in the Upper Ping
Source: Methi Ekasingh, CMU Multiple Cropping Centre, using their Decision Support System for Agri-cultural Resource Planning (Ekasingh et.al. 2005)
Page 14 Participatory Watershed Management for the Ping River Basin Project
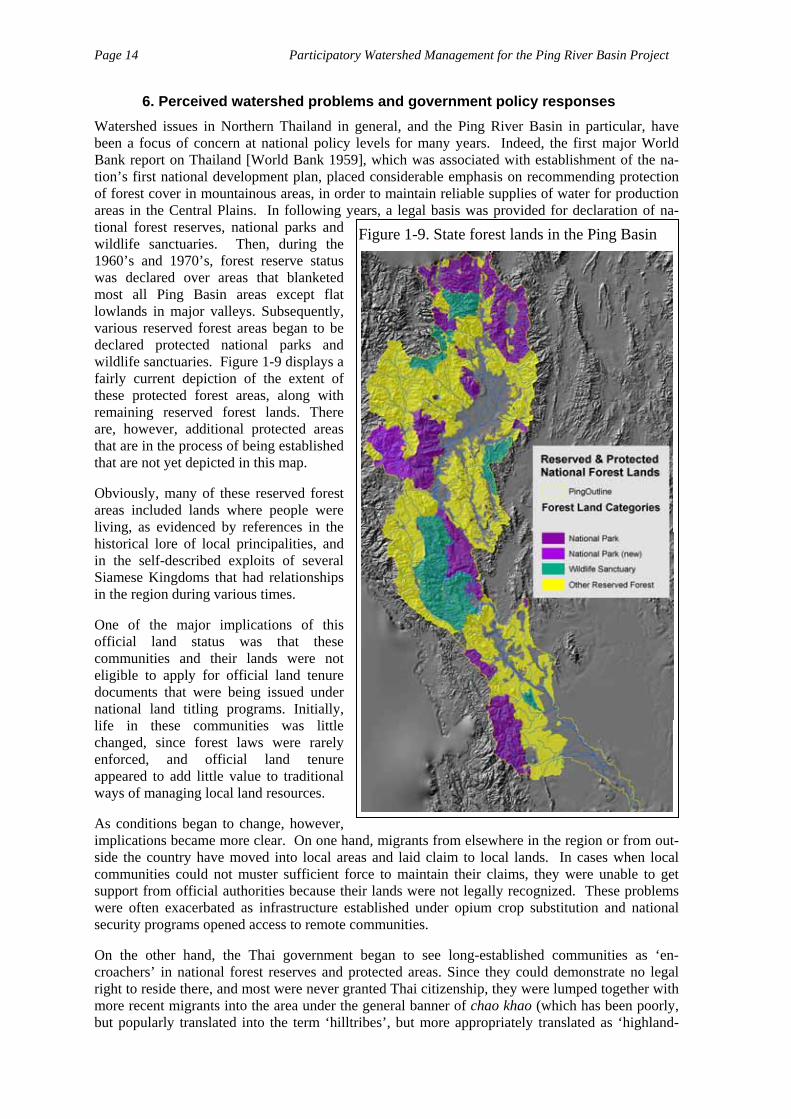
6. Perceived watershed problems and government policy responses
Figure 1-9. State forest lands in the Ping Basin
Watershed issues in Northern Thailand in general, and the Ping River Basin in particular, have been a focus of concern at national policy levels for many years. Indeed, the first major World Bank report on Thailand [World Bank 1959], which was associated with establishment of the na-tion’s first national development plan, placed considerable emphasis on recommending protection of forest cover in mountainous areas, in order to maintain reliable supplies of water for production areas in the Central Plains. In following years, a legal basis was provided for declaration of na-tional forest reserves, national parks and wildlife sanctuaries. Then, during the 1960’s and 1970’s, forest reserve status was declared over areas that blanketed most all Ping Basin areas except flat lowlands in major valleys. Subsequently, various reserved forest areas began to be declared protected national parks and wildlife sanctuaries. Figure 1-9 displays a fairly current depiction of the extent of these protected forest areas, along with remaining reserved forest lands. There are, however, additional protected areas that are in the process of being established that are not yet depicted in this map. Obviously, many of these reserved forest areas included lands where people were living, as evidenced by references in the historical lore of local principalities, and in the self-described exploits of several Siamese Kingdoms that had relationships in the region during various times. One of the major implications of this official land status was that these communities and their lands were not eligible to apply for official land tenure documents that were being issued under national land titling programs. Initially, life in these communities was little changed, since forest laws were rarely enforced, and official land tenure appeared to add little value to traditional ways of managing local land resources. As conditions began to change, however, implications became more clear. On one hand, migrants from elsewhere in the region or from out-side the country have moved into local areas and laid claim to local lands. In cases when local communities could not muster sufficient force to maintain their claims, they were unable to get support from official authorities because their lands were not legally recognized. These problems were often exacerbated as infrastructure established under opium crop substitution and national security programs opened access to remote communities. On the other hand, the Thai government began to see long-established communities as ‘en-croachers’ in national forest reserves and protected areas. Since they could demonstrate no legal right to reside there, and most were never granted Thai citizenship, they were lumped together with more recent migrants into the area under the general banner of chao khao (which has been poorly, but popularly translated into the term ‘hilltribes’, but more appropriately translated as ‘highland-

Final Report: Developing Watershed Management Organizations in Pilot Sub-Basins Page 15
ers’). As such, they have become targets for a range of programs launched by outsiders, from well-intentioned efforts to improve medical care, education and livelihood opportunities, to often mis-guided attempts to bring ‘civilization’ to their world. Various conditions have improved during re-cent years, and most mountain communities in the Ping River Basin (except for the most recent wave of migrants fleeing strife and hardship in Myanmar) now have citizenship and are being inte-grated into local administration and governance systems. The lack of any legal recognition of land holdings and local boundaries, however, remains a major obstacle for local land use management.
Figure 1-10. Ping Basin watershed classes Moreover, effects of internal population
growth and economic change have brought increasing resource scarcity, incentives for commercial activity, and a range of new stakeholder interest groups that profoundly changed the operating environment of mountain communities. While lowland society has long misunderstood and condemned all forms of shifting cultivation in mountain agroecosystems (no matter how well managed), it is the expansion of commercial agriculture that is the most commonly cited source of the serious degradation of forest and soil that is perceived to be occurring in mountain watersheds today. Indeed, economic in-centives for expansion of upland field crops began driving expansion of lowland agriculture into reserved forest areas in Lower Ping provinces during the 1970’s, as well as the subsequent penetration of agro-industrial crops (especially maize) into mountainous areas. This was further facilitated by anti-shifting cultivation pro-grams that forced conversion of rotational forest fallow systems in many areas into fixed field agriculture that required use of purchased chemicals to replace agronomic and ecological functions of forest fallow. Meanwhile, the success of opium crop substitution programs and expansion of road access in highland areas brought market forces into mountain areas that are driving expansion of a range of commercial
crops, some of which employ technologies that include sprinkler irrigation and intensive use of ag-ricultural chemicals. Expansion of tourism has also brought incentives to develop resorts, golf courses, vacation homes, and various associated facilities. And, since there are no legal boundaries to land holdings in any reserved or protected forest lands, there are few tools available to manage rising levels of competition for land resources and the resulting changes in land use patterns. Moreover, some of the newer stakeholders are backed by wealthy and powerful investors, who are sometimes able to use their connections and wealth to ‘purchase’ land documents not available to local long-term residents. National authorities responsible for management and maintenance of reserved and protected forest lands observed these changes with growing concern. Their first major response came during the mid-1980’s when a new national program was launched to classify all lands in the country accord-ing to their watershed characteristics. The resulting classification of watershed zones is meant to serve as a basis for efforts to restrict land use practices in critically important areas. Figure 1-10 depicts the outcome of this process for the Ping Basin.

Page 16 Participatory Watershed Management for the Ping River Basin Project
Backed by a resolution of the Ministerial Cabinet rather than specific legislation, watershed zones were an integral part of thinking that underlied the first national forest policy, approved and estab-lished in 1985. As a result, programs of the Watershed Conservation Division (then located within the Royal Forest Department) and their distributed watershed management units began receiving stronger support. While their programs began rapid growth a decade earlier, much of their effort was related to a combination of planting pine plantations (often in forest fallow fields where they were subsequently destroyed), or implementing projects related to national security and/or opium crop substitution. As part of the new approach, there was an expansion of watershed-oriented high-land development projects that included the UN-supported Sam Mun Highland Development Pro-ject in the Mae Taeng upper tributary valley of the Upper Ping, as well as the Queen Sirikit Forest Development Project that succeeded an earlier USAID supported project in the Mae Chaem upper tributary. Under Thai leadership provided by staff from the Watershed Conservation Division and its local watershed management units, both of these projects became pioneers in working with communities in upper watershed areas, employing a range of approaches developed in association with academics and other non-agency groups working on emerging community forestry and social forestry programs. Despite impressive progress made under these and other projects, which included collaboration in the development and testing of now internationally recognized and emulated participatory land use planning (PLP)1 techniques, national authorities remained unwilling and/or unable to establish any means for official recognition of land use zoning boundaries delineated in collaboration with local communities in these project areas. Rather, with backing from environmental interests and lobby groups, protected areas have continued to expand, and now all Class 1 watersheds located outside national parks and wildlife sanctuaries have been placed in the status of “being prepared” for pro-tected area status. This precludes access by local communities to land use recognition (less than full title) that might be provided under any of the Ministry’s community forestry programs. It is not so much the current magnitude of cultivated areas in the mountains that concerns environ-mental interests, as it is the strategic locations of various cultivated areas, along with fears of fur-ther expansion driven by economic forces believed to be beyond the capacity of local communities to manage. Somewhat ironically, it is the absence of enforceable land use boundaries that facili-tates expansion of the types of land use that environmentalists so abhor. In order to help clarify the nature of these concerns, Figure 1-11 displays overall land use patterns in the Ping River Basin dur-ing 2000, as interpreted from satellite imagery by forest department technical analysts. While simi-lar types of forest have been merged into the same color codes to simplify the presentation, differ-ences between evergreen and mixed or fully deciduous forest have been retained. Similarly, all types of agriculture are merged into one color, which eliminates issues associated with forestry analysts assigning fixed or shifting cultivation status to particular areas. Hill evergreen forests are perceived by forest hydrologists and environmentalists as being particu-larly important for hydrological processes at the watershed level. There is still substantial debate about whether evergreen forests cause increased rainfall [Tangtham 1998], or whether they exist because of higher rainfall associated with altitudinal gradients. While most existing hard evidence points to the latter [Bruijnzeel 2004], foresters and environmentalists in Thailand remain uncon-vinced. In any event, their location is associated with headwater areas of streams important for downstream agriculture and other forms of water use, and forest cover is viewed as very important for maintaining the most even seasonal distribution of rainfall possible [Tangtham 1998]. Al-though factors affecting infiltration of water may be more important for buffering seasonal stream flow than forest cover per se [van Noordwijk 2003], foresters and environmentalists do not believe that any alternative forms of land use can maintain infiltration rates similar to those found in pro-ductive natural forest. As close examination of Figure 1-11 indicates, many hill evergreen forest areas in the Ping Basin include orange areas that indicate the presence of strategically important highland agriculture. Moreover, a considerable number of these areas are where intensive horticul- 1 Dr. Uraivan Tan-kim-yong coined this term to characterize techniques developed and tested by a collabora-tive team for which she was the major source of conceptual and intellectual innovation and guidance.

Final Report: Developing Watershed Management Organizations in Pilot Sub-Basins Page 17
tural crops are now being grown in contiguous fixed fields, often employing sprinkler irrigation and substantial use of agricultural chemicals. For foresters and environmentalists, then, these are the most important “hot spots” of forest degradation in Ping Basin watersheds, and the most im-portant targets for efforts to limit land use.
Figure 1-11. Ping Basin land use, 2000
Source: Forest department data provided by ONEP

Page 18 Participatory Watershed Management for the Ping River Basin Project
A second source of concern relates to the total proportion of land under forest cover, regardless of the type of forest involved. For more than 50 years, the Thai forestry establishment (with the back-ing of certain international forestry and environmental interests) has maintained that a minimum of 40 to 50 percent overall forest cover is necessary for the nation to remain environmentally sustain-able. And, since most of the lowland areas of the country have long been converted to non-forest forms of land cover (as in the two Lower Ping Basin provinces), large areas of forest cover must be maintained in mountain areas in order to achieve this overall percentage. While there may well be a need for a more rational approach to determining which areas that society wants to maintain un-der forest cover, the overall percentage approach has been enshrined in national policy, ingrained in the mindsets of environmentalists, and accepted by many segments of Thai society. In addition to forest clearing conducted by lowland communities expanding their upland crop pro-duction (as has been particularly dramatic in the Lower Ping Basin), the culprit responsible for much, if not most deforestation is widely believed to be mountain communities practicing any form of shifting cultivation, regardless of the type of forest within which they are located. Indeed, the use of fire in these systems provides an easily recognizable indicator of their existence, with so much smoke filling the air during burning season that even air traffic can be disrupted. Moreover, areas burned each year are classified and calculated as deforestation, while fields returned to forest regeneration in rotational forest fallow systems are ignored. These factors have helped inflate pub-lic perceptions of deforestation beyond the reality that can be observed by remote sensing.
Figure 1-12. Ping Basin overall tree cover
In addition to conversion of forest to other types of land use, foresters and environmentalists are now emphasizing degradation that is occurring within areas classified as forests. While this type of forest degradation is somewhat more subtle and difficult to detect from remote sensing, some relevant tools are under development. For example, Figure 1-12 shows moderately coarse resolution data (500m cell size) from NASA’s Modis satellite platform, also from the year 2000. This data focuses exclusively on the density of tree cover, without regard for classifications of forest or agricultural types of tree cover. While we can see that evergreen forest areas are indicated as dense cover, a substantial number of additional areas also have similar densities. Moreover, at least a modest to medium level of tree cover is present in many agricultural areas, as can be clearly seen in comparison with the fruit orchard areas around Chiang Mai City identified in Figure 1-8). At the same time, various forest areas (especially in dry deciduous forest zones) have relatively modest levels of forest cover. Clearly this type of density, which is a function of tree leaf area, is only one indicator of forest quality. It indicates, however, directions of technological development that hold considerable promise for more robust measures of forest quality in the future. Environmental concerns about watershed management, however, are not limited to forest cover and quality issues, and they are not the exclusive domain of environmental activists and foresters. Indeed, public envi-ronmental awareness and concern about
source: NASA Modis data from USGS website

Final Report: Developing Watershed Management Organizations in Pilot Sub-Basins Page 19
land use in upper watershed areas has been fed by a range of trends, events and perceived risks that can strongly affect people in their everyday lives. In terms of water flow regimes, major issues include:
• Flash floods and landslides. News media have reported a series of incidents involving rela-tively localized flash floods and landslides that have resulted in serious agricultural and property damage, and sometimes substantial loss of lives. Sites within the Ping River Basin have been included, and they are usually located in upper tributary valleys at the foot of steeply sloping small mountain stream valleys.
• Main channel floods. Damage caused by major floods along the main channel of the Ping River and its major tributaries have also been featured in mass media, and there is a general impression that they are increasing in frequency and magnitude. The most recent example is the series of floods that hit Chiang Mai City during 2005, which have been described as the most serious floods in 40 years. And given the level of riverside and floodplain devel-opment during that period, the level of their damage is unprecedented.
• Dry season agricultural water shortages. Rising demand for reliable year-round water sup-plies for irrigated agriculture at downstream locations has increased sensitivity to, and competition for water during the dry season. Thus, many have been taking an increasingly critical look at uses of both land and water at upstream locations.
• Inadequate village and urban water supplies. Similarly, efforts to improve supplies of water for drinking and domestic use in villages and urban areas alike have added an additional element of competition for water resources, which reaches a peak during dry seasons and during El Nino years.
• Diminishing ground water supplies. A growing number of communities have invested in shallow and deep wells to help provide access to water for agricultural, domestic and even industrial uses. In some areas, such as parts of the Chiang Mai Valley, many are now re-porting receding groundwater tables that are causing increasing alarm.
Another dimension of public concern relates to water quality, and begins making the link between natural resources and public health more directly. Areas of particular concern include:
• Waste water pollution. A growing volume of wastewater is being generated at village, ur-ban and industrial levels. This includes sewage and domestic wastewater, which has dis-ease implications for downstream populations, as well as threats of toxic chemicals and other substances present in wastes from business operations of various types. While waste treatment programs have expanded during recent years, there are major concerns that the pace of these programs has been inadequate to meet the challenges faced.
• Poisoning by agricultural chemicals. Increasing levels of use of agricultural chemicals is perceived as posing two types of public health threats. The first is through applicator poi-soning, while the second is through pollution of waterways with toxic substances. Both appear to be perceived as serious and growing issues among many sectors of the general population.
• Effects of industrial pollution. Waste by-products of industrial processes of various types and scales are a related concern. Much of the concern focuses on disposal of potentially toxic or disease-laden substances into waterways, but air and noise pollution can also be important in some cases.
This latter point introduces two additional important issues that are also growing concerns of com-munities and general populations within the Ping River Basin:
• Solid waste disposal. Trash and garbage are currently the main issues here. Rising levels of solid waste are associated with processes of economic integration and lifestyle change, and many communities find it difficult to cope with the problem. The ‘NIMBY’ (not in my back yard) phenomenon is evident when landfill sites are sought, and burning is subject to increasingly strict restrictions. Waste reduction programs are still in their infancy.
Page 20 Participatory Watershed Management for the Ping River Basin Project
• Air pollution. Emissions from vehicles and industry are primarily an urban-related prob-lem. While emissions from power generation plants are relatively localized, emissions from burning are more generalized. Burning associated with land clearing and agriculture can be seasonally very widespread (in both lowland and mountain areas) and quite heavy. Government restrictions are beginning to emerge, but enforcement will not be easy.
While these problems are widely associated with a variety of natural resource management and public health issues, agency personnel and their programs often underestimate the importance of the livelihood issues with which they are associated. Many, if not most of the practices associated with these problems are a reflection of the lack of viable alternative livelihood opportunities avail-able to the people employing them. Moreover, the poorest components of the population are the ones who most frequently encounter constraints on their access to such alternatives. And at the same time, they are also often among those most vulnerable to the negative impacts that they cause. It has also become quite clear that approaches of the past have been inadequate to effectively deal with most of these issues. Indeed, it is increasingly widely recognized that there are also serious gaps in resource governance structures and processes located at levels that are intermediate be-tween national and local community levels. More functional arrangements at these levels are nec-essary in order to analyze and understand problems that emerge at broader landscape levels, to identify and negotiate viable, practical and equitable means for addressing those problems, and to mobilize the range of human and financial resources required to implement such solutions.
7. Changing approaches to resource governance Changes in local governance processes accelerated rapidly after passage of the 1997 national con-stitution and related reforms. Most all communities in the Ping River Basin now have citizenship and elected local governments at the sub-district (tambon) level, even in more remote mountain areas. Tessabans and Tambon Administrative Organizations (TAO) are building their capacity in many areas, including levying and managing local taxes. Mandates are in place for communities and tambons to increase their role and participation in natural resource governance, but many tam-bon and tessaban governments lack relevant information and skills, and most of their constituents (especially in poorer areas) feel the need to place higher priority for use of scarce funds on provid-ing basic infrastructure and services that are necessary to improve aspects of their livelihoods that are perceived to be of more immediate day-to-day concern. At the same time, however, many gov-ernment ministries and their agencies and programs are being reorganized to provide more empha-sis at local levels, and especially for support of initiatives by local communities. And, there has been a surge in efforts by local communities to organize themselves in various forms and formats, including local networks that are now beginning to develop alliances at broader levels. All of these changes are overlaid by growing education, information flow, and public awareness that are increasingly linked with trends at international and global levels. One important dimension of these linkages that is of particular relevance to this project relates to environmental awareness and action. Many environmental problems are now perceived and identified in the Ping River Ba-sin, and local initiatives are being developed and launched to help address them.
• Major problems perceived in lowland areas near main river channels include lack of proper planning, administration and management of fluvial systems, environmentally insensitive river engineering projects, inappropriate development of flood plain areas, pollution of rivers from sewage and agricultural and industrial drainage, encroachment into river corridors and water bodies that narrows rivers and canals and reduces public access, and loss of river landscape quality, aesthetic beauty and cultural legacies [CMU 2004]. Excessive groundwater extraction is a problem in and around urban areas, as well as in some areas of intensive agriculture.
• In mountain areas, perceived environmental problems focus on deforestation of watershed headlands, which is believed to result in loss of biodiversity, accelerated soil erosion, and a range of impacts on hydrological systems, with claims extending beyond dry season stream flow to include flooding, landslides, and even assertions about impacts on total annual water yield, rainfall patterns and climate change [Walker 2002]. Highland agriculture [Tangtham
Final Report: Developing Watershed Management Organizations in Pilot Sub-Basins Page 21
1998] and roads [Ziegler 2004] are seen as the worst offenders, along with stream pollution by agricultural chemicals, and dry season water use by sprinkler irrigation. Forest fallow agricul-ture and its use of fire are seen as the source of major negative problems in the midlands, and together with expansion of field crop production into sloping lands above lowland paddies, they are seen to be generating serious negative impacts on watershed services and biodiversity.
Although environmental concerns began to be integrated into agendas of civil society organizations as they emerged in the national political arena 20 years ago, a significant division in their directions and positions has taken place during the last decade or so. Activities initially focused largely on opposition to dam construction, logging concessions and large forest plantations, and there still ap-pears to be substantial agreement about issues and actions that need to be taken regarding environ-mental problems in lowland, urban and industrial areas, and along main river channels. All tend to place much of the blame for these problems on unbridled commercialization, growth of consumer-ism, and very weak planning and regulatory mechanisms that are easily overridden by the wealthy and powerful. Their division is most apparent, however, in rural, and especially mountain areas:
• On the one hand, ‘deep green’ environmental groups are pushing hard for severe restrictions on midland and highland land use and segregation of local communities from forest lands, includ-ing strong support for efforts by conservation agencies to expand national parks and wildlife sanctuaries to cover all class 1 watersheds and remaining natural forest areas in the Kingdom.
• On the other side, ‘populist’ environmental groups are pushing for community management and control of forest lands, based on local traditions, knowledge and practices. They have lob-bied hard for passage of community forestry legislation ‘stuck’ in Parliament, and support re-sistance by communities threatened with displacement by protected area expansion.
Both sides have been very active in the Ping River Basin, and have built alliances that include dif-ferent factions in academia, government and other sectors of society. Tension between them has sometimes erupted into open conflict, such as in the Chom Thong district of Chiang Mai province a few years ago. Both sides also appear to be learning from this experience, however, and few want to see a repeat of such unproductive and divisive events.
And perhaps most importantly, as local communities are exposed to the arguments and advocacy from both sides, many are listening to both points of view and seeking to identify a ‘middle way’ to improve their overall quality of life and safeguard the legacy of future generations. Many have begun to invest considerable effort to develop ‘peoples organizations’ based largely on informal networks among local communities, and some are developing broader alliances among networks. More astute government agencies and urban-based NGOs have seen the important potential of these networks, and have begun to seek ways to support and facilitate their further development.
Moreover, Thailand’s Royal Family have shown exceptional leadership in these issues, and are constantly urging Thai society to develop a common vision of the future that combines improved livelihoods with sustainable natural resource management. This is a very important source of in-spiration for efforts seeking unity across government, business, civil society, and local community sectors of society. It is in this context that river basin management programs and this project have emerged. Anecdotal evidence already clearly indicates that communities and groups in various parts of the Ping River Basin are building organizational capacity and experience with multi-community networks, often across ethnic and other social boundaries, to manage local sub-watersheds (called lumnamyoi in this report). And in some areas, these local networks are building alliances and federations among themselves to extend their organizational and management capacities to sub-basin levels. These are efforts that can provide the localized building blocks upon which sub-basin and river basin level management organizations such as those envisioned by this project can and should be built to effectively address the wide range of intertwined livelihood and environmental issues that organi-zations promoted under this project must address.

Final Report: Developing Watershed Management Organizations in Pilot Sub-Basins Page 39
This type of information system could also be further enhanced by linkage of the spatial database with specialized analytical techniques, including simulation or programming models, to help strengthen understanding about basic processes, trade-offs, or implications of different future de-velopment scenarios that are high priority concerns among sub-basin stakeholders. Some examples are introduced in an ICRAF report to the Rockefeller Foundation [Thomas 2004a], and more detail is presented in their ASB report to the World Bank [van Noordwijk 2003]. Summary of Suggestions and Recommendations in Part I:
1. This part of the report proposes a framework for understanding the context of efforts to build sub-basin management organizations for the Ping River Basin that includes:
• Diversity of physical, economic & social characteristics of the Ping River Basin should be viewed in the context of a gradient of conditions that begins with large areas of paddy & rolling uplands in lower parts of the basin adjacent to the Central Plains, then runs through the hills of lower & transition provinces into the inter-montane Chiang Mai Valley, and finally extends into largely mountainous upper tributary watersheds.
• Overall economic growth & development strategies, general patterns of land use change & their impacts on natural resources, and broader impacts of national land use & resource conservation policies should be assessed along this gradient using spatial & provincial time series data, along with other forms of available information.
• National natural resource governance issues & debates should be assessed for how they apply to each major portion of the river basin along this gradient.
• Current progress & status of watershed & sub-basin management, including the nature and status of any related emerging organizations, should be reviewed & assessed at major levels of watershed units & administration units, from local sub-watersheds & tambons to river system & national levels.
• Hierarchies of administrative units & natural watershed units should be compared as part of an initial assessment of levels where interaction needs to occur between admini-stration & watershed units, and potential strengths & weaknesses at each level.
• In the current Ping Basin context, initial assessment of comparative strengths & weak-nesses indicates the sub-basin level should place emphasis on its potential for provid-ing a venue for interaction between top-down & bottom-up processes of organization for watershed & natural resource management.
• Both non-governmental planning initiatives & regular local development planning processes need to be reviewed in terms of how they can & should interact with basin & sub-basin management at various levels.
2. Efforts to build sub-basin management organizations should strive to address current key gaps & operational issues that include:
• Effective & consistent efforts need to be made to reduce confusion & uncertainty about river basin & sub-basin programs, which is largely due to repeated rounds of planning under changing mandates & shifting responsibilities of agencies & organizations, with-out a clear commitment to actual implementation.
• Venues & processes should foster stakeholder discussion & debate aimed at building mutual understanding of commonalities and differences in interests & visions of the fu-ture, development of a common identity among stakeholders at the sub-basin level, and an atmosphere where reasoned compromise solutions can be formulated.

Page 40 Participatory Watershed Management for the Ping River Basin Project
• Government agencies need to examine their own strengths & weaknesses, and join with other stakeholders in identifying means for overcoming problems associated with poor coordination & cooperation among agencies, & lack of downward accountability.
• Problem identification & analysis needs to become more empirical & data based, and recognize the need for negotiating trade-offs among the benefits & costs accruing to different stakeholder groups. There needs to be less focus on winning/losing, and more focus on equitably achieved ‘best possible’ outcomes.
• Principles of subsidiarity & specialization need to be used in identifying & building appropriate coalitions that can help achieve broader & more difficult goals.
• In order to provide a solid basis for transparency, accountability & learning, sub-basin management organizations should place substantial emphasis on building their capacity to conduct three types of monitoring: (1) project inputs & outputs: (2) progress toward achieving program & plan objectives; (3) status of the range of conditions correspond-ing to their overall mandate. Partnerships & coalitions will be needed to effectively achieve all these types of monitoring.
3. A systematic & effective information management system needs to be developed at the Ping River Basin level. It needs to build on previous & on-going work, and provide link-ages with emerging sub-basin organizations that can support their functions & further de-velopment.

Final Report: Developing Watershed Management Organizations in Pilot Sub-Basins Page 141
Summary of Suggestions and Recommendations in Part II:
1. Priority or ‘pilot’ sub-basins should be selected in full consultation with local leaders in all sub-basins, with a clear understanding that ALL sub-basins will receive support for their efforts to build participatory management organizations after the pilot phase.
2. Technical criteria used to support ‘pilot’ sub-basin selection should be pragmatic, able to use data from readily available secondary sources, easy to implement quickly, & simple enough to be communicated to a wide range of river basin stakeholders. They also need to be clearly linked with major issues, logically sound, & reasonably quantitative.
3. Categorization of lower, middle & upper groups of sub-basins in the Ping Basin should be based on their bias toward lowland or upland conditions, using relative proportions of their area in lowland, midland & highland altitude zones, as in Indicator 1.1.
4. The range of relevant stakeholder & institutional interests then needs to be assessed accord-ing to sub-basins & sub-basin groups. Key sets of stakeholders for the Ping Basin should include: (a) central government agencies; (b) local administrations; (c) forestry agencies & policies; (d) agriculture of various types; (e) private business; (f) urban centers; (g) local government; and (h) civil society & academia. A diagrammatic framework for stakeholder relationships is proposed in Figure 2-23, & discussions of stakeholders are in section II.B.2.
5. Data to help this analysis become more quantitative should be derived from village-based data sources such as กชช.2ค linked with GIS, so that they can be aggregated at sub-basin & sub-basin category levels.
6. A minimum set of quantitative criteria for selection of a pilot sub-basin within each group of sub-basins needs to include at least three major categories. The proposed logic for de-veloping specific sub-criteria & quantitative indicators is summarized in Figure 2-24.
• Severity of natural resource issues: Selected sub-basins should include conditions mak-ing it likely that issues will arise related to forest & land degradation, natural hazards, & water use. Sub-criteria & indicator details are in section II.B.4.
Available data needed to quantitatively assess these indicators should be improved in several key areas: (a) designation of areas as deteriorated forest; (b) soil erosion; (c) landslide risk; (d) flash flood risk; and (e) areas under sprinkler or small-scale pump ir-rigation. Sources of data on groundwater & stream flow need to be more transparent.
• Severity of socio-economic issues: Selected sub-basins should include areas where poverty & health problems are relatively high, where land use is restricted & conflict is likely, & areas where upland minorities and/or urban populations play significant roles. Sub-criteria & indicator details are in section II.B.5.
Available data needed to quantitatively assess these indicators should be improved in several key areas: (a) village-level income data by type of source; (b) Community De-velopment Department indices are needed for the entire river basin in a spatial format; (c) up-to-date protected area boundaries that include newly declared areas; (d) better classification of agriculture areas, especially in mountain zones; (e) access to more re-cent data on ethnicity; (f) more clear & consistent urban population data; (f) better data on water quality & existing & planned wastewater treatment facilities; (g) better data on pesticide residues, & illness linked with water quality, air quality & toxic wastes; and (h) additional health data should be made available on a village-level basis.
• Local organizational capacity and administrative complexity. Selected sub-basins should have reasonable levels of local organizational capacities & relevant skills, but avoid areas where excessive administrative complexity may prevent adequate testing of model approaches within the project timeframe. Sub-criteria & indicator details are in section II.B.6.
Page 142 Participatory Watershed Management for the Ping River Basin Project
Available data needed to quantitatively assess these indicators should be improved in several key areas: (a) data on the existence, status & effectiveness of local networks and/or other prachakhom organizations related to natural resource management within sub-basins; (b) data on the nature & coverage of emerging alliances & federations of relevant types of networks; (c) data on presence & nature of support for local organiza-tions & networks provided by NGOs and/or government agencies; (d) Community De-velopment Department indices are needed for the entire river basin in a spatial format; (e) improved consistency of data on local knowledge specialists; (f) improved informa-tion on difficulty of coordination among administrative units at different levels.
7. Relative weights applied to reflect the importance of different criteria & indicators in the context of a particular analysis need to be assigned in a transparent manner. This will help them to be clearly understood, and allow them to be adjusted to reflect different experience, expert opinion, or consensus.
8. A proposed rationale for assigning relative weights is explained in section II.B.7.(c)., along with results of indicator calculations using these weights. Assignments of sub-basin rank-ings based on these calculations are displayed in Figure 2-61.
9. Given the importance of village-level data in assessing sub-basin characteristics & patterns of diversity, a few suggestions are made for ways to improved กชช.2ค data:
• Data entry & screening checks need to be improved to prevent some of the obvious er-rors & inconsistencies that are present in a minority of database records.
• Data on local knowledge specialists can be improved by adjusting the questionnaire to more clearly explain definitions & criteria for identifying local specialists.
• Data on education could be greatly improved by re-writing questions in a manner that can be clearly understood by local leaders providing the information, and by having cross-checks on demographic data to assure consistency.
10. In conducting pilot sub-basin selection using a ‘Water Forum’ approach, five essential component phases of activity are proposed (as summarized in Figure 2-62):
• A preparation phase should include careful consideration of technical criteria & indica-tors (such as those in this report or others), and clear articulation of (a) the reason for & nature of activities conducted to prepare for the forum; (b) the informing (not prede-termining) role of quantitative criteria & indicators; and (c) the role of the Forum itself.
• The Forum should begin with clear articulation of the above information, followed by clear explanation of proposed quantitative criteria & indicators and their potential use as a decision-making aid, including appropriate visual aids to facilitate understanding of the data & calculations.
• The next phase should center on soliciting feedback, additional information, and alter-native points of view from stakeholders represented in the Water Forum, using smaller discussion groups if necessary.
• Effort should then be shifted to clarification of major views, interpretations or dis-agreements, in order to set the stage for a constructive decision-making process.
• The final phase should center on reaching a decision on sub-basin selection, and on mobilizing widespread support for the pilot project among representatives from all sub-basins in the river basin, including encouragement for further efforts throughout the river basin to continue building networks or other activities that can provide a founda-tion for rapid progress during subsequent expansion.
11. Future river basin-level activities, or those involving multiple sub-basins, such as a ‘Water Forum’ should prepare for the likely lack of common identity & purpose that can be achieved at that level, as well as associated difficulty in engaging in clearly reasoned, evi-dence-based processes. It seems unlikely that this situation will be able to improve until such processes can first be achieved at sub-basin levels.
Page 200 Participatory Watershed Management for the Ping River Basin Project
visions, however, for a petition submitted by a specified percentage of stakeholder representatives in the RSBO assembly to conduct a special system review due to significant contextual changes, urgent unanticipated problems, or emergence of significant improprieties. Summary of Suggestions and Recommendations in Part III:
1. It is useful for leaders of, and advisors to, efforts to develop sub-basin management organi-zations to understand the global context of trends toward river basin management, includ-ing: • intergovernmental agreements & institutional polices (discussed in section III.A.1(a) ) • emerging global & regional civil society organizations (discussed in section III.A.1(b)) • recent international literature on river basin organizations (discussed in section III.A.2) Suggested overall lessons that can be drawn from international experience with river basin organizations are summarized in section III.A.3.
2. Based on review of experience at both international and Ping River Basin levels, six areas
of consideration are proposed for priority consideration in developing models of organiza-tion for river sub-basin management organizations (RSBOs):
• Mandate, responsibilities & authority. Conditions in the Ping Basin favor a broad and integrated mandate for RSBOs, but their roles and responsibilities need to construc-tively complement regular development planning processes and the administration hi-erarchy. Both ‘expert’ and local knowledge need to be combined in problem identifica-tion & analysis, but either agencies or local organizations probably need to take a lead-ership role. Program and project planning is an area for RSBO leadership, but an over-all sub-basin management plan is needed to provide goals, objectives, priorities, and resource allocation. RSBOs need to clarify their roles in terms of project implementa-tion and any regulation functions. Conditions in the Ping Basin argue for a strong RSBO role in monitoring & learning. Access to sources of authority will depend on a common sense of ownership.
• Representation: core membership, constituencies & selection processes. Particular at-tention needs to be given to achieving appropriate stakeholder balance among sectors, between central & local government, among elements of local governance systems, and between gender groups. The main RSBO ‘assembly’ or decision-making body needs to be of a manageable size, probably in the range of 20-50 representatives, with appropriate working sub-groups, Selection of stakeholder representatives needs to be transparent and participatory, while allowing flexibility for election or consensus proc-esses. Those outside the entourage of an organized interest group also need representa-tion, and mechanisms such as fixed terms are needed to assure all representatives are accountable to their constituents.
• Leadership. While flexibility needs to be maintained, attention needs to be given to the individual leadership qualities and characteristics of potential leaders. Where numerous factions exist, cohesion may be encouraged by election standards higher than a plural-ity of voters. If new selection procedures are established, current leaders should be en-couraged to become candidates.
• Institutional positioning & linkages. RSBOs will need to develop linkages with other organizations at levels above & below the sub-basin in organizational hierarchies, as well as peer-to-peer linkages among organizations at similar levels. The principle of subsidiarity implies more local levels should take the lead in most issues, and raise is-sues they have difficulty addressing to the RSBO. The RSBO should pass issues they cannot resolve to river basin or other higher levels. All levels need sufficient authority

Final Report: Developing Watershed Management Organizations in Pilot Sub-Basins Page 201
and resources to take initiative at their level, and all must be accountable for their ac-tions. Alliances will be needed among local organizations within sub-basins, among sub-basins in the context of river basin level issues and processes, and among local groups with similar concerns in networks that cross sub-basin boundaries. RSBOs should seek partnerships to strengthen their overall operations.
• Legal status. RSBOs should consider the advantages and disadvantages of different op-tions for their official legal status, and there should be flexibility for it to change over time as capacity develops and conditions change.
• Operational components & specialists. While RSBOs should have flexibility to design their own structure, they need to consider at least 3 basic types of components: (a) an RSBO assembly where the full range of stakeholder representatives conducts overall deliberations & decision-making processes; (b) permanent & temporary working groups to lead efforts in program & project planning, data & communications, public participation & awareness, problem identification & analysis, and monitoring & learn-ing; (c) a secretariat to conduct administrative & operational tasks, support working groups, & manage facilities. Location of the secretariat needs careful consideration.
3. An array of five alternative sub-basin organizational models is proposed for consideration,
selection & adaptation by sub-basin working groups & stakeholders (see Figure 3-5):
• Focused government model. Main focus is on helping MoNRE design & implement its programs in a more effective & efficient manner, and coordinate work of its agencies. MoNRE takes a strong leadership role, with RSBO providing assistance.
• Broader government model. Main focus is on improving effectiveness & efficiency of programs within MoNRE, plus coordination with other ministries. Provincial admini-strations partner with MoNRE in coordination & integration of plans, with RSBO as-sisting.
• Central – local partnership model. Main focus is on a partnership between central & local levels, with the RSBO providing more leadership in identifying & analyzing problems, planning monitoring of conditions & impacts, and public awareness. Partici-pating ministries are reaching down to local partners for work within their mandates.
• Local – central partnership model. Main focus is on a local-central partnership with RSBO leading most tasks. Local organizations and civil society groups are reaching up for partnerships with relevant ministries under locally defined mandates.
• Local non-government model. Main focus is on mobilizing non-governmental groups & civil society institutions to formulate, advocate & monitor activities within a locally-defined RSBO mandate.
4. A five phase process is proposed for developing river sub-basin management organizations
(RSBOs) in the context of the Ping River Basin, as summarized in Figure 3-6:
• Getting started. This phase builds on existing organizations & plans in establishing a preliminary sub-basin working group & formulating initial action plans. Emphasis is on articulating goals, objectives, criteria & priorities for selecting action plan compo-nent projects, reviewing & screening existing sub-basin plans, linking with TAO & provincial plans, & selecting priority ‘demonstration’ activities & local studies.
• Establishing long-term organization and process. This phase centers on participatory review of experience with planning processes at sub-basin and other relevant levels, and selection and localization of an initial organizational model for a long-term RSBO. Views should also be solicited about directions in which the RSBO should evolve.
• Launching implementation in a River Basin Management framework. This phase moves into ‘multi-tasking’ mode, wherein activities under the initial action plan begin

Page 202 Participatory Watershed Management for the Ping River Basin Project
implementation, and monitoring systems begin to be established and activated. At the same time, a broader RSBO Management Plan (see Figure 3-9) is outlined, which in-cludes strategies for monitoring, information, partnerships, capacity building & fund-ing. Initial implementation of the capacity building strategy also begins, in parallel with efforts at the Ping River Basin level to build support capacities in terms of a knowledge center, mobile technical support teams, and data & analytical systems.
• Strengthening long-term management planning & learning processes. This phase moves to a multi-year approach, with emphasis on broadening and deepening under-standing and consensus in the sub-basin. RSBO structures, plans and processes are fur-ther refined, based on careful consideration of various views, and emphasis on learning from experience with actual implementation activities. To help stimulate these consid-erations, a number of questions are suggested in section III.D.4. An annual review process would become part of a long-term continuous learning cycle of problem identi-fication, analysis, planning, monitoring, and outcome & impact assessment. This proc-ess should be participatory, inclusive, transparent, accessible, and both downwardly and upwardly accountable.
• Maintaining long-term organizational relevance, vitality & performance. The final open-ended phase takes well-functioning RSBOs into long-term operation & mainte-nance mode. In addition to annual learning & adjustment cycles, a second perhaps 5 to 6 year cycle is added to focus on longer-term changing conditions, & on assessments of RSBO performance & stakeholder satisfaction, including needs for programs & op-erations, and ways to improve structures & functions to respond to those needs.
5. Suggestions about factors that are likely to influence the time frame required to implement
this five phase process of RSBO development can be found in section III.D.6.

Final Report: Developing Watershed Management Organizations in Pilot Sub-Basins Page 243
Summary of Suggestions and Recommendations in Part IV:
1. Spatial assessments of local sub-watershed configurations conducted in combination with natural resource, demographic & other data can help anticipate & understand organiza-tional issues within sub-basins, as discussed in section IV.B.1., including needs for col-laboration in defining official sub-basin boundaries, and for maintaining ‘space’ for local communities & networks to take the lead in defining the most ‘appropriate’ units for sub-watershed level management within sub-basins.
2. Suggestions regarding local facilitator training materials include:
• Communications skills module. It would have been interesting if these presentations could be complemented by views, approaches, & techniques employed by people more on the activist community organizer side of the spectrum. This might add some useful techniques or tools, & a more complete view of paradigms used by different stake-holder groups. While these skills are useful for facilitators & local leaders, earlier sug-gestions included emphasis on how to facilitate participation, dialogue, trade-off analy-sis, & negotiations, including use of systematically acquired data & information.
• Natural resources module. (a) In the natural resources processes & management sub-module, distinctions between agricultural & forest ecosystems should allow for land-scapes intermediate between the two (or have mixtures of both) – as found in most Ping River sub-basins. (b) Focus of the community participation module is on conser-vation, but the issues & principles have wider relevance. (c) The management tools sub-module appears to provide the main introduction into planning processes of the project. Earlier concerns & recommendations (appendix b) were largely addressed.
• Mountain minorities module. It is good that IMPECT provided help with this module, as they can articulate points of view quite different from government agencies or aca-demic institutions. Materials like these can help improve discussion of issues related to mountain minority communities, & they should be further developed & expanded for future use in all sub-basins where these stakeholder groups are important. It is a good to have strategic network organizations like this participate in basin management ac-tivities, & such strategic partner relationships should further expand in the future.
• Health module. While this module should be commended for an approach that began with assessment of health data in pilot sub-basins, it would by good to see more spe-cific information on how sub-basin management might help address issues like diar-rheal diseases, as well as intestinal parasite infestations that are significant in at least many mountain communities. Since use of pesticides was stressed as an issue, it would be useful to have an explanation why associated reported illness was very low, and somewhat in contrast to village reports (Figure 2-45).
• Pollution module. Sub-module materials are quite informative, but other than agricul-tural pollution, they are very brief with no information about how & where further in-formation or details can be accessed. The agricultural pollution sub-module includes an interesting introduction to herbal alternatives to pesticides that should be further devel-oped. Earlier recommendations regarding these modules are in appendix b.
• Local knowledge & local organization module. This useful module was added by drawing in a well-known researcher on local knowledge, who provided materials from published sources. This helped address earlier suggestions that more on local knowl-edge & experience could help balance emphasis on theoretical “scientific” knowledge, and provide information useful in ‘front line’ discussions, & often debate, about rela-tionships between theoretical ‘scientific’ knowledge & local knowledge & experience.

Page 244 Participatory Watershed Management for the Ping River Basin Project
3. Packaging and development of training materials for technical toolkits should consider:
• Earlier suggestions on the soil and water handbook that are not yet addressed include a need to assess and address why especially soil conservation types of practices have seen so little adoption despite many years of extension efforts, as well as specific ex-ample of sites where they are working well.
• Since training materials on water, community & industrial pollution are very brief, they might be developed into brief brochures or “information sheets”. But they still need in-formation about where interested people or groups can find additional information. Lists of titles of laws, or paragraphs on prevention or mitigation methods are of little use without information about where to access further details. Each prevention or miti-gation measure could be the topic of individual extension-type brochures or booklets.
• Training materials on natural resources and agricultural pollution have more details and illustrations, and could be further developed into booklets. But again, recom-mended reading and sources of additional information need to be provided.
• Appropriate existing publications from beyond the project, such as those on local knowledge, should be included in toolkits. Another example would be Green Word Foundation publications on methods and tools for ‘stream detectives’, which could also be included in awareness & education toolkits. Many other examples are likely to exist, but there are no known central collections of these types of materials.
4. Development of training materials for organizational toolkits should consider:
• Project materials that may fit in this category include natural resource sub-modules on community participation and ‘management tools’ (i.e. plans, rules and organization), contents of the communications skills module (which should be expanded to include more points of view), and the mountain minorities module (which should be further re-fined and expanded). It could also include the local organization component of Dr. Pornchai’s local knowledge and organization module, and associated publications.
• Areas apparently missing at this point include information on expenditure processes, credit & savings funds, and evaluation of intervention results & disclosure. Resource persons who assisted working group discussions on criteria and indicators might be a potential source of materials related to evaluation of intervention results & disclosure.
• Given the many recent initiatives employing revolving funds, there should be materials available from various sources. Recent materials on conflict management should also be available from other sources for inclusion or suggested as further reading.
5. Packaging & development of materials for awareness & education toolkits should consider:
• Materials for distribution at activities such as village fairs should be more in the form of attractive brochures or ‘information sheets’ that include sections on where & how to get more information, as well as items like posters, shirts, etc., that feature specific concepts, points, slogans, etc. Dr. Pornchai’s annotated artistic renderings of land-scapes, & the DLD video CD are examples of potentially attractive formats.
• While some of these types of materials could be useful for capturing attention in schools, health centers, etc., these venues are also likely to need more detailed informa-tion in a style appropriate for students or non-specialist audiences. One example of technical materials already employed at various Ping Basin schools is the ‘stream de-tectives’ package of handbooks and materials published by Green World Foundation.
• Materials for community radio networks are more specialized, & might include lists of local persons knowledgeable & articulate on sub-basin management efforts & issues. Interviews with such people could be conducted & packaged in a logical sequence.

Final Report: Developing Watershed Management Organizations in Pilot Sub-Basins Page 245
6. It may be useful to reflect on what is NOT included in training materials cum ‘toolkits’ at this point. In addition to the items noted above, a few examples include:
• Information on more fully developed long-term participatory river basin management processes (as opposed to watershed management & project compilations), as in Part III.
• Materials on building widespread consensus among stakeholders in river basins or sub-basins regarding the content and approaches of a holistic long-term management plan.
• Materials with more breadth and depth of discussion about livelihood development and livelihood alternatives that could be realistic viable options for sub-basin stakeholders.
• Information on more dimensions of urban environmental quality, including many cul-tural & quality of life dimensions championed in the earlier study by CMU [2004].
• Information that addresses flood plain, riverbank, stream channel and canal issues, in-cluding impacts of encroachment, infrastructure, and engineering modifications.
• Information on more aspects of and approaches for improving water use efficiency by the range of types of stakeholders present in sub-basins.
• Materials that introduce concepts like alternative future scenarios, which can help sub-basin stakeholders think about & visualize trajectories for future development.
• Materials to explain & explore trade-offs among livelihood & environmental objec-tives, distribution of costs & benefits among stakeholders, & compensating measures.
• Information related to incentives for more environmentally-friendly behavior, includ-ing but not limited to economic and regulatory incentives.
• All toolkit materials need to place high priority on providing suggestions for further reading & contacts where people can gain access to further information, and on how information needs relate to recommendations on development of a “knowledge center”.
7. Although final action plans for pilot sub-basins were not yet available for this report, some
suggestions regarding their general content are based on preliminary information:
• A relatively wide range of basic problems have been identified, and to varying extents included in vision statements. While there is at least a degree of follow through in goal and objective statements, there appears to be a progressive narrowing at each level that draws conceptual boundaries closer to key patron government agency domains. It may be worth reconsidering this issue after a period of experience with implementation.
• Much ‘lumpiness’ in preliminary allocations among tambons is due to a few large pro-jects for water treatment facilities, solid waste disposal facilities, & even slaughter-house facilities. Whether such items are seen as appropriate, and the priority assigned to them are decisions for sub-basin working groups, but the logic underlying such deci-sions should be clearly stated. Further scrutiny may be needed for unusual lumpiness, or where allocations are equal across tambons. Transparency & accountability are key.
• Inclusion of study or exploratory activities in areas of the action plan where they are appropriate & justifiable (especially regarding livelihoods) are strongly recommended.
• As general trends in the public policy arena suggest funding levels may be less than promised, justification, priority setting, transparency & accountability are crucial.
8. Sub-basin monitoring & information plans should consider:
• Although agencies & local governments have their own regulations & mandates for monitoring project inputs & outputs, sub-basin organizations should at least collaborate in monitoring inputs & outputs of projects in sub-basin plans. There will need to be mutual understanding & arrangements about how such activities will be conducted.

Page 246 Participatory Watershed Management for the Ping River Basin Project
• Final action plan project & activity lists can be tagged and re-sorted according to their monitoring needs. This can help identify the scope of, & potential complementarities within monitoring activities, and facilitate formulation of the most efficient and effec-tive monitoring program & arrangements possible. For a more holistic monitoring & information strategy, monitoring needs could be combined with information required for goal & objective level criteria & indicators into a package of information require-ments that could be assessed in terms of sources within and outside the sub-basin.
9. Sub-basin capacity building & partnership plans should consider:
• Since numerous capacity building components will likely be embedded in action plans, they should be brought together into an overall capacity building plan. Final project lists can be tagged & resorted according to their training needs & sources. This could help identify the scope of, and potential complementarities among training activities, and formulation of the most efficient and effective training programs & arrangements possible. It will be especially useful in organizing, negotiating & scheduling assistance from particular sources, and systematic identification of gaps and additional needs.
• If RSBO operational capacity building needs have been integrated into projects, ar-rangements required to meet these needs can also be part of the above process. If they are not yet included or emerge later, the capacity building strategy needs to include re-sponsibilities for obtaining appropriate assistance. International experience indicates capacity building is a long-term need that will change & evolve over time.
• Since awareness is fairly high & local specialists are present in most sub-basins, train-ing activities should emphasize practical methods & tools to support local efforts to identify, develop, plan, implement & monitor specific problem-solving activities. Em-phasis should also be given to developing, refining, managing, & adapting participa-tory processes at both the sub-basin & more local levels. While support will require ac-cess to information, tools, & relatively conventional training, needs for mentoring processes are also likely.
• Thus, beyond project toolkit information packages, more interactive & tailored support will be needed, including mentoring processes and interactive assistance that can foster independent local analysis & creativity drawing on both local & outside information.
• Especially regarding relationships between livelihood development and environmental issues, efforts need to foster local entrepreneurship that can identify and realize viable and creative responses to changing opportunities and constraints.
• As sub-basins interact more with each other, and with other levels, more interests, needs, and opportunities are likely to emerge. Thus, they should consider how to best develop vertical and horizontal partnership linkages with other organizations and insti-tutions. A partnership strategy can begin with facilitating networks & interactions within sub-basins, and that experience can help in developing partnership linkages with other sub-basins and organizations beyond their sub-basin. Two-way interaction can help build local capacity, mobilize expertise & other types of support, and provide lo-cal experience to assist others.
10. Additional suggestions based on project experience include:
• Future projects related to river basin or sub-basin (or local sub-watershed) management should accept that they will not start with a “clean slate”, so that project design cannot use only linear logical processes based on theoretical considerations. Local participa-tion needs to be included at all levels of program and project development, even in-cluding processes like sub-basin delineation. Currently existing plans – despite what-ever flaws they may have – must become one of the initial building blocks upon which projects can seek to add value and further development. Local initiatives (some of which were agency induced) already taking place within sub-basins are of key impor-

Final Report: Developing Watershed Management Organizations in Pilot Sub-Basins Page 247
tance, and these groups, networks, and local government initiatives are essential build-ing block components of sub-basin organization. The sub-basin level has demonstrated its great potential for becoming a key venue for developing the interface between top-down and bottom-up processes, but this process must become much more interactive if it is to be truly effective and viable.
• There is important variation among sub-basins in biophysical, economic, ethnic, & other characteristics. Configurations of sub-basin issues & stakeholders are closely re-lated to these characteristics. Diversity in social & cultural dimensions is also reflected in the types & levels of local organization available as building blocks for sub-basin organization. Ping Basin programs should learn from this experience to better antici-pate sub-basin needs in designing & building RSBO support services & facilities.
• This project & international experience confirm that development of truly collaborative processes requires consistency & persistence, and thus takes time. While project delays made some original goals unachievable, even time horizons in the approval document were too short to achieve fully tested & functional organizations & fully articulated collaborative sub-basin management plans. At least 2 to 3 years (usually more) are needed even in societies where strong local communities have high capacities
• Further Ping Basin efforts must move beyond the stage of yet another round of plan-ning without implementation (“plan-ning”). Further learning needs to be much more experience-based and empirical, in order to maintain and expand interest and participa-tion, further build consensus, and begin putting into place, testing and refining remain-ing components of a river sub-basin management system that are not yet fully estab-lished and functional. Efforts need to do the best they can to build on existing local ini-tiatives and planning process, and then move on to further development and refinement in the context of the next stages of RSBO development. We can now see more clearly how unfinished sub-basin management processes are after the first two phases of the development process. Even further refinements of operational mandates for RSBOs need more experience derived from actual implementation, along with feedback on real-world impacts and changing conditions provided by an effective monitoring sys-tem, in the context of increasingly participatory learning processes to guide further re-finement and adaptation. Without continuing support – which changes its nature as processes continue to build and evolve – sub-basin management organizations stand little chance of achieving the lofty goals that have been set for them by stakeholders at local, national, and even international levels.
• Initiatives and support are most effective and efficient when they are coordinated and various components are appropriately timed.
11. Suggestions and comments related to financing mechanisms include:
• A financing strategy is an important and often fairly complex component of a full-scale long-term river sub-basin management plan. International experience suggests long term organizational viability and sustainability are enhanced by a mix of funding sup-port from central and local sources.
• Issues related to financing mechanisms can only be assessed, explored, and negotiated after detailed plans, projects and activities are developed to the point that an initial funding needs assessment can be conducted. This underscores the need to focus on sub-basin plans as the beginning of the process and not as an end product delivered at the last moment. Once plans become available, they could be flagged and sorted by categories that would reflect different potential types of funding sources.
• High-profile promises by government leaders of massive central government funding for Ping Basin programs diverted discussion from truly local funding sources into dis-cussions of channels through which central funds could flow to local levels.

Page 248 Participatory Watershed Management for the Ping River Basin Project
• Local funding sources that do not originate from central sources might include funds derived from local taxes, license fees, fines or user fees, cost recovery mechanisms, or revenue from income generating activities.
o Since only government units are authorized to levy taxes, license fees, or fines, it would only be possible to mobilize such sources in collaboration with local gov-ernments. Revenues from designated types of violations or taxes might go into a community fund earmarked for certain types of activities managed by the RSBO.
o Cost recovery through user fees may be an option for operational funds associated with centrally-funded investments in facilities like reliable water supply, wastewa-ter treatment, trash disposal, or similar types of projects in sub-basin action plans.
• Existing community savings & credit funds are primarily intended & used for producer credit purposes. The logical use for such funds appears to be for micro-investments in livelihood activities, or perhaps education or skill upgrading with real prospects for generating additional income that could be used to repay savings or revolving funds.
• For RSBO operational budgets (as opposed to budgets for projects under action plans), working groups & sub-basin leaders are clearly still expecting central funding support. No other viable options appear to be immediately available at this point. In any event, central support will remain important, and its long-term consistency has been shown to be more important overall than the magnitude of support during any particular period.
• In other countries, supplementary funding for either operations or projects from private business or private or parastatal non-profit sources can also be important, as can dona-tions from private, public or membership sources. Some even establish separate units for managing income producing services and facilities, such as power generation or water supply or treatment, which sometimes help subsidize operations and projects that benefit the general public or disadvantaged groups.
• Many of these issues are complex and require careful consideration, and often exten-sive negotiations and consensus building. They cannot be established in a 3 to 4 month period. Thus, exploration and development of a full sub-basin financing strategy ap-pears to remain beyond the scope of this current project.
12. Final action plans for pilot sub-basins under this project should be compared with sub-
basin plans developed under previous planning efforts led by DNP and DWR. This can help assess how much conditions, processes and actors under this project have affected “bottom line“ views about what should be done at this point. This report seeks to help fa-cilitate his process by providing some baseline summaries of those plans, and an example assessment of preliminary proposals for the Ping Part 1 sub-basin. (see section III.C.2.)

Final Report: Developing Watershed Management Organizations in Pilot Sub-Basins Page 257
Summary of Suggestions and Recommendations in Part V:
1. A general framework for expansion of support for development of river sub-basin organi-zations (RSBOs) throughout the Ping Basin should include at least four important themes:
• Minimum imposed uniformity. This is needed to provide ‘space’ for adaptation and ac-ceptance of differences among localities in circumstances, perceptions, needs and ini-tiatives.
• Focus on processes enabling effective localization can help bring coherence to these ef-forts, as in the five phases of RSBO development found in Part III of this report.
• Accepting current plans as a starting point. This can help efforts move beyond “plan-ning” into the next phases of more experience-based and empirical learning processes.
• Interactive support for gradually improving organizations, plans, and implementation needs a paradigm shift to RSBOs that are continuously making incremental improve-ments based on learning from experience, growing local and science-based knowledge, broader and deeper participation, and growing consensus.
2. An orientation toward processes & empirical learning can help guide efforts to disentangle
and address complex issues such as:
• Mandates. Since problem identification is now broader than action projects, experi-mental learning & partnerships can help explore ways to address remaining problems..
• Roles. Careful experimentation can help further refine views about implementation, leadership, representation, other stakeholder roles, linkages, partnerships & alliances.
• Plans. Planning processes need to include annual progress reviews, rolling plans, and public access to information, combined with effective monitoring systems.
• Funding. More modest levels than anticipated in initial plans may provide incentives for creativity in mobilizing different types of central, local or non-governmental funds.
3. Since balanced and effective monitoring systems are critically important for transparent
evidence-based learning, they need to include:
• Review of available and potential biophysical criteria, indicators & measures of envi-ronmental quality, establishment of strong baseline data on current conditions, & more systematic monitoring of change in those conditions. This can help address poor under-standing of how conditions are (or are not) changing, and often misdirected & unneces-sarily divisive debate about both trends & causation underlying perceived problems.
• Much more emphasis on direct involvement of local communities in monitoring proc-esses, in order to (a) build understanding & trust in monitoring information; (b) expand types of information used in analysis, interpretations, comparisons & cross-checks; and (c) build credibility that can help facilitate negotiation & conflict management.
• Efforts to seek a complementary balance among monitoring techniques, including ap-propriate levels of interaction & collaboration, in order to foster synergies & consensus building. Information access & transparency will be critical for these efforts.
4. Urgent efforts should be made to establish a Ping River Basin Knowledge & Support Cen-
ter at the river basin level, with three types of services to support sub-basin level work:
• Information center. Services would include (a) a library & clearinghouse for access to relevant training & extension materials & publications in a variety of forms; (2) a con-tact center to link groups, organizations, agencies & resource persons who can provide

Page 258 Participatory Watershed Management for the Ping River Basin Project
or exchange information on experience & tools; (3) a center for developing forms of materials appropriate for the range of stakeholders; (4) a center for coordinating trans-lation & adaptation of information for international exchange & minority languages.
• Responsive technical support teams. Services would focus on helping guide & mentor RSBO-related groups, especially on topics where systematic on-site assistance is diffi-cult to obtain. Topics might include technical & operational issues & processes, repre-sentation, accountability, stakeholder interaction & negotiations, building consensus, improving equity & participation, using monitoring data in learning processes, manag-ing information to provide wide access, transparency, & public education, etc..
• RBO data & analytical support system. Services would focus on sophisticated tools to support RBO & RSBO programs & activities, such as spatial information systems, ana-lytical modeling, instrumented monitoring, & other types of databases & analytical tools. This would build on ongoing work at CMU, DNP & elsewhere.
The center would depend on partnerships with institutions & groups in the Ping Basin, and serve as a focal point, convenor, & channel for information synthesis & dissemination to complement existing activities and increase their coverage & impact.
5. High level support and an ‘enabling’ policy environment are needed, including coordinated
long-term commitment, support and incentives.
• Clarity & consistency are needed more than high profile temporary promises of mas-sive funding.
• A clear policy statement of long-term commitment to building fully operational & ef-fective RSBOs that would play an important role in helping direct & assess activities according to resource availabilities is needed to reduce uncertainty & as a policy signal to government agencies to continue moving in the directions implied by these efforts.
• ONEP and its provincial counterpart offices are well placed to help coordinate and fa-cilitate support for collaborative processes to expand support of RSBO development.
• A reasonable level of core operating expenses for all five phases of the RSBO devel-opment process is necessary. Funding could be contingent on standard of performance, if assessment processes are transparent and fair.
• Serious attention to incentives for improved quality of RSBO processes & sub-basin management impacts, and for RSBO use in encouraging improved behavior within sub-basins, should be a priority consideration..
6. Given realities of power relationships among stakeholders, mechanisms are needed to as-
sure as much equity & accountability in RSBO development & operations as possible:
• Constructive balanced organizational process monitoring that includes balance between local & outside elements, would help assure stakeholders have adequate & accountable representation, & that distributions of costs & benefits include attention to equity.
• Transparent information. Access to information, & the means by which is derived, is critical for assuring equity & accountability. It is now seen by many groups as a prob-lem.
• Channels for redress of grievances. Efforts should be made to devise suitable channels for redress of legitimate grievances by stakeholders if they are unjustly treated by RSBOs.
• Accountability to constituents. Mechanisms such as fixed terms &/or other measures are needed to help insure that representative are accountable to their constituencies.