i rswb - lm.doe.gov 300502x… · miamisburg closure project ch2mhill rswb osc report final 9:44am...
TRANSCRIPT

I I I I I I I I I I I I I I I I I I ';I
RSWB Removal Action
OSCREPORT Closes PRSs 131-146, 209, 234, 249-254, 327-329, 425, 437-438, 440 Closes slab/soil. for Buildings R, SW, 58, 62, 68, B& T Stacks, and B Building structure/slab/soil
July 2006
Final
Department of Energy Miamisburg Closure Project
CH2MHILL
RSWB OSC Report Final 9:44AM

• CH2MHILL ~-
Mr. Don Pfister, Director Miamisburg Closure Project U. S. Department of Energy 175 Tri-County Parkway Springdale, OH 45246
ATTENTION: Paul Lucas
CH2M HILL Mound, Inc.
1075 Mound Road
P.O. Box 750
Miamisburg, OH 45343-0750
SM0-472/06 August3,2006
SUBJECT: Contract No. DE-AC24-030H20152: Deliverable #36 Building Data Package; Section C.2.1.1 FacilityDemolition; RSWB OSC Report, Final ·
Dear Mr. Pfister:
Attached is the following Final document for your records.
RSWB OSC Report, Final
If you or members of your staff have any questions regarding the document, or if additional support is needed, please contact Dave Rake! at 937-865-4203. ·
Sincerely,
Michael D. Ebben Site Manager
ME/jg
Enclosures
cc: T. Fischer, USEPA, (1) w/attachments B. Nickel, OEPA, (1) w/attachments S. Helmer, ODH, (1) w/attachments J. Crombie, ODH, (1) w/attachments M. Wojciechowski, Tetra Tech, (1) w/attach G. Gorsuch, DOE/MCP, (1) w/attachments R. Tormey, DOE/OH, (1) w/attachments G. Desai, DOE/HQ, (1) w/attachments C. Kline, CH2M Hill, (1) w/attachments Public Reading Room (1) w/attachments Admin Records, CH2M Hill, (2) w/attachs
ER Recqrds, CH2M Hill, (1) w/attachs DCC (1) w/attachments . M. Ebben, CH2M Hill, w/o attachments K. Armstrong; CH2M Hill, w/o attachments D. Rake!, CH2M Hill, w/o attachments D. Kramer, CH2M Hill, w/o attachments J. Fontaine, CH2M Hill, w/o attachments S. Barr, CH2M Hill, w/o attachments S. Brindle, CH2M Hill, w/o attachments file, CH2M Hill, w/o attachments

I s;d~ ·sa ·.;a~ d~~~~i·s~~d- ;i~ E s;d~ -~i~ri •• Memo (final, April 2000). :
· Bldg 62 is considered part of Bldg SW. '
I, S 234 (EG-6 tank) is listed in RISW AM, bu(
as previously NFA on 8123/96; the remaining· , oil in the vicinity will be verified via the SUD. :
Bldg 58 & Bldg+slabs of B, R, SW, 68, 62, B & T Stacks PRSs 131, 132, 133, 134, 135, 136, 137, 138, 139, 140, 141, 142, 143 (EG-1 tank), 144, 145, 146, 209, 234 (EG-6 tank), 249, 250, 251, 252, 253, 254, 327, 328, & 329.
: Some PRSs are listed in multiple work plans ;
Includes work planning & verification of parts of PRS 425, 437, & 438
• because the work was performed in phases •
It· .......................... ' Authorization
II Action Me:~~ Action Me:~
II 4'-~'f~ii-. . . .. .. . . 0~~~~ .1. ..... .
A 'I-' . Authfor B Bldg'"' A. . ~l:pv B Bid :stab & Soil, & PRS\r· UGL. uth tor PRSs 425.
I g , 252 (Stack) only , • 437, & 438 only. : L... -----·AM includes oth~r; ·AM includes other;
• activities. actiVIttes.
Planning & Execution
Includes Bldgs R, SW, 62', & 58.
Addendum 1 T east/west Stacks (PRSs 253&254)
:Includes PRSs 131,132,133,134,135,136,: Action Memo~ ·137, 138, 139, 140, 141, 142, 143 (EG-1 tank),• .,e1-:144, 145, 146, 209, 234 (EG-6 tank), 249, 25o.: .8VV : 251' 327, 328, & 329. : • • • . ~ .....
: Includes Bldgs R, SW, 62 & sa· slabs. ; r" ffJsw /58 '--: Includes conatminated soils below Bldgs. R, : -B ·ld & 68 • SW 58 68 & 62 • gs, • ·- · • • • • • • ••• ·: ·: • • • • • • • • • • •• Slab AM
l . .I.. I
:slabs·. : soils& : ', PRSs ,'
Work~~
.. :I: ...
II
II ,' See the UGL you ·,
IPre-Ex SUD
SUs1·!~~ Work Plar\I"'Y
"o~i! r-
)ncludes soil bel~w • T Stacks (PRSs ; ',. 253 and 254) :
Work~~;t. ~""V
~ \)i B Stack Superstructure
~~v (I~~ Bldg R
Superstructure
.... J. ...
I• : are ~=~e~i~~ ~ork :
~ : verification : • documentation for :
Bidgs R, SW, 68, 58 slabs, bgs
structures & soil
II II
' PRS440 L------4 ~-------·-·····-~- .......... .
, Includes slabs & bgs structures • & soil for Bldgs R, SW, 68, 58, B, & B : : stack Includes PRSs 131, 132, 133, ; :134, 135, 136, 137, 138, 139, 140, 141,; ' 142, 144, 145, 146, 209, 234•, 249, ' ·250, 251, 252 (B Stack), 327, 328, 329,. •• 425, & 437, & a portion of PRS 438. :
.· ... -........ : ........... .. Partially or
·-· ...... ·
fre-Ex SUD
Work PI~~$. :4v-~
't!J~'f ~ ~-~Stacks
Slab/Soil
. · i--sia·ri ;.~~tis ·. included in the R,
:Structure& only.
T ,'inc! PRS 142.'· ', 144, 145, 146 : . .
~ ...... -
lw~~~~~~ (;~~~gR
r--- Breezeway
II ' completely removed : :before or during Sate; , Shutdown: PRSs , ' 132-142, 144-146, : ••• 209, 327-329 • :
: SW, 58, 68, and B .' • .soils Post-Ex SUD·
Post-Ex~i Post-Ex-,/ •••••• Post-Ex
su~~ s~~{ ~~~~u • .t,~ Work PI<!~ 'f..
~'\>~. ~
II
II
II
II
I I I
You
Are Here
113july06 kma
<j.\~ r- ~;!J App Ill "s~s 9-10 only ~~Us 1-8 & I SU 14 I acks East (B Bldg Soil) 11·13 only 1 Slab/Sot!
I Post Ex exceprt closes T east stack slab/soil
.......... : PRS 234 (EG~i. ~ ', NFA Rec Pg .'
incorp by reference: ____; UGL V Data Report
• • • • • • • • • • (part of 438 & 440)
;PRS 143(EG-1) ', •••••.••••••• ·• BUSTR letter .~ . .
I Data Report
OSC Report
RSWB ).i,. ··-~·-·······
:~'ft closes PRSs • •• ,.0'131-146, 209, 234, 249-254, :
\V ••• :~7 ~2_9: 42_5: ~:7.:3_8: ~0 •• .......... L ........ .
'-:' closes Bldg B structure/slab/soil • • ' & slab/soil for B&T stacks '
& Bldgs RSW/58162/68
I
Completion
OSC Report
Structu r.e~1'" gv"'
~~ ;CT Stacks &
B Stack
j.~ldgSW Superstructure
.... ·. ~ .... • • incl Bldg 62, • •
; SW exhaust stack, •• ·.PRSs 134, 140, 141,.' •• 1.~2, ~~9. ~ _2_59. '
OSC Report OSC Report
Structure-~ Structure it ~,.., s~
~~'f; ~-.. ~~ ~ o">"'~
f.:,O Bldg R ~ J Bldg SW
Work PI?.~
g<v'V ~
~ CBidg 58 Superstructure
... J •••••
,' inc! PRS 251 HEFS stack
OSC Repor
structuV
r.-f'V t'.o'ffl ~-
Bldg 58
I.__ _____ No !Rss ane closed via the! four ______ __,
Structure OSC Reports.

I I I I I I I I I I I I I I I I I I I
TABLE OF CONTENTS
Section Page
RECOMMENDATION ..................................................................................................... iii
1 .0 SUMMARY OF EVENTS ...................................................................................... 1 1.1 Site Conditions and Background ................................................................ 1 1.2 Organization of the Removal Actions ................................................ : ........ 2 1.3 Objectives .................................................................................................. 3 1.4 Chronological Narrative of the Removal Actions ........................................ 6
2.0 EFFECTIVENESS OF THE REMOVAL ACTIONS ............................................... 6 2.1 Actions Taken by Mound Personnel ........................................................... 6 2.2 Actions Taken by Local, State, and Federal Agencies ............................... 7 2.3 Actions Taken by Subcontractors ............................................................... 7
3.0 DIFFICULTIES ENCOUNTERED ......................................................................... 7 3.1 Items that Affect the Removal Actions ....................................................... 7 3.2 Issues of Intergovernmental Coordination .................................................. 7
4.0 RECOMMENDATIONS ......................................................................................... 7 4.1 Means to Prevent a Recurrence ................................................................. 7
Tables Table 1: PRSs Closed with this OSC Report ........................................................... 1 Table 2: Organization of the Removal Action ........................................................... 3 Table 3: Materials and Disposition ........................................................................... 3 Table 4: Removal Cost. ............................................................................................ 3 Table 5: Soil Cleanup Objectives ............................................................................. 4 Table 6: Chronology of RA ....................................................................................... 6
Attachment A Attachment B Attachment C Attachment D Attachment E
RSWB Report Final
Data Report General Media Information Post-Ex SUD Excerpts Backfill Packages BUSTR Letter & PRS 234 Recommendation Page
of iii
Attachments
July 2006

CERCLA co coc cy DOE Ex HS MCL MCP OEPA osc pCi/g PRP PRS" RA RBGV ROD SUD UCL USEPA VSAP
TABLE OF CONTENTS (continued)
Acronyms
Comprehensive Environmental Response, Compensation, and Liability Act cleanup objective contaminant of concern cubic yards Department of Energy Excavation hot spot maximum contaminant level Miamisburg Closure Project Ohio Environmental Protection Agency On-Scene Coordinator picoCuries per gram Potentially Responsible Parties Potential Release Site Removal Action Risk-Based Guideline Value Record of Decision Survey Unit Design upper confidence limit United States Environmental Protection Agency Verification Sampling and Analysis Plan
RSWB OSC Report Final
ii of iii July 2006
I I I I I I I I I I I I I I I I I I I

rnnllt:I.Oit $t!4iitili.U
Jui·Z0-2006 1Z:Z6pm From- T-998 P.OOZ/002
I I I I I I I I I I I I I I I I I I
RECOMMENDATION: RSWB Closes PRSs 1~1-146, 209, 234, 249·254, 327-329, 425, -437·438, 440
Closes stab/soli for Buildings R. sw. 58, 82. 68, B&T ~teck&, and B Building structura/alablsoll
The RSWB Removal Action (RA) was authorized via th9 RJSW/58 Buildings and 68 Slab Action Memo, (Action Memorandum E!:ICA) and the e Building Action Memo, Final, March 2002. The RSWB RA wes performed as a resLJit of historical knowledge and processes, and radiological surveys which .showed elevated levels of multiple isotopes. All below grade structures were removed prior to vsrification.
Verification sampling was performed per the associated Action Memo, the Standard VSAP. Soils Verification Sampling & Analysis Plan [VSAPJ, Fim~l. August 2.004, and the Post-Excavation SUDs to demonstrate that the remaining soiJJT',eets the cleanup criteria. This removal action was successfully completed and resulted in the e)(cavatlon and disposal of approXimately 56,287 cubic yards o{ sol1/debrt$ below grade (for disposal at Envirocare).
The soil cleanup criteria established in the Standard VSAP are satisfied if all verification sample results are below cleanup objectives (COs) or all sample results are below hot spot (HS) criteria and the 95% UCL (upper eonfidence limit) for the area of interest is less than the CO and the data set passes the Sign test
Hard su11aces are evaluated by dlrer;t and swipe measurement results. The hard surfaces cleanup criteria established In the Standard VSAP are satisfied If all results meet the most stringent of the surface free release criteria (average of results less than 100 disintegrations per minute (dpm) per 1 OOcm2 and maxJmum result not greater than 300 dpm/100 cm2
). The hard surfaces claanup criteria also require that If any results are greater than the CO (100 dpm/100 cm2
}, the 95% UCL for the arsa of interest is less than the CO and the data set passes the Sign test.
The co for tritium In sol! is 75,800 pCi/g. A conservative model was developed to account for the potential for tritium in soil to ''leach" to groundwater. The resulting value of 75 pCI/g 15 comparable to·a screening level that represents the actMty of tritium In soli that, If transported via groundwater to the Buried Valley AQuifer (BVA), could result In a maximum contaminant level (MCL) exceedanee. If the 95%. UCL is greater than 75 pCI/g, further evaluation is needed.
Vertfication sampling documents that the self ana nard surfaces cleanup criteria were met. The 95% UCL for tritium is greater than 75 pCi/g. The Core Team agrees that tritium will be further -:~valuated. during the seep monitoring that will be required in the Parcel 6, 7, & 8 Rec:ord of Decision (ROD).
After a thorough review of this On·Scene Coordinator (OSC) Report, the Core Team agrees that the RA associated with RSWB Is complete, ana that all prevlouslll existing environmental 1ss1.1es associated with I\ have been resolved through removal and continued monitoring.
QJ ~ _?/t.f__,__/D_(:. ___ _ Paul Lucas, OSC U.S. Department of Energy, Springdale. Ohio
Brian Nickel, reject Manager ( OEPA, Dayto , Ohio RSWB OSC ~poJt i.!i ~f iii
F-777

I I I I I I I I I I I I I I I I I I I
1.0 SUMMARY OF EVENTS
This section describes the site background and events leading up to the removal action (RA), parties involved in responding to the RA, cleanup objective (CO) determination, chronological narrative of the RA, and resources committed to complete the projects.
1.1 Site Conditions and Background
Background. This OSC Report closes the slab/soil for Buildings R, SW, 58. 62, 68, B&T Stacks, and B Building structure/slab/soil. Potential Release Sites (PRSs) closed via this OSC Report are identified in Table 1 below. These PRSs and building structure/slab/soils identified above are collectively referred to as "RSWB". The structures associated with the PRSs were removed. The previous recommendation page (No Further Assessment) for PRS 234 (see page E2/2) is included herein for completeness.
PRS 131 132 133 134 135 136 137 138 139 140 141 142 143 144 145 146 209 234 249 250 251 252 253 254 327 328 329 425 437 438 440
RSWB OSC Report Final
Table 1: PRSs Closed via this OSC Report
Description SW Building Soils Area 15 Entombed SW Cave (Room SW-1A) SW Building Room 1 B Building SW Drum Storage (Staging) Area Room SW-8, Beta Wastewater Tank (Tank 20) Room SW-125, Beta Wastewater Tank 21 Room SW-143, Beta Wastewater Tank 22 Room SW 137 Alpha Wastewater Sump (Tank 23) Room SW-10, Beta Wastewater Sump (Tank 226) Beta Waste Solidification Facility, SW Tritium Effluent Recovery System (ERS) SW/R Building Solid Radioactive Waste Compactor RISW/T Building Stack Diesel Fuel Storage Tank 117 [assoc. with EG-1] R Building Sanitary Waste Collection Tank Room R-128 Alpha Wastewater Tank R Building Rooms 121, 144, 146, & 148 Entombed Drains Building 62 Stack Deluge Tank Building 58 Diesel Fuel Storage Tank 222 [assoc. with EG-6] SW Building NCPDF Stack SW Building SW1C Stack SW Building HEFS Stack B Building Stack T Building West Stack T Building East Stack R-111 Calorimetry Bath (Tank 255) R-111 Calorimetry Bath {Tank 256) Building 62 Hot Waste Sump (Tank 258) Main Hill Underground Rad Waste Lines Main Hill Underground Rad Waste Lines Main Hill Underground Rad Waste Lines Main Hill Underground Rad Waste Lines
1 of7 July 2006

Removal Action. The RSWB Removal Action (RA) was authorized via the R/SW/58 Buildings and 68 Slab Action Memo, (Action Memorandum EE/CA) and the B Building Action Memo, Final, March 2002. The level of soil radiological contamination present warranted a RA under CERCLA (Comprehensive Environmental Response, Compensation, and Liability Act). All below grade structures were removed prior to verification.
The location of the RSWB Area is shown on Figure 1 of Appendix A (page A7/39).
Verification sampling and analysis were performed in accordance with the Standard VSAP, Soils Verification Sampling & Analysis Plan [VSAP], Final, August 2004; and the Post-Excavation (Ex) Survey Unit Designs (SUDs). Excerpts from the SUDs are included in Appendix C of Attachment A to this On-Scene Coordinator (OSC) Report.
T East Stack (PRS 254) did not require verification based on data provided in the PostEx SUD excerpt (page C71/82). Prior to demolition of T East Stack, Radiological Controls performed an evaluation of the radiological history of the stack and fanhouse and also performed pre-demolition radiological surveys. After demolition, debris pile surveys were performed on the stack and fanhouse debris. The survey results indicated that all debris met the surface release criteria. In-process demolition surveys and, later RASS soil samples for T East Stack revealed no contamination exceeding cleanup objectives (page C79/82). No soil remediation was indicated or performed around the T East Stack. Therefore, no COCs have been identified for T East Stack and verification sampling was not required.
PRS 143 is the underground storage tank (UST) associated with Emergency Generator 1 (EG-1 ). The UST was closed per BUSTR guidance. The State Fire Marshal approval letter of the UST removal is provided on page E1/2. PRS 234 (UST associated with EG-6) was previously binned by the Core Team as requiring No Further Assessment (see page E2/2).
Since the Department of Energy (DOE) is the sol,e responsible party for verification of RSWB, no Potentially Responsible Parties (PRPs) were sought to clean up the site. Monsanto Research Corporation, EG&G Mound Applied Technologies, and BWXT of Ohio, Inc were the operating contractors at the site from 1948 to 30 September 1988, from 1 October 1988 until 30 September 1997, and from 1 October 1997 until 31 December 2002 respectively. CH2M Hill Mound, Inc. became the site contractor for the Miamisburg Closure Project (MCP) effective January 1, 2003.
1.2 Organization of the Removal Actions
Table 2 lists the parties responding to the removal actions, and their responsibilities.
RSWB OSC Report Final
2 of7 July 2006
I I I I I I I I I I I I I I I I I I I

I I I I I I I I I I I I I I I I I I I
Table 2: Organization of the Removal Action
US Environmental Protection Agency (USEPA) Timothy J. Fischer Federal agency responsible for oversight SFR-5J 77 W. Jackson Street Chicago, IL 60604 312-353-2000
Ohio Environmental Protection Agency (OEPA) Brian K. Nickel State agency responsible for oversight 401 E. Fifth Street Dayton, OH 45402-2911 937-285-6357
US Dept. of Energy Paul Lucas On-Scene Coordinator responsible for oversight and Miamisburg Closure Project success 175 Tri-County Parkway Springdale, OH 45246 513-246-0071
CH2M HILL Jim Fontaine Provide OSC with technical assistance, administrative Environmental Restoration Project support, field oversight, sample management, site 1075 Mound Road safety, photo, site documentation, and preparation of Miamisburg, OH 45343-3030 the OSC Report 937-608-8220
1.3 Objectives
Documentation Objective. The objectives of this OSC Report are to describe the RA fieldwork and document successful completion of the project. Material quantities, disposition locations, and project costs are included in Tables 3 and 4.
Table 3: Materials and Disposition
Type of Material Quantity (cy) Disposal Method
Contaminated soil/debris below grade 56,287 Rail transport
Table 4: Removal Cost
Cost Category
Planning/Fieldwork/ Restoration/grading/seeding
Subcontractors (Verification Sampling, Analyses, & Data Validation)
Closure Documentation
Transportation/Disposal of Contaminated Soil
RSWB {below grade) Estimated Total Project Cost
Cost Category
Bldgs. R, SW, B, 58, 62, 68, & T Stacks Estimated Demo Project Cost
RSWB OSC Report Final
3 of7
Disposal Location
Envirocare of Utah
Cost
$3,165,776
$6,473,051
$9,638,827
Cost
$12,307,456
July 2006

Cleanup Objective. Contaminants of Concern (COCs), COs, and hot spot (HS) criteria for RSWB are identified in Table 5. COCs associated with individual areas are identified on page C33/82.
Table 5: Soil Cleanup Objectives (pCi/g)
Analyte Cleanup Objective Hot Spot
Actinium-227+0 4.6 13.61
Americium-241 63 189
Beryllium (mg/kg) 22,500 67,500
Bismuth-207 1.2 3.6
Bismuth-210m 8.3 24.9
Cobalt-60 0.7 2.1
Cesium-137+0 3.8 10.62
Lead-210+0 7.4 19.8
Protactinium-231 +0 4.0 11.81
Plutonium-238 55 165
Plutonium-239/240 62 181
Radium-226+0 2.9 4.7
Thorium-228+0 2.6 4.8
Thorium-229 18.9 56.7
Thorium-230+0 2.8 4.6
Thorium-232+0 2.1 3.5
Tritium 75,800 227,000
Uranium-233/234 4.82 14.5
Uranium-235+0 3.2 44.8
Uranium-238+0 2.2 4.2
Strontium-90 94.72. 282.72
+D: indicates that daughter product activity is included in the CO.
Hard Surfaces Cleanup Objective (dpm/100cm2)
I Pu-238 I average < 100 & maximum < 300
Verification sampling results totaled over 19,000 and confirmed all results are below Hot Spot criteria. Two verification results for Th-230 of 2.87 and 3.88 pCi/g exceeded the CO of 2.8 pCi/g. One verification result for U-238 of 2.5 pCi/g exceeded the CO of 2.2 pCi/g. Four verification results for U-233/234 of 6.7, 6.7, 8.3, and 12.6 pCi/g exceeded
RSWB OSC Report Final
4 of7 July 2006
I I I I I I I I I I I I I I I I I I I

I I I I I I I I I I I I I I I I I I I
the CO of 4.82 pCi/g. Nineteen verification results for Pu-238 ranging from 57.2-162 pCi/g exceeded the CO of 55 pCi/g.
The Bi-214 10·5 Risk-Based Guideline Value (RBGV) based on the most conservative of Construction Worker and Site Employee scenarios is 1.17 pCi/g and is not inclusive of background or daughter product activity. Thirty-two verification results (balded on Table 1, page A 12/39) for Bi-214 ranging from 1.18-1.97 pCi/g exceeded the RBGV of 1.17 pCi/g. The Bi-214m is probably in equilibrium with U-238, but is unproven because the detection limits for the U-238 were not sensitive enough. Bi-214 is a daughter product of U-238 and the CO for U-238 accounts for daughter product activity; therefore, these results are not considered significant and are not evaluated further.
While U-238 was not a COC for all areas sampled, results were requested and reported from the offsite gamma spec analyses. Although a U-238 duplicate result (RSW-761 D) was 2.4 pCi/g, no action was taken because field duplicate results are not used in the statistical analyses and because of the range of uncertainty for this sample.
All other results are below COs.
Cleanup Criteria. The soil cleanup criteria are satisfied if all verification sample results are below CO or all sample results are below hot spot (HS) criteria and the 95% UCL (upper confidence limit) for the area of interest is less than the CO and the data set passes the Sign test.
Hard surfaces are evaluated by direct and swipe measurement results. The hard surfaces cleanup criteria established in the Standard VSAP are satisfied if all results meet the most stringent of the surface free release criteria (average of results less than 100 disintegrations per minute (dpm) per 100cm2 and maximum result not greater than 300 dpm/1 00 cm2
) presented in the Work Plan for Environmental Restoration of the DOE Mound Site, The Mound 2000 Approach, Final, Rev. 0, February 1999 (Attachment A, Table 1 ). The hard surfaces cleanuR criteria also require that if any results are greater than the CO (1 00 dpm/1 00 em ), the 95% UCL for the area of interest is less than the CO and the data set passes the Sign test.
Bi-214 is a daughter product in the U-238 decay chain. Since all U-238 results meet the cleanup criteria, the Bi-214 CO exceedances are not considered significant because the CO for the parent nuclides account for daughter product activity. Therefore, no further action will be taken based on the parent nuclide results.
The CO for tritium in soil is 75,800 pCi/g and there are no results above CO. A conservative model was developed to account for the potential for tritium in soil to "leach" to groundwater. The resulting value of 75 pCi/g is comparable to a screening level that represents the activity of tritium in soil that, if transported via groundwater to the Buried Valley Aquifer (BVA), could result in a maximum contaminant level (MCL) exceedance. If the 95% UCL is greater than 75 pCi/g, further evaluation is needed. The Core Team agreed to evaluate tritium verification data as one statistical unit. The 95% UCL for tritium (see page A 15/39) is greater than 75 pCi/g. The Core Team agreed that additional removal was not practical due to encountering hard surfaces and tritium will
RSWB OSC Report Final ·
5of7 July 2006

be further evaluated during the seep monitoring that will be required in the Parcel 6, 7, & 8 Record of Decision (ROD).
Verification sampling documents that the soil and hard surfaces cleanup criteria were met.
Hot Spot Criteria. The Hot Spot criteria for the COCs are presented in Table 5 above. There were no sample results that exceeded the hot spot criteria for any analyte.
1.4 Chronological Narrative of the Removal Action
Table 6 presents a chronological narrative of events surrounding the RA.
Table 6: Chronology of RA
Timeframe Activity
June 2003 RJSW /58 Buildings and 68 Slab Action Memo finalized
March 2002 B Building AM finalized
November 2004 - Work Plans approved March 2006
February 2006 R Building OSC Report finalized
February 2006 SW Building OSC Report finalized
February 2006 Building 58 Structure OSC Report finalized
December 2004 - RA fieldwork and excavation June 2006
December 2005 - May 2006 Verification sampling & analysis
July 2006 OSC Report prepared
2.0 EFFECTIVENESS OF THE REMOVAL ACTIONS
The RSWB removal action is complete, and the objectives of the Action Memoranda have been met. The limits of verification are identified on Figure 2 (see page A8/39). Results of verification sampling and analysis are provided in Attachment A.
2.1 Actions Taken by Mound Personnel
CH2M Hill Mound, Inc. personnel planned and performed removal action oversight, and performed excavation, monitoring, sampling and analyses, and documentation. The project met the removal action objectives (Section 1.3), as outlined in the Action Memoranda.
RSWB OSC Report Final
6 of7 July 2006
I I I I I I I I I'
I I I I I I I I I I

I I I I I I I I I I I I I I I I I I I
2.2 Actions Taken by Local, State, and Federal Agencies
The DOE/MCP was the lead agency for the RA and provided the funding. DOE, USEPA, and OEPA had oversight responsibility for the RA and review of the Action Memorandum and OSC Report to ensure that the objectives were met.
2.3 Actions Taken by Subcontractors
Subcontractors involved in the project included:
• Envirocare (Clive, Utah) - disposal of radiologically contaminated waste via rail transport.
• Severn Trent Laboratory (St. Louis, MO)- analyzed verification samples.
• SAIC (Dublin, OH)- sample collection, data management, and validation.
• SK Construction (Middletown, OH)- provided backfilling for restoration.
3.0 DIFFICULTIES ENCOUNTERED
3.1 Items that Affect the Removal Actions
No difficulties were encountered during the removal actions.
3.2 Issues of Intergovernmental Coordination
All DOE/OEPA/USEPA interactions were good. The agencies were updated informally on a regular basis, and formally at monthly Core Team meetings. The Mound 2000 Process worked well.
4.0 RECOMMENDATIONS
4.1 Means to Prevent a Recurrence
Soil sampling verified removal of radiological contamination. Mound Removal Actions have regulator approved work plans, each of which has a section that addresses runon/runoff controls. In addition, the site Storm Water Pollution Prevention Plan applies to the entire site and is monitored by the Environmental Compliance and Analytical Services group. As a result of the removal of contamination and the implementation of runon/runoff protection, spread of contamination is prevented. After the removal action and the CERCLA process for the parcel are complete, the area will be transferred from Federal to private ownership. All State and Federal disposal rules will apply.
RSWB OSC Report Final
7of7 July 2006

I I I I I I ATTACHMENT A
I DATA REPORT
I I I I I I I I I I· I I

I I I I I I I I I I I I I I I I I I I
DATA REPORT RSWB {SUs 1-14)
July 2006
Rev.O
Department of Energy
Miamisburg Closure Project
• CH2MHILL ••
08/01/06@ 8:46AM 0:\SHARED\ERIR&SW+\OATA REPORTIRSW DataReport Final.doc

I I I I I I I I I I I I I I I I I I I
Table of Contents
Section Page
1.0 PURPOSE ............................................................................................................ 1
2.0 DOCUMENT ORGANIZATION I SUMMARY ........................................................ 1
3.0 FIELD ACTIVITIES ............................................................................................... 1
4.0 DATA REVIEW I VALIDATION ............................................................................. 2
Figure 1: Location of RSWB Area
Figure 2: PRSs, SUs and Bldgs.
Figure 3: RSWB Sample Locations
Figure 4: Tritium Posting Plot
Table 1: Verification Results
Table 2: SUs and COGs
Table 3: SU5 Bias Metals results
Table 4: Tritium 95% UCL Calculations
Figures
Tables
Appendix A
Appendix 8
Appendix C Data Review & Validation
RSWB Data Report, Rev. 0 i of ii
Figures
Tables
Appendices

BUSTR
coc EG
Ex
mg/kg
pCi/g
PRS
QC
RA
RASS
R&V
su SUD
· UCL
VSAP
Table of Contents
Bureau of Underground Storage Tank Regulations
contaminant of concern
emergency generator
Excavation
milligram per kilogram
picoCuries per gram
Potential Release Site
quality control
removal action
Remedial Action Survey Support
review and validation
Survey Unit
Survey Unit Design
upper confidence limit
Verification Sampling and Analysis Plan
(continued)
Acronyms
RSWB Data Report, Rev. 0 ii of ii July 2006 3/39
I I I I I .I
I I I I I I I I I I I I I

I I I I I I I I I I I I I I I I I I I
1.0 PURPOSE
This Data Report provides documentation of sampling activities conducted in
accordance with the Standard VSAP, Soils Verification Sampling & Analysis Plan
[VSAP], Final, August 2004 and the Post-Excavation (Ex) SuNey Unit Designs (SUDs);
required to close out SuNey Units 1 through 14 (SUs 1-14) of the RSWB removal
action (RA). The RSWB area is shown on Figure 1. The locations of SUs 1-14 (and
associated Potential Release Sites [PRSs] and buildings) are shown on Figure 2.
The purposes of this Data Report are to:
• document any variances to the VSAP/Post-Ex SUDs,
• present statistical and bias data (separately),
• present summary statistics and statistical analyses of the applicable data, including retrospective power cuNe, and
• provide documentation of data review and validation.
2.0 DOCUMENT ORGANIZATION I SUMMARY
Unless otherwise specified as a variance, sampling and analyses were conducted in
accordance with the VSAP and Post-Ex SUDs. Applicable excerpts of the Post-Ex
SUDs are presented in Attachment C to the RSWB On-Scene Coordinator (OSC)
Report.
3.0 FIELD ACTIVITIES
Verification sampling activities occurred between December 2005 and May 2006. The
investigation was conducted in accordance with the VSAP.
Soil verification results are presented in Table 1 and results above cleanup objective
(CO) are balded. A breakdown of Contaminants of Concern (COCs) by SU is shown on
Table 2. Verification and Remedial Action Support SuNey (RASS) sample locations,
hard surface locations, CO exceedances, and result~ ofwalkover suNeys are identified
on Figure 3.
A ~/33 RSWB Data Report, Rev. 0 1 of 2 July 20d6

Per the Post-Ex SUD, one bias location in ·su5 (RSW-778) was analyzed for total
metals with results reported in Table 3. This location was subsequently excavated to a
hard surface but the results document that metals were not present above COs.
Statistical analyses (except for tritium) are presented in the Backfill Packages
(presented in Attachment D to the RSWB OSC Report) to document that the results
above cleanup objective and below hot spot criteria were acceptable. A posting plot for
tritium is provided as Figure 4 and the associated 95% upper confidence limit (UCL)
calculation is shown on Table 4. Results of sampling at hard surface locations are
presented in Attachment D.
Removal of the emergency generator underground storage tank (EG-1 UST) was based
on Bureau of Underground Storage Tank Regulations (BUSTR) guidance. The State
Fire Marshal approval letter requiring no further action is included in Attachment E to
the RSWB OSC Report.
4.0 DATA REVIEW I VALIDATION
All data were reviewed and 10% of offsite data were validated.
Field and laboratory QC (quality control) were assessed as part of the data review and
validation (R&V) process.
Documentation of review and validation (and related variances) is provided in Appendix
C. Review and validation supports that the data are usable.
------=--=---------------------~5/33 RSWB Data Report, Rev. 0 2 of 2 July 2006
I ·I I I I I I I I I I I I I I I I I I

I I I I I I APPENDIX A
I FIGURES
I I I I I I I I I I I I A-h/39

I I I I I I I I I I I I I I I I I I I
Scale in feet
0 200400 600 8001000
Figure 1: Location of RSWB Area

I I I I I I I I I I I I I I I I I
... ·
Note: PRSs 438 and 440 are dosed via the RSWB OSC Report. Verification data· · for thOse portions Of PRSs'438 and 440 within RSWB Area are included in tllfs Data Report. Verification data-for tile·rer:nainder of PRSs 438 and 440 il~~pn;Vided in the UGL Partial V Data Report, PRSs 124;427, 428, & 439, Rev. O,-;June·20o6; which is Attachernent A to the UGL Partial V·O~~ 'Report, E!fl.!iti •. Ju~§'2oo6. . ·
I -• ~ • Site Boundary D Umils of RSWB Verification
· Paved Drives & Parking - PRS Area
D Building • PRS Point I D Historic Building 50 0 50 100 --- ---- -Feet

I I I I
~:. .
I I I I I I I I I I su 2
I I I I I
Tritium Posting Plot Tritium results rounded to the
nearest whole number (pCi/g) for legiblity
Figure 4: Tritium Posting Plot (detailed results in Table 1)
10, I I I I I I . 10 20 30 40 50ft

I I
::I
I I I APPENDIX 8
I TABLES
I I I I I I I I I I I I kf'/39

CD for Table 1
-~·····-~~'-··-- .. , -....

I I I I I I I I I I I I I I I I I I I
su
Ac-227 Am-241 Bi-207 Bi-210m Co-60 Cs-137 Pa-231 Pb-210 Pu-238 Pu-239/240 Ra-226 Th-228 Th-230 Th-232 Tritium Th-229 U-233/234 U-235 U-238
·sr-90 Beryllium
1 2 3 X X X
X X X
X X X
X X X·
X X X
X X X
X X X
X X X
X X X
X X X
X X X
X X X
X X X
X X X
X
Table 2: SUs and COCs
4 5 6 7 8 9 10 11 12 13 14 X X X X X X X X X X X
X X X X X X X X X
X X X X X X X X X
X X X X X X X X X
X X X X X X X X .x X X X X X X X X X
X X X X X X X X X
X X X X X X X X X X X
X X X X X X X X X
X X X X X X X X X
X X X X X X X X X
X X X X X X X X X
X X X X X X X X X
X X X X X 'X X X X
X X
X
X
X
X
X
X X

Table 3: SUS Bias Metals Results (mg/kg)
Location Date Analyte RSW-778A 6/14/06 Mercury RSW-778A 6/14/06 Aluminum RSW-778A 6/14/06 Antimony RSW-778A 6/14/06 Arsenic RSW-778A 6/14/06 Barium RSW-778A 6/14/06 Beryllium RSW-778A 6/14/06 Cadmium RSW-778A 6/14/06 Calcium RSW-778A 6/14/06 Chromium RSW-778A 6/14/06 Cobalt RSW-778A 6/14/06 Copper RSW-778A 6/14/06 Iron RSW-778A 6/14/06 Lead RSW-778A 6/14/06 Magnesium RSW-778A 6/14/06 Manganese RSW-778A 6/14/06 Nickel RSW-778A 6/14/06 Potassium RSW-778A 6/14/06 Selenium RSW-778A 6/14/06 Silver RSW-778A 6/14/06 Sodium RSW-778A 6/14/06 Thallium RSW-778A 6/14/06 Vanadium RSW-778A 6/14/06 Zinc
E: estimated due to interference N: spiked sample recovery outside of control limits U: not detected
co HI Result 63.9 0.036
213000.0 7110 85.2 1.1
28.50 63.9 2 14900.0 11.9
22500.00 421.0 0.41 30000.00 213.0 0.54
(note 1) 217000 319000.0 7.4
12800.0 5 8520.0 7
(note 1) 16900 (note 2) 5.8 (note 11 16000
22800.0 423 112000.00 4260.0 10.7
(note 1) 1590 1060.0 1.6 1060.0 1.1
(note 1) 181 17.0 2.2
1490.0 7.5 63900.0 26.7
DL 0.036
217 1.1 1.1 5.4
0.54 0.54 1360
1.1 5.4 2.7 109 1.1
109 1.1 4.4
5430 1.6 1.1 109 2.2 5.4 5.4
B: less than contract required reporting limit but equal to or greater than instrument detection limit DL: detection limit CO: cleanup objective HI: hazard Index (HI=1) values note 1: essential human nutients note 2: result is below the residential setting value of 400 mg/kg
note: this sample location was subsequently excavated to a hard surface.
Lab Qual u
NE UN
B UN NE
B
NE
NE NE
BN u
UN
u
N
I I I.
I I I I I I I I I I I I I I I
A-IY39 I

I I I I I I I I I I I I I I I I I I I
Data File
Raw Statistics Number of Valid Samples Number of Unique Samples Minimum Maximum Mean Median Standard Deviation Variance Coefficient of Variation Skewness
Gamma Statistics khat k star (bias corrected) Theta hat Theta star nu hat nu star Approx.Chi Square Value (.05) Adjusted Level of Significance Adjusted Chi Square Value
Log-transformed Statistics Minimum of log data Maximum of log data Mean of log data Standard Deviation of log data Variance of log data
RECOMMENDATION
196 181
0.005 895
72.38597 14.65
138.7716 19257.56 1.917107 3.156705
0.37467 0.372336 193.1995
'194.41 02 146.8705 145.9558 119.0295 0.048776 118.8509
-5.29832 6.796824 2.507025 2.290939 5.248403
Data are Non-parametric (0.05)
Use 99% Chebyshev (Mean, Sd) UCL
95% UCL <CO of 75,800 pCi/g >» PASS
Variable: 0.32
Normal Distribu~ion Test Lilliefors Test Statisitic Lilliefors 5% Critical Value Data not normal at 5% significance level
0.30098 0.063286
95% UCL (Assuming Normal Distribution) Student's-t UCL 88.76801
Gamma Distribution Test A-D Test Statistic A-D 5% Critical Value K-S Test Statistic K-S 5% Critical Value Data do not follow gamma distribution at 5% significance level
2.744231 0.85108
0.101848 0.069562
95% UCLs (Assuming Gamma Distribution) Approximate Gamma UCL 88.76076 Adjusted Gamma UCL 88.89418
Lognormal Distribution Test Lilliefors Test Statisitic 0.067738 Lilliefors 5% Critical Value 0.063286 Data not lognormal at 5% significance level
95% UCLs (Assuming Lognormal Distribution) 95% H-UCL 299.8658 95% Chebyshev (MVUE) UCL 365.9627 97.5% Chebyshev (MVUE) UCL 454.4418 99% Chebyshev (MVUE) UCL 628.2418
95% Non-parametric UCLs CLT UCL Adj-CL T UCL (Adjusted for skewness) Mod-t UCL (Adjusted for skewness) Jackknife UCL Standard Bootstrap UCL Bootstrap-t UCL Hall's Bootstrap UCL Percentile Bootstrap UCL BCA Bootstrap UCL 95% Chebyshev (Mean, Sd) UCL 97.5% Chebyshev (Mean, Sd) UCL 99% Chebyshev (Mean, Sd) UCL
88.69018 91.07832 89.14051 88.76801 88.80583 91.12431 91.23599 89.69765 92.18546 115.5925
134.288 171.01171
95% UCL >screening level of 75 pCi/g >» FAIL
Table 4: Tritium 95°/o UCL Calculation

I I I I I I APPENDIX C
I DATA REVIEW & VALIDATION
I I I I I I I I I I I I Af%9

I I I I I Review & Validation (R&V) Report I I I I I I I I I I I I I I
Table of Contents
1.0 INTRODUCTION AND SUMMARY ...................................................................... 1
U INTRODUCTION ........................................................................................ 1
2.0 DATA REVIEW I VALIDATION ............................................................................ 1
2.1 FIELD QA FREQUENCY ........................................................................... 3
2.2
2.3
2.2.1 2.2.2 2.2.3 2.2.4 2.2.5
2.3.1 2.3.2 2.3.3 2.3.4 2.3.5
Equipment Rinsates ............................................................................... 3 Field Duplicates ...................................................................................... 3 Matrix Spikes .......................................................................................... 4 Trip Blanks .............................................................................................. 4
GAMMA SPECTROSCOPY ....................................................................... 4
Laboratory Blanks ................................................................................... 4 Laboratory Duplicates ............................................................................. 4 Laboratory Control Spike ........................................................................ 5 Radionuclide Quantitation ....................................................................... 5 Overall Assessment of Data ................................................................... 5
ISOTOPIC THORIUM ................................................................................ 6 Yields ...................................................................................................... 6 Laboratory Blanks ................................................................................... 6 Laboratory Duplicates ............................................................................. 7 Laboratory Control Spike ........................................................................ 7 Radionuclide Quantitation ....................................................................... 7

2.4
2.5
2.6
2.8
2.9
2.4.1 2.4.2 2.4.3 2.4.4 2A.5 2.4.6
2.5.1 2.5.2 2.5.3 2.5.4 2.5.5
2.7.1 2.7.2 2.7.3 2.7.4 2.7.5
2.8.1 2.8.2 2.8.3 2.8.4 2.8.5
Overall Assessment of Data ................................................................... 8
ISOTOPIC PLUTONIUM ............................................................................ 8 Yields ...................................................................................................... 9 Laboratory Blanks ................................................................................... 9 Laboratory Duplicates ............................................................................. 9 Laboratory Control Spike ........................................................................ 9 Radionuclide Quantitation ..................................................................... 10 Overall Assessment of Data ................................................................. 1 0
ISOTOPIC URANIUM .............................................................................. 10
Yields .................................................................................................... 11 Laboratory Blanks ................................................................................. 11 Laboratory Duplicates ........................................................................... 11 Laboratory Control Spike ...................................................................... 11 Overall Assessment of Data ................................................................. 12
TRITIUM ................................................................................................... 12 Yields .................................................................................................... 12 Laboratory Blanks ................................................................................. 13 Laboratory Duplicates ........................................................................... 13 Laboratory Control Spike ...................................................................... 13 Overall Assessment of Data .................................................................. 13
GROSS BETA .......................................................................................... 14 Yields .................................................................................................... 14 Laboratory Blanks ................................................................................. 14 Laboratory Duplicates ........................................................................... 14 Laboratory Control Spike ...................................................................... 15 Overall Assessment of Data ................................................................. 15
STRONTIUM-90 ....................................................................................... 15 Yields .................................................................................................... 15 Laboratory Blanks ................................................................................. 16 Laboratory Duplicates ........................................................................... 16 Laboratory Control Spike ...................................................................... 16 Overall Assessment of Data ................................................................. 16
TOTAL METALS ...................................................................................... 17 2.9.1 Holding Times ....................................................................................... 17 2.9.2 Initial Calibration ................................................................................... 17 2.9.3 Continuing Calibration .......................................................................... 17 2.9.4 Laboratory Blanks ................................................................................. 18 2.9.5 Laboratory Duplicates ........................................................................... 18 2.9.6 Laboratory Control Spike ...................................................................... 19 2.9.7 Serial Dilution ....................................................................................... 19
REFERENCES ................................................................................................... 19
I I I I I I I I I I I I I I I I I I I

I I Acronyms
I % percent
%0 percent difference
I LCS laboratory control spike
I NAD normalized absolute difference
MB method blank
I MDA minimum detectable activity
I NC non-calculable
pCi/g picoCurie/gram
I PQL project quantitation limit
I PRS potential release site
RPD relative percent difference
I RSD relative standard deviation
SDG sample delivery group
I sow Statement of Work
I VSAP Verification Sampling and Analysis Plan
I I I I I I I /}lr19

1.0 Introduction and Summary
1.1 Introduction
This data assessment has been prepared to describe the data quality for the
RISW /58/68/B soil verification samples. The work was generally performed in
. compliance with the Statement of Work (SOW) issued April 27, 2005; the Mound
Verification Sampling and Analysis Plan (VSAP) dated August, 2004; sample maps and
target parameters issued by CH2M Hill Mound for each sample event; and the Mound
Methods Compendium. Data assessment encompasses two types of quality control
reviews on the data: data review and data validation. Data review involves a review of
the basic quality control data included in the laboratory data package, e.g., laboratory
blanks, surrogate recoveries, matrix spike recoveries, and field duplicates. All (1 00%)
of the data are reviewed. Data validation is a detailed review of the laboratory data
packages that includes all of the data review elements plus verification of such things as
proper instrument calibration, instrument calibration validity during sample analysis,
identification of target analytes, and proper treatment and quantification of the data.
The results of the data validation are assessed to identify whether any systemic
problems are apparent. Suspect values are flagged to assure the validity of the data to
the user. While only 10% of the data is required to be validated, data validation was
performed on 1 00% of the samples. Both data review and validation are combined and
discussed below.
2.0 Data Review I Validation
The quality control data submitted with the analytical data packages were reviewed and
validated. The results of the assessment are presented in this section. The following
qualifications were used to indicate data quality problems identified during the data
validation process.
Page 1 of 19
I I I I I I I I I I I I I I I I I I I

I I I I I I I I I I I I I I I I I I I
Table 1 - Data Validation Qualifications Qualification Qualification Description
= The sample result is positively identified and quantified. J The associated positive sample result is estimated.
J/UJ The associated positive or non-detected sample result is qualified estimated.
UJ The associated not-detected sample result is qualified estimated. u The associated sample result is qualified not detected. R The associated sample result is rejected and unusable.
Reason Codes are used to assign meaning to the qualifiers used. The following are the
reason codes that were applied to this project.
· Table 2- Validation Reason Codes Reason
Code Reason Code Description EO? Serial dilution criteria were not met. F01 Sample data were qualified as a result of the method blank.
Concentration of the contaminant was detected at a level less than the action limit, but greater than the CRQL (contract required
F07 detection limit) Surrogate/radiological chemical recovery was below the lower control
G02 limit. MS/MSD (matrix spike/matrix spike duplicate) recovery was below the
H02 lower control limit. H04 MS/MSD pairs exceed the RPD (relative percent difference) limit.
Duplicate RPD/radiological duplicate error ratio (DER) was outside J01 the control limit.
MDLs (method detection limits) reported by the laboratory exceeded N02 corresponding CRQLs. T04 Professional judgment was used to qualify the data.
Analytical result is less than the associated MDA( minimum T05 detectable activity), but greater than the counting uncertainty.
Analytical result is less than both the associated counting uncertainty T06 and MDA.
Negc;~tive analytical result where the absolute value exceeds 2X the TO? associated MDA. T15 Activity may be biased low due to lack of ingrowth.
Page 2 of 19

This sampling effort is discussed in nine sections: field quality assurance (QA)
frequency, gamma spectroscopy, isotopic plutonium, isotopic thorium, isotopic uranium,
tritium, strontium-90, gross beta, and total metals. The data validation of each of these
is discussed in the following subsections. The validated results immediately follow this
R&V (Review and Validation) Report.
Field QA Frequency
The field team is responsible for introducing or specifying field quality control samples.
The frequency of these samples is discussed below.
2.1.1 Equipment Rinsates
Equipment rinsate samples were not required for this sampling effort. The field team
used a dry decontamination method and equipment along with the dry wipes that were
used during the decontamination process that were scanned in the field to monitor the
decontamination process.
2.1.2 Field Duplicates
Field duplicates demonstrate that the collection technique was adequately precise.
Thirty-nine (39) field duplicates were collected for eight hundred forty-six (846) regular
field samples for a frequency of 4.6%. This approximately meets the planned collection
goal of five percent. The field duplicate samples were evaluated by calculating the
relative percent differences (RPD). Relative percent differences are considered non
calculable for duplicate pairs where one or both results were not detected or less than
2x the MDA. If one result was greater than 2x the MDA and the other result was
detected at less than 2x the MDA, the relative percent difference was calculated. For
three pairs, one analyte was compared; for twenty-nine pairs, twenty-one analytes were
compared; for two pairs, twenty-two analytes were compared; for two pairs, twenty
three analytes were compared; and for three pairs, twenty-four analytes were
compared, making a total of seven hundred seventy-four (774) comparisons. Sixty-four
comparisons (8.3%) exceeded an RPD of 35%. The field collection efforts were
sufficiently precise. No qualification of the data is necessary.
Page 3 of 19
I I I I I I I I I I I I I I I I I I I

I I I I I I I I I I I I I I I I I I I
2.1.3 Matrix Spikes
Matrix spikes (MS) and matrix spike duplicates (MSD) are prepared to verify that the
sample matrix is not interfering with the accurate and precise determination of target
parameters in non-radiological fractions. For each Total Metals batch, an MS and MSD
were analyzed. When an MS or MSD percent recovery exceeded the control limits,
affected sample results were qualified as estimated J/UJ, H02. Seven (7) Total Metals
results were qualified as estimated, J/UJ, H02. When the MS/MSD relative percent
difference exceeded the control limits, the affected sample results were qualified as
estimated, J, H04. Two Total Metals (2) results were qualified J, H04.
2.1.4 Trip Blanks
Trip blanks are included in each shipping container used to transport samples for
volatile analysis. This sampling effort did not include volatile samples. Therefore, trip
blanks were not analyzed.
2. 2 Gamma Spectroscopy
The field team submitted eight hundred forty-six (846) samples for gamma spectroscopy
analysis. The associated quality control result assessments are discussed in the following
subsections.
2.2.1 Laboratory Blanks
Laboratory blanks are used to verify that laboratory handling and procedures are not
cross-contaminating samples with target isotopes. Each sample delivery group (SDG)
had one laboratory blank per analytical run. No gamma spec sample data were
affected by blank contamination.
2.2.2 Laboratory Duplicates
Laboratory duplicates are used to assess the sample analytical precision. The
laboratory duplicate samples were evaluated by calculating the relative percent
differences (RPD). Relative percent differences are considered non-calculable for
duplicate pairs where one or both results were not detected or less than 2x the MDA. If
Page 4 of 19

one result was greater than 2x the MDA and the other result was detected at less than
2x the MDA, the relative percent difference was calculated. The laboratory analyzed
one duplicate pair for each analytical run. One hundred twenty (120) results (0.9% of
gamma spec results) were qualified as estimated, J/UJ, J01, due to laboratory duplicate
exceedances.
2.2.3 Laboratory Control Spike
Laboratory control spikes (LCS) are prepared to verify the sample analytical accuracy.
A LCS is a control sample of known composition. A percent recovery within control
limits demonstrates that the laboratory method is acceptable. All LCS recoveries are
within control limits and no qualifications to the data are required.
2.2.4 Radionuclide Quantitation
Project Ouantitation Limits (POLs) establish the MDAs required to properly quantify
non-detected analytes. Four thousand two hundred two (31.0%) gamma spec results
were non-detect, but the MDA did not meet the POL of 0.1 (pCi/g). These results that
were non-detect and did not meet the POL are qualified with the reason code N02.
Radium-226 is reported via the 609.31 (keV) line of Bismuth-214. Because the samples
have not had the required twenty-one day ingrowth, the reported Radium-226 activities
are estimated and may be biased low. All (100%) Radium-226 sample results are
qualified as estimated (J/UJ) with a reason code T15.
2.2.5 Overall Assessment of Data
Sample results that were quantified greater than the MDA with an uncertainty 50% to
100% of the sample result were qualified as estimated (J) with a reason code T04. Four
hundred forty-one (441) records (3.3% of the gamma spec records) had results qualified
as estimated (J) with a reason code T04.
Sample results that were quantified less than the MDA, but greater than the uncertainty
were qualified non-detect (U) with a reason code T05. Nine hundred thirty-four (934)
Page 5 of 19
I I I I I I I I I I I I I I I I I I I

I I I I I I I I I I I I I I I I I I I
records (6.9% of the gamma spec records) had results qualified non-detect (U) with a
reason code T05.
Sample results with analytical results less than both the MDA and uncertainty were
qualified as non-detect, estimated (UJ) with a reason code T06. Eight thousand one
hundred eighteen (8118) records (60.0% of the gamma spec records) had results
qualified as non-detect, estimated (UJ) with a reason code T06.
Sample results with negative analytical results where the absolute value of the result is
greater than twice the MDA were qualified as rejected (R) with a reason code T07. Two
(2) records (<0.1% of the gamma spec records) had results qualified as rejected (R)
with a reason code T07.
2.3 Isotopic Thorium
The field team submitted eight hundred forty-eight (848) samples for isotopic thorium
analysis. The associated quality control result assessments are discussed in the
following subsections.
2.3.1 Yields
Non-target isotopes are added to samples just prior to digestion and separation. The
non-target isotopes are used to determine the digestion, separation, and analysis
efficiencies. These non-target isotope recoveries are expressed as yields and used to
calculate the target isotope activities. Seven samples had yields for thorium analysis
that exceeded control limits. These seven samples (0.8% of the samples) had the
Thorium-228, Thorium-230 and Thorium-232 results qualified as estimated, J/UJ, G02,
due to tracer yields exceeding the control limits.
2.3.2 Laboratory Blanks
Laboratory blanks are used to verify that laboratory handling and procedures are not
cross-contaminating samples with target isotopes. Each SDG had one laboratory blank
per analytical run.
Page 6 of 19

Thorium-230 was detected in eight blanks with activity concentrations ranging from
0.027 pCi/g to 0.037 pCi/g. This may indicate that contamination could have been
introduced during the laboratory preparation. Those samples where the normalized
absolute difference (NAD) between the blank and the sample result is greater than 2.58
are qualified as estimated (J) with a reason code F01. Forty-one samples (4.8% of the
samples) had Thorium-230 results qualified as estimated (J) with a reason code F01.
2.3.3 Laboratory Duplicates
Laboratory duplicates are used to assess the sample analysis precision. The laboratory
duplicate samples were evaluated by calculating the relative percent differences.
Relative percent differences are considered non-calculable for duplicate pairs where
one or both results were not detected or less than 2x the MDA. If one result was
greater than 2x the MDA and the other result was detected at less than 2x the MDA, the
RPD was calculated. The laboratory analyzed one duplicate pair for each analytical
run. One hundred twenty-three samples (14.5%) had the Thorium-228 results qualified
J01 because the associated laboratory duplicate had an RPD greater than 35%. One
hundred thirty-one samples (15.5%) had the Thorium-230 results qualified J01 because
the associated laboratory duplicate had an RPD greater than 35%. One hundred forty
samples (16.5%) had the Thorium-232 results qualified J01 because the associated
laboratory duplicate had an RPD greater than 35%.
2.3.4 Laboratory Control Spike
Laboratory control spikes (LCS) are prepared to verify the sample analysis accuracy. A
LCS is a control sample of known composition. A percent recovery within control limits
demonstrates that the laboratory method is acceptable. All LCS recoveries were within
control limits and no qualifications to the data were required.
2.3.5 Radionuclide Quantitation
Project Ouantitation Limits (POLs) establish the MDAs required to properly quantify
. non-detected analytes. One (0.1 %) Thorium-228 result was non-detect, but the MDA
did not meet the POL of 0.1 (pCi/g). One (0.1%) Thorium-232 result was non-detect,
Page 7 of 19
I I I I I I I I I I I I I I I I I I
A-ztyfl I

I I I I I I I I I I I I I I I I I I I
but the MDA did not meet the PQL of 0.1 (pCi/g). These results that were non-detect
but did not meet the PQL were qualified with the reason code N02.
2.3.6 Overall Assessment of Data
Sample results that were quantified greater than the MDA with an uncertainty 50% to
100% of the sample result were qualified as estimated (J) with a reason code T04.
Thirty-eight samples (4.5% of the samples) had Thorium-228 results qualified as
estimated (J) with a reason code T04. Fifteen samples (1.8% of the samples) had
Thorium-230 results qualified as estimated (J) with a reason code T04. Thirty-two
samples (3.8% of the samples) had a Thorium-232 result qualified as estimated (J) with
a reason code T04.
Sample results that were quantified less than the MDA, but greater than the uncertainty
were qualified non-detect (U) with a reason code T05. Two samples (0.2% of the
samples) had Thorium-228 results qualified non-detect (U) with a reason code T05.
None of the samples had Thorium-230 results qualified non-detect (U) with a reason
code T05. One sample (0.1% of the samples) had Thorium-232 results qualified non
detect (U) with a reason code T05.
Sample results with analytical results less than both the MDA and uncertainty were
qualified as non-detect, estimated (UJ) with a reason code T06. One of the samples
(0.1% of the samples) had Thorium-228 results qualified as non-detect, estimated (UJ)
with a reason code T06. None of the samples had Thorium-230 results qualified as
non-detect, estimated (UJ) with a reason code T06. Two samples (0.2% of the
samples) had Thorium-232 results qualified as non-detect, estimated (UJ) with a reason
code T06.
2.4 Isotopic Plutonium
The field team submitted eight hundred forty-four (844) samples for isotopic plutonium
analysis. The associated quality control result assessments are discussed in the
following subsections.
Page 8 of 19

2.4.1 Yields
Non-target isotopes are added to samples just prior to digestion and separation. The
non-target isotopes are used to determine the digestion, separation, and analysis
efficiencies. These non-target isotope recoveries are expressed as yields and used to
calculate the target isotope activities. All yields for plutonium analysis were within
control limits. No qualifications to the usability of the data were required based on the
yield recoveries.
2.4.2 Laboratory Blanks
Laboratory blanks are used to verify that laboratory handling and procedures are not
cross-contaminating samples with target isotopes. Each sample delivery group (SDG)
had one laboratory blank per analytical run. All laboratory blanks were non-detect for
plutonium. No blank contamination of the samples was detected.
2.4.3 Laboratory Duplicates
Laboratory duplicates are used to assess the sample analysis precision. The laboratory
duplicate samples were evaluated by calculating the relative percent differences
(RPDs). Relative percent differences are considered non-calculable for duplicate pairs
where one or both results were not detected or less than 2x the MDA. If one result was
greater than 2x the MDA and the other result was detected at less than 2x the MDA, the
relative percent difference was calculated. The laboratory analyzed one duplicate pair
for each analytical run. One hundred forty-three (143) Plutonium-238 records were
qualified as estimated, J/UJ, J01 due to the laboratory duplicate. Eighty-eight (88)
Plutonium-239/240 records were qualified as estimated,· J/UJ, J01 due to the laboratory
duplicate.
2.4.4 Laboratory Control Spike
Laboratory control spikes (LCSs) are prepared to verify the sample analysis accuracy.
A LCS is a control sample of known composition. A percent recovery within control
limits demonstrates that the laboratory method is acceptable. All LCS recoveries were
within control limits and no qualifications to the data were required.
Page 9 of 19
I I I I I I I I I I I I I I I I I I I

I I I I I I I I I I I I I I I I I I I
2.4.5 Radionuclide Quantitation
Project Ouantitation Limits (POLs) establish the MDAs required to properly quantify
non-detected analytes. Four (0.5%) Plutonium-238 results were non-detect, and the
MDA did not meet the POL of 0.1 (pCi/g). Nine (1.1 %) Plutonium-239/240 results were
non-detect, but the MDA did not meet the POL of 0.1 (pCi/g). These results that were
non-detect but did not meet the POL are qualified with the reason code N02.
2.4.6 Overall Assessment of Data
Sample results that were quantified greater than the MDA with an uncertainty 50% to
100% of the sample result were qualified as estimated (J) with a reason code T04.
Ninety-four samples (11.1% of the samples) had Plutonium-238 results qualified as
estimated (J) with a reason code T04. One hundred ninety-seven of the samples
(23.3% of the samples) had Plutonium-239/240 results qualified as estimated (J) with a
reason code T04.
Sample results that were quantified less than the MDA, but greater than the uncertainty
were qualified non-detect (U) with a reason code T05. Nine of the samples (1.1% of the
samples) had Plutonium-238 results qualified non-detect (U) with a reason code T05.
Forty-three samples (5.1% of the samples) had Plutonium-239/240 results qualified
non-detect (U) with a reason code T05.
Sample results with analytical results less than both the MDA and uncertainty were
qualified as non-detect, estimated (UJ) with a reason code T06. Eighty-nine of the
samples (10.6% of the samples) had Plutonium-238 results qualified as non-detect,
estimated (UJ) with a reason code T06. Four hundred seventy-one samples (55.8% of
the samples) had Plutonium-239/240 results qualified as non-detect, estimated (UJ)
with a reason code T06.
2.5 Isotopic Uranium
The field team submitted fifty-eight (58) samples for isotopic uranium analysis. The
associated quality control result assessments are discussed in the following
subsections.
Page 10 of 19

2.5.1 Yields
Non-target isotopes are added to samples just prior to digestion and separation. The
non-target isotopes are used to determine the digestion, separation, and analysis
efficiencies. These non-target isotope recoveries are expressed as yields and used to
calculate the target isotope activities. All yields for isotopic uranium analysis were
within control limits. No qualifications to the usability of the data were required based
on the yield recoveries.
2.5.2 Laboratory Blanks
Laboratory blanks are used to verify that laboratory handling and procedures are not
cross-contaminating samples with target isotopes. Each SDG had one laboratory blank
per analytical run. One laboratory blank had Uranium-233/234 detected at a level that
affected one sample. One Uranium-233/234 result was qualified as estimated, J, F01
due to blank contamination.
2.5.3 Laboratory Duplicates
Laboratory duplicates are used to assess the sample analysis precision. The laboratory
duplicate samples were evaluated by calculating the relative percent differences.
Relative percent differences are considered non-calculable for duplicate pairs where
one or both results were not detected or less than 2x the MDA. If one result was
greater than 2x the MDA and the other result was detected at less than 2x the MDA, the
RPD was calculated. The laboratory analyzed one duplicate pair for each analytical
run. All RPDs were within control limits. The sample data did not require qualification
for sample analytical precision.
2.5.4 Laboratory Control Spike
Laboratory control spikes (LCSs) are prepared to verify the sample analysis accuracy.
A LCS is a control sample of known composition. A percent recovery within control
limits demonstrates that the laboratory method is acceptable. All LCS recoveries were
within control limits and no qualifications to the data were required.
Page 11 of 19
lf~39
I I I I I I I I I I I I I I I I I I I

I I I I I I I I I I I I I I I I I I I
2.5.5 Overall Assessment of Data
Sample results that were quantified greater than the MDA with an uncertainty 50% to
100% of the sample result were qualified as estimated (J) with a reason code T04. One
sample (1.7% of the samples) had Uranium-233/234 results qualified as estimated (J)
with a reason code T04. None of the samples had Uranium-238 results qualified as
estimated (J) with a reason code T04.
Sample results that were quantified less than the MDA, but greater than the uncertainty
were qualified non-detect (U) with a reason code T05. None of the samples had
Uranium-233/234 or Uranium-238 results qualified non-detect (U) with a reason code
T05.
Sample results with analytical results less than both the MDA and uncertainty were
qualified as non-detect, estimated (UJ) with a reason code T06. None of the samples
had Uranium-233/234 or Uranium-238 results qualified as non-detect, estimated (UJ)
with a reason code T06.
2.6 Tritium
The field team submitted two hundred seventeen (217) samples for Tritium analysis.
The associated quality control result assessments are discussed in the following
subsections.
2.6.1 Yields
Non-target isotopes are added to samples just prior to digestion and separation. · The
non-target isotopes are used to determine the digestion, separation, and analysis
efficiencies. These non-target isotope recoveries are expressed as yields and used to
calculate the target isotope activities. All yields for the Tritium analysis were within
control limits. No qualifications to the usability of the data were required based on the
yield recoveries.
Page 12 of 19

2.6.2 Laboratory Blanks
Laboratory blanks are used to verify that laboratory handling and procedures are not
cross-contaminating samples with target isotopes. Each SDG had one laboratory blank
per analytical run. All laboratory blanks were non-detecf for Tritium. No blank
contamination of the samples was detected.
2.6.3 Laboratory Duplicates
Laboratory duplicates are used to assess the sample analysis precision. The laboratory
duplicate samples were evaluated by calculating the relative percent differences.
Relative percent differences are considered non-calculable for duplicate pairs where
one or both results were not detected or less than 2x the MDA. If one result was
greater than 2x the MDA and the other result was detected at less than 2x the MDA, the
RPD was calculated. The laboratory analyzed one duplicate pair for each analytical
run. Sixty-four samples (29.5% of the samples) were qualified as estimated, J/UJ, with
a reason code J01 due to the laboratory duplicate relative percent difference exceeding
the control limit.
2.6.4 Laboratory Control Spike
Laboratory control spikes {LCSs) are prepared to verify the sample analysis accuracy.
A LCS is a control sample of known composition. A percent recovery within control
limits demonstrates that the laboratory method is acceptable. All LCS recoveries are
within control limits and no qualifications to the data were required.
2.6.5 Overall Assessment of Data
Sample results that were quantified greater than the MDA with an uncertainty 50% to
100% of the sample result were qualified as estimated (J) with a reason code T04. Five
samples (2.3% of the samples) had their Tritium results qualified as estimated (J) with a
reason code T04.
Sample results that were quantified less than the MDA, but greater than the uncertainty
were qualified non-detect {U) with a reason code T05. Five samples (2.3% of the
samples) had their Tritium results qualified non-detect (U) with a reason code T05.
Page 13 of 19
I I I I I I I I I I I I I I I I I I I

I I I I I I I I I I I I I I I I I I I
Sample results with analytical results less than both the MDA and uncertainty were
qualified as non-detect, estimated (UJ) with a reason code T06. Twelve samples (5.5%
of the samples) had their Tritium results qualified as non-detect, estimated (UJ) with a
reason code T06.
2. 7 Gross Beta
The field team submitted forty-nine (49) samples for Gross Beta analysis. The
associated quality control result assessments are discussed in the following
subsections.
2.7.1 Yields
Non-target isotopes are added to samples just prior to digestion and separation. The
non-target isotopes are used to determine the digestion, separation, and analysis
efficiencies. These non-target isotope recoveries are expressed as yields and used to
calculate the target isotope activities. All yields for Gross Beta were within control limits.
No qualifications to the usability of the data were required based on the yield recoveries.
2. 7.2 Laboratory Blanks
Laboratory blanks are used to verify that laboratory handling and procedures are not
cross-contaminating samples with target isotopes. Each SDG had one laboratory blank
per analytical run. All laboratory blanks were non-detect for Gross Beta. No blank
contamination of the samples was detected.
2.7.3 Laboratory Duplicates
Laboratory duplicates are used to assess the sample analysis precision. The laboratory
duplicate samples were evaluated by calculating the relative percent differences.
Relative percent differences are considered non-calculable for duplicate pairs where
one or both results were not detected or less than 2x the MDA. If one result was
greater than 2x the MDA and the other result was detected at less than 2x the MDA, the
RPD was calculated. The laboratory analyzed one duplicate pair for each analytical
run. None of the samples required qualification due to the laboratory duplicate.
Page 14 of 19

2.7.4 Laboratory Control Spike
Laboratory control spikes (LCSs) are prepared to verify the sample analysis accuracy.
A LCS is a control sample of known composition. A percent recovery within control
limits demonstrates that the laboratory method is acceptable. All LCS recoveries were
within control limits and no qualifications to the data were required.
2. 7.5 Overall Assessment of Data
Sample results that were quantified greater than the MDA with an uncertainty 50% to
100% of the sample result were qualified as estimated (J) with a reason code T04.
None of the samples had their Gross Beta results qualified as estimated (J) with a
reason code T04.
Sample results that were quantified less than the MDA, but greater than the uncertainty
were qualified non-detect (U) with a reason code T05. None of the samples had their
Gross Beta results qualified non-detect (U) with a reason code T05.
Sample results with analytical results less than both the MDA and uncertainty were
qualified as non-detect, estimated (UJ) with a reason code T06. None of the samples
had their Gross Beta results qualified as non-detect, estimated (UJ) with a reason code
T06.
2.8 Strontium-90
The field team submitted three (3) samples for Strontium-90 analysis. The associated
quality control result assessments are discussed in the following subsections.
2.8.1 Yields
Non-target isotopes are added to samples just prior to digestion and separation. The
non-target isotopes are used to determine the digestion, separation, and analysis
efficiencies. These non-target isotope recoveries are expressed as yields and used to
calculate the target isotope activities. All yields for Strontium-90 were within control
limits. No qualifications to the usability of the data were required based on the yield
recoveries.
Page 15of 19
I I I I I I I I I I I I I I I I I I I

I I I I I I I I I I I I I I I I I I I
2.8.2 Laboratory Blanks
Laboratory blanks are used to verify that laboratory handling and procedures are not
cross-contaminating samples with target isotopes. Each SDG had one laboratory blank
per analytical run. All laboratory blanks were non-detect for Strontium-90. No blank
contamination of the samples was detected.
2.8.3 Laboratory Duplicates
Laboratory duplicates are used to assess the sample analysis precision. The laboratory
duplicate samples were evaluated by calculating the relative percent differences.
Relative percent differences are considered non-calculable for duplicate pairs where
one or both results were not detected or less than 2x the MDA. If one result was
greater than 2x the MDA and the other result was detected at less than 2x the MDA, the
RPD was calculated. The laboratory analyzed one duplicate pair for each analytical
run. None of the samples required qualification due to the laboratory duplicate.
2.8.4 Laboratory Control Spike
Laboratory control spikes (LCSs) are prepared to verify the sample analysis accuracy.
A LCS is a control sample of known composition. A percent recovery within· control
limits demonstrates that the laboratory method is acceptable. All LCS recoveries are
within control limits and no qualifications to the data were required.
2.8.5 Overall Assessment of Data
Sample results that were quantified greater than the MDA with an uncertainty 50% to
100% of the sample result were qualified as estimated (J) with a reason code T04.
None of the samples had their Strontium-90 results qualified as estimated (J) with a
reason code T04.
Sample results that were quantified less than the MDA, but greater than the uncertainty
were qualified non-detect (U) with a reason code T05. None of the samples had their
Strontium-90 results qualified non-detect (U) with a reason code T05.
Page 16 of 19

Sample results with analytical results less than both the MDA and uncertainty were
qualified as non-detect, estimated (UJ) with a reason code T06. Three samples (100%
of the samples) had their tritium results qualified as non:-detect, estimated (UJ) with a
reason code T06.
2.9 Total Metals
The field team submitted two (2) samples for Total Metals analysis. The associated
quality control result assessments are discussed in the following subsections.
2.9.1 Holding Times
Holding times are established to ensure that target parameters do not deteriorate prior
to analysis. All samples were analyzed within holding times. No qualification of the
data was necessary.
2.9.2 Initial Calibration
. The laboratory analyzes an initial calibration verification sample to confirm the accuracy
of the calibration line or curve against which sample concentrations are determined.
The percent recovery (%R) of the initial calibration verification sample should be
between 90% and 110% for each analyte. The RPD was within control limits for all
initial calibration verification samples. No qualification of the data was required.
2.9.3 Continuing Calibration
A continuing calibration verification is performed every 10 samples that are analyzed to
ensure that the initial calibration curve is still valid for the determination of sample
concentration. The percent recovery (%R) is calculated to check the accuracy of the
calibration curve used and should be between 90% and 110% to be considered in
control. The %R was within control for these analyses. No qualification of the data was
required.
Page 17 of 19
I I I I I I I I I I I I I I I I I I I

I I I I I I I I I I I I I I I I I I I
2.9.4 Laboratory Blanks
Laboratory blanks are used to verify that laboratory handling and procedures are not
cross-contaminating samples with target analytes. Each SDG had one method blank
and at least one continuing calibration blank per analytical run.
Arsenic and Beryllium were detected in the method blank at concentrations of 4.3 and
3.3 )lg/L, respectively. Selenium and Thallium were detected in the method blank at
concentrations of 4.1 and 5.6 )lg/L, respectively. This may indicate that contamination
could have been introduced during the laboratory preparation. An action level is
calculated for each batch by multiplying the detected contamination by five and converting
to soil units. Those samples where the sample result is less than the associated action
level are qualified as non-detect (U) with a reason code F01. One sample (50.0% of the
samples) had the Arsenic, Beryllium, Selenium and Thallium results qualified as non
detect (U) with a reason code F01.
Arsenic and Beryllium were detected in the continuing calibration blank at
concentrations of 10.1 and 8.9 )lg/L, respectively. This may indicate that contamination
could have been introduced during the laboratory analysis. An action level is calculated
for each batch by multiplying the detected contamination by five and converting to soil
units. Those samples where the sample result is less than the associated action level
are qualified as non-detect (U) with a reason code F07. One sample (50.0% of the
samples) had the Arsenic and Beryllium results qualified as non-detect (U) with a
reason code F07.
2.9.5 Laboratory Duplicates
Laboratory duplicates are used to assess the sample analysis precision. The laboratory
duplicate samples were evaluated by calculating the relative percent differences.
Relative percent differences are considered non-calculable for duplicate pairs where
one or both results were not detected or less than 2x the MDL. If one result was greater
than 2x the MDL and the other result was detected at less than 2x the MDL, the RPD
was calculated. The laboratory analyzed one duplicate pair for each analytical run. All
laboratory duplicates had RPDs within control limits.
Page 18 of 19

2.9.6 Laboratory Control Spike
Laboratory control spikes (LCSs) are prepared to verify the sample analysis accuracy.
A LCS is a control sample of known composition. A percent recovery within control
limits demonstrates that the laboratory method is acceptable. All LCS recoveries were
within control limits and no qualifications to the data were required.
2.9.7 Serial Dilution
Serial dilutions are analyzed to verify the sample matrix does not contribute variability to
the quantitation of total metals samples. A serial dilution is prepared by diluting a field
sample by a factor of five and comparing the expected value to the analyzed value. A
percent recovery within control limits demonstrates that the sample matrix does not
interfere with the quantitation. Both samples had serial dilutions with percent recoveries
that exceeded the control limits. Both samples had all results qualified as estimated,
J/UJ, with a reason code EO?.
3.0 References
Reference 1: Methods Compendium. Mound Plant, Miamisburg OH. Technical Manual
MD-80045, Issue 2, January 2002.
Reference 2: Data Validation. Science Application International Corporation.
Technical Procedure-Data Management-300-7, Revision 5, February 2004.
Page 19 of19
I I I I I I I I I I I I I I I I I I I

CD for R & V Table

I I I I I I I I I I I I I I I I I I I
ATTACHMENT B
GENERAL MEDIA INFORMATION
[there was no general media information released to the public]

I I I I I I I I I I I I I I I I t· I .I
ATTACHMENT C POST-EX SUD EXCERPTS
• RSWB SUs 1·8 & 11-14 • RSWB SUs 9 & 1 0 • T East and T West Stack Soil
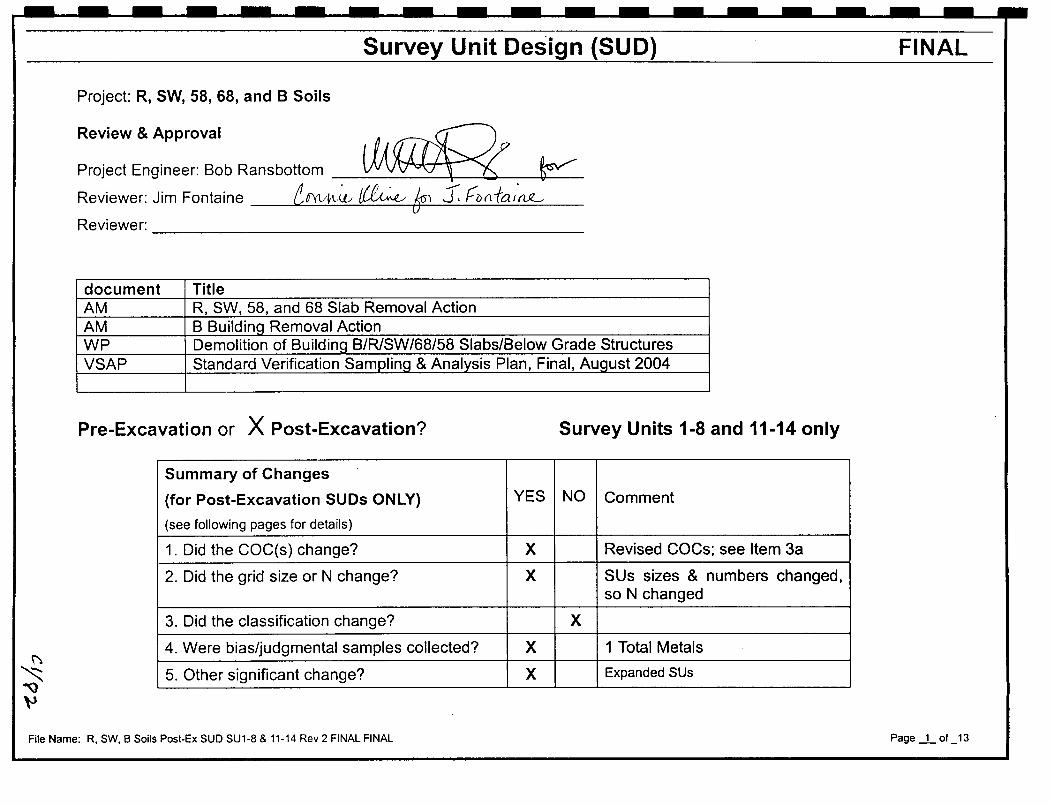
i\
""' "'\)
"'
Survey Unit Design {SUD)
Project: R, SW, 58, 68, and 8 Soils
Review & Approval
~~ Reviewer: ________________________________________________ __
document Title AM R, SW, 58, and 68 Slab Removal Action AM B Building Removal Action WP Demolition of Building B/R/SW/68/58 Slabs/Below Grade Structures VSAP Standard Verification Sampling & Analysis Plan, Final, August 2004
Pre-Excavation or X Post-Excavation? Survey Units 1-8 and 11-14 only
Summary of Changes
(for Post-Excavation SUDs ONLY) YES NO Comment
(see following pages for details)
1. Did the COC(s) change? X Revised COGs; see Item 3a
2. Did the grid size or N change? X SUs sizes & numbers changed, soN changed
3. Did the classification change? X
4. Were bias/judgmental samples collected? X 1 Total Metals
5. Other significant change? X Expanded SUs
File Name: R, SW, 8 Soils Post-Ex SUD SU1-8 & 11-14 Rev 2 FINAL FINAL
FINAL
I
I
Page _1_ of _13

SUD Worksheet
~tern J Summary of historic information relevant to SU:
The Removal Action associated with this SUD addressed identified contamination areas with contaminants of concern (COCs} above the cleanup objective (CO).
R and SW were used for various radiological processes through the years. The R, SW, 58, and 68 slab Action Memorandum COCs include Actinium-227, Americium-241, Bismuth-207, Cesium-137, Lead-21 0, Proactinium-231, Plutonium-238, Plutonium-239/240, Radium-226, Strontium-90, Thorium-228, Thorium-230, Thorium-232, Tritium, Uranium-233, Uranium-234, and Uranium-238. Isotopes associated with polonium processing also include Bi-210m and Co-60. Th-229 was associated with U-233 processing. Curium-244 has been found during recent R Building drain sampling.
B Building was used for Actinium and Polonium radioisotopic research on animals. The B Building Action Memorandum COCs include Actinium-227, Lead-210, Tritium, and Beryllium. The tritium is due to B Building's proximity to R/SW and the Beryllium is due to processes in the building. Isotopes associated with polonium processing also include Bi-207, Bi-210m and Co-60. In addition, a solvent shed was associated with B Building, so organic COCs include Trichloroethene, 1 ,2 trans-Dichloroethene, and 1,2 cis-Dichloroethene.
Changes if any, from Pre-ex SUD Metals were included in the Pre-Ex SUD due to a suspected drain line break under SW 137, which could have been a source of some metals such as mercury, chromium, lead, etc. With this information in mind, a bias sample will be taken under the former location of room 137 where there was a suspected drain line break. The sample will undergo analysis for the following metals_: Mercury, Cadmium, Chromium, Lead, Silver, Copper and Zinc.
Item I Summary of historic data relevant to SU: 2
Item 3a
0
~ "
See Appendix A
(pCi/g)
co HS
Offsite Analysis & Compendium Method gamma lso Pu lso Th lso U Tritium Stronti Metals I VOCs I Explosi
(A-016) Mercur 010) MAX I (A-015) (A-012) (A-012) (A-012) (A-014) um-90 & (A-001) ves (A·
Co y(A· C BASIS o31)
Analyses of COCs in surface soil are to be performed per Mound Methods Compendium as applicable. Compendium Method A-012 is Isotopic Uranium, Isotopic Plutonium, and Isotopic Thorium by Alpha Spectrometry. Cm-244 analysis is performed using the method found in Appendix G. Compendium Method A-015 is Gamma Spectrometry. A-014 is analysis by liquid scintillation for Tritium and A-016 is analysis for Strontium-90. Note that alpha spec data will supercede gamma spec data for isotopes where the former is more sensitive (e.g., Th-230, Pu-238). Analysis for Volatile Organic Compounds (VOCs) is by Operation A-002, for Explosives is A-001, for TPH is A-023, and for metals is A-031. (See Appendix D for the Target Analyte Lists for A-001, A-01 0, A-023, and A-031 ). Surface samples/analysis are to be in accordance with MD-80036 OP 30005, 30007, 30040 for the FIDLER and 90022 for the AXISS. (Note: FIDLER G5 and Axiss instruments are both to be used for walkover surveys. See table in Appendix F for reference.)
File Name: R. SW. B Soils Post-Ex SUD SU1-8 & 11-14 Rev 2 FINAL FINAL Page _.L of _13
-------------------

Changes if any, from Pre-ex SUD:
See Table 1 in Attachment Ill for changes to the COC list. Changes are associated with the change described in Item 5 change section.
Item
3b Chern basis for std dev, AM COCs/New COCs
Changes, if any, from Pre-Ex SUD:
No changes
Item 1 Classify Areas & provide justification 4
NA, Sec~ ltern 2
The 181 ,44 7 sq. ft area covered in this SUD includes the footprints of R, SW,
Selection Class Scan Coverage guidelines
sus 1 -121 1 100% B, and 68 Buildings, as well as part of the Hot Waste Drain system and the l-----1r------+-------------------j
(""\
~ ao ~
loadout areas and roadways around the buildings. The H Building area is N/A I 2 excluded since it was previously verified to be clean and is not being used as l-----1r------+-------------------j a loadout or storage area for the RISW /B demolition. All of the above buildings housed various processes that were radiological or chemical in nature. As a result, all SUs are Class 1 due to the known presence of radiological contamination in the buildings above the areas, known contamination in pipe lines below the buildings, and possible cross-contamination from the demolition and load-out of debris.
Changes if any, from Pre-ex SUD:
N/A I 3
This Post-Ex SUD only applies to Survey Units 1-8 and 11-14. Post-Ex SUD for SU 9 & 10 was previously approved.
File Name: R, SW, B Soils Post-Ex SUD SU1-8 & 11-14 Rev 2 FINAL FINAL Page _L of _13

Item I Subdivide areas into SUs 5
("l,
"t ~
See Appendix A for Data
See Appendix B for SUs
File Name: R, SW, 8 Soils Post-Ex SUD SU1-8 & 11-14 Rev 2 FINAL FINAL
The area is divided into 12 Survey Units (SUs). The SUs were first situated according to the processes that occurred in each area, but were limited in size to less than the 17,500 sq. ft. threshold. SU 1 is 12,347 sq. ft. and is located to the west and south of SW Building and includes the roadway as well as PRS 143, RISWrr Bldg. Stack Diesel Fuel Storage Tank (EG-1) and PRS 253 T West Stack. A portion of the SW underground exhaust duct toT West stack lies in the SU. The EG-1 diesel tank was removed under the BUSTR program. Resulting soil sample analysis results will be presented along with the data report for this SUD. The T West stack foundation will be removed under a separate work plan and SUD. SU 2 is 14,978 sq. ft. and covers the western portion of R Building and the eastern portion of SW Building and includes SW-8, SW-13, and R-108 as well as PRSs 133, 135, 139, 142, 144, 327, and 328. SU 2 also includes a portion of the PRS 131 red and yellow drain system. The PRS 437 Hot Waste line runs through this SU but is broken out under SU 12. SU 3 is 13,807 sq. ft., covers the western portion of SW and includes the PRS 132 Old and New Cave areas , the SW-20 complex, as well as PRSs 136, 137, 138, 249, and 250. A portion of the SW underground exhaust duct toT West stack lies in the SU. As with SU 2, a portion of the PRS 437 Hot Waste line runs through this SU, but is excluded. SU 4 is 18,103 sq. ft., covers the middle portion of R Building and includes the majority of the PRS 131 red and yellow drain system as well as PRSs 145 and 146. This area slightly exceeds the 17,500 sq. ft. threshold, but it is totally surrounded by other SUs and includes a clearly definable potion of R Building. SU 5 is 16,784 sq. ft. and includes the northeast portion of R Building and the associated loadout area. SU 6 is 17,247 sq. ft. and includes the southeast portion of R Building and the associated loadout area as well as the Building 68 pad. SU 7 is 15,289 sq. ft., covers the southern portion of R Building and includes the R Building underground exhaust duct toT West stack. SU 8 is 11,316 sq. ft. and covers the area under and adjacent to Building 58. It includes Rooms SW-149/149A as well as PRSs 134, 140, 141, 209, 234, 251, and 329. As with SUs 2 and 3, a portion of the PRS 437 Hot Waste line and the PRS 425 portion of the Hot Waste line run through this SU, but are excluded. SU 9 is 17,541 sq. ft., covers the additions to B Building and the adjacent areas. SU 10 is 16,969 sq. ft., covers the original portion of B Building and adjacent areas. SU 11 is 16,752 sq. ft., covers the northern portion of R Building, the courtyard between R, SW, and B Buildings and includes PRS 252, B Building Stack. As with SUs 2 and 3, a portion of the PRS 437 Hot Waste line as well as PRS 425, runs through this SU, but are excluded. SU 12 is 10,313 sq. ft, including sidewalls. It was established to follow the Hot Waste Line, including PRSs 425, 437 and a portion of 438, through SW Building. In order to layout the required trench wall surveys, this SU was split out separately from the surrounding SUs and laid open.
Page....!... of _13
-------------------

Item 5 Cont
~ 1::>0 tJ
Changes from Pre-Ex SUD:
SUs were laid out fairly uniformly over the RJSW footprint, with SUS positioned over historic tritium, Th-229, U 233/234, U23S, and U238 areas and SU6 over tritium and Sr-90 areas {based upon historical information). The COCs associated with this layout were adjusted accordingly with the aforementioned for the Post-Excavation SUD. Areas are as listed below. SU13 was added due to the excavation extending to the South more than originally expected and the SU size constraints specified by MARSSIM. Refer to Attachment II. SU14 was added and SU1, SU2, and SU4 were reconfigured due to logistical issues, laboratory issues, and a power substation removal. Refer to Attachment Ill for further explanation.
SU 1 - 16,S79 sq. ft. SU2- 10,440 sq. ft. SU3 - 13,64 7 sq. ft. SU4- 14,606 sq. ft. SUS - S, 7 40 sq. ft. SU6 - 8,260 sq. ft. SU7 -16,617 sq. ft. sua- 21.419 sq. ft. SU11 -13,689 sq. ft. SU12 -1S,08S sq. ft. SU13 -16,544 sq. ft. SU14 -1,70S ~ft.
File Name: R. SW, 8 Soils Post-Ex SUD SU1-8 & 11-14 Rev 2 FINAL FINAL Page_§_ of _13

Item I Calculations I Rad 6a
1. Calculate the (s) for each COC listed above: See Appendix B.
2. Number of Samples (N): See Appendix B.
Spreadsheet Calculated = 9 samples based upon the data for each of SU 1 through 12.
SU1 Scanning MDC (Area Factor) corrected = 382 samples
SU2 Scanning MDC (Area Factor) corrected = 464 samples
SU3 Scanning MDC (Area Factor) corrected = 428 samples
SU4 Scanning MDC (Area Factor) corrected= 561 samples
SUS Scanning MDC (Area Factor) corrected = 520 samples
SU6 Scanning MDC (Area Factor) corrected = 534 samples
SU7 Scanning MDC (Area Factor) corrected = 473 samples
SUB Scanning MDC (Area Factor) corrected = 350 samples
SU9 Scanning MDC (Area Factor) corrected = n/a - Pu-238 not COC in SU-9
SU10 Scanning MDC (Area Factor) corrected= n/a- Pu-238 not COC in SU-10
SU11 Scanning MDC (Area Factor) corrected = 519 samples
SU12 Scanning MDC (Area Factor) corrected= 319 samples
Visual Sample Plan (VSP) 15 foot triangular grid:
SU1 Calculated= 9 Selected Samples (on Map)= 67 including 2 biased samples
SU2 Calculated= 9 Selected Samples (on Map)= 87 including 9 biased samples.
SU3 Calculated = 9 Selected Samples (on Map)= 90 including 17 biased samples.
·~ ~
SU4 Calculated= 9 Selected Samples (on Map)= 94 including 1 biased samples
SU5 Calculated = 9 Selected Samples (on Map)= 85 with 0 biased samples.
File Name: R, SW, 8 Soils Post-Ex SUD SU1-8 & 11-14 Rev 2 FINAL FINAL Page_§__ of _13
-------------------

----------
~ ~
""
SU6 Calculated = 9 Selected Samples (on Map)= 88 with 0 biased samples.
SU7 Calculated= 9 Selected Samples (on Map)= 83 including 5 biased samples.
SUB Calculated= 9 Selected Samples (on Map)= 75 including 16 biased samples.
SU9 Calculated = 8 Selected Samples (on Map)= 92 with 0 biased sample.
SU10 Calculated= 8 Selected Samples (on Map)= 87 with 0 biased samples.
SU11 Calculated= 9 Selected Samples (on Map)= 86 including 1 biased sample.
SU12 Calculated= 9 Selected Samples (on Map)= 53 with 0 biased samples.
The determination of the number of samples is consistent with section 3.7 of the standard VSAP, which provides a default grid spacing for SUs where PU-238 is the primary driver in the removal action.
Sample locations were selected by VSP with sampling goals of finding a Hot Spot utilizing a 15-foot triangular grid with a random starting point. Additional samples chosen via judgmental sampling. Sample locations will be surveyed at the time of sampling or closely following.
A total of 1000 sample locations will be assessed.
Note: Due to safety concerns of placing an individual in the excavation of piping such as the hot waste lines, which are expected to be up to 15 feet below grade, FSS side wall sampling will be accomplished by scraping the sidewall with an excavator bucket and subsequent sampling of the material in the bucket in accordance with the procedures established the standard VSAP, Final, August 2004, Section 4.4 Special Considerations.
File Name: R, SW, B Soils Post-Ex SUD SU1-8 & 11-14 Rev 2 FINAL FINAL Page _]_ of _13

Changes if any, from Pre-ex SUD:
This Post-Ex SUD only applies to Survey Units 1-8 and 11-14. SU areas and sample numbers were changed as follows:
Spreadsheet Calculated= 9 samples based upon the data for each of SU 1-8 and 11-14 (see spreadsheets in Attachment II and Attachment Ill).
SU1 Scanning MDC (Area Factor) corrected= 513 samples SU2 Scanning MDC (Area Factor) corrected = 323 samples SU3 Scanning MDC (Area Factor) corrected = 423 samples SU4 Scanning MDC (Area Factor) corrected = 452 samples SU5 Scanning MDC (Area Factor) corrected = 178 samples SU6 Scanning MDC (Area Factor) corrected = 256 samples SU7 Scanning MDC (Area Factor) corrected = 515 samples sua Scanning MDC (Area Factor) corrected = 350 samples SU11 Scanning MDC (Area Factor) corrected= 424 samples SU12 Scanning MDC (Area Factor) corrected= 467 samples SU13 Scanning MDC (Area Factor) corrected= 512 samples SU14 Scanning MDC (Area Factor) corrected= 53 samples
Visual Sample Plan (VSP) 15 foot triangular grid (consistent with Section 3. 7 of the Standard VSAP):
SU1 Calculated= 9 Selected Samples (on Map)= 83 SU2 Calculated= 9 Selected Samples (on Map)= 54 SU3 Calculated= 9 Selected Samples (on Map)= 72 SU4 Calculated= 9 Selected Samples (on Map)= 73 SU5 Calculated= 9 Selected Samples (on Map)= 31 plus one biased sample SU6 Calculated= 9 Selected Samples (on Map)= 42 SU7 Calculated= 9 Selected Samples (on Map)= 85 SUB Calculated= 9 Selected Samples (on Map)= 110 SU11 Calculated= 8 Selected Samples (on Map)= 68 SU12 Calculated= 8 Selected Samples (on Map)= 76 SU13 Calculated= 8 Selected Samples (on Map)= 83 SU14 Calculated= 9 Selected Samples (on Map)= 10
A total of 788 (including one bias) samples will be taken in SU 1-8 and 11-14.
Item I Calculations/Chem, Std dev, Number of Samples 6b
NA, See Item 2
Changes if any, from Pre-ex SUD:
~ I No chemicals or metals will be analyzed for in SU 1-4, 6-8, and 11-14. One biased sample in SU5 will be analyzed for metals.
~ ~
File Name: R. SW. B Soils Post-Ex SUD SU1-8 & 11-14 Rev 2 FINAL FINAL Page _!L of _13
-------------------
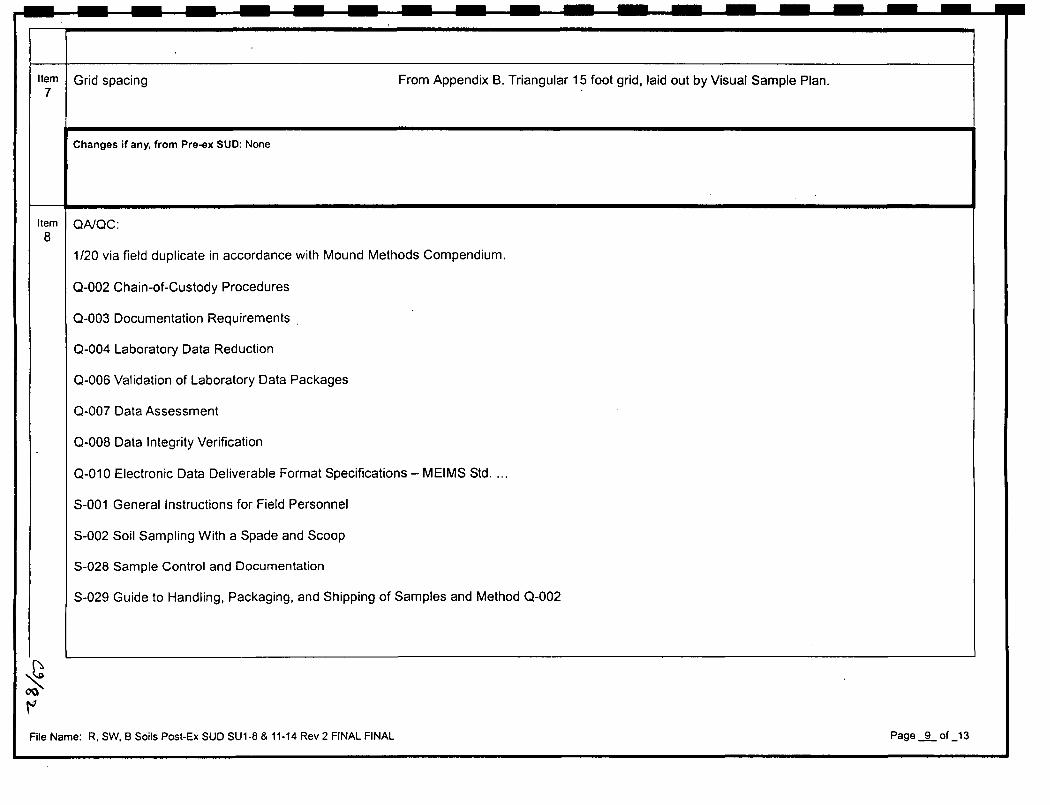
Item 1 Grid spacing 7
Changes if any, from Pre-ex SUD: None
Item I QNQC: 8
From Appendix B. Triangular 15 foot grid, laid out by Visual Sample Plan.
1/20 via field duplicate in accordance with Mound Methods Compendium.
Q-002 Chain-of-Custody Procedures
Q-003 Documentation Requirements .
Q-004 Laboratory Data Reduction
Q-006 Validation of Laboratory Data Packages
Q-007 Data Assessment
Q-008 Data Integrity Verification
Q-01 0 Electronic Data Deliverable Format Specifications- MEIMS Std ....
S-001 General Instructions for Field Personnel
S-002 Soil Sampling With a Spade and Scoop
S-028 Sample Control and Documentation
S-029 Guide to Handling, Packaging, and Shipping of Samples and Method Q-002
~ OQ
tot File Name: R, SW, 8 Soils Post-Ex SUD SU1-8 & 11-14 Rev 2 FINAL FINAL Page _JL of _13
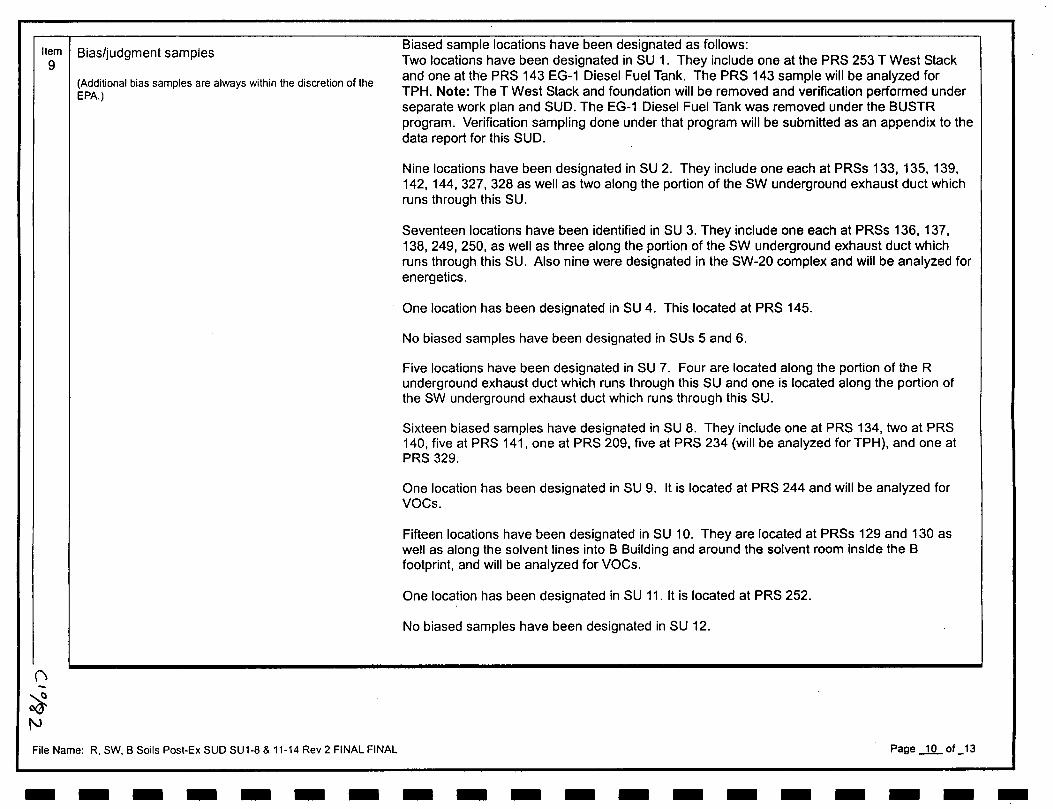
Item 1 Bias/judgment samples 9
(\ -~ "'
(Additional bias samples are always within the discretion of the EPA.)
File Name: R, SW, B Soils Post-Ex SUD SU1-8 & 11-14 Rev 2 FINAL FINAL
Biased sample locations have been designated as follows: Two locations have been designated in SU 1. They include one at the PRS 253 T West Stack and one at the PRS 143 EG-1 Diesel Fuel Tank. The PRS 143 sample will be analyzed for TPH. Note: The T West Stack and foundation will be removed and verification performed under separate work plan and SUD. The EG-1 Diesel Fuel Tank was removed under the BUSTR program. Verification sampling done under that program will be submitted as an appendix to the data report for this SUD.
Nine locations have been designated in SU 2. They include one each at PRSs 133, 135, 139, 142, 144, 327, 328 as well as two along the portion of the SW underground exhaust duct which runs through this SU.
Seventeen locations have been identified in SU 3. They include one each at PRSs 136, 137, 1 ~8. 249, 250, as well as three along the portion of the SW underground exhaust duct which runs through this SU. Also nine were designated in the SW-20 complex and will be analyzed for energetics.
One location has been designated in SU 4. This located at PRS 145.
No biased samples have been designated in SUs 5 and 6.
Five locations have been designated in SU 7. Four are located along the portion of the R underground exhaust duct which runs through this SU and one is located along the portion of the SW underground exhaust duct which runs through this SU.
Sixteen biased samples have designated in SU 8. They include one at PRS 134, two at PRS 140, five at PRS 141, one at PRS 209, five at PRS 234 (will be analyzed forTPH), and one at PRS 329.
One location has been designated in SU 9. It is located at PRS 244 and will be analyzed for VOCs.
Fifteen locations have been designated in SU 10. They are located at PRSs 129 and 130 as well as along the solvent lines into B Building and around the solvent room inside the B footprint, and will be analyzed for VOCs.
One location has been designated in SU 11. It is located at PRS 252.
No biased samples have been designated in SU 12.
Page _1Q_ of _13
-------------------

~
~ ~ ~
Changes from Pre-Ex SUD: Due to the massive extent of excavation, no biased samples will be taken (see Table I for COCs). Note: T West Stack, which was previously to be verified under the T East and T West Stack SUD, will be now be verified under this SUD as part of SUs 1 and 2. Due to the fact that the area has been excavated to bedrock, which far exceeds what was envisioned in the Pre-Ex SUD, VOCs, TPH, and energetics are being removed as biases.
One biased sample in SUS will be analyzed for metals.
File Name: R, SW, B Soils Post-Ex SUD SU1-8 & 11-14 Rev 2 FINAL FINAL Page _1L of _13
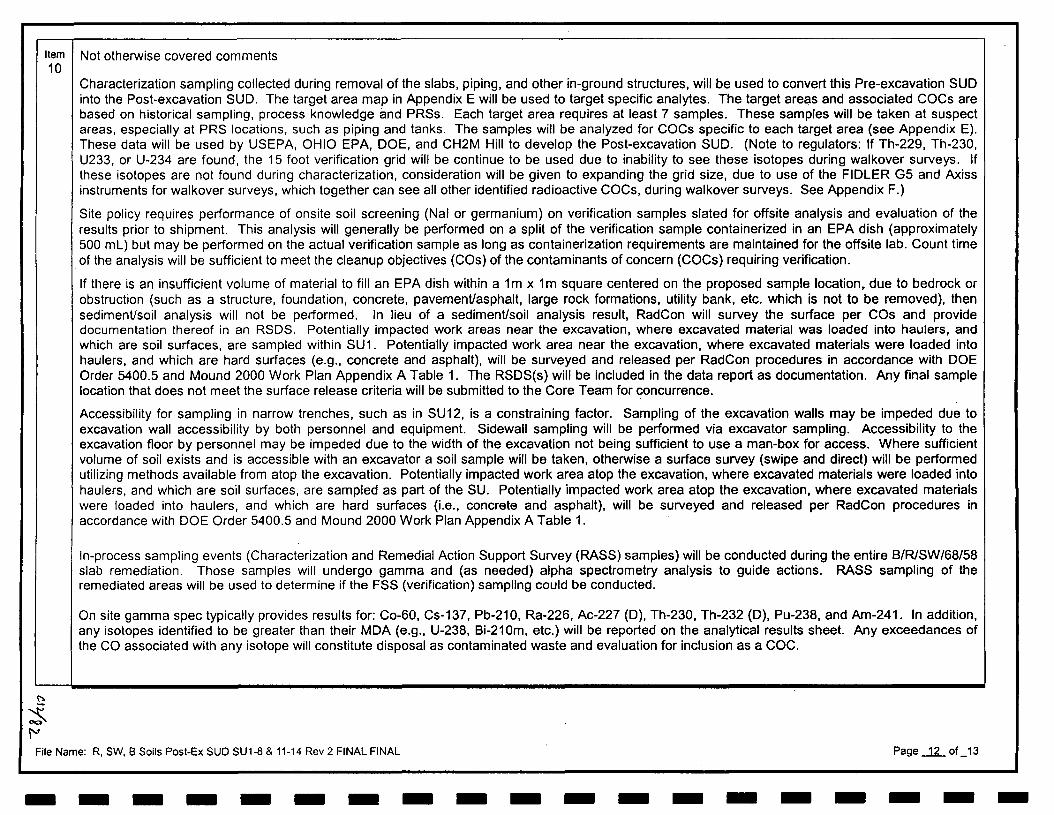
Item I Not otherwise covered comments 10
£!
~ I"'
Characterization sampling collected during removal of the slabs, piping, and other in-ground structures, will be used to convert this Pre-excavation SUD into the Post-excavation SUD. The target area map in Appendix E will be used to target specific analytes. The target areas and associated COCs are based on historical sampling, process knowledge and PRSs. Each target area requires at least 7 samples. These samples will be taken at suspect areas, especially at PRS locations, such as piping and tanks. The samples will be analyzed for COCs specific to each target area (see Appendix E). These data will be used by USEPA, OHIO EPA, DOE, and CH2M Hill to develop the Post-excavation SUD. (Note to regulators: If Th-229, Th-230, U233, or U-234 are found, the 15 foot verification grid will be continue to be used due to inability to see these isotopes during walkover surveys. If these isotopes are not found during characterization, consideration will be given to expanding the grid size, due to use of the FIDLER G5 and Axiss instruments for walkover surveys, which together can see all other identified radioactive COCs, during walkover surveys. See Appendix F.)
Site policy requires performance of onsite soil screening (Nal or germanium) on verification samples slated for offsite analysis and evaluation of the results prior to shipment. This analysis will generally be performed on a split of the verification sample containerized in an EPA dish (approximately 500 ml) but may be performed on the actual verification sample as long as containerization requirements are maintained for the offsite lab. Count time of the analysis will be sufficient to meet the cleanup objectives (COs) of the contaminants of concern (COCs) requiring verification.
If there is an insufficient volume of material to fill an EPA dish within a 1m x 1m square centered on the proposed sample location, due to bedrock or obstruction (such as a structure, foundation, concrete, pavemenVasphalt, large rock formations, utility bank, etc. which is not to be removed), then sedimenUsoil analysis will not be performed. In lieu of a sedimenVsoil analysis result, RadCon will survey the surface per COs and provide documentation thereof in an RSDS. Potentially impacted work areas near the excavation, where excavated material was loaded into haulers, and which are soil surfaces, are sampled within SU1. Potentially impacted work area near the excavation, where excavated materials were loaded into haulers, and which are hard surfaces (e.g., concrete and asphalt), will be surveyed and released per RadCon procedures in accordance with DOE Order 5400.5 and Mound 2000 Work Plan Appendix A Table 1. The RSDS(s) will be included in the data report as documentation. Any final sample location that does not meet the surface release criteria will be submitted to the Core Team for concurrence.
Accessibility for sampling in narrow trenches, such as in SU12, is a constraining factor. Sampling of the excavation walls may be impeded due to excavation wall accessibility by both personnel and equipment. Sidewall sampling will be performed via excavator sampling. Accessibility to the excavation floor by personnel may be impeded due to the width of the excavation not being sufficient to use a man-box for access. Where sufficient volume of soil exists and is accessible with an excavator a soil sample will be taken, otherwise a surface survey (swipe and direct) will be performed utilizing methods available from atop the excavation. Potentially impacted work area atop the excavation, where excavated materials were loaded into haulers, and which are soil surfaces, are sampled as part of the SU. Potentially impacted work area atop the excavation, where excavated materials were loaded into haulers, and which are hard surfaces (i.e., concrete and asphalt), will be surveyed and released per RadCon procedures in accordance with DOE Order 5400.5 and Mound 2000 Work Plan Appendix A Table 1.
In-process sampling events (Characterization and Remedial Action Support Survey (RASS) samples) will be conducted during the entire 8/R/SW/68/58 slab remediation. Those samples will undergo gamma and (as needed) alpha spectrometry analysis to guide actions. RASS sampling of the remediated areas will be used to determine if the FSS (verification) sampling could be conducted.
On site gamma spec typically provides results for: Co-60, Cs-137, Pb-210, Ra-226, Ac-227 (D), Th-230, Th-232 (D), Pu-238, and Am-241. In addition, any isotopes identified to be greater than their MDA (e.g., U-238, Bi-210m, etc.} will be reported on the analytical results sheet. Any exceedances of the CO associated with any isotope will constitute disposal as contaminated waste and evaluation for inclusion as a COC.
File Name: R, SW, 8 Soils Post-Ex SUD SU1-8 & 11-14 Rev 2 FINAL FINAL Page ..JL. of _13
-------------------

~
~ ~
Changes from Pre-Ex SUD: Reference to the AXISS unit has been removed. See Ron Daily letter in Attachment II for details. RASS sampling involved taking samples on a 30-foot grid. (See Attachment II for results). RASS sampling and waste characterization, as related to Target Areas defined in the Pre-Ex SUD, were considered in the development of the new SUs for this Post-Ex SUD. A 15 foot verification grid was laid out over the excavated, loadout, decon, and travel paths within the project boundaries. A FIDLER walkover will be performed and reported in each SU. There are locations within the excavation that consist of bedrock (shale) surfaces. The Standard VSAP in Section 4.4 says that detailed information on how to implement the approach to bedrock surfaces will be address in the Post-Ex SUD. The following is the detailed approach for this SUD: All potentially impacted areas, including those on asphalt and concrete, are included within this SUD for sampling. Where such sample points fall on a hard surface, a direct reading and a swipe will be taken as stated in the obstruction statement of the Standard VSAP. There are no sidewalls in SU 2-8 & 11-13 as was anticipated in the Pre-Ex SUD.
MH-12 is located within SU1 of the SUD. The excavation, verification sampling and backfill will occur as a continuous process to avoid runoff from the RJSW area into the adjacent PRS 124. This excavation is expected to be at least 23 feet deep, therefore sidewall sampling may apply.
Isotopic Detection, Curium -244 (Cm-244)
Ronald R. Daily, Mound Radiological Manager, advises that for the purpose of the isotopic detection of Curium -244 (Cm-244), the Miamisburg Closure Project will utilize its daughter product of Plutonium 240. Cm-244 has only an 18.11-year half-life while Pu-240 has a 6.6 thousand year half-life.
Laboratory results for Pu-239 and Pu-240 are reported as (Pu-239/240) and therefore any detection of Pu-239/240 will be considered a detection of Cm-244.
File Name: R, SW. B Soils Post-Ex SUD SU1-8 & 11-14 Rev 2 FINAL FINAL Page _1L of _13

. '
/ L
.. •:;:---- • l .. ,
r !
+·> (.._
0 i:J
. _.~··"'··',..,.....,....,\. ·-'
\ .. -~
"' 0 ::;:
·, '·· ···"'
-· ..
·j\
II
l
0 I i} !
I I I I I I
\ I I I I I I I I I I I I

I I c:
1-
I I I I I I I I I I :;, (/)
I cu c :J cu +
'
I L
; Ill
u 0
t: ~
I>
+'
L +
' +
' 0
4--J:
I Q
) c.
c. a. E
E
C
') c u
"' e £
z(
rn :::l
:I
I rn
OJ
+> U
) ii:
1: .....
<(
0:: 0
I ~
~
I I e'%
2--

I RJSW RASS SAMPLE RESULTS I
30 Foot Grid Onsite Long-Count Gamma Spec
co 55 I
Sample Mason- PU-238 Description # Dixon Sample ID Reading• MDA
RJSW PV 12/16/05 #006 6 N GL09204 3.24 20.35 I RJSW PV 12/16/05 #007 7 N GL09205 21.67 25.9 122205 RISW-08 PV 8 N GL09327 8.88 13.33 RJSW PV 12/16/05 #009 9 N GL09214 1.06 15.36 I RJSW PV 12/16/05 #010 10 N GL09215 3.31 15.83 RJSW 012006-011 Resample 11 N GL09566 0 14.02 RJSW PV 12/16/05 #012 12 N GL09217 2.93 13.15 R/SW PV 12/16/05 #013 13 N GL09224 0 14.23
I RISW PV 12/16/05 #014 14 N GL09206 4.4 22.54 R/SW PV 12/16/05 #015 15 N GL09218 1.91 20.82 R/SW PV 12/16/05 #016 16 N GL09219 1.41 15.4 I RJSW PV 12/16/05 #017 17 N GL09207 0.21 11.83 RJSW PV 12/16/05 #018 18 N GL09208 0 13.77 R/SW PV 12/16/05 #019 19 N GL09209 0 19.17 I RJSW PV 12/16/05 #020 20 N GL09210 0 16.35 R/SW PV 12/16/05 #021 21 N GL09211 3.5 12.53 R/SW PV 12/16/05 #022 22 N GL09220 0 16.7 RJSW PV 12/16/05 #023 23 N GL09221 8.76 16.4 I R/SW PV 12/16/05 #024 24 N GL09567 10.45 13.71 RJSW PV 12/16/05 #025 25 N GL09213 37.9 17.03 R/SW PV 12/16/05 #026 26 N GL09222 21.47 13.02 I R/SW PV 12/16/05 #027 27 N GL09223 0 18.34 R/SW 012006-028 Resample 28 N GL09568 0 15.86 RISW 012006-029 Resample 29 N. GL09569 10.71 12.96 RISW PV 12/16/05 #030 30 N GL09247 1.29 13.66
I R/SW PV 12/16/05 #031 31 N GL09248 41.97 12.01 010906 32 Resample #1 32 N GL09416 0 14.52 R/SW PV 12/16/05 #033 33 N GL09226 29.1 20.58 I R/SW 012006-034 Resample 34 N GL09571 1.03 14.9
·.~ .·.' RISW 012006-035 Resa~le 35 N GL09572 7.58 15.49 RISW 012006-036 Resample 36 N GL09570 1.34 13.39 I R/SW 012006-037 Resample 37 N GL09574 10.66 11.52 RISW PV 12/16/05 #038 38 N GL09235 1.66 11.84 R/SW PV 12/16/05 #039 39 N GL09250 4.23 15.96 R/SW 012006-040 Resam_Qie 40 N GL09576 0 16.25
j I RISW 012006-041 Resample 41 N GL09599 8.47 11.21 122205 R/SW-42 PV 42 N GL09315 6.15 14.68 RISW 012006-043 Resample 43 N GL09575 2.04 15.65 I RISW 012006-044 ResamJ)Ie 44 N GL09573 0 12.27 RISW 012006-045 Resample 45 N GL09234 25.29 31.64 122205 R/SW-46 PV 46 N GL09316 0 16.04 122205 R/SW-47 PV 47 N GL09317 12.05 17.83
I __j I
122205 R/SW-48 PV 48 N GL09318 0 15.62 R/SW PV 12/17/05 #049 49 N GL09253 0.5 10.73 122205 R/SW-50 PV 50 N GL09319 0.57 11.49 I
• Note: Results above CO will be removed prior to verification sampling I :j c,t '=' /ss '2-- I

I I I I I I I I I I I I I I I I I I I
RJSW RASS SAMPLE RESULTS 30 Foot Grid
Onsite Long-Count Gamma Spec
co 55 Sample Mason- PU~238
Description # Dixon Sample ID Reading• 122205 R/SW-51 PV 51 N GL09320 33.09 R/SW PV 12/17/05 #052 52 N GL09254 1.57 R/SW PV 12/17/05 #053 53 N GL09229 0 R/SW 012006-054 Resample 54 N GL09578 2.72 R/SW 012006-055 Resample 55 N GL09579 0 R/SW PV 12/17/05 #056 56 N GL09230 0 R/SW PV 12/17/05 #057 57 N GL09231 0 122205 R/SW-58 PV 58 N GL09322 4.06 122205 R/SW-59 PV 59 N GL09323 2.84 122205 R/SW-60 PV 60 s GL09586 277.5 122205 R/SW-61 PV 61 s GL09587 20.35 122205 R/SW-62 PV 62 N GL09324 6.99 R/SW 012006-063 Resample 63 N GL09580 5.16 R/SW 012006-064 Resample 64 N GL09581 0.44 R/SW 012006-065 Resample 65 N GL09582 8.33 122205 R/SW-66 PV 66 N GL09329 5.54 R/SW PV 12/16/05 #067 67 N GL09233 12.52 122205 R/SW-68 PV 68 N GL09330 0 122205 R/SW-69 PV 69 N GL09326 0 122206 R/SW-70 PV 70 s GL09588 13.02 122206-071 RJSW 71 5 GL09589 6479 122206-072 RJSW 72 s GL09590 57.39 011906 R/SW 073 73 s GL09565 5.6 011906 R/SW 074 74 s GL09522 5.57 011906 R/SW075 75 s GL09523 28.68 R/SW PV12/17/05 #076 76 N GL09242 0 R/SW PV12/17/05 #077 77 N GL09243 0 122205 R/SW-78 PV 78 N GL09331 2.96 122205 R/SW-79 PV 79 N GL09332 6.21 R/SW 012006-080 Resample 80 s GL09583 16.39 122206-081 RJSW 81 s GL09591 62.72 R/SW 012006-082 Resample 82 s GL09584 10.82 RISW 012006-083 Resample 83 s GL09594 2.37 RISW 012006-084 Resample 84 s GL09595 6.42 R/SW 012006-085 Resample 85 s GL09596 3.65 RISW 012006-086 Resample 86 s GL09597 4.58 RISW 012006-087 Resample 87 s GL09598 0 011906 RISW-088 88 s GL09529 2.72 011906 R/SW-089 89 S. GL09530 5.3 RISW PV12/17/05 #092 92 N GL09255 0 RISW PV12/17/05 #094 94 N GL09256 0 122205 R/SW-95 PV 95 N GL09333 2.98 R/SW PV12/17/05 #096 96 N GL09258 12.97 RISW PV12/17/05 #097 97 N GL09244 0 122205 R/SW-98 PV 98 N GL09334 5.91
"Note: Results above CO will be removed prior to verification sampling
MDA 14.18 13.04 18.65 13.19 14.56 17.66 18.06 12.29 12.03 94.52 14.88 12.87 14.07 11.57 16.34 11.73 14.38 13.42 13.29 14.72 31.9
17.44 11.51 10.99 14.46 13.37 13.52 9.6
10.27 12.22 14.06 13.24 13.91 19.22 15.45 18.09 14.85 14.02 13.97 9.32 9.2
12.78 10.18
13 12.02
C,.11fq'2-

. '
·'
' !
.i
j
.J
J
RJSW RASS SAMPLE RESULTS 30 Foot Grid
On_site Long-Count Gamma Spec
co 55 Sample Mason- PU-238
Description # Dixon Sample 10 Reading* RJSW PV12117/05 #099 99 N GL09259 0 RJSW PV12/17105 #100 100 N GL09245 0 RJSW PV12/17/05 #101 101 N GL09246 0 011906 R/SW-102 102 s GL09531 3.48 RISW 012006-103 Resample 103 s GL09585 232 011906 R/SW-104 104 s GL09533 6.13 011906 R/SW-105 105 s GL09534 25.56 011906 RJSW-106 106 s GL09535 1.94 011906 R/SW-107 107 s GL09536 1.6 011906 R/SW-108 108 s GL09537 21.16 011906 R/SW-109 109 s GL09538 6.69 011906 R/SW-110 110 s GL09539 20.79 011906 R/SW-111 111 s GL09541 11.53 011906 R/SW-112 112 s GL09540 4.4 011906 RJSW-113 113 s GL09542 3.97 011906 R/SW-114 114 s GL09543 0 011906 R/SW-115 115 s GL09544 55.17 011906 R/SW-116 116 s GL09545 8.33 011906 R/SW-117 117 s GL09546 12.59 011906 R/SW-118 118 s GL09547 0 011906 R/SW-119 119 s GL09548 0 011906 R/SW-120 120 s GL09549 4.95 011906 RJSW-121 121 s GL09550 4.57 011906 RJSW-122 122 s GL09551 6.08 011906 RJSW-123 123 s GL09552 3.32 011906 RJSW-124 124 s GL09553 3.18 011906 RJSW-125 125 s GL09554 6.28 011906 R/SW-126 126 s GL09555 0 011906 RJSW-127 127 s GL09556 0.28 011906 R/SW-128 128 s GL09559 1.75 011906 R/SW-129 129 s GL09557 3.38 011906 R/SW-130 130 s GL09558 0.88 011906 R/SW-131 131 s GL09560 2.9 011906 R/SW-132 132 s GL09561 47.72 011906 R/SW-133 133 s GL09562 18.01 011906 R/SW-134 134 s GL09563 3.45 011906 R/SW-135 ·135 s GL09564 0
• Note: Results above CO will be removed prior to verification sampling
I I I
MDA 8.91 I
21.42 13.09
.. 8.67 I 19.79 12.92 13.58 I 11.26 11.24 10.68 11.44 I 10.02 10.09 12.95 I 9.37 11.26 12.7 12.33
I 10.36 12.2
14.45 I 12.54 13.46 12.59 I 10.03 11.59 13.49 10.99 I 13.46 14.15 9.62 I
14.54 12.55 15.35 11.61
I 12.29 9.15 I
I I I
C.,IB/(}2-- I

I I I I I I I I I I I I I I I I I I I
Location
SW Soil Results. Offsite Tritium Analysis
Sampied 9/13/05
Moisture Tritium MDC % - ---pcii9 . - . pdlg
Lab Qualifier
SW Hole #1 0-2' 15.3 361 0.6 J ... --·-·· ·---·-········-- - --~ -----. . . . - ..... -···-··---·· .. -·-···· ·-------- -----------··· . ---------·· ---·-···---···
SW Hole #1 2-4' 10.6 98 0.6 J .. ---. .. - -- . ... -- .. ---- --- ·------ --- ... -- . ------ ~ ---· - "" ----- .... ·····-·-·· SW Hole #2 0-2' 7.3 24.7 0.6 J ................ ----·· .. ·-··-- .. . ·---·------ - -------------··----~ ~------------- ··-·-· ---------···----------------sw Hole #2 2-4" 10 537 0.6 . --~-----~----- --- .. --- ·-·- ---~-----·· -·- ----------- -·-···· --------------. ---------------- ----------------------?~.§~~1_§_~~!?~~~1-~~: __ ... _________ .!~:!_____ __1.2_4 ________ ___ 9:~~- __ ________ L __ _ _ SW Soil Sample #3 4-6' 18.8 48 0.6 J svrsoilsample-#44=6· ------- - · - ··14:5 ___ ---·----g·:g·--·-··- -·--·---6~6------ _______ J ____ _ sWsCiiisample_#6_4~;·---- ········ --33:r·- · ---·T30 _____ --------o~;.r --- ______ J ______ __
J = Result is greater than sample detection limit but less than stated reporting limit.

-l ; .~·~
-1 ·: 1
l i
I I
1 --'
l _]
: l -~
SOIL ANALYSIS l~EPORT
Field Sample II>:
Lab Sample II>: (il.<l74(ll
File II>: I SC024S2.s0
Priority: Y c.:s
,.
l>cscript ion \Location
SW Hole# I 0~2"
l,ong Count
Radionuclidc Activin· {nCi/g} Co-60 Cs-137 Pb-210 Ra-226 Ac-227 (D) Th-230 Th-232 (D) Pu-238 Am-241
Other Nuclides
Radio nuclide
0.03 DOT
* 0
0.36
• - 0.61
1.16
• 0.14
• 0
0.37
* 0
* 0
ActivitY (pCi/g)
nCi/g
DOT 2nCii;; limit. tntal activity.
{I>) Dcntll~s idcntitbtti<ll1 hy dan~htcr emissions.
Sarupk is·Aso,umcllto lx: in ~.:cular cquilihnum_
MDA
0.07
0.06
0.82
0.99
0.26
8.73
0.28
16.12
0.1
Collector: 5349 Date Received: 9/ll/05 Date Collectcli:9/J3/05
. ____.- ..
Instrument type: lligh l'urity Gmnanium
lndiGll,·,; ;"tivit~ · \1Dt\ Milt\ us.:d in limits calculatinn
Cummcnfs:
Date: 9/ I ~/OS Counted By: 52XX Analyzed By: 52HX Initials
I I I I I I I I I I I I I I I I I I I

I I I I I I I I I I I I I I I I I I I
SOIL ANALYSIS REPORT
Field Sample II>:
Lab Sample ID: GL07464
File II>: I SC024R5.s0
f•riority: Y cs
'"
Description \Location
SW Hole 11112-4" Long Count
Rad ionuclidc Activit\• {~Ci/g}
Co-60
Cs-137
Pb-210 Ra-226 Ac-227 (D)
Th-230 Th-232 (0)
Pu-238 Am-241
Other Nuclides
Radionuclide
~ 0.03 DOT
* 0.03
* 0
* 0.09
1.68
* 0.07
* 2.36
0.48
* 0
* 0.01
Activity fpCi/g)
nCi/g
DUI 2nl"iig limit. lntal activity.
(I)) l>cnutcs ic.lcntili..:atinn hy daughter cmissiuns.
Sample ;, As.,nn><:d to he in secular cquilihrimn.
MDA 0.06
0.06
0.81
0.75
0.25
8.27
0.22
16.24
0.09
Collector: 5349 Date Received: 9/13/05 Date Collccted:9/13/05
Instrument type: lligh Purity (icrmanium
lndi.:ah:~ <tcti,·it: · 1\11\A. MDA us~d inlimib c:tkulatiun
Cnmmcnts:
Dah.:: 9i 14105 Counted By: 52XX Analyzed By: 52XX Initials

.·.·:, ~ •. "I
·:fl
. I _j
·;.• .... j
J
SOIL ANALYSIS I~EPORT
Field Sample II>:
Lab S:tmplc ID: GL07463
Filt.· II>: ISC02484.s0
Priority: Y cs
i~
Dcscription\Location
SW Hole #2 0-2" Long Count
Radionuclidc Activit\' (~Ci/g)
Co-60
Cs-137 Pb-210 Ra-226 Ac-227 (0)
Th-230 Th-232 (D) Pu-238 Am-241
Other Nuclides
Radionuclidc
0.03 DOT
* 0
* 0.02
* 0
1.45
* 0
* 3.43
0.52
* 4.13
* 0
Activity (pCilg)
nCi/g
DOT 2nCi/g limil. 101al a~tivity.
(f)) Denotes idc:ntilication hy daug.hlo:r emissions .
Sample is As,urncd to h.: in secular equilibrium.
MDA
0.1
0.05
0.95
1
0.31
9.95
0.25
19.06
0.11
Collt.·ctor: 5349
Date Received: 9/13/05 Date Cnllcctcd:9/13/05
Instrument type: llii·.h Purity (j,·nnanitun
Indicates activity< MIM MI>A u..cd in limits calculation
Comments:
Date: 9/14/05 Counted By: 52XH Analyzl'd By: 52S~f · Initials
I I I I I I I I I I I I I I I I I I
c. z. rz.. It! t,- I

I I I I I I I I I I I I I I I I I I I
•
SOIL ANALYSIS REPORT
Field Sample ID:
Lab Sample ID: < il.ll7·Hl(l
File ID: I SC024X7.s0
a•riority: y cs
,.
Description \Location
SW Hole #2 2-4"
!.ong Count
Radionuclidc Activin· (nCi/g} Co-60 Cs-137 Pb-210 Ra-226 Ac-227 (D) Th-230 Th-232 (D) Pu-238 Am-241
Other Nuclides
Radionuclidc
L o.o2 DOT
* 0
0.08
0.94
* 0.55
* 0.09
* 1.69
0.28
* 3.08
* 0.02
Activity (pCilg)
nCi/g
DOT 2nCi/g limit. totul activity.
(I>) Denotes idcntilication hy daughter emission~.
Sample i, ,\s,UJn~d tu be in s..:cular equilibrium.
MI>A 0.08
0.08
0.72
0.86
0.28
7.56
0.28
13.54
0.08
Collector: 5349
Date Received: 911 3/05 llate Collcctcd:9113/05
lnstnmu:nttypc: lligh Purity Gcmwnium
Indicate~ a<:tl\·ity ·· Milk 1111>1\ used in limits 'alculation
Cnmmcnts:
Date: W 14/05 Counted By: 52XX 1\nalyzcd By: 5288 Initials
/

. : J
.. .J
. ' :)_ d
I . .J
J _j
SOIL ANALYSIS REPORT
Field Sample ID:
Lah Sample II>: GL07462
File ID: 1 SC02483 .sO
Priority: Yes
'
Dcscription\Loc;ttiun
SW Soil Sample Ill 4-<i" l,ong Count
R:uJi(HIUclidt• Activih· (pC i/g}
Co-60 Cs-137
Pb-210 Ra-226 Ac-227 (D)
Th-230 Th-232 (D) Pu-238 Am-241
Other Nuclides
Radionuelide
0.04 DOT
* 0
3.08
* 0.47
3.36
* 0.25
* 0
0.59
* 4
* 0
Activitv (pCi/g)
nCi/g
DOT 2nCi/~; limit. total ao.:livit)
{D) Denotes iJcntilication hy daughkr <:mi;.,i,m;.
Sample is :\ssulllc<lt" lw in ·.~cular ,-,tuilthrimu
MDA 0.09
0.1
1.27
1.18
0.59
12.3
0.34
22.08 . 0.13
Collector: 5349
Date Received: 9/13/05
Date Collccted:9/13/05
lnstntmcnttypc: High Purity (l~nnanium
lndic:tll'S activity< Ml I !I \11 l1\ ""'''in lunih ~akulati .. n
( :ummcnts:
Date: 9114105 CouJllcd By: 52XX ;\nalyz~d By: 52XX Initials
I I I I I I I I I I I I I I I I I I I

I I ~
I I I I I I I I I I I I I I I I I
SOIL ANALYSIS I~EP()I~T
Field S:1mplc Ill:
Lab Sample IU: GLIJ74(>S
Fil(• Ill: I SC02·186.s0
l'riorily: Y ~:s
,.
Description \Location
SW Soil Sample #2 4-6" Long Count
l{adionuclidc ActivitY {pCi/g)
Co-60
Cs-137
Pb-210
Ra-226
Ac-227 (D)
Th-230
Th-232 (D)
Pu-238
Am-241
Other Nuclides
Radionuclide
2: o.tt DOT
* 0
0.13
* 0.34
2.43
2.11
* 12.26
0.52
89.52
0.53
Activitv {pCi/g)
nCi/g
I>< IT 2nCi/g limit. hllal activity.
(I)) lknotcs idcntilicatinn br !laughter emissions.
Sample is Assumctllu he in secular C<Jililihriurn.
MDA 0.09
0.07
1.19
1.17
0.37
12.63
0.18
29.14
0.17
Collector: 5349
Date Received: 9/1 V05 nate Collected:9/ 13/05
No+ ().noly~d fo ( fr /-/JM.ft'l
t'ij .. J .. OIP
lnstruml·nt t\'pt: lligh Purity< inmanium
lmli~atcs acti\'ity '' MI>A MilA used in limits .::olculation
Cu mnu:n ts:
Date: 9114105 Counted By: 52XX Analyzed By: 52XX Initials

;,·.,1
. 1 j i
.l
l
l I I
.. l
.. J g
SOIL ANALYSIS REPORT
Field Sampk II>:
Lab Sumplc ID: GL07467
File ID: I SC0~4Xl\.s0
Priority: Y cs
~
Description \Loc<lt ion
SW Soil Sample #3 4-6" Long Count
Radionuclidc Activit" {nCi/g} Co-60 Cs-137 Pb-210 Ra-226 Ac-227 (D) Th-230 Th-232 (D) Pu-238 Am-241
Other Nuclides
Radionuclidc
L 0.03 DOT
* ()
0.33
* 0
* 0.43
0.61
* 0.38
0.74
* 11.5
* 0.1
Activity <nCi/g)
nCi/g
IJ< IT 2nCii;; limit. tr,tal activity
(D) Denote~ illcntilication hy dauglu,·r emissions
San!J'IIC is /\s,urncd In be in St:("nl:u cquilihrium.
MDA 0.1
0.09
1.06
1.09
0.29
9.79
0.17
19.81
0.11
Collector: 5:;49
nate Received: 9/13/05 Date Collcctrd:9/1 :;;os
Instrument type: lligh l'urity Germanium
Indicates ~ctivity •· MD/\. MilA u,c.J in limit- .::rkulati•'"
( :ommcuts:
Dah:: 'J/ 14/05 Counted By: 52SX Analyzed By: 52S8 lnitiuls
-----/
I I I I I I I I I I I I I I I I I I I

I I I I I I I I I I I I I I I I I I I
SOIL ANAL YSlS I~EPORT
Field Sample ID: Lab Sample ID: GL0746X
File In: ISC024X!J.s0
Priority: Y cs
Dcscriptiun \Location
· SW Soil Samplc<--#4 4-6" I .ong Count
,.
Radionuclidc
Co-60 Cs-137 Pb-210 Ra-226 Ac-227 (D) Th-230 Th-232 (D)
Pu-238 Am-241
Other Nuclides
Radionuclide
0.07 DOT
Activih· {nCi/g}
* 0
* 0
* 0.95
2.68
11.3
* 0
0.26
* 2.98
* 0
Activitv CpCi/g)
nCi/g
-DOT ::!nCi/g.limit. tutal activity.
(I>) lkn<>lcs idcntilicatiun by daughter cmissinm •.
Sampk i-; Assumed to be in secular t4uilibrium.
MDA OJ>7 0.06
1.6
1.42
0.52
21.36
0.25
29.83 0") . ..:.
Collector: 5349 lhte Received: 9/J 3/05 lhtc Collcctcd:9/13/05
Instrument type· lligh l'urit~· 1 ;,·rmaniunl
lrulic;at<:' activity ·· ,\-IDA. MIM used in limits Clllculatiun
Cum men ts:
Date: 9/14/05 Counted By: 52XX i\nalyzl'd By: 52XX Initials

.. =. ;:~
j
i:J ''-'.J
1 _j
1
j
I
j
Dcscription\Loc:ttion
SW Soil Sample #5 4-6"
Long Count
SOIL ANALYSIS REPOI~T
Field Sample ID:
Lah S:amplc II>: GL074r,9
Fill· ID: I SC02490.s0
Priority: Y cs
Collector: 5349
Date Received: 9113/05 Date Collcctcd:9/l3105
lbdionuclidc Activity {11Ci/g) MDA Co-60 * 0.02 0.07
Cs-137 * 0.02 0.07
Pb-210 * 1.17 1.24 Nol (),rtd.yzed Ra-226 2.42 1.11
for triftun<-Ac-227 (D) 3.06 0.32 c.rzt g.;j,~h Th-230 * 0 14.19
,.
Th-232 (D) Pu-238 Am-241
Other Nuclides
Radionuclide
2: 0.18 DOT
0.58
162.1
0.71
Activity (pCi/g)
nCi/g
DOT 2nCi/g limit. total activity
(Ill lknotcs itlcntil"lcation hy daughter emissions.
S:unpk i~ Assumed to he in secular C!juilihrium.
0.25
136
0.17
lndic;~tcs activity-: MilA. I\1DA used in limits Clllculation
Cummcnts:
Date: 9/14/05 Counted By: 52~8 Analyzed By: 52XX
ln~trumcnt I) l'l": lligh l'uritv < i~r1n:mium
Initials
/
CZ8/~"J....
I I I I I I I I I I I I I I I I I I I

I I I I I I I I I I I I I I I I
SOIL ANALYSIS REPORT
Field Sample Ill:
Lab Sample ID: GL07470 File 10: I SC02491.s0
Priority: Yes
,.
Dcscription\Location
SW Soil Srunplc #6 4-6' Long Count
Radionuclidc Co-60 Cs-137 Pb-210 Ra-226 Ac-227 (0)
Th-230 Th-232 (D) Pu-238 Am-241
Other Nuclides
Radionuclide
2: 0.03 DOT.
Activitv {f!Ci/g}
* 0
* 0.01
* 0
1.11
0.61
* 3.02
0.37
* 7.16
0.1
ActivitY (pCi/g)
nCi/g
-J)( ff' 2nCJ/g limit. !Oial :ICiivity.
(Ill I knntcs idcntitkatiun by dau!?htcr cmissitiO$.
S:unplc is Assumed to l>c in secular cquilil,rium.
!n,lical~~. :tclivity < MDA. MDI\ used in limits calcul:Ui<lll
MDA 0.07
0.05
0.76
0.86
0.25
8.02
0.21
14.35
0.08
Collector: 5349 Date Received: 09113/05 Date Collectcd:09/1 J/05
lnstrunu:nl type: High l'urity C.crmanium
I Comments:
I I
Date: 09/14/05 Counted By: 5288 Analyzed By: 528K Initials
•

ATTACHMENT Ill CHANGES FROM R/SW/8 POST-EX SUD THAT APPLY TO SU1, SU2, SU4, AND NEW SU14
Explanation for Attachment Ill
Figure 1: R/SW Figure 1 Revised
Table 1: Revised Comparison Table for SUs
Revised MARSSIM spreadsheet calculations for SU1, SU2, SU4, and SU14
Table 2: Sample Coordinates and Location Labels
Q ?;L-'/82-
I I I I I I I I I I I I I I I 1. I I I

I I I I I I I I I I I I I I I I I I I
Attachment Ill Explanation
Due to logistical difficulties and to enable proper implementation of runoff controls (the construction of a berm) to protect SU2 of PRS 124, the western small portion of the newly added SU14 was developed to include the area and survey locations previously covered by SU2 of PRS 124 (locations 104 and 105). The eastern section of the newly added SU14 was developed due to the removal of the electrical substation and the subsequent excavation extending further than previously anticipated. In addition, the aforementioned sample locations (1 04 and 1 05) in PRS 124 SU2 were improperly handled at the offsite lab rendering tritium analysis unobtainable. In an effort to properly evaluate the soils in the area, the boundary of RJSW/8 SU2 was redeveloped and tritium added as a COC. Due the redevelopment of SU2, SU1 and SU4 were revised as well.

\
c--
' \
\ ---
\ -
N
I R/SW Figure 1 Revision
Attachment Ill- Changed Boundaries fl \)" \'j
~\' ~=~~~===-----~:~~~ ~L~~~--=--------- [62'~-=sta'o ft I J
-- - - - ------
/
~
- - - - - - - -


() I.J.)
~ ~
Sample Standard Cleanup Deviation (s) Radionuclide Objective
.· 0.212 Ac-227+0 4.6
0.182 Am-241 ,63
Ce-141 · 38 0.0138. Cs-137+D 3.8
0.0174 Co-60 0.7 Cm-244 92
0.373 Pb-210+D 7.4 Np-237+D 10.4
Ni-95 · 2.5 0.388 Pu-238 55
0.0098 Pu-239/240 62 Pa-231 27.2
. 0.328 . Pa-231+0 4 0.527' Ra-226+D · 2.9'
Ra-228 2.1 .·
0.279 Th-228+0 2.6 Th-229+D 5.06.
Th-230 83.8 . 0.284 Th-230+D 2.8
Th-232 . 73.4' 0.276 Th-232+D' 73.4. ·.'
Tritium . 7.58E+04 U-233+D 4.8
U-233/234 103 . ~· U-234 106.1 .
U-234+D 2 U-235 15.01
U-235+D 3.2 U-238 42.3
.. .U-238+D 2.09 0.0082 Bi-207 ,··· . 1.2 0.0085 Bi-210m . 8.3
Tc-99 · 2140 Sr-90 94.72
Std. Dev. unchanged from Pre-Ex SUD Square footage revised
R-SW-8 SU-1 MARSSIM ReCalc 04-17-06
. ~ .
· .. Units (pCi/g)
. (pCi/g) (pCi/g) ··
(pCi/g) ·
(pCi/g) (pCi/g)
(JJCi/g) (pCi/g) •
· (pCi/g) (pCi/g) (pCi/g) . (pCi/g) (pCi/g) · (pCi/g): (pCi/g) ·· (pCi/g) · (pCi/g) (pCi/g) (pCi/g) .. · (pCi/g) (pCi/g)
· (pCi/g) (pCi/g) (pCi/g) (pCi/g).
(pCi/g) . (pCi/g) (pCi/g) (pCi/g) (pCi/g) (pCi/g) (pCi/g) (pCi/g) (pCi/g)
Estimate (N) - Sign Test Type I Error 0.05
z1-alpha .1.645 Type II Error 0.2
z1-beta ·.' 0.842
Effective] .· ~- ~-d~26](sJ
OCGL
LBGR
Delta
(s) Rei Shift (N)
1
0.50 ' 0.50. ·.
0.26.
1.933 9.00
Sign PI 0.9712841 Pu-238 Area Factor (N) 513
Calculat~ t-h~ Total Effect i-.e (s) ·
15-foot Triangular Grid is to be used per the Standard VSAP N=83
Sample Grid Spacing
SU Area 1,540 m2 SU Area --16~579
Grid Length 12.2 m Grid Length 39.9 Grid Height 10.5 m Grid Height 34.6
Area IR/SW/B 1 Survey Unit [SU 1 ]
ft2
ft ft
4/19/2006 7:44 AM
-------------------

-------------------
0 w \!')·
"-'· ~' ~
,
::sample Standard Cleanup
Deviation (s) Radionuclide Objective
0.212 Ac-227+D 4.6 0.182 Am-241. .63
Ce-141 38 0.0138 .. · Cs-137+D .. 3.8 0.0174 ' ' Co-60 0.7
Cm-244 .. 92 ..
0.373 Pb-210+D 7.4 . . ' ' Np-237+D 10.4
. Ni-95 2.5 .·. 0.388 Pu-238 ·55
. ··0.0098 Pu-239/240 62 Pa-231 27.2 ..
' 0.328. Pa-231+D 4 0.527 Ra-226+D 2.9 .
Ra-228 2.1 '0.279 Th-228+D 2.6
Th-229+D 5.06 Th-230 83.8 .
0.284 Th-230+D 2:8 : •!, .. · Th-232 ·. 73.4.
0.276 Th-232+D 73.4 . 18.2 ' . Tritium 7.58E+04
U-233+D 4.8 U-233/234 103
U-234 106.1 · U-234+D 2
U-235 15.01 . ·U-235+D 3.2
'· U-238 42.3 U-238+D 2.09
0.0082 Bi-207 1.2. 0.0085 '. Bi-210m 8.3
Tc-99 2140 Sr-90 94.72
Std. Dev. unchanged from Pre-Ex SUD COGs and square footage revised
R-SW-8 SU-2 MARSSIM ReGale 04-17-06
.. ·
Units (pCi/g) (pCi/g) (pCi/g) (pCi/g) (pCi/g) (pCi/g) [pCi/g) pCi/g) [pCi/g) [pCi/g) pCi/g) (pCi/g) (pCi/g) ··
. (pCi/g) (p_Ci/gj (pCi/g) (pCi/g) (pCi/g). {pCi/g) .
· (pCi/g} (pCi/g) (pCi/g) (pCi/g) (pCi/g} (pCi/g)
(QCilgj · (pCi/g)
(pCi/g) (pCi/g) (pCi/g) (pCi/g) .. (pCi/g) (pCi/g) (pCi/g) ·
Type I Error
z1-alpha
Type II Error
z1-beta
. 0.05
1.645
0.2 0.842
EffectiveC--~_-o.26j(sJ
Estimate (N) - Sign Test DCGL LBGR
Delta (s) Rei Shift (N)
1 0.50 0.50 0.26 1.933 9.00
Sign PI -<:l:971284l Pu-238 Area Factor (N) 323
Cai9ulate the Total Effecti~ (s) '
15-foot Triangular Grid is to be used per the Standard VSAP N=54
Sample Grid Spacing
SU Area EJ. · 970 m2
Grid Length · · · .. · 9. 7 m Grid Height · ··. . • 8.4 m
Area [R?SW78--]
SU Area Grid Length Grid Height
10,440 ft2
31.7 ft 27.4 ft
Survey Unit I slJ 2 I
4/19/2006 8:05 AM

n: w ~.: ~'i ~
::samp1e Standard Cleanup
Deviation (s) Radionucl.ide ·objective
0.212 Ac-227+0 4.6 0.182 Am-241 63
Ce-141 38 0.0138 Cs-137+0 3.8
.. ,0.0174 Co-60 · O.T· ...
.. .. i':' Cm-244 92 .. · ' 0.373 Pb-210+0 7:4
Np-237+0 10.4. ·· .. ,. Ni-95 2.5.·
. 0.388': Pu-238 55 0.0098 Pu-239/240 · · 62'
Pa-231 27.2 0.328· •.. Pa-231+0 4
.. 0.527 Ra-226+0 2.9 . • .. · ..... Ra-228 .· 2.1
·0.279 Th-228+0 2.6 Th-229+0 . 5.06
Th-230- . 83.8 . 0.284' Th-230+0. 2.8
... Th-232 ..... 73.4'• .
0.276 '. Th-232+0 · 73.4.' . Tritium 7.58E+04
.. U-233+0 .. 4.8 .,. U-233/234 ,· 103 '
U-234. 106.1 U-234+0 2
U-235 . ·· 15.01 U-235+0 3.2
, •t! ,I .". ;;,· U-238 42.3 -U-238+0 2.09.
0.0082 8i-207 1.2 ' 0.0085 . 8i-210m 8.3
Tc-99 2140. ' Sr-90 94.72
Std. Dev. unchanged from· Pre-Ex SUD Square footage revised
R-SW-8 SU-4 MARSSIM ReGale 04-17-06
Units I
(pCi/g) (pCi/g)
(pCi/g) (pCi/g) (pCi/g) (pCi/g) (pCi/g) (pCi/g). (pCi/g) (pCi/g)
·(pCi/g) (pCi/g) . (pCi/g)
·(pCi/g) ·_(pCi/g) (pCi/g) .·
.(pCi/g) ' _(pCi/g) . (pCi/g).· (pCi/g) ··
· (pCi/g) (pCi/g).· (pCi/g) . (pCi/g) (pCi/g) (pCi/g) (pCi/g) · · (pCi/g) •·
. (pCi/g) . (pCi/g)'
(pCi/g) (pCi/g) (pCi/g) ·. (pCi/g)
Type I Error .0:05 z1-alpha ••. ·· 1.645
Type II Error · .0.2 z1-beta • •· 0~842
Effectivej ' 0.26](s)
Estimate (N) - Sign Test DCGL L8GR
Delta (s) Rei Shift . (N)
1 0.50
0.50
0.26 1.933 9.00
Sign PI 0.971284] Pu-238 Area Factor (N) 452
dlculate:tl1e.iotal Effe~ti~ (s) :, .,·. :·.·~,:; .. ~~'::·,-'~"; ,.
15-foot Triangular Grid is to be used per the Standard VSAP N=73
Sample Grid Spacing
SU Area Grid Length Grid Height
Area
~2
~ m
IR/SW/8 ·.·]
SU Area Grid Length Grid Height
14,606 ft2
37.5 ft 32.5 ft
Survey Unit ISU 4 nul
4/19/2006 7:43 AM
------ --------------

-------------------
0 vJ .J ,_ ~
"'
Sample Standard Deviation (s) Radionuclide
0.212 Ac-227+0 0.182 Am-24.1
Ce-141. ·
0.0138 Cs-137+0. 0.0174 Co-60
Cm-244 0.373 Pb-210+0
Np-237+0 Ni-95
0.388 :. Pu-238 0~0098 .. Pu-239/240
Pa-231 0.328 . Pa-231+0 0.527 Ra-226+0
Ra-228 . 0.279. Th-228+0
Th-229+0 Th-230
0.284 Th-230+0 . Th-232
0.276 Th-232+0 Tritium
U-233+0 . .. U-233/234 .
U-234 U-234+0
U-235 U-235+0
U-238 U-238+0
0.0082 Bi-207 0.0085 Bi-210m
Tc-99 Sr-90
------
R-SW-8 SU-14 MARSSIM 04-17-06
Clea_nup Objective Units
4.6 (pCi/g) 63 (pCi/g) 38 (pCi/g) 3.8. (pCi/g) 0.7 (pCi/g) · 92 (pCi/g) 7.4 (pCi/g)
.10.4 (pCi/g) 2.5 (pCi/g) 55 (pCi/g) · 62 (pCi/g)
27.2 (pCi/g) . • 4 . (pCi/g)
2.9. (pCi/g} 2.1 (pCi/g} ·· 2.6 (pGi/g} 5.06. (pCi/g) 83.8 (pCi/g} 2.8 (pCi/g) 73.4 (pCi/g) 73.4 (pCi/g)
7.58E+04 (pCi/g} 4.8 . (pCi/g} 103 (pCi/g).
106.1 (pCi/g}
2 (pCi/g) · 15.01 (pCi/g) 3.2 (pCi/g)
42.3 (pCi/g) 2.09 (pCi/g) -· 1.2 (pCi/g)
. 8.3 (pCi/g) 2140 (pCi/g} · I 94.72 (pCi/g) I
Type I Error 0.05
z1-alpha 1.645 Type II Error . 0.2
z1-beta 0.842
Effective[ 0.26l(s)
Estimate (N) - Sign Test .DCGL LBGR Delta (s) Rei Shift (N)
1 0.50 0.50 0.26. 1.933 9.00
Sign PI 0.9712841 Pu-238 Area Factor (N) 53
Calculate theTotal Effecti\e (s)
15-foot Triangular Grid is to be used per the Standard VSAP N=10
Sample Grid Spacing
SUArea a··-158 m2
Grid Length · . · · 3.9 m Grid Height ·· · . 3.4 m
Area I RiSW/B --.. ,
SU Area Grid Length Grid Height -
Survey Unit ISU 14 · I
4/19/2006 7:42 AM

Attachment Ill Sample Coordinates and Location Labels I . . I Location Label Eastin·g Northing
SU1-RSW-1 1464761.941 598741.080 SU1-RSW-2 1464776.941 598741.080
I SU1-RSW-3 1464791.941 598741.080 SU1-RSW-4 1464806.941 598741.080 SU1-RSW-5 1464821 .941 598741.080 SU1-RSW-7 1464769.441 598754.070 I SU1-RSW-8 1464784.441 598754.070 SU1-RSW-9 1464 799.441 598754.070 SU1-RSW-10 1464814.441 598754.070 I SU1-RSW-11 1464829.441 598754.070 SU1-RSW-14 1464776.941 598767.061 SU1-RSW-15 1464 791.941 598767.061
I SU1-RSW-16 1464806.941 598767.061 SU1-RSW-17 1464821.941 598767.061 SU1-RSW-18 1464836.941 598767.061
I SU1-RSW-19 1464851.941 598767.061 SU1-RSW-22 1464814.441 598780.051 SU1-RSW-23 1464829.441 598780.051
I SU1-RSW-24 1464844.441 598780.051 SU1-RSW-25 1464859.441 598780.051 SU1-RSW-26 1464874.441 598780.051 SU1-RSW-29 1464836.941 598793.042 I SU1-RSW-30 1464851.941 598793.042 SU1-RSW-31 1464866.941 598793.042 SU1-RSW-32 1464881 .941 598793.042
I SU1-RSW-33 1464896.941 598793.042 SU1-RSW-34 1464829.441 598806.032 SU1-RSW-35 1464844.441 598806.032
I SU1-RSW-36 1464859.441 598806.032 SU1-RSW-37 1464874.441 598806.032 SU1-RSW-38 1464889.441 598806.032
I SU1-RSW-39 1464904.441 598806.032 SU1-RSW-40 1464919.441 598806.032 SU1-RSW-41 1464934.441 598806.032 SU1-RSW-42 1464851.941 598819.022 I SU1-RSW-43 1464866.941 598819.022 SU1-RSW-44 1464881 .941 598819.022 SU1-RSW-45 1464896.941 598819.022 I SU1-RSW-46 1464911.941 598819.022 SU1-RSW-47 1464926.941 598819.022 SU1-RSW-48 1464941.941 598819.022
I SU1-RSW-49 1464956.941 598819.022 SU1-RSW-50 146487 4.441 598832.013 SU1-RSW-51 1464889.441 598832.013
I SU1-RSW-52 1464904.441 598832.013 SU1-RSW-53 1464919.441 598832.013 SU1-RSW-54 1464934.441 598832.013 SU1-RSW-55 1464949.441 598832.013 I SU1-RSW-56 1464964.441 598832.013 SU1-RSW-57 1464979.441 598832.013 SU1-RSW-58 1464994.441 598832.013 I
- I
,
I c:3'8/t-v

I Attachment Ill Sample Coordinates and Location Labels
I ~ . Location Label Eastin·g Northing
SU1-RSW-59 1465024.441 598832.013
I SU1-RSW-60 1464911.941 598845.003 SU1-RSW-61 1464926.941 598845.003 SU1-RSW-62 1464941.941 598845.003
I SU1-RSW-63 1464956.941 598845.003 SU1-RSW-64 1464971.941 598845.003 SU1-RSW-65 1464986.941 598845.003 SU1-RSW-66 1465001.941 598845.003
I SU1-RSW-67 1465016.941 598845.003 SU1-RSW-68 1465031.941 598845.003 SU1-RSW-69 1464934.441 598857.993
I SU1-RSW-70 1464949.441 598857.993 SU1-RSW-71 1464964.441 598857.993 SU1-RSW-72 1464979.441 598857.993
I SU1-RSW-73 1464994.441 598857.993 SU1-RSW-74 1465009.441 598857.993 SU1-RSW-75 1465024.441 598857.993
I SU1-RSW-76 1464956:941 598870.984 SU1-RSW-77 1464971.941 598870.984 SU1-RSW-78 1464986.941 598870.984 SU1-RSW-79 1465001.941 598870.984
I SU1-RSW-80 1465016.941 598870.984 SU1-RSW-81 1465031.941 598870.984 SU1-RSW-82 1465046.941 598870.984
I SU1-RSW-83 1464979.441 598883.974 SU1-RSW-84 1464994.441 598883.974 SU1-RSW-85 1465009.441 598883.974
I SU1-RSW-86 1465024.441 598883.974 SU1-RSW-87 1465039.441 598883.974 SU1-RSW-88 1465001.941 598896.965
I SU1-RSW-89 1465016.941 598896.965 SU1-RSW-90 1465031.941 598896.965
SU2-RSW-6 1464754.441 598754.070
I SU2-RSW-12 1464 746.941 598767.061 SU2-RSW-13 1464761.941 598767.061 SU2-RSW-20 1464 784.441 598780.051
I SU2-RSW-21 1464 799.441 598780.051 SU2-RSW-27 1464806.941 598793.042 SU2-RSW-28 1464821.941 598793.042
I SU2-RSW-91 1464 709.441 598832.013 SU2-RSW-93 1464 709.441 598754.070 SU2-RSW-94 1464 724.441 598754.070
I SU2-RSW-95 1464686.941 598767.061 SU2-RSW-96 1464701.941 598767.061 SU2-RSW-97 1464716.941 598767.061 SU2-RSW-98 1464731.941 598767.061
I SU2-RSW-99 1464679.441 598780.051 SU2-RSW-100 1464694.441 598780.051 SU2-RSW-101 1464 709.441 598780.051
I SU2-RSW-102 1464724.441 598780.051
I -
I i .. , .-
c..:.S~/g?;

Attachment Ill Sample Coordinates and Location Labels I Location Label Eastin·g Northing I SU2-RSW-103 1464739.441 598780.051
SU2-RSW-1 04 1464754.441 598780.051
I SU2-RSW-1 05 1464769.441 598780.051 SU2-RSW-106 1464716.941 598793.042 SU2-RSW-107 1464731.941 598793.042 SU2-RSW-108 1464746.941 598793.042 I SU2-RSW-109 1464761.941 598793.042 SU2-RSW-110 1464776.941 598793.042 SU2-RSW-111 1464791.941 598793.042 I SU2-RSW-112 1464724.441 598806.032 SU2-RSW-113 1464739.441 598806.032 SU2-RSW-114 1464 754.441 598806.032
I SU2-RSW-115 1464769.441 598806.032 SU2-RSW-116 1464784.441 598806.032 SU2-RSW-117 1464799.441 598806.032
I SU2-RSW-118 1464814.441 598806.032 SU2-RSW-119 1464716.941 598819.022 SU2-RSW-120 1464731.941 598819.022 SU2-RSW-121 1464 7 46.941 598819.022 I SU2-RSW-122 1464761.941 598819.022 SU2-RSW-123 1464776.941 598819.022 SU2-RSW-124 1464791.941 598819.022 I SU2-RSW-125 1464806.941 598819.022 SU2-RSW-126 1464821.941 598819.022 SU2-RSW-128 1464724.441 598832.013
I SU2-RSW-129 1464 739.441 598832.013 SU2-RSW-130 1464754.441 598832.013 SU2-RSW-131 1464769.441 598832.013
I SU2-RSW-132 1464784.441 598832.013 SU2-RSW-133 1464799.441 598832.013 SU2-RSW-138 1464746.941 598845.003 SU2-RSW-139 1464761.941 598845.003 I SU2-RSW-140 1464776.941 598845.003 SU2-RSW-141 1464791.941 598845.003 SU2-RSW-148 1464769.441 598857.993 I SU2-RSW-149 1464784.441 598857.993
SU4-RSW-92 1464791.941 598870.984
I SU4-RSW-127 1464836.941 598819.022 SU4-RSW-134 1464814.441 598832.013 SU4-RSW-135 1464829.441 598832.013
I SU4-RSW-136 1464844.441 598832.013 SU4-RSW-137 1464859.441 598832.013 SU4-RSW-142 1464806.941 598845.003 SU4-RSW-143 1464821.941 598845.003 I SU4-RSW-144 1464836.941 598845.003 SU4-RSW-145 1464851.941 598845.003 SU4-RSW-146 1464866.941 598845.003 I SU4-RSW-147 1464881.941 598845.003 SU4-RSW-150 1464799.441 598857.993 SU4-RSW-151 1464814.441 598857.993
.. 1.71 ,.. ... 7 . .,
C'-toj~z_. I

I Attachment Ill Sample Coordinates and Location Labels
I . ~ Eastin·g Location Label Northing
SU4-RSW-152 1464829.441 598857.993
I SU4-RSW-153 1464844.441 598857.993 SU4-RSW-154 1464859.441 598857.993 SU4-RSW-155 1464874.441 598857.993
I SU4-RSW-156 1464806.941 598870.984 SU4-RSW-157 1464821.941 598870.984 SU4-RSW-158 1464836.941 598870.984 SU4-RSW-159 1464851.941 598870.984
I SU4-RSW-160 1464866.941 598870.984 SU4-RSW-161 1464829.441 598883.974 SU4-RSW-162 1464844.441 598883.974
I SU4-RSW-163 14648 59.441 598883.974 SU4-RSW-164 1464851.941 598896.965 SU4-RSW-237 1464701.941 598845.003
I SU4-RSW-238 1464716.941 598845.003 SU4-RSW-239 1464731.941 598845.003 SU4-RSW-240 1464694.441 598857.993
I SU4-RSW-241 1464709.441 598857.993 SU4-RSW-242 1464 724.441 598857.993 SU4-RSW-243 1464 739.441 598857.993 SU4-RSW-244 1464754.441 598857.993
I SU4-RSW-245 1464686.941 598870.984 SU4-RSW-246 1464701.941 598870.984 SU4-RSW-247 1464716.941 598_870.984
I SU4-RSW-248 1464731.941 598870.984 SU4-RSW-249 1464746.941 598870.984 SU4-RSW-250 1464761.941· 598870.984
I SU4-RSW-251 1464776.941 598870.984 SU4-RSW-252 1464709.441 598883.974 SU4-RSW-253 1464724.441 598883.974
I SU4-RSW-254 1464 739.441 598883.974 SU4-RSW-255 1464754.441 598883.974 SU4-RSW-256 1464769.441 598883.974 SU4-RSW-257 1464784.441. 598883.974
I SU4-RSW-258 1464799.441 598883.974 SU4-RSW-259 1464814.441 598883.974 SU4-RSW-260 1464731.941 598896.965
I SU4-RSW-261 1464746.941 598896.965 SU4-RSW-262 1464761.941 598896.965 SU4-RSW-263 1464776.941 598896.965
I SU4-RSW-264 1464791.941 598896.965 SU4-RSW-265 1464806.941 598896.965 SU4-RSW-266 1464821.941 598896.965
I SU4-RSW-267 1464836.941 598896.965 SU4-RSW-268 1464769.441 598909.955 SU4-RSW-269 1464 784.441 598909.955 SU4-RSW-270 1464 799.441 598909.955
I SU4-RSW-271 1464814.441 598909.955 SU4-RSW-272 1464829.441 598909.955 SU4-RSW-273 1464844.441 598909.955
I SU4-RSW-27 4 1464859.441 598909.955
... J. -
I I.
C4 Y~v

Attachment Ill Sample Coordinates and Location Labels
Location label SU4-RSW-275 SU4-RSW-276 SU4-RSW-277 SU4-RSW-278 SU4-RSW-279 SU4-RSW-280 SU4-RSW-281 SU4-RSW-282
Easting 1464791.941 1464806.941 1464821.941 1464836.941 1464851.941 1464814.441 1464829.441 1464844.441
Northing 598922.945 598922.945 598922.945 598922.945 598922.945 598935.936 598935.936 598935.936
SU14-RSW-779 1464747.250 598745.207 SU14-RSW-780 1464739.750 598758.198 SU14-RSW-781 1464834.335 598739.385 SU14-RSW-782 1464849.335 598739.385 SU14-RSW-783 1464864.335 598739.385 SU14-RSW-784 1464841.835 598752.375 SU14-RSW-785 1464856.835 598752.375 SU14-RSW-786 1464871.835 598752.375 SU14-RSW-787 1464864.335 598765.365 SU14-RSW-788 1464879.335 598765.365
I ·I I I I I I I I I I I I I I I I
- I -. I
I I I
I c~?-/9v

- - - ~ .• !.Lb"··-·--· ---~:;:iH~.lt~H~.:~. - - p-- _c_:.:_i;.:·-'-1.:.:. ~- p.;
0 ...c \:}-.)
~ ~
Survey Unit Design (SUD)
Project: R, SW, 58, 68, and 8 Solis
Review & Approval .\. a
Project Engineer: Bob Ransbottom _ji2. 0 .. 1~ rufc;s.. tfo1i::;; ---------------------Reviewer: Bob Coblentz
Reviewer: Connie Kline -====~]~----------------------------
document Title AM R. SW, 58. and 68 Slab Removal Action AM B Building Removal Action WP Demolition of Building B/R/SW/68/58 Slabs/Below Grade Structures VSAP Standard Verification SamplinQ & Analysis Plan, Final, Auoust 2004
Pre-Excavation or X Post-Excavation? Survey Units 9 and 10 Date: 5/18/2005
Summary of Changes
(for Post-Excavation SUDs ONLY)
(see following pages for details)
1. Did the COC(s) change?
2. Did the grid size or N change?
3. Did the classification change?
4. Were bias/judgmental samples collected?
5. Other significant change?
File Name: R ~..;'.\" ~! ~;n:':-: P1·::;!--E" SUD f~e\' ():':_,_!nf:
YES I NO
X
X
X
X
None
_;_.__..-_J - -:;:-.. _..:..._..:-------
Paqe _,_ of_ 11

I 0 ~ .s
.......... ~
. ' ·,,·.:·:. ·'·-··"'-. . ·------ ·:.~i;,~;+;: : /iHi/.illiiil:.. ------- ~iJJ.fhF; ..i;;_;-'- .
SUD Worksheet
Item I Summary of historic Information relevant to SU: 1
The Removal Action associated with this SUD addressed identified contamination areas with contaminants of concern (COCs) above the cleanup objective (CO).
R and SW were used for various radiological processes through the years. The R, SW, 58, and 68 slab Action Memorandum COCs include Actinium-227, Americium-241, Bismuth-207, Cesium-137, Lead-210, Proactinium-231, Plutonium-238, Plutonium-239/240, Radium-226, Strontium-90, Thorium-228, Thorium-230. Thorium-232, Tritium, Uranium-233, Uranium-234, and Uranium-238. Isotopes associated with polonium processing also include Bi-210m and Co-60. Th-229 was associated with U-233 processing. Curium-244 has been found during recent R Building drain sampling.
B Building was used for Actinium and Polonium radioisotopic research on animals. The B Building Action Memorandum COCs include Actinium-227, lead-210, Tritium, and Berylium. The tritium is due to B Building's proximity to RJSW and the Bery/ium is due to processes in the building. Isotopes associated with polonium processing also include Bi-207, Bi-210m and Co-60. In addition, a solvent shed was associated with B Building. so organic COGs include Trichloroethane, 1,2 trans-Dichloroethene, and 1,2 cis-Dichloroethene.
llem I Summary of historic data relevant to SU: 2
Item
3a
See Appendix A
coc BASIS
(pCilg)
co HS MAX
Offsite Analysis & Compendium Method
g;wrrna I 1$0-Pi:JT 1$o Th l ,,., u I Trottvrn I -S!!t>nb r MP."'"' l voc. I E~ (A-0151 (A-012) 1 JA-012) (A-0121 (A-0141 ~ro & (A-001) ""'<"'
( A-016) ~~= 010)
II" 0311
T
~ I File Name: ' '. ; .. . ·': :1 ·. 1;. Page ...L of _ 11
- - - - - - - - - - - - - - - - - - I -

------------ -------
Item
3b
Analyses or COGs in surface soil are to be performed per Mound Methods Compendium as applicable. Compendium Method A-012 is Isotopic Uranium, Isotopic Plutonium, and Isotopic Thorium by Alpha Spectrometry. Cm-244 analysis is performed using the method found in Appendix G. Compendium Method A-015 is Gamma Spectrometry. A-014 is analysis by liquid scintillation for Tritium and A-016 is analysis for Strontium-90. Note that alpha spec data will supercede gamma spec data for isotopes where the former is more sensitive (e.g., Th-230, Pu-238). Analysis for Volatile Organic Compounds (VOCs) is by Operation A-002, for Explosives is A-001. for TPH is A-023, and for metals is A-031. (See Appendix D for the Target Analyte Lists for A-001, A-010, A-023, and A-031). Surface samples/analysis are to be in accordance with MD-80036 OP 30005, 30007, 30040 for the Fidler and 90022 for the AXISS. (Note: Fidler GS and Axiss instruments are both to be used for walkover surveys. See table in Appendix F for reference.)
Changes If any, from Pre-exc SUD:
The AXISS will not be used for walkover surveys. See memo Actinide X-Ray In-Situ Scanning System "AXISS" by Ron Daily in Attachment II, Appendix L. The FIDLER will be used and if any elevated readings are found, additional soil will be removed and the area resurveyed.
Note: Attachment II, Appendix H contains survey and sample analysis results obtained during excavation (RASS data). Included are results from sampling for VOCs in SU-10. No results are above screening levels. Therefore, verification samples in SU-9 and 10 will not be analyzed for VOCs. Metals were erroneously included as COGs for SU-9 and 10. Therefore, verification samples in SU-9 and 10 will not be analyzed for metals. Analysis or RASS samples of post excavation soil at the south boundary of the B slab nearest toR and SW, revealed very low levels of tritium (See Appendix H). Therefore, tritium is being removed as a COG for Survey Units 9 and 10.
Chern basis for std dev, AM COGs/New COGs
Changes, if any, from Pre-Ex SUD:
No changes
Item 1 Classify Areas & provide justification 4
Selection Class Scan Coverage guidelines
~ .s: ~ 00 ~
The 181.447 sq. ft area covered in this SUD includes the footprints of R, SW, sus 1 -121 1 100% B, and 68 Buildings, as well as part of the Hot Waste Drain system and the t------t-----+-----------------1 loadout areas and roadways around the buildings. The H Building area is N/A I 2 excluded since it was previously verified to be clean and is not being used as a t-----+-----4----------------~ loadout or storage area for the R/SW/B demolition. All of the above buildings housed various processes that were radiological or chemical in nature. As a result, all SUs are Class 1 due to the known presence of radiological contamination in the buildings above the areas, known contamination in pipe lines below the buildings, and possible cross-contamination from the demolition and load-out of debris.
NIA I 3
File Name: Page_Lof _11
--:--:- ·;-,"'1 '' •••••· ,r-·~:{j.T~ ... ~·. :nr;;r;r:-· --- · : ··::·::J~f ': :['~~ -~--~~;) : -"--·-- ----;·-·:q~;mf: -····~>: <

i I l :.·.~-1
·\~-:l '
.. : ' l
I' I .. c ;::) en u >< ' G:l ... 0..
E
~ -~
c C'G ~
fn
G:l C
) c C'G .c (.)
...... I
(f) Q
)
·c. 0.
co >
. "E 0 0 ::> (/) )(
UJ I
...... w
0 c.. (f)
:2
1-
I.
' 0 ~I ~ a.. .. ·"
I I I I I I I I I I I I I I I I I I

-------------------Item Subdivide areas into SUs The area is divided into 12 Survey Units (SUs). The SUs were first situated according to the 5 processes that occurred in each area, but were limited in size to less than the 17,500 sq. ft.
See Appendix A for Data threshold. SU 1 is 12,347 sq. ft. and is located to the west and south of SW Building and includes the roadway as well as PRS 143, RJSWrr Bldg. Stack Diesel Fuel Storage Tank (EG-1)
See Appendix B for SUs and PRS 253 T West Stack. A portion of the SW underground exhaust duct to T West stack lies in the SU. The EG-1 diesel tank was removed under the BUSTR program. Resulting soil sample analysis results will be presented along with the data report for this SUD. The T West stack foundation will be removed under a separate work plan and SUD. SU 2 is 14,978 sq. ft. and covers the western portion of R Building and the eastern portion of SW Building and includes SW-8, SW-13, and R-108 as well as PRSs 133, 135, 139, 142, 144, 327, and 328. SU 2 also includes a portion of the PRS 131 red and yellow drain system. The PRS 437 Hot Waste line runs through this SU but is broken out under SU 12. SU 3 is 13,807 sq. ft., covers the western portion of SW and includes the PRS 132 Old and New Cave areas, the SW-20 complex, as well as PRSs 136, 137, 138, 249, and 250. A portion of the SW underground exhaust duct toT West stack lies in the SU. As with SU 2, a portion of the PRS 437 Hot Waste line runs through this SU, but is excluded. SU 4 is 18,103 sq. ft., covers the middle portion of R Building and includes the majority of the PRS 131 red and yellow drain system as well as PRSs 145 and 146. This area slightly exceeds the 17,500 sq. ft. threshold, but it is totally surrounded by other SUs and includes a clearly definable potion of R Building. SU 5 is 16,784 sq. ft. and includes the northeast portion of R Building and the associated loadout area. SU 6 is 17,247 sq. ft. and includes the southeast portion of R Building and the associated loadout area as well as the Building 68 pad. SU 7 is 15,289 sq. ft., covers the southern portion of R Building and includes the R Building underground exhaust duct to T West stack. SU 8 is 11,316 sq. ft. and covers the area under and adjacent to Building 58. It includes Rooms SW-1491149A as well as PRSs 134, 140, 141,209,234,251, and 329. As with SUs 2 and 3, a portion of the PRS 437 Hot Waste line and the PRS 425 portion ci the Hot Waste line run through this SU, but is excluded. SU 9 is 17,541 sq. ft., covers the additions to B Building and the adjacent areas. SU 10 is 16,969 sq. ft., covers the original portion of B Building and adjacent areas. SU 11 is 16,752 sq. ft., covers the northern portion of R Building, the courtyard between R, SW, and B Buildings and includes PRS 252, B Building Stack. As with SUs 2 and 3, a portion of the PRS 437 Hot Waste line as well as PRS 425, runs through this SU, but are excluded. SU 12 is 10,313 sq. ft, including sidewalls. It was established to follow the Hot Waste line, including PRSs 425, 437 and a portion of 438, through SW Building. In order to layout the required trench wall surveys, this SU was split out separately from the surrounding SUs and laid open.
Changes from Pre-Ex SUD:
For clarification, PRSs 129/130, and 244 were binned NFA by the Core Team 5/14/97 and 12117/96 respectively (See Attachment II, Appendix M). These PRSs are not included in this SUD verification. However, part of the area under the former B slab (SU 9) was evaluated for VOCs, due to the proximity to PRSs 129/130 (see Attachment II, Appendix K, Item 2.).
0 .s: s \'10 ~ File Name: ·, ·i) ·-... Page~of _11
·)·: -.,.rr•-,-r·
·:.;·:·:: ·---- . ·::::::':? ::k~ ---. __ _ 7~-:~n;::~~(-~.: :•·,·····:-·'"'. ,-.-~ ..
·-:~~ni"Hf: ':n·::·:::~:··

Item I Calculations I Rad 6a
. . : ~- : : -·-~~·-~· . .::..t___. --- . :.;~/l: ~~v ~~-~~(L: .. -~·--·----
1. Calculate the (s) for each COC listed above: See Appendix B.
2. Number of Samples (N): See Appendix B.
'---~
Spreadsheet Calculated = 9 samples based upon the data for each of SU 1 through 12.
("")
.J:
~
SU1 Scanning MDC (Area Factor) corrected = 382 samples
SU2 Scanning MDC (Area Factor) corrected = 464 samples
SU3 Scanning MDC (Area Factor) corrected= 428 samples
SU4 Scanning MDC (Area Factor) corrected = 561 samples
SU5 Scanning MDC (Area Factor) corrected = 520 samples
SU6 Scanning MDC (Area Factor) corrected = 534 samples
SU7 Scanning MDC (Area Factor) corrected= 473 samples
SUS Scanning MDC (Area Factor) corrected = 350 samples
SU9 Scanning MDC (Area Factor) corrected= nfa - Pu-236 not COC in SU-9
SU10 Scanning MDC (Area Factor) corrected= nfa- Pu-238 not COC in SU-10
SU11 Scanning MDC (Area Factor) corrected= 519 samples
SU12 Scanning MDC (Area Factor) corrected= 319 samples
Visual Sample Plan (VSP) 15 foot triangular grid:
SU1 Calculated= 9 Selected Samples (on Map)= 67 including 2 biased samples
SU2 Calculated= 9 Selected Samples (on Map)= 87 including 9 biased samples.
SU3 Calculated = 9 Selected Samples (on Map) = 90 including 17 biased samples.
SU4 Calculated = 9 Selected Samples (on Map) = 94 including 1 biased samples
SU5 Calculated= 9 Selected Samples (on Map)= 85 with 0 biased samples.
~Name: ..
.• :.L._.:.· "'":<t.;t .. ;:;;\~J;:i. :~<r:. :· ___ i!.,_...._._
Page _§_ or _ 11
-------------------

- - -- -- - - - - - - - - - - ---SU6 Calculated = 9 Selected Samples (on Map) = 88 with 0 biased samples.
SU7 Calculated = 9 Selected Samples (on Map) = 83 including 5 biased samples.
SUS Calculated= 9 Selected Samples (on Map)= 75 including 16 biased samples.
SU9 Calculated = 8 Selected Samples (on Map) = 92 with 0 biased sample.
SU10 Calculated= 8 Selected Samples (on Map)= 87 with 0 biased samples.
SU11 Calculated= 9 Selected Samples (on Map)= 86 including 1 biased sample.
SU12 Calculated= 9 Selected Samples (on Map)= 53 with 0 biased samples.
The determination of the 'number of samples is consistent with section 3.7 of the standard VSAP, which provides a default grid spacing for SUs where PU-238 is the primary driver in the removal action.
Sample locations were selected by VSP with sampling goals of finding a Hot Spot utilizing a 15-foot triangular grid with a random starting point. Additional samples chosen via judgmental sampling. Sample locations will be surveyed at the time of sampling or closely following.
A total of 1000 sample locations will be assessed.
Note: Due to safety concerns of placing an individual in the excavation of piping such as the hot waste lines, which are expected to be up to 15 feet below grade, FSS side wall sampling will be accomplished by scraping the sidewall with an excavator bucket and subsequent sampling of the material in the bucket in accordance with the procedures established the standard VSAP, Final, August 2004, Section 4.4 Special Considerations.
Changes if any, from Pre-exc SUD:
This Post-Ex SUD only applies to Survey Units 9 and 10. Puis not a COC on SU 9 & 10, therefore the MDC factor Puis not used for these survey units. Biased locations for VOCs were removed from SU 9 and 10. A default 15' grid was used because we cannot scan for tritium. A total of 176 sample locations will be assessed in SU-9 and 19_(88 samples in each).
Item I Calculations/Cham, Std dev, Number of Samples 6b
NA, See Item 2
() ~
~ ~
.._l_
'\' Item ..
Changes If any, from Pre-exc SUD:
This Post-Ex SUD only applies to Survey Units 9 and 10. Puis not a COC on SU 9 & 10, therefore the MDC factor Puis not used for these survey units. Biased locations for VOCs were removed from SU 9 and 10. A default 15' grid was used because we cannot scan for tritium. A total of 176 sample locations will be assessed in SU-9 and 10 .
Grid spacing From Appendix B. Triangular 15 foot grid, laid out by Visual Sample Plan.
File Name: Page .L. or _ 11
---.···-·····~: ~· ... "':'"".7"" ·;;/:::· ::n~Er ' lj;; ··:!'. '' ·--~r· (' l··,f.., .. ,l ...
·~.: v· ··:.:: ·:~ .i: · ···--· .. -·-· .-;~-:Fr;:·

~ __ _.....__ ' ~ . . ........ ~ll:~~~'-" ; .• ~ ,j·
7 Changes if any, from Pre-axe SUD: None
Hem QAIQC: 8
1120 via field duplicate in accordance with Mound Methods Compendium.
Q-002 Chain-of-Custody Procedures
0-003 Oo~mentation Requirements
0-004 Laboratory Data Reduction I
Q-006 Validation of Laboratory Data Packages !
Q-007 Data Assessment
0·008 Data Integrity Verification
Q-010 Electronic Data Deliverable Format Specifications- MEIMS Std ....
S-001 General Instructions for Field Personnel
S-002 Soil Sampling With a Spade and Scoop
S-028 Sample Control and Documentation
S-029 Guide to Handling, Packaging, and Shipping of Samples and Method Q-002
Item Bias/judgement samples Biased sample locations have been designated as follows:
9 Two locations have been designated in SU 1. They include one at the PRS 253 T West Stack
(Additional bias samples are always within the discretion or lhe and one at the PRS 143 EG-1 Diesel Fuel Tank. The PRS 143 sample will be analyzed for EPA.) TPH. Note: The T West Stack and foundation will be removed and verification performed under
separate work plan and SUD. The EG-1 Diesel Fuel Tank was removed under the BUSTR
0 program. Verification sampling done under that program will be submitted as an appendix to the
\Jl data report for this SUD.
~~ Nine locations have been designated in SU 2. They include one each at PRSs 133, 135. 139. ~ 142, 144, 327, 328 as well as two along the portion of the SW underground exhaust duct which . ·~ File Name: I • , io':·' ~ Page .JL of _ 11
--- ------ --- --- ----

-------------------
()
~ <>\)
~
runs through this SU.
Seventeen locations have been identified in SU 3. They include one each at PRSs 136, 137, 138, 249, 250, as well as three along the portion of the SW underground exhaust duct which runs through this SU. Also nine were designated in the SW-20 complex and will be analyzed for energetics.
One location has been designated in SU 4. This located at PRS 145.
No biased samples have been designated in SUs 5 and 6.
Five locations have been designated in SU 7. Four are located along the portion of the R underground exhaust duct which runs through this SU and one is located along the portion of the SW underground exhaust duel which runs through this SU.
Sixteen biased samples have designated in SU 8. They include one at PRS 134, two at PRS 140, five at PRS 141, one at PRS 209, five at PRS 234 (will be analyzed for TPH), and one at PRS 329.
One location has been designated in SU 9. It is located at PRS 244 and will be analyzed for VOCs.
Fifteen locations have been designated in SU 10. They are located at PRSs 129 and 130 as well as along the solvent lines into B Building and around the solvent room inside the B footprint, and will be analyzed for VOCs.
One location has been designated in SU 11. It is located at PRS 252.
No biased samples have been designated in SU 12.
Changes from Pre-Ex SUD: SU 9- VOC samples collected and reported (See Attachment II, Appendix K). No further VOC samples are planned. PRS 244 was previously binned NFA; therefore no biased samples will be taken at that location. SU 10- VOC samples collected and reported (See Attachment II Appendix K). No further VOC samples are planned. PRSs 129 and 130 were previously binned NFA; therefore no biased samples will be taken at those locations.
R1e Name: Page ...i_ of _11
----,.····-··:.·· ·.: . . ·, i .::: ·::::f~I?~- --:~-I~~r:IT:.:: ____________ .
.r~--······ ~: -·:;_~ti~; )~ir.:~:;::!~=~ ?\::" ,:.~!:!-·

·' .. :.:. .~~Ljl~L--··~·- ;\:. j>. ~;~:. :.~W~~l~· ·::· .:.:~.:-:~(.
Item I Not otherwise covered comments 10
Q "l
~ ~
~
Characterization sampling collected during removal of the slabs, piping, and other in-ground structures, will be used to convert this Pre-excavation SUD into the Post-excavation SUD. The target area map in Appendix E will be used to target specific analytes. The target areas and associated COCs are based on historical sampling. process knowledge and PRSs. Each target area requires at least 7 samples. These samples will be taken at suspect areas. especially at PRS locations. such as piping md tanks. The samples will be analyzed for COCs specific to each target area (see Appendix E). These data will be used by USEPA, OHIO EPA, DOE, and CH2M Hill to develop the Post-excavation SUD. (Note to regulators: If Th-229. Th-230. U233, or U234 are found, the 15 foot verification grid will be continue to be used due to inability to see these isotopes during walkover surveys. If these isotopes are not found during characterization, consideration will be given to expanding the grid size, due to use of the Fidler G5 and Axiss instruments for walkover surveys, which together can see all other identified radioactive COCs, during walkover surveys. See Appendix F.)
Site policy requires performance of onsite soil screening (Nal or germanium) on verification samples slated for offsite analysis and evaluation of the results prior to shipment. This analysis will generally be performed on a split of the verification sample containerized in an EPA dish (approximately 500 ml) but may be performed on the actual verification sample as long as containerization requirements are maintained for the offsite lab. Count time of the analysis will be sufficient to meet the cleanup objectives (COs) of the contaminants of concern (COCs) requiring verification.
If there is an insufficient volume of material to fill an EPA dish within a 1m x 1m square centered on the proposed sample location. due to bedrock or obstruction (such as a structure, foundation, concrete, pavemenVasphalt, large rock formations, utility bank, etc. which is not to be removed), then sedimenVsoil analysis will not be performed. In lieu of a sedimenVsoil analysis result, RadCon will survey the surface per COs and provide documentation thereof in an RSDS. Potentially impacted work areas near the excavation, where excavated material was loaded into haulers. and which are soil surfaces, are sampled within SU1. Potentially impacted work area near the excavation, where excavated materials were loaded into haulers, and which are hard surfaces (e.g., concrete and asphalt), will be surveyed and released per RadCon procedures in accordance with DOE Order 5400.5 and Mound 2000 Work Plan Appendix A Table 1 The RSDS(s) will be included in the data report as documentation. Any final sample location that does not meet the surface release criteria will be submitted to the Core Team for concurrence.
Accessibility for sampling in narrow trenches, such as in SU 12, is a constraining factor. Sampling of the excavation walls may be impeded due to excavation wall accessibility by both personnel and equipment. Sidewall sampling will be performed via excavator sampling. Accessibility to the excavation floor by personnel may be impeded due to the width of the excavation not being sufficient to use a man-box for access. Where sufficient volume of soil exists and is accessible with an excavator a soil sample will be taken, otherwise a surface survey (swipe and direct) will be performed utilizing methods available from atop the excavation. Potentially impacted work area atop the excavation, where excavated materials were loaded into haulers, and which are soil surfaces, are sampled as part of the SU. Potentially impacted work area atop the excavation. where excavated materials were loaded into haulers. and which are hard surfaces (i.e., concrete and asphalt), will be surveyed and released per RadCon procedures in accordance with DOE Order 5400.5 and Mound 2000 Work Plan Appendix A Table 1.
In-process sampling events (Characterization and Remedial Action Support Survey (RASS) samples) will be conducted during the entire 8/R/SW/68/58 slab remediation. Those samples will undergo gamma and (as needed) alpha spectrometry analysis to guide actions. RASS sampling of the remediated areas will be used to determine if the FSS (verification) sampling could be conducted.
On site gamma spec typically provides results for: Co-60, Cs-137, Pb-210, Ra-226, Ac-227 (D), Th-230, Th-232 (D). Pu-238. and Am-241. In addition. any isotopes identified to be greater than their MDA (e.g., LJ.238, Bi-210m, etc.) will be reported on the analytical results sheet. Any exceedances of the CO associated with any isotope will constitute disposal as contaminated waste and evaluation for inclusion as a COG.
File Name: Page _1Q_ of _ 11
- - - - - - - - - - - - - - - - - - -
-------------------
("')
U1 ~ ~
"
Changes from Pre-Ex SUD: Reference to the AXISS unit has been removed. See Attachment II Appendix l for details. Other than the VOC samples taken. no RASS samples were collected and analyzed. Because SU 9 and 10 are believed to have no elevated soil levels, and rad surveys of underground pipes and of concrete debris indicated no elevated levels, CH2 intends to proceed with verification per Attachment II.
File Name: Page _1L of _ 11
~~~·U~~ ::~F~:::f ?:· ...
·>·' .

1. RSDS Sheets Documenting Rad Surveys of Removed Piping
SUMMARY OF RESULTS
RSDS# 05-TF-0127 details isotopic analysis of an acid etch taken from an area at B Slab where surface scans indicated contamination on concrete debris. All results are below DOE-5400.5 limits.
RSDS# 05-R/SW-0203 details surveys taken on ends of piping excavated from beneath B Slab. All results are below DOE-5400.5 limits
oF 17
I I I I I I I I I I I I I I I I I I I

I I I I I I I I I I I I I I I I I I I
RADIOLOGICAL SURVEY DATA SHEET Page _j_ of _.!i_
B-Buildi
Acid Etch sampling of concrete footer surface
osw
Concrete debris
MAP I DRAWING
Separated concrete for acid etch sampling
05-TF-0127
NIA
OSE
Direct measurement prior to etching: 500 dpm/1 00cm2 alpha; 700 dpm/1 00cm2 beta No detectable activity on acid etch location after sample collected.
# = mremnv <r> whole body #E c mremlhr <P+tl+f) ectremfty on contact
K ·factor ot 1000
- • - • - • - .. rac:liological boundaJy
INSTRUMENTS USED
~ Serial Nuntler CelO.Oid.e
2360/43-89 5767/5798 811012005
3030 5901 212112006 ---- NA -1-----
NORTH

.,
i --~
I Survey No.
05-TF-0127 Page~ of~
RADIOLOGICAL SURVEY DATA SHEET (cont) Removable Contamination Removable Contamination
Swipes (dpm/100cm2) _ ... . / .. i.··/,j.; . .-:~:-- Swipes (dpm/1 OOcmJ) .. :--:. · .....
Sampief IVy Alpha Trtllum Comments Sampletl Pi'f Alpha Tritium Comments
1 26 0 N/A ICOd *" loco!>on \ 1\ \
\ \ _\ \
\ \ \
1\ \ \ \ \ \ \ \ \ \ \
\ \
\ \ \ \ \ A \A
N _\. N\ ~ ' \ \
r'\ \ \ \ \ \ \ \ ~ \
__'.,_ \ \ ' \ [\
\ \ \ \ \
\ \ \ ~
!COMMENTS: Nore
NOTES:
1. See M~ 10002 for calcUIIIIIon5 of WS. alremJly Cld sltin dose flies.
2. To request RO Counl Room -'Ysia for lli'f, alpha or tr11ium, leaYe colurm blank. Mark column N/A If not needed. If count room pr1nlcut
of results are llllac:hed, v.rte "see attached" n column.
i!· Annol2lte r.pecial sample type (e.g., &Oil. water). special idenlifienl or othe!wise in Comments. If not Meded. maf1( N/A.
~ 5 of=- 17
\ \
\ \
\
I I I I I I I I I I I I I I I I I I

I I I I I I I I I I I I I I I I I I I
Laboratory 10#: ProjecUfunction: Submitted: Submitted by: Point of Contact: RSDS#: Date:
LabiD Sample Location
0501842 B. Building Mar 21,2005 L. Hopkins B. Coblentz N/A Mar 30,2005
0501842 B-Bidg Etch #1
(4 s 7) 5 6 ')- ;r::. 0 11 7
Pa~ 5 '6 '+
Isotope dpm/sample Uncertainty+/- LDL Pu-238 Pu-239/240
0.46 0.27
HP#
HP#
' !c 4-- o~ 17
- 30· 05 Date
Page 1 of 1

RSDS#_o_s-:_-_T_F_-_O_I_Z_7 __ . oate:---=-~3/'-'-J ...... £>;('-'-o...;;..r' __
8-Building Concrete Acid Etch Data Analysis
Group 3 (5000 dpm) Group 2 (1000 dpm) Group '1 (1 00 dpm) Po-210 134.63 Th-230 U-233 7.25 U-238 3.45
Total: 145.33 Total:
Fraction of Fradion of Total 0.897376 Total
Sample: Sample:
Maximum Gross Alpha Measurement Group 1 Contribution: Group 2 Contribution: Group 3 Contribution:
3.37 Th-227 Th-228 Th-230 Pu-238
3.37 Total: Fraction of
0.020809 Total Sample:
560 dpm/1 OOcm2 46 dpm/1 OOcm2 12 dpm/1 00cm2
503 dpm/1 00cm2
46 100
12 + 503 -+ 1000 5000 -0
·5703
1.37 3.26 8.62 0.46
13.25
0.081815
The sum of the ratios of 0.5703 is < 1.0, therefore acceptable for release
I I
Page 4 of tf I I I I I I I I I .I
I I I I I I
t.So/~-v I

I I I I I I I I I I I I I I I I I I I
RADIOLOGICAL SURVEY DATA SHEET
?../SW DEMO AREA
~-----··-
! BD 58 \
MAP I DRAWING
'·
13-PI;D
r·-·-·-·-·-·-·-·-·-·-, ?OSTE;)
CONTAMn~ATIO~·Z
.-·-_____ • ..J
.- .....
n I ~RESPIRATOR I_! ~TRAILER
LEGEND
!?:.S.. 4 l<!C. P:.f)c. 2. fc:r s .... ~c.r ...J;.~ LO(ato'"u..-.J
8~30
l"''·~< .s:c;"; i'l;: c/i.tt' J/1 {r 'jv1t;d f, .,._ <
#E • rrn.,mlhr ((i+11-1) .,Jd,.,mrty on eM! ad
K = tact or at 1 OQ()
B. 'llrerrvhr ne:-1ron
INS i RUMEtiTS USED
~rumen1 $("~:tl Number C..l. Dud O;>te
..\3&0 S&~cln~lJ n/3/~:.-~ .... f\rf,utul ~Hu15
l I j_i • t ~ '
ML-9620 (2-98j
\(_ G O/F I 7
osw
~-DOOR ! L___ _____ _,

I Survey No. uS"· R.J,sw 6203
Page 2 of_:}_
. RADIOLOGICAL SURVEY DATA SHEET (cont.) Removable Contamination Removable Contamination
Swipes (dpm/1 00cm2) ~~{~;~~~~~~~t/~ Swipes (dpm/1 OOcm2
) :·~:~:}~k~~@~~~ffi;}~. Sample# 111-r Alpha Trith.:m Comments Sample# IVy Alpha Tntiurr-. Comments
I Sc~ I\TT1KJkd S"h.-~r'i f; ,:'(. i M-;t-CJ5 0<. \ ) 1 \ J I \ 'I / \ 6 \ ' I, I \ 1 ~
8 I nJ.M<. ¥1\l~ \
" \ \ /D \ II '\. \
12 ~ \ /3 '\ \ 1'1 \ \ /~ 1\ P , \H. c,u 1)1~ ~ ~ ,, \ \ 1'1 \ . ;e \ i'J JNSlOt PIVt \ Zo \
';z.l 1 \ :zz. ~
2.3 I ~1llt. O~o.1S\Ot. \ 2cl I \ ')5 l 1 \ 1-~ 7 !p,Ye lNS\Ot y 21 I \ 2Jf \ ~1 "' I
\
i'-"'-.. ---...
tJ ~ Pr ~
I I
\ \
\
\. '\. ,...____ \
fOMMENTS: A) I A
NOTES: 1. See MD-&1036 10002 lor calculation5 of WB, extrrmrty and skin dose 111trs. . 2. To reqUKI RO Count Room analySis for IVY. alpha or !rtbum, leave col:.nnn blank. Mark column NIA 1! no: needed. II count room printout~.~
~re a:tached, write ·see attached"" in column. c· n ;r:~ d 3. An:totale s.pec~SI sample type (e.g., soil. water). spec:al id~nhhers or ot~"'"""se "' Comm•r.t,. l! no: needod, mark N/A. ~
JAL-9520A i4-98)
~ 7 OF 17
I I I I I I I I I I I I I I I I I I

-
r ~
~ ~ ~
- - -
T' '·-
(~ _,
0 \l
.._)
- - - - - - - - - -Smear Analysis
l'oit Trre: I.BC IOOfW
Coomtins UnitiD: A'J"'I 0..11. ftle ...,., SMEAR0~4
Baldi Ead<d: 3ftlft:IS 15:38
Crosotal\. <:<>rmolio~ pemn•'!Oii Rocalibtati01l Date: 11/0Jl'Ol
Stri&l Nari>er. i.6966-I
llat:hm0~-0203 M fir!.P.MillU:'(l9) AO -··.
Detector Sample !D ID DPM AI I 0.00
Al 2 0.00
AJ ) 0.00
M 4 0.00
Ill s 1.69
D2 6 0.00
Dl 7 O.()!)
BC 8 0.00
I Cl 9 1.8)
C2 10 0.00
CJ II 0.00
c• 12 I ~I
1)1 13 us m . 14 Vll
Dl IS OOil
04 16 0.00
AI 17 0.00
Al IR 1.73
AJ 19 0.00
A4 21) 0.00
I Ill 21 0.00
m 22 1.49
m 2) 0.00
D4 l4 0,00
Cl 25 0.00
C2 lli 0.00
Cl 27 0.00
n 28 0.00
[)I 29 0.00 ,/
Aloha Acuvitv (I n......
2.22
:2.27 2.16
~.04
1.93
2.13
1.95
1.17 l.U
2.H
2.12
2.10
2.19 214
1.95
2.1 s 2.17
2.16 2.18
2.05
2.01
2.07 1.96
U? 2.34
2.16 2.11 2.05
2.11
.,119• • ef..l t-V' J/ n lo.J
3o{l.j
Rcta Activi DPM " 3,49 2.86 ,,SS 3.10
0.00 U7 0.00 1.78
0.00 1.~4
).4S 1.91
0.10 2 17
0.00 1.20 2.99 J..l2
4,97 ).$7
I.Sl 2.65
2.Jl 2.M
0.00 1.\l
0 .. 98 2 IQ
0.00 2.04
u.oo I.U
0.00 I 8l
4.13 HJ 0.43 1.16 1.15 2.16 3.10 2.77
0.00 2.08
U2 uo 0.00 1.65 0.00 1.97 0.00 1.96
0.22 2.3 I 0.00 I.J~ o_,- l.Sl
- - - - -\·;- ~
I ·_·:-~
X· ·~.;~
() ()
rJ-·

11 Her 2005 17:48 ALPHA/BETA - 1 09 Protocol II: 6 PW H3 ~403727
Time: 2.00 Data Mode: DPH Nuclide: SMGLS02 Oackground Subtract.: 1st. Vial
LL UL LCR 2S~ BKG Region A: 0.5 - 18.6 0 0.0 7.86 Region B: 2.0 - 18.6 0 0.0 7. 37 Region C: 40.0 - 2000 0 0.0 11.40
S# TIME CPHA CPMB CPMC tSIE LUM -1 10.00 7.86 7.37 11.40 630.42 5
0 2.00 556.56 536.77 0.00 615.17 0 1 2.00 0.00 0.00 0.00 396.27 0 2 2.00 0.00 0.00 0.00 344.76 0 3 2.00 0.00 0.00 0.10 517.78 9 4 2.00 0.00 0.00 0.60 476.29 0 5 2.00 1.98 2.47 0.00 396.34 0 6 2.00 0.00 0.00 0.00 456.13 0 7 2.00 0.00 0.00 0.00 253.59 0 8 2.00 0.00 0.00 0. 00 411.08 14 9 2.00 0.00 0.00 0.00 304.00 0
10 2.00 0.00 0.00 0.00 393.25 0 11 2.00 0.00 0.00 0.10 342.93 0 12 2.00 0.00 0.00 0.00 195.09 14 13 2.00 0.00 0.00 0.00 465.95 0 g 2.00 0.00 0.00 0.10 448.10 14 15 2.00 0.64 0.60 4.10 319.05 12 16 2.00 0.00 0.00 0.00 488.19 0 17 2.00 0.00 0.00 0.60 408.43 20 18 2.00 1. 39 1. 63 1.10 442.18 5 19 2.00 0.00 0.00 0.10 609.15 0 20 2.00 0.64 0.76 0.00 377.37 12 21 2.00 0.00 0.00 0. 00 431.38 0 22 z.oo 0.00 0.00 0.00 593.85 0 Z3 2.00 0.00 0.00 0.57 339.25 so 24 2.00 0.00 0.00 0.00 479.59 0 25 2.00 0.00 0.00 0.00 405.85 8 26 2.00 0.00 0.00 0.00 443.45 15 27 2.00 0.00 0.00 2.10 514.99 0 28 2.00 1.44 1.83 0.60 478.13 0 29 2.00 0.00 0.00 0.00 560.97 14
FLAG B
'-1 ,r 4 _pBS e U·MS .1t.J,c
User : 2138
Quench Set: SKGLS02
DPt11 2SIGliA 0.00
1156.17 109.88 0.00 0.00 0.00 0.00 0.00 0.00 0.00 0.00 5.34 12.93 0.00 0.00 0.00 0.00 0.00 0.00 0.00 0.00 0.00 0.00 0.00 0.00 0.00 0.00 0.00 0.00 0.00 0.00 2.06 14.58 0.00 0.00 0.00 0.00 3.49 11.71 0.00 0.00 1. 79 12.67 0.00 0.00 0 .. 00 0.00 0.00 0.00 0.00 0.00 0.00 0.00 0.00 0.00 0.00 0.00 3.43 11.14 0.00 0.00 ./
I I I
I. I I
!
I I
II I I I I I I I I I I I I

I I I I I I I I I I I I I I I I I I I
2. Preliminary Soil Sample Results Taken and Biased Sample Locations for VOCs
SUMMARY OF RESULTS
Soil samples were taken at locations called out in the pre-excavation SUD for biased sampling for VOCs at B Slab. No results were above the cleanup objective or hazard index for each analyte.
~ )QOf:::. l7

\") ~
~ ~
~
-
fC
\)'
T(
...j
-
Analyte 1. 1,1-Trictloroethane 1.1.2.2-Te:mchloroe1hene 1. 1,2· Trictloroethane 1. 1, · Dichlcroethene 1, 1 -Dichloroethane 1,2-Dichlo~obenzene
1.2-Dichlo·oethane
1 .2·Dichlo-oethene (total)
1. 2-Dichlo-opropane 1. 3-Dichlo-obenzene 1,4-Dichlo-obenzene 2-Butanone 2-Hexanone 4-melhyl-2-penlanone Acetone Benzene Bromodlct,loromethane Bromoform Bromomelhane Carbon disulfide Carbon te"achloride Chlorobenzeno Chloroethano Chloroform Chloromethane cis-1.3-Dichloropropene Oibromochloromethane Ethylbenzene Methylene chloride Styrene Tetrachloi"))thene Toluene trans-1.3-Dichloropropern
Trichloroe:hene
Vinyl chloride Xytenes(tctal) Sys. Monitoring_ Cmpds 1.2·Dichlo-oethane-d4 4 -Bromonuorobenzene Oibromonuoromethane Toluene-d3
- -
:,.
POL B-01 B-02 B-03 B-04 pglkg pglkg I pglkg pg/kg I pglkg
5.8 12 5.8 5.8 5.8 5.8 5.8
12
12 5.8 5.8 0.49 23 5.8 23 23 5.8 5.8 5.8 12 5.8 5.8 5.8 12 5.8 12 5.8 12 5.8 5.8 5.7 3.7 4.1 3.7 5.8 5.8 5.8 12
5.8 9.0 4.0 6.2 15
5.8 12
%Recovery 72-134 110 106 102 106 68-150 110 106 109 101 78-130 99 97 97 93 80-130 102 98 103 106
B-05 B-06 lllglkg IIQikg
4.7 3.6
19 16
109 106 98 94 94 86 107 94
B Building Sub-foundation Soil VOA Sampled 1120105
Blank Cells=Non-Detect
B-07 B-08 B-09 8·10 IIIQ/kg pg/kg pg/kg pg/kg
1.2
1.4
27 33 36
14 9.5 4.5 6.0
94 107 108 111 104 102 104 101 94 111 95 110 104 102 107 108
Blank cells are non-detects below Instrument detection levels Italics Indicate detections below POL I I I POL • Practical Ouantitatlon Level I I I
- - - - - - -
B-11 B-12 8·13 B-14 B-15 Blank SSL co HI pg/kg pg/kg pg/kg 11alka 11!1/kg 11!1/kg 11!1/kg 11Qikg 11Qikg
3.31E•06 8.88E•03 1.90E •04 8. 18E•06
1 06E•07 1.92e
7.61E•03 1.97E•07
255.0524
4.38E•05 2. 16E•04 6.38E•06
089 0.6 0.47 1.24E •06 1.54E+12 9.30E +06
1.92E•08 5.42E •OS 4 90E•05 4.81E•05 4.26E•06 3.77E•06 -1 26E•06
1.26E•O-I 1.16E+06
5.38E +03 5.62E +03 -1.89E+05 ---- -- 1.GOE•05.
5.1 SE•OJ 1.50E+06 2.7tE+04 1.5BE+05
3.55E•05 4.26E+06 4.80E+02
3.5 3.0 3.2 40 35 38 1.45E•07
1.87E+05 2.13E•06 2.50E•05
5.0 3.8 4.6 27 14 62.1748 5.25E+04 4.40E+05
4.14E•OO 1.19E•05 4.2GE •07
109 110 114 110 116 113 65 120 127 116 90 90 34 81 90 104 11 95 100 117 118 101 94 96
.J
- - - - - - - -

I I I I I I I I I I I I I I I I I I I
3. Analysis Results of Purple Material Found Under Slab Cap
SUMMARY OF RESULTS
During removal of the B Slab, a small area of purple discoloration was found between the slab and what appeared to be a slab cap in the area of the former plastic injection molding area (See map). Samples were taken and the analysis shows no results over the cleanup objective or hazard index of each analyte.
K li of= i 7

. .----SU-8
'G
\ \
\ \ \
N
\( 1s oF
I I I
/ I I
•• )> /
/ I '.·.
I s~
I I I I I I I I I I I
17 I

I I I I I I I I I I I I I I I I I I I
B Bldg Suo Pad "Purple" So1l Sem1volallles
Samploa 3129/05 Blank Cells=Non-Detocl
Analysis Reaults of Purple Suined Matoriul at B Slab
POL BP-23905 BP-23905
Dilu_!~ 1 Flag 100 £~9 Analyie pfl/KQ 11Q/kQ IIQikQ
Phenol 370 t>1s (2-Chtoroolhyl.i-etn<" 370 2-Chlorophenol 370 1.3-0IChlorobenzene 370
, ~ .4-0ichtO<Obenzene 370 1.2-0ochlorobenzene 370 2-Melhy1phenol 370 2.2' -oxyb1s( 1-Cnlorop,ooane) 370 4-Mcthylpnenol 730 ~ 30E•05 E . 1 tOE+05 0 N-Notrosodi-n-oropyl-am1nc 370 ----·· Hc<achloroothan" 370 Nitrobenzene 370 lsophorene 370 I 2-Nitrophenol 370 2.4-0imcthyiphenol 370 6 OOE·03 E bos(2-Chloroeth0xv) metnane 370 2.4-0ichloropnenol 370 1.2.4· Trichlorobenzene 370 Naphthalene 370 4-Chloroanitine 370 Hexac.'llorobutad1ene 370 4-Chloro-3-methyiphenol 370 2-Me1hv1naph\1"181ene 370 HexacntorocyclopentadiCne 1800 2.4,6-Trichlorophenol 370 2.4.5-Trichloroohenol 370 2-Chloronaphthalene 370 2-Nitroanijone 1800 Dimethyl phthalate 370 Aoenaph\hvtene 370 2,6-0initrotoluene 370 3-Nilroaniline 1800 Acenaphthene 370 2.4,-0initrophenol 1800 4-Nitrophenot 1800 Dibenzofuran 370 2.4-0initrotoluene 370 OICthyt p!lthalate 370 Fluorene 370 4-Chtorophenyl phl(!nyt ether 370 4-Nitroanitine 1800 4.6.-Dinitro-2-me\hviPhenol 1800 N-Nitrosodiphenytamine 370 4-Bromophenyt phenyl ether 370 Hexachlorobenzene 370 Pentachlorophenol 1800 Phenanthrene 370 Anthracene 370 Carbazole 370 Di-n-butyl phthalate 370 Fluoranlhene 370 7.30E~1 J IPvrene 370 6.80E+02 Butyl benzyl phthalate 370 3.10E•02 J Benzo{a )anthracene 370 6.40E~2
3.3.'-0ocnlorobenzidone 1800 ChJYSene 370 6.10E~2
bis (2-Ethythexy1) phthalate 370 Do-n-octvt ohlhalate 370 Benzo{b )ftuorantherie 370 5.30E+02 Benzolk lffuoranthiCne 370 3.90E+02 Benzo{a lovrene 370 3.80E~2
lndeno( 1 .2.3-od)pyrene 370 2.30E+02 J
Benzo(ghi)perytene 370 2.40E~2 J Dobenzo (a.h) anthracene 370
Cloanup ObjOCIIVO
1.00E-06 ::q/;..q
I
8.50E+06 6.40E•06
4.08E~
4.08E~
4.08E+04 4.08E+05 4.08E+03 4.08E~
Blank ~Us_ ondiCate anatytes that were not detected "J" flags are for an~fY.!~_g_etectedJl.!!~!lt less than the Praa1cal Ouantota!lon Lomot (POL) "E" nags are for analytes detected at cor~oentrat10ns a:lOVe the C!'hbratoon range ·o· flags aro for analytos that aeterm>nad from d1luted samples
Note: No doanup ObjediYO Or nazard 1nde> BXISIS lor BenzO(Qni)Pfjrytenc
Hazard
Index
1 ;.q';..q
1 OGE•06
~ 26E+Q6
8.25E+06 6.39E+06 4.26E•07
Summary: No analyte exceecs cteanu~ OO!ecl>vP o· nazare mdu•. so none w1tl be addco to lne COC hst.
JJ /\ r:- I ~-

... J
4. Analysis of results for soil at south edge of 8 Slab
SUMMARY OF RESULTS
Soil samples were taken along a 15-foot grid at the south boundary of B Slab, which is nearest toR and SW Buildings, which would be the source of any tritium. The samples were analyzed for tritium and the results are listed.
~ 1s- oF \7 C'%v
I I I I I I I I I I I I I I I I I I I

I I I I I I I I I I I I I I I I I : I
i-~
;,
1 -.
.• k
,
.....
~
.· '
'
--

SAMPLE 10
SU 1 0-RSWB-900 SU1 0-RSWB-901 SU 1 0-RSWB-904 SU1 0-RSWB-905 SU10-RSWB-911 SU1 0-RSWB-912 SU1 0-RSWB-920 SU10-RSWB-921 SU 1 0-RSWB-932 SU 1 0-RSWB-933
Blank
B Building Sub-Foundation Soil Tritium Results
Sampled May 5, 2005
MDC I H-3 pCi/g I 0.68 1.12 0.69 1.30 0.67 1.05 0.67 0.69 0.68 0.83 . ..
0.70 1.12 ... .. 0.68 0.69 0.69 0.78 0.66
.. .
0~o R~covery Lab Control Sampl.~ 91%,
SU1 0-RSWB-900 MS 89% ' SU1 0-RSWB-900 MSD 87%
r
Blank cells are results< MDC . !
•Italic results are less than Practical Quantitation Levels but > than MDC ... . ..
MDC- Mininum Detectable Concentration
....
._ .. _____ .. ___ ·-·--·--·---·-Ms·:·Matrix Spike ·----··---·~-- __ ._~~------i .
MSD - Matrix Spike Duplicate . ' '
E Jendrek 1 of 1 BBidgH-3.xls
I I I I I I I I I I I I I I I I I I

-------------------Survey Unit Design (SUD) Final
Project: T East and T West Stack Soils (PRS 253 and 254)
Review & Approval
Rev~ewer: Jim Fontain£~-~ Rev1ewer: _
--------~,~----------------------------------
document Title AM R, SW, 58, and 68 Slab Removal Action Addendum 1 WP Demolition and Car>Ring ofT East and T West Stack Foundations VSAP Standard Verification Sampling & Analysis Plan, Final, August 2004
D Pre-Excavation or ~ Post-Excavation?
Summary of Changes
(for Post-Excavation SUDs ONLY) YES NO COMMENTS
(see following pages for details)
1. Did the COC(s) change? X No COCs for T EasV T West moved to RJSW/8
2. Did the grid size or N change? X No COCs for T EasV T West moved to RJSW/8
3. Did the classification change? X No COCs for T Easv T West moved to RJSW/8
4. Were bias/judgmental samples collected? X
5. Other significant change? X No COCs for T EasV T West moved to RJSW /8
~
~ ~
~ File Name: T _Stacks_Post_Ex_SUD final Page _1_ of....§_

SUD Worksheet
Item I Summary of historic information relevant to SU: 1
The Removal Action associated with this SUD addressed identified contamination areas with contaminants of concern (COCs) above the cleanup objective (CO).
R, SW, and T were used for various radiological processes. Refer to Action Memorandum, Buildings R, SW, 58, and 68 Slab, Removal Action, Revision 1, Final, June 2003 and Buildings R, SW, 58 and 68 Slab Removal Action, Action Memorandum, Addendum 1, March 2005 for building descriptions and uses. The R, SW, 58, and 68 slab Action Memorandum Addendum 1 COCs include Actinium-227, Americium-241, Bismuth-207, Cesium-137, Lead-210, Proactinium-231, Plutonium-238, Plutonium-239/240, Radium-226, Silver 108m, Strontium-90, Thorium-228, Thorium-230, Thorium-232, Tritium, Uranium-233, Uranium-234, and Uranium-238. Isotopes associated with polonium processing also include Bi-21 Om and Co-60.
Item I Summary of historic data relevant to SU: 2
Item
3a
\"'}
~
See Appendix A
coc BASIS
See Appendix C
(pCi/g)
co HS MAX gamma (A-015)
Offsite Analysis & Compendium Method
lso Pu I lso Th I lso U (A-012) (A-012) (A-012)
Tritium I Strontium (A-014) -90 (A·
016)
Metals & Mercury (A.Q31)
Analyses of COCs in surface soil are to be performed per Mound Methods Compendium as applicable. Compendium Method A-012 is Isotopic Uranium, Isotopic Plutonium, and Isotopic Thorium by Alpha Spectrometry. Compendium Method A-015 is Gamma Spectrometry. Ag-108m will also be by gamma spectroscopy. A-014 is analysis by liquid scintillation for Tritium. Note that alpha spec data will supercede gamma spec data for isotopes where the former is more sensitive (e.g., Th-230, Pu-238). Surface samples/analysis are to be in accordance with MD-80036 OP 30005, 30007, 30040 for the Fidler.
File Name: T _Stacks_Post_Ex_SUD final Page _L of .JL
-------------------

-------------------
Item
3b
Changes If any, from Pre-exc SUD: COCs for the T East Stack in the Pre-Ex SUD were by default the same as for the T West Stack. However, prior to demolition, Radiological Controls performed an evaluation of the radiological history of the stack and fanhouse and also performed pre-demolition radiological surveys. After demolition, debris pile surveys were performed on the stack and fanhouse debris. The survey results indicated that the debris met surface release criteria. In-process demolition surveys and RASS samples forT East Stack reveal no contamination exceeding cleanup objectives (see Appendix II). A MARSSIM Final Status Survey was performed in accordance with the T Building Verification Sampling and Analysis Plan on the T Buildings East Headhouse and the horizontal and vertical shaft that led from the Headhouse to the previously demolished T East Stack. (See T Building Final Status Survey Report for Survey Units SYS-01 and SYS-01 B). These structures were surveyed for direct activity and removable contamination. No elevated areas were detected. The Core Team has approved the Final Status Survey Report for these Survey Units. No soil remediation was indicated or performed around the T East Stack.
Therefore, no COCs have been identified forT East Stack and, by extension, verification sampling is not required. T West Stack verification sampling will be folded into the RISW/B Post Ex SUD and removed from this SUD.
Chern basis for std dev, AM COCs/New COGs NA, none identified.
Item 1 Classify Areas & provide justification 4
Selection Class
SU 1 (T l1
Scan Coverage guidelines
1100%
~ "-\
The 10,107 sq. ft area covered in this SUD includes a 15 foot perimeter around the footprints of T East and T West Stacks. Since the T East and T West Stacks were connected to buildings, which housed various processes that were radiological and were known to be radiologically contaminated, all SUs
East) & SU 2 (TWest Stacks)
are Class 1. Air Shafts connecting the T East and T West stacks to T Building 1----will be remain and·wm be surveyed under the T Building VSAP. The portion of Air Shafts connecting the T West Stack toR and SW Buildings that lie outside 1----
N/A i a 15 foot perimeter ofT West Stack will be removed under the RISW/B Slab removal work plan and verified under the RISW/S Slab SUD; however the sections that lie within a 15 foot perimeter of the stack will be removed under the T Stack Foundation work Plan and will verified under this SUD.
N/A 3
~ ~ ~ Nafne: T _Stacks_Post_Ex_SUD final Page ..L of _1L

Changes If any, from Pre-exc SUD: COCs for the T East Stack in the Pre-Ex SUD were by default the same as for the T West Stack. However, prior to demolition, Radiological Controls performed an evaluation of the radiological history of the stack and fanhouse and also performed pre-demolition radiological surveys. After demolition, debris pile surveys were performed on the stack and fanhouse debris. The survey results indicated that the debris met surface release criteria. In-process demolition· surveys and RASS samples forT East Stack reveal no contamination exceeding cleanup objectives (see Appendix II). A MARSSIM Final Status Survey was performed in accordance with the T Building Verification Sampling and Analysis Plan on the T Buildings East Headhouse and the horizontal and vertical shaft that led from the Headhouse to the previously demolished T East Stack. (See T Building Final Status Survey Report for Survey Units SYS-01 and SYS-01 B). These structures were surveyed for direct activity and removable contamination. No elevated areas were detected. The Core Team has approved the Final Status Survey Report for these Survey Units. No soil remediation was indicated or performed around the T East Stack.
Therefore, no COCs have been identified forT East Stack and, by extension, verification sampling is not required. T West Stack verification sampling will be folded into the RJSW/B Post Ex SUD and removed from this SUD.
Item I Subdivide areas into SUs 5
The area is divided into 2 Survey Units (SUs). Each SU includes its associated stack, fanhouse, and a 15 foot perimeter around the facility. The T West Stack SU-2 includes PRS 253 and encompasses 6,431 sq. ft. The T East Stack SU-1 includes PRS 254 and encompasses 3,676 sq. ft.·
~
""" ~ o<;:)
~
See Appendix A for Data
See Appendix B for SUs
Changes If any, from Pre-exc SUD: COCs for the T East Stack in the Pre-Ex SUD were by default the same as for the T West Stack. However, prior to demolition, Radiological Controls performed an evaluation of the radiological history of the stack and fan house and also performed pre-demolition radiological surveys. After demolition, debris pile. surveys were performed on the stack and fanhouse debris. The survey results indicated that the debris met surface release criteria. In-process demolition surveys and RASS samples forT East Stack reveal no contamination exceeding cleanup objectives (see Appendix II). A MARSSIM Final Status Survey was performed in accordance with the T Building Verification Sampling and Analysis Plan on the T Buildings East Headhouse and the horizontal and vertical shaft that led from the Headhouse to the previously demolished T East Stack. (See T Building Final Status Survey Report for Survey Units SYS-01 and SYS-01 B). These structures were surveyed for direct activity and removable contamination. No elevated areas were detected. The Core Team has approved the Final Status Survey Report for these Survey Units. No soil remediation was indicated or performed around the T East Stack.
Therefore, no COCs have been identified forT East Stack and, by extension, verification sampling is not required. T West Stack verification sampling will be folded into the RJSW/B Post Ex SUD and removed from this SUD.
File Name: T _Stacks_Post_Ex_SUD final Page _L of _lL
- - - - - - - - - - - - - - -· - - - -

- - - - - - - - - - ·- - - - - - - - -Item I Calculations I Rad 6a
('\ ...... t' ~
\
1. Calculate the (s) for each COC listed above: See Appendix B.
2. Number of Samples (N): See Appendix B.
Spreadsheet Calculated= 10 samples based upon the data for each SU.
SU-2 (T West Stack) Scanning MDC (Area Factor) corrected = 199 samples
SU-1 (T East Stack) Scanning MDC (Area Factor) corrected= 114 samples
Visual Sample Plan (VSP) 15 foot triangular grid:
SU-2 (T West Stack) Calculated= 34 Selected Samples; (on Map)= 35 including 1 biased sample.
SU-1 (T East Stack) Calculated= 19 Selected Samples; (on Map)= 20 including 1 biased sample.
The determination of the number of samples is consistent with section 3.7 of the standard VSAP, which provides a default grid spacing for SUs where PU-238 is the primary driver in the removal action.
Sample locations were selected by VSP with sampling goals of finding a Hot Spot utilizing a 15-foot triangular grid with a random starting point. Additional samples chosen via judgmental sampling. Sample locations will be surveyed at the time of sampling or closely following.
A total of 55 sample locations will be assessed.
Changes If any, from Pre-exc suo: COCs for the T East Stack in the Pre-Ex SUD were by default the same as for the T West Stack. However, prior to demolition, Radiological Controls performed an evaluation of the radiological history of the stack and fan house and also performed pre-demolition radiological surveys. After demolition, debris pile surveys were performed on the stack and fanhouse debris. The survey results indicated that the debris met surface release criteria. In-process demolition surveys and RASS samples forT East Stack reveal no contamination exceeding cleanup objectives (see Appendix II). A MARSSIM Final Status Survey was performed in accordance with the T Building Verification Sampling and Analysis Plan on the T Buildings East Headhouse and the horizontal and vertical shaft that Jed from the Headhouse to the previously demolished T East Stack. (See T Building Final Status Survey Report for Survey Units SYS-01 and SYS-01 B). These structures were surveyed for direct activity and removable contamination. No elevated areas were detected. The Core Team has approved the Final Status Survey Report for these Survey Units. No soil remediation was indicated or performed around the T East Stack.
Therefore, no COCs have been identified forT East Stack and, by extension, verification sampling is not required. T West Stack verification sampling will be folded into the RISW/B Post Ex SUD and removed from this SUD .
Ale Name: T _Stacks_Post_Ex_SUD final Page __§_ of .JL

~ Calculations/Chem, Std dev, Number of Samples 6b
NA, none identified.
Changes if any. from Pre-exc SUD:
Item 1 Grid spacing 7
From Appendix B. Triangular 15 foot grid, laid out by Visual Sample Plan.
~ ~
~ ~ ~
Changes If any, from Pre-exc suo: COGs for the T East Stack in the Pre-Ex SUD were by default the same as for the T West Stack. However, prior to demolition, Radiological Controls performed an evaluation of the radiological history of the stack and fanhouse and also performed pre-demolition radiological surveys. After demolition, debris pile surveys were performed on the stack and fanhouse debris. The survey results indicated that the debris met surface release criteria. In-process demolition surveys and RASS samples forT East Stack reveal no contamination exceeding cleanup objectives (see Appendix II). A MARSSIM Final Status Survey was performed in accordance with the T Building Verification Sampling and Analysis Plan on the T Buildings East Headhouse and the horizontal and vertical shaft that led from the Headhouse to the previously demolished T East Stack. (See T Building Final Status Survey Report for Survey Units SYS-01 and SYS-01 B). These structures were surveyed for direct activity and removable contamination. No elevated areas were detected. The Core Team has approved the Final Status Survey Report for these Survey Units. No soil remediation was indicated or performed around the T East Stack.
Therefore, no COGs have been identified forT East Stack and, by extension, verification sampling is not required. T West Stack verification sampling will be folded into the RJSW/B Post Ex SUD and removed from this SUD.
File Name: T _Stacks_Post_Ex_SUD final Page ....§_ of .JL
- - - - - - - - - - ·- - - - - - - - -

-------------------~
Item I QA/QC: 8
1120 via field duplicate in accordance with Mound Methods Compendium.
Q-002 Chain-of-Custody Procedures
Q-003 Documentation Requirements
Q-004 Laboratory Data Reduction
Q-006 Validation of Laboratory Data Packages
Q-007 Data Assessment
Q-008 Data Integrity Verification
Q-010 Electronic Data Deliverable Format Specifications- MEIMS Std.
S-001 General Instructions for Field Personnel
S-002 Soil Sampling With a Spade and Scoop
S-028 Sample Control and Documentation
S-029 Guide to Handling, Packaging, and Shipping of Samples and Method Q-002
Item 1 Bias~udgment samples 9
~ .....,)
~ ~
~
(Additional bias samples are always within the discretion of the EPA.)
Ale Name: T_Stacks_Post_Ex_SUD final
Biased sample locations have been designated as follows:
One location was designated at the base of each stack.
Note: Biased samples were placed along the removed underground air shafts from R and SW Buildings to the T West Stack in the R, SW, 58, 68, and B Soils SUD. The underground air shafts from T East and T West Stacks toT Building will not be removed. They will be released through surveys performed under requirements of the T Building Removal Action, Action Memo.
Page _]_ of .JL (;,

9 Changes If any, from Pre-exc suo: COCs for the T East Stack in the Pre-Ex SUD were by default the same as for the T West Stack. However, prior to demolition, Radiological Controls performed an evaluation of the radiological history of the stack and fanhouse and also performed pre-demolition radiological surveys. After demolition, debris pile surveys were performed on the stack and fanhouse debris. The survey results indicated that the debris met surface release criteria. In-process demolition surveys and RASS samples forT East Stack reveal no contamination exceeding cleanup objectives (see Appendix II}. A MARSSIM Final Status Survey was performed in accordance with the T Building Verification Sampling and Analysis Plan on the T Buildings East Head house and the horizontal and vertical shaft that led from the Head house to the previously demolished T East Stack. (See T Building Final Status Survey Report for Survey Units SYS-01 and SYS-01 B). These structures were surveyed for direct activity and removable contamination. No elevated areas were detected. The Core Team has approved the Final Status Survey Report for these Survey Units. No soil remediation was indicated or performed around the T East Stack.
Therefore, no COCs have been identified forT East Stack and, by extension, verification sampling is not required. T West Stack verification sampling will be folded into the RJSW/B Post Ex SUD and removed from this SUD.
Item I Not otherwise covered comments 10
\'4 ....,~
~
RASS sampling collected during removal of the slabs and other in-ground structures, will be used to convert this Pre-excavation SUD into the Postexcavation SUD and adjust COCs as appropriate. This data will be used by USEPA, OHIO EPA, DOE, and CH2M Hill to develop the Post-excavation SUD. .
Site policy requires performance of onsite soil screening (Nal or germanium) on verification samples slated for offsite analysis and evaluation of the results prior to shipment. This analysis will generally be performed on a split of the verification sample containerized in an EPA dish (approximately 500 ml) but may be performed on the actual verification sample as long as containerization requirements are maintained for the offsite lab. Count time of the analysis will be sufficient to meet the cleanup objectives (COs) of the contaminants of concern (COCs) requiring verification.
If there is an insufficient volume of material to fill an EPA dish within a 1m x 1m square centered on the proposed sample location, due to bedrock or obstruction (such as a structure, foundation, concrete, pavemenVasphalt, large rock formations, utility bank, etc. which is not to be removed), then sedimenVsoil analysis will not be performed. In lieu of a sedimenVsoil analysis result, RadCon will survey the surface per COs and provide documentation thereof in an RSDS. Potentially impacted work areas near the excavation, where excavated material was loaded into haulers, and which are soil surfaces, are sampled within SU1. Potentially impacted work area near the excavation, where excavated materials were loaded into haulers, and which are hard surfaces (e.g., concrete and asphalt), will be surveyed and released per RadCon procedures in accordance with DOE Order 5400.5 and Mound 2000 Work Plan Appendix A Table 1. The RSDS(s) will be included in the data report as documentation. Any final sample location that does not meet the surface release criteria will be· submitted to the Core Team for concurrence.
In-process sampling events (Characterization and Remedial Action Support Survey (RASS) samples) will be conducted during the T East and T West stack slab removal. Those samples will undergo gamma and (as needed) alpha spectroscopy analysis to guide actions. RASS sampling of the remediated areas will be used to determine if the FSS (verification) sampling could be conducted.
On site gamma spec typically provides results for: Co-60, Cs-137, Pb-210, Ra-226, Ac-227 (D), Th-230, Th-232 (D), Pu-238, and Am-241. In addition, any isotopes identified to be greater than their MDA (e.g., U-238, Bi-21 Om, etc.) will be reported on the analytical results sheet. Any exceedances of the CO associated with any isotope will constitute disposal as contaminated waste and evaluation for inclusion as a COC.
~ile Name: T _St2cksJ'os:_E:x_SUD final Page .JL of .JL
-------------------

I I I I I I I I I I I I I I I I I I I
APPENDIX II
ATTACHMENTS FOR POST-EX SUD FOR REVIEW
This attachment presents RASS sample results and other back-up data to justify not performing verification sampling forT East Stack.
• • •
Map for T East Stack RASS sampling RASS sample results forT East Stack RASS Sample Locations

T East Stack location
N
I SU-1
~
Fanhouse location
Plenum Opening to T Building
10 15ft
T EAST STACK SURVEY UNIT 1 with SAMPLE LOCATIONS
\'1>
~ ~ - - - - - - -· - - - - - - - - - - - -

- -Sample ID
RJSWTES-01 RISWTES..()2 RJSWTES..()J RJSWTE$..()4 RJSWTES-05 RJSWTE$..()6 RJSWTES-07 RISWTE$..()8 RJSWTE$..()9 RJSW TES-10 RJSWTES-11 RJSWTES-12 RJSWTES-13 RJSWTES-14 RISW TES-15 RJSWTES-16 RJSW TES-17 RISWTES-18 RJSWTES-19 RJSWTES-20
~
'?._~l
-labiO
GL09741 Gl09742 GL09743 GL09744 Gl09745 GL09746 Gl09747 GL09748 GL09749 GL09750 GL09751 GL09752 GL09753 GL09754 GL09755 GL09756 GL09757 GL09758 GL09759 GL09760 Std. Oev.
Max
- -Co-60
co 0.76 IPCil<l Activity MOA
0 0.07 0 0.05 0 0.05
O.Q1 0.05 O.D1 0.08 0.04 O.o7
0 0.1 0.03 0.05
0 0.08 0 0.09
0,01 0.08 0 0.07 0 0.05
0.01 O.Q7 0 0,06
0.05 0.06 0.02 0.06 0.03 0.05
0 0.07 0.01 0.05
0.015 0.05
~"'~
T East Stack RASS Samples.xls
- - - - - -T East Stack RASS Samples Jan. 30, 2006
Cs-137 Pb-210 Ra-226 Ac-227 3.84 Cilg 7.45 Cil!l 3.01 Cilg 4.64 Clln
Activity MOA Activity MOA Activity MDA Activity MOA 0.03 0.04 0.38 0.55 1.41 0.07 0 0.22 0.02 0.05 0.51 0.6 1.45 0.63 0.03 0.21 0.04 0.04 0.54 0.58 1.38 0.6 0 0.23 0.08 0.04 0.72 0.5 1.48 0.56 0 0.22 O.o3 0.06 0.51 0.75 1.17 0.77 0 0.28 0.07 0.06 0.72 0.78 1.83 0.77 0.15 0.27 0.03 0.06 0.51 0.8 1.05 0.92 0.14 0.29 0.01 O.o7 0.76 0.74 0.67 0.89 0.1 0.27 0.03 0.05 0.83 0.6 1.34 0.78 0.04 0.26 0.05 0.05 0.72 0.65 1.08 0.69 0.07 0.26 O.o3 0.06 1.35 0.66 1.08 0.81 0.05 0.35 0.04 0.04 0.78 0.61 1.26 0.77 0 0.25 0.02 0.04 0.96 0.56 0.9 0.66 0 0.25
0 O.Q7 1.48 0.8 1.45 0.88 0 0.33 0.05 0.05 0.45 0.68 1.12 0.81 0 0.28 0.06 0.07 1.16 0.7 2.71 0.89 0.24 0.27 0.09 0.06 1.23 0.76 1.8 0.78 0 0.29 0.05 0.05 0.85 0.62 1.73 0.73 0.07 0.23 0.05 0.04 0.87 0.51 1.27 0.67 0 0.21 0.16 0.05 1.66 0.72 2.18 0.83 0 0.28
0.035 0.359 0.463 0.067 0.16 1.66 2.71 0.24
- - - - - - - -Th-230' Th·232 Pu-238 Am-241 2.8 [pCi/g 2.1 [pCIIg 55[pCi/g 63.1 pCi!g
Activity MDA Activity MDA Activity MOA Activity MOA 128 5.92 0.3 0.2 2.82 13.42 0.02 0.7
0 6.37 0.43 0.19 3.93 13.14 0.03 0.06 1.58 6.27 0.45 0.18 0 13.05 0.03 0.06 0.45 • 5.23 0.3 0.18 0.26 12.81 O.ot 0.06 4,45 7.08 0.46 0.25 0.05 12.65 0 0.08 3.92 7.98 0.78 0.14 0.12 14.63 0.01 0.09
0 8.9 0.67 0.22 0 15.28 0 0.1 1.4 7.4 0.44 0.19 1.87 13.59 0.04 0.08
5.04 7.3 0.45 0.22 0 13.67 0 0.08 1.88 7.3 0.59 0.21 0.36 11.83 O.D1 0.07
0 7.73 0.17 0.27 0 15.55 0.02 0.08 1.82 6.56 0.38 0.22 1.09 14.4 0 0.07
0 6.04 0.4 0.19 0 14.15 0.02 0.06 0 8.95 0.98 0.13 0 16.16 0 0.09 0 7.45 0.33 0.24 7.93 12.04 0.08 0,07
1.79 9.01 0.64 0.22 0 17.29 0 0.1 1.29 7.53 0.67 0.09 0 14.34 0 0.09 1.03 6.84 0.37 0.19 0 14.71 0 O.Q7
0 6.31 0.3 0.15 0 15.37 0.02 0.06 1.06 7.43 0.43 0.21 3.42 15.6 0.05 0.08
1.528 0.192 2.039 0.021 5.04 0.98 7.93 0.08
• Th-230 acceptable If Activity is >CO but< MOA. and MOA <10 pCi/g
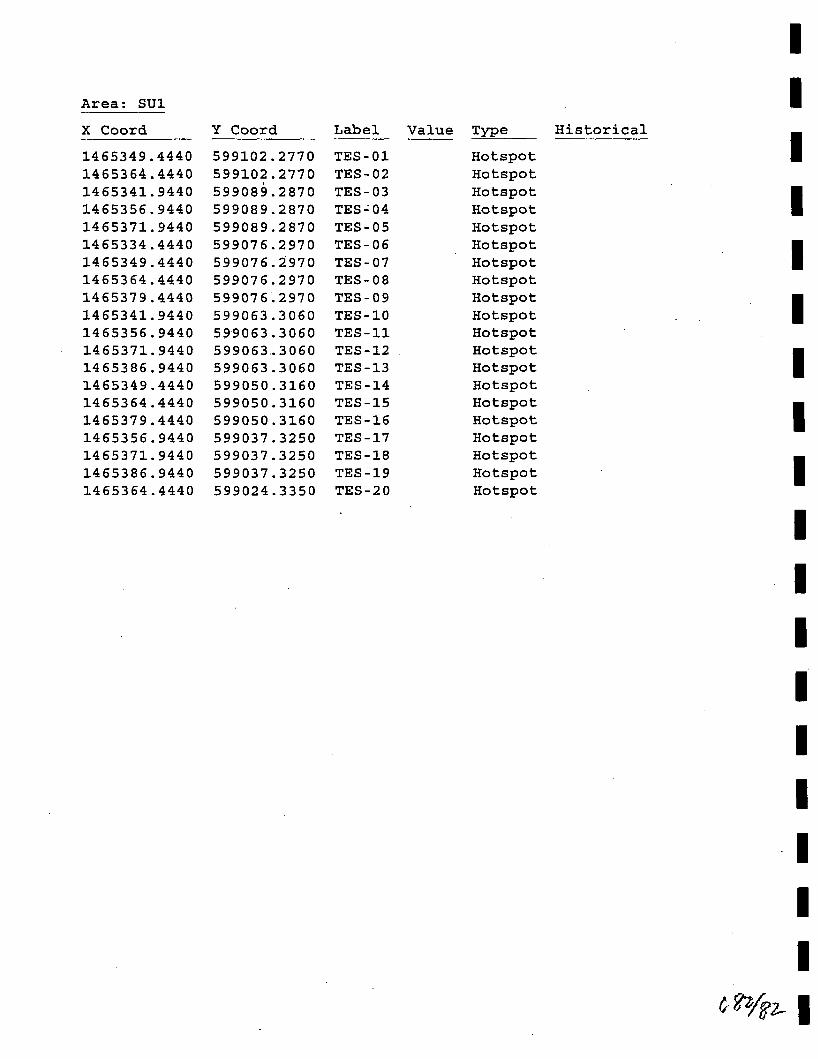
Area: SOl
X Coord Y Coord Label
1465349.4440 599102.2770 TES-01 1465364.4440 599102.2770 TES-02 1465341.9440 599089.2870 TES-03 1465356.9440 599089.2870 TEs..:o4 1465371.9440 599089.2870 TES-05 1465334.4440 599076.2970 TES-06 1465349.4440 599076.2970 TES-07 1465364.4440 599076.2970 TES-08 1465379.4440 599076.2970 TES-09 1465341.9440 599063.3060 TES-10 1465356.9440 599063.3060 TES-11 1465371.9440 599063.3060 TES-12 1465386.9440 599063.3060 TES-13 1465349.4440 599050.3160 TES-14 1465364.4440 599050.3160 TES-15 1465379.4440 599050.3160 TES-16 1465356.9440 599037.3250 TES-17 1465371.9440 599037.3250 TES-18 1465386.9440 599037.3250 TES-19 1465364.4440 599024.3350 TES-20
Value Type Historical
Hotspot Hotspot Hotspot Hotspot Hotspot Hotspot Hotspot Hotspot Hotspot Hotspot Hotspot Hotspot Hotspot Hotspot Hotspot Hotspot Hotspot Hotspot Hotspot Hotspot
I I I I I I I I I I I I I I I I I
I I I I I ATTACHMENT D
I BACKFILL PACKAGES
I I • ·sus 1, 2, 4, & 14
• SUs 3 & 11-13
I • sus • SU6 • SUs 7-8
I • SUs 9-10
I I I I I I I I ·I

CD of Attachment D. (Backfill Packages)
'~
~
' ~~ \ Backfill Packages· '~
·- ---" .-·· ·'c.

I I I I I I I I I I I I I I I I I I I
ATTACHMENT E BUSTR LETTER & PRS 234 RECOMMENDATION PAGE

I I I I I I I I I I I I I I I I I I I
October 05, 2005
Ohio Department of Commerce Division of State Fire Marshal
Bureau of Underground Storage Tank Regulations 8895 E. Main St. • P.O. Box 687 Reynoldsburg, OH 43068-9009
(614) 752-7938 FAX (614) 752-7942 www.com.state.oh.us
Bob Taft Governor
Doug White Director
WILLIAM TAYLOR DIRECTOR MCP US DEPT OF ENERGY 175 TRI COUNTY PARKWAY SPRINGDALE, OH 45246
SITE: U.S. DEPT OF ENERGY EMERGENCY GENERATORS 1& 2 1 MOUND AVE MIAMISBURG OH MONTGOMERY COUNTY RELEASE #57000630-N00004
RE: NO FURTHER ACTION STATUS REGARDING ·cORRECTIVE ACTION REQUIREMENTS ·
Dear Director Taylor:
The Bureau of Underground Storage Tank Regulations (BUSTR) has reviewed all information submitted for the referenced release. Based on this information, BUSTR requires no further action under Ohio Administrative Code 1301 :7-9-13, effective September 1992.
Thank you for your cooperation. If you have any questions, please contact our office at (614) 752~7938.
Sincerely,
XC: Site File John Lehew, CH2M HILL Mark Case, Montgomery County Health Department Robert L Bobbitt, Miamisburg Fire Dept
£ {:t , I ,· ~ PI< ~ I t.{ 3 I ~~~~nEb
FINANCIAL INSTITUTIONS • INDUSTRIAL COMPLIANCE· LIQUOR CONTROL· REAL ESTATE AND PROFESSIONAL UCENSING • SECURITIES • STATE FIRE MARSHAL • UNCLAIMED FUNDS "An Equal Oppor/llnity Employer and Service Provider ..

MOUND PLANT PRS 234
FORMER TANK SITE BUILDING 58 DIESEL FUEL
RECOMMENDATION: This Potential Release Site (PRS) is the fonner location of a 3,000 gallon unlined, steel tank that was used to supply diesel fuel to an emergency generator. The tank was identified as a PRS because of its inclusion in the Mound Plant Underground Storage Tank Program Plan and Regulatory Status Review. Components of diesel fuel arc the contaminants of concern associated with this PRS.
The tank was removed in December, 1989. During closure and removal, three soil samples were collected from the base, and the east and west walls of the open excavation. Lab analysis for Total Petroleum Hydrocarbon (I'PH) indicated no contamination above the detection limit of 5 ppm as compared to the Bureau of Underground Storage Tank Regulations (BUSTR) guideline criteria of 105 ppm. Soil gas samples in the vicinity ofPRS 234 detected trichloroethane (111-
TCA), trichloroethene (TCE) and toluene. Calculations converting the 10-6 Risk Based Guideline Values for these compounds (given in mg contaminant per kg soil) into a corresponding 10-6 Risk Based Guideline Values for soil gas concentrations (parts contaminant per parts soil gas) showed the 111 TCA detection was approximately 60 times less than the guideline criteria, the TCE detection approximately 16 times less than the guideline criteria , and the toluene detection approximately 50,000 times less then guideline criteria. Radiological analysis also indicated Pu-238 and Th-232 below their guideline criteria of 25 pCilg and 5 pCi/g respectively.
Therefore, since the VOC soil gas detections establishing this soils location as a PRS do not show evidence of contamination. above guideline criteria and since there is no additional Jab data or history to suppon evidence of contamination. PRS 234 requires NO FURTHER ASSESSMENT.
CONCURRENCE: DOE!MB:
USEPA:
OEPA:
Arthur W. Kleinrath, Remedial Project Manager
(date)
vb._Y'i/, ; }
(date)
SUMMARY OF COMMENTS AND RESPONSE i (,I 7 b Comment period from 7 q to _...LI ...... 0.c..,/LL-f-.C::::~....J.f~1~?!::::....._ __ _
~ No comments were received during the comment period.
0 Comment responses can be found on page ____ of this package.
Pt<S ~34 . ·~ E6-~
I I I I I I I I I I I I I I I I I J
E--z.;~ I

SU9-RSW081 • StJ9-RSW082 SU9-RSW083 SU9-RSW084 SU9-RSW085 SU9-RSW086
. • • a •
SU9-RSW071 SU9-ASW072 SU9-RSW073 SU9-RSW074 SU9-RSW075 SU9-RSW076 SU9-RSW077 SU9-RSW078 SU9-RSW079 SU9-RSW080
• • • • • • • • • • SU •RS174 SU9-AS175 SU10 5176
• ~S 9-RSW061 SU9-RSW062 SU9-RSW063 SU9-RSW064 SU9-RSW065 SU9-F:I_!;iW066 SU9-RSW067 SU9-RSW068 ~ . . . . . ~ . . SU9-RSW069 SU9-RSW070
SU9-RSW052 SU9 RSW053 SU9-RSW054 SU9-RSW055 SU9-RSW056 SU9-RSW057 SU9·RSW058 SU9·RSW059 SU9-RSW060 I -. . . . . . . . SI!J9--RSW044 SU9-ASW045 SU9-RSW046 SU9-RSW047 SU9-RSW048 SU9-RSW049 SU9-RSW050 SU9-RSW051
• II • • • • • •
SU10- S 63 SU10-RS164 •
• •
SU10-RS170 • SU10-RS171 •
SU10-RS172 •
SU10-RS173 •
SU10-RS165 •
SU10-RS166 •
SU10-RS167 •
SU10·RS168 •
SU10-RS169 •
SU10 StJ'IO-RS154 SU10-RS155 SU10-RS156 SU10-RS157 SU10-RS158 SU10-RS159 SU10-RS160 SU1D·RS161 SU10-RS162
SU -RSW037 SU9-RSW038 SU9·RSW039 SU9·RSW040 SU9-RSW041 SU9-RSW042 SU9-RSW043 • • • • • • • • • • • • • • • •
SU10-RS143 SU10-RS144 SU10-RS145 SU10-RS146 SU10·RS147 SU10·RS148 SU10-RS149 SU10·AS150 SU10·RS151 SU10-AS152 SU10·RS153
SU9-RSW033 SU9-RSW034 SU9-RSW035 SU9-RSW036 • • • • • • • • • • • • • •
s \o:st3o s u1o:s131 su1o:s132 su1o:s133 suto-~5134 su1o.:s135 su1o:s135 SU10-RS137 SU10-RS13B • •
SU10-RS139 SU10-RS140 • •
SU9 SU9-RSW029 SU9-RSW030 SU9-RSW031 SUQ-R
0SWO\ . . . \
SU1Q--RS117 SU10-RS118 SU10-RS119 SU1D-RS120 SU10-0RS121 SUtO-R$122 SU10-RS123 SU10-RS124 SU10-RS125 SU10-RS126
\ . . . . . . . . . SU9-RSW026 SU9-RSW027 SU9-RSW028
0 0 0
\U10-0RS107 SU1o--AS108 SU10-RS109 SU10-RS110 SU10-RS111 SU10-RS112 SU10-RS113 SU10-RS114 SU10-RS115 SU10-RS116
S -RSW019 SU9-RSW020 SU9-ASW021 SU9-ASW022 SU9·R W023 e • e • • • e • • II • • •
SU10-RS099 SU10-RS100 SU10-RS101 SUtO-RS102 SU10-RS103 SU10·RS104 SU10-RS105 • • • • • • • U9-RSW015 SU9-RSW016 SU9-RSW017 SU9-RSW018 • • • RSW-440 RSW-591
SU10-RS093 SU10-RS094 SU10-RS095 SU10-RS096 • • • • SU9-RSW011 SU9-RSW012 SU9-ASW013 SU9-RSW014 • • •
SU10-RS141 •
SU10-RS142 •
SU10-RS090 SU10-RS091 RSW-436
• "'"'"""
0
"'"'"""l57,-R~v:5ao RSW-581 •
SU9-RSW007 SU9·RSWOOB SU9·RSW009 SU9·ASWOtO • • • •
SU9-RSW003 SU9-B_SW004 • •
• •
RSW-539 • RSW-430 • RSW-431 • RSW·432 • RSW-569 • _&SW-570
11 • RSW-571
•
AS""-61 8
RSW-614 • RSW-615 •
RSW.fi07 • ASW.--608 •
----R'sW-601 • RSW--602
•
RSW-595 •
RSW-596
RSW-609 • RSW-610 • ASW-611 •
RSW-616 •
RSW-612 • RSW-613 •
RSW-604 • RSW--605 • RSW-606 •
RSW-597 • RSW-598 •
RSW-599 • RSW-600 • RSW-583
• S..Ll11W-586 RSW-587
92 • RSW-588 • RSW-589 • RSW-590 •
RSW-572 • RSW-573 •
• •
RSW 1~ t ASW-575 . \ . ..
RSW-576 • RSW-577 • RSW-578 • 95 ..
W~90 • RSW-691 •
RSW-692 •
RSW-693 •
RSW-535 • RSW-536 •
RSW-537 • RSW-425 • RSW-426 • ASW-427 •
10 RSW-428 .A.
• \ "'"'~1 RSW-562
• RSW-563
• RSW-564 •
.. 20
RSW-565 RSW-566 RSW-567 •
RSW-56 • RSW-684 • RSW-685 • RSW-686 • RSW-687
• RSW-688 • RSW-689 • SU9--RSW001
RS~-532 • • RSW--419 • RSW-420 • 9
RSW~21 • RSW-422 • RSW-423 • . .. . RSW-559 • RSW-560 • SW-675 • ..,.,. RSW--676
•
94 .. RSW-678 • RSW-679 •
96 ... RSW--680 •
97 .. RSW-661 • RSW-663 •
SW-525 • RSW-526 •
RSW-533(RSW 18
RS~527 RS"'-528 R:\ RS"'-412
6
tsw-413 • RSW-414 • RSW--415 • RSW-416 •
RSW.<4,24 RSW-556 19 RSW-557
RSW--4\,7 A ,552 RS'1·553 RS"'"554 . . ,. \ RSW-664 ,. . RSW-665 • RSW-666 • RSW-667 •
RSW--669 • R~RSW.-fi71 RS~-672 RS~--673 RSW-674 • .. SU12
38 .. " .. RS~-523 RSW-524 R W.--406 RS~-407 RSW-408
• RSW-409
• R~-410 17
RS'1--411 RS~-399 S~-551 SV!-651 27 IRS~-652 RSW-653 • RSW--654 • RSW-655 • RSW-656 RSW-657 • • RSW--656 • RSW-662 • 6 ..
RSW-516 • RSW-51 7 • RSW-518 • RSW-519 RSW-404 •
RSW-512 RSW-513 RS~-514
0
RSW-511 ° R~ 00
• •
• • •
RSW-51 15
RSW--4CJ1! • RSW-388 •
RSW-380 • RSW-381 •
16 .A. RSW-405 • RSW-395
• RSW-396 • RSW-397 •
RSW-398 :1. 26
RSW-391 • RSW-392
•25• RSW-393 • ASW-394 •
SU7 RSW-382 • RSW-383 • RSW-385 • RSW-386 •
...
RSW-64i • RSW-642 •
RSW-643 • 36 .. RSW-644
•
" .. RSW.fi45
• RSW-646
• RSW-647 • RSW-648 • RSW-649 •
48 .. RSW-650 • RSW·
fRSW-632 RSW-633 • RSW-634 • RSW-635 •
RSW-636 •
RSW-637 •
.. 47
RSW--638 RSW-639 •
RSW-769 •
RSW-770 •
ASW-625 •
• 35 .. RSW-626 • RSW-627 • RSW-628 •
45 .. RSW-629 •
46 .. RSW-630 •
•
RSW-763 •
58 .. RSW-764
•
59 .. RSW-765
•
RSW-663 • FfSW-777
RSW-776 •
RSW-772 •
RSW-773 •
RSW-767 • RSW-768 •
RS -510 RSW-371 • RSW-372 • RSW-373 • RS~-375 RS~-376 RS~~H7 RS~-378 RSW--3: RSW-623 • RSW-753 • RSW-754 • RSW-755 • RSW-756 • RSW-757 • ASW-758 • RSW-760 • RSW-761 •
RSW--454 • 22
.Bs~-364 RS~-365 RSyt367 RSW-316 • RSW-317 • RSW-354 • 43 .. ASW-619 •
.. 44
RSW-741 •
56 .. RSW-742 •
57 .. RSW-743
• RSW-744
• ASW~745 RSW-746 • • SU13
69 RSW-747 A • ASW-748 • RSW-750 • RSW-751
•
RSW-452 RSW-45
0
RS~450 ~ RSW-.359
• RSW-360
• RSW-361
• RSW-315
• RSW-350
• RSW-351
• RSW-352
• RSW-727
• RSW-728
• RSW-729
• RSW-730
• RSW~731
• RSW~732
• ASW-733
• RSW.t34 RSW-735 •
ASW-736 • RSW-737 • RSW-739 • RS ·23
RSW ~6 RSW--447 • RSW-448
RSW-443 • RSW-444 •
• RSW-445
RS~·356 ~ RS"t·357 RS"l·286 RS""-344 RSW-345 • .. 41
RSW-346 •
" ... RSW-347 •
SU6 RSW-348 • RSW-34!9 •
54 .. RSW-263 •
ASW-284 • RSW-302 • RSW-303 • RSW-338 •
RSW-339 • RSW-340 RSW-341 RSW-342 • RSW-343 •
RSW-298 • RSW-299 • RSW-300 •
RSW-332 • RSW-333 • BIAS-7
+
• •
RSW-334 •
53 ... RSW-335 • RSW-336 • RSW-337 •
64 ..
55 .. RS~-716 RSW-717 • RSW-718 • RSW-719 • .. ..
RSW-720 •
67 .. RSYi·721
•
RS'Il·722 RSW-723 • RSW-724 • RSW-zg§. • 79
RSW-706 •
RSW-707 • RSW-708 •
RSW-709 •
RSW-710 •
RSW-711 •
RSW-712 •
76 RSW-713
• RSW-714 • RSW-228 •
RSW-697 •
65 ... ASW-698 • RSW-699 • RSW-700 • RSW-701 • RSW-702 •
77
A nsw-7o3 • RSW-221 • RSW-222
• RSW-223 ... ..
RSW-234 • RS~2\
. .. . RSW-230 102 RSW-231 RSW0-23\ RS~225 RSVL-226 RS~-2\
\1 RSW-442 • RSW-472 • RSW-473 • RSW-294 • RSW-295 • RSW-296 •
sus RS"'-29"
BIAS-6 +
BlAS-S+
RSW-326 • ASW--327 RS~-328
• s1.fs-a
RSW-290 • 50 .. ASW-291 • RStf92 RS~ J RSW-322 • RSW..J23 •
ASW-329 • 63 ..
A$'1-330
RSVL-325 RSW-276 • ASW-277 •
75 .. RS'l.-2 2
RSW-278 •
RSW-695 • RSW--696 • R W!211 •
RSW-200 • RS'1·201
RS""-212 RSW-213 • RSW-215 • RSW-216 • RSW-2 \ RSW-218 RSW-219 RSW0-2 0
• • 113 • ..
AS -484
Legend
• Verification Location
SW-468 • RSW-469 • RSW-470 • RSW~71
RSW-464 • RSW-465 •
RSW-460 •
RSW-466 • RSW-467 • .... S RSW-462
•
5~267
RSW-306 •
RSW-778
BIAS-4
RSW-310 •
RSW~07
RSW-311 • • • BIAS-9 +
RSW\2 RSW-320 RSW-32
RSW-309 R ~ RSW-262 • • •
RSW-269 • 73 ...
RSW-270 •
74 .. RSW-271
• RSW~272 •
RSW-263 • RSW-264 • RSW-265 • RSW-266 • RSW-267 • "• FISW-164
•
RSW-202 • RSW-203 • RSW-204 •
RSW-205 •
RSW-206 •
SU3 RS""-207 RSW-2 8 RS"l·209
... 112
RSW-190 • RSW·191 • RS~-192 RSW-193
• RSW-194 • RSW-195 .&111 •
RSW-196
RSW-162 • RSW-183 • RSW-186 •
•
RSW-jll8 RSW-189 RS: "«68 y ·
RSW-2 10 •
RSW-o89 • RSW-D90 •
R W-457 • RSW-456 • RSW-459 • RSW-508 • RSW-304 • RSW-254 • RSW-255
• RSW-256 •
84
RSW-259 ,A. • RSW-161 • RSW-1 62 • RSW-1 63 • RSW-175 • RSW-176 • RSW-118 • RSW-179 RSW-180 • • S .083 RSW-{]84 • • RSW-085 • RSW-066
•
SW-503 • RSW-504 • RSW-505
• RSW-506
•
RSW-498 • RSW-499 • RSW-500 • RSW-501 •
RSW RSW-493 • RSW-494 • RSW-495 • RSW-496 •
RSW-485 • RSW-486 • RSW-487 • RSW-468 • RSW-489 •
RS"'"245 RSW-246 • RSW-247 • RSW-248 • RSW-250 •
62 .. RSW-251
•
63 .. RSW-D92 • nsw.,SUw1 7 • • RSW-158 •
107
RS'1.·159
RSW-240 RSW-241 RSW-242 • RSW-243 • RSW-244 • RSW-150 • RSW-151 • RSW-15 2. RSW-153 RSW-154 • • •
RSW-237 • RSW-238 •
RSW-239 •
RSW-138 • RS"l·139
•• ... RSW-128 • RSW-129 • RSW-130 •
104 .. RSW-131 •
105
A, RSW-132 •
106
nst.-142 •
RSW-13 •
• •
RSW-143 • RSW-144 • Re:~ ,...RSW-146 119 RSW-147
~ . .. . RSW-135
• RS~36 RSW ~oso RSW-051 - 118 • •
RSW-171 •
RSW-D52 RSW-D53 • 131 • ..
• 122
RSW-070 •
RS~77
RSW-D71 • 133 ... RSW-D72
RSW-062 • RSW-{)63 • RSW-064 • .. 132
RSW-D54 • RSW-055 • RSW-056 • RSW..057 •
RSW-479 • RSW-480 • RSW-481 • RSW-462 • RSW-483 • RSW-121 • RSW-122 • RSW-12!3 • RSW-1 24 • RSW-125 • RS"'~)
RSW-044 • a13o
RSW-045 • RSW-()46 • RSW-047 • RSW-Q48 • RSW-D49 •
ASW--474 • RSW-475 •
SU2 116 RS"'-476 RS"'-477 RS~545 RS"'-546 RS"'-547 RS~ RS~-112 RS~-1!J RS~114 RS~115 RS"'-116 A RS~117 RSW..036 RSW-Q37 • • RSW-D38 •
'--------------~R~SW-540 RSW0-541 RSW-542 RSW-543 RS\1!'
0..:!544 ...... R~0 06 RSW
0-107 RSW-108 RSW-109 RSW-11 10 RSW-111 RSW-027 • • • ~ • + • + • ••
BIAS-11 BIAS-12
RSW-Q32 •
---~'RSW-o99 • RSW-100 • RSW-101 •
RSW-095 • RSW-Q96 • RS"'¥;097
RSW-D93 • RSW-o94 •
BIAS-10+
RSW-103 • RSW-104 • AS~· lOS IRSW-020 •
BIAS-2 RSW.:OtJ RSW..Q114 RSW-o1 5 • • • BIAS-1
RSW..Q16 • RSW-017 •
RSW-{124 • RSW-025 •
RSW-018 •
ASW-()19 • SW-787 • RSW-7 •
RSW..Q07 • RSW-DOB • RSW-009 • RSW-oto • RSW-()11 • RSW-785 RSW-786
RSW-001 • RSW-00}2
• RSW.003 • RSW-oo4 •
100
• • •
SU14 RSW-782 •
RSW-783
N
RSW-D39 • RSW-D40 • RSW-D41 •
RSW.-079
135 ... RSW-D80 •
RSW-081 • RSW:.073 RSW-D74 RSW-075
RSW-066 •
RSW-Q58 •
• RSW-067 •
• RSW-066 •
ASW-08 •
.,. RASS 30ft. Grid "As Left" Location Feet
+ OEPA Bias Sample
@ Verification Sample COGs > CO & < HS
s Environmenlal Restoration Geographic Information System
Figure 3 RSWB Sample Loca~ ions
• Hard Surface Location
D SU Boundary
D Excavated Boundary DATE: 07/12/06 I BY: SSP I APPROVED:* FIDLER Walkover Indication > 1 Kcpm & < 5 Kcpm
FILE NAME: e:\arcmap\r_sw\rsw071206.mxd