i - nasa · january 16, 1984 braz il wheat y ieu) covariance model (e84- 10 103) eh azil iaeai...
TRANSCRIPT

Yi.?ld Fi/z.del Development
YM-N4-04454 JSC 18906
A Joint Program for *
Agriculture and Resources Inventory Surveys Through Aerospace Remote Sensing -
JANUARY 16, 1984
BRAZ I L WHEAT Y IEU) COVARIANCE MODEL ( E 8 4 - 10 103) Eh AZIL i a E A I Y I E L i i COVAi3IAllCE Y84-2 1921
HODEL ( H d t l o n a l Cceanlc and A t m o s p h e r i c A d n i n i s t r a t i o o ) 22 p BC ACL/l!!F 80 1 C S C L 02C
i lnclas G3/43 OOlaj
SUSAN L, C A L L I S CLARENCE SAKAMOTO
/Y OAA @?l$/i DELF ~ N C H ,,,+I E! EL BUG 6 C R ( I Y S R T COLUMBIA, MO 65201
Lyndon B. Johnson Space Center Houston. Texas 77058
. - , . .- .. . *. ? i s L .. w.. .* - . . I. -- -' . .. -.. .-., . - ". ..'"& .,- ,..*., .,--. - - P C r I
https://ntrs.nasa.gov/search.jsp?R=19840013853 2019-12-29T11:07:03+00:00Z
*Fur rale by the National Technical Information Service, Springfield, Virginia 22161
JSC Farm 1424 (Rw Nov 76)
I r - - * . . * 2-• --
1. Report No.
YM-Y4-04454, JSC 18906 2. Government Accession No. 3. Accipwlt's Catalog No.
4. Title and Subtitle
B r a z i l Wheat Y ie ld Covariance Model
7. Author($)
Susan L. Call i s and Clarence Sakamoto
9. RDIfarminp &gmization Name and Address
USDC/NOAA CIAD/Model s Branch Room 200, Fedeyal Bl dg, 608 Cherry S t . Columbia, MO 65201
12. Sponuxing Agsncy Name and Addnu
National Aeronautics and Space Administrat ion Lyndon B. Johnson Space Center Houston, TX 77058
15. Supplemenw Notes
5. Report Date
Januav 16, 1984 6. Performing Organization
8. Worming Organization Rspat No.
10. Work Unit Nc.
11. Contract or Grant NO.
13. Type of Report and Period Cowed
14. Sponsoring ~gmcy code
16. Abtract
A model based on mu1 t i p l e regression was developed t o est imate wheat y i e l d s fo r the wheat-growing states o f Rio Grande do Sul, Parzna, and Santa Catarina i n Braz i l . The meteorological data o f these three sts tes were "pooled" and the years 1972 t o 1979 were used t o develop the model since there was no tec!inological t rend i n the y i e l d s dur ing these years. Predic tor var iables were derived from monthly t o t a l p rec ip i t a t i on , average monthly mean temperature, and average monthly maximum temperature.
17. Key Word (Suggestst! by Aul'hor(s))
Mu1 t i p l e regress1 on analysis Predictor var iables
--
18. Distribution Statement
19. Sscurity Classif. (of this rupo:t)
Unclass i f ied i
21. No. of Pages
19 20. Security Classif. (of this page)
Unclasssi f ied
22. Rice'

BRAZIL WHEAT YIELD COVAP IANCE MODEL
Susan L. C a l l i s
and
Clarence Sakamoto
AISC Models Branch
Jznuary 16, 1984

I NTRODUCT 1 ON
The purpose of t h i s study was t o se lec t monthly weather var iab les t h a t
could be used t o est imate wheat y i e l d s f o r t h e wheat growing areas o f B raz i i .
Wheat i s grown i n seven s ta tes i n B raz i l : R io Grande do Sul, Santa Catarina,
Parana, Sao Paulo, Mato Grosso, Goias, and Minas Gerdis. R io Grande do Sul
i s B r a z i l ' s o r i g i n a l wheat-producing s ta te ; u n t i l 1972 i t was t h e country 's
most important product ion area. Increasingly , however, Parana, Mato Grosso
and Sao Paulo have grown i n importance. I n 1977, Parana took over t he number
one spot. Figure 1 shows t h e wheat-growing areas o f Brazi 1.
Although wheat has been grown s ince t h e s i x teen th century, B r a z i l has y e t
t o develop a h igh-qua l i t y wheat v a r i e t y t h a t prodbczs we l l under the country 's
widely var ied c l i m a t i c condi t ions. B r a z i l ' s wheat crops have cont inuously
been plagued w i t h problems r e s u l t i n g i n cons i s ten t l y low y ie lds . Frosts and
p lan t disease occasional ly reduce y i s lds . The h igh cos t discourages use o f
fungicides. Expansion o f acreage sown t o wheat was met w i t h c u l t i v a t i n g
problems and h igh costs. New land areas c u l t i v a t e d i n wheat are h igh l y a c i d i c
and low i n f e r t i l i t y , F e r t i l i z e r i s cost ly . Late-season r a i n s f requent ly
delay harvest and reduce y ie ld .
The c l imate o f t he southern wheat-producing s ta tes i s "subtropical humid";
r a i n f a l l i s r e l a t i v e l y abundant and we1 1-di s t r i buted throughout t he year, w i t h
s l i g h t l y more r a i n f a l l i n t h e warm months. There i s usua l l y no season o f
drought. The northern s ta tes a re "semiartd" w i t h a w in te r d ry season and l ess
t o t a l annual r a i n f a l l . Summers are hot and w in ters are mild. Parana and
southern Sao Paulo are t h e nor thern l i m i t f o r f r o s t ocurrence.
Wheat i s planted i n t h e months o f A p r i l through June and i s harvested i n
November and December.

ORIGIRAL PAGE 19 OF POOR QUALITY
MINAS G E R A I S
MATO GROSS0 - -
-- - -
Figure 1- meat-growing areas of Braz i l . (J- Mc%igg, R - Willis,, 1982. personal -
communication)
METHOD
Mu1 t i p l e regress ion ana l ys i s o f y i e l d w i t h se lected agroc l i m a t i c i n d i c e s
was used t o de r i ve a s u i t a b l e model. The index P-PET ( p r e c i p i t a t i o n minus
p o t e n t i a l evapo t ransp i ra t ion) was used i n t h e regress ion equat ions t o represent
a v a i l a b l e s o i l moisture, monthly p r e c i p i t a t i o n , and monthly maximum temperature.
The regress ion equat ion i s: A Y = a + BlTXi + B2Ri + B3 (P-PET), + E
where A Y = Estimated y i e l d ,
(X = Constant,
B j = C o e f f i c i e n t s o f va r i ab les j = 1-3,
TXi = Maximum temperature f o r month i ,
d i = To ta l p r e c i p i t a t i o n f o r month i,
(P-PET)i = P r e c i p i t a t i o n m i nus PET f o r month i , and
E = Unexplained e r ro r .
I n developing t h e model, va r ious procedures o f t h e S t a t i s t i c a1 Ana lys is
System (SAS I n s t i t u t e , Inc., 1979) were used, The procedures used and t h e
operat ions performed w i t h each a re summarized i n t h e Appendix. The se lected
model had t he h ighes t ~2 and inc luded v a r i a b l e s t h a t were s i g n i f i c a n t a t t h e
10 per cent l e v e l 3nd agronomical ly meaningful.
DATA
The B r a z i l c rop da ta were obta ined from t h e Fore ign A g r i c u l t u r a l Serv ice
(Sam Ruf f , Personal Communication, 1982). The da ta was recorded w i t h yea r
o f y i e l d as year o f harvest, so t h e weather i n f l u e n c i n g t h e c rop occurred
d u r i n g year - 1.

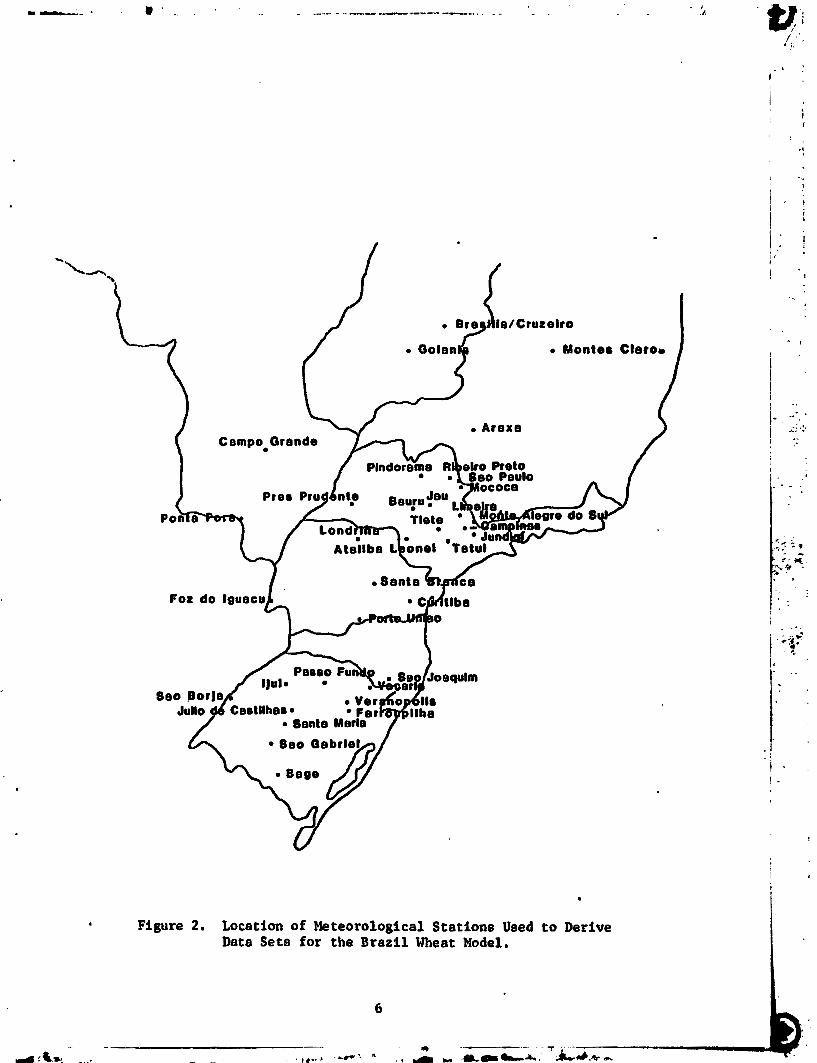
Meteorological data from 1972 through 1977 were used t o model because
there i s no apparent t rend i n the y i e l d data dur ing t h i s period. Furthermore,
1977 represented the l a t e s t avai lable data. Table 1 l i s t s the s ta t ions used t o
derive the meteorological data sets f o r each state. Figure 2 shows the
location of each station.
PROCEDURES
Since Rio Grande do Sul 's meteorological data has the longest period of
record, i n i t i a l models were developed f o r t h i s s ta te alone. Various weather
variables were t r i e d i n regression equations i n many d i f fe ren t combinations.
The resul ts were not good. Several d i f f e ren t trend, were t r i e d w i th d i f f e ren t
regression models, but none were s ign i f i can t a t the 10 per cent level. From
h is to r i ca l accounts, i t i s believed tha t some so r t o f t rend o f increased y i e l d
began i n 1962 because o f increased use o f f e r t i li zer and more adaptable
var ie t ies o f wheat. Yet the y i e l d data d i d not ind ica te th is . It was decided
t o model f o r years 1972-1979 f o r which i t was believed no trend existed.
El iminating years o f data created the problem o f fewer degrees of f reedorn.
However, by combining data f o r the states o f R i o Grande do Sul , Parana, and
Santa Catarina, a covariance model could be devloped.
Variables used i n the regression equations f o r the covariance model,
included "dummy variables" f o r Parana and Santa Catarina. The "dumqy variables"
adjust the contr ibut ions i o y i e l d o f both states t o a base y i e l d which, i n t h i s
ease, i s Rio Grande do Sul 's yield. The "dummy var iable" f o r Parana was not
s ign i f icant a t the 10 per cent leve l i n the f i n a l model. The coe f f i c ien t f o r
Santa Catarina's "dumw variable" i s negative, ind ica t ing t h a t i t s y i e l d i s
below that o f the norm set by Rio Grande do Sul.

STATE - Mato Grosso
Parana
Rio Grande do Sul
Santa Catarina
Sao Paulo
blETEOROLOGICAL STATION
Campo Grande Ponta Pora Pres Prudente
Londrina Santa Branca Cuririba Porto Uniao
I j d Sao Borjb. Passo Fundo Ju l io de Castilhas Santa Maria Sao Gabriel Bage
Porto Uniao Vacaria Sao Joaquim
Pres Prudente Bauru Jau Tiete Ataliba Leone1 Tatui
WMO NUMBER
Table 1. Meteorological Stations Used to Derive Data Sets for the Brazil Wheat Model.
---7
Monter Clerot,
. Figure 2. Location of Meteorological Statione Used to Derive Data Sets for the Brazil Wheat Model.

The fol lowing i s the elected model :
DUM Dumqy var iable t o adjust Santa Catarina's y i e l d
TM7 July Mean Temperature
P-PET8 August P-PET
SP-PET8 Squared August P-PET
P-PET9 September P-PET %
RDFNll Deviation from normal o f November p rec ip i ta t ion
Too high temperatures i n Ju ly and too much r a i n f a l l i n November both reduce
yield. The negative coe f f i c ien t f o r t he l i nea r term P-PET8 suggests t h a t i n I
August excess p rec ip i ta t ion above demand, BET8, i s damaging t o y ie ld. This i s I 1
reasonable i n Braz i l when i n August the crop i s i n the t i l l e r i n g stage. The 1.. , '
quadratic term indicates tha t increased y i e l d i s favorable a t some leve l when I
PET i s higher than precipi tat ion. However, one i s cautioned not t o extend t h i s i in terpreta t ion beyond the l i m i t s o f the data base used. The s t a t i s t i c s o f the 1 selected model are summarized i n Table 2.
The same variables were used i n regression equations f o r only the two states
o f Rio Grancle do Sul and Santa Catarina. The problem encountered was t h a t models
wi th agronomically reasonable variables had tm low an ~ 2 ; models w i th .
acceptable ~2 had too many variables for the number o f degrees o f freedom.
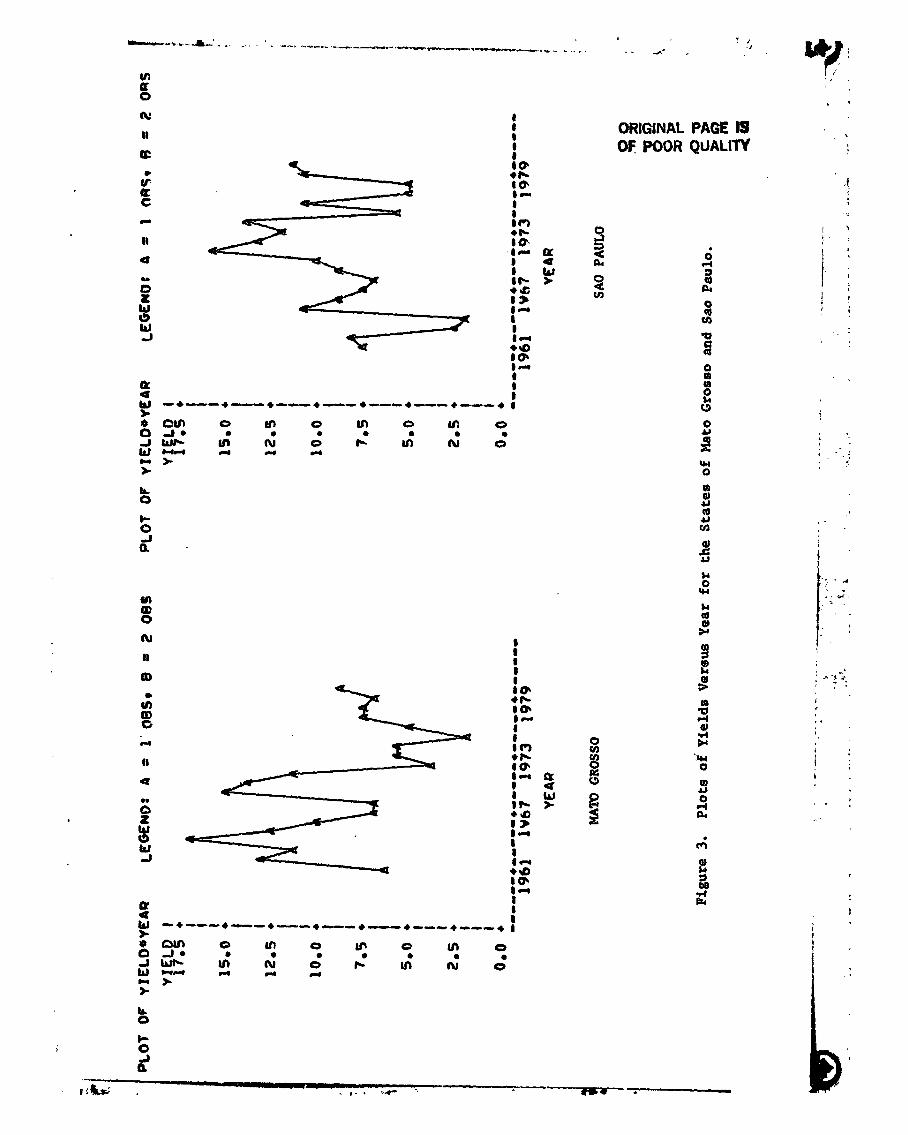
Final ly, modeling was attempted f o r the northern states o f Mato Grosso and
Sao Paulo. Overlapping p lo t s of weather variables versus y i e l d were made f o r
both states. From these plots, i t was determined tha t modellng f o r a I 1
combination o f data f o r these two states would not be acceptable; t h e i r cl imates !
I
are too d i f ferent . Next, reasonable weather variables were t r i e d i n regression i f o r both states separately. No sui table models were derived. For information, I
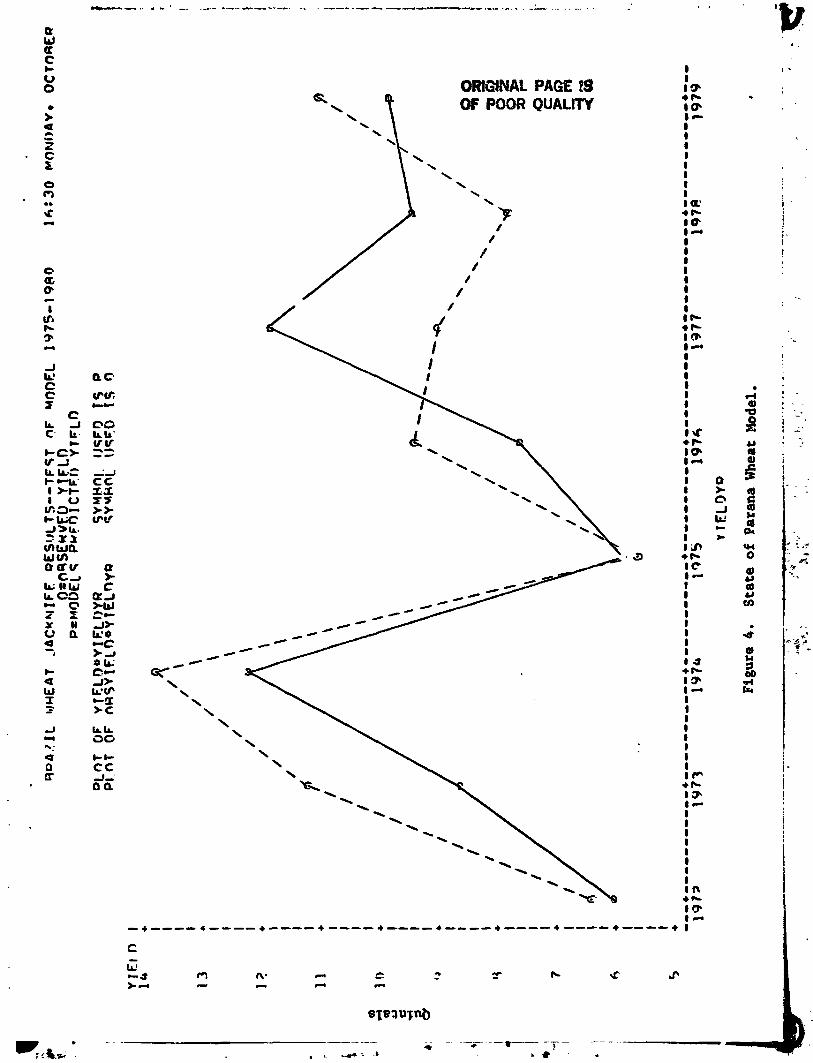
I p lo ts o f y ie lds f o r both states are shown i n Figure 3. 1

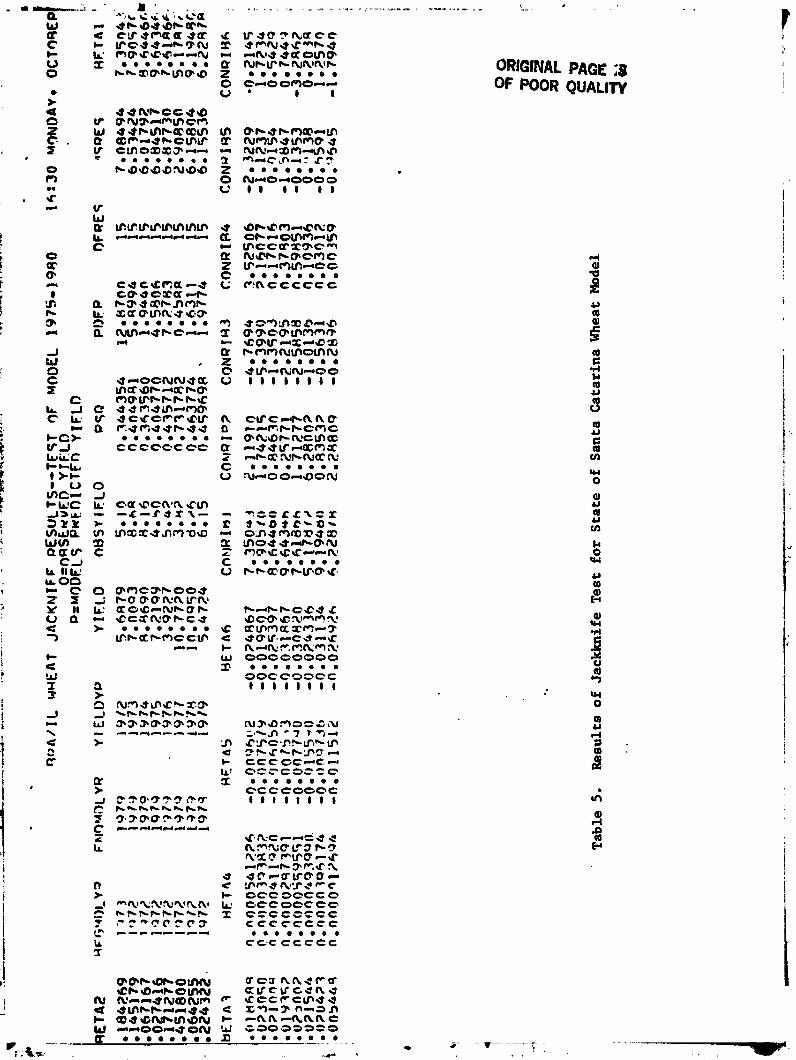
TEST RESULTS
A jackkni fe t es t was run on the selected model. I n t h i s test , a year was ,.! . , i - . el iminated from the crop data and the model was used t o pred ic t tha t year's .
yie ld . This process was done f o r each successive year beginning w i th 19?, E . The t e s t had t o be run separately on each state. The resu l t s are prir:.:-d on
Tables 3 through 5 and p lo t ted on Figures 4 through 6.

APPENDIX
Def ini t ion o f Variables
P-PET, prec ip i ta t ion m i nus potenti a1 evapotranspi Pati on, i 5 used a measure I : of the amount o f moisture avai 1 able f o r plant growth. Potent i c l evapot ranspira-
t i o n i s determined by the procedure developed by Thornthwai t e (1948). It re-
quires only temperature: I
where I = heat index, which i s the sum o f the 12 monthly indices i ,
T = monthly temperature i n OC, and
a = an empirical exponent 6.75 x 10-713 - 7.71 x 10-512 + 1.79 x 10'21 +
The duration o f day1 ight i s used t o adjust potent ial e :apotranspiration as a
port ion o f 12 hours.
S ta t is t i ca l Analysis System Procedures Used
PROC CORR
PROC PLOT
PROC STEPW I SE
;, :,- Computes corre lat ion coeff ic ients between ? - variables, including Pearson product-moment I
! and wet ghted product-moment correlation. , .
, r
Graphs one variable against another, producing a pr in te r plot.
Provides f i v e methods f o r stepwi se regression. Stepwi se i s useful when selecting variables t o be included i n a regression model from a col lect ion o f independent variables.
!
Begins by f ind ing the ne-variable model that 4 t - I
produces the highest R . Far each of the I :
other independent var i abl es , FORWARD calculetes F-stat i s t i cs ref lect ing the con- t r i bu t i on t o the model if the variable were t o be Included.

tic
*I -
ZQ
) c
,-C
d h
Q)- Q
W
a)
C.
00
mug-,,
Y
.rd
C
P-
ow
*
cr
Q
a
me
-
-€
cn
Q)
e
CW
*'E
CQ
).
sC1s
2
0 =s 0
EW
E
-
ORIGINAL PAGE W OF POOR QUALIW
a i 2 -*--*-+---*--+--+--*---*# rO CLR 0 U, 0 M 0 M 0 0 a. A w l s ln N 0 PI UI N 0
d W * - w m4 d k > > lL 0
t- o J a

u+ C3t mu, JU a6€' rtrt
CN (Vcr
4 fv
0RlGlNAL PAGE OF WOR QUALITY
I- C I - + a * 8 •
z 0 I 0 v, I & I1 I LL*
c c k FIPOdCmNl X i A l ~ ' ef-crr-otr I P-
C k J 2 5 t d h . J N Q S I i c a mrum.l;tmt I t
= : = > V u 1 ) * . - ( . . . 1 5 3 I 6 i r .a --~LC---.Xl I
C d V. IC -3jJCiNJ I 3 (L bfwy tP?CCC?OC I 2
V Y O C -CI * * . a m . * 1 a V h d - 3 3 C C I L) I 6 % I l l 8 I l l ~c
z. n a I lL E I - 1 rl I 2
I c $ I - I u
C I Lr' I Ir' Q 2 B I il Ire C tO I u C C I '
z V a I d I W V
LL'Z-' (I Q C C I L' C 3 t c g t h 0L.l 4
a' lA @ c . - a 10 I = @ IZ u.t- *L' f -G'JaSl Lr:
< - I x I C
C I Q t 2 > I -
I - I V J I W a I A
I IT I
-- ,-----.A. ,, - - , . ., .,. . ,@. . &:%*-. ,.. . , . , , .- 4 - , , , a 4 . > s

ORlGIhtAL PAGE fl OF POOR QUALifY
c--" r - x - 4 r r+.?'-3CCc
f- x.C.b=-c;nrrc, 3 En--r\iS.-X!U r 33f f2- f - t L CCCCCCCC a ........
3 = 5 9 0 C = 3 1 1 8 1 1 1 I l
ORIGiNAL PAGE !S OF PQOR QUALITY
I I a' .I- It? Id I I I
I IF- *F-
c c i : kc


ORIGINAL PAGE 3 OF POOR QUALITY
lcc.rcrce9u ;tZ S co' S? v-" X'
S: ccmmaccrs~3 C u o u ~ - C 3 ~ C C (\~RF.f'?K'-9.1' W OOCCOOOO I! . . . . . . . .
3 0 C C 3 = r C C l 1 8 l 1 l l 1
*&cc-f u e &3n;(rr3b3 W Z O F l r W .-c cF-lrc9cc.\r x
a u r ~ t r v o o - C ' P F f W ' Y d F C C O C C ~ C C C C I L' GCCOCCCC\ r C C C C t C C C
c e c e c c e ~ . a . . a a . . c e c C C C C C
