i n i n d i a report/state of... · i n i n d i a ag r icu lt u r e ou t pu t has 8b6e%en o vf...
TRANSCRIPT

Tanvi Deshpande
March 2017
State of Agriculture in India
Agriculture output has
been volatile
86% of land holdings are
less than 2 hectares
Informal sources of credit
constitute 40% of loans

DISCLAIMER: This document is being furnished to you for your information. You may choose to reproduce or redistribute this report for
non-commercial purposes in part or in full to any other person with due acknowledgement of PRS Legislative Research (“PRS”). The opinions expressed herein are entirely those of the author(s). PRS makes every effort to use reliable and comprehensive information, but
PRS does not represent that the contents of the report are accurate or complete. PRS is an independent, not-for-profit group. This document
has been prepared without regard to the objectives or opinions of those who may receive it.

2
INSIGHTS
The agriculture sector employs nearly half of the workforce in the country. However, it
contributes to 17.5% of the GDP (at current prices in 2015-16).
Over the past few decades, the manufacturing and services sectors have increasingly contributed
to the growth of the economy, while the agriculture sector’s contribution has decreased from more
than 50% of GDP in the 1950s to 15.4% in 2015-16 (at constant prices).
India’s production of food grains has been increasing every year, and India is among the top
producers of several crops such as wheat, rice, pulses, sugarcane and cotton. It is the highest
producer of milk and second highest producer of fruits and vegetables. In 2013, India contributed
25% to the world’s pulses production, the highest for any one country, 22% to the rice production
and 13% to the wheat production. It also accounted for about 25% of the total quantity of cotton
produced, besides being the second highest exporter of cotton for the past several years.
Figure 1: Yield in different countries (tonne/ha)
Sources: Food and Agriculture Organization of the United
Nations; PRS.
However, the agricultural yield (quantity
of a crop produced per unit of land) is
found to be lower in the case of most
crops, as compared to other top producing
countries such as China, Brazil and the
United States.
Although India ranks third in the
production of rice, its yield is lower than
Brazil, China and the United States. The
same trend is observed for pulses, where it
is the second highest producer.
Figure 2: Agricultural growth (in %)
Sources: Agricultural Statistics at a Glance, 2015; PRS.
Agricultural growth has been fairly volatile
over the past decade, ranging from 5.8% in
2005-06 to 0.4% in 2009-10 and -0.2% in
2014-15.
Such a variance in agricultural growth has
an impact on farm incomes as well as
farmers’ ability to take credit for investing
in their land holdings.
Key issues affecting agricultural productivity include the decreasing sizes of agricultural land
holdings, continued dependence on the monsoon, inadequate access to irrigation, imbalanced use
of soil nutrients resulting in loss of fertility of soil, uneven access to modern technology in
different parts of the country, lack of access to formal agricultural credit, limited procurement of
food grains by government agencies, and failure to provide remunerative prices to farmers.
Some of the recommendations made by committees and expert bodies over the years include
bringing in agricultural land leasing laws, shifting to micro-irrigation techniques to improve
efficiency of water use, improving access to quality seeds by engaging with the private sector, and
introducing a national agricultural market to allow the trading of agricultural produce online.
0
2
4
6
8
10
Paddy Wheat Other cereals Pulses
India Brazil China USA
-4%
-2%
0%
2%
4%
6%
8%
1951
-52
1961
-62
1971
-72
1981
-82
1991
-92
2001
-02
2011
-12
2012
-13
2013
-14
2014
-15
2015
-16

3
State of Agriculture of India
Agricultural productivity depends on several factors. These include the availability and quality of
agricultural inputs such as land, water, seeds and fertilizers, access to agricultural credit and crop
insurance, assurance of remunerative prices for agricultural produce, and storage and marketing
infrastructure, among others. This report provides an overview of the state of agriculture in India. It
discusses factors related to the production and post-harvest activities in agriculture.
As of 2009-10, more than half of the total workforce (53%) of the country, i.e. 243 million persons
were employed in agriculture.1 The share of population depending on agriculture for its livelihood
consists of landowners, tenant farmers who cultivate a piece of land, and agricultural labourers who
are employed on these farms. Agricultural output has been volatile over the past 10 years, with
annual growth ranging from 8.6% in 2010-11, to -0.2% in 2014-15 and 0.8% in 2015-16.2 Figure 3
shows the trend in the growth of agricultural sector over the past 10 years.
Figure 3: Growth in agriculture sector (%)
Sources: Agricultural Statistics at a Glance 2015, Ministry of
Agriculture; PRS.
Figure 4: Contribution to GDP of sectors (%)
Sources: Ministry of Statistics and Programme Implementation;
PRS.
As seen in Figure 4, the agriculture sector’s contribution to the Gross Domestic Product (GDP)
decreased from 54% in 1950-51 to 15.4% in 2015-16, while that of the services sector increased from
30% to 53%.3,2 While the agriculture sector’s contribution to GDP has decreased over the past few
decades, the contribution of sectors such as manufacturing (employing 10.5% of the population) and
services (employing 24.4% of the population) has increased.1
Agricultural production and yield
Figure 5 shows the production of crops over the past few decades. The production of major crops
over the past few decades is shown in Table 7 in the Annexure.
Figure 5: Agricultural production (million tonnes)
Sources: Ministry of Agriculture; PRS.
Total production of food grains increased
from 51 million tonnes in 1950-51 to 252
million tonnes in 2015-16.4 According to
the second advance estimate by the
Ministry of Agriculture, food grains
production is estimated to be 272 million
tonnes in 2016-17.5
The production of wheat and rice took off
after the green revolution in the 1960s, and
as of 2015-16, wheat and rice accounted
for 78% of the food grains production in
the country.
0%
1%
2%
3%
4%
5%
6%
7%
8%
2004
-05
2005
-06
2006
-07
2007
-08
2008
-09
2009
-10
2010
-11
2011
-12
2012
-13
2013
-14
2014
-15
2015
-16
0%
10%
20%
30%
40%
50%
60%
70%
1950
-51
1960
-61
1970
-71
1980
-81
1990
-91
2000
-01
2010
-11
2015
-16
Agriculture Manufacturing Services
0
20
40
60
80
100
120
1950
-51
1960
-61
1970
-71
1980
-81
1990
-91
2000
-01
2010
-11
2014
-15
2015
-16
Wheat Rice Pulses Oilseeds

4
The country’s requirement for food grains in order to provide for its population is projected to be 300
million tonnes by 2025.6 The estimate of food grains production in 2015-16 is 252 million. This
implies that the crop output needs to grow at an annual average of 2%, which is close to the current
growth trend.
Despite high levels of production, agricultural yield in India is lower than other large producing
countries. Agricultural yield is the quantity of a crop produced on one unit of land. Agricultural yield
of food grains has increased by more than four times since 1950-51, and was 2,070 kg/hectare in
2014-15.7 However, as seen in Figure 6, India’s yield is low when compared to countries such as
China, Brazil and the USA.
Figure 6: Yield in different countries in 2014-
15 (in tonne/ha)
Sources: Food and Agriculture Organization of the United
Nations; PRS.
Although India is the second highest
producer of paddy (rice) in the world (as of
2013), its yield is lower than China, Brazil
and the USA. It is also the leading producer
of pulses, but its yield is the lowest.8,9
India’s productivity has also grown at a
slower rate as compared to others. For
instance, while Brazil’s yield for rice
increased from 1.3 tonne/ha in 1981 to 4.9
tonne/ha in 2011, India’s increased from 2.0
to 3.6. China’s productivity in rice also
grew from 4.3 to 6.7 in this period.
Food security and nutrition
Besides providing for the livelihood of farmers and labourers, the agricultural sector also addresses
food security for the nation. The Food and Agricultural Organisation (FAO) of the United Nations
defines food security as a situation where all people have, at all times, physical and economic access
to sufficient, safe and nutritious food that meets the dietary needs and food preferences for a healthy
and active life.10 Despite high levels of production in the country, 15% of the population continues to
be under-nourished, as per 2014 estimates.11,12
India enacted the National Food Security Act in 2013. The 2013 Act aims to provide food and
nutritional security to people by ensuring access to adequate amount of quality food at affordable
prices.13 Under the 2013 Act, persons belonging to certain categories are provided with food grains
(wheat, rice and coarse cereals) at subsidised prices. As of 2015, 68% of the population, i.e. 81 crore
persons (of which 77% are in rural areas and 23% in urban areas) are covered under the Act.14
Over the past few decades, with increasing per capita income and access to a variety of food groups,
the consumption pattern of food in the country has been changing. Dependence on cereals for
nutrition has decreased and the consumption of protein has increased.15 Sources of protein include
pulses, meat, seafood, and eggs, among others. According to a Finance Ministry report on
incentivising the production of pulses in the country, poor levels of nutrition suggest that increasing
the consumption of proteins should be the policy priority for the government.16 The report estimates
that the cost of pulses as a source of protein is lower than other sources. Under the current domestic
scenario, India is facing a shortage of pulses which is being plugged by imports.
0
2
4
6
8
10
Paddy Wheat Other cereals Pulses
India Brazil China USA

5
Agricultural trade
Major commodities imported to India are pulses, edible oils, fresh fruits and cashew nuts. Major
commodities exported by India are rice, spices, cotton, meat and its preparations, sugar, etc. Over the
past few decades, the share of agricultural imports in total imports has increased from 2.8% in 1990-
91 to 4.2% in 2014-15, whereas the share of agricultural exports has reduced from 18.5% to 12.7%.17
Tables 1 and 2 show the major agricultural exports and imports over the past three years.
Table 1: Agricultural exports (in $ billion)
Commodity 2013-14 2014-15 2015-16
Rice 6.2 7.8 7.9
Meat and meat preparations
3.3 4.5 4.9
Processed foods 2.8 2.7 2.7
Spices 2.8 2.5 2.4
Oil meals 3.0 2.8 1.3
Sugar 1.6 1.2 0.9
Wheat 1.9 1.6 0.8
Pulses 0.2 0.3 0.2
Agriculture exports
32.0 33.0 30.1
Sources: Annual Reports, Department of Commerce; PRS.
Table 2: Agricultural imports (in $ billion)
Commodity 2013-14 2014-15 2015-16
Pulses 2.4 1.8 2.8
Cashew 1.0 0.8 1.1
Vegetable oils 9.9 7.2 10.6
Fresh fruits 1.1 1.3 1.6
Spices 0.5 0.6 0.7
Sugar 0.6 0.4 0.6
Cocoa products 0.2 0.2 0.3
Natural Rubber 0.8 0.9 0.8
Agriculture Imports
16.8 14.9 15.9
Sources: Annual Reports, Department of Commerce; PRS.
India’s trade policy is affected by factors such as domestic availability of commodities, cost of
production as well as global price levels.18 However, frequent changes in trade policy, such as
reducing the import duty on a commodity in response to a shortage in supply, or decreasing minimum
export price of a commodity to facilitate its exports, may have an adverse effect on the development
of the agro-processing sector.18
Factors affecting agricultural productivity
Increase in small land holdings
140 million hectare of land is used as agricultural area, as of 2012-13.19 Over the years, this area has
been fragmented into smaller pieces of land. As seen in Table 3, the number of marginal land
holdings (less than one hectare) increased from 36 million in 1971 to 93 million in 2011.20 Marginal
and small land holdings face a number of issues, such as problems with using mechanisation and
irrigation techniques.
Table 3: Agricultural holdings (millions)
Holding 1970 -71
1980 -81
1990 -91
2000 -01
2010 -11
Marginal 36 50 63 75 93
Small 13 16 20 23 25
Medium 19 21 22 21 20
Large 3 2 2 1 1
All sizes 71 89 107 120 138 Note: Marginal: up to 1 hectare, Small: 1-2 hectares,
Medium: 2-10 hectares, Large: over 10 hectares.
Sources: Agriculture Census 2011; PRS.
Since smaller land holdings are either fragments
of larger holdings which have been passed on
within the family or have been informally leased
by a large holder, farmers who cultivate these
holdings often do not have a formal lease
agreement. The absence of such land records
does not allow these farmers to access formal
credit or be eligible for government benefits
such input subsidies or crop insurance schemes.
Land records and informal leasing
Of the total agricultural area under operation, 10% of land has been given out on agricultural leases,
with the percentage of leased out land varying across states.21 34% of the land in Andhra Pradesh,
25% in Punjab, 21% in Bihar and 18% in Sikkim has been leased out. In the past, states such as

6
Karnataka and West Bengal have attempted to provide legal rights to tenant farmers by forming
electronic records of land holdings and giving tenant farmers the right to their produce.22,23
Currently, laws of tenancy of agricultural land vary across different states.21 States such as Kerala,
Jammu and Kashmir and Manipur completely prohibit the leasing of agricultural land. Others such as
Bihar, Karnataka, Uttar Pradesh, Telangana and Odisha allow land leasing only by certain categories
of land owners. On the other hand, states such as Gujarat, Maharashtra, and Assam do not explicitly
prohibit leasing, and allow the tenant to purchase the land from the owner after a specified period of
tenancy. In Andhra Pradesh, Tamil Nadu and West Bengal, there is no legal ban on leasing land.
Different states also have different ceilings on the area of land which may be leased.21
The NITI Aayog has proposed a Model Land Leasing Law to provide for the legalisation of land
leasing.21 This would ensure that land owners have the security of ownership rights, and land tenants
are secure in their tenancy. Legalisation of land tenancy would also ensure that farmers get access to
formal credit, insurance, and inputs such as fertilizers. Table 16 in the Annexure provides details
regarding land leasing restriction and the extent to which the Model land leasing law has been adopted
in states.24 Only Madhya Pradesh has adopted the Model land leasing law so far.
Access to agricultural credit and insurance
Access to agricultural credit is linked to the holding of land titles. As a result, small and marginal
farmers, who account for more than half of the total land holdings, and may not hold formal land
titles, are unable to access institutionalized credit.25 Farmers may require credit for short term uses
such as purchasing inputs, weeding, harvesting, sorting and transporting, or long term uses such as
investing in agricultural machinery and equipment, or irrigation. Table 4 shows the distribution of
agricultural loans according to sources, as of 2013.
Table 4: Land holdings and sources of agricultural credit (as of 2013) Size of land
(hectare) Co-operative
society Bank
Money lender
Shopkeeper/ trader
Relatives/ friends
Others
0-1 10% 27% 41% 4% 14% 4%
1-2 15% 48% 23% 2% 8% 6%
2-4 16% 50% 24% 1% 6% 4%
4-10 18% 50% 19% 1% 7% 6%
10+ 14% 64% 16% 1% 4% 2%
Sources: Table 3.2, Report of the Committee on Medium-term Path on Financial Inclusion, Reserve Bank of India; PRS.
E-Bhoomi project in Karnataka
The E-Bhoomi project was started by the Government of Karnataka in the early 2000s. The
project aims to computerize existing land records and create a transparent system for changing
land records and dividing or merging plots of land. Under the system, farmers can collect land
record information for their plot at the Tehsil level, called Pahani. These records would contain
information such as the survey number of the land, land owner’s details, the classification of the
soil, and details regarding irrigation and crops grown, among others. The Pahani would enable
the farmer to (i) know whether the plot he wants to purchase is genuine, (ii) raise farm credit from
banks, (iii) use the land records for official or legal purposes. E-Bhoomi also allows farmers to
approach the government to address grievances.
Bargadar system in West Bengal
The West Bengal Land Reforms Act, 1955 provides certain rights to Bargadars or land tenants.
Bargadars are persons lawfully cultivating any land belonging to another person (who is not a
family member). Under the Act, produce from the farm is divided between the tenant and owner
in a 50:50 proportion if the cattle, manure and seeds are provided by the landowner, and 75:25 in
all other cases. Illegal eviction of tenants is a cognizable offence punishable with imprisonment
or fine, under the Act. However, it does not provide any ownership rights to the tenant.

7
Farmers with land holdings of less than a hectare primarily borrow from informal sources of credit
such as moneylenders (41%), whereas those with land holdings of two or more hectares primarily
borrow from banks (50% or more). Other major sources of agricultural credit include shopkeepers,
relatives or friends, and co-operative societies. Key issues relating to agricultural credit are lack of
access to formal credit owing to unclear land records, skewed ratio between short term and long term
agricultural credit, and inadequate access to crop insurance. These are summarized below.25
Short term and long term credit
Short term credit is generally taken for pre-harvest and post-harvest activities such as weeding,
harvesting, sorting and transporting. Long term credit is generally taken in order to invest in
agricultural machinery and equipment, irrigation and other developmental activities, etc. Over the
past few decades, the trend of short term and long term agricultural credit in the country has reversed.
In 1990-91, a majority of crop loans taken was long term credit, whereas short term credit accounted
for only about a quarter of all agricultural loans.26 As of 2011-12, 61% of crop credit was short term,
whereas long term credit had a share of 39%.27
In addition, small and marginal farmers, who account for about 86% of total land holdings, take more
short term loans than farmers with medium or large land holdings. This group of farmers also has the
highest share of borrowings from informal sources of credit such as moneylenders, family and friends.
Inadequate access to crop insurance
As of 2011, about 10% of Indian farmers were covered under a crop insurance scheme.28 Some
persistent issues with the crop insurance system include (i) unawareness about insurance schemes, (ii)
inadequate coverage of insurance schemes, (iii) assessment of the extent of damages in case of crop
losses, and (iv) timely settlement of claims.29
The Standing Committee on Finance has recommended that assessment of crop damage should be
completed and compensation should be deposited directly into farmers’ accounts in a timely manner.29
In addition, to reduce the seeking of unproductive credit, the government should create awareness
about what crops should be grown based on the quality of soil and incidence of rainfall, etc. in
different regions.29
A Committee on Financial Inclusion under the Reserve Bank of India had recommended that credit
eligibility certificates, which would act as tenancy/lease certificates should be issued to tenant
farmers.25 These certificates would enable also landless cultivators to obtain agricultural credit. It
recommended that the Reserve Bank of India should issue guidelines to banks, to give loans to
farmers against these certificates.
Pradhan Mantri Fasal Bima Yojana
The Pradhan Mantri Fasal Bima Yojana was launched by the central government in January 2016.30
The scheme aims to provide insurance coverage to farmers for crop failure, stabilise farmers’
income, and encourage farmers to adopt modern agricultural practices, among others. The scheme
has been allocated Rs 9,000 crore in the Union Budget 2017-18, compared to Rs 5,501 crore in
2016-17.31,32 The scheme covers all farmers, including tenant farmers and sharecroppers, who are
growing notified crops in notified areas. It covers crops such as cereals, pulses, oilseeds,
vegetables, and spices. As of December 2016, the scheme has covered 367 lakh farmers for a sum
of Rs 1,41,625 crore in the Kharif season of 2016, as compared to 309 lakh farmers and a sum of
Rs 69,307 crore in the Kharif season of 2015.33,34,35

8
Availability of water
Currently, about 51% of the agricultural area cultivating food grains is covered by irrigation.36 The
rest of the area is dependent on rainfall (rain-fed agriculture). Sources of irrigation include ground
water (wells, tube-wells) and surface water (canals, tanks). Table 5 shows the various sources of
irrigation used in agriculture.
Table 5: Sources of irrigation (as of 2010-11)
Sources: Agriculture Census 2011; PRS.
Source of Irrigation
% share of holdings
Number of holdings
Tube wells 44.2% 31,722
Canals 25.7% 18,414
Wells 19.7% 14,101
Other sources 8.4% 6,046
Tanks 5.8% 4,180
There is a need to improve the efficiency of
water use, especially in agriculture. Irrigation
currently consumes about 84% of the total
available water in the country.37
Nearly 65% of the irrigated land holdings use
ground water sources such as tube wells and
wells for irrigation.
The past few decades has led to an overuse of ground water sources in states, especially those
growing water intensive crops such as rice. For instance, in Haryana and Rajasthan, 40%-75% of the
ground water units are over-exploited, and the situation is worse in Punjab, where 75%-90% of
ground water units have been over-exploited.38 Details of ground water development across states
may be found in Table 15 in the Annexure.
The Commission for Agricultural Costs and Prices has recommended that quantitative ceilings should
be fixed on the per hectare use of water.39 In addition, farmers using lesser water than the ceiling
fixed should receive money equivalent to remaining units of water at the current domestic costs. This
would incentivize them to ration their use of water.
In 2011 and 2013, the government released Model Bills for Ground Water Management, based on
which states could formulate their own laws.40 It also launched a Policy in 2012 relating to water
demand management, efficiency of water usage, and pricing.41 The Model Bills were based on the
doctrine of public trust, under which resources meant for public use cannot be converted into private
ownership. More recently, the Ministry of Water Resources circulated a Model Bill for Groundwater,
2016, which may be adopted by states.42 The Bill provides an institutional framework for the
protection and management of groundwater. It states that groundwater is a common resource of all
persons, and ownership of the land over a groundwater resource should not deprive others from
accessing it. It also states that industrial or bulk usage of groundwater will be priced.
Micro-irrigation techniques
The Economic Survey 2015-16 observed that India largely uses the technique of flood irrigation,
where water is allowed flow in the field and seep into the soil.43 This results in the wastage of water
since excess water seeps into the soil or flows off the surface without being utilised. It has been
recommended that farmers should move from flood irrigation to the drip or sprinkler irrigation
systems (micro irrigation).44 This would help in conserving water as well as save on the cost of
irrigation. Using micro-irrigation systems (such as drip or sprinkler irrigation) has also been linked to
an increase in the yield of crops.
Note that India uses 2-3 times as much water to produce one tonne of grain as countries such as
China, Brazil and the United States.43 If India also increases its efficiency of water use, it will be able
to cover a wider area for irrigation. Table 14 in the Annexure provides a state-wise coverage of
micro-irrigation in the country.
Soil and fertilizers
Quality of soil
Soil is one of the most important factors in the productivity of agriculture. Indian soil consists of
primary nutrients such as nitrogen, phosphorous and potassium, secondary nutrients such as sulphur,

9
calcium and magnesium, and micro-nutrients such as zinc, iron, and manganese.45 While the levels of
food production have increased over the past few decades, it has also led to issues such as an
imbalance of nutrients in the soil, decline in the water table as well as the quality of water, and overall
depletion of soil health. The Ministry of Agriculture has noted that the quality of Indian soil is
deteriorating.46 About 5.3 billion tonnes of soil gets eroded annually, at a rate of about 16.4
tonne/hectare.
Imbalance in the use of fertilizers in soil may also result in a loss of fertility. If farmers are unaware
about the kind of fertilizer which is required for the soil in which they sow their crops, the
productivity of the soil will be subsequently affected. The Soil Health Card scheme was launched by
the central government in 2015. Under the scheme, all farmers are issued soil health cards, once
every three years. The soil health cards contain information such as the nutrient status of the soil, and
the recommended dose of nutrients to be provided to the soil to improve its fertility. As of February
2017, 2.9 crore farmers have been covered under this scheme.47 2.5 crore soil samples have been
collected, and 1.8 crore samples have been tested.48 The Ministry had set a target of 2.53 crore
samples to be collected by March 2017.
Imbalance in use of fertilizers
The manufacture, sale, and distribution of fertilizers in the country is regulated by the Ministry of
Chemicals and Fertilizers, under the Essential Commodities Act, 1955. There are three major types of
nutrients used as fertilizers: Nitrogen (N), Phosphatic (P), and Potassic (K). Of these, the pricing of
urea (containing N fertilizer) is controlled by the government, while P and K fertilizers were
decontrolled in 1992, on the recommendation of a Joint Parliamentary Committee. It has been
observed that urea is used more than other fertilizers. While the recommended ratio of use of the
NPK fertilizers is 4:2:1, this ratio in India is currently at 6.7:2.4:1.6 Overuse of urea is especially
observed in the states of Punjab, Haryana and Uttar Pradesh.6 Figure 7 shows the trend in the
consumption of fertilizers over the past decade.
An imbalanced use of urea may lead to a
loss of fertility in the soil over a period of
time, affecting productivity. Urea (N) is the
most produced (86%), consumed (74%) and
imported (52%) fertilizer in the country.49
The government determines the quantity of
fertilizers to be imported based on their
domestic availability.
However, the process of fixing the quantity
to be imported and actually receiving the
imports takes about 60-70 days, since only
three companies are allowed to import urea
into the country. Thus shortages are often
caused in the urea market. Since farmers
have to ensure that urea is applied to their
crops on time, it leads to the growth of black markets selling urea, often at prices above the maximum
retail prices.49
The level of fertilizer required for a crop depends upon the soil type, level of yield, and water
availability, in addition to the type of crop.6 Certain crops such as rice, wheat, maize, cotton and
sugarcane require larger quantities of nitrogen as compared to pulses, fruits and vegetables. Although
the ratio of N, P, and K fertilizer usage across crops has increased, the quantity of fertilizers used by
India is still lower as compared to other countries. The average consumption of fertilizers increased
from 106 kg per ha in 2005-06 to 128 kg per ha in 2012-13. In comparison, Pakistan consumes 205
kg per ha and China consumes 396 kg per ha.
Figure 7: Consumption of fertilizers (lakh tonnes)
Sources: Agricultural Statistics at a Glance 2015; PRS.
0
50
100
150
200
250
300
2004
-05
2005
-06
2006
-07
2007
-08
2008
-09
2009
-10
2010
-11
2011
-12
2012
-13
2013
-14
2014
-15
Urea Phosphatic Potassic
10
To meet the production target of 300 million tonnes of food grains by 2025 which was mentioned
earlier, 45 million tonne of fertilizers would be required. Of this, 6-7 million tonnes may be met from
organic fertilizers, but the rest would be met by chemical fertilizers (containing N, P and K). The
domestic production of fertilizers would have to be increased to meet this demand.6
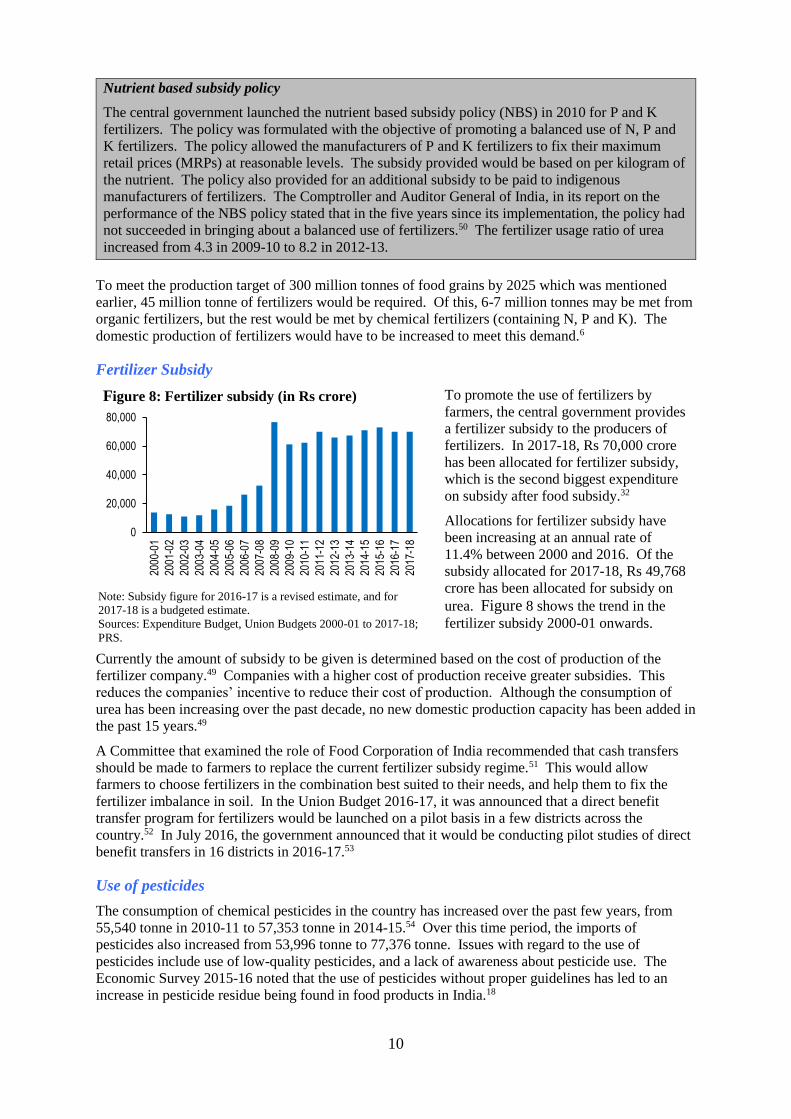
Fertilizer Subsidy
Figure 8: Fertilizer subsidy (in Rs crore) To promote the use of fertilizers by
farmers, the central government provides
a fertilizer subsidy to the producers of
fertilizers. In 2017-18, Rs 70,000 crore
has been allocated for fertilizer subsidy,
which is the second biggest expenditure
on subsidy after food subsidy.32
Allocations for fertilizer subsidy have
been increasing at an annual rate of
11.4% between 2000 and 2016. Of the
subsidy allocated for 2017-18, Rs 49,768
crore has been allocated for subsidy on
urea. Figure 8 shows the trend in the
fertilizer subsidy 2000-01 onwards.
Currently the amount of subsidy to be given is determined based on the cost of production of the
fertilizer company.49 Companies with a higher cost of production receive greater subsidies. This
reduces the companies’ incentive to reduce their cost of production. Although the consumption of
urea has been increasing over the past decade, no new domestic production capacity has been added in
the past 15 years.49
A Committee that examined the role of Food Corporation of India recommended that cash transfers
should be made to farmers to replace the current fertilizer subsidy regime.51 This would allow
farmers to choose fertilizers in the combination best suited to their needs, and help them to fix the
fertilizer imbalance in soil. In the Union Budget 2016-17, it was announced that a direct benefit
transfer program for fertilizers would be launched on a pilot basis in a few districts across the
country.52 In July 2016, the government announced that it would be conducting pilot studies of direct
benefit transfers in 16 districts in 2016-17.53
Use of pesticides
The consumption of chemical pesticides in the country has increased over the past few years, from
55,540 tonne in 2010-11 to 57,353 tonne in 2014-15.54 Over this time period, the imports of
pesticides also increased from 53,996 tonne to 77,376 tonne. Issues with regard to the use of
pesticides include use of low-quality pesticides, and a lack of awareness about pesticide use. The
Economic Survey 2015-16 noted that the use of pesticides without proper guidelines has led to an
increase in pesticide residue being found in food products in India.18
Nutrient based subsidy policy
The central government launched the nutrient based subsidy policy (NBS) in 2010 for P and K
fertilizers. The policy was formulated with the objective of promoting a balanced use of N, P and
K fertilizers. The policy allowed the manufacturers of P and K fertilizers to fix their maximum
retail prices (MRPs) at reasonable levels. The subsidy provided would be based on per kilogram of
the nutrient. The policy also provided for an additional subsidy to be paid to indigenous
manufacturers of fertilizers. The Comptroller and Auditor General of India, in its report on the
performance of the NBS policy stated that in the five years since its implementation, the policy had
not succeeded in bringing about a balanced use of fertilizers.50 The fertilizer usage ratio of urea
increased from 4.3 in 2009-10 to 8.2 in 2012-13.
Note: Subsidy figure for 2016-17 is a revised estimate, and for
2017-18 is a budgeted estimate.
Sources: Expenditure Budget, Union Budgets 2000-01 to 2017-18;
PRS.
0
20,000
40,000
60,000
80,000
2000
-01
2001
-02
2002
-03
2003
-04
2004
-05
2005
-06
2006
-07
2007
-08
2008
-09
2009
-10
2010
-11
2011
-12
2012
-13
2013
-14
2014
-15
2015
-16
2016
-17
2017
-18

11
While the production of pesticides is monitored by the Ministry of Chemicals and Fertilizers, their
usage is administered by the Ministry of Agriculture. There is a need to review the Insecticide Act,
1968, to provide for a regulatory framework for the pesticides sector.6 The Standing Committee on
Agriculture has also recommended that a Pesticides Development and Regulation Authority be
created to regulate the manufacturing, import and sale of pesticides in the country.6 Other
recommendations include developing an integrated pest-management system, which includes a mix of
the mechanical and biological methods of pest control, and encourages the use of bio-pesticides.18
Access to quality seeds
Quality seeds is another input necessary for agricultural productivity, and good quality seeds account
for 20%-25% of increased crop productivity.55 Seeds are regulated by the Seeds Act, 1966. The Act
regulates the quality, production, and sale of seeds. The Seeds Control Order, 1983 regulates the
licenses to sell, export and import seeds. Three varieties of seeds commonly used are (i) farm-saved
seeds, which account for 65%-70% of the total seeds consumption, (ii) commercially produced seeds
of the breeder, foundation and certified varieties, and (iii) genetically modified and hybrid seeds.
Agricultural seeds are produced by various agencies such as Indian Council of Agricultural Research
and its research institutions, state agricultural universities, and national and state seeds corporations.
The private sector has also started playing a role in supplying some seeds such as hybrid maize, bajra,
cotton and sunflower. Some of the challenges identified in the development and distribution of
quality seeds are (i) access to quality seeds, and (ii) inadequate research support.56
About 30%-35% of the total seeds available are produced by private and public sector companies, and
farm bred seeds account for the remaining seeds.18 While farmers can develop certain varieties of
seeds from the crops harvested on their land, high-yielding varieties of seeds have to be purchased
from the market. The cost of these varieties is too high for marginal and small farmers to afford, thus
disincentivising them from purchasing these varieties.43 The Economic Survey 2015-16 has
recommended bringing in more players into the production of seeds, to improve their availability in
the market and also reduce their prices.
Agricultural machinery
Mechanization is another aspect with a significant impact on agricultural productivity. The use of
agricultural machinery in agriculture enables agricultural labour to be used in other activities. It
makes activities such as tilling, spreading of seeds and fertilizers and harvesting more efficient, so that
the cost of inputs is offset. It can also make the use of labour in agriculture more cost-effective.
The status of mechanisation in agriculture varies for different activities, although the overall level of
mechanisation is still less than 50%, as compared to 90% in developed countries.62 The highest level
of mechanisation (60%-70%) is observed in harvesting and threshing activities and irrigation (37%).
The lowest level of mechanisation is found in seeding and planting. To increase productivity, farm
Genetically modified seed varieties
Genetically modified (GM) seeds are those where certain genes are modified to develop traits such as
a resistance to pests and herbicide, and increased productivity. Bt cotton is currently the only
approved GM technology seed in India. It was adopted in India in 2002 and as of 2014, 92% of the
area covered by cotton uses Bt cotton.57 After releasing Bt cotton in the country, the crop’s yield
increased from 190 kg/ha in 2000-01 to 461 kg/ha in 2014-15.58
Over the years, various GM crops such as Bt brinjal have been developed, but they have not received
the regulatory approval to be released in Indian markets. Under the existing regulatory process, the
Genetic Engineering Appraisal Committee (GEAC) under the Ministry of Environment, Forest and
Climate Change, approves proposals for the commercial use of GM seeds.59 In September 2016, the
GEAC invited public comments on a report authorising the environmental release of GE mustard.60,61
The Ministry of Environment is yet to provide the final approval for GE mustard to be released
commercially.

12
equipment which is durable, light-weight and low cost, and also specific to different crops and regions
should be made available for small and marginal farmers.62
Some challenges faced by farm mechanisation include different soil and climatic zones which require
customised farm machinery, and small land holdings with lack of access to resources. Mechanisation
should aim to increase agricultural efficiency by reducing the time and labour requirement,
minimising wastage and reducing costs of labour.63
Post-harvest activities
Storage facilities
After agricultural produce is harvested, it requires a robust storage infrastructure in order to minimise
any losses due to adverse weather conditions or in the process of transportation. The quantity of food
which is wasted during the harvest and post-harvest processes in the country has increased over the
past five years.18 The highest losses are observed in the case of fruits and vegetables (4.6%-15.9% of
production in 2015), pulses (6.4%-8.4%) and oilseeds (5.3%-9.9%).
Food wastage occurs at all levels of farming- the farmer, transporter, wholesaler and retailer. Some of
the reasons for this wastage are crop damage, improper harvesting techniques, poor packaging and
transportation, and poor storage. Some of the issues with the state of storage facilities in the country
are inadequate capacity and poor conditions of storage.64 In cases where the storage capacity is found
to be sufficient, the conditions of the godown are unfit, either because of the damp condition of the
storage or because of its remote location.
Food grains from the central pool are stored in warehouses managed by the Central Warehousing
Corporation (CWC), under the Department of Food and Public Distribution. As of December 2016,
the CWC was operating 438 warehouses with a total capacity of 9.7 million tonnes. State
Warehousing Corporations manage storage facilities at the state level. As of December 2016, 19 such
SWCs were operating 1,757 warehouses with a total capacity of 26 million tonnes.65
Another system for the storage of agricultural commodities is the negotiable warehousing system,
regulated by the Warehousing Regulatory and Development Authority. Under this system, farmers
who store their produce are issued a receipt with details of the location of the warehouse, and the
quality and quantity of the produce being stored. This receipt acts a collateral in case the farmer
wants to access agricultural credit.66 As of 2015, a storage capacity of 118 million tonnes was with
warehouses registered with the WRDA. Of this, 19 million tonne was with the private sector, 15
million tonne with the co-operative sector, and the remaining with government storage.67
Since foodstuffs such as certain fruits and vegetables deteriorate faster and lead to wastage, they are
stored at cold temperatures to reduce their perishability.68 Cold storage facilities in the country were
set up by the Cold Storage Order, 1964 under the Essential Commodities Act, 1955. Some challenges
identified in the development of cold storage in the country are delays in the process of changing land
use from agriculture to industrial use, lack of tax exemptions accrued to cold storage for agricultural
commodities, availability of power, and accessibility to farmers.69
Mega Food Parks
The Mega Food Parks scheme was launched by the Ministry of Food Processing Industries in
2008.70 The scheme aims to create a mechanism of linking agricultural production to the markets,
by involving farmers, processors and retailers together in a cluster-based approach. Expected
outcomes of the scheme would be a higher price for farmers from their produce, creation of high
quality food processing infrastructure, reduction in food wastage, and creation of an efficient food
supply chain, among others. The scheme is being implemented through a Special Purpose Vehicle
set up under the Companies Act, 2013. As of July 2016, 42 mega food parks were sanctioned by
the Ministry, of which 38 have been approved for implementation and 8 are operational.71

13
Agricultural Pricing
Procurement of agricultural commodities is the purchase of food grains by the central or state
governments. The Food Corporation of India is responsible for the purchase, storage, movement,
distribution and sale of agricultural produce.72 Minimum Support Prices are the prices at which the
government purchases food grains from farmers.
The largest procurement at MSPs is for rice and wheat. About a third of the wheat and rice produced
in the country is procured by the central government. In 2015-16, 33% of the wheat and 30% of the
rice produced in the country was procured by the central government. Note that India is a big
exporter of wheat; in 2014-15, of the 90.8 million tonnes of wheat produced in the country, 28 million
tonnes was procured for the central pool, and 29 million tonnes was exported.
Minimum Support Prices (MSPs)
MSPs are the prices at which the central government purchases food grains from farmers. MSPs are
fixed by the central government in order to ensure remunerative prices to farmers. Factors taken into
consideration in determining MSPs include costs of cultivation and production, productivity of crops,
and market prices.73 High MSPs of crops provide incentives to farmers to adopt modern technologies
and farming practices, to increase the overall productivity of their crops. The government announces
MSPs for 22 crops (and a fair and remunerative price for sugarcane), but the Public Distribution
System, for which grains are procured, primarily distributes wheat and rice to its beneficiaries. Since
procurement is mainly carried out for wheat and rice, farmers have focused on the cultivation of these
crops over other crops such as pulses and oilseeds.37 Table 17 in the Annexure shows the MSPs for
crops from 2005-06 to 2015-16.
Effectiveness of MSPs
Although MSPs are declared for various crops, procurement at these prices mainly happens for wheat,
rice, sugarcane and cotton, in a few states. 74 As a result, in procuring states, farmers focus on
cultivating these crops over other crops such as pulses, oilseeds, and coarse grains. MSPs are
declared prior to each sowing season (in June and October) so that farmers are aware of the minimum
price the government will offer for their produce. This is meant to encourage them to increase their
investment in the production of crops.74 In a report to measure the efficacy of MSPs, the NITI Aayog
found that a low proportion of farmers (10%) was aware of MSPs before the sowing season. 62% of
the farmers were informed of MSPs after sowing their crops. The pricing policy of MSPs would be
effective only if farmers are aware of it at the time of deciding what crops to grow. The NITI Aayog
recommended that the awareness level of farmers regarding MSPs must be increased and the
mediums of dissemination of this information must be strengthened.74
Other issues with the implementation of the MSP regime include long distances to the procurement
centres, increasing cost of transportation for farmers, irregular hours of the procurement centres, lack
of coverage storage godowns and inadequate storage capacity, and delays in the payment of MSPs to
farmers.74 The NITI Aayog notes that the agricultural pricing policy needs to be reviewed to ensure
that farmers are receiving remunerative prices for their produce. One of the measures it recommends
is a price deficiency system. Under such a system, farmers would be compensated for certain
commodities if their prices fall under a specified threshold. This would reduce stock-holding by
farmers who store commodities until prices increase, and also incentivise farmers to produce different
crops. Farmers would be paid by using the direct benefit transfer system, through bank accounts
linked to the their Aadhaar numbers.

14
Agricultural markets
The production, supply and distribution of certain commodities comes under the purview of the
Essential Commodities Act, 1955.75 These commodities include food grains, oilseeds, cotton and
woollen textiles, jute, and coal, among others. Under the Act, the central government may control the
price at which any essential commodity is traded. It may also regulate licenses for its storage,
transport, distribution, disposal or consumption.
Agricultural markets in the country are regulated by state Agricultural Produce Marketing Committee
(APMC) laws.76 Under these state Acts, farmers are required to sell their produce at state-owned
mandis. Over the years, several issues have been highlighted in this system. For instance, APMC
mandis currently levy a market fee on farmers who wish to sell their produce in the mandis. This
makes it expensive for farmers to sell at APMC mandis. In addition, farmers have to arrange for their
produce to be transported from their farms to the nearest mandi, which brings in costs such as
transport and fuel. In transporting the produce from the farm to the store, several intermediaries are
involved. These intermediaries are all paid a certain proportion of the price, as commissions. Thus
the market price which the farmer receives for his produce is significantly lower than the price at
which his produce is sold to the retailer.
The central government had released a Model APMC Act in 2003, to be enacted by states.77 The
Model Act (i) provides for the direct selling of produce through contract farming, (ii) permits private
persons, farmers and consumers to establish agricultural markets, (iii) levies a single market fee on the
sale of the commodity, and (iv) replaces licences with registration of market agencies so that they can
operate in more than one market, among other things. However, only 18 states and union territories
have implemented the reforms laid out in the Model Act.78 Four states are yet to initiate the reforms,
and the remaining states are at various stages of implementing them.
The Economic Survey 2014-15 recommended that a National Agricultural Market (NAM) be created
to provide for a national electronic platform on which farmers may sell their produce.79 Such a
market would enable farmers to receive a corresponding price for their produce and also allow them
to sell their produce anywhere in the country. In April 2016, the central government launched the
National Agricultural Market in 8 states districts, and integrated wholesale mandis in these areas to
create a common platform.80 Information regarding states’ progress towards APMC reforms may be
found in Table 18 of the Annexure.
1 Table 10, Employment across various sectors, Report of the 12th Plan Working Group on Employment, Planning and Policy, December 2011, http://planningcommission.gov.in/aboutus/committee/wrkgrp12/wg_emp_planing.pdf. 2 Press Note on First Revised Estimates of National Income, 2015-16, Ministry of Statistics and Programme Implementation, January 31, 2017, http://mospi.nic.in/sites/default/files/press_release/nad_PR_31jan17.pdf. 3 Tables 1.3A and 1.3B, Statistical Appendix, Economic Survey 2015-16, http://unionbudget.nic.in/es2015-16/estat1.pdf. 4 Fourth Advance Estimates of Production of Food grains for 2015-16, Directorate of Economics and Statistics, Ministry of Agriculture,
August 17, 2015, http://eands.dacnet.nic.in/Advance_Estimate/4th_Adv2014-15Eng.pdf. 5 Second Advance Estimates of Production of Food Grains for 2016-17, Directorate of Economics and Statistics, Ministry of Agriculture and
Farmers Welfare, February 15, 2017, http://eands.dacnet.nic.in/Advance_Estimate/2nd_Advance_Estimate_ENG.pdf. 6 29th Report: Impact of Chemical Fertilizers and Pesticides on Agriculture and allied sectors in the country, Standing Committee on
Agriculture, August 11, 2016, http://164.100.47.134/lsscommittee/Agriculture/16_Agriculture_29.pdf. 7 Table 4.4: Season-wise Area, Production and Yield of food grains, Agricultural Statistics at a Glance 2015,
http://eands.dacnet.nic.in/PDF/Agricultural_Statistics_At_Glance-2015.pdf... 8 Table 7.2, Agricultural Statistics at a Glance 2015, http://eands.dacnet.nic.in/PDF/Agricultural_Statistics_At_Glance-2015.pdf... 9 Food and Agricultural Organisation of the United Nations, http://www.fao.org/faostat/en/#compare. 10 “Food Security”, Policy Brief, Issue 2, June 2006, Food and Agriculture Organisation, United Nations, http://www.fao.org/forestry/13128-0e6f36f27e0091055bec28ebe830f46b3.pdf. 11 “The State of Food Insecurity in the World, 2015”, Food and Agriculture Organization of the United Nations, http://www.fao.org/3/a-i4646e.pdf. 12 “Food Management”, Chapter 5: Prices, Agriculture and Food Management, Economic Survey 2015-16, http://unionbudget.nic.in/es2015-
16/echapvol2-05.pdf. 13 National Food Security Act, 2013, Department of Food and Public Distribution, Ministry of Food and Public Distribution,
http://dfpd.nic.in/writereaddata/Portal/Magazine/Document/1_43_1_NFS-Act-English.pdf.

15
14 National Food Security Act, 2013, Food Grains Bulletin December 2015, Department of Food and Public Distribution, Ministry of
Consumer Affairs, Food and Public Distribution, http://dfpd.nic.in/writereaddata/images/EstdStatewiseNFSA.pdf. 15 “Nutritional Intake in India, 2011-12”, NSS 68th Round (July 2011 to June 2012), National Sample Survey Office, Ministry of Statistics
and Programme Implementation, October 2014, http://mospi.nic.in/sites/default/files/publication_reports/nss_report_560_19dec14.pdf. 16 “Incentivising productivity of pulses through minimum support prices”, Ministry of Finance, September 16, 2016,
http://finmin.nic.in/reports/Pulses_report_16th_sep_2016.pdf. 17 Table 12.1, Agricultural Statistics at a Glance 2015, Ministry of Agriculture,
http://eands.dacnet.nic.in/PDF/Agricultural_Statistics_At_Glance-2015.pdf. 18 Chapter 5, Prices, Agriculture and Food Management, Volume 2, Economic Survey 2015-16, http://unionbudget.nic.in/es2015-
16/echapvol2-05.pdf. 19 Table 13.1: Agricultural Land by use in India, Agricultural Statistics at a Glance 2015,
http://eands.dacnet.nic.in/PDF/Agricultural_Statistics_At_Glance-2015.pdf.. 20 Agriculture Census 2010-11, http://agcensus.nic.in/document/agcensus2010/completereport.pdf. 21 Report of the Expert Committee on Land Leasing, NITI Aayog, March 31, 2016,
http://www.niti.gov.in/writereaddata/files/document_publication/Final_Report_Expert_Group_on_Land_Leasing.pdf. 22 Frequently Asked Questions, Bhoomi, Government of Karnataka, http://bhoomi.karnataka.gov.in/faq.htm. 23 Part XV, Agrarian Reforms, Report of the National Commission on Agriculture, 1976, Ministry of Agriculture, http://krishikosh.egranth.ac.in/bitstream/1/2041446/1/CCS320.pdf. 24 Study Report on Agricultural Marketing and Farmer Friendly Reforms Across Indian States and UTs, October 2016, NITI Aayog, http://www.niti.gov.in/writereaddata/files/document_publication/Index_Agri_reform_%20Oct2016.pdf. 25 Report of the Committee on Medium-term Path on Financial Inclusion, Reserve Bank of India, December 2015, https://rbidocs.rbi.org.in/rdocs/PublicationReport/Pdfs/FFIRA27F4530706A41A0BC394D01CB4892CC.PDF. 26 Report of the Internal Working Group to Revisit the Existing Priority Sector Lending Guidelines, Reserve Bank of India, March 2, 2015, https://rbidocs.rbi.org.in/rdocs/PublicationReport/Pdfs/PSGRE020315.pdf. 27 Report of the Advisory Committee on Flow of Credit to Agriculture, Reserve Bank of India, May 2004, https://rbidocs.rbi.org.in/rdocs/PublicationReport/Pdfs/53525.pdf. 28 12th Plan Working Group Report on Natural Resource Management and Rainfed Farming, November 15, 2011. 29 34th Report: State of rural/agricultural banking and crop insurance, Standing Committee on Finance, August 10, 2016,
http://164.100.47.134/lsscommittee/Finance/16_Finance_34.pdf. 30 “Pradhan Mantri Fasal Bima Yojana (PMFBY), Ministry of Agriculture, http://agricoop.nic.in/imagedefault/whatsnew/sch_eng.pdf;
“Cabinet approves New Crop Insurance Scheme – Pradhan Mantri Fasal Bima Yojana”, Press Information Bureau, Ministry of Agriculture, January 13, 2016. 31 Expenditure Budget Volume 2, Department of Agriculture and Co-operation, Ministry of Agriculture and Farmers Welfare, Union Budget 2016-17, http://unionbudget.nic.in/ub2016-17/eb/sbe1.pdf. 32 Expenditure Profile, Union Budget 2017-18, http://unionbudget.nic.in/vol1.asp. 33 Lok Sabha Starred Question no. 196, Ministry of Agriculture and Farmers Welfare, Answered on November 29, 2016,
http://164.100.47.194/Loksabha/Questions/QResult15.aspx?qref=42786&lsno=16. 34 Union Budget 2017-18 Budget Speech, http://unionbudget.nic.in/ub2017-18/bs/bs.pdf. 35 “Achievements of Ministry of Agriculture and Farmers Welfare”, Press Information Bureau, Ministry of Agriculture, January 2, 2017. 36 Pocket Book of Agricultural Statistics, 2015, Ministry of Agriculture and Farmers Welfare, http://eands.dacnet.nic.in/PDF/Pocket-Book2015.pdf. 37 “Raising Agricultural Productivity and Making Farming Remunerative for Farmers”, NITI Aayog, December 16, 2015, http://www.niti.gov.in/writereaddata/files/document_publication/RAP3.pdf. 38 Water and Related Statistics 2015, Central Water Commission, April 2015, http://www.cwc.gov.in/main/downloads/Water%20&%20Related%20Statistics%202015.pdf. 39 Recommendations for Price Policy, Price Policy for Kharif Crops 2015-16, Commission for Agricultural Costs and Prices, Ministry of Agriculture, March 2015, http://cacp.dacnet.nic.in/ViewReports.aspx?Input=2&PageId=40&KeyId=532. 40 Draft Model Bill for the Conservation, Protection and Regulation of Groundwater,
http://www.planningcommission.nic.in/aboutus/committee/wrkgrp12/wr/wg_model_bill.pdf; ‘
Draft National Water Framework Bill, 2013, Ministry of Water Resources, http://www.indiaenvironmentportal.org.in/files/file/Draft%20national%20framework%20bill,%202013.pdf. 41 National Water Policy, 2012, http://wrmin.nic.in/writereaddata/NationalWaterPolicy/NWP2012Eng6495132651.pdf. 42 Model Bill for the Conservation, Protection, Regulation and Management of Ground Water Bill, 2016, Ministry of Water Resources, River Development and Ganga Rejuvenation, http://wrmin.nic.in/writereaddata/Model_Bill_Groundwater_May_2016.pdf. 43 “Chapter 4: Agriculture: More from less”, Economic Survey 2015-16, http://unionbudget.nic.in/es2015-16/echapvol1-04.pdf. 44 Natural Resource Management, State of Indian Agriculture 2015-16, Ministry of Agriculture and Farmers Welfare, May 2016,
http://agricoop.nic.in/imagedefault/state_agri_1516.pdf. 45 “Compendium on Soil Health”, Ministry of Agriculture, January 2012,
http://agricoop.nic.in/Admin_Agricoop/Uploaded_File/Comsoilhealth28612.pdf. I 46 Soil and its Survey, State of Indian Agriculture 2015-16, Ministry of Agriculture and Farmers Welfare, May 2016,
http://eands.dacnet.nic.in/PDF/State_of_Indian_Agriculture,2015-16.pdf. 47 Progress Report for states, Soil Health Card scheme website, Department of Agriculture, Co-operation and Farmers Welfare, February 15,
2017, http://soilhealth.dac.gov.in/PublicReports/StateWiseSampleEnteredTestedSHCPrintedDateFromTo. . 48 Lok Sabha Unstarred Question no. 755, Ministry of Agriculture and Farmers Welfare, Answered on February 7, 2017. 49 Chapter 9, Volume 1, Reforming the Fertiliser Sector, Economic Survey 2015-16, http://unionbudget.nic.in/es2015-16/echapvol1-09.pdf 50 Report No. 16 of 2015, Performance Audit on Nutrient Based Subsidy Policy, http://cag.gov.in/content/report-no-16-2015-performace-
audit-nutrient-based-subsidy-policy-decontrolled-phosphatic.

16
51 Report of the High Level Committee on Reorienting the role and restructuring the Food Corporation of India, January 2015,
http://www.fci.gov.in/app/webroot/upload/News/Report%20of%20the%20High%20Level%20Committee%20on%20Reorienting%20the%20Role%20and%20Restructuring%20of%20FCI_English_1.pdf. 52 Budget Speech, Union Budget 2016-17, http://unionbudget.nic.in/ub2016-17/bs/bs.pdf. 53 “Department of Fertilizers to conduct pilot in 16 districts to capture details as a precursor to DBT in fertilizer sector”, Press Information
Bureau, Ministry of Chemicals and Fertilizers, July 29, 2016. 54 Farm Inputs and Management, State of Indian Agriculture 2015-16, Ministry of Agriculture and Farmers Welfare, May 2016,
http://agricoop.nic.in/imagedefault/state_agri_1516.pdf. 55 “Indian seed sector”, Seednet India Portal, Ministry of Agriculture and Farmers Welfare,
http://seednet.gov.in/Material/IndianSeedSector.htm. 56 Productivity through seed development, Chapter 5, Agriculture and Food Management, Volume 2, Economic Survey 2015-16,
http://unionbudget.nic.in/es2015-16/echapvol2-05.pdf. 57 State of Indian Agriculture 2015-16, Ministry of Agriculture, http://eands.dacnet.nic.in/PDF/State_of_Indian_Agriculture,2015-16.pdf. 58 Table 4.21(a), Agricultural Statistics at a Glance 2015, http://eands.dacnet.nic.in/PDF/Agricultural_Statistics_At_Glance-2015.pdf... 59 GEAC clearances, Ministry of Environment, Forest and Climate Change, http://envfor.nic.in/major-initiatives/geac-clearances. 60 “GEAC invites comments for the proposal on authorisation of environmental release of Genetically Engineered Mustard”, Press
Information Bureau, Ministry of Environment, Forest and Climate Change, September 6, 2016. 61 “Assessment of Food and Environmental Safety”, Environmental release of Genetically Engineered Mustard hybrid DMH-11, Ministry of
Environment, Forests and Climate Change, September 2016, http://www.moef.gov.in/sites/default/files/Safety%20assessment%20report%20on%20GE%20Mustard_0.pdf. 62 Mechanization and Technology, Chapter 8, Agriculture and Food Management, Economic Survey 2013-14, http://unionbudget.nic.in/budget2014-2015/es2013-14/echap-08.pdf. 63 Mechanization, Chapter 5, Prices, Agriculture and Food Management, Volume 2, Economic Survey 2015-16, http://unionbudget.nic.in/es2015-16/echapvol2-05.pdf. 64 “Audit on the Preparedness for the Implementation of National Food Security Act, 2013”, Ministry of Consumer Affairs, Food and Public Distribution, Comptroller and Auditor General of India, April 2016,
http://www.cag.gov.in/sites/default/files/audit_report_files/Union_Civil_National_Food_Security_Report_54_of_2015.pdf. 65 Storage, Department of Food and Public Distribution, http://dfpd.nic.in/storage-intro.htm. 66 Storage of Food Grains, State of Indian Agriculture 2015-16, Ministry of Agriculture and Farmers Welfare, May 2016, http://agricoop.nic.in/imagedefault/state_agri_1516.pdf. 67 Annual Report 2014-15, Warehousing Development and Regulatory Authority, http://wdra.nic.in/Annual-report2014-15%20English.pdf. 68 Cold storage, Tamil Nadu Agricultural University Agritech Portal,
http://agritech.tnau.ac.in/agricultural_marketing/agrimark_cold%20storage.html. 69 “Challenges to cold chain development”, National Centre for Cold-Chain Development, 2012,
http://www.nccd.gov.in/PDF/ChallengeColdChain-Development.pdf. 70 Report on Evaluation of the Impact of the Scheme for Mega Food Park of the Ministry of Food Processing, Indian Council for Research
for International Economic Relations, July 2015, http://mofpi.nic.in/sites/default/files/ICRIERreportonimpactofMFPS%28Final%29_0.pdf. 71 “Food Processing Units and Mega Food Parks”, Press Information Bureau, Ministry of Food Processing Industries, July 29, 2016. 72 Department of Food and Public Distribution, Ministry of Consumer Affairs, Food and Public Distribution. 73 “Pricing, Costs, Returns and Productivity in Indian Crop Sector during 2000s”, Commission for Agriculture Costs and Prices, Ministry of Agriculture, June 2013, http://cacp.dacnet.nic.in/ViewQuestionare.aspx?Input=2&DocId=1&PageId=42&KeyId=480. 74 Evaluation Report on Efficacy of Minimum Support Prices (MSPs), NITI Aayog, January 2016, http://www.niti.gov.in/writereaddata/files/document_publication/MSP-report.pdf. 75 The Essential Commodities Act, 1955, http://seednet.gov.in/PDFFILES/Essential_Commodity_Act_1955(No_10_of_1955).pdf. 76 Agricultural Marketing, Department of Agriculture, Co-operation and Farmers Welfare, Ministry of Agriculture and Farmers Welfare,
http://www.agricoop.nic.in/divisiontype/agricultural-marketing. 77 Salient Features of the Model Act on Agricultural Marketing, Ministry of Agriculture and Farmers Welfare,
http://agmarknet.nic.in/amrscheme/modelact.htm. 78 Agricultural Prices, Marketing and International Trade, State of Indian Agriculture 2015-16, Ministry of Agriculture and Farmers
Welfare, May 2016, http://agricoop.nic.in/imagedefault/state_agri_1516.pdf. 79 Chapter 8, “A National Market for Agricultural Commodities – Some Issues and the Way Forward”, Volume 1, Economic Survey 2014-15, http://www.indiabudget.nic.in/es2014-15/echapvol1-08.pdf. 80 “The Prime Minister launched National Agricultural Market”, Press Information Bureau, April 14, 2016.
17
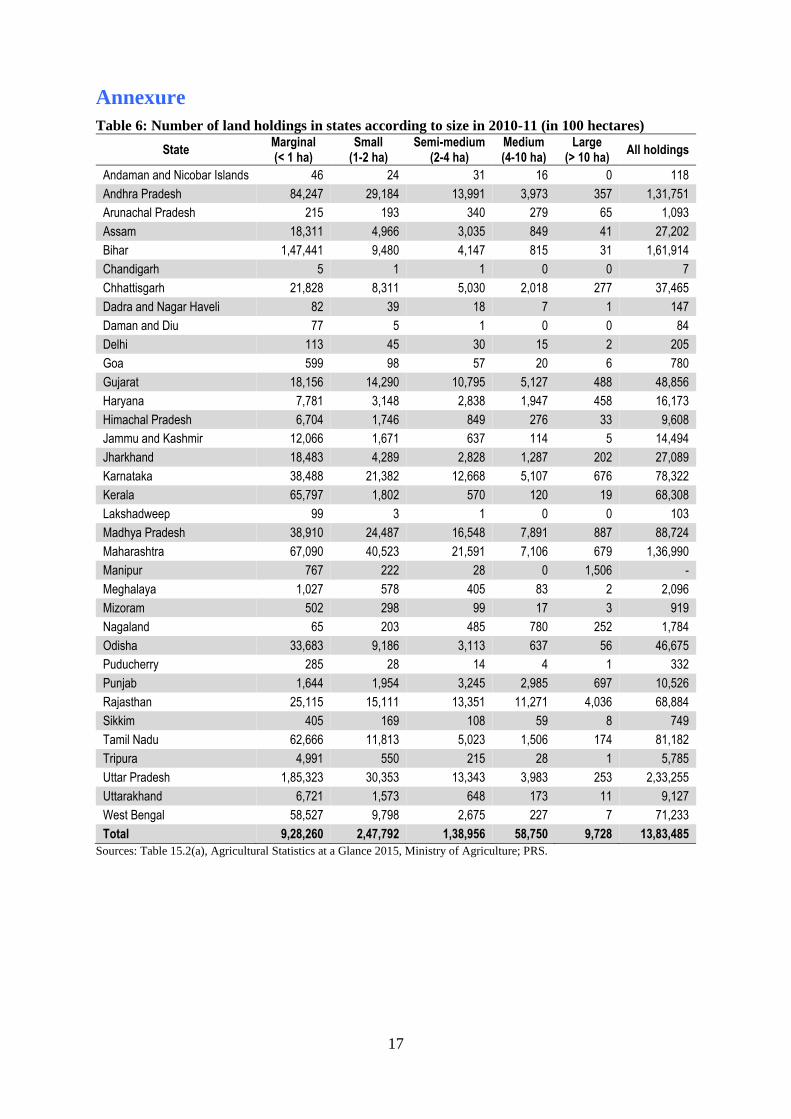
Annexure
Table 6: Number of land holdings in states according to size in 2010-11 (in 100 hectares)
State Marginal (< 1 ha)
Small (1-2 ha)
Semi-medium (2-4 ha)
Medium (4-10 ha)
Large (> 10 ha)
All holdings
Andaman and Nicobar Islands 46 24 31 16 0 118
Andhra Pradesh 84,247 29,184 13,991 3,973 357 1,31,751
Arunachal Pradesh 215 193 340 279 65 1,093
Assam 18,311 4,966 3,035 849 41 27,202
Bihar 1,47,441 9,480 4,147 815 31 1,61,914
Chandigarh 5 1 1 0 0 7
Chhattisgarh 21,828 8,311 5,030 2,018 277 37,465
Dadra and Nagar Haveli 82 39 18 7 1 147
Daman and Diu 77 5 1 0 0 84
Delhi 113 45 30 15 2 205
Goa 599 98 57 20 6 780
Gujarat 18,156 14,290 10,795 5,127 488 48,856
Haryana 7,781 3,148 2,838 1,947 458 16,173
Himachal Pradesh 6,704 1,746 849 276 33 9,608
Jammu and Kashmir 12,066 1,671 637 114 5 14,494
Jharkhand 18,483 4,289 2,828 1,287 202 27,089
Karnataka 38,488 21,382 12,668 5,107 676 78,322
Kerala 65,797 1,802 570 120 19 68,308
Lakshadweep 99 3 1 0 0 103
Madhya Pradesh 38,910 24,487 16,548 7,891 887 88,724
Maharashtra 67,090 40,523 21,591 7,106 679 1,36,990
Manipur 767 222 28 0 1,506 -
Meghalaya 1,027 578 405 83 2 2,096
Mizoram 502 298 99 17 3 919
Nagaland 65 203 485 780 252 1,784
Odisha 33,683 9,186 3,113 637 56 46,675
Puducherry 285 28 14 4 1 332
Punjab 1,644 1,954 3,245 2,985 697 10,526
Rajasthan 25,115 15,111 13,351 11,271 4,036 68,884
Sikkim 405 169 108 59 8 749
Tamil Nadu 62,666 11,813 5,023 1,506 174 81,182
Tripura 4,991 550 215 28 1 5,785
Uttar Pradesh 1,85,323 30,353 13,343 3,983 253 2,33,255
Uttarakhand 6,721 1,573 648 173 11 9,127
West Bengal 58,527 9,798 2,675 227 7 71,233
Total 9,28,260 2,47,792 1,38,956 58,750 9,728 13,83,485
Sources: Table 15.2(a), Agricultural Statistics at a Glance 2015, Ministry of Agriculture; PRS.

18
Table 7: Production of crops (in million tonnes)
Year Rice Wheat Coarse cereals Pulses Total food grains Oilseeds Cotton Sugarcane
1950-51 21 6 15 8 51 5 3 57
1960-61 35 11 24 13 82 7 6 110
1970-71 42 24 31 12 108 10 5 126
1980-81 54 36 29 11 130 9 7 154
1990-91 74 55 33 14 176 19 10 241
2000-01 85 70 31 11 197 18 10 296
2010-11 96 87 43 18 244 32 33 342
2014-15 105 87 43 17 252 28 35 362
2015-16 104 94 38 16 252 25 30 352
Note: Cotton production is in bales of 170 kg each.
Sources: Agricultural Statistics at a Glance 2015, Ministry of Agriculture; PRS.
Table 8: Top producing states for major crops in 2014-15
State Production
(million tonnes) % of all India
Yield (kg/ha)
Area under irrigation (%)
Rice
West Bengal 14.7 14.0 2,731 48.2%
Uttar Pradesh 12.2 11.7 2,082 83.1%
Andhra Pradesh 11.6 11.0 3,036 96.8%
India 104.8 2,390 58.3%
Wheat
Uttar Pradesh 25.2 28.4 2,561 98.4%
Punjab 15.8 17.7 4,491 98.9%
Madhya Pradesh 14.2 16.0 2,551 90.8%
India 88.9 2,872 93.4%
Maize
Andhra Pradesh 4.2 17.9 4,257 49.5%
Karnataka 3.9 16.5 2,921 36.0%
Maharashtra 2.2 9.3 2,080 12.7%
India 23.7 2,557 25.4%
Coarse cereals
Rajasthan 7.6 18.1 1,257 7.4%
Karnataka 6.7 16.0 1,992 20.1%
Andhra Pradesh 4.7 11.3 3,596 39.7%
India 41.8 1,729 16.5%
Pulses
Madhya Pradesh 4.7 27.4 877 38.5%
Rajasthan 2.0 11.3 580 21.1%
Maharashtra 1.7 10.1 553 9.2%
India 17.2 744 18.6%
Oilseeds
Madhya Pradesh 7.7 29.0 1,090 5.5%
Rajasthan 5.3 20.0 1,192 60.4%
Gujarat 4.0 14.9 1,550 31.3%
India 26.7 1,037 28.3%
Sugarcane
Uttar Pradesh 138.5 38.5 62,154 95.1%
Maharashtra 81.9 22.8 78,120 100.0%
Karnataka 41.9 11.7 93,100 100.0%
India 359.3 69,860 95.0%
Cotton (in million bales: 1 bale= 170 kg)
Gujarat 11.1 31.3 626 58.7%
Maharashtra 7.0 19.8 285 2.7%
Andhra Pradesh 6.6 18.7 444 13.9%
India 35.5 461 33.8% Sources: Agricultural Statistics at a Glance 2015, Ministry of Agriculture; PRS.

19
Table 9: State-wise yield of food grains (in kg/ha)
State/UT 2004-
05 2005-
06 2006-
07 2007-
08 2008-
09 2009-
10 2010-
11 2011-
12 2012-
13 2013-
14 2014-15*
Andhra Pradesh 2,138 2,365 2,231 2,613 2,744 2,294 2,530 2,519 2,670 2,661 2,653
Arunachal Pradesh 1,178 1,212 1,216 1,241 1,255 1,555 1,673 1,778 1,786 1,794 #
Assam 1,405 1,416 1,286 1,378 1,551 1,662 1,763 1,704 1,962 1,916 2,012
Bihar 1,192 1,311 1,656 1,546 1,766 1,530 1,479 2,098 2,366 2,018 1,948
Chhattisgarh 979 1,111 1,148 1,238 1,041 1,008 1,424 1,384 1,506 1,524 1,433
Goa 2,456 2,509 2,254 2,091 2,231 1,990 2,264 2,272 2,361 2,659 #
Gujarat 1,412 1,551 1,423 1,831 1,595 1,560 1,843 1,874 1,970 2,097 1,955
Haryana 3,092 3,045 3,393 3,420 3,388 3,383 3,526 3,879 3,689 3,855 3,772
Himachal Pradesh 1,923 1,731 1,714 1,918 1,757 1,297 1,787 1,911 1,850 1,962 2,011
Jammu and Kashmir 1,686 1,680 1,733 1,711 1,851 1,405 1,639 1,690 1,962 1,915 1,379
Jharkhand 1,234 1,073 1,550 1,709 1,720 1,330 1,257 1,798 1,876 1,891 1,855
Karnataka 1,388 1,776 1,289 1,548 1,511 1,377 1,684 1,629 1,488 1,620 1,684
Kerala 2,278 2,219 2,331 2,221 2,440 2,470 2,399 2,695 2,547 2,530 2,805
Madhya Pradesh 1,131 1,130 1,167 1,069 1,168 1,285 1,162 1,510 1,676 1,603 1,719
Maharashtra 836 948 940 1,150 1,001 1,039 1,184 1,155 1,038 1,207 1,043
Manipur 2,390 2,241 2,241 2,297 2,236 1,796 2,244 2,397 1,926 1,745 #
Meghalaya 1,674 1,455 1,800 1,774 1,783 1,809 1,803 1,873 1,997 2,387 #
Mizoram 1,888 1,754 822 285 898 1,047 1,246 1,382 1,756 1,506 #
Nagaland 1,577 1,615 1,482 1,567 1,811 1,256 1,958 1,967 2,027 2,018 #
Odisha 1,300 1,349 1,369 1,484 1,363 1,262 1,432 1,303 1,592 1,625 1,733
Punjab 4,040 3,986 1,359 4,255 4,231 4,144 4,280 4,364 4,347 4,500 4,144
Rajasthan 1,008 919 4,017 1,180 1,263 931 1,249 1,348 1,480 1,334 1,535
Sikkim 1,406 1,354 991 1,378 1,351 1,496 1,448 1,495 1,608 1,577 #
Tamil Nadu 1,874 1,847 1,354 2,125 2,225 2,477 2,393 3,162 2,131 2,554 2,529
Tripura 2,179 2,194 2,610 2,563 2,526 2,544 2,587 2,620 2,711 2,680 #
Uttar Pradesh 1,961 2,057 2,399 2,206 2,365 2,236 2,386 2,498 2,542 2,484 2,117
Uttarakhand 1,697 1,548 2,057 1,785 1,715 1,780 1,841 1,945 1,962 1,995 1,824
West Bengal 2,479 2,423 1,760 2,525 2,493 2,522 2,601 2,645 2,717 2,721 2,691
Others N/A N/A N/A N/A N/A N/A N/A N/A N/A N/A 2,778
All India 1,652 1,715 1,756 1,860 1,909 1,798 1,930 2,078 2,129 2,120 2,070
*4th Advance Estimates.
Sources: Agricultural Statistics at a Glance 2015, Ministry of Agriculture; PRS.

20
Table 10: State wise yield of wheat (in kg/ha)
State/UT 2005-
06 2006-
07 2007-
08 2008-
09 2009-
10 2010-
11 2011-
12 2012-
13 2013-
14 2014-
15
Andhra Pradesh 818 900 889 1,143 1,000 1,300 1,375 1,250 500 1,000
Arunachal Pradesh 1,525 1,575 1,472 1,576 1,505 1,595 1,757 1,498 1,510 *
Assam 1,074 1,117 1,268 1,090 1,087 1,179 1,147 1,304 1,292 1,257
Bihar 1,617 1,908 2,058 2,043 2,084 1,948 2,206 2,427 2,358 1,851
Chhattisgarh 886 1,002 1,059 1,040 1,086 1,144 1,227 1,396 1,304 1,388
Gujarat 2,700 2,498 3,013 2,377 2,679 3,155 3,014 2,875 3,255 2,810
Haryana 3,844 4,232 4,158 4,390 4,213 4,624 5,030 4,452 4,722 4,574
Himachal Pradesh 1,894 1,385 1,376 1,520 928 1,530 1,671 1,671 1,873 1,800
Jammu and Kashmir 1,790 1,893 1,782 1,735 1,003 1,535 1,689 1,595 2,061 1,200
Jharkhand 1,340 1,529 1,621 1,541 1,738 1,642 1,908 1,944 2,123 1,931
Karnataka 858 762 946 918 887 1,094 858 796 1,005 1,091
Madhya Pradesh 1,613 1,835 1,612 1,723 1,967 1,757 2,360 2,478 2,405 2,551
Maharashtra 1,393 1,325 1,659 1,483 1,610 1,761 1,558 1,528 1,460 1,381
Meghalaya 1,714 2,000 1,833 1,750 1,773 1,791 1,564 1,806 1,881 *
Nagaland 1,583 867 1,067 1,500 1,200 1,712 1,711 1,801 1,823 *
Odisha 1,364 1,487 1,554 1,396 1,450 1,458 1,644 1,894 1,574 1,772
Punjab 4,179 4,210 4,507 4,462 4,307 4,693 4,898 4,724 5,017 4,492
Rajasthan 2,762 2,751 2,749 3,175 3,133 2,910 3,175 3,028 3,083 2,974
Sikkim 1,385 1,385 1,000 1,345 1,135 1,023 1,060 1,058 1,083 *
Tripura 2,636 1,800 1,900 2,000 1,984 2,025 2,000 2,000 2,000 *
Uttar Pradesh 2,627 2,721 2,817 3,002 2,846 3,113 3,113 3,113 3,038 2,561
Uttarakhand 1,633 2,049 2,050 2,003 2,139 2,316 2,379 2,396 2,422 1,902
West Bengal 2,109 2,282 2,602 2,490 2,680 2,760 2,765 2,786 2,791 2,836
All India 2,619 2,708 2,802 2,907 2,839 2,989 3,177 3,117 3,145 2,872
Note: Figures for 2014-15 are 4th advance estimates. *in 2014-15, yield of Arunachal Pradesh, Meghalaya, Nagaland,
Sikkim and Tripura has been consolidated as 3,902 kg/ha.
Sources: Agricultural Statistics at a Glance 2015; PRS.
21
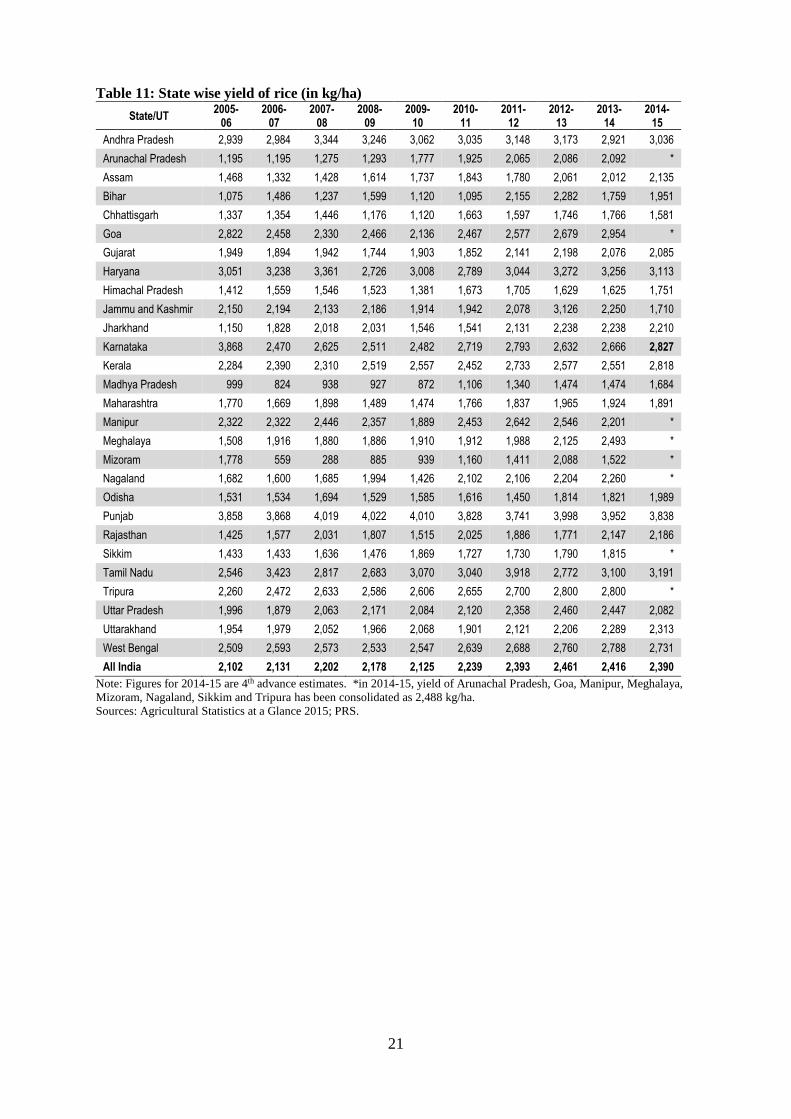
Table 11: State wise yield of rice (in kg/ha)
State/UT 2005-
06 2006-
07 2007-
08 2008-
09 2009-
10 2010-
11 2011-
12 2012-
13 2013-
14 2014-
15
Andhra Pradesh 2,939 2,984 3,344 3,246 3,062 3,035 3,148 3,173 2,921 3,036
Arunachal Pradesh 1,195 1,195 1,275 1,293 1,777 1,925 2,065 2,086 2,092 *
Assam 1,468 1,332 1,428 1,614 1,737 1,843 1,780 2,061 2,012 2,135
Bihar 1,075 1,486 1,237 1,599 1,120 1,095 2,155 2,282 1,759 1,951
Chhattisgarh 1,337 1,354 1,446 1,176 1,120 1,663 1,597 1,746 1,766 1,581
Goa 2,822 2,458 2,330 2,466 2,136 2,467 2,577 2,679 2,954 *
Gujarat 1,949 1,894 1,942 1,744 1,903 1,852 2,141 2,198 2,076 2,085
Haryana 3,051 3,238 3,361 2,726 3,008 2,789 3,044 3,272 3,256 3,113
Himachal Pradesh 1,412 1,559 1,546 1,523 1,381 1,673 1,705 1,629 1,625 1,751
Jammu and Kashmir 2,150 2,194 2,133 2,186 1,914 1,942 2,078 3,126 2,250 1,710
Jharkhand 1,150 1,828 2,018 2,031 1,546 1,541 2,131 2,238 2,238 2,210
Karnataka 3,868 2,470 2,625 2,511 2,482 2,719 2,793 2,632 2,666 2,827
Kerala 2,284 2,390 2,310 2,519 2,557 2,452 2,733 2,577 2,551 2,818
Madhya Pradesh 999 824 938 927 872 1,106 1,340 1,474 1,474 1,684
Maharashtra 1,770 1,669 1,898 1,489 1,474 1,766 1,837 1,965 1,924 1,891
Manipur 2,322 2,322 2,446 2,357 1,889 2,453 2,642 2,546 2,201 *
Meghalaya 1,508 1,916 1,880 1,886 1,910 1,912 1,988 2,125 2,493 *
Mizoram 1,778 559 288 885 939 1,160 1,411 2,088 1,522 *
Nagaland 1,682 1,600 1,685 1,994 1,426 2,102 2,106 2,204 2,260 *
Odisha 1,531 1,534 1,694 1,529 1,585 1,616 1,450 1,814 1,821 1,989
Punjab 3,858 3,868 4,019 4,022 4,010 3,828 3,741 3,998 3,952 3,838
Rajasthan 1,425 1,577 2,031 1,807 1,515 2,025 1,886 1,771 2,147 2,186
Sikkim 1,433 1,433 1,636 1,476 1,869 1,727 1,730 1,790 1,815 *
Tamil Nadu 2,546 3,423 2,817 2,683 3,070 3,040 3,918 2,772 3,100 3,191
Tripura 2,260 2,472 2,633 2,586 2,606 2,655 2,700 2,800 2,800 *
Uttar Pradesh 1,996 1,879 2,063 2,171 2,084 2,120 2,358 2,460 2,447 2,082
Uttarakhand 1,954 1,979 2,052 1,966 2,068 1,901 2,121 2,206 2,289 2,313
West Bengal 2,509 2,593 2,573 2,533 2,547 2,639 2,688 2,760 2,788 2,731
All India 2,102 2,131 2,202 2,178 2,125 2,239 2,393 2,461 2,416 2,390
Note: Figures for 2014-15 are 4th advance estimates. *in 2014-15, yield of Arunachal Pradesh, Goa, Manipur, Meghalaya,
Mizoram, Nagaland, Sikkim and Tripura has been consolidated as 2,488 kg/ha.
Sources: Agricultural Statistics at a Glance 2015; PRS.

22
Table 12: State wise yield of pulses (in kg/ha)
State/UT 2005-
06 2006-
07 2007-
08 2008-
09 2009-
10 2010-
11 2011-
12 2012-
13 2013-
14 2014-
15
Andhra Pradesh 772 679 803 818 740 675 637 833 928 797
Arunachal Pradesh 1,078 1,078 1,078 1,059 1,000 879 920 1,076 1,149 *
Assam 537 557 558 567 560 555 573 598 695 642
Bihar 749 722 818 801 836 878 975 1,052 1,044 830
Chhattisgarh 477 543 586 580 604 624 613 700 574 834
Goa 1,045 1,358 991 1,030 1,082 1,057 836 902 1,102 *
Gujarat 704 593 843 777 705 812 815 867 897 912
Haryana 622 824 602 972 758 899 706 800 819 692
Himachal Pradesh 713 932 1,062 758 681 1,213 954 1,413 1,763 1,251
Jammu and Kashmir 504 505 508 464 456 584 508 530 535 292
Jharkhand 567 686 736 724 709 773 885 1,038 1,021 1,004
Karnataka 487 377 531 466 451 561 492 555 641 644
Kerala 775 857 857 818 991 778 747 1,042 1,091 1,158
Madhya Pradesh 754 780 609 808 871 656 803 972 861 877
Maharashtra 584 602 746 537 702 768 693 704 802 554
Manipur 523 523 497 504 497 897 942 936 933 *
Meghalaya 750 744 825 867 881 881 896 1,019 1,092 *
Mizoram 1,215 1,160 529 900 1,667 1,534 1,389 1,061 1,468 *
Nagaland 1,281 1,200 1,189 1,203 906 1,085 1,091 1,099 1,124 *
Odisha 416 445 446 481 461 486 471 513 537 527
Punjab 804 850 804 908 896 910 789 823 872 894
Rajasthan 261 462 401 497 204 685 546 603 593 580
Sikkim 897 897 928 937 977 899 903 915 925 *
Tamil Nadu 337 541 303 307 382 386 552 413 752 689
Tripura 629 654 691 718 713 706 697 705 719 *
Uttar Pradesh 811 725 731 899 748 832 993 985 736 618
Uttarakhand 590 642 794 609 719 851 891 841 869 799
West Bengal 785 703 793 704 826 898 706 952 843 713
All India 598 612 625 659 630 691 699 789 764 744
Note: Figures for 2014-15 are 4th advance estimates. *in 2014-15, yield of Arunachal Pradesh, Goa, Manipur, Meghalaya,
Mizoram, Nagaland, Sikkim and Tripura has been consolidated as 7,029 kg/ha.
Sources: Agricultural Statistics at a Glance 2015; PRS.

23
Table 13: State wise yield of oilseeds (in kg/ha)
State/UT 2005-
06 2006-
07 2007-
08 2008-
09 2009-
10 2010-
11 2011-
12 2012-
13 2013-
14 2014-
15
Andhra Pradesh 698 609 1,276 842 724 861 650 849 929 778
Arunachal Pradesh 838 838 962 963 928 921 1,015 909 958 *
Assam 465 495 523 542 526 576 557 610 611 628
Bihar 982 1,031 979 999 1,042 1,048 1,046 1,120 1,189 1,058
Chhattisgarh 419 503 532 507 607 686 550 723 640 595
Goa 2,394 1,769 1,892 2,158 2,807 2,862 2,500 2,409 2,544 *
Gujarat 1,544 908 1,618 1,345 1,109 1,692 1,608 1,103 2,231 1,551
Haryana 1,124 1,344 1,214 1,723 1,645 1,855 1,394 1,712 1,637 1,415
Himachal Pradesh 344 477 442 365 271 514 579 514 490 591
Jammu and Kashmir 429 610 846 760 763 821 826 789 895 670
Jharkhand 311 422 553 560 563 625 680 787 663 652
Karnataka 600 478 681 556 502 782 665 647 824 773
Kerala 667 889 706 696 632 1,032 1,230 1,045 980 1,179
Madhya Pradesh 1,009 955 1,015 1,075 1,129 1,143 1,073 1,231 858 1,090
Maharashtra 925 963 1,274 857 725 1,394 1,223 1,337 1,276 658
Manipur 7,000 7,000 NA 778 778 774 788 729 840 *
Meghalaya 684 673 670 676 701 704 766 695 1,030 *
Mizoram 1,125 927 229 781 1,106 1,203 967 1,078 1,146 *
Nagaland 926 901 896 1,142 835 1,040 1,043 1,047 1,048 *
Odisha 565 550 608 604 589 619 661 700 755 692
Punjab 1,097 1,111 1,288 1,276 1,354 1,336 1,360 1,350 1,335 1,065
Rajasthan 1,134 1,146 1,051 1,114 1,066 1,203 1,243 1,296 1,144 1,192
Sikkim 727 727 872 763 959 832 841 863 887 *
Tamil Nadu 1,624 1,829 1,739 1,782 1,898 2,077 2,479 2,103 2,362 2,292
Tripura 709 705 675 714 717 732 751 506 759 *
Uttar Pradesh 857 993 837 856 865 753 832 828 898 699
Uttarakhand 750 967 1,000 1,138 1,012 1,082 1,236 1,070 892 892
West Bengal 952 918 997 828 1,065 1,047 994 1,162 1,181 1,194
All India 1,004 916 1,115 1,006 958 1,193 1,133 1,168 1,168 1,037
Note: Figures for 2014-15 are 4th advance estimates. *in 2014-15, yield of Arunachal Pradesh, Goa, Manipur, Meghalaya,
Mizoram, Nagaland, Sikkim and Tripura has been consolidated as 1,070 kg/ha.
Sources: Agricultural Statistics at a Glance 2015, Ministry of Agriculture; PRS.

24
Table 14: Coverage of micro-irrigation in states (in hectares)
State/UT Drip Sprinkler Total % of net sown area
under micro-irrigation
Andhra Pradesh 8,34,865 3,28,441 11,63,306 10.5%
Arunachal Pradesh 613 - 613 0.3%
Assam 310 129 439 0%
Bihar 4,610 97,440 1,02,050 1.9%
Chhattisgarh 15,553 2,41,420 2,56,973 5.5%
Goa 965 899 1,864 1.4%
Gujarat 4,11,208 4,18,165 8,29,373 8.1%
Haryana 22,682 5,50,458 5,73,140 16.3%
Himachal Pradesh 291 684 975 0.2%
Jharkhand 6,303 9,919 16,222 2.2%
Karnataka 4,29,903 4,17,005 8,46,908 60.2%
Kerala 22,516 6,948 29,464 0.3%
Madhya Pradesh 1,66,358 1,85,759 3,52,117 17.2%
Maharashtra 8,96,343 3,74,783 12,71,126 8.3%
Manipur 47 30 77 0%
Mizoram 1,727 425 2,152 0.7%
Nagaland 200 5,005 5,205 1.8%
Odisha 18,431 82,147 1,00,578 86.7%
Punjab 30,805 12,161 42,966 11.3%
Rajasthan 1,70,098 15,14,451 16,84,549 38.4%
Sikkim 5,544 2,769 8,313 0.2%
Tamil Nadu 2,90,009 30,436 3,20,445 1.8%
Telangana 25,299 5,293 30,592 39.7%
Tripura 100 392 492 0%
Uttar Pradesh 15,519 21,164 36,683 14.3%
Uttarakhand 696 316 1,012 0.1%
West Bengal 604 50,576 51,180 0.3%
Others 15,500 31,000 46,500 0.9%
All India 33,87,099 43,88,215 77,75,314 5.6%
Sources: Agricultural Statistics at a Glance 2015, Ministry of Agriculture; PRS.

25
Table 15: Ground water development and coverage of irrigation in states
State Ground water
development (%) % Irrigated area
Andhra Pradesh 45% 38.0%
Arunachal Pradesh 0% 13.0%
Assam 14% 5.4%
Bihar 44% 47.8%
Chhattisgarh 35% 26.4%
Goa 28% 40.4%
Gujarat 137% 41.2%
Himachal Pradesh 71% 11.4%
Haryana 67% 90.2%
Jharkhand 21% 3.7%
Jammu and Kashmir 133% 39.9%
Karnataka 32% 26.9%
Kerala 64% 22.2%
Maharashtra 57% 16.7%
Meghalaya 0% 20.9%
Manipur 1% 18.6%
Madhya Pradesh 47% 43.8%
Mizoram 4% 9.5%
Nagaland 6% 7.0%
Odisha 28% 26.2%
Punjab 172% 99.5%
Rajasthan 26% 31.9%
Sikkim 137% 15.9%
Tamil Nadu 77% 50.2%
Tripura 7% 21.4%
Uttarakhand 74% 40.9%
Uttar Pradesh 57% 76.2%
West Bengal 40% 62.2%
All states 62% 47.2% Sources: Central Water Commission; Agricultural Census 2011; PRS.

26
Table 16: Legal status of land leasing in states as of October 2016
State/UT Land leasing
restriction Adoption of Model
land leasing law
Andhra Pradesh Partial No
Arunachal Pradesh Ban No
Assam Partial No
Bihar Ban No
Chhattisgarh Ban No
Goa Ban No
Gujarat Ban No
Haryana Partial No
Himachal Pradesh Ban No
Jammu and Kashmir Ban No
Jharkhand Ban No
Karnataka Ban No
Kerala Ban No
Madhya Pradesh - Yes
Maharashtra Partial No
Manipur Ban No
Meghalaya Ban No
Mizoram Ban No
Nagaland Ban No
Odisha Ban No
Punjab Partial No
Rajasthan Partial No
Sikkim Ban No
Tamil Nadu Partial No
Telangana Ban No
Tripura Partial No
Uttar Pradesh Partial No
Uttarakhand Ban No
West Bengal Partial No
Andaman and Nicobar Islands Ban No
Chandigarh Ban No
Dadra and Nagar Haveli Ban No
Daman and Diu Ban No
Delhi Ban No
Lakshadweep Ban No
Puducherry Ban No Sources: Study Report on Agriculture Marketing and Farmer Friendly Reforms Across Indian States, NITI Aayog; PRS.
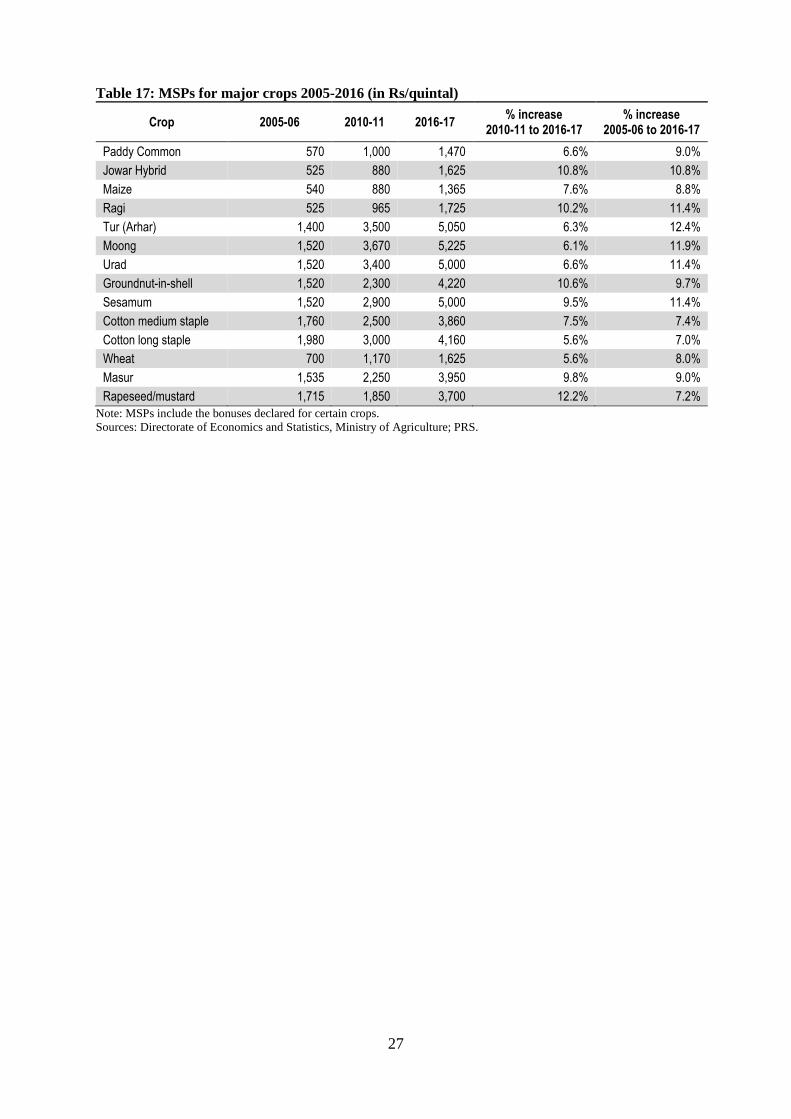
27
Table 17: MSPs for major crops 2005-2016 (in Rs/quintal)
Crop 2005-06 2010-11 2016-17 % increase
2010-11 to 2016-17 % increase
2005-06 to 2016-17
Paddy Common 570 1,000 1,470 6.6% 9.0%
Jowar Hybrid 525 880 1,625 10.8% 10.8%
Maize 540 880 1,365 7.6% 8.8%
Ragi 525 965 1,725 10.2% 11.4%
Tur (Arhar) 1,400 3,500 5,050 6.3% 12.4%
Moong 1,520 3,670 5,225 6.1% 11.9%
Urad 1,520 3,400 5,000 6.6% 11.4%
Groundnut-in-shell 1,520 2,300 4,220 10.6% 9.7%
Sesamum 1,520 2,900 5,000 9.5% 11.4%
Cotton medium staple 1,760 2,500 3,860 7.5% 7.4%
Cotton long staple 1,980 3,000 4,160 5.6% 7.0%
Wheat 700 1,170 1,625 5.6% 8.0%
Masur 1,535 2,250 3,950 9.8% 9.0%
Rapeseed/mustard 1,715 1,850 3,700 12.2% 7.2%
Note: MSPs include the bonuses declared for certain crops.
Sources: Directorate of Economics and Statistics, Ministry of Agriculture; PRS.

28
Table 18: Status of APMC reforms in states as of October 2016
State/UT Fruits and
vegetables out of APMC
Taxes on agricultural
commodities
Direct selling by producers
e-NAM Number of
markets under NAM
Andhra Pradesh Not done 7.0% Yes Yes 5
Arunachal Pradesh Not done 2.0% Yes No 0
Assam Done 1.0% Yes No 0
Bihar Not done 0.0% No No 0
Chhattisgarh Partial 2.0% Yes Yes 12
Goa Not done 5.0% Yes No 0
Gujarat Done 5.8% Yes Yes 40
Haryana Partial 10.5% Yes Yes 36
Himachal Pradesh Partial 7.0% Yes Yes 7
Jammu and Kashmir Not done 0.0% No No 0
Jharkhand Not done 5.3% Yes Yes 8
Karnataka Partial 7.5% Yes No 0
Kerala Not done 3.0% No No 0
Madhya Pradesh Partial 2.0% Yes Yes 20
Maharashtra Partial 3.0% Yes Yes 0
Manipur Not done 0.0% No No 0
Meghalaya Done 1.0% No No 0
Mizoram Not done 0.0% Yes No 0
Nagaland Partial 0.0% Yes No 0
Odisha Done 5.5% No No 0
Punjab Not done 13.5% Yes No 0
Rajasthan Partial 2.8% Yes Yes 11
Sikkim Not done 1.3% Yes No 0
Tamil Nadu Not done 5.0% No No 0
Telangana Not done 0.0% Yes Yes 44
Tripura Not done 2.0% Yes No 0
Uttar Pradesh Not done 4.0% No Yes 66
Uttarakhand Not done 9.0% Yes No 0
West Bengal Partial 5.0% Yes No 0
Andaman and Nicobar Islands
Not followed 0.0% No No 0
Chandigarh Not followed 10.5% Yes No 0
Dadra and Nagar Haveli Not followed 0.0% No No 0
Daman and Diu Not followed 0.0% No No 0
Delhi Partial 7.0% No No 0
Lakshadweep Not followed 0.0% No No 0
Puducherry Not followed 4.8% No No 0 Sources: Study Report on Agriculture Marketing and Farmer Friendly Reforms Across Indian States, NITI Aayog; PRS.