i n b a n g l a d e s h b u s i n e s s c o n f i d e n c
TRANSCRIPT

C O V I D - 1 9 A N DB U S I N E S S C O N F I D E N C E
I N B A N G L A D E S H
FINDINGS FROM THE 4TH ROUND OF
NATIONWIDE FIRM-LEVEL SURVEY IN APRIL 2021
S E L I M R A I H A N | M A H T A B U D D I N | M D . T U H I N A H M E D

i
COVID-19 and Business Confidence in Bangladesh Findings from the 4th Round of Nationwide Firm-level Survey in April 2021 May 2021 Authors
Selim Raihan Professor of Economics, University of Dhaka and Executive Director, SANEM
Mahtab Uddin Lecturer of Economics, University of Dhaka and Research Economist, SANEM
Md. Tuhin Ahmed Senior Research Associate, SANEM
ii
Acknowledgement
The successful accomplishment of this report based on the output of the fourth round of the Business Confidence Index (BCI) survey would not have been possible without the assistance of the people who have contributed immensely towards this survey. Our deepest appreciation and indebtedness are due to The Asia Foundation for collaborating with us in this timely endeavour. We would like to take this opportunity to extend our sincerest gratitude towards Mahmood Tabina Aida Xaviera (Intern, SANEM), and Jabun Naher (Research Associate, SANEM) for providing their valuable inputs and assisting the research team in preparing the report. We also thank Sk. Ashibur Rahman (Assistant Director and Admin, SANEM) and Shoaib Ahamad (Programme Associate, SANEM) for providing both internal and external communications and logistic support throughout the project. This project would not have been possible without the hard work and determination of the enumerators who have played a central role in data collection for this study. We convey our heartiest gratitude to Shafa Tasneem who is a current student of Dhaka University; Takrem Ferdous Surid and Rifah Tasfia Ishadi from Jahangirnagar University; Tahmina Jahan Usha, Zahin Ferdous Maesha and Halima Binte Islam from Bangladesh University of Professionals; and Rafiul Ahmed from Shahjalal University of Science and Technology. Lastly, we would like to acknowledge the contributions of the survey respondents for taking out the time of their busy schedules to participate in this project.

iii
© 2021 South Asian Network on Economic Modeling (SANEM) Disclaimer: The views and observations presented in this report are those of the authors and do not necessarily reflect the views of the South Asian Network on Economic Modeling (SANEM) or The Asia Foundation (TAF). The authors are fully responsible for any errors/views/opinions contained in this research report.
Published in May 2021
Citation: Raihan, S., Uddin, M., & Ahmed, M.T. (2021). COVID-19 and business confidence in Bangladesh: Findings from the 4th round of nationwide firm-level survey in April 2021. SANEM Publications, Dhaka, Bangladesh.
Published by South Asian Network on Economic Modeling (SANEM) Flat K-5, House 1/B, Road 35, Gulshan 2 Dhaka 1212, Bangladesh Phone: +88-02-58813075 Email: [email protected] http://www.sanemnet.org
With support from The Asia Foundation Cover Photo: Getty Images
Cover Design: Syeda Tasfia Tasneem Publisher SANEM Publications 252/3, North Goran, Khilgaon Dhaka-1219, Bangladesh

iv
Table of Contents Table of Contents ...................................................................................................................... iv List of Tables ............................................................................................................................. vi List of Figures ........................................................................................................................... vii List of Maps ............................................................................................................................. viii Acronyms and Abbreviations .................................................................................................... ix Executive Summary .................................................................................................................... x
Major findings ........................................................................................................................ x
Policy implications ............................................................................................................... xiv
Section-I: Introduction ................................................................................................................ 1 Objectives of the Business Confidence Index (BCI) survey ...................................................... 2
Outline of the report ............................................................................................................... 2
Section-II: Methodology ............................................................................................................. 4 Survey Methodology............................................................................................................... 4
Survey Coverage ................................................................................................................. 4
Survey technique and sampling framework ....................................................................... 4
Sampling framework .......................................................................................................... 4
Sampling distribution across divisions ................................................................................ 6
Selection of firms ................................................................................................................ 8
Business Confidence Index (BCI) Methodology ...................................................................... 9
Indicators for the assessment ............................................................................................. 9
The methodology of the indices ........................................................................................ 10
Steps to calculating the indices ........................................................................................ 11
Enabling Business-Environment Index (EBI) Methodology .................................................. 12
Construction of EBI ........................................................................................................... 13
Procedures to calculating the index ................................................................................. 14
Reliability of the survey ........................................................................................................ 15
Section III: Characteristics of the Surveyed Firms .................................................................... 16 Location of the surveyed firms ............................................................................................. 16
Ownership types of the firms ............................................................................................... 16
Years in operation ................................................................................................................ 18
Surveyed firm sizes ............................................................................................................... 18
Size of the workforce of the surveyed firms ......................................................................... 20
Export status of the surveyed firms ...................................................................................... 21
Profile of the respondents .................................................................................................... 22

v
Section-IV: Business Status and Confidence............................................................................. 24 Present Business Status Index (PBSI) over last year ............................................................. 24
Sectoral Present Business Status Index (PBSI) over last year ............................................... 26
Present Business Status Index (PBSI) over last quarter ........................................................ 28
Sectoral Present Business Status Index (PBSI) over last quarter .......................................... 29
Business Confidence Index (BCI) ........................................................................................... 31
Sectoral Business Confidence Index...................................................................................... 32
Analysis of PBSI and BCI by firm size .................................................................................... 34
Analysis of PBSI and BCI by sector ........................................................................................ 36
Analysis of PBSI and BCI by location ..................................................................................... 38
Analysis of PBSI and BCI by export status ............................................................................ 39
Firms’ Expectations versus Reality ....................................................................................... 41
Comparison of BCI to PBSI ratio among all four rounds of the BCI survey ....................... 41
Section-V: Business Environment ............................................................................................. 45 An overall analysis of Enabling Business-Environment Index .............................................. 45
Sectoral analysis of Enabling Business-Environment Index ................................................. 47
EBI and firm sizes .................................................................................................................. 53
EBI and PBSI .......................................................................................................................... 53
Section-VI: Status on Stimulus Packages ................................................................................. 54 Status of availing the stimulus package ............................................................................... 54
Reasons behind not availing of the stimulus packages ........................................................ 57
Problems faced by the recipients of the stimulus packages ................................................ 58
The effectiveness of stimulus packages ............................................................................... 59
Section-VII: Perceptions towards Economic Recovery ............................................................. 63 Firms’ perception towards overall economic recovery ........................................................ 63
Status of economic recovery ............................................................................................. 63
Contributing factors to the overall economic recovery .................................................... 66
Firms have actually been able to recover themselves .......................................................... 67
Section-VIII: Factors Influencing PBSI: A Panel Data Approach ............................................... 71 Regression model ................................................................................................................. 71
Regression results ................................................................................................................. 72
Section-IX: Conclusion and Policy Recommendations .............................................................. 74 References ................................................................................................................................ 78 Annexe: Questionnaire for the Business Confidence Index (BCI) Survey ................................. 79

vi
List of Tables
Table 1: Sector-wise firm size classification ............................................................................... 4
Table 2: Sampling distribution of firms for the manufacturing and services firms ................... 4
Table 3: Distribution of firms in the manufacturing sector ....................................................... 5
Table 4: Distribution of firms in the services sector ................................................................... 6
Table 5: Attrition from the survey (considered from first to fourth round) ............................... 6
Table 6: Attrition from the survey (considered from second to fourth round) .......................... 6
Table 7: Distribution of firms by Divisions ................................................................................. 7
Table 8: Weights assigned to five Likert response options ...................................................... 11
Table 9: Weights assigned to seven Likert response options ................................................... 14
Table 10: Location of surveyed firms by sector ........................................................................ 16
Table 11: Ownership type of surveyed firms by sector ............................................................ 16
Table 12: Female ownership status in manufacturing firms (per cent) ................................... 17
Table 13: Female ownership status in services firms ( per cent) ............................................. 17
Table 14: Years in operation for the firms ............................................................................... 18
Table 15: Surveyed firm sizes in the manufacturing sector ..................................................... 19
Table 16: Surveyed firm sizes in the services sector................................................................. 19
Table 17: Average permanent employment of the firms ......................................................... 20
Table 18: Employment status by gender in the manufacturing firms ..................................... 20
Table 19: Employment status by gender in the services firms ................................................. 21
Table 20: Export status of firms in the manufacturing sectors ................................................ 22
Table 21: Export status of firms in the services sector ............................................................. 22
Table 22: Years of experiences of the respondents .................................................................. 22
Table 23: The ratio of BCI to PBSI by broad-sectors for all rounds of the BCI survey .............. 42
Table 24: The ratio of BCI to PBSI by sub-sectors for all rounds of the BCI survey .................. 42
Table 25: Firms receiving stimulus packages in the manufacturing sector ............................. 55
Table 26: Firms receiving stimulus packages in the services sector ........................................ 56
Table 27: t-test on the PBSI score (compared to last quarter) by the status of stimulus
package receipt ........................................................................................................................ 60
Table 28: t-test on the BCI score by the status of stimulus package receipt ........................... 61
Table 29: t-test on the BCI score by the status of stimulus package receipt ........................... 62
Table 30: Recovery status before current COVID-19 upsurge in the manufacturing sector .... 64
Table 31: Recovery status after current COVID-19 upsurge in the manufacturing sector ...... 64
Table 32: Recovery status before current COVID-19 upsurge in the services sector ............... 65
Table 33: Recovery status after current COVID-19 upsurge in the services sector .................. 65
Table 34: Variable name and description ................................................................................ 72
Table 35: Factors influencing PBSI (quarter) under FE (model 1-9) ......................................... 73
Table 36: Factors influencing PBSI (quarter) under FE (model 10-18) ..................................... 73
vii
List of Figures
Figure 1: Distribution of economic establishment by Divisions (% of total) .............................. 7
Figure 2: Broad indicators for BCI/PBSI assessment .................................................................. 9
Figure 3: Likert options for answering the questions ............................................................... 10
Figure 4: Components of Enabling Business Environment Index ............................................. 13
Figure 5: Seven Likert response options ................................................................................... 13
Figure 6: Surveyed firm sizes .................................................................................................... 18
Figure 7: Share of exports in total sales (%) ............................................................................. 21
Figure 8: Interpretation of BCI/PBSI indices ............................................................................. 24
Figure 9: Present Business Status Index (PBSI) over the past year .......................................... 25
Figure 10: Indicator-wise PBSI over last year ........................................................................... 26
Figure 11: Sectoral PBSI over last year..................................................................................... 27
Figure 12: Present Business Status Index (PBSI) over last quarter ........................................... 28
Figure 13: Indicator-wise PBSI over last quarter ...................................................................... 29
Figure 14: Sectoral PBSI over last quarter ............................................................................... 30
Figure 15: Business Confidence Index (BCI).............................................................................. 31
Figure 16: Indicator-wise BCI ................................................................................................... 32
Figure 17: Sectoral BCI ............................................................................................................. 33
Figure 18: PBSI (quarter) by firm sizes ..................................................................................... 34
Figure 19: PBSI (year) by firm sizes .......................................................................................... 35
Figure 20: BCI by firm sizes ...................................................................................................... 35
Figure 21: PBSI (year) by sector ............................................................................................... 36
Figure 22: PBSI (quarter) by sector .......................................................................................... 37
Figure 23: BCI by sector ............................................................................................................ 37
Figure 24: PBSI (year) by location ............................................................................................ 38
Figure 25: PBSI (quarter) by location ....................................................................................... 38
Figure 26: BCI by location ........................................................................................................ 39
Figure 27: PBSI (year) by exporter............................................................................................ 40
Figure 28: PBSI (quarter) by export status ............................................................................... 40
Figure 29: BCI by export status ................................................................................................ 41
Figure 30: The ratio of BCI to PBSI (first round: April-June 2020) ............................................ 44
Figure 31: The ratio of BCI to PBSI (second round: July-September 2020) .............................. 44
Figure 32: The ratio of BCI to PBSI (third round: October-Decber 2020) ................................. 44
Figure 33: The ratio of BCI to PBSI (fourth round: January-March 2021) ................................ 44
Figure 34: Enabling Business Environment Index (EBI) and its components ........................... 46
Figure 35: Sectoral EBI ............................................................................................................. 48
Figure 36: Sectoral overall EBI ................................................................................................. 49
Figure 37: Sectoral EBI in terms of electricity (connection and quality) .................................. 50
Figure 38: Sectoral EBI in terms of the tax system................................................................... 50
Figure 39: Sectoral EBI in terms of property registration ........................................................ 50
Figure 40: Sectoral EBI in terms of access to finance ............................................................... 50
Figure 41: Sectoral EBI in terms of corruption ......................................................................... 51
Figure 42: Sectoral EBI in terms of skilled workforce ............................................................... 51

viii
Figure 43: Sectoral EBI in terms of transport quality ............................................................... 52
Figure 44: Sectoral EBI in terms of trade logistics ................................................................... 52
Figure 45: Sectoral EBI in terms of government support ......................................................... 52
Figure 46: Sectoral EBI in terms of COVID management ......................................................... 52
Figure 47: EBI by firm sizes....................................................................................................... 53
Figure 48: Relationship between EBI and PBSI ........................................................................ 53
Figure 49: Distribution of the firms on stimulus package receipt options ............................... 54
Figure 50: Percentage of firms receiving benefits by sub-sectors ........................................... 56
Figure 51: Stimulus package receipt by firm sizes (%) ............................................................. 57
Figure 52: Reasons for not availing of the stimulus packages ................................................. 58
Figure 53: Problems in availing stimulus packages ................................................................. 59
Figure 54: Effectiveness of the stimulus packages .................................................................. 59
Figure 55: PBSI and stimulus package ..................................................................................... 60
Figure 56: EBI and stimulus package ....................................................................................... 61
Figure 57: Recovery stats before current upsurge ................................................................... 63
Figure 58: Recovery status after current upsurge.................................................................... 63
Figure 59: Recovery before current upsurge by firm sizes ....................................................... 66
Figure 60: Recovery after current upsurge by firm sizes .......................................................... 66
Figure 61: Contributing factors to the overall economic recovery .......................................... 67
Figure 62: Status of firm’s internal recovery since the pandemic ............................................ 68
Figure 63: Status of firm’s internal recovery since the pandemic by Divisions ........................ 68
Figure 64: Status of firm’s internal recovery since the pandemic by firm sizes ....................... 69
Figure 65: Status of firm’s internal recovery since the pandemic by sub-sectors .................... 69
Figure 66: Status of firm’s internal recovery since the pandemic by export status ................. 70
Figure 67: Status of firm’s internal recovery since the pandemic by the recipient of the
stimulus package ..................................................................................................................... 70
List of Maps
Map 1: Covered districts in the first round BCI survey ............................................................... 8
Map 2: Covered districts in the second round BCI survey .......................................................... 8
Map 3: Covered districts in the third round BCI survey ............................................................. 8
Map 4: Covered districts in the fourth round BCI survey ........................................................... 8
Map 5: Percentage of firms with stimulus package by divisions ............................................. 55

ix
Acronyms and Abbreviations BBS Bangladesh Bureau of Statistics BCI Business Confidence Index BCS Business Confidence Survey BGMEA Bangladesh Garment Manufacturers and Exporters Association BKEMA Bangladesh Knitwear Manufacturers and Exporters Association BTMA Bangladesh Textile Mills Association COVID-19 Corona Virus Disease 2019 EBI Enabling Business-Environment Index EDF Export Development Fund EPZ Export Processing Zone FDIs Foreign Direct Investments FE Fixed Effect FY Fiscal Year GDP Gross Domestic Product GoB Government of Bangladesh GVA Gross Value Addition ICT Information and Communications Technology ID Identity MSMEs Micro, Small, and Medium Enterprises NAS National Accounts Statistics NBR National Broad of Revenue NIP National Industrial Policy OECD Organization for Economic Co-operation and Development PBSI Present Business Status Index R&D Research and Development RMG Ready-Made Garments SANEM South Asian Network on Economic Modeling SEZ Special Economic Zone SMEs Small and Medium Enterprises SMI Survey of Manufacturing Industry TAF The Asia Foundation TPE Total Persons Engaged VAT Value Added Tax

x
Executive Summary
There is no doubt that Bangladesh has severely felt the effects of the COVID-19 pandemic. Due to the nationwide lockdown in 2020, the business had suffered greatly - increased business costs, decreased productivity levels, and low sales have even led to permanent closures. While there were some signs of economic recovery after the lockdown had ended, further progress has been deterred due to the rise in cases, new variants and inadequate vaccinations in 2021, leading to an ongoing second wave and another lockdown. It is, therefore, crucial to monitor the private sector in this new scenario, and change and improve upon existing government policies. In relation to this, SANEM and The Asia Foundation jointly conducted the fourth round of the Business Confidence Index (BCI) survey on over 503 firms in Bangladesh in attempts to explore attitudes and expectations of businesses on profitability, investment, wages, employment, business costs, and sales or exports, amongst others. Out of the 503 firms surveyed, 253 firms were from the manufacturing sector and 250 firms were from the services sector. Seven sub-sectors in the manufacturing industry and eight sub-sectors in the services industry were identified based on Bangladesh’s latest available National Accounts Statistics. The survey covers RMG, Textiles, Pharmaceuticals, Leather and Tannery, Light Engineering, Food Processing, etc. in the manufacturing sector. In the Services sector, this study covers Wholesales, Retails, Restaurants, Transport, ICT and Telecommunications, Financial Sectors, Real Estate, etc. The number of firms to be surveyed for each of the sub-sectors was chosen based on the sub-sector's contribution to the GDP. Based on the survey responses, this study constructs four indices, namely – (i) Present Business Status Index in January-March 2021compared to October-December 2020, (ii) Present Business Status Index in January-March 2021 compared to January-March 2021, (iii) Business Confidence Index for April-June 2021 compared to January-March 2021 and (iv) Enabling Business-Environment Index (EBI). The indices are first prepared at the firm level and later aggregated to the sub-sectoral and sectoral level incorporating appropriate weights. Besides such indices measures, this study includes a section that presents the thoughts of business insiders on the availability and effectiveness of incentive packages, barriers to access these packages, and major challenges faced by the business firms. There is a section on perceptions towards economic recovery that includes the opinions of business insiders regarding their perceptions on the economic recovery and the type of recovery that Bangladesh might have, comparing between their thoughts before and after the second wave of COVID-19. Furthermore, this study includes a section that attempts to explore the factors influencing PBSI (quarter) through a robust econometrics method.
Major findings The improvement in overall business status has picked up the pace but is still slow. The overall Present Business Status Index (PBSI) in April-June 2020, July-September 2020, October-December 2020 and January-March 2021 compared to the corresponding quarters of the previous years (2019 and 2020) stands at 26.44, 34.23, 36.50 and 40.55 respectively. The increase in the fourth round has been higher than that in the third round - which is a good sign. However, it is still not as significant as the increase that took place in the second round.

xi
Improvement in most sub-indicators of PBSIs, with business cost in particular; slight decreases in others. The fourth round of the survey, like the first three rounds, also shows the highest score on wages - although there has been a small decrease from 52.19 to 50.05 between October-December 2020 and January-March 2021 compared to the corresponding quarters in the previous years. Unlike previous rounds, the PBSI for employment has decreased from 46.12 to 45.38. Investment, on the other hand, has risen to 46.67 January-March 2021 from 37.45 in October-December 2020 - possibly due to economic recovery and the distribution of the vaccine. For the profitability, sales/export and investment indicators, the scores have shown further improvements. Most notably, while in the previous quarters the PBSI of business cost had decreased quite significantly, it has increased to 25.99 in January-March 2021. This is quite promising and is likely a result of, again, the COVID-19 vaccine and fewer restrictions on business activity. Slight improvement in most sectoral PBSI scores; financial sector still the highest. The Financial sector is the subsector with the highest PBSI scores in all four rounds, with a score of 49.70 in January-March 2021. The Other Manufacturing, Restaurant, Financial and Other Services sub-sectors however, have seen small decreases in their PBSI scores. The business confidence for the April-June 2021 quarter has decreased over business status in the October-December 2020 quarter significantly. The BCI for April-June 2021 quarter, compared to the January-March 2021 quarter is 41.39. This is the first time in the four rounds that there has been a decrease in the BCI. Decrease in all sectoral BCI scores, but there is higher overall business confidence in the service sector, compared to the manufacturing sector. Most of the service sub-sector BCIs seem to be higher than those of the manufacturing sector, with the highest overall BCI being that of the Financial sector (52.38). Large firms continue to perform better than the Micro, Small, and Medium Enterprises (MSMEs) in both PBSI and BCI indicators. Like all previous rounds of the survey, the PBSI score compared to the previous quarter and the BCI score of large firms are much higher in comparison to other firm sizes. This is likely due to the advantages large firms have in times of economic turmoil, such as greater access to finance and a well-established business network. The gap between expectation and reality has decreased further. Comparing the BCI to PBSI ratios from the four rounds of the survey, the expectations of the firms are getting closer to the realities. This is because the impacts of the pandemic are now more predictable, making it easier for firms to adjust their expectations. Business environment is still unfavourable for firms. The overall EBI scores in all four rounds are 45.19, 44.61, 43.39 and 47.00 respectively, which are quite low despite the increase. EBI scores of every component, besides Covid Management, in the overall score has increased in the January-March 2021 quarter.
xii
All sectors have had improvements in their EBI score in the January-March 2021 quarter compared to the October-December 2020 quarter. The Financial and Other Manufacturing sectors have the highest EBIs in this quarter, increasing to scores above 50. Large firms have better business environments. The EBI score of large firms is higher across all rounds, compared to the EBI scores of MSME firms. In the fourth round, the EBI score of large firms is 47.22. A weak economic recovery is expected by 67% of firms after the current upsurge of COVID-19; previously the rate was only 14%. Before this, most of the firms expected a moderate recovery (52%). Now, the proportion has decreased to 31%. In terms of sectors, most manufacturing and service sector firms feel the same as the majority. While the majority expect a weak recovery across all firm sizes, large firms remain more optimistic. Foreign remittance, export of goods and services, banks’ credit to the private sector and the vaccination programme seem to be the factors with the strongest contributions to the overall economic recovery. Other factors seem to mainly have a moderate to low contribution. 39% of 484 firms opined that the management of the 2nd wave of COVID-19 has had a low contribution to economic recovery. 38% of 435 firms think that the import of raw materials, goods and services has had a moderate contribution. 41% of 470 firms think that the existing stimulus package and its disbursement had a low contribution. 14% of 459 firms opined that the social protection programme has had zero contribution. The majority of the firms have recovered to 51-75% of their pre-pandemic state. 19.3% of the firms have had 76-99% recovery, 16.9% have had 26-50% recovery and 7.0% have had 1-25% recovery. Only 8.6% have fully recovered, and 5.4% are better off in comparison to their pre-pandemic state. Recovery is not uniform across the divisions. Surveyed firms recovered 57% compared to their pre-pandemic situation. Dhaka (71%) and Sylhet (61%) had the highest recovery. While Mymensingh (51%), Khulna (49%), Rangpur (45%) and Barishal (40%) are far below the overall rate. Large firms have made a greater recovery to their pre-pandemic state, at 77.3%. Medium firms have recovered 63.6%, micro and small firms have recovered only 46.9%. In terms of sectors, the largest recoveries were in the Financial sector, Pharmaceuticals, RMG, and Textile. On the other hand, sectors like Leather & Tannery, Retailer, Other Services, Transportation, and Light Engineering are far below the overall rate. Exporter firms have had a higher recovery, at 68.8%. In comparison, non-exporter firms stand at 50.2%. Firms that have received stimulus packages have a higher recovery rate. It stands at 72.4%, while for non-recipient firms the rate is 53.1%.

xiii
69% of the surveyed firms are yet to receive any stimulus packages announced by the Government of Bangladesh. Around 22% of the respondents said their firm received the stimulus package announced by the GoB. Around 9% of the respondents were not sure whether their firm received the stimulus package or not. The distribution of the firms with stimulus packages is not uniform across divisions. The distribution is the highest in Dhaka, where 31% of the firms surveyed responded that they received the stimulus package. In Chittagong, 28% of the surveyed firms received the incentive package. This rate is 28% in Chittagong, and 11-17% in Khulna, Rajshahi, Rangpur, and Mymensingh. Sylhet and Barisal have the lowest rates - 8% and 0% respectively. The manufacturing sector availed more stimulus packages than the service sector. 80% of the firms that received the stimulus packages are from the manufacturing sector. From the firms surveyed in the manufacturing sector, 36% of the firms received the stimulus packages, with RMG and Textiles being the majority. In the services sector, 8% of the surveyed firms received the stimulus package - most of them being from the Financial, Wholesale, Transport, and Real Estate sectors. Large firms received more stimulus packages than micro, small and medium firms. 46% of the surveyed large firms received stimulus packages, whereas this rate was 30% for medium firms, and 9% for micro and small firms. Major factors that led to firms not availing the stimulus packages were the lengthy procedure, lack of packages for certain industries, difficulty in obtaining information, the package not being a grant etc. 89% of 190 respondents stated that the reason for not availing of the stimulus package is ‘it is not a grant rather a loan with soft terms’. For 75% of 212 firms, there were no packages for their respective industry. 79% of 158 firms cited that delays in receiving the package are what discouraged them from availing it. 61% of firms out of 168 stated that they did not avail due to bank-related difficulties. Additional factors include difficulty in obtaining information, the size of the package itself and even bribes. 58% of respondents who received the stimulus packages thought of it as effective. 25% thought that it was very effective, 15% were neutral, while only 2% said that it was ineffective. Firms that have received stimulus packages have higher mean PBSI scores on all sub-indicators than non-recipients. This implies that recipient firms are performing better than non-recipient firms during the January-March 2021 quarter than the previous quarter. Firms that have received stimulus packages have higher business confidence in terms of most indicators. The only indicator where the packages have not had an impact is business costs, which is likely due to the second wave of COVID-19 and subsequent lockdown measures. Stimulus packages may help improve the business environment. The EBI score of firms that received the stimulus packages is 49.91, higher than the overall EBI and EBI of non-recipient firms, which stands at 46.18.

xiv
Policy implications Creating an annual budget that is COVID-19 focused: In the previous fiscal year, the proposed budget could not take into account the widespread and detrimental effects of COVID-19 on the economy, as the planning process likely took place before the pandemic. However, it is crucial that this year’s budget reflects the impact of COVID-19 and presents policies that are targeted towards healthcare and economic recovery. Lowering the implicit/indirect costs for the businesses: Implicit or indirect costs indirectly increase the overall business costs. The higher the implicit/indirect costs, the lower the overall business performance of the firms. Higher EBI, perhaps, indicates lesser indirect and implicit costs borne by a firm. It also represents lower business risks. Therefore, the government must focus on improving the overall business environment to lower such implicit/indirect costs of business operation. Increasing the tax net and automation in tax collection: Due to the negative impacts of the pandemic on economic growth and private sector investment, the 2020-21 budget is far behind on its revenue target - this may lead to an increase in pressure on existing taxpayers to gain greater revenue. To combat this, taxation agencies should be given targets to increase the tax net every year. Furthermore, full automation of VAT and direct taxes would aid in solving the issue of corruption present in this process. Making a proper database on the business community: To sustain and revive the overall business environment amid the COVID-19 pandemic, a proper database for all the categories like employees’ list, wage list, employees’ different allowance list, etc. is crucial because it can give us a proper concept about the business community. Based on the information from the database, the GoB can easily undertake the necessary strategies and monitor the overall business situation. So, the GoB should undertake a policy framework to create the proper database and prepare a common platform on which all types of data will be available. The database will be very helpful for the policy-makers to understand the overall business environment and to design relevant & contemporary policies. Focusing on appropriate policy formulation and design: The GoB should formulate appropriate policies to create a business-friendly environment amid the pandemic to retain and increase the business confidence of the business community, especially during the ongoing second wave and the resulting decrease in BCI scores. The GoB should adopt strong monetary and fiscal policies to increase investment and create new job opportunities, to stimulate overall economic activities. The GoB should start a combined discussion with the private sector to renew their confidence in terms of recovery, which has gone down significantly due to the current upsurge. To revitalise the economy's supply side, the GoB should focus on domestic demand generation and robust supply chain management for the businesses.
Strong support needed for the Micro and Small firms: As observed in the survey, MSMEs were least successful in availing a stimulus package compared to the large firms. The barriers

xv
to access to stimulus packages by the small and medium firms need to be identified and solved. The survey has shown that the business status of the stimulus package recipient firms is more favourable compared to the non-recipient firms. The recipient firms are performing relatively well compared to the non-recipient firms. It implies that the stimulus packages should be expanded and modified with a long-term plan as soon as possible to revive the MSME sector of the country. The requirements and procedures of getting the packages should be simplified and easier.
Assessment and proper monitoring of the stimulus package need to be ensured: It is important to assess the efficacy of the stimulus packages and bring on any required modifications and expansions, especially in the context of the second wave of COVID-19. A mere announcement of the stimulus packages will not be an adequate measure to aid businesses to overcome the negative effects of the ongoing COVID-19 pandemic. Though the GoB has made a timely release of the funds so far, businesses (particularly MSMEs) could not manage to receive the monetary benefits and utilize them on time due to barriers in the form of corruption, banking non-transparencies, information asymmetries and a complex taxation system. Thus, the GoB should conduct an assessment about the proper implementation of the stimulus packages to identify the ineffectiveness in the processes and institutional arrangements.
Access to the stimulus package needs to be eased: As has been observed in this study as well as in many media reports, banks are less interested in disbursing the incentive packages to the medium, small, and micro firms. In many cases, the incentive packages have only been disbursed to the banks' existing customers and there is also a strong bank-client relationship between the banks and the large firms. Bangladesh Bank needs to provide a guideline to the banks in disbursing the loans to the medium, small, and firms, which could include setting a rule to pay out stimulus packages in terms of GDP contribution of firms of such size and firms in the informal sector. All problems against access to finance identified and relevant policy support should be ensured. The post-pandemic policy criteria of the bank-client relationship should be simplified. Moreover, in Bangladesh, many business entities remain outside of the formal banking system. The Bangladesh Bank can undertake necessary measures in collaboration with the National Board of Revenue (NBR) in devising a policy so that all business enterprises come under the financial sector network and the non-banking firms are given the opportunities to get the loan facilities amid the crisis. Furthermore, non-profit organisations (NGOs) and trade bodies can also be engaged to monitor whether the banks are disbursing the stimulus packages efficiently. Friendlier business policies should be on focus: There has been a sequential change in the gap between expectations and reality amongst the firms – in this round, we see that the gap has decreased substantially. Since the pandemic has now taken a more predictable path, the firms' expectations are now more aligned to reality. The firms would be more responsive to policy changes now than before – a window the government must capitalize.
1
Section-I: Introduction
COVID-19 pandemic has had a significant, negative impact on the global economy - rising levels of poverty, unemployment, business costs and closures due to lockdowns and restricted business activity are just some of the economic effects that have led to the largest global recession in history, which is still ongoing. The shock of the pandemic is being felt in the Bangladeshi economy as well, with similar effects. This is a cause of concern for the Government of Bangladesh (GoB); it is aiming to support the economy towards recovery by providing multiple incentive packages for businesses. While some progress has been made, the speed of recovery is still quite slow; although the distribution of vaccines provides some hope. The private sector is one of the biggest driving forces of the economy, which is why it should also be closely monitored.
Continuously observing the response from businesses during the multiple phases of economic recovery, that is whether they are more or less confident about future prospects, is essential to gauge the effectiveness of the policies implemented (vaccination programmes, stimulus packages etc.) and bring about changes accordingly. Such observations enable the policymakers to answer some vital questions such as, ‘whether the private sectors are confident enough for their returns’, ‘what are their perceptions regarding the investment opportunities in the next quarter?’, ‘what are their perceptions regarding employment, or wages scenario?’, ‘how do they think the overall business cost in the economy is going to be in the next quarter?’, ‘what are their views about ease of doing business and the overall business environment during the outbreak of COVID-19?’, or how much they are confident about the economic recovery amid the pandemic?’
There are multiple reasons why the answers to these questions are significant. Based on the results of the survey, the current confidence level of private sector businesses, in general, can be reasonably estimated. Continuous monitoring of the data allows to track the progress of government policies and assists in targeting the sectors that require more or less support in terms of stimulus packages. This data also helps in negotiations between policymakers and businesses - with sector-level business confidence being a component in the data, it can be used by business communities when they require government attention in regards to their sectors.
Such investment and business confidence monitoring tools are widely available in developed economies. The OECD countries regularly update an index named Business Confidence Index with a similar objective. Since the Asian Crisis in the late 1990s, the East Asian countries periodically monitor and update information on ‘business sentiment’. Most of these countries collect this data at a regular interval, such as monthly or quarterly. As already mentioned, during a crisis period, such monitoring becomes more crucial. In the context of Bangladesh, no such regular monitoring data on ‘business confidence’ is available.
In order to facilitate economic recovery, private sector investment is crucial for the Bangladeshi economy; more than three-quarters of Bangladesh’s total investment comes from the private sector. Such investment contributes to job creation and leads to a virtuous multiplier effect across the backward and forward linking industries. However, in order for
2
more private sector investment to take place, businesses must have greater confidence in gaining favourable returns with lower risk. This is why Bangladesh should frequently monitor business confidence levels, to appropriately set policies and stimulus packages according to the pandemic situation at hand.
Against this backdrop, regular and timely monitoring on the confidence of the business insiders that will capture their concerns and expectations could not be timelier. The Business Confidence Index Survey by South Asian Network on Economic Modeling (SANEM) and the Asia Foundation (TAF) aims to capture this perspective quarterly for the FY2020-21. SANEM, with support from TAF, collected the data from representative Manufacturing and Services sectors for the first quarter of FY2020-21 in July 2020. The findings from the first round of the report were presented and published in August 2020, illustrating the immediate effects of the economic downturn. The second round of the survey was conducted in October 2020 and was published in November 2020, highlighting the economic recovery taking place after the gradual reopening of businesses. The third round of the survey, conducted in January 2021, provides information for the last quarter of 2020 which showed an overall slower economic recovery compared to previous quarters. The fourth round of the survey looks further into business expectations for the new year, now analyzing the effects on business confidence as firms have become more adapted to the pandemic and its restrictions. This round covers the present business scenario of the firms during January-March 2021 and their expectations about the overall business environment for the following quarter. This report is a summary of the findings from the fourth round of the BCI survey.
Objectives of the Business Confidence Index (BCI) survey
The business confidence survey aims to analyze the expectations of private sector businesses on indicators such as investment, employment, wages, stimulus packages, performance related to business costs, sales or exports, the status of the overall business environment, and the status of potential economic recovery during the COVID-19 pandemic.
More specifically, the objectives of the survey could be outlined as follows:
o Industry expectations of profit, business expenditure, prices, employment, wages, and new investment opportunities, total output, export demand, domestic output demand & supply, etc.
o Business thoughts on incentive packages (adequate/inadequate; effectiveness; etc.) o Barriers to accessing the incentive packages o Views on the overall business environment (favourable/unfavourable), infrastructural
barriers, covid-19 related challenges, etc. o Perceptions on economic recovery.
Outline of the report
The rest of this report is organized as follows: Section II details the survey methodology, sampling framework, as well as indices methodologies. Section III elaborates on the basic characteristics of the surveyed firms. Section IV details the findings from the analysis of the present business status indices and business confidence indices along with the gaps between firms’ expectations and realities. In section V, this report presents an analysis of the enabling business environment indices and their components. In section VI, this study elaborates on

3
the results and analysis related to the stimulus packages, and existing business environment. Section VII analyzes the insights of economic recovery from the firm’s perspective. Section VIII applies a robust econometrics approach to explore the factors influencing PBSI (quarter) during this unprecedented time. Finally, section IX concludes with a set of policy recommendations.

4
Section-II: Methodology
SANEM, in collaboration with The Asian Foundation (TAF), initiated a Business Confidence Index (BCI) survey in 2020, on a quarterly basis. The first round of the survey was conducted in July 2020, with the findings published in a report in August 2020. The second round took place in October 2020, and its results were shared in November 2020. In January 2021, the third round of the survey was conducted, and its findings were disseminated in February 2021. The fourth round of the survey was conducted in April 2021, and this study is a comparative analysis of the four rounds. It is important to assess the expectations and reality in every quarter in a consistent way to allow for efficient assessment - therefore this study followed a similar methodology in line with the first, second and third round analyses.
Survey Methodology The study has been carried out, taking into account ‘primary data’ collected from private sector businesses in four rounds. This section details the survey methodology. Survey Coverage All four rounds of the BCI survey have covered firms from the Manufacturing and Services sectors. The firms are categorized into micro, small, medium, and large based on their sizes as defined in the National Industrial Policy 2016. The definition of the firm sizes differs for the manufacturing and the services sector (Table 1).
Table 1: Sector-wise firm size classification
Firm Size Manufacturing sector (Total Persons Engaged, TPE)
Services sector (Total Persons Engaged, TPE)
Micro Firms Less than 30 Less than 15 Small Firms Between 31 and 120 Between 16 and 50 Medium Firms Between 121 and 300 Between 51 and 120 Large Firms More than 300 More than 120
Source: National Industrial Policy, 2016
Survey technique and sampling framework All four rounds of the survey have been convened with the top managers of the firms over the phone. To construct panel data, the survey is conducted quarterly on the same sample during four rounds. Sampling framework The sample size of the first-round survey was specified to be 300 firms (150 manufacturing firms and 150 services sector firms) (Table 2). The study distributed around 50% of total firms surveyed into the services sector as the services sector contributes half of the country’s GDP.
Table 2: Sampling distribution of firms for the manufacturing and services firms
Quarter Manufacturing firms Services firms
Q1 153 150 Q2 252 250 Q3 252 250 Q4 253 250
Total 910 900
Source: Authors’ estimation based on SANEM BCI (quarterly) Survey, 2020-21
5
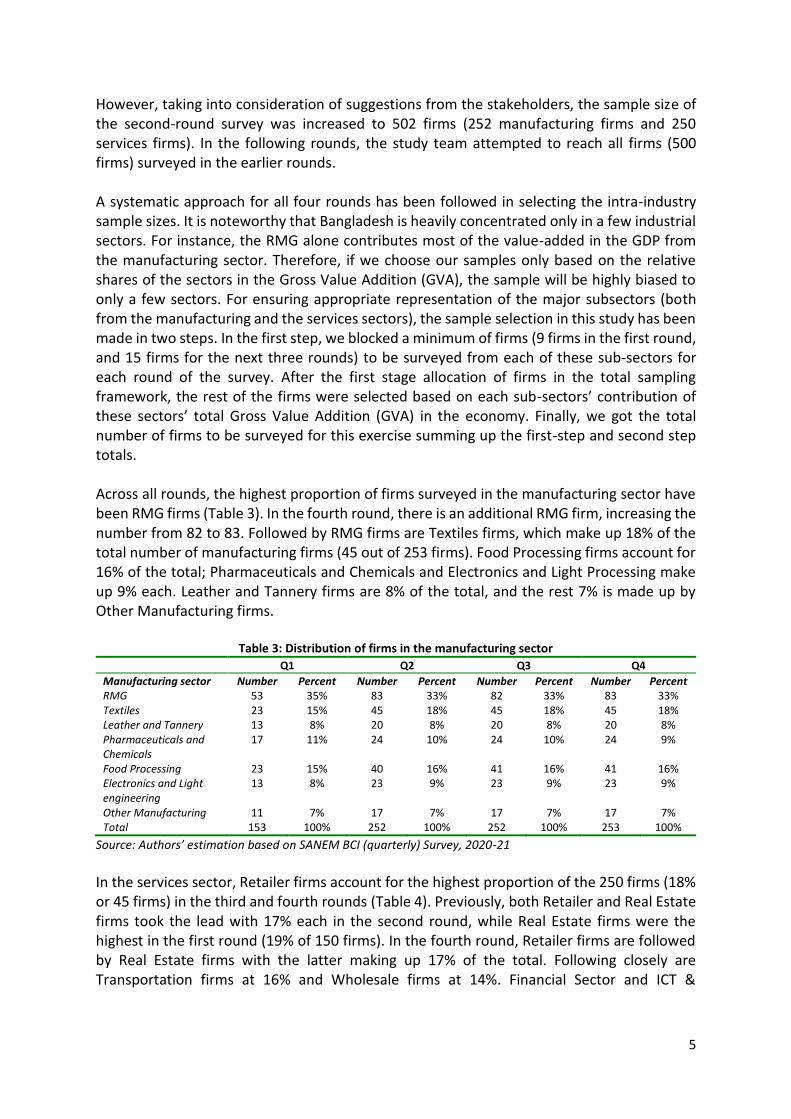
However, taking into consideration of suggestions from the stakeholders, the sample size of the second-round survey was increased to 502 firms (252 manufacturing firms and 250 services firms). In the following rounds, the study team attempted to reach all firms (500 firms) surveyed in the earlier rounds. A systematic approach for all four rounds has been followed in selecting the intra-industry sample sizes. It is noteworthy that Bangladesh is heavily concentrated only in a few industrial sectors. For instance, the RMG alone contributes most of the value-added in the GDP from the manufacturing sector. Therefore, if we choose our samples only based on the relative shares of the sectors in the Gross Value Addition (GVA), the sample will be highly biased to only a few sectors. For ensuring appropriate representation of the major subsectors (both from the manufacturing and the services sectors), the sample selection in this study has been made in two steps. In the first step, we blocked a minimum of firms (9 firms in the first round, and 15 firms for the next three rounds) to be surveyed from each of these sub-sectors for each round of the survey. After the first stage allocation of firms in the total sampling framework, the rest of the firms were selected based on each sub-sectors’ contribution of these sectors’ total Gross Value Addition (GVA) in the economy. Finally, we got the total number of firms to be surveyed for this exercise summing up the first-step and second step totals. Across all rounds, the highest proportion of firms surveyed in the manufacturing sector have been RMG firms (Table 3). In the fourth round, there is an additional RMG firm, increasing the number from 82 to 83. Followed by RMG firms are Textiles firms, which make up 18% of the total number of manufacturing firms (45 out of 253 firms). Food Processing firms account for 16% of the total; Pharmaceuticals and Chemicals and Electronics and Light Processing make up 9% each. Leather and Tannery firms are 8% of the total, and the rest 7% is made up by Other Manufacturing firms.
Table 3: Distribution of firms in the manufacturing sector Q1 Q2 Q3 Q4
Manufacturing sector Number Percent Number Percent Number Percent Number Percent RMG 53 35% 83 33% 82 33% 83 33% Textiles 23 15% 45 18% 45 18% 45 18% Leather and Tannery 13 8% 20 8% 20 8% 20 8% Pharmaceuticals and Chemicals
17 11% 24 10% 24 10% 24 9%
Food Processing 23 15% 40 16% 41 16% 41 16% Electronics and Light engineering
13 8% 23 9% 23 9% 23 9%
Other Manufacturing 11 7% 17 7% 17 7% 17 7% Total 153 100% 252 100% 252 100% 253 100%
Source: Authors’ estimation based on SANEM BCI (quarterly) Survey, 2020-21
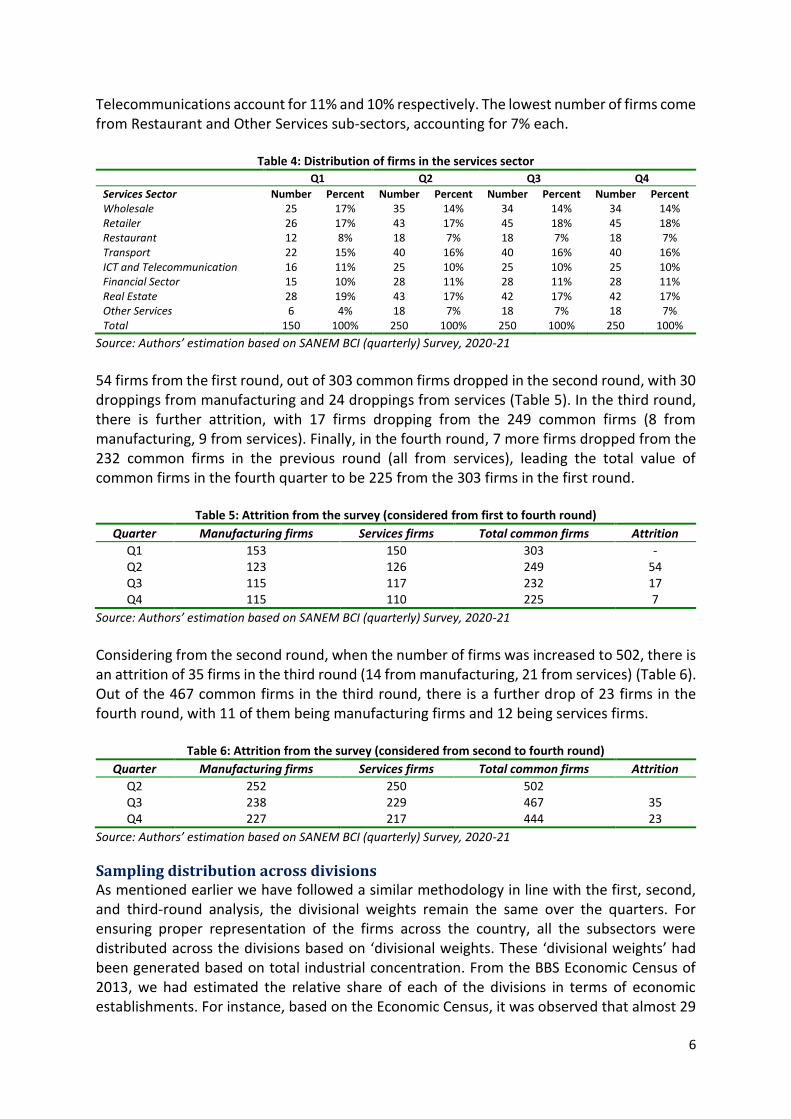
In the services sector, Retailer firms account for the highest proportion of the 250 firms (18% or 45 firms) in the third and fourth rounds (Table 4). Previously, both Retailer and Real Estate firms took the lead with 17% each in the second round, while Real Estate firms were the highest in the first round (19% of 150 firms). In the fourth round, Retailer firms are followed by Real Estate firms with the latter making up 17% of the total. Following closely are Transportation firms at 16% and Wholesale firms at 14%. Financial Sector and ICT &
6
Telecommunications account for 11% and 10% respectively. The lowest number of firms come from Restaurant and Other Services sub-sectors, accounting for 7% each.
Table 4: Distribution of firms in the services sector
Q1 Q2 Q3 Q4
Services Sector Number Percent Number Percent Number Percent Number Percent Wholesale 25 17% 35 14% 34 14% 34 14% Retailer 26 17% 43 17% 45 18% 45 18% Restaurant 12 8% 18 7% 18 7% 18 7% Transport 22 15% 40 16% 40 16% 40 16% ICT and Telecommunication 16 11% 25 10% 25 10% 25 10% Financial Sector 15 10% 28 11% 28 11% 28 11% Real Estate 28 19% 43 17% 42 17% 42 17% Other Services 6 4% 18 7% 18 7% 18 7% Total 150 100% 250 100% 250 100% 250 100%
Source: Authors’ estimation based on SANEM BCI (quarterly) Survey, 2020-21
54 firms from the first round, out of 303 common firms dropped in the second round, with 30 droppings from manufacturing and 24 droppings from services (Table 5). In the third round, there is further attrition, with 17 firms dropping from the 249 common firms (8 from manufacturing, 9 from services). Finally, in the fourth round, 7 more firms dropped from the 232 common firms in the previous round (all from services), leading the total value of common firms in the fourth quarter to be 225 from the 303 firms in the first round.
Table 5: Attrition from the survey (considered from first to fourth round)
Quarter Manufacturing firms Services firms Total common firms Attrition
Q1 153 150 303 - Q2 123 126 249 54 Q3 115 117 232 17 Q4 115 110 225 7
Source: Authors’ estimation based on SANEM BCI (quarterly) Survey, 2020-21
Considering from the second round, when the number of firms was increased to 502, there is an attrition of 35 firms in the third round (14 from manufacturing, 21 from services) (Table 6). Out of the 467 common firms in the third round, there is a further drop of 23 firms in the fourth round, with 11 of them being manufacturing firms and 12 being services firms.
Table 6: Attrition from the survey (considered from second to fourth round)
Quarter Manufacturing firms Services firms Total common firms Attrition
Q2 252 250 502
Q3 238 229 467 35 Q4 227 217 444 23
Source: Authors’ estimation based on SANEM BCI (quarterly) Survey, 2020-21
Sampling distribution across divisions As mentioned earlier we have followed a similar methodology in line with the first, second, and third-round analysis, the divisional weights remain the same over the quarters. For ensuring proper representation of the firms across the country, all the subsectors were distributed across the divisions based on ‘divisional weights. These ‘divisional weights’ had been generated based on total industrial concentration. From the BBS Economic Census of 2013, we had estimated the relative share of each of the divisions in terms of economic establishments. For instance, based on the Economic Census, it was observed that almost 29

7
per cent of the total economic establishments of Bangladesh were concentrated in Dhaka. This rate was 19 per cent for Chittagong, 12 per cent for Rajshahi, 11 per cent for Khulna, seven per cent for Mymensingh, and six per cent for Barisal and Sylhet respectively (Figure 1).
Figure 1: Distribution of economic establishment by Divisions (% of total)
Source: Authors’ calculation based on Economic Census 2013, BBS
We had consumed this divisional weight as the basis for our sampling distribution across divisions. It is noteworthy that not all the industries were available in all divisions. For instance, there were no Leather and Tannery firms in Barisal. In that case, we incorporated another firm (such as agro-processing, food processing, etc.) from other sub-categories to maintain a total divisional balance. The omitted subcategory was covered from the districts where it was more available. For instance, in this case, the tannery was most available in Dhaka. Hence, we incorporated it from Dhaka and provide one agro-processing firm to Barisal taking that from the Dhaka Division. Despite the practical problems faced during the survey, the actual sample for both rounds of the survey was kept quite close to the original sampling framework (Table 7).
Table 7: Distribution of firms by Divisions
Q1 Q2 Q3 Q4
Division Number Percent Number Percent Number Percent Number Percent Dhaka 101 33% 193 38% 197 39% 204 41% Chattogram 58 19% 86 17% 87 17% 82 16% Barishal 16 5% 30 6% 32 6% 33 7% Khulna 29 10% 39 8% 38 8% 39 8% Mymensingh 26 9% 39 8% 36 7% 35 7% Rajshahi 30 10% 48 10% 47 9% 45 9% Rangpur 25 8% 30 6% 28 6% 28 6% Sylhet 18 6% 37 7% 37 7% 37 7% Total 303 100% 502 100% 502 100% 503 100%
Source: Authors’ estimation based on SANEM BCI (quarterly) Survey, 2020-21
In the first round survey, the randomly drawn samples (300 firms) cover 22 districts of Bangladesh (Map 1). In this similar approach with a larger sample size (500 firms), the second-round survey covers 37 districts of Bangladesh (Map 2). The third and fourth rounds of the survey cover 36 districts of Bangladesh (Map 3 & Map 4).
Barisal, 6%Chittagong,
19%
Dhaka, 29%Mymensingh,
7%
Khulna, 11%
Rajshahi, 12%
Rangpur, 11%Sylhet, 6%

8
Map 1: Covered districts in the first round BCI survey
Map 2: Covered districts in the second round BCI survey
Map 3: Covered districts in the third round BCI survey
Map 4: Covered districts in the fourth round BCI survey
Source: Authors’ estimation based on SANEM BCI (quarterly) Survey, 2020-21
Selection of firms Each of the firms (new firms as well) from the respective divisions is chosen randomly. To do so, SANEM has incorporated the list of all firms from the respective business association’s websites (such as BGMEA, BKEMA, Bangladesh Textile Mills Association (BTMA), etc.). From the lists, we divided the firms across the divisions. Each of the firms was provided with a unique ID. Thereafter, based on those IDs, each of the firms from the respective divisions was selected randomly using a random number table.

9
Business Confidence Index (BCI) Methodology
Indicators for the assessment Business Confidence and Business status have been assessed based on six indicators. The indicators were selected so that they can reflect the economic condition and the business outlook of firms (Figure 2). The six broad indicators include: (i) profitability, (ii) investment, (iii) employment, (iv) wages, (v) business cost, and (vi) sales/exports.
Figure 2: Broad indicators for BCI/PBSI assessment
Source: Authors’ assessment on SANEM BCI (quarterly) Survey, 2020-21
Apart from the six indicators, the survey also covered several other important areas such as stimulus package, problems faced by the firms in acquiring stimulus package, current business challenges, and the overall business environment, etc. A questionnaire was developed to compute the attitudes and outlooks of business firms on these parameters (Annex 1). The questionnaire was developed in such a way so that it could be used for forecasting the next quarter's business confidence and commenting about the present quarter compared with the previous quarter of the same year as well as the corresponding quarter of the previous year. For instance, for each indicator, the respondents were asked three questions for the fourth round BCI survey:
(i) What was the condition of his business on the indicator ‘i’ in January-March 2021 compared to January-March 2020;
(ii) What was the condition of his business on the indicator ‘i’ in January-March 2021 compared to October-December 2020;
PBSI-----BCI
Profitability
Investment
Employment Wage
Business cost
Sales/Exports
10
(iii) And what is the expectation on the condition of his business on the indicator ‘i’ in April-June 2021 compared to January-March 2021
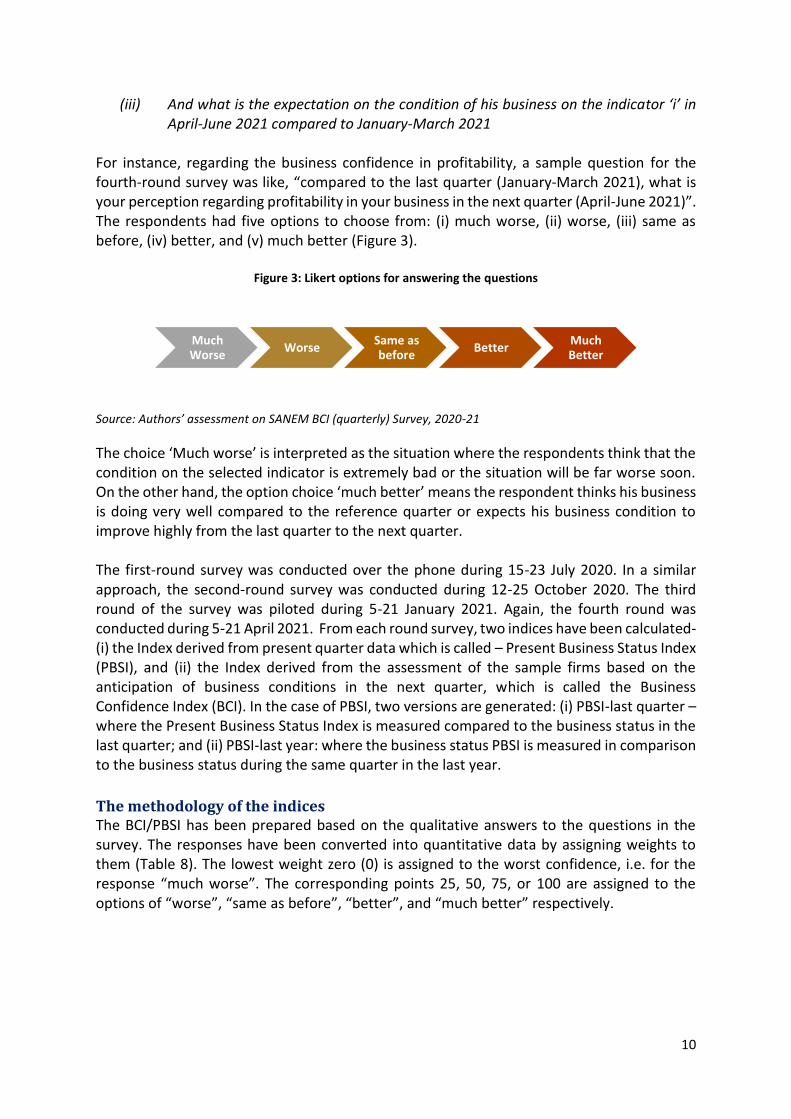
For instance, regarding the business confidence in profitability, a sample question for the fourth-round survey was like, “compared to the last quarter (January-March 2021), what is your perception regarding profitability in your business in the next quarter (April-June 2021)”. The respondents had five options to choose from: (i) much worse, (ii) worse, (iii) same as before, (iv) better, and (v) much better (Figure 3).
Figure 3: Likert options for answering the questions
Source: Authors’ assessment on SANEM BCI (quarterly) Survey, 2020-21
The choice ‘Much worse’ is interpreted as the situation where the respondents think that the condition on the selected indicator is extremely bad or the situation will be far worse soon. On the other hand, the option choice ‘much better’ means the respondent thinks his business is doing very well compared to the reference quarter or expects his business condition to improve highly from the last quarter to the next quarter.
The first-round survey was conducted over the phone during 15-23 July 2020. In a similar approach, the second-round survey was conducted during 12-25 October 2020. The third round of the survey was piloted during 5-21 January 2021. Again, the fourth round was conducted during 5-21 April 2021. From each round survey, two indices have been calculated- (i) the Index derived from present quarter data which is called – Present Business Status Index (PBSI), and (ii) the Index derived from the assessment of the sample firms based on the anticipation of business conditions in the next quarter, which is called the Business Confidence Index (BCI). In the case of PBSI, two versions are generated: (i) PBSI-last quarter – where the Present Business Status Index is measured compared to the business status in the last quarter; and (ii) PBSI-last year: where the business status PBSI is measured in comparison to the business status during the same quarter in the last year.
The methodology of the indices The BCI/PBSI has been prepared based on the qualitative answers to the questions in the survey. The responses have been converted into quantitative data by assigning weights to them (Table 8). The lowest weight zero (0) is assigned to the worst confidence, i.e. for the response “much worse”. The corresponding points 25, 50, 75, or 100 are assigned to the options of “worse”, “same as before”, “better”, and “much better” respectively.
Much Worse
WorseSame as before
BetterMuch Better

11
Table 8: Weights assigned to five Likert response options
Sl. Responses Weights
1 Much worse 0 2 Worse 25 3 Same as before 50 4 Better 75 5 Much better 100
Source: Authors’ assessment on SANEM BCI (quarterly) Survey, 2020-21
Steps to calculating the indices In the first step the scores for the sub-indicator k (such as profitability) for sub-sector j (such as RMG) is calculated as follows:
𝑠𝑗𝑘 =∑ 𝑥𝑖𝑛𝑖=1
𝑛
Here, j is the sub-sector (such as RMG under manufacturing), k is the sub-indicator (such as profitability) 𝑥𝑖 is the score of the firm in that indicator (such as the score of a firm in the RMG on profitability) and n is the total number of firms surveyed in that sector (RMG).
Based on these scores, the index (BCI or PBSI) for the subsector j (such as RMG) is calculated as follows:
𝐼𝑗 =
∑ 𝑠𝑗𝑘𝑚
𝑘=1
𝑚
Where, - 𝐼𝑗 is the index value of subsector j
- m is the number of sub-indicators (which is six in this case) Based on the scores, the weighted BCI/PBSI for each of the sub-indicators for the broad sectors (such as manufacturing/services) is calculated as follows:
𝐼𝐿𝑘 = ∑𝜔𝑗𝑠𝑗𝑘
𝑚
𝑘=1
Where, - 𝜔𝑗 is the weight of the j-th subsector (such as RMG) in the broad sector L
(manufacturing/services) Finally, we calculate the overall BCI/PBSI score for the manufacturing/service sector as following:
𝐼𝐿 =∑𝜔𝑗𝐼𝑗
𝑙
𝑗=1
Where, - 𝐼𝐿 is the BCI/ PBSI scores for the manufacturing or services sector.

12
Here, the score of sub-sector j on indicator k is the cumulative score on that indicator for all the firms divided by the number of firms surveyed in that indicator. Calculation of the combined BCI/PBSI scores: We calculate the combined BCI/PBSI for the sub-indicator k as follows:
𝐼𝑘 =∑∑𝜔𝑙𝜔𝑗𝑠𝑗𝑘
𝑚
𝑘=1
2
𝑙=1
Where, - 𝜔𝑙 is the weight of the broad sectors (manufacturing and services); l = 1 for
manufacturing, l=2 for services. Finally, we calculate the overall BCI/PBSI as following:
𝐼 =∑∑𝜔𝑙𝜔𝑗𝐼𝑗
𝑙
𝑗=1
2
𝑙=1
Enabling Business-Environment Index (EBI) Methodology One of the crucial factors in the earlier rounds of the survey was the cost of the business in all sectors. The increasing trend of the business cost was observed. The increase in business cost prompted the researchers to construct a third index called the Enabling Business-Environment Index (EBI). The index derived from the assessment of the sample firms on the overall business performance based on ten indicators.
Another important reason behind the construction of EBI was to understand the overall business performance of the firms and how much the overall business environment was favourable to them during this unprecedented time. However, this index will also help to have a better understanding of the business costs and the reasons behind the frequent increase of business costs over the quarters. To construct the index, the study has considered ten major components. The components are electricity (connection & quality), availability of skilled workers, transport quality, business or property registration, access to finance, overall tax system, government support for the industry, management of the COVID-19 crisis, trade logistics (port and customs) and corruption (Figure 4).

13
Figure 4: Components of Enabling Business Environment Index
Source: Authors’ assessment on SANEM BCI (quarterly) Survey, 2020-21
Construction of EBI To have an observation on the EBI, the respondents were asked: “On a weight of 0 to 100, at present, how much favourable are the following indicators for your overall business performance?” Here 0 represented an extremely unfavourable situation, whereas 100 represented an extremely favourable situation. The choice ‘extremely unfavourable’ is construed as the situation where the respondents consider that the condition on the selected indicator is extremely poor or the situation is worse. On the other hand, the option choice ‘extremely favourable’ indicates the respondents enjoyed all the components of ease of doing business in the present quarter and their businesses have performed better amid the pandemic. The option choice ‘indifferent’ indicates that the respondents have found no changes in the overall business environment in the present quarter compared to the past quarter (Figure 5).
Figure 5: Seven Likert response options
Source: Authors’ assessment on SANEM BCI (quarterly) Survey, 2020-21
The study then sorted these seven indicators into five broad categories: extremely unfavourable, unfavourable, neither unfavourable nor favourable, favourable, and extremely favourable. The responses have been converted into quantitative data by assigning weights to them (Table 9). The lowest weight zero (0) is assigned to the worst confidence, i.e. for the response “extremely unfavourable”. The corresponding points 25, 50, 75, or 100 are assigned
EBIElectricity (connectio
n & quality)
Availability of skilled workers
Transport quality
Business or property
registration
Access to finance
Overall tax system
Government support for the industry
Management of COVID-
19 crisis
Trade logistics (port &
customs)
Corruption
Extremely unfavourab
le
Moderately unfavourab
le
Slightly unfavourab
leIndifferent
Slightly favourable
Moderately favourable
Extremely favourable
14
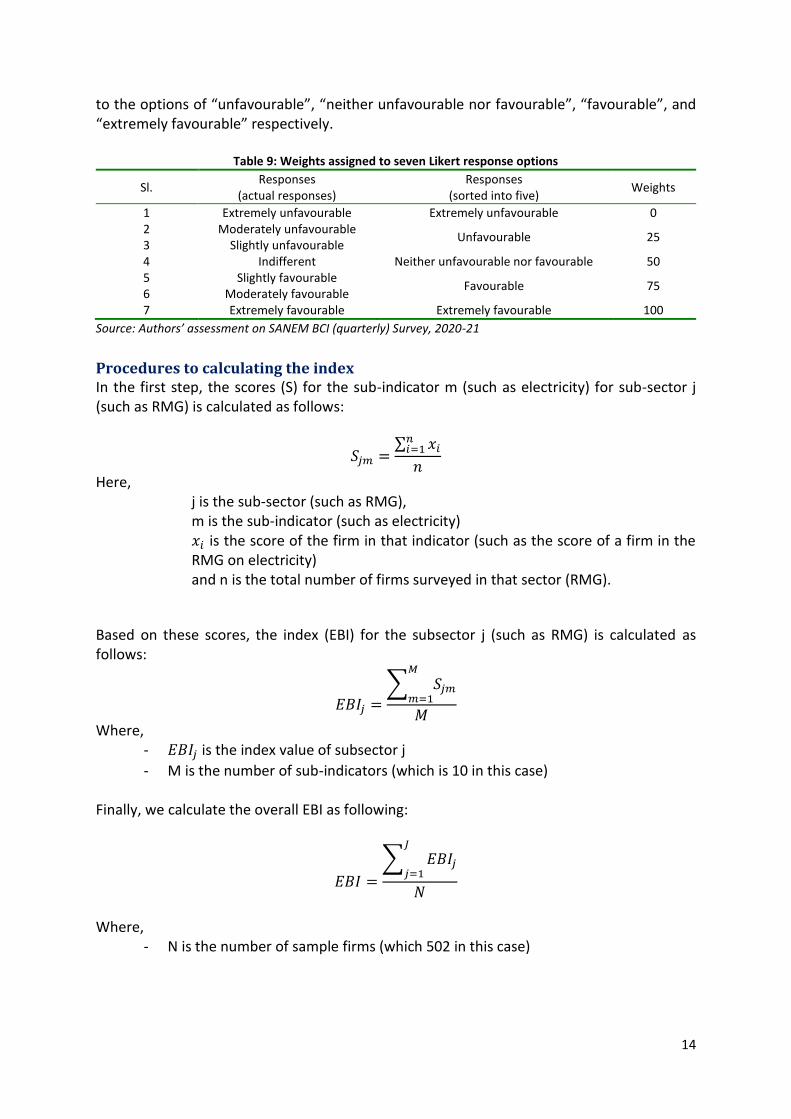
to the options of “unfavourable”, “neither unfavourable nor favourable”, “favourable”, and “extremely favourable” respectively.
Table 9: Weights assigned to seven Likert response options
Sl. Responses
(actual responses) Responses
(sorted into five) Weights
1 Extremely unfavourable Extremely unfavourable 0 2 Moderately unfavourable
Unfavourable 25 3 Slightly unfavourable 4 Indifferent Neither unfavourable nor favourable 50 5 Slightly favourable
Favourable 75 6 Moderately favourable 7 Extremely favourable Extremely favourable 100
Source: Authors’ assessment on SANEM BCI (quarterly) Survey, 2020-21
Procedures to calculating the index In the first step, the scores (S) for the sub-indicator m (such as electricity) for sub-sector j (such as RMG) is calculated as follows:
𝑆𝑗𝑚 =∑ 𝑥𝑖𝑛𝑖=1
𝑛
Here, j is the sub-sector (such as RMG), m is the sub-indicator (such as electricity) 𝑥𝑖 is the score of the firm in that indicator (such as the score of a firm in the RMG on electricity) and n is the total number of firms surveyed in that sector (RMG).
Based on these scores, the index (EBI) for the subsector j (such as RMG) is calculated as follows:
𝐸𝐵𝐼𝑗 =
∑ 𝑆𝑗𝑚𝑀
𝑚=1
𝑀
Where, - 𝐸𝐵𝐼𝑗 is the index value of subsector j
- M is the number of sub-indicators (which is 10 in this case) Finally, we calculate the overall EBI as following:
𝐸𝐵𝐼 =
∑ 𝐸𝐵𝐼𝑗𝐽
𝑗=1
𝑁
Where,
- N is the number of sample firms (which 502 in this case)

15
Reliability of the survey The Cronbach α coefficient is widely used in surveys where the questionnaire is designed on the Likert scale (Heo, Kim, & Faith, 2015; Bland & Altman, 1997). As all rounds of the survey were set based on a Likert questionnaire, it was very relevant to calculate the α coefficient for the survey. The α coefficient is therefore calculated using the following formula:
𝛼 =𝑁
𝑁 − 1(1 −
∑ 𝜎𝑖2𝑁
𝑖=1
𝜎𝑋2 )
Where, - α is the Cronbach coefficient, - N is the number of items (questions),
- 𝜎𝑖2 is the variance of items i,
- 𝜎𝑋2 is the variance of total scores (total scores are calculated by adding the score for
each of items i) Based on 18 questions of the Business Confidence Survey, the α coefficient for the first, second, third, and fourth rounds of the BCI survey are calculated as 0.81, 0.83, 0.88, and 0.88, respectively. The coefficient is used to measure the accuracy and reliability of the survey (Ercan, Yazici, Sigirli, Ediz, & Kan, 2007; Quansah, 2017; Becker, 2000; Kocak, Egrioglu, Yolcu, & Aladag, 2014). When the coefficient is between 0 to 0.40, 0.40 to 0.60, 0.60 to 0.80, and 0.80 to 1, the survey is considered as not reliable, less reliable, quite reliable, and highly reliable, respectively (OECD, 2005). According to this, all three rounds of the BCI survey are highly reliable.

16
Section III: Characteristics of the Surveyed Firms
This section details the basic characteristics of the surveyed firms. The main features of the surveyed firms include the location of firms, ownership type of firms, the female share of ownerships, firm’s year in operation, surveyed firm sizes, size of the workforce of the firms, the export status of the firms, and profile of the respondents. The analysis has been elaborated for the manufacturing and services firms as well.
Location of the surveyed firms Almost 78.9 per cent of the firms covered in this survey are located outside of the SEZ/EPZ or industrial areas/parks (Table 10). Around 19.7 per cent of the firms surveyed are from the industrial areas/industrial parks, while 1.4 per cent is from the Export Processing Zones or Special Economic Zones. In the case of 253 manufacturing firms, 34.8 per cent of them come from industrial parks or industrial areas, and 2.8 per cent comes from the EPZ or SEZ. In the case of the services sector, about 95.6 per cent comes from outside of EPZ/SEZ/industrial parks or industrial areas.
Table 10: Location of surveyed firms by sector
Location
Distribution of firms by Location (Number)
Distribution of firms by Location (% of total)
Manufacturing Services Total Manufacturing Services Total EPZ/SEZ 7 0 7 2.8% 0.0% 1.4% Industrial park/ Areas 88 11 99 34.8% 4.4% 19.7% Outside of EPZ/SEZ/Industrial parks
158 239 397 62.5% 95.6% 78.9%
Total 253 250 503 100.0% 100.0% 100.0%
Source: Authors’ estimation based on SANEM BCI (fourth round) Survey, 2020-21
Ownership types of the firms Most of the firms (98.0 per cent) in the survey are domestic private-ownership companies (Table 11). One per cent of firms in the survey are public-private joint ventures, while the remaining 1 per cent consists of domestic foreign joint ventures and foreign-owned firms. In the case of manufacturing firms, 98.8 per cent of them are domestic private-owned companies. In the case of service firms, 97.2 per cent of them are domestic private-owner companies.
Table 11: Ownership type of surveyed firms by sector
Ownership type
The ownership type of firms by industries (number)
The ownership type of firms by industries (% of total)
Manufacturing Services Total Manufacturing Services Total Domestic Private company 250 243 493 98.8% 97.2% 98.0% Public-private joint venture 2 3 5 0.8% 1.2% 1.0% Foreign ownership 1 2 3 0.4% 0.8% 0.6% Government ownership 0 2 2 0.0% 0.8% 0.4% Total 253 250 503 100.0% 100.0% 100.0%
Source: Authors’ estimation based on SANEM BCI (fourth round) Survey, 2020-21

17
In terms of gender composition amongst the owners, around 40.3 per cent of the manufacturing firms have partial female ownership (Table 12). Around 2 per cent of the manufacturing firms have full female ownership. The highest rates of female ownerships (partially or fully) are observed in the RMG (53 per cent), Textiles (48.9 per cent), Pharmaceuticals and Chemicals (45.8 per cent), and Food processing (43.9 per cent).
Table 12: Female ownership status in manufacturing firms (per cent)
Manufacturing sector
Female ownership of firms by sub-sector (number)
Female ownership of firms by sub-sector (per cent)
Fully owned by
female
No female
ownership
Partially owned by
female
Total
Fully owned by
female
No female
ownership
Partially owned
by female
Total
RMG (N=83) 3 39 41 83 3.6% 47.0% 49.4% 100.0% Textiles (N=45) 0 23 22 45 0.0% 51.1% 48.9% 100.0% Leather and Tannery (N=20)
1 13 6 20 5.0% 65.0% 30.0% 100.0%
Pharmaceuticals and Chemicals (N=24)
0 13 11 24 0.0% 54.2% 45.8% 100.0%
Food Processing (N=41)
1 23 17 41 2.4% 56.1% 41.5% 100.0%
Electronics & Light Engineering (N=23)
0 21 2 23 0.0% 91.3% 8.7% 100.0%
Other Manufacturing (N=17)
0 14 3 17 0.0% 82.4% 17.6% 100.0%
Total (N=253) 5 146 102 253 2.0% 57.7% 40.3% 100.0%
Source: Authors’ estimation based on SANEM BCI (fourth round) Survey, 2020-21
In the service sector, the partial female ownership rate is 25.6 per cent (Table 13) and the full ownership rate is 0.4%. In the case of the services sector firms, the highest rates of female ownerships are observed in Financial Sectors (75 per cent), Real Estate (38.1 per cent), Other services (33.3 per cent), Transport (22.5 per cent), and Restaurant (22.2 per cent).
Table 13: Female ownership status in services firms ( per cent)
Services Sector
Female ownership of firms by sub-sector (number)
Female ownership of firms by sub-sector (per cent)
Fully owned by
female
No female ownership
Partially owned by
female Total
Fully owned by
female
No female ownership
Partially owned
by female
Total
Wholesale (N=34)
0 33 1 34 0.0% 97.1% 2.9% 100.0%
Retailer (N=45) 1 40 4 45 2.2% 88.9% 8.9% 100.0% Restaurant (N=18)
0 14 4 18 0.0% 77.8% 22.2% 100.0%
Transport (N=40) 0 31 9 40 0.0% 77.5% 22.5% 100.0% ICT and Telecommunication (N=25)
0 22 3 25 0.0% 88.0% 12.0% 100.0%
Financial Sector (N=28)
0 7 21 28 0.0% 25.0% 75.0% 100.0%
Real Estate (N=42)
0 26 16 42 0.0% 61.9% 38.1% 100.0%
Other services (N=18)
0 12 6 18 0.0% 66.7% 33.3% 100.0%
Total(N=250) 1 185 64 250 0.4% 74.0% 25.6% 100.0%
Source: Authors’ estimation based on SANEM BCI (fourth round) Survey, 2020-21

18
Years in operation The average years of existence of the surveyed manufacturing firms are 20.31 years. In the case of the manufacturing sector, the mean years of existence are highest for Pharmaceuticals and Chemicals (28.25 years), followed by Leather and Tannery (23.90 years), Textiles (20.82 years), RMG (18.93 years), and Light Engineering (18.30 years). In the case of the services sector, the mean years of existence are 16.43 years where the Financial Sector (29.11 years), wholesales (15.41 years), and Retailers (15.40) have the highest mean years of existence.
Table 14: Years in operation for the firms
Sector Firms Mean Std. Dev.
Manufacturing
RMG (N=83) 18.93 10.22
Textiles (N=45) 20.82 13.29
Leather and Tannery (N=20) 23.90 17.17 Pharmaceuticals and Chemicals (N=24) 28.25 19.00
Food Processing (N=41) 19.68 11.77
Electronics and Light Engineering (N=23) 18.30 14.61
Other Manufacturing (N=17) 14.47 7.07
Total (N=253) 20.31 13.20
Service
Wholesale (N=34) 15.41 11.62
Retailer (N=45) 15.40 13.78
Restaurant (N=18) 12.50 10.51
Transport (N=40) 17.30 18.24
ICT and Telecommunication (N=25) 15.84 9.28
Financial Sector (N=28) 29.11 14.78 Real Estate (N=42) 12.86 6.89
Other services (N=18) 12.33 9.12
Total (N=250) 16.43 13.40
Source: Authors’ estimation based on SANEM BCI (fourth round) Survey, 2020-21
Surveyed firm sizes Out of the 503 surveyed firms, 61.23 per cent are micro and small, 9.94 per cent of the firms are medium, and 28.83 per cent firms are large (Figure 6).
Figure 6: Surveyed firm sizes
Source: Authors’ estimation based on SANEM BCI (fourth round) Survey, 2020-21
Micro and Small,61.23
Medium, 9.94
Large,28.83
Micro and Small (N=308) Medium (N=50) Large (N=145)

19
In the manufacturing sector, 41.1 per cent of the firms are micro and small, 14.2 per cent of the firms are medium, and 44.7 per cent of the firms are large (Table 15). Amongst the subsectors in the manufacturing industry, RMG’s 67.5 per cent of the firms are large whereas this is 55.6 per cent for Textiles, 50 per cent for the Pharmaceuticals and Chemicals industry, and 26.8 per cent for the Food Processing. Electronics & Light Engineering and Leather & Tannery sectors comprise mostly micro and small firms (78.3 per cent and 65 per cent, respectively).
Table 15: Surveyed firm sizes in the manufacturing sector
Firm
Number of firms surveyed (Number)
Firm distribution (% of total manufacturing sector firms)
Micro and Small
Medium Large Total Micro and
Small Medium Large Total
Ready Made Garments (RMG) 19 8 56 83 22.9% 9.6% 67.5% 100.0% Textiles 12 8 25 45 26.7% 17.8% 55.6% 100.0% Leather and Tannery 13 2 5 20 65.0% 10.0% 25.0% 100.0% Pharmaceuticals and Chemicals 7 5 12 24 29.2% 20.8% 50.0% 100.0% Food Processing 21 9 11 41 51.2% 22.0% 26.8% 100.0% Electronics and Light Engineering 18 3 2 23 78.3% 13.0% 8.7% 100.0% Other Manufacturing 14 1 2 17 82.4% 5.9% 11.8% 100.0% Total 104 36 113 253 41.1% 14.2% 44.7% 100.0%
Source: Authors’ estimation based on SANEM BCI (fourth round) Survey, 2020-21
In the case of the services sector, 81.6 per cent of the surveyed firms are micro and small, 5.6 per cent of the firms are medium, and 12.8 per cent of the firms are large (Table 16). Amongst the sub-sectors, the Financial sector, ICT and Telecommunications, and Restaurant sectors have a relatively large proportion of large firms (71.4 per cent, 16 per cent, and 11.1 per cent respectively). Retail, Wholesale, Other services, Transport, and ICT sectors comprise mostly micro and small firms (100 per cent, 100 per cent, 94.4 per cent, 85 per cent, and 84 per cent respectively).
Table 16: Surveyed firm sizes in the services sector
Firm
Number of firms surveyed (Number)
Firm distribution (% of total manufacturing sector firms)
Micro and Small Medium Large Total Micro and
Small Medium Large Total
Wholesale 34 0 0 34 100.0% 0.0% 0.0% 100.0% Retailer 45 0 0 45 100.0% 0.0% 0.0% 100.0% Restaurant 14 2 2 18 77.8% 11.1% 11.1% 100.0% Transport 34 3 3 40 85.0% 7.5% 7.5% 100.0% ICT and Telecommunication 21 0 4 25 84.0% 0.0% 16.0% 100.0% Financial Sector 6 2 20 28 21.4% 7.1% 71.4% 100.0% Real Estate 33 6 3 42 78.6% 14.3% 7.1% 100.0% Other services 17 1 0 18 94.4% 5.6% 0.0% 100.0% Total 204 14 32 250 81.6% 5.6% 12.8% 100.0%
Source: Authors’ estimation based on SANEM BCI (fourth round) Survey, 2020-21

20
Size of the workforce of the surveyed firms In the manufacturing sector, the average workforce size of the surveyed firms was 874 (Table 17). Amongst the subsectors in the manufacturing sector, RMG (1508), Textiles (862), and Pharmaceuticals & Chemicals (724) have the largest workforce size. In the services sector, the average workforce size is 187. Among the other sub-sectors of the service sector, the financial sector (1403) has the largest workforce size on average.
Table 17: Average permanent employment of the firms Sector Firm Mean Std. Dev.
Manufacturing
RMG (N=83) 1508 2551
Textiles (N=45) 862 1268
Leather and Tannery (N=20) 341 545 Pharmaceuticals and Chemicals (N=24) 724 846
Food Processing (N=41) 312 547
Electronics and Light Engineering (N=23) 396 1198
Other Manufacturing (N=17) 652 2414
Total (N=252) 874 1806
Services
Wholesale (N=34) 8 10
Retailer (N=45) 7 10
Restaurant (N=18) 48 71
Transport (N=40) 71 233
ICT and Telecommunication (N=25) 39 65 Financial Sector (N=28) 1403 2556
Real Estate (N=42) 50 84
Other services (N=18) 10 15
Total (N=250) 187 952
Source: Authors’ estimation based on SANEM BCI (quarterly) Survey, 2020-21
In the case of the manufacturing sector, around 54 per cent of total workers are female (Table 18). The highest rates of female employment are observed in RMG (67 per cent), Leather and Tannery (51 per cent), Textiles (46 per cent) and Food processing (44 per cent) subsectors.
Table 18: Employment status by gender in the manufacturing firms
Firm
Employment status by gender (number, mean)
Employment status by gender (% of total)
Male Female Total Male Female Total RMG (N=83) 505 1003 1508 33% 67% 100% Textiles (N=45) 462 399 862 54% 46% 100% Leather and Tannery (N=20) 168 174 341 49% 51% 100% Pharmaceuticals and Chemicals (N=24)
596 128 724 82% 18% 100%
Food Processing (N=41) 175 137 312 56% 44% 100% Electronics and Light Engineering (N=23)
292 104 396 74% 26% 100%
Other Manufacturing (N=17) 499 153 652 77% 23% 100% Total (N=252) 406 468 874 46% 54% 100%
Source: Authors’ estimation based on SANEM BCI (fourth round) Survey, 2020-21
The workforce in the services sector is mostly male-dominated. Around 67 per cent of total employment in the services sector is male (Table 19). Amongst the sub-sectors, the share of female workers in the total employment is higher for the Financial sector (37 per cent), Retailer (14 per cent), and ICT & Telecommunication (11 per cent).

21
Table 19: Employment status by gender in the services firms
Firm
Employment status by gender (number, mean)
Employment status by gender (% of total)
Male Female Total Male Female Total Wholesale (N=34) 7 0 8 95% 5% 100% Retailer (N=45) 6 1 7 86% 14% 100% Restaurant (N=18) 43 4 48 91% 9% 100% Transport (N=40) 65 6 71 91% 9% 100% ICT (N=25) 34 4 39 89% 11% 100% Financial Sector (N=28) 883 520 1403 63% 37% 100% Real Estate (N=42) 44 6 50 89% 11% 100% Other services (N=18) 9 1 10 93% 7% 100% Total (N=250) 126 61 187 67% 33% 100%
Source: Authors’ estimation based on SANEM BCI (fourth round) Survey, 2020-21
Export status of the surveyed firms Amongst the total surveyed firms, 38.4 per cent are export-oriented (partially or fully) (Figure 7). A quarter of the total surveyed firms are fully exported oriented (100 per cent of the sales come from exports). Out of the 193 export-oriented firms, 167 of them from the manufacturing sector, whereas in the service sector, the number of firms is 26.
Figure 7: Share of exports in total sales (%)
Source: Authors’ estimation based on SANEM BCI (fourth round) Survey, 2020-21
Amongst the surveyed manufacturing firms, 66 per cent of them have some shares of exports in total sales (Table 20). Almost all the firms (88.0 per cent) in the RMG sector have export shares in total sales, whereas, in the case of the textiles sector, 80 per cent of the firms are export-oriented. In the leather and tannery sector, 80 per cent of the surveyed firms are export-oriented. In the case of pharmaceuticals and chemicals, around 37.5 per cent of the firms are export-oriented, whereas, in the case of food processing, 78 per cent of the firms are exporters. The least share of exporters is observed for the light engineering sector (only 4.3 per cent of the firms are exporters).
0% 50%< 51-90% 90%>

22
Table 20: Export status of firms in the manufacturing sectors
Manufacturing sector
Export status by firms (number)
Export status by firms (per cent)
Non-exporter Exporter Total Non-exporter Exporter Total RMG 10 73 83 12.0% 88.0% 100.0% Textiles 9 36 45 20.0% 80.0% 100.0% Leather and Tannery 4 16 20 20.0% 80.0% 100.0% Pharmaceuticals and Chemicals 15 9 24 62.5% 37.5% 100.0% Food Processing 9 32 41 22.0% 78.0% 100.0% Electronics and Light engineering 22 1 23 95.7% 4.3% 100.0% Other Manufacturing 17 0 17 100.0% 0.0% 100.0% Total 86 167 253 34.0% 66.0% 100.0%
Source: Authors’ estimation based on SANEM BCI (fourth round) Survey, 2020-21
Only 10.4 per cent of the surveyed services sector firms are exporters (Table 21). Amongst the subsectors, Transport (37.5 per cent) and Financial Sector (17.9 per cent) have some export shares in their total sales. In the case of other sub-sectors such as Retailer, Restaurant, and Real estate firms are found no export shares in total sales (0 per cent, 0 per cent, and 0 per cent respectively).
Table 21: Export status of firms in the services sector
Services Sector
Export status by firms (number)
Export status by firms (per cent)
Non-exporter Exporter Total Non-exporter Exporter Total Wholesale 30 4 34 88.2% 11.8% 100.0% Retailer 45 0 45 100.0% 0.0% 100.0% Restaurant 18 0 18 100.0% 0.0% 100.0% Transport 25 15 40 62.5% 37.5% 100.0% ICT and Telecommunication 24 1 25 96.0% 4.0% 100.0% Financial Sector 23 5 28 82.1% 17.9% 100.0% Real Estate 42 0 42 100.0% 0.0% 100.0% Other Services 17 1 18 94.4% 5.6% 100.0% Total 224 26 250 89.6% 10.4% 100.0%
Source: Authors’ estimation based on SANEM BCI (fourth round) Survey, 2020-21
Profile of the respondents The survey team tried to engage with the relevant top executives of the firms. Among the respondents, only two per cent were females. On average, the respondents from the manufacturing sector had an experience of 13.5 years (Table 22). In the case of the services sector, the mean years of experience of the top executives were 10.7 years.
Table 22: Years of experiences of the respondents Sector Firm Mean Std. Dev.
Manufacturing
RMG (N=83) 13.2 8.1 Textiles (N=45) 14.0 9.0
Leather and Tannery (N=20) 14.3 9.3
Pharmaceuticals and Chemicals (N=24) 14.9 6.8
Food Processing (N=41) 14.6 10.1
Electronics and Light Engineering (N=23) 11.0 8.4
Other Manufacturing (N=17) 11.3 7.6 Total (N=252) 13.5 8.6
Services Wholesale (N=34) 10.2 7.9
Retailer (N=45) 10.4 7.6

23
Sector Firm Mean Std. Dev.
Restaurant (N=18) 7.4 6.6 Transport (N=40) 10.7 7.8
ICT and Telecommunication (N=25) 14.4 9.6
Financial Sector (N=28) 13.7 10.4
Real Estate (N=42) 9.7 7.1
Other services (N=18) 8.8 6.0 Total (N=250) 10.7 8.1
Source: Authors’ estimation based on SANEM BCI (fourth round) Survey, 2020-21

24
Section-IV: Business Status and Confidence
As discussed in the introduction, monitoring the business status and confidence of the private sector is essential during the time of the pandemic in order to adjust or introduce policies that are relevant and that will boost the economy towards recovery by supporting the private sector. In order to do this, this study, from the results of the survey, presents two indices - Present Business Status Index (PBSI) and Business Confidence Index (BCI).
Following the methodology described, based on the survey data, this study constructs BCI and PBSI indices for each round of the survey. The calculated index value ranges from 0 to 100. The closer the score towards 100, the better the business confidence or the present business status in the country and vice versa (Figure 8). An index value of 50 would indicate ‘no change’ in the business confidence compared to the reference period. A score higher than 50 would indicate some improvement in business confidence, while a score of less than 50 would indicate an erosion of confidence.
Figure 8: Interpretation of BCI/PBSI indices
Source: Authors’ assessment based on SANEM BCI (quarterly) Survey, 2020-21
Present Business Status Index (PBSI) over last year This study constructs two sets of Present Business Status Index (PBSI) for each round of BCI survey. For the first round of the BCI survey, the PBSIs were PBSI in April-June 2020 compared to the previous quarter (January to March 2020) and PBSI in April to June 2020 compared to last year (April-June 2019). Again, for the second round of the survey, the PBSIs were PBSI in July to September 2020 compared to the previous quarter (April to June 2020), and PBSI in July to September 2020 compared to the previous year (July to September 2019). In the third round of the survey, the PBSIs were PBSI in October-December 2020 compared to the previous quarter (July to September 2020), and PBSI in October-December 2020 compared to the previous year (October to December 2019). Similarly, for the fourth round of the survey, the study has constructed two sets of PBSI: (i) PBSI in January to March 2021 compared to the previous quarter (October to December 2020), and (ii) PBSI in January to March 2021 compared to the previous year (January to March 2020). The overall PBSI in April-June 2020, July-September 2020, October-December 2020 and January-March 2021 compared to the corresponding quarters of the previous years (2019 and 2020) stands at 26.44, 34.23, 36.50 and 40.55 respectively (Figure 9). There was a significant improvement of PBSI scores in July-September 2020 compared to April-June 2020, followed by a much smaller improvement between July-September 2020 and October-December 2020. However, the improvement between the last quarter of 2020 and the first

25
quarter of 2021 is a positive sign, as there has been a higher jump compared to the third round.
Figure 9: Present Business Status Index (PBSI) over the past year
Source: Authors’ estimation based on SANEM BCI (quarterly) Survey, 2020-21
Like the previous rounds of the survey, wages is also the indicator with the highest PBSI in the fourth round (Figure 10) - although there has been a small decrease from 52.19 to 50.05 between October-December 2020 and January-March 2021 compared to the corresponding quarters in the previous years. While employment was the second leading indicator in the first three rounds, we observe a shift in trends in this round. The PBSI for employment has decreased slightly from 46.12 to 45.38. Investment, on the other hand, has shown commendable improvement - it has risen to 46.67 January-March 2021 from 37.45 in October-December 2020. It is still below 50, however, which means that the business status on the indicator is worse than it was during the same period in 2019. The economic recovery from the lifting of lockdown restrictions, the prompt government response in channelling funds for wages of the workers, returning cancelled purchase orders from our export destinations, and the positive outlook due to the invention and distribution of the COVID-19 vaccine could be justification for the higher PBSIs of wages and investment. However, it should be noted that firms are usually less willing to share information on employment and wage reductions when analysing these indicators. Amongst others, the PBSI on profitability and sales/export, while lower than the other indicators discussed, have shown great improvement in all four rounds of the survey. The PBSI of profitability has had a more significant increase in the fourth round, leading it to be greater than that of sales/export (38.27 in comparison to 36.93) - we had seen the opposite in the third round. While in the previous quarters the PBSI of business cost had decreased quite significantly, it has increased to 25.99 in January-March 2021. This is a positive sign, which might again be due to the COVID-19 vaccine and fewer shipment restrictions as cases have gone down, reducing raw material costs. However, it has yet to reach the same level of the first round (32.51) and a score of a little over half of 50 implies that firms are still worse off than they were in 2020.
26.44
34.23 36.5040.55
0.00
25.00
50.00
75.00
100.00
Apr-Jun 2020 Jul-Sep 2020 Oct-Dec 2020 Jan-Mar 2021
PB
SI (
Ye
ar)
Sco
res

26
Figure 10: Indicator-wise PBSI over last year
Source: Authors’ estimation based on SANEM BCI (quarterly) Survey, 2020-21
Sectoral Present Business Status Index (PBSI) over last year There have been marginal improvement in the PBSI (year) scores in January-March 2021 compared to October-December 2020 (Figure 11). The Other Manufacturing, Restaurant, Financial and Other Services sub-sectors have seen small decreases in their PBSI scores. The increase in the Pharma sector is quite promising, rising from 40.63 in October-December 2020 to 49.48 in January-March 2021 (Figure 11.d) - becoming the second-highest PBSI score in this round. This could be due to the rollout of the COVID-19 vaccine in Bangladesh in 2021. The Financial sub-sector, although facing a slight decrease, still remains the one with the highest PBSI across all four rounds, with a score of 49.70 in January-March 2021 (Figure 11.d). However, as all the sectoral PBSI scores are lower than 50, the overall business situation in January-March 2021 compared to the previous year has deteriorated amid the pandemic.
0.00
25.00
50.00
75.00OVERALL
Profitability
Investment
EmploymentWage
Business Cost
Sales/Export
Apr-Jun'20 Jul-Sep'20 Oct-Dec'20 Jan-Mar'21
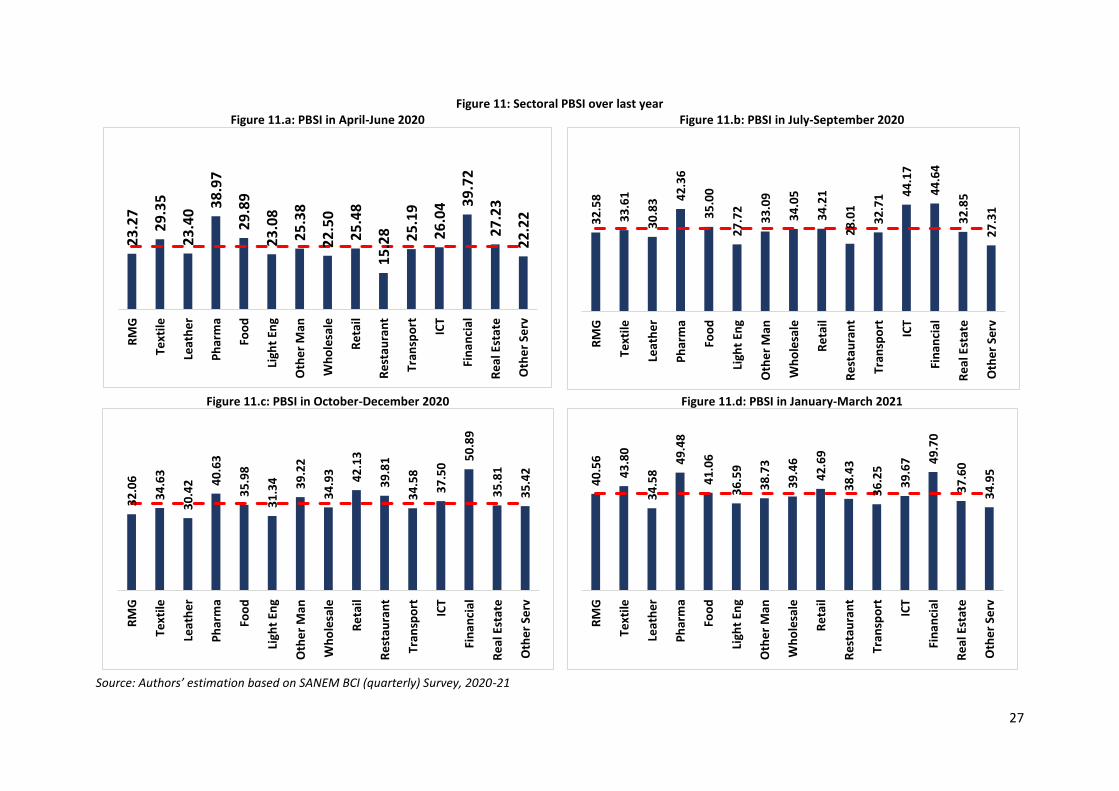
27
Figure 11: Sectoral PBSI over last year Figure 11.a: PBSI in April-June 2020
Figure 11.b: PBSI in July-September 2020
Figure 11.c: PBSI in October-December 2020
Figure 11.d: PBSI in January-March 2021
Source: Authors’ estimation based on SANEM BCI (quarterly) Survey, 2020-21
23
.27
29
.35
23
.40
38
.97
29
.89
23
.08
25
.38
22
.50
25
.48
15
.28 25
.19
26
.04 3
9.7
2
27
.23
22
.22
RM
G
Text
ile
Leat
he
r
Ph
arm
a
Foo
d
Ligh
t En
g
Oth
er
Man
Wh
ole
sale
Re
tail
Re
stau
ran
t
Tran
spo
rt
ICT
Fin
an
cial
Re
al E
stat
e
Oth
er
Serv
32
.58
33
.61
30
.83 4
2.3
6
35
.00
27
.72
33
.09
34
.05
34
.21
28
.01
32
.71 4
4.1
7
44
.64
32
.85
27
.31
RM
G
Text
ile
Leat
he
r
Ph
arm
a
Foo
d
Ligh
t En
g
Oth
er
Man
Wh
ole
sale
Re
tail
Re
stau
ran
t
Tran
spo
rt
ICT
Fin
anci
al
Re
al E
stat
e
Oth
er
Serv
32
.06
34
.63
30
.42 4
0.6
3
35
.98
31
.34 39
.22
34
.93 42
.13
39
.81
34
.58
37
.50
50
.89
35
.81
35
.42
RM
G
Text
ile
Leat
he
r
Ph
arm
a
Foo
d
Ligh
t En
g
Oth
er
Man
Wh
ole
sale
Re
tail
Re
stau
ran
t
Tran
spo
rt
ICT
Fin
an
cial
Re
al E
stat
e
Oth
er
Serv
40
.56
43
.80
34
.58
49
.48
41
.06
36
.59
38
.73
39
.46
42
.69
38
.43
36
.25
39
.67 4
9.7
0
37
.60
34
.95
RM
G
Text
ile
Leat
he
r
Ph
arm
a
Foo
d
Ligh
t En
g
Oth
er
Man
Wh
ole
sale
Re
tail
Re
stau
ran
t
Tran
spo
rt
ICT
Fin
an
cial
Re
al E
stat
e
Oth
er
Serv

28
Present Business Status Index (PBSI) over last quarter When compared to the last quarter (April-June 2020), the overall Present Business Status Index (PBSI) for July-September 2020 is found to be 47.96 (Figure 12), the PBSI for October-December 2020 over July-September 2020 is found to be 48.83 and the overall PBSI for January-March 2021 over October-December 2020 is found to be 51.38. The overall PBSI score in July-September 2020 increased significantly compared to the April-June 2020 quarter. Compared to the July-September 2020 quarter, the overall score of PBSI in the October-December 2020 quarter has also increased but very marginally. We observe a greater increase in the January-March 2021 quarter, with the PBSI now being above 100, implying that businesses are better off in this quarter compared to the previous one.
Figure 12: Present Business Status Index (PBSI) over last quarter
Source: Authors’ estimation based on SANEM BCI (quarterly) Survey, 2020-21
Amongst the sub-indicators, there is improvement in all indicators, besides employment which has seen a small decrease (Figure 13). Most notably, while the PBSI of the business cost was seeing decreases in all the quarters observed in 2020, it has had a significant increase in January-March 2021, rising to 35.79 from 31.72 in the previous quarter. This is a positive sign and implies that business costs are adjusting due to fewer pandemic-related restrictions.
29.48
47.96 48.83 51.38
0.00
25.00
50.00
75.00
100.00
Apr-Jun 2020 Jul-Sep 2020 Oct-Dec 2020 Jan-Mar 2021
PB
SI (
Qu
arte
r) S
core
s
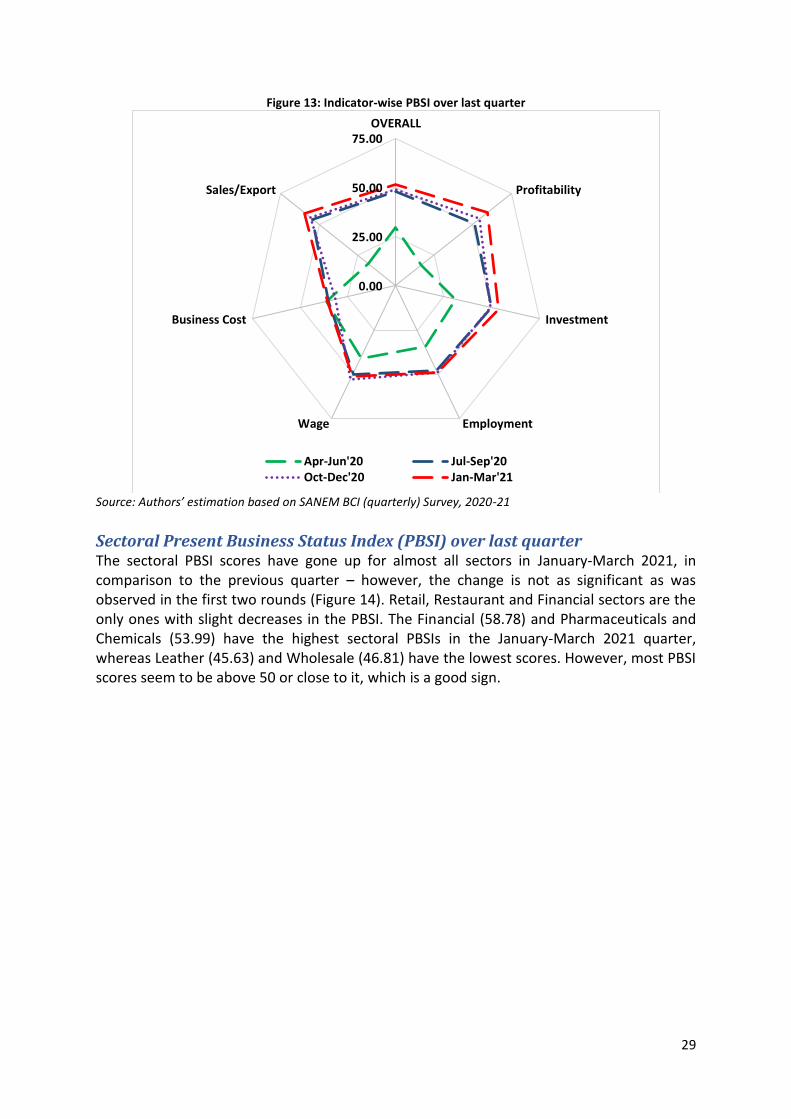
29
Figure 13: Indicator-wise PBSI over last quarter
Source: Authors’ estimation based on SANEM BCI (quarterly) Survey, 2020-21
Sectoral Present Business Status Index (PBSI) over last quarter The sectoral PBSI scores have gone up for almost all sectors in January-March 2021, in comparison to the previous quarter – however, the change is not as significant as was observed in the first two rounds (Figure 14). Retail, Restaurant and Financial sectors are the only ones with slight decreases in the PBSI. The Financial (58.78) and Pharmaceuticals and Chemicals (53.99) have the highest sectoral PBSIs in the January-March 2021 quarter, whereas Leather (45.63) and Wholesale (46.81) have the lowest scores. However, most PBSI scores seem to be above 50 or close to it, which is a good sign.
0.00
25.00
50.00
75.00OVERALL
Profitability
Investment
EmploymentWage
Business Cost
Sales/Export
Apr-Jun'20 Jul-Sep'20Oct-Dec'20 Jan-Mar'21

30
Figure 14: Sectoral PBSI over last quarter Figure 14.a: PBSI in April-June 2020
Figure 14.b: PBSI in July-September 2020
Figure 14.c: PBSI in October-December 2020
Figure 14.d: PBSI in January-March 2021
Source: Authors’ estimation based on SANEM BCI (quarterly) Survey, 2020-21
25
.63
31
.16
25
.64
40
.69
32
.25
27
.56
25
.76
26
.83
30
.13
20
.83 30
.11
30
.99 4
2.5
0
29
.02
22
.92
RM
G
Text
ile
Leat
he
r
Ph
arm
a
Foo
d
Ligh
t En
g
Oth
er
Man
Wh
ole
sale
Re
tail
Re
stau
ran
t
Tran
spo
rt
ICT
Fin
anci
al
Re
al E
stat
e
Oth
er
Serv
46
.89
49
.07
43
.33
50
.69
49
.38
42
.93
50
.00
42
.98
48
.64
46
.76
46
.04 55
.00
54
.61
48
.74
44
.44
RM
G
Text
ile
Leat
he
r
Ph
arm
a
Foo
d
Ligh
t En
g
Oth
er
Man
Wh
ole
sale
Re
tail
Re
stau
ran
t
Tran
spo
rt
ICT
Fin
anci
al
Re
al E
stat
e
Oth
er
Serv
47
.05
49
.07
43
.13 51
.22
47
.76
44
.75
51
.72
45
.96
51
.11
51
.85
46
.35
48
.67 60
.27
48
.21
50
.46
RM
G
Text
ile
Leat
he
r
Ph
arm
a
Foo
d
Ligh
t En
g
Oth
er
Man
Wh
ole
sale
Re
tail
Re
stau
ran
t
Tran
spo
rt
ICT
Fin
anci
al
Re
al E
stat
e
Oth
er
Serv
51
.81
53
.43
45
.63 53
.99
53
.15
48
.73
52
.45
46
.81
51
.02
51
.16
48
.65
49
.17 58
.78
51
.19
53
.24
RM
G
Text
ile
Leat
he
r
Ph
arm
a
Foo
d
Ligh
t En
g
Oth
er
Man
Wh
ole
sale
Re
tail
Re
stau
ran
t
Tran
spo
rt
ICT
Fin
anci
al
Re
al E
stat
e
Oth
er
Serv
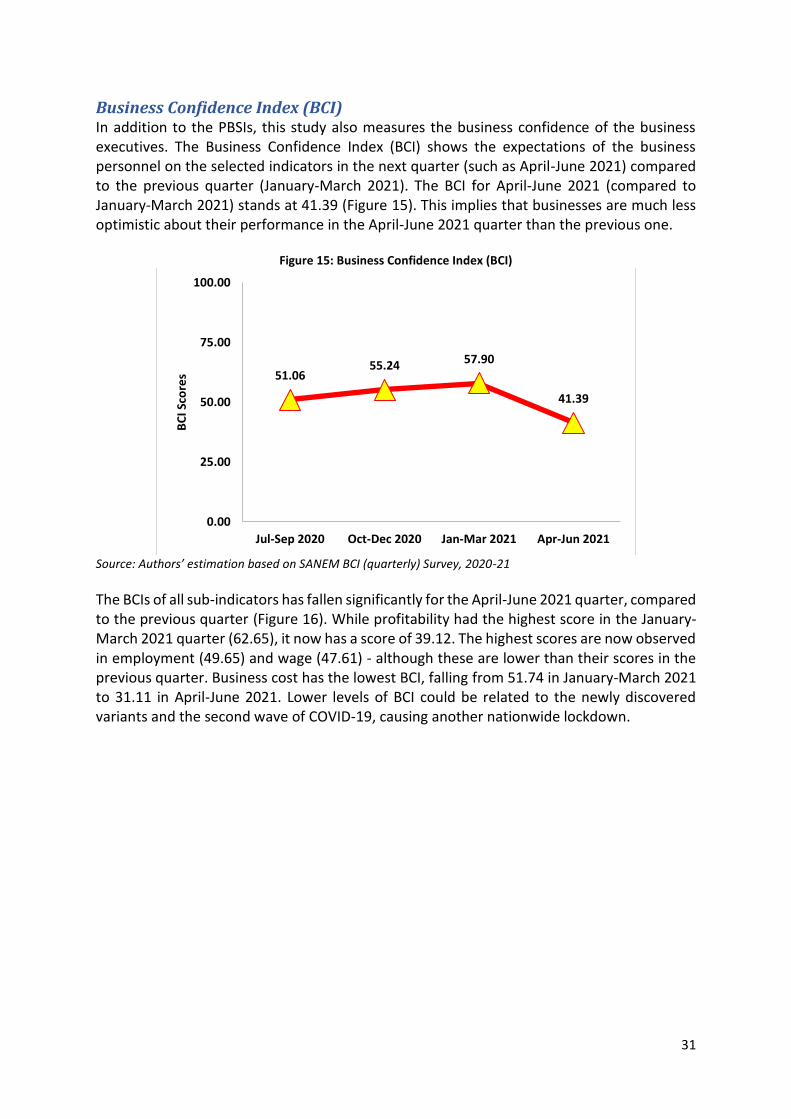
31
Business Confidence Index (BCI) In addition to the PBSIs, this study also measures the business confidence of the business executives. The Business Confidence Index (BCI) shows the expectations of the business personnel on the selected indicators in the next quarter (such as April-June 2021) compared to the previous quarter (January-March 2021). The BCI for April-June 2021 (compared to January-March 2021) stands at 41.39 (Figure 15). This implies that businesses are much less optimistic about their performance in the April-June 2021 quarter than the previous one.
Figure 15: Business Confidence Index (BCI)
Source: Authors’ estimation based on SANEM BCI (quarterly) Survey, 2020-21
The BCIs of all sub-indicators has fallen significantly for the April-June 2021 quarter, compared to the previous quarter (Figure 16). While profitability had the highest score in the January-March 2021 quarter (62.65), it now has a score of 39.12. The highest scores are now observed in employment (49.65) and wage (47.61) - although these are lower than their scores in the previous quarter. Business cost has the lowest BCI, falling from 51.74 in January-March 2021 to 31.11 in April-June 2021. Lower levels of BCI could be related to the newly discovered variants and the second wave of COVID-19, causing another nationwide lockdown.
51.0655.24 57.90
41.39
0.00
25.00
50.00
75.00
100.00
Jul-Sep 2020 Oct-Dec 2020 Jan-Mar 2021 Apr-Jun 2021
BC
I Sco
res
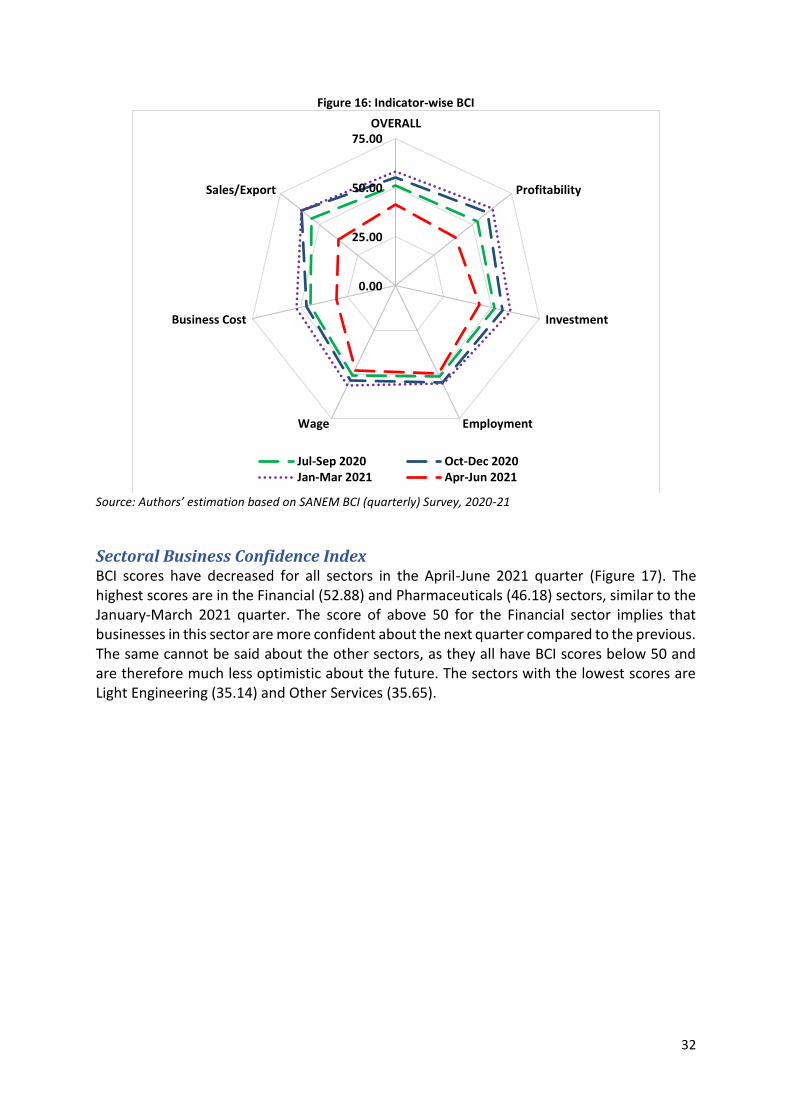
32
Figure 16: Indicator-wise BCI
Source: Authors’ estimation based on SANEM BCI (quarterly) Survey, 2020-21
Sectoral Business Confidence Index BCI scores have decreased for all sectors in the April-June 2021 quarter (Figure 17). The highest scores are in the Financial (52.88) and Pharmaceuticals (46.18) sectors, similar to the January-March 2021 quarter. The score of above 50 for the Financial sector implies that businesses in this sector are more confident about the next quarter compared to the previous. The same cannot be said about the other sectors, as they all have BCI scores below 50 and are therefore much less optimistic about the future. The sectors with the lowest scores are Light Engineering (35.14) and Other Services (35.65).
0.00
25.00
50.00
75.00OVERALL
Profitability
Investment
EmploymentWage
Business Cost
Sales/Export
Jul-Sep 2020 Oct-Dec 2020Jan-Mar 2021 Apr-Jun 2021

33
Figure 17: Sectoral BCI Figure 17.a: BCI in July-September 2020
Figure 17.b: BCI in October-December 2020
Figure 17.c: BCI in January-March 2021
Figure 17.d: April-June 2021
Source: Authors’ estimation based on SANEM BCI (quarterly) Survey, 2020-21
48
.58
55
.07
45
.19
58
.58
50
.18
43
.59
45
.83
52
.00
50
.96
52
.43
50
.38
54
.17
57
.50
51
.04
50
.00
RM
G
Text
ile
Leat
he
r
Ph
arm
a
Foo
d
Ligh
t En
g
Oth
er
Man
Wh
ole
sale
Re
tail
Re
stau
ran
t
Tran
spo
rt
ICT
Fin
anci
al
Re
al E
stat
e
Oth
er
Serv
53
.41
56
.48
48
.96
55
.03
55
.94
52
.17
55
.39
56
.55
56
.01
56
.25
52
.81
59
.50
60
.71
55
.14
55
.79
RM
G
Text
ile
Leat
he
r
Ph
arm
a
Foo
d
Ligh
t En
g
Oth
er
Man
Wh
ole
sale
Re
tail
Re
stau
ran
t
Tran
spo
rt
ICT
Fin
anci
al
Re
al E
stat
e
Oth
er
Serv
55
.79
56
.85
55
.21
62
.33
56
.61
54
.35
61
.76
53
.43
59
.26
62
.27
57
.19
61
.33
67
.71
56
.25
57
.18
RM
G
Text
ile
Leat
he
r
Ph
arm
a
Foo
d
Ligh
t En
g
Oth
er
Man
Wh
ole
sale
Re
tail
Re
stau
ran
t
Tran
spo
rt
ICT
Fin
anci
al
Re
al E
stat
e
Oth
er
Serv
43
.17
39
.54
37
.71 46
.18
41
.97
35
.14
38
.48
42
.89
40
.93
37
.96
37
.71
37
.67
52
.38
44
.44
35
.65
RM
G
Text
ile
Leat
he
r
Ph
arm
a
Foo
d
Ligh
t En
g
Oth
er
Man
Wh
ole
sale
Re
tail
Re
stau
ran
t
Tran
spo
rt
ICT
Fin
anci
al
Re
al E
stat
e
Oth
er
Serv

34
Analysis of PBSI and BCI by firm size As the literature suggests, the coping capacities of large firms during recessions are much higher than the small and medium firms. Several factors put the large firms in a better position during such a crisis like – (i) greater access to finances and stimulus packages (a strong bank client relationship), (ii) higher bargaining powers, (iii) well-established business network, (iv) a more diversified market reach, etc. A reflection of such advantages of the large firms over the small and medium firms can be observed from the PBSI and BCI scores of the firms by their sizes (Figure 18).
Large firms are observed to have higher PBSI (quarter) in all four rounds of the survey (Figure 18). In the first round of the survey, the PBSI (in April-June 2020 over January-March 2020) of the micro and small firms was 28.47 whereas the PBSI of the large firms was 32.04. In the second round, the PBSI (July-September 2020 over April-June 2020) of the small firms has increased to 45.89 while the PBSI of the large firms has increased to 51.35. Again, in the third round of the survey, the PBSI (October-December 2020 over July-September 2020) of the micro and small firms has improved marginally to 46.79 whereas the PBSI of the large firms has increased somewhat to 52.86. In the fourth round of the survey, we now see that the PBSI (in January-March 2021 over October-December 2020) of the micro and small firms stands at 49.45, and the PBSI of large firms has increased to 56.35. This shows that large businesses have been better off than micro and small ones throughout the pandemic.
Figure 18: PBSI (quarter) by firm sizes
Source: Authors’ estimation based on SANEM BCI (quarterly) Survey, 2020-21
Like the PBSI (quarter), large firms are observed to have higher PBSI (year) in all four rounds of the survey, always above the overall score (Figure 19). In the first round of the survey, the PBSI (in April-June 2020 over the same quarter in the previous year) of the micro and small firms was 24.74 whereas the PBSI of the large firms was 29.53. In the second round, the PBSI (July-September 2020 over the same quarter in 2019) of the small firms has increased to 32.09; the PBSI of the large firms has increased to 38.00. In the third round of the survey, the PBSI (October-December 2020 over October-December 2019) of the micro and small firms
28
.47
45
.89
46
.79
49
.45
27
.40
50
.00
49
.54
52
.08
32
.04
51
.35
52
.86
56
.35
29
.48
47
.96
48
.83
51
.38
0.00
25.00
50.00
75.00
100.00
Apr-Jun'20 Jul-Sep'20 Oct-Dec'20 Jan-Mar'21
Micro and small Medium Large Overall
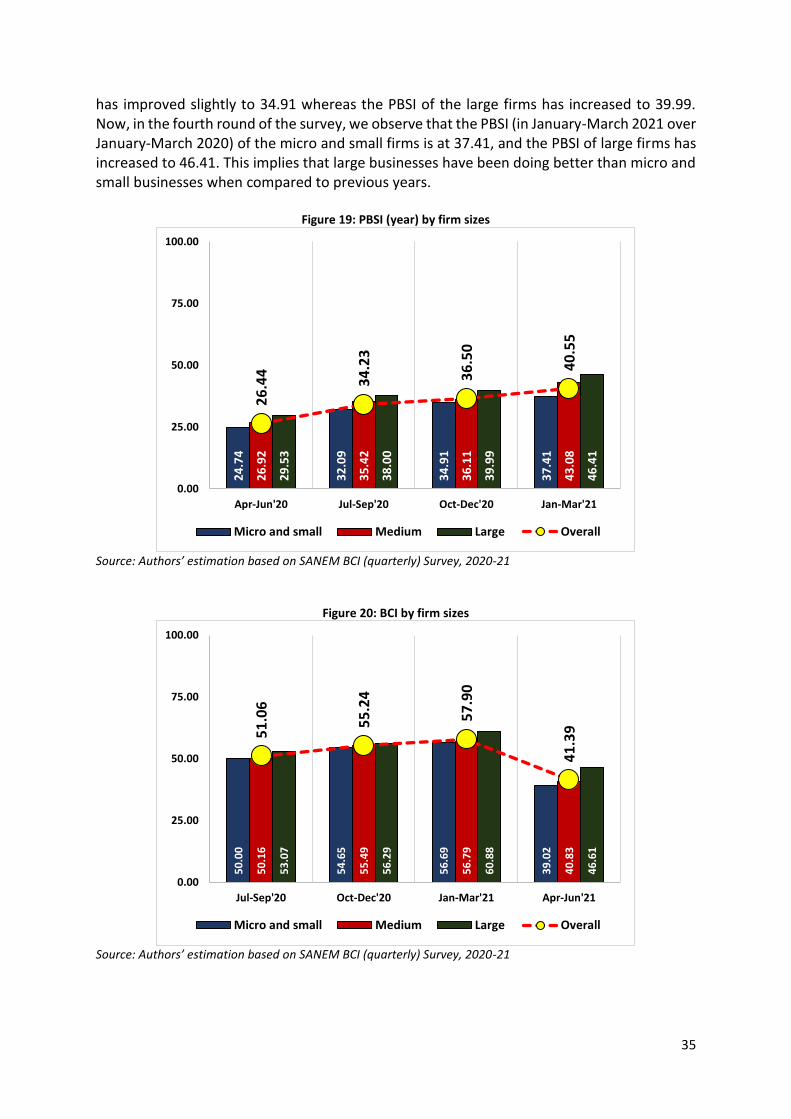
35
has improved slightly to 34.91 whereas the PBSI of the large firms has increased to 39.99. Now, in the fourth round of the survey, we observe that the PBSI (in January-March 2021 over January-March 2020) of the micro and small firms is at 37.41, and the PBSI of large firms has increased to 46.41. This implies that large businesses have been doing better than micro and small businesses when compared to previous years.
Figure 19: PBSI (year) by firm sizes
Source: Authors’ estimation based on SANEM BCI (quarterly) Survey, 2020-21
Figure 20: BCI by firm sizes
Source: Authors’ estimation based on SANEM BCI (quarterly) Survey, 2020-21
24
.74
32
.09
34
.91
37
.41
26
.92
35
.42
36
.11
43
.08
29
.53
38
.00
39
.99
46
.41
26
.44
34
.23
36
.50
40
.55
0.00
25.00
50.00
75.00
100.00
Apr-Jun'20 Jul-Sep'20 Oct-Dec'20 Jan-Mar'21
Micro and small Medium Large Overall
50
.00
54
.65
56
.69
39
.02
50
.16
55
.49
56
.79
40
.83
53
.07
56
.29
60
.88
46
.61
51
.06
55
.24
57
.90
41
.39
0.00
25.00
50.00
75.00
100.00
Jul-Sep'20 Oct-Dec'20 Jan-Mar'21 Apr-Jun'21
Micro and small Medium Large Overall

36
In terms of BCI, large firms have higher scores across all four rounds of the survey. However, BCIs for firms of all sizes have seen a drop in the April-June 2021 quarter, with the BCI of large firms falling to 46.61 from 60.88, and the BCI of micro and small firms falling from 56.99 to 39.02 (Figure 20).
Analysis of PBSI and BCI by sector Interesting trends can be observed when analysing the PBSI scores in terms of sectors. In the PBSI (year), it can be seen that in the fourth round the PBSI score of the manufacturing sector is greater than that of the services sector, standing at 41.14 (Figure 21). This implies that manufacturing has had more improvement in the January-March 2021 quarter compared to the corresponding quarter in the previous year than services – this trend was observed in the first round as well. In the second and third rounds, however, the services sector was slightly ahead.
Figure 21: PBSI (year) by sector
Source: Authors’ estimation based on SANEM BCI (quarterly) Survey, 2020-21
Like PBSI (year), PBSI (quarter) is also higher in the manufacturing sector compared to the services sector, standing at 51.80 (Figure 22). The services sector is slightly behind at 51.60. Regardless, this is a positive sign for both sectors as a score above 50 implies that they are doing better in the January-March 2021 quarter than the previous quarter. Interestingly, this is also the first time in the survey that the manufacturing sector has had a higher PBSI score.

37
Figure 22: PBSI (quarter) by sector
Source: Authors’ estimation based on SANEM BCI (quarterly) Survey, 2020-21
In terms of the BCI scores by sector, it can be seen that it has suffered from a significant drop in the fourth round, i.e. for the April-June 2021 quarter, in both sectors (Figure 23). With scores below 50, confidence in both sectors is comparatively low. In general, however, BCI scores in the services sector are always higher, meaning that there is more confidence in businesses from this sector.
Figure 23: BCI by sector
Source: Authors’ estimation based on SANEM BCI (quarterly) Survey, 2020-21

38
Analysis of PBSI and BCI by location In this sub-section, we look at the differences in PBSI and BCI, categorized by location – Dhaka and non-Dhaka. In terms of PBSI (year), the score for Dhaka (43.97) in the January-March 2021 quarter is higher than for non-Dhaka (38.24) in comparison to the corresponding quarter in the previous year (Figure 24). Non-Dhaka businesses seemed to do slightly better in the first and third rounds only.
Figure 24: PBSI (year) by location
Source: Authors’ estimation based on SANEM BCI (quarterly) Survey, 2020-21
Figure 25: PBSI (quarter) by location
Source: Authors’ estimation based on SANEM BCI (quarterly) Survey, 2020-21
In the measurement of PBSI (quarter) by location, the score for Dhaka in the fourth round is again higher, standing at 52.84 (Figure 25). Non-Dhaka is slightly behind at 50.92, although

39
both scores are higher – this implies an improved business status compared to the previous quarter. It appears that Dhaka has been ahead in almost all rounds of the survey.
In the measure of BCI by location (Figure 26), it can be seen that BCI scores have decreased regardless of the location in the fourth round – possibly due to new lockdown restrictions and cases. Despite this, Dhaka consistently has a higher BCI score than non-Dhaka in all rounds, implying overall greater business confidence in this region.
Figure 26: BCI by location
Source: Authors’ estimation based on SANEM BCI (quarterly) Survey, 2020-21
Analysis of PBSI and BCI by export status In the fourth round of the survey, it is observed that exporter firms have a higher PBSI (year) than non-exporter firms, standing at 42.98 (Figure 27). This is a significant increase compared to the third round, where the PBSI score of non-exporter firms was higher. Overall, it shows that the business status of exporters is improving compared to the previous year, which is a positive sign.

40
Figure 27: PBSI (year) by exporter
Source: Authors’ estimation based on SANEM BCI (quarterly) Survey, 2020-21
A similar trend is observed in the PBSI (quarter) (Figure 28). In the fourth round, the PBSI score of exporters (53.84) is higher than that of non-exporters (50.36), unlike the third round where we see the opposite happening. The BCI scores in the fourth round for both are also above 50, implying that the business status for both exporters and non-exporters is better in the January-March 2021 quarter compared to the previous quarter.
Figure 28: PBSI (quarter) by export status
Source: Authors’ estimation based on SANEM BCI (quarterly) Survey, 2020-21
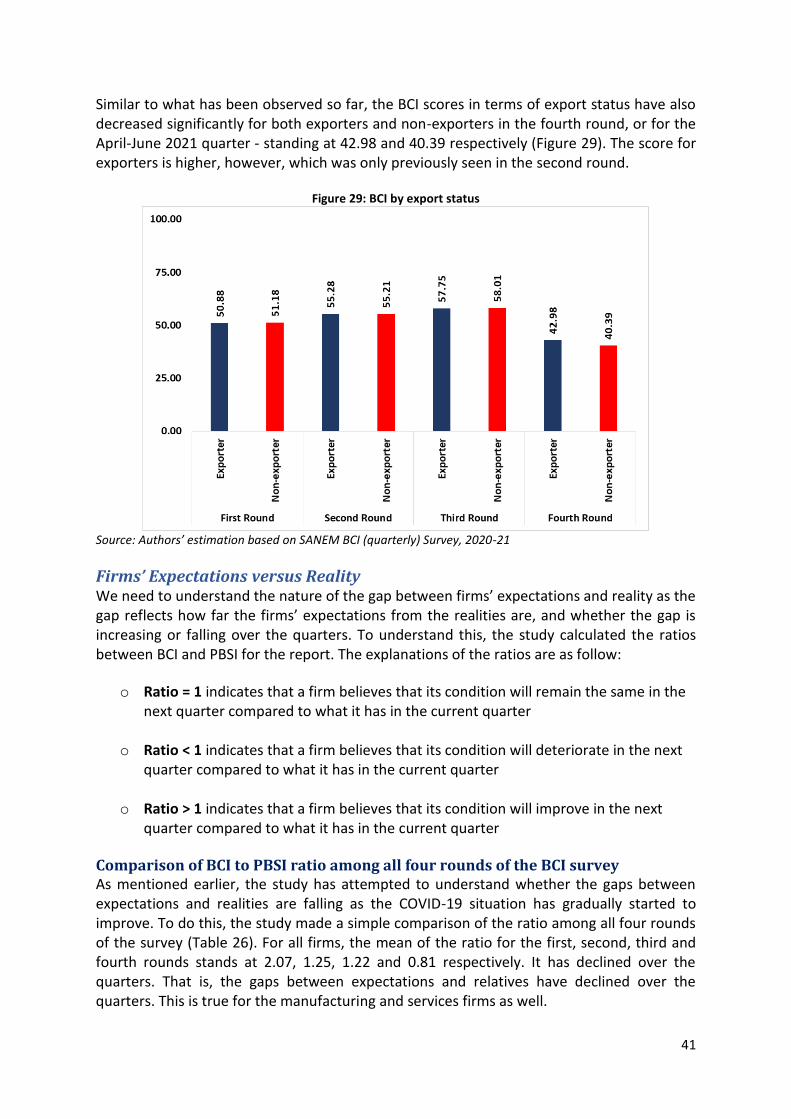
41
Similar to what has been observed so far, the BCI scores in terms of export status have also decreased significantly for both exporters and non-exporters in the fourth round, or for the April-June 2021 quarter - standing at 42.98 and 40.39 respectively (Figure 29). The score for exporters is higher, however, which was only previously seen in the second round.
Figure 29: BCI by export status
Source: Authors’ estimation based on SANEM BCI (quarterly) Survey, 2020-21
Firms’ Expectations versus Reality We need to understand the nature of the gap between firms’ expectations and reality as the gap reflects how far the firms’ expectations from the realities are, and whether the gap is increasing or falling over the quarters. To understand this, the study calculated the ratios between BCI and PBSI for the report. The explanations of the ratios are as follow:
o Ratio = 1 indicates that a firm believes that its condition will remain the same in the next quarter compared to what it has in the current quarter
o Ratio < 1 indicates that a firm believes that its condition will deteriorate in the next quarter compared to what it has in the current quarter
o Ratio > 1 indicates that a firm believes that its condition will improve in the next
quarter compared to what it has in the current quarter
Comparison of BCI to PBSI ratio among all four rounds of the BCI survey As mentioned earlier, the study has attempted to understand whether the gaps between expectations and realities are falling as the COVID-19 situation has gradually started to improve. To do this, the study made a simple comparison of the ratio among all four rounds of the survey (Table 26). For all firms, the mean of the ratio for the first, second, third and fourth rounds stands at 2.07, 1.25, 1.22 and 0.81 respectively. It has declined over the quarters. That is, the gaps between expectations and relatives have declined over the quarters. This is true for the manufacturing and services firms as well.
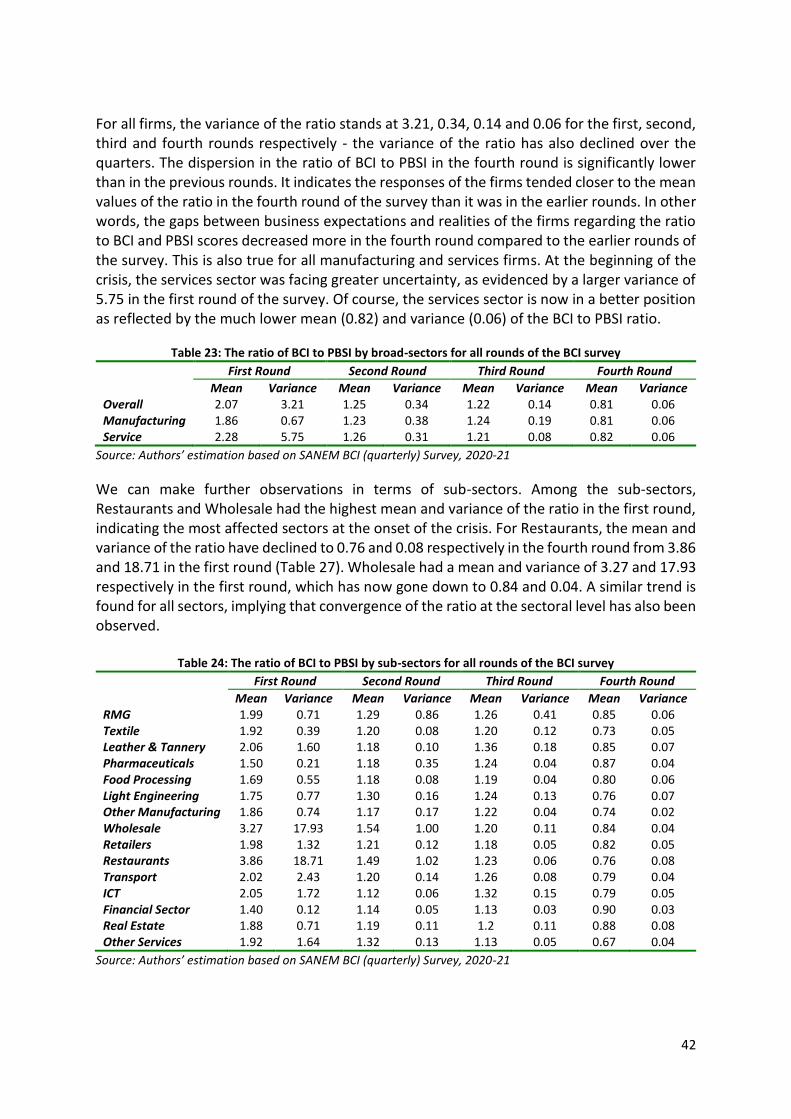
42
For all firms, the variance of the ratio stands at 3.21, 0.34, 0.14 and 0.06 for the first, second, third and fourth rounds respectively - the variance of the ratio has also declined over the quarters. The dispersion in the ratio of BCI to PBSI in the fourth round is significantly lower than in the previous rounds. It indicates the responses of the firms tended closer to the mean values of the ratio in the fourth round of the survey than it was in the earlier rounds. In other words, the gaps between business expectations and realities of the firms regarding the ratio to BCI and PBSI scores decreased more in the fourth round compared to the earlier rounds of the survey. This is also true for all manufacturing and services firms. At the beginning of the crisis, the services sector was facing greater uncertainty, as evidenced by a larger variance of 5.75 in the first round of the survey. Of course, the services sector is now in a better position as reflected by the much lower mean (0.82) and variance (0.06) of the BCI to PBSI ratio.
Table 23: The ratio of BCI to PBSI by broad-sectors for all rounds of the BCI survey
First Round Second Round Third Round Fourth Round
Mean Variance Mean Variance Mean Variance Mean Variance Overall 2.07 3.21 1.25 0.34 1.22 0.14 0.81 0.06 Manufacturing 1.86 0.67 1.23 0.38 1.24 0.19 0.81 0.06 Service 2.28 5.75 1.26 0.31 1.21 0.08 0.82 0.06
Source: Authors’ estimation based on SANEM BCI (quarterly) Survey, 2020-21
We can make further observations in terms of sub-sectors. Among the sub-sectors, Restaurants and Wholesale had the highest mean and variance of the ratio in the first round, indicating the most affected sectors at the onset of the crisis. For Restaurants, the mean and variance of the ratio have declined to 0.76 and 0.08 respectively in the fourth round from 3.86 and 18.71 in the first round (Table 27). Wholesale had a mean and variance of 3.27 and 17.93 respectively in the first round, which has now gone down to 0.84 and 0.04. A similar trend is found for all sectors, implying that convergence of the ratio at the sectoral level has also been observed.
Table 24: The ratio of BCI to PBSI by sub-sectors for all rounds of the BCI survey
First Round Second Round Third Round Fourth Round
Mean Variance Mean Variance Mean Variance Mean Variance RMG 1.99 0.71 1.29 0.86 1.26 0.41 0.85 0.06 Textile 1.92 0.39 1.20 0.08 1.20 0.12 0.73 0.05 Leather & Tannery 2.06 1.60 1.18 0.10 1.36 0.18 0.85 0.07 Pharmaceuticals 1.50 0.21 1.18 0.35 1.24 0.04 0.87 0.04 Food Processing 1.69 0.55 1.18 0.08 1.19 0.04 0.80 0.06 Light Engineering 1.75 0.77 1.30 0.16 1.24 0.13 0.76 0.07 Other Manufacturing 1.86 0.74 1.17 0.17 1.22 0.04 0.74 0.02 Wholesale 3.27 17.93 1.54 1.00 1.20 0.11 0.84 0.04 Retailers 1.98 1.32 1.21 0.12 1.18 0.05 0.82 0.05 Restaurants 3.86 18.71 1.49 1.02 1.23 0.06 0.76 0.08 Transport 2.02 2.43 1.20 0.14 1.26 0.08 0.79 0.04 ICT 2.05 1.72 1.12 0.06 1.32 0.15 0.79 0.05 Financial Sector 1.40 0.12 1.14 0.05 1.13 0.03 0.90 0.03 Real Estate 1.88 0.71 1.19 0.11 1.2 0.11 0.88 0.08 Other Services 1.92 1.64 1.32 0.13 1.13 0.05 0.67 0.04
Source: Authors’ estimation based on SANEM BCI (quarterly) Survey, 2020-21

43
At the individual firm level, the convergence of the BCI to PBSI ratio has been illustrated using four different scatter diagrams (Figure 30, 31, 32 and 33). In the first round, the dots were scattered and very far from the 1. Compared to the first round, the dots in the second round were observed close to 1. However, in the third round, the dots were found very close to 1. Finally, in the fourth round, the dots are even closer to 1. This indicates that the expectations of the firms are getting closer to the realities observed over the quarters. The dispersion of the firms is significantly lower in the fourth round compared to the earlier rounds of the survey. This implies that there has been a sequential change in the gap between expectations and reality amongst the firms. Since the pandemic has now taken a more predictable path, expectations formed by the firms now are more aligned to reality.

Figure 30: The ratio of BCI to PBSI (first round: April-June 2020)
Figure 31: The ratio of BCI to PBSI (second round: July-September 2020)
Figure 32: The ratio of BCI to PBSI (third round: October-Decber 2020)
Figure 33: The ratio of BCI to PBSI (fourth round: January-March 2021)
Mean = 2.07 Median = 1.73 Standard deviation = 1.79 Variance = 3.21
Mean = 1.25 Median = 1.14 Standard deviation = 0.59 Variance = 0.34
Mean = 1.22 Median = 1.17 Standard deviation = 0.37 Variance = 0.14
Mean = 0.81 Median = 0.79 Standard deviation = 0.24 Variance = 0.06
Source: Authors’ estimation based on SANEM BCI (quarterly) Survey, 2020-21

45
Section-V: Business Environment
An overall analysis of Enabling Business-Environment Index Cost minimization is always a goal for firms when carrying out business activities. A favourable business environment can be achieved through the contribution of reduced direct and indirect costs. The significance of costs in a business environment, combined with the high business costs observed in previous rounds of the survey has led researchers to construct a third index - Enabling Business-Environment Index (EBI). To gain further insight on the impact of the pandemic on the overall business environment, the surveyed firms were asked to answer based on each of the ten indicators (such as electricity, corruption, etc.) specified in the methodology part section. For instance, the firms were asked: “On a weight of 0 to 100, at present, how favourable are the following indicators for your overall business performance?” Seven options were provided - extremely unfavourable, slightly unfavourable, moderately unfavourable, neither unfavourable nor favourable, slightly favourable, moderately favourable, and extremely favourable. Here, zero represents an extremely unfavourable situation, whereas 100 represents an extremely favourable situation. Thereafter, the study clustered the seven alternatives into five broad categories: extremely unfavourable, unfavourable, neither unfavourable nor favourable, favourable, and extremely favourable. The overall EBI scores in all four rounds stand at 45.19, 44.61, 43.39 and 47.00 respectively (Figure 34). The scores in all four rounds are found between 25 and 50, indicating that the overall business environment is unfavourable for the firms. However, while the score had decreased from 44.61 in the July-September 2020 quarter to 43.49 in the October-December 2020 quarter, it has increased to 47.00 in the January-March 2021 quarter, which indicates an improving business environment. The EBI scores of all components, besides Covid Management, have increased in the January-March 2021 quarter. While some components such as Trade Logistics and Government Support have had marginal improvements, other components have had significant increases. In the January-March 2021 quarter, Electricity and Skilled Workforce have had the most improvement, becoming the highest EBI scores (62.08 and 73.66 respectively). On the other hand, the score for Covid Management has decreased to 34.10 and is the lowest BCI score in the January-March 2021 quarter.
Corruption is the only indicator that has consistently progressed over the quarters. Even though the score regarding corruption was very low, to begin with at 30.69 (April-June 2020), it has improved to 36.38 (January-March 2021), which is a ray of hope for everyone.
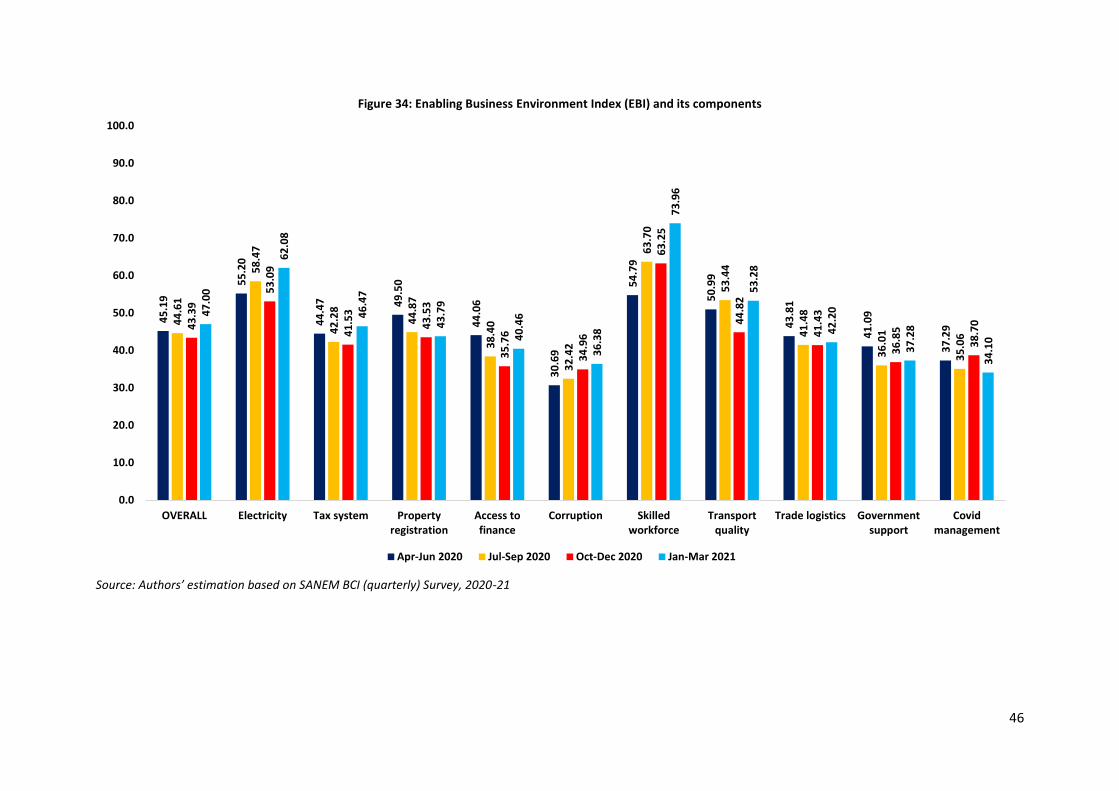
46
Figure 34: Enabling Business Environment Index (EBI) and its components
Source: Authors’ estimation based on SANEM BCI (quarterly) Survey, 2020-21
45
.19
55
.20
44
.47 49
.50
44
.06
30
.69
54
.79
50
.99
43
.81
41
.09
37
.29
44
.61
58
.47
42
.28
44
.87
38
.40
32
.42
63
.70
53
.44
41
.48
36
.01
35
.06
43
.39
53
.09
41
.53
43
.53
35
.76
34
.96
63
.25
44
.82
41
.43
36
.85
38
.70
47
.00
62
.08
46
.47
43
.79
40
.46
36
.38
73
.96
53
.28
42
.20
37
.28
34
.10
0.0
10.0
20.0
30.0
40.0
50.0
60.0
70.0
80.0
90.0
100.0
OVERALL Electricity Tax system Propertyregistration
Access tofinance
Corruption Skilledworkforce
Transportquality
Trade logistics Governmentsupport
Covidmanagement
Apr-Jun 2020 Jul-Sep 2020 Oct-Dec 2020 Jan-Mar 2021

47
Sectoral analysis of Enabling Business-Environment Index The EBI scores vary across the sectors. This is primarily because not all sectors have equal business access and environment to flourish their businesses. In this regard, a thorough sectoral analysis is required to have a clear picture of a single sector and thereby provide possible policy suggestions for the sector.
The sectoral EBI scores are presented in Figure 35. The EBI scores of all sectors have increased in the January-March 2021 quarter compared to the October-December quarter of 2020, which implies that the business environment for all sectors has improved. Most notably, the Financial and Other Manufacturing sectors have the highest EBIs in this quarter, rising to 50.15 and 57.23 respectively - this also implies that the business environment in this quarter is better than the previous one.

48
Figure 35: Sectoral EBI
Source: Authors’ estimation based on SANEM BCI (quarterly) Survey, 2020-21
45
.19
47
.55
44
.78
37
.88
46
.62
42
.72
36
.92
44
.32
47
.40
42
.98
40
.21
42
.73
45
.63
55
.83
45
.89
55
.00
44
.61
43
.40
46
.33
39
.88 4
5.6
3
44
.81
41
.30 4
6.7
6
44
.64
46
.34
43
.47
40
.50
42
.30
56
.52
43
.08
45
.97
43
.39
44
.76
43
.06
43
.25
45
.73
44
.09
43
.37
43
.09
42
.72
42
.33
43
.61
39
.81
42
.90
50
.18
40
.77
41
.674
7.0
0
48
.73
47
.39
44
.75
48
.54
45
.06
43
.70 5
0.1
5
45
.07
45
.67
47
.50
45
.38
45
.50
57
.23
45
.48
43
.89
0.0
10.0
20.0
30.0
40.0
50.0
60.0
70.0
80.0
90.0
100.0
OVERALL RMG Textile Leather Pharma Food Light Eng Other Man Wholesale Retail Restaurant Transport ICT Financial Real Estate Other Serv
Apr-Jun 2020 Jul-Sep 2020 Oct-Dec 2020 Jan-Mar 2021

49
However, the sectoral performance, in terms of EBI, can be elaborated based on each indicator. This will allow us to have the indicator-specific performance of the sectors precisely. To do this, we have selected firms’ performance on the indicators in the latest quarter. One reason behind the selection of the recent quarter is to realise how and to what extent the business environment is currently favourable to the firms.
The baseline case is presented at the aggregated level (Figure 36). The red dotted line is the overall or aggregated EBI score for the January-March 2021 quarter. The firms whose EBI scores above the line have a relatively better business environment among the sectors and vice-versa. It is observed that more than half of the firms could not cross the red dotted line. It implies that the overall business environment was not as much as favourable to the firms. The EBI score of sectors like the Financial sector (57.43), Other Manufacturing (50.15), Pharmaceuticals (48.54), RMG (48.73) and are above the overall score (47.00). On the other hand, the EBI score of sectors like Leather & Tannery (44.75), Light Engineering (43.70) and Other Services (43.89) are far below the benchmark. Sectors like Textile (47.39) and Restaurant (47.50) marginally pass the benchmark EBI.
Figure 36: Sectoral overall EBI
Source: Authors’ estimation based on SANEM BCI (fourth round) Survey, 2020-21
The overall EBI score of Electricity (connection & quality) in the January-March 2021 quarter stands at 62.08 (Figure 37). The highest EBI score is found in the Financial sector (70.54). In the case of Food Processing (63.41), Light Engineering (64.13), Other Manufacturing (67.65), Transportation (69.38), Real Estate (65.48) and Other Services (63.89), the EBI scores are found above the overall Electricity EBI score. It indicates that these sectors have better electricity connection and quality among the sub-sectors. In contrast, the EBI scores of Wholesale (59.56), Retailer (58.33), ICT & Telecommunication (56.00), RMG (59.04), Textile (60.00), Pharmaceuticals (60.42), and Restaurant (56.94) sectors are below the overall Electricity EBI score, indicating these sectors have poor electricity connection and quality among the sub-sectors. Sectors like Pharmaceuticals, and Restaurant are far below the overall Electricity EBI score.
48
.73
47
.39
44
.75
48
.54
45
.06
43
.70
50
.15
45
.07
45
.67
47
.50
45
.38
45
.50 57
.23
45
.48
43
.89
0.0
10.0
20.0
30.0
40.0
50.0
60.0
70.0
80.0
90.0
100.0
RM
G
Text
ile
Leat
he
r
Ph
arm
a
Foo
d
Ligh
t En
g
Oth
er
Man
Wh
ole
sale
Re
tail
Re
stau
ran
t
Tran
spo
rt
ICT
Fin
an
cial
Re
al E
stat
e
Oth
er
Serv
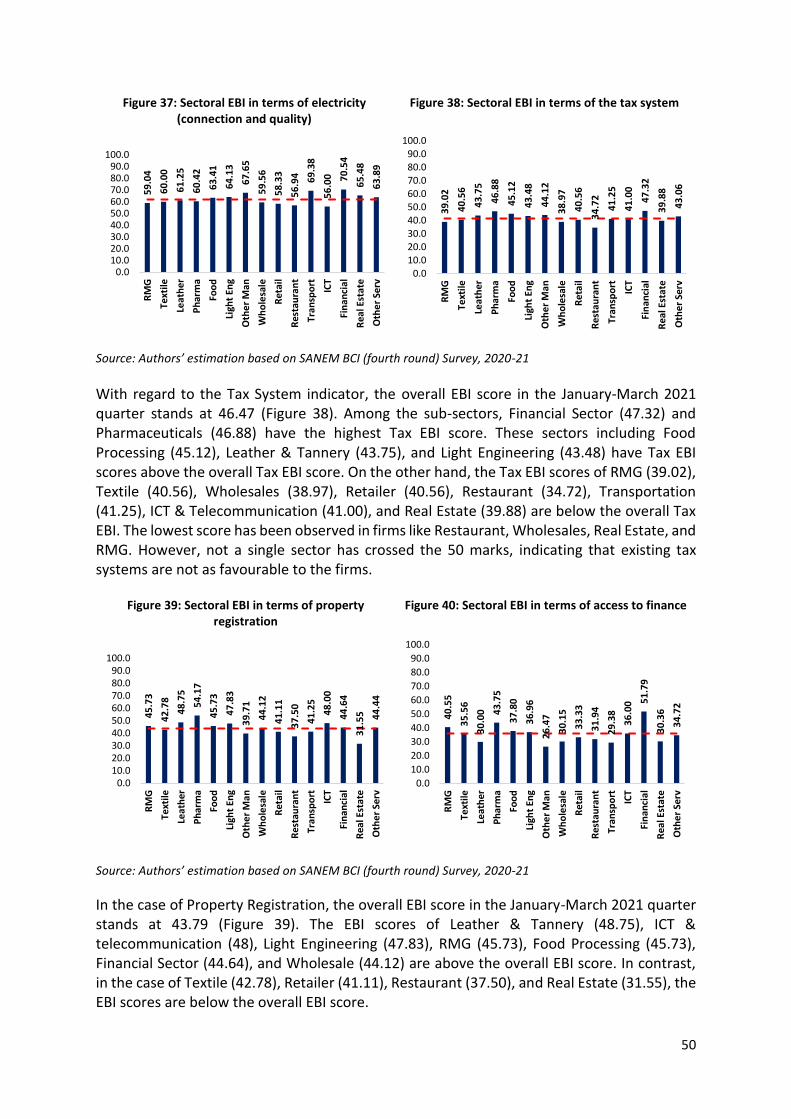
50
Figure 37: Sectoral EBI in terms of electricity (connection and quality)
Figure 38: Sectoral EBI in terms of the tax system
Source: Authors’ estimation based on SANEM BCI (fourth round) Survey, 2020-21
With regard to the Tax System indicator, the overall EBI score in the January-March 2021 quarter stands at 46.47 (Figure 38). Among the sub-sectors, Financial Sector (47.32) and Pharmaceuticals (46.88) have the highest Tax EBI score. These sectors including Food Processing (45.12), Leather & Tannery (43.75), and Light Engineering (43.48) have Tax EBI scores above the overall Tax EBI score. On the other hand, the Tax EBI scores of RMG (39.02), Textile (40.56), Wholesales (38.97), Retailer (40.56), Restaurant (34.72), Transportation (41.25), ICT & Telecommunication (41.00), and Real Estate (39.88) are below the overall Tax EBI. The lowest score has been observed in firms like Restaurant, Wholesales, Real Estate, and RMG. However, not a single sector has crossed the 50 marks, indicating that existing tax systems are not as favourable to the firms.
Figure 39: Sectoral EBI in terms of property registration
Figure 40: Sectoral EBI in terms of access to finance
Source: Authors’ estimation based on SANEM BCI (fourth round) Survey, 2020-21
In the case of Property Registration, the overall EBI score in the January-March 2021 quarter stands at 43.79 (Figure 39). The EBI scores of Leather & Tannery (48.75), ICT & telecommunication (48), Light Engineering (47.83), RMG (45.73), Food Processing (45.73), Financial Sector (44.64), and Wholesale (44.12) are above the overall EBI score. In contrast, in the case of Textile (42.78), Retailer (41.11), Restaurant (37.50), and Real Estate (31.55), the EBI scores are below the overall EBI score.
59
.04
60
.00
61
.25
60
.42
63
.41
64
.13
67
.65
59
.56
58
.33
56
.94 69
.38
56
.00 70
.54
65
.48
63
.89
0.010.020.030.040.050.060.070.080.090.0
100.0R
MG
Text
ile
Leat
her
Ph
arm
a
Foo
d
Ligh
t En
g
Oth
er
Man
Wh
ole
sale
Ret
ail
Res
tau
ran
t
Tran
spo
rt
ICT
Fin
anci
al
Rea
l Est
ate
Oth
er
Serv
39
.02
40
.56
43
.75
46
.88
45
.12
43
.48
44
.12
38
.97
40
.56
34
.72
41
.25
41
.00
47
.32
39
.88
43
.06
0.010.020.030.040.050.060.070.080.090.0
100.0
RM
G
Text
ile
Leat
her
Ph
arm
a
Foo
d
Ligh
t En
g
Oth
er
Man
Wh
ole
sale
Ret
ail
Res
tau
ran
t
Tran
spo
rt
ICT
Fin
anci
al
Rea
l Est
ate
Oth
er
Serv
45
.73
42
.78
48
.75
54
.17
45
.73
47
.83
39
.71
44
.12
41
.11
37
.50
41
.25
48
.00
44
.64
31
.55 44
.44
0.010.020.030.040.050.060.070.080.090.0
100.0
RM
G
Text
ile
Leat
her
Ph
arm
a
Foo
d
Ligh
t En
g
Oth
er
Man
Wh
ole
sale
Ret
ail
Res
tau
ran
t
Tran
spo
rt
ICT
Fin
anci
al
Rea
l Est
ate
Oth
er
Serv
40
.55
35
.56
30
.00 4
3.7
5
37
.80
36
.96
26
.47
30
.15
33
.33
31
.94
29
.38
36
.00 5
1.7
9
30
.36
34
.72
0.0
10.0
20.0
30.0
40.0
50.0
60.0
70.0
80.0
90.0
100.0
RM
G
Text
ile
Leat
her
Ph
arm
a
Foo
d
Ligh
t En
g
Oth
er
Man
Wh
ole
sale
Ret
ail
Res
tau
ran
t
Tran
spo
rt
ICT
Fin
anci
al
Rea
l Est
ate
Oth
er
Serv
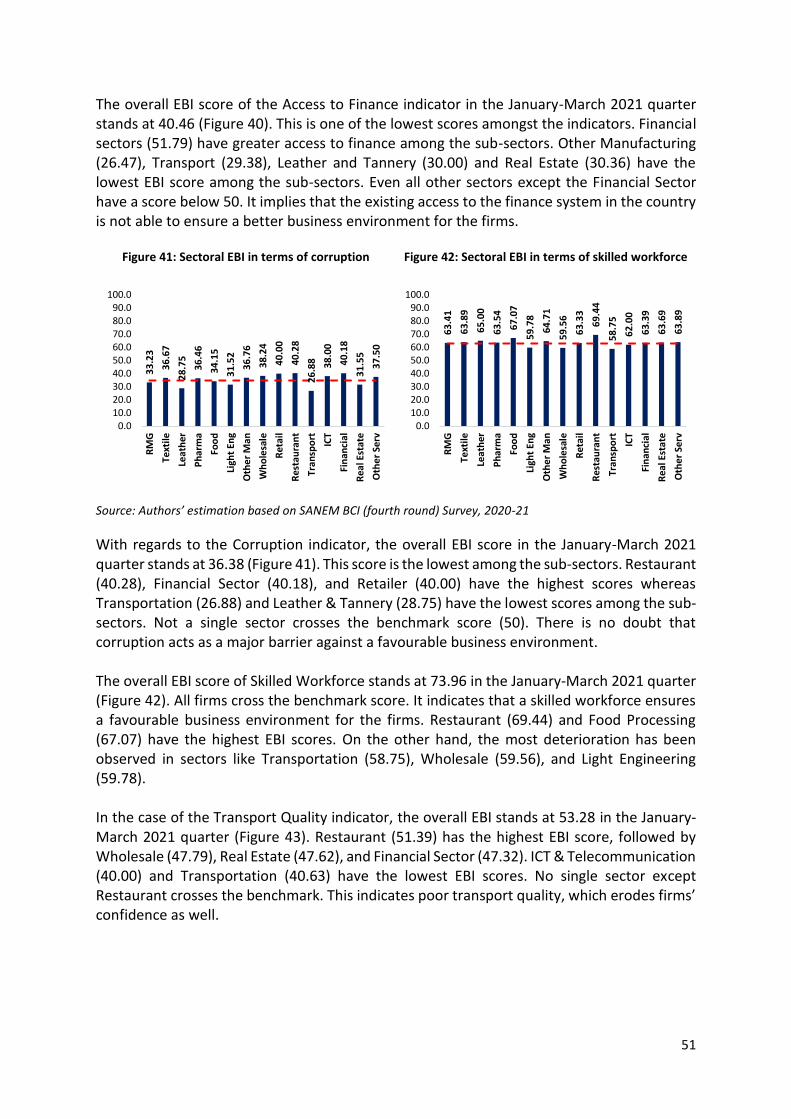
51
The overall EBI score of the Access to Finance indicator in the January-March 2021 quarter stands at 40.46 (Figure 40). This is one of the lowest scores amongst the indicators. Financial sectors (51.79) have greater access to finance among the sub-sectors. Other Manufacturing (26.47), Transport (29.38), Leather and Tannery (30.00) and Real Estate (30.36) have the lowest EBI score among the sub-sectors. Even all other sectors except the Financial Sector have a score below 50. It implies that the existing access to the finance system in the country is not able to ensure a better business environment for the firms.
Figure 41: Sectoral EBI in terms of corruption
Figure 42: Sectoral EBI in terms of skilled workforce
Source: Authors’ estimation based on SANEM BCI (fourth round) Survey, 2020-21
With regards to the Corruption indicator, the overall EBI score in the January-March 2021 quarter stands at 36.38 (Figure 41). This score is the lowest among the sub-sectors. Restaurant (40.28), Financial Sector (40.18), and Retailer (40.00) have the highest scores whereas Transportation (26.88) and Leather & Tannery (28.75) have the lowest scores among the sub-sectors. Not a single sector crosses the benchmark score (50). There is no doubt that corruption acts as a major barrier against a favourable business environment. The overall EBI score of Skilled Workforce stands at 73.96 in the January-March 2021 quarter (Figure 42). All firms cross the benchmark score. It indicates that a skilled workforce ensures a favourable business environment for the firms. Restaurant (69.44) and Food Processing (67.07) have the highest EBI scores. On the other hand, the most deterioration has been observed in sectors like Transportation (58.75), Wholesale (59.56), and Light Engineering (59.78). In the case of the Transport Quality indicator, the overall EBI stands at 53.28 in the January-March 2021 quarter (Figure 43). Restaurant (51.39) has the highest EBI score, followed by Wholesale (47.79), Real Estate (47.62), and Financial Sector (47.32). ICT & Telecommunication (40.00) and Transportation (40.63) have the lowest EBI scores. No single sector except Restaurant crosses the benchmark. This indicates poor transport quality, which erodes firms’ confidence as well.
33
.23
36
.67
28
.75
36
.46
34
.15
31
.52
36
.76
38
.24
40
.00
40
.28
26
.88 38
.00
40
.18
31
.55
37
.50
0.010.020.030.040.050.060.070.080.090.0
100.0
RM
G
Text
ile
Leat
her
Ph
arm
a
Foo
d
Ligh
t En
g
Oth
er
Man
Wh
ole
sale
Ret
ail
Res
tau
ran
t
Tran
spo
rt
ICT
Fin
anci
al
Rea
l Est
ate
Oth
er
Serv
63
.41
63
.89
65
.00
63
.54
67
.07
59
.78
64
.71
59
.56
63
.33
69
.44
58
.75
62
.00
63
.39
63
.69
63
.89
0.010.020.030.040.050.060.070.080.090.0
100.0
RM
G
Text
ile
Leat
her
Ph
arm
a
Foo
d
Ligh
t En
g
Oth
er
Man
Wh
ole
sale
Ret
ail
Res
tau
ran
t
Tran
spo
rt
ICT
Fin
anci
al
Rea
l Est
ate
Oth
er
Serv

52
Figure 43: Sectoral EBI in terms of transport quality
Figure 44: Sectoral EBI in terms of trade logistics
Source: Authors’ estimation based on SANEM BCI (fourth round) Survey, 2020-21
In the January-March 2021 quarter, the overall EBI score regarding the Trade Logistics indicator stands at 42.20 (Figure 44). We observe a higher EBI score for the services sector compared to the manufacturing sector. Wholesale (48.53) has the highest EBI score whereas Transportation (37.50) and Food processing (37.80) have the lowest EBI scores in this round.
The overall EBI score of the Government Support indicator stands at 37.28 in the January-March 2021 quarter (Figure 45). Financial Sector (51.39), and RMG (49.70) have the highest EBI scores, whereas Real Estate (29.17) and Transportation (29.38) have the lowest EBI scores. None except for RMG, Textile, and Financial sectors cross the overall Government Support EBI score, which is alarming to the businesses. In the case of the COVID-19 Management indicator, the overall EBI score in the January-March 2021 quarter stands at 34.10 (Figure 46). The EBI score of most of the firms is below the overall EBI score as well as the benchmark, indicating firms are in an unfavourable position regarding the COVID-19 Management indicator. Financial Sector (50) has the highest EBI score while Food Processing (34.76) has the lowest EBI score.
Figure 45: Sectoral EBI in terms of government
support
Figure 46: Sectoral EBI in terms of COVID management
Source: Authors’ estimation based on SANEM BCI (fourth round) Survey, 2020-21
46
.34
44
.44
47
.50
45
.83
46
.95
45
.65
41
.18
47
.79
41
.67
51
.39
40
.63
40
.00
47
.32
47
.62
33
.33
0.010.020.030.040.050.060.070.080.090.0
100.0R
MG
Text
ile
Leat
her
Ph
arm
a
Foo
d
Ligh
t En
g
Oth
er
Man
Wh
ole
sale
Ret
ail
Res
tau
ran
t
Tran
spo
rt
ICT
Fin
anci
al
Rea
l Est
ate
Oth
er
Serv
38
.11
38
.33
38
.75
41
.67
37
.80
39
.13
47
.06
48
.53
42
.78
44
.44
37
.50
42
.00
45
.54
44
.64
47
.22
0.010.020.030.040.050.060.070.080.090.0
100.0
RM
G
Text
ile
Leat
her
Ph
arm
a
Foo
d
Ligh
t En
g
Oth
er
Man
Wh
ole
sale
Ret
ail
Res
tau
ran
t
Tran
spo
rt
ICT
Fin
anci
al
Rea
l Est
ate
Oth
er
Serv
49
.70
40
.56
31
.25
36
.46
34
.15
35
.87
30
.88
33
.82
32
.78
31
.94
29
.38
32
.00 5
1.7
9
29
.17
27
.78
0.010.020.030.040.050.060.070.080.090.0
100.0
RM
G
Text
ile
Leat
her
Ph
arm
a
Foo
d
Ligh
t En
g
Oth
er
Man
Wh
ole
sale
Ret
ail
Res
tau
ran
t
Tran
spo
rt
ICT
Fin
anci
al
Rea
l Est
ate
Oth
er
Serv
41
.16
38
.33
36
.25
41
.67
34
.76
35
.87
45
.59
34
.56
37
.78
37
.50
36
.25
38
.00
50
.00
39
.88
30
.56
0.010.020.030.040.050.060.070.080.090.0
100.0
RM
G
Text
ile
Leat
her
Ph
arm
a
Foo
d
Ligh
t En
g
Oth
er
Man
Wh
ole
sale
Ret
ail
Res
tau
ran
t
Tran
spo
rt
ICT
Fin
anci
al
Rea
l Est
ate
Oth
er
Serv

53
EBI and firm sizes In the fourth round of the BCI survey, the EBI scores of large firms stand at 47.22, while the scores for the medium and micro and small firms are 42.27 and 41.78, respectively (Figure 47). It indicates that the current overall business environment is more favourable for large firms than medium, micro, and small firms.
Figure 47: EBI by firm sizes
Source: Authors’ estimation based on SANEM BCI (fourth round) Survey, 2020-21
EBI and PBSI A comparison has been made between EBI and PBSI to understand whether there is any relationship between EBI and PBSI (Figure 48). We observe a positive relationship between EBI and PBSI. The greater the EBI, the higher the PBSI. That is, to what extent the firms perform in this quarter depends on the extent to which the country ensures EBI in the same quarter.
Figure 48: Relationship between EBI and PBSI
Source: Authors’ estimation based on SANEM BCI (fourth round) Survey, 2020-21
47
.22
42
.27
41
.78
0.0
10.0
20.0
30.0
40.0
50.0
60.0
70.0
80.0
90.0
100.0
Lar
ge
Me
diu
m
Mic
ro a
nd
smal
l
0.0
20.0
40.0
60.0
80.0
100.0
0.0 20.0 40.0 60.0 80.0 100.0
PB
SI (
qu
arte
r)
Enabling Business-Environemnt Index (EBI)

54
Section-VI: Status on Stimulus Packages
To lessen the negative impact of COVID-19 on businesses and facilitate their recovery process, the Government of Bangladesh has distributed several stimulus packages for businesses in both the manufacturing and service sectors. This section aims to analyse business thoughts on the availability and effectiveness of incentive packages, barriers to access to the incentive packages, challenges of doing business, and the overall business environment of the country to achieve two objectives of this study.
Status of availing the stimulus package The respondents who participated in the fourth round of the BCI survey were asked whether the firms have received the stimulus package or not. Around 22% of the respondents said their firms received the stimulus package announced by the GoB (Figure 49). Another 69% of the respondents replied that they did not avail of the incentive package. Some of the respondents (around 9%) were not sure whether their firm received the stimulus package benefit or not.
Figure 49: Distribution of the firms on stimulus package receipt options
Source: Authors’ estimation based on SANEM BCI (fourth round) Survey, 2020-21
The distribution of the firms with stimulus packages is not uniform across divisions. 31% of the firms surveyed in Dhaka responded that they received the stimulus package (Map 5). In Chittagong, 28% of the firms had received the incentive package. This rate is around 11-17% for Khulna, Rajshahi, Rangpur, and Mymensingh. The lowest proportion of firms with stimulus packages is observed for Sylhet (8%) and Barisal (0%) divisions. Such heterogeneity in distribution reflects that there might be some accessibility barriers to the stimulus packages for the firms outside Dhaka and Chittagong. To some extent, the heterogeneity can be attributed to the distribution of the firms across divisions. Dhaka and Chittagong divisions host the majority of the manufacturing firms (large firms) that might have more access to the announced packages than others.
Yes22 %
No 69%
Don't know 9 %

55
Map 5: Percentage of firms with stimulus package by divisions
Source: Authors’ estimation based on SANEM BCI (fourth round) Survey, 2020-21
Table 25: Firms receiving stimulus packages in the manufacturing sector
Firms receiving stimulus packages (number)
Firms receiving stimulus packages (%)
Manufacturing sector No/Don't Know
Yes Total No/Don't
Know Yes Total
RMG 35 48 83 42.2% 57.8% 100.0% Textiles 27 18 45 60.0% 40.0% 100.0% Leather and Tannery 14 6 20 70.0% 30.0% 100.0% Pharmaceuticals and Chemicals 19 5 24 79.2% 20.8% 100.0% Food Processing 32 9 41 78.0% 22.0% 100.0% Electronics and Light Engineering 19 4 23 82.6% 17.4% 100.0% Other Manufacturing 16 1 17 94.1% 5.9% 100.0% Total 162 91 253 64.0% 36.0% 100.0%
Source: Authors’ estimation based on SANEM BCI (fourth round) Survey, 2020-21
Amongst the firms that received the stimulus packages, 80% are from the manufacturing sector (Table 25). In total, out of the 253 firms surveyed in the manufacturing sector, 36% per cent of the firms replied that they received the GoB announced stimulus packages. Among the manufacturing sub-sectors, the highest proportions of firms who received the package are seen for the RMG and Textiles: 57.8% of the surveyed RMGs replied that they had availed the stimulus package, whereas, in the case of Textiles, this rate is 40% (Figure 50). In Leather and Tannery, 30% of the firms received the package whereas, in the case of Food Processing and Pharmaceuticals & Chemicals, these rates are 22% and 20.8 %, respectively. The least

56
proportion of firms with stimulus packages in the manufacturing sector is observed in Light engineering: only 17.4% of the firms availed the packages. In the services sector, only 8% of the surveyed firms received the stimulus package (Table 26). Most of the recipients of the packages in this sector are from the Transport, Real Estate, Financial, Retailer and Wholesale sub-sectors. On the other hand, in the case of ICT and Telecommunication and other services, no firms availed the incentive packages.
Table 26: Firms receiving stimulus packages in the services sector
Firms receiving stimulus packages (number)
Firms receiving stimulus packages (%)
Service sector No/Don't
Know Yes Total
No/Don't Know
Yes Total
Wholesale 32 2 34 94.1% 5.9% 100.0% Retailer 41 4 45 91.1% 8.9% 100.0% Restaurant 17 1 18 94.4% 5.6% 100.0% Transport 38 2 40 95.0% 5.0% 100.0% ICT 25 0 25 100.0% 0.0% 100.0% Financial Sector 22 6 28 78.6% 21.4% 100.0% Real Estate 38 4 42 90.5% 9.5% 100.0% Other Services 18 0 18 100.0% 0.0% 100.0% Total 231 19 250 92.4% 7.6% 100.0%
Source: Authors’ estimation based on SANEM BCI (fourth round) Survey, 2020-21
Figure 50: Percentage of firms receiving benefits by sub-sectors
Source: Authors’ estimation based on SANEM BCI (fourth round) Survey, 2020-21
There is a clear pattern between firm size and the status in availing the stimulus packages (Figure 51). In the case of the micro and small firms, only 9% of the firms received the stimulus package. In contrast, 46% of the surveyed large firms and 30% of the medium firms received the benefits of the incentive packages.
58%
40%
30%
22% 21% 21%17%
10% 9%6% 6% 6% 5%
0% 0%
22%
0%
10%
20%
30%
40%
50%
60%
70%
RM
G
Text
iles
Leat
he
r
Foo
d
Fin
anci
al
Ph
arm
a
Ligh
t En
g
Re
al E
stat
e
Re
taile
r
Oth
er M
anu
Wh
ole
sale
Re
stau
ran
t
Tran
spo
rt
ICT
Oth
er
Serv All

57
Figure 51: Stimulus package receipt by firm sizes (%)
Source: Authors’ estimation based on SANEM BCI (fourth round) Survey, 2020-21
Reasons behind not availing of the stimulus packages Firms that did not avail of the stimulus package were asked to identify the reasons for not availing of the stimulus packages. The respondents were given five alternatives: strongly disagree, disagree, neither agree nor disagree, agree, and strongly agree. Afterwards, the five alternatives are further clustered into three: agree, neither agree nor disagree, and disagree (Figure 52). Many of the respondents (89% of 190 respondents) opined that the reason for not availing of the stimulus package is ‘it is not a grant rather a loan with soft terms’. Many firms (75% of 212 firms) identified that there were no packages for their industries. From 158 firms who responded to the question of lengthy procedure, 79% of them stated that the procedure delays in availing the stimulus package barred them from opting it. Another 61% of respondents (out of 168) replied that they did not avail it due to bank-related difficulties. Difficulty in obtaining information and the size of the stimulus packages were also identified as reasons hindering the firms from getting it. Among the 148 firms who responded to bribes as a hindering factor, only 7% agreed that it was one of the deterring reasons. It should be noted another 65% of the respondents replied ‘neither agree nor disagree’ as their option when asked about the bribes whereas in the case of ‘disagree’, the rate is 28%. The response rate on this indicator could be downward biased as the respondents might not feel comfortable in answering questions on bribes/corruption.
9%
30%
46%
22%
91%
70%
54%
78%
0%
20%
40%
60%
80%
100%
Micro and small(304)
Medium (54) Large (144) Total (502)
Yes No/Don't Know
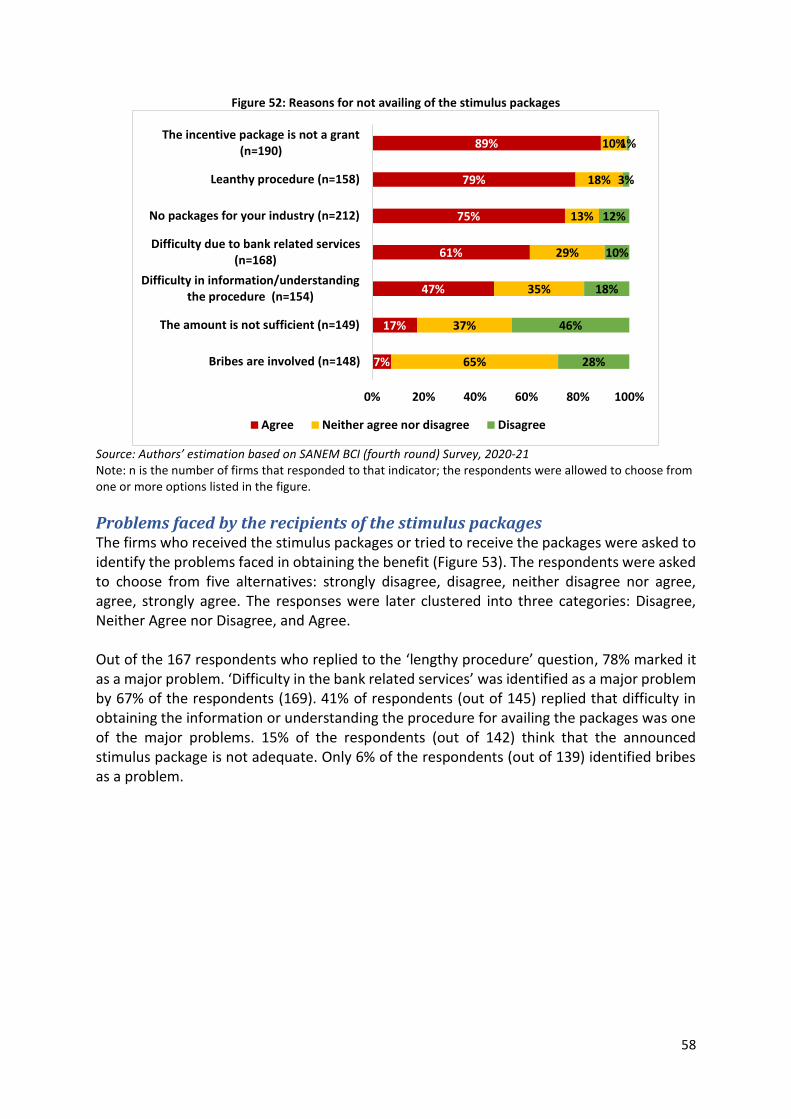
58
Figure 52: Reasons for not availing of the stimulus packages
Source: Authors’ estimation based on SANEM BCI (fourth round) Survey, 2020-21 Note: n is the number of firms that responded to that indicator; the respondents were allowed to choose from one or more options listed in the figure.
Problems faced by the recipients of the stimulus packages The firms who received the stimulus packages or tried to receive the packages were asked to identify the problems faced in obtaining the benefit (Figure 53). The respondents were asked to choose from five alternatives: strongly disagree, disagree, neither disagree nor agree, agree, strongly agree. The responses were later clustered into three categories: Disagree, Neither Agree nor Disagree, and Agree. Out of the 167 respondents who replied to the ‘lengthy procedure’ question, 78% marked it as a major problem. ‘Difficulty in the bank related services’ was identified as a major problem by 67% of the respondents (169). 41% of respondents (out of 145) replied that difficulty in obtaining the information or understanding the procedure for availing the packages was one of the major problems. 15% of the respondents (out of 142) think that the announced stimulus package is not adequate. Only 6% of the respondents (out of 139) identified bribes as a problem.
7%
17%
47%
61%
75%
79%
89%
65%
37%
35%
29%
13%
18%
10%
28%
46%
18%
10%
12%
3%
1%
0% 20% 40% 60% 80% 100%
Bribes are involved (n=148)
The amount is not sufficient (n=149)
Difficulty in information/understandingthe procedure (n=154)
Difficulty due to bank related services(n=168)
No packages for your industry (n=212)
Leanthy procedure (n=158)
The incentive package is not a grant(n=190)
Agree Neither agree nor disagree Disagree

59
Figure 53: Problems in availing stimulus packages
Source: Authors’ estimation based on SANEM BCI (fourth round) Survey, 2020-21 Note: n is the number of firms that responded to that indicator; the respondents were allowed to choose from one or more options listed in the figure.
The effectiveness of stimulus packages The respondents who received the stimulus packages were asked to mark the effectiveness of the stimulus packages that they received on a scale of 1 (very ineffective) to 5 (extremely effective). Out of the 110 stimulus package recipient firms, 25% viewed the packages as very effective, and another 58% opined it as effective (Figure 54). Only 2% of the recipients said the stimulus package was ineffective.
Figure 54: Effectiveness of the stimulus packages
Source: Authors’ estimation based on SANEM BCI (fourth round) Survey, 2020-21
6%
15%
41%
67%
78%
32%
25%
24%
9%
9%
62%
60%
34%
24%
13%
0% 20% 40% 60% 80% 100%
Asked for bribes (n=139)
The amount is not sufficient (n=142)
Difficulty in understanding the procedureof application (n=145)
Difficulty due to bank related services(n=169)
Lengthy procedure (n=167)
Agree Neither agree nor disagree Disagree
0%
2%
15%
58%
25%
Very ineffective
Ineffective
Neither effective norineffective
Effective
Very effective
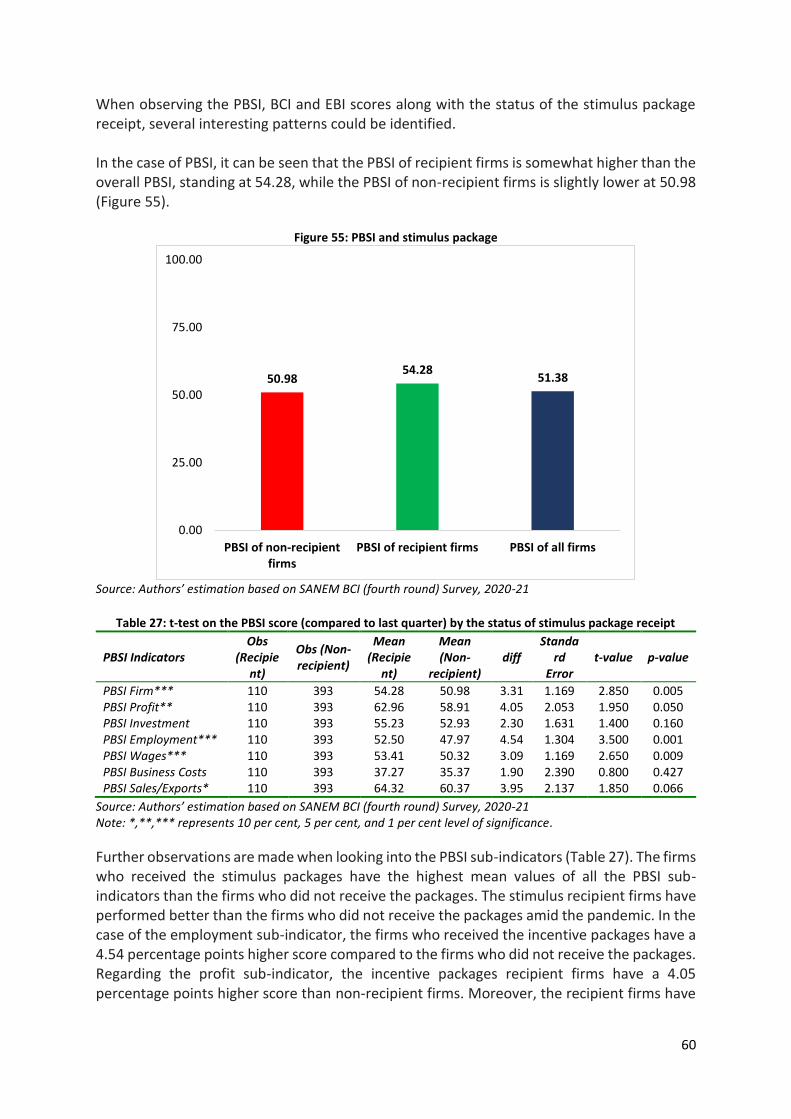
60
When observing the PBSI, BCI and EBI scores along with the status of the stimulus package receipt, several interesting patterns could be identified. In the case of PBSI, it can be seen that the PBSI of recipient firms is somewhat higher than the overall PBSI, standing at 54.28, while the PBSI of non-recipient firms is slightly lower at 50.98 (Figure 55).
Figure 55: PBSI and stimulus package
Source: Authors’ estimation based on SANEM BCI (fourth round) Survey, 2020-21
Table 27: t-test on the PBSI score (compared to last quarter) by the status of stimulus package receipt
PBSI Indicators Obs
(Recipient)
Obs (Non-recipient)
Mean (Recipie
nt)
Mean (Non-
recipient) diff
Standard
Error t-value p-value
PBSI Firm*** 110 393 54.28 50.98 3.31 1.169 2.850 0.005 PBSI Profit** 110 393 62.96 58.91 4.05 2.053 1.950 0.050 PBSI Investment 110 393 55.23 52.93 2.30 1.631 1.400 0.160 PBSI Employment*** 110 393 52.50 47.97 4.54 1.304 3.500 0.001 PBSI Wages*** 110 393 53.41 50.32 3.09 1.169 2.650 0.009 PBSI Business Costs 110 393 37.27 35.37 1.90 2.390 0.800 0.427 PBSI Sales/Exports* 110 393 64.32 60.37 3.95 2.137 1.850 0.066
Source: Authors’ estimation based on SANEM BCI (fourth round) Survey, 2020-21 Note: *,**,*** represents 10 per cent, 5 per cent, and 1 per cent level of significance.
Further observations are made when looking into the PBSI sub-indicators (Table 27). The firms who received the stimulus packages have the highest mean values of all the PBSI sub-indicators than the firms who did not receive the packages. The stimulus recipient firms have performed better than the firms who did not receive the packages amid the pandemic. In the case of the employment sub-indicator, the firms who received the incentive packages have a 4.54 percentage points higher score compared to the firms who did not receive the packages. Regarding the profit sub-indicator, the incentive packages recipient firms have a 4.05 percentage points higher score than non-recipient firms. Moreover, the recipient firms have
50.9854.28
51.38
0.00
25.00
50.00
75.00
100.00
PBSI of non-recipientfirms
PBSI of recipient firms PBSI of all firms

61
performed better on the sales/exports (3.95), wages (3.09) and business costs (1.90) sub-indicators compared to the non-recipient firms.
In the case of the BCI indicators (Table 28), the stimulus package recipient firms’ expectations regarding all scenarios, besides business costs, are higher than those of non-recipients. Overall, the business confidence of recipient firms is 4.53 percentage points higher. Confidence in terms of profit, investment and wages are also higher for recipient firms. However, the business costs sub-indicator is 0.71 percentage points lower for recipient firms, implying that the stimulus package has not been significantly effective in boosting confidence regarding business costs - which have gone up due to closures and lockdown restrictions.
Table 28: t-test on the BCI score by the status of stimulus package receipt
BCI Indicators Obs
(Recipient)
Obs (Non-recipient)
Mean (Recipie
nt)
Mean (Non-
recipient) diff
Standard
Error t-value p-value
BCI Firm*** 110 393 44.92 40.40 4.53 1.464 3.100 0.003 BCI Profit*** 110 393 41.23 38.53 2.70 0.548 4.950 0.000 BCI Investment*** 110 393 44.46 43.16 1.30 0.475 2.750 0.007 BCI Employment** 110 393 50.36 49.46 0.90 0.362 2.500 0.014 BCI Wages*** 110 393 48.73 47.30 1.43 0.260 5.500 0.000 BCI Business Costs** 110 393 30.56 31.27 -0.71 0.299 -2.350 0.018 BCI Sales/Exports** 110 393 38.47 37.07 1.40 0.662 2.100 0.036
Source: Authors’ estimation based on SANEM BCI (fourth round) Survey, 2020-21 Note: *,**,*** represents 10 per cent, 5 per cent, and 1 per cent level of significance.
Figure 56: EBI and stimulus package
Source: Authors’ estimation based on SANEM BCI (fourth round) Survey, 2020-21
An interesting pattern could also be identified when observed with the EBI scores and the status of the stimulus package receipt. A difference between stimulus package recipients and non-recipients on the EBI score is observed. The EBI score of all 503 firms stands at 47.00, while recipient firms score at 49.91. The firms who receive the incentive packages have a 2.92
46.1849.91
47.00
0.00
25.00
50.00
75.00
100.00
EBI of non-recipientfirms
EBI of recipient firms EBI of all firms

62
percentage points higher EBI score compared to the firms who did not receive the packages (Figure 56). This implies that effective implementation of stimulus packages is required to ensure a favourable business environment for the firms. The EBI scores of all sub-indicators, besides electricity, skilled workforce and trade logistics, are higher in the case of recipients (Table 29). The overall EBI of recipient firms is 49.91, greater than the non-recipient score of 46.18. Although sub-indicators like electricity and skilled workforce have higher mean scores for recipients (61.82 and 73.64), they are still lower than that of non-recipients (62.15 and 74.05) - this implies that stimulus packages have not been very useful in improving electricity and trade logistics issues, and in hiring more skilled workers. The greatest impact is seen to have been on the EBI of government support with the EBI of recipient firms being 17.16 percentage points higher, which is a good sign in terms of the effectiveness of the government’s COVID-19 related policies.
Table 29: t-test on the BCI score by the status of stimulus package receipt
EBI Indicators Obs (Recipient)
Obs (Non-Recipient)
Mean (Recipi
ent)
Mean (Non-
recipient)
Diff Stand
ard Error
t-value p-
value
EBI firms*** 110 393 49.91 46.18 3.73 1.159 3.200 0.002 EBI electricity 110 393 61.82 62.15 -0.33 2.606 -0.150 0.899 EBI tax system 110 393 47.73 46.12 1.61 2.784 0.600 0.565 EBI property registration 110 393 44.77 43.51 1.26 2.522 0.500 0.618 EBI access to finance** 110 393 45.23 39.12 6.11 2.679 2.300 0.024 EBI corruption** 110 393 41.36 34.99 6.38 2.635 2.400 0.017 EBI skilled workforce 110 393 73.64 74.05 -0.41 1.340 -0.300 0.760 EBI transport quality** 110 393 57.27 52.16 5.11 2.498 2.050 0.042 EBI trade logistics** 110 393 38.64 43.19 -4.56 2.082 -2.200 0.030 EBI government support*** 110 393 50.68 33.52 17.16 2.761 6.200 0.000 EBI covid management* 110 393 37.96 33.02 4.94 2.740 1.800 0.073
Source: Authors’ estimation based on SANEM BCI (fourth round) Survey, 2020-21

63
Section-VII: Perceptions towards Economic Recovery
The COVID-19 pandemic has caused adverse effects on economies worldwide, impacting exports, imports, production etc. significantly. While Bangladesh has been seeing some slow economic recovery after the lockdown was lifted in May 2020, there are questions as to whether the second wave of COVID-19 in 2021 will have further effects. To analyse this, in this section we take the opinions of businesses regarding their perceptions on the economic recovery – particularly before and after the second wave of COVID-19, factors that have affected economic recovery and whether firms themselves have been able to recover since the pandemic.
Firms’ perception towards overall economic recovery
Status of economic recovery The 503 firms who participated in the fourth round of the survey were asked about the kind of economic recovery they expected before and after the current upsurge of COVID-19 in 2021 (Figure 57). The respondents were asked to choose from three alternatives: strong recovery, moderate recovery, and weak recovery. Before the current upsurge, the majority of the firms surveyed (52%) opined that the Bangladeshi economy has had a moderate recovery (Figure 58). 34% of the firms had observed a strong economic recovery, while 14% observed a weak recovery. This trend takes a complete shift post the second wave of COVID-19. Now, a very large percentage (67%) of the firms expect a weak economic recovery, while 31% expect a moderate recovery. On the other hand, only 2% of the 503 firms expect a strong economic recovery.
Figure 57: Recovery stats before current upsurge
Figure 58: Recovery status after current upsurge
Source: Authors’ estimation based on SANEM BCI (fourth round) Survey, 2020-21
Weak Recovery
14%
Moderate
Recovery52%
Strong Recovery
34%
Weak Recovery
; 67%
Moderate
Recovery; 31%
Strong Recovery
; 2%

64
Before the second wave of COVID-19, 32.4% of manufacturing firms expected a strong economic recovery, while the majority (55.3%) expected a moderate recovery (Table 30). Looking into the specific sub-sectors, Pharmaceuticals and Chemicals firms expected a strong recovery the most (45.8%), while Food Processing and Electronics and Light Engineering firms had the highest expectations of moderate recovery (65.9% and 65.2%, respectively). On the other hand, Leather & Tannery had the highest expectation of weak recovery (30%).
Table 30: Recovery status before current COVID-19 upsurge in the manufacturing sector
Status of economic recovery (number)
Status of economic recovery (%)
Manufacturing sector Weak Moderate Strong Total Weak Moderate Strong Total RMG 8 46 29 83 9.6% 55.4% 34.9% 100.0% Textiles 4 26 15 45 8.9% 57.8% 33.3% 100.0% Leather and Tannery 6 8 6 20 30.0% 40.0% 30.0% 100.0% Pharmaceuticals and Chemicals
5 8 11 24 20.8% 33.3% 45.8% 100.0%
Food Processing 4 27 10 41 9.8% 65.9% 24.4% 100.0% Electronics and Light Engineering
3 15 5 23 13.0% 65.2% 21.7% 100.0%
Other Manufacturing 1 10 6 17 5.9% 58.8% 35.3% 100.0% Total 31 140 82 253 12.3% 55.3% 32.4% 100.0%
Source: Authors’ estimation based on SANEM BCI (fourth round) Survey, 2020-21
The aforementioned trends took a shift after the second wave of COVID-19 (Table 31). Overall, 70% of the surveyed manufacturing firms expect a weak recovery, while only 28.1% and 2% expect moderate and strong recoveries. Now, most sub-sectors do not even consider the chance of strong economic recovery - Food Processing has the highest rate at 4.9%, which is still extremely low. RMG and Other Manufacturing firms have the highest percentages of moderate recovery expectations, with rates of 37.3% and 35.3%, respectively. In all sub-sectors, weak economic recovery is the most dominating expectation - it is the highest in Electronics and Light Engineering (91.3%) and Leather & Tannery (85%).
Table 31: Recovery status after current COVID-19 upsurge in the manufacturing sector
Status of economic recovery (number)
Status of economic recovery (%)
Manufacturing sector Weak Moderate Strong Total Weak Moderate Strong Total RMG 51 31 1 83 61.4% 37.3% 1.2% 100.0% Textiles 29 15 1 45 64.4% 33.3% 2.2% 100.0% Leather and Tannery 17 3 0 20 85.0% 15.0% 0.0% 100.0% Pharmaceuticals and Chemicals
17 6 1 24 70.8% 25.0% 4.2% 100.0%
Food Processing 31 8 2 41 75.6% 19.5% 4.9% 100.0% Electronics and Light Engineering
21 2 0 23 91.3% 8.7% 0.0% 100.0%
Other Manufacturing 11 6 0 17 64.7% 35.3% 0.0% 100.0% Total 177 71 5 253 70.0% 28.1% 2.0% 100.0%
Source: Authors’ estimation based on SANEM BCI (fourth round) Survey, 2020-21
Like the manufacturing sector, we also observe the status of economic recovery in the services sector (Table 32). Before the second wave of COVID-19, 34.8% of services firms expected a strong economic recovery, while the majority (49.2%) expected a moderate recovery. Among the sub-sectors, the largest portion of Financial sector firms expected a

65
strong recovery (42.9%), while the highest rates of moderate recovery were seen in Restaurant (66.7%) and Real Estate firms (59.5%). Wholesale firms were the least optimistic, with 26.5% of them expecting a weak recovery.
Table 32: Recovery status before current COVID-19 upsurge in the services sector
Status of economic recovery (number)
Status of economic recovery (%)
Service sector Weak Moderate Strong Total Weak Moderate Strong Total Wholesale 9 14 11 34 26.5% 41.2% 32.4% 100.0% Retailer 7 19 19 45 15.6% 42.2% 42.2% 100.0% Restaurant 1 12 5 18 5.6% 66.7% 27.8% 100.0% Transport 9 17 14 40 22.5% 42.5% 35.0% 100.0% ICT 5 12 8 25 20.0% 48.0% 32.0% 100.0% Financial Sector 0 16 12 28 0.0% 57.1% 42.9% 100.0% Real Estate 5 25 12 42 11.9% 59.5% 28.6% 100.0% Other services 4 8 6 18 22.2% 44.4% 33.3% 100.0% Total 40 123 87 250 16.0% 49.2% 34.8% 100.0%
Source: Authors’ estimation based on SANEM BCI (fourth round) Survey, 2020-21
After the current COVID-19 upsurge (Table 33), 65.2% of the surveyed services firms expect a weak recovery, while only 33.2% and 1.6% expect moderate and strong recoveries. Similar to the manufacturing sector, most sub-sectors do not even consider the chance of strong economic recovery - Real Estate has the highest rate at 4.8%, which is still extremely low. Financial and ICT & Telecommunication firms have the highest percentages of moderate recovery expectations, with rates of 57.1% and 36% respectively. In all sub-sectors besides Financial, weak economic recovery is also the most dominating expectation, highest in Other Services (77.8%) and Wholesale (73.5%).
Table 33: Recovery status after current COVID-19 upsurge in the services sector
Status of economic recovery (number)
Status of economic recovery (%)
Service sector Weak Moderate Strong Total Weak Moderate Strong Total Wholesale 25 9 0 34 73.5% 26.5% 0.0% 100.0% Retailer 31 13 1 45 68.9% 28.9% 2.2% 100.0% Restaurant 12 6 0 18 66.7% 33.3% 0.0% 100.0% Transport 26 14 0 40 65.0% 35.0% 0.0% 100.0% ICT 16 9 0 25 64.0% 36.0% 0.0% 100.0% Financial Sector 11 16 1 28 39.3% 57.1% 3.6% 100.0% Real Estate 28 12 2 42 66.7% 28.6% 4.8% 100.0% Other services 14 4 0 18 77.8% 22.2% 0.0% 100.0% Total 163 83 4 250 65.2% 33.2% 1.6% 100.0%
Source: Authors’ estimation based on SANEM BCI (fourth round) Survey, 2020-21
When looking at these results in terms of the size of the firms surveyed, we can observe a pattern. Before the current upsurge (Figure 59), more large and medium firms had expected a strong economic recovery than micro and small firms (39% and 50%, compared to 29%). However, the percentage of firms expecting a moderate recovery was quite similar across all firm sizes.

66
Figure 59: Recovery before current upsurge by firm sizes
Source: Authors’ estimation based on SANEM BCI (fourth round) Survey, 2020-21
On the other hand, after the current upsurge, it is seen that most of the firms across all firm sizes expect a weak recovery (Figure 60). Micro and small and medium firms are very close, with 73% and 72% (respectively) of firms expecting a weak recovery and 26% of both expecting a moderate recovery. Large firms, however, are more optimistic with 54% expecting a weak recovery and 43% expecting a moderate recovery.
Figure 60: Recovery after current upsurge by firm sizes
Source: Authors’ estimation based on SANEM BCI (fourth round) Survey, 2020-21
Contributing factors to the overall economic recovery Firms were asked to identify the level of contribution to the overall economy of multiple indicators. The respondents were given four options: strong, moderate, low and no contribution (Figure 61). Many respondents (61% of 473 firms) stated that foreign remittances had a strong contribution to the overall economic recovery, while 31% thought it had a moderate
14%
7%
2%
19%
52%
54%
48%
52%
34%
39%
50%
29%
0% 20% 40% 60% 80% 100%
Total
Large
Medium
Micro and Small
Weak Recovery Moderate Recovery Strong Recovery Total
68%
54%
72%
73%
31%
43%
26%
26%
2%
3%
2%
1%
0% 20% 40% 60% 80% 100%
Total
Large
Medium
Micro and Small
Weak Recovery Moderate Recovery Strong Recovery Total

67
contribution. 46% and 40% of 450 firms opined that the export of goods and services had a strong contribution and moderate contribution (respectively) to economic recovery. 35% of 464 firms think that bank’s credit to the private sector had a strong contribution, while 44% think that it had a moderate contribution. In terms of the vaccination programme, while 35% of 480 firms stated that it had a strong contribution, 30% and 25% thought that it had a moderate and low contribution to economic recovery. In the other indicators, moderate to low contribution seems to be the dominating opinion. 39% of 484 firms think that the management of the 2nd wave of COVID-19 has had a low contribution to economic recovery, in comparison to 28% and 24% of firms stating that it has had a strong and moderate contribution. Out of 435 firms surveyed, 38% feel that the import of raw materials, goods and services has had a moderate contribution, followed by 33% stating that the contribution was low. Most notably, 41% of 470 firms opined that the existing stimulus package and its disbursement had a low contribution - which should be taken into account in government policies for the current upsurge. The social protection programme has the highest percentage in zero contribution (14% of 459 firms) and the lowest percentage in high contribution (11%).
Figure 61: Contributing factors to the overall economic recovery
Source: Authors’ estimation based on SANEM BCI (fourth round) Survey, 2020-21
Firms have actually been able to recover themselves The fourth round of the survey introduces a new element for analysis – firms’ perceived self-recovery, i.e. to what extent they have recovered to their pre-pandemic state. To understand this, the surveyed firms were asked to state a percentage to measure how much they have recovered. The results have been compiled into seven ranges: 0% recovery, 1-25% recovery, 26-50% recovery, 51-75% recovery, 76-99% recovery, 100% recovery and greater than 100% recovery (Figure 62).
It is observed that the majority (25.8%) of the firms have recovered to 51-75% of their pre-pandemic state. 19.3% of the firms have had 76-99% recovery, 16.9% have observed 26-50%
61%
46%
35%
35%
28%
23%
19%
11%
31%
40%
44%
30%
24%
38%
30%
37%
8%
10%
18%
25%
39%
33%
41%
38%
0%
3%
2%
10%
9%
6%
10%
14%
0% 10% 20% 30% 40% 50% 60% 70% 80% 90% 100%
Foreign Remittances (N=473)
Export of goods and services (N=450)
Bank’s credit to the private sector (N=464)
Vaccination programme (N=480)
Management of current upsurge/2nd wave incovid-19 (N=484)
Import of raw materials, goods, and services(N=435)
Existing stimulus package and its disbursement(N=470)
Social protection programme (N=459)
Strong Contribution Moderate Contribution Low Contribution No Contribution
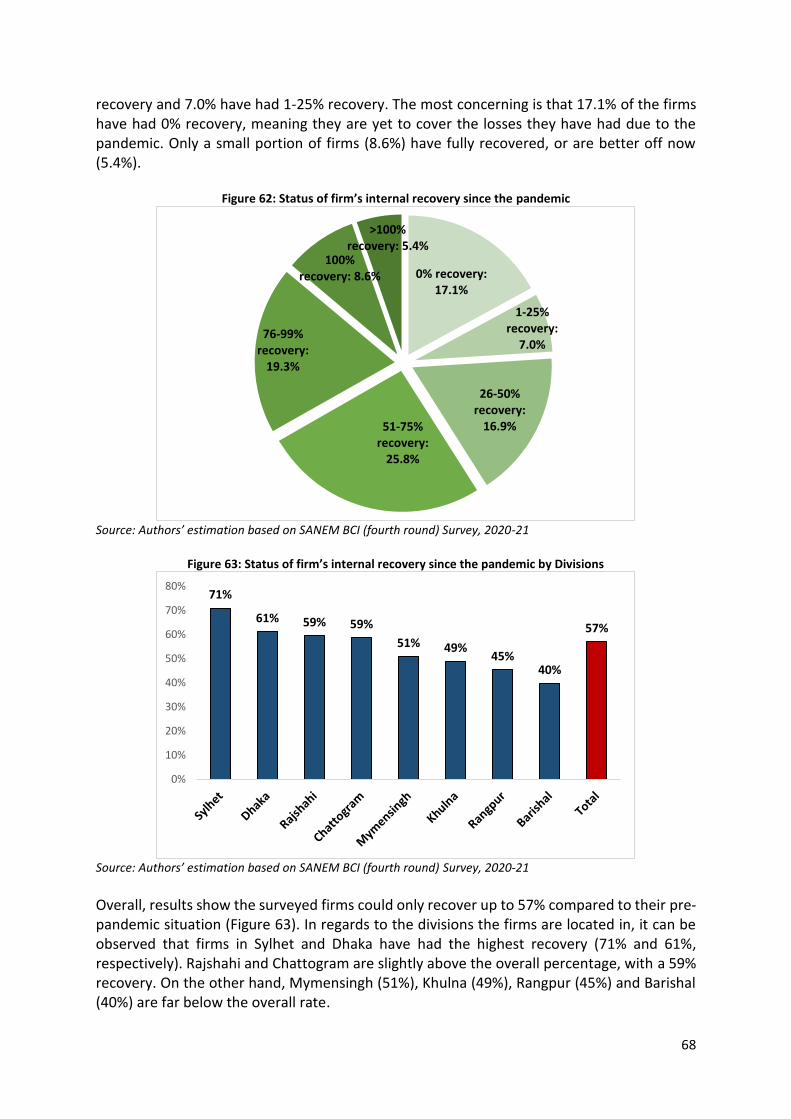
68
recovery and 7.0% have had 1-25% recovery. The most concerning is that 17.1% of the firms have had 0% recovery, meaning they are yet to cover the losses they have had due to the pandemic. Only a small portion of firms (8.6%) have fully recovered, or are better off now (5.4%).
Figure 62: Status of firm’s internal recovery since the pandemic
Source: Authors’ estimation based on SANEM BCI (fourth round) Survey, 2020-21
Figure 63: Status of firm’s internal recovery since the pandemic by Divisions
Source: Authors’ estimation based on SANEM BCI (fourth round) Survey, 2020-21
Overall, results show the surveyed firms could only recover up to 57% compared to their pre-pandemic situation (Figure 63). In regards to the divisions the firms are located in, it can be observed that firms in Sylhet and Dhaka have had the highest recovery (71% and 61%, respectively). Rajshahi and Chattogram are slightly above the overall percentage, with a 59% recovery. On the other hand, Mymensingh (51%), Khulna (49%), Rangpur (45%) and Barishal (40%) are far below the overall rate.
0% recovery:17.1%
1-25%recovery:
7.0%
26-50%recovery:
16.9%51-75%recovery:
25.8%
76-99%recovery:
19.3%
100%recovery: 8.6%
>100%recovery: 5.4%
71%
61% 59% 59%
51% 49%45%
40%
57%
0%
10%
20%
30%
40%
50%
60%
70%
80%

69
Further observations can be made when comparing this to the recovery made in terms of firm sizes. It can be seen that large firms have recovered 77.3% of their pre-pandemic state, while medium firms have recovered 63.6% (Figure 64). However, micro and small firms are still worse off as they have recovered only 46.9% - much below the overall value.
Figure 64: Status of firm’s internal recovery since the pandemic by firm sizes
Source: Authors’ estimation based on SANEM BCI (fourth round) Survey, 2020-21
In terms of sectors, most sectors are still below the overall percentage of economic recovery (Figure 65). The largest recoveries were observed for the Financial sector (73%), Pharmaceuticals (72%), RMG (67%), and Textile (66%). Other Manufacturing (61%) and Food Processing (57%) marginally reach the overall level.
Figure 65: Status of firm’s internal recovery since the pandemic by sub-sectors
Source: Authors’ estimation based on SANEM BCI (fourth round) Survey, 2020-21
Sectors like Restaurant (55%), Real Estate (54%) and ICT & Telecommunication (53%) are all below the overall economic recovery, with Leather & Tannery (52%), Retailer (50%), Other Services (47%) Transportation (42%), and Light Engineering (38%) being much lower.
46.9
63.6
77.3
0.0
10.0
20.0
30.0
40.0
50.0
60.0
70.0
80.0
90.0
Micro and Small Medium Large
73% 72%67% 66%
61%57% 56% 55% 54% 53% 52% 50%
47%42%
38%
57%
0%
10%
20%
30%
40%
50%
60%
70%
80%
Fin
anci
al
Ph
arm
a
RM
G
Te
xtile
s
Oth
er M
anu
Foo
d
Wh
ole
sale
Re
stau
ran
t
Re
al E
stat
e
ICT
Leat
he
r
Re
taile
r
Oth
er S
erv
Tran
spo
rt
Ligh
t En
g
All

70
We also look into firms’ internal recovery since the pandemic in terms of their export status (Figure 66). It can be seen that exporter firms have had a much higher recovery (68.8%) in comparison to non-exporter firms (50.2%), who are far below the overall rate.
Figure 66: Status of firm’s internal recovery since the pandemic by export status
Source: Authors’ estimation based on SANEM BCI (fourth round) Survey, 2020-21
Firms that have received stimulus packages also have a much higher recovery rate (72.4%) (Figure 67). However, firms that have not received stimulus packages have a significantly lower rate of internal recovery (53.1%).
Figure 67: Status of firm’s internal recovery since the pandemic by the recipient of the stimulus package
Source: Authors’ estimation based on SANEM BCI (fourth round) Survey, 2020-21
50.2%
68.8%
57.4%
0.0%
10.0%
20.0%
30.0%
40.0%
50.0%
60.0%
70.0%
80.0%
Recovery of non-exporter
Recovery of exporter Recovery of all firms
53.1%
72.4%
57.4%
0.0%
10.0%
20.0%
30.0%
40.0%
50.0%
60.0%
70.0%
80.0%
Recovery of non-recipient firms
Recovery of recipeintfirms
Recovery of all firms

71
Section-VIII: Factors Influencing PBSI: A Panel Data Approach
The Present Business Status Index (PBSI) over quarter basically shows the business status in the country in the current quarter compared to the immediate past quarter. As observed in section IV, the PBSI (quarter) has improved over the quarters. It might be the case that performance of earlier quarter could play a crucial role to have better PBSI in the following quarter. Section IV also shows that PBSI varies across the firms. In section V, we observe a positive relationship between PBSI and EBI. As discussed in section VI, the firms who received the stimulus packages have the highest mean values of all the PBSI sub-indicators than the firms who did not receive the packages. Based on the findings, a deeper investigation is required on several key research questions, such as -
o Does size matter in a firm’s performance in terms of the Present Business Index (PBSI)?
o Do firms, who received the stimulus packages, perform better than others? o Does a friendlier business environment help perform better in terms of PBSI?
In this regard, the panel fixed effect model has been used to explore the potential relationships amongst the variables.
Regression model Since there are four rounds of surveys, a panel fixed effect model has been considered for the present exercise. As an assumed fixed effect, we impose time-invariant impact for each variable that is possibly correlated with explanatory variables (Gujarati, 2006; Gujarati & Porter, 2009). Fixed-effects model controls for all time-invariant differences between the firms or individuals. As a result, the estimated coefficients of the fixed-effects models can be unbiased because of omitted time-invariant characteristics (Pakko & Wall, 2001; Plümper & Troeger, 2007; Bevan & Danbolt, 2007; Davies, Ionascu, & Kristjánsdóttir, 2008; Kripfganz & Schwarz, 2015; Bell, Fairbrother, & Jones, 2018). In the presence of dummy variables, the least square dummy variable (LSDV) approach provides the fixed effect estimate (Venkadasalam, 2014; Adeleke, Binuomote, & Adeleke, 2020; Abdulwakil, Abdul-Rahim, & Alsaleh, 2020; Okoroafor, Okechukwu, Anuonye, & Uka, 2020). Therefore, the following regression equation is estimated:
𝑃𝐵𝑆𝐼𝑖𝑡 = 𝛽1𝑋𝑖𝑡 + 𝑎𝑖 + 𝑢𝑖𝑡
Where, 𝑃𝐵𝑆𝐼𝑖𝑡 = PBSI (quarter) of firm i, in quarter t 𝛽 = 𝑉𝑒𝑐𝑡𝑜𝑟 𝑜𝑓 𝑐𝑜𝑒𝑓𝑓𝑖𝑐𝑖𝑒𝑛𝑡𝑠 𝑓𝑜𝑟 𝑡ℎ𝑒 𝑒𝑥𝑝𝑙𝑎𝑛𝑎𝑡𝑜𝑟𝑦 𝑣𝑎𝑟𝑖𝑎𝑏𝑙𝑒 𝑋𝑖𝑡 = 𝑉𝑒𝑐𝑡𝑜𝑟 𝑜𝑓 𝑒𝑥𝑝𝑙𝑎𝑛𝑎𝑡𝑜𝑟𝑦 𝑣𝑎𝑟𝑖𝑎𝑏𝑙𝑒𝑠 𝑎𝑖 = 𝐹𝑖𝑟𝑚 𝑠𝑝𝑒𝑐𝑖𝑓𝑖𝑐 𝑖𝑛𝑑𝑖𝑣𝑖𝑑𝑢𝑎𝑙𝑖𝑠𝑡𝑖𝑐 𝑒𝑓𝑓𝑒𝑐𝑡𝑠 𝑢𝑖𝑡 = 𝐸𝑟𝑟𝑜𝑟 𝑡𝑒𝑟𝑚
All the regressions control for time fixed effects. Table 34 provides the list of explanatory variables with descriptions.
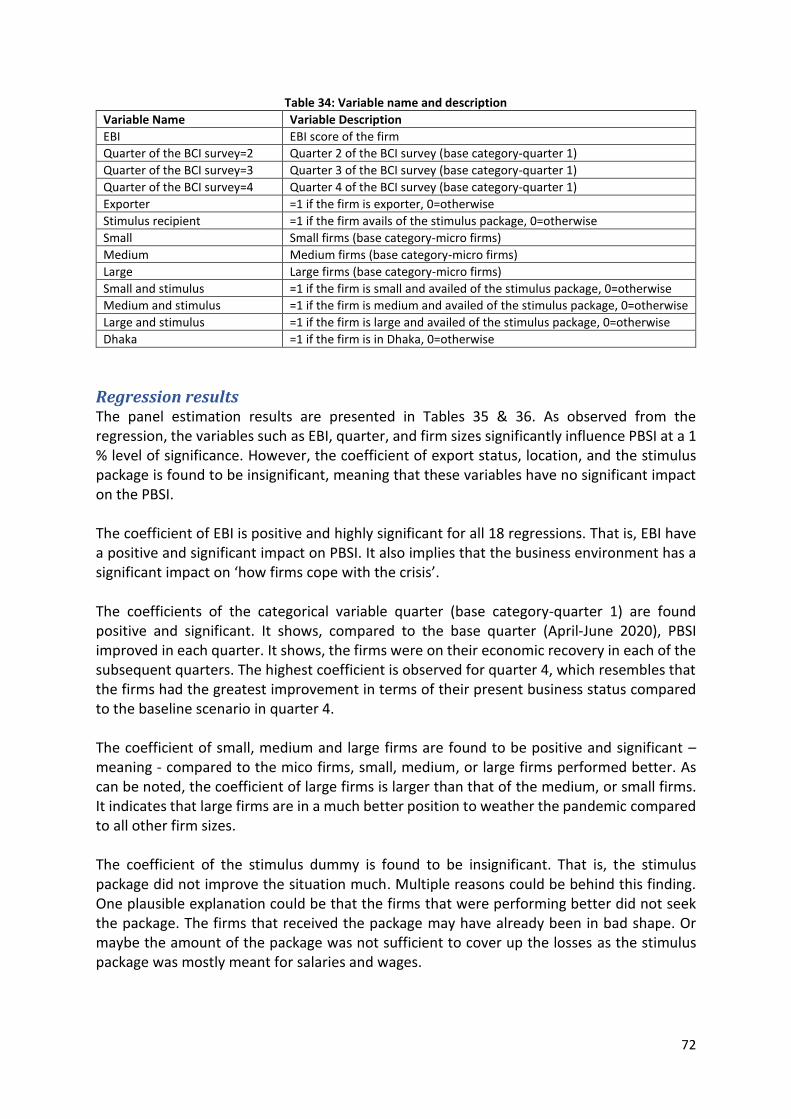
72
Table 34: Variable name and description
Variable Name Variable Description
EBI EBI score of the firm
Quarter of the BCI survey=2 Quarter 2 of the BCI survey (base category-quarter 1)
Quarter of the BCI survey=3 Quarter 3 of the BCI survey (base category-quarter 1)
Quarter of the BCI survey=4 Quarter 4 of the BCI survey (base category-quarter 1)
Exporter =1 if the firm is exporter, 0=otherwise
Stimulus recipient =1 if the firm avails of the stimulus package, 0=otherwise
Small Small firms (base category-micro firms)
Medium Medium firms (base category-micro firms)
Large Large firms (base category-micro firms)
Small and stimulus =1 if the firm is small and availed of the stimulus package, 0=otherwise
Medium and stimulus =1 if the firm is medium and availed of the stimulus package, 0=otherwise
Large and stimulus =1 if the firm is large and availed of the stimulus package, 0=otherwise
Dhaka =1 if the firm is in Dhaka, 0=otherwise
Regression results The panel estimation results are presented in Tables 35 & 36. As observed from the regression, the variables such as EBI, quarter, and firm sizes significantly influence PBSI at a 1 % level of significance. However, the coefficient of export status, location, and the stimulus package is found to be insignificant, meaning that these variables have no significant impact on the PBSI. The coefficient of EBI is positive and highly significant for all 18 regressions. That is, EBI have a positive and significant impact on PBSI. It also implies that the business environment has a significant impact on ‘how firms cope with the crisis’. The coefficients of the categorical variable quarter (base category-quarter 1) are found positive and significant. It shows, compared to the base quarter (April-June 2020), PBSI improved in each quarter. It shows, the firms were on their economic recovery in each of the subsequent quarters. The highest coefficient is observed for quarter 4, which resembles that the firms had the greatest improvement in terms of their present business status compared to the baseline scenario in quarter 4. The coefficient of small, medium and large firms are found to be positive and significant – meaning - compared to the mico firms, small, medium, or large firms performed better. As can be noted, the coefficient of large firms is larger than that of the medium, or small firms. It indicates that large firms are in a much better position to weather the pandemic compared to all other firm sizes. The coefficient of the stimulus dummy is found to be insignificant. That is, the stimulus package did not improve the situation much. Multiple reasons could be behind this finding. One plausible explanation could be that the firms that were performing better did not seek the package. The firms that received the package may have already been in bad shape. Or maybe the amount of the package was not sufficient to cover up the losses as the stimulus package was mostly meant for salaries and wages.
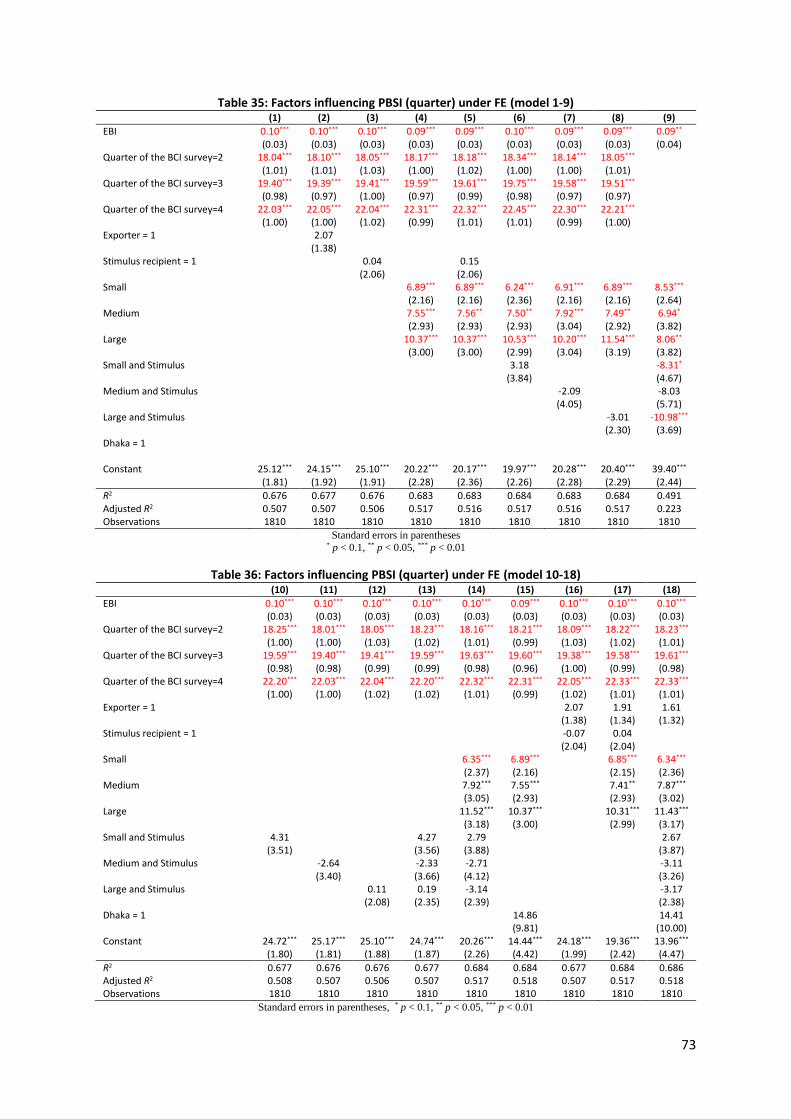
73
Table 35: Factors influencing PBSI (quarter) under FE (model 1-9) (1) (2) (3) (4) (5) (6) (7) (8) (9)
EBI 0.10*** 0.10*** 0.10*** 0.09*** 0.09*** 0.10*** 0.09*** 0.09*** 0.09** (0.03) (0.03) (0.03) (0.03) (0.03) (0.03) (0.03) (0.03) (0.04) Quarter of the BCI survey=2 18.04*** 18.10*** 18.05*** 18.17*** 18.18*** 18.34*** 18.14*** 18.05*** (1.01) (1.01) (1.03) (1.00) (1.02) (1.00) (1.00) (1.01) Quarter of the BCI survey=3 19.40*** 19.39*** 19.41*** 19.59*** 19.61*** 19.75*** 19.58*** 19.51*** (0.98) (0.97) (1.00) (0.97) (0.99) (0.98) (0.97) (0.97) Quarter of the BCI survey=4 22.03*** 22.05*** 22.04*** 22.31*** 22.32*** 22.45*** 22.30*** 22.21*** (1.00) (1.00) (1.02) (0.99) (1.01) (1.01) (0.99) (1.00) Exporter = 1 2.07 (1.38) Stimulus recipient = 1 0.04 0.15 (2.06) (2.06) Small 6.89*** 6.89*** 6.24*** 6.91*** 6.89*** 8.53*** (2.16) (2.16) (2.36) (2.16) (2.16) (2.64) Medium 7.55*** 7.56** 7.50** 7.92*** 7.49** 6.94* (2.93) (2.93) (2.93) (3.04) (2.92) (3.82) Large 10.37*** 10.37*** 10.53*** 10.20*** 11.54*** 8.06** (3.00) (3.00) (2.99) (3.04) (3.19) (3.82) Small and Stimulus 3.18 -8.31* (3.84) (4.67) Medium and Stimulus -2.09 -8.03 (4.05) (5.71) Large and Stimulus -3.01 -10.98*** (2.30) (3.69) Dhaka = 1 Constant 25.12*** 24.15*** 25.10*** 20.22*** 20.17*** 19.97*** 20.28*** 20.40*** 39.40*** (1.81) (1.92) (1.91) (2.28) (2.36) (2.26) (2.28) (2.29) (2.44)
R2 0.676 0.677 0.676 0.683 0.683 0.684 0.683 0.684 0.491 Adjusted R2 0.507 0.507 0.506 0.517 0.516 0.517 0.516 0.517 0.223 Observations 1810 1810 1810 1810 1810 1810 1810 1810 1810
Standard errors in parentheses * p < 0.1, ** p < 0.05, *** p < 0.01
Table 36: Factors influencing PBSI (quarter) under FE (model 10-18) (10) (11) (12) (13) (14) (15) (16) (17) (18)
EBI 0.10*** 0.10*** 0.10*** 0.10*** 0.10*** 0.09*** 0.10*** 0.10*** 0.10*** (0.03) (0.03) (0.03) (0.03) (0.03) (0.03) (0.03) (0.03) (0.03) Quarter of the BCI survey=2 18.25*** 18.01*** 18.05*** 18.23*** 18.16*** 18.21*** 18.09*** 18.22*** 18.23*** (1.00) (1.00) (1.03) (1.02) (1.01) (0.99) (1.03) (1.02) (1.01) Quarter of the BCI survey=3 19.59*** 19.40*** 19.41*** 19.59*** 19.63*** 19.60*** 19.38*** 19.58*** 19.61*** (0.98) (0.98) (0.99) (0.99) (0.98) (0.96) (1.00) (0.99) (0.98) Quarter of the BCI survey=4 22.20*** 22.03*** 22.04*** 22.20*** 22.32*** 22.31*** 22.05*** 22.33*** 22.33*** (1.00) (1.00) (1.02) (1.02) (1.01) (0.99) (1.02) (1.01) (1.01) Exporter = 1 2.07 1.91 1.61 (1.38) (1.34) (1.32) Stimulus recipient = 1 -0.07 0.04 (2.04) (2.04) Small 6.35*** 6.89*** 6.85*** 6.34*** (2.37) (2.16) (2.15) (2.36) Medium 7.92*** 7.55*** 7.41** 7.87*** (3.05) (2.93) (2.93) (3.02) Large 11.52*** 10.37*** 10.31*** 11.43*** (3.18) (3.00) (2.99) (3.17) Small and Stimulus 4.31 4.27 2.79 2.67 (3.51) (3.56) (3.88) (3.87) Medium and Stimulus -2.64 -2.33 -2.71 -3.11 (3.40) (3.66) (4.12) (3.26) Large and Stimulus 0.11 0.19 -3.14 -3.17 (2.08) (2.35) (2.39) (2.38) Dhaka = 1 14.86 14.41 (9.81) (10.00) Constant 24.72*** 25.17*** 25.10*** 24.74*** 20.26*** 14.44*** 24.18*** 19.36*** 13.96*** (1.80) (1.81) (1.88) (1.87) (2.26) (4.42) (1.99) (2.42) (4.47)
R2 0.677 0.676 0.676 0.677 0.684 0.684 0.677 0.684 0.686 Adjusted R2 0.508 0.507 0.506 0.507 0.517 0.518 0.507 0.517 0.518 Observations 1810 1810 1810 1810 1810 1810 1810 1810 1810
Standard errors in parentheses, * p < 0.1, ** p < 0.05, *** p < 0.01

74
Section-IX: Conclusion and Policy Recommendations
The impact of COVID-19 on Bangladesh’s economy in 2020 had been widespread, followed by the rise in cases and the subsequent lockdown, economic shocks such as business losses, shutdowns, loss of employment and income, and rising inequality were all observed. However, in the latter half of the year, the economy was slowly moving towards recovery. This progress has been somewhat interrupted in 2021 - the ongoing “second wave” and another nationwide lockdown, combined with uncertainties regarding vaccination, have again amplified the detrimental effects of the pandemic and has become an obstacle for businesses to overcome in order to reach recovery. To support the recovery process, the government had previously initiated and disbursed stimulus packages to local firms. Furthermore, while not much progress was made in terms of vaccination before the second wave, the government has recently been successful in negotiating with other countries for more doses of the vaccine - which is the first step towards the socio-economic situation returning to normal. Whether the government’s measures are effective will largely depend on close monitoring of the private sector, especially during these unpredictable times, to address business issues and update both policies and stimulus packages to best suit the needs of individual sectors and the economy whole.
In this respect, this study convened a survey of 503 firms across the country (253 manufacturing; 250- services sector firms). Seven sub-sectors in the manufacturing industry and eight sub-sectors in the services industry were identified based on Bangladesh’s latest available National Accounts Statistics. The survey covers RMG, Textiles, Pharmaceuticals, Leather and Tannery, Light Engineering, Food Processing, etc. in the manufacturing sector. In the Services sector, this study covers Wholesales, Retailers, Restaurants, Transport, ICT and Telecommunication, Financial Sectors, Real Estate, etc. The number of firms to be surveyed for each of the sub-sectors was chosen based on the sub-sectors contribution to the GDP.
Based on the survey responses, this study constructs four indices, namely – (i) Present Business Status Index in January-March 2021 compared to October-December 2020, (ii) Present Business Status Index in January-March 2021 compared to January-March 2020, (iii) Business Confidence Index for April-June 2021 compared to January-March 2021 and (iv) Enabling Business-Environment Index (EBI). The indices are first prepared at the firm level and later aggregated to the sub-sectoral and sectoral level incorporating appropriate weights.
There have been some improvements in overall business status in January-March 2021 compared to the business status in October-December 2020 - while the increase is not as significant as that seen between July-September 2020 and April-June 2020, it is a greater change compared to the one seen in the previous round of the survey. The PBSI (quarter) score has finally gone above 50, which means that firms are in a better position in January-March 2021 compared to the previous quarter. This is the same case when comparing the business status to that of the same quarter in 2020 - although the score remains below 50. This implies that, despite improvements, firms have not recovered to their pre-pandemic status. Sectors are experiencing recovery at varying paces. Faster recovery is taking place in the Pharmaceuticals and Chemicals, and Financial sectors.
Profitability, investment, and sales/export indicators have shown consistent improvement in PBSI throughout the four rounds of the survey. The business cost indicator, which had gone
75
down in the previous round, has had significant improvement. On the other hand, employment and wage indicators have seen slight decreases.
The business confidence for April-June 2021 shows a significant decline over business confidence in January-March 2020. This is quite concerning, as there had been consistent increases in the BCI in all the previous rounds. Even in the sub-indicators, all of them have seen a decrease in their BCI scores for the April-June 2021 quarter compared to the previous quarter. A possible explanation for this fall in business confidence is the second wave of COVID-19 taking place in 2021, along with fears of new variants of the disease spreading in the country.
The EBI scores in all four rounds are found between 25 and 50, indicating that the overall business environment is unfavourable for the firms. However, there is some hope in the fourth round - while the EBI score previously decreased in the third round, it has increased in the January-March 2021 quarter. Similar trends are seen in the sub-indicators, where most of them have had increases in their EBI scores.
There has been a sequential decline in the gap between expectations and reality amongst the firms. In this round, BCI scores were lower than the PBSI scores for the first time. Thus, the ratio between BCI and PBSI fell below 1 for most of the firms.
Before the current upsurge of COVID-19 (in March 2021), 34% of the firms thought that the economy was on a strong recovery, while 14% of the firms stated it was on a weak recovery, and 52% thought it was on a moderate recovery.
After the current upsurge of the COVID-19, only 2% of the firms stated that the economy would be on a strong recovery, 68% thought it would be on a weak recovery, and 31% thought it would be on a moderate recovery.
The firms, on average, have been able to recover themselves by 57% of the damages that occurred during the pandemic (March 2020 – March 2021). Most notably, the Financial sector has been able to recover 73% of their damages, followed by Pharmaceuticals and Chemicals (72%), RMG (67%), and Textiles (66%), amongst others. This shows that the firms have not gone back to the pre-pandemic situation as of yet.
In the fourth round, around 69% of the surveyed firms have not received a stimulus package. Among the overall stimulus package recipients, 57.8% of RMG firms received the package while no ICT & Telecommunication and Other Services firms received it. In terms of firm size, only 9% of micro and small firms have received the package, while 46% of large firms were recipients.
Like the previous rounds of the survey, recipients of the packages faced problems due to lengthy procedures, difficulty in bank services, and procedural application systems. Those who did not receive it said that the incentive package is not a grant, no package for the industry, procedural and bank-related difficulties. No significant improvements were observed on these indicators.
Based on the survey findings and results, the study suggests the following sets of policy recommendations to be adopted with priority:
76
Creating an annual budget that is COVID-19 focused: In the previous fiscal year, the proposed budget could not take into account the widespread and detrimental effects of COVID-19 on the economy, as the planning process likely took place before the pandemic. However, it is crucial that this year’s budget reflects the impact of COVID-19 and presents policies that are targeted towards healthcare and economic recovery.
Lowering the implicit/indirect costs for the businesses: Implicit or indirect costs indirectly increase the overall business costs. The higher the implicit/indirect costs, the lower the overall business performance of the firms. Higher EBI, perhaps, indicates lesser indirect and implicit costs borne by a firm. It also represents lower business risks. Therefore, the government must focus on improving the overall business environment to lower such implicit/indirect costs of business operation.
Increasing the tax net and automation in tax collection: Due to the negative impacts of the pandemic on economic growth and private sector investment, the 2020-21 budget is far behind on its revenue target - this may lead to an increase in pressure on existing taxpayers to gain greater revenue. To combat this, taxation agencies should be given targets to increase the tax net every year. Furthermore, full automation of VAT and direct taxes would aid in solving the issue of corruption present in this process.
Making a proper database on the business community: To sustain and revive the overall business environment amid the COVID-19 pandemic, a proper database for all the categories like employees’ list, wage list, employees’ different allowance list, etc. is crucial because it can give us a proper concept about the business community. Based on the information from the database, the GoB can easily undertake the necessary strategies and monitor the overall business situation. So, the GoB should undertake a policy framework to create the proper database and prepare a common platform on which all types of data will be available. The database will be very helpful for the policy-makers to understand the overall business environment and to design relevant & contemporary policies.
Focusing on appropriate policy formulation and design: The GoB should formulate appropriate policies to create a business-friendly environment amid the pandemic to retain and increase the business confidence of the business community, especially during the ongoing second wave and the resulting decrease in BCI scores. The GoB should adopt strong monetary and fiscal policies to increase investment and create new job opportunities, to stimulate overall economic activities. The GoB should start a combined discussion with the private sector to renew their confidence in terms of recovery, which has gone down significantly due to the current upsurge. To revitalise the economy's supply side, the GoB should focus on domestic demand generation and robust supply chain management for the businesses.
Strong support needed for the Micro and Small firms: As observed in the survey, MSMEs were least successful in availing a stimulus package compared to the large firms. The barriers to access to stimulus packages by the small and medium firms need to be identified and solved. The survey has shown that the business status of the stimulus package recipient firms is more favourable compared to the non-recipient firms. The recipient firms are performing relatively well compared to the non-recipient firms. It implies that the stimulus packages should be expanded and modified with a long-term plan as soon as possible to revive the
77
MSME sector of the country. The requirements and procedures of getting the packages should be simplified and easier.
Assessment and proper monitoring of the stimulus package need to be ensured: It is important to assess the efficacy of the stimulus packages and bring on any required modifications and expansions, especially in the context of the second wave of COVID-19. A mere announcement of the stimulus packages will not be an adequate measure to aid businesses to overcome the negative effects of the ongoing COVID-19 pandemic. Though the GoB has made a timely release of the funds so far, businesses (particularly MSMEs) could not manage to receive the monetary benefits and utilize them on time due to barriers in the form of corruption, banking non-transparencies, information asymmetries and a complex taxation system. Thus, the GoB should conduct an assessment about the proper implementation of the stimulus packages to identify the ineffectiveness in the processes and institutional arrangements.
Access to the stimulus package needs to be eased: As has been observed in this study as well as in many media reports, banks are less interested in disbursing the incentive packages to the medium, small, and micro firms. In many cases, the incentive packages have only been disbursed to the banks' existing customers and there is also a strong bank-client relationship between the banks and the large firms. Bangladesh Bank needs to provide a guideline to the banks in disbursing the loans to the medium, small, and firms, which could include setting a rule to pay out stimulus packages in terms of GDP contribution of firms of such size and firms in the informal sector. All problems against access to finance identified and relevant policy support should be ensured. The post-pandemic policy criteria of the bank-client relationship should be simplified. Moreover, in Bangladesh, many business entities remain outside of the formal banking system. The Bangladesh Bank can undertake necessary measures in collaboration with the National Board of Revenue (NBR) in devising a policy so that all business enterprises come under the financial sector network and the non-banking firms are given the opportunities to get the loan facilities amid the crisis. Furthermore, non-profit organisations (NGOs) and trade bodies can also be engaged to monitor whether the banks are disbursing the stimulus packages efficiently.
Friendlier business policies should be on focus: There has been a sequential change in the gap between expectations and reality amongst the firms – in this round, we see that the gap has decreased substantially. Since the pandemic has now taken a more predictable path, the firms' expectations are now more aligned to reality. The firms would be more responsive to policy changes now than before – a window the government must capitalize.
78
References Abdulwakil, M. M., Abdul-Rahim, A. S., & Alsaleh, M. (2020). Bioenergy efficiency change and its
determinants in EU-28 region: Evidence using Least Square Dummy Variable corrected estimation. Biomass & Bioenergy.
Adeleke, O., Binuomote, S. O., & Adeleke, H. (2020). Estimating The Effect Of Production Factors On Agricultural Output In ECOWAS: Using Least Square Dummy Variable (Fixed Effects) Model. International Journal of Innovative Research and Advanced Studies (IJIRAS).
Becker, G. (2000). Creating Comparability among Reliability Coefficients: The Case of Cronbach Alpha and Cohen Kappa. SAGE.
Bell, A., Fairbrother, M., & Jones, K. (2018). Fixed and random effects models: making an informed choice. Springer, 1051–1074.
Bevan, A., & Danbolt, J. (2007). Testing for inconsistencies in the estimation of UK capital structure determinants. Applied Financial Economics, Pages 55-66.
Bland, J. M., & Altman, D. G. (1997). Statistics notes: Cronbach's alpha. Retrieved from https://www.bmj.com/CONTENT/314/7080/572?VARIANT=FULL-TEXT%3E
Davies, R. B., Ionascu, D., & Kristjánsdóttir, H. (2008). Estimating the Impact of Time-Invariant Variables on FDI with Fixed Effects. Review of World Economics, 381–407.
Ercan, I., Yazici, B., Sigirli, D., Ediz, B., & Kan, I. (2007). Examining Cronbach Alpha, Theta, Omega Reliability Coefficients According to Sample Size. Journal of Modern Applied Statistical Methods.
Gujarati, D. N. (2006). Essentials of Econometrics. New York: Mcgraw-hill. Gujarati, D. N., & Porter, D. C. (2009). Basic Econometrics. New York: Mcgraw-hill. Heo, M., Kim, N., & Faith, M. S. (2015). Statistical power as a function of Cronbach alpha of instrument
questionnaire items. BMC Medical Research Methodology. Kocak, C., Egrioglu, E., Yolcu, U., & Aladag, C. H. (2014). Computing Cronbach Alpha Reliability
Coefficient for Fuzzy Survey Data. American Journal of Intelligent Systems, 204-213. Kripfganz, S., & Schwarz, C. (2015). Estimation of linear dynamic panel data models with time-invariant
regressors. European Central Bank (ECB). OECD. (2005). Building up a Real Sector Business Confidence Index for Turkey. OECD Workshop on
International Development of Business and Consumer tendency surveys, Brussels. Okoroafor, I. B., Okechukwu, C. N., Anuonye, R. C., & Uka, C. O. (2020). APPLICATION OF LEAST SQUARE
DUMMY VARIABLE (LSDV) IN ESTIMATION. European Journal of Statistics and Probability, 35-38.
Pakko, M. R., & Wall, H. J. (2001). Reconsidering the Trade-Creating Effects of a Currency Union. Social Science Research Network.
Plümper, T., & Troeger, V. E. (2007). Efficient Estimation of Time-Invariant and Rarely Changing Variables in Finite Sample Panel Analyses with Unit Fixed Effects. Cambridge University Press, pp. 124-139 (16 pages).
Quansah, F. (2017). The Use Of Cronbach Alpha Reliability Estimate In Research Among Students In Public Universities In Ghana. African Journal of Teacher Education, 6.
Venkadasalam, S. (2014). Implementation of Goods and Service Tax Implementation of Goods and Service Tax Implementation of Goods and Service Tax Implementation of Goods and Service Tax Implementation of Goods and Service Tax Implementation of Goods and Service Tax Implementation. International Conference on Economics, Education and Humanities (ICEEH'14) Dec. 10-11.

79
Annexe: Questionnaire for the Business Confidence Index (BCI) Survey
The Global Economy is passing through an unprecedented crisis. Bangladesh is no different. The economic crisis fuelled by COVID-19 has been proven to be unpredictable and rapidly evolving. During such economic downturns, close monitoring of the private sector is warranted. This is primarily because, for any economy, private investment is one of the fundamental sources of economic expansion. Recovery from economic downturns caused by the pandemic would require a revamped rejuvenation of the private sector. Unless and otherwise, the business community in a country are assured of their returns, along with assurances of risk minimizations, no country can revive from economic recessions. SANEM and The Asia Foundation (TAF) have jointly taken the initiative to measure the condition of business confidence in Bangladesh quarterly. SANEM is a renowned Think Tank and Research Organisation based in Dhaka, Bangladesh. The Asia Foundation is a leading non-profit international development organisation working for improving lives across developing Asia. Meanwhile, SANEM and TAF have successfully conducted three rounds of the business confidence survey in July 2020, October 2020 & January 2021 respectively. Based on the survey responses, three consecutive workshops were arranged on August 2020, November 2020 & February 2021, and findings of the surveys were communicated to renowned economists and policymakers in the country. We will now conduct the fourth round of the survey, which will begin on 4 April 2021 and will be completed by 14 April 2021. This round is very crucial to compare the opinions of the business community with the previous rounds and to have their expectations in the next round.
As a business insider, once again your opinions have become extremely important during such crises. Your perceptions regarding the overall business scenario are extremely valuable in understanding what policy revisions are required, and where further policy deepening is essential. It will take a maximum of 10-15 minutes to complete this survey. We are most grateful to you for making this time amidst your busy schedule. Your valuable insights are essential in this endeavour. We assure you that your all responses, including your personal and firm details, will be kept strictly confidential. All your responses will only be used for the purpose of research.
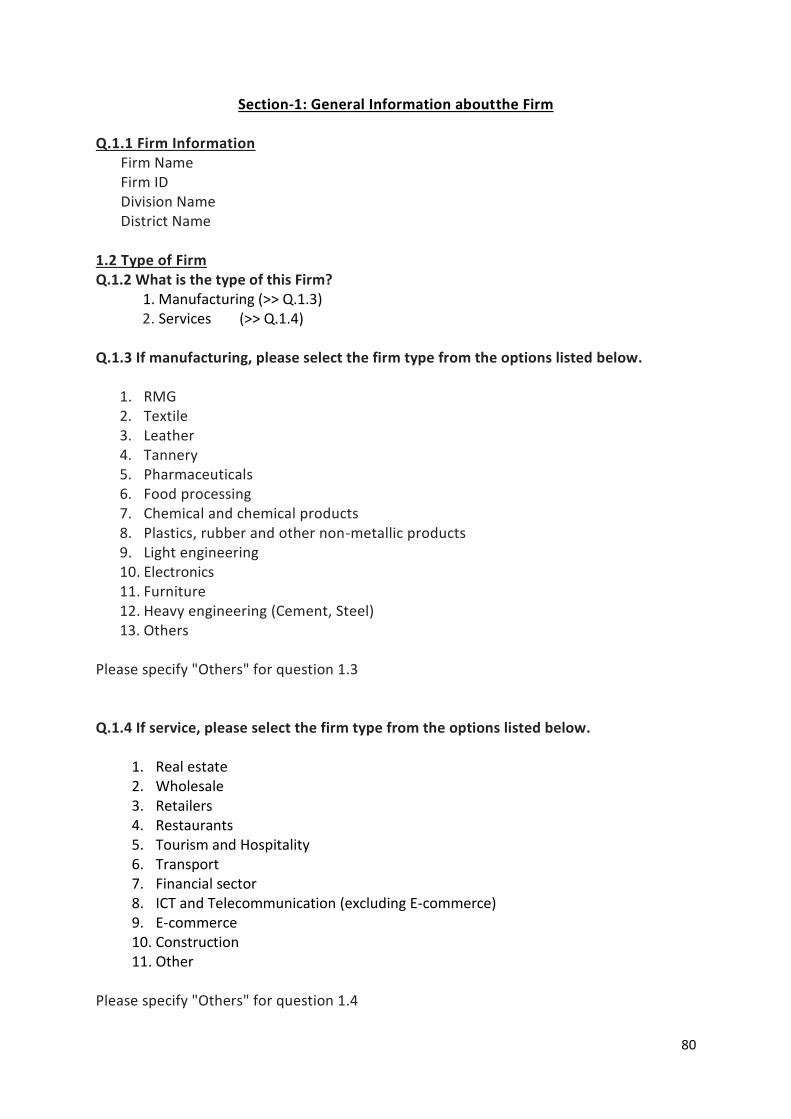
80
Section-1: General Information aboutthe Firm
Q.1.1 Firm Information
Firm Name
Firm ID Division Name District Name
1.2 Type of Firm Q.1.2 What is the type of this Firm? 1. Manufacturing (>> Q.1.3) 2. Services (>> Q.1.4) Q.1.3 If manufacturing, please select the firm type from the options listed below.
1. RMG 2. Textile 3. Leather 4. Tannery 5. Pharmaceuticals 6. Food processing 7. Chemical and chemical products 8. Plastics, rubber and other non-metallic products 9. Light engineering 10. Electronics 11. Furniture 12. Heavy engineering (Cement, Steel) 13. Others
Please specify "Others" for question 1.3 Q.1.4 If service, please select the firm type from the options listed below.
1. Real estate 2. Wholesale 3. Retailers 4. Restaurants 5. Tourism and Hospitality 6. Transport 7. Financial sector 8. ICT and Telecommunication (excluding E-commerce) 9. E-commerce 10. Construction 11. Other
Please specify "Others" for question 1.4

81
1.5(a) Firm Contact Information
Mailing Address Phone Number
Do you agree to start the interview now? 1. Yes (>> Respondent’s Contact Details; Start the Interview) 2. No (>> 10; Thank the contact person and conclude the interview)
1.5(b) Respondent's Contact Details Respondent's Name Respondent's gender Respondent's designation in the Firm Mobile Number of the respondent Email Address Number of years in Firm 1.6 Location of the Firm Q.1.6 where is the Firm located? 1. EPZ/SEZ 2. Industrial Park/ Industrial Area 3. Outside of the above-mentioned locations 1.7 Firm Ownership Q.1.7 What is the type of ownership of the Firm?
1. Government ownership 2. Domestic Private company 3. Public-Private joint ownership 4. Domestic-Foreign joint venture 5. Foreign Ownership
1.8 [Female ownership in the Firm] Q.1.8 Is this establishment owned by a female [partially/fully]? 1. Fully owned by a female
2. Partial female ownership 3. No female share or ownership 1.9 Year of Establishment Q.1.9 In which year was the Firm established?

82
Section-2: Financial Condition or Profitability
Respondents should choose the option that suits their perception best. Here, all the options are scaled between 0 and 100. Much worse is equivalent to 0; 'Worse' is 25; 'Same as before' is 50; 'Better' is 75; and 'Much better' is 100. Q.2.1 How was your profit in January to March (2021) compared to October to December
(2020)?
o Much worse [0] o Worse [25] o Same as before [50] o Better [75] o Much better [100]
Q.2.2 How was your profit in January to March (2021) compared to January to March (2020)?
o Much worse [0] o Worse [25] o Same as before [50] o Better [75] o Much better [100]
Q.2.3 Compared to January to March (2021), what is your expectation about profit in April to June (2021)?
o Much worse [0] o Worse [25] o Same as before [50] o Better [75] o Much better [100]

83
Section-3: Investment Situation
Respondents should choose the option that suits their perception best. Here, all the options are scaled between 0 and 100. Much worse is equivalent to 0; 'Worse' is 25; 'Same as before' is 50; 'Better' is 75; and 'Much better' is 100. Q.3.1 How was your investment scenario in January to March (2021) compared to October
to December (2020)?
o Much worse [0] o Worse [25] o Same as before [50] o Better [75] o Much better [100]
Q.3.2 How was your investment scenario in January to March (2021) compared to January
to March (2020)?
o Much worse [0] o Worse [25] o Same as before [50] o Better [75] o Much better [100]
Q.3.3 Compared to January to March (2021), what is your expectation about the investment scenario in April to June (2021)?
o Much worse [0] o Worse [25] o Same as before [50] o Better [75] o Much better [100]

84
Section-4: Employment Situation Respondents should choose the option that suits their perception best. Here, all the options are scaled between 0 and 100. Much worse is equivalent to 0; 'Worse' is 25; 'Same as before' is 50; 'Better' is 75; and 'Much better' is 100. Q.4.1 How many permanent employees do you have NOW (April 2021)? (Record in number) Q.4.2 How many of the permanent employees are females (April 2021)? (Record in number) Q.4.3 How was your overall employment scenario in your organization in January to
March (2021) compared to October to December (2020)?
o Much worse [0] o Worse [25] o Same as before [50] o Better [75] o Much better [100]
Q.4.4 How was your overall employment scenario in your organization in January to March (2021) compared to January to March (2020)?
o Much worse [0] o Worse [25] o Same as before [50] o Better [75] o Much better [100]
Q.4.5 Compared to January-March (2021), what is your expectation about the overall
employment scenario in your organization in April to June (2021)?
o Much worse [0] o Worse [25] o Same as before [50] o Better [75] o Much better [100]

85
Section-5: Wages Situation
Respondents should choose the option that suits their perception best. Here, all the options are scaled between 0 and 100. Much worse is equivalent to 0; 'Worse' is 25; 'Same as before' is 50; 'Better' is 75; and 'Much better' is 100. Q.5.1 How was the salary/wages of the workers/employees in your organization in
January to March (2021) compared to October to December (2020)?
o Much worse [0] o Worse [25] o Same as before [50] o Better [75] o Much better [100]
Q.5.2 How was the salary/wages of the workers/employees in your organization in
January to March (2021) compared to January to March (2020)?
o Much worse [0] o Worse [25] o Same as before [50] o Better [75] o Much better [100]
Q.5.3 Compared to January to March (2021), what is your expectation about the
salary/wages of the workers/employees in your organization in April to June (2021)?
o Much worse [0] o Worse [25] o Same as before [50] o Better [75] o Much better [100]

86
Section-6: Business Costs Respondents should choose the option that suits their perception best. Here, all the options are scaled between 0 and 100. Business cost 'Increased a lot' is equivalent to 0; 'Increased' is 25; 'Same as before' is 50; 'Decreased' is 75; and 'Decreased a lot' is 100. Q.6.1 How was your overall business cost in January to March (2021) compared to October
to December (2020)?
o Increased a lot [0] o Increased [25] o Same as before [50] o Decreased [75] o Decreased a lot [100]
Q.6.2 How was your overall business cost in January to March (2021) compared to January to March (2020)?
o Increased a lot [0] o Increased [25] o Same as before [50] o Decreased [75] o Decreased a lot [100]
Q.6.3 Compared to January-March (2021), what do you expect regarding your overall business cost in April to June (2021)?
o Increase a lot [0] o Increase [25] o Same as before [50] o Decrease [75] o Decrease a lot [100]

87
Section-7: Sales or Exports
Respondents should choose the option that suits their perception best. Here, all the options are scaled between 0 and 100. Export/Sales order 'Decreased a lot' is equivalent to 0; 'Decreased' is 25; 'Same as before' is 50; 'Increased' is 75; and 'Increased a lot' is 100. Q.7.1. What is the share of export in your total sales? (Write in Percentage, %: 0% to 100%)
Q.7.2 How was your sales/export order in January to March (2021) compared to October
to December (2020)?
o Decreased a lot [0] o Decreased [25] o Same as before [50] o Increased [75] o Increased a lot [100]
Q.7.3 How was your sales/export order in January to March (2021) compared to January to March (2020)?
o Decreased a lot [0] o Decreased [25] o Same as before [50] o Increased [75] o Increased a lot [100]
Q.7.4 Compared to January-March (2021), what is your expectation about sales/export orders in April to June (2021)?
o Decrease a lot [0] o Decrease [25] o Same as before [50] o Increase [75] o Increase a lot [100]

88
Section 8: Stimulus Packages and Business Environment Q.8.1 Have you availed of any of the announced incentive packages?
1. Yes (>>Q.8.2) 2. No (>>Q.8.3) 3. I do not know whether my company availed stimulus package or not (>>Q.8.7)
Q 8.2 How many times did you receive the stimulus package?
1. Once (>>Q.8.4>>Q.8.5>>Q.8.7) 2. Twice (>>Q.8.4>>Q.8.5>>Q.8.7) 3. More than twice(>>Q.8.4>>Q.8.5>>Q.8.7)
Q.8.3 Have you tried to avail any of the announced stimulus packages?
1. Yes (>>Q.8.4>>Q.8.7) 2. No (>>Q.8.6>>Q.8.7)
Q.8.4 What problems did you face in availing/pursuing the incentive package (Multiple selections possible)
Options Strongly Disagree (1)
Disagree (2) Neither agree nor disagree (3)
Agree (4) Strongly Agree (5)
a. The amount is not sufficient
b. Asked for bribes
c. Lengthy procedure
d. Difficulty in understanding the procedure of application
e. Difficulty due to Bank collateral/Bank related services
f. Others [Specify ]
Please specify "Others" for question 8.4 Q.8.5 On a scale of 1 (Very ineffective) to 5 (extremely effective), in your view, how effective are the incentive packages for your industry as a whole?
1. Very ineffective 2. Ineffective 3. Neither effective nor ineffective 4. Slightly effective 5. Extremely effective

89
Q.8.6 What are the reasons for you not to avail the incentive package/try to avail the incentive package (Multiple selections)
Options Strongly Disagree (1)
Disagree(2) Neither agree nor disagree (3)
Agree (4)
Strongly Agree (5)
a. No package for your industry (in your knowledge)
b. The incentive package is basically a loan with a low interest rate/ This is not a grant
c. The amount is not sufficient
d. Bribes are involved
e. Lengthy procedure
f. Difficulty in information/ understanding the procedure of application
g. Difficulty due to Bank collateral/Bank related services
h. Others [Specify]
Please specify "Others" for question 8.6

90
Q.8.7 On a scale of 1 to 6, at present how much favourable are the following indicators for your overall business performance (here, 1 represents extremely unfavourable to business, and 6 represents extremely favourable to business)
Options Extremely unfavourable (1)
Moderately unfavourable (2)
Slightly unfavourable (3)
Slightly favourable (4)
Moderately favourable (5)
Extremely favourable (6)
Electricity (connection and quality)
Overall Tax System
Business or property Registration
Access to finance
Corruption
Availability of skilled workers
Transport quality
Trade Logistics (Port and Customs)
Overall government support for your industry
Management of the COVID-19 crisis (health sector and economy)
Section 9: Path to Economic Recovery
Q.9.1 Before the current COVID-19 upsurge, what kind of economic recovery did you observe?
1. Strong Recovery 2. Moderate Recovery 3. Weak Recovery
Q.9.2 Now, after the current COVID-19 upsurge, what kind of economic recovery do you expect to see?
1. Strong Recovery 2. Moderate Recovery 3. Weak Recovery

91
Q.9.3 Under the current situation, according to your opinion, what are the contribution of the following factors to the overall economic recovery of the country?
Indicators Strong Moderate Low No Contribution
Not applicable /don’t know
Bank’s credit to the private sector
Foreign Remittances
Import of raw materials, goods, and services
Export of goods and services
Existing stimulus package and its disbursement
Social protection programme
Management of current upsurge/ 2nd wave in covid-19
Vaccination programme
Q.9.4 Overall, compared to the pre-pandemic situation in March 2020, to what extent you have been able to recover your business in March 2021? [Write in percentage %: 0% to any positive %]. If the business expands, it can be more than 100.
Section-10: Interviewer details 10.1 Enumerator Name 10.2 Enumerator's ID number 10.3 Enumerator’s Comment

SANEM, launched in January 2007 in Dhaka, is anon-profit research organization registered withthe Registrar of Joint Stock Companies and Firms inBangladesh. It is also a network of economists andpolicymakers with a special emphasis on economicmodeling. SANEM aims to promote objective andhigh quality research in the areas of internationaltrade, macroeconomy, poverty, labour market,environment, political economy and economicmodeling. SANEM contributes to governments’policy-making by providing research supports bothat individual and organizational capacities. SANEMhas maintained strong research collaboration withglobal, regional and local think-tanks, research anddevelopment organizations, universities, andindividual researchers. SANEM arranges regulartraining programs on economic modeling andcontemporary economic issues.
SANEM Publications252/3, North Goran, KhilgaonDhaka - 1219, Bangladesh