i. introduction - cpcb
TRANSCRIPT
AAccttiioonn PPllaann
FFoorr
AAbbaatteemmeenntt ooff PPoolllluuttiioonn
iinn rreessppeecctt ooff
FFaarriiddaabbaadd TToowwnn
PPrreeppaarreedd bbyy
HHaarryyaannaa SSttaattee PPoolllluuttiioonn CCoonnttrrooll BBooaarrdd - 0 -

I. INTRODUCTION
1
LIST OF ABBREVIATIONS USED CPCB Central Pollution Control Board HSPCB Haryana State Pollution Control Board CEPI Comprehensive Environmental Pollution Index HUDA Haryana Urban Development Authority RTA Regional Transport Authority NHAI National Highway Authority of India DMRC Delhi Metro Rail Corporation MCF Municipal Corporation Faridabad HSIIDC Haryana State Industrial Infrastructure Development Corporation PHED Public Health Engineering Department HEMS Haryana Environment Management Society CHWTSDF Common Hazardous Waste Treatment Storage and Disposal Facility MSWTSDF Municipal Solid Waste Treatment Storage and Disposal Facility ECBC Energy Conservation Building Code ETP Effluent Treatment Plant STP Sewerage Treatment Plant CETP Common Effluent Treatment Plant CNG Compressed Natural Gas PNG Pipe Natural Gas BOD Bio Chemical Oxygen Demand COD Chemical Oxygen Demand
2
1. INTRODUCTION
The Central Pollution Control Board carried out Comprehensive Environmental Pollution Index Assessment (CEPI) Study in association with Indian Institute of Technology, Delhi for 88 Industrial Clusters in the country. Based on the study 43 Industrial Clusters have been declared as Critically Polluted having CEPI of more than 70 and the District Faridabad has been listed at the 18th place.
The District Faridabad has been adjudged with high CEPI score of 77.07 and has been declared as one of the Critically Polluted Industrial Cluster by Central Pollution Control Board. The Haryana State Pollution Control Board envisages preparing a Draft Action Plan for Abetment of Pollution in respect of Faridabad Town Comprehensive Environmental Pollution Abatement Action Plan in order to make Faridabad a better place to live and work.
Faridabad, a major industrial city of Haryana state was founded in 1607 by Shaikh Farid, treasurer of Jahangir, with the object of protecting the highway which passed through the town. Shaikh Farid built a fort, a tank and a mosque, which are in ruins. Later, it becomes the headquarters of a pargana which was held in jagir by the Ballabgarh ruler. Faridabad became 12th district of Haryana State on 15th August 1979.
1.1 Area Detail including brief history (background information)
Faridabad District adjoins Delhi on its south-eastern side having total area of 742.90 sq. km. and Municipal Area of 208 sq. km. It is located at 28° 25' 16" North Latitude and 77° 18' 28" East Longitude. It is bounded by the National Capital Territory of Delhi on its North. Delhi-Mathura National Highway No. 2 passes through the centre of the district. Faridabad is famous for Henna Production on agriculture sector while Tractors, Motorcycles, Textile Dyeing & Printing, Switch Gears, Refrigerators, Shoes and Tyres are other famous industrial products of the District. Badkhal Lake tourist complex, Suraj Kund Tourist Complex, Aravalli Golf Club & Raja Nahar Singh Palace are the famous tourist spots. Faridabad is the oldest Industrial City of the State & has further grown enormously during the last few years, particularly because a large number of industries have come up in the town. All these developments are associated with intense pressure on the receiving Environment. The rapid growth of the city also brought immigrants from other parts of the country. People from UP, Rajasthan, Bihar and Bengal increased the population size of Faridabad District.
1.2 Location Municipal Area 208 Sq.Km Geographical 28° 25' 16" North Latitude Coordinates 77° 18' 28" East Longitude Distance from River 12 Km Yamuna Distance from National 30 Km Capital Delhi
3
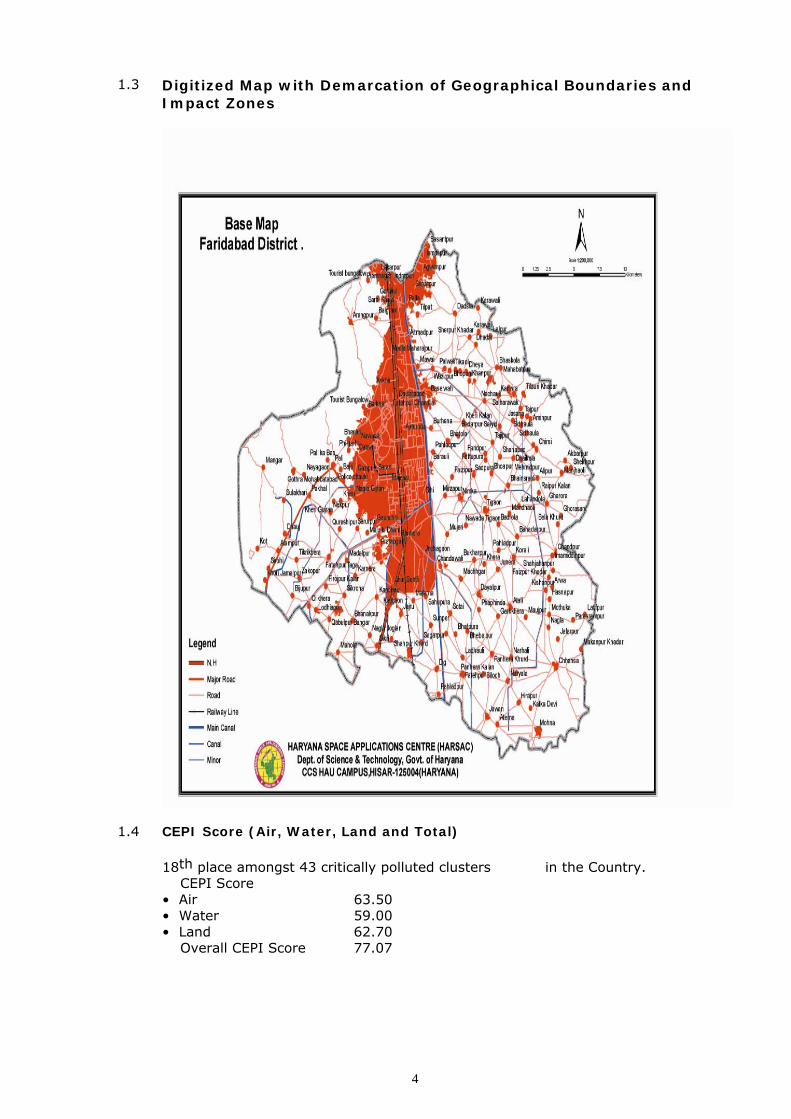
1.3 Digitized Map with Demarcation of Geographical Boundaries and Impact Zones
1.4 CEPI Score (Air, Water, Land and Total) 18th place amongst 43 critically polluted clusters in the Country. � CEPI Score • Air 63.50 • Water 59.00 • Land 62.70 � Overall CEPI Score 77.07
4
1.5 Total population and sensitive receptors (hospital, educational institutions, courts etc) residing in the area comprising of geographical area of the cluster and its impact zone (minimum 2 km) Faridabad was initially planned for 3 lac people (300, 000) but the total population in the Municipal area is over 15.25 lacs. No. of Hospitals existing for than 50 beds = 16 No. of Educational Institutions = 19 No. of Courts = 01
1.6 Eco-geological features Impact Zones [the area comprising of geographical area of the cluster and its impact zone (minimum 2 km)] Badkhal Lake, Suraj Kund, Aravali Hills
1.6.1 Major Water Bodies (Rivers, Lakes, ponds, etc.) Badkhal Lake, Suraj Kund, River Yamuna, Agra Canal, Gurgaon Canal
1.6.2 Ecological parks, Sanctuaries, flora and fauna or any eco sensitive zones. Aravali Hills is situated in the western side of Faridabad District and is a ecologically very sensitive and fragile zone.
1.6.3 Buildings or Monuments of Historical/ archaeological/ religious importance Raja Nahar Singh Palace, Rani Ka Chatri
5
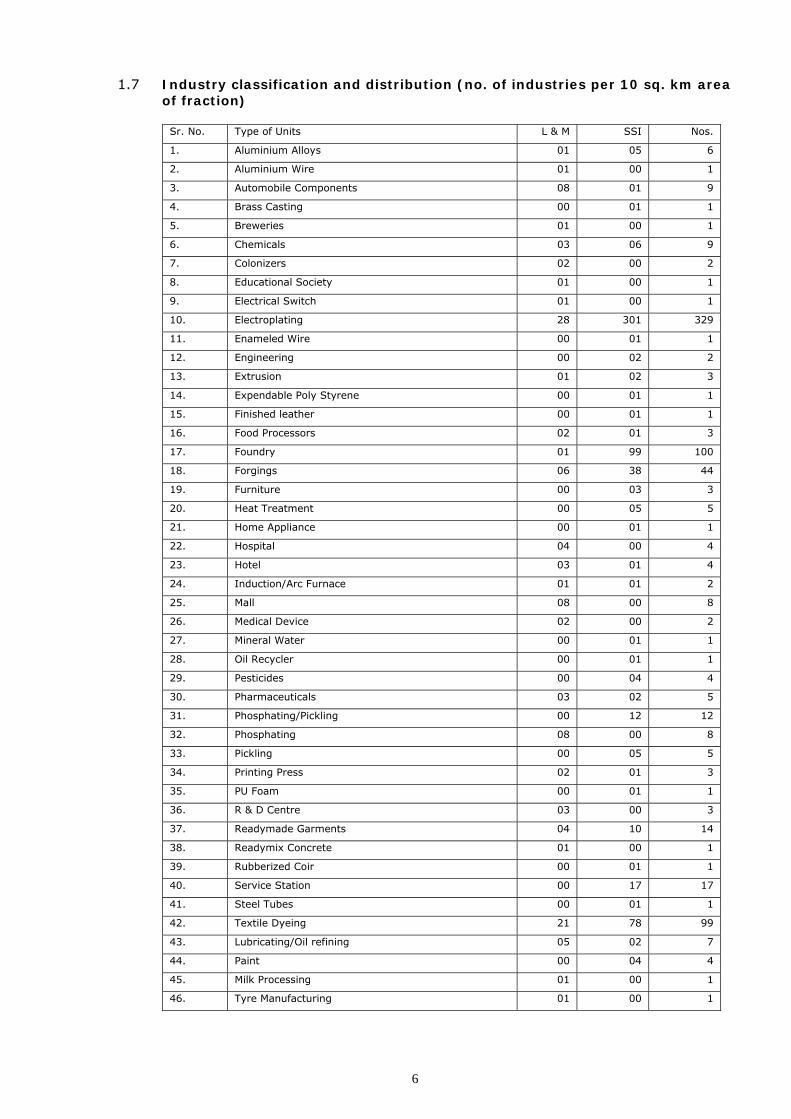
1.7 Industry classification and distribution (no. of industries per 10 sq. km area of fraction)
Sr. No. Type of Units L & M SSI Nos.
1. Aluminium Alloys 01 05 6
2. Aluminium Wire 01 00 1
3. Automobile Components 08 01 9
4. Brass Casting 00 01 1
5. Breweries 01 00 1
6. Chemicals 03 06 9
7. Colonizers 02 00 2
8. Educational Society 01 00 1
9. Electrical Switch 01 00 1
10. Electroplating 28 301 329
11. Enameled Wire 00 01 1
12. Engineering 00 02 2
13. Extrusion 01 02 3
14. Expendable Poly Styrene 00 01 1
15. Finished leather 00 01 1
16. Food Processors 02 01 3
17. Foundry 01 99 100
18. Forgings 06 38 44
19. Furniture 00 03 3
20. Heat Treatment 00 05 5
21. Home Appliance 00 01 1
22. Hospital 04 00 4
23. Hotel 03 01 4
24. Induction/Arc Furnace 01 01 2
25. Mall 08 00 8
26. Medical Device 02 00 2
27. Mineral Water 00 01 1
28. Oil Recycler 00 01 1
29. Pesticides 00 04 4
30. Pharmaceuticals 03 02 5
31. Phosphating/Pickling 00 12 12
32. Phosphating 08 00 8
33. Pickling 00 05 5
34. Printing Press 02 01 3
35. PU Foam 00 01 1
36. R & D Centre 03 00 3
37. Readymade Garments 04 10 14
38. Readymix Concrete 01 00 1
39. Rubberized Coir 00 01 1
40. Service Station 00 17 17
41. Steel Tubes 00 01 1
42. Textile Dyeing 21 78 99
43. Lubricating/Oil refining 05 02 7
44. Paint 00 04 4
45. Milk Processing 01 00 1
46. Tyre Manufacturing 01 00 1
6
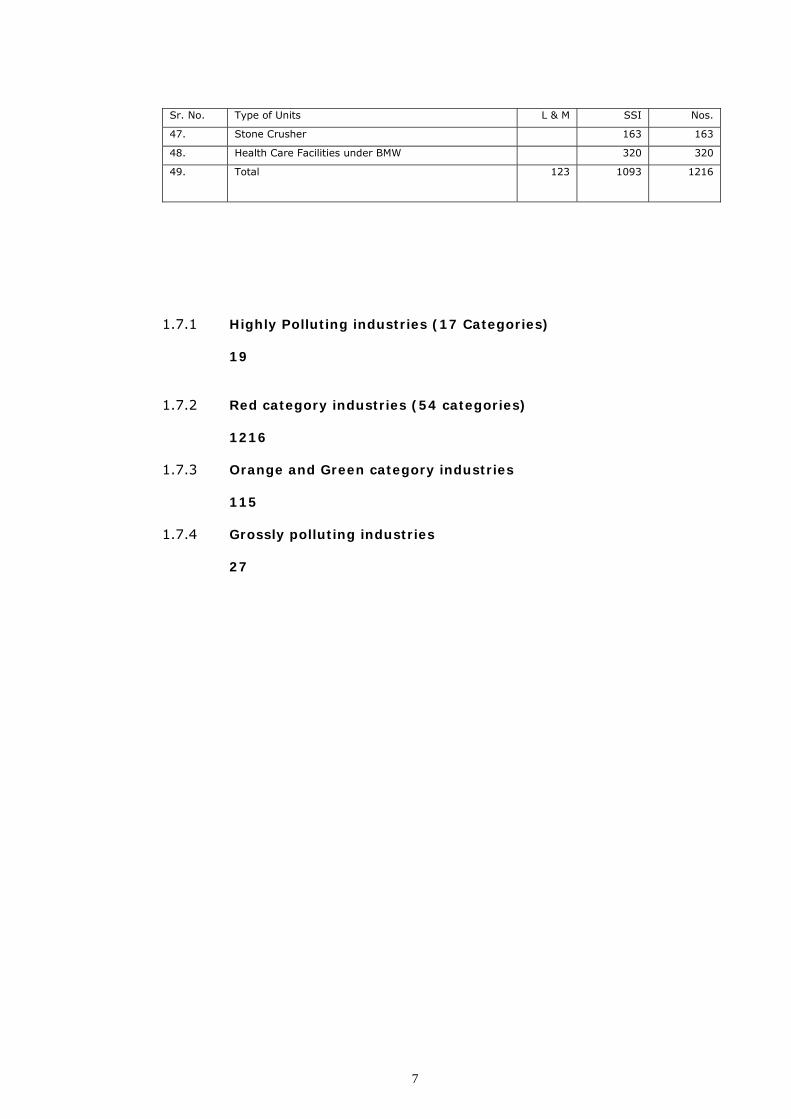
Sr. No. Type of Units L & M SSI Nos.
47. Stone Crusher 163 163
48. Health Care Facilities under BMW 320 320
49. Total 123 1093 1216
1.7.1
Highly Polluting industries (17 Categories) 19
1.7.2 Red category industries (54 categories) 1216
1.7.3 Orange and Green category industries 115
1.7.4 Grossly polluting industries 27
7

8
II. WATER ENVIRONMENT
2. WATER ENVIRONMENT
2.1 Present status of water environment supported with minimum one year analytical data
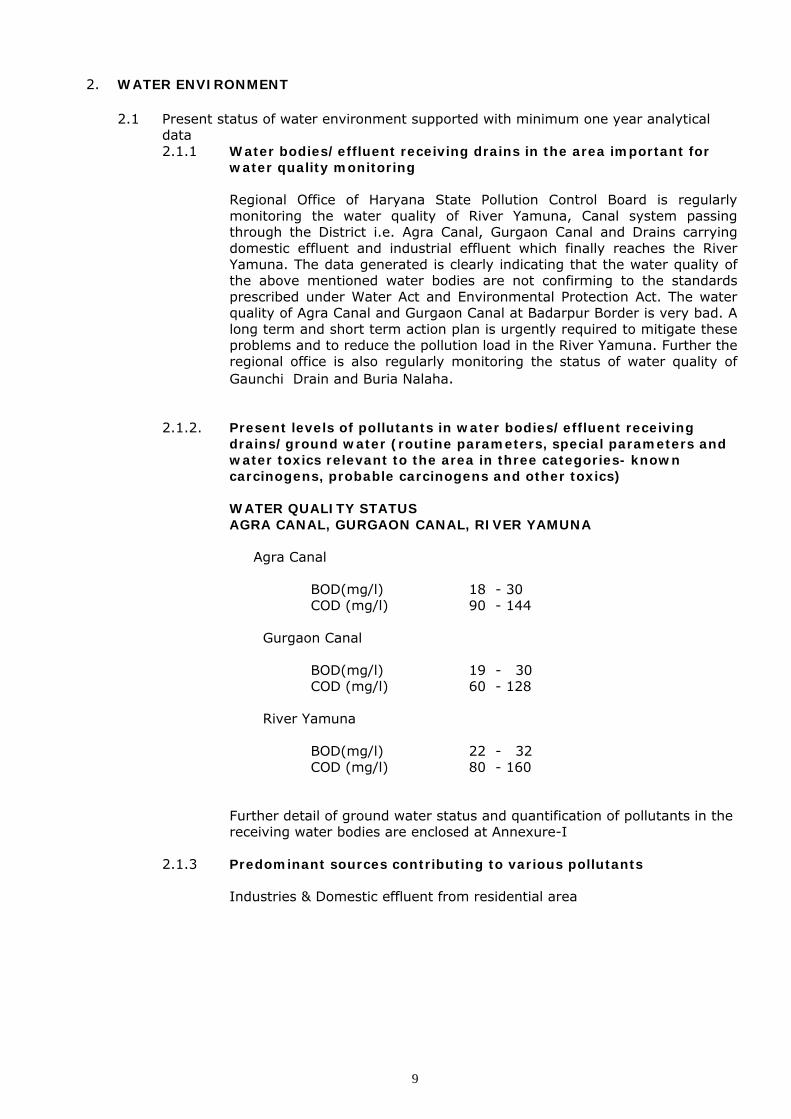
2.1.1 Water bodies/effluent receiving drains in the area important for water quality monitoring Regional Office of Haryana State Pollution Control Board is regularly monitoring the water quality of River Yamuna, Canal system passing through the District i.e. Agra Canal, Gurgaon Canal and Drains carrying domestic effluent and industrial effluent which finally reaches the River Yamuna. The data generated is clearly indicating that the water quality of the above mentioned water bodies are not confirming to the standards prescribed under Water Act and Environmental Protection Act. The water quality of Agra Canal and Gurgaon Canal at Badarpur Border is very bad. A long term and short term action plan is urgently required to mitigate these problems and to reduce the pollution load in the River Yamuna. Further the regional office is also regularly monitoring the status of water quality of Gaunchi Drain and Buria Nalaha.
Present levels of pollutants in water bodies/effluent receiving drains/ground water (routine parameters, special parameters and water toxics relevant to the area in three categories- known carcinogens, probable carcinogens and other toxics) WATER QUALITY STATUS AGRA CANAL, GURGAON CANAL, RIVER YAMUNA
Agra Canal
2.1.2.
BOD(mg/l) 18 - 30 COD (mg/l) 90 - 144
Gurgaon Canal
BOD(mg/l) 19 - 30 COD (mg/l) 60 - 128
River Yamuna
BOD(mg/l) 22 - 32 COD (mg/l) 80 - 160
Further detail of ground water status and quantification of pollutants in the receiving water bodies are enclosed at Annexure-I
2.1.3 Predominant sources contributing to various pollutants Industries & Domestic effluent from residential area
9
2.2 Sources of water pollution
2.2.1
Industrial
Total Numbers of Industries - 733
Large & Medium Category - 123
SSI Category - 610
Water Polluting Industries - 367
Air Polluting Industries - 491
Total industrial discharge is 26 MLD
2.2.2
Domestic 200 MLD out of which 115 MLD is being treated in the STP
2.2.3
Others (Agricultural runoff, leachate from MSW dump, illegal dump site etc.) The is no substantial data available in this regard
2.2.4
Impact on surrounding area (Outside the CEPI Area) on the water courses/ drainage system of the area under consideration There is no significant contribution of pollutants from the surrounding area outside the CEPI area on the water courses/ drainage system of District Faridabad.
10
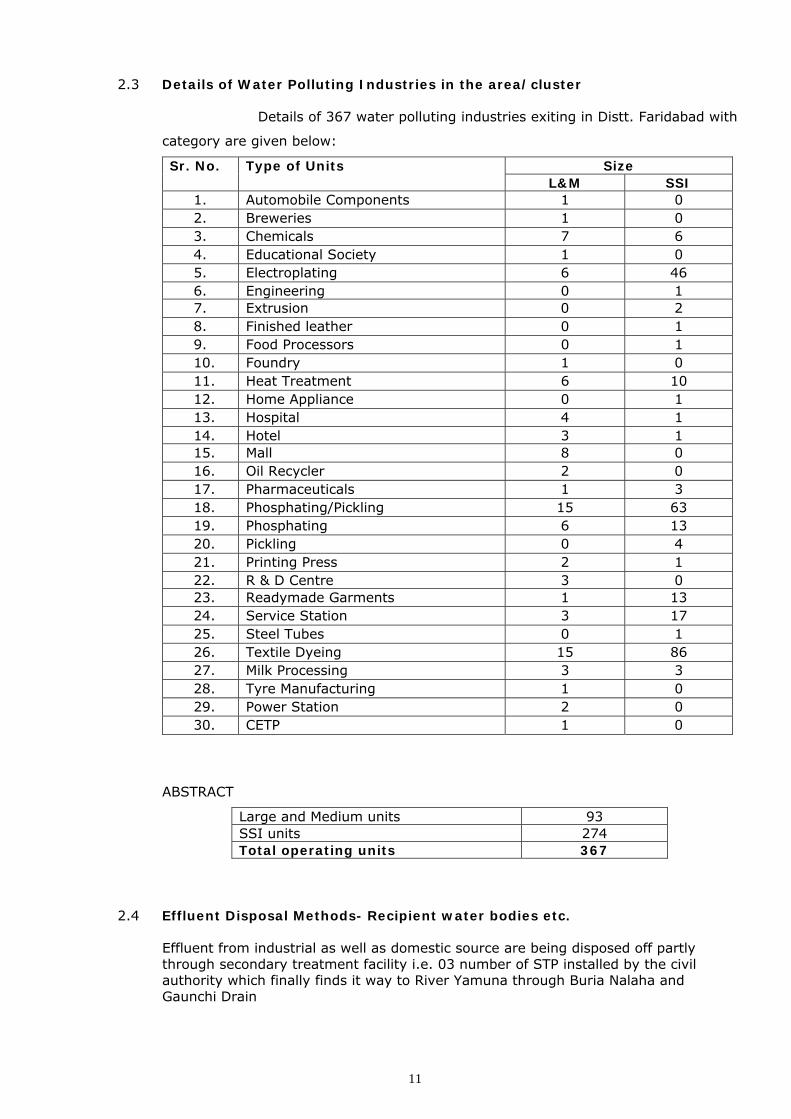
2.3 Details of Water Polluting Industries in the area/cluster
Details of 367 water polluting industries exiting in Distt. Faridabad with
category are given below:
Size Sr. No. Type of Units L&M SSI
1. Automobile Components 1 0 2. Breweries 1 0 3. Chemicals 7 6 4. Educational Society 1 0 5. Electroplating 6 46 6. Engineering 0 1 7. Extrusion 0 2 8. Finished leather 0 1 9. Food Processors 0 1 10. Foundry 1 0 11. Heat Treatment 6 10 12. Home Appliance 0 1 13. Hospital 4 1 14. Hotel 3 1 15. Mall 8 0 16. Oil Recycler 2 0 17. Pharmaceuticals 1 3 18. Phosphating/Pickling 15 63 19. Phosphating 6 13 20. Pickling 0 4 21. Printing Press 2 1 22. R & D Centre 3 0 23. Readymade Garments 1 13 24. Service Station 3 17 25. Steel Tubes 0 1 26. Textile Dyeing 15 86 27. Milk Processing 3 3 28. Tyre Manufacturing 1 0 29. Power Station 2 0 30. CETP 1 0
ABSTRACT
Lar 93 ge and Medium units SSI units 274 Tot 367al operating units
2.4 Effluent Disposal Methods- Recipient water bodies etc. Effluent from industrial as well as domestic source are being disposed off partly through secondary treatment facility i.e. 03 number of STP installed by the civil authority which finally finds it way to River Yamuna through Buria Nalaha and Gaunchi Drain
11
2.5 Quantification of wastewater pollution load and relative contribution by different source viz industrial/ domestic
Industrial BOD Load Total Heavy Metal Load 177.80 Kg/day 6.74 Kg/day
Domestic (Industrial+Domestic) BOD Load 67800 Kg/day
2.6 Action Plan for compliance and control of pollution
2.6.1 Existing infrastructure facilities-Water quality monitoring network, ETPs, CETPs, Sewerage Treatment Plant of industry (STPs), surface drainage system, effluent conveyance channels/outfalls etc.
a.) Domestic Discharge
The present population of District Faridabad is generating 200 MLD of Sewage per day and the combined capacity existing Sewage Treatment Plant owned by Municipal Corporation, Faridabad and P.W.D. (Water Supply & Sanitation Department) is 115 MLD. The rest of 85 MLD of domestic sewage is being discharge to River Yamuna without any treatment through Buria Nalaha and Gaunchi Drain
b.) Industrial Discharge
There are 12468 Registered industries in District Faridabad and number of water polluting industrial units are 367. All these units have installed Effluent Treatment Plant in their premises to treat the trade effluent generated. The treated trade effluent are being discharged into Sewer which finally finds its way to the River Yamuna. Before reaching to River Yamuna the industrial effluent passes through 3 number of Sewage Treatment Plant as terminal treatment facility, installed by the Public Health Department/Municipal Corporation, Faridabad. A part of the treated industrial trade effluent is being discharged into the Gaunchi Drain and Buria Nalaha which is not being treated by the STP and finally reaching River Yamuna The abstract of pollution control devices installed by the industries / civic authorities are given below
No. of ETP installed by the unit 367 No. of STP 03 No. of CETP 01
The name of surface drainage system, effluent conveyance channels/ outfalls / drains are given below
1. Gaunchi Drain 2. Buria Nalaha 3. Movai Drain
2.6.2 Pollution control measures installed by Industries
367 no of water polluting industries have installed ETP to treat their trade effluent.
2.6.3 Technological Intervention
2.6.3.1 Inventorization of prominent industries with technological gaps
Presently all the prominent industries are complying the provisions of Water Act and need no further upgradation in the existing APCD.
2.6.3.2 Identification of low cost and advanced cleaner technology for pollution control
12
Waste minimization by using concept of recycle and reuse Low brine ratio in textile dyeing unit Recycling of scouring waste Use of trivalent chrome and easily degradable passivation chemicals in electroplating and phosphating process Reduction in the use of hexavalant chromium in electroplating process Reduction of heavy metal load in electroplating process Reduction of organic load from breweries and distilleries, food processing unit by opting of zero discharge concept
2.6.4 Infrastructure Renewal 2.6.4.1 Details of existing infrastructure facilities
ETP Installed 367 STP 03 CETP 01
2.6.4.2 Need of up gradation of existing facilities STP 03 CETP 01 Additional Infrastructure such as 02 STP required to be installed for treating balance 85 MLD domestic effluent and 7 no of CETP in different industrial zones are also required to be installed additional
2.6.4.3 De-silting of water tanks, drains, rivulets, etc. There is an urgent need to de-silt the following drains in Distt. Faridabad to facilitate the easy flow of surface run off and effluents 1. Buria Nalaha 2. Gaunchi Drain 3. Movai Drain
2.6.4.4 Construction of lined drains/connections None of these following drains carrying domestic effluent, industrial effluent and surface run off has been lined and needs an urgent action in this regard. 1. Buria Nalaha 2. Gaunchi Drain 3. Movai Drain
2.6.4.5 Treatment and management of contaminated surface water bodies
Infrastructure for treating the contaminated surface run off during rainy season is not exiting therefore the contaminated water is directly reaching to River Yamuna.
2.6.4.6 Rejuvenation/Management Plan for important ecogeological features
Badkhal Lake, Suraj Kund Lake are the most important eco-geological features in the Aravali Hills. Due to mining activity in the Aravali Hills these two lakes are presently dried out. The perennial source of water supply to these lakes was catchments area in the Aravali Hills and due to mining activity these sources have since been dried out. There is an urgent need to provide alternate source of water to these lakes. The mining activities in the region has already been stopped by Hon’ble Supreme Court of India. The mining department and
13
the Irrigation department Govt. of Haryana to take urgent action in this regard.
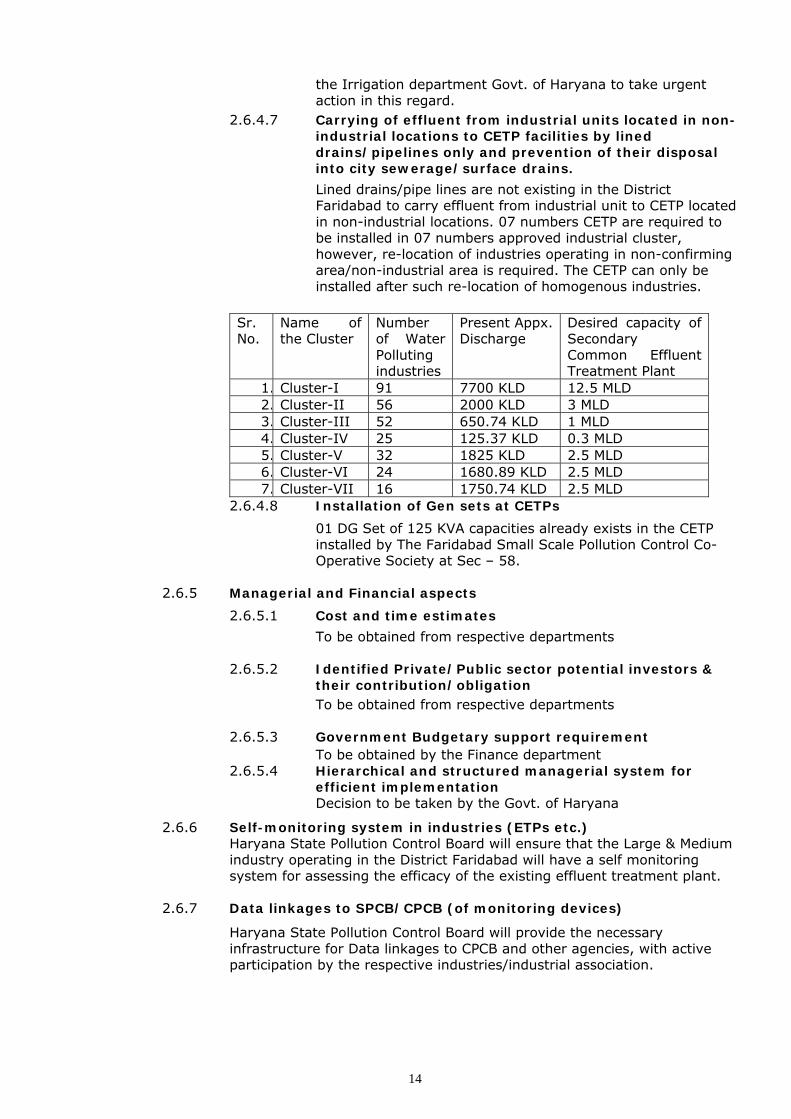
2.6.4.7 Carrying of effluent from industrial units located in non-industrial locations to CETP facilities by lined drains/pipelines only and prevention of their disposal into city sewerage/surface drains.
Lined drains/pipe lines are not existing in the District Faridabad to carry effluent from industrial unit to CETP located in non-industrial locations. 07 numbers CETP are required to be installed in 07 numbers approved industrial cluster, however, re-location of industries operating in non-confirming area/non-industrial area is required. The CETP can only be installed after such re-location of homogenous industries.
Sr. No.
Name of the Cluster
Number of Water Polluting industries
Present Appx. Discharge
Desired capacity of Secondary Common Effluent Treatment Plant
1. Cluster-I 91 7700 KLD 12.5 MLD 2. Cluster-II 56 2000 KLD 3 MLD 3. Cluster-III 52 650.74 KLD 1 MLD 4. Cluster-IV 25 125.37 KLD 0.3 MLD 5. Cluster-V 32 1825 KLD 2.5 MLD 6. Cluster-VI 24 1680.89 KLD 2.5 MLD 7. Cluster-VII 16 1750.74 KLD 2.5 MLD
2.6.4.8 Installation of Gen sets at CETPs
01 DG Set of 125 KVA capacities already exists in the CETP installed by The Faridabad Small Scale Pollution Control Co-Operative Society at Sec – 58.
2.6.5 Managerial and Financial aspects
2.6.5.1 Cost and time estimates
To be obtained from respective departments
2.6.5.2 Identified Private/Public sector potential investors & their contribution/obligation
To be obtained from respective departments
2.6.5.3 Government Budgetary support requirement
To be obtained by the Finance department 2.6.5.4 Hierarchical and structured managerial system for
efficient implementation Decision to be taken by the Govt. of Haryana
2.6.6 Self-monitoring system in industries (ETPs etc.) Haryana State Pollution Control Board will ensure that the Large & Medium industry operating in the District Faridabad will have a self monitoring system for assessing the efficacy of the existing effluent treatment plant.
2.6.7 Data linkages to SPCB/CPCB (of monitoring devices)
Haryana State Pollution Control Board will provide the necessary infrastructure for Data linkages to CPCB and other agencies, with active participation by the respective industries/industrial association.
14

III. AIR ENVIRONMENT
15
3. AIR ENVIRONMENT
3.1 Present status of Air environment supported with minimum one year analytical data
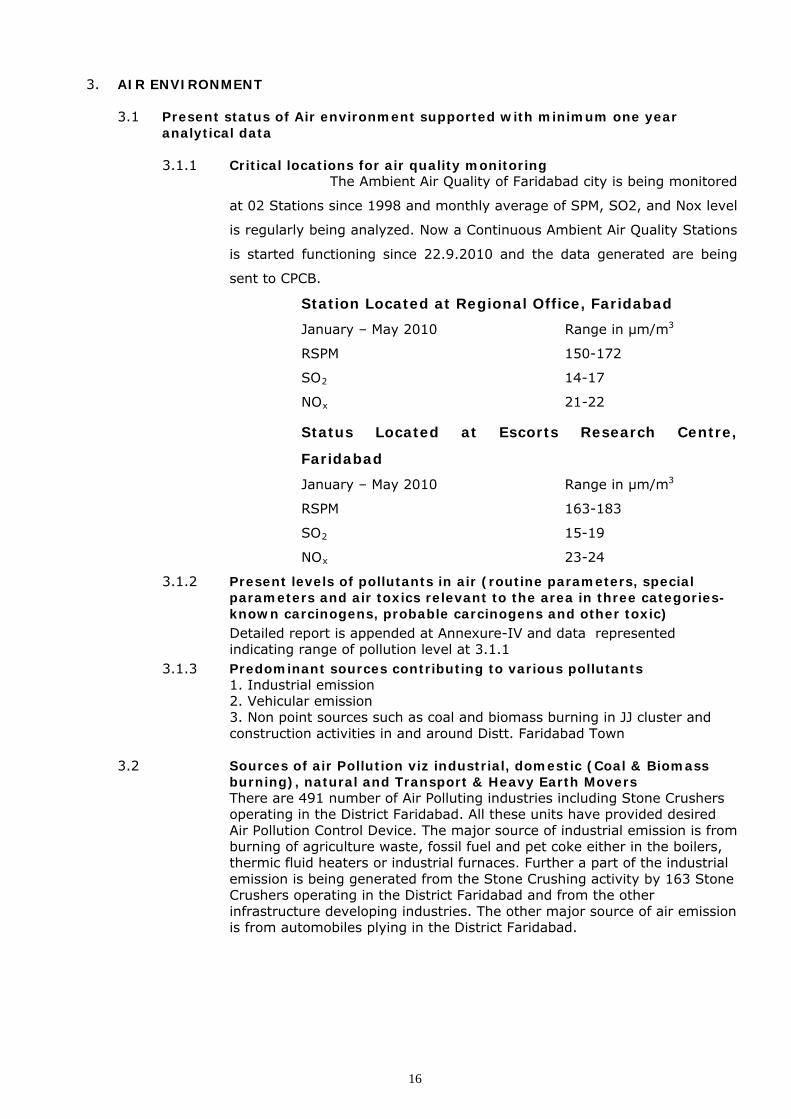
3.1.1 Critical locations for air quality monitoring The Ambient Air Quality of Faridabad city is being monitored
at 02 Stations since 1998 and monthly average of SPM, SO2, and Nox level
is regularly being analyzed. Now a Continuous Ambient Air Quality Stations
is started functioning since 22.9.2010 and the data generated are being
sent to CPCB.
Station Located at Regional Office, Faridabad
January – May 2010 Range in µm/m3
RSPM 150-172
SO2 14-17
NOx 21-22
Status Located at Escorts Research Centre,
Faridabad
January – May 2010 Range in µm/m3
RSPM 163-183
SO2 15-19
NOx 23-24
3.1.2 Present levels of pollutants in air (routine parameters, special parameters and air toxics relevant to the area in three categories-known carcinogens, probable carcinogens and other toxic)
Detailed report is appended at Annexure-IV and data represented indicating range of pollution level at 3.1.1
3.1.3 Predominant sources contributing to various pollutants 1. Industrial emission 2. Vehicular emission 3. Non point sources such as coal and biomass burning in JJ cluster and construction activities in and around Distt. Faridabad Town
3.2 Sources of air Pollution viz industrial, domestic (Coal & Biomass burning), natural and Transport & Heavy Earth Movers There are 491 number of Air Polluting industries including Stone Crushers operating in the District Faridabad. All these units have provided desired Air Pollution Control Device. The major source of industrial emission is from burning of agriculture waste, fossil fuel and pet coke either in the boilers, thermic fluid heaters or industrial furnaces. Further a part of the industrial emission is being generated from the Stone Crushing activity by 163 Stone Crushers operating in the District Faridabad and from the other infrastructure developing industries. The other major source of air emission is from automobiles plying in the District Faridabad.
16
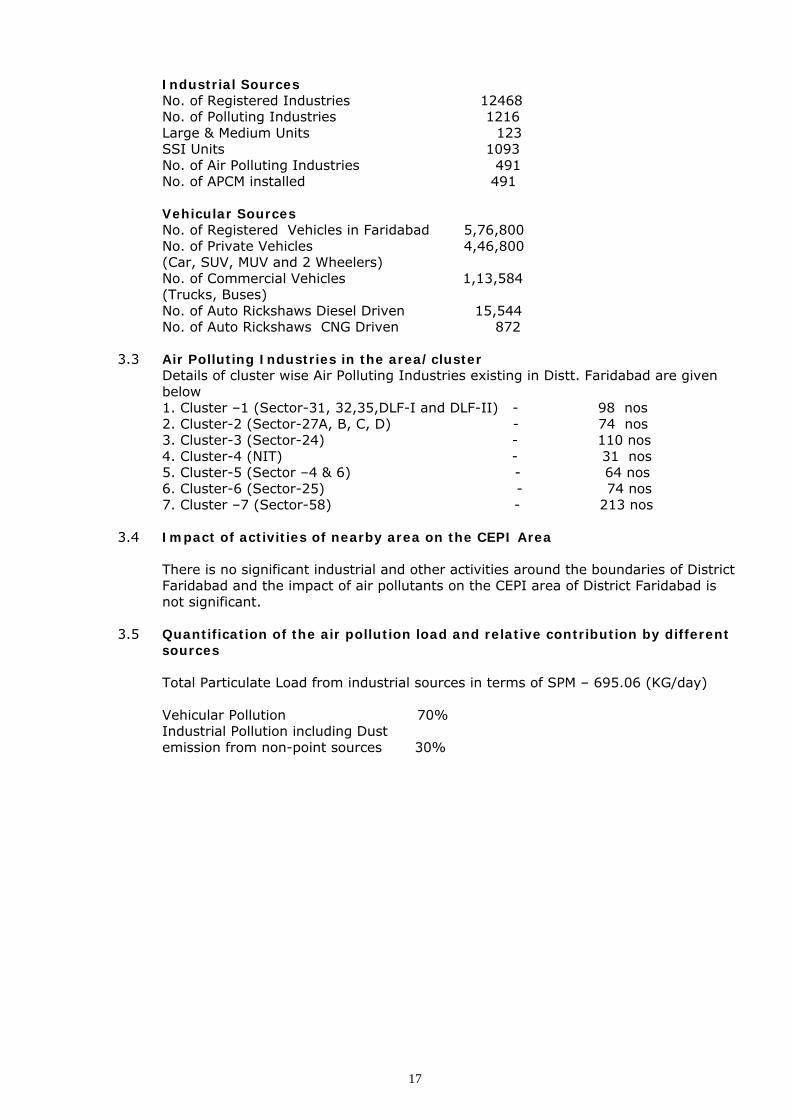
Industrial Sources No. of Registered Industries 12468 No. of Polluting Industries 1216 Large & Medium Units 123 SSI Units 1093 No. of Air Polluting Industries 491 No. of APCM installed 491 Vehicular Sources No. of Registered Vehicles in Faridabad 5,76,800 No. of Private Vehicles 4,46,800 (Car, SUV, MUV and 2 Wheelers) No. of Commercial Vehicles 1,13,584 (Trucks, Buses) No. of Auto Rickshaws Diesel Driven 15,544 No. of Auto Rickshaws CNG Driven 872
3.3 Air Polluting Industries in the area/cluster Details of cluster wise Air Polluting Industries existing in Distt. Faridabad are given below 1. Cluster –1 (Sector-31, 32,35,DLF-I and DLF-II) - 98 nos 2. Cluster-2 (Sector-27A, B, C, D) - 74 nos 3. Cluster-3 (Sector-24) - 110 nos 4. Cluster-4 (NIT) - 31 nos 5. Cluster-5 (Sector –4 & 6) - 64 nos 6. Cluster-6 (Sector-25) - 74 nos 7. Cluster –7 (Sector-58) - 213 nos
3.4 Impact of activities of nearby area on the CEPI Area There is no significant industrial and other activities around the boundaries of District Faridabad and the impact of air pollutants on the CEPI area of District Faridabad is not significant.
3.5 Quantification of the air pollution load and relative contribution by different sources Total Particulate Load from industrial sources in terms of SPM – 695.06 (KG/day) Vehicular Pollution 70% Industrial Pollution including Dust emission from non-point sources 30%
17
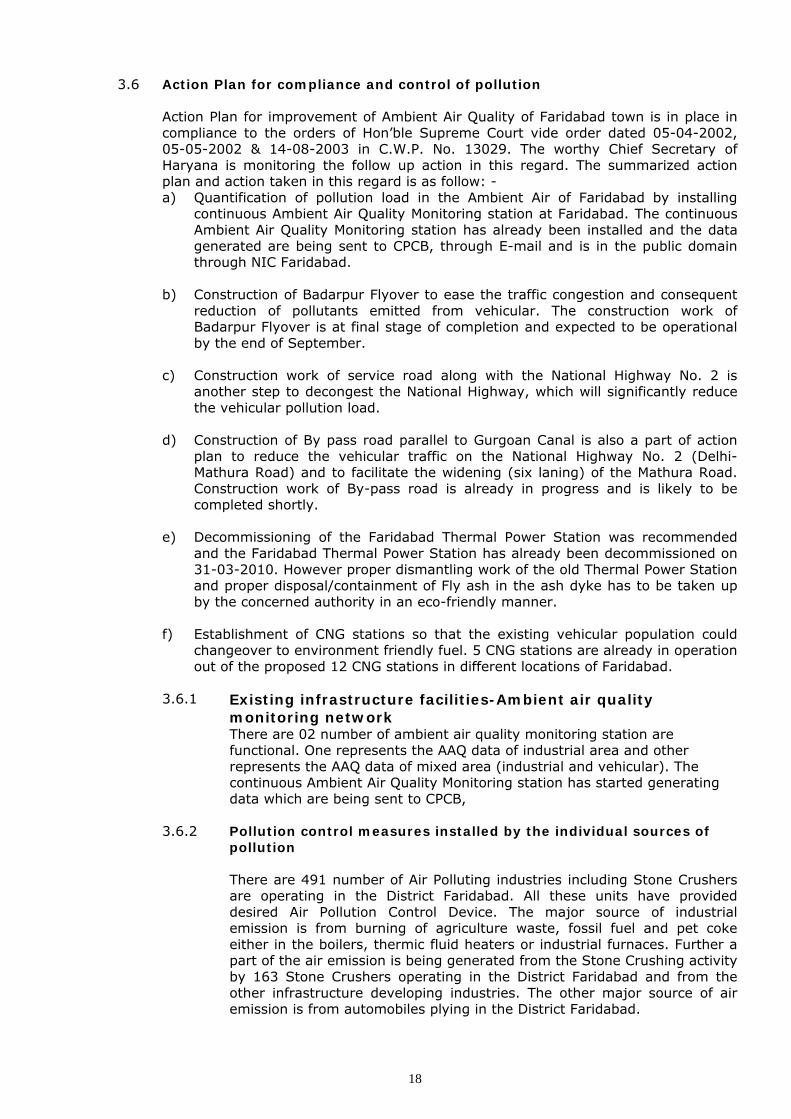
3.6 Action Plan for compliance and control of pollution Action Plan for improvement of Ambient Air Quality of Faridabad town is in place in compliance to the orders of Hon’ble Supreme Court vide order dated 05-04-2002, 05-05-2002 & 14-08-2003 in C.W.P. No. 13029. The worthy Chief Secretary of Haryana is monitoring the follow up action in this regard. The summarized action plan and action taken in this regard is as follow: - a) Quantification of pollution load in the Ambient Air of Faridabad by installing
continuous Ambient Air Quality Monitoring station at Faridabad. The continuous Ambient Air Quality Monitoring station has already been installed and the data generated are being sent to CPCB, through E-mail and is in the public domain through NIC Faridabad.
b) Construction of Badarpur Flyover to ease the traffic congestion and consequent
reduction of pollutants emitted from vehicular. The construction work of Badarpur Flyover is at final stage of completion and expected to be operational by the end of September.
c) Construction work of service road along with the National Highway No. 2 is
another step to decongest the National Highway, which will significantly reduce the vehicular pollution load.
d) Construction of By pass road parallel to Gurgoan Canal is also a part of action
plan to reduce the vehicular traffic on the National Highway No. 2 (Delhi-Mathura Road) and to facilitate the widening (six laning) of the Mathura Road. Construction work of By-pass road is already in progress and is likely to be completed shortly.
e) Decommissioning of the Faridabad Thermal Power Station was recommended
and the Faridabad Thermal Power Station has already been decommissioned on 31-03-2010. However proper dismantling work of the old Thermal Power Station and proper disposal/containment of Fly ash in the ash dyke has to be taken up by the concerned authority in an eco-friendly manner.
f) Establishment of CNG stations so that the existing vehicular population could
changeover to environment friendly fuel. 5 CNG stations are already in operation out of the proposed 12 CNG stations in different locations of Faridabad.
3.6.1 Existing infrastructure facilities-Ambient air quality
monitoring network There are 02 number of ambient air quality monitoring station are functional. One represents the AAQ data of industrial area and other represents the AAQ data of mixed area (industrial and vehicular). The continuous Ambient Air Quality Monitoring station has started generating data which are being sent to CPCB,
3.6.2 Pollution control measures installed by the individual sources of pollution There are 491 number of Air Polluting industries including Stone Crushers are operating in the District Faridabad. All these units have provided desired Air Pollution Control Device. The major source of industrial emission is from burning of agriculture waste, fossil fuel and pet coke either in the boilers, thermic fluid heaters or industrial furnaces. Further a part of the air emission is being generated from the Stone Crushing activity by 163 Stone Crushers operating in the District Faridabad and from the other infrastructure developing industries. The other major source of air emission is from automobiles plying in the District Faridabad.
18
3.6.3 Technological Intervention 3.6.3.1 Inventorization of prominent industries with
technological gaps Presently all the prominent industries is complying the provisions of Air Act and need no further upgradation in the existing APCD.
3.6.3.2 Identification of low cost and advanced cleaner technology for air pollution control Mandatory installation of Fluidized Bed Burning System in all industries using solid fossil fuel and Agricultural Waste as fuel.
3.6.3.3 Introduction and switch over to cleaner fuel M/s Adani Gas Limited has been authorized to provide infrastructure for supplying CNG to the industries. At present two nos. of industries are already using CNG as fuel. Further M/s Adani Gas Limited has already started dispensing CNG to the Automobiles in 5 nos. stations. 7 nos. CNG stations are proposed to be installed by the end of 2010. M/s Adani Gas Limited has proposed to lay 81Km. long steel pipe line network in the industrial area for supplying piped natural gas (PNG) to the industries
3.6.4 Need of infrastructure Renovation Haryana State Pollution Control Board will impose conditions while grating consent to established ( NOC) to Air polluting unit that all the new boilers/thermic fluid heaters/furnaces installed by the unit should either use cleaner fuel viz. CNG/LNG/LPG/HSD or fluidized bed burning system for solid fuel such as coal/ pet cock/ biomass.
3.6.4.1 Development of roads
a. Government of Haryana and NHAI is constructing Flyover at Badarpur Border and is at final stage of completion, which will facilitate the smooth flow of traffic and consequent reduction in vehicular emission.
b. NHAI has started the work for six laning the existing Mathura Road (NH-2) and Service lane along the Mathura Road, which will decongest the Mathura Road and consequent reduction in vehicular emission.
c. NHAI and B & R Department will construct by pass road, synchronize traffic signals on Main Mathura Road and arterial road inside the town to de-congest the traffic flow.
d. DMRC is proposed to extend the Metro Rail from Badarpur to YMCA Chowk, which further reduce the vehicular population on main Mathura Road (NH-2).
19
3.6.5 Impact on CEPI score after installation/commissioning of full fledged air pollution control systems The CEPI score w.r.t Ambient Air Quality of District Faridabad will considerably reduce after decommissioning of Faridabad Thermal Power Station, use of cleaner fuel such as CNG by the industry, vehicles and commissioning of Badarpur Flyover and Metro Rail Network in Faridabad.
3.6.6 Managerial and Financial aspects –Cost and time estimates
3.6.6.1 Cost and time estimates To be obtained from respective departments
3.6.6.2 Identified Private/Public sector potential investors & their contribution/obligation To be obtained from respective departments
3.6.6.3 Government budgetary support requirement To be obtained by the Finance department
3.6.6.4 Hierarchical and structured managerial system for efficient implementation Decision to be taken by the Govt. of Haryana
3.6.7 Self monitoring system in industries (Stacks, APCDs) Haryana State Pollution Control Board will ensure that the Large & Medium industry operating in the District Faridabad will have a self-monitoring system for assessing the efficacy of the existing air pollution control devices.
3.6.8 Data linkages to SPCB/CPCB (of monitoring devices) State Pollution Control Board will provide the necessary infrastructure for Data linkages to CPCB and other agencies, with active participation by the respective industries/industrial association.
20
IV. LAND ENVIRONMENT (Soil and Ground Water)
21
4. LAND ENVIRONMENT (Soil and Ground Water)
4.1 Soil contamination 4.1.1 Present status of land environment supported with minimum one
year analytical data Data not available.
4.1.2 Critical locations for land/soil pollution assessment and ground water monitoring Status of ground water quality at 25 stations obtained from Ground Water Board is enclosed at Annexure-IV.
4.1.3 Present levels of pollutants in land/soil and ground water (routine parameters, special parameters and water toxics relevant to the area in three categories- known carcinogens, probable carcinogens and other toxics) As annexed at Annexure- IV.
4.1.4 Predominant sources contributing to or posing danger of pollution of land and ground water such as hazardous/toxic wastes or chemicals dumps/storage etc.
a. Discharge of untreated domestic and industrial waste generated from residential areas and industrial areas respectively through the open drain namely Buria Nala and Gounchi drain is the main source of contamination of soil/ ground water.
b. Unscientific disposal of Municipal Solid Waste in the low lying areas is another source of soil / ground water contamination.
4.1.5 Sources of Soil Contamination 1. Unscientific disposal of Municipal Solid Waste 2. Unscientific disposal of Bio Medical Waste 3. Unscientific disposal of Hazardous Waste
4.1.6 Types of existing pollution
a. Municipal Solid Waste b. Unscientific use of fertilizer and pesticides.
4.1.7 Remedies for abatement, treatment and restoration of normal soil quality Agricultural Department of Government of Haryana to take initiative for abatement, treatment and restoration of normal soil quality.
4.2 Ground water contamination
4.2.1 Present status/quality of ground water Status of ground water quality at 25 stations obtained from Ground Water Board is enclosed at Annexure-IV.
22
4.2.2
Source Identification (Existing sources of Ground water Pollution) a. Municipal Solid Waste. b. Unscientific use of fertilizer and pesticides.
4.2.3
Ground water quality monitoring program Presently Central Ground Water Board at 25 locations is carrying out the monitoring of ground water status such as depth of water table and qualitative analysis of ground water. The data w.r.t. ground water status has already been appended. Haryana State Pollution Control Board is incorporating some other protocols to analyzed toxic metals in the ground water of District Faridabad in association with Central Ground Water Board Faridabad in all the 25 locations.
4.2.4
Action Plan for control of Pollution including cost/time aspects
a. Municipal Corporation Faridabad to expedite the completion of construction of an integrated Municipal Solid Waste Treatment and Disposal Facilities (1000 Tones per day) in 31 Acres (Appx.) land at village – Bandhwari, Gurgaon.
b. Rehabilitation of existing MSW dumping sites by covering it with soil.
c. HEMS and Gujrat Enviro Protection and Infrastructure Pvt. Ltd will expedite the completion of secure landfill site i.e. CELL-IA for disposal of Hazardous Waste.
d. The installation work of incinerator for disposal of incinerable Hazardous Waste has just started and will be completed by October 2010.
e. HSPCB to monitor the strict compliance of BMW, Rules by Health Care Facilities.
4.2.5 Treatment and management of contaminated ground water bodies, etc. Presently there is no technology available to Haryana State Pollution Control Board for treating the contaminated ground water bodies.
4.2.6
Impact on CEPI score after abatement of pollution The CEPI score w.r.t. land is definitely going to reduce after the above mentioned steps taken by the concerned department and industries.
23
4.3 Solid waste Generation and management
4.3.1 Waste classification and Quantification 4.3.1.1 Hazardous waste
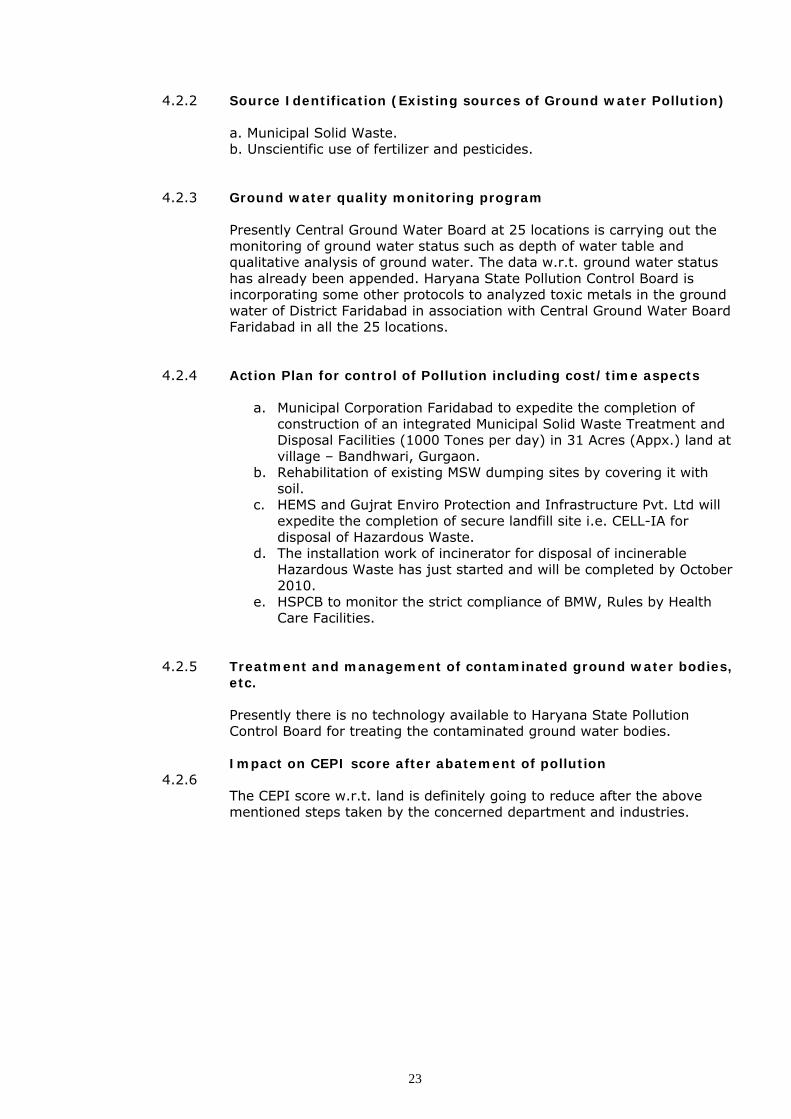
The total quantity of hazardous waste generated by 298 numbers of units is 8884.48 tones per year in the Distt. Faridabad. Haryana Environmental Management Society constituted by the industries of Haryana in collaboration with M/s Gujrat Enviro Protection and Infrastructure (Haryana) Pvt. Ltd. is installing a Common Hazardous Waste Treatment, Storage & Disposal Facility (CHWTSDF) at Village-Pali. The TSDF has started collecting and storing Hazardous Waste from the industries in their premises. The secured landfill site Cell-1A is at final stage of completion. The incinerator for disposing incinerable hazardous waste is under installation and shall be completed by September/October 2010. The incinerable hazardous waste with moderate to high calorific value will be used as fuel and co processed in cement kiln.
4.3.1.2 Bio-medical waste There are 269 number of Health Care Facilities existing in District Faridabad and are disposing off their Bio-Medical Waste through the Service Provider M/s Vulcan Waste Management Co., Gurgaon. The Common Bio-Medical Waste Treatment and Disposal facilities existing in District-Gurgaon which caters the requirement of Health Care Facilities operating in District Faridabad.
24
4.3.1.3 Electronic waste Inventorization of electronic waste generated in Distt Faridabad is being carried out by the HSPCB and should be completed by March 2011
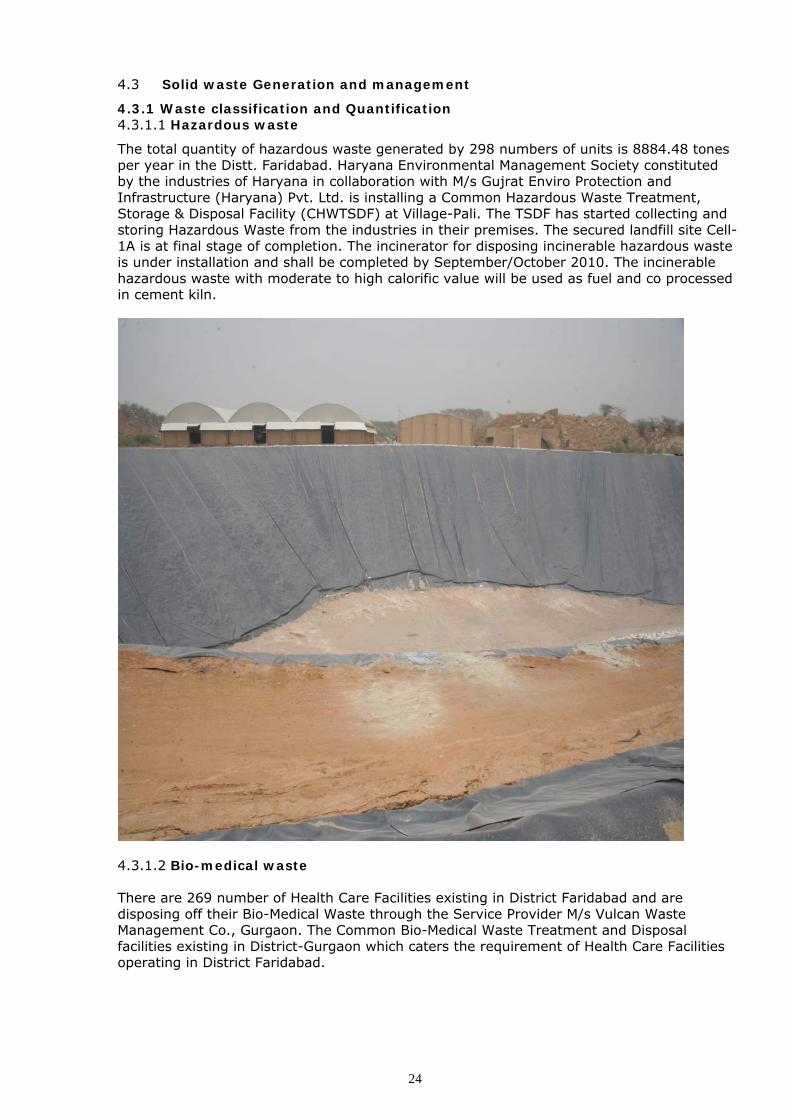
Other industrial sources Municipal Corporation, Faridabad and Municipal Corporation, Gurgaon is installing an integrated Municipal Solid Waste Treatment and Disposal facilities (1000 Tones per day) in 31 Acres (Appx.) land at Village- Bandhwari in Distt Gurgaon. Faridabad town is generating Municipal Solid Waste to the tune of 560 MT/Day. The MSWTSDF is expected to be operational by end of December 2010.
Plastic waste The quantity of plastic waste generated along with Municipal Solid Waste in District Faridabad is to the tune of 0.8 to 1% of the total Municipal Solid Waste. The NBCC reported that the quantum of plastic waste could be around 3 to 5 ton/day. The segregated plastic waste will be used as fuel in adjoining cement industries.
4.3.1.5
25
4.3.1.6 Quantification of wastes and relative contribution form different sources
Municipal Solid Waste
Quantity of MSW Generated 560 MT/Day MSW disposal site Under Development (capacity 1000 MT/Day) Bio Medical Waste No. of health care facilities 269 Quantity of BMW Generated Waste Category Kg/per
month Human Anatomical Waste
3164.85
Animal Waste 82.5
Microbiology & Biotechnology Waste 2074.15 Waste Sharps
3336
Discarded Medicines and Cytotoxic drugs 1065.7 Solid Waste
3092.9
Solid Waste 3666
Incineration Ash 57.25
Chemical Waste 408.75
BMW disposal Service Provider Hazardous Waste No. of hazardous waste generating units 298 Quantity of hazardous waste Total 8884.49 MT/Y Land fill 8790.89 MT/Y Recyclable 61.95 MT/Y Incinerable 31.65 MT/Y TSDF for hazardous waste Under Development
4.3.2 Identification of waste minimization and waste exchange options
The necessary guideline has already been circulated by CPCB. Required inventerization need to be carried out by the HSPCB before suggesting any waste exchange option to the industry concerned.
4.3.3 Reduction/Reuse /Recovery/Recycle options in the co-processing of wastes. The above mentioned inventerization of waste, which can be co- processed will facilitate to identify the available options for co-processing of wastes
4.3.4 Infrastructure facilities 4.3.4.1 Existing TSDF/ Incineration facilities including
capacities
Haryana Environmental Management Society constituted by the industries of Haryana in collaboration with M/s Gujrat Enviro Protection and Infrastructure (Haryana) Pvt. Ltd. is installing a Common Hazardous Waste Treatment, Storage &
26
Disposal Facility (CHWTSDF) at Village-Pali. The capacity of the TSDF site is appx. 12,00,000 Cu. meter,and it can cater the hazardous waste for 30 years. The incinerator having capacity of 500 kg/hr is under installation.
4.3.4.2 Present status/performance and need of up gradation of existing facilities including enhancement of capacities
Presently performance upgradation/capacity enhancement is not required.
4.3.4.3 Treatment and management of contaminated waste disposal sites, etc.
The Hazardous Waste will be disposed as per the provisions of Hazardous Waste (Management & Transboundary) Rule 2008.
4.3.4.4 Impact on CEPI score after proper management of Solid Wastes The present CEPI score will reduce after the effective operation of TSDF, MSWTSDF and additional BMWTSDF.
5 PPP Model
5.1 Identification of project proposals (for both the options i.e. technology intervention and infrastructure renewal) for implementation under the PPP mode under the Action Plan Necessary steps will be taken by the Govt. of Haryana.
5.2 Identification of stakeholder/agencies to be involved and to evolve financial and managerial mechanisms for implementation of PPP projects Necessary steps will be taken by the Govt. of Haryana
6 Other infrastructure Renewal measures: 6.1 Green Belts
Forest Department will develop green belt on vacant land. Large and medium industries will carry out plantation in their premises.
6.2 Development of Industrial Estate(s) District Administration and HUDA/HSIDC will acquire the land and provide infrastructure for developing new industrial area to re-locate the displaced industries, which are existing in non-confirming/residential area.
6.3 Development/shifting of industries located in the non- industrial area to the existing/new industrial estates. Municipal Corporation Faridabad/HUDA/HSIDC to conduct fresh survey with District Industries Center and make inventorization of industries operating illegally in non confirming/residential area so that the new industrial estate could be curved out and the displaced industries could be accommodated in the new industrial area.
27
7 Specific Schemes: 7.1 GIS-GPS system for pollution sources monitoring
Necessary infrastructure and funding in this regard will be made operational by the concerned department only after obtaining clearance from Govt. of Haryana.
7.2 Hydro-geological fracturing for water bodies rejuvenation The Topography of District Faridabad is suitable for providing check dams and small barrages in the Aravali Hills to rejuvenate the existing water bodies. Further the existing unused Silica Sand Mine pits can also be utilized to hold rain water and to recharge the ground water level.
7.3 In-situ remediation of sewage The In-situ remediation of sewage in District Faridabad can be taken up by the PWD (Water Supply and Sanitation) department.
7.4
Utilization of MSW inert by gas based brick kilns At present the MSWTSDF is under construction. The MSW inert can only be used in Brick Kilns.
7.5
Co-processing of wastes in cement industries At present the HWTSDF and MSWTSDF are under construction. Thereafter the incinerable waste from HWTSDF and MSWTSDF can be co processed in Cement Industry.
8
Public awareness and training Programmes
a. Sensitization of eco clubs regarding the imminent impacts of environmental degradation on the receiving environment.
b. Awareness programme to ban the use of recycle plastics. c. Awareness programme to desist the farmers from burning wheat and paddy stubble
and other agricultural waste in the field and propagating the concept of alternative eco friendly use of such agricultural waste.
d. Awareness programme amongst the industries for scientific disposal of hazardous waste so that the imminent danger of contaminating the sub soil water could be avoided.
e. Awareness programme amongst the public at large for segregation and proper disposal of Municipal Solid Waste.
9
Overall Impact of installation/commissioning of pollution control equipments/measures on the CEPI score The overall present CEPI score will reduce after the effective implementation of above mentioned Action Plans w.r.t Water, Air and Land.
28
10
Assessment of Techno-economical feasibility of pollution control systems in clusters of small/medium scale industries. The existing pollution control devices installed by the industries are capable of achieving the standards. However the necessary performance upgradation/capacity enhancement can be undertaken wherever it is necessary to do so.
11
Efforts shall be made to encourage use of Bio-Fertilizer alongwith the chemical fertilizer in the state to minimize the unutilized chemical fertilizer run-off into the natural water resources from agriculture fields (through Govt. policy) The Agriculture Department, Govt. of Haryana to take necessary steps in this regard.
29
V. PROPOSED ACTION
POINTS
30
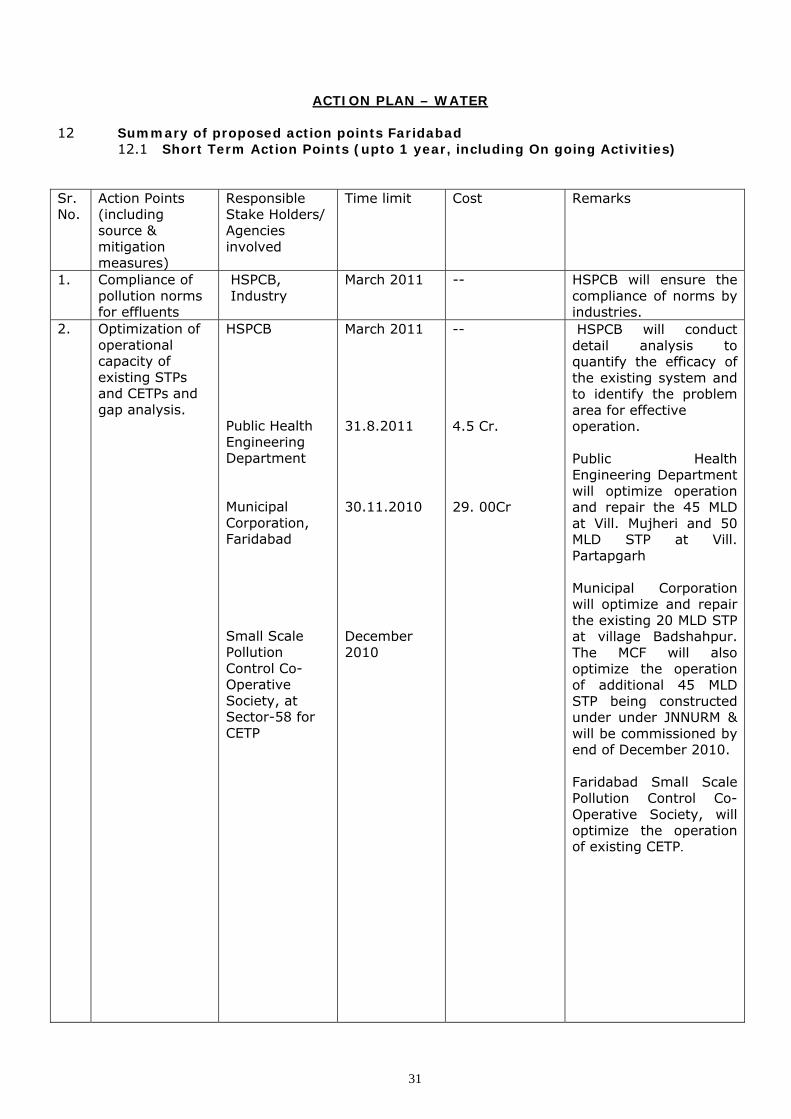
ACTION PLAN – WATER
12 Summary of proposed action points Faridabad 12.1 Short Term Action Points (upto 1 year, including On going Activities)
Sr. No.
Action Points (including source & mitigation measures)
Responsible Time limit Cost Remarks Stake Holders/ Agencies involved
1. Compliance of pollution norms for effluents
HSPCB, March 2011 -- HSPCB will ensure the compliance of norms by industries.
Industry
2. Optimization of operational capacity of existing STPs and CETPs and gap analysis.
HSPCB Public Health Engineering Department Municipal Corporation, Faridabad Small Scale Pollution Control Co-Operative Society, at Sector-58 for CETP
March 2011 31.8.2011 30.11.2010 December 2010
-- 4.5 Cr. 29. 00Cr
HSPCB will conduct detail analysis to quantify the efficacy of the existing system and to identify the problem area for effective operation. Public Health Engineering Department will optimize operation and repair the 45 MLD at Vill. Mujheri and 50 MLD STP at Vill. Partapgarh Municipal Corporation will optimize and repair the existing 20 MLD STP at village Badshahpur. The MCF will also optimize the operation of additional 45 MLD STP being constructed under under JNNURM & will be commissioned by end of December 2010. Faridabad Small Scale Pollution Control Co-Operative Society, will optimize the operation of existing CETP.
31
Sr. No.
Action Points (including source & mitigation measures)
Responsible Time limit Cost Remarks Stake Holders/ Agencies involved
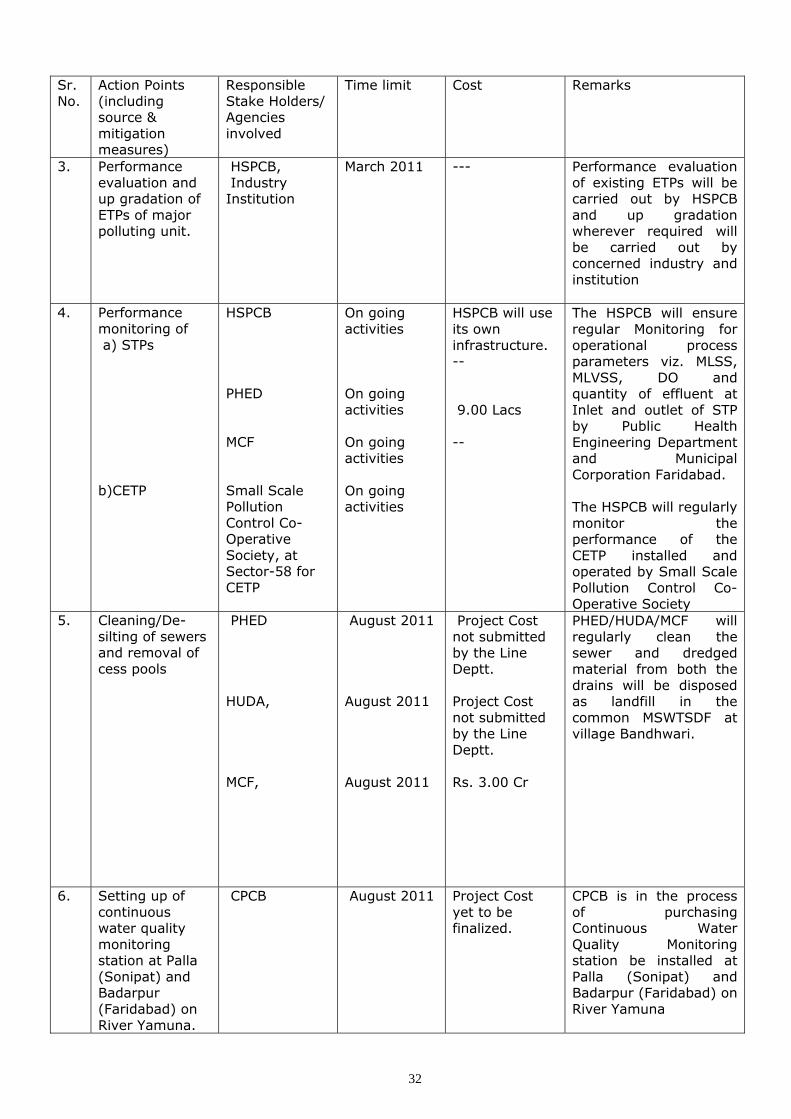
3. Performance evaluation and up gradation of ETPs of major polluting unit.
HSPCB, Industry Institution
March 2011 ---
Performance evaluation of existing ETPs will be carried out by HSPCB and up gradation wherever required will be carried out by concerned industry and institution
4. Performance monitoring of a) STPs b)CETP
HSPCB PHED MCF Small Scale Pollution Control Co-Operative Society, at Sector-58 for CETP
On going activities On going activities On going activities On going activities
HSPCB will use its own infrastructure. -- 9.00 Lacs --
The HSPCB will ensure regular Monitoring for operational process parameters viz. MLSS, MLVSS, DO and quantity of effluent at Inlet and outlet of STP by Public Health Engineering Department and Municipal Corporation Faridabad. The HSPCB will regularly monitor the performance of the CETP installed and operated by Small Scale Pollution Control Co-Operative Society
5. Cleaning/De-silting of sewers and removal of cess pools
PHED HUDA, MCF,
August 2011 August 2011 August 2011
Project Cost not submitted by the Line Deptt. Project Cost not submitted by the Line Deptt. Rs. 3.00 Cr
PHED/HUDA/MCF will regularly clean the sewer and dredged material from both the drains will be disposed as landfill in the common MSWTSDF at village Bandhwari.
6. Setting up of continuous water quality monitoring station at Palla (Sonipat) and Badarpur (Faridabad) on River Yamuna.
CPCB
August 2011
Project Cost yet to be finalized.
CPCB is in the process of purchasing Continuous Water Quality Monitoring station be installed at Palla (Sonipat) and Badarpur (Faridabad) on River Yamuna
32
Sr. No.
Action Points (including source & mitigation measures)
Responsible Time limit Cost Remarks Stake Holders/ Agencies involved
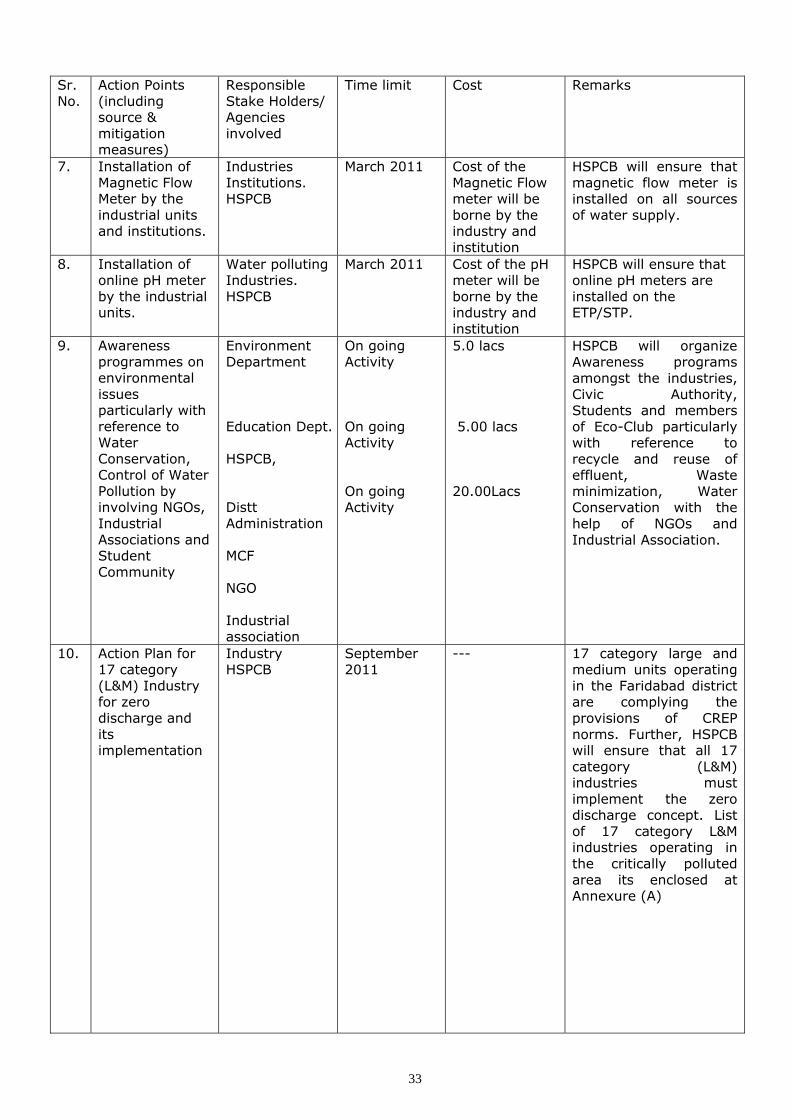
7. Installation of Magnetic Flow Meter by the industrial units and institutions.
Industries Institutions. HSPCB
March 2011 Cost of the Magnetic Flow meter will be borne by the industry and institution
HSPCB will ensure that magnetic flow meter is installed on all sources of water supply.
8. Installation of online pH meter by the industrial units.
Water polluting Industries. HSPCB
March 2011 Cost of the pH meter will be borne by the industry and institution
HSPCB will ensure that online pH meters are installed on the ETP/STP.
9. Awareness programmes on environmental issues particularly with reference to Water Conservation, Control of Water Pollution by involving NGOs, Industrial Associations and Student Community
Environment Department Education Dept. HSPCB, Distt Administration MCF NGO Industrial association
On going Activity On going Activity On going Activity
5.0 lacs 5.00 lacs 20.00Lacs
HSPCB will organize Awareness programs amongst the industries, Civic Authority, Students and members of Eco-Club particularly with reference to recycle and reuse of effluent, Waste minimization, Water Conservation with the help of NGOs and Industrial Association.
10. Action Plan for 17 category (L&M) Industry for zero discharge and its implementation
Industry HSPCB
September 2011
--- 17 category large and medium units operating in the Faridabad district are complying the provisions of CREP norms. Further, HSPCB will ensure that all 17 category (L&M) industries must implement the zero discharge concept. List of 17 category L&M industries operating in the critically polluted area its enclosed at Annexure (A)
33
Sr. No.
Action Points (including source & mitigation measures)
Responsible Time limit Cost Remarks Stake Holders/ Agencies involved
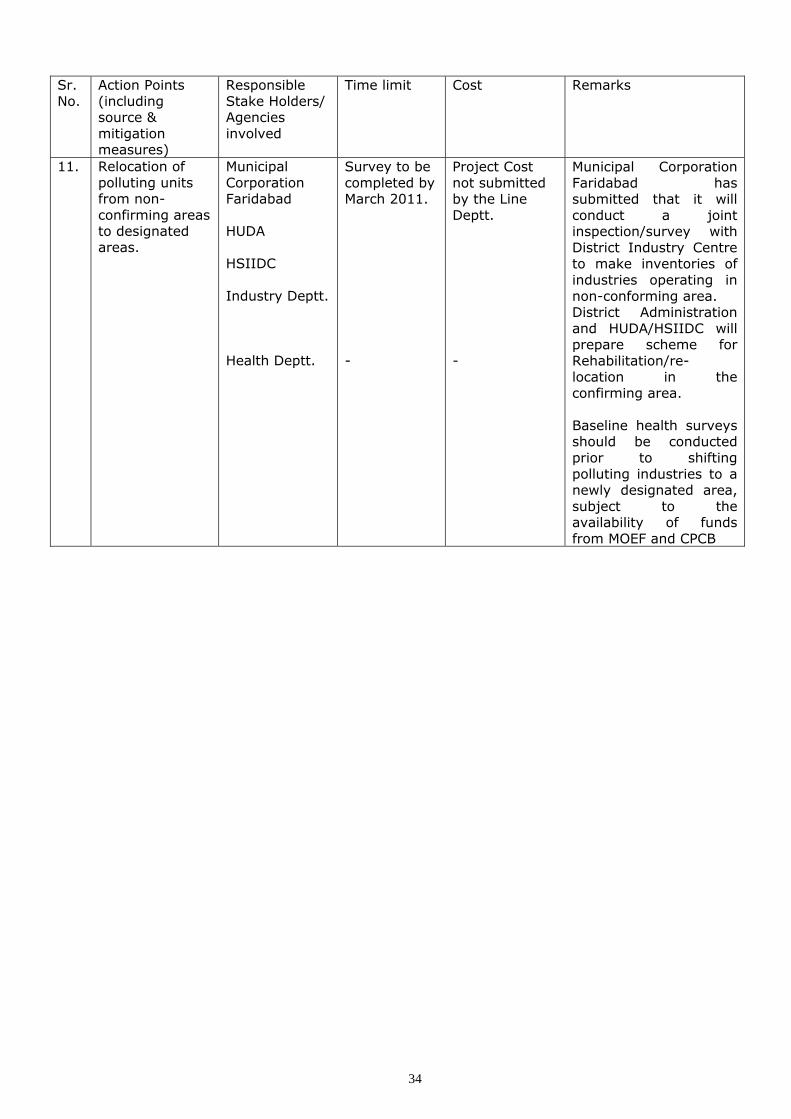
11. Relocation of polluting units from non-confirming areas to designated areas.
Municipal Corporation Faridabad HUDA HSIIDC Industry Deptt. Health Deptt.
Survey to be completed by March 2011. -
Project Cost not submitted by the Line Deptt. -
Municipal Corporation Faridabad has submitted that it will conduct a joint inspection/survey with District Industry Centre to make inventories of industries operating in non-conforming area. District Administration and HUDA/HSIIDC will prepare scheme for Rehabilitation/re-location in the confirming area. Baseline health surveys should be conducted prior to shifting polluting industries to a newly designated area, subject to the availability of funds from MOEF and CPCB
34
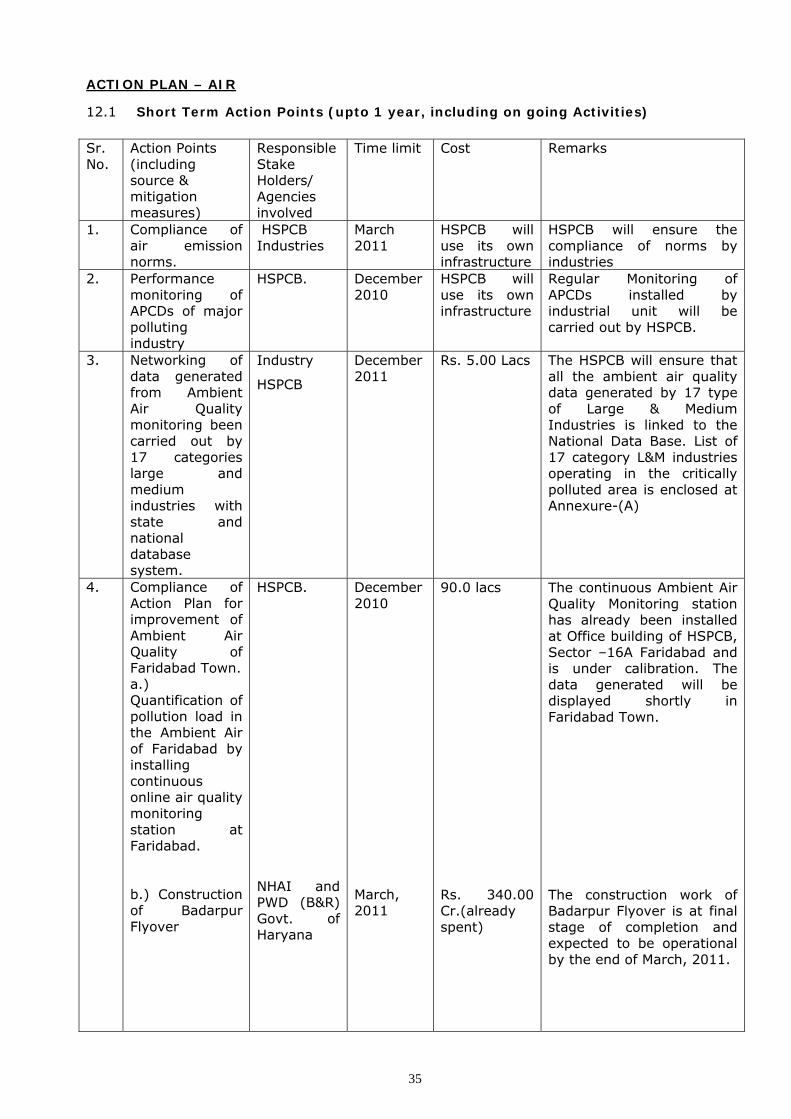
ACTION PLAN – AIR
12.1 Short Term Action Points (upto 1 year, including on going Activities)
Sr. No.
Action Points (including source & mitigation measures)
Responsible Stake Holders/ Agencies involved
Time limit Cost Remarks
1. Compliance of air emission norms.
HSPCB Industries
March 2011
HSPCB will use its own infrastructure
HSPCB will ensure the compliance of norms by industries
2. Performance monitoring of APCDs of major polluting industry
HSPCB. December 2010
HSPCB will use its own infrastructure
Regular Monitoring of APCDs installed by industrial unit will be carried out by HSPCB.
3. Networking of data generated from Ambient Air Quality monitoring been carried out by 17 categories large and medium industries with state and national database system.
Industry
HSPCB
December 2011
Rs. 5.00 Lacs The HSPCB will ensure that all the ambient air quality data generated by 17 type of Large & Medium Industries is linked to the National Data Base. List of 17 category L&M industries operating in the critically polluted area is enclosed at Annexure-(A)
4. Compliance of Action Plan for improvement of Ambient Air Quality of Faridabad Town. a.) Quantification of pollution load in the Ambient Air of Faridabad by installing continuous online air quality monitoring station at Faridabad. b.) Construction of Badarpur Flyover
HSPCB.
NHAI and PWD (B&R) Govt. of Haryana
December 2010 March, 2011
90.0 lacs Rs. 340.00 Cr.(already spent)
The continuous Ambient Air Quality Monitoring station has already been installed at Office building of HSPCB, Sector –16A Faridabad and is under calibration. The data generated will be displayed shortly in Faridabad Town. The construction work of Badarpur Flyover is at final stage of completion and expected to be operational by the end of March, 2011.
35
Sr. No.
Action Points (including source & mitigation measures)
Responsible Time limit Cost Remarks Stake Holders/ Agencies involved
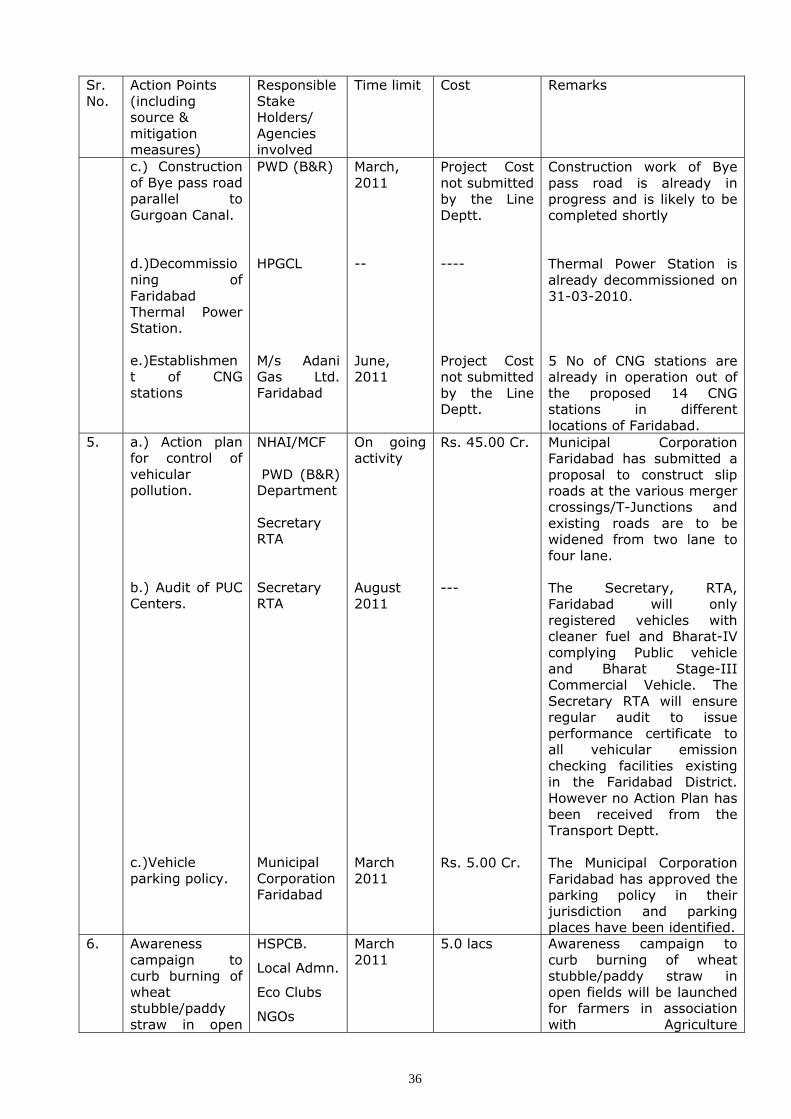
c.) Construction of Bye pass road parallel to Gurgoan Canal. d.)Decommissioning of Faridabad Thermal Power Station. e.)Establishment of CNG stations
PWD (B&R) HPGCL M/s Adani Gas Ltd. Faridabad
March, 2011 -- June, 2011
Project Cost not submitted by the Line Deptt. ---- Project Cost not submitted by the Line Deptt.
Construction work of Bye pass road is already in progress and is likely to be completed shortly Thermal Power Station is already decommissioned on 31-03-2010. 5 No of CNG stations are already in operation out of the proposed 14 CNG stations in different locations of Faridabad.
5. a.) Action plan for control of vehicular pollution. b.) Audit of PUC Centers. c.)Vehicle parking policy.
NHAI/MCF PWD (B&R) Department Secretary RTA Secretary RTA Municipal Corporation Faridabad
On going activity August 2011 March 2011
Rs. 45.00 Cr. --- Rs. 5.00 Cr.
Municipal Corporation Faridabad has submitted a proposal to construct slip roads at the various merger crossings/T-Junctions and existing roads are to be widened from two lane to four lane. The Secretary, RTA, Faridabad will only registered vehicles with cleaner fuel and Bharat-IV complying Public vehicle and Bharat Stage-III Commercial Vehicle. The Secretary RTA will ensure regular audit to issue performance certificate to all vehicular emission checking facilities existing in the Faridabad District. However no Action Plan has been received from the Transport Deptt. The Municipal Corporation Faridabad has approved the parking policy in their jurisdiction and parking places have been identified.
6. Awareness campaign to curb burning of wheat stubble/paddy straw in open
HSPCB.
Local Admn.
Eco Clubs
NGOs
March 2011
5.0 lacs Awareness campaign to curb burning of wheat stubble/paddy straw in open fields will be launched for farmers in association with Agriculture
36
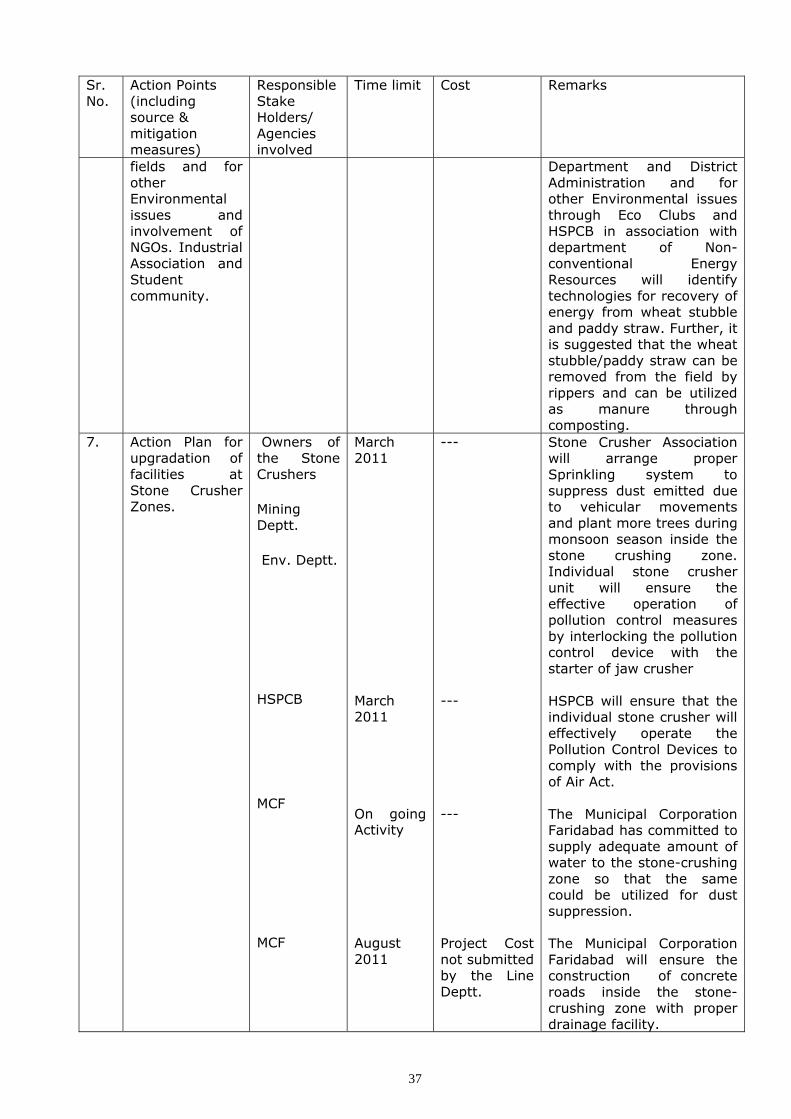
Sr. No.
Action Points (including source & mitigation measures)
Responsible Time limit Cost Remarks Stake Holders/ Agencies involved
fields and for other Environmental issues and involvement of NGOs. Industrial Association and Student community.
Department and District Administration and for other Environmental issues through Eco Clubs and HSPCB in association with department of Non-conventional Energy Resources will identify technologies for recovery of energy from wheat stubble and paddy straw. Further, it is suggested that the wheat stubble/paddy straw can be removed from the field by rippers and can be utilized as manure through composting.
7. Action Plan for upgradation of facilities at Stone Crusher Zones.
Owners of the Stone Crushers
Mining Deptt.
Env. Deptt.
HSPCB
MCF
MCF
March 2011 March 2011 On going Activity August 2011
--- --- --- Project Cost not submitted by the Line Deptt.
Stone Crusher Association will arrange proper Sprinkling system to suppress dust emitted due to vehicular movements and plant more trees during monsoon season inside the stone crushing zone. Individual stone crusher unit will ensure the effective operation of pollution control measures by interlocking the pollution control device with the starter of jaw crusher HSPCB will ensure that the individual stone crusher will effectively operate the Pollution Control Devices to comply with the provisions of Air Act. The Municipal Corporation Faridabad has committed to supply adequate amount of water to the stone-crushing zone so that the same could be utilized for dust suppression. The Municipal Corporation Faridabad will ensure the construction of concrete roads inside the stone-crushing zone with proper drainage facility.
37
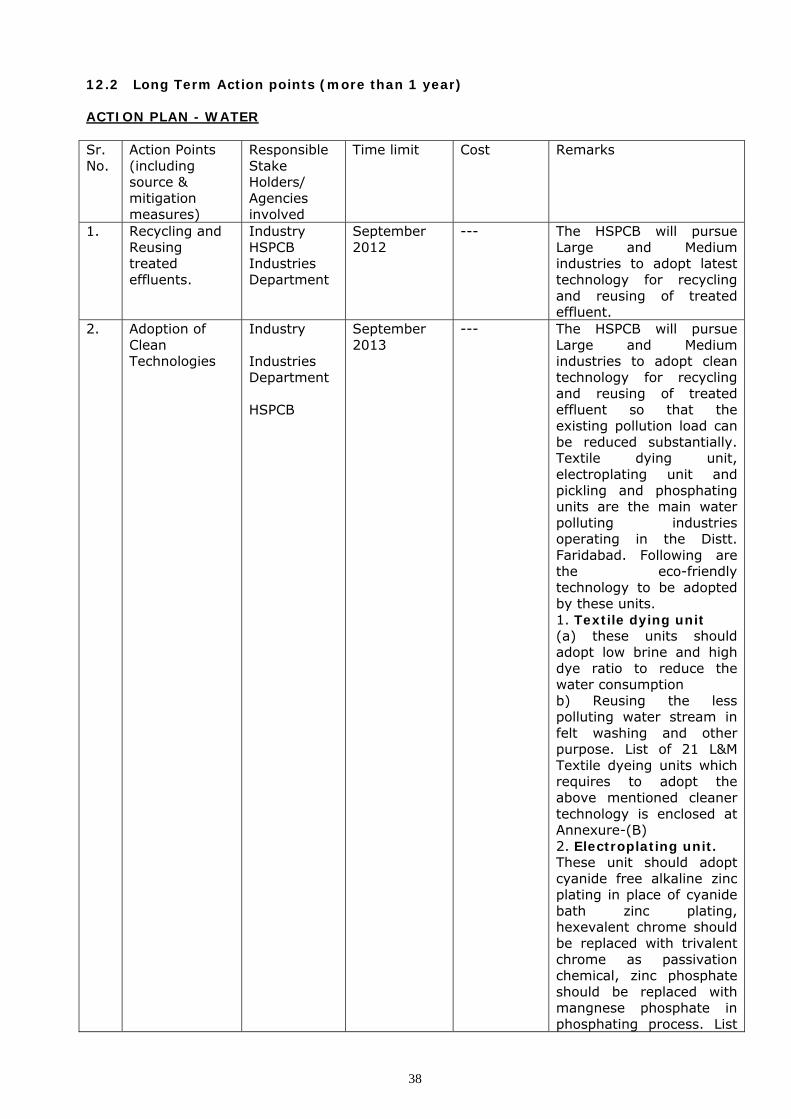
12.2 Long Term Action points (more than 1 year) ACTION PLAN - WATER Sr. No.
Action Points (including source & mitigation measures)
Responsible Stake Holders/ Agencies involved
Time limit Cost Remarks
1. Recycling and Reusing treated effluents.
Industry HSPCB Industries Department
September 2012
--- The HSPCB will pursue Large and Medium industries to adopt latest technology for recycling and reusing of treated effluent.
2. Adoption of Clean Technologies
Industry September 2013
--- The HSPCB will pursue Large and Medium industries to adopt clean technology for recycling and reusing of treated effluent so that the existing pollution load can be reduced substantially. Textile dying unit, electroplating unit and pickling and phosphating units are the main water polluting industries operating in the Distt. Faridabad. Following are the eco-friendly technology to be adopted by these units. 1. Textile dying unit (a) these units should adopt low brine and high dye ratio to reduce the water consumption b) Reusing the less polluting water stream in felt washing and other purpose. List of 21 L&M Textile dyeing units which requires to adopt the above mentioned cleaner technology is enclosed at Annexure-(B) 2. Electroplating unit.
Industries Department HSPCB
These unit should adopt cyanide free alkaline zinc plating in place of cyanide bath zinc plating, hexevalent chrome should be replaced with trivalent chrome as passivation chemical, zinc phosphate should be replaced with mangnese phosphate in phosphating process. List
38
Sr. No.
Action Points (including source & mitigation measures)
Responsible Stake Holders/ Agencies involved
Time limit Cost Remarks
of 36 L&M Electroplating and Phosphating units which requires to adopt the above mentioned cleaner technology is enclosed at Annexure-(C).
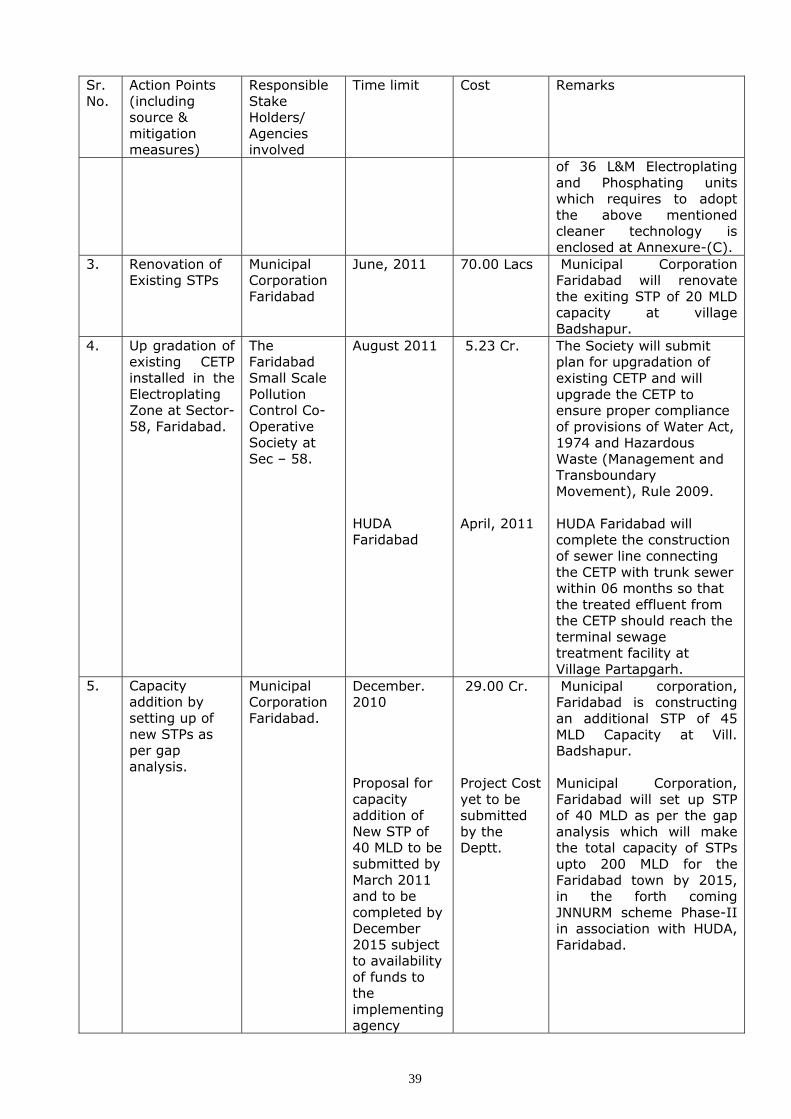
3. Renovation of Existing STPs
Municipal Corporation Faridabad
June, 2011 70.00 Lacs Municipal Corporation Faridabad will renovate the exiting STP of 20 MLD capacity at village Badshapur.
4. Up gradation of existing CETP installed in the Electroplating Zone at Sector-58, Faridabad.
The Faridabad Small Scale Pollution Control Co-Operative Society at Sec – 58.
August 2011 HUDA Faridabad
5.23 Cr. April, 2011
The Society will submit plan for upgradation of existing CETP and will upgrade the CETP to ensure proper compliance of provisions of Water Act, 1974 and Hazardous Waste (Management and Transboundary Movement), Rule 2009. HUDA Faridabad will complete the construction of sewer line connecting the CETP with trunk sewer within 06 months so that the treated effluent from the CETP should reach the terminal sewage treatment facility at Village Partapgarh.
5. Capacity addition by setting up of new STPs as per gap analysis.
Municipal Corporation Faridabad.
December. 2010 Proposal for capacity addition of New STP of 40 MLD to be submitted by March 2011 and to be completed by December 2015 subject to availability of funds to the implementing agency
29.00 Cr. Project Cost yet to be submitted by the Deptt.
Municipal corporation, Faridabad is constructing an additional STP of 45 MLD Capacity at Vill. Badshapur. Municipal Corporation, Faridabad will set up STP of 40 MLD as per the gap analysis which will make the total capacity of STPs upto 200 MLD for the Faridabad town by 2015, in the forth coming JNNURM scheme Phase-II in association with HUDA, Faridabad.
39
Sr. No.
Action Points (including source & mitigation measures)
Responsible Stake Holders/ Agencies involved
Time limit Cost Remarks
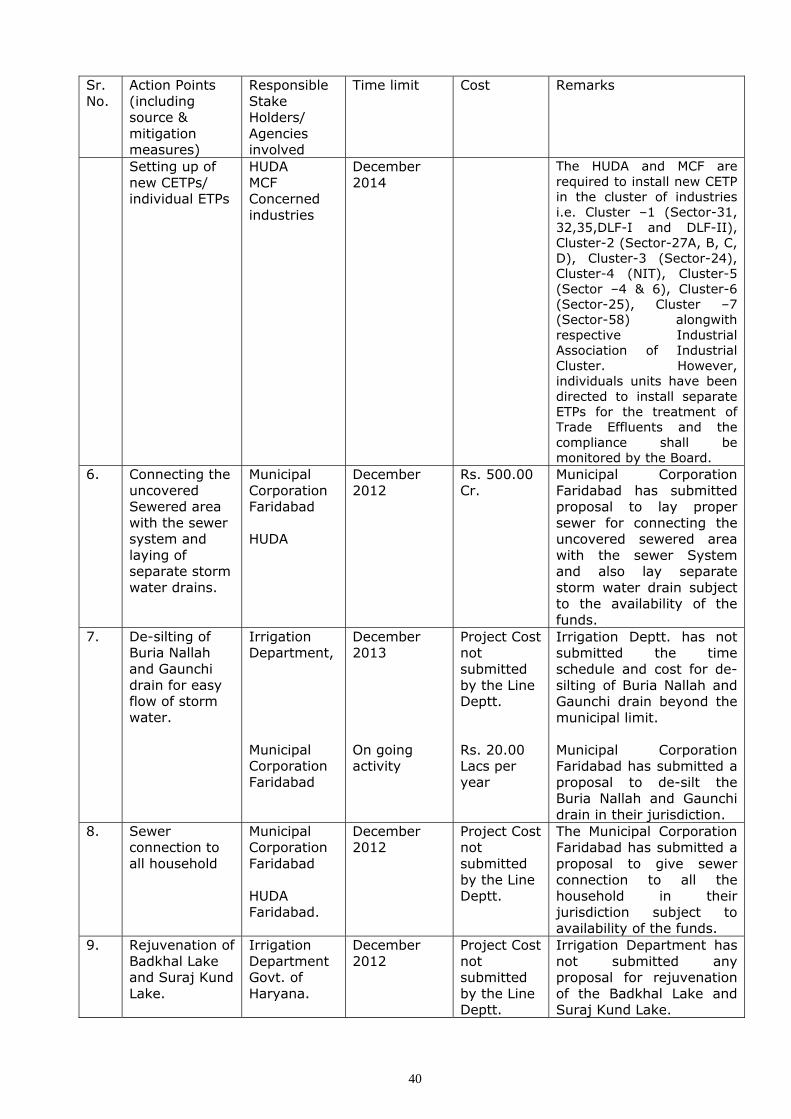
Setting up of new CETPs/ individual ETPs
HUDA MCF Concerned industries
December 2014
The HUDA and MCF are required to install new CETP in the cluster of industries i.e. Cluster –1 (Sector-31, 32,35,DLF-I and DLF-II), Cluster-2 (Sector-27A, B, C, D), Cluster-3 (Sector-24), Cluster-4 (NIT), Cluster-5 (Sector –4 & 6), Cluster-6 (Sector-25), Cluster –7 (Sector-58) alongwith respective Industrial Association of Industrial Cluster. However, individuals units have been directed to install separate ETPs for the treatment of Trade Effluents and the compliance shall be monitored by the Board.
6. Connecting the uncovered Sewered area with the sewer system and laying of separate storm water drains.
Municipal Corporation Faridabad HUDA
December 2012
Rs. 500.00 Cr.
Municipal Corporation Faridabad has submitted proposal to lay proper sewer for connecting the uncovered sewered area with the sewer System and also lay separate storm water drain subject to the availability of the funds.
7. De-silting of Buria Nallah and Gaunchi drain for easy flow of storm water.
Irrigation Department, Municipal Corporation Faridabad
December 2013 On going activity
Project Cost not submitted by the Line Deptt. Rs. 20.00 Lacs per year
Irrigation Deptt. has not submitted the time schedule and cost for de-silting of Buria Nallah and Gaunchi drain beyond the municipal limit. Municipal Corporation Faridabad has submitted a proposal to de-silt the Buria Nallah and Gaunchi drain in their jurisdiction.
8. Sewer connection to all household
Municipal Corporation Faridabad HUDA Faridabad.
December 2012
Project Cost not submitted by the Line Deptt.
The Municipal Corporation Faridabad has submitted a proposal to give sewer connection to all the household in their jurisdiction subject to availability of the funds.
9. Rejuvenation of Badkhal Lake and Suraj Kund Lake.
Irrigation Department Govt. of Haryana.
December 2012
Project Cost not submitted by the Line Deptt.
Irrigation Department has not submitted any proposal for rejuvenation of the Badkhal Lake and Suraj Kund Lake.
40
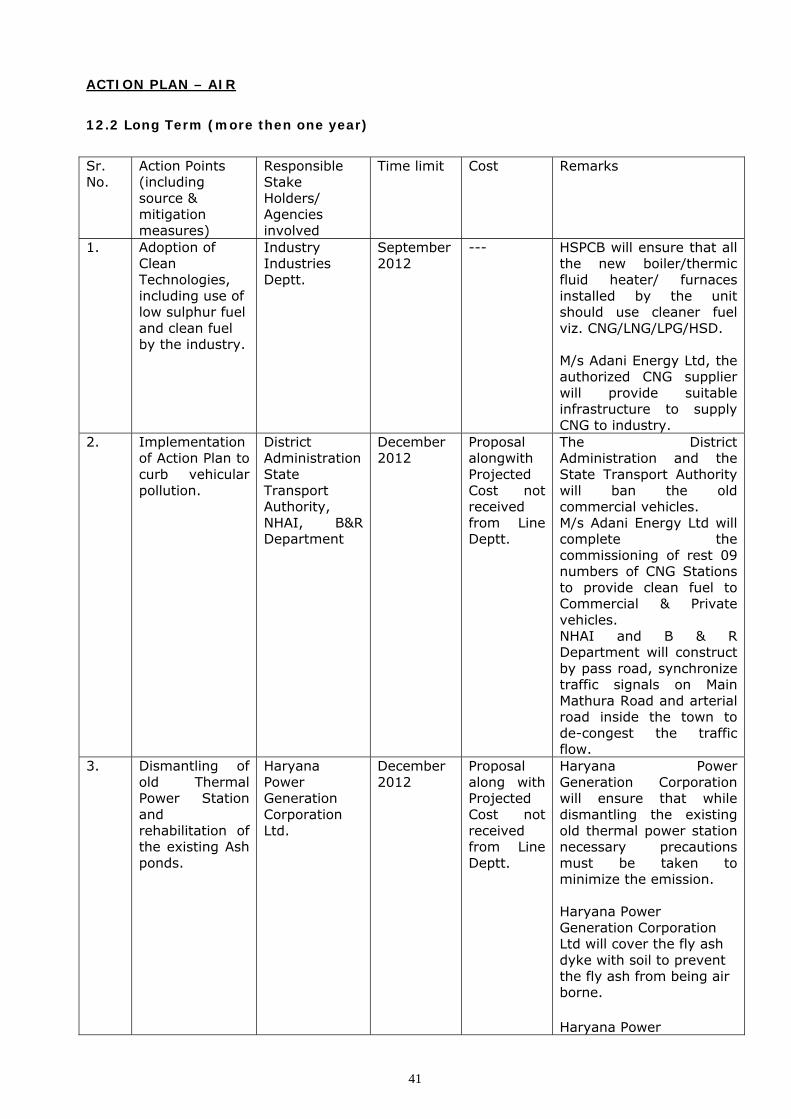
ACTION PLAN – AIR
12.2 Long Term (more then one year)
Sr. No.
Action Points (including source & mitigation measures)
Responsible Stake Holders/ Agencies involved
Time limit Cost Remarks
1. Adoption of Clean Technologies, including use of low sulphur fuel and clean fuel by the industry.
Industry Industries Deptt.
September 2012
--- HSPCB will ensure that all the new boiler/thermic fluid heater/ furnaces installed by the unit should use cleaner fuel viz. CNG/LNG/LPG/HSD. M/s Adani Energy Ltd, the authorized CNG supplier will provide suitable infrastructure to supply CNG to industry.
2. Implementation of Action Plan to curb vehicular pollution.
District Administration
December 2012
State Transport Authority, NHAI, B&R Department
Proposal alongwith Projected Cost not received from Line Deptt.
The District Administration and the State Transport Authority will ban the old commercial vehicles. M/s Adani Energy Ltd will complete the commissioning of rest 09 numbers of CNG Stations to provide clean fuel to Commercial & Private vehicles. NHAI and B & R Department will construct by pass road, synchronize traffic signals on Main Mathura Road and arterial road inside the town to de-congest the traffic flow.
3. Dismantling of old Thermal Power Station and rehabilitation of the existing Ash ponds.
Haryana Power Generation Corporation Ltd.
December 2012
Proposal along with Projected Cost not received from Line Deptt.
Haryana Power Generation Corporation will ensure that while dismantling the existing old thermal power station necessary precautions must be taken to minimize the emission. Haryana Power Generation Corporation Ltd will cover the fly ash dyke with soil to prevent the fly ash from being air borne.
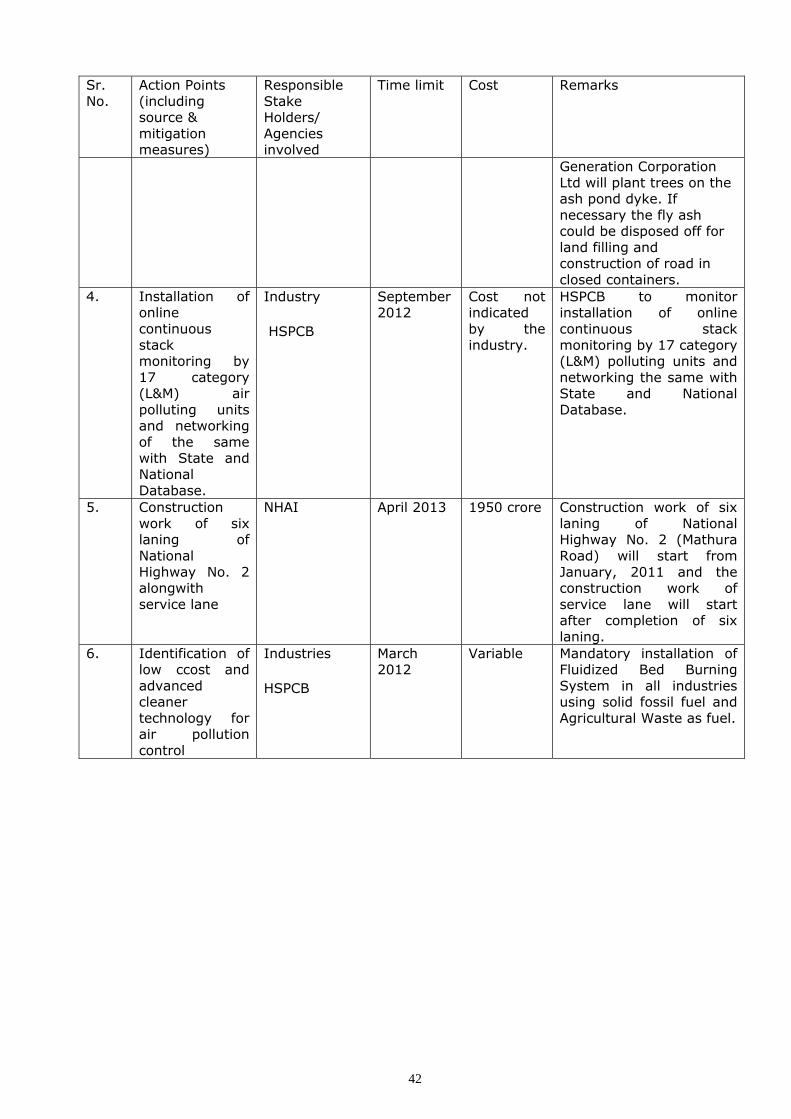
Haryana Power
41
Sr. No.
Action Points (including source & mitigation measures)
Responsible Stake Holders/ Agencies involved
Time limit Cost Remarks
Generation Corporation Ltd will plant trees on the ash pond dyke. If necessary the fly ash could be disposed off for land filling and construction of road in closed containers.
4. Installation of online continuous stack monitoring by 17 category (L&M) air polluting units and networking of the same with State and National Database.
Industry
HSPCB
September 2012
Cost not indicated by the industry.
HSPCB to monitor installation of online continuous stack monitoring by 17 category (L&M) polluting units and networking the same with State and National Database.
5. Construction work of six laning of National Highway No. 2 alongwith service lane
NHAI April 2013 1950 crore Construction work of six laning of National Highway No. 2 (Mathura Road) will start from January, 2011 and the construction work of service lane will start after completion of six laning.
6. Identification of low ccost and advanced cleaner technology for air pollution control
Industries
HSPCB
March 2012
Variable Mandatory installation of Fluidized Bed Burning System in all industries using solid fossil fuel and Agricultural Waste as fuel.
42
- 43 -
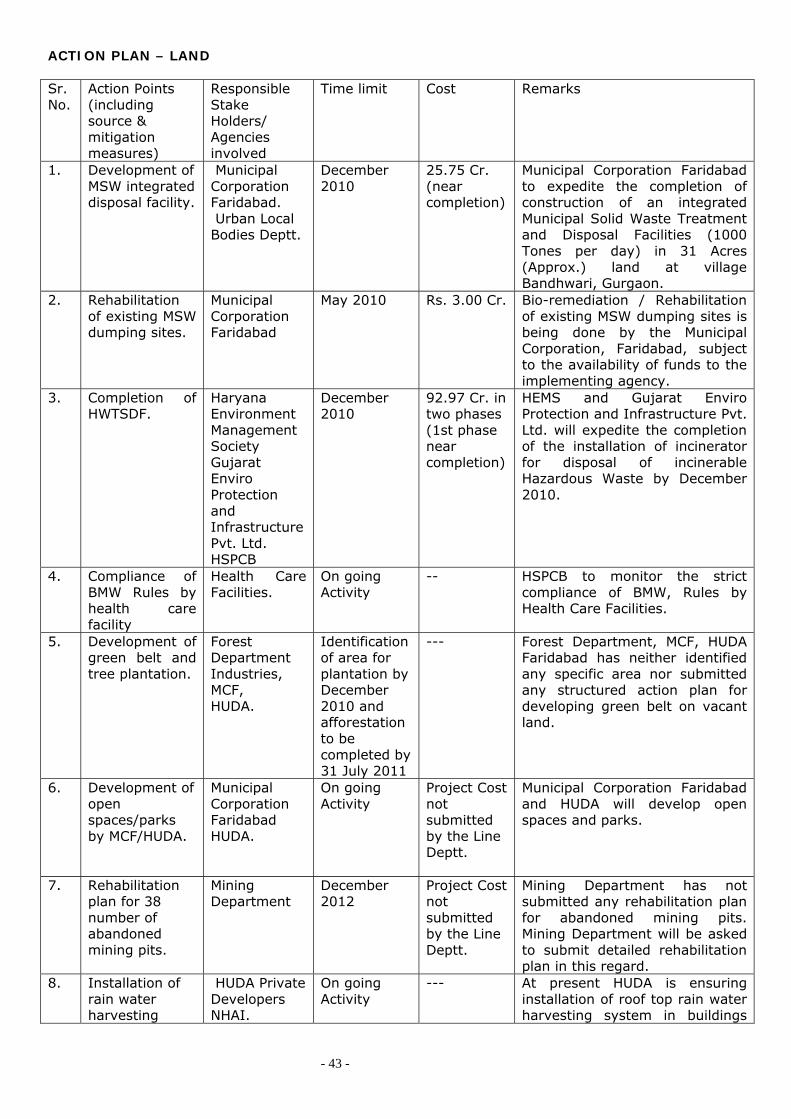
ACTION PLAN – LAND Sr. No.
Action Points (including source & mitigation measures)
Responsible Stake Holders/ Agencies involved
Time limit Cost Remarks
1. Development of MSW integrated disposal facility.
Municipal Corporation Faridabad. Urban Local Bodies Deptt.
December 2010
25.75 Cr. (near completion)
Municipal Corporation Faridabad to expedite the completion of construction of an integrated Municipal Solid Waste Treatment and Disposal Facilities (1000 Tones per day) in 31 Acres (Approx.) land at village Bandhwari, Gurgaon.
2. Rehabilitation of existing MSW dumping sites.
Municipal Corporation Faridabad
May 2010 Rs. 3.00 Cr.
Bio-remediation / Rehabilitation of existing MSW dumping sites is being done by the Municipal Corporation, Faridabad, subject to the availability of funds to the implementing agency.
3. Completion of HWTSDF.
Haryana Environment Management Society Gujarat Enviro Protection and Infrastructure Pvt. Ltd. HSPCB
December 2010
92.97 Cr. in two phases (1st phase near completion)
HEMS and Gujarat Enviro Protection and Infrastructure Pvt. Ltd. will expedite the completion of the installation of incinerator for disposal of incinerable Hazardous Waste by December 2010.
4. Compliance of BMW Rules by health care facility
Health Care Facilities.
On going Activity
-- HSPCB to monitor the strict compliance of BMW, Rules by Health Care Facilities.
5. Development of green belt and tree plantation.
Forest Department Industries, MCF, HUDA.
Identification of area for plantation by December 2010 and afforestation to be completed by 31 July 2011
--- Forest Department, MCF, HUDA Faridabad has neither identified any specific area nor submitted any structured action plan for developing green belt on vacant land.
6. Development of open spaces/parks by MCF/HUDA.
Municipal Corporation Faridabad HUDA.
On going Activity
Project Cost not submitted by the Line Deptt.
Municipal Corporation Faridabad and HUDA will develop open spaces and parks.
7. Rehabilitation plan for 38 number of abandoned mining pits.
Mining Department
December 2012
Project Cost not submitted by the Line Deptt.
Mining Department has not submitted any rehabilitation plan for abandoned mining pits. Mining Department will be asked to submit detailed rehabilitation plan in this regard.
8. Installation of rain water harvesting
HUDA Private Developers NHAI.
On going Activity
--- At present HUDA is ensuring installation of roof top rain water harvesting system in buildings
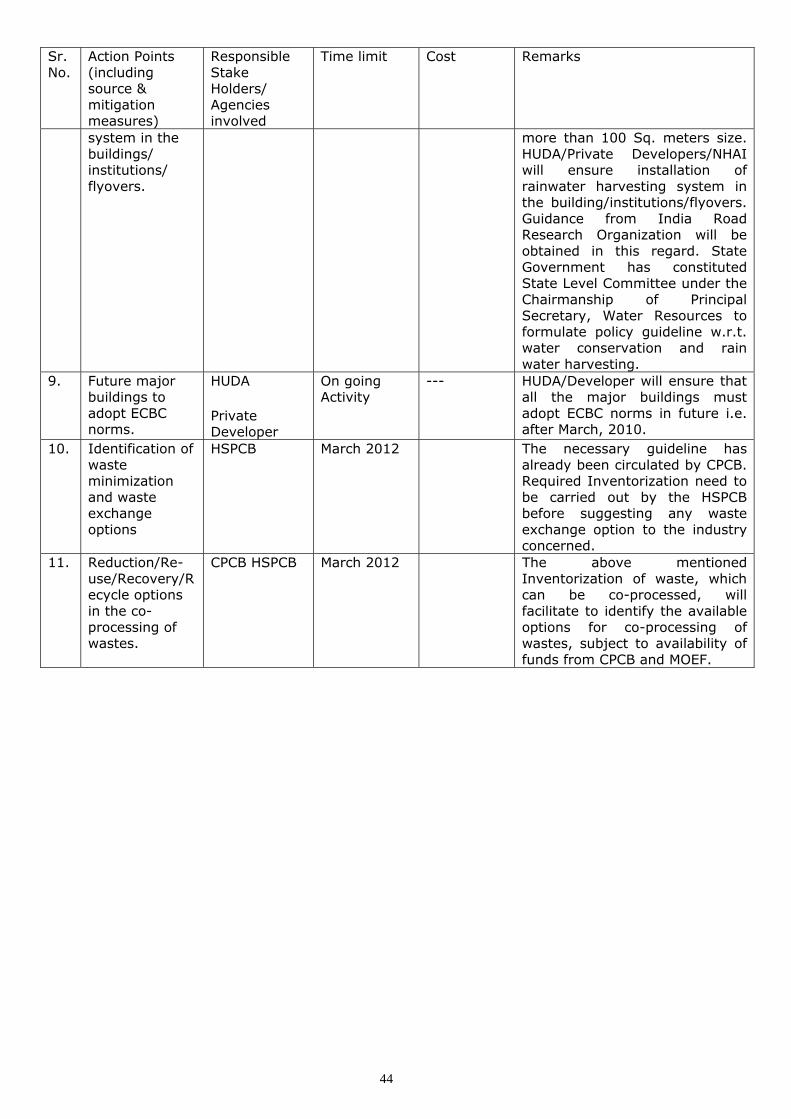
Sr. No.
Action Points (including source & mitigation measures)
Responsible Stake Holders/ Agencies involved
Time limit Cost Remarks
system in the buildings/ institutions/ flyovers.
more than 100 Sq. meters size. HUDA/Private Developers/NHAI will ensure installation of rainwater harvesting system in the building/institutions/flyovers. Guidance from India Road Research Organization will be obtained in this regard. State Government has constituted State Level Committee under the Chairmanship of Principal Secretary, Water Resources to formulate policy guideline w.r.t. water conservation and rain water harvesting.
9. Future major buildings to adopt ECBC norms.
HUDA
Private Developer
On going Activity
---
HUDA/Developer will ensure that all the major buildings must adopt ECBC norms in future i.e. after March, 2010.
10. Identification of waste minimization and waste exchange options
HSPCB March 2012 The necessary guideline has already been circulated by CPCB. Required Inventorization need to be carried out by the HSPCB before suggesting any waste exchange option to the industry concerned.
11. Reduction/Re-use/Recovery/Recycle options in the co-processing of wastes.
CPCB HSPCB March 2012 The above mentioned Inventorization of waste, which can be co-processed, will facilitate to identify the available options for co-processing of wastes, subject to availability of funds from CPCB and MOEF.
44
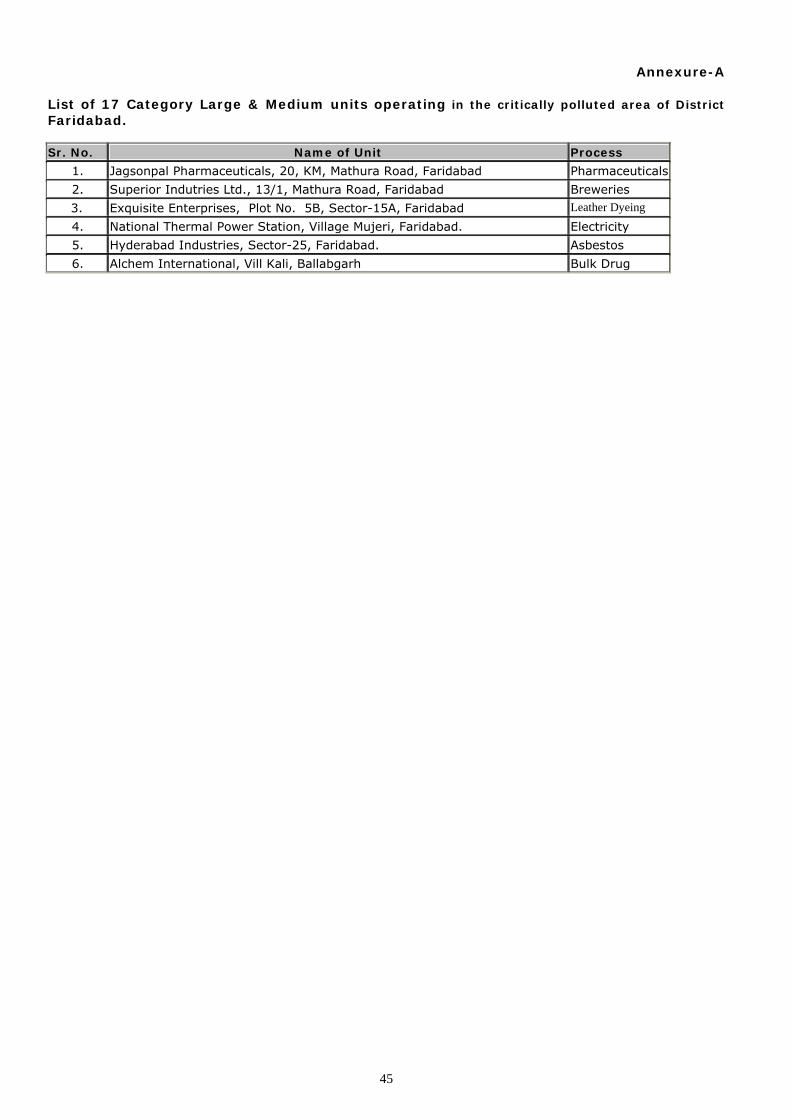
Annexure-A
List of 17 Category Large & Medium units operating in the critically polluted area of District Faridabad. Sr. No. Name of Unit Process
1. Jagsonpal Pharmaceuticals, 20, KM, Mathura Road, Faridabad Pharmaceuticals
2. Superior Indutries Ltd., 13/1, Mathura Road, Faridabad Breweries Leather Dyeing Exquisite Enterprises, Plot No. 5B, Sector-15A, Faridabad 3.
4. National Thermal Power Station, Village Mujeri, Faridabad. Electricity
5. Hyderabad Industries, Sector-25, Faridabad. Asbestos
Alchem International, Vill Kali, Ballabgarh Bulk Drug 6.
45
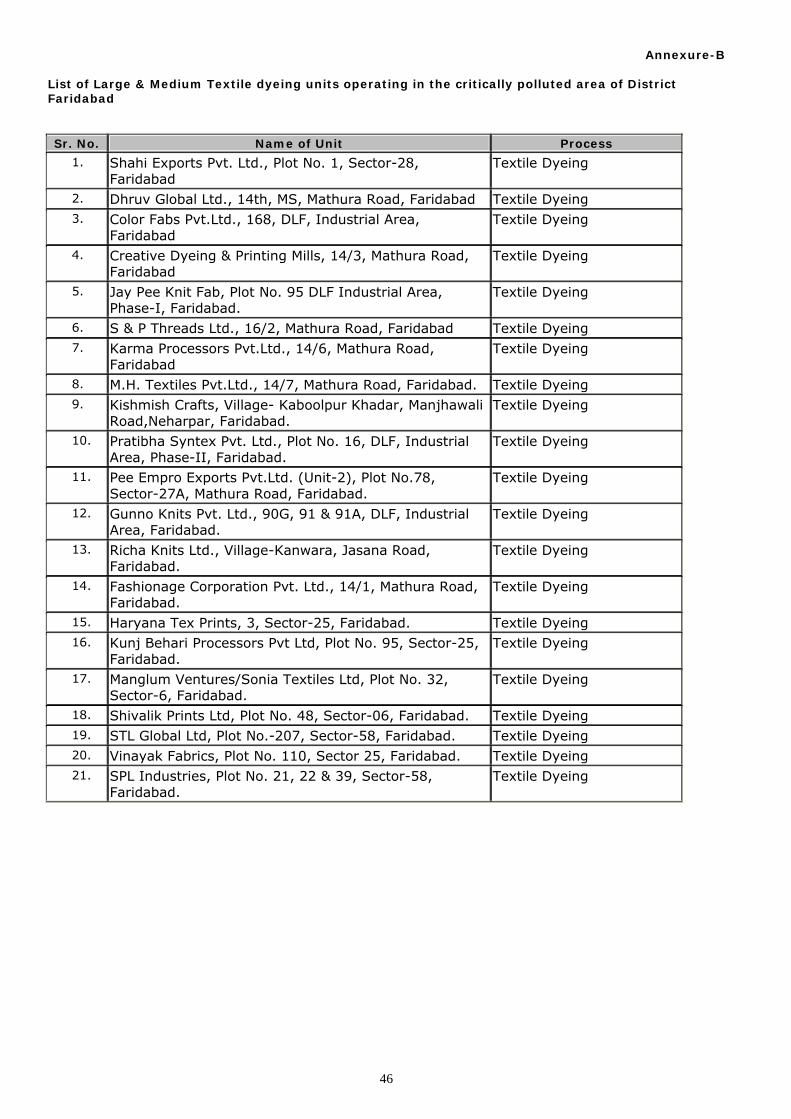
Annexure-B List of Large & Medium Textile dyeing units operating in the critically polluted area of District Faridabad
Name of Unit Sr. No. Process
Shahi Exports Pvt. Ltd., Plot No. 1, Sector-28, Faridabad
Textile Dyeing 1.
Dhruv Global Ltd., 14th, MS, Mathura Road, Faridabad Textile Dyeing 2.
Color Fabs Pvt.Ltd., 168, DLF, Industrial Area, Faridabad
Textile Dyeing 3.
Creative Dyeing & Printing Mills, 14/3, Mathura Road, Faridabad
Textile Dyeing 4.
Jay Pee Knit Fab, Plot No. 95 DLF Industrial Area, Phase-I, Faridabad.
Textile Dyeing 5.
S & P Threads Ltd., 16/2, Mathura Road, Faridabad Textile Dyeing 6.
Karma Processors Pvt.Ltd., 14/6, Mathura Road, Faridabad
Textile Dyeing 7.
M.H. Textiles Pvt.Ltd., 14/7, Mathura Road, Faridabad. Textile Dyeing 8.
Kishmish Crafts, Village- Kaboolpur Khadar, Manjhawali Road,Neharpar, Faridabad.
Textile Dyeing 9.
Pratibha Syntex Pvt. Ltd., Plot No. 16, DLF, Industrial Area, Phase-II, Faridabad.
Textile Dyeing 10.
Pee Empro Exports Pvt.Ltd. (Unit-2), Plot No.78, Sector-27A, Mathura Road, Faridabad.
Textile Dyeing 11.
Gunno Knits Pvt. Ltd., 90G, 91 & 91A, DLF, Industrial Area, Faridabad.
Textile Dyeing 12.
Richa Knits Ltd., Village-Kanwara, Jasana Road, Faridabad.
Textile Dyeing 13.
Fashionage Corporation Pvt. Ltd., 14/1, Mathura Road, Faridabad.
Textile Dyeing 14.
Haryana Tex Prints, 3, Sector-25, Faridabad. Textile Dyeing 15.
Kunj Behari Processors Pvt Ltd, Plot No. 95, Sector-25, Faridabad.
Textile Dyeing 16.
Manglum Ventures/Sonia Textiles Ltd, Plot No. 32, Sector-6, Faridabad.
Textile Dyeing 17.
Shivalik Prints Ltd, Plot No. 48, Sector-06, Faridabad. Textile Dyeing 18.
STL Global Ltd, Plot No.-207, Sector-58, Faridabad. Textile Dyeing 19.
Vinayak Fabrics, Plot No. 110, Sector 25, Faridabad. Textile Dyeing 20.
SPL Industries, Plot No. 21, 22 & 39, Sector-58, Faridabad.
Textile Dyeing 21.
46
Annexure-C
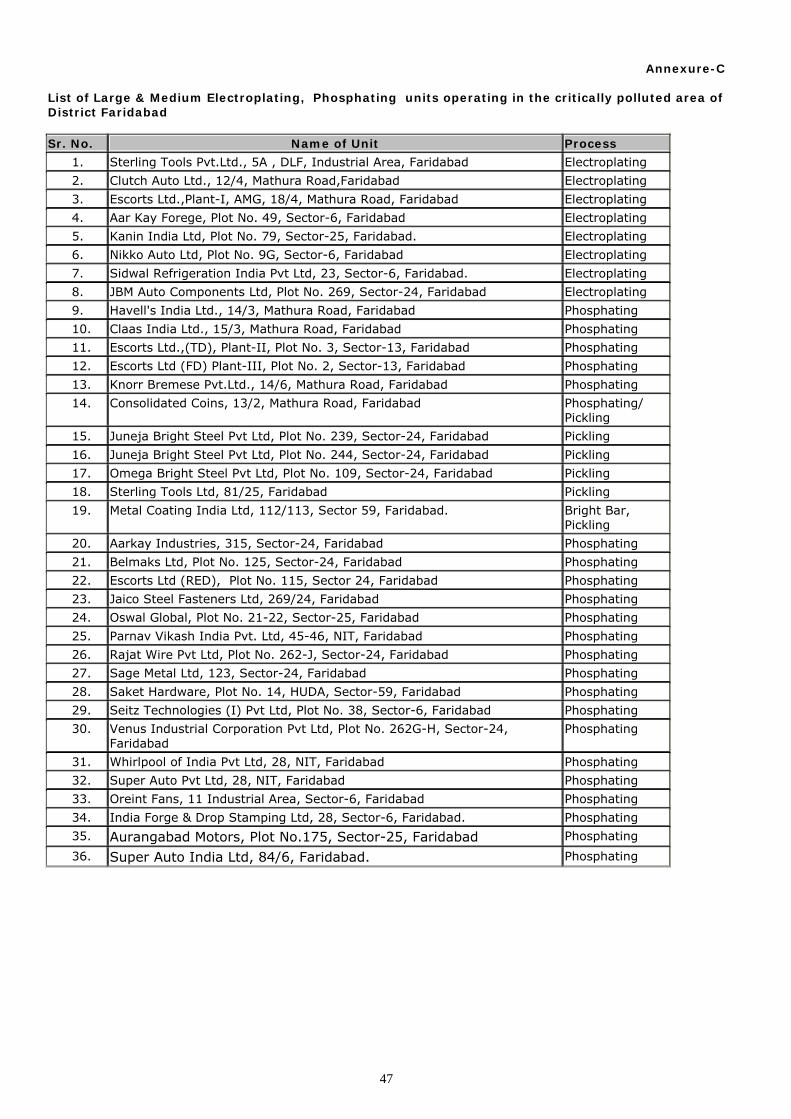
List of Large & Medium Electroplating, Phosphating units operating in the critically polluted area of District Faridabad Sr. No. Name of Unit Process
Sterling Tools Pvt.Ltd., 5A , DLF, Industrial Area, Faridabad Electroplating 1.
Clutch Auto Ltd., 12/4, Mathura Road,Faridabad Electroplating 2.
Escorts Ltd.,Plant-I, AMG, 18/4, Mathura Road, Faridabad Electroplating 3.
Electroplating 4. Aar Kay Forege, Plot No. 49, Sector-6, Faridabad
Electroplating 5. Kanin India Ltd, Plot No. 79, Sector-25, Faridabad.
Nikko Auto Ltd, Plot No. 9G, Sector-6, Faridabad Electroplating 6.
Sidwal Refrigeration India Pvt Ltd, 23, Sector-6, Faridabad. Electroplating 7.
JBM Auto Components Ltd, Plot No. 269, Sector-24, Faridabad Electroplating 8.
Havell's India Ltd., 14/3, Mathura Road, Faridabad Phosphating 9.
Claas India Ltd., 15/3, Mathura Road, Faridabad Phosphating 10.
Escorts Ltd.,(TD), Plant-II, Plot No. 3, Sector-13, Faridabad Phosphating 11.
Escorts Ltd (FD) Plant-III, Plot No. 2, Sector-13, Faridabad Phosphating 12.
Knorr Bremese Pvt.Ltd., 14/6, Mathura Road, Faridabad Phosphating 13.
Consolidated Coins, 13/2, Mathura Road, Faridabad Phosphating/ Pickling
14.
Juneja Bright Steel Pvt Ltd, Plot No. 239, Sector-24, Faridabad Pickling 15.
Juneja Bright Steel Pvt Ltd, Plot No. 244, Sector-24, Faridabad Pickling 16.
Omega Bright Steel Pvt Ltd, Plot No. 109, Sector-24, Faridabad Pickling 17.
Sterling Tools Ltd, 81/25, Faridabad Pickling 18.
Metal Coating India Ltd, 112/113, Sector 59, Faridabad. Bright Bar, Pickling
19.
Aarkay Industries, 315, Sector-24, Faridabad Phosphating 20.
Belmaks Ltd, Plot No. 125, Sector-24, Faridabad Phosphating 21.
Escorts Ltd (RED), Plot No. 115, Sector 24, Faridabad Phosphating 22.
Jaico Steel Fasteners Ltd, 269/24, Faridabad Phosphating 23.
Oswal Global, Plot No. 21-22, Sector-25, Faridabad Phosphating 24.
Parnav Vikash India Pvt. Ltd, 45-46, NIT, Faridabad Phosphating 25.
Rajat Wire Pvt Ltd, Plot No. 262-J, Sector-24, Faridabad Phosphating 26.
Sage Metal Ltd, 123, Sector-24, Faridabad Phosphating 27.
Saket Hardware, Plot No. 14, HUDA, Sector-59, Faridabad Phosphating 28.
Seitz Technologies (I) Pvt Ltd, Plot No. 38, Sector-6, Faridabad Phosphating 29.
Venus Industrial Corporation Pvt Ltd, Plot No. 262G-H, Sector-24, Faridabad
Phosphating 30.
Whirlpool of India Pvt Ltd, 28, NIT, Faridabad Phosphating 31.
Super Auto Pvt Ltd, 28, NIT, Faridabad Phosphating 32.
Oreint Fans, 11 Industrial Area, Sector-6, Faridabad Phosphating 33.
India Forge & Drop Stamping Ltd, 28, Sector-6, Faridabad. Phosphating 34.
Aurangabad Motors, Plot No.175, Sector-25, Faridabad Phosphating 35.
Super Auto India Ltd, 84/6, Faridabad. Phosphating 36.
47
48
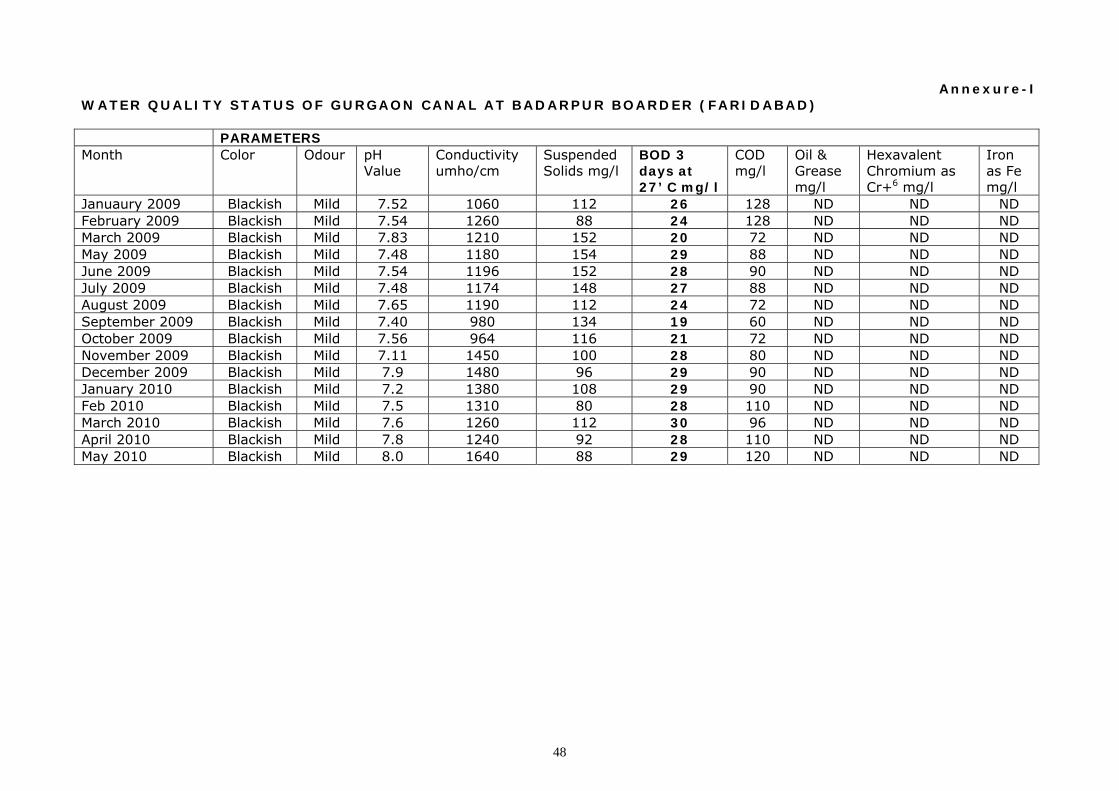
Annexure-I WATER QUALITY STATUS OF GURGAON CANAL AT BADARPUR BOARDER (FARIDABAD) PARAMETERS Month Color Odour pH
Value Conductivity umho/cm
Suspended Solids mg/l
BOD 3 days at 27’ C mg/l
COD mg/l
Oil & Grease mg/l
Hexavalent Chromium as Cr+6 mg/l
Iron as Fe mg/l
Januaury 2009 Blackish Mild 7.52 1060 112 26 128 ND ND ND February 2009 Blackish Mild 7.54 1260 88 24 128 ND ND ND March 2009 Blackish Mild 7.83 1210 152 20 72 ND ND ND May 2009 Blackish Mild 7.48 1180 154 29 88 ND ND ND June 2009 Blackish Mild 7.54 1196 152 28 90 ND ND ND July 2009 Blackish Mild 7.48 1174 148 27 88 ND ND ND August 2009 Blackish Mild 7.65 1190 112 24 72 ND ND ND September 2009 Blackish Mild 7.40 980 134 19 60 ND ND ND October 2009 Blackish Mild 7.56 964 116 21 72 ND ND ND November 2009 Blackish Mild 7.11 1450 100 28 80 ND ND ND December 2009 Blackish Mild 7.9 1480 96 29 90 ND ND ND January 2010 Blackish Mild 7.2 1380 108 29 90 ND ND ND Feb 2010 Blackish Mild 7.5 1310 80 28 110 ND ND ND March 2010 Blackish Mild 7.6 1260 112 30 96 ND ND ND April 2010 Blackish Mild 7.8 1240 92 28 110 ND ND ND May 2010 Blackish Mild 8.0 1640 88 29 120 ND ND ND
49
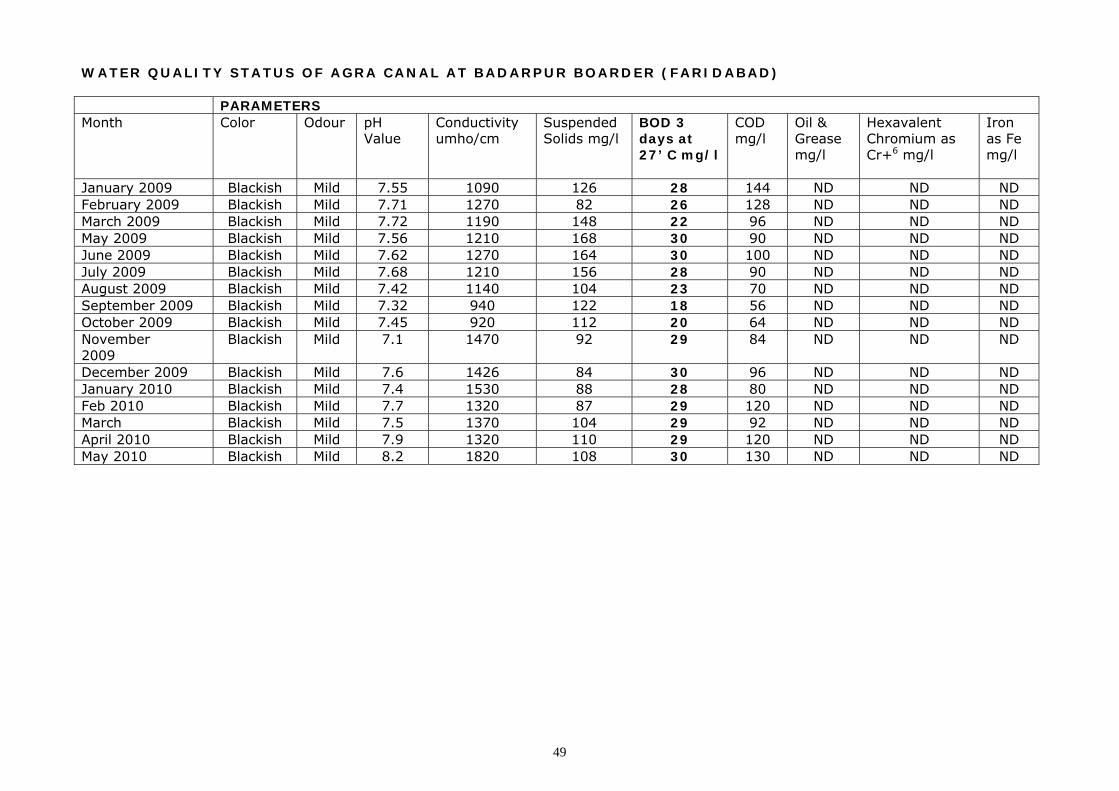
WATER QUALITY STATUS OF AGRA CANAL AT BADARPUR BOARDER (FARIDABAD) PARAMETERS Month Color Odour pH
Value Conductivity umho/cm
Suspended Solids mg/l
BOD 3 days at 27’ C mg/l
COD mg/l
Oil & Grease mg/l
Hexavalent Chromium as Cr+6 mg/l
Iron as Fe mg/l
January 2009 Blackish Mild 7.55 1090 126 28 144 ND ND ND February 2009 Blackish Mild 7.71 1270 82 26 128 ND ND ND March 2009 Blackish Mild 7.72 1190 148 22 96 ND ND ND May 2009 Blackish Mild 7.56 1210 168 30 90 ND ND ND June 2009 Blackish Mild 7.62 1270 164 30 100 ND ND ND July 2009 Blackish Mild 7.68 1210 156 28 90 ND ND ND August 2009 Blackish Mild 7.42 1140 104 23 70 ND ND ND September 2009 Blackish Mild 7.32 940 122 18 56 ND ND ND October 2009 Blackish Mild 7.45 920 112 20 64 ND ND ND November 2009
Blackish Mild 7.1 1470 92 29 84 ND ND ND
December 2009 Blackish Mild 7.6 1426 84 30 96 ND ND ND January 2010 Blackish Mild 7.4 1530 88 28 80 ND ND ND Feb 2010 Blackish Mild 7.7 1320 87 29 120 ND ND ND March Blackish Mild 7.5 1370 104 29 92 ND ND ND April 2010 Blackish Mild 7.9 1320 110 29 120 ND ND ND May 2010 Blackish Mild 8.2 1820 108 30 130 ND ND ND
50
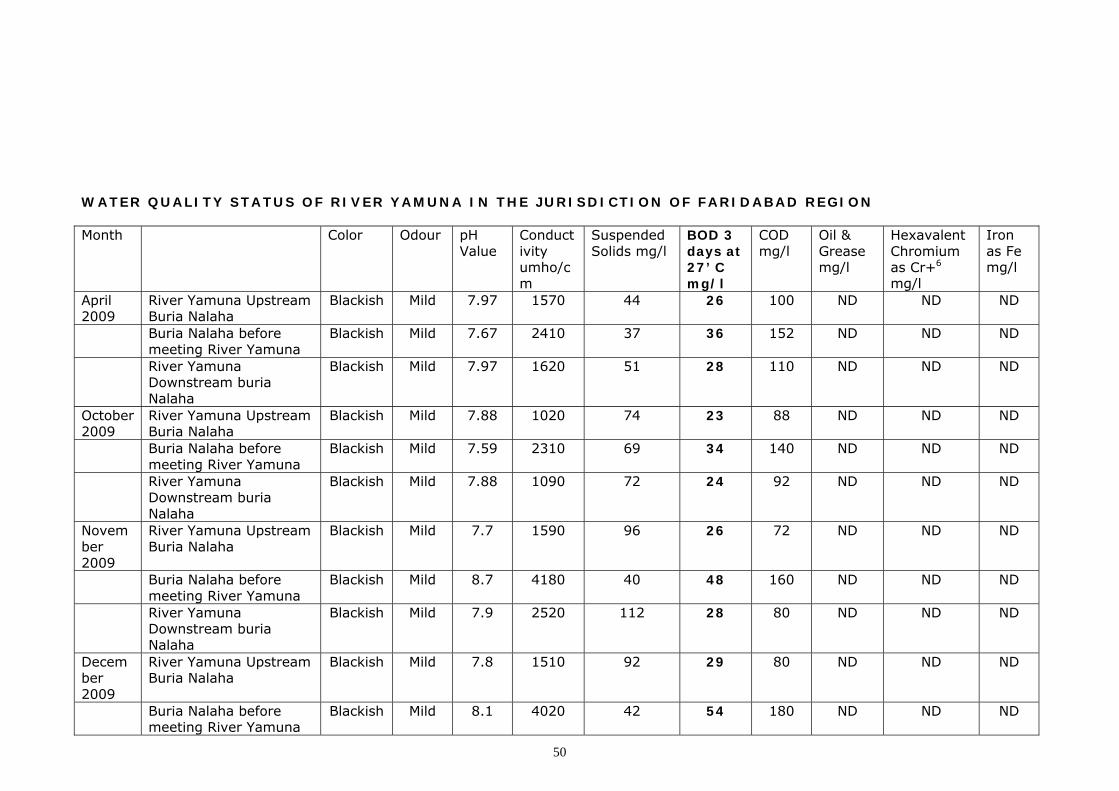
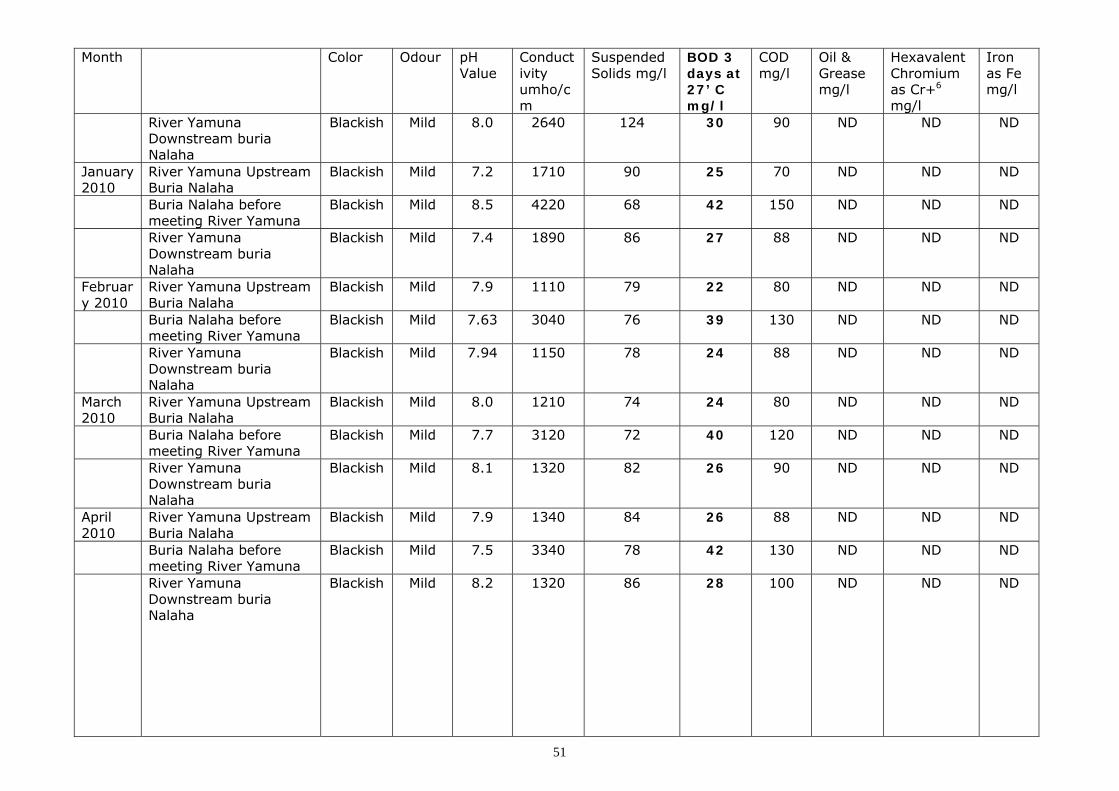
WATER QUALITY STATUS OF RIVER YAMUNA IN THE JURISDICTION OF FARIDABAD REGION Month Color Odour pH
Value Conductivity umho/cm
Suspended Solids mg/l
BOD 3 days at 27’ C mg/l
COD mg/l
Oil & Grease mg/l
Hexavalent Chromium as Cr+6 mg/l
Iron as Fe mg/l
April 2009
River Yamuna Upstream Buria Nalaha
Blackish Mild 7.97 1570 44 26 100 ND ND ND
Buria Nalaha before meeting River Yamuna
Blackish Mild 7.67 2410 37 36 152 ND ND ND
River Yamuna Downstream buria Nalaha
Blackish Mild 7.97 1620 51 28 110 ND ND ND
October 2009
River Yamuna Upstream Buria Nalaha
Blackish Mild 7.88 1020 74 23 88 ND ND ND
Buria Nalaha before meeting River Yamuna
Blackish Mild 7.59 2310 69 34 140 ND ND ND
River Yamuna Downstream buria Nalaha
Blackish Mild 7.88 1090 72 24 92 ND ND ND
November 2009
River Yamuna Upstream Buria Nalaha
Blackish Mild 7.7 1590 96 26 72 ND ND ND
Buria Nalaha before meeting River Yamuna
Blackish Mild 8.7 4180 40 48 160 ND ND ND
River Yamuna Downstream buria Nalaha
Blackish Mild 7.9 2520 112 28 80 ND ND ND
December 2009
River Yamuna Upstream Buria Nalaha
Blackish Mild 7.8 1510 92 29 80 ND ND ND
Buria Nalaha before meeting River Yamuna
Blackish Mild 8.1 4020 42 54 180 ND ND ND
51
Month Color Odour pH Value
Conductivity umho/cm
Suspended Solids mg/l
BOD 3 days at 27’ C mg/l
COD mg/l
Oil & Grease mg/l
Hexavalent Chromium as Cr+6 mg/l
Iron as Fe mg/l
River Yamuna Downstream buria Nalaha
Blackish Mild 8.0 2640 124 30 90 ND ND ND
January 2010
River Yamuna Upstream Buria Nalaha
Blackish Mild 7.2 1710 90 25 70 ND ND ND
Buria Nalaha before meeting River Yamuna
Blackish Mild 8.5 4220 68 42 150 ND ND ND
River Yamuna Downstream buria Nalaha
Blackish Mild 7.4 1890 86 27 88 ND ND ND
February 2010
River Yamuna Upstream Buria Nalaha
Blackish Mild 7.9 1110 79 22 80 ND ND ND
Buria Nalaha before meeting River Yamuna
Blackish Mild 7.63 3040 76 39 130 ND ND ND
River Yamuna Downstream buria Nalaha
Blackish Mild 7.94 1150 78 24 88 ND ND ND
March 2010
River Yamuna Upstream Buria Nalaha
Blackish Mild 8.0 1210 74 24 80 ND ND ND
Buria Nalaha before meeting River Yamuna
Blackish Mild 7.7 3120 72 40 120 ND ND ND
River Yamuna Downstream buria Nalaha
Blackish Mild 8.1 1320 82 26 90 ND ND ND
April 2010
River Yamuna Upstream Buria Nalaha
Blackish Mild 7.9 1340 84 26 88 ND ND ND
Buria Nalaha before meeting River Yamuna
Blackish Mild 7.5 3340 78 42 130 ND ND ND
River Yamuna Downstream buria Nalaha
Blackish Mild 8.2 1320 86 28 100 ND ND ND
52
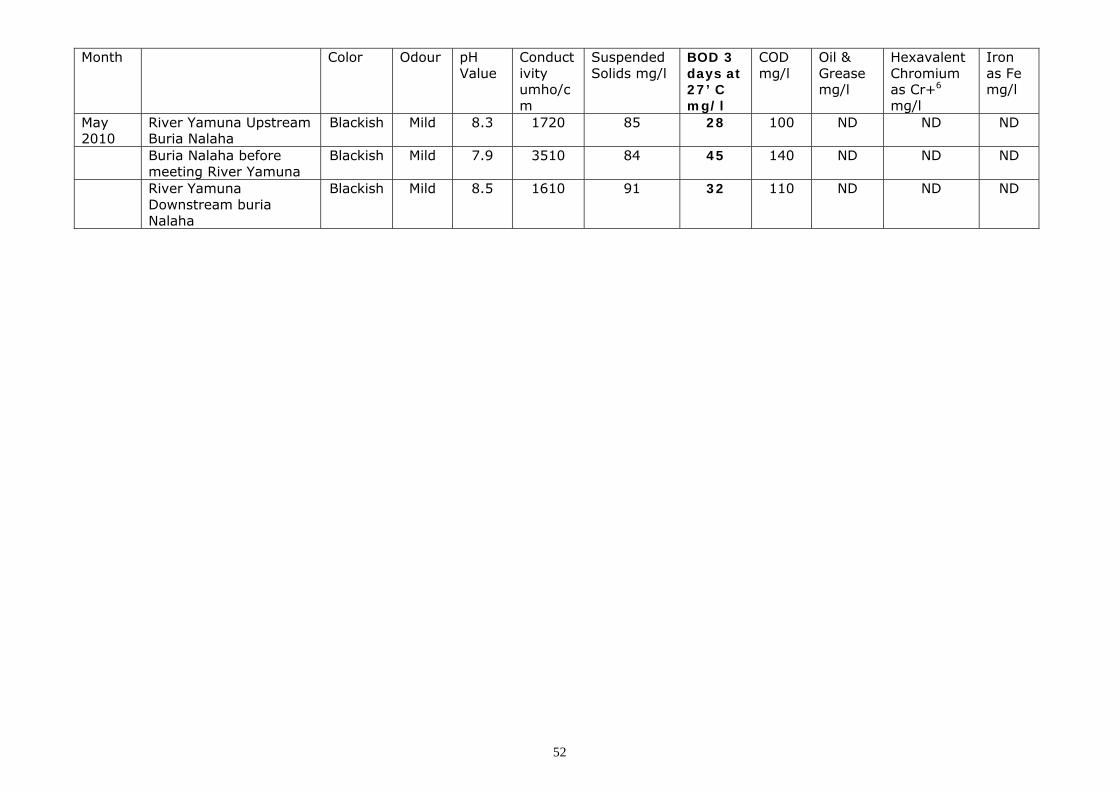
Month Color Odour pH Value
Conductivity umho/cm
Suspended Solids mg/l
BOD 3 days at 27’ C mg/l
COD mg/l
Oil & Grease mg/l
Hexavalent Chromium as Cr+6 mg/l
Iron as Fe mg/l
May 2010
River Yamuna Upstream Buria Nalaha
Blackish Mild 8.3 1720 85 28 100 ND ND ND
Buria Nalaha before meeting River Yamuna
Blackish Mild 7.9 3510 84 45 140 ND ND ND
River Yamuna Downstream buria Nalaha
Blackish Mild 8.5 1610 91 32 110 ND ND ND
53
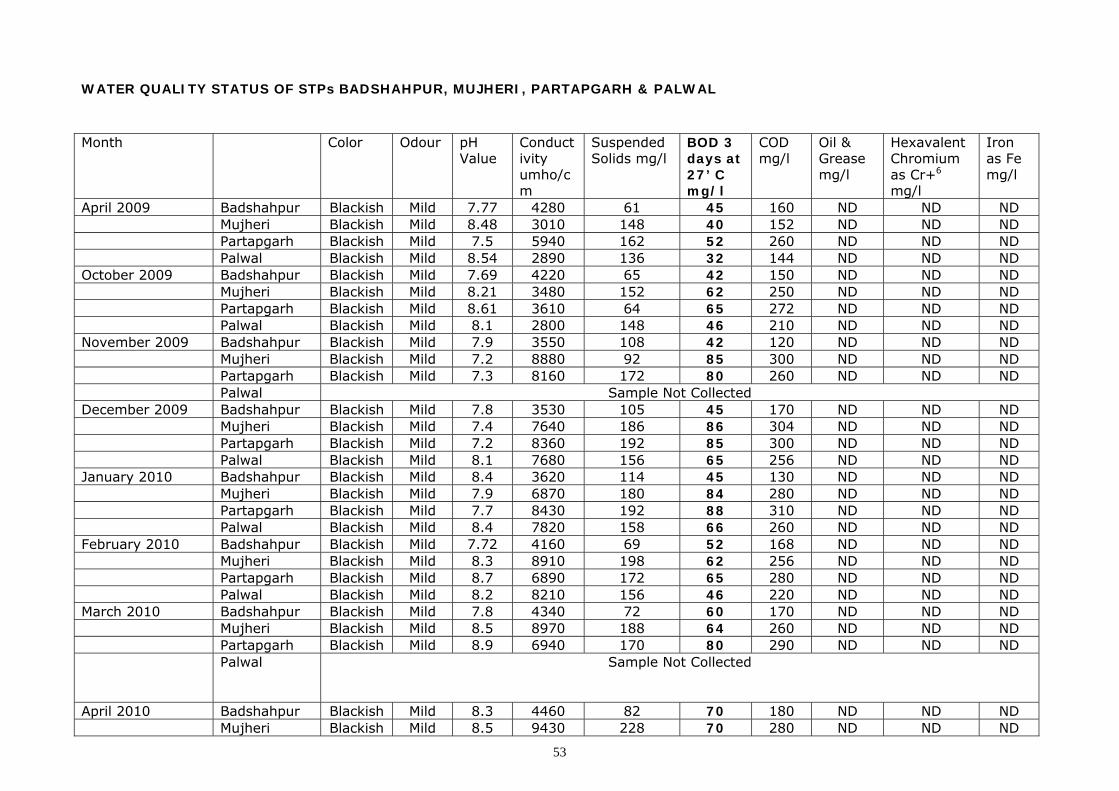
WATER QUALITY STATUS OF STPs BADSHAHPUR, MUJHERI, PARTAPGARH & PALWAL Month Color Odour pH
Value Conductivity umho/cm
Suspended Solids mg/l
BOD 3 days at 27’ C mg/l
COD mg/l
Oil & Grease mg/l
Hexavalent Chromium as Cr+6 mg/l
Iron as Fe mg/l
April 2009 Badshahpur Blackish Mild 7.77 4280 61 45 160 ND ND ND Mujheri Blackish Mild 8.48 3010 148 40 152 ND ND ND Partapgarh Blackish Mild 7.5 5940 162 52 260 ND ND ND Palwal Blackish Mild 8.54 2890 136 32 144 ND ND ND October 2009 Badshahpur Blackish Mild 7.69 4220 65 42 150 ND ND ND Mujheri Blackish Mild 8.21 3480 152 62 250 ND ND ND Partapgarh Blackish Mild 8.61 3610 64 65 272 ND ND ND Palwal Blackish Mild 8.1 2800 148 46 210 ND ND ND November 2009 Badshahpur Blackish Mild 7.9 3550 108 42 120 ND ND ND Mujheri Blackish Mild 7.2 8880 92 85 300 ND ND ND Partapgarh Blackish Mild 7.3 8160 172 80 260 ND ND ND Palwal Sample Not Collected December 2009 Badshahpur Blackish Mild 7.8 3530 105 45 170 ND ND ND Mujheri Blackish Mild 7.4 7640 186 86 304 ND ND ND Partapgarh Blackish Mild 7.2 8360 192 85 300 ND ND ND Palwal Blackish Mild 8.1 7680 156 65 256 ND ND ND January 2010 Badshahpur Blackish Mild 8.4 3620 114 45 130 ND ND ND Mujheri Blackish Mild 7.9 6870 180 84 280 ND ND ND Partapgarh Blackish Mild 7.7 8430 192 88 310 ND ND ND Palwal Blackish Mild 8.4 7820 158 66 260 ND ND ND February 2010 Badshahpur Blackish Mild 7.72 4160 69 52 168 ND ND ND Mujheri Blackish Mild 8.3 8910 198 62 256 ND ND ND Partapgarh Blackish Mild 8.7 6890 172 65 280 ND ND ND Palwal Blackish Mild 8.2 8210 156 46 220 ND ND ND March 2010 Badshahpur Blackish Mild 7.8 4340 72 60 170 ND ND ND Mujheri Blackish Mild 8.5 8970 188 64 260 ND ND ND Partapgarh Blackish Mild 8.9 6940 170 80 290 ND ND ND
Palwal Sample Not Collected
April 2010 Badshahpur Blackish Mild 8.3 4460 82 70 180 ND ND ND Mujheri Blackish Mild 8.5 9430 228 70 280 ND ND ND
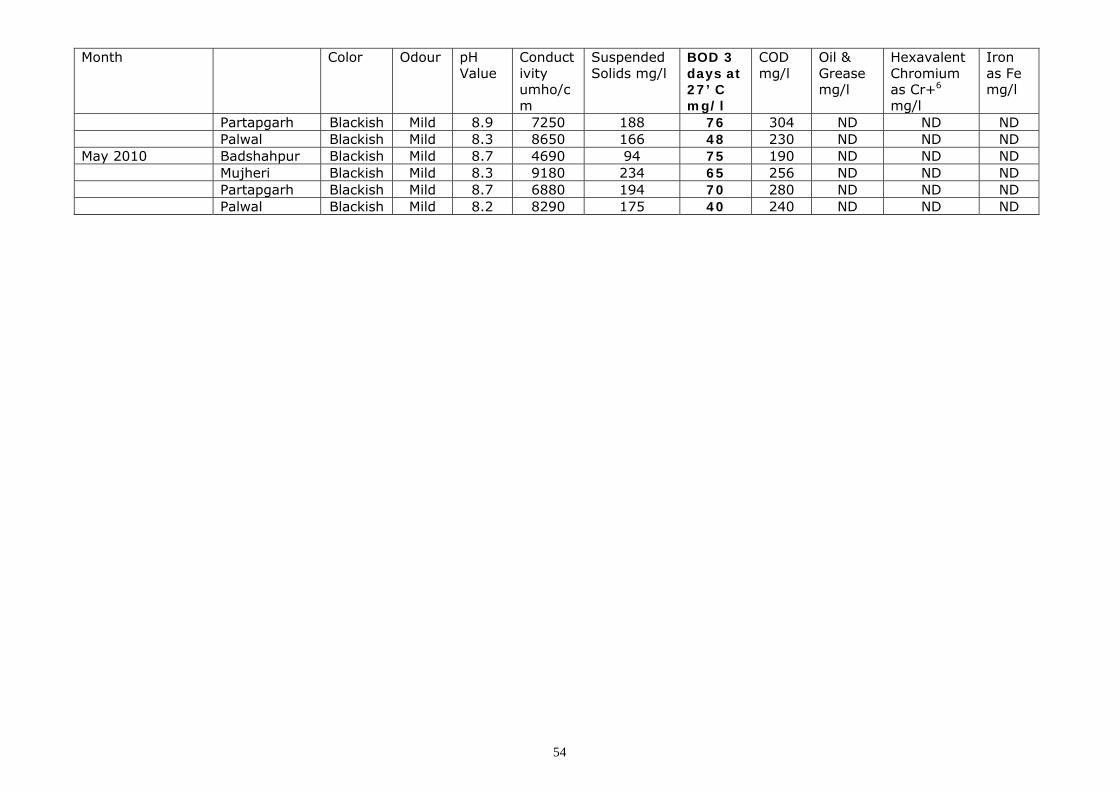
54
Month Color Odour pH Value
Conductivity umho/cm
Suspended Solids mg/l
BOD 3 days at 27’ C mg/l
COD mg/l
Oil & Grease mg/l
Hexavalent Chromium as Cr+6 mg/l
Iron as Fe mg/l
Partapgarh Blackish Mild 8.9 7250 188 76 304 ND ND ND Palwal Blackish Mild 8.3 8650 166 48 230 ND ND ND May 2010 Badshahpur Blackish Mild 8.7 4690 94 75 190 ND ND ND Mujheri Blackish Mild 8.3 9180 234 65 256 ND ND ND Partapgarh Blackish Mild 8.7 6880 194 70 280 ND ND ND Palwal Blackish Mild 8.2 8290 175 40 240 ND ND ND
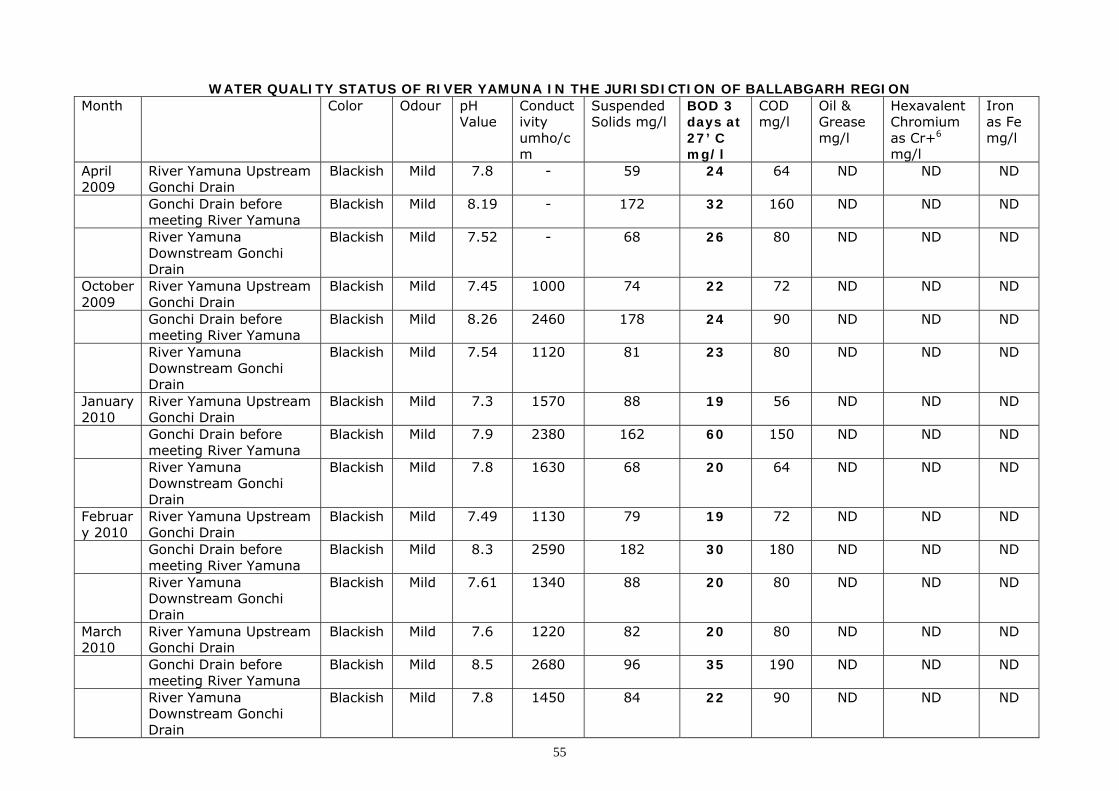
55
WATER QUALITY STATUS OF RIVER YAMUNA IN THE JURISDICTION OF BALLABGARH REGION Month Color Odour pH
Value Conductivity umho/cm
Suspended Solids mg/l
BOD 3 days at 27’ C mg/l
COD mg/l
Oil & Grease mg/l
Hexavalent Chromium as Cr+6 mg/l
Iron as Fe mg/l
April 2009
River Yamuna Upstream Gonchi Drain
Blackish Mild 7.8 - 59 24 64 ND ND ND
Gonchi Drain before meeting River Yamuna
Blackish Mild 8.19 - 172 32 160 ND ND ND
River Yamuna Downstream Gonchi Drain
Blackish Mild 7.52 - 68 26 80 ND ND ND
October 2009
River Yamuna Upstream Gonchi Drain
Blackish Mild 7.45 1000 74 22 72 ND ND ND
Gonchi Drain before meeting River Yamuna
Blackish Mild 8.26 2460 178 24 90 ND ND ND
River Yamuna Downstream Gonchi Drain
Blackish Mild 7.54 1120 81 23 80 ND ND ND
January 2010
River Yamuna Upstream Gonchi Drain
Blackish Mild 7.3 1570 88 19 56 ND ND ND
Gonchi Drain before meeting River Yamuna
Blackish Mild 7.9 2380 162 60 150 ND ND ND
River Yamuna Downstream Gonchi Drain
Blackish Mild 7.8 1630 68 20 64 ND ND ND
February 2010
River Yamuna Upstream Gonchi Drain
Blackish Mild 7.49 1130 79 19 72 ND ND ND
Gonchi Drain before meeting River Yamuna
Blackish Mild 8.3 2590 182 30 180 ND ND ND
River Yamuna Downstream Gonchi Drain
Blackish Mild 7.61 1340 88 20 80 ND ND ND
March 2010
River Yamuna Upstream Gonchi Drain
Blackish Mild 7.6 1220 82 20 80 ND ND ND
Gonchi Drain before meeting River Yamuna
Blackish Mild 8.5 2680 96 35 190 ND ND ND
River Yamuna Downstream Gonchi Drain
Blackish Mild 7.8 1450 84 22 90 ND ND ND
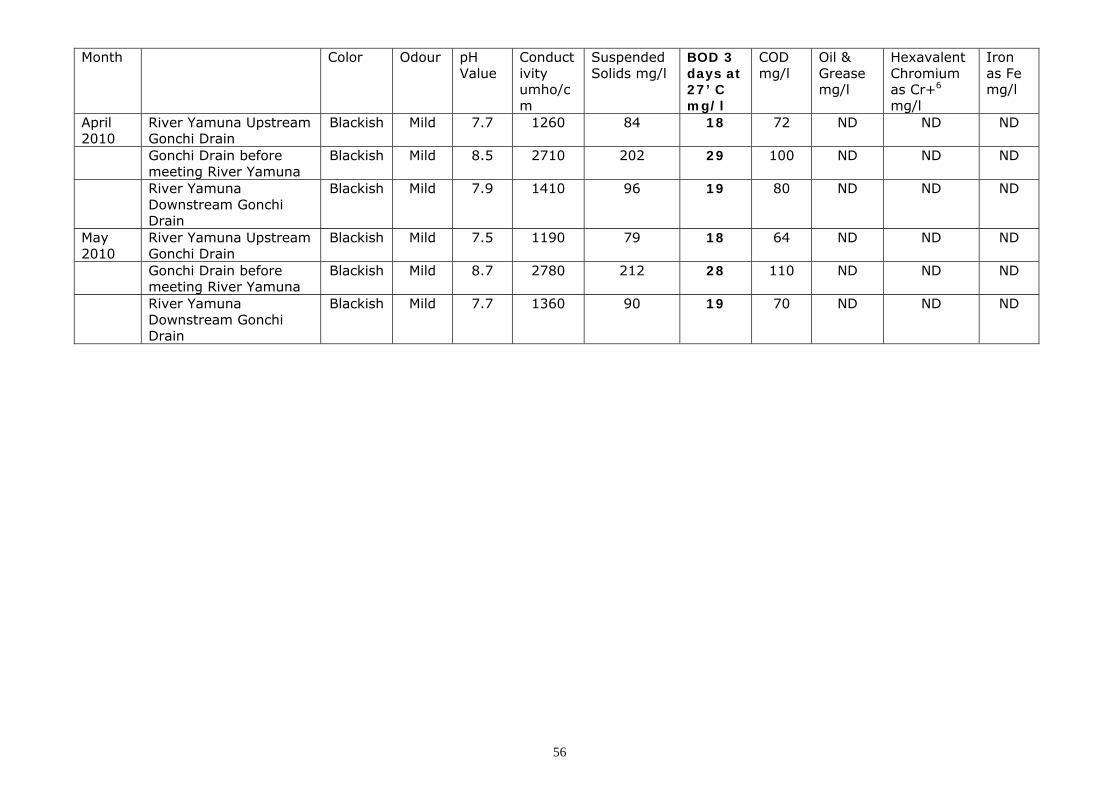
56
Month Color Odour pH Value
Conductivity umho/cm
Suspended Solids mg/l
BOD 3 days at 27’ C mg/l
COD mg/l
Oil & Grease mg/l
Hexavalent Chromium as Cr+6 mg/l
Iron as Fe mg/l
April 2010
River Yamuna Upstream Gonchi Drain
Blackish Mild 7.7 1260 84 18 72 ND ND ND
Gonchi Drain before meeting River Yamuna
Blackish Mild 8.5 2710 202 29 100 ND ND ND
River Yamuna Downstream Gonchi Drain
Blackish Mild 7.9 1410 96 19 80 ND ND ND
May 2010
River Yamuna Upstream Gonchi Drain
Blackish Mild 7.5 1190 79 18 64 ND ND ND
Gonchi Drain before meeting River Yamuna
Blackish Mild 8.7 2780 212 28 110 ND ND ND
River Yamuna Downstream Gonchi Drain
Blackish Mild 7.7 1360 90 19 70 ND ND ND
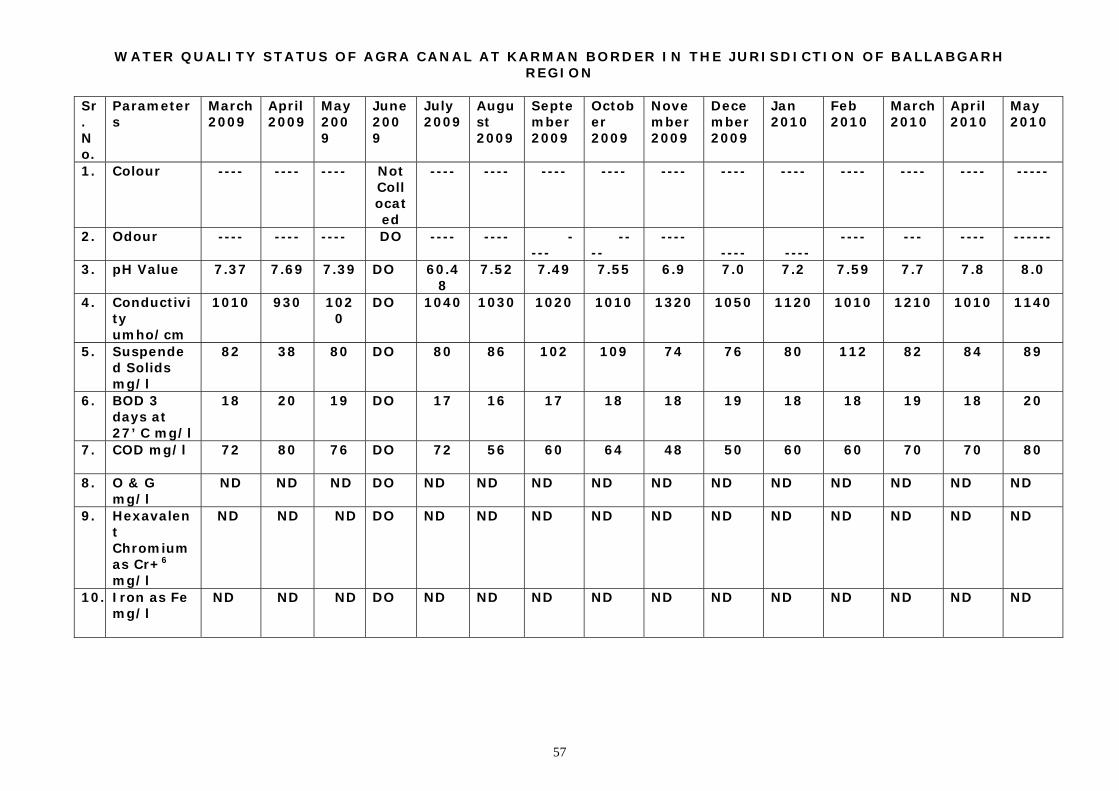
57
WATER QUALITY STATUS OF AGRA CANAL AT KARMAN BORDER IN THE JURISDICTION OF BALLABGARH REGION
Sr. No.
Parameters
March 2009
April 2009
May 2009
June 2009
July 2009
August 2009
September 2009
October 2009
November 2009
December 2009
Jan 2010
Feb 2010
March2010
April 2010
May 2010
1. Colour
---- ---- ---- Not Collocated
---- ---- ---- ---- ---- ---- ---- ---- ---- ---- -----
2. Odour
---- ---- ---- DO ---- ---- ----
----
---- ----
----
---- --- ---- ------
3. pH Value
7.37 7.69 7.39 DO 60.48
7.52 7.49 7.55 6.9 7.0 7.2 7.59 7.7 7.8 8.0
4. Conductivity umho/cm
1010 930 1020
DO 1040 1030 1020 1010 1320 1050 1120 1010 1210 1010 1140
5. Suspended Solids mg/l
82 38 80 DO 80 86 102 109 74 76 80 112 82 84 89
6. BOD 3 days at 27’ C mg/l
18 20 19 DO 17 16 17 18 18 19 18 18 19 18 20
7. COD mg/l
72 80 76 DO 72 56 60 64 48 50 60 60 70 70 80
8. O & G mg/l
ND ND ND DO ND ND ND ND ND ND ND ND ND ND ND
9. Hexavalent Chromium as Cr+6 mg/l
ND ND ND DO ND ND ND ND ND ND ND ND ND ND ND
10. Iron as Fe mg/l
ND ND ND DO ND ND ND ND ND ND ND ND ND ND ND
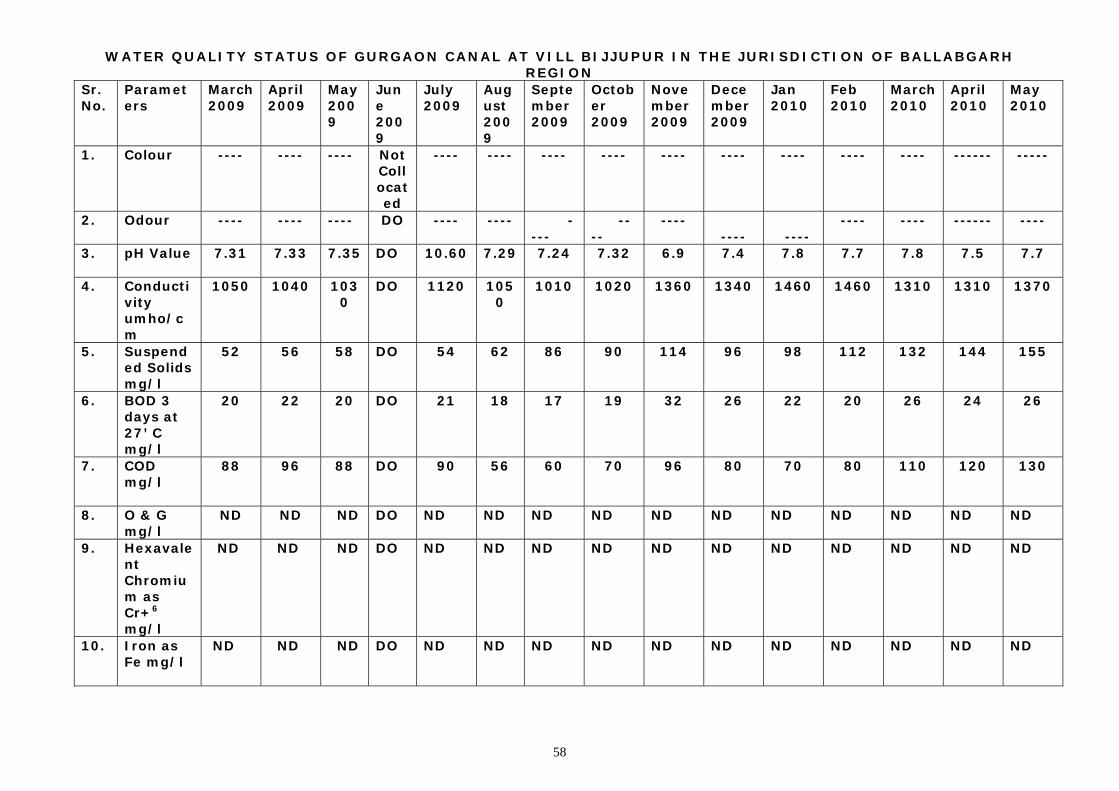
58
WATER QUALITY STATUS OF GURGAON CANAL AT VILL BIJJUPUR IN THE JURISDICTION OF BALLABGARH REGION
Sr. No.
Parameters
March 2009
April 2009
May 2009
June 2009
July 2009
August 2009
September 2009
October 2009
November 2009
December 2009
Jan 2010
Feb 2010
March 2010
April 2010
May 2010
1. Colour
---- ---- ---- Not Collocated
---- ---- ---- ---- ---- ---- ---- ---- ---- ------ -----
2. Odour
---- ---- ---- DO ---- ---- ----
----
---- ----
----
---- ---- ------ ----
3. pH Value
7.31 7.33 7.35 DO 10.60 7.29 7.24 7.32 6.9 7.4 7.8 7.7 7.8 7.5 7.7
4. Conductivity umho/cm
1050 1040 1030
DO 1120 1050
1010 1020 1360 1340 1460 1460 1310 1310 1370
5. Suspended Solids mg/l
52 56 58 DO 54 62 86 90 114 96 98 112 132 144 155
6. BOD 3 days at 27’ C mg/l
20 22 20 DO 21 18 17 19 32 26 22 20 26 24 26
7. COD mg/l
88 96 88 DO 90 56 60 70 96 80 70 80 110 120 130
8. O & G mg/l
ND ND ND DO ND ND ND ND ND ND ND ND ND ND ND
9. Hexavalent Chromium as Cr+6 mg/l
ND ND ND DO ND ND ND ND ND ND ND ND ND ND ND
10. Iron as Fe mg/l
ND ND ND DO ND ND ND ND ND ND ND ND ND ND ND
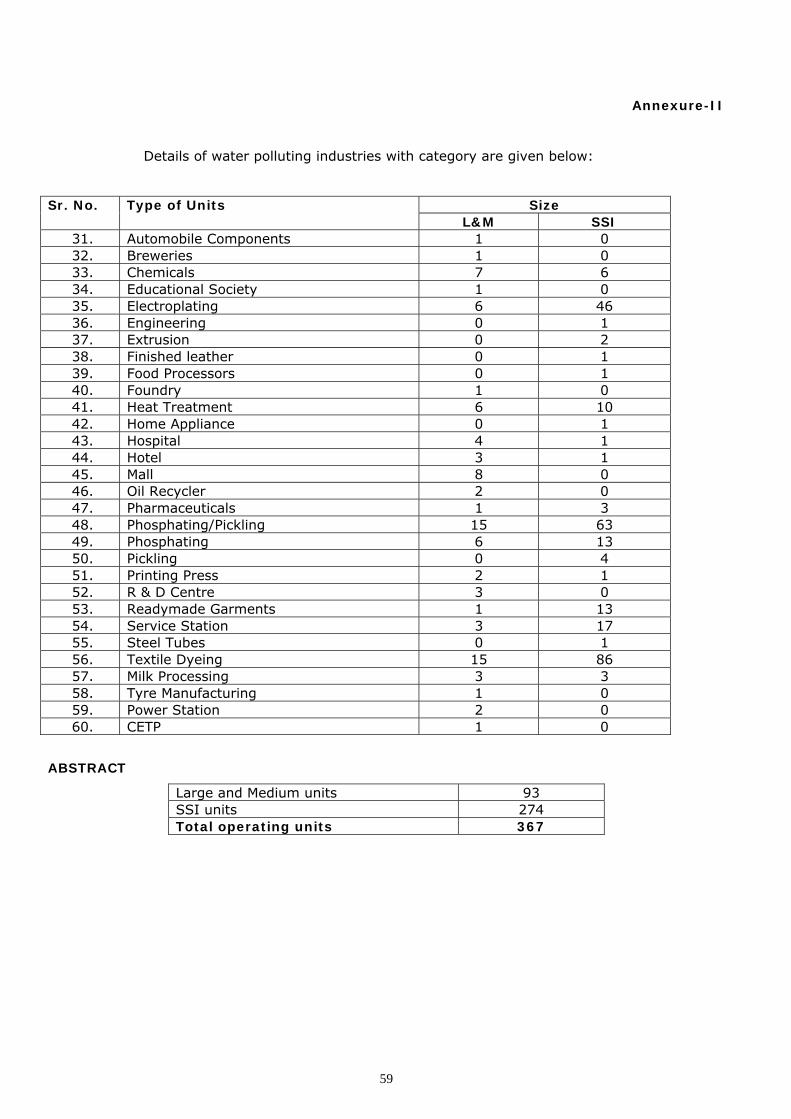
59
Annexure-II
Details of water polluting industries with category are given below:
Size Sr. No. Type of Units L&M SSI
31. Automobile Components 1 0 32. Breweries 1 0 33. Chemicals 7 6 34. Educational Society 1 0 35. Electroplating 6 46 36. Engineering 0 1 37. Extrusion 0 2 38. Finished leather 0 1 39. Food Processors 0 1 40. Foundry 1 0 41. Heat Treatment 6 10 42. Home Appliance 0 1 43. Hospital 4 1 44. Hotel 3 1 45. Mall 8 0 46. Oil Recycler 2 0 47. Pharmaceuticals 1 3 48. Phosphating/Pickling 15 63 49. Phosphating 6 13 50. Pickling 0 4 51. Printing Press 2 1 52. R & D Centre 3 0 53. Readymade Garments 1 13 54. Service Station 3 17 55. Steel Tubes 0 1 56. Textile Dyeing 15 86 57. Milk Processing 3 3 58. Tyre Manufacturing 1 0 59. Power Station 2 0 60. CETP 1 0
ABSTRACT
Large and Medium units 93 SSI units 274 Total operating units 367
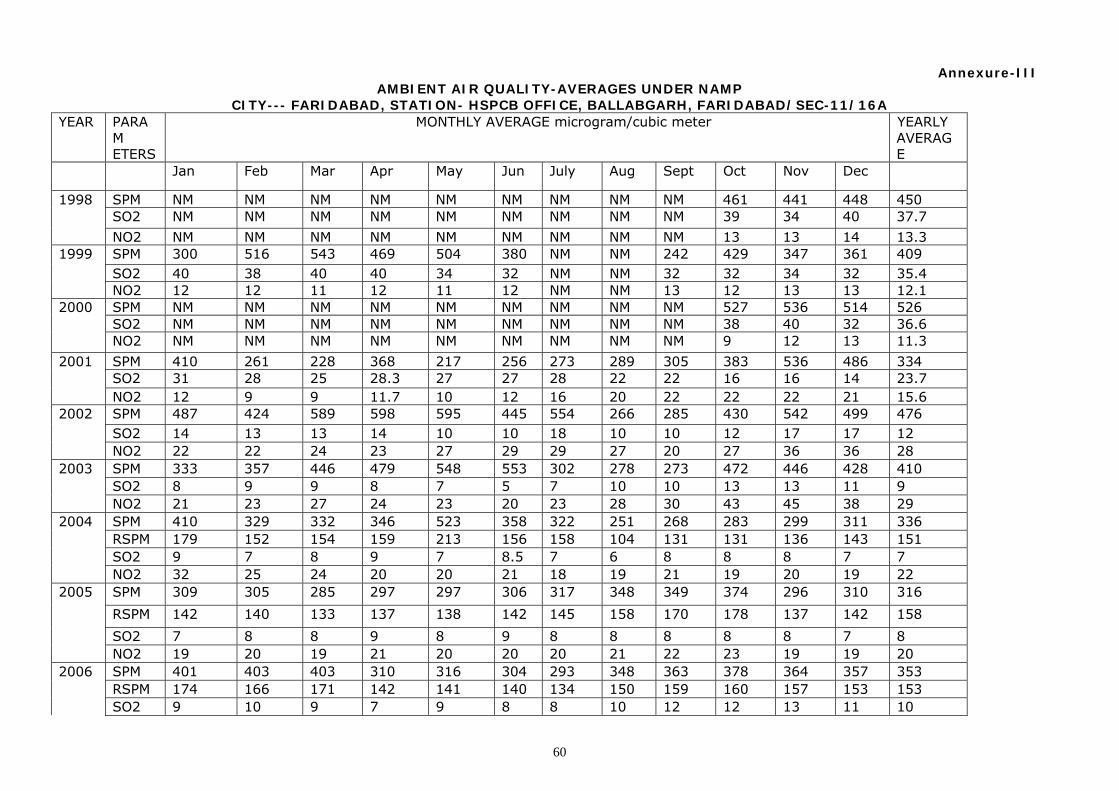
60
Annexure-III
AMBIENT AIR QUALITY-AVERAGES UNDER NAMP CITY--- FARIDABAD, STATION- HSPCB OFFICE, BALLABGARH, FARIDABAD/SEC-11/16A
YEAR PARAM ETERS
MONTHLY AVERAGE microgram/cubic meter YEARLY AVERAGE
Jan Feb Mar Apr May Jun July Aug Sept Oct Nov Dec
SPM NM NM NM NM NM NM NM NM NM 461 441 448 450 SO2 NM NM NM NM NM NM NM NM NM 39 34 40 37.7
1998
NO2 NM NM NM NM NM NM NM NM NM 13 13 14 13.3 SPM 300 516 543 469 504 380 NM NM 242 429 347 361 409 SO2 40 38 40 40 34 32 NM NM 32 32 34 32 35.4
1999
NO2 12 12 11 12 11 12 NM NM 13 12 13 13 12.1 SPM NM NM NM NM NM NM NM NM NM 527 536 514 526 SO2 NM NM NM NM NM NM NM NM NM 38 40 32 36.6
2000
NO2 NM NM NM NM NM NM NM NM NM 9 12 13 11.3
SPM 410 261 228 368 217 256 273 289 305 383 536 486 334 SO2 31 28 25 28.3 27 27 28 22 22 16 16 14 23.7
2001
NO2 12 9 9 11.7 10 12 16 20 22 22 22 21 15.6 SPM 487 424 589 598 595 445 554 266 285 430 542 499 476 SO2 14 13 13 14 10 10 18 10 10 12 17 17 12
2002
NO2 22 22 24 23 27 29 29 27 20 27 36 36 28 SPM 333 357 446 479 548 553 302 278 273 472 446 428 410 SO2 8 9 9 8 7 5 7 10 10 13 13 11 9
2003
NO2 21 23 27 24 23 20 23 28 30 43 45 38 29 SPM 410 329 332 346 523 358 322 251 268 283 299 311 336 RSPM 179 152 154 159 213 156 158 104 131 131 136 143 151 SO2 9 7 8 9 7 8.5 7 6 8 8 8 7 7
2004
NO2 32 25 24 20 20 21 18 19 21 19 20 19 22 SPM 309 305 285 297 297 306 317 348 349 374 296 310 316
RSPM 142 140 133 137 138 142 145 158 170 178 137 142 158
SO2 7 8 8 9 8 9 8 8 8 8 8 7 8
2005
NO2 19 20 19 21 20 20 20 21 22 23 19 19 20 SPM 401 403 403 310 316 304 293 348 363 378 364 357 353 RSPM 174 166 171 142 141 140 134 150 159 160 157 153 153
2006
SO2 9 10 9 7 9 8 8 10 12 12 13 11 10
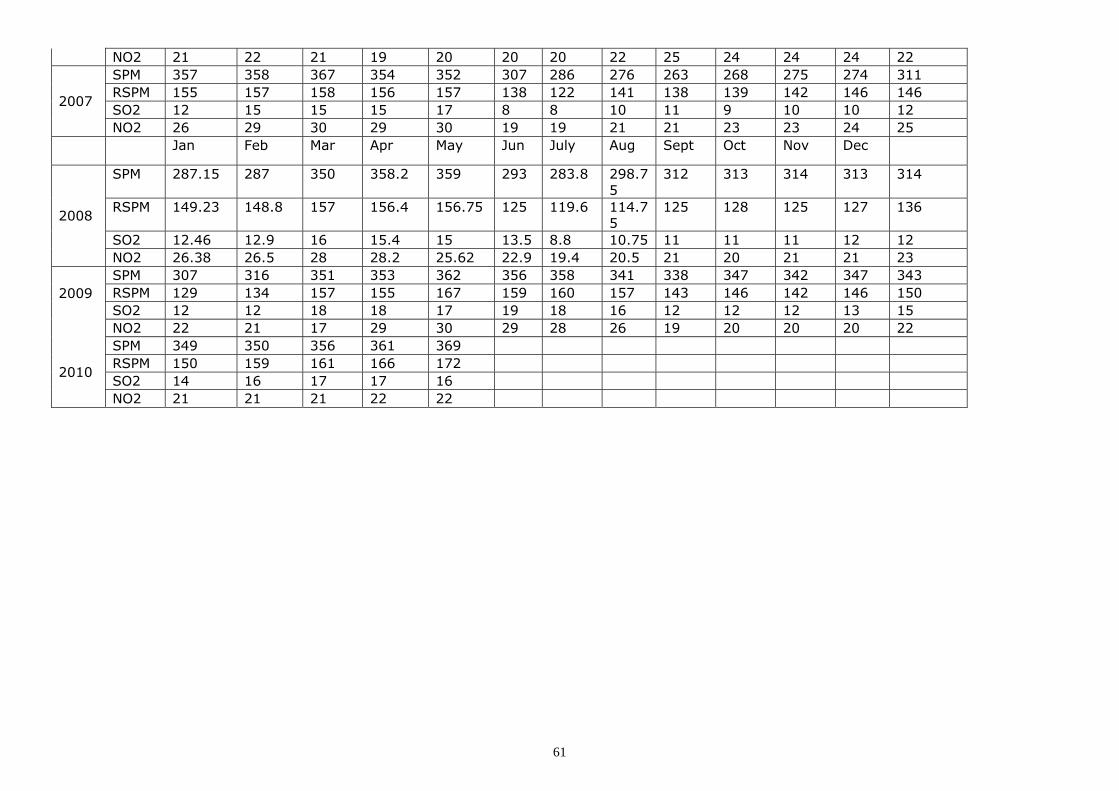
NO2 21 22 21 19 20 20 20 22 25 24 24 24 22 SPM 357 358 367 354 352 307 286 276 263 268 275 274 311 RSPM 155 157 158 156 157 138 122 141 138 139 142 146 146 SO2 12 15 15 15 17 8 8 10 11 9 10 10 12
2007
NO2 26 29 30 29 30 19 19 21 21 23 23 24 25 Jan Feb Mar Apr May Jun July Aug Sept Oct Nov Dec
SPM 287.15 287 350 358.2 359 293 283.8 298.75
312 313 314 313 314
RSPM 149.23 148.8 157 156.4 156.75 125 119.6 114.75
125 128 125 127 136
SO2 12.46 12.9 16 15.4 15 13.5 8.8 10.75 11 11 11 12 12
2008
NO2 26.38 26.5 28 28.2 25.62 22.9 19.4 20.5 21 20 21 21 23 SPM 307 316 351 353 362 356 358 341 338 347 342 347 343 2009 RSPM 129 134 157 155 167 159 160 157 143 146 142 146 150 SO2 12 12 18 18 17 19 18 16 12 12 12 13 15 NO2 22 21 17 29 30 29 28 26 19 20 20 20 22
SPM 349 350 356 361 369 RSPM 150 159 161 166 172 SO2 14 16 17 17 16
2010
NO2 21 21 21 22 22
61
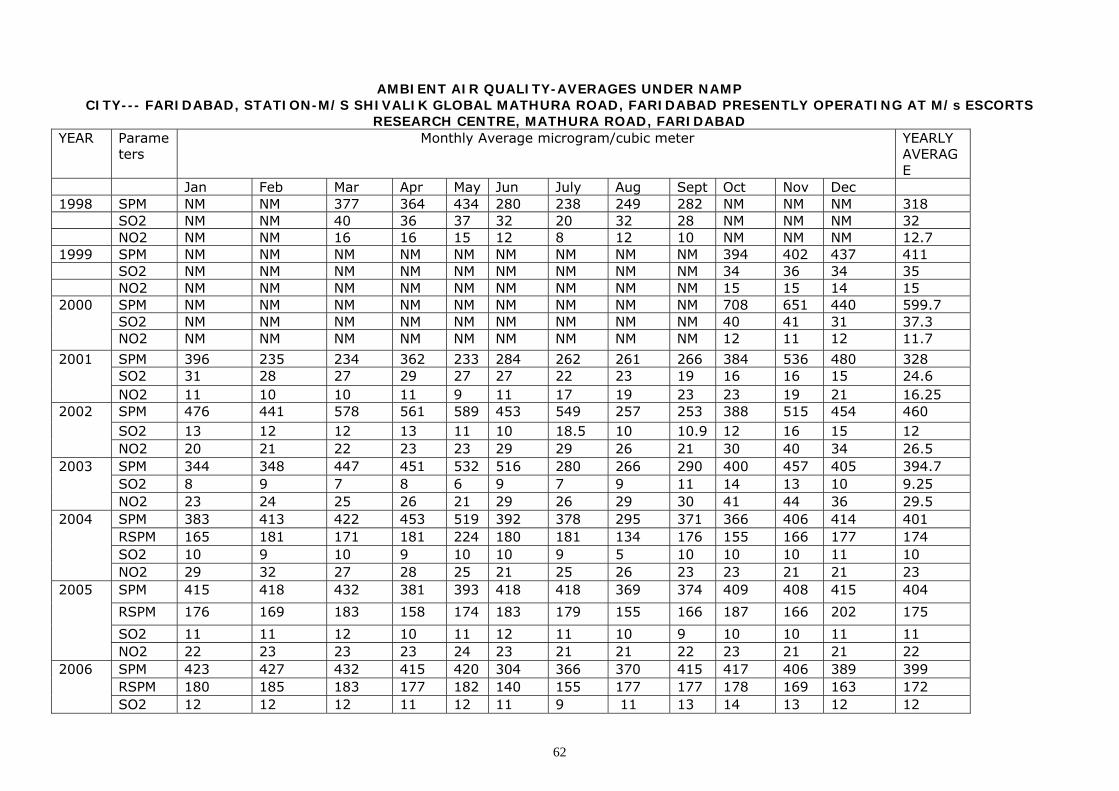
AMBIENT AIR QUALITY-AVERAGES UNDER NAMP CITY--- FARIDABAD, STATION-M/S SHIVALIK GLOBAL MATHURA ROAD, FARIDABAD PRESENTLY OPERATING AT M/s ESCORTS
RESEARCH CENTRE, MATHURA ROAD, FARIDABAD YEAR Monthly Average microgram/cubic meter YEARLY Parame
ters AVERAGE
Jan Feb Mar Apr May Jun July Aug Sept Oct Nov Dec 1998 SPM NM NM 377 364 434 280 238 249 282 NM NM NM 318 SO2 NM NM 40 36 37 32 20 32 28 NM NM NM 32 NO2 NM NM 16 16 15 12 8 12 10 NM NM NM 12.7 1999 SPM NM NM NM NM NM NM NM NM NM 394 402 437 411 SO2 NM NM NM NM NM NM NM NM NM 34 36 34 35 NO2 NM NM NM NM NM NM NM NM NM 15 15 14 15
SPM NM NM NM NM NM NM NM NM NM 708 651 440 599.7 SO2 NM NM NM NM NM NM NM NM NM 40 41 31 37.3
2000
NO2 NM NM NM NM NM NM NM NM NM 12 11 12 11.7
SPM 396 235 234 362 233 284 262 261 266 384 536 480 328 SO2 31 28 27 29 27 27 22 23 19 16 16 15 24.6
2001
NO2 11 10 10 11 9 11 17 19 23 23 19 21 16.25 SPM 476 441 578 561 589 453 549 257 253 388 515 454 460 SO2 13 12 12 13 11 10 18.5 10 10.9 12 16 15 12
2002
NO2 20 21 22 23 23 29 29 26 21 30 40 34 26.5 SPM 344 348 447 451 532 516 280 266 290 400 457 405 394.7 SO2 8 9 7 8 6 9 7 9 11 14 13 10 9.25
2003
NO2 23 24 25 26 21 29 26 29 30 41 44 36 29.5 SPM 383 413 422 453 519 392 378 295 371 366 406 414 401 RSPM 165 181 171 181 224 180 181 134 176 155 166 177 174 SO2 10 9 10 9 10 10 9 5 10 10 10 11 10
2004
NO2 29 32 27 28 25 21 25 26 23 23 21 21 23 SPM 415 418 432 381 393 418 418 369 374 409 408 415 404
RSPM 176 169 183 158 174 183 179 155 166 187 166 202 175
SO2 11 11 12 10 11 12 11 10 9 10 10 11 11
2005
NO2 22 23 23 23 24 23 21 21 22 23 21 21 22 SPM 423 427 432 415 420 304 366 370 415 417 406 389 399 RSPM 180 185 183 177 182 140 155 177 177 178 169 163 172
2006
SO2 12 12 12 11 12 11 9 11 13 14 13 12 12
62
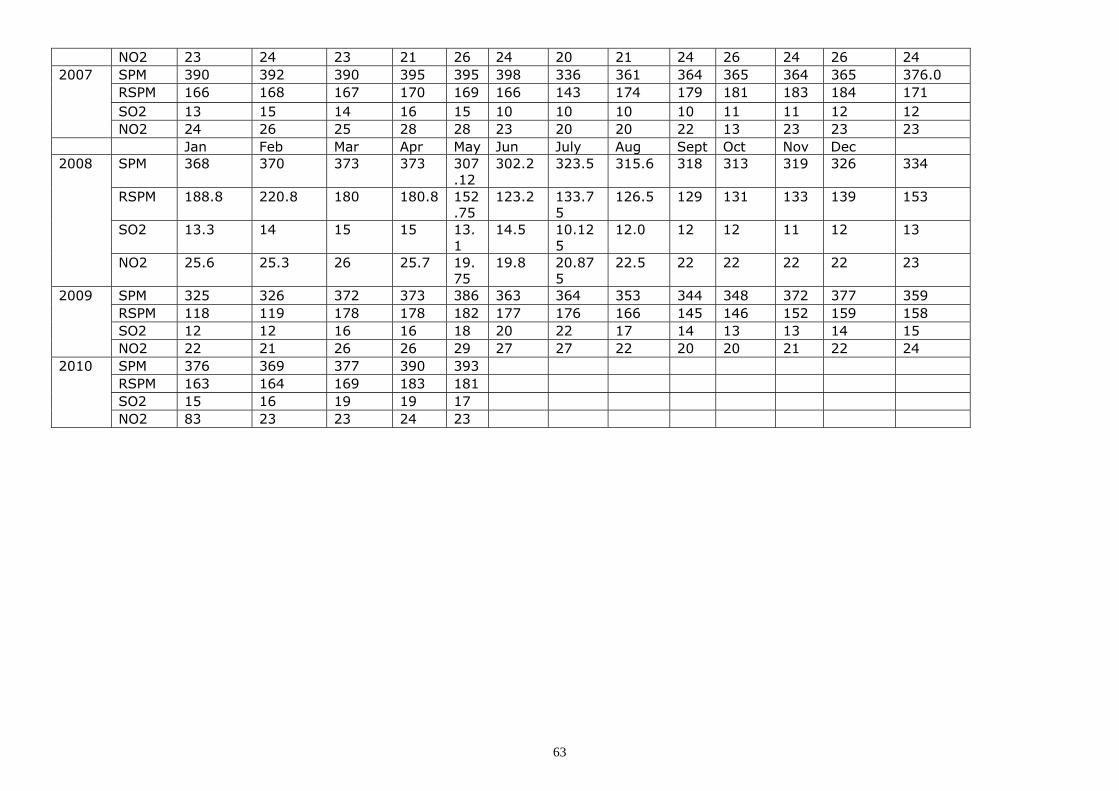
NO2 23 24 23 21 26 24 20 21 24 26 24 26 24 SPM 390 392 390 395 395 398 336 361 364 365 364 365 376.0 RSPM 166 168 167 170 169 166 143 174 179 181 183 184 171 SO2 13 15 14 16 15 10 10 10 10 11 11 12 12
2007
NO2 24 26 25 28 28 23 20 20 22 13 23 23 23 Jan Feb Mar Apr May Jun July Aug Sept Oct Nov Dec
SPM 368 370 373 373 307.12
302.2 323.5 315.6 318 313 319 326 334
RSPM 188.8 220.8 180 180.8 152.75
123.2 133.75
126.5 129 131 133 139 153
SO2 13.3 14 15 15 13.1
14.5 10.125
12.0 12 12 11 12 13
2008
NO2 25.6 25.3 26 25.7 19.75
19.8 20.875
22.5 22 22 22 22 23
SPM 325 326 372 373 386 363 364 353 344 348 372 377 359 RSPM 118 119 178 178 182 177 176 166 145 146 152 159 158 SO2 12 12 16 16 18 20 22 17 14 13 13 14 15
2009
NO2 22 21 26 26 29 27 27 22 20 20 21 22 24 SPM 376 369 377 390 393 RSPM 163 164 169 183 181 SO2 15 16 19 19 17
2010
NO2 83 23 23 24 23
63
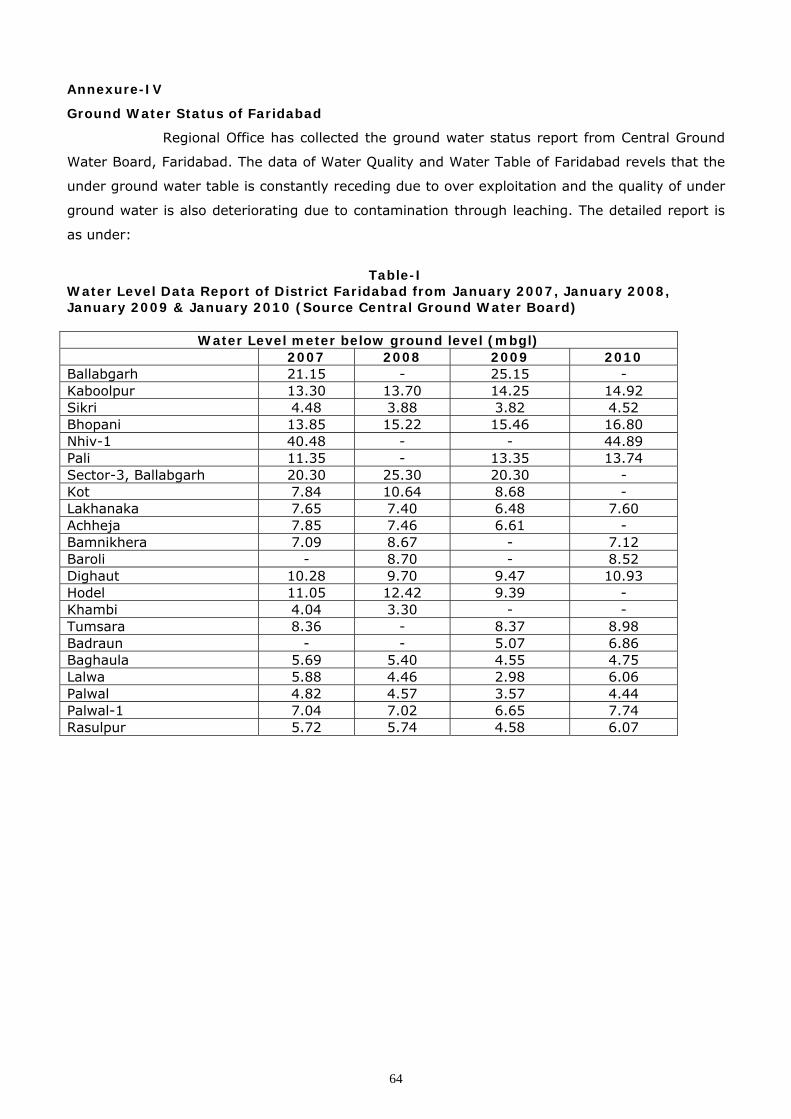
64
Annexure-IV
Ground Water Status of Faridabad
Regional Office has collected the ground water status report from Central Ground
Water Board, Faridabad. The data of Water Quality and Water Table of Faridabad revels that the
under ground water table is constantly receding due to over exploitation and the quality of under
ground water is also deteriorating due to contamination through leaching. The detailed report is
as under:
Table-I
Water Level Data Report of District Faridabad from January 2007, January 2008, January 2009 & January 2010 (Source Central Ground Water Board)
Water Level meter below ground level (mbgl) 2007 2008 2009 2010 Ballabgarh 21.15 - 25.15 - Kaboolpur 13.30 13.70 14.25 14.92 Sikri 4.48 3.88 3.82 4.52 Bhopani 13.85 15.22 15.46 16.80 Nhiv-1 40.48 - - 44.89 Pali 11.35 - 13.35 13.74 Sector-3, Ballabgarh 20.30 25.30 20.30 - Kot 7.84 10.64 8.68 - Lakhanaka 7.65 7.40 6.48 7.60 Achheja 7.85 7.46 6.61 - Bamnikhera 7.09 8.67 - 7.12 Baroli - 8.70 - 8.52 Dighaut 10.28 9.70 9.47 10.93 Hodel 11.05 12.42 9.39 - Khambi 4.04 3.30 - - Tumsara 8.36 - 8.37 8.98 Badraun - - 5.07 6.86 Baghaula 5.69 5.40 4.55 4.75 Lalwa 5.88 4.46 2.98 6.06 Palwal 4.82 4.57 3.57 4.44 Palwal-1 7.04 7.02 6.65 7.74 Rasulpur 5.72 5.74 4.58 6.07
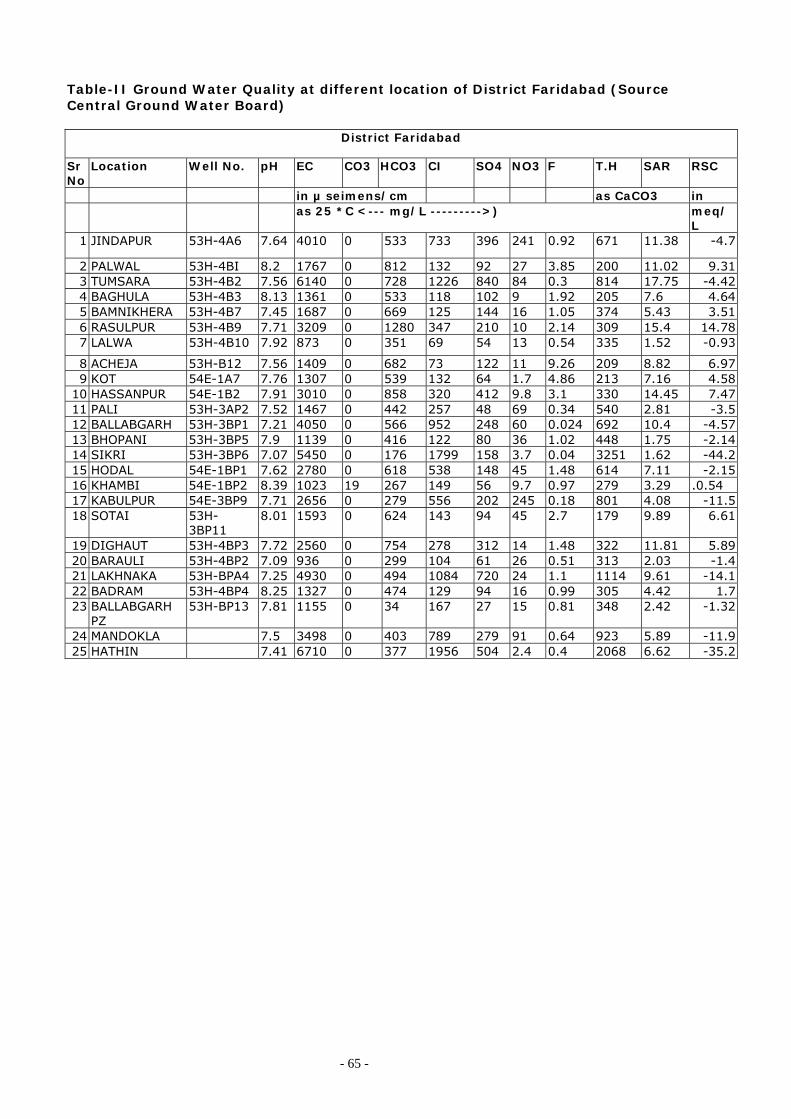
Table-II Ground Water Quality at different location of District Faridabad (Source Central Ground Water Board)
District Faridabad
Sr No
Location Well No. pH EC CO3 HCO3 CI SO4 NO3 F T.H SAR RSC
in µ seimens/cm as CaCO3 in as 25 *C <--- mg/L --------->) meq/
L 1 JINDAPUR 53H-4A6 7.64 4010 0 533 733 396 241 0.92 671 11.38 -4.7
2 PALWAL 53H-4BI 8.2 1767 0 812 132 92 27 3.85 200 11.02 9.31 3 TUMSARA 53H-4B2 7.56 6140 0 728 1226 840 84 0.3 814 17.75 -4.42 4 BAGHULA 53H-4B3 8.13 1361 0 533 118 102 9 1.92 205 7.6 4.64 5 BAMNIKHERA 53H-4B7 7.45 1687 0 669 125 144 16 1.05 374 5.43 3.51 6 RASULPUR 53H-4B9 7.71 3209 0 1280 347 210 10 2.14 309 15.4 14.78 7 LALWA 53H-4B10 7.92 873 0 351 69 54 13 0.54 335 1.52 -0.93
8 ACHEJA 53H-B12 7.56 1409 0 682 73 122 11 9.26 209 8.82 6.97 9 KOT 54E-1A7 7.76 1307 0 539 132 64 1.7 4.86 213 7.16 4.58
10 HASSANPUR 54E-1B2 7.91 3010 0 858 320 412 9.8 3.1 330 14.45 7.47 11 PALI 53H-3AP2 7.52 1467 0 442 257 48 69 0.34 540 2.81 -3.5 12 BALLABGARH 53H-3BP1 7.21 4050 0 566 952 248 60 0.024 692 10.4 -4.57 13 BHOPANI 53H-3BP5 7.9 1139 0 416 122 80 36 1.02 448 1.75 -2.14 14 SIKRI 53H-3BP6 7.07 5450 0 176 1799 158 3.7 0.04 3251 1.62 -44.2 15 HODAL 54E-1BP1 7.62 2780 0 618 538 148 45 1.48 614 7.11 -2.15 16 KHAMBI 54E-1BP2 8.39 1023 19 267 149 56 9.7 0.97 279 3.29 .0.54 17 KABULPUR 54E-3BP9 7.71 2656 0 279 556 202 245 0.18 801 4.08 -11.5 18 SOTAI 53H-
3BP11 8.01 1593 0 624 143 94 45 2.7 179 9.89 6.61
19 DIGHAUT 53H-4BP3 7.72 2560 0 754 278 312 14 1.48 322 11.81 5.89 20 BARAULI 53H-4BP2 7.09 936 0 299 104 61 26 0.51 313 2.03 -1.4 21 LAKHNAKA 53H-BPA4 7.25 4930 0 494 1084 720 24 1.1 1114 9.61 -14.1 22 BADRAM 53H-4BP4 8.25 1327 0 474 129 94 16 0.99 305 4.42 1.7 23 BALLABGARH
PZ 53H-BP13 7.81 1155 0 34 167 27 15 0.81 348 2.42 -1.32
24 MANDOKLA 7.5 3498 0 403 789 279 91 0.64 923 5.89 -11.9 25 HATHIN 7.41 6710 0 377 1956 504 2.4 0.4 2068 6.62 -35.2
- 65 -