i. expressions and operations ii. relations and functions iii. · pdf file ·...
TRANSCRIPT
Virginia Department of Education 1 Texas Instrument Classroom Activities
VIRGINIA DEPARTMENT OF EDUCATIONWorksheets to accompany Videos
VIRGINIA STANDARDS OF LEARNINGMATHEMATICS AND THE TEXAS INSTRUMENT GRAPHING
CALCULATOR
Worksheets for SIX PROGRAMS
Written by Ellen S. Hook and Milton O. Norman
I. Expressions and Operations
II. Relations and Functions
III. Equations and Inequalities
VI. Statistics
V. Systems of Equations and Inequalities
VI. Geometry
Virginia Department of Education 2 Texas Instrument Classroom Activities
Program I. EXPRESSIONS AND OPERATIONS
SOL Topic:
A.12The student will factor completely first-and second-degreebinomials and trinomials in one or two variables. The graphingcalculator will be used as both a primary tool for factoring andfor confirming an algebraic factorization.
Activity 1 : Demonstrate how to connect factors, zeros, and graphs usingthe quadratic equation x2 - x - 6 = 0.
Instruction :• Type the quadratic equation into Y1 = x2 - x - 6• Typing the factors into Y2 = ( x - 3 )( x + 2 ) ( Use the Style key)• Graph in a Zoom Standard Window• Observe the tables, are they the same?
Activity 2: Algebraically determine the factors of other given polynomials,then Support graphically and numerically.
Review of the different types of factoring such as the Difference of Two Squares,Trinomials, and MonomialsType the following polynomials in Y1 =,then type each polynomial in factored form into Y2 =
• x2 - 4• x2 + 10x + 21• x2 - 9x + 20• 6x2 + 11 x + 3• x3 + 10x2 + 21x
Virginia Department of Education 3 Texas Instrument Classroom Activities
Activity 3: Determine if an equation, ax2 + bx + c = 0 , can be factored usingthe Discriminant “b2 - 4ac” on the home screen.
For the equation:• y = x2 + 7x + 10• Let a = 1, b = 7, c = 10• Type 1 - > a: 7 - > b: 10 - > c: b 2 - 4ac• If the answer is a positive perfect square, then the trinomial can be factored.• If the answer is not a positive perfect square, then the trinomial cannot be
factored.• ENTER the answer is “9”. (A perfect square numeral)
Now try the equation:• y = x2 + 2x + 8• 1 - > a: 2 - > b: 8 - > c: b2 - 4ac• “ENTER”, the answer is “- 28”• The equation cannot be factored.
Activity 4: Using the Test Menu and Boolean Algebra to support factoring atrinomial graphically . Use the “Y =” window.
• Y1 = ( x2 + 10x + 21 ) = (x + 3)(x + 7) and graph in a Zoom 4 window.A true statement results in a line at y = 1 and a false statement results in a line at y= 0 for all values of x. This statement is true.
Activity 5: Use Boolean Algebra to support binomial multiplicationnumerically on the “home screen”.Store:
• 10 -> x : ( x + 3)2 = x2 + 9 on the home screen. Press enter.A true statement results in a value = 1 and a false statement results ina value = 0. This statement is false for all values of x.
Try: (x + 3)2 = x2 + 6x + 9 This statement is true for all values of x.
Virginia Department of Education 4 Texas Instrument Classroom Activities
Activity 6: Given the product of two binomials in “Y1 =” , use FOIL toexpand the binomials in “Y2 =” to obtain the quadratic.
Type on the “Y =” window:• Y1 = ( x - 1)( x + 2)• Y2 = x2 + 2x - x - 2• Y3 = x2 + x - 2
Show that the graphs are identical.
On the home screen show the connection between arithmetic and algebra• (10 - 1)(10 + 2) = (9)(12)• show using FOIL that 100 + 20 - 10 - 2 = 108 in simplifying the above
Activity 7: Investigating signed numbers and operations on the GraphScreen. (addition and subtraction)
Using the cursor keys, we will visually observe the movement of the cursor to berepresented on the graph screen as adding or subtracting signed numbers.
• On the graph screen “Y =” clear,• Zoom 6 (Standard Window),• Zoom 8 (Integer Window)
• Examples: -5 - 3 = - 8 -5 - (-3) = - 2
• -5 + 3 = - 2From the origin, move the cursor to the left five times observing the x-value, thenmove the cursor to the left three times observing the final x-value. The cursor fallson -8.
Addition is a move to the right and subtraction is a move to the left.

Virginia Department of Education 5 Texas Instrument Classroom Activities
Activity 8: Investigating signed number operations on the Home Screen.
Addition, subtraction, multiplication and division using order of operations andsigned numbers. Type the same examples on the home screen.
• Examples: -5 - 3 = - 8 -5 - (-3) = - 2
• -5 + 3 = - 2
Program II. RELATIONS AND FUNCTIONS
SOL Topic:
A. 16The student will, given a rule, find the values of a function forelements in its domain and locate the zeros of the function bothalgebraically and with a graphing calculator. The value of f(X)will be related to the ordinate on the graph.
Activity 1: Solve the equation 3x - 15 = 12 on the graphing calculator usingfour methods of inquiry:
• Let Y1 = 3x - 15, Trace on an integer window (zoom 8) until y = 12, read thex-value
• Examine the table values where y= 12, READ the corresponding x element• Using the multi-graph method, let Y1 = 3x - 15, Y2 = 12, using the multi-
graph method find the point of intersection, read the x-value for the solutionto the equation
• Subtracting 12 from both side of the equation, we obtain 3x - 27 = 0. LetY1 = 3x - 27. Observe where the equation crosses the x- axis. The x-value isthe solution to the equation. This is the x-intercept method.

Virginia Department of Education 6 Texas Instrument Classroom Activities
SOL Topic:
A. 14The student will solve quadratic equations in one variable bothalgebraically and graphically. Graphing calculators will be usedboth as a primary tool in solving problems and to verify algebraicsolutions.
Activity 2: Solving quadratic equations: Using the same four methods ofsolution on the Graphing calculator, Solve x2 - 2x - 13 = 2.
• Trace Method• Multigraph Method• Table Values Method• X-intercept Method
SOL Topic:
AII.8
The student will recognize multiple representations of functions(linear, quadratic, absolute value, step, and exponentialfunctions) and convert between a graph, table, and symbolicform. A transformation approach to graphing will be employedthrough the use of graphing calculators.
Activity 3: Transformations of quadratic equations:Question--How does the graph change in shape, domain and range?
• Investigate the role of “K” in Y = X2 + K• Investigate the role of “H” in Y = (X - H)2
• Investigate the role of “A” in Y = A*X2
• Predict and describe the graph of Y = 2(X + 4)2 - 8
Virginia Department of Education 7 Texas Instrument Classroom Activities
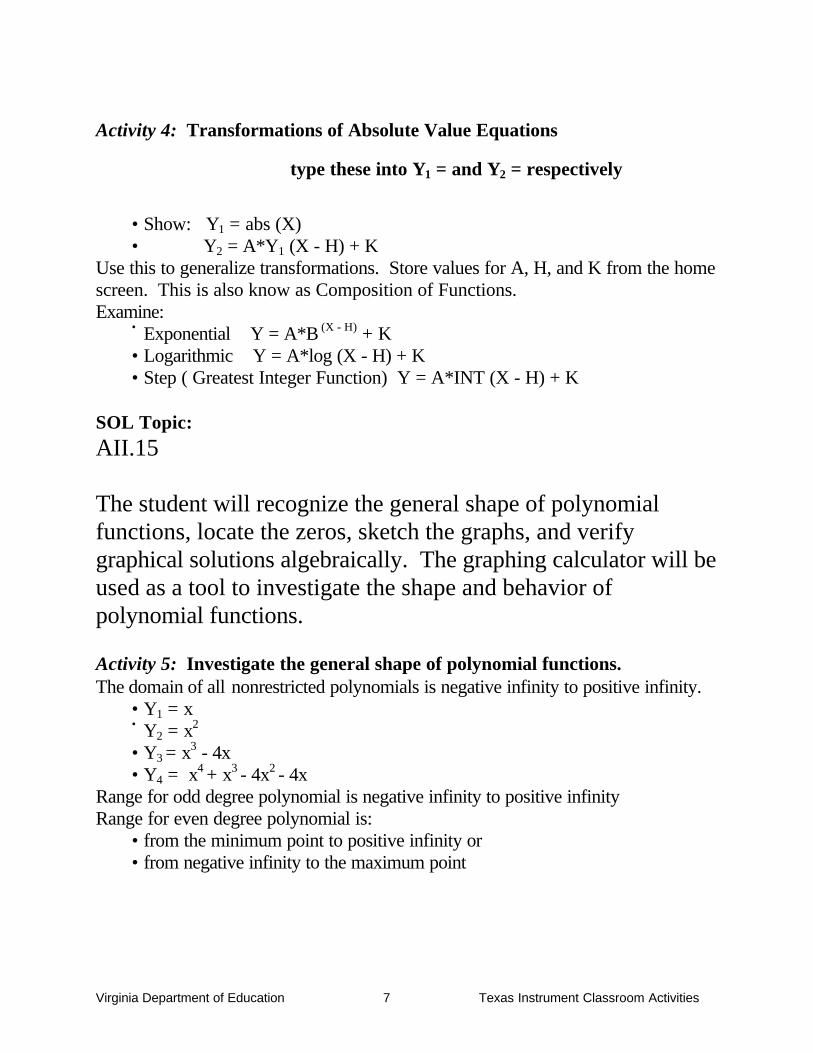
Activity 4: Transformations of Absolute Value Equations
type these into Y1 = and Y2 = respectively
• Show: Y1 = abs (X)• Y2 = A*Y1 (X - H) + K
Use this to generalize transformations. Store values for A, H, and K from the homescreen. This is also know as Composition of Functions.Examine:
• Exponential Y = A*B (X - H) + K• Logarithmic Y = A*log (X - H) + K• Step ( Greatest Integer Function) Y = A*INT (X - H) + K
SOL Topic:
AII.15
The student will recognize the general shape of polynomialfunctions, locate the zeros, sketch the graphs, and verifygraphical solutions algebraically. The graphing calculator will beused as a tool to investigate the shape and behavior ofpolynomial functions.
Activity 5: Investigate the general shape of polynomial functions.The domain of all nonrestricted polynomials is negative infinity to positive infinity.
• Y1 = x• Y2 = x2
• Y3 = x3 - 4x• Y4 = x4 + x3 - 4x2 - 4x
Range for odd degree polynomial is negative infinity to positive infinityRange for even degree polynomial is:
• from the minimum point to positive infinity or• from negative infinity to the maximum point

Virginia Department of Education 8 Texas Instrument Classroom Activities
Activity 6: Locating the zeros, sketch the graphs, and verify graphicalsolutions algebraically.
For : y = x3 - 3x2 - 4x + 12 use the Rational Root Theorem to find the zeros. P = { -12, -6, -4, -3, -2, -1, 1, 2, 3, 4, 6, 12} Q = {-1, 1}P/Q = { 12, 6, 4, 3, 2, 1, -1, -2, -3, -4, -6, -12} are the possible rational roots
Use the Graph to eliminate some roots and to estimate possible rational roots :• Y1 = x
3 - 3 x2 - 4x + 12, observe where f(x) = 0• Use the CALC menu to find the zeros.• Verify zeros algebraically on the home screen using Y1(x) .• Explore the TABLE values, show where y = 0.• Y2 = (x - 2)(x - 3)(x + 2)
Investigate non-complex, irrational roots using the graphing calculator.• Y1= x3 - 3x2 - 4x + 11• Let Y2 = 0• Show where doesY1 = Y2, using the INTERSECT feature.
SOL Topic:
AII.9The student will find the domain, range, zeros and inverse of afunction, the value of a function for a given element in itsdomain, and the composition of multiple functions. Functionswill include those that have domains and ranges that are limitedand/or discontinuous. The graphing calculator will be used as atool to assist in investigation of functions, including exponentialand logarithmic.
Virginia Department of Education 9 Texas Instrument Classroom Activities
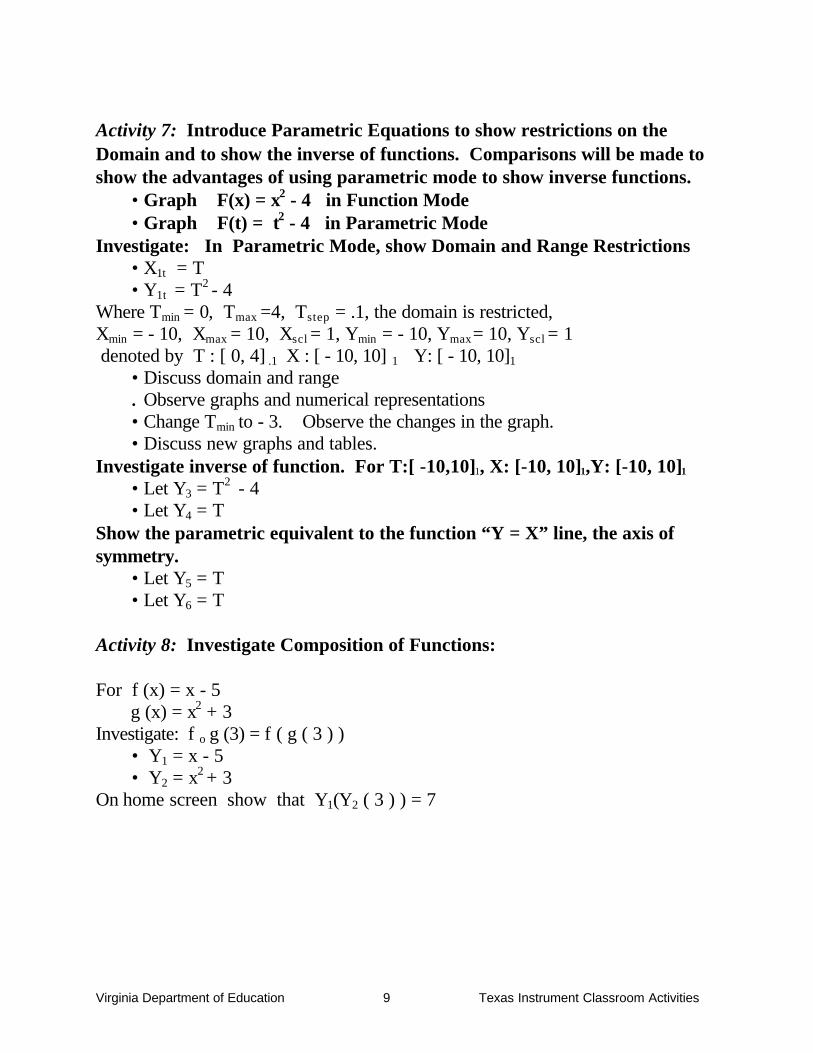
Activity 7: Introduce Parametric Equations to show restrictions on theDomain and to show the inverse of functions. Comparisons will be made toshow the advantages of using parametric mode to show inverse functions.
• Graph F(x) = x2 - 4 in Function Mode• Graph F(t) = t2 - 4 in Parametric Mode
Investigate: In Parametric Mode, show Domain and Range Restrictions• X1t = T• Y1t = T2 - 4
Where Tmin = 0, Tmax =4, Tstep = .1, the domain is restricted,Xmin = - 10, Xmax = 10, Xscl = 1, Ymin = - 10, Ymax = 10, Yscl = 1 denoted by T : [ 0, 4] .1 X : [ - 10, 10] 1 Y: [ - 10, 10]1
• Discuss domain and range• Observe graphs and numerical representations• Change Tmin to - 3. Observe the changes in the graph.• Discuss new graphs and tables.
Investigate inverse of function. For T:[ -10,10]1, X: [-10, 10]1,Y: [-10, 10]1
• Let Y3 = T2 - 4• Let Y4 = T
Show the parametric equivalent to the function “Y = X” line, the axis ofsymmetry.
• Let Y5 = T• Let Y6 = T
Activity 8: Investigate Composition of Functions:
For f (x) = x - 5 g (x) = x2 + 3Investigate: f o g (3) = f ( g ( 3 ) )
• Y1 = x - 5• Y2 = x2 + 3
On home screen show that Y1(Y2 ( 3 ) ) = 7

Virginia Department of Education 10 Texas Instrument Classroom Activities
On the graph screen: Show that these statements are equivalent.• Y3 = Y1 (Y2(x) )• Y4 = ( (x2 + 3) - 5) or Y4 = x2 - 2• Show the commutative properties of “f + g” and “g * f”• Show the noncommutative properties of “f - g” and “g/f”.
In the Zoom INTEGER Window:• Emphasize the discontinuity in composition of “g / f”.

Virginia Department of Education 11 Texas Instrument Classroom Activities
Program III. EQUATIONS AND INEQUALITIES:
SOL Topic:
A.1The student will solve linear equations and inequalities in onevariable, solve literal equations (formulas) for a given variableand apply these skills to solve practical problems. Graphingcalculators will be used to confirm algebraic solutions.
Activity 1: Solving linear inequalities in one variable.
Solve: 2 x - 7 < 0 in Zoom-4 window (Decimal Window) and identify the x-values for which y < 0.
• Graph: Y1 = 2 x - 7• “2nd TRACE” (“2nd CALC”) find the zero.• The solution is x < 3.5
Show Boolean Representation:• Graph: Y2 = 2 x - 7 < 0• Observe the horizontal line through y = 1, representing where the statement
is true.
Activity 2: Solve literal equations (formulas) for a given variable and applythese skills to solve practical problems.
Margaret is traveling from Norfolk, VA to Williamsburg, VA. She knows that thestore opens at 9am, and she wants to know what time she has to leave home inorder to make the sale at the Outlet Mall. The distance from Norfolk to the OutletMall is 50 miles. If she travels at an average rate of 47.5 mph, what is the elapsedtime for travel and what time does she have to leave home?
Virginia Department of Education 12 Texas Instrument Classroom Activities
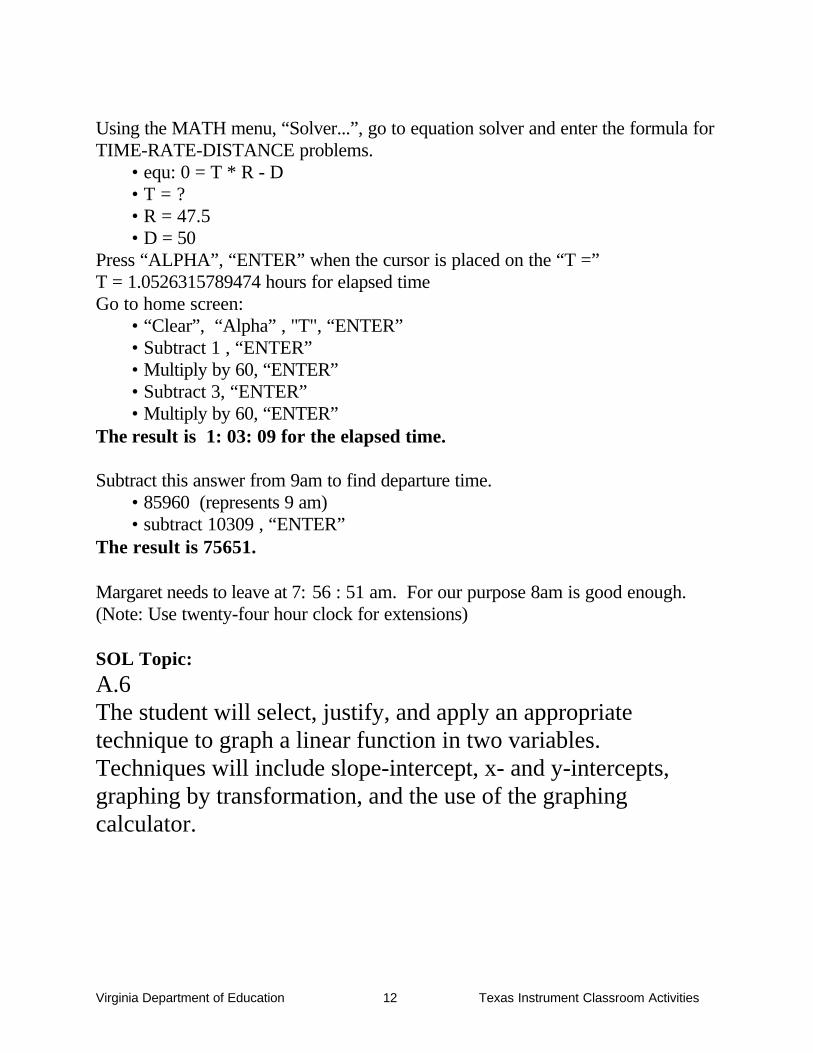
Using the MATH menu, “Solver...”, go to equation solver and enter the formula forTIME-RATE-DISTANCE problems.
• equ: 0 = T * R - D• T = ?• R = 47.5• D = 50
Press “ALPHA”, “ENTER” when the cursor is placed on the “T =”T = 1.0526315789474 hours for elapsed timeGo to home screen:
• “Clear”, “Alpha” , "T", “ENTER”• Subtract 1 , “ENTER”• Multiply by 60, “ENTER”• Subtract 3, “ENTER”• Multiply by 60, “ENTER”
The result is 1: 03: 09 for the elapsed time.
Subtract this answer from 9am to find departure time.• 85960 (represents 9 am)• subtract 10309 , “ENTER”
The result is 75651.
Margaret needs to leave at 7: 56 : 51 am. For our purpose 8am is good enough.(Note: Use twenty-four hour clock for extensions)
SOL Topic:
A.6The student will select, justify, and apply an appropriatetechnique to graph a linear function in two variables.Techniques will include slope-intercept, x- and y-intercepts,graphing by transformation, and the use of the graphingcalculator.

Virginia Department of Education 13 Texas Instrument Classroom Activities
Activity 3: Graphing a a linear function in two variables using the slope-intercept format. For the formula y = mx + b.
Examples of linear transformations may be shown by:Same m, different b:
• Y1 = x + 3• Y2 = x + 1• Y3 = x - 2
Same b, different m:• Y1 = 2 x + 3• Y2 = -3 x + 3• Y3 = 0.5 x + 3
Using lists in “Y =”:• Y1 = x + {3, 1, 2}• Y2 = {2, -3, 0.5} x + 3
SOL Topic:
AII.4The student will solve absolute value equations and inequalitiesgraphically and algebraically. Graphing calculators will be usedboth as a primary method of solution and to verify algebraicsolutions.
Activity 5: Solve absolute value equations and inequalitiesSolve: | x | = 3 in a Zoom-4 (Decimal window), find two points of intersection
• Y1 = abs (x)• Y2 = 3
Solve: | x | < 3• Y1 = abs (x)• Y2 = 3• Y3 = Y1 - Y2
• Y4 = Y1 < Y2
Virginia Department of Education 14 Texas Instrument Classroom Activities
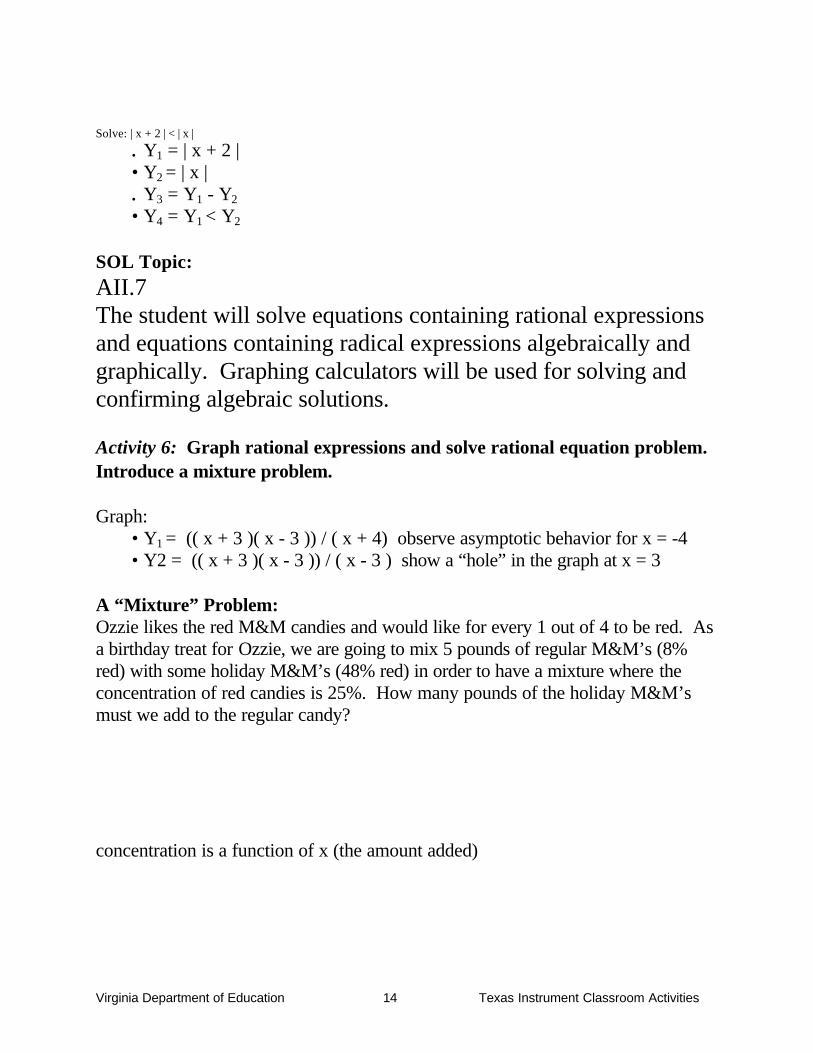
Solve: | x + 2 | < | x |
• Y1 = | x + 2 |• Y2 = | x |• Y3 = Y1 - Y2
• Y4 = Y1 < Y2
SOL Topic:
AII.7The student will solve equations containing rational expressionsand equations containing radical expressions algebraically andgraphically. Graphing calculators will be used for solving andconfirming algebraic solutions.
Activity 6: Graph rational expressions and solve rational equation problem.Introduce a mixture problem.
Graph:• Y1 = (( x + 3 )( x - 3 )) / ( x + 4) observe asymptotic behavior for x = -4• Y2 = (( x + 3 )( x - 3 )) / ( x - 3 ) show a “hole” in the graph at x = 3
A “Mixture” Problem:Ozzie likes the red M&M candies and would like for every 1 out of 4 to be red. Asa birthday treat for Ozzie, we are going to mix 5 pounds of regular M&M’s (8%red) with some holiday M&M’s (48% red) in order to have a mixture where theconcentration of red candies is 25%. How many pounds of the holiday M&M’smust we add to the regular candy?
concentration is a function of x (the amount added)

Virginia Department of Education 15 Texas Instrument Classroom Activities
AII.6The student will select, justify, and apply a technique to solve aquadratic equation over the set of complex numbers. Graphingcalculators will be used for solving and confirming algebraicsolutions.
Activity 7: Solve quadratic equations over the set of complex numbers in agraphing environment.
Graph individually in a Zoom-4 window and observe where the graph crosses the x-axis.
• Y1 = x2 tangent to the x-axis
• Y2 = x2 - 1 crosses the x-axis twice• Y3 = x2 + 1 does not cross the x-axis• Y4 = x2 + x + 1 does not cross the x-axis
Look at the table values where Y1 = 0, Y2 = 0, Y3 = 0, and Y4 = 0 to find the roots.• Use TRACE on the graph screen, type an x-value to find where Y = 0.• Use the 2nd CALC menu to find the zeros, show how the roots cannot be
found when the roots are complex.• Discuss the meaning of “estimate, approximate, guess”• Use the board to show the quadratic formula method for finding complex
roots for “x2 + x + 1 = 0”

Virginia Department of Education 16 Texas Instrument Classroom Activities
Show the Rectangular Complex Mode, Change MODE to “a + bi”.
• Add complex numbers (3 + 6i) + (4 - 8i)• Subtract complex numbers• Multiply complex numbers• Divide complex numbers
Show the iterating powers of “i” on the home screen:
• 1 ENTER• press * i , ENTER• ENTER• ENTER...
Program IV. STATISTICS
SOL Topic:
A.4The student will use matrices to organize and manipulate data,including matrix addition, subtraction, and scalar multiplication.Data will arise from business, industrial, and consumersituations.
Activity 1: Show matrix data entry, matrix addition, matrix subtraction, andscalar multiplication.
In the matrix menu enter the following data for a 2 X 2 matrix

Virginia Department of Education 17 Texas Instrument Classroom Activities
Return to the home screen and perform the following operations:
• [A] + [B]• [A] - [B]• 2 [A]• 2 [A] - 3 [B]
Activity 2: Organize data into matrices to find the inventory of 2 shoe stores.Show matrix addition to show total inventory of the shoe store chain suchthat inventory does not fall below 30 of each size.
Data for Store Alpha:Styles Sizes Inventory
Loafers 10 3011 7012 90
Sneakers 10 12011 20012 50
Oxfords 10 4011 7012 33

Virginia Department of Education 18 Texas Instrument Classroom Activities
Data for Store Beta:Styles Sizes Inventory
Loafers 10 8011 1012 100
Sneakers 10 20011 18512 150
Oxfords 10 7511 8012 106
SizesStore Alpha:
Store Beta:
Store [Alpha] + Store [Beta] = [Total Inventory] -> [Gamma]• Show how to store a matrix• Show how to “fill” a matrix with the numeral “30” = [Minimum Inventory]
[Total Inventory] - [Minimum Inventory] = [Quantity Sold Prior to Reordering]
Virginia Department of Education 19 Texas Instrument Classroom Activities
SOL Topic
A.17The student will, given a set of data points, write an equation fora line of best fit, using the median fit method, and use theequation to make predictions.
Activity 3: CLASSROOM VIDEO of collection of data from "The WAVE”Procedure:
• Select the number of persons for each group.• The first person will stand up, say “START”, his first and last name, sit
down.• The last person must say “STOP” after saying his first and last name.• Record the time in seconds.• Increase the number of groups with each pass.• Save data as an ordered pairs (number of people, time).• Enter the data in lists (L1 and L2).• Graph the data as a scatter plot.• Estimate a line of best fit with a piece of spaghetti.• Find the slope of that line.• Derive an equation and place in “Y1 =”• In “Y2 =” find the line of best fit using Linear Regression “LinReg (ax+b)”.• Compare the two lines.• Predict how long it would take to “Do the WAVE Twice”
SOL Topic:
A.18The student will compare multiple one-variable data sets, usingstatistical techniques that include measures of central tendency,range, stem-and-leaf plots, and box-and-whisker graphs.
Virginia Department of Education 20 Texas Instrument Classroom Activities
Activity 4: CLASSROOM VIDEO: The Birthday Problem collecting one-variable data showing, central tendency, range, and a box-and-whiskergraph.
Procedure for Box and Whisker Graphs: Using a Julian Calendar and the home screen of the calculator students willcompute the Julian Calendar Day on which they were born.
• Students will form a line in ascending order using their calendar day.• Find the middle (Median) of that line.• Find the Minimum day, Maximum day, compute the Range, the First
Quartile, the Third Quartile, and the Mean (a useless quantity)• Go to “STAT PLOT” (2nd Y=), press ENTER.• Enter the data into the calculator in L1.• Turn Plot 1...On, Highlight Box and Whisker, press ENTER, let Xlist : L1,
Freq: 1• For WINDOW let : Xmin = - 10, Xmax = 400, Ymin = - 3, Ymax = 10,
Yscl = 1.• GRAPH and TRACE find : MinX, Q1, Med, Q3 , MaxX.
Activity 4: CLASSROOM VIDEO: Derive a Histogram and Stem and LeafPlot from the Birthday DataProcedure for Histogram:
• Using the “Birthday Program” previously linked into the calculators, studentswill find the day of the week on which they were born.
• Students will line up in seven lines representing each day of the week.• Teacher will assign a position number to each student.• Enter the position numbers into the calculator in L1.• Turn Plot 1...On, Highlight Histogram, press ENTER, let Xlist : L1, Freq: 1• For WINDOW let : Xmin = 0, Xmax = 100, Xscl = 10, Ymin = -3, Ymax
= 10, Yscl = 1.• GRAPH and TRACE.• Show Stem and Leaf Plot from the data extracted from the Histogram.

Virginia Department of Education 21 Texas Instrument Classroom Activities
SOL Topic:
AII.19The student will collect and analyze data to make predictions,write equations, and solve practical problems. Graphingcalculators will be used to investigate scatter plots to determinethe equation for a curve of best fit.
Activity 5: CLASSROOM VIDEO: The M&M problem showing exponentialdecay will be exploredProcedure and Student Activity:
• Instructor will place the students into groups of four.• Distribute one small bag of M&M’s and cup.• Give instructions to students to count the total number of pieces.• Place in cup. Roll onto table and separate into two groups.• Count the ones WITHOUT “M’s” showing.• Record the data (Two column data...Number of Trials vs. Number of pieces
without “M’s”).• Place the pieces WITH “M’s” back in the cup.• Repeat the roll until none of the pieces are remaining.• Record data after each trial.
On the calculator:• Collect the data from each group by recording the sum of each trial and
placing in a LIST---remembering that the “MMS” cannot equal zero.• Show how to “Name” a list (“TRIAL” and “MMS”).• Show how to set up the STAT PLOT, WINDOW, and GRAPH in a
“Scatter Plot” mode.• Discuss the meaning of the scatter plots as they relate to Exponential Decay.• Find the line of best fit using the “ExpReg” and place equation in “Y1=”.
Virginia Department of Education 22 Texas Instrument Classroom Activities
Program V. Systems of Equations and Inequalities
SOL Topic:
A.9The student will solve systems of two linear equations in twovariables, both algebraically and graphically, and apply thesetechniques to solve practical problems. Graphing calculatorswill be used as both a primary tool of solution and to confirm analgebraic solution.
Activity 1: Solve the following system graphically, numerically, and confirmanalytically.
Place both equations into slope-intercept form:• Y1 = (-1/2) x + 4• Y2 = 2x + 12• Use 2nd CALC, “intersect” to determine where the lines cross.• The graphical solution is (x, y) = ( -3.2, 5.6)• Examine table values with TblStart = -4 , d tbl = .2• On the table find : X = -3.2, Y1 = 5.6, Y2 = 5.6• Show algebraic solution using linear combination. (x, y) = (-16/5, 28/5)
Activity 2: Solving practical problems using systems of equations.
The Video Club of Virginia advertises a membership fee of $20.00 per year andallows its members to rent each video for $1.50 each. Write an equation for theproblem: How many videos rentals can you get for $29?
• Let Y1 = 20 +1.5x• In Zoom 8, trace to find where Y = 29, Solution is X = 6 videos.• Show table values.
Video Club of America is a competitor which advertises a membership fee of$25.00 per year and allows its members to rent each video for $1.25 each.Write a linear function for Video Club of America’s rental in Y2.
• Y2 = 25 + 1.25x
Virginia Department of Education 23 Texas Instrument Classroom Activities
Questions:
• When is Video Club of America the least expensive?
• For the memberships to be equal how many videos do you have to rent ?
• Solve the equation 20 + 1.5x = 25 + 1.25x.
• If your parents allow you to rent four videos per month, and this was a Christmas present, on July 31st how
much have you spent if you joined Video Club of Virginia? How much have you spent if you joined Video
Club of America?
SOL Topic:
AII.11The student will use matrix multiplication to solve practicalproblems. Graphing calculators will be used or computerprograms with matrix capabilities will be used to find theproduct.
Activity 3: Demonstrate weighted averages using Matrix Multiplication.A grading system is establishes in a math class with the following criteria:Tests are 50%, Homework 20%, and Quizzes 30%. The following table gives theaverage scores for four students in each of the three areas.
Name Examination Homework PresentationEllen 71.2 82.86 80Gene 71.4 81.43 83.33Mike 69.8 72.9 81.7Christine 88 84.29 91.67
Place the average scores in matrix A. Place the weights in matrix B.Multiply [A] [B].
[A] * [B] = [Weighted averages]
[A] [B]

Virginia Department of Education 24 Texas Instrument Classroom Activities
• How would you establish, on a scale of 90%-A, 80%-B, 70%-C, 60%-D,and below 60% an F, a grade for Ellen, Gene, Mike and Christine?
• Calculate their grades.
Emphasize that for a class of 30, the first matrix has a dimension of “30 by 3”, andthe second matrix still has a dimension of “3 by 1”.
SOL Topic:
AII.12The student will represent problem situations with a system oflinear equations and solve the system using the inverse matrixmethod. Graphing calculators or computer programs with matrixcapability will be used to perform computations.
Activity 4: Solving systems of equations using matrix multiplication andexamining the “reduced row echelon format” on the calculator.
Use matrices to solve:
• [A] [X] = [B]• [A]-1[A][ X] = [A]-1[B]• [X] = [A]-1[B]
• Where [A] is the matrix of coefficients, [X] is the matrix of Variables, and [B] is thematrix of constants.For the Reduced Row Echelon Form use:
• “MATRX”, “MATH”, “rref ( [A] )”
Virginia Department of Education 25 Texas Instrument Classroom Activities
SOL Topic:
AII.13The student will solve systems of linear inequalities and linearprogramming problems and describe the results both orally andin writing. A graphing calculator will be used to facilitatesolutions to linear programming problems.
Activity 5: Describe use of a linear programming activity.A computer manufacturing plant can assemble computer parts using two processes.Hours of unskilled labor, skilled labor, and machine time per computer are given.You can use up to 4200 hours of unskilled labor and up to 2400 hours each ofmachine time and skilled labor. How many computers should you assemble byeach process to obtain a maximum profit?
Process A earns a profit of $125 per computer, and Process B earns a profit of$160 per computer. 0bjective is to obtain a maximum profit P.
P = 125A + 160B

Virginia Department of Education 26 Texas Instrument Classroom Activities
The vertices at the points of intersection of the graph are:• (0, 1200) P = $192,000• (400, 1000) P = $210,000 Max Profit• (1000, 400) P = $189,000• (1200, 0) P = $150,000• (0, 0) P = $0
There for the maximum profit is obtained by making 400 component parts usingprocess A and 1000 component parts using process B.
SOL Topic
AII.14The student will solve nonlinear systems of equations, includinglinear-quadratic and quadratic-quatratic, algebracially andgraphically. The graphing calculator will be used as a tool tovisualize graphs and predict the number of solutions.Activity 5: Demonstrate a projectile motion problem (quadratic equation) asit relates to a real world situation.
For a Linear /Quadratic System:
A CO2 rocket is launched straight up from ground level with an initial velocity (V0)
of 150 feet per second. At what time will the rocket be at least 200 feet above theground? (S0 =0). What is the maximum height? When will it occur?
The formula for projectile motion is s = -.5gt2 + v0t + s0, where g = -32ft/sec2
Show Algebraic Solution:• -16 x2 + 150x = 200• -16x2 +150x - 200 = 0

Virginia Department of Education 27 Texas Instrument Classroom Activities
In Function mode:
• Let Y1 = -16x2 + 150x :• Y2 = 200• Using 2nd CALC, intersect, compute the two points of intersection which
represents time (x-values).• The solutions are x = 1.6097 seconds and x = 7.7653 seconds.• The maximum height = 351.56 feet, when x = 4.688 seconds.
Graph in Parametric Mode, Simultaneous Mode:• Let: X1T = T• Y1T = -16T2 + 150T• X2T = 4.688 (Change style of the equation)• Y2T = - 16T2 + 150T
Window :• T: [ 0, 10] .1
• X: [ -2, 10] 1
• Y: [-100, 500]100
Program VI. GEOMETRYSOL Topic:
G.7The student will solve practical problems involving righttriangles by using the Pythagorean Theorem and its converse,properties of special right triangles, and right triangletrigonometry. Calculators will be used to solve problems andfind decimal approximations for the solutions.
Activity 1: Use the Pythagorean Theorem to explore Algebraic relationshipsin Geometry.
The hypotenuse of a right triangle is 13 units. The difference of the lengths of thelegs is 7 units. Find the length of each leg. Explore analytically, graphically, andnumerically.

Virginia Department of Education 28 Texas Instrument Classroom Activities
ANALYTICALLY :Let:
• One leg = x• Second leg = (x - 7)• Hypotenuse = 13• Equation to solve analytically is “x2 + (x - 7)2 = 132
• Solution: first leg is x = 12, second leg (x - 7) is 5.
GRAPHICALLY:
• Y1 = X2 + (X - 7)2
• Y2 = 132
• Use “2nd Calc”, “Intersect” to find solutions
• Solutions are x = -5, and x = 12, when y = 169 but a side of a triangle cannot be negative, therefore x = 12 is
the solution.
NUMERICALLY:
• INVESTIGATE THE TABLES:
• When x = -5 and x = 12
Activity 2: Graph in Polar Mode, the Unit Circle with degree increments as the x and y coordinates correspond to the
special right triangle values .
Mode:
• Polar
• Degree
Window:
• Zoom Decimal, divided by 3;
Graph and trace when:
• r1 = 1To observe the special properties of right triangles note the X and Y coordinates,when theta = 0, 30, 45, 60, 90 degrees with an added bonus of 15 and 75 degreesat no charge.

Virginia Department of Education 29 Texas Instrument Classroom Activities
Questions:In which quadrant does a 120 degree angle fall?What is the coterminal angle of -67.5 degrees?In which quadrant does a -128.5 angle fall?Can you find the sine, cosine, and tangent of 128.5 degrees?What is the tangent of 45 degrees?What is the sine of 30 degrees?What is the cosine of 60 degrees?When are the sine and cosine equal?
Activity 3: Graphing Simultaneously the Unit Circle and Sine Wave inParametric Mode.
Mode:• Parametric• Simul• Radian
• X1T = cos(T) - 1• Y1T = sin (T)• X2T = T• Y2T = sin(T)
Window:
Graph and Trace when T = 1.57, T = 3.14, T = 4.71, T = 6.28View the circle and the sine curve using the “up” cursor when tracing.
Activity 4: Solving word problems in trigonometry using the home screenof the graphing calculator.Problem:A person is 6 feet tall and casts a shadow of 8 feet on the ground. At what angle isthe sun above the horizon?Is it morning, noon or evening? Explain.

Virginia Department of Education 30 Texas Instrument Classroom Activities
Solution to finding the angle of the sun above the horizon:• Degree Mode• Home Screen• Tan -1(6/8) = 36.86989765 degrees
Change into degrees-minutes-seconds:• 2nd ANGLE , #4: DMS• ENTER• Solution is 36 degrees 52 minutes, 11.632 seconds
G.13The student will use formulas for surface area and volume ofthree dimensional objects to solve practical problems.Calculators will be used to find decimal approximations forresults.Activity 5: Solving a practical problem in three dimensional geometry.
Find the amount of material required to construct a cone-shaped drinking cup forthe Granby Elementary School water fountain. The slant height of the cone must be5 inches, the radius of the cone is 4 inches. What is the height of the cone? Whatis the lateral area? What is the amount of water which the cone will hold?
Solution: From a 3-4-5 right triangle, if the radius = 4, then the height = 3.Use the Formulas for finding the Lateral Area and the Volume of a cone :
On the home screen:
Virginia Department of Education 31 Texas Instrument Classroom Activities
SOL Topic:
G.15The student will draw a system of vectors and find the resultantgraphically, write the components of a vector as a columnmatrix, and find the resultant by matrix addition; and solvepractical problems using a system of vectors.
Activity 6: Given a system of vectors find the resultant with vector additionon the graph screen of the calculator.Problem:
• Add the vectors v1(2,5) , v2 (4,3) to find the resultant vr (6,8) geometrically.New Activity:Window:
• X: [-10, 84] 10
• Y: [-10, 52] 10
Using the LINE command on the DRAW MENU:• Draw a line segments (representing a vectors) on the home screen.• Line (0, 0, 10, 25)• Line (0, 0, 20, 15)• Algebraically find the resultant.• (10, 25) + (20, 15) = (10+20, 25+15) -> (30, 40)• Graph the translation of the resultant using DRAW, “Line (• Begin at the endpoint (10, 25), press Enter.• Move the cursor on the graph screen right 20 units then move up 15
units, then press ENTER.• Graph the resultant.• Line ( 0, 0, 30, 40)

Virginia Department of Education 32 Texas Instrument Classroom Activities
Activity 7: Writing the components of vectors in a column matrix then findthe resultant by matrix addition within a practical problem applications.
The problem:A tourist takes a taxi to go to the nearest pizza parlor in New York City. The taxidriver takes him 10 blocks east and 25 blocks north of his original location. Hesays, “This taxi driver is nuts” and gets out of the taxi and flags another. He says,“Please take me to your nearest pizza parlor.” The new taxi takes him 20 blockswest and 15 blocks north. When they arrived at the pizza parlor, how much did hepays both taxi drivers, and how many blocks from his point of origin had hetraveled? ( east-west, north-south)
Represent the vectors in a 2 by 1 column matrix.
Solution:He had traveled 10 blocks west and 40 blocks north of his original location.(Teacher can assume a charge per block in making an extension).