i~ a s te file cspy - bureau of reclamation · 0", i~ a s te file cspy bureau of reclamation...
TRANSCRIPT

i..~ ~ ~ . , ' ' ,
. ~ , 6 1
4
::'i:. ,::2. , , , - .
i : ~ j .
*: ; , ' i l ; : . . ' '
:! .2 : .
:! .,D- ,
i . ,~ 5 :
: i . C • ,
0", I~ A s T E
File CSPY BUREAU OF RECLAMATION HYI~AULI C LABORATORY
NOT TO BE RF21OVEO FROM FILES
* * * * * * * * * * * * * * * * * * * * * *
,ma~ S~A~S DEPAR~T OF ~HE INTERIOR
BUREAU OF REC~0N
IULDRAULIC LABORATORY REPORT E~O, L x)
F~0N IN STEEP CHUTES ~Tl~i~I SPECIAL ~ E
• 0 SELF-~ION
By R~ Ehrenberger
Translated By Ed~mrd F. ~ilsey, Assistant Engineer
Denver, colorado Ootober 193~
/, /

d
.ee
i:
~X~BD ~A~8
.BURBLU ~ ~cL~J~?ZO~
e~ Dl~41pm end O ~ i o ~
~ P , Ce)a , .a4e ,. ' Oo~ebor 193~
Ib"~ula t , zabon,,,,.ke~ ~ 8 ~ d ~ o ~ 1,'. WileeF+ m~Ammd ~ , ,I. ~ . Wara,e~
. , , , .+ ,+~mm .or_u,n.mse~e,m :.1,a 8~e£~oa ~ ' _ no s~mam, mr S ~ X o k ~ l , t , sme, de1" +tm,,.Iv~..t,,_"~,,,.n,u,.~..._...__ ,,. __ . ) mlt • , - - - - o -,,,.,,~,.,.e,~6ua ~ttag ~e ~ l l l ) o r
.- ~ und As'ohi'~,o,.,.,. , , o ~ m , ;z.ns s
llaelm ~ o r =~ram ~ upper 1~o~ ,at l ~ L g l ~ ~ p31~ts £s u ~ .
dt~eo~od tntbe ~umbZo bets in wl~Loh ,enor U disstps~toa ( L ~ n ~ z l J t b £ o n ) i s
8 ~ k ~ P i o t m ~ aoi~oTod. ~h~ 8overo nhooks to ~h~=h sooh d e ~ o o e m lubo
~ o ~ o ~ a8 ~ 1 1 as the ~ K o o c m e l ~ o ~ t o n oo~ko ~n~o2~d~ l'n.vo l od to 4~h~,
suF~os~Lon ~ h ~ than e x o e o s f lmr . m i ~ be dL~o~od b 7 ms~nn .oF s~ml~o ~
a~eop ohu~eso Zn suoh oh~meZe~ a l O ~ e l S t ~ i o n ~ o J e p ~ o o ~8 a r e s u ~
o f tho ~1o~on~1 ~tnd .air r e s £ 8 ~ o e . 8~oh a oh~oe was . o m ~ P u o ~ m d ~ o ~
lento u~mh tk4s ~ eF o ~ e ~ o ~ ~o~k8+ as ~ml l a8 ~ho ~ k that tho
nien~e of t~Zow in s~oop olm~es £e .~A~2 sn a~mo~ une~Zored ~leZd+
out ,oared ~hs~ an e z p e r ~ l ,st"ud~ o.P ~ e ~ o ~ and ~ho a o o 0 m ~
e ~ l ~seribe~ heroin w~e msde in ~ ~ y d l ~ Z l ~ ~ruo-
~u~,+ .Rese~v~ Ine~t~u~o a¢ ~h~ . ine~tK~£on +of ~he .'B~r,.'~ e~ A U ~ i , ~
~ l w ¥ . . 81~oe .ezi~la~ wlNl~7 ~oPnu~a ape ~ o ~ Z ~ t e d ~n appIi-
ea~len .to s2ope8 of .abou~ ~ ~o 1.5 ~eroen~, ~ho u2tla~te a~,. of thie etud~
u~8 ~o ee~abXAal~ a ro~l~Aon ~ , t ~ , o n the a v e ~ e No~4onsX veloeAL~,
8Yo~o, and ~ P ~ u ~ o radius ~ p i+1o~e8 +up ~e m y 70 peroen~:. ~n *ddi~ lo~
~;0 "~1~8, i ~ ~118 a~temp~ed +'P,,O ~IJ~ & ro~g~q;io~ bql~qlO~ ~h0 t V e ~ p l e ~ L O a
• : ~ a orose N o , t o n ( e x p r e u e d a~ ~he ra the b7 v o l u ~ e ~ ~ e ~ e r pea,-tiam
~0 the whole w a ~ e ~ i r m l ~ u r e ) , ~q:he s%ope It, d .Ir~h~uZlo ~d£~aJ. Xq:
should be n~nt:£oned &~-thio p¢In~ ~ha~ th~ m m a a ~ t of-tho awn, a~ ,
el~eo-soetio~sl ~810o£~y ~et8 with ~un~al di~fie~tle.s. ~or ~he
a ~ a ~ a b l o + i n g ~ m e ~ For ~e~a~ring ~eloel~, s'ueh 04 o~rea~ moterl 0£
• t~Aous ~ p e e and I ~ t ~ : . e~e +l:~.sed on "khe %aolt & s t a t i o n t h a t tho
s/~o.tfLe p 'wr l .~ e~' the liqluid As ur iah . ~heoo ~mmmmont8 u ~ u l e ne~ be
+ , ! + : ,
't;i

i / i,~;/ i ̧
applicable, should they be first calibrated in ~.~ter aerated to various
desrees, for, as the experkments showed, ti:e -.~mter presented different
degrees of aeration at different •points of the cros~ section which would
have to be pre~iously determined. ~efore proceeding with thedeter"
mination of velocities, the complete lay-out of the apparatus and the
general plan of the investi~ation will be described in detailo
The experiments ~re performed on chutes with ~ive different
slopes and with ,four different discharges for each ,slope. .These bottom
slopeslin test series I to V were S - 15.5, 20.6, 32.0, 49.5, and ?6,2
percent. The last value corresponds to the slope of the wastermy at
the Rutz Works. Anabsolute fall ~of 3~5 meters (iI.5 feet) was avail-
able in the laboratory. The len~th along the incline for the smallest
slope (test series I) was 16~9*.ers i(52.5 feet) and for the maximum
slope (test series V) was 5.5 meters (18 feet). In ,,~eneral, those
lengths were entirely ~sufficient to ins;re uniform Dlow at the lower ~
end nf the chute. 0nly in,test series V, at the higher velocities,
did it appear that uniformity was not completely,achieved. .'~enoe, in
this case, extrapolation had to be employed. The disc.harses used for
each of the test series were i0. 20, 31, and ~4.5 second-liters (0-353,
0.706, 1.09, ~Lnd 1.-57 second-feet). Occasior~lly, a discharge as low
as throe second-liters '.(0.-i00 second-feet) was used as a check. The
44.5 second-liter (1.57 second-feet) discl~rGe v~s the maximum attaln-
able under the given laboratory conditions. A bafZle served to quiet
IBy the slope, S, Is meant the tangent of the an~le of incllrmtion
of the bottom of the chute. ~he slne of the angle of inclination had
to be introduced, however, in the final formula for theoretloal con-
s i derati ons.
; b
2
i. ̧ ;
the flow issuing from the high reservoir. The •cross section of the
channel w~s rectangular and in conformity to the dimensions of the Rutz
waste chute (bottom width 2. bmeters or 8.2 feet~ had a width of about
0. 25 meters or 0,82 feet.
A certain problem arose in connection with the exact determination
of the water surface. As a result of :the aeration phenomenon (produced
by air resistance), with the ~naller slopes, the surface w~s much
roughened, and in addition, detached drops of water moved along parallel
to the water surface, while with Greater velocities, a water surface, in
the usual sense of the word, simply did not exist because of the gradt~l
transition from air to water. With the larger discharzes in test series
V, in which surface velocities of 8.5 meters per second (27.9 feet per
second) occurred, the water surface exhibited, as a result of the large
~mount of intermingled air, the same milky-white appearance noticeable
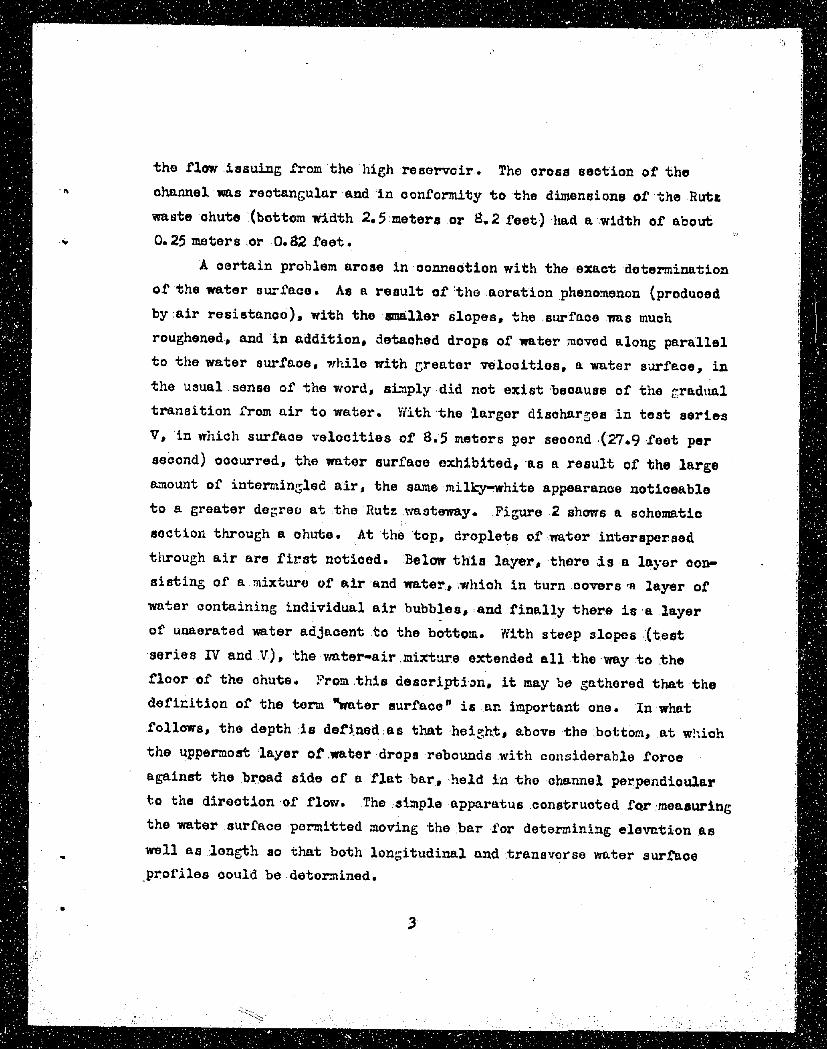
to a greater degree at the Rutz wasteway. Figure 2 shows a schematic
section through a chute. At the top, droplets of w~ter interspersed
through air are first noticed. Below this .layer, there is a layer con-
sistin G of a mixture of air rand water, which in turn covers ~, layer of
water containing individual air bubbles, and finally there is a layer
of unaerated w~ter adjacent to the bottom. With steep slopes (test
series IV and V), the voter-air mixture extended all the way to the
floor o f the chute. From this description, it may be ~athered that the
definition of the term "water surface" is an important one. In what
follows, the depth is def~ned as that height, above ~he bottom, at which
the uppermost layer of.water rdrops rebounds ,with considerable force
against the b~oad side of a flat bar, held in the channel perpendicular
to the direction-of flow. The s~mple apparatus . oonsSrue ted fQr measuring
the water surface permitted moving the bar for determining elevation as
well as length so that both longitudinal and transverse w~ter surface
profiles could be •determined.
3

• S e l f o A e r a t t o n o~ Water
As aiready mentioned, ~the phenomenon of self-aeration is also
severed briefly in the tests. By means of several ~lass windows placed
on the sides of and extending ~to the bottom of the Chute, this phenomenon
could be directly and effect ivel2 observed. A white area indicated the
aerated ~ter, while below this strip, extending to the floor, a clear
portion (air-free) was observed. Bet~on ~h,)se two layers, a more or
less well defined 'Boundary laye#'was noticed markin G the lhuit of the
aeration. If the velocity hea~, determined by means of a ~s~_mple Fitct
tube, held at v~rious heights along a normal to the w~ter surface, is
plotted on coordinate paper, charact~ristic ~or~al velocity head carves
are obtained (figure 7). The elevation o£ t.hat point denoted by tl,
above which the veloclt~j head, ns a result of aeration, decreases rapidly
agrees well, Tot the ~s.ll slopes (test series I-II!), with the elevation
of the previously mentioned , boundary layer." Pitot tube measurements
made along the center line of the chute also gave informs&ion on the
variation of the aeration in the longitudinal direction. Fig~re~ shows
a longitudinal section in which the sloping bottom is shown horizontally.
The heavy curve shows the water surface, and the dashed curve indicates
the position of the boundary layer. The cross-hatched ,part between these
t~o curves represents the water-air mixture. It is seen from this graph
that the aeration takes place gradually and nQt suddenly, as in certain
cases of the hydra.~lic J~mp. Further, ~a welml defined dip in the water
sure'ace is to be observed. This can be explained by the fact that the
depth of ~ater in the upper part of the channel, where no appreciable
aeration is present, corresponds t o an ~increase in ~elocity , whi~e in
the lower part, in spite of the further veloc~hy increase, ~he depth,
as a result of the aeration, co~tinues to increase until a final constant condition is reached.

.Determir~tion of tl~e. surface ~Velocity
by a Photographic Precedes_
In order to ascertain the avera~e velocity in a cross section,
a knov¢ledge of the surface velocity was first necessary. This w~s
afforded by photographin~ a !luminous float, for a short exposure (0.1
to 0.2 seconds), placed in the upper ~end of the chute. These floats
consisted of small match boxes to which pieces of ma~aesium ribbon were
fixed. The luminous magnesium was recorded on ~he film as a white strip
~.hoee real length could be easily found by comparia Z it with sage lines
of k~aovm, length placed everymeter along the sides of the chute at the
same elevation as the existing :',~ter surface. ~tch boxes were chosen
for floats, in order to prevent the ext!nguishin~ of the light source
by the surrounding w~ter spray. Such a float projectin~ relatively
i:i~h above thewator surface encounters a small air resistance, which
will be discussed i later. Evidently, this procedure is primarily adapted
t o a n instant when the float is in.a region o f uniform velocity. Only
with the largest discharges of testseries V, in w~tich absolutely uni-
form stretches did not exist, viers several luminous floats released
simultaneously close behind one another, in order to arrive at the
trend of the surface velocity in the longitudinal direction.
To find the actual t£me of exposure, was mot so simplo as to
measure the path described by the float. The time of exposure had to
be as short as possible (about 0,I second)for the steep chutes, con-
sidertng the hio~h velocities ~and ithe relatively short uniform paths.
At first the time was measured by photographing on the same film a
clocko placed near to the chute and ha~ing a l~minous ~haad movin E over
a black face, and the luminous float. The elapsed time was found by
simple division f~..~m the angular veloo.it~j of .and the angle traversed 'bY
t ho hand (a stoP watch was used in determining the angular velocity),
the movement of the hand .over the ~black face recording well on the film.
5

!/
'v
H~ever, it was shown that the moti'cn .. of 'the ~b~nd, in .spite of .a .b~l-
ance wheel, was not accurately uniform and, further, the elapsed time
• could not be determined with the .required accuracy by simply .using :a
• stop w~toh. For example, if the velocity is to !be determined within
, accuracy '•Of -- 5 ,perce~Gr, the t&~e must be accu v • ratel , 0.005 second, assuming an elapsed tim e of the exposure y measured t;o
o f about~ 0.1 second. Since such an accuracy could no~ be a t ta ined with th is method,
the time had to be •measured in some otherlway" This was afforded ~by
the use ~of an arc 'lamp suppllied with alternating current (25t000 CP;).
The light emitted ,by an arc lamp, as is well known, is not of constant
intensity i but changes regularly from maximum to minimum eor~espondlng
%o the reversals of the poles (equal to twice the frequency). Accord-
ingly, the path of the han~ is recorded not as a ~:~fcrm white image
on a dark background, but a~ a series~of isolated white Lma~es on a
dark background. If now the frequency of the alternating current
amounts to 50 cycles per second, the number of p~le :reversals is i00;
hence, the time between two consecutive positions:of the hand is ac-
curately O. 0 1 second. The total time of exposure is ~obtained from
~.he n~mber of images of the hand. Using this method, it is evidently
unimportant whether the hand moves wlth uniform angular velocity or
not. Since the frequency, in consequence of the different leads im-
posed on the transmission network, at ~ost varies about two percent,
an accuracy in the measurement of the tLme bet~een two successive
positi, ~s of the hands of 0.004 second was achieved, or about /four
percentl. Accurate experiments proved that this percentage in the most
unfavorable tests should be increased perhaps by a small amount as a
result of the difficulty ~in reading the first and ~last positions of
the ~hand. The total probable error can therefore be ~taken as about
five percent ~ for the .7,ost unfavorable conditions. The desired velocity
is given by dividing the length of the path of the float by the time
6

. . r . . . . •
thus ~ determined. The ~surface ~eloolty at a point ~is ~obtained by this
method or, to 'be more accurate, ~the:average over the width of the match
box (about one-seventh~of the %otal~width of the chute). A!knowledge
of the "average surface velocity"~was ~necessar 5, ~for the further anal-
ysis. Since the float evidently did not move accurately in the middle,
the correspondin~ reduction could not ~follow accordlng to a definite,
fixed ratio, but must~be evaluated by considerin~ the ~position~of the
float at a given instant. The ~maverage surface velocities, Obtained
in this vmy are given in the following table (table i) and arc denoted
v • o
It should be mentioned that the term "average Surface velocity,,
thus obtained, is not absdlutely correct because the float has various
depths of iz~.ersion as a result of the different ~degre~.s cf aeration in
a single test. Therefore, the calculated values do not ~ive the exact
surface velocities. ~In thefollo~in~, the assumption is made ithat an
increase in the velocity of the ~float. This~assumption~appears Jus-
tifiable because, as the tests slowed, the water,portion of the water-
air mixture increases rapidly from top to bottom; :therefore water par-
ticles at the elevation of the bottom of the float play ~the chief part
in impelling the float. The elevation of the bottom of the float was
accuratel> ~determined ~by stretching wirus~across the chute at such an
elevt, tion that the match box.coul'd ~float under the wire close ..to but
not touching it..iThe correct elevation of .the bcttom.of the float
was ~Iven with sufficio.ut accuracy by the elevation of the wires above
the bottom and the height of match box. Check calculations for the
elevation of the bottom of the float .on the basis of ~the specific grav-
it-j of-the v~ter-air mixturc~a~d Archimedes principle gave a good
agreement with the direct observations.

P~y
Q
Q~
R
t
t w
t"
tm
tr
V
V
Vo
vm
Nomenclature
a - angle of inclination of the chute.
A = area of -~ . the cross section.
~/~ = specific weight of ~ater
a~TL = apparent specific r~ight of the ~ater-air mixture.
hw = h -velocity head at a point in ~ater.
hWL " v e l o c i t y head a t a p o i n t i n t h e m i x t u r e o f ~ t e r a n d a i r .
II = average of ~, over the entire crosssection.
~:~ = ratio of tl~ volume of water to the volume of the v~ter-~ir
mixture at a point.
PL = ratio o f the volume o f air to the volume o f the water-air
mixture .at a point.
= average pf p,~ over the entire cross section.
= ~,~ " discharge of water only.
" disclmrge offerer and air combined.
= hydraulic radius
[] depth of flow normal t o the bottom of the canal.
= distance of the bottom of the float above the ibottom of the chute.
= depth measured at the edge of the Rutz chutes
= average depth of flew~at a cross section.
- average depth of unaerated flew = PWtm.
= velocity at a point.
=average velocity~over the entire cross section.
- average %urfaee velocity.as measured by the £1oat.
= average velocity computed from the surface velocity.
8

i'i.
2
:,1-
L'~ i~z: ,'~'! ~
ii " ...... ee0 o e o o
~P |
e o e e o o e o o
• . |
!1:
e e ~ o . ~ o , e e
d Q).
ffh
e ~ e e ~
4.)
• ~ 1 "
0 | !
¢
' 0 %.
m o e . e e B e e e
g
I ~ 0 ~.-4 IX) L~ eO L~.
,
dd~ C;dGIGGctd I
o o $ ~ 0, , ' , , i , - , ,~ ~ ~
. . • • I ' , e . e • i ~ e - e , o .~
o e , e l e e e e . ~ e : ~ o ! e e ~ e ~ o ,
,..-t C~ O',ICW-.~r~;c3 ~ h . " - ur.,. ~.~ I D ~ O ~ ~ ~ ~ 3 u'~
• o o ~ l o g , ~ i o o B , d
. . . . " " "1 . . . . . . . . ! . . . . . . . 0 0 ~ " - " ~ - I 1 ¢ " ) 0 0 : ' ~ 0 o, o-, o . o , ~ . ~., ,- , , , , ~ ' ~ ~ " l
0 O " O O
A
0 ',~ '.~'xO
0 0 0 ~
0 ' 0 - e o , o e e l
~ .'2.
d d d d
ea~ i~e e e e o o e o e o e o e • "
.t'~" 0 t '~ ~ ' ~'~1' ~". 0 %0
. 0 • • . a 41 0 : , 0 . 0
0 0 O C 0 0 0 0 • 4) oat e e o e ,be e o • e l ) - e e ~ e
xO, ¢W O~ 0 ',,0: O~ [-- 0 • ~ O , O • ' e • • •
• ..4 ,-.t ~"1 ~"1 ,-'4 ~1 ,..-I ~,..4
e ~ l - . e e e q l o o , o e | e ~ o e , ~ e e 4
, ~ o ~ ~ ~ ~"~ ~ ' ~ - 0 ~ l e r~ ~ ~'- 0 ,,~
• • . • . O | . O ~ • • •
0 0 ~ , - - I 1 0 . 0 , . I ,-41
' 1
, ~ , ~ , ~ - .
• • . e
0 0 0
e o e ~ , 6 0
' ~ L eldl , , q~o " oae elm me oqp
.o." ~ ~ • ' ~ " • • .0 ! 0 , 0 0 0 • e o • ~ o - o o o o , e a ~ •
. . . .
e e ,
0 0 0 0
~r~ ~O ~0 0 ",¢ 0 ~ 0
o"~ ,,,0
d d . i ~ oaJ o e g o j a r e o
O ' ~ U ~ " ' o o B N o o t~.g
~ : o . ' . o . ' ~ .
o e - e e , l i e , o o •
.r ~1' ~0 . O ~ o ~ ~', i o ~ o ~1~ 8 0 :::1 : e l • " O O ~ " 0 ' " O . O ~J~lo " 0 ,~O • ~'@
0 0 0 O O . O 0 ~ . . . ~ I O 0 O 0
o e o e 4 o - c o | o o e o • o o . o e | e o , o o ~ e e . e o e e
O ,-~ , ~ 4 l O O , H ~ t
~ . 0
'.;"~ 0 c~ . ¢ ~ 1 0
.c-e ~ o 1 0 , 0 8
¸ % 0 0
0 , I P '
~ 0 O
0
I I .~,
~ 0
0
I I
O ~
d II
v
"O
m
O
k,.
_~5, :

i!~i:~:~!~ ,,
D e t e r n i n a t i o n of. the A..v.era~
" V e l o c i , a t a Cross Seot!on and t h e Avera e Aera%ion.
As a l r e a d y mentioned in t he foreword, the de t e rmina t ion of the
velocities at any poin t in the cross section meets with fundamental
difficulties as a result of the aeration. Two independent variables
enter at the same time (velocity and aeration). The oaiibration curve
of the instrument is known. The average normal velocity curve (average
velocity over the whole width of the chute at various depths normal to
the bottom) was determined in the following manner8 Since, with the ex-
ception o f test series V, the aeration did not reach all the way to
bottom, it was possible to establish the average normal velocity curve
by direct Pitot tube measurements at least in the unaerated portion of
the flow. The lower part of the curve was obtained by this means. The
mavera~e surface velocityn, Vo , found photo~raphically, gave another
point on the curve at the elevation of the bottom of the float. The de-
sired c,Arve for v and t can be tolerably drawn through the branch rising
from the bottom and through this single point. Only the top portion of
the curve is doubtful. T~is i~ of no great importance in the further
computations, since the amount of water in the ~p layers amounts to o n l y
a small percent. Finally~ a comparison of the discharge computed from
this normal velocity curve and the actual discharge, as will be shown
later, shows a good agreement.
The average velocity at a arose section cannot be set equal t o
the arithmetic mean of the individual values of the velooi~, because
there are different degrees o f a~ratlon at different depths. Before
goin~ into the calculation of this average velocity, a mathematical ex-~
pression for the term "aeration" must be derived. This seems to,be
necessa ry because the product of the c r o s s - s e c t i o n a l a rea and t h e ave r -
age velocity does not ~ive the actual dlsc.har~e when aeration is present. The expression consists o f the inequali~ys
AV> Q w
i0
~i/r•~ ? ••~• • Z • • ~:~ • • • • :• !i ~

.O
~To produce an equal : i ty , a r e d u c t i o n f a c t o r , :1~, the~peroen t of wa te r ,
.by volL~ne, in the total water-~Ir:mixture, must be introduced. Thls gives the equation:
':Or PW ,= - ~ .v . (1)"
?~ere it possible to measure directly,the~discB~rge actually flowing
through anisolated horizontal.strip,-:the v~lues of the aeration in the
different 18yers couldbe .determined directly. ";Let .:A..Qwrepresen t the
discharge .passingt~ough.a horizontal .strip ~Iose area ris ~ A, and let .W!
u denote the ratio:
then
- - m : U
A .A ((2
i t f o l l o w s from equation (i) that
._I A ~ _I
= ' ~ = ~ C3') P w ~ • ' v v
_I
in which v represents the actual velocity taken f~om the average
normal v e l o c i t y curve a t the g iven s t r i P : a r e a " A A.
F o r the purpose-of :ca: l ibrat ' ing the l a y e r s , a shee t -meta l ~conduit
of rectangular cross section vms fabricated to accurately :fit the inside
of the experimental chute (figur e :6). The upstream end of this conduit
was placedat the lower end of and at various heights above ~the :bottom
of the chute so that the flow. as ~it were, was ~cut into two :parts, one
of which flowed through the cond,~t, the other underneath it. The
latter discharge was caught by a wooden :calibration .tank ~of a .oapacIty
.of :about six.eublo meters.. Thus, :it was possible to de, ermine .the values
of A A .and A Qw,of .equation 2 . ~ rThis method should Eive e.esential,ly cor-
rect 'values in-tests w~th :smal~l iohannel Slopes, for experimental .dlffi-
~culties, due to hi~l~ .me!Iocities, .did not enter,. High ,~e~ocities introduce
ii

%
,i~ ~, . .
errors that are not permissible. It w~s firs~ assumed that using :sheet
metal as thin as possible, wouldnot dis~urb the :flew very much. !Iow~
ever, the stiffness of the sheet•metal was not sufficient to prevent
excessive vibrations of the bottom of the conduit. A further difficulty
lay in' accurately determining the quantity of water flowing into the
calibration tank ~in a ~iven~tim~..Were it possible to create ~a ,quiet
horizontal wuter surface in the calibration tank with high velocities
of flew, a further •difficulty would still be ~encountered as a result
of the •large •quantities of water partly aerated dischargin G into the
tank,. Much air would then be in the tank, resulting in water depths
that are too 'large. Consldering,these difficulties the depth in the
tank had to be measured cautiously. This m~thod was only used ~for
checking the tests on the flatter slopes.
In comparison with this method, the use of a Pitot tube ~(without
an ejector) possessed greater possibilities for determining the actual
value of the average aeration. The up.ream leg of the Pitet tube had
• an•opening . of~about two millimeters and could be moved up and down and
crosswise of the chute. To reduce the :incipient, :large pulsations, the
glass riser tubes ;had a relatively i:lar~e diameter (50 millimeters).
Since, as is w~ll known, when a static leg (~irected downstream)~is also
taken into account, the velocity head, h = ~-~ 0 is given:by the differ-
once between the kinetic ~le~ reading and the static leg reading. In
spite of the large damping effect, pulsations persisted. Thereforew:
average readings w~re taken after observin G the fluotuatln~ water
columns for several minutes. Consequently, a complete .Pitet tube trav-
erse .required four or five hours.
Before computing the aeration (expressed by Pw) from the velocity
head, several remarks are in order,. The weight per second of the dis-
charge, A Qw, flowing through a small strip of area, A A can be expressed
in two ways:
JJ'

!i ̧ ::
-e
,Q
71. ;By the ;discharge and the :specific weight, Cthusl G - . A , % % - ~ A v . ~ .
;2, ,'By the ,voltmle .0£ .the w~ter-air -mixture :flowing ,per ;:second and the apparent .specific weight, a~L , thusl
G - A QWL ~'tL = 'AA . v ~ N L "
hence Pw'= - - - ~
• &Cter those ~kor t , p r e l i m i n a r y :remarks the :correct procedure f o r
computin Z the .aeration from the .velocity head should be investigated. The velocity head of the water-air mixture cannot be used for determining
the apparent specific gravity, 'ClVL , directly. "This veloclty head ~is
hi~iL= ~-. 2e> (5)
If the rising .legs of the Pitot tube do not contain a fluid of •specific
gravity, aWL , :but, on the contrary, umaerated water of:sPecific gravity
sly, as is actually,the case, since the air bubbles .escape from the ri.sing
legs in a short time, the foll~ing >relation obtainsi
or ~. ~.~
el' 1~om :equation (2)
•Equating
w
P.
(5 ) and . . (6) , we have
;,Pw ..~ and, finally,
= 2tthl
C61.)
(7~)
• ~ ' i ~ d
! .i
7!
:,1.3

~i~! ~ ~
i '
,i °
Five complete ~Pitot tube traverses were made for each experiment
for flndin~ the average value of the aeration, Pw, over the whole cross
section. Pw denotes this average value. ?icuros 7 and 8 SlL~ the com-
puted values for test series II, with Q-20 liters per second (0.706
second-foot). The.nLeasurements were made at five verticals, and a total
of 40 points v~s ~cvered. The two ~raphs tc ~he left in fisure 7 show
sample normal velocity-head curves, while figure 8 shows sample hori-
zontal velocity-hc~d curves. The avora~,es of all the readin~s~ includ-
ing those not shovnu in the figures for the sake of Clearness, are given
• be the right in fi2ure ~ and thus represent an averase normal velocity-
head curve. With the aid of these cur,yes and the normal velocity curves,
earlier described, the aeration index for a ~iven horizontal layer can
be computed. From equation (7) we have
Fi~,ure ~9 shows curves for both I~W and v. However, it should be noted
that the lower part of the v-curve, in the reo~ion where no aeration
exists as was seen tltrou~h the ~lass windows, ~s fo,And from the follow-
ing equation, which is valid for ordinary ~o~ditionsl
By averaging the pw-eurve, the final averas.e aeration factor, Pw,
for the entire cross section is obtained. The Pw-curves for all tests
have practically the sam~ sl~pe. Aeration ~begins at the surface where
the percentaj~e oC air, PL " (I - Pw) = 100%, and percentage of water,
= 0%.
As the depth increases, the percentace of air decreases rapidly
at first and then cradually ~lecreases to 0 percent at the elevation ,of
the bounda~j layer (see figure2 ). This depth corresponds ~approximately
to the inflexion point of'the corresponding vertical velocity-head ,our~e.
Evidently~ this limit is not sharply defined. Although the llmit,l~v = I~
14
L
i

/
/i, ¸• :~
/
:::
occurred above the :bottom in test series I to I!l, :it v~s Just at the b
bottom in series IV, ~d in ser:ies V the aeration at the bottom v ~ s
Pw = 0.83. ~%veraging the v-curve doeG not give the proper av~raL~e veloc-
ity., • V, for the whole cross ~ection .because of the .various degrees of
aeration at different levels in the flOWo E~ch indi.vi~ua~ veloclty
must be weigl~ted according "to the aeration, Pw~ st the correspondlhg
depth. The mean velec:ity for ~the entire cross :section was computedby
considering narrow horizontal strips three millimeters high. Average
values of v' and p~for each strip were taken from the proper v and Pw curves. The desired V is then computed from
~; ! V ! v ,, ::(.9.)
This computation procedure can be checked by the discharge. :If ~ Q i~s
the discharge through a narrow horizontal strip whose area :is A A, then
AQ=AAv!~.
and the total diso}~rge is
Q .,, z
The discharge computed from this equation a~reos v~l'l with the dis-
charge measured by a weir. in order to .effect a complete agreement in
the disclmrgss, Pw was :computed directly from
AV
and not from the .average of the Pw-values as described heretofore. V
.is the velocity computed according to equation .(9). These Values of
V are shown in table 1 and they do not deviate appreciably from the
previously computed average values of v.
The check me, hod Just described offers the principal means-of
settin G up the correct average vertical velocity curve for test series
V, im which considerable aeration is present ,at the •bottom of the chute.
The bottom velocities v~re therefore determlned bY extrapolating ,aux-
iliazy ,curves f o r v s and :S (for equal discharges),. • ~[~
15

I;
• i k¸"
There is another method for oomputin~ pwwithout including ~he
surface velocity measurements. It is based on the discharge measure-
ments and the average velocity }mad, !~, over theentire cross sec-
tion, obtained by finding the moan of the hw-eurves such as the one
shown to the ri~ of figure 7. Correspondingly, equation 7, w~ich is
valid for any single poLnta can be made to :apply, with close approxi-
mation, to the whole cross section by introducing average values of
the variables over the whole cross section. Thus
V
~om equation (I).
APw
Introducing t:-is equation into (7), .we ~hnve.,
2 2 ( 12 )
The v~luos in column i0 of table I, computed from this .equations in
~en6ral, are Somewlmt smaller than the previous ~p~ obtained by using +
v o. This may be explained, as will ibe shown at the conclusion of this
investigation~ bj. the fact that due to neL, lecting the air resistance of
the float in measurino~ the surface velocity, average velocities values
,were obtained that are too low.
.D
16
~ ~ i,/~ ~

Summary and Compar,.ison of the
Experimental Re su~t s t
In order to eliminate the ~unavoidable errors ~of observation and
to obtain a general idea of the accuracy involved, the following graphs
were prepared. On account 'oi" the limitations of space, o~ly the most
important are reproduced herewith. Figure I0 shows the relation ~between
Vo and Q for the various slopes; figure II shows the ;relations betwmen
t m and tan a for various discharges, Q. In ~both cases a group of curves
are drawn arbitrarily through the plotted ~points. In figure 12 curves
are plotted for :comparing t m and :the computed values of v o. For find-
ing the average depth, t m was plotted a~ainst tan ra rather than ~against
Q, for, primarily on account of the phenomenon of aeration, no coherent
relation was found in the latter ease. Figure 13 is applicable for
finding the elevation, t', of the bo~tem of the float above the :floor
of the chute. Finally, in figure 14 the average velocity, V, for the
entire cross section and the average aeration, Pw, for the whole cruces
section are plotted against the average depth, t m, over the whole cross
section. Table I is a s~-~mary ..of the results.
Analysis of the Results
Thus far, for the sake of simplicity and the fact that e rectan-
gular chute was ~empioyed, the average depth, to, for the entire cross
section has been used rather than the usual hydraulic radius, :R. }h~r-
ever, in order to Generalize the test :results, tmwaS replaced by R, in
the logarithmic ~raphs in figure 15. Five parallel, ~straisht , dashed
lines corresponding to different slopes pass through the plotted :points°
For comparison, the computed values from Rehbook,slrevised and complete
• . _ - .
1Rehbook, Betraahtung ~ber Abfluss, S t a u - und Walzenbildung
bei flelssenden Gew~ssern. (Observations on Discharge, Backwater and
Roller Formation in :Flowing Streams)- Julius Sprlnc~er, Berlin, 1917, p.46.

/ i • . .
form of the Ganguillet-Kuttor formula ;(n = O.010)are given in .the same
figure (dashed lines without points). Prom :the flatter :slope oT these
latter lines as compared with the first set of lines, the -mount' ~f
energy dissipation due to self-aeration is to be seen.
It ~is ,worth mentionin G t~-t the Tntersoct~cns iof the two sets of
dashed lines :fall~0etween approximately 3.00 and 3.!50 meters !.per secomd
(9.8 and ii.5 feet per second). In ~oonsequonce of the smallness of the
.angles of intersection, the position of the intersection pc.Lnts, as
read, :are subject to erroz. The choice of Kutter's n also has a mod-
erate influence on the position of these inters(~ctions. As has already
beenmentloned, if the difficulty of the defining ~"wat.er surface, is
considered, it secms possible that the intersections should lie some-
what lower, namel~, at approximately 2.0 meters per second '(5.1 feet
per second). In spite of this, this graph does show that self-aeration
• begins at a definite velocity,. This veloei~: .may be considered to be
from 2 to 3 meters per second (6.6 to 9,8 feet ~per ~second~) for smooth,
wooden flumes; that is, the ~ulid range of the ~exi~ting velocity formulas
v~ry probably extends only up to this limit. At-some greater velocl, ty
the braking effect of aeration comes into ,play.
i
_Some Supp!ementm~-y Remarks
.on-the Phenomenon of Aeration
The underl~,in~ purpose of the preceding investigation was not ~to
study the causes of aeration, ye t •there are •some interesting facts v~ioh
may contzibute to clarifying its behavior, if ~lass plates areattached
to the end of the wooden:chute so as~o £erman exteneion~ef the two side
~lls, aeration:of the under side of the Jet will be produced, since the
Jet on leavi~ g the bottom of the chute comes in,contact with the:alr. In
order to studythe conditions on the bottom:and at the end Of the chute
18
j - .

•m
Lr
better, pieces were cut out :of the :side walls, extending all the vmy ire
the bottom, and replaced by glass plates. Aeration was produced wi~h
a bottom velocity of 3.00 meters iper second (9,8 feet per second). This
test corresponded to test series I vrlth Q. /~51iters per second (1,57
second-feet). A 'slmi~lar condition should be ~observed In a water jet
discharging from a pipe ~line under pressure. ~.'or this purpose a short,
wooden pipe of square ~seetion (ir.ner dimensions i x I o n.~ was fabri-
~cated,and connected to a pipe line under pressure. The two side walls
of the wooden pipe were ~not carried all the way to the end but, as in
the previous case of the chute, were supplemented ~by 51ass plates which
projected out for some distance iron the end of the pipe. ~°ith this
arrangement it was possible to observe the sides of the flow before and
after it emerged from bhe end of the pipe proper. A~ain characteristic
aeration ~vas observed at the top and bottom ~of the jet with an unaerated
portion bet~veen. If the jet is ,discharged under a lo~er pressure, it
retains its shape, there being no disintegration of the Upper and lo~r
surfaces into individual water drops ~(beL:inning of aeration). As the
velocity ~s gradually increased, the two s~rfaoes first exhibited con-
siderable roughnes s and then decomposed into individual drops of water,
and finally, as the velocity vms [increased still more, a typio~l state
of aeration ~ms produced. By careful observation, that velocZty was
sought at which the first separation of drops of water (beglnnin~ of
aeration) occurred. ~ithouorh the beginning of this condition ~was not
sharply indicated, this velooitylmay be said to be approximately three
meters per second i(9..8 feet per second) which is somewhat smaller ~than
the ~limitin g value determined previously from figure 15. V,%ether the
cause of this difference is %0 be attributed to the fscZ that in a steep
chute the air directly ever the-ater surface is already in motion, while
In the case of the pipe, the jet, ~after discharging from the end of %he
pipe comes iinto contact with quiet air; or is to be attributed ~o the
uncertainty, 5in determining the "water surface • (in steep chutes); ._or
19

~ .
whether other conditions play a part, cannot be answered hera. Finally,
let us turn back for a moment. Aeration, as determined from the ear-
lier investigation, began in every case a% 100 percent !(Pw a O) a~ the
water surface and at a definite depth fell to 0 percent (Pw " I). ?/ith
the aid of p- and v-curves plotted from the results of single measure-
ments, it was attempted to find that velocity up tc which aeration in-
creased or at which air Bubbles were still be±ng absorbed. From figure
9 it is seen that the aeration increases, for example, down to a depth
of 7ram. (0.023 feet). This depth corresponds ~o a velocity of 3.80
meters per second (12.15 feet per second!). If all other such oases are
investigated, values are Obtained which vary between the relatively
narrow limits of ;3.5 meters per second (~1.5 feet per second); and £.5
meters pe r second (14.8 feet per second).; the mosul lies around 4.00
meters per second (13.1 feet per second).
~erifioation and Genera)~,tion | i | •
~,of ~,the Resu~lts ~Found f,or ~he ~iiodel
Chute on .the ~Basis .of ~easurement
o f a n A c t u a l Chute a t the Ruts Wor~-
As a l r eady mentioned a t the beg inn ing , the chute i n s e r i e s V
of the exper iments had the same s l o p e as t h e wasteway a~ the Rutz Works.
Since the completion of this otructure, so,feral measurements l~ve been
made of the surface velocity by!
i. R~melin and Angerer, three measurements in 1913.
2. der Versuchsanetalt f~r Waseerbau (.Vienna !lydraullc
Laboratory) bY order .of t;he Bureau for .the Eleetri-
£1oation of the Austrian State Railways, four
measurements in 1923.
3. der Wasserkraftwerks . A.G (Water Power Plant ComPany,
WAG), five measurements in 192~.
The discharge for the first case was determined from a calibrated
weir; in the last two cases from the inflow and outflow of a reservoir,
20

The storage ~o t ion o f the ~eservo~r ,and in take tumnel s,v~.s not T~ken
i n to cons ide ra t i on . ~.For ~he :determi~at,~on o f ',~he d ischarge ~ .om ~he
,re s e r ~ o ' i r i n t h e sec end ~oa~e, two .oo~ple~e c u r r e n t m e t e r m e a s u r e m e n t s
made in the tailrace of ~:the turbine dra'f~ :tubes ser~e~, and in the third
case, the disoharse ~iasram of ~he ~urbines ,~s used. None too ~,re~t
~an accuracy could be expected in ~ho discharge thus measured. A ~ some-
wh~t greater accuracy ~s a~tainea in the surface velocity measurements.
The depth measurements were made at only one side ,of the Chute in the
second and third oases, ~;hile in the first they ..were made at both s~ides.
P.Smelin ~found that ithe vmter surface in a transverse profile v~s r_ot
horizontal, but w~s dish-shaped, and ,ft~rthcrmore,. the depths measured
at the two banks of the trapezoidal seetlon show~d a difference up ~o
i0 centimeters (0.~28 feet)at a discharze of ~.4 Oubi0 metezs l~er se-
cond (120 second-feet). Likewise. in spite of the s~numetrical arrange °
ment, similar conditions were observed in the z,:odel tests. '.Vith tbiis
circumstance in mind, as well a~ a later one ccncern~ug the average
aeration, it appears that v~itb the exception of the ~data furnished by
R~mel~n, the depth of flow, in general, appears to be too large. It
seems permissible, therefore, to reduce the measured depths, t", to
correspond. Several considerations lead to the following relation for
findin~ the adjusted depth of flow~
t "= 0-8 t "
The difference tn-t amounts to .5-5 cent,.no,era (0,18 feet) for the
maximum case. This value can be a~coepted ~n view of the difficulty in
determinin~ the w~ter surface. The complete resuIts o~" these measure-
meats are given in ta~.~le Ill.
In order to discuss the average cross-sectional velocity in terms
of the float velocity, it is necessary t o find a relation between V .and
v o. E~idently, ihere we are dea~lin~ with ~uesses. R~melin s view is
that there is a considerable difference bet~en these velocities; other~s
think them to be about equal. The model tests of the Rutz wasteway to
21
i ̧ . ~ , )- ~ ' . ~ r . • ~C.,"

i?~;~.~'~ -~. k . " . '
a scale of~ls:lO shov;a probable r a t i o o f - ~ = 0.9. Therefore, th ' is
wasused in a~ll further calculations.
Since the resL~lts of the measurements in table I I~are eTidently
st~ject to ine~itaNle errors o~obsermation, the oorrespo~ding values
of t and V, and V and Q are plotted in figure 18 and :smooth curves
~drawn through ~hepolnts. For practioal :oonsiderations, a curve:~for
R and ,Vwas substituted for a ouzve for t~amd ~. The adJusted~mli~ues
of V and Q for various va~ues of ~ intable III are taken from figure
18. iThe computed,values:of the average aeration, expressed by
AV
are given in the~lasti!ine. If theadJusted values of R:and Vim
table IIIare plotted on loGarithmic ~paper, as in ~igure 15, a straight
line may be dravmtltrough the points obtained. This line fits the
~points ~vell and from it .the effect Of aerat:ion is readilyd~saernible.
Its slope deviates somewhat from the slope of the lines found from the
model tests and this may beattributed ~o neglecting the air resistanoe
of the iLLminous float. The:maximum,deviation oeourswith Q =44.5
liters per second (1.57 second-feet,. If :the deviation of the ~eloclty,
d V, Is~ta~enas a measure of ~the air resistance, then, s~noe ~he air
resistance is proportional to the square of relative velocity betV~en
the;Sloat and the surrounding~air, we have
V -~K V 2
If ~ths ~ine found ~fzom ~he model tests ~(fi~ure~i~ is prolonged UP-
~mrd and the velocity d~fferenees computed :from this line and the line
for the Rutz measurements, a ,relation between A V~andV is obtained.
Y.~hen plotted logarithmioa!,ly, a ~straight line ~ariation is clearly
given. Thetangent of the~angle between this line and the horizontal
axis is ~.6, so :that ~the ~equation of the line becomes~
K v 1-6
Thus it is seon~ that the ve1~city di£ferenoe oaused bY the air
,k! X
i "l
22

- 0
!::-: ~ O
ffl
.~-.0
IE
&
..~
.CM
' 0
'1 |
0
C • e o •
041 ,.llq
.el . I
e o o o i i l l 414
o o , e e
-r c
,.~
.1~
o e , g o , , o
'I
.E
.,,~
C 'C
C C
.~'~ ~ d "
.1~
,:d S . ~ e o o ,o,q
o o o l g o ~ql
.11 : ~
~ 119 oQ I1 |
,--4 B . ,,~1
. I
o e o l . ~ ~ , e l
l a l e l o o e q l
i o .. o e o e ,qNJ ~ ~,eND
..
~ l . o o o e , o o Oo , OO
o iN
: ®
~0
|1 '
' 0
C ~
• . L r
~ o e . o e l l ,o ,
• .~, , t%"
'C( , ~ I , ~ " (
,("w 'u~"
" 4
o o o~ g o -,oe
• C r(Y'
4 ( .v ' ,
e o 04 9 e o 4
I
I q ~ . ~
~ "d
.~t ' m
" ~ .~'~
141 e4l l i e e o
¢
" 4 ' : :
• . e . ~
.IM I i
!
~3
L(I.
o e , @
o 4 e q
~4
o o o i l
e o e 4
e l l , ~ J
.41
o o , o l
e o eel
,-4 . e
o o i ~
o o , OQ
. 4
0
e ~ q ~
4.3
-0
,rl e o t
• e o o~
~d . q
.q
' l f"
,d
o e e q
I
e , O
~ a o
0
14 •
.41
: f , J
IW . W
o
F.0 (D
cll
4
J ,t:~)
. 0
f
e
!

~L
E-o
c~
r~
. . . : -
I
~lff"
Q Qo Q4
4
a
C
' o l ~o
C LI" .eQ ~
L'-
e.o o,
.t
q
~ ela
In
. o
O
~ o o •
G
bo o Q ~
,Q t tb
.O
4 o o ~
e 0 i
. ~ ! ,,
m e o . e l
ltc O
I>1

'resistance !is~approx~ately proportional to the square of the ~average
cress, sectional •velocity. The unLuportant de-~iation in :the exponents
may :be ,explained by the circumstance tl,at the air directly ~over ~hs
water surface is ,net ;at rest but is actually movin~ in the direction
of the water. ~Thus there is "r. complete Justification for maMing~a
small correction .in :the curve for R and V obtained by model experiments
(dashed llnes in :fiKure 15). By doing this, the 'computed va'lue8 of P w
in colunu~ 7of table i show a small decrease, so ti~t .an excellent
agreement is obtained with the values of Pw in column I0, which are
Computed l'rom the average velocity head. The agreement with these
latter values of Pw which are indePendent of the fl~at measurements
and their 'attendant errors, is:a ,further reason for Justifying ~this
correction. The :corrected curves for R and Pw.are .shown on the right-
hand side of fig~-e 15. From these lines, it ,is-seen that the percent-
age of water in'the total water-air ~low decreases slowly.with:an in-
creasing hydraulic radius. The ~.~ore or less complete .scattering of :the
~points relatin~ to *.i:e I~utz waste~my,may be attributed to the :probable
irmccuracies in the disc]mrge measurements. The corrected curves for
V and Q (dashed lines)for the Rutz wasteway, using the ne~ :relations
for R and ~,', and R and Pw, are plotted~by way of comparison in .figure 18. "
, . . ~ . . . '
The ,Two ~.~'~ For~ul=s The two final relations,
V = f, (~, sin a) arc. pw ,, f2 (,:~, sin'a),
which we have been searching fo~, are obtained directly-from the log&~
rithmie graph in figure :1.5. Although the first :fu~ction may be repre-
sented by a single :equation, the second requires two parts, acoording
~to whether sin a is smaller or greater Khan 0.476 (28.5°). :This :limit
seems to correspond !to tl~t .slope at which ithe aeration extends ~all ;the
way to the bottom of the chute. This view is corroborated by directly
27

ebseT,'ving the flew through the glass W i n d o w in test series I,V i(sin a ~'-
0.444)~ in which %his aeration condition was approximately~reproduced,
while ;for test seriesI t o ~III it.~s not the case.
The new formulas (in English units) are,
V = 9 7 R 0~52 sin a 0 ' ' 4
s i n a O' l
The percentage of water ~in the total wnter-airmixture Is ex- ~pressed~by thefollowing two,equatlons! "
-'0.26 Pw "/~ 2R'0'05 sin a forsin a < 0.476
;Pw ~= .30 2"O'05.-sin a "~3"7/~ for ,sin a > 0.476
These equations are valid for artificial.chutes of dressed.wood
and approximately rectangular cross section. They are represented
logarithmically in flgure.19 ;for practical use. They are valid up toe
R- 0.30 m. :(0.98 feet) and sin a - 06707 (a -45o).
It is seen from this graph that within the given valid range an
upper, limiting value for thevelocity, independent of the hydraulic
radius and the :slope, is not yet reached. The ~uestlon, whether the
curve of R and .V with greater R-values a0quires.a :steeper slope and
finally ends vertically, cannot be answered on the:basis :of ithe ex-
perlments made heretofore. It should also ibe mentioned that the com-
puted-velocities for a free overfall ~into'an air-filled space cannot
• b e applied, to our study.wlthout further:ana!y.sls ' since for steep
chutes in the limiting case ~nhen,sin a -1 !(vertical chute), the air
enters at only one side, the.other :throe :sides bein~ protected from
the surrounding air bywalls. As t o ~.the:development,of the aeration,
it is to be emphasized that with e~ual wall ~roughnesa, ~the slope Is the
most important factor, and t h e hydraulic radius and hence the depth are only minor factors.
,26
f

• . ~i. L.., ̧.~•..!.,i~, ' •~ '•' • . . . . •i' ~ ~ '
~.~
h
Finally, attention should be calledtoacircumstancewhich may
be adapted to olarifylng the problem of self-aeration fromanother
point,of vi~v. If the simultaneous ~lues of~tm and V are taken from
theresults era single experiment and plotted on Iogarit.hmic paper,
the graph on the /eft-hand sideof figure 20 is obtained. The
frictional effect o f aeration is clearly s~own in that at the larger
slopes, other conditions remaining constant, the depth suddenly in-
creases with increasing slope. If the average depth~at a cross sec-
tion is m~itiplied by the aeration ratio, Fwo r
t r ~ I~ t
and the,simultaneous values of t r and V are plotted in a slmilar fash-
ion (right-~,~nd side of figure 20), the disturbing aetlon of aeration
is a~ain brought out. It should be remembered that the valuesofV
and P w are taken from the corrected lines of figure 15 and that~the
chute is rectangular in cross seCtlon.
C_onclusions
The foregoing investigation w~sundertaken to olarlfy the prin .
ciples offlovr insteep chutes, and the phenomenon of aeration. The
degree of •self-aeration is denoted by thelpercen t of water, pw, i n
the total water-air mixture. The relation:
Q = A V P w
serves to express the measurements undertaken in a chute, V iis the
average velocity at a cress section, and Pw ~is the averageaeratlon in
the two principal equations I and II o r t h e graphical representation in
figure 19. These equations are valid for artificial •chutes of dressed
wood, with approximately reactangula r cross section. Although no state-
ment of their absolute accuracy can be given, in view of the difficulties
of establishing a single arg~nent for such, they should serve a useful
purpose to the practicing ensineer in designing,new-structures. In the
27 • •r i

interest of the ooiltinuous de,Telopment of the ~k~nowlcdge coaoerning flow
in steep ohucea, let the desire be expressed that the results oi" ve-
locity and discharge measur~nts at all such exi~tln~ structures be
given the widest distribution possible.

I,,̧ ¸̧
lib ~ .,..,.,.~n. .......... ,I~"{~':'.o ~°°~ ~-l-T~- l I t-f~ 7
:1 FIGURE 2"SCHEMATIC CROSS 8ECTON O~THE ~; " ~ - • ,
" ~ • 6 8 0 1 2 -
~ ., THE"OHUTE
t.. 0,04 ~ ! "
I o.o,
o ~ . ~ . o ~o VrLO~'IIY H~'&O,h~t'IN l[l~1 i ~
FIGURE 7 "NORMAL VELOGIT'r -HEAD CURVES
..~- ~_- ..., ~.~.~.--~ .... -,.~ 0.09 . . . . . . . . . . . . . . . . . . . . . . . .,,..
°°°1 t . . . . FIGURE B" HORIZONTAL-VELOCITY
- o.o,; HEAl] (~URV[S
o ~ - - "~ - "~ " : -~ ' - " : " "v'." 0,0,, . ..................... • j... :
o" CC,~,T~,a- .-:-~_.~.#.-'-- , j ~ '~ I ' , . . , > " l i I
~E,,o- , . . . . o - - E s ~, i ! ;
_,o~//;~t_.~ I~ '~ ........ • . . ~ - - ~ l ! k - ' - . . . . . ~ . IL . . cs , . "
- - ,., . . . . . ,e t . . . . ~ lU~
2 _ _ _] ~ / I ~ I ; '~
t~n(:[;~N pERCE~'r ~0 ,,m- ~O I~ 8[COl~9-Fi[i[r 2.0
FIGURE I I - CURVr. S FOR FIN{) NG THE AVPRAGE FI@URE IO'~'CURVES,.FOR FINO|NG CROSS-SECT$OH,(~L DEPTH THE Av|rRAGE~.S.URFACE.VELOgiTy
~, -. ~ - N¥O-Z9
~.~ . " - .
~ - . - ~ - - - - : _ ~ _ _ , _ . _ ~ L - '

:J
r r
I~l~ QeI~;' Illt~., r . . '
~ ~ ' ~ . . . . Z . O.;~06.- ' ' v . . . . . .
V o IN FE[T PER
~.~l-I'k I-I- 2O 25
SL~ONO
' F I G U R E 1 2 - R E L A T I O N " BETWEEN fm A N D V o
,~ .~.~.~ .~.~,~,~.~
d • 1.67 ~;EG.'FT. *'~ I I - 0.1! ) = I - t ~
F::,-;:I:: . . . . . . . . . . . . . . . . /
.-,-,, .o,,:~:~i : J ~ " ~ : ,, .......... .?:I-.M' 7/:IE~-i:
°"'"""~'1~.~ . ........... ......... " '"- "- ]~-i- .... ~ I ~ - - 0,4 0.50~ ~ 7 0 8 ~ 0 4 I I~ IG 210 ?4
P~ V IN F [ (T PF.R ~;[CON~
F I G U R E I 4 - . R ( L A T I O N S B E T W E E N I T H tr A V E R A G E CROSS-SECTIONAL V E L O C I T Y ' A N D DEPTH AND THE
",AVe.RAG F" C R O S S - S E C T I O N A L : A E R A T I O N ANO DEPTH
0.9
O.', *-* . . . . . . * - . -~ / 0,4 )-* . . . . . . ~---
~,, L I - I ,-!/
V IN F(L'T PER 6(COND Pm
F I G U R E 1 9 - L O G A R I T H M I C , R E P R ( S E N T A T I O N OF THE TWO F O R M U L A S . V . f . ( f l ; S ) A N D P w - f ) ( R , S )
Q* LS7 $rc.* FI[
o* h09 8£C.1~.
Q*~.?06 S(~.. r lr.
~0,365 S(¢, Fr.
O.ZO ~;':~.c:-rrJ ' ° "~1 I I I I I
O.lO
:,. o.,,,I.-,...,,.-,-.,. Qq.S7 SE~-FT.
• 0.04 Q,<~70~I~..~.. irT"
00~
V II~il lrlLrT V I l I flEET .
F I G U R E ~ 0 - ~,OMPARISON OF T H F RELATIONS
BETWEEN ?m AND V. AND f r A N D V I N , W H I C H
t r *, Pw f m
0 1 0 - ~ ' . - L, • _ - : ~ : ~ ~ ~ : _ - " ; . ~ .,
.
0 0.1 F 0.3 0.4 0,~ 0*6 0.7 O.e ton C~
• FIGURE 13*•DETERMINATION OF" THE' ELEVATIOr~ . f : .OF THE FLOAT, BOTTOM
. c ° ~ ? I . - L L ~ , . . . . ~L.-J . . . . . ' . , .
°I-ltl;~-k~o-L////PI-II "c ~ l i i , , 3 @ L . . L , ' ~ • • . _.~ i;noL*0,444 Jo . ,
o, I L i :: o.,l: l. l,. K//kd.2 :12 .... .+. ' l i
'0.,o .I.]: . ' ..I: i : . ~. ~i.~,II "~o~- , / - - " : : " - H ' I I
.:o°:Z_ - -~ : . , - : ? . . . . . . .
o.~i ,#,t-i-.--I-.i?hl .-. :WFt--i-H,d-t I
0,'0~ *0 1~ 20 3 0 - 4 ~ !~O~ :~ lO 03 114 GS ~0 V IN Fr [~ " PIER IS(GONO Pw
~I~:UR ~" 1 5 " I N F L U E N C E OF T t ' I E - H Y D R A U L I G R A D I U S R.ON V . A N O . C ~ I ' p w
O IN ~.J~ND* FLEET 0,8 ZS 50 7~ ~O q~ tSO,..r ~-~
" ca : , .... ; ~'J "I • ~ )
I J ,, * f o
. I t .-'~"~.<LV*!l~; ,- ]_ 0,4 ~ . . ~
• q[ G3 "1" ";-- 6" * ]
o : ~,_
o 4- o ~ , 0 f :
• V iN FI[I[T pER IEC01iD
.~ l ISULf i l A¢CORDCNO TO ~" nUtmil*n
VWi,~JIlO~lt ( V*4n no Hydl'mdi¢ I,,.o b )
~ 8 0
I .170
o
1,o ilo
F I G U R E . I G * RF.,SULTG OF M I ~ U I U R E M E N T 8 O N . T H E RUTZ , W A R T [ W A Y
~I'41,-
H Y D - 1 9
|