i-30 planning & environmental linkages study · 2016-04-05 · i-30 planning &...
TRANSCRIPT

I-30 Planning & Environmental Linkages Study
TEAM Conference
Mike Spayd, PE, PTOE, Garver
Joe Blasi, PE, PTOE, HNTB
March 10, 2016
Presentation
• Connecting Arkansas Program (CAP)
• I-30 Project
• Background
• Project Needs
• Timeline
• PEL Process
• Overview
• Purpose and Need
• Screening process
• Recommended Alternative
• Next Steps

I-30 Planning & Environmental Linkages Study
Connecting
Arkansas
Program

AHTD CAP Overview Size of State Highway Systems

AHTD CAP Overview Highway Revenue per Mile
Arkansas Challenges
12th largest system in the country
44th in highway revenue per mile
Missouri Challenges
7th largest system in the country
40th in highway revenue per mile

• Blue Ribbon Committee
• Move Arkansas Forward Group
• November 2012: 10-year, ½
cent sales tax approved by
constitutional amendment (57%
support)
• 30% of revenue to local
governments
• AHTD - $1.8 billion program
• 35 projects along 19 corridors
AHTD CAP Overview

Program Benefits • Improves transportation
connections to all four corners
of Arkansas
• Increases capacity by widening
highways to four lanes
• Improves traveler safety
• Eases congestion
• Supports job growth and
improves Arkansas’ economy
• Accelerates highway
improvement projects.
AHTD CAP Overview

Central Arkansas
AHTD CAP Overview

I-30 Planning & Environmental Linkages Study
I-30 Project

I-30 Project Background

• Approximately 6.7 miles in length
and extends through portions of
Little Rock and North Little Rock
• 80% Local O-Ds
• System to System Interchanges • I-30/I-530/I-440
• I-30/I-630
• I-30/I-40
• I-40/US 67
• Major components • River bridge replacement
• Interstate widening
• Interchange improvements
• Local Connections
I-30 Project Background

I-30 Project Needs

I-30 Project Needs
111,000*
119,000*
94,000*
144,000*
156,000*
123,000*
*ADT = Average
Daily Traffic Existing (2013) Peak Hour Congestion Future No-Action (2040) Peak Hour Congestion
Traffic Congestion

I-30 Project Needs Safety • For the safety analysis, the latest three years of crash data were
reviewed (2010-2012)
• Crash rates from I-630 to I-40 were over 3 times the average in
Arkansas
• More than 1 crash every day in the corridor over the 3 years
Interstate 30, Section 230, Log Mile 139.67-142.02 (Interstate 630 to Interstate 40)
Year Length
(miles)
Weighted
ADT
#
Crashes
Crash
Rate
AR Avg
Crash
Rate
Type Crash Rate
Ratio
2010 2.35 115,740 471 4.74 1.53 Six-Lane Access
Control 3.10
2011 2.35 113,336 371 3.81 1.22 Six-Lane Access
Control 3.12
2012 2.35 109,817 406 4.31 0.95 Six-Lane Access
Control 4.54

Navigational Safety Issues
I-30 Project Needs

• I-30 Bridge downgraded to
structurally deficient (October 2013
inspection)
• The fact that a bridge is classified
as “structurally deficient” does not
imply that it is unsafe.
• A structurally deficient bridge,
when left open to traffic, typically
requires [additional] maintenance
and repair to remain in service and
eventual rehabilitation or
replacement to address
deficiencies. Source: Federal Highway Administration, Status of the
Nation’s Highways, Bridges and Transit: Conditions and
Performance Report to Congress, 2008
Structural Bridge Deficiencies
I-30 Project Needs
Broken Bearing Pad and Shifting Masonry Plate
Bottom Flange & Web Have Section Loss

I-30 Project Needs
Short Ramp Merges on Bridge
Inadequate Shoulder Width and Congestion on I-30 Bridge
• Shoulders on bridge below
current standards for new
construction.
• Reduced bridge width/lack of
adequate shoulders may lead
to:
Driver discomfort
Decreased speed
Increased congestion
No storage for disabled
vehicles
No easy passage of
emergency response
Functional Bridge Deficiencies

Structural Roadway Deficiencies
• Cracking, patch deterioration, joint
separation & raveling
Longitudinal and Traverse Cracking on I-30
Linear Cracking on I-40
Functional Roadway Deficiencies
• Horizontal Curves (8 locations)
• Inadequate Shoulders (9 segments)
• Curb and gutter immediately adjacent to
travel lanes (2 segments)
• Ramps lacking sufficient merge distance (15
locations)
• Short Weaving Distance (12 locations)
Inadequate Shoulders, Curb, and Gutter Adjacent to I-30
I-30 Project Needs

I-30 Project Timeline
PEL • Planning and Environmental Linkages study
Environmental and Schematic • NEPA clearance
• 20% - 30% schematics
Design-Build Procurement • D-B guidelines and procedures update
• RFQ development, response, evaluation, and short list
• RFP development, response, evaluation, and selection
Design and Construction • Final design
• Construction

I-30 Planning & Environmental Linkages Study
I-30 PEL

PEL Overview
• SAFETEA-LU (2005)
– Linking the Transportation Planning and NEPA Process
• FHWA launched EDC in 2009 to speed up delivery of transportation projects
• PEL is one of ten initiatives in the toolkit
• Benefits
– Relationship-building
– Improved project delivery timeframes
– Early planning-level decisions that can be carried into NEPA
– On-the-ground outcome benefits
– Saves time, money and effort
Planning Environment
Data and analysis tools
Interagency coordination
Decision process
Purpose & Need

PEL Process
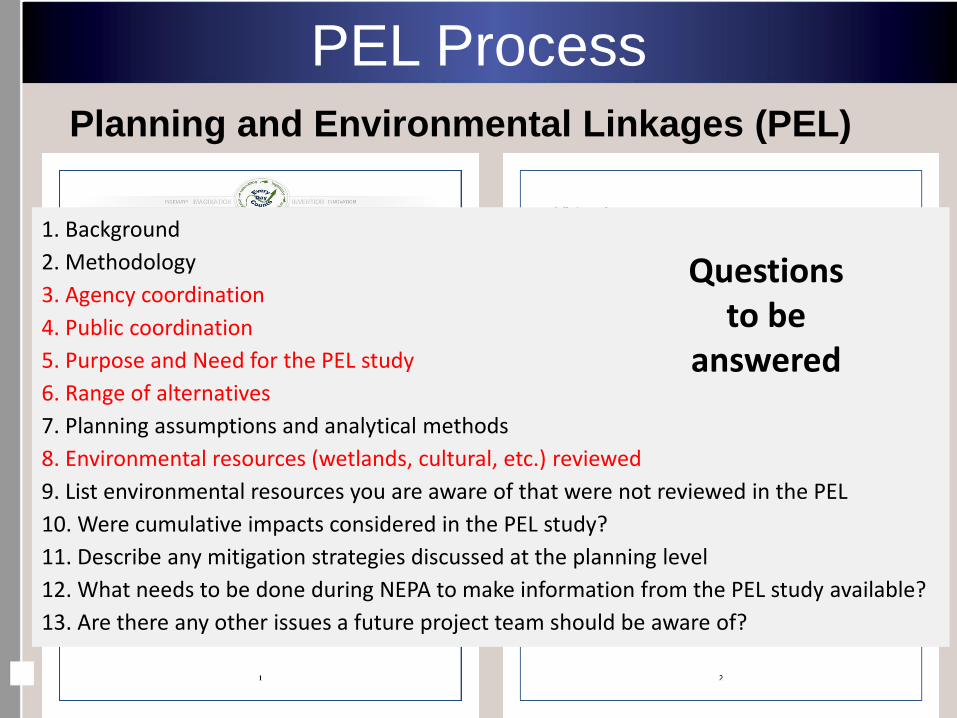
Planning and Environmental Linkages (PEL)
PEL Process
Planning and Environmental Linkages (PEL)
1. Background
2. Methodology
3. Agency coordination
4. Public coordination
5. Purpose and Need for the PEL study
6. Range of alternatives
7. Planning assumptions and analytical methods
8. Environmental resources (wetlands, cultural, etc.) reviewed
9. List environmental resources you are aware of that were not reviewed in the PEL
10. Were cumulative impacts considered in the PEL study?
11. Describe any mitigation strategies discussed at the planning level
12. What needs to be done during NEPA to make information from the PEL study available?
13. Are there any other issues a future project team should be aware of?
Questions to be
answered

I-30 PEL

I-30 PEL

PEL Coordination & Meetings
Public Meetings
Four public meetings were held during the PEL to
discuss and present information for the I-30 PEL
study. They were open house meetings with no
formal presentations:
• August 2014: PEL introduction, study area,
alternative screening process, purpose and
need, and study area constraints
• November 2014: Universe of Alternatives and
Preliminary Alternatives
• January 2015: Level 2 screening and
Reasonable Alternatives
• April 2015: Level 3 screening and PEL
Recommendation(s)
Technical Work Group (TWG)
35+ agencies (local, state, federal) provided
technical input and expertise. TWGs were held prior
to the corresponding public meeting.
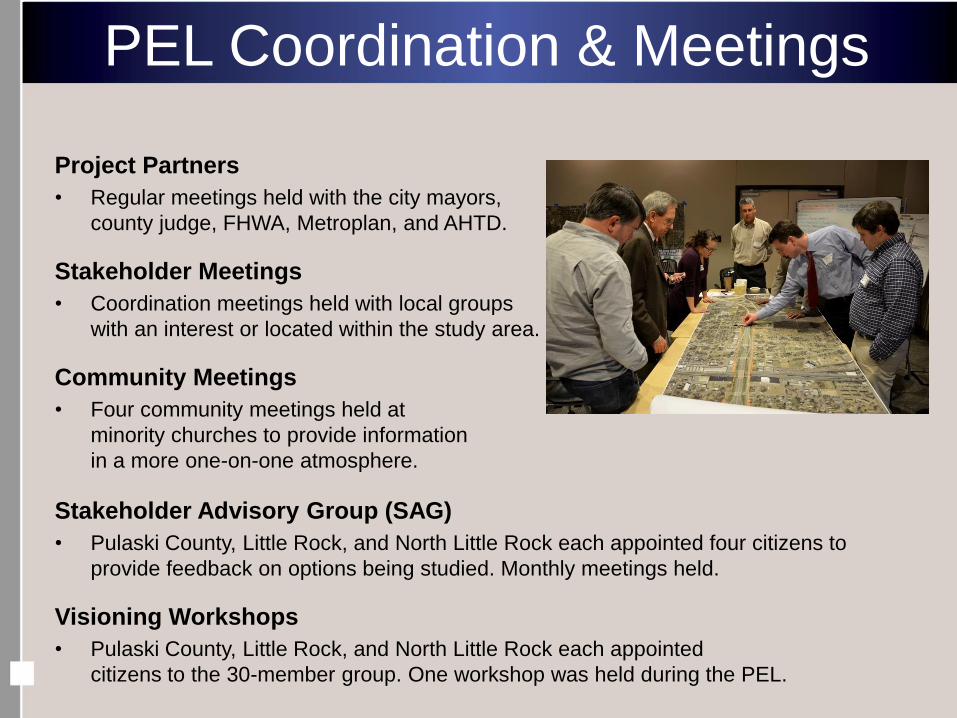
PEL Coordination & Meetings
Project Partners
• Regular meetings held with the city mayors,
county judge, FHWA, Metroplan, and AHTD.
Stakeholder Meetings
• Coordination meetings held with local groups
with an interest or located within the study area.
Community Meetings
• Four community meetings held at
minority churches to provide information
in a more one-on-one atmosphere.
Stakeholder Advisory Group (SAG)
• Pulaski County, Little Rock, and North Little Rock each appointed four citizens to
provide feedback on options being studied. Monthly meetings held.
Visioning Workshops
• Pulaski County, Little Rock, and North Little Rock each appointed
citizens to the 30-member group. One workshop was held during the PEL.

Outreach
CAP and 30 Crossing Website
• ConnectingArkansasProgram.com
• 30Crossing.com
Phone and Email
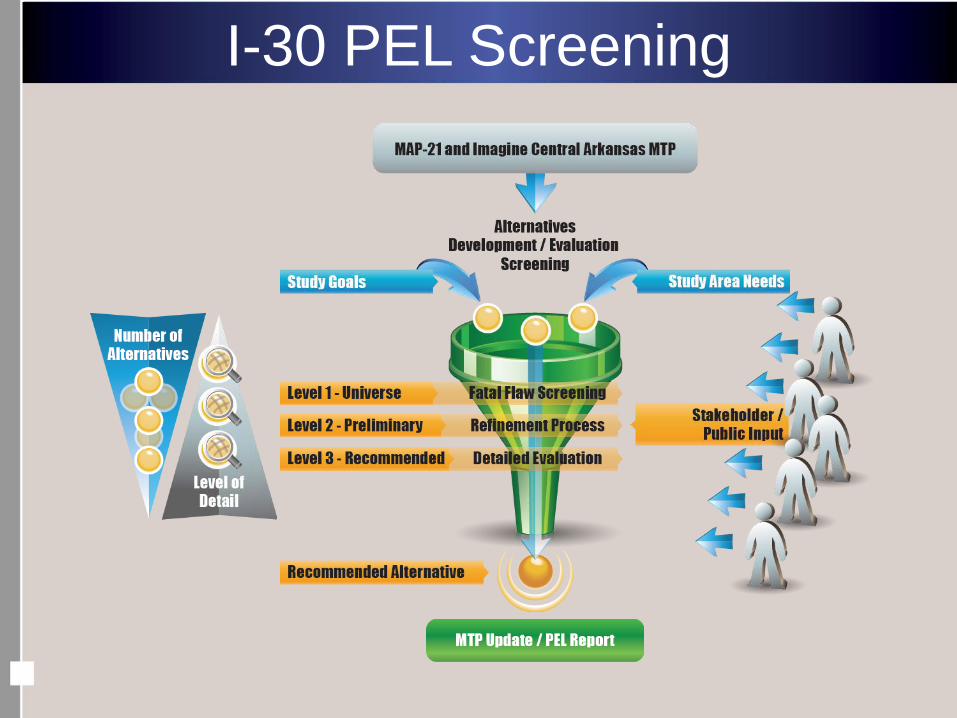
I-30 PEL Screening

PEL Universe of Alternatives
Highway Build (14)
I-30 Arkansas River Bridge (3)
Other Modes (10)
Congestion Management (10)
Non-Recurring Congestion (5)

Level 1 Screening
Level 1 screening eliminated 5 alternatives • Dedicated Truck
Lanes/Ramps • Elevated Lanes
(Highway) • Elevated Lanes (Bridge) • Heavy Rail • High-Speed Rail 38 alternatives moved on to Level 2 screening

Level 2 Screening
Level 2 screening eliminated 8 alternatives • Bypass Route • I-30 River Bridge
Rehabilitation • Commuter Rail • Light Rail • Managed Lanes • Reversible Lanes • Hard Shoulder Running • Land Use Policy 30 alternatives moved on to further screening

Scenarios

I-30 PEL
Reasonable
Alternatives
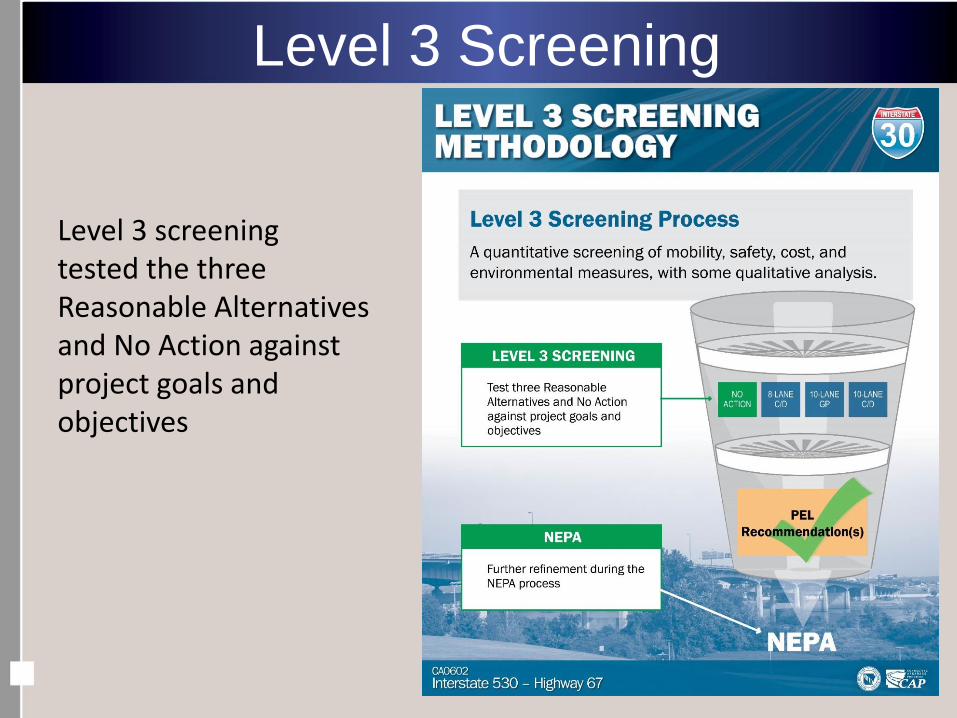
Level 3 Screening
Level 3 screening tested the three Reasonable Alternatives and No Action against project goals and objectives

PEL Recommendation
The study team proposed that the 10-Lane with Downtown C/D be advanced to NEPA as the PEL Recommendation.
Corridor receives traffic from six
major interstates/highways:
I-30 , I-530, I-440
I-630, I-40, Hwy. 67
The PEL study is available to view or download at 30Crossing.com

I-30 PEL

I-30 Schedule Overview
PEL • Planning and Environmental Linkages study
Environmental &Schematic • NEPA clearance
• 20% - 30% schematics
Design-Build Procurement • D-B guidelines and procedures update
• RFQ development, response, evaluation, and short list
• RFP development, response, evaluation, and selection
Design and Construction • Final design
• Construction
We are here

I-30 Planning & Environmental Linkages Study
Questions?