i-3. potential failure mode analysis - bureau of reclamation · i-3. potential failure mode...
TRANSCRIPT

Last Modified 3/13/2015
I-3-1
I-3. Potential Failure Mode Analysis
Key Concepts Identifying, fully describing, and evaluating site-specific potential failure modes are arguably the most important steps in conducting a risk analysis. This forms the basis for risk evaluations and event tree development. If this is not done properly, the remainder of the risk analysis could be of limited value and even misleading. An adequate job of identifying potential failure modes can only be performed after thoroughly reading all relevant background information on a dam, including geology, design, analysis, construction, flood and seismic loadings, operations, dam safety evaluations, and performance and monitoring documentation. Photographs, particularly those taken during construction or unusual events, are often key to identifying issues related to potential failure modes. It is essential that the records be diligently collected and reviewed, even if those involved have familiarity with the project, as something might have been missed in previous reviews. A site examination should also take place if at practicable. The examination team should be looking for clues as to how the dam and facilities might be vulnerable to uncontrolled reservoir release. Operations personnel should be involved in the examination, and queried as to how they handle flood operations and other unusual incidents. They should also be asked their opinion as to where the vulnerabilities lie. More than one qualified person should take part in the data review and examination activities, as one person might uncover something that another might miss. The interaction of disciplines often reveals vulnerabilities that would otherwise be missed. First hand input from operating personnel is essential to the process of identifying and understanding potential failure modes. This usually occurs at the examination and initial meeting. For team facilitated risk analyses, operating personnel are typically part of the risk analysis team. It is important to include, but also think beyond, the traditional “standards-based” analyses when identifying potential failure modes. Some of the more critical potential for uncontrolled release of water may be related to operational issues, or behavior that cannot be analyzed using traditional standards-based engineering analyses.
Identifying and Describing Potential Failure Modes Identifying potential failure modes is done in a facilitated team setting, with a diverse group of qualified people. The facilitator is ideally a senior level registered engineer with many years experience in dam or levee design, analysis and construction. The facilitator must have participated in several failure mode and risk analysis sessions before facilitating a session. It is important to take a fresh look at the potential failure modes, and not just default to those that may have been previously identified.
I-3-2
The facilitator elicits “candidate” potential failure modes from the team members, based on their understanding of the vulnerabilities of the dam and project from the data review and field conditions. It is often useful to “brainstorm” potential failure modes, then go back and evaluate each one. The first step following the brainstorming session is to identify those potential failure modes that are not expected to contribute significantly to the risk associated with the dam. The detailed resons for excluding these fromfurther evaluation should be clearly documented. The team should discuss and agree on those that potentially contribute the most to the risk. These are often referred to as “risk-driver” potential failure modes. It should not be just one person’s opinion, nor should the team just accept the previous failure mode screening. Once the risk-driver potential failure modes have been identified, it is the facilitator’s role to ensure these potential failure modes are completely described. It is important to put scale drawings or sketches up on the wall, and sketch the potential failure modes during the discussions. The potential failure modes must be described fully, from initiation through step-by-step progression to breach and uncontrolled release. There are three parts to the description:
• The initiator. For example, this could include increases in reservoir due to flooding (perhaps exacerbated by a debris-plugged spillway), strong earthquake ground shaking, malfunction of a gate or equipment, deterioration, an increase in uplift, or a decrease in strength.
• Failure progression. This includes the step-by-step mechanisms that lead to the breach or uncontrolled release of the reservoir. The location where the failure is most likely to occur should be also be highlighted. For example, this might include the path through which materials will be transported in an internal erosion situation, the location of overtopping in a flood, or anticipated failure surfaces in a sliding situation.
• The resulting impacts. The method and expected magnitude of the breach or uncontrolled release of the reservoir is also part of the description. This would include how rapid and how large the expected breach would be, and the breach mechanism. For example, the ultimate breach from an internal erosion failure mechanism adjacent to an outlet conduit might result from progressive sloughing and unraveling of the downstream slope as a result of flows undercutting and eroding the toe of the dam, until the reservoir is breached at which point rapid erosion of the embankment remnant ensues, cutting a breach to the base of the conduit.
The reasons for completely describing the potential failure modes are: (1) to ensure the team has a common understanding for the follow-on discussions, (2) to ensure that someone picking the report up well into the future will have a clear understanding of what the team was thinking, and (3) to enable development of an event tree or other means of estimating risks, if warranted. Examples of potential failure mode descriptions, as initially written and then as fleshed out to meet the requirements of this section, follow.
• Unedited (insufficient detail): Sliding of the concrete dam foundation. • Edited: As a result of high reservoir levels, a continuing increase in uplift
pressure on the old shale layer slide plane at about elevation 1135, and a decrease in shearing resistance due to gradual creep on the slide plane, sliding of the
I-3-3
buttresses initiates. Major differential movement between two buttresses takes place causing the deck slabs to be unseated from their simply supported condition on the corbels. Breaching failure of the concrete dam through two bays rapidly results. (Note that each of the basic failure mode components is underlined here for emphasis).
• Unedited (insufficient detail): Foundation liquefaction. • Edited: Liquefaction of a continuous saturated loose sand layer in the dam
foundation, identified in borings between stations 2+50 and 6+50 at about elevation 1664, leads to loss of shear strength in the layer, instability of the downstream slope, and loss of freeboard to the point that the crest drops below the reservoir level. Overtopping erosion ensues and the embankment is breached to the base of the dam.
• Unedited (insufficient detail): Piping through the embankment. • Edited: Internal erosion of the embankment core initiates at the gravel transition
interface. The core material is carried through the gravel transition zone and rockfill shell material, and into the waste berm at the toe of the dam. Backward erosion occurs until a “pipe” forms through the core to the upstream gravel transition beneath the reservoir level. At that point, flow through the “pipe” increases, eroding the core material until the gravel transition and upstream shell collapse into the void, forming a sinkhole in the upstream face. Continued increase in flow erodes and enlarges the “pipe” until the crest collapses into the void and the embankment is breached. Erosion continues to the base of the dam, about elevation 2960.
• Unedited (insufficient detail): Dam overtopping due to gate failure. • Edited: During a large flood, releases in excess of those that can be passed
through the automated spillway gate are required (there are three additional spillway gates that are not automated). The limit switch on the automated gate fails (as occurred in 1994) due to a loss in SCADA communications and the gate opens fully wiping out the main access road. An operator is deployed to the site, but cannot make it to the gate operating controls in time. The release capacity of the single automated gate is insufficient and the dam overtops, eroding down to the stream level.
Evaluating and Screening Potential Failure Modes
Adverse and Favorable Factors After the team has completely described a potential failure mode, it is then evaluated by listing the adverse factors that make the failure mode “more likely”, and the favorable factors that make the failure mode “less likely”. These are based on the team’s understanding of the facility and background material. The facilitator captures these in bullet form on a flip chart or table. However, these must also be fleshed out in the documentation so that someone picking up the report in the future will understand what the team was thinking. It is the facilitator’s job to review the report and ensure that this happens.
Consider the internal erosion potential failure mode described above. A list of adverse and favorable factors might look like the following. Regular text shows how they might

I-3-4
be captured on the flip chart or table, while text in italics indicates how they would be fleshed out in the report.
• Adverse or “More Likely” Factors: • The gravel transition zones do not meet modern “no erosion” filter
criteria relative to the core base soil. • The gravel transition zone may be internally unstable, leading to erosion
of the finer fraction through the coarser fraction and even worse filter compatibility with the core.
• The reservoir has never filled to the top of joint use; it has only been within 9 feet of this level; most dam failures occur at reservoir levels reached for the first time, which may occur here for a 50 to 100-year snowpack.
• The core can sustain a roof or pipe; the material was well compacted (to 100 percent of laboratory maximum), and contains some plasticity (average PI~11).
• There is a seepage gradient from the core into the downstream gravel transition zone, as evidenced by the hydraulic piezometers installed during original construction (and since abandoned).
• Favorable or “Less Likely” Factors:
• Very little seepage is seen downstream; the weir at the downstream toe, which captures most of the seepage through the dam, records about 10 gal/min at high reservoir when there is no preceding precipitation, indicating the core is relatively impermeable; this level of flow is unlikely to initiate erosion.
• The core material is well compacted (to 100 percent of laboratory maximum) and has some plasticity (average PI~11), both of which reduce its susceptibility to erosion.
• There are no known or suspected benches in the excavation profile that could cause cracking.
• If erosion of the core initiates, the gravel transition zone may plug off before complete breach occurs, according to the criteria for “some erosion” or “excessive erosion” by Foster and Fell (ASCE J. Geotech. and Geoenv. Engr., Vol. 127, No. 4, May 2001).
Consequence Review Although a detailed consequence evaluation will be performed as part of the risk analysis (see Section on Consequences Evaluation), an initial review is performed to get a general sense of how significant the downstream hazard is. This is done in two parts. The first part is the downstream impacts of the given potential failure mode; the second part relates to factors specific to the potential failure mode in terms of how quickly it might progress, whether a partial or full breach is more likely, or other site specific attributes. The following paragraphs illustrate these two components.
• If the East Dam were to breach by this mechanism, at risk would be two county roads, several farmhouses, two bridges, a railroad line, an interstate highway, a gas pumping station, an aggregate plant, a barley mill, a transmission line, and the town of Tannerville at about 30 miles downstream. There is little recreation
I-3-5
activity downstream of the dam. The total population at risk is estimated at about 90.
• If this potential failure mode were to initiate, it would be difficult to detect due to the coarse rockfill shell and waste berm downstream which would hide the seepage. The downstream weir is affected by precipitation that often masks the true seepage. Therefore, the failure mode could be well developed and in progress by the time it is detected. Once the core of the dam is breached to the reservoir, rapid enlargement and complete loss of the reservoir could occur in less than an hour.
Risk Screening of Risk-Driver Potential Failure Modes As the team collects and discusses the adverse and favorable factors, they typically get a sense of which factors are most important and should receive the most weight, as well as the overall risk posed by the potential failure mode under consideration. Once all the adverse and favorable factors that the team can think of have been collected, and the consequences have been reviewed, each potential failure mode is screened to determine its potential contribution to the risk. It is helpful to use the semi-quantitative matrix approach (described later in this manual) to get a sense of the risks associated with each risk-driver potential failure mode. This can be useful in identifying interim risk reduction actions, monitoring improvements, and additional data or analyses that could be useful in better defining the risks. In addition, quantitative risk analyses can be quite expensive and time-consuming, and such a screening exercise will help focus any quantitative risk analyses on only the failure modes potentially critical in terms of risk guidelines (also described later in this manual).
Potential Failure Modes Considerations A list of issues related to potential failure modes that have been identified in past potential failure mode analyses is provided below. It is not an exhaustive list, nor have the descriptions been fleshed out to the extent needed in the documentation. This must be done on a case-by-case basis. However, the list provides food for thought in conducting a potential failure mode analysis.
• Discharge capacity is reduced during flooding by flows that take out powerplant
transformers (eliminating the ability to generate and discharge through the units), power supplies to gates, or access to open gates, leading to premature overtopping.
• High tailwater floods the powerplant and leads to loss of release capacity through the units, resulting in premature overtopping.
• Loss of power or communications due to lightning, earthquake shaking, or other causes leads to gate misoperation, and overtopping or life-threatening downstream releases.
• Binding of gates (possibly due to ASR concrete expansion) or mechanical failure can lead to inability to open gates and premature overtopping.
• Spillway discharge capacity is reduced when the reservoir rises to levels not envisioned in the original design and impinges on the bottom of open gates, transitioning from free flow to orifice flow, leading to overtopping.
• Opening the gates in accordance with the Water Control Manual or Standing Operating Procedures rule curves would flood people out downstream and there

I-3-6
may be reluctance on the part of the operators to do this, which in turn could lead to a delay in releases and premature overtopping of the dam.
• Faulty instrumentation could indicate reservoir levels and flows are within normal ranges, but dangerous inflows, outflows, or water levels are developing.
• Overtopping of concrete dams may be acceptable and advisable. The quality of the rock on which the flows impinge must be evaluated.
• Careful attention must be paid to the flood routings. In some cases the dam crest may be lower than assumed or shown on the drawings, crest elevations may vary between reservoir impounding structures, or the elevation of a single structure may vary, creating a flow concentration possibility.
• A “fuse plug” may be relied on for flood routings that indicate the dam will not be overtopped. In such cases, the design and construction of the fuse plug should be reviewed to ensure it will perform as intended.
• Some reservoirs produce debris during flood events that could plug spillway gates and lead to premature overtopping. Log booms may or may not be able to sustain the debris load; they should be evaluated also.
• Spillways can fail to perform as anticipated due to overtopping of spillway walls, jacking of chute slabs due to “stagnation” pressures, cavitation, or erosion of deteriorated materials. The resulting erosion can headcut upstream and breach the reservoir. Defensive measures for these scenarios should be reviewed.
• Seepage occurring from an unprotected/unfiltered exit could lead to internal erosion through the dam or foundation. In some cases the flows may be measured by flumes, which cannot trap and detect sediments in the seepage flow. In other cases, seepage, if occurring, cannot be observed due to vegetation, tailwater, or an unfiltered blanket at the toe that dried up the area.
• The rock foundation beneath the core of an embankment dam contains open joints that were not treated with slush grout or dental concrete, leading to the possibility of internal erosion of the embankment material into the foundation. A similar concern exists if the embankment core material was placed directly against foundation soils that may not be filter compatible.
• In some cases, incidents related to internal erosion and sinkholes have developed in the past, but are buried in the archives. A careful review could identify significant potential internal erosion seepage paths.
• Internal erosion of material into under-drain systems can leave a void adjacent to or beneath a conduit or structure. This provides an unfiltered exit (into the void) closer to the reservoir than would otherwise exist and increases the average gradient. This can be especially problematic in low plasticity soils.
• Internal erosion of material from beneath concrete dams founded on alluvial soils can lead to a rapid draining of the reservoir beneath the dam and life-threatening downstream flows.
• In some cases, no engineering geology or rock mechanics evaluation has been performed for a concrete dam, and the rock is pronounced to be “good” due to its hardness, even though adversely oriented joints, faults, shears, foliation planes, or bedding planes can be observed in construction photos and downstream of the dam. Foundation instability could occur under a change in loading conditions.
• Two-dimensional analyses can sometimes indicate a potential problem when three-dimensional effects will result in a stable condition (for example, a narrow concrete gravity section wedged between a solid rock wall and massive spillway section, with a keyed joint).
I-3-7
• Large spillway gates could release life-threatening flows if they failed under normal operating conditions. Buckling of radial (Tainter) gate arms under operation (trunnion pin friction) or seismic loading may be an important consideration. Deterioration due to lack of maintenance can be a contributing factor.
• Spillway piers are designed to carry loads in the upstream-downstream direction; cross canyon seismic loading could produce high moments about the weak axis. Moment failure of a pier could result in the loss of two adjacent gates.
• Liquefaction of loose foundation or embankment soils can lead to deformation and loss of freeboard, perhaps leading to overtopping, or otherwise possibly leading to cracking and subsequent seepage erosion through the cracks.
• Seismic soil-structure interaction between an embankment and spillway wall can lead to separation at the contact and seepage erosion through the gap.
• “Kinks” or changes in slope on a concrete gravity dam can lead to stress concentrations during seismic loading, cracking through the structure, and sliding failure. Post-earthquake analyses are helpful in evaluating this condition.
• Shake table model studies on concrete arch dams indicate the most likely seismic failure mode is horizontal cracking near the center of the structure, diagonal cracking parallel to the abutments, and rotation of concrete blocks isolated by the “semi-circular” cracking downstream.
• Fault displacement within the foundation of an embankment dam could crack the core and lead to seepage paths and internal erosion. If fault displacement occurred within the foundation of a concrete dam, severe cracking and structural distress could result, perhaps leading to foundation erosion, differential displacement and rupture of gates, loss of the reservoir through the created gap, or loss of ability to carry load.
• Large landslides may fail quickly into a reservoir creating a wave that overtops and erodes the dam. Landslide movement within the abutment of a dam could lead to cracking of the core and internal erosion of an embankment, or foundation instability or severe structural stress to the point where load carrying capacity is lost if a concrete dam.
Summary Potential failure mode analysis is the vital first step in conducting a risk analysis. A lot can be learned from this step alone. A thorough job of failure mode identification, description, and screening will lead to a more relevant and efficient risk analysis process. It will also help to identify potential interim risk reduction actions, monitoring enhancements, and additional data or analyses that would be helpful in better defining the risks. The following exercise is provided for practicing this process.
I-3-8
Potential Failure Mode Analysis Exercise If the class participants are primarily working in dam safety, use the following exercise. If primarily working in levee safety, use the exercise at the end of this chapter.
Dam Safety Exercise Note: This exercise was created by Larry Von Thun, who is now a Consulting Engineer after working many years for the Bureau of Reclamation.
Exercise 1 Read the following paragraphs on Evans Creek Dam, and develop a potential failure mode description that someone will be able to clearly understand in five years without having to search through the background information on the dam.
Exercise 2 Develop a list of Adverse (“More Likely”) and Favorable (“Less Likely”) factors for the failure mode described in Exercise 1. Using the understanding gained from developing this list, classify the potential failure mode using the semi-quantitative procedure described later in this manual. Describe the rationale for the categories you pick, by noting the two or three key factors from the lists that clearly support and most influence the ratings the ratings, and why. (See also section on Semi-Quantitative Risk Assessment.)
Evans Creek Dam and Power Plant
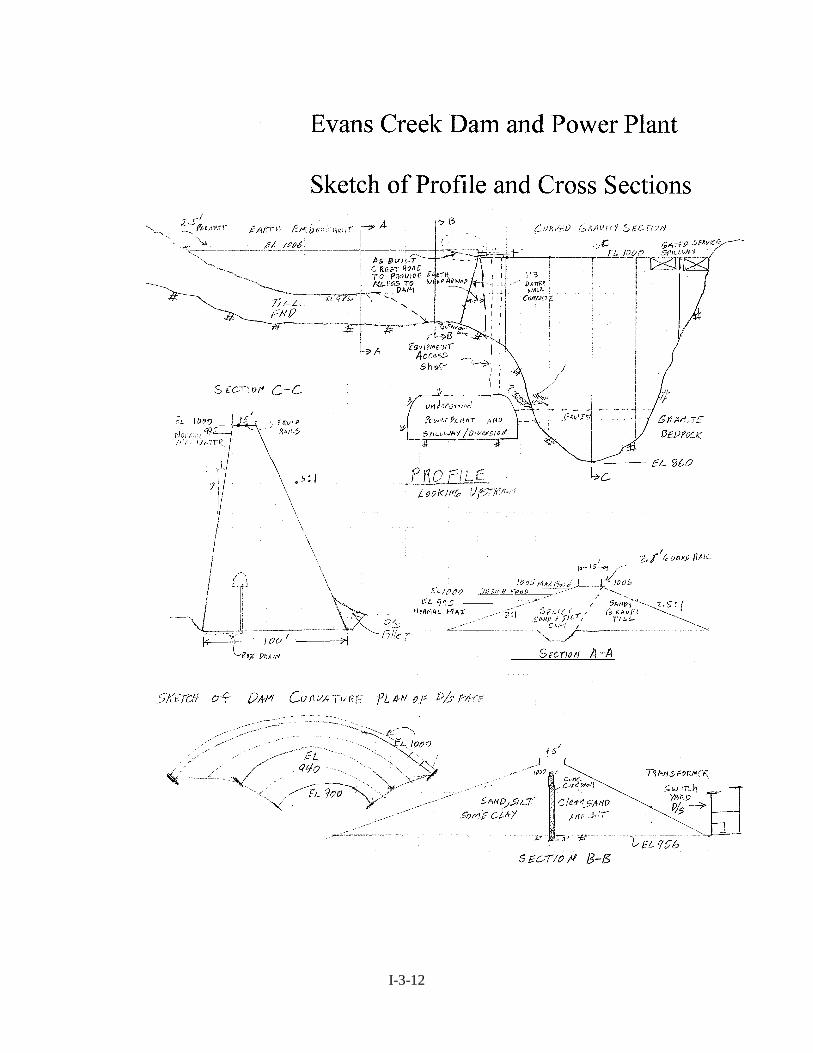
Background Information The Evans Creek Project, constructed in 1932, includes an underground powerplant and a composite dam. The dam consists of a 140-foot-high curved concrete gravity structure, and a 30-foot-high, 200-foot-long embankment dam (see “Profile” sketch). The embankment dam was constructed on glacial till overburden (see Section A-A sketch), except at the interface with the concrete dam, where the excavation was taken down to rock (see Section B-B sketch). A service spillway is located at the left end (looking downstream) of the concrete gravity dam. The “emergency spillway” is flow over the concrete gravity dam. Evans Creek Dam is built across a relatively steep gorge in an otherwise long, relatively flat and narrow valley.
Hydrology The reservoir holds 1,500 acre-feet of storage and receives runoff from a 30-square-mile basin. Records indicate that the crest of the concrete gravity dam (at elevation 1000 feet) was established based on passage of the “Standard Project Flood” of approximately 9,000 ft3/s. The underground powerplant is considered to be fully operable under flood conditions and can pass 5,000 ft3/s (with all units running). The 40-foot-wide, two-bay gated service spillway (crest elevation 990), on the left side of the concrete dam, can pass 4,000 ft3/s with the reservoir at elevation 1000 feet. The “emergency spillway” is the crest of the concrete gravity dam (elevation 1000 feet, 120 feet in length). The embankment to the right of the concrete gravity dam was constructed to elevation 1006 (6 feet higher than the concrete gravity structure crest) with a 2.5-foot-high parapet wall that

I-3-9
was designed to serve as a wave barrier. The wave barrier terminates at the locked access gate to the top of the concrete gravity structure. A revised flood study (performed in 1984) using the Probable Maximum Precipitation (PMP) for the area showed that the Probable Maximum Flood (PMF) for the site had a peak inflow of 20,000 ft3/s. Routing of this flood, starting at the normal maximum water surface elevation of 995 feet, yielded a peak discharge of 16,500 ft3/s and a peak reservoir elevation of 1005 feet. The service spillway passes 7,500 ft3/s, the powerplant passes 5,000 ft3/s, and 4,000 ft3/s passes over the crest of the concrete gravity dam (“emergency spillway”) in passing the PMF. Maximum tailwater during the PMF is at elevation 905, which is well below the transmission service yard at elevation 956 (shown on Section B-B sketch). There are no external openings to the powerplant, and the powerplant is protected from external seepage with two pumps capable of handling 500 gal/min of seepage. Maximum seepage experienced to date has been 50 gal/min during the flood of April 1965 (peak inflow of 8,000 ft3/s) when tailwater reached elevation 885. The flood of 1965 was safely passed.
Geology The dam is constructed on a relatively massive granite pluton. Joint spacing is 2 to 5 feet. There are two, near vertical joint sets approximately parallel and perpendicular (+/- 10 degrees) to the axis of the embankment dam (which is N 15° W) and one nearly horizontal joint set. The joints are fairly tight, especially at depth and show minor weathering on the joint surfaces. Excavation for the concrete dam had to be performed using blasting. The granite bedrock is viewed to be sound, capable of resisting erosion, and is considered fully capable of receiving any flow over the concrete dam. Regional shearing with a dip of 30 to 45 degrees to the south is observable in the canyon. The shears are widely spaced (50 to 300 feet) and occasionally are in-filled with clay gouge. Two shears (see “Profile” sketch) were mapped in the dam foundation. Both dipped out of the abutment at about 35 degrees. One shear was about 4- to 6-feet-wide on the right abutment granite ledge (under the portion of the embankment founded on rock adjacent to the concrete gravity dam). The other shear was on the right abutment of the gravity dam (6 to 8 feet exposed along the abutment – see “Profile” sketch). The gallery was relocated to avoid excavation in this shear zone.
Concrete Gravity Dam The concrete gravity structure (see Section C-C sketch) was constructed on and keyed into granite bedrock. Stress analyses performed on the dam during design and later for a dam safety review (performed in 1998) show that all factors of safety and stability criteria are met.
Embankment Dam, Portion Founded on Glacial Till (see Section A-A) Permeability tests (both surface and drill hole) showed the glacial till overburden to be quite impermeable. Thus, only a shallow cutoff trench was dug into the till. Borrow area studies identified a sandy/silty clay till for the impermeable portion of the dam embankment (core). A sandy gravel layer was located for obtaining the embankment dam’s shell material. Compaction of embankment material was by equipment travel. Drill holes (to recover samples) showed high SPT blow counts in the core material, and
I-3-10
very high SPT blow counts in the shell material. Questions about the possibility of gravel influence were addressed with shear wave velocity tests which also indicated that the shell material was well-compacted. All of the embankment and foundation materials are broadly graded and “no erosion” filter criteria have been examined recently. It was found that filter criteria for the core material is met by both the foundation and shell material. There is no seepage observable for this portion of the embankment and there are also no piezometers or seepage collection points. Observation wells downstream show that the water surface is just above bedrock. Stability factors of safety meet all criteria.
Embankment Dam, Portion Founded on Granite Bedrock (see Section B-B) A concrete core wall was constructed to within 5 feet of the crest. The embankment material was pit-run, with dirtier material placed upstream and cleaner material placed downstream. Stability factors of safety meet all criteria. Embankment samples show that the Plasticity Index (PI) of the upstream embankment material is on the order of 3 to 8, and most samples of the downstream embankment were non-plastic. The transition between the section on glacial till (sketch Section A-A) and this section was not described in detail. A single row of grout holes at 10-foot spacing was drilled and grouted to a depth of 40 feet during original construction to prevent seepage through the foundation of this section. Seepage in this section is reported to now be clear and constant at about 200 gal/min. The seepage in this section (over about 40 feet in width) is measured with a Parshall flume installed at the end of a shallow toe drain excavated in the weathered rock at the embankment toe. This seepage collection and monitoring system was constructed after seepage developed and increased in the mid-1930’s. Initial seepage during reservoir filling was about 50 gal/min and it gradually increased to 250 gal/min before becoming constant at 200 gal/min, where it has remained for the last 50 years. The transformer yard is just downstream of this section. Equipment in this area is founded on pads and a coarse gravel fill surrounds the whole yard.
Inspection and Monitoring Notes No significant concrete deterioration has occurred and cracking on the concrete dam (and at the service spillway) is minimal, with the exception of one diagonal crack on the downstream face (see “Profile” sketch) which formed during the first year of filling. The crack was carefully monitored for 15 years afterwards and showed no change in length or opening. It is now monitored only by visual inspection and annual photographic record. Seepage periodically emerges from the crack, and calcium carbonate deposits are readily observable. An equipment rail line runs across the top of the concrete dam to the service spillway structure. This rail line was closely observed during the most recent inspection, especially at the contraction joints of the 30-foot-wide blocks, and was found to have no offsets or deformation. Also surveys of the concrete dam crest, which were originally performed annually and now are performed every 5 years, show no settlement of consequence and no permanent upstream or downstream deflections. Seasonal variations in deflections are observable, but they are reasonable and make sense. The gallery is without cracks and is dry except for flow from drain holes drilled from the crown just beyond the dam foundation contact on the right abutment. The crest road on the embankment dam is paved and no cracks were observed when the crest road was recently inspected. The parapet structure is sturdy (was well constructed)

I-3-11
and can easily resist wave action (and could likely retain water as well). Vehicles can drive on to the embankment, but no public vehicle access is allowed on the concrete structure as a locked gate exists on the embankment about 20 feet from the beginning of the concrete dam. All of the operators (3 are trained) have keys to the gate as does the plant supervisor. The powerplant is remotely operated but workers are onsite on a daily basis. The concrete dam has a 3-foot-high hand rail that also carries power to the service spillway. An emergency generator was acquired to ensure that the service spillway gates could be opened, and the unit is regularly tested. Primary access to the service spillway is from the right abutment, along the 15-foot-wide road over the crests of the embankment and concrete dams. Secondary access to the service spillway is a road that leads to the left abutment. There is a stairway down the abutment to the service spillway.
Downstream Hazard If a major portion of the dam were to breach, the following would be inundated: 1) a small 10 site campground at the mouth of the canyon, 2) a state highway and adjacent rail line including one bridge each, 3) a lumber mill employing about 20 people located about 10 miles downstream, and 4) the town of Andrews City at about 50 miles downstream. The total population at risk is estimated at about 370. Flows will be deep and rapid through the canyon but will spread out beyond.
Flood Frequency A review of the hydrology indicates that the service spillway was likely designed to pass something on the order of the 1/100 to 1/200 flood by itself. Because local storms control the flood hazard and the basin is relatively large, a flood that corresponds to a project discharge of 12,500 ft3/s is estimated to have an annual exceedance probability of about 1/7500.
I-3-12
I-3-13
Levee Safety Exercise
Exercise 1 Read the following paragraphs on Cobb Creek Right Bank Levee, and develop a potential failure mode description that someone will be able to clearly understand in five years without having to search through the background information on the levee.
Exercise 2 Develop a list of Adverse (“More Likely”) and Favorable (“Less Likely”) factors for the failure mode described in Exercise 1. Using the understanding gained from developing this list, rank the failure modes from most risky to least risky based on consideration of both likelihood and consequences. Describe the rationale for the ranking, by noting the two or three key factors from the lists that most influenced the ranking, and why. The risk matrix is useful for developing the ranking (see also section on Semi-Quantitative Risk Assessment).
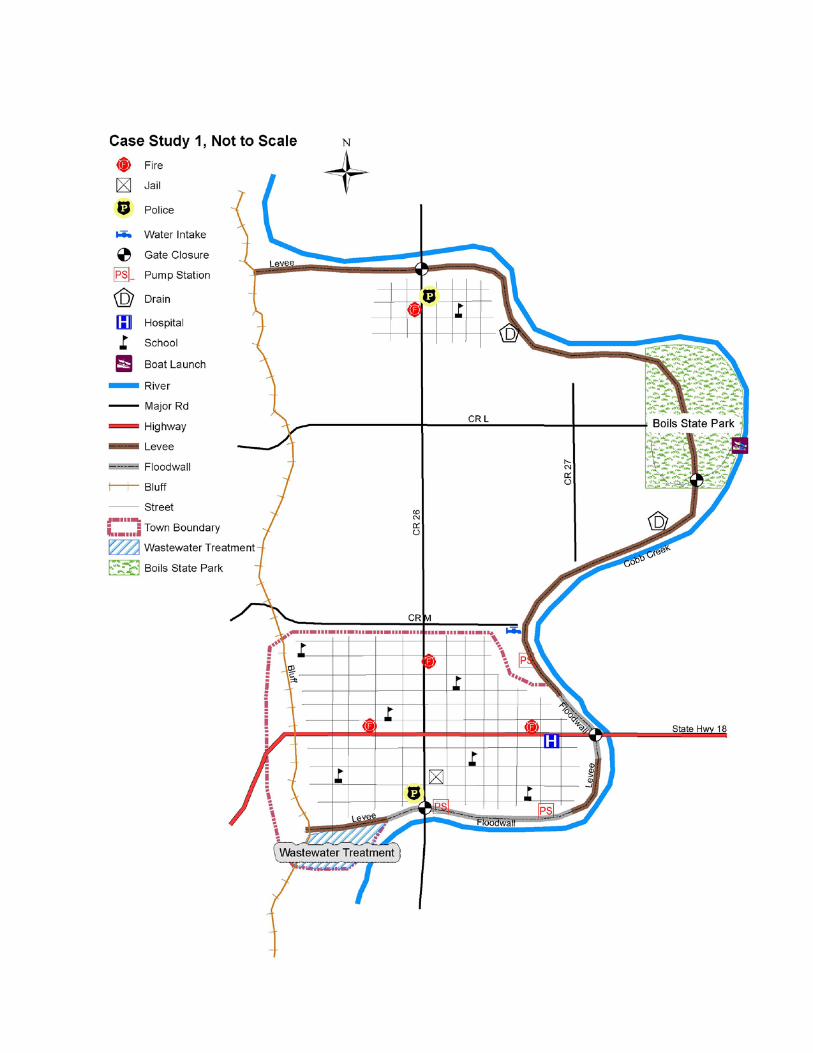
Cobb Creek Right Bank Levee
Background Information Cobb Creek flows from north to south in the project area. The project was authorized by Congress in 1935, and built between 1945 and 1947. The levee consists of an earthen embankment 5.4 miles long, with 1.2 miles of concrete floodwall around portions of Ernieton, and 3 closure structures totaling 160 feet in length (see the sketch plan at the end of this section). There are also 3 pump stations, 2 gravity drainage structures, and one water supply pipe that cross the centerline of the levee. The levee has a maximum height of 18 feet and ties into high ground at the upstream and downstream ends. The levee crest varies from elevation 560 at the upstream end to 510 at the downstream end.
Hydrology Cobb Creek receives runoff from a 20-square mile basin. Rainfall patterns are considered flashy, therefore a flood event is assumed to be of relatively short duration (less than 24-hours). There are no recorded ice flow conditions at the location of the Cob Creek Levee. No erosion issues have been documented either, and it is assumed all existing erosion prevention measures are adequately maintained.
Records show the Cobb Creek Levee was designed to contain the ‘design flood’, considered to be the greatest flood stage with the reasonable probability of occurrence. This design flood is assumed to be smaller in magnitude than the probable maximum flood (the greatest flood that could occur based on assumptions intended to maximize possible precipitation and runoff). The exceedance frequency of the design flood event is estimated to be 1% (100-year). Final levee crest elevations are the result of the design flood stage plus 3.0 feet of freeboard, thus it is estimated the overtopping exceedance will occur approximately at the 0.2% (500-year) flood event. Additionally, loading at the levee toe occurs approximately at the 10% (10-year) flood event.
I-3-14
I-3-15
The historic flood on Cobb Creek since the levee was built occurred in 1968. This flood represents a loading to 75 percent of the levee height. Additionally the levee has been loaded to 25 percent of its height 8 times and 50 percent of its height during the 1995 flood in addition to the record flood. There is no superiority (designed overtopping section) included in the levee design. The most recent levee inspection rating is documented as “Minimally Acceptable”. Areas of concern are vegetation and the condition of the pipe drains. The riprap and revetments rating is “Minimally Acceptable”, as erosion protection features appear to be capable to operate as designed; however there are some small bushes and trees intermittently growing between rocks. The pipe drain rating is “Unacceptable”, due to no video taping, inoperable flap gates, and minor corrosion.
Geology Cobb Creek is located within a relative wide old river valley. The river that formerly flowed through the valley was up to 100 feet lower in elevation during a previous glacial period. The valley was subsequently filled with outwash deposits and river overbank, natural levee, and splay deposits. The creek currently meanders across the floodplain.
Embankment The levee embankment was constructed using locally available materials with 3:1 creek side slopes and 2:1 land side slopes. The crest of the levee is 10 feet wide in most locations. The levee embankment is reported to have a 3 foot thick clayey zone on the creek side of the levee.
Floodwall The floodwall is primarily a T-wall (6000 ft. long) with about 80 feet of I-wall at each end where it ties into the levees. The exposed portions of the T-wall sections are between 12 and 15 feet high, and are founded on large footings with sheet-piling to a depth of 12 feet below the base.
Closure Structures Two of the closures are 30 foot long rolling gates across County Road 26, one at the north end of Burtville, and the second at the south end of Ernieton. The other closure is a 100 ft wide post and panel closure across State Highway 18 east out of Ernieton before the bridge across Cobb Creek. The post and panel closure system is stored at the public works yard on the west side of Ernieton. It has been 17 years since the post and panel structure was set in place.
Penetrations The three pump stations are located approximately as shown on the sketch plan. The pump stations remove runoff from precipitation in the vicinity of Ernieton, and have a combined drainage area of about 6 square miles. All three pump stations have 60 inch outlet pipes through the levee embankment. The pump stations operate when the water level in Cobb Creek is above gauge level of -2 ft, which occurs about twice a year. The pumping stations are maintained by the Ernieton Public Works Department. One of the gravity drains is located on the south side of Burtville and is a cast in place concrete double box culvert. Each barrel of the culvert is 6 feet high and 8 feet wide with

I-3-16
flap valves on the creek side of the embankment. The second gravity drain is located about 2.5 miles south of Burtville in an agricultural area. This drain is an original 48 inch CMP pipe with a flap valve on the creek side of the levee. During the last annual inspection heavy corrosion of the CMP was visible from both ends. A six inch diameter “sinkhole” was noted near the creek side headwall during the annual inspection 5 years ago, and was reportedly backfilled prior to the next inspection. The water supply intake line for Ernieton is a 36-inch-diameter cast iron pipe that crosses below the floodwall at the location shown on the sketch plan. The water intake line takes water from Cobb Creek at about local gage level of -10 feet.
Performance During the 1968 flood event, areas of seepage and sand boils were described in the report on the flood, but locations, severity, and photographs were not provided. Documentation from other more recent flood fights is limited, but they do mention areas of seepage and sand boils. Areas of thick vegetation exist along the river side and land side toes of the levee, and in some locations small woody vegetation has been noted as being on the lower slopes of the levee in the rural portions of the levee. During the last annual inspection numerous fences and utility poles were noted along the land side toe of the levee within both Burtville and Ernieton. A backyard swimming pool was observed within 5 feet of the toe of the levee in Ernieton. The inspection noted many sets of stairs on both sides of the levee, from back yards to docks along Cobb Creek. The inspection also noted what appeared to be 3 relatively new auxiliary structures (garage or workshop buildings) that encroached into the levee embankment. In Ernieton a landscape materials supplier has constructed about 6 bins using the floodwall as the back of the bins. The bins were being used to store landscaping rock and mulch.
Leveed Area Burtville has an estimated population of 1500 residents. There is an elementary school, a fire station, and a sheriff’s substation within the town limits. The city also operates water and wastewater treatment facilities that support the local community. Many of the store fronts in the old downtown area are empty, and most residents go to Ernieton for retail services. Ernieton has an estimated population of 30,000. There are many small manufacturing and repair shops in town, which is the county seat and largest town within about 50 miles. Ernieton has a small police force, 4 fire stations, the main county sheriff’s office, and the county courthouse and jail. There are 4 elementary schools, two middle schools, and the county high school and sports complex. The old 50 room hospital which is being converted into an elder care facility is located along County Road 26 just north of the gate closure on the south side of the downtown commercial district. The new 100 room hospital and adjacent medical office building are located on the east side of town just west of the closure structure along the highway and both have views of Cobb Creek over the adjacent section of floodwall and through the closure structure. The rural agricultural area between Burtville and Ernieton, and the levee and the bluffs on the side of the valley has about 500 full time residents. A state park with about 60

I-3-17
camping spaces is located along the river about 2 miles south of Burtville. The camping spaces are split about evenly on both side of the levee, with an access road over the top of the levee. The park road over the levee also provides access to a public boat ramp, fishing area, and extensive trail system within the park. The main park services including bath house and toilet facilities for the campground are located on the landward side of the levee. One of the noted natural features within the park is an area referred to on the park map as the boils. The area contains at least 6 identified sand boils from the 1968 flood. The largest deposit from one of the boils is about 4 feet high and 10 feet in diameter.