i 1 ii !i cryogenic fluid film bearing i - nasai cryogenic fluid film bearing tester development...
TRANSCRIPT
If_
I
i
1
I
I
I
RSR-CO02-93
ii_!i
CRYOGENIC FLUID FILM BEARING
TESTER DEVELOPMENT STUDY
¸¸¸¸¸¸by
Joseph Ki Scharrer, editorBrian Ti Murphy
Lawrence A. Hawkins
ROTORDYNAMICS-SEAL RESEARCH
/
Prepared for
NATIONAL AERONAUTICS AND SPACE ADMINISTRATION
George C. Marshall Space Flight Center
June 1993
(NASA-Cq-1925Ao) CRYOGENIC FLUIDFILM _EARING TESTER DEVELOPMENT
STUOY Final Report, 16 Apr. - 16
Jun. 1993 (RotoFdynamics-Seal
Resedrch) 109 p
N94-12791
Unclas
G3/37 0180887
https://ntrs.nasa.gov/search.jsp?R=19940008319 2018-06-24T23:16:04+00:00Z
CONTENTS
1.0
2.0
3.0
4.0
INTRODUCTION
1.1
1.2
1.3
...................................... 1-1
ROTORDYNAMIC COEFFICIENTS ..................... 1-1
TRANSFER FUNCTION MEASUREMENT ................. 1-2
TEST APPARATUS FLEXIBILITY ...................... 1-2
SYSTEM CONSIDERATIONS
2.1
2.2
............................. 2-1
TESTER CONCEPTUAL DESIGN ...................... 2-1
TRANSDUCER SELECTION, INSTALLATION, ANDCALIBRATION ................................. 2-3
2.3 TEST PROCEDURE ............................... 2-4
2.4 CABLING AND SIGNAL CONDITIONING ................. 2-4
2.5 DATA ACQUISITION .............................. 2-4
2.6 DATA PROCESSING AND REDUCTION ................. 2-5
CANDIDATE DESIGNS
3.1 CONSIDERATIONS ABOUT OVERHUNG TESTERS ............
3.2 SLAVE BEARING CONSIDERATIONS .....................
3.3 CANDIDATE DESIGNS FOR EVALUATION .................
3.3.1 Floating Housing Rig With Magnetic BearingExciter/Support .............................. 3-4
3.3.2 Fixed Housing Rig With Magnetic BearingExciter/Support .............................. 3-6
Floating Housing Rig With Shakers ................ 3-6
Fixed Housing Rig With Shakers .................. 3-9
.................... 4-1
................................. 3-1
3-1
3-3
3-4
3.3.3
3.3.4
EVALUATION OF CANDIDATE DESIGNS.
FREQUENCY RESPONSE ANALYSIS .................... 4-1
4.1.1 Magnetic Bearing Supported/Excited Testers .......... 4-1
4.1.1.1 Floating Housing (1) .................... 4-4
4.1.1.2 Fixed Housing (2) ..................... 4-11
4.1

4.1.2 Shaker Excited Testers ....................... 4-26
4.1.2.1 Floating Housing (3) ................... 4-26
4.1.2.2 Fixed Housing (4) ..................... 4-26
4.1.3 Response Analysis Summary ................... 4-29
4.2 UNCERTAINTY ANALYSIS........................... 4-29
4.2.1 Magnetic Bearing Supported/Excited Testers ........ 4-31
4.2.1.1 Floating Housing (1)................... 4-31
4.2.1.2 Fixed Housing (2)..................... 4-33
4.2.2 Shaker Excited Testers....................... 4-37
4.2.2.1 Floating Housing (3) ................... 4-37
4.2.2.2 Fixed Housing (4) ..................... 4-37
4.2.3 Uncertainty Analysis Summary .................. 4-39
4.3 RELATIVE ROTOR/STATORTILT...................... 4-39
5.0 FACILITY REQUIREMENTS................................ 5-1
6.0
5.1
5.2
5.3
5.4
TEST METHOD ................................... 5-1
BEARING TYPE ................................... 5-1
TEST APPARATUS DESIGN ........................... 5-3
EXISTING MSFC TEST FACILITY CAPABILITIES ............. 5-4
6-1
COST .......................................... 6-1
6.1.1 Magnetic Bearing Supported/Excited Testers ......... 6-1
6.1.1.1 Floating Housing (1) .................... 6-1
6.1.1.2 Fixed Housing (2) ....................... 6-3
6.1.2 Shaker Excited Testers ........................ 6-4
6.1.2.1 Floating Housing (3) ..................... 6-4
6.1.2.2 Fixed Housing (4) ....................... 6-5
SCHEDULE ..................................... 6-5
6.2.1 Magnetic Bearing Supported/Excited Testers ......... 6-5
6.2.1.1 Floating Housing (1) ................... 6-5
6.2.1.2 Fixed Housing (2) ..................... 6-7
DEVELOPMENT PROGRAM CONSIDERATIONS .................
6.1
6.2
°°°
III
7.0
8.0
6.2.2 Shaker Excited Testers ....................... 6-7
6.2.2.1 Floating Housing (3) ................... 6-7
6.2.2.2 Fixed Housing (4) ..................... 6-7
CONCLUSIONS AND RECOMMENDATIONS ................... 7-1
7.1 CONCLUSIONS .................................. 7-1
7.2 RECOMMENDED TESTER ............................ 7-1
REFERENCES ........................................ 8-1
APPENDIX 1 SURVEY OF ROTORDYNAMIC COEFFICIENT EXTRACTION
TECHNIQUES ....................................... A-1
iv

FIGURES
1-1
3-1
3-2
3-3
3-4
3-5
4-1
4-2
4-3
4-4
4-5
4-6
4-7
4-8
4-9
Experimental fluid film bearing transfer function ................ 1-3
Example overhung test rig ............................... 3-2
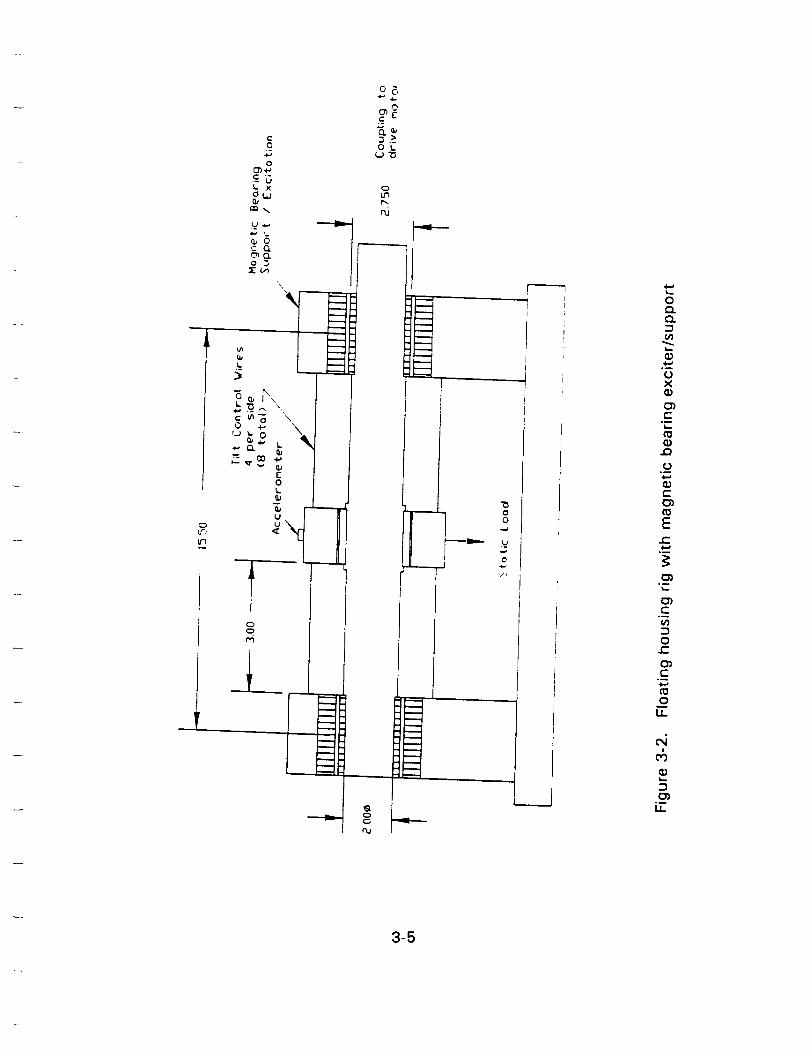
Floating housing rig with magnetic bearing exciter/support ......... 3-5
Fixed housing rig with magnetic bearing exciter/support ........... 3-7
Floating housing rig with shakers ............. : ............ 3-8
Fixed housing rig with shakers ........................... 3-10
Stiff magnetic bearing transfer function used in analysis ........... 4-2
Soft magnetic bearing transfer function used in analysis ........... 4-3
Relative test article response for floating housing/magnetic
bearing rig, 2" journal, 200,000 Ib/in test article, stiff
magnetic bearing ..................................... 4-5
Test article acceleration for floating housing/magnetic bearing
rig, 2" journal, 200,000 Ib/in test article, stiff magnetic
bearing ............................................ 4-6
Test article load for floating housing/magnetic bearing rig, 2"
journal, 200,000 Ib/in test article, stiff magnetic bearing .......... 4-7
Relative test article response for floating housing/magneticbearing rig, 2" journal, 200,000 Ib/in test article, soft
magnetic bearing ..................................... 4-8
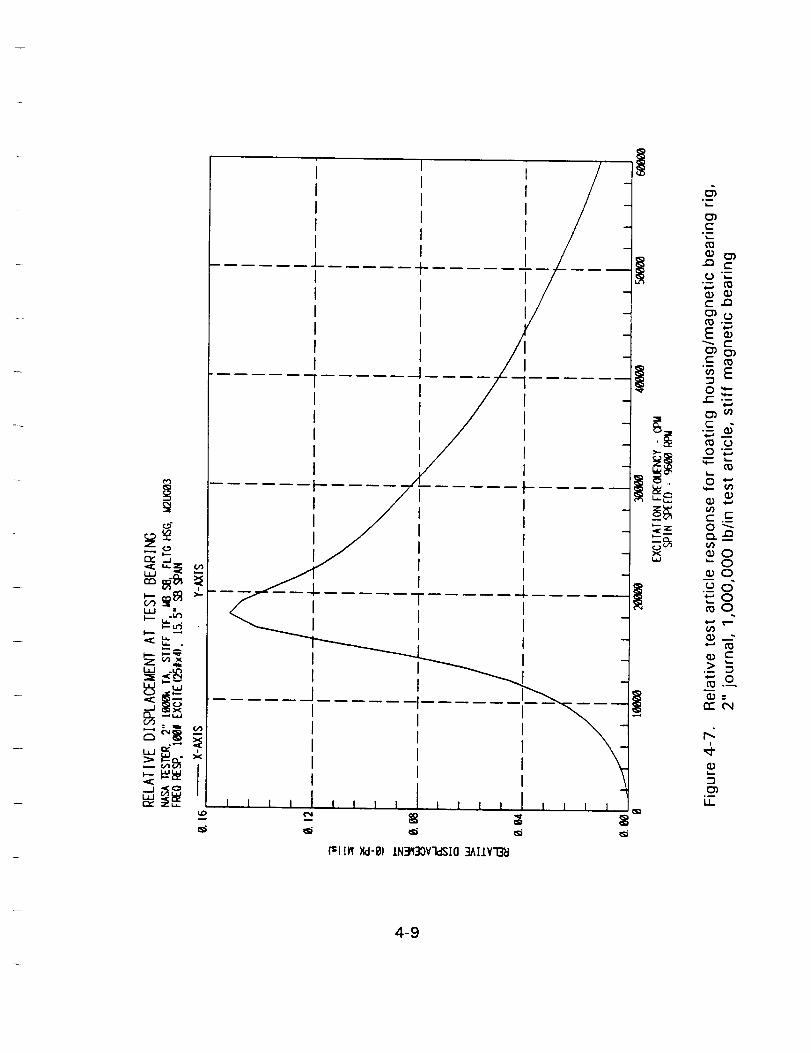
Relative test article response for floating housing/magnetic
bearing rig, 2" journal, 1,000,000 Ib/in test article, stiff
magnetic bearing ..................................... 4-9
Relative test article response for floating housing/magnetic
bearing rig, 2" journal, 1,000,000 Ib/in test article, soft
magnetic bearing .................................... 4-10
Relative test article response for floating housing/magnetic
V

4-10
4-11
4-12
4-13
4-14
4-15
4-16
4-17
4-18
4-19
4-20
bearing rig, 6" journal, 200,000 Ib/in test article, stiff
magnetic bearing .................................... 4-12
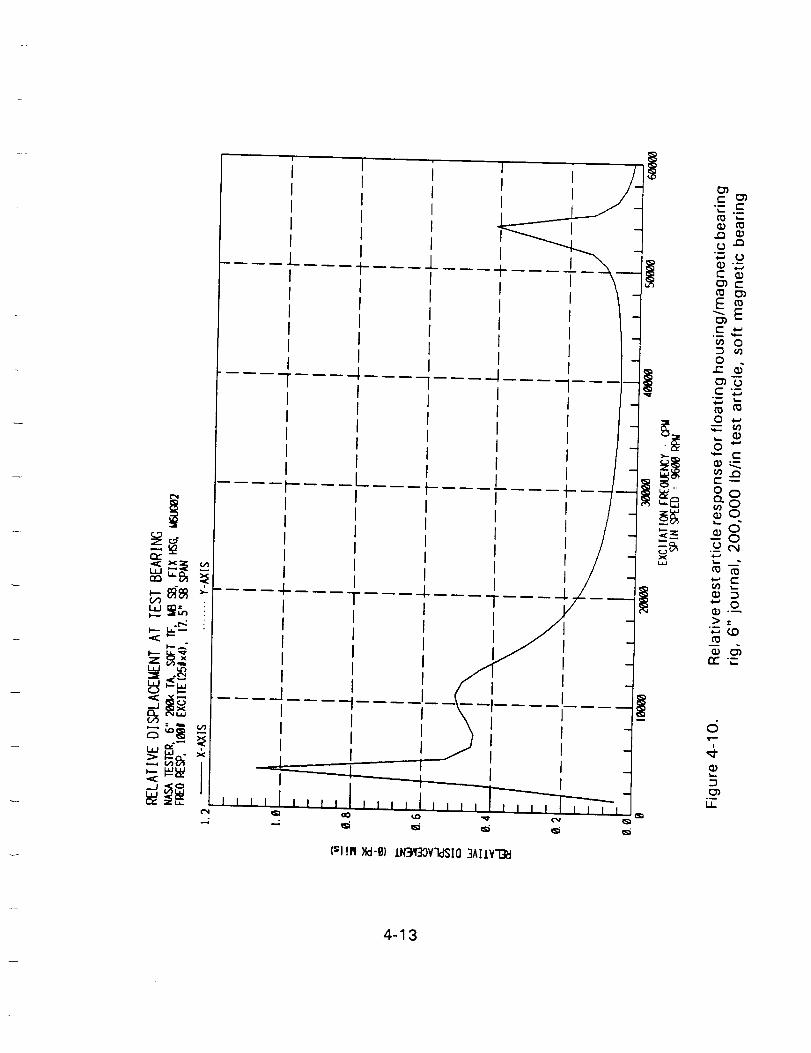
Relative test article response for floating housing/magneticbearing rig, 6" journal, 200,000 Ib/in test article, soft
magnetic bearing .................................... 4-13
Relative test article response for floating housing/magnetic
bearing rig, 6" journal, 1,000,000 Ib/in test article, stiff
magnetic bearing .................................... 4-14
Relative test article response for floating housing/magnetic
bearing rig, 6" journal, 1,000,000 Ib/in test article, soft
magnetic bearing .................................... 4-15
Relative test article response for fixed housing/magneticbearing rig, 2" journal, 200,000 Ib/in test article, stiff
magnetic bearing .................................... 4-16
Test article acceleration for fixed housing/magnetic bearing
rig, 2" journal, 200,000 Ib/in test article, stiff magneticbearing ........................................... 4-17
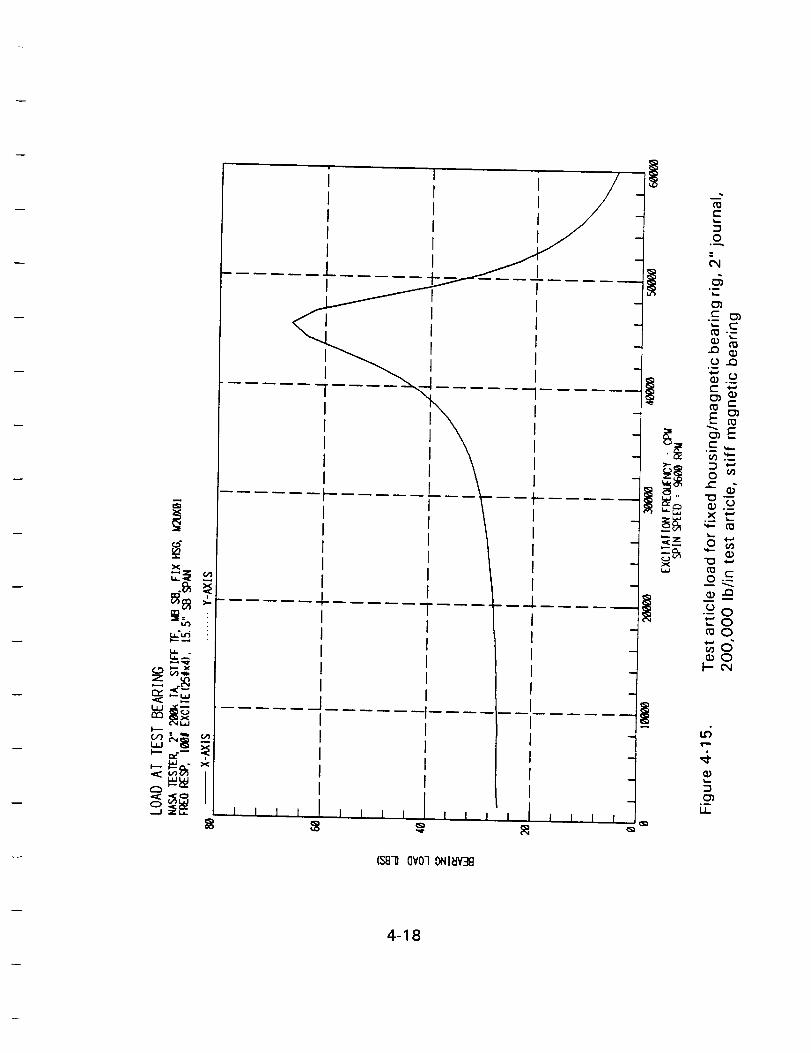
Test article load for fixed housing/magnetic bearing rig, 2"
journal, 200,000 Ib/in test article, stiff magnetic bearing ......... 4-18
Relative test article response for fixed housing/magnetic
bearing rig, 2" journal, 200,000 Ib/in test article, soft
magnetic bearing .................................... 4-19
Relative test article response for fixed housing/magnetic
bearing rig, 2" journal, 1,000,000 Ib/in test article, stiff
magnetic bearing .................................... 4-20
Relative test article response for fixed housing/magneticbearing rig, 2" journal, 1,000,000 Ib/in test article, soft
magnetic bearing .................................... 4-21
Relative test article response for fixed housing/magneticbearing rig, 6" journal, 200,000 Ib/in test article, stiff
magnetic bearing .................................... 4-22
Relative test article response for fixed housing/magnetic
bearing rig, 6" journal, 200,000 Ib/in test article, soft
vi
4-21
4-22
4-23
4-24
4-25
4-26
4-27
4-28
4-29
4-30
4-31
magnetic bearing .................................... 4-23
Relative test article response for fixed housing/magnetic
bearing rig, 6" journal, 1,000,000 Ib/in test article, stiff
magnetic bearing .................................... 4-24
Relative test article response for fixed housing/magnetic
bearing rig, 6" journal, 1,000,000 Ib/in test article, soft
magnetic bearing .................................... 4-25
Relative test article response for floating housing/shaker rig,
3" test article, 250k - 750k Ib/in test article, stiff slave
bearing ........................................... 4-27
Test article load for floating housing/shaker rig, 3" test
article, 250k - 750k Ib/in test article, stiff slave bearing .......... 4-27
Relative test article response for fixed housing/shaker rig, 3"test article, 250k - 750k Ib/in test article, stiff slave
bearing ........................................... 4-28
Test article load for fixed housing/shaker rig, 3" test article,
250k - 750k Ib/in test article, stiff slave bearing ............... 4-28
Test rig schematic for uncertainty analysis, a) floating
housing rigs, b) fixed housing rigs ......................... 4-30
Uncertainty in amplitude and phase, floating housing/magnetic bearing rig, 2" journal, 200k Ib/in test article,
stiff mag brg ....................................... 4-32
Uncertainty in amplitude and phase, floating housing/
magnetic bearing rig, 2" journal, 1,000k Ib/in test article,
stiff mag brg ....................................... 4-34
Uncertainty in amplitude and phase, fixed housing/magneticbearing rig, 2" journal, 200k Ib/in test article, stiff mag
brg .............................................. 4-35
Uncertainty in amplitude and phase, fixed housing/magnetic
bearing rig, 2" journal, 1,000k Ib/in test article, stiffmag brg ........................................... 4-36
vii

4-32
4-33
4-34
5-1
6-1
6-2
6-3
6-4
Uncertainty in amplitude and phase, floating housing/shakerrig, 3" test article, 250k - 750k Ib/in test article, stiff
mag brg ........................................... 4-38
Uncertainty in amplitude and phase, fixed housing/shaker rig,
3" test article, 250k - 750k Ib/in test article, stiff magbrg .............................................. 4-40
Tilt ratio comparison; floating versus fixed housing ............. 4-41
Time domain depiction of potential excitation signals ............. 5-2
Schedule for magnetic bearing tester with floating housing ......... 6-6
Schedule for magnetic bearing tester with fixed housing ........... 6-8
Schedule for shaker excited tester with floating housing ........... 6-9
Schedule for shaker excited tester with fixed housing ........... 6-10
VIII

TABLES
6-1 Cost estimates for candidate designs ......................... 6-2
7-1 Summary comparison ................................... 7-2
ix

1.0 INTRODUCTION
Rolling element bearings have a DN (Diameter in mm X Speed in rpm) limit ofapproximately 2-2.5 X 10 8 and require lubrication to achieve a reasonable operational
life. Fluid film bearings do not have a DN limit and offer life and speed characteristics
which are unachievable with rolling element bearing technology. In order to unlock
the potential of fluid film bearings for cryogenic turbomachinery applications, research
is required to define their characteristics in the cryogenic environment. This research
should include materials evaluation, steady-state performance, and rotordynamiccoefficients.
The determination of rotordynamic coefficients is important for the development
of new bearing technologies, validation of analytical models, and the application ofbearing technology to high speed rotating machinery. While fluid film bearings hold
great potential for long life, low cost, and reliable operation, there is a general dearth
of experimental data for their rotordynamic performance. This is especially true of foil
bearings and other bearings operating in cryogens.
This report documents the results of a study to define the conceptual design
of a test apparatus and associated facility for the identification of rotordynamic
coefficients of fluid film bearings in a cryogenic environment.
1.1 ROTORDYNAMIC COEFFICIENTS
Historically, for rotordynamics, bearing testing has had the objective of
determining the coefficients in the following bearing force-displacement model:
+-/_+E'xx (Z)
where (X,Y,X,_,_,_ are the rotor displacements, velocities and accelerations. (F_,Fy) arethe fluid film forces acting on the rotor, and (K,C,M) are the stiffness, damping, and
inertia coefficients of the fluid film, respectively.
For bearings with a large length to diameter ratio a more extensive force-displacement model may be required which takes into consideration angular rotation
of the shaft. This force/moment-displacement/rotation model is expressed in the
following form:
1-1

g. K.J x e.
c I .IM ,. M,,,M,,,
c'J;1l:.,'"""'Cpp _ Mpy Mp, Mpp]"-'
(2)
1.2 TRANSFER FUNCTION MEASUREMENT
The aforementioned force-displacement models of Equations 1 and 2 are linear
models. The term linear refers to the inherent assumption that the force coefficients
K,C, and M are not frequency dependent. It is not good practice to assume the
characteristics of data ahead of time. In some cases, such as gas hydrostaticbearings and magnetic bearings, analysis will indicate ahead of time that the linear
model may not apply. Therefore, the actual measurement objective for dynamic
testing of bearings (and also seals) is the transfer function. Equation 1 can berewritten in terms of the complex transfer function as follows:
(3)
where (for the linear model of Equation 1)
Hw=Kq-,o2M +E,oC,j
Once obtained from test data, the transfer functions will determine whether or not the
linear model applies. If the linear model does apply, the K,C,M coefficients can be
obtained using linear and polynomial curve fits of the transfer function data. If the
linear model does not apply, the transfer function information is used in the
rotordynamic analysis in place of stiffness, damping, and mass coefficients. An
example set of transfer functions for fluid film bearing testing is shown in Figure 1-1.
A similar expression can be developed for the more complicated model of Equation 2.
1.3 TEST APPARATUS FLEXIBILITY
When developing a test apparatus for fundamental research it is important to
make the apparatus as flexible as possible. The test results, and not test rig design,
must determine what characteristics are important. The evolution of bearing and sealtesting for rotordynamic coefficients has demonstrated that limitations in test rig
design because of preconceived notions about the relative importance of certain
characteristics has rendered useless (or suspect) much of the available data.
1-2

CY
'ii,,,.,,,,wlv,
_ § _ _ oN
(_IN_) (H)U_I
II I:A!i8
! ! I(*=/N_.) (_)_
A
0')
>
0
E9
¢-0
°_
c-
C
E
o_
C
E
XU.I
o_
U.
1-3
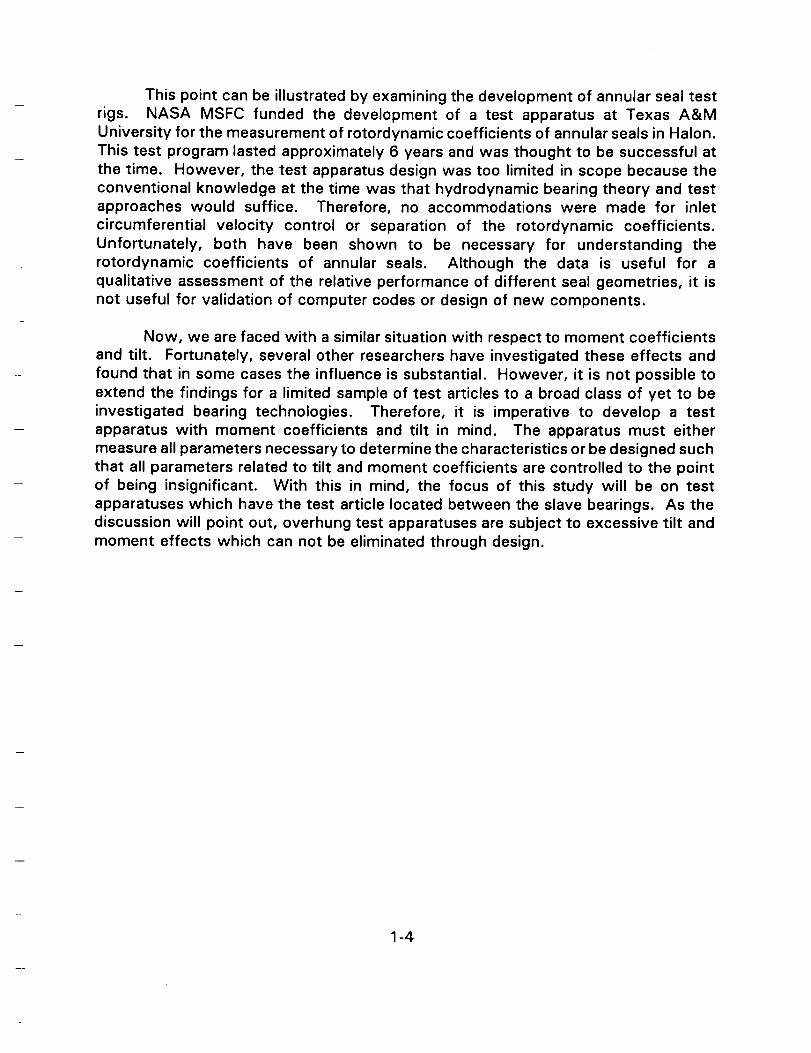
This point can be illustrated by examining the development of annular seal testrigs. NASA MSFC funded the development of a test apparatus at Texas A&M
University for the measurement of rotordynamic coefficients of annular seals in Halon.
This test program lasted approximately 6 years and was thought to be successful at
the time. However, the test apparatus design was too limited in scope because the
conventional knowledge at the time was that hydrodynamic bearing theory and testapproaches would suffice. Therefore, no accommodations were made for inlet
circumferential velocity control or separation of the rotordynamic coefficients.
Unfortunately, both have been shown to be necessary for understanding the
rotordynamic coefficients of annular seals. Although the data is useful for a
qualitative assessment of the relative performance of different seal geometries, it is
not useful for validation of computer codes or design of new components.
Now, we are faced with a similar situation with respect to moment coefficients
and tilt. Fortunately, several other researchers have investigated these effects and
found that in some cases the influence is substantial. However, it is not possible to
extend the findings for a limited sample of test articles to a broad class of yet to be
investigated bearing technologies. Therefore, it is imperative to develop a test
apparatus with moment coefficients and tilt in mind. The apparatus must either
measure all parameters necessary to determine the characteristics or be designed suchthat all parameters related to tilt and moment coefficients are controlled to the point
of being insignificant. With this in mind, the focus of this study will be on test
apparatuses which have the test article located between the slave bearings. As thediscussion will point out, overhung test apparatuses are subject to excessive tilt and
moment effects which can not be eliminated through design.
1-4

2.0 SYSTEM CONSIDERATIONS
The test measurement system includes many components both within andexternal to the apparatus. Due to the difficulty of the task at hand, all componentsmust be designed and/or selected for optimum performance to achieve acceptableexperimental uncertainties. It is fair to say that the measurement system is like achain, and is only as strong as its weakest link. This section briefly discusses thelinks that form the chain, and some of the primary factors that go into each.
2.1 TESTER CONCEPTUAL DESIGN
Selection of a basic tester concept is probably the most important decision in
the conceptual design phase of an apparatus for rotordynamic coefficient testing. Toa very large extent this determines, among other things, tester functionality, cost,
suitability, ease of use, and overall uncertainty in the experimental result. A variety
of alternative tester concepts can be found in the open literature as both basic and
applied research of this type has taken place in the U.S. and around the world (see
APPENDIX 1). A thorough discussion of each application is beyond the scope of this
effort. There are different ways to classify testers. Some of these are:
test article location
overhung
centrally mounteddynamic excitation source
shaker, independently controlled
electrodynamichydraulic
magneticmechanical (i.e., ball vibrolator)
synchronous unbalance or eccentricity
asynchronous unbalance or eccentricity
impulse hammer
step input (eg., strap)point of application of dynamic excitation
test article housing
directly on shaft
indirectly on shaft through a bearing
support bearing
auxiliary (non-support) bearingload measurement scheme
reaction force within test article stator
dynamic model matching from response only
simple - rigid test article housing
2-1

complex - flexible test shaftforce input measurement (usually involves some model matching,
minimal to extensive)film pressure integration
test article support
fixed housing
floating housingtype of test article
rolling element bearing
fluid film bearing
magnetic bearingseal
test conditions
low/high test shaft rotational speed
low/high test frequency range
cryogenic/ambient/high temperatures or multiple
low/high feed flow rateslow/high pressures (inlets, deltas, films, etc.)
presence of thrust reactionlinear/nonlinear conditions
deadband clearances
large displacementscavitation
structural
transient/steady state
condition matching (do speeds, loads, pressures, temperatures,
etc., match or scale with the target application)
This is just a sampling of some of the factors that differentiate the manyapproaches to rotordynamic coefficient testing. There are numerous interrelated pros
and cons for each. Another basic consideration is the overall goal of the test
program. The primary goal may be tester accuracy. Or perhaps versatility is
paramount such that accuracy is compromised so that test articles can be more easily
interchanged. Cost is always a factor, and whether it is realized or not, budget
constraints can and do affect the accuracy of the experimental result. More oftenthan not the number one trade off is between accuracy and everything else. Only
through a thorough understanding of all facets of rotordynamics and test methods can
meaningful accuracy be attained while adhering to the constraints of the test program.
2-2

2.2 TRANSDUCER SELECTION, INSTALLATION AND CALIBRATION
Ideally transducer selection should be an integral part of tester conceptual
design. For example, standard series Bently Nevada proximeter probes are often used
to measure shaft motion. For many tester applications that motion is on the order of
several hundred microinches, or less. Due consideration need be given to the fact that
such probes are generally considered to have a resolution of roughly 50 microinches.
Thus, 200 microinches can only be measured accurately with a 50 microinch device
if it is calibrated and applied correctly. Experience has shown that the use of higher
gain proximeters can, and does, greatly enhance resolution. But the corresponding
reduction in useful transducer measurement range can make it very difficult, if not
impossible, to obtain useful readings. Installation of displacement probes should
always be done a quad fashion (4 per plane). For static measurements this allows the
cancellation of thermal drift, and centrifugal/thermal/pressure growth. For dynamic
testing it reduces random measurement errors. Proximeter probe calibration should
always be performed at the temperature and pressure to which their subjected. Also,
calibrations should be dynamic, not just static, since gain and phase lag in eddy
current probes have been measured by the authors to be frequency dependent to aconsiderable extent.
Accelerometers also are usually a critical part of the test measurement system.
Their selection is usually a trade off on size, sensitivity, and range. Proper attention
to their installation is also important, especially in high flow fluid bearing testers.
Since flow turbulence beyond the test frequency measurement range can cause full
or partial saturation of the accelerometer electronics. Like displacement proximeters,
accelerometers should be mounted in redundant arrays to reduce random
measurement errors. Accelerometer calibrations are generally performed only for
amplitude sensitivity. For rotordynamic coefficient measurements, it is imperative that
they also be phase calibrated.
For many tester concepts dynamic loads are measured with load cells.
Piezoelectric load cells potentially offer greatly enhanced accuracy and range overother types of sensors. Like proximeter probes, load cells generally are calibrated only
for load sensitivity. For this application calibrations need to be for sensitivity and
phase, both as functions of frequency. Their installation requires tight machining
tolerances on the mating parts which they contact. Also, their installation needs to
be assessed from the standpoint of incremental Ioadings brought on by thermal and
pressure effects at test conditions. For cryogenic applications, the installation andlocation of piezoelectric load cells must be done carefully. Dynamic testing of
piezoelectric load cells by the authors in both liquid helium and liquid nitrogen showed
that the crystal would delaminate or crack under low cycle load conditions.Piezoelectric load cells must be preloaded accurately and maintain a known preload
during operation. Therefore, piezoelectric load cells must be insulated from the
cryogenic test fluid to avoid changes in preload during operation and possible failure.
2-3

2.3 TEST PROCEDURE
The test procedure is generally a direct consequence of the tester concept being
used, and the mode of operation of the facility. The effect on experimentaluncertainty comes about from the direct influence on what kind of data, and how
much, is acquired for a given test article operating condition. Tester design largely
determines what kind of data can be acquired, and this is a major factor inestablishing potential bias errors which cannot be "corrected" or "calibrated" out.
The "quantity" of data that can be obtained for any single test condition directlyinfluences random errors in the experimental result. Test time made available at any
given test condition is strongly influenced by the type of facility (continuous closed
loop vs blow down). Cost is also an obvious factor. Repeating a test, or simplyrunning it for a longer length of time, increases confidence and lowers random errors
(practically the same thing).
2.4 CABLING AND SIGNAL CONDITIONING
Transducer cabling and signal conditioning equipment are often not considered
for their effect on experimental uncertainty. Normally, cabling is not a factor as long
the usual precautions are taken to prevent tribological effects in the case of capacitive
transducers, and good connections are always verified. Signal conditioning equipmentlike amplifiers and filters should be treated like any high frequency transducer. They
should be calibrated for their amplitude and phase characteristics as functions offrequency.
2.5 DATA ACQUISITION
In modern day test labs, data is acquired with computer systems using highspeed analog to digital converters. This avoids the use of FM tape recorders which
potentially can introduce large errors in rotordynamic coefficients. The dataacquisition system is one of the most important "links" in the overall chain of the test
system. It must be accurate, it must have adequate precision, and these must be
verified by thorough calibration. A computerized data acquisition system is mostlyjust a fast digital volt meter with multi-channel and self storage capability. But in
addition to that it has integral parts such as a high speed clock and bank of analog
filters. Calibration of the acquisition system should verify the high frequency
characteristics of both gain and phase for the complete system.
Quite often, the calibration of the whole multi-channel instrumentation system,
except the transducers themselves, can be done at one time. This is accomplishedby passing an appropriate broadband calibration signal simultaneously through all
cabling and signal conditioning equipment, and recording the signal with all channels
2-4

of the acquisition system. This "measurement" provides the means to calibrate the
complete system for amplitude and phase across the entire test frequency range.
2.6 DATA PROCESSING AND REDUCTION
In rotordynamic coefficient testing the data processing phase is the final step
to obtaining the desired experimental result. That is to essentially calculate the
rotordynamic coefficients from a multitude of data channels. In addition to simply
producing measured estimates of the rotordynamic coefficients, the calculationmethod should suppress the effects of noise and minimize uncertainties. It is often
overlooked that the calculation method itself has the potential to either magnify orreduce experimental uncertainties, and this applies to both bias and random errors in
the rotordynamic coefficients.
To make the most of this opportunity to reduce errors requires a thoroughknowledge of digital signal analysis techniques and methods. For example, there are
multiple ways to compute the stiffness from a pair of load and deflection
measurements. Under ideal circumstances it rarely matters which method is used.
When test conditions are less than ideal, such as in the presence of significant
instrumentation noise or other types of noise, there are methods which are specifically
optimized to reduce, of not eliminate, the effect of various types of noise.
2-5

3.0 CANDIDATE DESIGNS
Numerous tester designs for measuring rotordynamic coefficients have been
published in the open literature. Nearly all such testers fall into one of two broad
categories: overhung or centrally mounted. This refers to the location of the test
article (seal, bearing or impeller) with respect to the support bearings (also called slave
bearings). A vast majority of the testers in existence are of the centrally mountedvariety. This is a natural consequence of the pros and cons that apply to each
concept. Without attempting a complete treatise on the subject, the following table
suggests some of the more significant pros and cons:
Tester Concept Type
Centrally Mounted Overhung
PROS • immune to shaft tilt • Easy to change test articles• slave bearings loaded leas than test article
CONS • interchanging test articles can be time consuming • Subject to errors associated with shaft tilt
• Slave bearing(s) loaded more than test article
3.1 CONSIDERATIONS ABOUT OVERHUNG TESTERS
An example overhung test apparatus is shown in Figure 3-1. One of the points
brought out in the table is that tilt of the test shaft has a detrimental affect. For test
articles having an axial length as much or more than the shaft diameter, moments
produced by tilt of the shaft can be significant. If measurement of moment
coefficients is beyond the scope of the test program, it is important to minimize theirpotential effect. The only sure way to accomplish this is to preclude the presence of
tilt of the test shaft at the test article location. This is best done by positioning the
test article midway between two slave bearings. Overhung test articles, on the other
hand, are particularly prone to the effect of shaft tilt. This effect, should it occur, can
have serious consequences when trying anchor analytical models to test data
unknowingly influenced by the presence of fluid film moments produced by tilt.
Another point brought out in the table is the loading to which the slave bearingswill be subjected. When testing bearing concepts for advanced turbopump designs,
the high operating DN's and large working loads can be beyond the capability of
mechanical bearings. This usually suggests the use of fluid film bearings. Testing
such a bearing will require rather large flow rates of working fluid at extremely high
pressure. This creates a problem for slave bearing design because there may not be
enough high pressure flow capacity to supply two fluid film slave bearings and a testbearing. So the natural slave bearing choice would seem to be ball bearings, except
that the speed and load conditions are so severe. One thing that can be done is to
minimize the loads to which the slave bearings are subjected. The centrally mounted
tester concept accomplishes this by sharing the test bearing load bewteen two slave
3-1

\
3-2.
.m
f_
C_c-
(...
>0
E
XW
u_

bearings. In an overhung tester the near slave bearing actually experiences more loadthan the test bearing.
The last point brought in the table is the aspect of test article interchangeability.
The primary advantage of the overhung concept is the relative ease with which the
test article can be removed and replaced. For the centrally mounted concept utilizing
rolling element bearings, removing the test article either requires horizontally split
bearing housings, or removal of one slave bearing pedestal. If magnetic or fluid film
bearings are used with the centrally mounted concept, the shaft can be easilyremoved for access to the test article.
3.2 SLAVE BEARING CONSIDERATIONS
The type and characteristics of slave bearings has a profound influence on the
development of not only the test apparatus, but the entire facility. The overallaccuracy and quality of the test results obtained from the test apparatus are heavily
dependent on the dynamic characteristics of the rotor-bearing-test article system. If
at all possible, the slave bearing rotordynamic characteristics should remain constantfor all test conditions. For cryogenic testing, this is a very difficult requirement tomeet.
Fluid film bearing rotordynamic characteristics are very clearance and fluid
viscosity dependent. It is nearly impossible to design a fluid film bearing which will
have the same or similar rotordynamic characteristics for operation at room
temperature, LOX temperature, and LH2 temperature. If fluid film slave bearings are
preferred, different geometries will have to be designed and fabricated for each
temperature and fluid condition. Otherwise, the different dynamic and load
characteristics will have to be accounted for by changing the test method and data
reduction procedure for each test condition. The facility requirements for fluid film
slave bearings are as extensive as for the test article and will severely limit test time
in a blow down facility.
Rolling element bearing rotordynamic characteristics are less sensitive to testfluid properties than fluid film bearings. However, they are sensitive to changes in
bearing deadbando It may be possible to arrive at 2 rolling element bearing designs
which will suffice; one for cryogenic and one for room temperature. Considering the
range of test fluids and temperatures that this test apparatus must accommodate, the
rolling element bearing is preferred over the fluid film bearing. Also, the facility
requirements for rolling element bearings are much less than for fluid film bearings.
Magnetic bearings offer the greatest flexibility for this type of test apparatus.
They are relatively insensitive to speed and temperature changes and can provide the
same dynamic characteristics for all test conditions. In fact, the magnetic bearing canfunction as the exciter, eliminating the need for shakers. Magnetic bearings also
3-3

provide the simplest means for measuring the effects of tilt and moment coefficients.
The facility requirements for magnetic bearings are minimal.
3.3 CANDIDATE DESIGNS FOR EVALUATION
The previous discussion has shown that apparatuses with overhung test articleshave many deficiencies which limit their usefulness and quality of data. By
comparison, apparatuses with centrally mounted test articles are more likely to
produce accurate data. Furthermore, fluid film slave bearings may be too sensitive to
thermal conditions and fluid properties to function reliably over the entire range ofexpected tester conditions. Based on these arguments, further discussion and
analysis will be limited to apparatuses with centrally mounted test articles utilizingrolling element or magnetic slave bearings. The four candidate configurations are:
1
2
3
4
Floating Housing Rig With Magnetic Bearing Exciter/Support
Fixed Housing Rig With Magnetic Bearing Exciter/Support
Floating Housing Rig With ShakersFixed Housing Rig With Shakers
3.3.1 Floating Housing Rig With Magnetic Bearing Exciter/Support. A concept sketch
of this rig is shown in Figure 3-2. The stator or housing of the test article is
supported only by the fluid film bearing to be tested (the test article). The stator is
held parallel to the initial shaft centerline by tilt control wires that have a negligible
lateral stiffness. Magnetic bearings are used as both slave bearings and an excitation
source. The excitation force is input to the shaft at the slave bearings and the
reaction force is measured by measuring the acceleration of the floating housing. This
approach eliminates thermal difficulties associated with load cells in a cryogenictester. A static load can be applied through a cable attached directly to the floating
housing. The static load is supplied by a pneumatic cylinder through an isolationspring to the cable. The tilt control wires can also be used to add intentional tilt to
the housing to determine the effect of static tilt on the transfer function to bemeasured.
While this tester concept may eliminate most or all of the thermal constraints
of load measurement, it falls short in its ability to control the dynamic motion at thetest article. For this concept to be successful, multiple arrays of accelerometers must
be placed carefully on the test article and sophisticated calibration and data reduction
techniques developed. This design will not be able to generate data for thedetermination of moment coefficients.
3-4
0
C
0
U
00
r,i
m
o6
0 _.
0Un
nj
-[ _------4•.._ I-.----_•-_ I.-.----_
•_ _.--.--4•-i [--...4
1-!
--4.i..._.,...._
.,....._
...----.d-,mid...,..,_......_
/
0
0
i/,
0
£0.
_a°_
£Jx
c_t--._-to
o._
c-C_
Et-
.__
t-
0f--
c
0u_
ii
3-B

3.3.2 Fixed Housing Rig With Magnetic Bearinq Exciter/Support. This rig, shown in
Figure 3-3, is similar to the floating housing rig (1) except that the test article statoris firmly supported by a pedestal. A thermally resistant material is used to isolate aload cell table in the pedestal used to measure test article load. Accelerometers are
used to correct for stator inertia force. The excitation force is applied directly to the
shaft at the slave bearings. A static load can be applied using the magnetic bearings
or by moving the tester support. Using two independently adjustable, symmetricallymounted magnetic bearings makes it possible to prevent dynamic tilt (a common
problem with fixed housing test rigs). This tester works best with a stiff shaft.
This concept attempts to address every major issues facing the developmentof a new cryogenic bearing test apparatus. The magnetic slave bearings provide
temperature independent support and excitation, the load cell table is thermallyisolated, the magnetic bearings are capable of exciting the shaft in every conceivable
manner, and test article access is simplified by removing the shaft. The combination
of the load cell table and magnetic bearing excitation at the slave bearings will enablethe determination of all force and moment coefficients.
3.3.3 Floating Housing Rig With Shakers. This type of rig is the most common for
measuring rotordynamic coefficients for fluid film bearings. A somewhat standard
design has evolved over the past several years as researchers have perfected the test
technique for journal bearings. A concept sketch of this type of tester is shown in
Figure 3-4. The excitation force is applied to the floating stator through a load cell.
Stator mounted accelerometers are used to correct for stator inertia. Although acalibrated hammer can be used as the excitation source, hydraulic shakers are more
common due to the flexibility they provide in controlling the spectral content of the
input signal. As with tester (1), the static load can be applied through a cableattached to the floating housing, and tilt control wires can be used to hold the housing
parallel to the initial shaft centerline or provide intentional static tilt.
The major concerns about this type of tester design are tilt/moment control and
isolation of the load cell in the cryogenic environment. The load cell is mounted ona stinger between the shaker head and the test article. For extreme environments,
design difficulties may occur when trying to keep the load cell and shaker head at a
safe temperature while limiting the dynamic and mass characteristics of the stinger
and related insulation. This design will not be able to generate data for thedetermination of moment coefficients.
3-6

t
c
P_
o
c_
_W
a_
C0
t1T
o_
_0c f"
0 _,.U'O
eu
eu
y-
0
Lnw
C
.C 0_j
tl,
JY0r..
C)r_i-i,-1
04
{..,Z
0Q.Q.
,i.a
£bX
(-°_
¢-
E(-
r-°_
Q
u.
d_
U.
3-7

CD
CU
=_>_0 _.
t_t"
t"°m
t-°--
0t--
o3c
.w
t00
I.l.
!
tO
o_
I.I..
$8
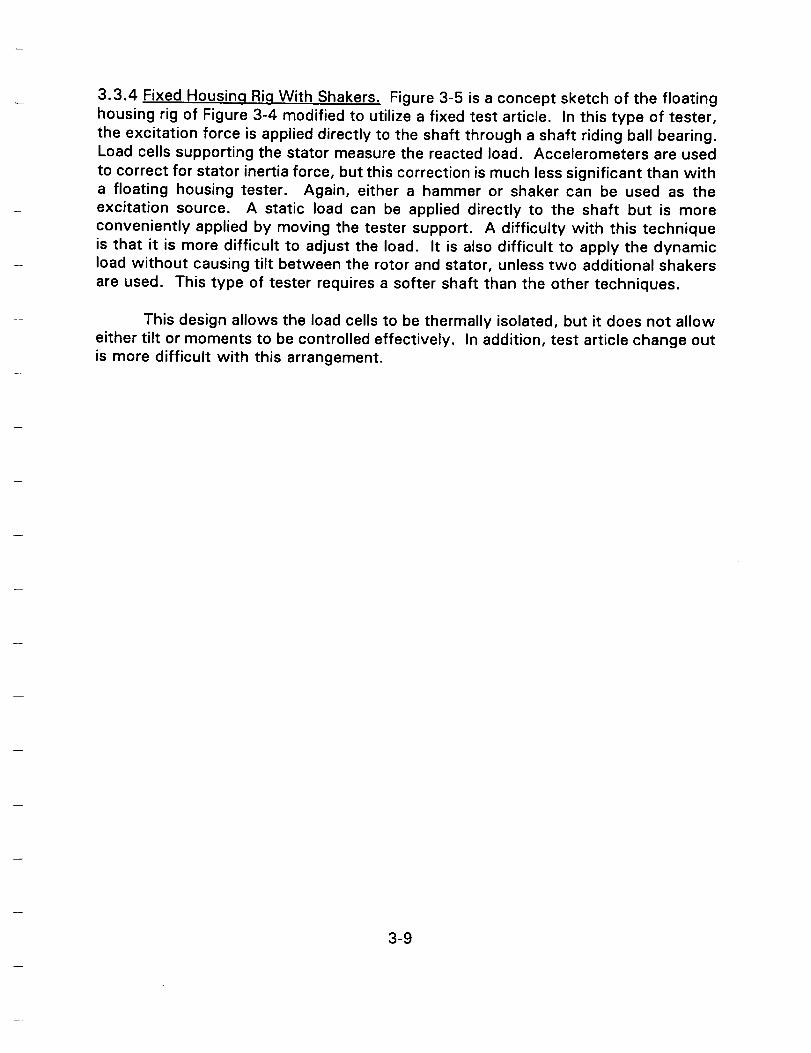
3.3.4 Fixed Housin.q Rig With Shakers. Figure 3-5 is a concept sketch of the floatinghousing rig of Figure 3-4 modified to utilize a fixed test article. In this type of tester,
the excitation force is applied directly to the shaft through a shaft riding ball bearing.Load cells supporting the stator measure the reacted load. Accelerometers are used
to correct for stator inertia force, but this correction is much less significant than witha floating housing tester. Again, either a hammer or shaker can be used as the
excitation source. A static load can be applied directly to the shaft but is more
conveniently applied by moving the tester support. A difficulty with this technique
is that it is more difficult to adjust the load. It is also difficult to apply the dynamicload without causing tilt between the rotor and stator, unless two additional shakers
are used. This type of tester requires a softer shaft than the other techniques.
This design allows the load cells to be thermally isolated, but it does not allow
either tilt or moments to be controlled effectively. In addition, test article change out
is more difficult with this arrangement.
3-9

_o_.>.0
0r,.
r__4
z
uo
E
c o
c-
e-
e,-o_
0r-
X._ii
u_
LL
3-10

4.0 EVALUATION OF CANDIDATE DESIGNS
Frequency response and uncertainty analyses were performed for the twomagnetic bearing supported testers to determine how they should be applied. The
results of a previous analysis of the two shaker excited testers for a NASA funded
SBIR (Imlach and Hawkins, 1992) were reviewed also. A finite element model was
built for each tester concept. Using these models, linear frequency response analyses
were performed using standard rotordynamics analysis techniques modified to account
for certain special characteristics of magnetic bearings such as sensor noncollocation.
Tester designs utilizing magnetic bearings were analyzed specifically for this
project. Designs utilizing rolling element bearings were originally analyzed by RSR for
a NASA funded SBIR. Results from this previous analysis are review and discussed.
4.1 FREQUENCY RESPONSE ANALYSIS
The frequency response analysis was performed for a constant rotor speed of
9,600 rpm and a flat input force spectrum of 100 lb. In the analysis of the twomagnetic bearing supported testers, 50 Ib is applied at each magnetic bearing. In the
floating housing tester of Figure 3-2, 100 Ib is applied at the test article casing. In the
fixed housing tester of Figure 3-3, 100 Ib is applied directly to the shaft 3.0 inchesfrom the test article center.
The frequency response analysis was performed for three reasons: 1) todetermine the general frequency response characteristics of each test method, 2) to
provide the necessary input for an uncertainty analysis, and 3) to determine the
required input force levels and measurement resolution requirements. The results
provide a basis for comparing and evaluating the relative merits of the test
approaches.
4.1.1 Magnetic Bearing Supported/Excited Testers
The analyses for testers (1) and (2) were performed for the followingconditions:
Test Article Stiffness:
Test Article Damping:
Test Bearing Journal Diameter:
Magnetic Bearing Stiffness:
200,000 Ib/in and 1,000,000 Ib/in
100 Ib-s/in2.0 in and 6.0 in
low and high
The two magnetic bearing transfer functions are shown in Figures 4-1 and 4-2
in terms of equivalent stiffness and damping coefficients. The larger test article
diameter causes two significant differences in the analysis presented here: 1 ) higher
4-1

A
Z
rn._Jv
o')¢,)uJZ11iim
I--_)_>
OUJ
A
Z
m_J
(.9Zn
OUJ
MAGNETIC BEARING TRANSFER FUNCTIONNASA CRYO TESTER, SOFT TF
800"
700
600.
_" 500"
t.-
400-0t--
I_. 300"
200"
100
00 _ 4'0
EXCITATION FREQ (CPM)
(Thousands)
J
MAGNETIC BEARING TRANSFER FUNCTIONNASA CRYO TESTER, SOFT TF
160"
140
120"
100-
80"
60
40
20-
00 2'o 3'o 4'o
EXCITATION FREQ (CPM)
(Thousands)
6O
5'0 60
Figure 4-1. Stiff magnetic bearing transfer function used in analysis4-2

MAGNETIC BEARING TRANSFER FUNCTIONNASA CRYO TESTER, STIFF TF
A
Z
o3_J
(1)09LUZu_
09>
OLU
700"
600
"oc
_ 5000e-
400
300
2OO0 _0 2'o 3'o 4'0 s'o 60
EXCITATION FREQ (CPM)(Thousands)
160
140'
Z120
Q3"J 100
(9ZE 80-
<o 60_>O 40w
20"
MAGNETIC BEARING TRANSFER FUNCTIONNASA CRYO TESTER, STIFF TF
' i i i i
0 10 20 30 40 50EXCITATION FREQ (CPM)
(Thousands)
60
Figure 4-2. Soft magnetic bearing transfer function used in analysis
4-3

test article stator mass - 168 Ib compared to 25 Ib, an effect that tends to drive the
rotor natural frequencies lower, and 2) a stiffer rotor which tends to increase the rotor
natural frequencies.
4.1.1.1 Floating Housinq (1). Frequency response analysis results with the floatinghousing are shown in Figures 4-3-4-12. Figure 4-3 shows the relative rotor/stator
response at the shaft center for a 2 inch test article journal diameter, 200,000 Ib/in
test article stiffness and the stiff magnetic bearing transfer function. The two
response peaks are due to the first and second mode of the tester. The response is
near zero at low excitation frequency because the input is through the slave bearings.In order to get relative motion across the test article, the excitation frequency has to
be high enough to excite one of the modes of the shaft/test article. The response at
high frequency becomes small due to the wide separation in the second and third
natural frequencies of the system. The response magnitude is above the minimum
threshold of 0.00005 inches from about 100 Hz to 900 Hz. This range could be
extended somewhat with an increase in input force. Figures 4-4 and 4-5 show test
article acceleration and test bearing load as a function of excitation frequency for this
case. The response levels are within acceptable limits from about 100 Hz to 900 Hz.
Figures 4-6-4-8 show relative rotor/stator displacement for three additional
cases - Figure 4-6 is for a soft magnetic bearing transfer function, Figure 4-7 is a stiffmagnetic bearing transfer function and 1,000,000 Ib/in test article stiffness, and
Figure 4-8 is for a soft magnetic bearing transfer function and 1,000,000 Ib/in testarticle stiffness.
The characteristics illustrated in Figures 4-3-4-8 show the major problem with
floating housing testers. The response at the test article is completely dependent on
test article natural frequencies which may change dramatically depending on the type
of bearing tested and the fluid medium used for the test. A flat response spectrum
is desired in order to produce the lowest uncertainties and to reduce any amplitude
nonlinearity effects. A much flatter response spectrum can be produced by spectrally
shaping the input force spectrum. This can easily be done with either magneticbearing or hydraulic shaker excitation. However, in either case, the response at null
frequencies, such as the low frequency region of Figure 4-3, can not be increasedsignificantly with a practical force input magnitude. Large changes in system dynamic
characteristics may require a flexible and extensive data reduction software package
which may need to be customized for each test series. Situations may also occur
where the response at the test article is below measurement capability over the
frequency range of interest (typically 0-1kHz).
4-4

t_J
°i
i
i _i ! -
/ l I
1 ! i !I I -.........___________,_....j_I I -. II J -°_
/ ! i _ - _I l -
I i I I I -
i..... t'--- I I -
I
(Sl !B _-@) IN_OV'IaSIO _IIY'BB
°B
(I}
.0
.C_ E°_
E.__
(_oE
C_.w:--(.- w-_
Om
w_
co Q;E _-_0 r-
0--_o._o 0
._> __.o
d
4-5

|
"C.
c-.m
CDcD
.£3
_D cD
CD_.£3
CD OE'.=
.cv) _3
Or- _,-
om
O
_- _DO
cD_
_O_O¢2
_o_-G
i-.o
CD0_LL.
Is,8 _-0) NOIIY_3"I300V3t_'10$_
4-6

)-.
L,.. ot.L._N_r
)---- Q..--
iIIIIJ__IIII
IIIIIIt-I
|
(_'_ _O'i _I_
_Z).. u
Et...
0
C'q
r-t...
(D
r" O_
E_
°_
__0 C_
0
0 c-o_
"_ 0
Q_d
D
4-7

(si!B_-6) IN_VI_$10 ]^IIY'G_
4-8
|IIIII-F-
IIIII
I I I I I
('4
7
IIIII.1IIII
IIIII
, I i I I I
(Sl!fl )kl-B 1N3B'--J0V7aSI03AIIY'I3B
o3
E°_
co
JO E
",_
c- ..O
fj
E _"_. r"
mEO_,--
E. __
x _0w _" 0
_0
_0_0
u_(D ._-"
._- 3*" 0
rZ
4-9

I-- .
I
.J I
I I
(Sl!I,1_-I_)IN_3C)V'I,:ISIO_IIY'BB
.m
(-.
.._ (.--c'-
E__ E
.__ m
_E0 *"t'- 0
•_- d
_.__
._
mO
._ -_•" Q
rr" _,1
L_
4-10

Figures 4-9-4-12 show relative rotor/stator displacement for four additionalcases that were analyzed with a 6 inch test article journal diameter. Figures 4-9-4-12correspond directly to Figures 4-3 and 4-6-4-8 for the 2 inch test article. Bycomparison of the figures, the higher test article mass reduced the natural frequencyof vibration for the responding modes of the tester. As a consequence, three vibrationmodes are in the frequency range of interest with the larger bearings. Of course, thelarger bearings will actually be tested at much higher stiffness values than the smaller2 inch bearing, partially negating this effect.
4.1.1.2 Fixed Housinq (2). Frequency response analysis results with the fixed housingare shown in Figures 4-13-4-22. Figure 4-13 shows the relative rotor/stator response
at the shaft center for a 2 inch test article journal diameter, 200,000 Ib/in test article
stiffness and the stiff magnetic bearing transfer function. The one response peak is
due to the second mode of the tester as the first mode is well damped by the
analyzed test article damping. Bearings having less net damping (significant cross-
coupled stiffness or less direct damping) would have a first mode response. A
significant difference between this configuration and the floating housing configuration
is that there are no null points in the frequency range of interest. The relativeresponse levels are similar for the similar force input. Figures 4-14 and 4-15 show
test article acceleration and test bearing load as a function of excitation frequency for
this case. Note that the acceleration is several orders of magnitude below the levels
predicted for the floating housing tester. This is because of the very high natural
frequency (2-4kHz) of the test article support relative to the frequency range ofinterest (0-1 kHz), and indicates that the acceleration measurement will be much less
important with the fixed housing tester. The response levels are such that spectralshaping of the input could be used to produce an acceptably flat response over theentire frequency range of interest.
Figures 4-16-4-18 show relative rotor/stator displacement for three additional
cases; Figure 4-16 is for a soft magnetic bearing transfer function, Figure 4-13 is astiff magnetic bearing transfer function and 1,000,000 Ib/in test article stiffness, and
Figure 4-18 is for a soft magnetic bearing transfer function and 1,000,000 Ib/in test
article stiffness. The differences in response among these three cases and Figure 4-13 are due to the differences in the locations and damping levels of the rotor natural
frequencies due to the different support stiffness values. In each case flat,
measurable response spectrums should be possible with reasonable input force andspectral shaping.
Figures 4-19-4-22 show relative rotor/stator displacement for four additional
cases that were analyzed with a 6 inch test article journal diameter. The larger testarticle diameter results in the same two differences stated before: 1) higher test
article stator mass - 168 Ib compared to 25 Ib, an effect which is not as importantwith the fixed housing tester, and 2) a stiffer rotor which tends to increase the rotor
4-11

|x
W
L_
_ °
tJ_
° iL._
IIIIII
4IIIIi
II
1-IIIiI
J.
IIi
-I
I I i
I I iI i I I I I i I I I I I f I I I I I I I ] I [ i Z t_
, . , .
(Sl!M )Id-9)IN_V'_I(] _IIY"I_
|
!
- _
- __
-- X
I
_i
.m
.C}
.__ c"
g_E._
t- C
oEc-
°--
o_
=_
_0--0.-_ 0
.>_ B_.__
4-12
rY
I
I
IIIIII
I Ij P /-
IIIII
IIIII
-I
I
IIII
J
|
(sl!n_-B} 1N_V'l_IO 3^IIV'BB
_- {_
f.) .._._,,-,(...)
(-" (_
"-E.c__0 0
0
_-._
0
0 o
_o_0
._0 e_
co_-, c-
_" 0(_ ._
>:
rr-':--
4-13

Z _x
° iL_
i I
i I t
I II II II II I
.......... T - ---I
I j
..... _ i .i--÷--I I
I \ i
l I \i
i
I I I I I I I
(Sl!)I_-@) J.N_3OV'IaSIO]^IIY'BB
&,. t,..
c- t-
EE
°_ ,_
0'} ",_
o_
0 _
,_
cOooo.. 0_c_"0_0
_E
¢_.0._> _-
co •:-
,i,=,=
'7,',::I"
U=
4-14

-I III I
&
(Sl!M )id-B)1N_33V'EISIO _IIY'B_
¢.. t-.c--•t-
.c) c_,u
¢- t-
EE
o_*-,
.c_0u) 03c}o_
_'_C
c- 0O0o-0
_c__-0_mo._ v--
_c
_._> :
-_c5tY" ":-
_t
-n
4-15

III
' IoC)
- I I
< IL_
(Sl!B_-6) IN_3OV'_F_IO3^IIV'BB
C _b•_ c-
._
(_
_-,C
E __E
0
-o._
X°_
E
E r_0--
o_o
E
0
>:
_CY
r_-_-
LL
4-16

i,i
III-L
I III
II
I
4-17
X
o . .
0._J
IIII
IIIIII
III
I I I I
I
IIIII
F
IIII
I I I I I I I I
IIII
|
I _ I I I
_4"7,
_Bl OVO10NI_Y_
4-18

g
_"x_,,i ,-_ -
.--1
I---
i,i
(_I!l_)kl-l_)LN_'W_Vla$10 3^IIV'B_
•c- (-
(.-
coE _"- E
(- 4-,o
o
x
o--
o
o
>-
er"
(6
u_
4-19

IiIII
IIIII
I
IIII
III
IIII
I
T
_D
IIII
m
_D
_=..--
!
_O
E E
.o_._o4--' 4...'
(-- c-
00
EEO_'+-
E "_¢,.) ¢_
_" (3
"o_
.X __,
o--
E --oO
_-0_0-8o
m E
_._>=
°--*" CNm
I_ "r-
'T,
U_
4-20

QCx
_r_ .
C.,')
°i>._,_
_J _,_
I
IIIII-iIII
II
dIIIII
L . +
I II I
I II II I
.... I .........
I II II I
I I I
{sl!B )Id-B)LN_VI_IO ]AIIY"BB
|
E r-•c-" -__
.._ ._
E _-
EE
E 0°_
o_(..)
Xo_
w,- ¢-
c"oo_0
_-0
o_
m E
_._.__ -_t'N
I_ "_"
U.
4-21

|I
Iiiiii iiii
-L
I I I I I I I I
(_I !_l )Id-8) 1N_V'I,:ISIO 3^IIY'I_,_
•_ ¢--°_
(_ {%}
{...)•_ 0
o_
{3) ¢-
E _
c- w.-
0.c&
-C} .C.)
X
4---
0 --
_o_c_-6o
w_0
> -°_.,-,CO
_m .
rr" "r_
0i'7",
U_
4-22