hyundai motor company 2016 business results · auto finance others 9 auto : production loss offset...
TRANSCRIPT

January 25, 2017
Hyundai Motor Company2016 Business Results

2
In the presentation that follows and in related comments by Hyundai Motor’s management, our useof the words “expect,” “anticipate,” “project,” “estimate,” “forecast,” “objective,” “plan,” “goal,”“outlook,” “target,” “pursue” and similar expressions is intended to identify forward lookingstatements.
The financial data discussed herein are presented on a preliminary basis before the audit from ourIndependent Auditor; final data will be included in HMC’s Independent auditor’s report. While thesestatements represent our current judgment on what the future may hold, and we believe thesejudgments are reasonable, actual results may differ materially due to numerous important factors.Such factors include, among others, the following : changes in economic conditions, currencyexchange rates or political stability; shortages of fuel, labor strikes or work stoppages; marketacceptance of the corporation’s new products; significant changes in the competitive environment;changes in laws, regulations and tax rates; and the ability of the corporation to achieve reductions incost and employment levels to realize production efficiencies and implement capital expenditures atlevels and times planned by management.
We do not intend or assume any obligation to update any forward-looking statement, which speaksonly as of the date on which it is made.
Cautionary Statement with Respect to Forward-Looking Statements
3
Sales Summary
Financial Summary
2017 Business Plan
Appendix- Operations by Plant
- Consolidated Financial Statements
Table of ContentsTable of Contents

4
Sales Summary
◇ Retail Sales
◇ Sales by Plant
◇ Sales by Segment

2015 2016
5
Sales Summary : Retail Sales
Company Data (Excluding CKD sales)
E U China
Korea
U S
India
Global Retail Sales Others
(Thousand units)
4,9144,843
2015
1,1331,037
497460
2016
657712
775762
+1.7%△7.8%+9.2%
+8.3%
+8.0%
1,3571,414
△4.0%
+1.5%
496458

(Thousand units) ‘15. 4Q 2015 ‘16. 4Q 2016 4Q16vs. 4Q15
2016 vs. 2015
Korea 518 1,867 488 1,667 △5.9% △10.7%
China 338 1,063 363 1,142 +7.3% +7.5%
India 183 643 179 662 △2.7% +2.9%
U S 99 380 86 387 △13.9% +1.6%
Czech 94 342 89 358 △5.4% +4.7%
Turkey 64 227 63 230 △1.8% +1.5%
Russia 66 230 56 207 △13.8% △9.6%
Brazil 48 174 45 161 △5.2% △7.4%
China (CV) 12 32 9 39 △28.1% +20.7%
Total 1,425 4,963 1,380 4,858 △3.2% △2.1%
6
Sales Summary : Sales by plant

(Thousand units) ‘15. 4Q(share)
2015.(share)
‘16. 4Q(share)
2016(share)
4Q16vs. 4Q15
2016 vs. 2015
P V
Small 264 18.5% 952 19.2% 246 17.8% 895 18.4% △0.7%p △0.8%p
Small-Mid 494 34.7% 1,806 36.4% 485 35.1% 1,669 34.4% +0.4%p △2.0%p
Mid 187 13.1% 644 13.0% 132 9.6% 528 10.9% △3.6%p △2.1%p
Large 53 3.7% 202 4.1% 57 4.1% 167 3.4% +0.4%p △0.6%p
Total 999 70.1% 3,605 72.6% 919 66.6% 3,259 67.1% △3.5%p △5.6%p
R V
Small-Mid 262 18.4% 771 15.5% 301 21.8% 1,044 21.5% +3.5%p +6.0%p
Mid 78 5.5% 274 5.5% 77 5.6% 257 5.3% +0.1%p △0.2%p
Total 340 23.9% 1,045 21.1% 379 27.4% 1,302 26.8% +3.6%p +5.7%p
C V
Light 55 3.9% 217 4.4% 53 3.9% 195 4.0% △0.0%p △0.4%p
Heavy 30 2.1% 95 1.9% 29 2.1% 102 2.1% △0.0%p +0.2%p
Total 86 6.0% 313 6.3% 82 6.0% 297 6.1% △0.1%p △0.2%p
Total 1,425 100.0% 4,963 100.0% 1,380 100.0% 4,858 100.0%
Share change
7
Sales Summary : Sales by segment
8
◇ Revenue and Operating Income Analysis
◇ COGS and SG&A Analysis
◇ Non-operating Income Analysis
Financial Summary

Auto Finance Others
9
▷ Auto : Production loss offset rising SUV sales
Revenue and Operating Income Analysis
Revenue by divisionRevenue by division
(Billion KRW)
Consolidated revenue and operating income under K-IFRS
Operating income by divisionOperating income by division
(Billion KRW)
▷ Finance : Expanding financial products on new models ▷ Finance : Loss from declining residual value in the US▷ Auto : Low utilization rate from strikes in Korea plants
Auto Finance Others Consolidationadjustments
183 434 118 575 915 703
5,142 3,481
2015 2016
6,843 6,914 12,436 14,052
72,680 72,684
2015 2016
6,358
5,194
△1,164(△18.3%↓)
+1,690(+1.8%↑)
91,959 93,649

10
Expenses 2015share
2016share change
Salary 2,748 3.0% 2,733 2.9% △0.5%
Marketing 3,036 3.3% 3,282 3.5% +8.1%
Warrantiesrelated 1,240 1.3% 1,469 1.6% +18.5%
Research 929 1.0% 1,019 1.1% +9.7%
Others 3,947 4.3% 3,992 4.3% +1.1%
Total 11,900 12.9% 12,496 13.3% +5.0%
COGS and SG&A Analysis
(Billion KRW) (Billion KRW)
% of Revenue :
COGSCOGS SG&ASG&A
▷ Rise in fixed costs due to lower utilization ratein Korea plants and declining KRW-USD FX rate ▷ Rise in research expenses on advanced research for
future technologies
▷ Rise in warranties expenses from year-end FX rate
73,701 75,960
2015 2016
80.1% 81.1%
+ 1.0%p
Consolidated revenue and operating income under K-IFRS
11
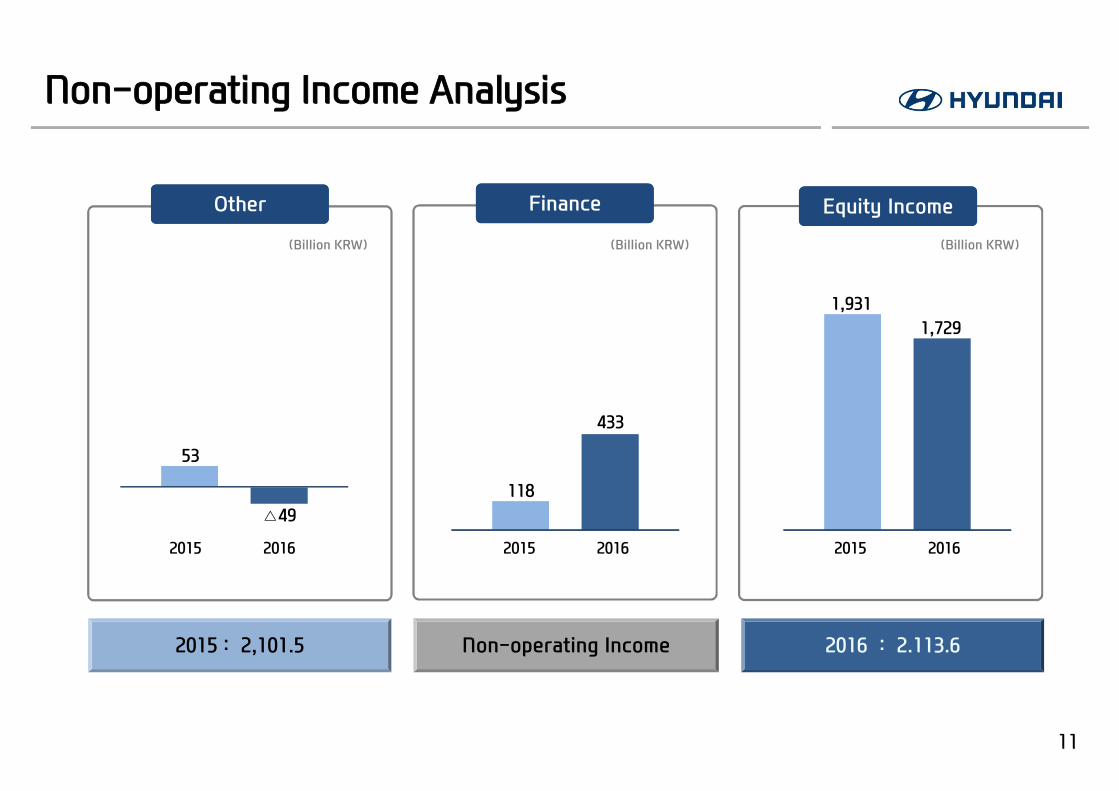
2015 : 2,101.5 2016 : 2.113.6
Non-operating Income Analysis
OtherOther FinanceFinance
Non-operating Income
Equity IncomeEquity Income
(Billion KRW) (Billion KRW) (Billion KRW)
20162015
53
△49118
433
20162015
1,9311,729
20162015
2017 Business Plan
12

2017 Business Plan
19
(Thousand units) 2016 2017 (P)YoY
Total Sales 4,858 5,080 +4.6%
Korea 1,667 1,748 +4.9%
Domestic 657 683 +4.0%
Export 1,010 1,065 +5.4%
Overseas 3,191 3,332 +4.4%
China 1,142 1,250 +9.5%
India 662 672 +1.5%
US 387 380 △1.7%
Czech 358 350 △2.4%
Others 642 680 +5.9%
Plant sales

14
◇ Operations by Plant
◇ Consolidated Financial Statements
Appendix

15
Operations by Plant
Korea Plant (HMC)Korea Plant (HMC)
Sales Volume Revenue
(Thousand units, Billion KRW)
2015 2016 Chg.
Rev. 44,440 41,714 △6.1%
Domestic 19,341 19,348 +0.0%
Export 25,099 22,366 △10.9%
292 252
259 287
166 138
175 134
759
617
2015 2016
Accent ElantraSonata Santa FeOthers
1,867
1,667
China Plant (BHMC)China Plant (BHMC)
Sales Volume Revenue
(Thousand units, Billion KRW)
2015 2016 Chg.
Rev. 19,203 20,129 +4.8%
214 157
323 411
155 148 76 41 103 113
159 249 33
22
2015 2016
Accent Elantra Mistra
Sonata ix25 Tucson
Santa Fe
1,0631,142
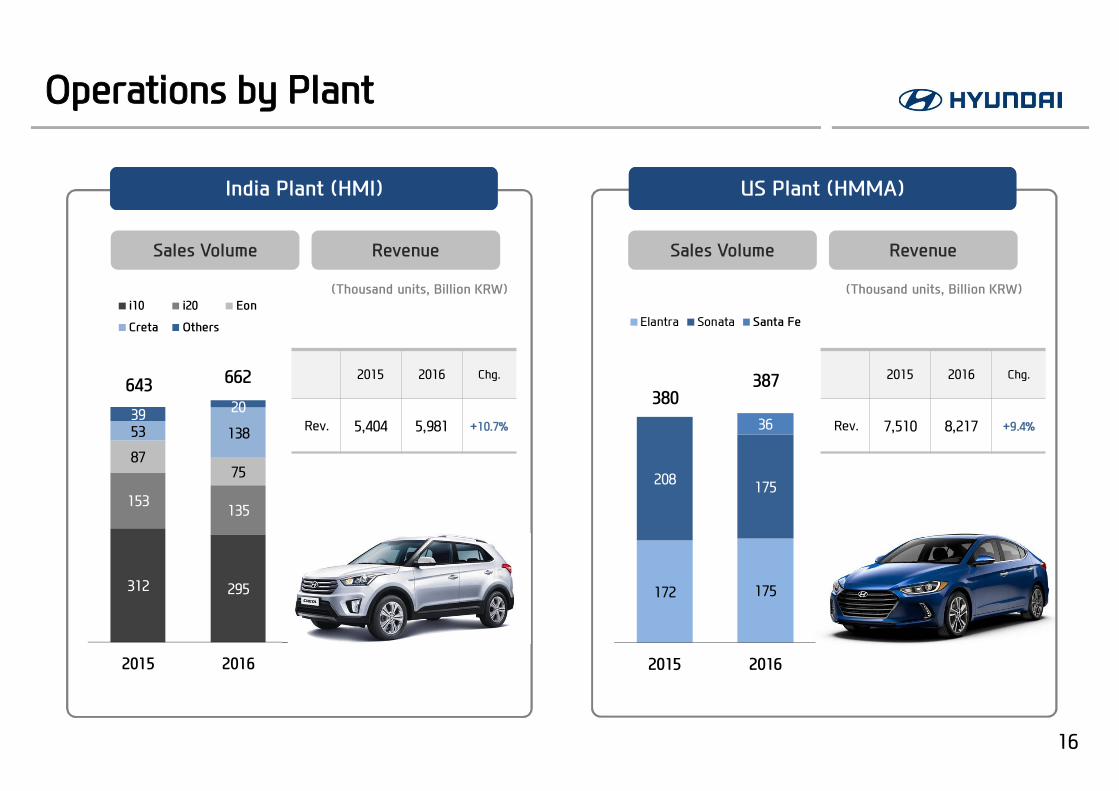
16
2015 2016 Chg.
Rev. 5,404 5,981 +10.7%
Operations by Plant
India Plant (HMI)India Plant (HMI)
Sales Volume Revenue
(Thousand units, Billion KRW)
312 295
153 135
87 75
53 138 39 20
2015 2016
i10 i20 Eon
Creta Others
662643
US Plant (HMMA)US Plant (HMMA)
Sales Volume Revenue
(Thousand units, Billion KRW)
2015 2016 Chg.
Rev. 7,510 8,217 +9.4%
172 175
208 175
36
2015 2016
Elantra Sonata Santa Fe
387380

17
2015 2016 Chg.
Rev. 5,794 6,787 +17.1%
Operations by Plant
Turkey Plant (HAOS)Turkey Plant (HAOS)Czech Plant (HMMC)Czech Plant (HMMC)
Sales Volume Revenue Sales Volume Revenue
(Thousand units, Billion KRW) (Thousand units, Billion KRW)
2015 2016 Chg.
Rev. 3,186 3,320 +4.2%
105 78
34 34
203 247
2015 2016
i30 ix20 ix35
358342
104 98
123 132
2015 2016
i10 i20
230227
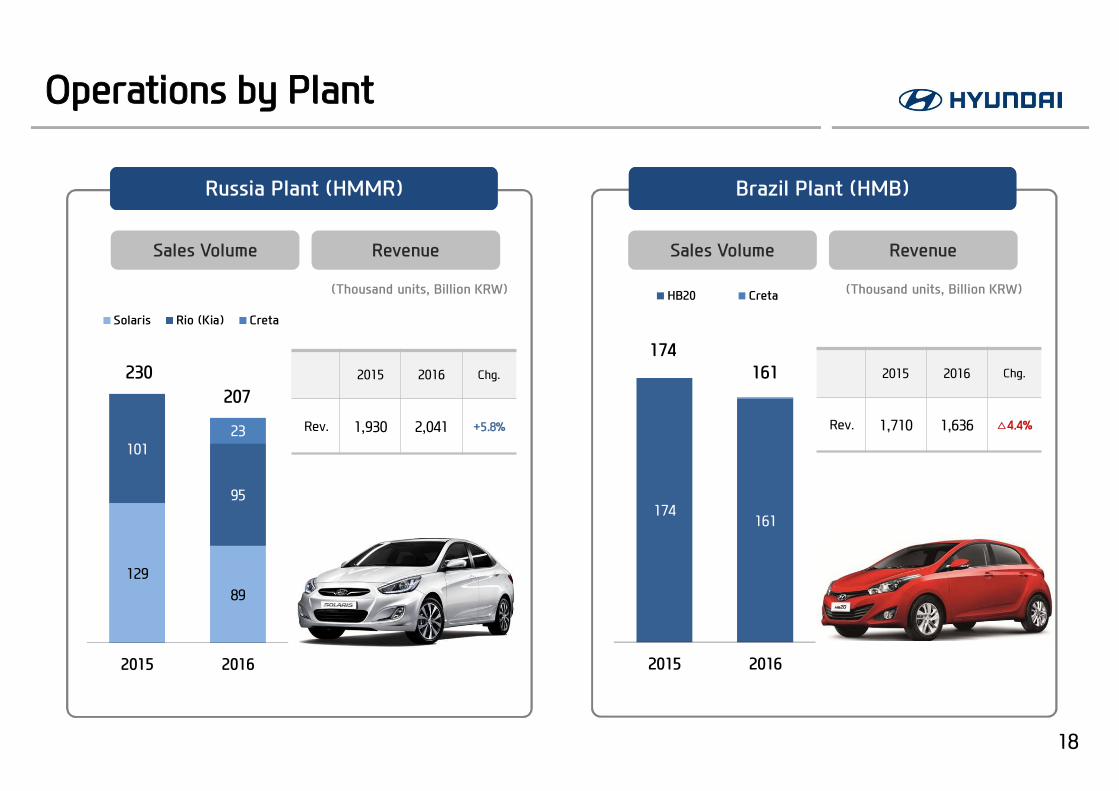
18
Operations by Plant
Brazil Plant (HMB)Brazil Plant (HMB)Russia Plant (HMMR)Russia Plant (HMMR)
Sales Volume Revenue
(Thousand units, Billion KRW)
Sales Volume Revenue
(Thousand units, Billion KRW)
2015 2016 Chg.
Rev. 1,930 2,041 +5.8%
2015 2016 Chg.
Rev. 1,710 1,636 △4.4%
12989
101
95
23
2015 2016
Solaris Rio (Kia) Creta
230207
174 161
2015 2016
HB20 Creta
161174

19
(Billion KRW) ‘15. 4Q ‘16. 1Q ‘16. 2Q ‘16. 3Q ‘16. 4QYoY QoQ
Revenue 24,765 22,351 24,677 22,084 24,538 △0.9% +11.1%
Gross Profit 4,719 4,239 5,023 3,894 4,533 △3.9% +16.4%
Margin (%) 19.1 19.0 20.4 17.6 18.5
SG&A 3,204 2,897 3,261 2,826 3,512 +9.6% +24.3%
Portion (%) 12.9 13.0 13.2 12.8 14.3
Operating Income 1,515 1,342 1,762 1,068 1,021 △32.6% △4.4%
Margin (%) 6.1 6.0 7.1 4.8 4.2
Income before tax 2,063 2,163 2,382 1,495 1,267 △38.6% △15.2%
Margin (%) 8.3 9.7 9.7 6.8 5.2
Net Income 1,529 1,768 1,764 1,119 1,069 △30.1% △4.5%
Margin (%) 6.2 7.9 7.1 5.1 4.4
Depreciation 515 529 527 537 573
Amortization 243 273 284 304 334
EBITDA 2,273 2,144 2,573 1,908 1,927
Statement of Income

20
(Billion KRW) ‘15. 4Q ‘16. 1Q ‘16. 2Q ‘16. 3Q ‘16. 4QYoY QoQ
Revenue 24,765 22,351 24,677 22,084 24,538 △0.9% +11.1%
Automotive 20,036 17,239 19,421 16,618 19,406 △3.1% +16.8%
Finance 2,985 3,529 3,561 3,767 3,195 +7.0% △15.2%
Others 1,744 1,583 1,695 1,699 1,937 +11.1% +14.0%
Operating Income 1,515 1,342 1,762 1,068 1,021 △32.6% △4.4%
Automotive 1,464 1,096 1,344 216 825 △43.6% +282.8%
Finance 145 199 260 161 84 △42.2% △48.1%
Others -82 96 159 145 174 △312.7% +20.5%
Adjustment -12 -49 -1 547 -62 +437.5% △111.3%
Statement of Income by division

21
(Billion KRW) End-2015 End-2016Diff. % chg.
Asset 165,368 178,836 +13,468 +8.1%
Current Asset(a) 67,529 72,450 +4,920 +7.3%
Liabilities(b) 98,487 106,491 +8,005 +8.1%
Current Liability(c) 41,214 43,610 +2,396 +5.8%
Debt(d) 64,932 73,444 +8,512 +13.1%
Provision 6,742 6,973 +231 +3.4%
Equity(e) 66,881 72,345 +5,463 +8.2%
Capital Stock 1,489 1,489 - +0.0%
Capital Surplus 3,520 4,203 +682 +19.4%
Retained Earnings 60,035 64,361 +4,326 +7.2%
Current Ratio(a/c) 163.9 % 166.1 %
Liability to Equity(b/e) 147.3 % 147.2 %
Debt to Equity(d/e) 97.1 % 101.5 %
EBITDA/Interest Exp. 35.3 x 31.4 x
Statement of Financial Position

22
(Billion KRW) ‘15. 4Q ‘16. 1Q ‘16. 2Q ‘16. 3Q ‘16. 4Q
Beginning 6,467 7,332 6,475 6,414 7,578
Net Income 1,530 1,768 1,764 1,119 1,069
Depreciation 515 529 527 537 573
Amortization 243 273 284 304 334
Acquisitions of Tangible △1,038 △905 △658 △510 △897
Acquisitions of Intangible △441 △244 △362 △300 △500
Dividends paid △130 △816 △269
Others 186 △2,277 △800 285 △266
Ending 7,332 6,475 6,414 7,578 7,890
Cash Flows