hypoxia, color vision deficiencies, and blood oxygen saturation€¦ · hypoxia, color vision...
TRANSCRIPT
Hypoxia, Color Vision Deficiencies, and Blood Oxygen Saturation
Jeffery K. Hovis1 Nelda J. Milburn2 Thomas E. Nesthus2
1University of Waterloo
School of OptometryWaterloo, ON N2L 2G1 Canada
2Civil Aerospace Medical InstituteFederal Aviation AdministrationOklahoma City, OK 73125 USA
November 2013
Final Report
DOT/FAA/AM-13/20Office of Aerospace MedicineWashington, DC 20591
Federal AviationAdministration
NOTICE
This document is disseminated under the sponsorship of the U.S. Department of Transportation in the interest
of information exchange. The United States Government assumes no liability for the contents thereof.
___________
This publication and all Office of Aerospace Medicine technical reports are available in full-text from the
Civil Aerospace Medical Institute’s publications website: www.faa.gov/go/oamtechreports

i
Technical Report Documentation Page1. Report No. 2. Government Accession No. 3. Recipient's Catalog No.DOT/FAA/AM-13/204. Title and Subtitle 5. Report Date
Hypoxia, Color Vision Deficiencies, and Blood Oxygen Saturation November 20136. Performing Organization Code
7. Author(s) 8. Performing Organization Report No.
Hovis JK,1 Milburn NJ,2 Nesthus TE2
9. Performing Organization Name and Address 10. Work Unit No. (TRAIS)1 University of WaterlooSchool of OptometryWaterloo, ON N2L 2G1 Canada
2FAA Civil Aerospace Medical InstituteP.O. Box 25082Oklahoma City, OK 73125
11. Contract or Grant No.
12. Sponsoring Agency name and Address 13. Type of Report and Period Covered
Office of Aerospace MedicineFederal Aviation Administration800 Independence Ave., S.W.Washington, DC 20591 14. Sponsoring Agency Code
15. Supplemental Notes
Work was accomplished under approved task AM-521.16. Abstract
Chromatic thresholds were measured using the Cambridge Color Test (CCT), Color Assessment and Diagnosis (CAD) test, and Cone Specific Contrast Test at ground and 3780 m (12,400 ft) for subjects with normal color vision and red-green color vision defects. The CAD revealed a small (~10%) increase in the red-green thresholds for the trichromatic subjects and a similar increase in the blue-yellow thresholds for the dichromats. The other two color vision tests did not reveal any significant change in chromatic thresholds. The CAD results for the trichromats were consistent with a rotation of the discrimination ellipse counterclockwise, with little change in the elliptical area. This alteration in the color discrimination ellipse is consistent with the hypothesis that the effects of mild hypoxia on basic visual function are similar to lowering the retinal illuminance.
17. Key Words Color Vision Deficiency, Color Vision, Hypoxia, Color Vision Screening Tests, Altitude
18. Distribution StatementDocument is available to the public
through the Internet:www.faa.gov/go/oamtechreports
19. Security Classif. (of this report) 20. Security Classif. (of this page) 21. No. of Pages 22. PriceUnclassified Unclassified 13
Form DOT F 1700.7 (8-72) Reproduction of completed page authorized

ii
iii
ACKNOWLEDGMENTS
Research reported in this paper was conducted under the Flight Deck Program Directive/Level of Effort Agreement between the Federal Aviation Administration Headquarters and the Aerospace Human Factors Division of the Civil Aerospace Medical Institute and was sponsored by Office of Aerospace Medicine and supported through the FAA NextGen Human Factors Division. We thank Professor John Barbur for his comments on earlier versions of the manuscript. We thank and very much appreciate the excellent technical support of many individuals, including test administrators: Deborah Perry, Carrie Roberts, Lena Dobbins, and Joy Banks; information technology: Robert Link, Joseph Mandella, and Dan Jack; altitude chamber: Rogers Shaw, Larry Boshers, Roger Storey, Junior Brown, Donold Demuth, and Eric Simson; and medical: Tracie Allison, RN, Donna Potter, Edward Matheke, MD, Arnold Angelici, MD, and Thomas Hatley, MD.


v
Hypoxia, Color Vision Deficiencies, and Blood Oxygen Saturation
CONTENTS
Introduction ----------------------------------------------------------------------------------------------------------1Methods ----------------------------------------------------------------------------------------------------------------1 Participants ----------------------------------------------------------------------------------------------------------1 Apparatus -----------------------------------------------------------------------------------------------------------2Results-------------------------------------------------------------------------------------------------------------------4 Chromatic Thresholds ---------------------------------------------------------------------------------------------4 Relationships to Other Factors -----------------------------------------------------------------------------------5Discussion --------------------------------------------------------------------------------------------------------------6References --------------------------------------------------------------------------------------------------------------7


1
Hypoxia, Color Vision DefiCienCies, anD BlooD oxygen saturation
INTRODUCTION
Pilots in United States’ airspace are permitted to fly without supplemental oxygen at altitudes up to 3800 m (12,500 ft). At higher altitudes, the pilot’s perceptual and cognitive abilities be-come too impaired to allow them to fly the aircraft safely without supplement oxygen. Color perception is just one of the visual functions that can be compromised in a hypoxic environment. Although there is a fair degree of individual variability, losses in color discrimination are primarily along the tritan axis and begin to occur at oxygen concentrations that are equivalent to an altitude of 2400 m (~8,000 ft) at mesopic light levels. The discrimination losses begin to occur at photopic light levels as the altitude increases beyond 3000 m (~9,000 ft), with more marked losses occurring above 4000 m (~13,100 ft) (Smith, Ernest, & Pokorny, 1976; Vingrys & Garner, 1987; Richalet, Duval-Arnould, Darnaud, Keromes, & Rutgers, 1988; Richalet et al., 1989; Brandl & Lachenmayr, 1994; Schellart, Pollen, & van der Kley, 1997; Bouquet, Gardette, Gortan, Therme, & Abraini, 2000; Karakucuk, Oner, Goktas, Siki, & Kose, 2004; Connolly, Barbur, Hosking, & Moorhead, 2008; Connolly, 2011). In addition to the color discrimination losses along the tritan axis at higher altitudes, the Nagel anomaloscope settings tend to require more green to match yellow, and there may be a relative decrease in the sensitivity to green light when measured using heterochromatic flicker photometry, especially at conditions equivalent to altitudes above 4000 m (~13,000 ft.)(Schmidt, 1937; Vingrys & Garner, 1987; Richalet et al., 1988; Richalet et al., 1989; Brandl & Lachenmayr, 1994; Schellart et al., 1997; Bouquet et al., 2000). It is not clear whether detection thresholds for blue and green lights are affected more than the thresholds for red lights at altitudes less than 4000 m (~13,000 ft.); how-ever, it is unequivocal that detection and contrast thresholds for all colored lights are elevated in mesopic and scotopic light conditions before photopic conditions (Kobrick, 1970; Ernest & Krill, 1971; Kobrick, Zwick, Witt, & Devine,1984; Connolly & Barbur, 2009; Connolly, 2011).
With the exception of two studies (Schmidt, 1937; Con-nolly et al., 2008), subjects participating in these hypoxia ex-periments all had normal color vision (NCV). In one of these studies, Schmidt reported that hypoxia produced subtle effects on the red-green color matches made by NCV and individu-als with congenital anomalous trichromatic red-green defects (DCV) using the anomaloscope (Schmidt, 1937). The NCV group required slightly more green in the mixture with red to match yellow with increasing hypoxia. Their range of acceptable matches also increased slightly after adapting to a bright white light at altitudes between 4000 m and 6000 m. The DCV group did not show any changes in their anomaloscope settings with altitude. However, if only the mild anomalous trichromats’ data are examined, then they required slightly more green to match
yellow and showed a slight increase in their range of acceptable matching for the neutral adaptation settings, but a decrease in the range of acceptable matches after adapting to a bright white light as altitude increased. This decrease in the range of acceptable matches was probably due to a practice effect. It is likely that the lower precision in establishing a match for the more severe cases masked the small changes that occurred with altitude for the mild anomalous trichromats.
In a second study, Connolly et al. (2008) reported that the one very mild deuteranomalous observer showed minimal changes in his color discrimination in the hypoxic environment at photopic and upper mesopic light levels. This result was similar to the results for their NCV group in the same study. At the lowest mesopic light level, both the NCV group and the DCV observer showed an increase in blue-yellow threshold with hypoxia; however, the percentage increase for the mild deutan observer was less than the percentage increase, based on the aver-age NCV data. The red-green thresholds also increased further at this dimmest light level with hypoxia for the deuteranomalous individual, and the percentage increase was greater than the increase for the NCV group, based on their mean values for the normoxia and hypoxia conditions (Connolly et al., 2008).
Although the data are limited, it appears that anomalous trichromats show a similar trend in the reduction of color vi-sion with hypoxia as NCV; however, the effect is small so that any changes in discrimination along the red-green axis could be masked by the poorer color discrimination in more severe cases. Because the data are limited to only a few subjects with congenital color vision defects and dichromats were excluded, we were interested in obtaining additional data from individuals with DCV, especially from individuals with more severe defects. We restricted the light levels to low photopic vision because it is likely that some of the individuals with the more severe defects would not be permitted to fly at night.
METHODS
ParticipantsPrior approval for all procedures and use of human par-
ticipants was obtained from the Institutional Review Board of the Civil Aerospace Medical Institute (Oklahoma City, OK) in accordance with the Declaration of Helsinki. Volunteers were recruited and paid by an independent contractor, who also paid for the medical assessment prior to the study. Recruitment was through advertisements in local newspapers. Informed consent was obtained prior to participation, and each participant was free to withdraw from the experiment without prejudice at any time.
Subjects were first screened to ensure that their visual acuity was at least 20/30 in at least one eye as measured with a Bausch and Lomb Orthorater for both near and far vision. Untinted spectacle corrective lenses were allowed, if necessary for all vision

2
tests. With one exception, all subjects had 20/30 acuity in each eye. The one exception was a severe deuteranomalous subject who had severe amblyopia in his left eye and was included in the study; however, the results from the Cone Specific Contrast Sensitivity analysis were excluded. His red-green threshold data for the other two binocularly viewed color vision tests were well within the range of the other severe deuteranomalous, and his blue-yellow thresholds were within the normal range for each test. For those participants requiring correction, they were asked to wear their glasses rather than their contact lenses dur-ing screening and study. Next, their color vision was screened using the Dvorine Pseudoisochromatic Plate Test (2nd edition, Psychological Corporation, Baltimore, MD) illuminated by True Daylight Illuminator T8 florescent tube in the desk lamp (Richmond Products, Albuquerque, NM). Illumination on the test booklet was 945 lux. Their color vision was further classified as to type and severity using a Nagel Type 1 anomaloscope. Table 1 lists the number of subjects that took each color vision test used in the study. The number of individuals is slightly different due to the availability of the different tests, and the individual with severe amblyopia was excluded from the Cone Specific Contrast Sensitivity test.
Participants who met the vision requirements completed a medical history pre-screening form that the study’s medical monitor used to make a general assessment of the participants’ health. Those cleared by the medical monitor visited a designated Federal Aviation Administration Aviation Medical Examiner to complete medical assessment, which was essentially equivalent to an FAA Class III medical evaluation. The examination included an electrocardiogram, measurement of the level of oxygen saturation in the blood, and tympanometry to determine whether the participant would be able to tolerate changes in barometric pressure in his ears and whether he could clear his ears by performing a Valsalva maneuver. Disqualifying medical conditions were: deep venous thrombosis; cardio-pulmonary disease; surgery involving the head, thorax, or abdomen within the past six months; use of certain drugs such as β-blockers, sildenafil and tadalafil; prior diagnosis of decompression sick-ness; seizures induced by optical stigma due to flickering lights, moving lights, or flashing displays; and diabetes.
All subjects were males, nonsmokers, between the ages of 18 and 57 years. The mean age of the color-normal group was 33.3 years (sd +12.6); the mean age of the color-defective group was 37.6 years (sd +12.1). The mean ages were not significantly different (p=0.20).
Apparatus The study took place in the FAA Civil Aerospace Medi-
cal Institute’s hypobaric chamber in Oklahoma City, OK. The experiment was conducted on two separate days at two different altitudes: ground (394 m 1,290 ft) and 3780 m (12,400 ft). The experimental sessions at ground level began with the subjects adapting to the chamber environment for 20 min. They then rotated to the various testing stations within the chamber every 45 min in a pre-determined order so that sequence of tests was balanced across subjects. The session lasted a total of 4.5 hr with a short lunch break at the 1.75-hr point of the study. Partici-pants stayed within the chamber during the break, and the FAA provided snacks and lunch. The lunch items consisted of bottled water, protein bars, an apple, and a small bottle of juice. The snacks were bottled water, beef jerky, and/or cheese sticks. The meals and snacks were intentionally light and designed to avoid caffeine and sugary items. Everyone had meal breaks at the same time on ground and altitude conditions. The lunch and snack selections were the same for ground and altitude.
The altitude session followed within three days of the ground session and maintained a similar schedule. The testing sequence for each subject was the same for both the ground and altitude sessions. Heart rates (beats/min) and percent blood oxygen satura-tion levels (SaO2) were monitored throughout the altitude trials using a multiparameter pulse oximeter (Nellcor Pulse Oximeter, Model 200; forehead electrode placement; Covidien-Nellcor™ Boulder, CO). The data were stored on a PC computer using Labview software (ver 8.6, National Instruments, Austin, TX).
The Cambridge Color Test was part of the Metropsis (ver 1.003, Cambridge Research Systems) program. The CCT presented a ring stimulus of one color within a background of another color. The subject had to locate the gap in the ring, which could be located in one of four possible positions. To ensure that identification of the gap is based only on chromatic differences, both the background and ring were composed of smaller circles, which varied in luminance around an average value. The design was based on a typical pseudoisochromatic plate used in most printed color vision screening tests. The subject had to identify the location of the gap, which could be located up, down, left, or right. The chromatic difference between the ring and the background was varied according to two interweaving staircases until 11 reversals were reached for each of the two hue directions that make up the two staircases. Threshold was calculated from the average of the chromatic differences between the test hue and background for the last six reversals. At the recommended
Table 1. Number of participants that took each test and their color vision status.
Test Cambridge Color Vision Test
Color Assessment and Diagnosis
Cone Specific Contrast Test
Color VisionNormal 14 16 13Deuteranomalous 9 6 6Protanomalous 2 2 2Deuteranope 5 4 4Protanope 3 3 3

3
test distance of 3.1 m, the ring subtended a visual angle of 2.2o, its gap was 1.0o, and the diameter of the background reference color was 4.3o (Regan, Reffin, & Mollon, 1994; Mollon & Regan, 1999). The stimulus was presented for 4 sec, unless the subject responded sooner.
A Dell Pentium 4 computer (Dell, Round Rock, TX) and the VSG71.02.013D (Cambridge Research Systems, Kent, UK) graphics system were used to generate the stimuli on a Sony Trinitron© Color Graphics 20-inch monitor (Model GDM F520, manufactured Jan. 2002). The average luminance of the monitor was 12.6 cd/m2 with maximum and minimum luminance values of 22.5 cd/m2 and 2.8 cd/m2, respectively. Thresholds for eight, equally-spaced hue angles were measured on gray and yellowish backgrounds in the CIE u' v' chromatic-ity space. The chromaticity coordinates of the gray background were u'=0.195 and v'=0.464, and the yellow coordinates were u'=0.23 and v'=0.5.
The Color Assessment and Diagnosis (CAD) system used a slightly different approach to measure thresholds and introduce luminance contrast noise in both the spatial and temporal do-main to ensure that discrimination was based on only chromatic differences. Both the background and colored stimulus of the CAD were composed of smaller squares subtending 10 min arc. The luminance noise was introduced by varying randomly the luminance of each smaller square of the stimulus and background +45% about the mean luminance value approximately every 80 ms. The stimulus was a colored square outline with horizontal and vertical lines bisecting in the center. The width of the lines was one square and total angular size was 1.1o. The angular size of the reference background was 3.3° by 3.3°. The stimulus moved diagonally in one of the four possible directions at a velocity of 4o/sec for a duration of 715 ms. Thresholds were determined for 16 different hue directions around a reference gray. The 16 hues were concentrated around the three dichromatic lines of confusion through the gray (Barbur, Harlow, & Plant, 1994; Barbur, 2003; Jennings & Barbur, 2010).
The subject indicated the direction of motion of the colored target using a response pad to enter the direction. The chromatic difference between the square and background varied according to four alternative forced-choice protocol using 16 different interweaving staircases. Each staircase rep-resented one hue direction (Barbur, Harlow, & Plant, 1994; Barbur, 2003; Jennings & Barbur, 2010). Similar to the CCT, the CAD staircase ended after 11 reversals had occurred for a given direction, and the threshold was calculated as the mean of chromatic contrasts from the last six reversals. The chromatic thresholds for the red-green and blue-yellow discrimination axes were then normalized relative to the median value for a large color-normal sample (Barbur, Rodriguez-Carmona, & Harlow, 2006). The CAD test (ver 1.12.1W; City University, London, UK) was presented on another calibrated Sony Trinitron© Color Graphics 20-inch monitor (Model GDM F520) using a CCL Computer (Bradford, UK). The gray chromaticity coordinates were u'=0.195 and v'=0.464. The average luminance of the display was 20.7 cd/m2.
The Cone Specific Contrast Sensitivity test (CSCT, ver 5.0; U.S. Air Force, Brooks City Base, San Antonio, TX) approximates measuring chromatic thresholds using letters of varying saturation, but the underlying theoretical basis and assumptions are slightly more complex. The dominant wavelength of the letters was selected so that hue fell on one of the dichromatic lines of confusion through the gray reference background. That is, the hue of a given series of letters was designed to stimulate only one of the three cones. The excitation purity of the letters was transformed into cone excitation values relative to cone excitation value for the gray background. This value then became the cone contrast value, and it was decreased systematically until the subject could no longer identify the letter (Rabin, 1996).
The vertical angular subtense of the letters was 1.3 degrees for the L- and M-cone contrast sensitivity test letters and 1.95 degrees for the S-cone contrast sensitivity test letters at the test viewing distance. The presentation started with the letters at a high cone contrast. Each letter was presented for 2 s with 2 s interstimulus interval. Five letters were presented individually, in random order, at each contrast level before the contrast was decreased by 0.2 log units. Sensitivity was determined by multiplying the number of incorrect letters by 0.04 log unit and subtracting the product from 2.0 for the L- and M-cone sensitivities and 1.1 for the S-cone sensitivities. These two values were the maximum sensitivity for each cone contrast. The L-cone test series was presented first, fol-lowed by the M-cone and then the S-cone. This was the only test that assessed the right and left eye individually, with the right eye always tested first.The subject occluded his nontested eye using a cupped hand. The CAD and CCT tests were viewed binocularly. The computer was a SAG P4-1.5G/478 (New Delhi, India), and the display monitor was an AOC (Fremont, CA) 19-inch CRT monitor. The chromaticity coordinates of the gray background were u'=0.19 and v'=0.58 (x=0.27, y=0.28); the luminance was 10.7 cd/m2.
A unique, random order of letters was generated for each CSCT administration, and a copy was printed for the test admin-istrator to record the subject’s responses. Subjects communicated their responses via a walkie-talkie.
For all tests, the administrator observed the participant on a closed-circuit television and through an observation window of the chamber. The progress of each test was monitored on a separate monitor outside the chamber. Walkie-talkies were used for communication on all three tests. All participants received detailed instructions and completed the learning module prior to their initial administration of the color vision tests during the “ground” condition.
Each monitor was calibrated with the accompanying calibra-tion system. All monitors were positioned outside the chamber and viewed through one of the chamber windows from the appropriate distance. Chromaticity measurements, using a Minolta CS-100 (Ramsey, NJ) on reference grays, confirmed that the transmission through the windows was neutral in the visible spectrum. Measure-ments of the sky in Waterloo, ON, during the summer months indicate that the luminance levels used in this experiment approxi-mated the luminance of a clear north sky 15 minutes before sunset.

4
Statistical analyses were carried out using the IBM© SPSS© Statistics program (ver 19; Chicago, Ill). Unless stated other-wise, repeated measures multivariate analysis of variance was carried out with direction in the test’s color space and altitude within-subject factors and color vision status, normal color vi-sion (NCV), anomalous trichromat (AT), and dichromat (D) as the between-subject factors. Wilks’ lambda was used as the statistical index, and statistical significance was based on alpha level <0.05, unless stated otherwise.
RESULTS
Chromatic ThresholdsCambridge Color Test. There were significant differences
in the chromatic thresholds between the subject groups along the red-green discrimination axis (p<0.001 for both backgrounds), but there was no significant effect of altitude or significant in-teraction involving altitude (p>0.25 for both backgrounds). The statistical analysis was performed on relative change at just the 90o and 270o vectors (blue-yellow) and the 0o and 180o vectors (red-green), and it did not reveal any significant effect (p>0.41 for any term involving altitude), indicating the results at the other vectors did not mask a change along either one these two axes. Figure 1 shows the mean relative change in thresholds at altitude for the NCV, anomalous trichromatic and dichromatic groups.
Color Assessment and Diagnosis Test. Statistical analysis performed using the three color vision groups (NCV, AT, and D) showed the expected difference between NCV and the two DCV groups (p<0.001) in terms of the color axis and interaction with the color vision group. The analysis also revealed statistically significant altitude effects and interactions involving altitude (p<0.05). Figure 2 illustrates these effects in terms of the relative change in thresholds at 3780 m (12,400 ft.) The NCV group had a relative increase in their red-green threshold, with no change in their blue-yellow threshold, whereas the dichromats had a larger change in their blue-yellow thresholds compared
with their red-green thresholds. The anomalous trichromats had relative increases in thresholds for both color directions with altitude, although the increase in the red-green direction was slightly larger.
Because the CSCT was performed monocularly, we first performed the statistical analysis with test-eye included as a factor. The test-eye factor was not significant (p=0.10), and there was no significant term or interaction involving altitude and test-eye (p>0.24). As a result, the contrast data from each eye was averaged and re-analyzed. Statistical analysis of the averaged-across-eye data revealed the expected differences and interactions between cones sensitivities for the NCV and the two DCV groups (p<0.003). Nevertheless, there was no statisti-cally significant altitude main effect or interaction involving the altitude term involving altitude (p>0.68).
Gray Background
Vector (degrees)0 45 90 135 180 225 270 315
Rel
ativ
e C
hang
e in
Thr
esho
ld(3
780
m/G
roun
d)
0.0
0.5
1.0
1.5
2.0
Color-Normal Anomalous Trichromats Dichromats
Yellow Background
Vector (degrees)0 45 90 135 180 225 270 315
Rel
ativ
e C
hang
e in
Thr
esho
ld(3
780
m/G
roun
d)
0.0
0.5
1.0
1.5
2.0
Color-Normal Anomalous Trichromats Dichromats
Figure 1. Relative change in the Cambridge Color Test thresholds at 3780 m (12,400 ft.) for the color-normal and the two color-defective groups. Red-green vectors are 0o and 180 o; blue-yellow vectors are 90 o and 270o. Error bars are + 1.0 standard error of the mean.
Direction in Color SpaceRed-Green Blue-Yellow
Rel
ativ
e C
hang
e in
Thr
esho
lds
(378
0 m
/Gro
und)
0.0
0.2
0.4
0.6
0.8
1.0
1.2
1.4
Figure 2. Relative change in the Color Assessment and Diagnosis thresholds at 3780 m (12,400 ft.) relative to ground for the color-normals (black), anomalous trichromats (dark gray) and dichromats (white). Error bars are + 1.0 standard error of the mean.
5
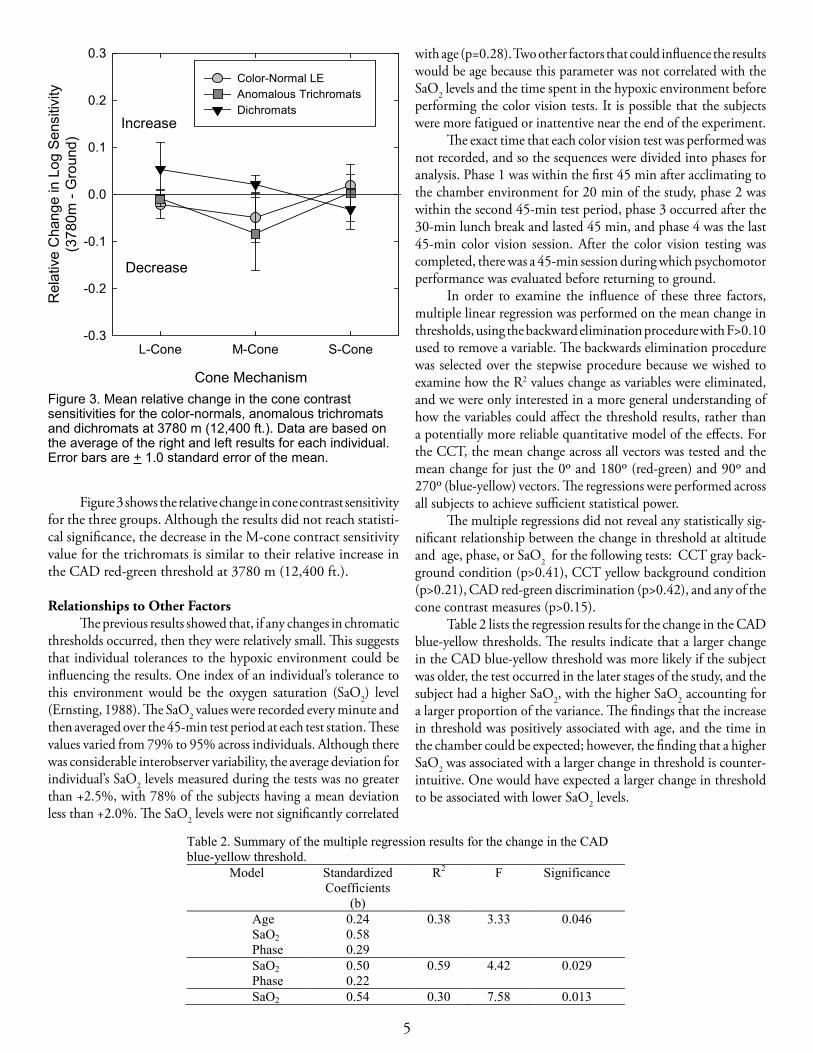
Figure 3 shows the relative change in cone contrast sensitivity for the three groups. Although the results did not reach statisti-cal significance, the decrease in the M-cone contract sensitivity value for the trichromats is similar to their relative increase in the CAD red-green threshold at 3780 m (12,400 ft.).
Relationships to Other FactorsThe previous results showed that, if any changes in chromatic
thresholds occurred, then they were relatively small. This suggests that individual tolerances to the hypoxic environment could be influencing the results. One index of an individual’s tolerance to this environment would be the oxygen saturation (SaO2) level (Ernsting, 1988). The SaO2 values were recorded every minute and then averaged over the 45-min test period at each test station. These values varied from 79% to 95% across individuals. Although there was considerable interobserver variability, the average deviation for individual’s SaO2 levels measured during the tests was no greater than +2.5%, with 78% of the subjects having a mean deviation less than +2.0%. The SaO2 levels were not significantly correlated
with age (p=0.28). Two other factors that could influence the results would be age because this parameter was not correlated with the SaO2 levels and the time spent in the hypoxic environment before performing the color vision tests. It is possible that the subjects were more fatigued or inattentive near the end of the experiment.
The exact time that each color vision test was performed was not recorded, and so the sequences were divided into phases for analysis. Phase 1 was within the first 45 min after acclimating to the chamber environment for 20 min of the study, phase 2 was within the second 45-min test period, phase 3 occurred after the 30-min lunch break and lasted 45 min, and phase 4 was the last 45-min color vision session. After the color vision testing was completed, there was a 45-min session during which psychomotor performance was evaluated before returning to ground.
In order to examine the influence of these three factors, multiple linear regression was performed on the mean change in thresholds, using the backward elimination procedure with F>0.10 used to remove a variable. The backwards elimination procedure was selected over the stepwise procedure because we wished to examine how the R2 values change as variables were eliminated, and we were only interested in a more general understanding of how the variables could affect the threshold results, rather than a potentially more reliable quantitative model of the effects. For the CCT, the mean change across all vectors was tested and the mean change for just the 0o and 180o (red-green) and 90o and 270o (blue-yellow) vectors. The regressions were performed across all subjects to achieve sufficient statistical power.
The multiple regressions did not reveal any statistically sig-nificant relationship between the change in threshold at altitude and age, phase, or SaO2 for the following tests: CCT gray back-ground condition (p>0.41), CCT yellow background condition (p>0.21), CAD red-green discrimination (p>0.42), and any of the cone contrast measures (p>0.15).
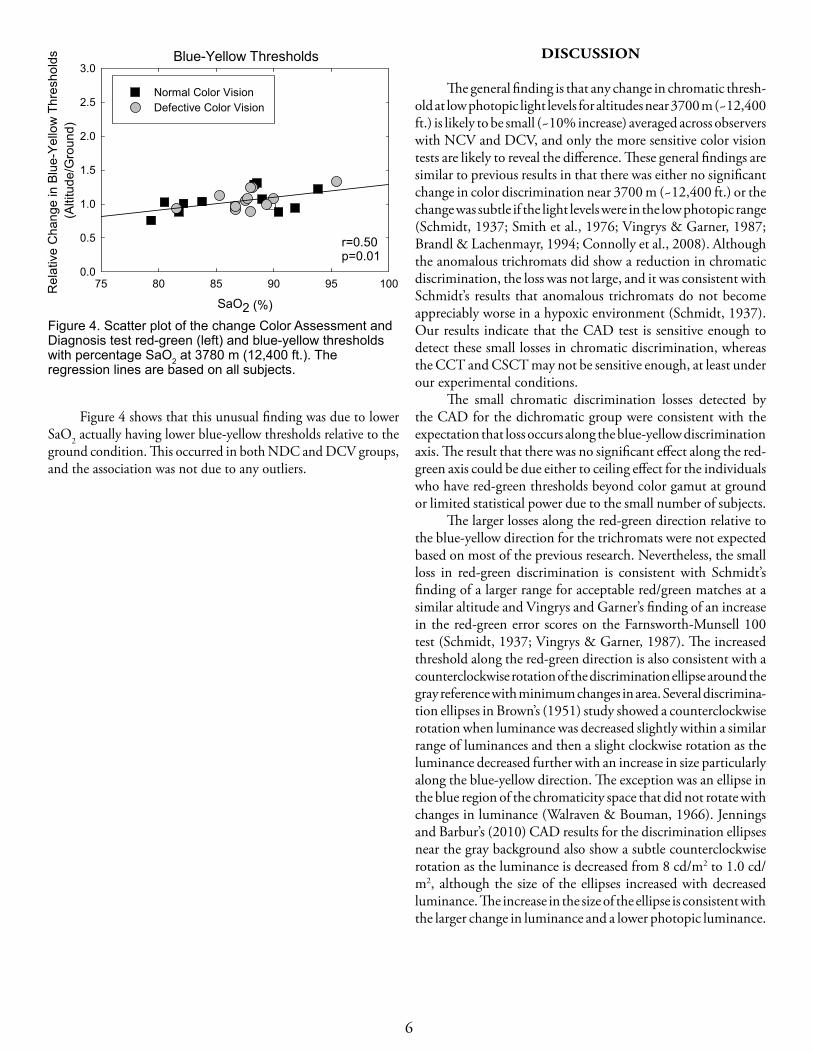
Table 2 lists the regression results for the change in the CAD blue-yellow thresholds. The results indicate that a larger change in the CAD blue-yellow threshold was more likely if the subject was older, the test occurred in the later stages of the study, and the subject had a higher SaO2, with the higher SaO2 accounting for a larger proportion of the variance. The findings that the increase in threshold was positively associated with age, and the time in the chamber could be expected; however, the finding that a higher SaO2 was associated with a larger change in threshold is counter-intuitive. One would have expected a larger change in threshold to be associated with lower SaO2 levels.
Cone Mechanism
L-Cone M-Cone S-Cone
Rel
ativ
e C
hang
e in
Log
Sen
sitiv
ity(3
780m
- G
roun
d)
-0.3
-0.2
-0.1
0.0
0.1
0.2
0.3
Color-Normal LE Anomalous Trichromats Dichromats
Decrease
Increase
Figure 3. Mean relative change in the cone contrast sensitivities for the color-normals, anomalous trichromats and dichromats at 3780 m (12,400 ft.). Data are based on the average of the right and left results for each individual. Error bars are + 1.0 standard error of the mean.
Table 2. Summary of the multiple regression results for the change in the CAD blue-yellow threshold.
Model Standardized Coefficients
(b)
R2 F Significance
AgeSaO2Phase
0.240.580.29
0.38 3.33 0.046
SaO2Phase
0.500.22
0.59 4.42 0.029
SaO2 0.54 0.30 7.58 0.013
6
Figure 4 shows that this unusual finding was due to lower SaO2 actually having lower blue-yellow thresholds relative to the ground condition. This occurred in both NDC and DCV groups, and the association was not due to any outliers.
DISCUSSION
The general finding is that any change in chromatic thresh-old at low photopic light levels for altitudes near 3700 m (~12,400 ft.) is likely to be small (~10% increase) averaged across observers with NCV and DCV, and only the more sensitive color vision tests are likely to reveal the difference. These general findings are similar to previous results in that there was either no significant change in color discrimination near 3700 m (~12,400 ft.) or the change was subtle if the light levels were in the low photopic range (Schmidt, 1937; Smith et al., 1976; Vingrys & Garner, 1987; Brandl & Lachenmayr, 1994; Connolly et al., 2008). Although the anomalous trichromats did show a reduction in chromatic discrimination, the loss was not large, and it was consistent with Schmidt’s results that anomalous trichromats do not become appreciably worse in a hypoxic environment (Schmidt, 1937). Our results indicate that the CAD test is sensitive enough to detect these small losses in chromatic discrimination, whereas the CCT and CSCT may not be sensitive enough, at least under our experimental conditions.
The small chromatic discrimination losses detected by the CAD for the dichromatic group were consistent with the expectation that loss occurs along the blue-yellow discrimination axis. The result that there was no significant effect along the red-green axis could be due either to ceiling effect for the individuals who have red-green thresholds beyond color gamut at ground or limited statistical power due to the small number of subjects.
The larger losses along the red-green direction relative to the blue-yellow direction for the trichromats were not expected based on most of the previous research. Nevertheless, the small loss in red-green discrimination is consistent with Schmidt’s finding of a larger range for acceptable red/green matches at a similar altitude and Vingrys and Garner’s finding of an increase in the red-green error scores on the Farnsworth-Munsell 100 test (Schmidt, 1937; Vingrys & Garner, 1987). The increased threshold along the red-green direction is also consistent with a counterclockwise rotation of the discrimination ellipse around the gray reference with minimum changes in area. Several discrimina-tion ellipses in Brown’s (1951) study showed a counterclockwise rotation when luminance was decreased slightly within a similar range of luminances and then a slight clockwise rotation as the luminance decreased further with an increase in size particularly along the blue-yellow direction. The exception was an ellipse in the blue region of the chromaticity space that did not rotate with changes in luminance (Walraven & Bouman, 1966). Jennings and Barbur’s (2010) CAD results for the discrimination ellipses near the gray background also show a subtle counterclockwise rotation as the luminance is decreased from 8 cd/m2 to 1.0 cd/m2, although the size of the ellipses increased with decreased luminance. The increase in the size of the ellipse is consistent with the larger change in luminance and a lower photopic luminance.
Blue-Yellow Thresholds
SaO2 (%)
75 80 85 90 95 100Rel
ativ
e C
hang
e in
Blu
e-Ye
llow
Thr
esho
lds
(Alti
tude
/Gro
und)
0.0
0.5
1.0
1.5
2.0
2.5
3.0
Normal Color VisionDefective Color Vision
r=0.50p=0.01
Figure 4. Scatter plot of the change Color Assessment and Diagnosis test red-green (left) and blue-yellow thresholds with percentage SaO2 at 3780 m (12,400 ft.). The regression lines are based on all subjects.

7
A counterclockwise rotation of the CAD discrimination ellipse could also be responsible the paradoxical decrease in thresholds for the blue-yellow as SaO2 decreases. This result could occur because the thresholds were measured along vectors near the tritanopic and red-green dichromatic lines of confu-sion instead of a more uniform sampling around the hue circle.
Another factor that could be playing a role in the nature of the discrimination loss is the concentration of other gases such as CO2 present in the circulating blood. Although the color vi-sion changes associated with hypercapnea and hypoxia could be additive (Schellart et al., 1997), it is less certain as to the effects of hypocapnea and hypoxia for color vision. Otis and colleagues (Otis, Rahn, Epstein, & Fenn, 1946; Rahn, Otis, Hodge, Epstein, Hunter, & Fenn, 1946) reported that hypocapnea and hypoxia were generally additive in terms of decrements in visual resolution at more extreme values, but mild hypocapnea could counteract the effects of mild hypoxia (Otis, Rahn, Epstein, & Fenn, 1946). They concluded that for most healthy individuals, any decrement in performance at altitudes near 3700 m (~12,400 ft.) would likely be due to hypoxia (Otis, Rahn, Epstein, & Fenn, 1946); however, it is uncertain as to whether this is the case for color related performance. Unfortunately, we could not examine this issue because the subjects did not wear a mask, and so we could not monitor end-tidal CO2.
There is also the issue of fatigue at 3780 m (~12,400 ft.), since fatigue is commonly associated with hypoxia (Crow & Kelman, 1973). Fatigue would be expected to increase thresholds and CAD results suggest that this did occur. The higher blue-yellow CAD thresholds were associated with increased time in the chamber. Fatigue could also increase the variability in the results, both within and across subjects, and that may be another reason for the lack of an effect on the other color vision tests. The issue as to why only the blue-yellow thresholds on the CAD were affected is not clear, but it appears that the effect of fatigue on these three color vision tests was also subtle.
There was a small loss (~10%) in chromatic discrimination at a hypoxic environment equivalent to 3780 m (~12,400 ft.) for NCV and DCV subjects. The loss was consistent with the hypothesis that mild hypoxia is equivalent to a slight reduction in retinal illumination. However, because the conditions were equivalent to low photopic light levels, the small loss is not likely to change pilot performance whether they have NCV or DCV. Whether the DCV color discrimination is affected to a greater extent at mesopic light levels remains unresolved.
REFERENCES
Barbur, J.L. (2003). Double-blind sight revealed through the processing of color and luminance contrast defined motion signals. Prog Brain Res, 144, 243–259.
Barbur, J.L., Harlow, A.J., & Plant, G.T. (1994). Insights into the different exploits of colour in the visual cortex. Proc Biol Sci, 258 (1353), 327-334.
Barbur, J.L., Rodriguez-Carmona, M., & Harlow, J.A. (2006). Establishing the statistical limits of “normal” chromatic sensitivity. In: Proceedings of the ISCC/CIE Expert Sym-posium 2006 “75 Years of the CIE Standard Colorimetric Observer”, 16–17 May 2006, Ottawa, Ontario, Canada. CIE x030:2006.
Bouquet, C., Gardette, B., Gortan, C., Therme, P., & Abraini, J.H. (2000). Color discrimination under chronic hypoxic conditions (simulated climb Everest-Comex 97). Percept Mot Skills, 90, 169-179.
Brandl, H., & Lachenmayr, B. (1994). Abhängigkeit der Emp-findlichkeit im zentralen Gesichtsfeld von der Hämoglobin-Sauerstoff-Sättigung. Ophthalmologe, 91, 151-155.
Brown, W.R J. (1951). The Influence of luminance level on visual sensitivity to color differences. J Opt Soc Am., 41, 684-688.
Connolly, D.M. (2011). Oxygenation state and twilight vision at 2438 m. Aviat Space Environ Med, 82, 2-8.
Connolly, D.M., Barbur, J.L., Hosking, S.L., & Moorhead, I.R. (2008). Mild hypoxia impairs chromatic sensitivity in the mesopic range. Invest Ophthalmol Vis Sci, 49, 820-827.
Connolly, D.M., & Barbur, J.L. (2009). Low contrast acuity at photopic and mesopic luminance under mild hypoxia, normoxia, and hyperoxia. Aviat Space Environ Med, 80, 933-940.
Crow, T.J.,& Kelman, G.R.(1973). Psychological effects of mild acute hypoxia. Br J Anaesth, 45, 335-337.
Ernsting, J.(1988) Respiratory physiology. Aviation Medicine, J. Ernsting & P. King, eds. London, UK: Butterworth-Heinemann, pp. 27-44.
Ernest, J.T., & Krill, A.E. (1971). The effect of hypoxia on visual function. Psychophysical studies. Invest Ophthalmol Vis Sci, 10, 323-328.
Jennings, B.J., & Barbur, J.L. (2010). Colour detection thresh-olds as a function of chromatic adaptation and light level. Ophthalmic Physiol Opt, 30, 560-567.
Karakucuk, S., Oner, A. O., Goktas, S., Siki, E., & Kose, O. (2004). Color vision changes in young subjects acutely exposed to 3,000 m altitude. Aviat Space Environ Med, 75, 364-366.
8
Kobrick, J.L. (1970). Effects of hypoxia and acetazolamide on color sensitivity zones in the visual field. J Appl Physiol, 28, 741-747.
Kobrick, J.L., Zwick, H., Witt, C.E., & Devine, J.A. (1984). Effects of extended hypoxia on night vision. Aviat Space Environ Med, 55, 191-195.
Mollon, J.D., & Regan, B.C. (1999). Cambridge Colour Test Handbook, ver 1.0. Cambridge, UK: Cambridge Research System.
Otis, A., Rahn, H., Epstein, M.A., & Fenn, W.O. (1946). Per-formance as related to composition of alveolar air. Am J Physiol, 146, 207-221.
Rabin, J. (1996). Cone-specific measures of human color vision. Invest Ophthalmol Vis Sci, 37, 2771-2774.
Rahn, H., Otis, A.B., Hodge, M., Epstein, M.A., Hunter, S.W., & Fenn, W.O. (1946). The effects of hypocapnia on per-formance. J Aviat Med, 17, 164-172.
Regan, B.C., Reffin, J.P., & Mollon, J.D. (1994). Luminance noise and the rapid determination of discrimination ellipses in colour deficiency. Vision Res, 34, 1279-1299.
Richalet, J.P., Duval-Arnould, G., Darnaud, B., Keromes, A., & Rutgers, V. (1988). Modification of colour vision in the green/red axis in acute and chronic hypoxia explored with a portable anomaloscope. Aviat Space Environ Med, 59, 620-623.
Richalet, J.P., Rutgers, V., Bouchet, P., Rymer, J.C., Keromes, A., Duval-Arnould, G., & Rathat, C. (1989). Diurnal variations of acute mountain sickness, colour vision, and plasma cortisol and ACTH at high altitude. Aviat Space Environ Med, 60, 105-111.
Schellart, N.A., Pollen, M. & van der Kley, A. (1997). Effect of dysoxia and moderate air-hyperbarism on red-green color sensitivity. Undersea Hyperb Med, 24, 7-13.
Schmidt, I. (1937). Farbensinnuntersuchungen an normalen and anomalen trichromaten im unterdruck. Farbensinn-prufungen bei der Luftfahrt, 2, 55-68.
Smith, V.C., Ernest, J.T., & Pokorny, J. (1976). Effect of hypoxia on FM 100-Hue test performance. Mod Probl Ophthalmol, 17, 248-256.
Vingrys, A.J., & Garner, L.F. (1987). The effect of a moderate level of hypoxia on human color vision. Doc Ophthalmol, 66, 171-185.
Walraven, P.L., & Bouman, M.A. (1966). Fluctuation theory of colour discrimination of normal trichromats. Vision Res, 6, 567-558.