hypoglycemia and jaundice in the breastfeeding …kansaslll.org/2014handouts/hypoglycemia and...
TRANSCRIPT
3/3/2014
1
Hypoglycemia and Jaundice in the Breastfeeding Newborn
Kathleen A. Marinelli MD, IBCLC, FABM, FAAP
March 2014
Chair, United States Breastfeeding Committee Board of Directors, Academy of Breastfeeding Medicine
Associate Professor of Pediatrics, Univ. of CT School of Medicine Neonatologist and CT Human Milk Research Center,
Connecticut Children's Medical Center
Faculty Disclosure Information
© K Marinelli MD, IBCLC 2014
I have nothing to disclose, except that I am a firm believer that human milk is
the optimal feeding for all human babies, with very few exceptions.
Kathleen A. Marinelli MD, IBCLC, FABM, FAAP
Following this discussion on hypoglycemia you will be able to:
To review the pathophysiology and definitions of hypoglycemia in the newborn.
To discuss risk factors and screening guidelines for hypoglycemia in the newborn.
To discuss strategies to avoid hypoglycemia in the breastfeeding infant.
To discuss treatment of hypoglycemia in the breastfeeding infant.
© K Marinelli MD, IBCLC 2014
K. Marinelli MD, IBCLC FABM
3/3/2014
2
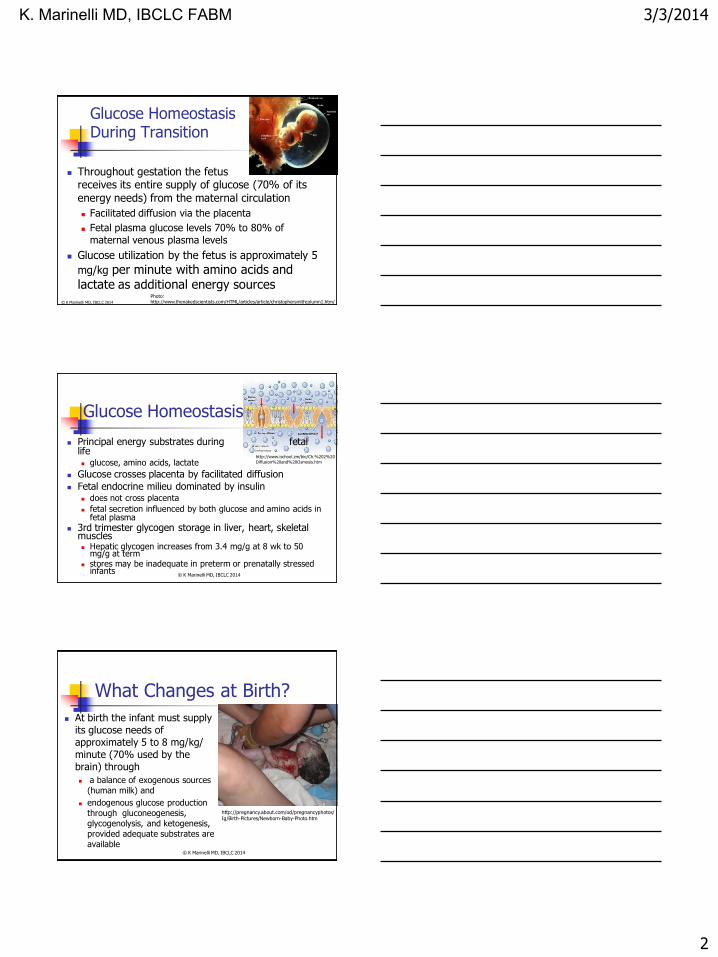
Glucose Homeostasis During Transition
Throughout gestation the fetus receives its entire supply of glucose (70% of its
energy needs) from the maternal circulation
Facilitated diffusion via the placenta
Fetal plasma glucose levels 70% to 80% of maternal venous plasma levels
Glucose utilization by the fetus is approximately 5
mg/kg per minute with amino acids and lactate as additional energy sources
Photo: http://www.thenakedscientists.com/HTML/articles/article/christophersmithcolumn1.htm/ © K Marinelli MD, IBCLC 2014
Principal energy substrates during fetal life glucose, amino acids, lactate
Glucose crosses placenta by facilitated diffusion
Fetal endocrine milieu dominated by insulin does not cross placenta
fetal secretion influenced by both glucose and amino acids in fetal plasma
3rd trimester glycogen storage in liver, heart, skeletal muscles Hepatic glycogen increases from 3.4 mg/g at 8 wk to 50
mg/g at term stores may be inadequate in preterm or prenatally stressed
infants
Glucose Homeostasis
http://www.ischool.zm/bio/Ch.%202%20
Diffusion%20and%20Osmosis.htm
© K Marinelli MD, IBCLC 2014
What Changes at Birth?
At birth the infant must supply its glucose needs of approximately 5 to 8 mg/kg/ minute (70% used by the brain) through
a balance of exogenous sources
(human milk) and
endogenous glucose production
through gluconeogenesis,
glycogenolysis, and ketogenesis,
provided adequate substrates are
available
http://pregnancy.about.com/od/pregnancyphotos/ Ig/Birth-Pictures/Newborn-Baby-Photo.htm
© K Marinelli MD, IBCLC 2014
K. Marinelli MD, IBCLC FABM
3/3/2014
3
Within minutes of cutting the umbilical cord:
3-to 5-fold surge in glucagon and catecholamines, which initiate glycogen breakdown;
high endogenous growth hormone and cortisol facilitate onset of gluconeogenesis within several hours;
insulin secretion is blunted so serum concentrations of insulin fall;
processes that ensure the availability of glucose and other fuels are collectively described as counter-regulation
activated primarily by glucagon and adrenalin. © K Marinelli MD, IBCLC 2014
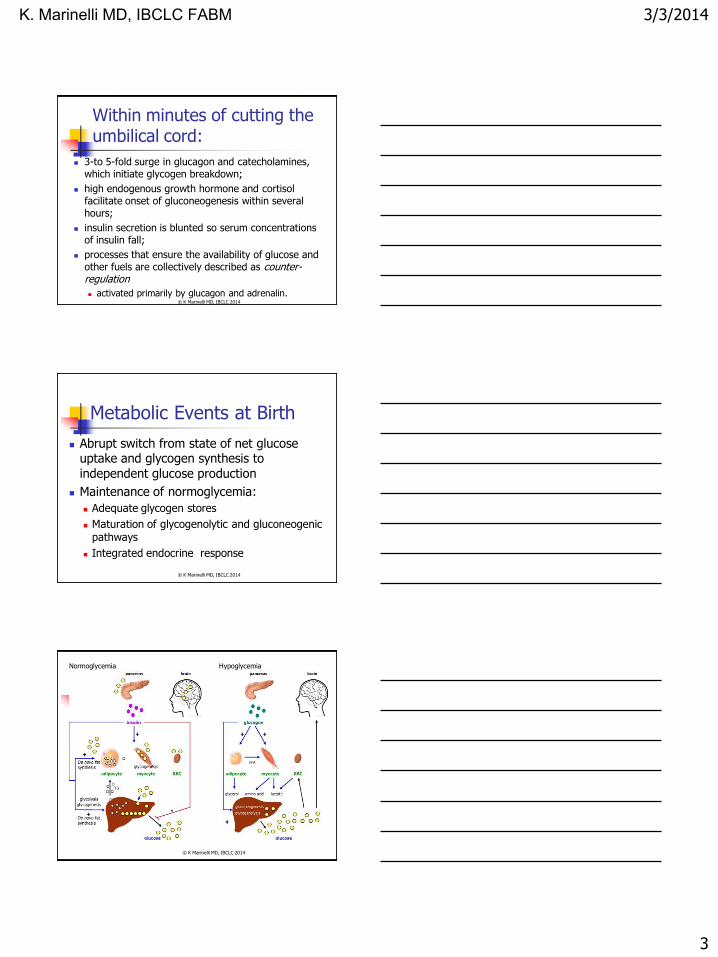
Metabolic Events at Birth
Abrupt switch from state of net glucose uptake and glycogen synthesis to independent glucose production
Maintenance of normoglycemia:
Adequate glycogen stores
Maturation of glycogenolytic and gluconeogenic pathways
Integrated endocrine response
© K Marinelli MD, IBCLC 2014
Normoglycemia Hypoglycemia
© K Marinelli MD, IBCLC 2014
K. Marinelli MD, IBCLC FABM
3/3/2014
4
Regulation of Blood Glucose After Birth
Utilization in tissues endogenous production
Insulin secreted in response to rises in blood
glucose
Counterregulatory hormones--glucagon and
adrenaline
Substrate concentration affects gluconeogenesis
Glucose--suppresses gluconeogenesis
Lactate, pyruvate, glucogenic amino acids--activate gluconeogenesis
© K Marinelli MD, IBCLC 2014
Metabolic Substrates After Birth
Blood glucose concentration falls in babies who are not fed
Healthy term (AGA) babies mobilize alternative substrates (free fatty acids, ketone bodies)
Breastfed babies have lower glucose, higher ketone bodies than formula fed
50% of energy in diet from fatty acids
© K Marinelli MD, IBCLC 2014
Hypoglycemia
The term refers to a low blood glucose concentration
Neonatal hypoglycemia is not a medical condition
a feature of illness
a failure to adapt from the fetal state of continuous transplacental glucose
consumption to the extrauterine pattern of intermittent nutrient supply
© K Marinelli MD, IBCLC 2014
K. Marinelli MD, IBCLC FABM
3/3/2014
5
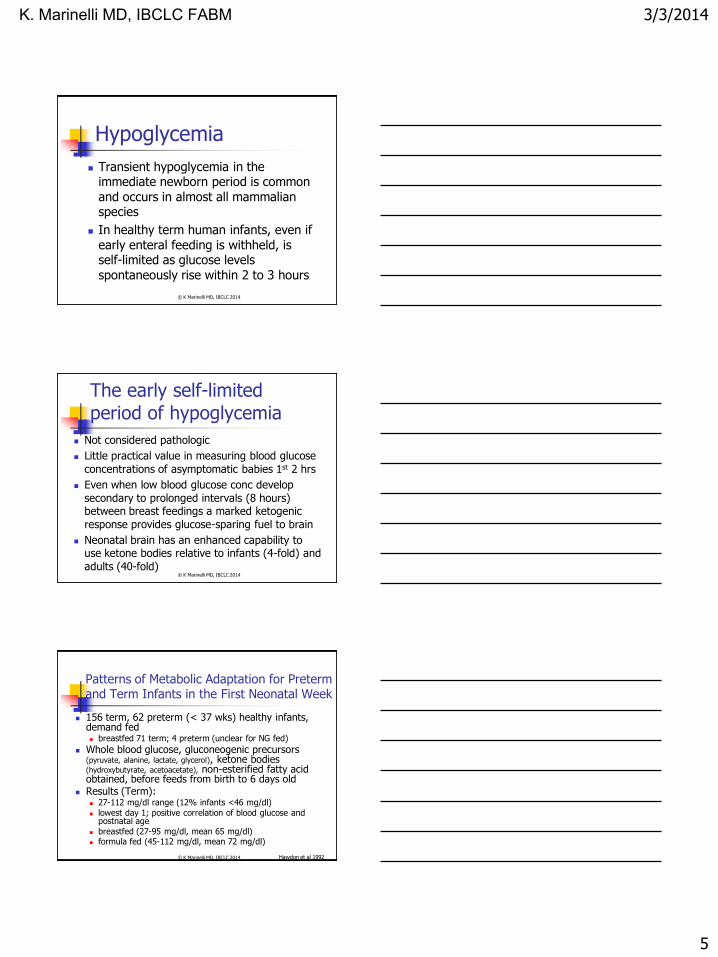
Hypoglycemia
Transient hypoglycemia in the immediate newborn period is common and occurs in almost all mammalian species
In healthy term human infants, even if early enteral feeding is withheld, is self-limited as glucose levels spontaneously rise within 2 to 3 hours
© K Marinelli MD, IBCLC 2014
The early self-limited period of hypoglycemia
Not considered pathologic
Little practical value in measuring blood glucose
concentrations of asymptomatic babies 1st 2 hrs
Even when low blood glucose conc develop
secondary to prolonged intervals (8 hours) between breast feedings a marked ketogenic
response provides glucose-sparing fuel to brain
Neonatal brain has an enhanced capability to use ketone bodies relative to infants (4-fold) and
adults (40-fold) © K Marinelli MD, IBCLC 2014
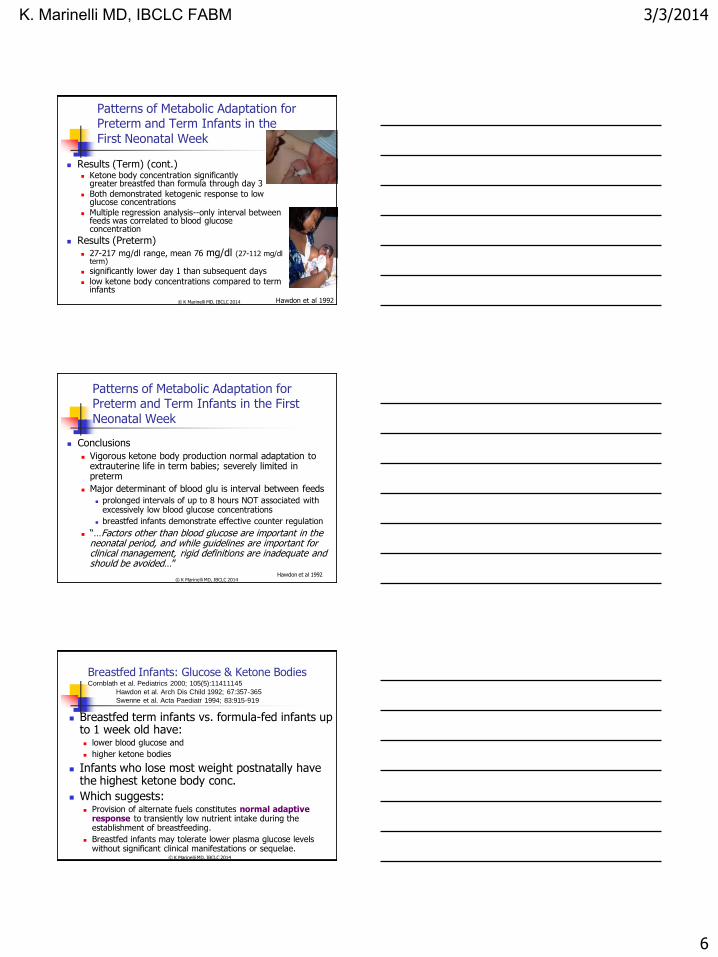
Patterns of Metabolic Adaptation for Preterm and Term Infants in the First Neonatal Week
156 term, 62 preterm (< 37 wks) healthy infants, demand fed breastfed 71 term; 4 preterm (unclear for NG fed)
Whole blood glucose, gluconeogenic precursors (pyruvate, alanine, lactate, glycerol), ketone bodies (hydroxybutyrate, acetoacetate), non-esterified fatty acid obtained, before feeds from birth to 6 days old
Results (Term): 27-112 mg/dl range (12% infants <46 mg/dl)
lowest day 1; positive correlation of blood glucose and postnatal age
breastfed (27-95 mg/dl, mean 65 mg/dl) formula fed (45-112 mg/dl, mean 72 mg/dl)
Hawdon et al 1992 © K Marinelli MD, IBCLC 2014
K. Marinelli MD, IBCLC FABM
3/3/2014
6
Patterns of Metabolic Adaptation for Preterm and Term Infants in the First Neonatal Week
Results (Term) (cont.) Ketone body concentration significantly
greater breastfed than formula through day 3
Both demonstrated ketogenic response to low glucose concentrations
Multiple regression analysis--only interval between feeds was correlated to blood glucose concentration
Results (Preterm) 27-217 mg/dl range, mean 76 mg/dl (27-112 mg/dl
term)
significantly lower day 1 than subsequent days
low ketone body concentrations compared to term infants
Hawdon et al 1992 © K Marinelli MD, IBCLC 2014
Patterns of Metabolic Adaptation for Preterm and Term Infants in the First Neonatal Week
Conclusions
Vigorous ketone body production normal adaptation to extrauterine life in term babies; severely limited in preterm
Major determinant of blood glu is interval between feeds
prolonged intervals of up to 8 hours NOT associated with excessively low blood glucose concentrations
breastfed infants demonstrate effective counter regulation
“…Factors other than blood glucose are important in the neonatal period, and while guidelines are important for clinical management, rigid definitions are inadequate and should be avoided…”
Hawdon et al 1992 © K Marinelli MD, IBCLC 2014
Breastfed Infants: Glucose & Ketone Bodies Cornblath et al. Pediatrics 2000; 105(5):11411145
Hawdon et al. Arch Dis Child 1992; 67:357-365
Swenne et al. Acta Paediatr 1994; 83:915-919
Breastfed term infants vs. formula-fed infants up to 1 week old have: lower blood glucose and
higher ketone bodies
Infants who lose most weight postnatally have the highest ketone body conc.
Which suggests: Provision of alternate fuels constitutes normal adaptive
response to transiently low nutrient intake during the establishment of breastfeeding.
Breastfed infants may tolerate lower plasma glucose levels without significant clinical manifestations or sequelae.
© K Marinelli MD, IBCLC 2014
K. Marinelli MD, IBCLC FABM
3/3/2014
7
Breast fed vs. non-breast fed infant – difference in metabolic responses
Exclusively breast fed babies have lower glucose values than those fed infant formula.
Able to tolerate lower glucose levels without symptoms
Able to mount a higher ketogenic response Presence of milk (especially breast milk) in gut has
not only implications as glucose source but also acts as an agent in increasing activity of glucose producing hormones and enzymes
Plasma and gut amino acids and peptides have a more normal pattern after breast feeding compared to formula feeding
Martin Ward Platt et al , 2005 © K Marinelli MD, IBCLC 2014
If accept that optimally breastfed infant’s lower blood glucose is the physiologic norm, and breastfed infants tolerate lower plasma glucose levels without significant clinical
manifestations or sequelae
Assume adaptive metabolic response systems are functioning normally
© K Marinelli MD, IBCLC 2014
One case series of hypoglycemia in “healthy, breastfed term newborns” (Moore 1999)
all were feeding poorly at discharge
revealed no urinary ketones in any of the three symptomatic infants
suggesting a defective ketogenic response
to fasting
© K Marinelli MD, IBCLC 2014
K. Marinelli MD, IBCLC FABM
3/3/2014
8
What is a NORMAL glucose?
It depends!
No Consensus re Definition of
Hypoglycemia/ Normoglycemia
Values different in whole blood, plasma, serum
Glu concentration in plasma or serum 10-15% higher than in whole blood
Varying study methodologies (age of infant, feeding regimens, time
from last feeding) © K Marinelli MD, IBCLC 2014
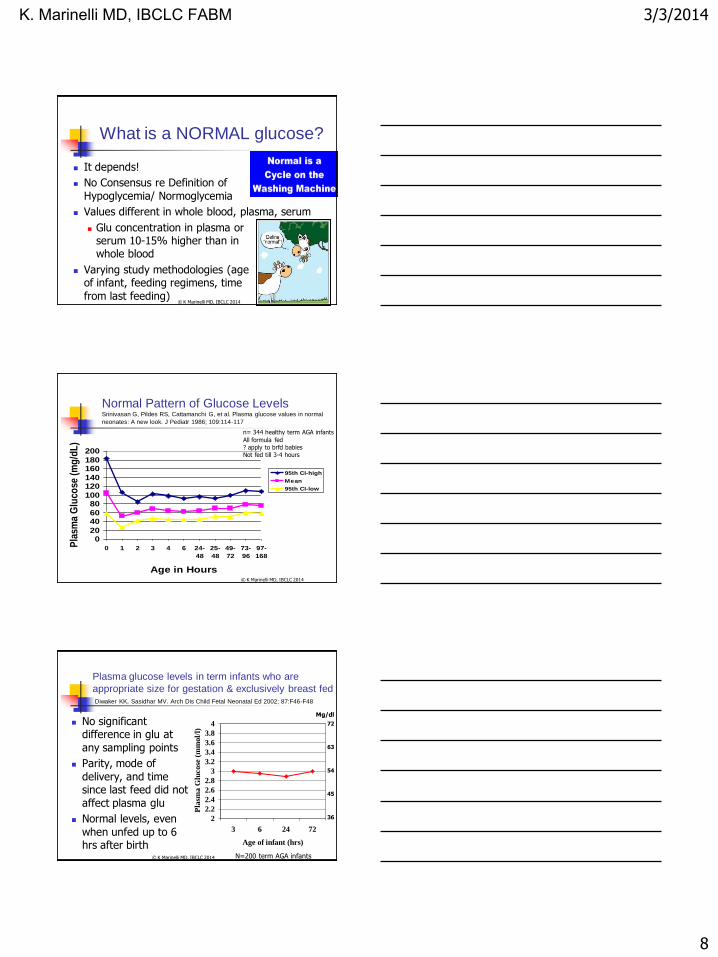
Normal Pattern of Glucose Levels Srinivasan G, Pildes RS, Cattamanchi G, et al. Plasma glucose values in normal
neonates: A new look. J Pediatr 1986; 109:114-117
020
4060
80100
120140
160180
200
0 1 2 3 4 6 24-
48
25-
48
49-
72
73-
96
97-
168
Age in Hours
Pla
sma
Glu
cose
(m
g/d
L)
95th CI-high
Mean
95th CI-low
n= 344 healthy term AGA infants
All formula fed
? apply to brfd babies
Not fed till 3-4 hours
© K Marinelli MD, IBCLC 2014
Plasma glucose levels in term infants who are
appropriate size for gestation & exclusively breast fed Diwaker KK, Sasidhar MV. Arch Dis Child Fetal Neonatal Ed 2002; 87:F46-F48
No significant difference in glu at
any sampling points
Parity, mode of
delivery, and time since last feed did not
affect plasma glu
Normal levels, even
when unfed up to 6 hrs after birth
2
2.2
2.4
2.6
2.8
3
3.2
3.4
3.6
3.8
4
3 6 24 72
Age of infant (hrs)
Pla
sma G
lucose
(m
mol/
l)
N=200 term AGA infants
54
45
63
Mg/dl
36
72
© K Marinelli MD, IBCLC 2014
K. Marinelli MD, IBCLC FABM
3/3/2014
9
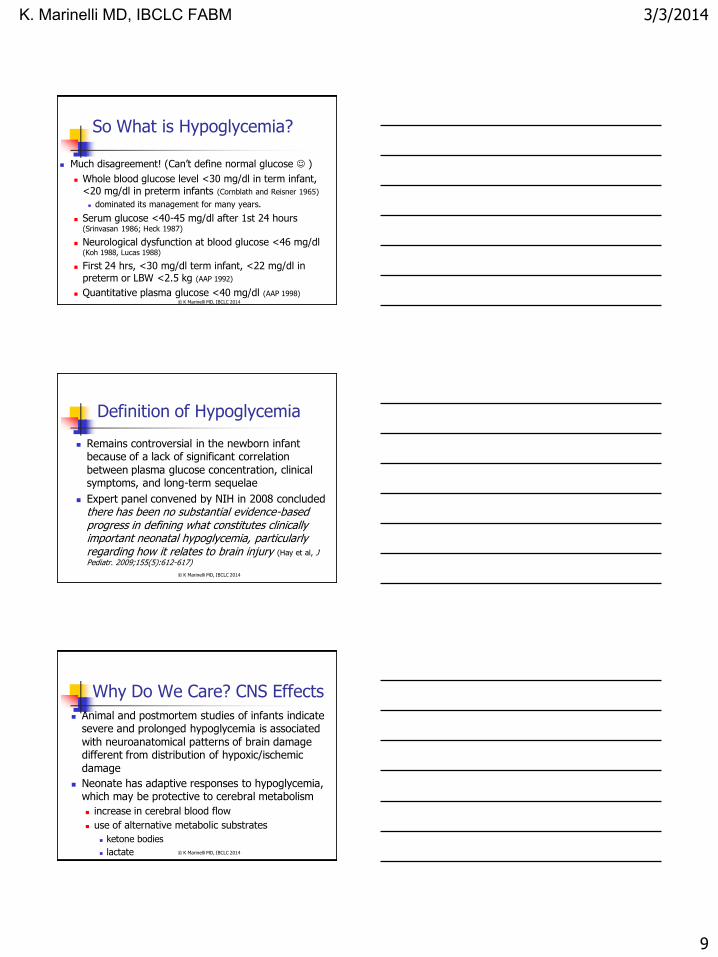
So What is Hypoglycemia?
Much disagreement! (Can’t define normal glucose )
Whole blood glucose level <30 mg/dl in term infant, <20 mg/dl in preterm infants (Cornblath and Reisner 1965)
dominated its management for many years.
Serum glucose <40-45 mg/dl after 1st 24 hours (Srinvasan 1986; Heck 1987)
Neurological dysfunction at blood glucose <46 mg/dl (Koh 1988, Lucas 1988)
First 24 hrs, <30 mg/dl term infant, <22 mg/dl in preterm or LBW <2.5 kg (AAP 1992)
Quantitative plasma glucose <40 mg/dl (AAP 1998)
© K Marinelli MD, IBCLC 2014
Definition of Hypoglycemia
Remains controversial in the newborn infant because of a lack of significant correlation
between plasma glucose concentration, clinical symptoms, and long-term sequelae
Expert panel convened by NIH in 2008 concluded there has been no substantial evidence-based progress in defining what constitutes clinically important neonatal hypoglycemia, particularly regarding how it relates to brain injury (Hay et al, J Pediatr. 2009;155(5):612-617)
© K Marinelli MD, IBCLC 2014
Why Do We Care? CNS Effects
Animal and postmortem studies of infants indicate severe and prolonged hypoglycemia is associated
with neuroanatomical patterns of brain damage different from distribution of hypoxic/ischemic
damage
Neonate has adaptive responses to hypoglycemia, which may be protective to cerebral metabolism
increase in cerebral blood flow
use of alternative metabolic substrates
ketone bodies
lactate © K Marinelli MD, IBCLC 2014
K. Marinelli MD, IBCLC FABM
3/3/2014
10
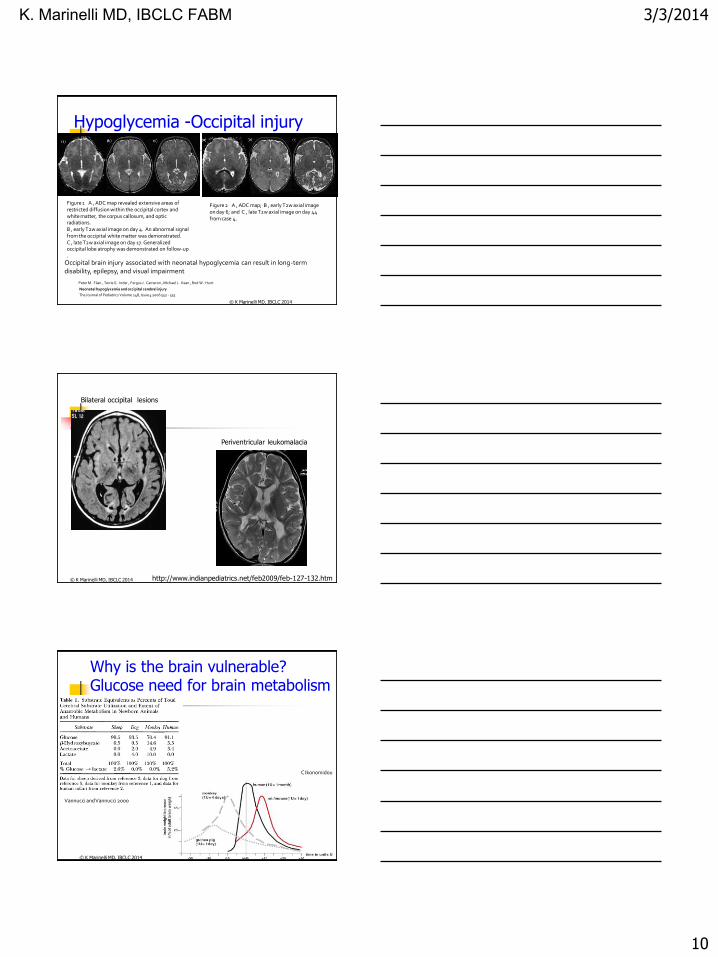
Figure 1 A , ADC map revealed extensive areas of restricted diffusion within the occipital cortex and white matter, the corpus callosum, and optic radiations. B , early T2w axial image on day 4. An abnormal signal from the occipital white matter was demonstrated. C , late T2w axial image on day 17. Generalized occipital lobe atrophy was demonstrated on follow-up .
Peter M. Filan , Terrie E. Inder , Fergus J. Cameron , Michael J. Kean , Rod W. Hunt
Neonatal hypoglycemia and occipital cerebral injury
The Journal of Pediatrics Volume 148, Issue 4 2006 552 - 555
Figure 2 A , ADC map; B , early T2w axial image on day 6; and C , late T2w axial image on day 44 from case 4.
Hypoglycemia -Occipital injury
Occipital brain injury associated with neonatal hypoglycemia can result in long-term disability, epilepsy, and visual impairment
© K Marinelli MD, IBCLC 2014
Bilateral occipital lesions
Periventricular leukomalacia
http://www.indianpediatrics.net/feb2009/feb-127-132.htm © K Marinelli MD, IBCLC 2014
Why is the brain vulnerable? Glucose need for brain metabolism
Vannucci and Vannucci 2000
C Ikonomidou
© K Marinelli MD, IBCLC 2014
K. Marinelli MD, IBCLC FABM
3/3/2014
11
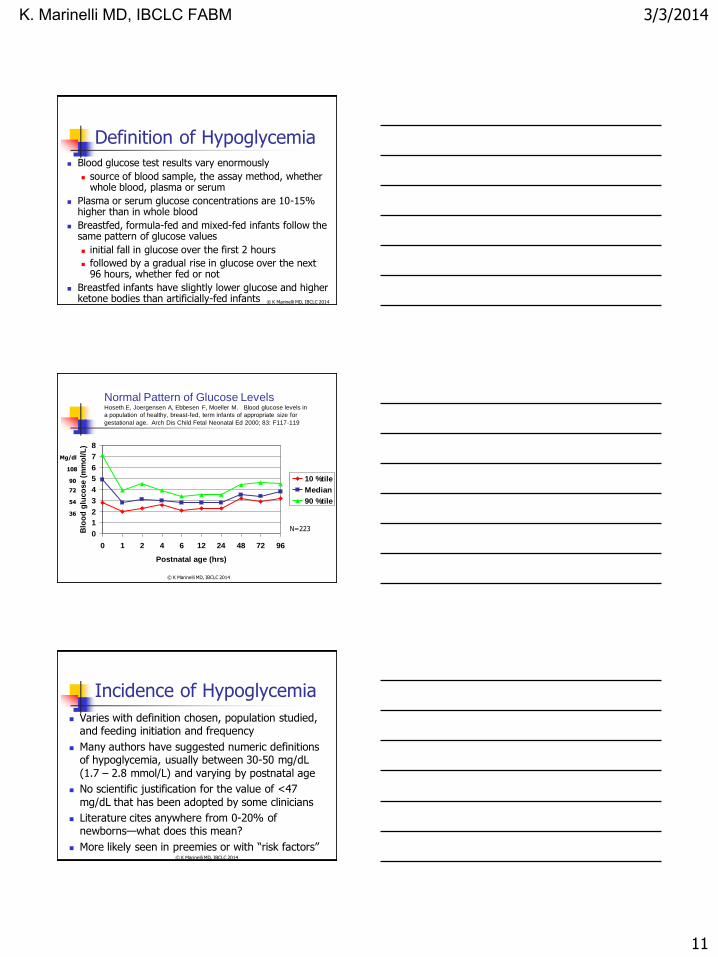
Definition of Hypoglycemia Blood glucose test results vary enormously
source of blood sample, the assay method, whether whole blood, plasma or serum
Plasma or serum glucose concentrations are 10-15% higher than in whole blood
Breastfed, formula-fed and mixed-fed infants follow the same pattern of glucose values
initial fall in glucose over the first 2 hours
followed by a gradual rise in glucose over the next 96 hours, whether fed or not
Breastfed infants have slightly lower glucose and higher ketone bodies than artificially-fed infants © K Marinelli MD, IBCLC 2014
Normal Pattern of Glucose Levels Hoseth E, Joergensen A, Ebbesen F, Moeller M. Blood glucose levels in
a population of healthy, breast-fed, term infants of appropriate size for
gestational age. Arch Dis Child Fetal Neonatal Ed 2000; 83: F117-119
0
1
2
3
4
5
6
7
8
0 1 2 4 6 12 24 48 72 96
Postnatal age (hrs)
Blo
od
glu
co
se (
mm
ol/
L)
10 %tile
Median
90 %tile
N=223
36
54
72
90
108
Mg/dl
© K Marinelli MD, IBCLC 2014
Incidence of Hypoglycemia
Varies with definition chosen, population studied, and feeding initiation and frequency
Many authors have suggested numeric definitions of hypoglycemia, usually between 30-50 mg/dL
(1.7 – 2.8 mmol/L) and varying by postnatal age
No scientific justification for the value of <47
mg/dL that has been adopted by some clinicians
Literature cites anywhere from 0-20% of newborns—what does this mean?
More likely seen in preemies or with “risk factors” © K Marinelli MD, IBCLC 2014
K. Marinelli MD, IBCLC FABM
3/3/2014
12
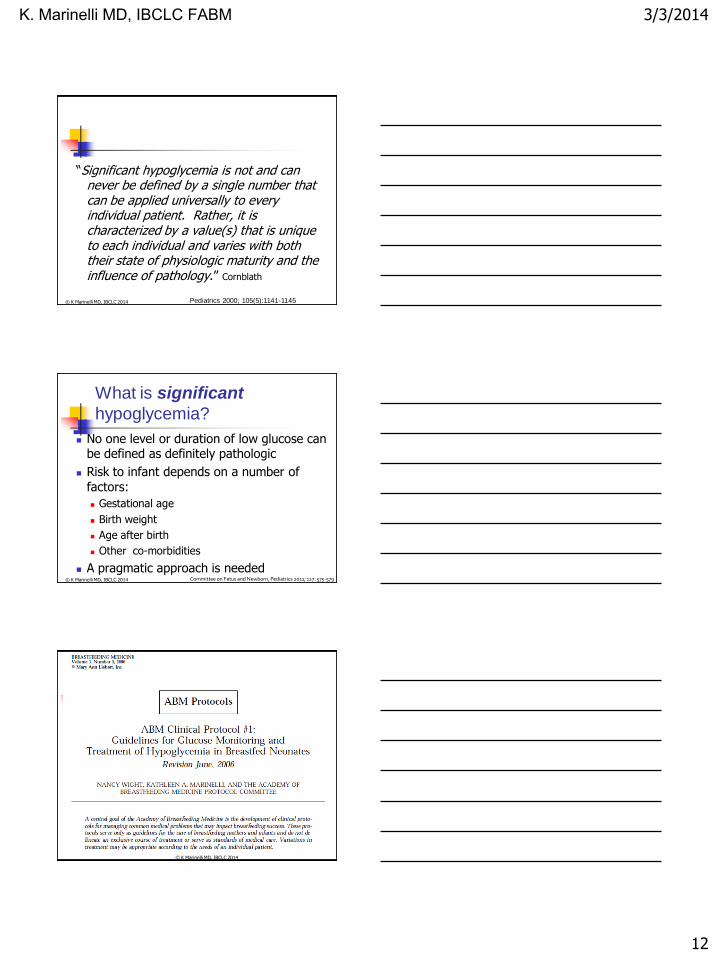
“Significant hypoglycemia is not and can never be defined by a single number that can be applied universally to every individual patient. Rather, it is characterized by a value(s) that is unique to each individual and varies with both their state of physiologic maturity and the influence of pathology.” Cornblath
Pediatrics 2000; 105(5):1141-1145 © K Marinelli MD, IBCLC 2014
What is significant
hypoglycemia?
No one level or duration of low glucose can be defined as definitely pathologic
Risk to infant depends on a number of factors:
Gestational age
Birth weight
Age after birth
Other co-morbidities
A pragmatic approach is needed Committee on Fetus and Newborn, Pediatrics 2011; 127: 575-579 © K Marinelli MD, IBCLC 2014
© K Marinelli MD, IBCLC 2014
K. Marinelli MD, IBCLC FABM
3/3/2014
13
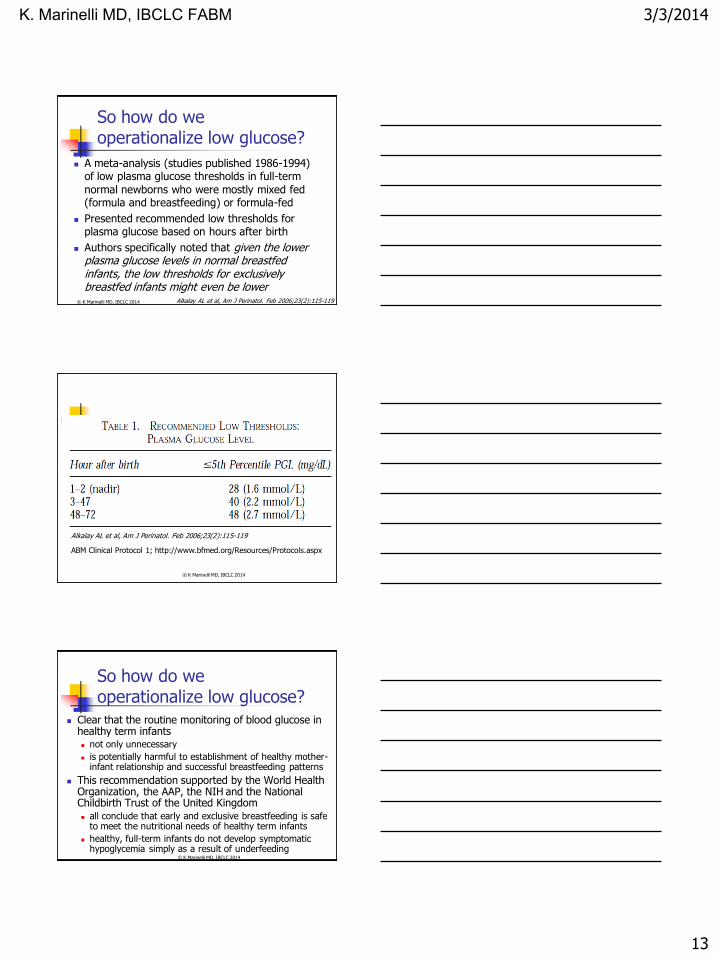
So how do we operationalize low glucose?
A meta-analysis (studies published 1986-1994) of low plasma glucose thresholds in full-term
normal newborns who were mostly mixed fed (formula and breastfeeding) or formula-fed
Presented recommended low thresholds for plasma glucose based on hours after birth
Authors specifically noted that given the lower plasma glucose levels in normal breastfed infants, the low thresholds for exclusively breastfed infants might even be lower
Alkalay AL et al, Am J Perinatol. Feb 2006;23(2):115-119 © K Marinelli MD, IBCLC 2014
Alkalay AL et al, Am J Perinatol. Feb 2006;23(2):115-119
ABM Clinical Protocol 1; http://www.bfmed.org/Resources/Protocols.aspx
© K Marinelli MD, IBCLC 2014
So how do we operationalize low glucose?
Clear that the routine monitoring of blood glucose in healthy term infants not only unnecessary
is potentially harmful to establishment of healthy mother- infant relationship and successful breastfeeding patterns
This recommendation supported by the World Health Organization, the AAP, the NIH and the National Childbirth Trust of the United Kingdom all conclude that early and exclusive breastfeeding is safe
to meet the nutritional needs of healthy term infants
healthy, full-term infants do not develop symptomatic hypoglycemia simply as a result of underfeeding
© K Marinelli MD, IBCLC 2014
K. Marinelli MD, IBCLC FABM
3/3/2014
14
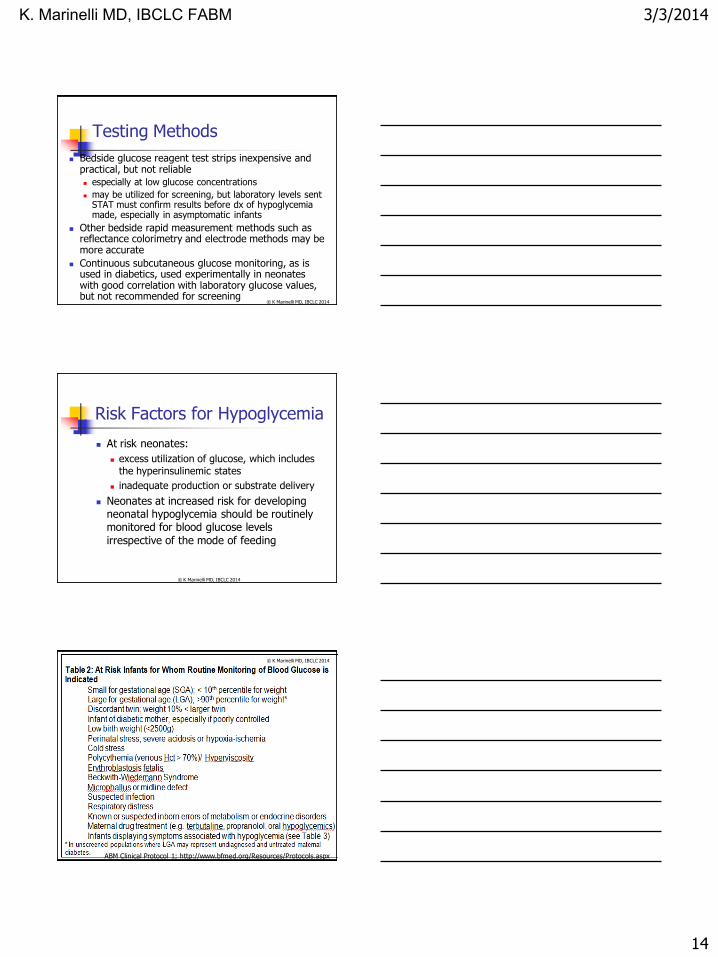
Testing Methods
Bedside glucose reagent test strips inexpensive and practical, but not reliable
especially at low glucose concentrations
may be utilized for screening, but laboratory levels sent STAT must confirm results before dx of hypoglycemia made, especially in asymptomatic infants
Other bedside rapid measurement methods such as reflectance colorimetry and electrode methods may be more accurate
Continuous subcutaneous glucose monitoring, as is used in diabetics, used experimentally in neonates with good correlation with laboratory glucose values, but not recommended for screening
© K Marinelli MD, IBCLC 2014
Risk Factors for Hypoglycemia
At risk neonates:
excess utilization of glucose, which includes the hyperinsulinemic states
inadequate production or substrate delivery
Neonates at increased risk for developing neonatal hypoglycemia should be routinely monitored for blood glucose levels
irrespective of the mode of feeding
© K Marinelli MD, IBCLC 2014
ABM Clinical Protocol 1; http://www.bfmed.org/Resources/Protocols.aspx
© K Marinelli MD, IBCLC 2014
K. Marinelli MD, IBCLC FABM

3/3/2014
15
Risk Factors for Hypoglycemia
Prematurity
reduced energy reserves (fat, glycogen)
increased insulin:glucose ratio
decreased ketogenesis
immature gluconeogenic pathways
more sensitive to effects of hypoglycemia
© K Marinelli MD, IBCLC 2014
Risk Factors for Hypoglycemia
Small for gestational age heterogeneous group
most concern: <3rd percentile; asymmetric IUGR; ? abnormal end diastolic flow velocities (Hawdon 1972)
high brain:body mass ratio (increased glucose consumption)
reduced fat stores
delayed maturation of gluconeogenesis (Haymond 1974, Hawdon 1993)
hyperinsulinism © K Marinelli MD, IBCLC 2014
Risk Factors for Hypoglycemia
Stress hypoglycemia
Sepsis, perinatal asphyxia, cold stress
catecholamine response to stress central to counterregulation
circulatory failure leads to reduced mobilization of substrate from periphery,
accumulation of lactate, exhaustion of liver glycogen, reduced capacity for gluconeogenesis
© K Marinelli MD, IBCLC 2014
K. Marinelli MD, IBCLC FABM
3/3/2014
16
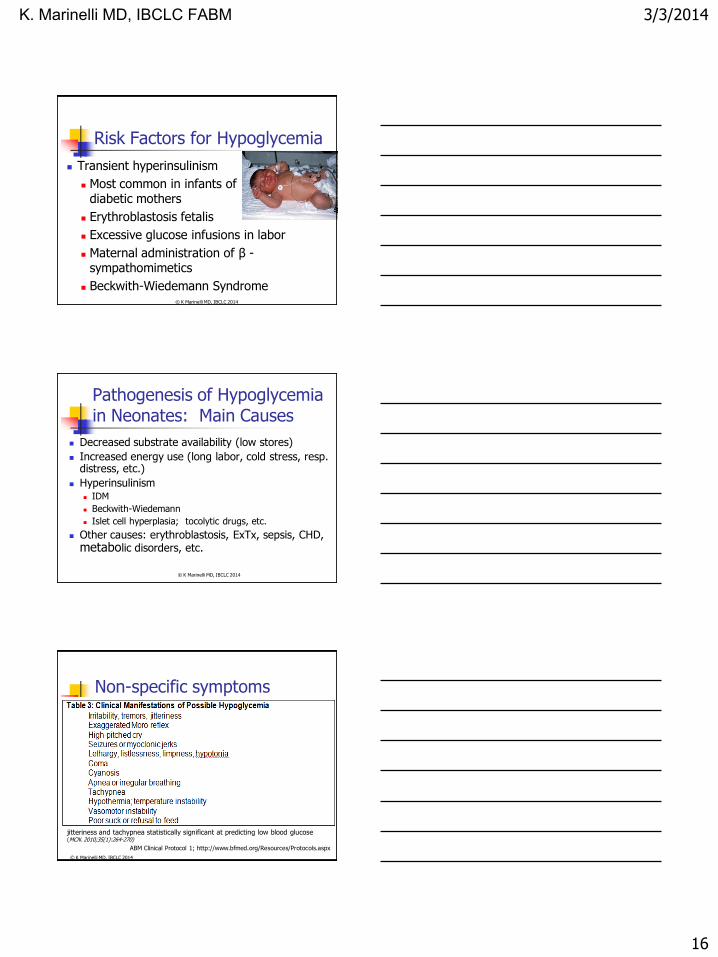
Risk Factors for Hypoglycemia
Transient hyperinsulinism
Most common in infants of diabetic mothers
Erythroblastosis fetalis
Excessive glucose infusions in labor
Maternal administration of β -sympathomimetics
Beckwith-Wiedemann Syndrome © K Marinelli MD, IBCLC 2014
Pathogenesis of Hypoglycemia in Neonates: Main Causes
Decreased substrate availability (low stores)
Increased energy use (long labor, cold stress, resp. distress, etc.)
Hyperinsulinism IDM
Beckwith-Wiedemann
Islet cell hyperplasia; tocolytic drugs, etc.
Other causes: erythroblastosis, ExTx, sepsis, CHD, metabolic disorders, etc.
© K Marinelli MD, IBCLC 2014
ABM Clinical Protocol 1; http://www.bfmed.org/Resources/Protocols.aspx
Non-specific symptoms
jitteriness and tachypnea statistically significant at predicting low blood glucose (MCN. 2010;35(1):264-270)
© K Marinelli MD, IBCLC 2014
K. Marinelli MD, IBCLC FABM
3/3/2014
17
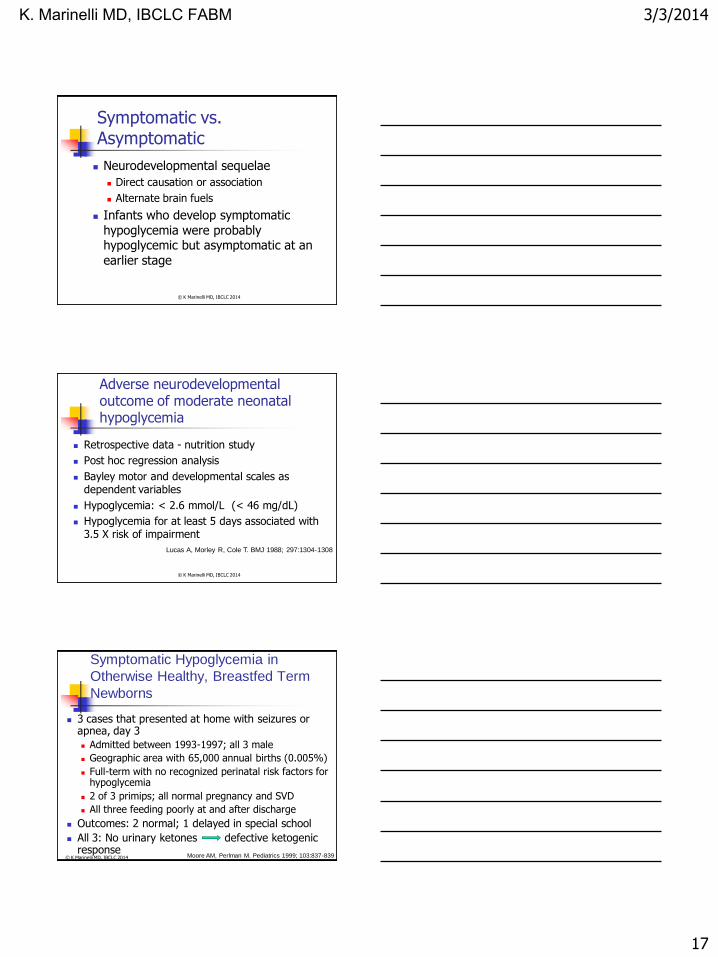
Symptomatic vs. Asymptomatic
Neurodevelopmental sequelae
Direct causation or association
Alternate brain fuels
Infants who develop symptomatic hypoglycemia were probably hypoglycemic but asymptomatic at an earlier stage
© K Marinelli MD, IBCLC 2014
Adverse neurodevelopmental outcome of moderate neonatal hypoglycemia
Retrospective data - nutrition study
Post hoc regression analysis
Bayley motor and developmental scales as dependent variables
Hypoglycemia: < 2.6 mmol/L (< 46 mg/dL)
Hypoglycemia for at least 5 days associated with 3.5 X risk of impairment
Lucas A, Morley R, Cole T. BMJ 1988; 297:1304-1308
© K Marinelli MD, IBCLC 2014
Symptomatic Hypoglycemia in
Otherwise Healthy, Breastfed Term
Newborns
3 cases that presented at home with seizures or apnea, day 3
Admitted between 1993-1997; all 3 male
Geographic area with 65,000 annual births (0.005%)
Full-term with no recognized perinatal risk factors for hypoglycemia
2 of 3 primips; all normal pregnancy and SVD
All three feeding poorly at and after discharge
Outcomes: 2 normal; 1 delayed in special school
All 3: No urinary ketones defective ketogenic response
Moore AM, Perlman M. Pediatrics 1999; 103:837-839 © K Marinelli MD, IBCLC 2014
K. Marinelli MD, IBCLC FABM
3/3/2014
18
Hypoglycemia and the
neonatal brain
“Evidence from studies of humans and other animals suggests that cortical damage and long-term sequelae occur after prolonged hypoglycemia sufficiently severe to cause neurologic signs.”
JM Hawdon. Eur J Pediatr 1999; 158(Suppl 1): S9-12 © K Marinelli MD, IBCLC 2014
Prevention of Hypoglycemia
Antenatal good control of maternal diabetes
Intrapartum avoid excessive maternal glucose infusion
Early Postpartum dried immediately to reduce evaporative heat loss which
increases energy demands
skin-to-skin contact as soon as possible to maintain core temperature and facilitate suckling and milk production
early enteral feeds should have the highest priority in healthy infants, whether term or preterm (Williams 1997)
© K Marinelli MD, IBCLC 2014
Feeding
“Most effective method of preventing hypoglycemia is feeding with milk as soon as possible after delivery” (Williams 1997)
Breastmilk preferred over formula promotes ketogenesis
formula has insulinogenic effect (Lucas 1981)
No justification for prelacteal glucose water feeds glucose water lower energy density than milk
no evidence that aspiration of colostrum any more harmful than that of glucose or water
Infants who cannot feed should be started on an appropriate IV glucose infusion
© K Marinelli MD, IBCLC 2014
K. Marinelli MD, IBCLC FABM
3/3/2014
19
To Prevent/Minimize
Hypoglycemia
Assess Hx, PE for risk factors for hypoglycemia
Very selective glucose screening
Mother and infant continuously together Skin to skin
Early and frequent breastfeeding - within 30-60 minutes of birth
© K Marinelli MD, IBCLC 2014
Hypoglycemia: Clinical
Management General Principles
Account for the overall metabolic and physiologic status of the infant;
Not necessary to disrupt the mother-infant relationship and breastfeeding;
Immediate intervention needed for infants with clinical signs/ symptoms because severe, prolonged, symptomatic hypoglycemia may result in neurologic injury;
© K Marinelli MD, IBCLC 2014
Hypoglycemia: Clinical
Management General Principles
Monitor infants at highest risk;
Confirm plasma glucose is low;
Demonstrate that symptoms resolve after restoring plasma glucose to normal;
Observe and document all these events
© K Marinelli MD, IBCLC 2014
K. Marinelli MD, IBCLC FABM
3/3/2014
20
Healthy Term Infants
Early and exclusive breastfeeding meets nutritional and metabolic needs of healthy, term newborn infants
Healthy term infants do not develop symptomatic hypoglycemia simply as a result of underfeeding
Routine supplementation of healthy, term infants with water, glucose water or formula unnecessary and may interfere with establishing normal breastfeeding and normal metabolic compensatory mechanisms
Initiate breastfeeding within 30-60 minutes of life and continue on demand
Early breastfeeding not precluded because the infant meets criteria for glucose monitoring
© K Marinelli MD, IBCLC 2014
Healthy Term Infants
Initiation and establishment of breastfeeding is facilitated by skin-to-skin contact of mother and infant
Maintains normal infant body temperature and reduces energy expenditure (enabling maintenance of normal blood glucose) while stimulating suckling and milk production
Feedings should be frequent
10-12 times per 24 hrs first few days after birth
Routine monitoring of blood glucose in asymptomatic, term newborns is unnecessary and may be harmful
© K Marinelli MD, IBCLC 2014
AAP Committee on Fetus
and Newborn
“…no study has shown that treatment of a transiently low blood glucose level offers a better short-term or long-term outcome than the outcome resulting with no treatment…. Furthermore, there is no evidence that asymptomatic hypoglycemic infants will benefit from treatment.”
Pediatrics 1993; 92(3): 474-476
© K Marinelli MD, IBCLC 2014
K. Marinelli MD, IBCLC FABM
3/3/2014
21
At-risk or symptomatic infants
Screen for hypoglycemia; frequency and duration related to specific risk factors of individual infant
Suggest monitoring begin within 30-60 minutes for infants with suspected hyperinsulinemia, no later than 2 hours for infants in other risk categories
Monitoring should continue until acceptable, pre-prandial levels consistently obtained
Reasonable (although arbitrary) goal to maintain plasma glucose conc 40-50 mg/dl (2.2 to 2.8 mmol/L)
Bedside glucose screening tests must be confirmed by formal laboratory testing
Treatment should begin immediately in symptomatic infants
© K Marinelli MD, IBCLC 2014
Selective Screening for
Hypoglycemia
SGA (<10th %tile)
Discordant (smaller) twin
LGA (>90th %tile, in
certain populations)
IDM
LBW (<2500 gm)
Post-asphyxia
Erythroblastosis fetalis
Polycythemia/hyperviscosity
Cold stress/hypothermia
Presence of microphallus or midline defect
Beckwith-Wiedemann
Syndrome or other endocrine or inborn errors of metabolism
Other stressors, such as
RDS, sepsis, etc.
© K Marinelli MD, IBCLC 2014
Management of Documented Hypoglycemia: Asymptomatic Infant
Continue breastfeeding (approx every 1-2 hours) or feed 1-5 ml/kg of expressed human milk or
substitute nutrition
Recheck blood glu conc before subsequent
feedings until value is acceptable and stable
Avoid forced feedings
If glu remains low despite feedings, begin IV glu
Breastfeeding may continue during IV glu
Carefully document response to treatment
© K Marinelli MD, IBCLC 2014
K. Marinelli MD, IBCLC FABM
3/3/2014
22
Symptomatic Infant or with plasma glu levels < 20-25 mg/dL (< 1.1-1.4 mmol/L)
Initiate IV 10% glucose solution with mini-bolus
Do not rely on oral or intragastric feeding to correct
extreme or symptomatic hypoglycemia
Glu conc in symptomatic infants should be
maintained > 45 mg/dL (> 2.5 mmol/L)
Adjust IV rate by blood glu concentration
Encourage frequent breastfeeding
Monitor gluc conc before feedings as IV is weaned until values stabilize off intravenous fluids
Carefully document response to treatment © K Marinelli MD, IBCLC 2014
Supporting the Mother Normal, healthy baby developing hypoglycemia may
jeopardize breastfeeding Reassure mother nothing wrong with her milk,
supplementation usually temporary Have mother hand-express or pump milk; feed to her infant
help overcome feelings of maternal inadequacy help establish a full milk supply
stimulate breasts expression with appropriate frequency (8 times/24 hours) until baby latching and suckling well to protect milk supply
Keep infant at breast or return infant to the breast as soon as possible
Skin-to-skin care easily done may lessen the trauma of intervention also provide physiologic thermoregulation, metabolic homeostasis
© K Marinelli MD, IBCLC 2014
Breastfeeding Plans
Term infants to breast within an 30-60 min of delivery; demand feeds
thereafter (at least 10-12 breastfeedings/24 hours)
Healthy preterm infants (32-36 weeks) offer breast as soon as possible after birth; then Q 3
hours/on demand
supplemental feedings by NG or cup/ bottle to support breastfeeding behaviors
expressed mom’s milk; donor milk; formula until mom’s milk available
80-100 cc/kg/d sufficient to maintain blood glucose
decrease supplements as infant improves at breast
Baby Weigh Scale helpful in determining intake at breast © K Marinelli MD, IBCLC 2014
K. Marinelli MD, IBCLC FABM
3/3/2014
23
Breastfeeding Plans
Healthy preterm infants <32 weeks
initiate gavage feeds of expressed mom’s
milk/donor milk/formula at 60-80 cc/kg/d
smaller infants, initiate TPN, and advance on
gavage human milk per protocol
SGA infants
initiate enteral feeds of human milk, and/or TPN, early
feed Q 3 hours © K Marinelli MD, IBCLC 2014
Breastfeeding Plans Infants of diabetic mothers
hypoglycemia most likely occur first 24 hours of life breastfeed as soon as possible after birth, and
thereafter on demand, but frequently antenatal colostrum expression (Chapman 2013, Forster 2011,
Soltani 2012, Cox 2006)
if pre-feed blood glucose at 3 hours of age normal, unlikely to require supplements
if plasma glucose <47mg/dl at this age, institute supplementary feeds (MOM>PDHM>formula)
most studies of neurodevelopmental outcome among IDM’s similar to that of controls if hypoglycemia appropriately treated
© K Marinelli MD, IBCLC 2014
Summary
Clear routine monitoring of blood glucose in healthy term infants not only unnecessary, but potentially harmful to establishment of healthy mother-infant relationship and successful breastfeeding patterns
This recommendation has been supported by the World Health Organization, the AAP, the NIH, ABM,
and the National Childbirth Trust of the United Kingdom All conclude early and exclusive breastfeeding is safe to
meet the nutritional needs of healthy term infants
Healthy, full-term infants do not develop symptomatic hypoglycemia simply as a result of underfeeding
© K Marinelli MD, IBCLC 2014
K. Marinelli MD, IBCLC FABM
3/3/2014
24
Following this discussion on jaundice you will be able to:
Define jaundice and differentiate the types associated with breastfeeding.
Review the physiology of bilirubin.
Understand the relationship of jaundice and breastfeeding.
Know how to successfully support breastfeeding in the jaundiced baby, and
why it is so important to do so. © K Marinelli MD, IBCLC 2014
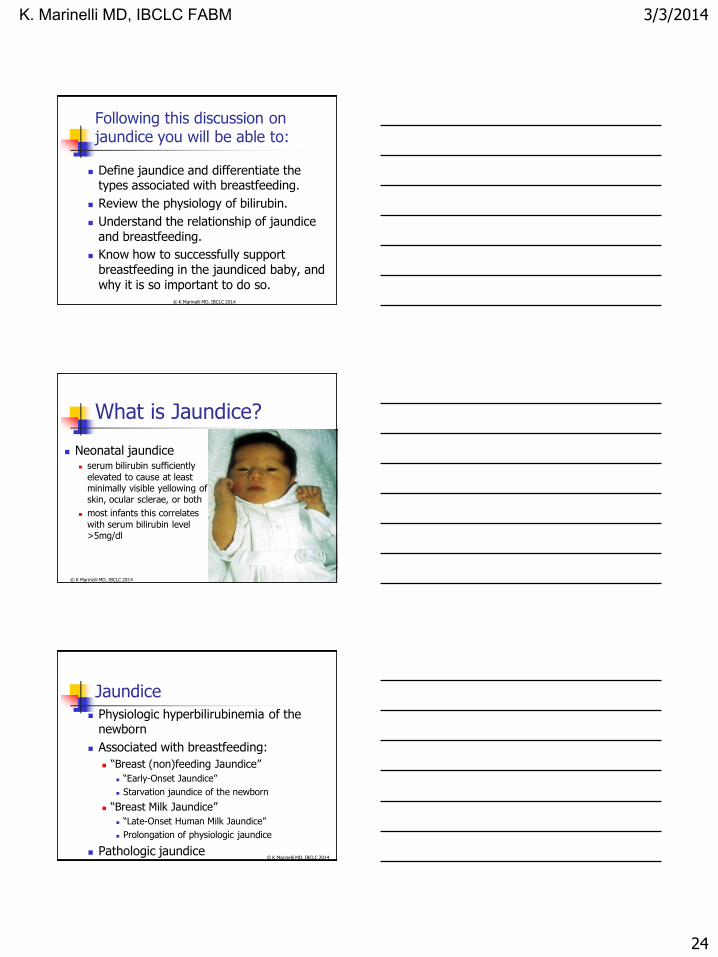
What is Jaundice?
Neonatal jaundice serum bilirubin sufficiently
elevated to cause at least minimally visible yellowing of skin, ocular sclerae, or both
most infants this correlates
with serum bilirubin level >5mg/dl
© K Marinelli MD, IBCLC 2014
Jaundice
Physiologic hyperbilirubinemia of the newborn
Associated with breastfeeding:
“Breast (non)feeding Jaundice”
“Early-Onset Jaundice”
Starvation jaundice of the newborn
“Breast Milk Jaundice”
“Late-Onset Human Milk Jaundice”
Prolongation of physiologic jaundice
Pathologic jaundice © K Marinelli MD, IBCLC 2014
K. Marinelli MD, IBCLC FABM
3/3/2014
25
Physiology of Neonatal Jaundice
Relatively low oxygen tension in utero
Fetus adapts by making more RBC’s
After delivery into relatively oxygen rich environment, infant ↓ need for so many RBC’s
Excess fetal cells have shortened half-life
Released Hgb broken down to heme in the reticuloendothelial
system (RES)
Cells in the RES oxidize heme to biliverdin
Biliverdin is water soluble
Rapidly degraded to bilirubin
One gram of Hgb produces 34 mg of bilirubin
© K Marinelli MD, IBCLC 2014
Biliverdin
Nontoxic, water-soluble green pigment
In primitive animals, amphibia, birds and
reptiles is major end-product of heme degradation
Why in mammals is water-soluble, non-toxic biliverdin converted to water-insoluble,
potentially toxic bilirubin?
© K Marinelli MD, IBCLC 2014
Biliverdin Theories
Fetus has significant heme degradation
Biliverdin cannot cross placenta to maternal circulation;
Large, polar molecule
Bilirubin crosses placenta,
Maternal liver disposes of it
Bilirubin is effective and potent antioxidant
Could physiologic jaundice provide an important
antioxidant for prevention of oxygen free radical injury during the newborn period, when other antioxidants
are not synthesized as readily?
© K Marinelli MD, IBCLC 2014
K. Marinelli MD, IBCLC FABM
3/3/2014
26
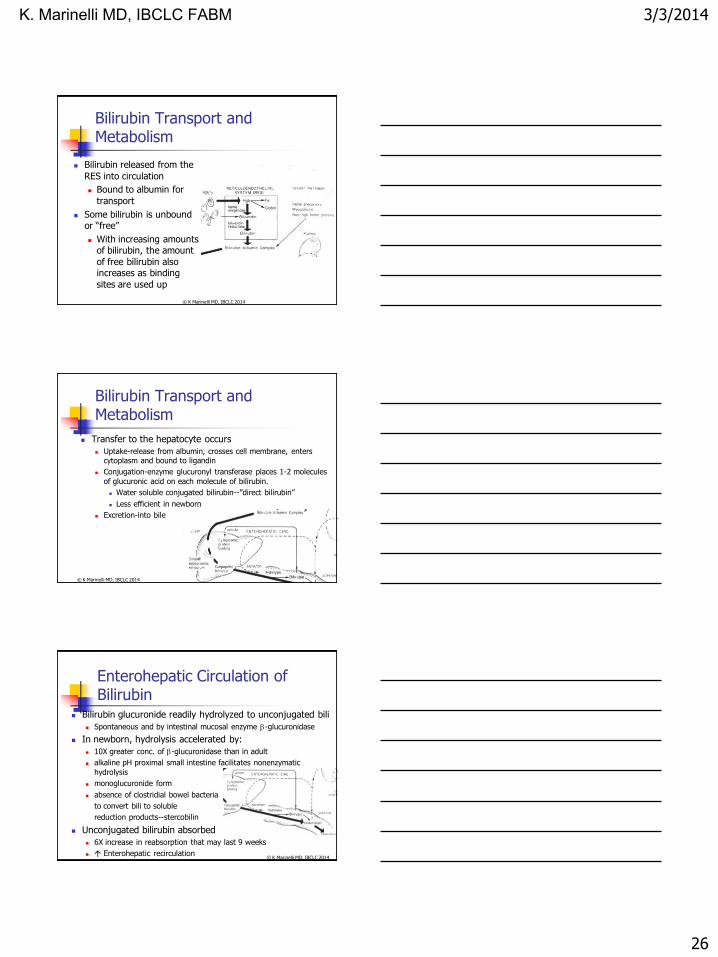
Bilirubin Transport and Metabolism
Bilirubin released from the
RES into circulation
Bound to albumin for
transport
Some bilirubin is unbound or “free”
With increasing amounts of bilirubin, the amount
of free bilirubin also increases as binding
sites are used up
© K Marinelli MD, IBCLC 2014
Bilirubin Transport and Metabolism
Transfer to the hepatocyte occurs
Uptake-release from albumin, crosses cell membrane, enters cytoplasm and bound to ligandin
Conjugation-enzyme glucuronyl transferase places 1-2 molecules
of glucuronic acid on each molecule of bilirubin.
Water soluble conjugated bilirubin--”direct bilirubin”
Less efficient in newborn
Excretion-into bile
© K Marinelli MD, IBCLC 2014
Enterohepatic Circulation of Bilirubin
Bilirubin glucuronide readily hydrolyzed to unconjugated bili
Spontaneous and by intestinal mucosal enzyme -glucuronidase
In newborn, hydrolysis accelerated by:
10X greater conc. of -glucuronidase than in adult
alkaline pH proximal small intestine facilitates nonenzymatic
hydrolysis
monoglucuronide form
absence of clostridial bowel bacteria
to convert bili to soluble
reduction products--stercobilin
Unconjugated bilirubin absorbed
6X increase in reabsorption that may last 9 weeks
Enterohepatic recirculation © K Marinelli MD, IBCLC 2014
K. Marinelli MD, IBCLC FABM
3/3/2014
27
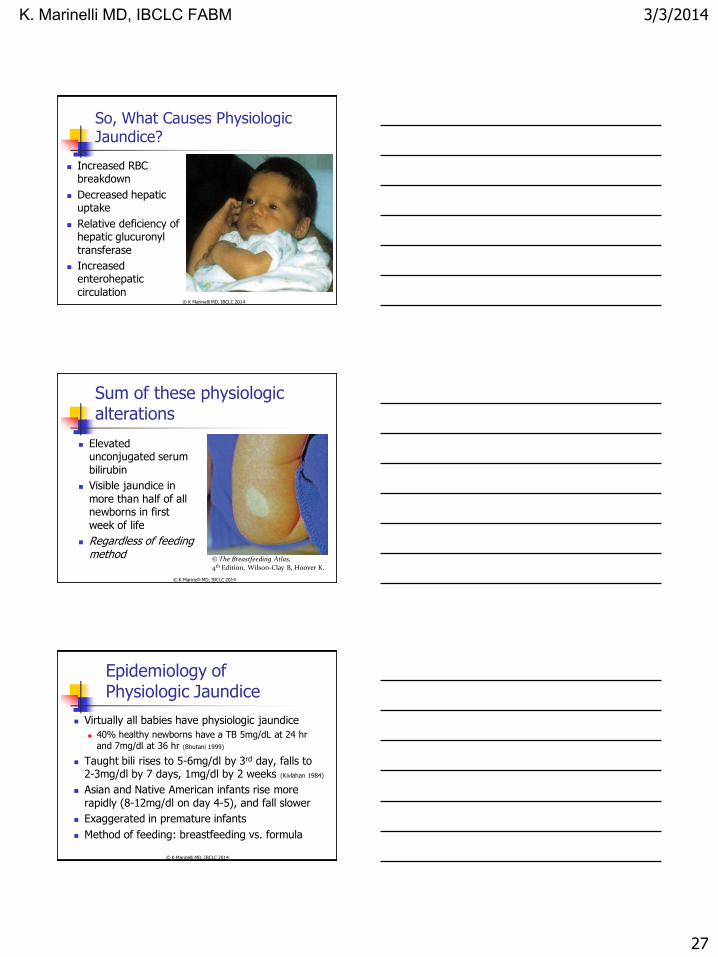
So, What Causes Physiologic Jaundice?
Increased RBC breakdown
Decreased hepatic uptake
Relative deficiency of hepatic glucuronyl
transferase
Increased enterohepatic
circulation © K Marinelli MD, IBCLC 2014
Sum of these physiologic alterations
Elevated unconjugated serum
bilirubin
Visible jaundice in
more than half of all newborns in first
week of life
Regardless of feeding method
© The Breastfeeding Atlas, 4th Edition, Wilson-Clay B, Hoover K.
© K Marinelli MD, IBCLC 2014
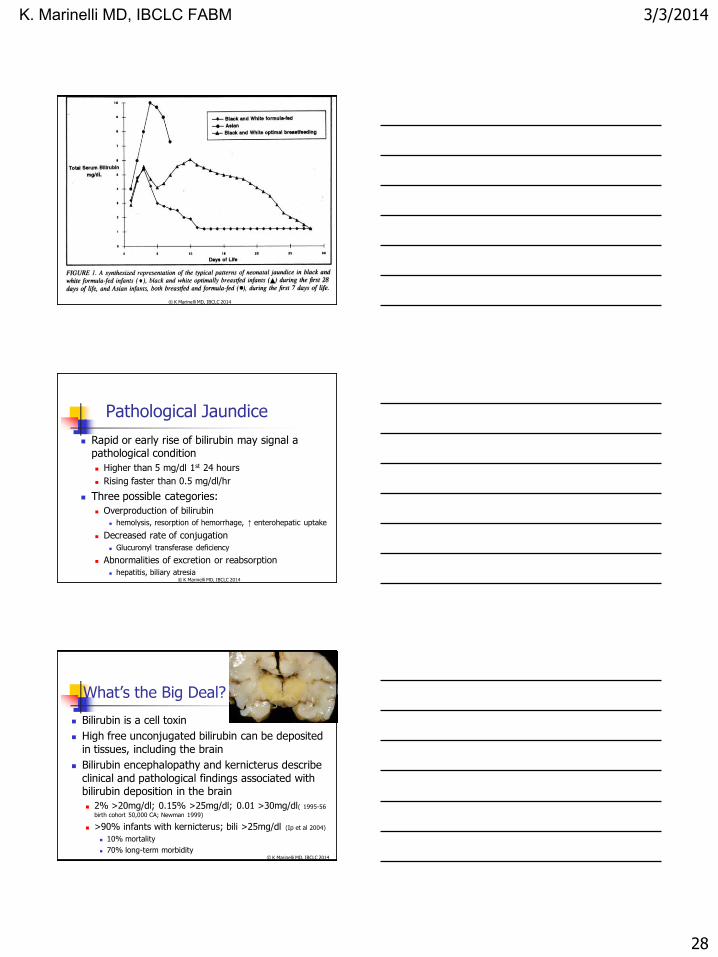
Epidemiology of Physiologic Jaundice
Virtually all babies have physiologic jaundice
40% healthy newborns have a TB 5mg/dL at 24 hr and 7mg/dl at 36 hr (Bhutani 1999)
Taught bili rises to 5-6mg/dl by 3rd day, falls to 2-3mg/dl by 7 days, 1mg/dl by 2 weeks (Kivlahan 1984)
Asian and Native American infants rise more
rapidly (8-12mg/dl on day 4-5), and fall slower
Exaggerated in premature infants
Method of feeding: breastfeeding vs. formula
© K Marinelli MD, IBCLC 2014
K. Marinelli MD, IBCLC FABM
3/3/2014
28
© K Marinelli MD, IBCLC 2014
Pathological Jaundice
Rapid or early rise of bilirubin may signal a pathological condition
Higher than 5 mg/dl 1st 24 hours
Rising faster than 0.5 mg/dl/hr
Three possible categories:
Overproduction of bilirubin
hemolysis, resorption of hemorrhage, ↑ enterohepatic uptake
Decreased rate of conjugation
Glucuronyl transferase deficiency
Abnormalities of excretion or reabsorption
hepatitis, biliary atresia © K Marinelli MD, IBCLC 2014
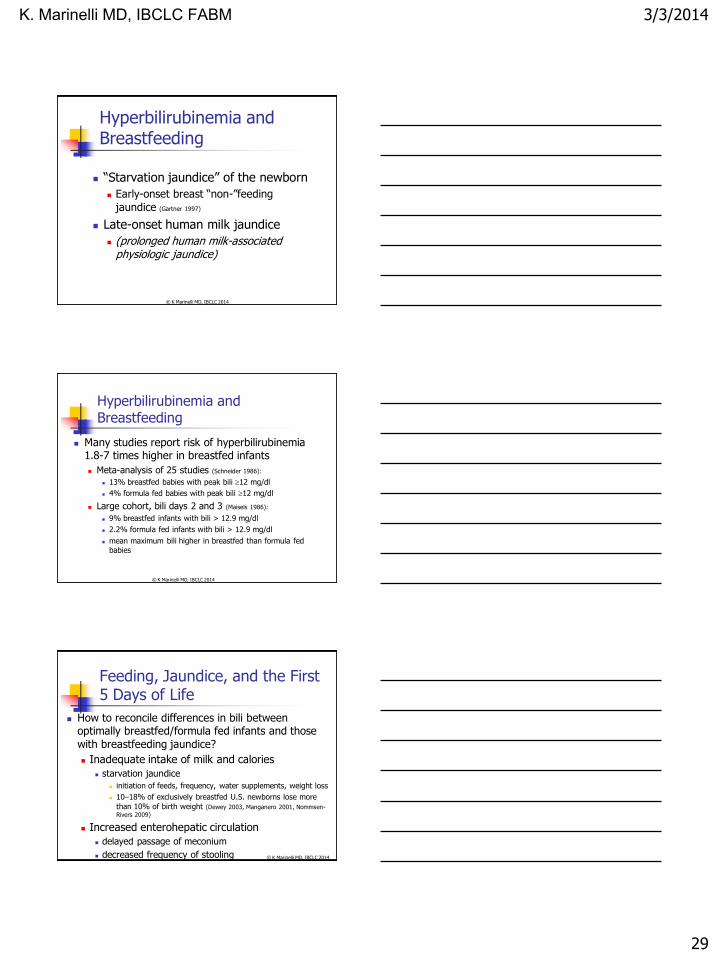
What’s the Big Deal?
Bilirubin is a cell toxin
High free unconjugated bilirubin can be deposited
in tissues, including the brain
Bilirubin encephalopathy and kernicterus describe
clinical and pathological findings associated with bilirubin deposition in the brain
2% >20mg/dl; 0.15% >25mg/dl; 0.01 >30mg/dl( 1995-56
birth cohort 50,000 CA; Newman 1999)
>90% infants with kernicterus; bili >25mg/dl (Ip et al 2004)
10% mortality
70% long-term morbidity © K Marinelli MD, IBCLC 2014
K. Marinelli MD, IBCLC FABM
3/3/2014
29
Hyperbilirubinemia and Breastfeeding
“Starvation jaundice” of the newborn
Early-onset breast “non-”feeding
jaundice (Gartner 1997)
Late-onset human milk jaundice
(prolonged human milk-associated physiologic jaundice)
© K Marinelli MD, IBCLC 2014
Hyperbilirubinemia and Breastfeeding
Many studies report risk of hyperbilirubinemia 1.8-7 times higher in breastfed infants
Meta-analysis of 25 studies (Schneider 1986):
13% breastfed babies with peak bili 12 mg/dl
4% formula fed babies with peak bili 12 mg/dl
Large cohort, bili days 2 and 3 (Maisels 1986):
9% breastfed infants with bili > 12.9 mg/dl
2.2% formula fed infants with bili > 12.9 mg/dl
mean maximum bili higher in breastfed than formula fed babies
© K Marinelli MD, IBCLC 2014
Feeding, Jaundice, and the First 5 Days of Life
How to reconcile differences in bili between optimally breastfed/formula fed infants and those
with breastfeeding jaundice?
Inadequate intake of milk and calories
starvation jaundice
initiation of feeds, frequency, water supplements, weight loss
10–18% of exclusively breastfed U.S. newborns lose more
than 10% of birth weight (Dewey 2003, Manganero 2001, Nommsen-
Rivers 2009)
Increased enterohepatic circulation
delayed passage of meconium
decreased frequency of stooling © K Marinelli MD, IBCLC 2014
K. Marinelli MD, IBCLC FABM
3/3/2014
30
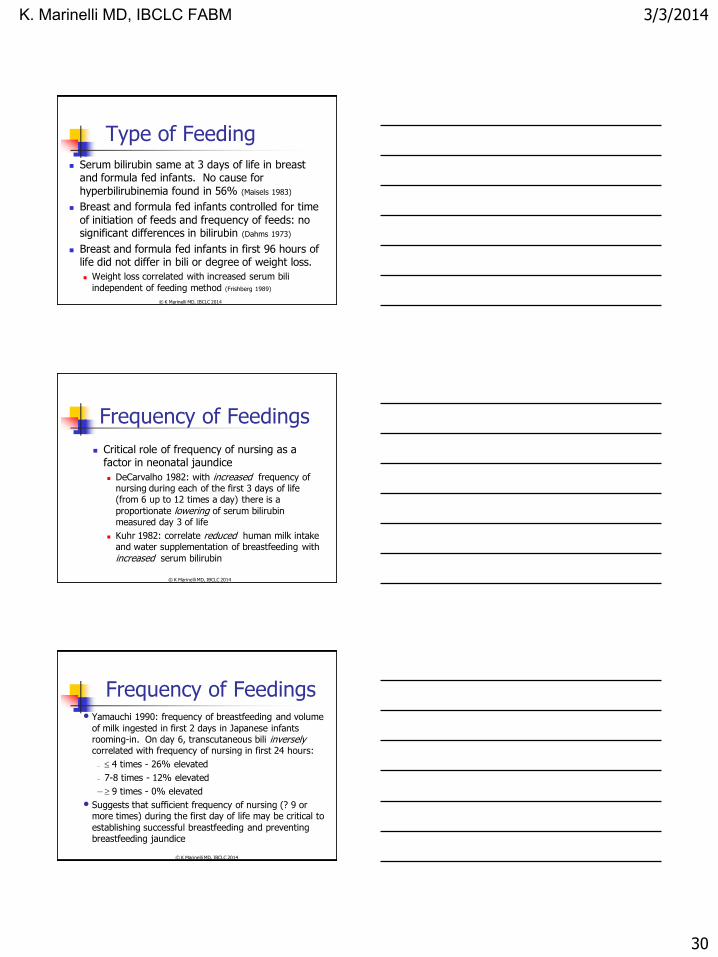
Type of Feeding
Serum bilirubin same at 3 days of life in breast and formula fed infants. No cause for
hyperbilirubinemia found in 56% (Maisels 1983)
Breast and formula fed infants controlled for time
of initiation of feeds and frequency of feeds: no significant differences in bilirubin (Dahms 1973)
Breast and formula fed infants in first 96 hours of life did not differ in bili or degree of weight loss.
Weight loss correlated with increased serum bili
independent of feeding method (Frishberg 1989)
© K Marinelli MD, IBCLC 2014
Frequency of Feedings
Critical role of frequency of nursing as a factor in neonatal jaundice
DeCarvalho 1982: with increased frequency of nursing during each of the first 3 days of life (from 6 up to 12 times a day) there is a
proportionate lowering of serum bilirubin measured day 3 of life
Kuhr 1982: correlate reduced human milk intake and water supplementation of breastfeeding with
increased serum bilirubin
© K Marinelli MD, IBCLC 2014
Frequency of Feedings • Yamauchi 1990: frequency of breastfeeding and volume
of milk ingested in first 2 days in Japanese infants rooming-in. On day 6, transcutaneous bili inversely correlated with frequency of nursing in first 24 hours:
4 times - 26% elevated
– 7-8 times - 12% elevated
9 times - 0% elevated
• Suggests that sufficient frequency of nursing (? 9 or more times) during the first day of life may be critical to
establishing successful breastfeeding and preventing breastfeeding jaundice
© K Marinelli MD, IBCLC 2014
K. Marinelli MD, IBCLC FABM
3/3/2014
31
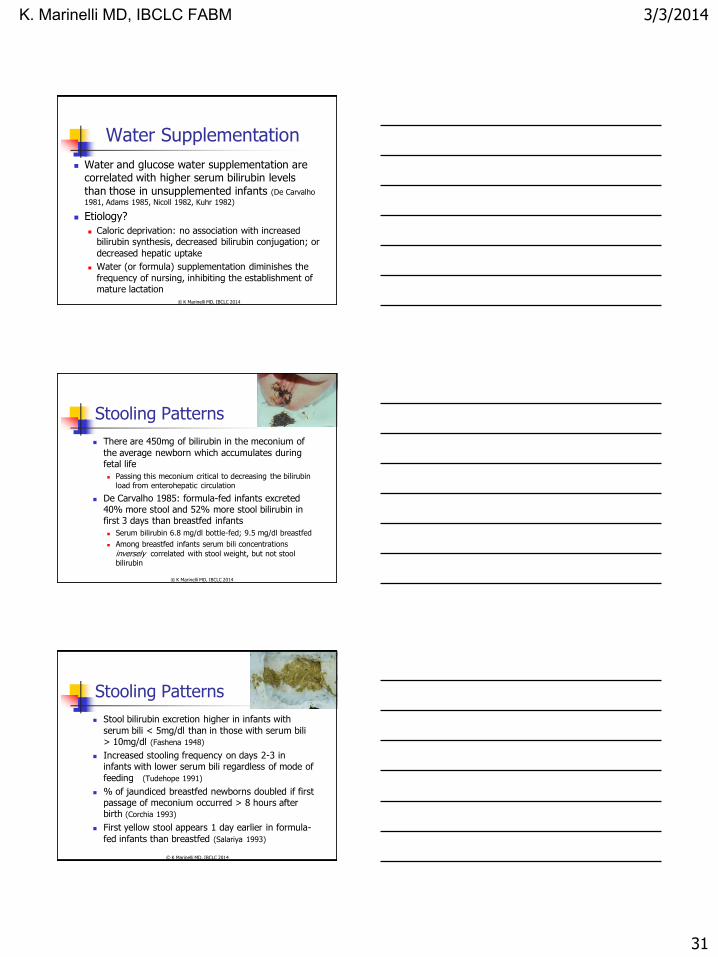
Water Supplementation
Water and glucose water supplementation are correlated with higher serum bilirubin levels
than those in unsupplemented infants (De Carvalho
1981, Adams 1985, Nicoll 1982, Kuhr 1982)
Etiology?
Caloric deprivation: no association with increased bilirubin synthesis, decreased bilirubin conjugation; or
decreased hepatic uptake
Water (or formula) supplementation diminishes the
frequency of nursing, inhibiting the establishment of mature lactation
© K Marinelli MD, IBCLC 2014
Stooling Patterns
There are 450mg of bilirubin in the meconium of
the average newborn which accumulates during fetal life
Passing this meconium critical to decreasing the bilirubin load from enterohepatic circulation
De Carvalho 1985: formula-fed infants excreted 40% more stool and 52% more stool bilirubin in first 3 days than breastfed infants
Serum bilirubin 6.8 mg/dl bottle-fed; 9.5 mg/dl breastfed
Among breastfed infants serum bili concentrations
inversely correlated with stool weight, but not stool bilirubin
© K Marinelli MD, IBCLC 2014
Stooling Patterns
Stool bilirubin excretion higher in infants with
serum bili < 5mg/dl than in those with serum bili > 10mg/dl (Fashena 1948)
Increased stooling frequency on days 2-3 in infants with lower serum bili regardless of mode of
feeding (Tudehope 1991)
% of jaundiced breastfed newborns doubled if first passage of meconium occurred > 8 hours after birth (Corchia 1993)
First yellow stool appears 1 day earlier in formula-
fed infants than breastfed (Salariya 1993)
© K Marinelli MD, IBCLC 2014
K. Marinelli MD, IBCLC FABM
3/3/2014
32
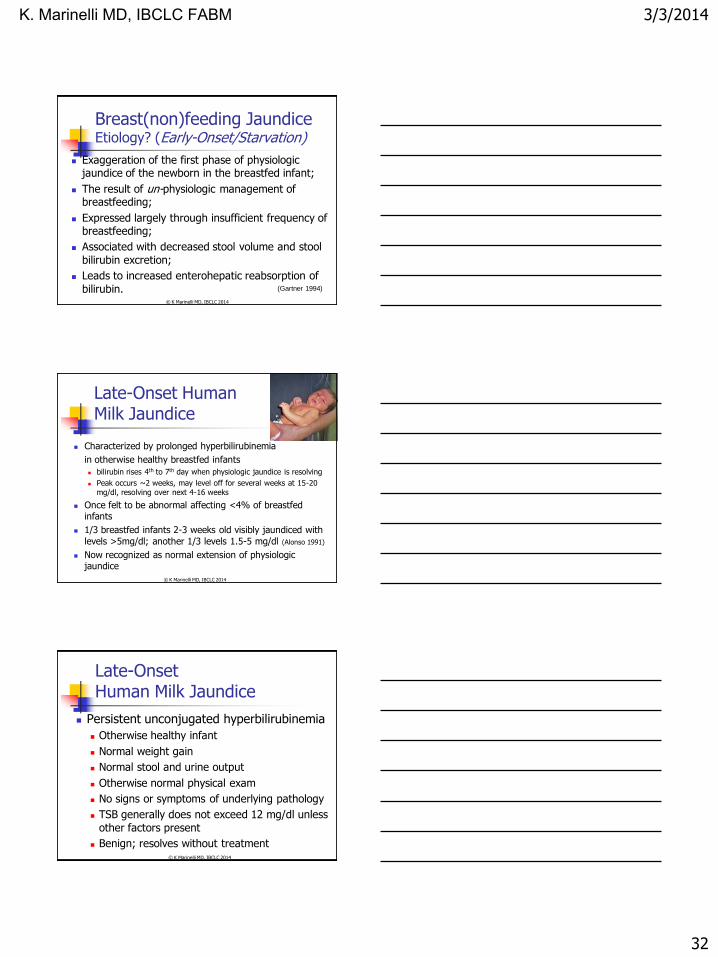
Breast(non)feeding Jaundice Etiology? (Early-Onset/Starvation)
Exaggeration of the first phase of physiologic jaundice of the newborn in the breastfed infant;
The result of un-physiologic management of breastfeeding;
Expressed largely through insufficient frequency of breastfeeding;
Associated with decreased stool volume and stool
bilirubin excretion;
Leads to increased enterohepatic reabsorption of
bilirubin. (Gartner 1994)
© K Marinelli MD, IBCLC 2014
Late-Onset Human Milk Jaundice
Characterized by prolonged hyperbilirubinemia
in otherwise healthy breastfed infants
bilirubin rises 4th to 7th day when physiologic jaundice is resolving
Peak occurs ~2 weeks, may level off for several weeks at 15-20 mg/dl, resolving over next 4-16 weeks
Once felt to be abnormal affecting <4% of breastfed infants
1/3 breastfed infants 2-3 weeks old visibly jaundiced with
levels >5mg/dl; another 1/3 levels 1.5-5 mg/dl (Alonso 1991)
Now recognized as normal extension of physiologic jaundice
© K Marinelli MD, IBCLC 2014
Late-Onset Human Milk Jaundice
Persistent unconjugated hyperbilirubinemia
Otherwise healthy infant
Normal weight gain
Normal stool and urine output
Otherwise normal physical exam
No signs or symptoms of underlying pathology
TSB generally does not exceed 12 mg/dl unless
other factors present
Benign; resolves without treatment
© K Marinelli MD, IBCLC 2014
K. Marinelli MD, IBCLC FABM
3/3/2014
33
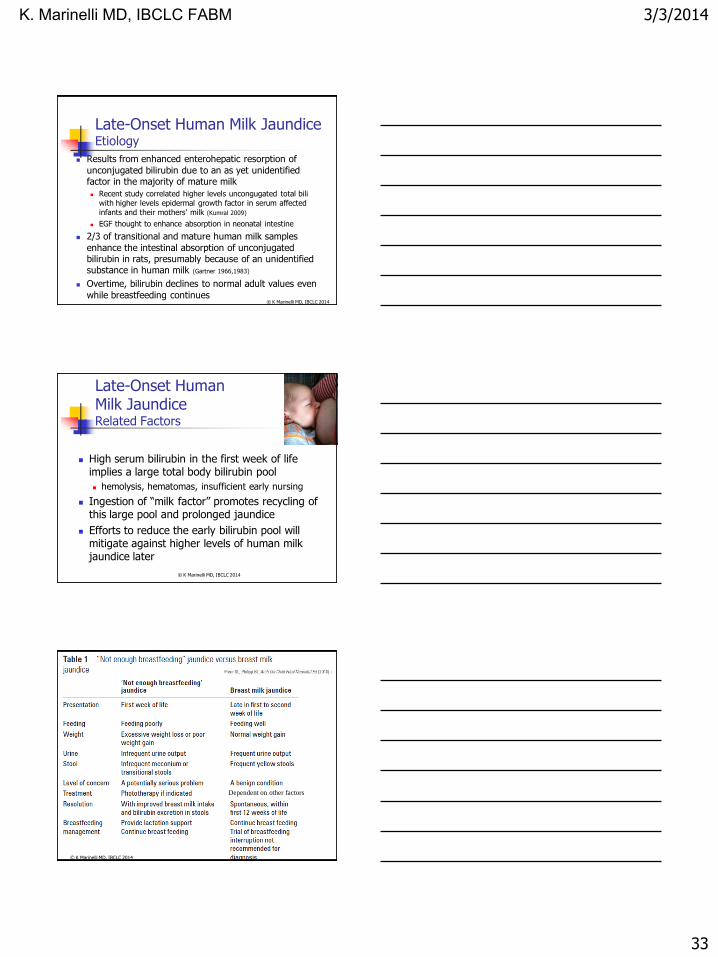
Late-Onset Human Milk Jaundice Etiology
Results from enhanced enterohepatic resorption of
unconjugated bilirubin due to an as yet unidentified factor in the majority of mature milk
Recent study correlated higher levels uncongugated total bili with higher levels epidermal growth factor in serum affected infants and their mothers’ milk (Kumral 2009)
EGF thought to enhance absorption in neonatal intestine
2/3 of transitional and mature human milk samples
enhance the intestinal absorption of unconjugated bilirubin in rats, presumably because of an unidentified substance in human milk (Gartner 1966,1983)
Overtime, bilirubin declines to normal adult values even
while breastfeeding continues © K Marinelli MD, IBCLC 2014
Late-Onset Human Milk Jaundice Related Factors
High serum bilirubin in the first week of life implies a large total body bilirubin pool
hemolysis, hematomas, insufficient early nursing
Ingestion of “milk factor” promotes recycling of this large pool and prolonged jaundice
Efforts to reduce the early bilirubin pool will mitigate against higher levels of human milk jaundice later
© K Marinelli MD, IBCLC 2014
Dependent on other factors
© K Marinelli MD, IBCLC 2014
K. Marinelli MD, IBCLC FABM
3/3/2014
34
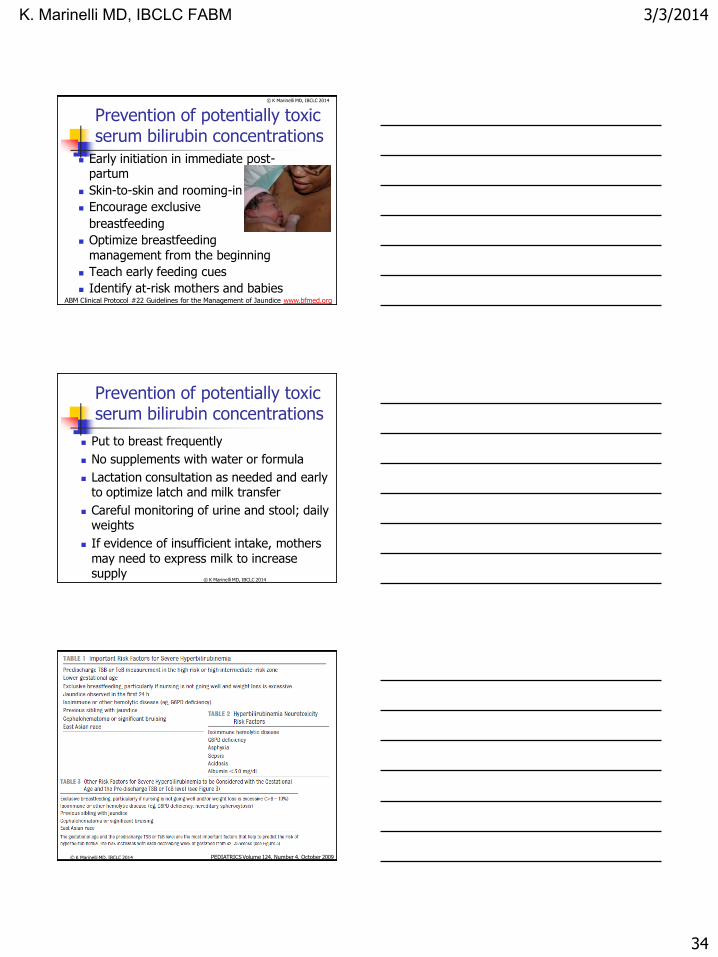
Prevention of potentially toxic serum bilirubin concentrations
Early initiation in immediate post-partum
Skin-to-skin and rooming-in
Encourage exclusive
breastfeeding
Optimize breastfeeding management from the beginning
Teach early feeding cues
Identify at-risk mothers and babies ABM Clinical Protocol #22 Guidelines for the Management of Jaundice www.bfmed.org
© K Marinelli MD, IBCLC 2014
Prevention of potentially toxic serum bilirubin concentrations
Put to breast frequently
No supplements with water or formula
Lactation consultation as needed and early to optimize latch and milk transfer
Careful monitoring of urine and stool; daily weights
If evidence of insufficient intake, mothers may need to express milk to increase supply
© K Marinelli MD, IBCLC 2014
PEDIATRICS Volume 124, Number 4, October 2009 © K Marinelli MD, IBCLC 2014
K. Marinelli MD, IBCLC FABM
3/3/2014
35
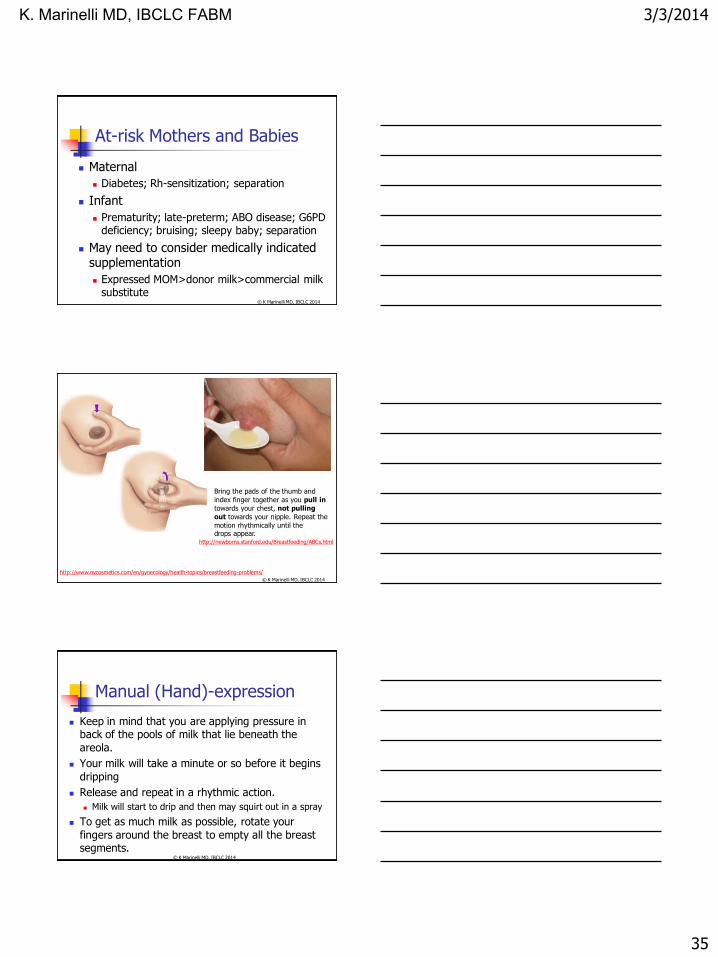
At-risk Mothers and Babies
Maternal
Diabetes; Rh-sensitization; separation
Infant
Prematurity; late-preterm; ABO disease; G6PD deficiency; bruising; sleepy baby; separation
May need to consider medically indicated supplementation
Expressed MOM>donor milk>commercial milk substitute
© K Marinelli MD, IBCLC 2014
http://www.nycosmetics.com/en/gynecology/health-topics/breastfeeding-problems/
Bring the pads of the thumb and
index finger together as you pull in
towards your chest, not pulling
out towards your nipple. Repeat the
motion rhythmically until the drops appear.
http://newborns.stanford.edu/Breastfeeding/ABCs.html
© K Marinelli MD, IBCLC 2014
Manual (Hand)-expression
Keep in mind that you are applying pressure in back of the pools of milk that lie beneath the
areola.
Your milk will take a minute or so before it begins
dripping
Release and repeat in a rhythmic action.
Milk will start to drip and then may squirt out in a spray
To get as much milk as possible, rotate your
fingers around the breast to empty all the breast segments.
© K Marinelli MD, IBCLC 2014
K. Marinelli MD, IBCLC FABM
3/3/2014
36
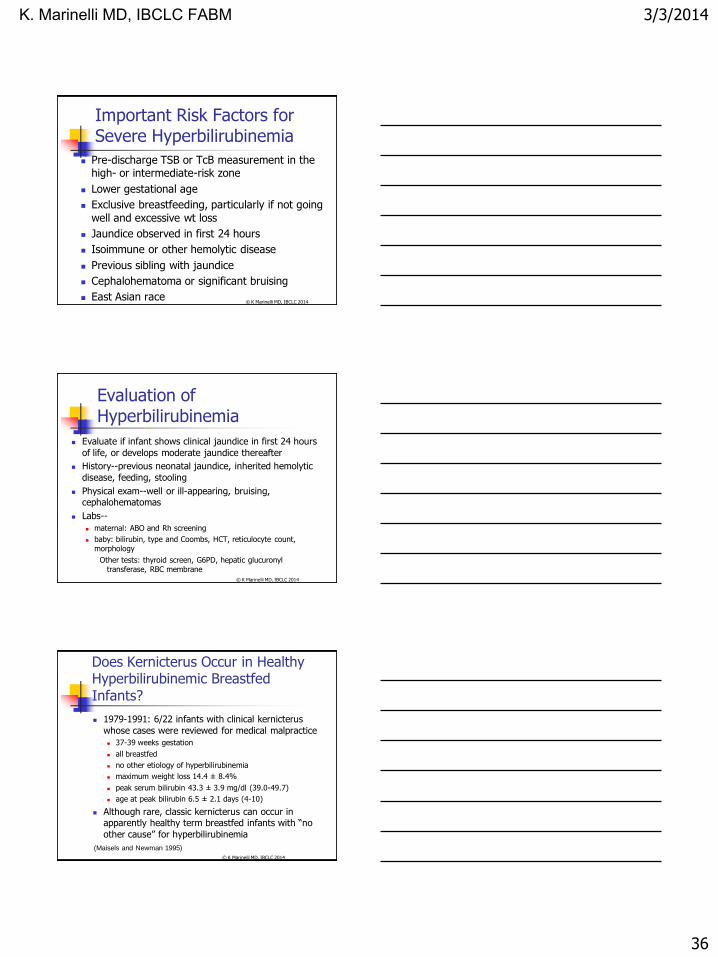
Important Risk Factors for Severe Hyperbilirubinemia
Pre-discharge TSB or TcB measurement in the high- or intermediate-risk zone
Lower gestational age
Exclusive breastfeeding, particularly if not going
well and excessive wt loss
Jaundice observed in first 24 hours
Isoimmune or other hemolytic disease
Previous sibling with jaundice
Cephalohematoma or significant bruising
East Asian race © K Marinelli MD, IBCLC 2014
Evaluation of Hyperbilirubinemia
Evaluate if infant shows clinical jaundice in first 24 hours
of life, or develops moderate jaundice thereafter
History--previous neonatal jaundice, inherited hemolytic
disease, feeding, stooling
Physical exam--well or ill-appearing, bruising, cephalohematomas
Labs--
maternal: ABO and Rh screening
baby: bilirubin, type and Coombs, HCT, reticulocyte count, morphology
Other tests: thyroid screen, G6PD, hepatic glucuronyl transferase, RBC membrane
© K Marinelli MD, IBCLC 2014
Does Kernicterus Occur in Healthy Hyperbilirubinemic Breastfed Infants?
1979-1991: 6/22 infants with clinical kernicterus
whose cases were reviewed for medical malpractice
37-39 weeks gestation
all breastfed
no other etiology of hyperbilirubinemia
maximum weight loss 14.4 ± 8.4%
peak serum bilirubin 43.3 ± 3.9 mg/dl (39.0-49.7)
age at peak bilirubin 6.5 ± 2.1 days (4-10)
Although rare, classic kernicterus can occur in apparently healthy term breastfed infants with “no
other cause” for hyperbilirubinemia
(Maisels and Newman 1995)
© K Marinelli MD, IBCLC 2014
K. Marinelli MD, IBCLC FABM
3/3/2014
37
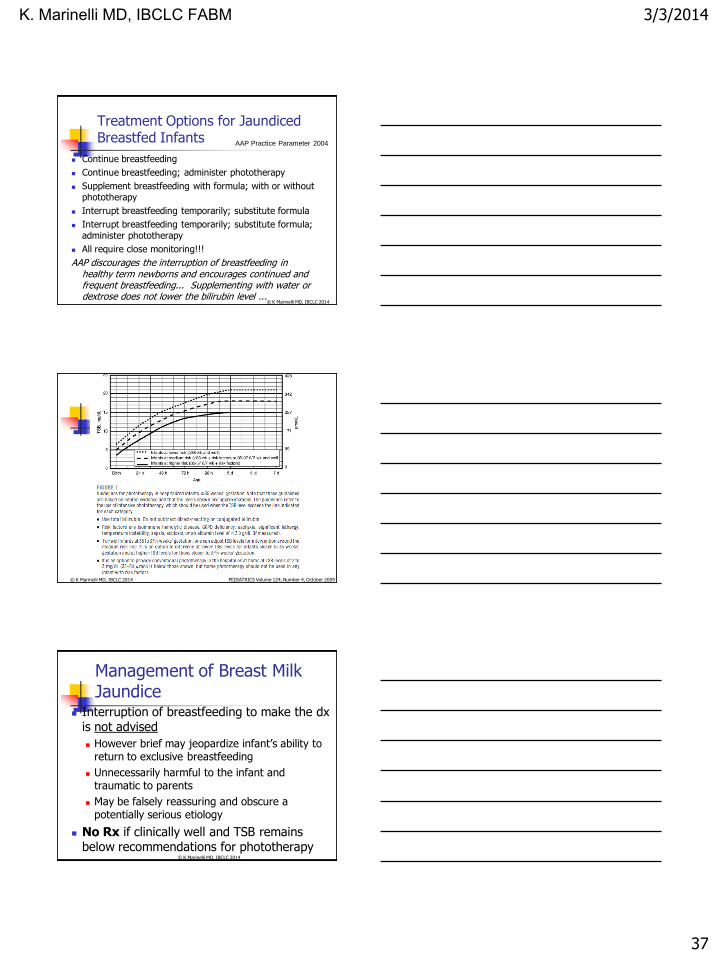
Treatment Options for Jaundiced Breastfed Infants
Continue breastfeeding
Continue breastfeeding; administer phototherapy
Supplement breastfeeding with formula; with or without phototherapy
Interrupt breastfeeding temporarily; substitute formula
Interrupt breastfeeding temporarily; substitute formula; administer phototherapy
All require close monitoring!!!
AAP discourages the interruption of breastfeeding in healthy term newborns and encourages continued and frequent breastfeeding... Supplementing with water or dextrose does not lower the bilirubin level ...
AAP Practice Parameter 2004
© K Marinelli MD, IBCLC 2014
PEDIATRICS Volume 124, Number 4, October 2009 © K Marinelli MD, IBCLC 2014
Management of Breast Milk Jaundice
Interruption of breastfeeding to make the dx is not advised
However brief may jeopardize infant’s ability to return to exclusive breastfeeding
Unnecessarily harmful to the infant and traumatic to parents
May be falsely reassuring and obscure a potentially serious etiology
No Rx if clinically well and TSB remains below recommendations for phototherapy
© K Marinelli MD, IBCLC 2014
K. Marinelli MD, IBCLC FABM
3/3/2014
38
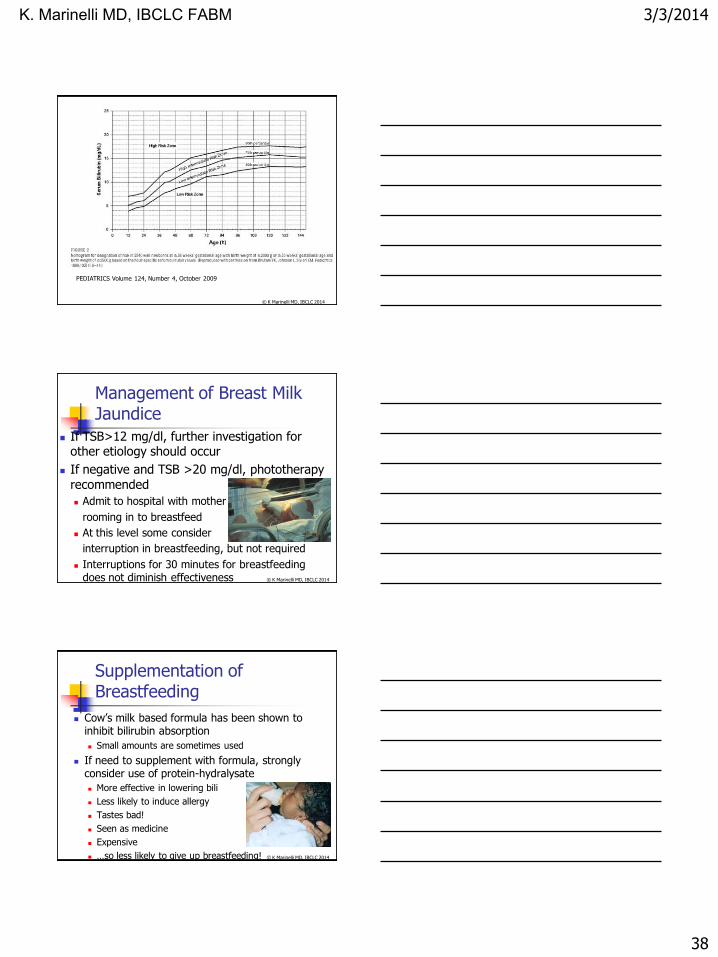
PEDIATRICS Volume 124, Number 4, October 2009
© K Marinelli MD, IBCLC 2014
Management of Breast Milk Jaundice
If TSB>12 mg/dl, further investigation for other etiology should occur
If negative and TSB >20 mg/dl, phototherapy recommended
Admit to hospital with mother
rooming in to breastfeed
At this level some consider
interruption in breastfeeding, but not required
Interruptions for 30 minutes for breastfeeding does not diminish effectiveness
© K Marinelli MD, IBCLC 2014
Supplementation of Breastfeeding
Cow’s milk based formula has been shown to inhibit bilirubin absorption
Small amounts are sometimes used
If need to supplement with formula, strongly consider use of protein-hydralysate
More effective in lowering bili
Less likely to induce allergy
Tastes bad!
Seen as medicine
Expensive
…so less likely to give up breastfeeding!
© K Marinelli MD, IBCLC 2014
K. Marinelli MD, IBCLC FABM
3/3/2014
39
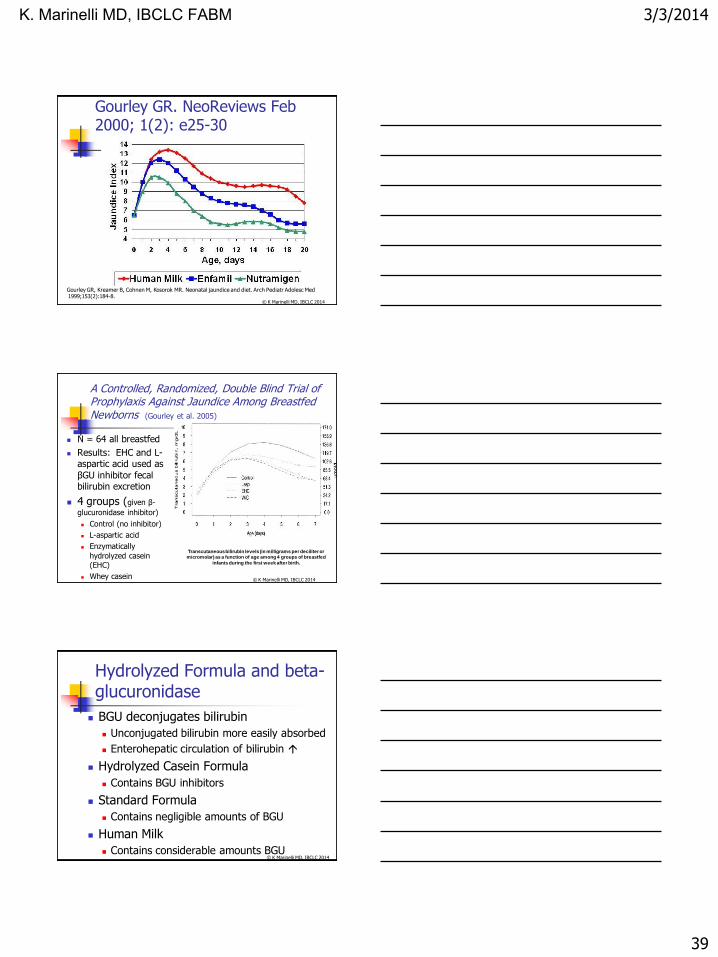
Gourley GR. NeoReviews Feb 2000; 1(2): e25-30
Gourley GR, Kreamer B, Cohnen M, Kosorok MR. Neonatal jaundice and diet. Arch Pediatr Adolesc Med 1999;153(2):184-8.
© K Marinelli MD, IBCLC 2014
A Controlled, Randomized, Double Blind Trial of Prophylaxis Against Jaundice Among Breastfed Newborns (Gourley et al. 2005)
N = 64 all breastfed
Results: EHC and L-aspartic acid used as
βGU inhibitor fecal bilirubin excretion
4 groups (given β-
glucuronidase inhibitor)
Control (no inhibitor)
L-aspartic acid
Enzymatically
hydrolyzed casein (EHC)
Whey casein
Transcutaneous bilirubin levels (in milligrams per deciliter or micromolar) as a function of age among 4 groups of breastfed
infants during the first week after birth.
© K Marinelli MD, IBCLC 2014
Hydrolyzed Formula and beta-glucuronidase
BGU deconjugates bilirubin
Unconjugated bilirubin more easily absorbed
Enterohepatic circulation of bilirubin
Hydrolyzed Casein Formula
Contains BGU inhibitors
Standard Formula
Contains negligible amounts of BGU
Human Milk
Contains considerable amounts BGU
© K Marinelli MD, IBCLC 2014
K. Marinelli MD, IBCLC FABM
3/3/2014
40
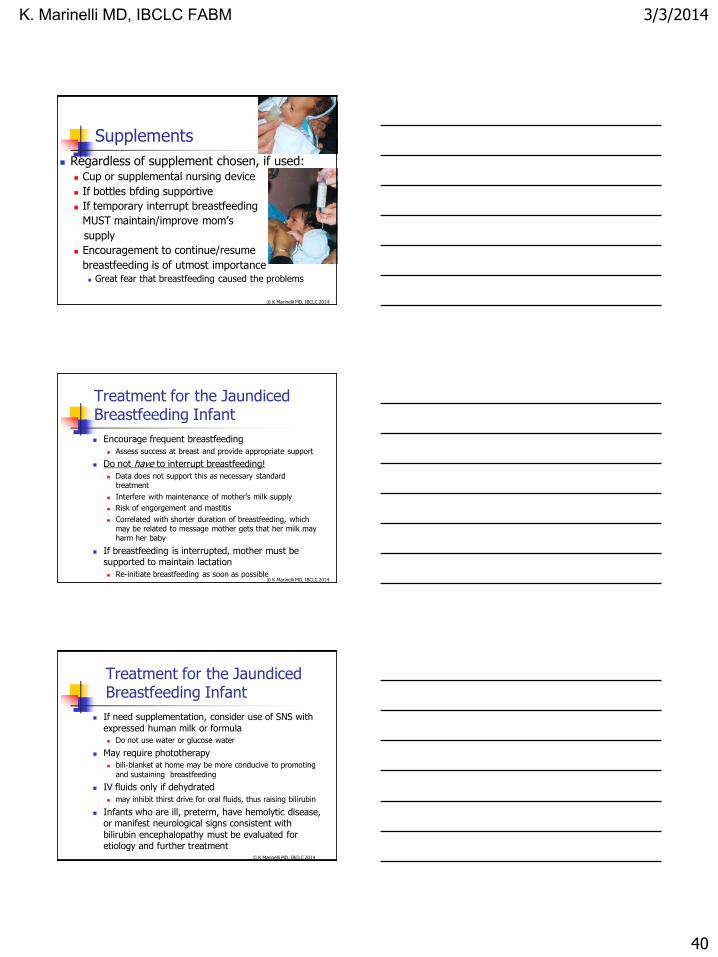
Supplements
Regardless of supplement chosen, if used: Cup or supplemental nursing device
If bottles bfding supportive
If temporary interrupt breastfeeding
MUST maintain/improve mom’s
supply
Encouragement to continue/resume
breastfeeding is of utmost importance Great fear that breastfeeding caused the problems
© K Marinelli MD, IBCLC 2014
Treatment for the Jaundiced Breastfeeding Infant
Encourage frequent breastfeeding
Assess success at breast and provide appropriate support
Do not have to interrupt breastfeeding!
Data does not support this as necessary standard treatment
Interfere with maintenance of mother’s milk supply
Risk of engorgement and mastitis
Correlated with shorter duration of breastfeeding, which may be related to message mother gets that her milk may harm her baby
If breastfeeding is interrupted, mother must be supported to maintain lactation
Re-initiate breastfeeding as soon as possible © K Marinelli MD, IBCLC 2014
Treatment for the Jaundiced Breastfeeding Infant
If need supplementation, consider use of SNS with
expressed human milk or formula
Do not use water or glucose water
May require phototherapy
bili-blanket at home may be more conducive to promoting
and sustaining breastfeeding
IV fluids only if dehydrated
may inhibit thirst drive for oral fluids, thus raising bilirubin
Infants who are ill, preterm, have hemolytic disease, or manifest neurological signs consistent with
bilirubin encephalopathy must be evaluated for etiology and further treatment
© K Marinelli MD, IBCLC 2014
K. Marinelli MD, IBCLC FABM
3/3/2014
41
Prevention of potentially toxic serum bilirubin levels
Early initiation
Exclusive breastfeeding
Supplementation only if inadequate milk intake
after attempt to “fix” breastfeeding
Documented failure milk production/ transfer
Milk weights
Significant dehydration
MOM>Donor milk>formula
© K Marinelli MD, IBCLC 2014
Prevention of potentially toxic serum bilirubin levels
Optimize breastfeeding management from beginning
Education on early feeding cues
Identify at-risk moms and babies
Mom—diabetes, RH sensitization
Baby-- ABO incompatible; premature (esp. late preterm); bruising
© K Marinelli MD, IBCLC 2014
© K Marinelli MD, IBCLC 2014
Thank you!!
Painting by Analyn Perez
K. Marinelli MD, IBCLC FABM