hypnotherapy for incontinence - bmj · urinary incontinence is one ofthe most socially...
TRANSCRIPT

1
Mouseembryonicstemcellsself-organizeintotrunk-likestructureswithneuraltubeandsomitesJesseVVeenvliet1,†*,,AdrianoBolondi2,†,HeleneKretzmer2,%,LeahHaut1,%,ManuelaScholze-Wittler1,DennisSchifferl1,FredericKoch1,MilenaPustet1,SimonHeimann1,ReneBuschow3,LarsWittler1,BerndTimmermann4,AlexanderMeissner2,*,BernhardGHerrmann1,5,*
1Dept.OfDevelopmentalGenetics,MaxPlanckInstituteforMolecularGenetics,Ihnestr.63-73,14195Berlin,Germany.2Dept.OfGenomeRegulation,MaxPlanckInstituteforMolecularGenetics,Ihnestr.63-73,14195Berlin,Germany.3MicroscopyandCryo-ElectronMicroscopy,MaxPlanckInstituteforMolecularGenetics,Ihnestr.63-73,14195Berlin,Germany.4SequencingCoreFacility,MaxPlanckInstituteforMolecularGenetics,Ihnestr.63-73,14195Berlin,Germany.5InstituteforMedicalGenetics,Charité-UniversityMedicineBerlin,CampusBenjaminFranklin,Hindenburgdamm30,12203Berlin,Germany.†Theseauthorscontributedequally%Theseauthorscontributedequally*Correspondingauthors,[email protected],[email protected],[email protected]
One sentence summary: A platform for generating trunk-like-structures with precursors of
spinalcord,boneandmusclefromstemcellsinadish
Abstract:
Post-implantation embryogenesis is a highly dynamic process comprising multiple lineage
decisionsandmorphogeneticchangesinaccessibletodeepanalysisinvivo.Mouseembryonic
stemcells(mESCs)canformaggregatesreflectingthepost-occipitalembryo(gastruloids),but
lacking propermorphogenesis. Herewe show that embedding of aggregates derived from
mESCsinanextracellularmatrixcompoundresultsinTrunk-Like-Structures(TLS)withahigh
leveloforganizationcomprisinganeuraltubeandsomites.Comparativesingle-cellRNA-seq
analysis demonstrates that TLS execute gene-regulatory programs in an embryo-like order,
and generateprimordial germ cell like cells (PGCLCs). TLS lackingTbx6 formectopicneural
tubes, mirroring the embryonic mutant phenotype. ESC-derived trunk-like structures thus
constitute a novel powerful in vitro platform for investigating lineage decisions and
morphogeneticprocessesshapingthepost-implantationembryo.
.CC-BY-NC-ND 4.0 International license(which was not certified by peer review) is the author/funder. It is made available under aThe copyright holder for this preprintthis version posted March 4, 2020. . https://doi.org/10.1101/2020.03.04.974949doi: bioRxiv preprint
2
Vertebratepost-implantationdevelopment comprisesamultitudeof complexmorphogenetic1
processes,whichresultfromself-organizationofstemcellsandtheirdescendantsshapingthe2
embryonicbodyplan1.Recentlydevelopedstemcellmodelsrepresentpowerfulplatformsfor3
deconstructing the dynamics of these processes that are inaccessible in the embryo1, 2. The4
mostadvancedmodelsintermsofdevelopmentalstageaccomplishedsofararegastruloids2,3,5
aggregatesofmESCsabletoself-organizeintothethreebodyaxes3.However,gastruloidslack6
propermorphogenesis,suchasa failureofneural tubeformationfromneuralcellsorsomite7
condensationfrompresomiticcells3.Invivo,theextracellularmatrix(ECM)hasacriticalrolein8
tissue morphogenesis4. In vitro, matrigel can serve as ECM surrogate, and culture media9
supplemented with a low percentage of matrigel have been shown to induce complex10
morphogenesisinorganoids5.11
We therefore explored if embryo-like morphogenetic features could be induced by12
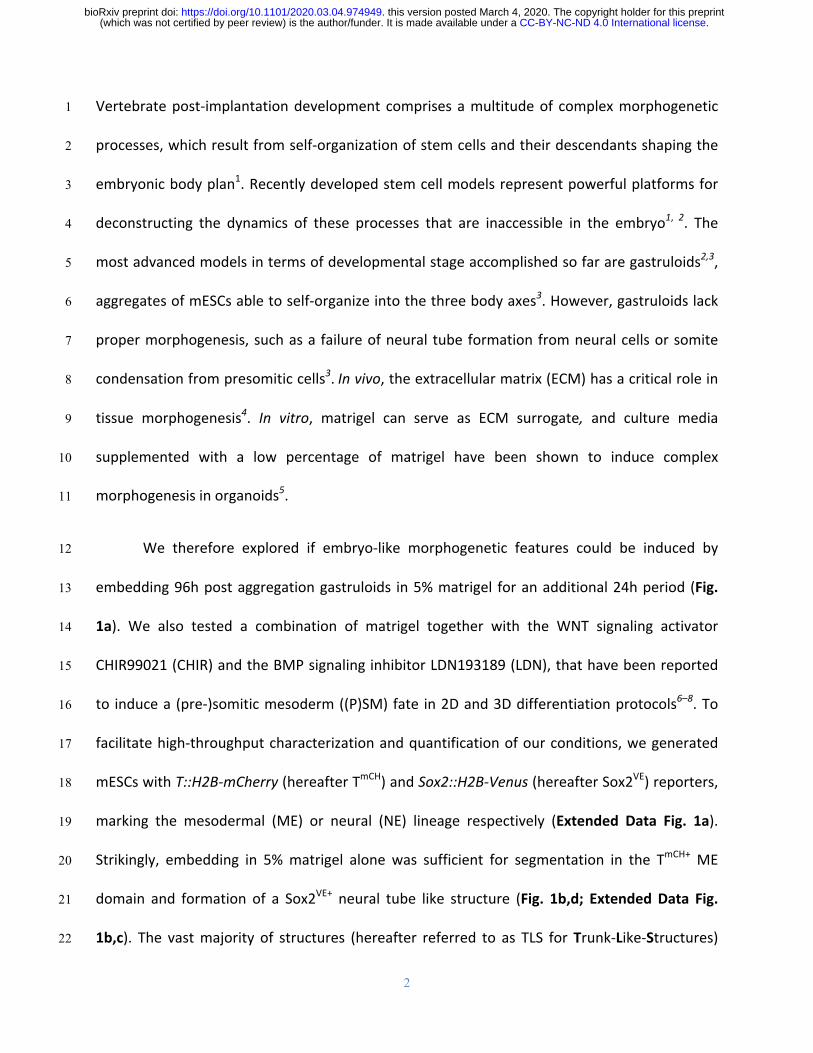
embedding96hpostaggregationgastruloids in5%matrigel foranadditional24hperiod (Fig.13
1a). We also tested a combination of matrigel together with the WNT signaling activator14
CHIR99021(CHIR)andtheBMPsignalinginhibitorLDN193189(LDN),thathavebeenreported15
to inducea(pre-)somiticmesoderm((P)SM)fate in2Dand3Ddifferentiationprotocols6–8.To16
facilitatehigh-throughputcharacterizationandquantificationofourconditions,wegenerated17
mESCswithT::H2B-mCherry(hereafterTmCH)andSox2::H2B-Venus(hereafterSox2VE)reporters,18
marking the mesodermal (ME) or neural (NE) lineage respectively (Extended Data Fig. 1a).19
Strikingly, embedding in 5%matrigel alone was sufficient for segmentation in the TmCH+ME20
domain and formation of a Sox2VE+ neural tube like structure (Fig. 1b,d; ExtendedData Fig.21
1b,c). The vastmajority of structures (hereafter referred to as TLS forTrunk-Like-Structures)22
.CC-BY-NC-ND 4.0 International license(which was not certified by peer review) is the author/funder. It is made available under aThe copyright holder for this preprintthis version posted March 4, 2020. . https://doi.org/10.1101/2020.03.04.974949doi: bioRxiv preprint
3
elongatedandformedaTmCH+poleattheposteriorend,withsegmentationoccurringinabout23
halftheTLS(Fig.1c).SegmentswereTmCH+demonstratingtheirmesodermalorigin,andwhole-24
mount in situ hybridization for Tcf15 and Uncx confirmed their somite identity (Fig. 1d,e)7.25
AdditionalCHIRtreatment,bothalone(hereafterTLSC)or incombinationwithLDN(hereafter26
TLSCL) improvedthephysicalseparationofneighboringsegmentswithoutaffectingTmCH+pole27
formation or elongation (Fig. 1b,c; Extended Data Fig. 1d-g), and resulted in an excess of28
segmentsattheanteriorend,arrangedlikea“bunchofgrapes”(Fig.1b,d)9.Moreover,theME29
domainexpandedattheexpenseoftheNEcompartment,withapparentdisorganizationofthe30
posterior end and neural tissue (Fig. 1b; Extended Data Fig. 1f,g), as well as reduction of31
TmCH+/Sox2VE+putativeneuromesodermalprogenitors (NMPs) -bipotentcells thatgive rise to32
both post-occipital NE andME -, as confirmed by flow cytometry (Fig. 1f)10. In all three TLS33
protocols,segmentsweresimilarinsizetoembryonicsomites(ExtendedDataFig.1h).34
Ingastruloids,endodermalcellsgenerallyorganize intoa tubular structure resembling35
anembryonic gut3.Whole-mount immunofluorescenceanalysisof characteristic, endodermal36
expressed transcription factorsFOXA2andSOX17also confirmedgut formation inour trunk-37
likestructures(ExtendedDataFig.2a-d).CellsattheposteriorbasewereSOX17-negative,but38
co-expressedFOXA2withhighlevelsofTmCH(ExtendedDataFig.2b).Thus,ourdatashowthat39
embedding inmatrigel is both necessary and sufficient to drive complex, embryo-like tissue40
morphogenesisofthethreeembryonicgermlayers.41
TocharacterizeourstructuresinmoredetailweperformedRNA-seqanalysis(Extended42
DataFig.3a),andfoundthatTLSmodelthepost-occipitalembryo,similartogastruloids,based43
.CC-BY-NC-ND 4.0 International license(which was not certified by peer review) is the author/funder. It is made available under aThe copyright holder for this preprintthis version posted March 4, 2020. . https://doi.org/10.1101/2020.03.04.974949doi: bioRxiv preprint

4
on selectedmarkergenes (Fig.2a; ExtendedDataFig.3b)3. Compared toTLS,bothTLSC and44
TLSCL showed a significant upregulation of genes involved in (pre)somitic development (e.g.45
Tbx6, Msgn1, Hes77, 8, 11) at the expense of NE marker genes (e.g. Sox1, Pax6, Irx311–13),46
corroborating the flowcytometryand imaging results (Fig.2a;ExtendedDataFig.3b-d).The47
analysis of marker gene sets for NMPs, their direct descendants undergoing lineage choice48
(NMP ME & NMP NE), and for committed NE and ME cells substantiated this finding11.49
Compared to TLS, TLSC and TLSCL displayed reduced expression of markers in all clusters50
includingME(Fig.2b).(P)SMspecificmarkers,however,wereonaverageupregulated,whereas51
intermediateME (IM) and lateral plateME (LPM)markerswere downregulated in TLSC, and52
further reduced inTLSCL (Fig.2b;ExtendedDataFig.3c,e)3, 8. Thesedataare in linewith the53
known role of WNT- versus BMP-signaling in conferring PSM versus IM and LPM subtype54
identity(Fig.2a;ExtendedDataFig.3e)7.55
We next searched for gene expression differences that might underlie the improved56
physical separation of somites observed in TLSC and TLSCL. Among the most strongly57
upregulatedgenescomparedtoTLSwasWnt6,whichactsasasomiteepithelializationfactorin58
vivo (Extended Data Fig. 3f)14. In addition, multiple ephrins and their receptors, and other59
factorsinvolvedinsomiteephithelializationwereupregulated(Fig.2c;ExtendedDataFig.3f)15,60
16. Expression changes of selected somite polaritymarkerswas observed concomitantlywith61
changes in their inducers, inagreementwith the role thatWNTs, in concertwithSHH,BMPs62
andtheirantagonistsplayinsomitecompartmentalizationinvivo(ExtendedDataFig.3g,h)7,17.63
Thus, exposure to CHIR or CHIR/LDN improved segment boundary formation, but affected64
somitepatterning.65
.CC-BY-NC-ND 4.0 International license(which was not certified by peer review) is the author/funder. It is made available under aThe copyright holder for this preprintthis version posted March 4, 2020. . https://doi.org/10.1101/2020.03.04.974949doi: bioRxiv preprint

5
PrincipalComponentAnalysis (PCA) indicates ahigh transcriptional similaritybetween66
gastruloidsandTLSdespiteprofoundmorphologicaldifferences(Fig.2d).Thelatterarebetter67
highlighted by Gene-Set-Enrichment-Analysis (GSEA), which shows that matrigel embedding68
promotestissuemorphogenesisandremodeling(Fig.2e;ExtendedDataFig.3i).Zoominginon69
embryonicandtissuemorphogenesisgenesetsshowedthatupregulatedgenesalsocomprise70
markers of blood vessel development suggesting the inductionof capillarymorphogenesis in71
TLS (Fig. 2f; ExtendedData Fig. 3j). Cell-cell and cell-matrix interactions play pivotal roles in72
morphogenesis,with important functions for (proto)cadherins,ephrinsand integrins in tissue73
formationandorganogenesis18–23.GSEAindeedrevealedanenrichmentofcelladhesionterms74
andoverallasignificantupregulationofcorrespondingmarkergenesinTLS(Fig.2e;Extended75
Data Fig. 4a,b). The most pronounced increase was observed for integrins, transmembrane76
receptorsmediatingcelladhesiontotheECMimportantfore.g.neuraltubeformation,blood77
vessel development, and segmentation (Fig. 2g; ExtendedData Fig. 4a,b)20, 21, 24–26. Of note,78
integrin ligands important for somite boundary formation (fibronectin, collagen IV, laminin79
alpha1and lamininalpha5)wereexpressedat the same levels in gastruloids (ExtendedData80
Fig. 4c)24, 25, 27, 28. Taken together, our molecular data confirm activation of morphogenetic81
programsthroughmatrigelembeddingthatmaybelinkedtotheupregulationofcelladhesion82
molecules.83
Basedon the above resultswedecided to focuson theTLS condition for an in-depth84
characterization, as it produced the most in-vivo-like configuration. First, to ensure85
reproducibility29, we evaluated variability between nine independent structures using the86
quantitative expression of a panel of 41 developmental genes. The data demonstrated high87
.CC-BY-NC-ND 4.0 International license(which was not certified by peer review) is the author/funder. It is made available under aThe copyright holder for this preprintthis version posted March 4, 2020. . https://doi.org/10.1101/2020.03.04.974949doi: bioRxiv preprint

6
correlationbetweenTLSsandrevealedthattheymostcloselyresembletheE8.5post-occipital88
stage(ExtendedDataFig.5a).Theanalysisofindividualgenesshowedthatendothelial,NMP,89
NE, and somiticMEgeneswere reproducibly expressed at similar levels across all replicates,90
whereashighervariationwasobservedintheexpressionofPSM,endodermal,andpluripotency91
genes(ExtendedDataFig.5b,c).92
Next we performed scRNA-seq analysis on a total of 20,294 post-processed cells93
sampled from TLS at 96, 108, and 120 hours (Extended Data Fig. 6a). Clustering analysis94
revealed14differentcellstateswiththe largeronescorrespondingtoderivativesofthePSM95
andNEthatflankputativeNMPs.Smallerclusterscomprisedendoderm,endothelialcellsand96
PrimordialGermCellLikeCells(PGCLCs)(ExtendedDataFig.6b).Themainclustersorganized97
into a continuum of states recapitulating spatio-temporal features of the developing post-98
occipitalembryo(Fig.3a).Acrossthethreetimepointssampledprogenitorsubtypesgradually99
decreasedinfavorofmorematureneuralandsomiticcellsasdevelopmentprogresses(Fig.3b;100
ExtendedDataFig.6c).Asexpected,putativeNMPsco-expressedTmCH,Sox2VEandCDX2,and101
showedanin-vivo-likeNMPsignatureandlocation(Fig.3c;ExtendedDataFig.6d)10,11,30.RNA102
Velocityanalysisrevealedneuralandsomitictrajectoriesrooted intheNMPs,suggestingthat103
TLSdevelopmentrecapitulatesthedevelopmentaldynamicsobservedinthepost-occipitalmid-104
gestationalembryo(Fig.3d;ExtendedDataFig.7a)31.Invivo,NMPsandtheirPSMdescendants105
arearranged inanorderofprogressivematurityalong theposterior toanterioraxis7. In line106
with this, ordering of cells along a pseudo-temporal trajectory showed that the somitic107
trajectoryreflectsthegeneticcascadeobservedintheembryo(Fig.3e;ExtendedDataFig.8a).108
Forexample,thetrajectoryfromFgf8+NMPsandPSMviathedeterminationfrontmarkedby109
.CC-BY-NC-ND 4.0 International license(which was not certified by peer review) is the author/funder. It is made available under aThe copyright holder for this preprintthis version posted March 4, 2020. . https://doi.org/10.1101/2020.03.04.974949doi: bioRxiv preprint

7
Mesp2toMeox1+somiteswasfaithfullyrecapitulatedandtheembryo-likespatialarrangement110
was confirmed bywhole-mount in situhybridization (Fig. 3f)7. Likewise, the genetic cascade111
fromNMPstoneuralprogenitorsinTLSreflecteditsinvivocounterpartinspaceandtime(Fig.112
3g).Notably,subclusteringoftheneuralcellsdemonstratedthatTLSgeneratebothdorsaland113
ventralneuralsubtypes,withdorsalsubtypesbeingmoreprevalent(ExtendedDataFig.8b)32.114
The analysis of Hox gene expression at consecutive time points demonstrated in-vivo-like115
collinearity, as described for gastruloids (Extended Data Fig. 8c)3. To test if TLS somites116
establish dorsal-ventral (DV) and anterior-posterior (AP) domains, we reclustered all somitic117
cells.At96hwedetectedtwomaingroups,corresponding to theUncx+posteriorandTbx18+118
anterior somite domains, in line with AP compartmentalization established during119
segmentation (ExtendedDataFig. 9a,b)7. At 120h,we founddistinct clusters of Pax3+ dorsal120
andPax1+ventralcells,andasmallclusterofLbx1+/Met+putativemigratorymuscleprecursors121
(ExtendedDataFig.9c-f)7,33. Inaddition,Scx+syndetomecellsweredetected(ExtendedData122
Fig. 9g), and Uncx and Tbx18 expression were anti-correlated (Extended Data Fig. 9h). An123
unexpectedfindingwastheidentificationofPGCLCs,sincetheyhavenotbeenobservedpriorin124
gastruloids3.Intheembryo,nascentPGCscanbeidentifiedatE7.5asagroupofDPPA3+cells,125
whicharegeneratedintheposteriorprimitivestreakandlatermigratealongthehindguttothe126
gonads34. We assigned PGCLC identity using characteristic PGC genes and identified their127
locationinourstructures(Fig.3h;ExtendedDataFig.10).At108hwefindagroupofSox2VE-high128
cellsthatco-expressedDPPA3(Fig.3h;ExtendedDataFig.10a).At120h,Sox2VE-highcellswere129
detected in contact with FOXA2+ cells, and DPPA3+ cells in contact with a TmCH+ gut-like130
epithelial structure (Fig. 3h; Extended Data Fig. 10b). These data show that trunk-like131
.CC-BY-NC-ND 4.0 International license(which was not certified by peer review) is the author/funder. It is made available under aThe copyright holder for this preprintthis version posted March 4, 2020. . https://doi.org/10.1101/2020.03.04.974949doi: bioRxiv preprint

8
structures indeed contain cells displaying characteristics typical for PGCs. To investigate how132
closethecellularstatesidentifiedinTLSresemblethoseinembryos,wemappedoursingle-cell133
transcriptomestoascRNA-seqcompendiumofpost-occipitalembryoniccellularsubtypes(Fig.134
4a)35.ThedatarevealedgloballyahighaccordanceofTLSandembryoniccell types including135
characteristicmarkergenesandpairwisecomparisonofmappedclustersidentifiedonlyasmall136
fractionofdifferentiallyexpressedgenes(Fig.4b,c;ExtendedDataFig.11a-d).Ofnote,PS-and137
early-NMP-likecellsareexclusivelypresentat96handreplacedbylate-NMP-likecellsat108h138
and 120h (Fig. 4d). Taken together, our scRNA-seq analyses demonstrate that the trunk-like139
structures execute gene-regulatory programs in a spatiotemporal order that resembles the140
embryo.141
Finally,toexploretheutilityoftrunk-likestructuresfurther,wenexttestediftheycould142
reproduce an embryonic mutant phenotype caused by gene ablation in a proof of concept143
experiment. In vivo, loss ofTbx6 results in an expansion ofNE and the formation of ectopic144
neuraltubesattheexpenseofPSMandsomites(Fig.4e)36.WedeletedTbx6fromTbx6::H2B-145
Venus(Tbx6Ve)mESC,generatedTLSandfoundaclearfailuretoformsomites,whichcouldalso146
not be rescued by CHIR or CHIR/LDN (Fig. 4e,f; Extended Data Fig. 12a). Quantitative PCR147
analysisonFACS-purifiedTbx6VE+cellsrevealedupregulationofneuralmarkersattheexpense148
of (P)SMmarkers in Tbx6-/- cells, thus recapitulating the in vivo phenotype at themolecular149
level (Extended Data Fig. 12b). Finally, whole-mount immunofluorescence analysis for SOX2150
showedthatTLS-Tbx6-/-generatedectopicTbx6VE+neuraltubes,whereasTLSCandTLSCLformed151
anexcessofmorphologicallyindistinctSOX2+tissue(Fig.4g;ExtendedDataFig.12c,d).152
.CC-BY-NC-ND 4.0 International license(which was not certified by peer review) is the author/funder. It is made available under aThe copyright holder for this preprintthis version posted March 4, 2020. . https://doi.org/10.1101/2020.03.04.974949doi: bioRxiv preprint

9
Here we report the generation of trunk-like structures and demonstrate that they153
faithfully reproduce important features of post-occipital embryogenesis, as confirmed by154
morphogeneticandtranscriptionalcriteria.Importantly,toourbestknowledgeaxialelongation155
togetherwith neural tube, gut and somite formation in combinationwith the generation of156
PGCLCs, solely by in vitro culture of stem cells, has been achieved for the first time. TLS157
therefore provide a powerful in vitro system for investigating the dynamics of embryo158
patterning and morphogenesis at the single cell level and in molecular detail, allowing to159
“understand the whole from the parts”1. Towards this latter goal, comparative analysis of160
gastruloids and TLSwill help to understand how cell-cell and cell-matrix interactions control161
embryonicarchitectures1.Inthisregard,celltypespecificexpressionofcelladhesionmolecules162
revealedbyoursingle-cellTLSatlaswillprovideguidanceforfuturework(Fig.S13).Although163
TLS display the closest in-vivo-like configuration, we envision that our CHIR and CHIR/LDN164
models can become important systems for studying the morphogenetic aspects of165
somitogenesis inhigh-throughput.OurTLSalreadydisplay remarkable reproducibilitybothat166
the morphological and molecular level. Nevertheless, we realize the importance of further167
integrated comparative analysis of single TLS at single-cell resolution, such as recently168
publishedforbrainandkidneyorganoids37,38.Finally,invivosomitesareformedinarhythmic169
process involving an oscillator - the segmentation clock39. We have observed that somite170
formation in TLS can occur sequentially at an embryo-like pace, and specific control genes171
involvedinthesegmentationprocessarecorrectlyexpressedinaPSMasexpected,suggesting172
thattheclockalsoticksinthePSMofTLS(ExtendedDataFig.14;SupplementaryVideo1).173
.CC-BY-NC-ND 4.0 International license(which was not certified by peer review) is the author/funder. It is made available under aThe copyright holder for this preprintthis version posted March 4, 2020. . https://doi.org/10.1101/2020.03.04.974949doi: bioRxiv preprint
10
In sum, our data demonstrate that the morphogenetic potential of mESC-derived174
aggregates is unlocked by providing an ECM surrogate. The resulting trunk-like structures175
provideascalable,tractable,readilyaccessibleplatformforinvestigatinglineagedecisionsand176
morphogenetic processes shaping the mid-gestational embryo at an unprecedented177
spatiotemporalresolution.178
.CC-BY-NC-ND 4.0 International license(which was not certified by peer review) is the author/funder. It is made available under aThe copyright holder for this preprintthis version posted March 4, 2020. . https://doi.org/10.1101/2020.03.04.974949doi: bioRxiv preprint

11
References1. M.N.Shahbazi,E.D.Siggia,M.Zernicka-Goetz,Self-organizationofstemcellsinto
embryos:Awindowonearlymammaliandevelopment.Science.364,948–951(2019).
2. M.N.Shahbazi,M.Zernicka-Goetz,Deconstructingandreconstructingthemouseand
humanearlyembryo.Nat.CellBiol.20,878–887(2018).
3. L.Beccarietal.,Multi-axialself-organizationpropertiesofmouseembryonicstemcells
intogastruloids.Nature.562,272–276(2018).
4. H.K.Kleinman,D.Philp,M.P.Hoffman,Roleoftheextracellularmatrixinmorphogenesis.
Curr.Opin.Biotechnol.14,526–532(2003).
5. J.A.Brassard,M.P.Lutolf,EngineeringStemCellSelf-organizationtoBuildBetter
Organoids.CellStemCell.24,860–876(2019).
6. M.Matsumiya,T.Tomita,K.Yoshioka-Kobayashi,A.Isomura,R.Kageyama,EScell-derived
presomiticmesoderm-liketissuesforanalysisofsynchronizedoscillationsinthe
segmentationclock.Development.145(2018),doi:10.1242/dev.156836.
7. J.Chal,O.Pourquié,Makingmuscle:skeletalmyogenesisinvivoandinvitro.
Development.144,2104–2122(2017).
8. J.Chaletal.,DifferentiationofpluripotentstemcellstomusclefibertomodelDuchenne
musculardystrophy.Nat.Biotechnol.33,962–969(2015).
9. A.S.Dias,I.deAlmeida,J.M.Belmonte,J.A.Glazier,C.D.Stern,Somiteswithoutaclock.
Science.343,791–795(2014).
10. D.Henrique,E.Abranches,L.Verrier,K.G.Storey,Neuromesodermalprogenitorsandthe
makingofthespinalcord.Development.142,2864–2875(2015).
.CC-BY-NC-ND 4.0 International license(which was not certified by peer review) is the author/funder. It is made available under aThe copyright holder for this preprintthis version posted March 4, 2020. . https://doi.org/10.1101/2020.03.04.974949doi: bioRxiv preprint

12
11. F.Kochetal.,AntagonisticActivitiesofSox2andBrachyuryControltheFateChoiceof
Neuro-MesodermalProgenitors.Dev.Cell.42,514–526.e7(2017).
12. M.Gouti,V.Metzis,J.Briscoe,Theroutetospinalcordcelltypes:ataleofsignalsand
switches.TrendsGenet.31,282–289(2015).
13. E.Dessaud,A.P.McMahon,J.Briscoe,Patternformationinthevertebrateneuraltube:a
sonichedgehogmorphogen-regulatedtranscriptionalnetwork.Development.135,2489–
2503(2008).
14. C.Schmidtetal.,Wnt6regulatestheepithelialisationprocessofthesegmentalplate
mesodermleadingtosomiteformation.Dev.Biol.271,198–209(2004).
15. L.Durbinetal.,Ephsignalingisrequiredforsegmentationanddifferentiationofthe
somites.GenesDev.12,3096–3109(1998).
16. M.Rowtonetal.,Regulationofmesenchymal-to-epithelialtransitionbyPARAXISduring
somitogenesis.Dev.Dyn.242,1332–1344(2013).
17. C.Marcelle,M.R.Stark,M.Bronner-Fraser,CoordinateactionsofBMPs,Wnts,Shhand
nogginmediatepatterningofthedorsalsomite.Development.124,3955–3963(1997).
18. J.M.Halbleib,W.J.Nelson,Cadherinsindevelopment:celladhesion,sorting,andtissue
morphogenesis.GenesDev.20,3199–3214(2006).
19. V.Barone,C.-P.Heisenberg,Celladhesioninembryomorphogenesis.Curr.Opin.CellBiol.
24,148–153(2012).
20. D.Jülichetal.,Cross-ScaleIntegrinRegulationOrganizesECMandTissueTopology.Dev.
Cell.34,33–44(2015).
.CC-BY-NC-ND 4.0 International license(which was not certified by peer review) is the author/funder. It is made available under aThe copyright holder for this preprintthis version posted March 4, 2020. . https://doi.org/10.1101/2020.03.04.974949doi: bioRxiv preprint

13
21. D.Jülich,A.P.Mould,E.Koper,S.A.Holley,Controlofextracellularmatrixassemblyalong
tissueboundariesviaIntegrinandEph/Ephrinsignaling.Development.136,2913–2921
(2009).
22. J.H.Shawky,L.A.Davidson,Tissuemechanicsandadhesionduringembryodevelopment.
Dev.Biol.401,152–164(2015).
23. J.Chal,C.Guillot,O.Pourquié,PAPCcouplesthesegmentationclocktosomite
morphogenesisbyregulatingN-cadherin-dependentadhesion.Development.144,664–
676(2017).
24. S.-W.Chong,Y.-J.Jiang,Offlimits--integrinsholdingboundariesinsomitogenesis.Trends
CellBiol.15,453–457(2005).
25. S.Koshidaetal.,Integrinalpha5-dependentfibronectinaccumulationformaintenanceof
somiteboundariesinzebrafishembryos.Dev.Cell.8,587–598(2005).
26. E.Nikolopoulou,G.L.Galea,A.Rolo,N.D.E.Greene,A.J.Copp,Neuraltubeclosure:
cellular,molecularandbiomechanicalmechanisms.Development.144,552–566(2017).
27. A.-G.Borycki,Themyotomalbasementmembrane:insightintolaminin-111functionand
itscontrolbySonichedgehogsignaling.CellAdhMigr.7,72–81(2013).
28. P.Rifes,S.Thorsteinsdóttir,Extracellularmatrixassemblyand3Dorganizationduring
paraxialmesodermdevelopmentinthechickembryo.Dev.Biol.368,370–381(2012).
29. M.Huch,J.A.Knoblich,M.P.Lutolf,A.Martinez-Arias,Thehopeandthehypeof
organoidresearch.Development.144,938–941(2017).
30. S.Aminetal.,CdxandTBrachyuryCo-activateGrowthSignalingintheEmbryonicAxial
ProgenitorNiche.CellRep.17,3165–3177(2016).
.CC-BY-NC-ND 4.0 International license(which was not certified by peer review) is the author/funder. It is made available under aThe copyright holder for this preprintthis version posted March 4, 2020. . https://doi.org/10.1101/2020.03.04.974949doi: bioRxiv preprint

14
31. G.LaMannoetal.,RNAvelocityofsinglecells.Nature.560,494–498(2018).
32. A.Sagner,J.Briscoe,Establishingneuronaldiversityinthespinalcord:atimeandaplace.
Development.146,dev182154(2019).
33.M.Buckinghametal.,Theformationofskeletalmuscle:fromsomitetolimb.J.Anat.202,
59–68(2003).
34.M.Saitou,M.Yamaji,Primordialgermcellsinmice.ColdSpringHarb.Perspect.Biol.4
(2012),doi:10.1101/cshperspect.a008375.
35. M.M.Chanetal.,Molecularrecordingofmammalianembryogenesis.Nature.570,77–82
(2019).
36. D.L.Chapman,V.E.Papaioannou,Threeneuraltubesinmouseembryoswithmutations
intheT-boxgeneTbx6.Nature.391,695–697(1998).
37. B.Phipsonetal.,Evaluationofvariabilityinhumankidneyorganoids.Nat.Methods.16,
79–87(2019).
38. S.-J.Yoonetal.,Reliabilityofhumancorticalorganoidgeneration.Nat.Methods.16,75–
78(2019).
39. O.Pourquié,Thesegmentationclock:convertingembryonictimeintospatialpattern.
Science.301,328–330(2003).
40. D.A.Stafford,L.J.Brunet,M.K.Khokha,A.N.Economides,R.M.Harland,Cooperative
activityofnogginandgremlin1inaxialskeletondevelopment.Development.138,1005–
1014(2011).
.CC-BY-NC-ND 4.0 International license(which was not certified by peer review) is the author/funder. It is made available under aThe copyright holder for this preprintthis version posted March 4, 2020. . https://doi.org/10.1101/2020.03.04.974949doi: bioRxiv preprint

15
41. X.M.Yang,K.Vogan,P.Gros,M.Park,Expressionofthemetreceptortyrosinekinasein
muscleprogenitorcellsinsomitesandlimbsisabsentinSplotchmice.Development.122,
2163–2171(1996).
42. Y.J.Jiangetal.,Notchsignallingandthesynchronizationofthesomitesegmentation
clock.Nature.408,475–479(2000).
43. T.J.Cunninghametal.,Retinoicacidactivityinundifferentiatedneuralprogenitorsis
sufficienttofulfillitsroleinrestrictingfgf8expressionforsomitogenesis.PLoSOne.10,
e0137894(2015).
44. R.Moritaetal.,ETStranscriptionfactorETV2directlyconvertshumanfibroblastsinto
functionalendothelialcells.Proc.Natl.Acad.Sci.USA.112,160–165(2015).
45. W.W.Sugdenetal.,Endoglincontrolsbloodvesseldiameterthroughendothelialcell
shapechangesinresponsetohaemodynamiccues.Nat.CellBiol.19,653–665(2017).
46. K.Xuetal.,BloodvesseltubulogenesisrequiresRasip1regulationofGTPasesignaling.
Dev.Cell.20,526–539(2011).
47. S.Kannoetal.,RolesoftwoVEGFreceptors,Flt-1andKDR,inthesignaltransductionof
VEGFeffectsinhumanvascularendothelialcells.Oncogene.19,2138–2146(2000).
48. S.Gauvritetal.,HHEXisatranscriptionalregulatoroftheVEGFC/FLT4/PROX1signaling
axisduringvasculardevelopment.Nat.Commun.9,2704(2018).
49. G.S.Eakin,A.-K.Hadjantonakis,Productionofchimerasbyaggregationofembryonic
stemcellswithdiploidortetraploidmouseembryos.Nat.Protoc.1,1145–1153(2006).
50. S.H.L.Georgeetal.,Developmentalandadultphenotypingdirectlyfrommutant
embryonicstemcells.Proc.Natl.Acad.Sci.USA.104,4455–4460(2007).
.CC-BY-NC-ND 4.0 International license(which was not certified by peer review) is the author/funder. It is made available under aThe copyright holder for this preprintthis version posted March 4, 2020. . https://doi.org/10.1101/2020.03.04.974949doi: bioRxiv preprint

16
51. J.P.Muyrers,Y.Zhang,G.Testa,A.F.Stewart,Rapidmodificationofbacterialartificial
chromosomesbyET-recombination.NucleicAcidsRes.27,1555–1557(1999).
52. F.A.Ranetal.,GenomeengineeringusingtheCRISPR-Cas9system.Nat.Protoc.8,2281–
2308(2013).
53. L.Beccarietal.,GeneratingGastruloidsfromMouseEmbryonicStemCells.Protocexch
(2018),doi:10.1038/protex.2018.094.
54. A.Butler,P.Hoffman,P.Smibert,E.Papalexi,R.Satija,Integratingsingle-cell
transcriptomicdataacrossdifferentconditions,technologies,andspecies.Nat.
Biotechnol.36,411–420(2018).
55. F.A.Wolf,P.Angerer,F.J.Theis,SCANPY:large-scalesingle-cellgeneexpressiondata
analysis.GenomeBiol.19,15(2018).
56. V.Bergen,M.Lange,S.Peidli,F.A.Wolf,F.J.Theis,GeneralizingRNAvelocitytotransient
cellstatesthroughdynamicalmodeling.BioRxiv(2019),doi:10.1101/820936.
57. F.A.Wolfetal.,PAGA:graphabstractionreconcilesclusteringwithtrajectoryinference
throughatopologypreservingmapofsinglecells.GenomeBiol.20,59(2019).
58. M.Martin,Cutadaptremovesadaptersequencesfromhigh-throughputsequencingreads.
EMBnetj.17,10(2011).
59. A.Dobinetal.,STAR:ultrafastuniversalRNA-seqaligner.Bioinformatics.29,15–21
(2013).
60. M.Perteaetal.,StringTieenablesimprovedreconstructionofatranscriptomefromRNA-
seqreads.Nat.Biotechnol.33,290–295(2015).
.CC-BY-NC-ND 4.0 International license(which was not certified by peer review) is the author/funder. It is made available under aThe copyright holder for this preprintthis version posted March 4, 2020. . https://doi.org/10.1101/2020.03.04.974949doi: bioRxiv preprint

17
61. M.I.Love,W.Huber,S.Anders,Moderatedestimationoffoldchangeand''dispersionfor
RNA-seqdatawithDESeq2.GenomeBiol.15,550(2014).
62. A.Sergushichev,Analgorithmforfastprerankedgenesetenrichmentanalysisusing
cumulativestatisticcalculation.BioRxiv(2016),doi:10.1101/060012.
.CC-BY-NC-ND 4.0 International license(which was not certified by peer review) is the author/funder. It is made available under aThe copyright holder for this preprintthis version posted March 4, 2020. . https://doi.org/10.1101/2020.03.04.974949doi: bioRxiv preprint

18
Acknowledgments:Wearegrateful for the supportand feedback received frommembersof
theHerrmann&Meissnerlaboratories,inparticularStefanieGrosswendtandAtsuhiroTaguchi.
We thank DijanaMicic & Judith Fiedler for animal care, Norbert Mages for assistance with
(sc)RNA-Seq, Claudi Giesecke-Thiel & Uta Marchfelder for assistance with FACS, Thorsten
Mielke&BeatrixFaulerforhelpwithmicroscopy,FabianToborandPollyBurtonfortechnical
assistance, and Nikolaus Rajewsky (MDC/BIMSB) for providing access to the NanoString.
Funding: J.V.V.was partly funded by an Alexander vonHumboldt Fellowship. Thisworkwas
supportedbyNIHgrantHG006193 (A.M.)and theMaxPlanckSociety.Author contributions:
B.G.H. initiated the study; J.V.V. and B.G.H. conceived the project; J.V.V., A.M. and B.G.H.
supervised the project. J.V.V., A.B. and L.H. designed, performed and quantified most
experiments.H.K.performedbulk&sc-RNA-SeqcomputationalanalysiswithhelpofJ.V.V.and
A.B. M.S-W., D.S., F.K. and M.P. generated mESC reporter lines. L.W. performed tetraploid
complementation. S.H. performed pilot experiments to optimize culture media. R.B. helped
withimageacquisitionandanalysis.B.T.supervisednext-generationsequencing.J.V.V.drafted
thefirstversionofthemanuscript.ThefinalmanuscriptwaswrittenbyJ.V.V,A.B.,H.K.,A.M.
and B.G.H. Competing interests: The authors declare no competing interests. Data and
materialsavailability:Alldataisavailableinthemaintextorthesupplementarymaterials.Bulk
and single-cell RNA-Seq data have been deposited in the Gene Expression Omnibus (GEO)
underaccessioncodeGSE141175.Allcomputationalcodeused inthisstudy isavailableupon
request.
.CC-BY-NC-ND 4.0 International license(which was not certified by peer review) is the author/funder. It is made available under aThe copyright holder for this preprintthis version posted March 4, 2020. . https://doi.org/10.1101/2020.03.04.974949doi: bioRxiv preprint
19
Fig.1.GenerationofTrunk-LikeStructureswithsomitesandaneuraltube.
a,Schematicofthecultureprotocol:200-250mESCswereaggregatedinultra-low-attachment
plates;WntagonistCHIR99021(CHIR)wasaddedbetween48and72hours(3).96aggregates
wereembeddedin5%matrigel(TLS).Optionally,structuresweretreatedwithCHIRalone(TLSC)
or in combinationwith the BMP antagonist LDN (TLSCL).b, 3D volumetric renderings (upper
panel) and confocal sections (bottom panel) of gastruloids, TLS, TLSC and TLSCL. Scale bars
100μm. Each image is representative of at least ten biological replicates with similar
morphology and expression patterns. c, Quantification of morphometric characteristics in
.CC-BY-NC-ND 4.0 International license(which was not certified by peer review) is the author/funder. It is made available under aThe copyright holder for this preprintthis version posted March 4, 2020. . https://doi.org/10.1101/2020.03.04.974949doi: bioRxiv preprint

20
gastruloidsandTLS(seeSupplementalInformationforscoringcriteria).d,SegmentsinTLSare
TmCH+ and positioned adjacent to the neural tube in TLS. In TLSC and TLSCL the segments are
arrangedin“bunchesofgrapes”.Scalebars25μm.Redarrowheadindicatesneuraltube,white
arrowheadsomites.e,SegmentsexpresssomiticmarkersTcf15andUncxasshownbywhole-
mountinsituhybridization.NotethecharacteristicstripyexpressionpatternofUncxinTLSdue
to Uncx restriction to the posterior somite half, whereas Tcf15 is expressed throughout the
segments (as in theembryo).Noteworthy, inTLSCandTLSCLUncx isdetected throughout the
segments,indicatinglossofanterior-posteriorpolarity.Scalebars100μm.f,PercentageofTmCH+
(mesodermal), Sox2VE+ (neural), and TmCH+/Sox2VE+ (neuromesodermal) cells in gastruloids and
TLS asmeasured by flow cytometry. Dots represent individual TLS/gastruloids, line indicates
median.
.CC-BY-NC-ND 4.0 International license(which was not certified by peer review) is the author/funder. It is made available under aThe copyright holder for this preprintthis version posted March 4, 2020. . https://doi.org/10.1101/2020.03.04.974949doi: bioRxiv preprint

21
Fig.2.GeneexpressiondifferencesbetweengastruloidsandTLSmodels.
a, Heatmap of log2(TPM+0.01) expression (TPM, Transcripts Per Million) of selected genes
associated with development of indicated embryonic structures in 96h aggregates, 120h
gastruloids, 120h TLS, 120h TLSC and 120h TLSCL, as measured by RNA-seq. Replicates were
derived from pools of independent biological samples (see Extended Data Fig. 3a for exact
experimental set-up). CE, caudal end, NMP, neuromesodermal progenitors, PSM, presomitic
mesoderm, LPM, lateral platemesoderm, IM, intermediatemesoderm.b,Box plots showing
distributionofmarkergenesforindicatedcelltypes.Boxesindicateinterquartilerange.Endof
.CC-BY-NC-ND 4.0 International license(which was not certified by peer review) is the author/funder. It is made available under aThe copyright holder for this preprintthis version posted March 4, 2020. . https://doi.org/10.1101/2020.03.04.974949doi: bioRxiv preprint

22
whiskersrepresentminimumandmaximum.Blackdotsindicateoutliers.Notchesarecentered
onthemedian.ListofgenesusedforeachcategoryinSupplmentaryTable1.c,Boxplotlikein
b representing average z-score per column (pool of 3 replicates) for somite epithelialization
factors(ExtendedDataFig.3fforgenes).d,PCAanalysisofsamplesfromawithcolorcodingof
individual samples (dots) as ina. PC1 and PC2 represents the two componentswith highest
percentageofexplainedvariance.e,SelectedsignificanttermsofGeneSetEnrichmentAnalysis
(GSEA) enriched in TLS as compared to gastruloids of 120h. Full list of significant (FDR<0.05)
terms is provided inSupplementary Table2. f, Volcano plot of genes involved in tissue and
embryonicmorphogenesis.Dotsizescaleswithlog2ofabsoluteexpression.Reddots,absolute
log2FC>1andpadj<10e-15.Greendots,absolutelog2FC>1.Upperdottedline,padj(FDR)=10e-15;
bottom dotted line, padj (FDR)=0.05. Green label, involved in somitogenesis; orange label,
involvedinbloodvesseldevelopment;yellowlabel,involvedinboth40-48.g,Heatmapofscaled
expression(rowz-score)ofintegrinswithsignificantlydifferentexpression(padj(FDR)<0.05)in
gastruloidsvs120hTLS.Boxplotrepresentsz-scorepercolumn(sample),withboxesindicating
interquartile range, end of whiskers representing minimum and maximum, dots showing
outliersandcentral linerepresentingmedian.Everycolumnrepresentoneof threebiological
replicates.
.CC-BY-NC-ND 4.0 International license(which was not certified by peer review) is the author/funder. It is made available under aThe copyright holder for this preprintthis version posted March 4, 2020. . https://doi.org/10.1101/2020.03.04.974949doi: bioRxiv preprint

23
Fig.3.Single-cellRNA-SequencingofTLS.
Intotal,20,294cellsweresampledfrom96,108,and120hourTLS(seeExtendedDataFig.5a
forexperimentalset-up).a,UMAP(UniformManifoldApproximationandProjection)coloured
by the fourteen clusters identified. b, Alluvial plot of percentage of neuromesodermal
progenitors(NMPs),posteriorpresomiticmesoderm(pPSM),anteriorPSM,somiticandneural
tube cells over time. c, NMPs co-express Sox2 and T (left panel, blending expression with
blend.threshold=0.4), and reside at the posterior end of TLS (confocal sections, right panel;
.CC-BY-NC-ND 4.0 International license(which was not certified by peer review) is the author/funder. It is made available under aThe copyright holder for this preprintthis version posted March 4, 2020. . https://doi.org/10.1101/2020.03.04.974949doi: bioRxiv preprint

24
white arrowheads,NMPs; red arrowheads, somites). Scale bars 50μm.d, UMAP coloured by
identified clusters with trajectories inferred from RNA Velocity. Grey arrow flows represent
calculated velocity trajectories. e, Heatmap with scaled expression of genes involved in
somitogenesis in9004 cells from120hTLSMG rooted inNMPsandorderedbypseudotime. f,
UMAP coloured by expression of indicated genes (left panel), and whole-mount in situ
hybridizationforthesamegenesinTLSandE9.5embryos(rightpanel).Numbersindicatethe
fractionofTLSwithembryo-likeexpression.ScalebarsTLS100μm,embryo200μm.g,Heatmap
with scaledexpressionof genes involved inneural development in 9004 cells from120hTLS
rootedinNMPsandorderedbypseudotime(upperpanel)andUMAPcolouredbyexpressionof
indicated genes (bottom panel). h, Split violin plots of expression of marker genes for
primordialgermcelllikecells(PGCLC,leftpanel),andconfocalsectionofTLSshowingSOX2VE-
high/DPPA3+PGCLCsat108h,andDPPA3+cellsinclosecontactwiththeTmCH+gut-like-structure.
Scale bars 50μm for 108h left panel and 120h overview, 25μm for 120hmagnifications. Red
arrowheadsindicategut-like-structure,whitearrowheadsindicateDPPA3+PGCLCs.
.CC-BY-NC-ND 4.0 International license(which was not certified by peer review) is the author/funder. It is made available under aThe copyright holder for this preprintthis version posted March 4, 2020. . https://doi.org/10.1101/2020.03.04.974949doi: bioRxiv preprint

25
Fig.4.TLScelltypesareembryo-likeandrecapitulatetheTbx6-/-phenotypeatthemolecular
andmorphologicallevel.
a,Comparative transcriptomeanalysis of TLS andpost-occipital E7.5 andE8.5embryoat the
single-cell level. b, TLS UMAP coloured by assigned embryonic cell type. TLS clusters are
projected as corresponding coloured contours. Blue font, TLS clusters; Red font, embryo
clusters. c, Split heatmap with percentage of assigned cells (dark grey) and certainty score
(orange) for TLS cells from the indicated cluster upon unbiased mapping to the in vivo
counterpart. Font colour code as in b. d, Alluvial plot of percentage of cells assigned to
indicated in vivo cluster in 96, 108 and 120h TLS. e, Schematic of Tbx6-/- phenotype in vivo
.CC-BY-NC-ND 4.0 International license(which was not certified by peer review) is the author/funder. It is made available under aThe copyright holder for this preprintthis version posted March 4, 2020. . https://doi.org/10.1101/2020.03.04.974949doi: bioRxiv preprint

26
(upper panel) and schematic view of Tbx6::H2B-Venus; Tbx6-/- mESC derivation. f,
Quantification of segmentation phenotype in TLS-Tbx6-/- . Data represent 3 different
experiments performed with 2 independent mESC lines of each genotype. g, Formation of
ectopicneuraltubesinTLS-Tbx6-/-.Green,SOX2;Magenta,Tbx6VE.Whitearrowheadsindicate
Tbx6VE+somitesinWT,andTbx6VE+/SOX2+ectopicneuraltubesinTbx6-/-.Scalebars50μm.
.CC-BY-NC-ND 4.0 International license(which was not certified by peer review) is the author/funder. It is made available under aThe copyright holder for this preprintthis version posted March 4, 2020. . https://doi.org/10.1101/2020.03.04.974949doi: bioRxiv preprint

27
SupplementaryInformation
Mouseembryonicstemcellsself-organizeintotrunk-like-structureswithneuraltubeandsomites
JesseVVeenvliet†*,AdrianoBolondi†,HeleneKretzmer,LeahHaut,ManuelaScholze-Wittler,DennisSchifferl,FredericKoch,MilenaPustet,SimonHeimann,ReneBuschow,LarsWittler,BerndTimmermann,AlexanderMeissner*,BernhardGHerrmann*
†Theseauthorscontributedequally*Corresponding authors. Email: [email protected], [email protected],[email protected]
SupplementaryInformationincludes:
MethodsExtendedDataFigs.1-15CaptionforSupplementaryVideo1CaptionsforSupplementaryTables1-10
OtherSupplementaryMaterials:
SupplementaryVideo1SupplementaryTables1-10
.CC-BY-NC-ND 4.0 International license(which was not certified by peer review) is the author/funder. It is made available under aThe copyright holder for this preprintthis version posted March 4, 2020. . https://doi.org/10.1101/2020.03.04.974949doi: bioRxiv preprint

28
Methods
Animalwork
All animal work was approved by the local authorities (LAGeSo Berlin, license numbers
G0247/13 and G0243/18). T::H2B-mCherry/Sox2::H2B-Venus embryos were generated via
tetraploid complementation49. For embryo isolation, mice were sacrificed by cervical
dislocationanduteriweredissectedinPBS.
Mouseembryonicstemcellculture
AllmediumcompositionsarelistedinSupplementaryTable3.Allmouseembryonicstemcells
(mESCs)usedinthisstudyweremaleandfromanF1G4background50.mESCsweremaintained
on 6cm plates (Corning 430166) gelatinized with 0.1% gelatin (1:20 dilution of 2% gelatin
(SigmaG1393)intissue-culturegradeH2O)andcoatedwithmitoticallyinactiveprimarymouse
embryo fibroblasts (3-4x10⁴cells/cm²) with standard mESC medium containing 15% FCS and
1000U/ml leukemia inhibitory factor (LIF,ChemiconESG1107)at37°Cand5% or7.5% CO2.
mESCs were split every second day with a dilution suitable to the proliferation velocity
(between1:5and1:9).ES+LIFmediumwasrefresheddaily.Forsplitting,mediawasaspirated
andcellswerewashedoncewithPBSandtrypsinized(Tryspin-EDTA(0.05%)(Gibco25300054))
for5-10’at37°C.Trypsinwasneutralizedby3mlES+LIFandcellscentrifugedfor5’at1000rpm,
after which the pellet was resuspended in ES+LIF. For freezing of mESCs, cell pellets were
resuspended inESmediumwith20%FCS,andmixed ina1:1 ratiowithES freezingmedium.
Cellswerefrozendowno/ninthe–80°Candtransferredtoliquidnitrogenthenextday.
.CC-BY-NC-ND 4.0 International license(which was not certified by peer review) is the author/funder. It is made available under aThe copyright holder for this preprintthis version posted March 4, 2020. . https://doi.org/10.1101/2020.03.04.974949doi: bioRxiv preprint
29
Generationoftransgenicmouseembryoniccelllines
ThemouseembryoniccelllinesusedfortheexperimentswereallderivedfromF1G4cells.To
generate the fluorescent reporter constructs,wegenome-engineered themouseBACsRP24-
530D23 (T), RP23-249O15 (Sox2) and RP23-421P23 (Tbx6), containing∼180 - 230kb of the
C57BL/6mousegenomesurroundingtherespectiveloci,viaRed/ETrecombineering51.Inshort,
the starting codon (ATG) of the genes was replaced with a reporter gene containing H2B-
mCherry(forT)orH2B-Venus(forSox2/Tbx6),followedbytherabbitb-globinpolyadenlylation
signal and an FRT-flanked selection cassette (hygromycin or neomycin), driven by the Pgk
promotor.Forrandomintegration,5μgofthemodifiedBACswaslinearizedwithPI-SceI(NEB)
andelectroporatedinto3x106mESCs.SelectionwasperformedusingmESCmediumcontaining
250μg/ml neomycin and 150μg/ml hygromycin for the T::H2B-mCherry;Sox2:H2B::Venus
reporter line. For the Tbx6::H2B-Venus reporter line 350μg/ml hygromycin was used for
selection.Afterselection,singlecloneswerepicked,expandedandcheckedforBACintegration
by PCR. Two independent Tbx6::H2B-Venus mESC lines were generated. In both lines, the
endogenous Tbx6 locus was targeted by CRISPR (Supplementary Table 4) to create null
mutants.Tothisend,adoublenickingapproachwithfourguideRNAs52wasused.Thespecific
target sequences contained 5’-GN19NGG-3’’, withN being any arbitrary nucleotide,G being
guanine andNGG the Protospacer adjacentmotif andGN19 the guide RNA. If there was no
guanineat the5’-endof the templatesequence,anextraguaninehad tobeadded5’ to the
other 20 bases. Single strandedoligonucleotides (Supplementary Table 4)with an added 5’-
.CC-BY-NC-ND 4.0 International license(which was not certified by peer review) is the author/funder. It is made available under aThe copyright holder for this preprintthis version posted March 4, 2020. . https://doi.org/10.1101/2020.03.04.974949doi: bioRxiv preprint

30
CACC-3’ at 5’-end and 5’-AAAC-3’ at 5’-end of the complementary strand were annealed in
10xT4 ligation buffer (PromegaM1801) by continuous cooling from 95°C to 25°C. Annealed
oligoswereclonedintotheBbsIsiteofpx335A_hCas9_D10A_G2P(giftfromDr.BorisGreber)
(Supplementary Table 4) containing expression cassettes for hCas9 nickase, guide RNA and
puromycinresitance.
Onedaypriortotransfection,3x105mESCscellswereseededonfibroblastcoated6-wellplates
(Costar3516)with3mlES+LIFperwell.Afterovernightincubation,themediumwasrefreshed
inthemorning.Mixesof110µlOpti-MEMreducedserummedium(Gibco31985062)plus25µl
Lipofectamine2000 (Thermo Fisher 2125239) and 125µl Opti-MEM plus 8µg per vector were
prepared.125µlofeachmixwere combinedand incubated for15minat room temperature
before being transferred to 1.25ml ES+LIF without Penicillin/streptomycin. After 5h of
incubation with the transfection mix, ESCs were split and plated on puromycin resistant
feeders.24haftertransfection,transientselectionwasstartedwithES+LIFcontaining8µg/ml
puromycin (Gibco10130127)atday1andday2andES+LIFcontaining4µg/mlpuromycinat
day3.Afterapproximatelyoneweek,singlecloneswerepickedandexpandedon96-wellplates
(Costar 3596). Clones were genotyped by PCR using primers spanning Exons 1-4. Deletion
breakpointswereanalyzedbySangersequencingofpurifiedPCRfragments.
Generationofgastruloids
Allmediumcompositionsare listed inSupplementaryTable3.Gastruloidsweregeneratedas
describedpreviously53,withsomeminormodifications.First,mESCswerefeederfreed.Tothis
.CC-BY-NC-ND 4.0 International license(which was not certified by peer review) is the author/funder. It is made available under aThe copyright holder for this preprintthis version posted March 4, 2020. . https://doi.org/10.1101/2020.03.04.974949doi: bioRxiv preprint

31
end,mESCsweretrypsinizedonthefeederplateasdescribedabove,washedwithES+LIFand
resuspendedin2mlES+LIF.Onthreegelatinized(0.1%gelatin)wellsofa6-wellplate,cellswere
sequentiallyplated for25’,20’and15’duringwhichcellswerekept in the incubatorat37°C
and 5% or 7.5% CO2. With each transfer, cells were triturated to maintain a single cell
suspension.Feeder-freedmESCswerethenwashedoncein5mlPBScontainingMgCl2andNaCl
(Sigma A8412) and once in 5 ml NDiff227 (Takara Y40002). mESCs were then pelleted by
centrifugation for 5’ at 1000rpm and resuspended in 500µl of NDiff227. 10µl of the cell
suspensionwasmixedwith10µlofTrypanblue(Bio-Rad1450021)forautomatedcellcounting
withLunaAutomatedCellCounter.200-250livecellswerethenplatedinavolumeof30to40µl
NDiff227 into each well of a 96-well round bottom, low attachment plate (Cellstar 96 well
suspension cultureplate (655185)orCostar7007ultra-lowattachment96well plate (7007)).
Cellswere then allowed to aggregate for 48 h. After these 48h cellswere pulsedwith 3µM
CHIR99021 (CHIR,Merck Millipore) in 150µl NDiff227. Between 72 and 120h, medium was
refreshedevery24hbyremoving150µloftheoldmediaandaddingthesamevolumeofnew,
pre-incubated (37°C and 5% or 7.5% CO2) NDiff227. For gastruloids treated with CHIR and
CHIR+LDN,5µMCHIRwithorwithout600nMLDN-193189(LDN,Reprocell)wasaddedfrom96h
to120h.Forcontrols,anequalvolumeofdiluent(DMSO)wasadded.
Generationoftrunk-like-structures
Allmedium compositions are listed inData S3. The gastruloid protocol described abovewas
followed until 96h.Gastruloidswere then embedded in 5%Growth-Factor-ReducedMatrigel
(MG)(Corning356231).Tothisend,freshNDiff227mediumwaspre-incubatedforatleast20’
.CC-BY-NC-ND 4.0 International license(which was not certified by peer review) is the author/funder. It is made available under aThe copyright holder for this preprintthis version posted March 4, 2020. . https://doi.org/10.1101/2020.03.04.974949doi: bioRxiv preprint

32
at37°Cand5%or7.5%CO2.Pre-incubatedmediumwasthenputonicefor5’,afterwhichMG
wasaddedtoachieveafinalconcentrationof5%intheculturewells.Mediumwasthenputon
roomtemperaturefor5’,duringwhich150µlofoldmediumwasremovedfromtheaggregates.
New medium with MG (150µl) was then added, and the cultures were returned to the
incubatorandfurtherculturedat37°Cand5%or7.5%.TLScultureswereallowedtosettlefor
at least 30’beforeproceeding to furtherexperimentation (e.g. live imaging). For TLS treated
withCHIRandCHIR+LDN,5µMCHIRwithorwithout600nMLDNwasaddedfrom96hto120h
priortoaddingtheMG.Forcontrols,anequalvolumeofdiluent(DMSO)wasadded.
Whole-mountImmunofluorescence
CollectedembryoswerewashedtwiceinPBSandthenfixedin4%PFAfor30’underrotationat
4°C,washed3xwithPBS,andstoredinPBSuntil immunofluorescentstainingwasperformed.
Gastruloidsortrunk-like-structureswerepickedusingap200pipettewiththetipcut-offatthe
50µlmark.GastruloidswerewashedtwicewithPBSandthenfixed in4%PFAfor1h inglass
vials(Wheaton224882)at4°Conaroller.Fortrunk-like-structures,individualstructureswere
pickedusingap200pipettewiththetipcut-offatthe50µlmark,andtransferredtoeither96-
wellplates(Costar3596)orIbidi8-wellglass-bottomplates(Ibidi80827).Trunk-like-structures
werewashedtwicewithPBS+MgCl2andNaCl+0.5%BSA(SigmaA8412),oncewithPBS,and
thenfixedin4%PFAfor1hrat4°Conarockingplatform.Subsequently,gastruloidsortrunk-
like-structureswerewashedtwiceinPBSfor5min,permeabilizedby3x20’incubationin0.5%
Triton-X/PBS (PBST) andblocked in 5% fetal calf serum/PBST (blocking solution) overnight at
4°C. For antibody staining, gastruloids/trunk-like-structures were transferred to Ibidi 8-well
.CC-BY-NC-ND 4.0 International license(which was not certified by peer review) is the author/funder. It is made available under aThe copyright holder for this preprintthis version posted March 4, 2020. . https://doi.org/10.1101/2020.03.04.974949doi: bioRxiv preprint

33
glassbottomplates.Primaryantibodyincubationwasperformedinblockingsolutionfor48-72h
at 4°C, after which gastruloids/trunk-like-structures were washed three times with blocking
solution and three times with PBST. After the last washing step, Gastruloids/trunk-like-
structureswereincubatedinblockingsolutiono/nat4°C.Thenextday,secondaryantibodies
diluted in blocking solution were added, and structures were incubated for 24h at 4°C.
Afterwards, gastruloids/trunk-like-structureswerewashed three timeswith blocking solution
and three timeswith PBST. The last PBSTwashing step after secondary antibody incubation
includedDAPI (0.02%,RocheDiagnostics10236276001).DAPIwas incubatedo/nandwashed
offoncewithPBST.AllprimaryandsecondaryantibodiesarelistedinSupplementaryTable3.
Tissueclearing
Prior to imaging, embryos, gastruloids and trunk-like-structures were cleared with RIMS
(refractive indexmatchingsolution).Tothisend,sampleswerewashedtwicewithPBSfor10
min,post-fixedin4%PFAfor20minutesandwashedthreetimeswith0.1Mphosphatebuffer
(PB,0.025MNaH2PO4and0.075MNa2HPO4,pH7.4).Clearingwasperformedbyincubationin
RIMS(133%w/vHistodenz(Sigma-AldrichD2158)in0.02MPB)onarockingplatformat4°Cfor
atleastonetoseveraldays.
Imaging
Gastruloidsandtrunk-like-structuresstainedwithantibodiesorcarryingfluorescentreporters
were imaged with the Zeiss AxioZoom v16 (wide-field), Celldiscoverer7 (wide-field), Zeiss
LSM710(laser-scanningmicroscopewithAiryscan)orZeissLSM880(laser-scanningmicroscope
withAiryscan)withappropriate filters formCherry,Venus,DAPI,AlexaFluor488,AlexaFluor
.CC-BY-NC-ND 4.0 International license(which was not certified by peer review) is the author/funder. It is made available under aThe copyright holder for this preprintthis version posted March 4, 2020. . https://doi.org/10.1101/2020.03.04.974949doi: bioRxiv preprint

34
568,AlexaFluor647,andcombinationsthereof.EmbryoswereimagedwithZeissLightsheetZ1
withappropriatefiltersformCherryandVenus.Whole-mountinsituhybridizationimageswere
acquiredwithZeissAxioZoomv16.Post-acquisitionimageprocessingwasperformedusingZen
and/orArrivis.ForliveimagingofTLSin96-wellplatesweusedtheCelldiscoverer7(Zeiss)with
incubator chamber temperature set at 37°C and CO2 content at 5%. Acquisition intervals
rangedfrom15-30minutes.
Morphometricanalysisofgastruloidsandtrunk-like-structures
ForquantificationofthenumberofstructureswithaT+-pole,weemployedtheT::H2B-mCherry
reporterline.Ifastructuredisplayedmultipleaxesofelongation,itwassufficientforoneend
to have a T::H2B-mCherry+ pole to be scored as having a “T-pole”. We defined
gastruloids/trunk-like-structuresas“segmented”whenatleastfourneighboringsegmentshad
developedalongtheanteroposterioraxisat120h.Finallyifastructuredisplayedtwoormore
axesofelongation,itwasscoredas“multipleaxes”,ifshowingjustoneas“oneaxes”,ifnone
“no elongation”. For all conditions, three independent experiments, eachone including each
treatment,wereanalyzed.Structures thatgrewoutof focus inaway that theycouldnotbe
ratedforoneofthecategorieswereexcludedfortherespectivecategory.
FlowcytometryandFACS
Individual trunk-like-structureswerewashedwith PBS+0.5%BSA 2 times, afterwhich 50μl of
trypsin was added. Trunk-like-structures were then incubated for 10’ at room temperature,
afterwhichsamplesweredissociatedbytriturationfor50timesusingap200pipettetoachieve
ahomogenoussuspension.Thereactionwasthenstoppedwiththeadditionof100μlof5%BSA
.CC-BY-NC-ND 4.0 International license(which was not certified by peer review) is the author/funder. It is made available under aThe copyright holder for this preprintthis version posted March 4, 2020. . https://doi.org/10.1101/2020.03.04.974949doi: bioRxiv preprint

35
in PBS. Before cell counting and/or sorting on a FACS Aria II (Becton Dickinson) or a BD
FACSCelestaFlowCytometer(BectonDickinson,countingonly)thecellsuspensionwasfiltered
througha35μmmesh.Equalnumbersofsamplesforeachconditionwereharvested inthree
independent experiments. For FACS, samples were dissociated as described above, and the
Tbx6VE+andTbx6VE-fractionwassortedin1.5mllow-bindingtubeswith350μlRLT(Qiagen)+1%
v/vB-mercaptoethanol(Sigma).FlowcytometrydatawerelateranalyzedusingFlowJoV10.
RNAisolation,reversetranscriptionandquantitativePCR
RNA isolation was performed using the RNeasy Micro Kit (Sigma 74004) according to the
manufacturer’s instructions with the followingmodifications: genomic DNAwas digested on
columnwith the addition of an extra 1μl of RNase-freeDNase I (Roche) to ensure complete
digestion, and after the 80% ethanol columnwash and column centrifugation the remaining
ethanol was removed with a p10 pipette tip and columns were left to air-dry for 5’.
Quantitative reverse transcriptase PCR (qRT-PCR) was then performed using a two-step
protocol. First, RNA was reverse transcribed using the Quantitect Reverse Transcription Kit
(Qiagen),accordingtothemanufacturer’sinstructions.qPCRwascarriedoutonaStepOnePlus
Real-Time PCR System (Life Technologies) using GoTaq qPCR Master Mix (Promega) with
validatedgene-specificprimers(SupplementaryTable4).FoldchangewascalculatedfromΔCt
usingTbpashousekeepinggene(SupplementaryTable5).
Measuringofsegmentsize
Segmentsizesweremeasured inFiji1.8.0usingthe imagesacquired in theTmChchannel.For
each structure, the four newest neighboring segments were measured counting from the
.CC-BY-NC-ND 4.0 International license(which was not certified by peer review) is the author/funder. It is made available under aThe copyright holder for this preprintthis version posted March 4, 2020. . https://doi.org/10.1101/2020.03.04.974949doi: bioRxiv preprint

36
posteriorend.Incaseofbilateralsegments,onlysegmentsononesideweremeasured.Forthe
‘bunches of grapes’ in TLSC and TLSCL, four segments along the antero-posterior axis were
measured counting from the posterior end. Length was defined as parallel to the anterior-
posterioraxis,widthwasdefinedasperpendiculartotheanterior-posterioraxis.
Whole-mountinsituhybridization
Probesynthesis
For synthesis of DIG labelled RNA probes, plasmids containing the cDNA of interest and
promoters for sense and anti-sense strand synthesis were used from theMAMEP database
(http://mamep.molgen.mpg.de). In order to obtain a sufficient amount of material, some
plasmidswerefirstretransformedintoE.coli(DH5α)andafterwardsisolatedwithamini-prep
kit (Qiagen) according to the manufacturer’s instructions as described below. To verify the
identityofthevectorandinsertofeachplasmid,plasmidsweredigestedbyrestrictionenzymes
andloadedona1.0%agarose/TAEgel.Probesweresynthesizedbyinvitrotranscriptionusinga
PCRproductofthedesiredcDNAorthelinearizedplasmid.
RetransformationinDH5αandmini-prep
DH5αcellswerethawedoniceand1µloftheplasmidwasaddedto100µlofcompetentcells
andincubatedonicefor30’.Subsequently,cellswereheatshockedat42°Cfor45”inawater
bathandthen immediatelycooleddownon ice.500µlofLBmediumwasaddedandthemix
was incubated for 1h at 37°C (heating block) under shaking. Then, 25µl and 250µl of the
mixture were plated on separate Agar-plates containing Ampicillin (Amp) for selection of
.CC-BY-NC-ND 4.0 International license(which was not certified by peer review) is the author/funder. It is made available under aThe copyright holder for this preprintthis version posted March 4, 2020. . https://doi.org/10.1101/2020.03.04.974949doi: bioRxiv preprint

37
transformed bacteria (all vectors carried a gene for Ampicillin resistance). The plates were
incubated overnight at 37°C. The next day, single colonies were picked in 5ml LB+Amp and
incubated overnight at 37°C under shaking. Plasmids were isolated with the QIAprep Spin
MiniprepKit (Qiagen) followingthe instructionsoftheQuick-StartProtocolusingacentrifuge
forprocessing.DNAconcentrationwasmeasuredwithaNanophotometer(Implen).
RestrictionDigest
Afterplasmiddigestion(250ngoftheplasmid,2µl10xbuffer,0.2µl100xBSAand2µlofeach
restrictionenzymeina20µltotalvolume),expectedbandsizedforthevectorsandinsertswas
confirmedona1%Agarose/TAE-gel,stainedwithSybrSafe(1:20.000).
Polymerase-Chain-Reaction(PCR)
ForPCR,5µlPlasmid(1ng/µl)wasusedina50µltotalreactionvolumecontaining5µl10xPCR
buffer (Invitrogen), 1.5µlMgCl2 (Invitrogen), 10µl dNTPMix (10mMeachnucleotide), 0.25µl
forward Primer (100 µM), 0.25µl reverse Primer (100 µM) and 0.2µl Taq DNA Polymerase
(5u/µl)(Invitrogen).FortheplasmidofUncx4.1adifferentPCRstrategywasused,becauseof
itsCGrichness.Here,the50µlreactioncontained5µlPlasmid(1ng/µl),1µldNTPS,0.25µlU5,
0.25µlL2,0.2µlTaqDNAPolymerase(5u/µl)(Qiagen)and10µl5xQ-solution(Qiagen).Primers
used for the respective vectors are listed in Supplementary Table 4. All PCR products were
checkedona1%Agarose/TAE-gel.
Linearizationofplasmidsforinvitrotranscription
.CC-BY-NC-ND 4.0 International license(which was not certified by peer review) is the author/funder. It is made available under aThe copyright holder for this preprintthis version posted March 4, 2020. . https://doi.org/10.1101/2020.03.04.974949doi: bioRxiv preprint

38
Plasmidswerelinearizedwitharestrictionenzyme(1.5µgDNA,2.5µl10xbuffer,filledupwith
DEPC-H2Oto25µl).The reactionwas incubated for1hat37°C.Subsequently,8µlammonium
acetate (10M)and80µl ice-cold100%ethanolwereadded, followedbycentrifugationof the
sample for30’at4°Cand13.200rpm.Thesupernatantwasthenremovedand150µlof70%
ice-cold ethanol was added. Sample was centrifuged again for 10’, the supernatant was
removed,andthepelletwasairdriedanddissolvedin9.5µlDEPC-H2O.
Invitrotranscription
Forinvitrotranscription,9µlofPCRproductor1.5µgoflinearizedplasmidwasincubatedwith
3µl10xTranscriptionbuffer,3µlACGnucleotides (4mMeachnucleotide),0.75µldigUTP-UTP
Mix (4mM),1.5µlDTT,1µlRNase inhibitorand60U of the respectiveRNApolymerase, ina
totalreactionvolume(filledupwithDEPC-H2O)of30µl.Thereactionwas incubatedfor2hat
37°C(T7,T3)or40°C(Sp6).Subsequently,3µlofRNase-freeDNaseI(10u/µl)wasaddedandthe
reactionwasincubatedfor15’at37°C.TheRNAprobewasthenpurifiedwithProbeQuantG50
Sephadex columns (Pharmacia).Adding20µlDEPC-H2O to theprobe, spinning it through the
resinofthecolumnandaddingagain30µlDEPC-H2Oincreaseditsvolumeto100µl.Aliquotsof
30µlwereimmediatelyputondryiceandstoredat-80°C.TheRNAprobeswerecheckedona
1%Agarose/TAE-gel.
Fixationandmethanolseries
Collectedembryos, gastruloidsand trunk-like-structureswerewashed twice inDEPC-PBSand
then fixed in 4% PFA overnight at 4°C. The next day, samples were transferred into 100%
methanolviaamethanolseries, includingtwowashingstepsinDEPC-PBSandatransferfrom
.CC-BY-NC-ND 4.0 International license(which was not certified by peer review) is the author/funder. It is made available under aThe copyright holder for this preprintthis version posted March 4, 2020. . https://doi.org/10.1101/2020.03.04.974949doi: bioRxiv preprint

39
25%to50%to375%to100%methanol/DEPC-PBS(10’each).Upontransferto100%methanol,
sampleswerewashedtwicein100%methanolandstoredin100%methanolat-20°C.Allsteps
wereperformedforatleast10’at4°C.
Pre-hybridization&Hybridization
Unless stated differently, all steps were performed for 10’ at 4 °C under rocking. For the
composition of the solutions used for in situ (Pre-hybridization, Hybridization, Post-
hybridization washes and antibody incubation, Post-antibody washes, Staining) we refer to
SupplementaryTable3.First,sampleswerepre-hybridizedbytransferringtoDEPC-PBSTviaa
reverse methanol series (100%, 75%, 50%, 25% for 10’ each). Subsequently, samples were
incubated in6%H2O2/DEPC-PBSTat4°C, trunk-like-structures/gastruloid for10’andembryos
for 20’, followed by three washes with DEPC-PBST. ProteinaseK/DEPC-PBST (10µg/ml)
treatment was performed at 4°C, (7’ for trunk-like-structures/gastruloids, 10’ for embryos).
ProteinaseK activity was quenched with Glycine/DEPC-PBST (2mg/ml) and two washes with
DEPC-PBST. Subsequently, sampleswerepost-fixed in0.2%Glutamine/4%PFA/DEPC-PBS for
30’ at room temperature and then washed twice with DEPC-PBST. Samples were then
incubated with 68°C pre-warmed Hyb for 15’ at room temperature after which Hyb was
refreshedandstructuresincubatedfor2morehoursat68°C.IfnotimmediatelyusedforRNA
probehybridization,thesampleswerepre-cooledfor15’atroomtemperatureandstoredat-
20 °C. Prior to hybridization with the RNA probe, the samples and Hyb solution were pre-
warmedat 68°Cand incubated in freshHyb for 15’ at 68°C.Meanwhile, theRNAprobewas
dilutedinHyb(200ng/ml)andpre-heatedfor13’at80°Cinaheatingblock.Thesampleswere
.CC-BY-NC-ND 4.0 International license(which was not certified by peer review) is the author/funder. It is made available under aThe copyright holder for this preprintthis version posted March 4, 2020. . https://doi.org/10.1101/2020.03.04.974949doi: bioRxiv preprint

40
thenincubatedwiththeRNAprobeat68°Covernight.TheHybsolutionofthe15’ incubation
stepwasstoredat-20°Cforthefirstwashingsteponthenextday.Allstepswereperformed
underrocking.
Post-hybridizationwashes,antibodyincubationandpost-antibodywashes
Thenextday, sampleswerewashedoncewithHyb (stored fromdaybefore) for30’at68°C,
twicewithSolution1for30’at68°C,twicewithSolution3Tfor30’at68°C,twicewithSolution
3Tfor1hat68°CandthreetimeswithTBSTfor15’atroomtemperature.Duringthe1hwashes
withSolution3T,antibodysolutionwasprepared.TBSTwithonegrainofembryopowderwas
pre-heatedfor30’at70°Cinawaterbathandcooleddownonice.Subsequently,1%v/vlamb
serumand0.2%v/vAnti-DIGantibody(Roche)wereaddedandincubatedfor1hat4°Cinthe
darkwhilerocking.Themixwascentrifugedfor10’at4000rpmat4°Cand1%lambserum/TBST
wasaddedtothesupernatant(finalantibodyconcentration1:2000).Afterfinishingthewashing
steps,thesampleswereblockedwith10%lambserum/TBSTfor2.5hatroomtemperatureand
incubatedwiththeantibodysolutionovernightat4°C.Allstepswereperformedunderrocking.
Thenextday,sampleswerewashedtwicewithTBSTfor15’,twicefor30’andsixtimesfor1h,
allatroomtemperature.ThefinalwashingstepwasperformedovernightinTBSTat4°C.
Staining
SampleswerewashedfourtimesinfreshlypreparedNTMTfor15’atroomtemperatureunder
rocking. In themeantime, the staining solutionBMPurple (Roche)was pre-warmed at room
temperatureandcentrifugedfor1’at13.200rpm.Thesupernatantwasthenusedforstaining
thesamplesand incubateduntila clearandspecific signalappeared.The first15’of staining
.CC-BY-NC-ND 4.0 International license(which was not certified by peer review) is the author/funder. It is made available under aThe copyright holder for this preprintthis version posted March 4, 2020. . https://doi.org/10.1101/2020.03.04.974949doi: bioRxiv preprint

41
were performed under rocking, afterwards without. For stopping the staining reaction, the
samples were washed once with NTT and twice with PBST, for at least 10’ each at room
temperatureunder rocking. The sampleswere stored in4%PFA/PBSat4°C. Embryos, trunk-
like-structuresandgastruloidswereimagedwiththeAxioZoom.V16(Zeiss).
Single-celltranscriptomeprofilingofTLSs
96h, 108hTLS and120hTLSwere generatedasdescribedabove. For 96h, 6 structureswere
selected based on the presence of a TmCh+ pole and absence ofmultiple axes formation; for
108h TLS, 5 structures were selected based on the presence of a TmCh+ pole, one axis of
elongation,andinitiationofneuraltubeformation,butnosegmentationintheTmCh+domain;
for 120h TLS, 3 structureswere selected based on the presence of a TmCh+ pole, one axis of
elongation, clear formation of a neural tube Sox2Ve+ domain and segmentation in the TmCh+
domain.TLSswerepickedwithap200withthepipettetipcut-offatthe50µlmark,andserially
washedthroughpipettetransferring(cut200µltip)inwellsfilledwith200µlof1xPBS/0.4%BSA
(5transfers)togetridoftheMatrigel.TLSsofthesametimepointwerethenpooledtogether
anddissociated in200µl TrypLEExpress (Gibco) for 15minutes (96h), 20minutes (108hTLS)
and25minutes(120hTLS)at37ºC,withpipettingevery5minintervals.Thecellsuspensionwas
filtered using Scienceware Flowmi Cell Strainers, 40µm. Cells were washed twice with 1ml
1xPBS/0.4%BSAwithcentrifugationstepsperformedfor5minutesat1200rpminlowDNAbind
Eppendorf tubes. The cell concentration was determined using a hemocytometer and cells
weresubjectedtosingle-cellRNAsequencing(10xGenomic,Chromium™SingleCell3’v3;one
reaction per timepoint has been used) aiming for a target cell recovery of up to 10,000
.CC-BY-NC-ND 4.0 International license(which was not certified by peer review) is the author/funder. It is made available under aThe copyright holder for this preprintthis version posted March 4, 2020. . https://doi.org/10.1101/2020.03.04.974949doi: bioRxiv preprint

42
sequenced cells per sequencing library (timepoint). Single-cell libraries were generated
according to the manual, with one modification: fewer PCR cycles (n=8) were ran than
recommended during cDNA amplification or library generation/sample indexing to increase
librarycomplexity.Librariesweresequencedwithaminimumof230millionpairedendreads
accordingtoparametersdescribedinthemanual.
BulkRNA-seqofgastruloidsandtrunk-like-structures
96h aggregates, gastruloids, TLS, TLSC and TLSCL were generated as described above. We
sequenced 3 biological replicates per condition (96h aggregates, Gastruloids, TLS, TLSC and
TLSCL). For 96h, 10 structures per replicatewere selected (see previous section for selection
criteria)andpooled; forGastruloids,6 structuresper replicatehavebeenselected (basedon
thepresenceofaTmCh+poleandoneaxisofelongation)andpooled;forTLS,TLSCandTLSCL,6
structuresperreplicatewereselected(seeprevioussectionforTLSselectioncriteria;TLSCand
TLSCL were selected based on the presence of of a TmCh+ pole, elongation along one axis,
segmentationinbunchesofgrapesattheanteriorTmCh+domain)andpooled.Allsampleswere
washed twice with 1xPBS/0.4%BSA. Then 350µl of RLT Plus buffer containing 1% β-
mercaptoethanol (Thermo) was added to dissociate the structures and lyse the cells. After
pipette dissociation and vortexing, samples were frozen at -80C. The next day, RNA was
extracted using RNeasy Plus Micro Kit (Qiagen) and RNA concentration and quality was
measured using the Agilent RNA 6000 Pico kit on an Agilent 2100 Bioanalyzer. All samples
analyzedhadaRINevaluehigherthan8.0,andweresubsequentlyusedforlibrarypreparation.
mRNAlibrarieswerepreparedusingKAPAStrandedRNA-SeqKit(KapaBiosystem)accordingto
.CC-BY-NC-ND 4.0 International license(which was not certified by peer review) is the author/funder. It is made available under aThe copyright holder for this preprintthis version posted March 4, 2020. . https://doi.org/10.1101/2020.03.04.974949doi: bioRxiv preprint

43
themanufacturer’s instructions. 500ng of total RNAwas used for each sample to enter the
librarypreparationprotocol.Foradapter ligationdual indexeswereused (NEXTFLEX®Unique
Dual IndexBarcodesNOVA-514150)ataworkingconcentrationof71nM(5µlof1uMstock in
each70µlligationreaction).Qualityandconcentrationoftheobtainedlibrarieswasmeasured
usingAgilentHigh SensitivityD5000 ScreenTapeon anAgilent 4150TapeStation.All libraries
were sequenced using 75bp-paired end sequencing (150 cycles kit; FC-410-1002) on a
HiSeq4000platformataminimumof23,7millionfragmentspersample.
ExpressionprofilingofTLSvariabilityusingNanoString
mESCs,mouseembryosandTLSweregenerated,selectedanddissociatedasdescribedabove.
FormESCs,atotalof20,000cellswereharvestedandfrozenin350µlRLTPlusbuffercontaining
1%β-mercaptoethanol(Thermo).Threeembryosforeachdevelopmentalstage(E8.5andE9.5)
weredecapitatedinordertoobtainthepost-occipitalportion,pooled,dissociated,andfrozen
in350µlRLTPlusbuffercontaining1%β-mercaptoethanol.For120hTLS,9individualstructures
havebeenselected(basedontheselectioncriteriaoutlinedbefore),dissociatedindependently
andfrozenin350µlRLTPlusbuffercontaining1%β-mercaptoethanol.RNAwasisolatedfrom
the 12 samples in parallel using RNeasy PlusMicro Kit (Qiagen) and RNA concentrationwas
measuredusingQubit™RNAHSAssayKit.
Toprofiletheexpressionof41genesand4housekeepinggenes(Polr1b,Hprt,Abcf1,Gusb),a
rangeof 36-161ng total RNA/samplewere used in aNanoString nCounter Element assay to
profilethe12 individualsamples.Probehybridizationwassetupaccordingtomanufacturer’s
instructions and performed for 24 hours (MAN-10040-05). Reactions were ran on the
.CC-BY-NC-ND 4.0 International license(which was not certified by peer review) is the author/funder. It is made available under aThe copyright holder for this preprintthis version posted March 4, 2020. . https://doi.org/10.1101/2020.03.04.974949doi: bioRxiv preprint

44
NanoStringnCounterSPRINTInstrument.Falsenegativeprobesdetectedupto5counts,which
informedthemagnitudeofpotentialfalsenegativesignal.Thus,6countswereconservatively
removed from all measurements. Positive control probes normalization step was applied
(geometric mean) and finally the combination of the four housekeeping genes was used to
obtain the final normalized counts table. To assess variability in the expression of individual
marker genes, the log2(MAX(all_samples)/MIN(all_samples))was used as a proxywith a high
valuerepresentinghighvariabilityandviceversa.SeeSupplementaryTable6forprobesdesign
andsequencesandDataS7fornormalizedgenecounts.
Computationalanalysis
Ifnotstatedotherwise:AllstatisticsandplotsaregeneratedusingRversion3.6.0“Plantingofa
Tree”andSeuratversion3.054.
Single-celltranscriptomeprofilingofTLSs
Preprocessing
TheCellRangerpipelineversion3(10xGenomicsInc.)wasusedforeachscRNA-seqdatasetto
de-multiplextherawbasecallfiles,generatethefastqfiles,performthealignmentagainstthe
mousereferencegenomemm10, filter thealignmentandcountbarcodesandUMIs.Outputs
frommultiplesequencingrunswerealsocombinedusingCellRangerfunctions.
Qualitycontrol
.CC-BY-NC-ND 4.0 International license(which was not certified by peer review) is the author/funder. It is made available under aThe copyright holder for this preprintthis version posted March 4, 2020. . https://doi.org/10.1101/2020.03.04.974949doi: bioRxiv preprint

45
The initialquality controlwasperformedusing scanpy55.Cellswith less than10,000ormore
than40,000counts,amitochondrial-fractionabove0.1andlessthan3,000geneswereflagged
asinsufficient.
Clusterdetermination
Single cell data created for the threedevelopmental timepoints (96h, 108h and120h)were
loaded to Seurat54,with aminimum requirementof 200 features and3 cells and filtered for
previously flagged barcodes. Subsequently, the expression data were independently
normalized,variablefeaturesweredetectedandlog-normalizedandscaledto10,000(default
settings).Next,fordownstreamintegrationofthethreetimepointssequenced,aPCAwasrun
foreachtimepointpriortointegrationanchorsetdetection(reduction="rpca",dims=1:30).
Finally, these integrationanchorswereusedto integratethedatapointsusingthepreviously
calculated anchor sets. A list of cell cyclemarkers loadedwith Seuratwas used to cell cycle
scoreallcellsandsubsequentlyrunthedefaultworkflowforscalingwithvars.to.regresssetto
cellcyclescoresforSandG2Mphase(ExtendedDataFig.15a).Fordownstreamanalysisand
visualizationofthe integrateddataset,aPCAwasruntothencalculatea jointUMAP(dims=
1:30, n.neighbors = 10). Standard workflow steps were applied for cluster generation
(FindNeighbors, dims = 1:20 and FindClusters, resolution = 0.5), resulting in a total of 15
clusters.Finally,twosmallclusters(Seurat_10andSeurat_11)wereremovedduetopresence
of stressed cells (high mitochondrial RNA counts and low total RNA counts) (Seurat_10;
.CC-BY-NC-ND 4.0 International license(which was not certified by peer review) is the author/funder. It is made available under aThe copyright holder for this preprintthis version posted March 4, 2020. . https://doi.org/10.1101/2020.03.04.974949doi: bioRxiv preprint

46
ExtendedDataFig.15b)anddoublets(shownbyalmostdoubleamountoftotalRNAscounts
and UMIs) (Seurat_11; Extended Data Fig. 15c). All remaining clusters show a similar
distribution of average UMIs and genes detected per cell (Extended Data Fig. 15d). See
SupplementaryTable8formarkergeneslistforeachidentifiedcluster.
Subclusteringofsomiticandneuralcells
For subclustering of somitic cells, data were first split by sampled timepoints and somitic
clusters (“Somite (0)”, “Somite”, “Somite (Dermo)”, “Somite (Sclero)”) were extracted.
Subclusteringwas thenperformed inScanpy (resolution=0.3). For subclusteringof theneural
tubecluster,cellsassignedto“NeuralTube2”fromTLSwereextracted.Subclusteringwasthen
performedinScanpy(resolution=0.65).
Comparisonwithmouseembryo
Apreviouslyestablishedreferencedatasetofmousepost-implantationdevelopment(E6.5to
E8.5)35 was utilized for gene expression comparison to in vivo data as well as cell type and
proportion comparisons. The in vivo data were filtered to include only the relevant embryo
time points (E.7.5, E8.0 and E8.5) all extra-embryonic and occipital cell-types (that are not
generatedingastruloids3andTLS(thisstudy))wereremoved.SeeSupplementaryTable8for
markergeneslistforeachidentifiedcluster.Both,themouseinvivoandtheTLSsinvitro,data
sets were normalized in parallel (SCTransform, default settings). To adjust for different
resolutionsincelltypedetectionbetweentheembryoandTLSdatasets,the invivo“somites”
.CC-BY-NC-ND 4.0 International license(which was not certified by peer review) is the author/funder. It is made available under aThe copyright holder for this preprintthis version posted March 4, 2020. . https://doi.org/10.1101/2020.03.04.974949doi: bioRxiv preprint

47
and “PSM” cell states were subclustered (resolution=0.15) to identify a cell cluster with an
anterior PSM (aPSM) signature (Extended Data Fig. 15e,f). These cells were relabeled
accordingly and subsequently treated as an individual cell type. The subclustering step also
generated two clusters from the in vivo PSM original cell state, but due to marker genes
similarity this subclustering was not taken into account in the further downstream analysis
(ExtendedDataFig. 15e,f). Prediction scoreswereusedasmeasurement for certainty in cell
typematching("certaintyscores").Scoresshownaremeansacrossallcellsevenifnotassigned
to the respective cluster. Finally, the in vivomouseand in vitro TLS cell typeswerematched
using an integrated reference, by first finding of transfer anchors, followed by data transfer
usingtheanchorsandfinallythepredictedcelltypeswereusedasinvivo/invitromatchedcell
typecounterparts.Fordifferentialexpressionandconservedmarkercalculationbothdatasets
were merged and genes located on the sex chromosomes were excluded to avoid biases
resultingfromcomparisonofonlymaleTLSswithinvivocellsfrommaleandfemaleembryos.
Analysisofconservedmarkergenes
TheconservedmarkergeneswascalculatedontheintegrationoftheTLSandembryodataas
describedaboveusing theFindConservedMarkers functionwithdefault setting.Cut-offsused
weresettoaminimumpercentagedifferenceof25%(forpercentofcellsexpressingthegene
ofinterest(GOI)),andanabsoluteminimumlog2FCof1.SeeSupplementaryTable9forlistof
top25conservedmarkergenes.
AnalysisofdifferentiallyexpressedgenesbetweenTLSandembryo
.CC-BY-NC-ND 4.0 International license(which was not certified by peer review) is the author/funder. It is made available under aThe copyright holder for this preprintthis version posted March 4, 2020. . https://doi.org/10.1101/2020.03.04.974949doi: bioRxiv preprint

48
TLS and embryo data were integrated as described above. For the analysis, the in vivo cell
stateswereusedasareference,andcomparedtotheTLScellsattributedtothatcluster.Tothis
end,thepercentofcellsexpressingageneaswellastheaverageexpressionforthatgene in
theinvivocellstatesaswellastheinvitrocellsattributedtothatclusterwascomputedusing
the FindMarkers function with default settings. Differential expression between TLS and
embryowastested foreitherall thegenesexpressed in theclusterof interest,or the20top
markergenesofeach invivocellstates.Cut-offsusedwereaminimumpercentagedifference
of25%(forpercentofcellsexpressingthegeneof interest (GOI)),andanabsoluteminimum
log2FCof1.SeeSupplementaryTable9forlistofgenomewidedifferentiallyexpressedmarker
genes.
RNAvelocityandpseudo-timeanalysis
RNAvelocitywascalculatedusingthevelocytotool31,56andvisualizedusingscanpy55.Trajectory
inference and pseudo-time analysis were done using the scanpy package PAGA57. The
previously calculatedUMAPand cell cluster assignmentwasused for velocity projection and
trajectoriesforpseudo-time.Forpseudo-timeanalysis,somiticclusters(“Somite(0)”,“Somite”,
“Somite (Dermo)”,“Somite (Sclero)”)weremerged, theputativeNMPclusterwassetas root
and108hand120hcellswereanalyzedseparately.
BulkRNA-seqofgastruloidsandtrunk-like-structures
Processingandexpressionlevels
.CC-BY-NC-ND 4.0 International license(which was not certified by peer review) is the author/funder. It is made available under aThe copyright holder for this preprintthis version posted March 4, 2020. . https://doi.org/10.1101/2020.03.04.974949doi: bioRxiv preprint

49
RNAseqtriplicatesofthedifferentgrowthconditions96h,Gastruloids120h,TLS,TLSCandTLSCL
werepre-processedusingcutadapt58toremoveadapterandtrimlowqualitybases.Readswere
subsequently aligned against the reference genome mm10 using STAR59 (parameter:
outSAMtype BAM SortedByCoordinate --outSAMattributes Standard --outSAMstrandField
intronMotif --outSAMunmapped Within --quantMode GeneCounts). Finally, Stringtie60 was
used for transcript assembly, e.g. calculation of strand-specific TPMs. The three biological
replicateshighlycorrelatebetweeneachother(ExtendedDataFig.15g).
Differentialgeneexpression
Differential expression analysis was done independently per group comparison using the R
packageDESeq261usingtherawexpressioncountsfromSTAR'sreadspergeneoutput.z-scores
were calculated according to the formula ((VALUE(sample)-
AVERAGE(all_samples))/STDEV(all_samples). TPM values for all genes can be found in
SupplementaryTable10.
GeneSetEnrichmentAnalysis(GSEA)
GSEA was performed using the R package “fgsea”62 (minSize=5, maxSize=500, number of
permutations=10.000) takingall genes statisticallydifferentiallyexpressedbetweenTLSand
gastruloids(FDR<0.05,nolog2FCcut-off).
Dataavailability
.CC-BY-NC-ND 4.0 International license(which was not certified by peer review) is the author/funder. It is made available under aThe copyright holder for this preprintthis version posted March 4, 2020. . https://doi.org/10.1101/2020.03.04.974949doi: bioRxiv preprint

50
Bulkandsingle-cellRNA-SeqdatahavebeendepositedintheGeneExpressionOmnibus(GEO)
underaccessioncodeGSE141175.
Codeavailability
Allcomputationalcodeusedinthisstudyisavailableuponrequest.
.CC-BY-NC-ND 4.0 International license(which was not certified by peer review) is the author/funder. It is made available under aThe copyright holder for this preprintthis version posted March 4, 2020. . https://doi.org/10.1101/2020.03.04.974949doi: bioRxiv preprint

51
ExtendedDataFig.1Inductionofembryo-likemorphologyintrunk-like-structures
a,SchematicofT::H2B-mCherry;Sox2::H2B-VenusdoublereportermESCs(upperpanel)and invivovalidationby
tetraploid complementation (bottom panel). Optical sections of light-sheet imaging of a E9.0 mouse embryo
caudalend(bottom-leftpanel)andofsomitesandneuraltube(bottom-rightpanel).Scalebar50μm.b,Wide-field
fluorescentandbright-fieldimagesof120hgastruloids.Scalebar200μm.c,Wide-fieldfluorescentandbright-field
images of 120h TLS.d,Wide-field fluorescent and bright-field images of 120h gastruloids treatedwith CHIR or
CHIR+LDNfrom96to120hshowingnosignsofsegmentationintheabsenceof5%matrigel.e,Quantificationsof
gastruloidsfromconditionsind.TreatmentofgastruloidswithCHIRandLDNdoesnotsignificantlyaltertheaxis
formation and induction of a TmCH+ pole, and is not able to induce segmentation. f,Wide-field fluorescent and
.CC-BY-NC-ND 4.0 International license(which was not certified by peer review) is the author/funder. It is made available under aThe copyright holder for this preprintthis version posted March 4, 2020. . https://doi.org/10.1101/2020.03.04.974949doi: bioRxiv preprint
52
bright-field images of 120h TLSC.g,Wide-field fluorescent andbright-field images of 120h TLSCL. Inb-dand f,g,
scalebaris200μm,exceptformagnifications,wherescalebaris50μm.h,QuantificationofsomitesizeinTLSand
embryosusingFiji (seeSupplemental Information)revealsthatTLSandTLSCsomiteshaveasimilar lengthbuta
slightlysmallerwidthascomparedtotheembryo,resultinginanoverallslightlyreducedsegmentarea. InTLSCL,
both somite length and width are smaller than in vivo. Boxes indicate interquartile range. End of whiskers
representminimumandmaximum.Symbolsindicateindividualsomite.Centrallinerepresentthemedian.
.CC-BY-NC-ND 4.0 International license(which was not certified by peer review) is the author/funder. It is made available under aThe copyright holder for this preprintthis version posted March 4, 2020. . https://doi.org/10.1101/2020.03.04.974949doi: bioRxiv preprint

53
ExtendedDataFig.2Formationofgut-like-structuresintrunk-like-structures
a, 3Dmaximum intensityprojectionofTLS (leftpanel) stained for FOXA2 (blue) to reveal thegut-like-structure.
Scale bar 50μm. b, Confocal sections showing the FOXA2+ (upper panel) and SOX17+ (bottom panel) gut-like
structure inTLS.NoteFOXA2+/TmCH-highcellsat thebaseof thegut (whitearrowheads).Redarrowheads indicate
somites. Scale bars 25μm. c, Confocal section showing gut-like structure in TLSC. d, 3D maximum intensity
projectionshowinggut-likestructureinTLSCL.Inthemagnifications(rightpanels)inc,dwhitearrowheadsindicate
FOXA2+/TmCH-highcellsatthebaseofthegut.Redarrowheadsindicateguttubularcavity.
.CC-BY-NC-ND 4.0 International license(which was not certified by peer review) is the author/funder. It is made available under aThe copyright holder for this preprintthis version posted March 4, 2020. . https://doi.org/10.1101/2020.03.04.974949doi: bioRxiv preprint

54
ExtendedDataFig.3BulkRNA-Sequencingofgastruloidsandtrunk-like-structures
a, Schematic of experimental set-up. N=number of pooled structures per replicate, n=number of replicates. b,
Heatmap of expression for an extended panel of selected genes associated with development of indicated
.CC-BY-NC-ND 4.0 International license(which was not certified by peer review) is the author/funder. It is made available under aThe copyright holder for this preprintthis version posted March 4, 2020. . https://doi.org/10.1101/2020.03.04.974949doi: bioRxiv preprint
55
embryonic structures in 96h aggregates, gastruloids, TLS, TLSC and TLSCL, as measured by RNA-seq. TPM,
Transcripts PerMillion. CE, caudal end,NMP, neuromesodermal progenitors, PSM, presomiticmesoderm, LPM,
lateralplatemesoderm, IM, intermediatemesoderm.c,Heatmapwithscaledexpression(rowz-score)ofknown
markergenesofposteriorpresomiticmesoderm(pPSM)8.Scoresareanaverageofthe3 independentreplicates
percondition.d,Heatmapwithscaledexpression(rowz-score)ofneuraltubeknownmarkergenes.Scoresarean
averageof the3 independent replicatesper condition. Boxplot showsdistributionof z-scores (per column) for
differentconditions.Dotsindicateoutliers.e,Boxplotsshowingdistributionofz-scoresforknownmarkergenesof
indicated tissue layers. Endo, Endoderm; IM, IntermediateMesoderm; LPM, Lateral PlateMesoderm;PSM,Pre-
SomiticMesoderm.Boxes indicate interquartile range.Endofwhiskers representminimumandmaximum.Dots
indicateoutliers.Centrallinerepresentthemedian.ListofgenesusedforeachcategoryinSupplementaryTable
1. f,Heatmapof scaledexpression (rowz-score)of somiteepithelialization factors ingastruloids,TLS,TLSCand
TLSCL. Scores are an average of the 3 independent replicates per condition.g, Schematic overview of signalling
factors involved in somitecompartmentalization invivo.M,medial; L, lateral;D,dorsal;V,ventral. h,Heatmap
with scaled expression (row z-score) of signalling factors depicted in g (top panel) and heatmap with scaled
expression of marker genes for different somite compartments (bottom panel). A, anterior; P, posterior; M,
medial; L, lateral;D, dorsal; V, ventral. Scores are an averageof the 3 independent replicates per condition. i,
GeneSetEnrichmentAnalysisenrichmentplotsofselectedsignificantpathways.j,Up-anddownregulatedgenes
involved inembryo&tissuemorphogenesis (relatedtoFig.2e).Dotsizescaleswith log2ofabsoluteexpression.
Reddots, log2FC>2andpadj<10e-15.Greendots, log2FC>2.Upperdotted line,padj=10e
-15; bottomdotted line,
padj(FDR)=0.05. Green label, involved in somitogenesis; orange label, involved in blood vessel development;
yellowlabel,involvedinboth.
.CC-BY-NC-ND 4.0 International license(which was not certified by peer review) is the author/funder. It is made available under aThe copyright holder for this preprintthis version posted March 4, 2020. . https://doi.org/10.1101/2020.03.04.974949doi: bioRxiv preprint

56
ExtendedDataFig.4ExpressionofcelladhesionmoleculesingastruloidsandTLS
a,Heatmapwithscaledexpression(rowz-score)ofcadherins,protocadherins,andephrinsingastruloidsandTLS.
Boxplotsshowdistributionofz-scores(percolumn)fordifferentsamples.Boxesindicateinterquartilerange.End
ofwhiskers representminimumandmaximum.Dots indicate outliers. Central line represent themedian. Every
columnineachheatmaprepresentoneofthethreebiologicalreplicates.b,Heatmapofscaledexpressionofgenes
.CC-BY-NC-ND 4.0 International license(which was not certified by peer review) is the author/funder. It is made available under aThe copyright holder for this preprintthis version posted March 4, 2020. . https://doi.org/10.1101/2020.03.04.974949doi: bioRxiv preprint

57
in a with significantly differential expression (FDR<0.05). c, Bar graph showing expression of integrin ligands
fibronectin (Fn1), lamininalpha-1 (Lama1), lamininalpha-5 (Lama5)andcollagen4a1 (Col4a1) ingastruloidsand
TLS.Bargraphsrepresentaverageof3samples.Errorbarsrepresentstandarddeviation.
.CC-BY-NC-ND 4.0 International license(which was not certified by peer review) is the author/funder. It is made available under aThe copyright holder for this preprintthis version posted March 4, 2020. . https://doi.org/10.1101/2020.03.04.974949doi: bioRxiv preprint
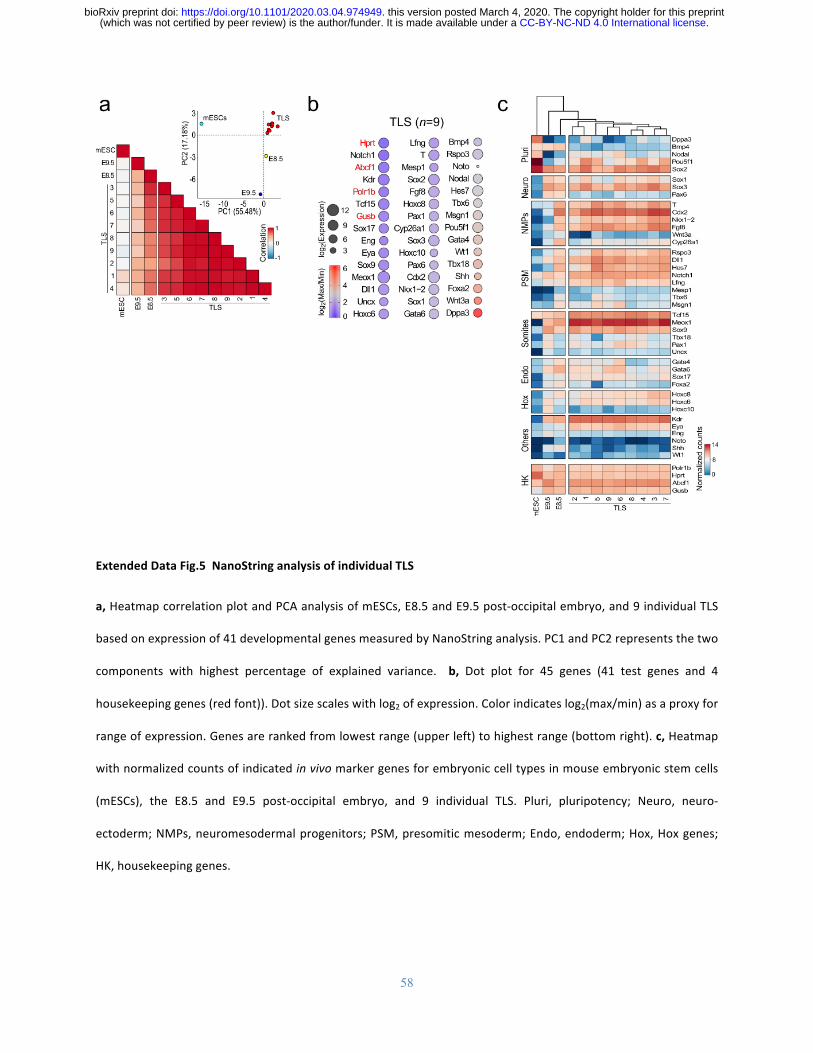
58
ExtendedDataFig.5NanoStringanalysisofindividualTLS
a,HeatmapcorrelationplotandPCAanalysisofmESCs,E8.5andE9.5post-occipitalembryo,and9individualTLS
basedonexpressionof41developmentalgenesmeasuredbyNanoStringanalysis.PC1andPC2representsthetwo
components with highest percentage of explained variance. b, Dot plot for 45 genes (41 test genes and 4
housekeepinggenes(redfont)).Dotsizescaleswithlog2ofexpression.Colorindicateslog2(max/min)asaproxyfor
rangeofexpression.Genesarerankedfromlowestrange(upperleft)tohighestrange(bottomright).c,Heatmap
withnormalizedcountsofindicatedinvivomarkergenesforembryoniccelltypesinmouseembryonicstemcells
(mESCs), the E8.5 and E9.5 post-occipital embryo, and 9 individual TLS. Pluri, pluripotency; Neuro, neuro-
ectoderm;NMPs,neuromesodermalprogenitors;PSM,presomiticmesoderm;Endo,endoderm;Hox,Hoxgenes;
HK,housekeepinggenes.
.CC-BY-NC-ND 4.0 International license(which was not certified by peer review) is the author/funder. It is made available under aThe copyright holder for this preprintthis version posted March 4, 2020. . https://doi.org/10.1101/2020.03.04.974949doi: bioRxiv preprint

59
ExtendedDataFig.6Single-CellRNA-sequencingofTLS
a,Experimentalset-up.CriteriaforfilteringandremovalofdoubletsaredescribedinMethods.b,Heatmapwith
scaled expression of top marker genes of the fourteen identified clusters. c, UMAPs coloured by sampled
timepoints.d,UMAPscolouredbyexpressionofindicatedinvivomarkergenesforneuromesodermalprogenitors
(NMPs).pPSM,posteriorpre-somiticmesoderm;aPSM,anteriorpre-somiticmesoderm;PGCLCs,primordialgerm
celllikecells.
.CC-BY-NC-ND 4.0 International license(which was not certified by peer review) is the author/funder. It is made available under aThe copyright holder for this preprintthis version posted March 4, 2020. . https://doi.org/10.1101/2020.03.04.974949doi: bioRxiv preprint

60
ExtendedDataFig.7RNAVelocityofinvivocelltypemarkergenesinTLS
a,Velocityandexpressionof invivomarkergenesof the somiticandneural trajectoryprojectedon thepooled
(96+108+120hTLS)UMAP.CellsarecolouredfollowingtheclustercoloursinFig.3a.
.CC-BY-NC-ND 4.0 International license(which was not certified by peer review) is the author/funder. It is made available under aThe copyright holder for this preprintthis version posted March 4, 2020. . https://doi.org/10.1101/2020.03.04.974949doi: bioRxiv preprint

61
ExtendedDataFig.8SpatiotemporalprogressionofgeneexpressioninTLS
a,Heatmapwithscaledexpressionofgenesinvolvedinsomitogenesisin4914cellsfrom108hTLSrootedinNMPs
andorderedbypseudotime. aPSM,anteriorPSM,pPSM,posteriorPSM.b,Heatmapwith scaledexpression for
neural lineagemarkergenesofeachclusterthatconferprogenitor identity alongtheDV-axis invivo (leftpanel)
andcolumnplotshowingsubclusterdistributions.D,Dorsal;V,Ventral.c,HeatmapwithscaledexpressionofHox
genesinNMPsandtheirdirectdescendants(NeuralTube1,pPSM),orderedbypseudotimeafterrootingin96h.
.CC-BY-NC-ND 4.0 International license(which was not certified by peer review) is the author/funder. It is made available under aThe copyright holder for this preprintthis version posted March 4, 2020. . https://doi.org/10.1101/2020.03.04.974949doi: bioRxiv preprint

62
ExtendedDataFig.9SomitecompartmentalizationinTLS
a,UMAPrepresentationofreclusteringof96hTLSsomiticcells.b,UMAPcolouredbyexpressionof indicated in
vivomarkergenesforanteriorandposteriorsomitecompartments.c, Invivo, thedorsalsomitecompartment is
markedbyPax3expressionandgivesrisetodermamyotomeandsubsequentlymigratorymuscleprecursorsand
myotome. The ventral somite compartment is marked by Pax1 and gives rise to the sclerotome, which
subsequentlydifferentiatesintochondrocytesandsyndetome.d,UMAPrepresentationofreclusteringof120hTLS
somitic cells. e, UMAP coloured by expression of indicated marker genes for dorsal and ventral somite
compartments. Asterisk refers to Pax1+/Scx+ population. f, Heatmap with scaled expression for top 10 marker
genesofeachcluster.g,UMAPcolouredbyexpressionofinvivosyndetomemarkerScx.NotethattheScxdomain
partially overlaps with a separate cluster of Pax1+ cells (indicatedwith an asterisk in e).h, UMAP coloured by
expressionofposterior(upperpanel)andanterior(bottompanel)markersUncxandTbx18.
.CC-BY-NC-ND 4.0 International license(which was not certified by peer review) is the author/funder. It is made available under aThe copyright holder for this preprintthis version posted March 4, 2020. . https://doi.org/10.1101/2020.03.04.974949doi: bioRxiv preprint

63
ExtendedDataFig.10PrimordialGermCellLikeCells(PGCLCs)inTLS
a,Confocalsectionof108hTLSshowingPGCLCsthatco-expressSox2VEandDPPA3.b,Confocalsectionof120hTLS
stained forFOXA2andSox2VE.NotehowSox2VE-high cells contact theFOXA2+ cells in120hTLS. Scalebars50μm,
25μmformagnifications.
.CC-BY-NC-ND 4.0 International license(which was not certified by peer review) is the author/funder. It is made available under aThe copyright holder for this preprintthis version posted March 4, 2020. . https://doi.org/10.1101/2020.03.04.974949doi: bioRxiv preprint

64
.CC-BY-NC-ND 4.0 International license(which was not certified by peer review) is the author/funder. It is made available under aThe copyright holder for this preprintthis version posted March 4, 2020. . https://doi.org/10.1101/2020.03.04.974949doi: bioRxiv preprint

65
ExtendedDataFig.11ComparisonofTLScell-typeswithpost-occipitalcell-typesofthemouseembryo
a, Heatmap showing correlation of cell types identified in TLS (blue font) and cell types identified in the post-
occipitalE7.5andE8.5embryo(redfont)baseontop20markergenesforinvivoclusters.b,Dotplotsshowingthe
tenmost conserved cell typemarkers for indicated cell types between TLS and the embryo. c, Bar graphwith
percentage of expressed genes (average expression in cluster > 0) that are differentially expressed in TLS as
comparedtotheembryo(min.diff.pct>0.25andlog2FC>1).d,Bargraphwithpercentageoftop20invivocluster
markergenesthataredifferentiallyexpressedinTLSascomparedtotheembryo(min.diff.pct>0.25andlog2FC>
1).
.CC-BY-NC-ND 4.0 International license(which was not certified by peer review) is the author/funder. It is made available under aThe copyright holder for this preprintthis version posted March 4, 2020. . https://doi.org/10.1101/2020.03.04.974949doi: bioRxiv preprint
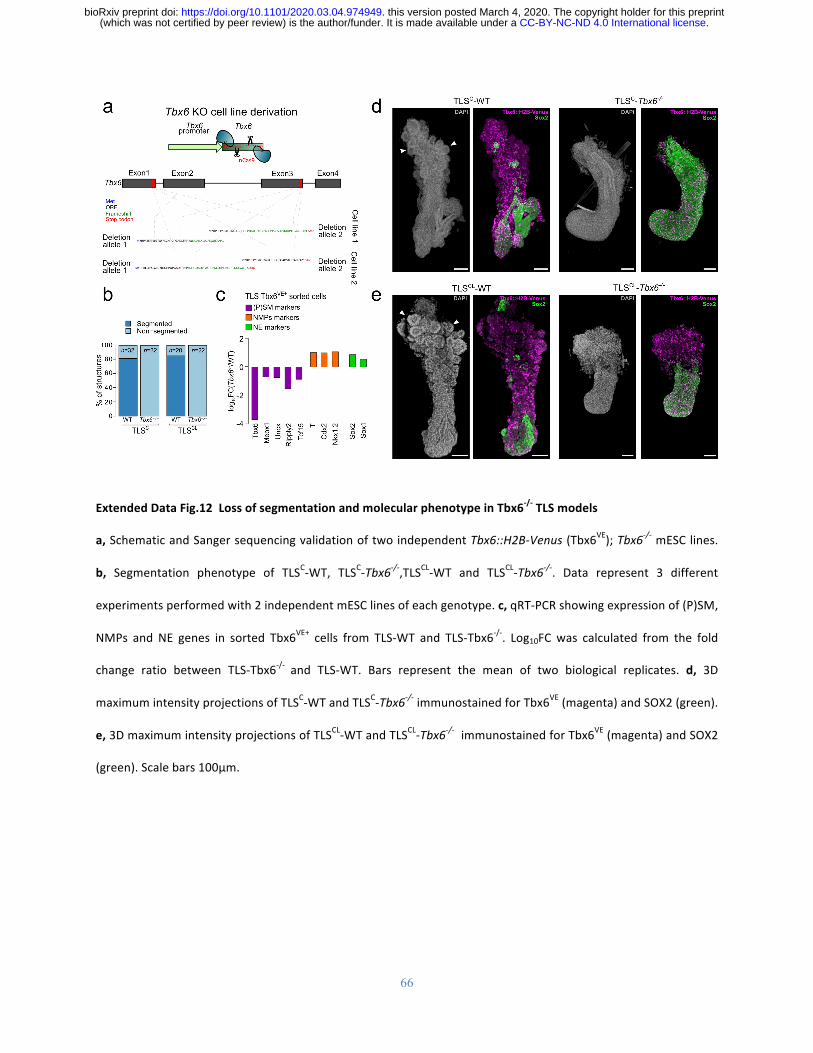
66
ExtendedDataFig.12LossofsegmentationandmolecularphenotypeinTbx6-/-TLSmodels
a,SchematicandSangersequencingvalidationoftwoindependentTbx6::H2B-Venus(Tbx6VE);Tbx6-/-mESClines.
b, Segmentation phenotype of TLSC-WT, TLSC-Tbx6-/-,TLSCL-WT and TLSCL-Tbx6-/-. Data represent 3 different
experimentsperformedwith2independentmESClinesofeachgenotype.c,qRT-PCRshowingexpressionof(P)SM,
NMPs and NE genes in sorted Tbx6VE+ cells from TLS-WT and TLS-Tbx6-/-. Log10FCwas calculated from the fold
change ratio between TLS-Tbx6-/- and TLS-WT. Bars represent the mean of two biological replicates. d, 3D
maximumintensityprojectionsofTLSC-WTandTLSC-Tbx6-/-immunostainedforTbx6VE(magenta)andSOX2(green).
e,3DmaximumintensityprojectionsofTLSCL-WTandTLSCL-Tbx6-/-immunostainedforTbx6VE(magenta)andSOX2
(green).Scalebars100μm.
.CC-BY-NC-ND 4.0 International license(which was not certified by peer review) is the author/funder. It is made available under aThe copyright holder for this preprintthis version posted March 4, 2020. . https://doi.org/10.1101/2020.03.04.974949doi: bioRxiv preprint

67
ExtendedDataFig.13CelltypespecificexpressionofcelladhesionmoleculesinTLS
a,UMAPof108hTLScolouredbyexpressionofindicatedgenes.b,UMAPof120hTLScolouredbyexpressionof
indicatedgenes.
.CC-BY-NC-ND 4.0 International license(which was not certified by peer review) is the author/funder. It is made available under aThe copyright holder for this preprintthis version posted March 4, 2020. . https://doi.org/10.1101/2020.03.04.974949doi: bioRxiv preprint

68
ExtendedDataFig.14SequentialsegmentationinTLSsomites
a,Stills frombrightfield live imaging showing sequential generationof somites along the anterior-posterior axis
withapproximatelyatwohourintervalinTLS.Arrowheadsindicateindividualsomitesthroughouttime.Scalebar
100μm.A,anterior;P,posterior.
.CC-BY-NC-ND 4.0 International license(which was not certified by peer review) is the author/funder. It is made available under aThe copyright holder for this preprintthis version posted March 4, 2020. . https://doi.org/10.1101/2020.03.04.974949doi: bioRxiv preprint

69
ExtendedDataFig.15Qualitycontrol
a,UMAPof96h,108hand120hTLScolouredbypredictedcellcycle,showingthatcellsdonotclusterbycellcycle.
To thisend, first foreachgene the cell cyclewasestimatedand subsequently this sourceofheterogeneitywas
regressedoutsothatthescaleddatacouldbeusedforUMAPcalculationwithoutacellcyclebias.b,Statisticsfor
eachoftheclusterbeforecorrectionfornumberofUMIs,genesandmitochondrialfraction.Cluster10isaclear
outlier showingastrongbias towardsanextremelyhighmitochondrial fractionandcluster11wasmarkedbya
highpercentageofcellswithanunusualnumberofUMIsandgenessuchthatafterremovalofthesecells,onlya
smallfractionofcellswasleft.Both,cluster10and11,wereexcludedfromfurtheranalysis.c,Tabledisplayingthe
averagenumberofUMIsandgenesdetectedforallcellsseparatedbycluster.TheaveragenumberofUMIsand
genesishomogeneousbetweenclustersanddoesnotshowanyoutliers.d,UMAPofinvivocellsfromSomiteand
PSMcell states.UMAPcolouredby initialcell state (left)comparedtomorestringentclusterassignment (right).
Thestringentclusterassignmentresults infoursub-clusters,thatsplitPSMintotwoequallysizedclusters,while
the Somites split into one larger cluster and a second group of cells that are located at the transition of the
previouslyidentifiedSomitesandPSMcluster.e,Heatmapofnormalizedexpressionofmarkergenesforthenewly
assignedfourclusterscomingfrominvivoPSMandSomitecells.ThetwoPSMclusterbothshowstrongexpression
.CC-BY-NC-ND 4.0 International license(which was not certified by peer review) is the author/funder. It is made available under aThe copyright holder for this preprintthis version posted March 4, 2020. . https://doi.org/10.1101/2020.03.04.974949doi: bioRxiv preprint

70
ofthesamesubsetofmarkergenes,however,thenewsmallsubsettransitioningSomitecellshasaclearanterior
PSM(aPSM)signature.f,CorrelationanalysisofbulkRNA-seq,showingveryhighcorrelationbetweenreplicatesof
thesametreatment.Onlygenescoveredbyallsamplesandexpressedinatleastonesamplewereconsidered(n=
29,963)andthepairwisePearsoncorrelationcoefficientwascalculatedonthelog2(TPM+1)values.
.CC-BY-NC-ND 4.0 International license(which was not certified by peer review) is the author/funder. It is made available under aThe copyright holder for this preprintthis version posted March 4, 2020. . https://doi.org/10.1101/2020.03.04.974949doi: bioRxiv preprint

71
SupplementaryVideo1.Wide-fieldliveimagingofTLSfrom96-120hshowingelongation,somitesegmentation,andneuraltubeformation.
SupplementaryTable1.
ListsofgenesusedtogenerateboxplotsfromFigure2bandExtendedDataFig.3e
SupplementaryTable2.
SignificantlyenrichedprocessesinTLSversusGastruloidsasrevealedbyGeneSetEnrichmentAnalysis
SupplementaryTable3.
Overviewofbuffers,culturemedia,kits,andantibodiesusedinthisstudy
SupplementaryTable4.
Sequencesofoligo’sandinsituhybridizationprobesusedinthisstudySupplementaryTable5.RawCtvaluesfromquantitativePCRanalysis
SupplementaryTable6.
DetailsofNanostringprobesusedinthisstudy
SupplementaryTable7.
Nanostringnormalizedgenecounts
SupplementaryTable8.
MarkergenesforTLSclusters(single-cellRNA-Seq)&Markergenesforembryoclusters(single-cellRNA-Seq)
SupplementaryTable9.
Top25conservedclustermarkergenesbetweenTLSandembryo&GenesdifferentiallyexpressedbetweenTLScelltypesandtheircorrespondinginvivocelltype
SupplementaryTable10.
ExpressionvaluesinTPM(TranscriptsPerMillion)forallgenes(bulkRNA-Seq)
.CC-BY-NC-ND 4.0 International license(which was not certified by peer review) is the author/funder. It is made available under aThe copyright holder for this preprintthis version posted March 4, 2020. . https://doi.org/10.1101/2020.03.04.974949doi: bioRxiv preprint

72
.CC-BY-NC-ND 4.0 International license(which was not certified by peer review) is the author/funder. It is made available under aThe copyright holder for this preprintthis version posted March 4, 2020. . https://doi.org/10.1101/2020.03.04.974949doi: bioRxiv preprint