hydrothermal evolution of two stages of gold ...€¦ · neumayr under the auspices of the...
TRANSCRIPT

Hydrothermal Evolution of Two Stages of Gold Mineralization at the Orogenic New Celebration Gold
Deposit, and Implications for Gold Mineralization within the Kalgoorlie-Kambalda Corridor, Eastern Goldfields
Province, Western Australia
Joanna L Hodge BSc., MSc. (Hons)
University of Auckland, New Zealand
This thesis is presented for the degree of Doctor of Philosophy
of the University of Western Australia
2010
Centre for Exploration Targeting School of Earth and Environment
Supervised by:
Professor Steffen G. Hagemann Professor T. Campbell McCuaig


ACKNOWLEDGEMENTS
3
ACKNOWLEDGEMENTS The idea for this research project was conceived by Steffen Hagemann and Peter
Neumayr under the auspices of the Predictive Mineral Discovery Cooperative Research
Centre (pmd*CRC). When I abandoned my lucrative career to take up this project I had
no idea of the wild ride that was ahead of me. There have been ups and downs, as
always in life, but I don’t regret a single moment of it, and I thank Steffen particularly,
for providing me with the opportunity to have had this experience. Thanks also to Cam
McCuaig who started off as an industry advisor and graduated to co-supervisor.
The pmd*CRC was a wonderful organization to be involved in as a graduate
student, and provided many opportunities for stimulating discussions with researchers
and industry participants from Australia and around the world. I would particularly like
to recognize their financial contributions, both as a provider of research funds, and also
the added support of a supplementary scholarship, which provided funding for interstate
and overseas travel in the pursuit of professional and personal advancement. Thanks
particularly to Helen Clark and Beverley Allen for facilitating this. I would also like to
thank the Education and Training Committee, for investing so much back into the
students, particularly Lucy Chapman, who started out as a colleague and rapidly became
a friend, and Bruce Goleby.
There are a number of people who came to the party with analytical facilities
and words of wisdom for those of us who strayed into geochemistry accidently – Dave
Banks at the University of Leeds, Sarah Gilbert at the University of Tasmania, and
particularly Keith Harris and Garry Davidson for assistance with sulfur isotope analyses
and for always providing a barbie and a beer in Hobart.
On a more personal level, thanks to all my office mates over the last years who
made day-to-day thesis writing a lot more bearable – you have all come and gone and I

ACKNOWLEDGEMENTS
4
am still here…. Thanks to Tansy for coming to Perth and convincing me to move to
Vancouver, and a big hi to all my friends in Vancouver who still keep inviting me out –
even though I turn you down every time – no excuses now! My family have always
believed in my ability to do whatever I turned my hand to, even when some of the
decisions (like this one), caused them to look a little sideways and without their support
I doubt that the last seven and a half years would have seemed achievable. Finally
though, this is for my husband Art, who gave me the motivation and means to submit,
and the incentive to finally be done and move on with our life together.
December 19th, 2010

TABLE OF CONTENTS
5
ACKNOWLEDGEMENTS .................................................................................. 3
ABSTRACT ........................................................................................................ 9
1 CHAPTER ONE: INTRODUCTION ........................................................... 12
1.1 Archean Orogenic Lode Gold Deposits ........................................................... 12 1.1.1 Global Distribution ..................................................................................... 12 1.1.2 Deposit Genesis ........................................................................................... 12 1.1.3 Outstanding Questions ................................................................................ 13
1.2 Thesis Objectives ............................................................................................... 14 1.3 Study Area ......................................................................................................... 15 1.4 Previous Work ................................................................................................... 17
1.4.1 Exploration and Production History............................................................ 17 1.4.2 Research ...................................................................................................... 17
1.5 Research Methods ............................................................................................. 18 1.5.1 Fluid Inclusions ........................................................................................... 18 1.5.2 Sulfur Isotopes ............................................................................................ 19 1.5.3 Mineral Chemistry ...................................................................................... 20
1.6 Thesis Organization .......................................................................................... 20
2 CHAPTER TWO: GEOLOGY OF THE KALGOORLIE TERRANE ........... 23
2.1 Stratigraphy ....................................................................................................... 23 2.2 Deformation ....................................................................................................... 25
2.3 The Boulder-Lefroy Fault Zone ....................................................................... 25 2.4 Distribution and Timing of Gold Mineralization ........................................... 28
3 CHAPTER THREE: GEOLOGY OF THE NEW CELEBRATION GOLD DEPOSIT .......................................................................................................... 30
3.1 Mine Stratigraphy ............................................................................................. 30 3.2 Mine Deformation Events and Regional Correlation .................................... 32 3.3 Gold Mineralization and Hydrothermal Alteration ...................................... 33
3.3.1 Pre-gold and Regional Alteration................................................................ 36 3.3.2 Stage I Gold Mineralization and Related Alteration ................................... 37
3.3.3 Stage II Gold Mineralization and Related Alteration ................................. 37 3.3.4 Post Gold Alteration .................................................................................... 39
3.4 Vein Paragenesis and Petrography ................................................................. 42 3.4.1 Vein Types .................................................................................................. 42 3.4.2 Vein Mineralogy and Textures.................................................................... 42
3.5 Summary ............................................................................................................ 44
4 CHAPTER FOUR: INTEGRATED FLUID STUDY .................................... 46
4.1 Sample Selection, Preparation and Analytical Procedures ........................... 46 4.1.1 Sample Selection and Preparation ............................................................... 46 4.1.2 Microthermometry Procedures ................................................................... 47 4.1.3 Laser Raman Procedures ............................................................................. 48
4.1.4 In Situ Fluid Inclusion Laser Ablation-ICP-MS Procedures ...................... 48
4.2 Fluid Inclusion Petrography ............................................................................ 49 4.2.1 Fluid Inclusion Classifications and Assemblages ....................................... 49
4.2.2 Fluid Inclusion Types .................................................................................. 50
4.3 Relative Timing Constraints ............................................................................ 53 4.4 Microthermometry and Laser Raman Results .............................................. 54
TABLE OF CONTENTS
6
4.4.1 Type 1 CH4 Inclusions ................................................................................ 54
4.4.2 Type 2 H2O-CO2 Inclusions ........................................................................ 54 4.4.3 Type III CO2-Rich Inclusions ..................................................................... 60 4.4.4 Type IV H2O-Rich Inclusions ..................................................................... 60 4.4.5 Interpretation of Laser Raman and Microthermometry Results ................. 61 4.4.5.1 Evidence for Fluid Immiscibility ............................................................ 61 4.4.5.2 Trapping Conditions ............................................................................... 63 4.4.5.3 Fluid Mixing ........................................................................................... 67
4.5 LA-ICP-MS Results .......................................................................................... 69 4.5.1 Gold ............................................................................................................. 70 4.5.2 Interpretation of In Situ Laser Ablation ICP-MS Results ........................... 73 4.5.2.1 Potential Fluid Sources ........................................................................... 73
4.6 Comparisons with Other Hydrothermal Systems .......................................... 73
5 CHAPTER FIVE: SULFUR ISOTOPIC COMPOSITION AND MINERAL CHEMISTRY OF SULFIDES, OXIDES AND GOLD ......................................... 78
5.1 Sulfur Isotopic Composition of Pyrite ............................................................. 78 5.1.1 Sample Selection and Analytical Procedure ............................................... 78 5.1.2 Results ......................................................................................................... 79 5.1.3 Interpretation of Results .............................................................................. 83 5.1.3.1 Sulfur Sources ......................................................................................... 83 5.1.3.2 Ore Forming Processes and their Influence on the Sulfur Isotopic Composition of Pyrite ............................................................................................. 84
5.1.4 Summary ..................................................................................................... 87 5.1.5 Comparisons with other Hydrothermal Mineral Systems ........................... 88 5.1.5.1 Orogenic Lode Gold Deposits ................................................................. 88 5.1.5.1.1 Eastern Goldfields Province ................................................................ 89 5.1.5.1.2 Global Examples ................................................................................. 90 5.1.5.2 Other Gold Mineral Systems ................................................................... 91
5.2 Sulfide, Oxide and Gold Mineral Chemistry .................................................. 92 5.2.1 Sample Selection, Preparation and Analytical Procedure ........................... 92 5.2.2 Results ......................................................................................................... 93 5.2.2.1 Pyrite ....................................................................................................... 93 5.2.2.2 Fe-oxides ................................................................................................. 94
5.2.2.3 Gold ......................................................................................................... 95 5.2.3 Interpretation of Mineral Chemistry ........................................................... 96 5.2.3.1 Tellurium ................................................................................................. 96
5.2.3.2 Ore Forming Processes and Mineral Chemistry ..................................... 98 5.2.4 Comparisons with other Hydrothermal Gold Mineral Systems .................. 99
6 CHAPTER SIX: HYDROTHERMAL FLUID MODEL FOR THE NEW CELEBRATION SYSTEM .............................................................................. 101
6.1 Ore Forming Processes ................................................................................... 101 6.1.1 Wall Rock Reaction .................................................................................. 101 6.1.2 Phase Immiscibility ................................................................................... 102
6.1.3 Fluid Mixing ............................................................................................. 103
6.2 Constraints on Fluid and Metal Sources ....................................................... 104 6.3 Integrated Model for the Evolution of the New Celebration Gold Mineral System within the BLFZ ......................................................................................... 108
6.3.1 Early Evolution (D1-D2)........................................................................... 108 6.3.2 Early D3NC ................................................................................................ 109

TABLE OF CONTENTS
7
6.3.3 Stage I Gold Mineralization (D3NC) .......................................................... 110
6.3.4 Stage II Gold Mineralization (Late D3NC-Early D4NC) ............................. 111 6.3.5 Post-gold evolution (>D4) ........................................................................ 111
6.4 Comparisons with other Orogenic Lode Gold Systems ............................... 112 6.4.1 Host Rocks and their Role in Gold Precipitation ...................................... 112 6.4.2 Methane-rich and Highly Saline Aqueous Fluids ..................................... 113 6.4.3 Cation Ratios and Metal Concentrations in Hydrothermal Fluids ............ 118 6.4.4 Sulfur Isotopes .......................................................................................... 121 6.4.5 Structural Setting ....................................................................................... 123
6.5 Key factors in the Location of the New Celebration Deposit ...................... 123 6.6 Outstanding Questions ................................................................................... 125
6.6.1 Fluid and Metal Source ............................................................................. 125
6.6.2 Timing of mineralization........................................................................... 126
6.7 Summary .......................................................................................................... 127
7 CHAPTER SEVEN: PROTRACTED GOLD MINERALIZATION IN THE KALGOORLIE-KAMBALDA CORRIDOR AND ITS RELATIONSHIP TO THE BOULDER-LEFROY FAULT ZONE, EASTERN GOLDFIELDS PROVINCE, WESTERN AUSTRALIA ................................................................................ 128
ABSTRACT ............................................................................................................. 128 1. INTRODUCTION ........................................................................................... 129 2. REGIONAL GEOLOGY ............................................................................... 131
2.1 The Boulder-Lefroy Fault Zone ................................................................ 135
3. HISTORY OF GOLD MINERALIZATION IN THE KALGOORLIE-KAMBALDA CORRIDOR .................................................................................... 135 4. GEOLOGY OF THE MAJOR GOLD CAMPS IN THE KALGOORLIE-KAMBALDA CORRIDOR .................................................................................... 137
4.1 Deposit Geology ........................................................................................ 137 4.2 Deformation and Timing of Gold Mineralization in the Kalgoorlie-Kambalda Corridor ............................................................................................... 141 4.3 Hydrothermal Alteration Mineralogy Spatially and/or Temporally Related to Gold Mineralization .......................................................................................... 143 4.4 Hydrothermal Fluid Chemistry Associated with Gold Mineral Systems in the Kalgoorlie-Kambalda Corridor ...................................................................... 145 4.5 Carbon, Oxygen and Hydrogen Stable Isotopes ....................................... 149 4.6 Sulfur Isotopic Composition and Comparison with Previous Studies ...... 150
4.7 Mineral Chemistry of Sulfides, Oxides and Gold Associated with Gold Mineral Systems in the Kalgoorlie-Kambalda Corridor ...................................... 155
5. EVOLUTION OF THE BOULDER-LEFROY FAULT ZONE AND ITS POTENTIAL ROLE IN THE LOCATION OF GOLD MINERALIZATION IN THE KALGOORLIE-KAMBALDA CORRIDOR ............................................. 160
5.1 D1- early D2 (>2675 – 2670) ................................................................... 160 5.2 Late D2 (2670 – 2660) .............................................................................. 164 5.3 D3 (2660-2647 Ma) -D4 (<2640 Ma) Deformation ................................. 165
5.4 Post-D4 ..................................................................................................... 168
6. DISCUSSION .................................................................................................. 177 6.1 Geochemistry............................................................................................. 177 6.2 Timing ....................................................................................................... 178
7. CONCLUSIONS ............................................................................................. 181 ACKNOWLEDGEMENTS.................................................................................... 183
TABLE OF CONTENTS
8
8 CHAPTER EIGHT: CONCLUSIONS ....................................................... 184
8.1 New Celebration Hydrothermal Fluid System ............................................. 184 8.1.1 Gold Mineralization .................................................................................. 185 8.1.2 Hydrothermal Evolution............................................................................ 187
8.2 Regional Hydrothermal Fluid System ........................................................... 188 8.3 Exploration Implications ................................................................................ 190 8.4 Future Work .................................................................................................... 190
REFERENCES ............................................................................................... 192
APPENDIX 1: “The New Celebration Gold Deposits: P-T-X Fluid Evolution and Two Stages of Gold Mineralization within the Crustal-scale Boulder-Lefroy Shear Zone, Yilgarn Craton, Western Australia” ............................ 215
APPENDIX 2 Sample Data ............................................................................ 272
APPENDIX 3 Petrographic Descriptions ..................................................... 275
APPENDIX 4 Fluid Inclusion Microthermometry ........................................ 302
APPENDIX 5 Laser Raman Analyses .......................................................... 307
APPENDIX 6 LA-ICP-MS Fluid Inclusion Analyses .................................... 309
APPENDIX 7 Sulfur Isotopic Analyses ........................................................ 320
APPENDIX 8 LA-ICP-MS Mineral Chemistry ............................................... 325
APPENDIX 9 Whole-Rock Geochemistry – Methodology And Results ... 382
ABSTRACT
9
ABSTRACT The Archean orogenic New Celebration gold deposit, located in the Kalgoorlie
Terrane of the Eastern Goldfields Province, Western Australia, is hosted within the
western segment of the first-order Boulder Lefroy fault zone (BLFZ). This setting
contrasts with the majority of orogenic lode gold deposits worldwide, which are
typically located in higher order splays, and as such, the New Celebration deposit
provides a unique opportunity to study the hydrothermal, structural, alteration and fluid
characteristics of a first-order crustal scale shear zone. Fluid inclusion, sulfur isotope
and mineral chemistry were used to reconstruct the evolution of hydrothermal fluids
within the BLFZ. Vein petrography, fluid inclusion microthermometry and laser
ablation-inductively coupled plasma-mass spectrometry microanalysis (LA-ICP-MS) of
single fluid inclusions, in addition to laser ablation sulfide sulfur isotope analyses and
LA-ICP-MS mineral chemistry were combined to determine the pressure-temperature-
composition evolution of the New Celebration gold deposit.
At New Celebration, gold mineralization took place in two stages: Stage I,
which is related to ductile, sinistral oblique slip fault movement and Stage II, which is
related to brittle-ductile and brittle strike-slip fault movement. Type 2 quartz and quartz-
calcite shear and extension veins concomitant with Stage I gold mineralization contain
pseudo-secondary 2- and 3-phase aqueous-carbonic (10 ± 1 to 33 ± 13 mole % CO2)
inclusions with salinities between 2 and 8 equiv. wt. percent NaCl, which were trapped
between 330° and 390° C and 3.2 and 4.0 kbars. Mixed aqueous-carbonic inclusions (16
± 3to 53 ± 28 mole % CO2) and aqueous>>carbonic fluid (<3 mole % CO2) inclusions
with variable phase ratios and salinities of 1.9 ± 1.1to 8.7 ± 2.6 equiv. wt. percent NaCl
in type 3 quartz-pyrite±sericite±calcite veins and quartz-calcite alteration associated
with Stage II gold mineralization were trapped between 280° and 320° C and 0.8 to 3.2
kbars. Coexisting liquid- and vapor-rich inclusions within the same trail or cluster
indicate these inclusions were trapped during phase separation. Secondary high-salinity
(18.4 to 23.3 equiv. wt. % NaCl) aqueous inclusions, and metane inclusion, which post-
dated gold mineralization, were trapped in type 2 and type 3 veins between 100° C and
180° C and pressures below 1 kbar.
Single inclusion laser ablation inductively coupled plasma mass spectrometry
analyses on aqueous and aqueous-carbonic inclusions indicate that the Stage I gold
related fluids were characteristically Na>Ca>K> Mg (K/Ca <1) whereas Stage II fluids

ABSTRACT
10
are Na>Mg>K>>Ca (K/Ca >1) and contained higher concentrations of, Pb, Zn, As, and
W than Stage I fluids. Average Au concentrations from both Stage I and Stage II-related
aqueous-carbonic inclusions returned values around 5 parts per million (ppm) although
individual inclusions contained up to 51 ppm. Variations in metal ratios and elemental
concentrations, in addition to K/Ca ratios potentially indicate different fluid sources for
each mineralizing event and suggest that a switch occurred in fluid and/or metal sources
between Stage I and Stage II.
Laser ablation inductively coupled plasma mass spectrometry analyses indicate
that New Celebration ore stage pyrites ubiquitously contain Ni and Co. Additionally,
Stage II pyrites contain Ti, W, Pb, Zn and Cr. Pyrites from both mineralization stages
contain trace Au-Ag±Pb tellurides. Gold grains from both Stages I and II contain trace
Te. Sulfur δ34S isotope values in ore-stage pyrite range between -7.6 per mil and +3.8
per mil in Stage I mineralization, and between -10.6 per mil and -3.2 per mil in Stage II
mineralization. These values are predominantly within the documented range for
orogenic lode gold deposits worldwide, although the negative values are amongst the
most negative values reported. The isotopic composition of the Stage I ore stage pyrites
likely reflect the redox state of the ore-forming fluids, whereas the negative values of
Stage II ore-related pyrite and the spread of observed values are attributed to fluid
oxidation during phase separation.
Pressure-temperature estimates describe an anticlockwise path and indicate that
Stage I gold mineralization occurred at temperatures and pressures similar to peak
regional metamorphism, whereas Stage II gold formed at lower temperatures and
fluctuating pressures, likely during a period of uplift, erosion and fault movement.
Replacement of magnetite by pyrite indicates that sulfidation reactions with Fe-oxides
were the main cause of gold mineralization in both mineralizing stages and the sole
cause of gold mineralization during Stage I. Fluid inclusion evidence suggests that
phase separation contributed to Stage II gold formation. The variety of fluids recorded
within the BLFZ and their diverse formation conditions suggest that the BLFZ was the
main conduit for gold-related and unrelated fluids at New Celebration over a protracted
period. Furthermore, it appears that during the evolution of the BLFZ it tapped at least
two geochemically distinct crustal fluid reservoirs, which led to the development of two
gold mineralization stages at New Celebration with differing geochemical
characteristics.

ABSTRACT
11
Regional models propose that a number of large gold camps, including the
Golden Mile to the north of New Celebration and St Ives to the south, are spatially,
temporally and genetically related to each other and the BLFZ. Integration of the data
collected during this study on New Celebration, with new geochemical data on ore-
stage sulfides from the Golden Mile and St Ives deposits and data collected over the last
100 years from these three gold camps indicate that at the Golden Mile, Fimiston and
Oroya lodes are unrelated to either the BLFZ or to other gold mineralization events in
the Kalgoorlie-Kambalda corridor. Their unique pyrite (As, Te, Sb-rich) composition,
association with abundant telluride mineralization, and V-rich roscoelite alteration, not
observed elsewhere in the corridor, suggests a link to alkalic magmatism and formation
at temperatures below 300° C at crustal depths less than 6 km. Similarities in sulfide
geochemistry between the St Ives and New Celebration deposits, in conjunction with
hydrothermal fluid and structural characteristics identified by other researchers, suggest
that gold mineralizing events at New Celebration and St Ives are genetically related.
Furthermore, structural relationships between both these camps and the BLFZ indicate
that mineralization at both is related to the formation and evolution of the BLFZ. Recent
work on the Golden Mile proposes that gold mineralization took place during D1-D2
deformation, i.e. earlier than the commonly proposed D3 event, and structural
interpretations of the BLFZ indicate that the fault system was not developed at that
time. Results of this study, interpreted with recently published conclusions on the
timing of gold mineralization at the Golden Mile, indicate that gold formation was
unrelated either to the BLFZ or to mineralization at New Celebration or St Ives.

CHAPTER ONE: INTRODUCTION
12
1 CHAPTER ONE: INTRODUCTION
1.1 Archean Orogenic Lode Gold Deposits
1.1.1 Global Distribution
Orogenic lode gold deposits are common to Archean granitoid-greenstone belts
world wide, and are amongst the largest gold deposits found anywhere on Earth, with
world class examples containing in excess of 100 tonnes of gold (Groves and Foster,
1993; Robert and Poulsen, 1997). Most Archean cratons host these types of deposits,
which collectively contribute approximately one fifth of the world’s total gold
production (Roberts, 1988). Some of the world’s largest gold deposits are Archean
orogenic lode gold deposits, including the Golden Mile (Western Australia), Hollinger-
McIntyre (Canada) and Kolar (India). Western Australia has produced over 5000 tonnes
of gold since the early 1890’s (data to December 2001, Department of Minerals and
Energy), almost all of which has been from Archean orogenic lode gold deposits, with
the world class Golden Mile in Kalgoorlie (>1,400t, Hagemann and Cassidy, 2000)
contributing over 30% of the state’s total production.
1.1.2 Deposit Genesis
Archean orogenic lode gold deposits comprise a group of genetically, temporally
and spatially related gold-only deposits commonly associated with metamorphic
terranes (Groves et al., 1998). They formed along convergent margins during terrane
accretion, translation or collision related to subduction or lithospheric delamination, and
traditional genetic models place them late in the deformational-metamorphic-magmatic
history of evolving volcano-plutonic terranes (Groves et al., 2000; Hagemann and
Cassidy, 2000). Gold mineralization has typically been inferred to take place late in the
deformation history of the orogen, usually synchronous with, or just post-dating, peak
metamorphism (Colvine et al., 1988; Clark et al., 1989; Groves et al., 1989; Hodgson,
1993; Kerrich and Cassidy, 1994; McCuaig and Kerrich, 1998; Ridley and Mengler,
2000) although recent models for some Yilgarn deposits, e.g. Golden Mile (Bateman et
al., 2001; Bateman and Hagemann, 2004) and Jundee (Yeats et al., 2001; Baggott et al.,
in press), propose an earlier timing for gold mineralization. Any rock type may host
gold mineralization (Hodgson, 1993), although in the Yilgarn and Pilbara cratons of
Western Australia iron-rich mafic and ultramafic lithologies are the dominant hosts
(Groves, 1990). Gold deposits are predominantly restricted to rocks metamorphosed to

CHAPTER ONE: INTRODUCTION
13
greenschist facies (Goldfarb et al., 2005). Deposits are structurally controlled, with
faults, shear zones, folds and competency contrasts between different rock types
important at both regional, camp and deposit scales (Eisenlohr et al., 1989; Groves et
al., 1990), and some of the most gold-rich camps show a common association with fold
hinges and anticlinal structures (Goldfarb et al., 2005). Gold mineralization may be
vein- or wall rock- hosted (Groves, 1990; Hagemann and Cassidy, 2000; Eilu and
Groves, 2001). Deposits display characteristic chlorite-calcite±biotite (<500 °C) and
amphibole-biotite-calcite±epidote (500-700 °C) alteration assemblages (Mueller and
Groves, 1991) and typically formed from low to moderate salinity aqueous-carbonic
fluids (Mikucki and Groves, 1990; Ridley and Diamond, 2000), which transport gold
(but not other metals) as a bisulfide complex (Seward, 1973, 1984; Benning and
Seward, 1996). Local variations generally reflect formation at varying crustal levels
(Groves, 1993; Gebre-Mariam et al., 1995), differences in host rock type, metamorphic
grade, and P-T conditions of formation (Colvine, 1989; Hagemann and Cassidy, 2000;
Eilu and Groves, 2001) and multiple depositional events over protracted time periods
(Robert and Poulsen, 1997; Groves et al., 2003).
Orogenic lode gold deposits as defined by Groves et al. (1998) include those
categorized as mesothermal (Nesbitt et al., 1986) and are classified according to ore
associations (gold only), host sequences (greenstone-hosted, slate-belt style, turbidite-
hosted), form (lode, quartz-carbonate vein, disseminated) or specific location (Mother-
lode style). They are additionally classified according to their inferred formation depth
as epizonal (<6km), mesozonal (6-12km) or hypozonal (>12km) (Gebre-Mariam et al.,
1995; Groves et al., 1998).
1.1.3 Outstanding Questions
There has been much research undertaken on Archean orogenic lode gold
deposits in the last thirty years, however, a number of questions regarding their genesis
remain outstanding. It is particularly noteworthy that despite almost 30 years of research
into orogenic lode gold deposits, the problem of fluid and/or metal source remains
equivocal. Other significant questions are those regarding the nature, source(s) and
pressure-temperature-composition-timing (P-T-X-t) characteristics of pre- and post-gold
fluids, which constrain the tectonic and fluid evolution of the entire hydrothermal
system, and the role that crustal-scale fault systems, which are spatially associated with
Archean orogenic lode gold systems worldwide, play in mineralization. Some of these
questions have been addressed and partially resolved by recent work, including research

CHAPTER ONE: INTRODUCTION
14
focused on the structure (Robert, 1989; Wilkinson et al., 1999), timing of mineralization
(Robert, 1990; Neumayr et al., 2000), hydrothermal fluid evolution (Neumayr and
Hagemann, 2002) and tectonic evolution (Neumayr et al., 2007) of the Cadillac
Tectonic Zone in the Abitibi greenstone belt.
1.2 Thesis Objectives
Archean orogenic lode-gold deposits worldwide typically show a close spatial
association with first-order, crustal-scale shear zones (Eisenlohr et al., 1989; Neumayr
et al., 2000), such as the Boulder-Lefroy (Western Australia) or the Destor-Porcupine
(Ontario) fault zones. At a camp- to deposit- scale, however, second- and third-order
splays host the majority of world class (>100t Au) orogenic lode gold deposits
(Eisenlohr et al., 1989; Groves, 1990). Much research into the fluid chemistry and P-T-
X-t evolution of hydrothermal fluids in the gold-endowed second- and third-order fault
systems has been undertaken, however, first-order faults have largely been ignored. This
is predominantly because most first-order fault systems are barren and research has
focused on mineralized lower-order faults adjacent to the main trans-crustal faults, but
is also due to the poor exposure of first-order faults. Recent research on first-order
systems has focused on the structure (Robert, 1989; Wilkinson et al., 1999; Neumayr
and Hagemann, 2002), timing of mineralization (Robert, 1990; Neumayr et al., 2000)
and hydrothermal fluid composition (Neumayr and Hagemann, 2002) on the Cadillac
Tectonic Zone in the Abitibi greenstone belt. More recently, researchers under the
auspices of the Predictive Mineral Discovery Cooperative Research Centre (pmd*CRC)
have worked on deposits associated with the Boulder Lefroy Fault Zone in the New
Celebration-Kambalda corridor, including Honours projects at New Celebration, and at
the Junction deposit in Kambalda and an integrated fluid and alteration study at St Ives.
The Boulder-Lefroy fault zone (BLFZ) is an interpreted, first-order crustal-scale
fault zone located in the Eastern Goldfields Province of the Yilgarn craton (Swager,
1989). It is spatially correlated with the Golden Mile (>1400 t Au) and St Ives (>200 t
Au) gold camps, both of which are hosted in adjacent second- and third-order splays.
The BLFZ also hosts the New Celebration gold deposit (>150 t Au). As orogenic gold
deposits hosted in first-order fault systems are rare, the New Celebration gold deposit
provides a unique opportunity to study the P-T-X-t-d evolution of hydrothermal fluids
in such a system, and evaluate the role regional scale structures play in focusing
mineralizing and non-mineralizing fluids.

CHAPTER ONE: INTRODUCTION
15
The aims of this PhD thesis are to: (1) document the fluid evolution in pressure-
temperature-composition (P-T-X) space of the western segment of the Boulder Lefroy
Fault Zone at the New Celebration gold deposit; (2) establish a paleohydrothermal fluid
model for the New Celebration gold deposit; (3) characterize the metal content of
mineralizing and non mineralizing fluids at the New Celebration gold deposit; (4)
evaluate potential fluid source(s) for both the mineralizing and non-mineralizing fluids;
and (5) determine the major and trace element composition of ore-related sulfides,
oxides and gold.; It also aims to (6) establish a regional hydrothermal fluid model for
the Kalgoorlie-Kambalda region, and evaluate potential links between gold mineralizing
events along the extent of the BLFZ through the integration and interpretation of data
available from the literature, unpublished sources and data collected during this research
project.
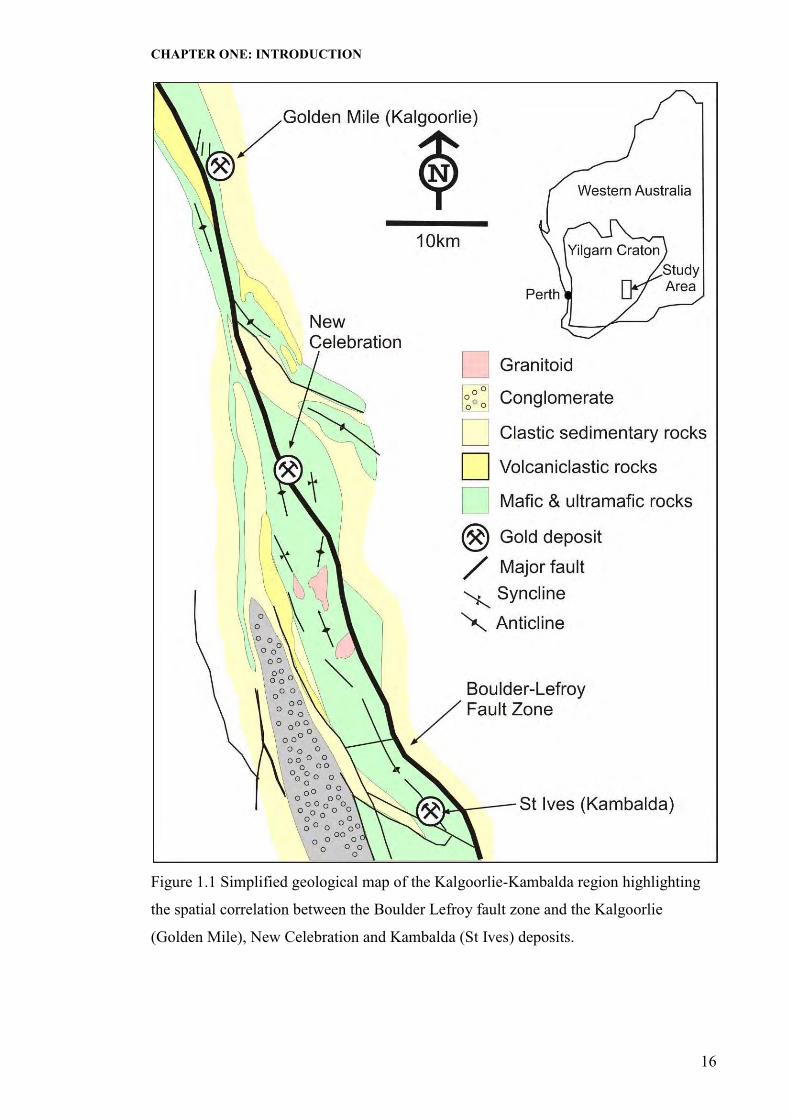
1.3 Study Area
The New Celebration gold deposit is located in the Eastern Goldfields province
of the Yilgarn craton, Western Australia, approximately 30km south of Kalgoorlie
(Figure 1.1). Geographically it is located at Latitude -31.03, Longitude 121.60 on the
Geological Survey of Western Australia Widgiemooltha (SH 51-14) 1:250 000 and
Lake Lefroy (3235) 1:100,000 map sheets. Access to the deposit is via the Kalgoorlie-
Kambalda Highway (94) and mine haul roads. Pit wall failure in the now-closed open
pit restricts access to much of the pit; however, abundant drill core is available.
The Kalgoorlie and Kambalda gold camps are located to the north and south of
New Celebration deposits, along the strike of the BLFZ. Geographically, the Kalgoorlie
deposits are located at Latitude -30.76, Longitude 121.51 on the Kurnalpi (SH51-10)
1:250,000 and Kanowna 3236 (1:100,000 map sheets. The Kambalda deposits are
located at Latitude -31.29, Longitude 121.74 on the Widgiemooltha (SH51-14)
1:250,000 and Lake Lefroy (3235) 1:100,000 map sheets. Samples and unpublished data
from these deposits were obtained from Steffen Hagemann and Louis Gauthier
(Kalgoorlie samples) and Klaus Petersen (Kambalda samples).
CHAPTER ONE: INTRODUCTION
16
Figure 1.1 Simplified geological map of the Kalgoorlie-Kambalda region highlighting
the spatial correlation between the Boulder Lefroy fault zone and the Kalgoorlie
(Golden Mile), New Celebration and Kambalda (St Ives) deposits.

CHAPTER ONE: INTRODUCTION
17
1.4 Previous Work
1.4.1 Exploration and Production History
Gold was first discovered in the New Celebration area in 1890 (Gresham, 1991)
but it was not until 1919 that significant discoveries, such as Celebration, Dawns Hope,
White Hope, Villiers Bretonneux, Jubilee and Triumph, named predominantly to reflect
the post-World War I social climate, were made (Norris, 1990; Copeland, 1998). The
town of Celebration City was established adjacent to the Celebration mine and serviced
a number of mining operations. Mining declined in the mid 1920’s, due to a fixed gold
price, lack of water and manpower shortages (Norris, 1990; Copeland, 1998).
In 1980, Hampton Areas Australia Limited (HAAL) and Newmont Australia Ltd
signed the Location 50 Joint Venture agreement, although HAAL subsequently excised
the Jubilee lease from the joint venture. Soil sampling, RAB and RC drilling delineated
the Hampton-Boulder deposit for the JV partners (Norris, 1990) and the Jubilee deposit
for HAAL (Copeland, 1998). Between 1986 and 1997, the Hampton-Boulder deposit
produced 7.4 million tonnes at 2.34 g/t Au for 557,000 ounces from the open pit and
1.01 million tonnes at 6.38 g/t Au for 207,000 ounces from underground. The Jubilee
pit produced 10.3 million tonnes at 2.09 g/t Au for 694,000 ounces in its ten years of
operation between 1987 and 1997 (Newcrest Mining Limited Internal Report, 2000). In
2001, Harmony Gold Australia Pty Ltd acquired and amalgamated the entire tenement
holdings previously held by separate owners. Dioro Exploration NL took over the
deposits in December 2007.
1.4.2 Research
A number of workers have studied various aspects of the New Celebration gold
deposits. Previous workers have focused on the structural (Dielemans, 2000) and
lithological controls (Williams, 1994) of Southern Ore Zone mineralization within the
Hampton-Boulder segment of the deposit, and on the structural and lithological controls
within the Jubilee segment of the deposit (Williams, 1991). More recently, Nichols
(2003) and Nichols et al. (in revision) evaluated the structural controls, hydrothermal
alteration and timing of mineralization of the entire New Celebration gold system.
Weinberg et al. (2005) established a kinematic history for the Boulder-Lefroy shear
zone and evaluated the controls on associated gold mineralization along its entire
length. Hodkiewicz (2003) studied the sulfur stable isotopic composition of ore-related
sulfides from New Celebration as part of a much larger regional-scale study on the

CHAPTER ONE: INTRODUCTION
18
physical and chemical processes within orogenic lode gold deposits of the Yilgarn
craton. A number of authors have published summaries of various aspects of the New
Celebration deposits, including Norris (1990) who discussed all aspects of the
Hampton-Boulder deposits, Copeland (1998), who summarized the Jubilee deposits,
and Witt (1993a) who included the New Celebration deposits within a wider framework
of deposits between Kalgoorlie and Kambalda.
1.5 Research Methods
New Celebration samples selected for analysis were taken from the Hampton-
Boulder and Jubilee open pits, diamond drill core, and samples collected by Nichols
(2003) and archived in the Edward de Courcy Clarke Museum at the University of
Western Australia. Steffen Hagemann and Louis Gauthier provided Kalgoorlie (Golden
Mile) samples; Klaus Petersen provided Kambalda samples from the St Ives deposits.
Polished thin sections for petrography and double polished thick sections for fluid
inclusion microthermometry, laser Raman and LA-ICP-MS analysis were made at the
University of Western Australia. Single polished thick sections for sulfur isotope
analysis were prepared at the University of Tasmania or by Pontifex Associates
(Adelaide). Polished block mounts for LA-ICP-MS mineral chemistry were prepared at
the University of Tasmania. Acme Analytical Laboratories Ltd in Vancouver, Canada,
crushed and analyzed New Celebration samples for whole rock major and trace element
geochemistry. The author completed transmitted and reflected light petrography, and
fluid inclusion microthermometry at the University of Western Australia, Laser Raman
analyses at Geoscience Australia in Canberra, sulfur isotope analyses and LA-ICP-MS
(laser ablation inductively coupled plasma mass spectroscopy) mineral chemistry
analyses at the University of Tasmania and single fluid inclusion LA-ICP-MS analyses
at the University of Leeds. This study builds on the excellent mapping and structural
work completed by Nichols (2003) and Nichols et al. (submitted) as part of a BSc.
(Hons) project completed at the University of Western Australia.
1.5.1 Fluid Inclusions
Fluid inclusions provide the only direct evidence of the fluids ascending through
the Earth’s crust and impart valuable information on the composition of ore forming
(and other) fluids, in addition to constraining formation temperatures and pressures.
Detailed petrography on well-constrained samples, in conjunction with good

CHAPTER ONE: INTRODUCTION
19
documentation of mineral and fluid paragenesis is therefore critical when interpreting
the data.
The New Celebration samples selected for analysis in this study were chosen to
reflect the different host rocks, deformation events and mineralization events and styles
established within the deposit (Nichols, 2003). Quartz±calcite veins from these samples
were categorized according to their mode of occurrence, mineral composition and
petrographic features, and correlated to the local deformation sequence established by
Nichols (2003). Fluid inclusions from these vein samples were examined
petrographically to identify different inclusion populations and types, reflecting pre-,
syn and post-mineralization fluids, whose evaluation is critical to establishing the
hydrothermal and tectonic history of the fault. Fluid inclusion data from the Golden
Mile and Kambalda deposits were obtained from the literature (Scantlebury, 1983;
Phillips, 1986; Ho, 1987; Clark et al., 1989; Clout, 1989; Ho et al., 1990; Mernagh,
1996; Neumayr et al., 2004; Petersen et al., 2005) or unpublished data (Petersen et al.,
submitted; K. Petersen, pers. comm. 2007)
1.5.2 Sulfur Isotopes
Gold in orogenic lode gold deposits typically precipitates in equilibrium with
sulfide minerals and is transported in the hydrothermal fluid as a bisulfide complex
(Seward, 1973; Mikucki, 1998). Sulfide sulfur isotopic composition is determined by
the source fluid composition and by physicochemical parameters at the depositional site,
such as pH, temperature and pressure (Ohmoto and Rye, 1979). Sulfur isotopes,
therefore, provide vital evidence about the oxidation state of ore fluid, which has
implications for gold solubility and the ability of the fluid to transport and precipitate
gold, and may provide evidence for fluid source or ore depositional processes.
The New Celebration samples were chosen to reflect the two gold mineralizing
events and four gold mineralizing styles observed within the deposit. Thirty-seven
Golden Mile samples were selected to represent syn-volcanic sulfides, different
mineralization styles (Fimiston and Oroya), different lode systems (East, West and
Aberdare), different chronological events within a single lode system (Fimiston Stages
I-IV), and shallow vs. deep gold mineralization (Hagemann et al., 1999). The Kambalda
samples represent different hydrothermal alteration fluid systems from within the
Conqueror and Revenge deposits at St Ives. The results of this study are compared with
existing data on sulfides from the Golden Mile (Lambert et al., 1984; Clout, 1989;

CHAPTER ONE: INTRODUCTION
20
Hagemann et al., 1999; Bateman et al., 2001; Bateman and Hagemann, 2004), New
Celebration (Hodkiewicz, 2003; Hodkiewicz et al., 2009; Hodge et al., in revision) and
St Ives (Palin and Xu, 2000; Hodkiewicz, 2003; Walshe et al., 2006) .
1.5.3 Mineral Chemistry
Sulfide, oxide and gold mineral chemistry can potentially be a sensitive indicator
of the ore fluid oxidation state, and provide valuable information on the ore fluid
chemistry. Pyrite, pyrrhotite, magnetite, ilmenite and gold from New Celebration,
Golden Mile and St Ives deposits were analyzed by LA-ICP-MS (laser ablation
inductively coupled mass spectrometry) to evaluate potential links between mineralizing
and hydrothermal alteration events at all three camps, and in the case of New
Celebration, to determine similarities between fluid chemistry (as determined by LA-
ICP-MS of individual fluid inclusions) and ore-bearing pyrite and gold grains.
1.6 Thesis Organization
This thesis was originally planned to be submitted as a series of three
publications to be published in earth science journals; however, a change in
organization partway through the research process necessitated a change in the thesis
organization. This thesis is therefore presented as a series of chapters (2 to 6, 8), and a
stand-alone paper (chapter 7), which includes a separate abstract. The organization of
the PhD thesis is compatible with the University of Western Australia rules for
submission of a PhD thesis.
Chapters 2 to 6 form the basis for a paper entitled “The New Celebration Gold
Deposits: P-T-X Fluid Evolution and Two Stages of Gold Mineralization within the
Crustal-scale Boulder-Lefroy Shear Zone, Yilgarn Craton, Western Australia” which
was submitted for publication in Economic Geology and is currently in revision. This
paper is presented as Appendix 1. The paper was co-authored by Steffen G. Hagemann,
Peter Neumayr, Garry Davidson and David Banks. The first author conducted all thin
section and polished section petrography, fluid inclusion petrography and
microthermometry, laser Raman analyses, single fluid inclusion laser ablation-ICP-MS
analyses, in situ sulfur isotope analyses and laser ablation-ICP-MS mineral chemistry
analyses, and wrote the first draft of the paper. Co-authors S. Hagemann, P. Neumayr
and G. Davidson read drafts of this paper and provided editorial comments. Co-authors
G. Davidson and D. Banks provided access to analytical facilities at the University of
Tasmania and the University of Leeds, respectively.

CHAPTER ONE: INTRODUCTION
21
Chapter 7 comprises a single paper, entitled “Protracted Gold Mineralization in
the Kalgoorlie-Kambalda Corridor and its Relationship to the Boulder-Lefroy Fault
Zone, Eastern Goldfields Province, Western Australia”, which was prepared for
submission to Ore Geology Reviews, and as such is presented as a paper, including a
separate abstract. The first author conducted the laser ablation ICP-MS mineral
chemistry analyses, the in situ sulfur isotope analyses not referenced to other studies,
literature research, and wrote the first draft of the paper. The co-authors S. Hagemann,
T.C. McCuaig and P. Neumayr read drafts of this paper and made scientific and
editorial comments.
Chapter 8 presents the conclusions of the entire research project and
encompasses the conclusions from chapters 2-6 and chapter 7.
Chapter 2 describes the regional geological setting of the Yilgarn craton,
Norseman-Wiluna belt and the Kambalda Domain. Chapter 3 presents the geology of
the New Celebration deposits including the structural setting of the mine and its
correlation with regional events, lithostratigraphy, gold mineralization, hydrothermal
alteration and vein paragenesis. This chapter predominantly presents the work of
previous researchers, particularly that of Nichols (2003), whose BSc. (Hons) thesis on
the structural control, hydrothermal alteration and relative timing of the New
Celebration gold deposit provided the deposit framework upon which this research
project was developed. All data and interpretations presented on quartz vein
mineralogy, and the paragenetic sequence is the candidates own, except where
otherwise referenced. Chapter 4 describes the results of fluid inclusion petrography,
microthermometry, Laser Raman and LA-ICP-MS geochemical analyses, evaluates the
trapping conditions of the different fluids, and the tectonic implications of these results
and interpretations. Chapter 5 presents the results of sulfide sulfur isotope and sulfide,
oxide and gold geochemistry analyses, and their implications for potential fluid sources
and ore forming processes. Chapter 6 discusses the New Celebration hydrothermal
system and proposes an integrated hydrothermal fluid model for the Boulder Lefroy
Fault Zone at New Celebration. Chapter 7 compiles available published and
unpublished fluid inclusion, hydrothermal alteration and radiogenic and stable isotope
data on the Kalgoorlie and Kambalda gold camps, and presents new sulfide sulfur
isotopic data and sulfide, oxide and gold LA-ICP-MS mineral chemistry analyses
collected during this study. This forms the basis for an integrated hydrothermal fluid
model for the Kalgoorlie-Kambalda area and evaluates the role of the Boulder Lefroy

CHAPTER ONE: INTRODUCTION
22
Fault Zone in facilitating the flow of metals and fluids to the spatially associated world-
class gold deposits within the Kalgoorlie-Kambalda corridor. Chapter 8 summarizes the
main conclusions of this research, and discusses the potential exploration implications
in addition to possible future work.

CHAPTER TWO: GEOLOGY OF THE KALGOORLIE TERRANE
23
2 CHAPTER TWO: GEOLOGY OF THE KALGOORLIE TERRANE
2.1 Stratigraphy
The Eastern Goldfields Province (EGP) orogenic belt is located on the eastern
margin of the Yilgarn craton (Fig. 2.1) and consists of six stratigraphically and
structurally distinct late Archean (Swager et al., 1992) terranes – Kalgoorlie, Kurnalpi,
Gindalbie, Edjudina, Laverton and Norseman. The Kalgoorlie Terrane is the best
defined terrane of the EGP (Swager et al., 1995) and is a 6-9 kilometer thick, elongate,
NNW trending volcano-sedimentary sequence, bounded to the east and west by wide
(up to 1km) anastamosing shear zones (Swager, 1997). The regionally extensive
volcano-sedimentary greenstone sequence comprises a mafic-ultramafic volcanic
sequence overlain by felsic volcanic and volcaniclastic rocks and intruded by a number
of mafic-ultramafic and granitoid suites. The oldest unit in the Kalgoorlie Terrane is the
Lunnon Basalt, a >200 meter-thick thick pillowed tholeiitic unit with thin interflow
sedimentary rocks. Overlying the Lunnon Basalt is an 800-1200 meter-thick
serpentinized komatiite sequence (named Hannans Lake Serpentinite in the north,
Kambalda Komatiite in the south), which grades upwards into high-Mg basalt. The
Devon Consols basalt (60-100 meter-thick) and Paringa basalt (up to 1500 meter-thick),
both high-Mg variolitic, pillowed basalt lavas, overly the komatiites. The Kapai slate, a
10 meter-thick sulfidic unit and distinctive marker bed throughout the region, separates
the two basalts. The Black Flag Group overlies the mafic volcanic package and
comprises a 1km thick sequence of upwards-coarsening volcano-sedimentary sequence
of black shales, felsic volcaniclastic sandstones, conglomerates and felsic intrusive
rocks. Differentiated tholeiitic mafic sills intrude the volcano-sedimentary sequence and
in Kalgoorlie host most of the gold. The youngest exposed rocks comprise coarse clastic
basins, which unconformably overlie the greenstone sequence and commonly bury
major boundary faults (Swager, 1997). Regionally the terrane is metamorphosed to
upper greenschist facies, with locally higher metamorphic grades (up to amphibolite
facies) recorded along the margins of, and adjacent to, granitoid plutons (Witt, 1991).
The New Celebration deposits mark the transition between lower- to middle-greenschist
facies metamorphism to the north at Kalgoorlie and upper-greenschist facies
metamorphism at St Ives, to the south (Witt and Vanderhor, 1998).
CHAPTER TWO: GEOLOGY OF THE KALGOORLIE TERRANE
24
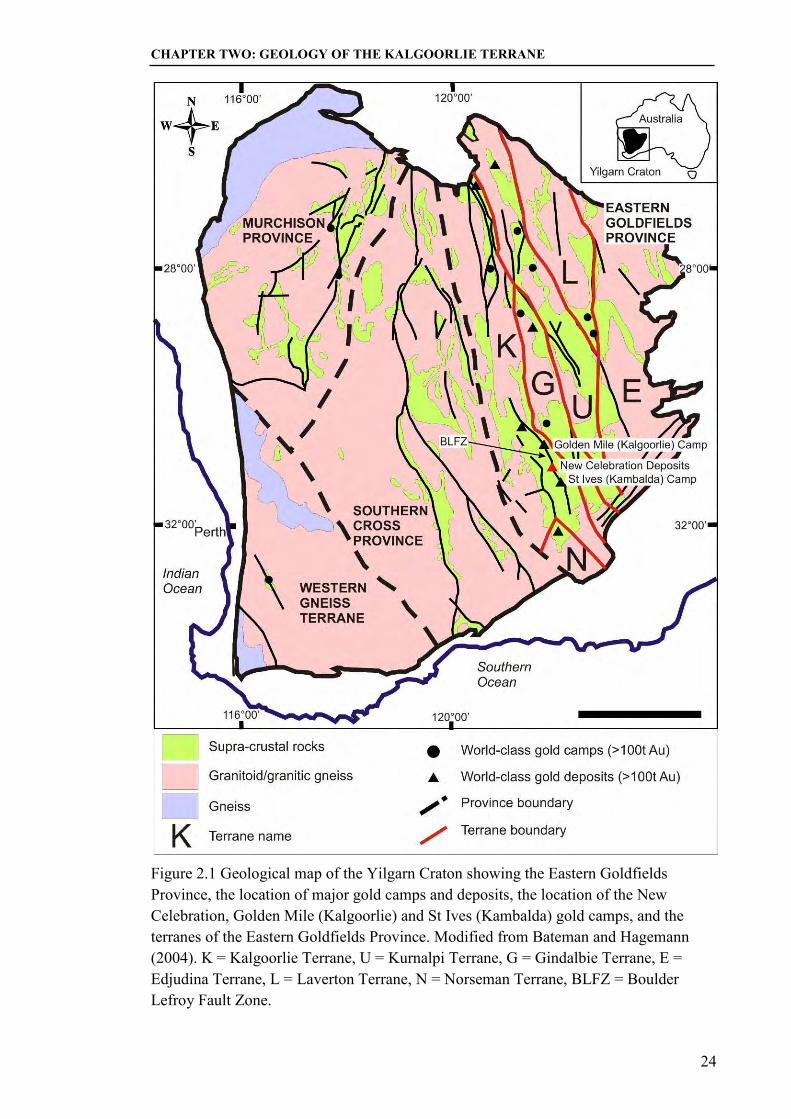
Figure 2.1 Geological map of the Yilgarn Craton showing the Eastern Goldfields Province, the location of major gold camps and deposits, the location of the New Celebration, Golden Mile (Kalgoorlie) and St Ives (Kambalda) gold camps, and the terranes of the Eastern Goldfields Province. Modified from Bateman and Hagemann (2004). K = Kalgoorlie Terrane, U = Kurnalpi Terrane, G = Gindalbie Terrane, E = Edjudina Terrane, L = Laverton Terrane, N = Norseman Terrane, BLFZ = Boulder Lefroy Fault Zone.
CHAPTER TWO: GEOLOGY OF THE KALGOORLIE TERRANE
25
2.2 Deformation
The characteristic NNW-trending tectonic grain of the EGP and the Kalgoorlie
Terrane developed predominantly through province-wide ~E-W shortening. Swager and
Nelson (1997) recognized four main compressive deformation episodes (D1-D4, Table
2.1) in the Kalgoorlie Terrane, each preceded by extensional periods (De). The volcano-
sedimentary sequence was deposited during De - the earliest extensional phase. South
over north compression (D1) followed at > 2675 Ma and led to thrust faulting and
widespread structural repetition (Swager and Nelson, 1997). Coarse clastic sequences
were deposited during a second extensional phase that preceded regional D2 shortening.
Widespread granitoid intrusion also accompanied this extensional phase (Weinberg et
al., 2003). Approximately E-W shortening during regional D2 (2675-2657 Ma, Nelson,
1997) resulted in NNW-SSE trending upright folds and penetrative foliation (Swager,
1989; Swager and Griffin, 1990; Weinberg et al., 2003). Deformation during D3 (2663-
2632) and D4 (<2640) (Nelson, 1997; Swager, 1997) changed from oblique-slip to
strike-slip in nature and progressed from a ductile to a brittle regime (Mueller et al.,
1988; Bateman et al., 2001). Recent studies have proposed a more complex
deformational history for the Kalgoorlie Terrane than that encompassed by the widely
accepted D1-D4 nomenclature. Blewett et al. (2004) proposed that D2 deformation was
episodic, involving switching between extensional and compressional tectonic regimes,
and that it was diachronous across the EGP. Weinberg et al. (2005) do not consider D3
and D4 to be separate tectonic events, as they are not separated by a significant time gap
and formed with the same strain orientation. They consider that these two events reflect
different expressions of the same tectonic event as the crust cooled or strain rate
increased.
2.3 The Boulder-Lefroy Fault Zone
The Boulder-Lefroy fault zone (BLFZ) is an interpreted first-order crustal-scale
fault system (e.g., Swager, 1989) located on the eastern margin of the Kalgoorlie
Terrane (Fig. 2.1) in the Eastern Goldfields Province of the Yilgarn Craton. The fault
extends over 200 kilometers in length from north of Kalgoorlie to south of Kambalda
(Gemuts and Theron, 1975; Griffin, 1990). At New Celebration, the BLFZ truncates the
eastern limb of the Celebration Anticline (Archibald, 1992) (Fig. 2.2) and has a
complicated history with a number of different interpretations regarding its movement
sense. Most researchers (e.g. Swager, 1989) concur that the major period of fault
CHAPTER TWO: GEOLOGY OF THE KALGOORLIE TERRANE
26
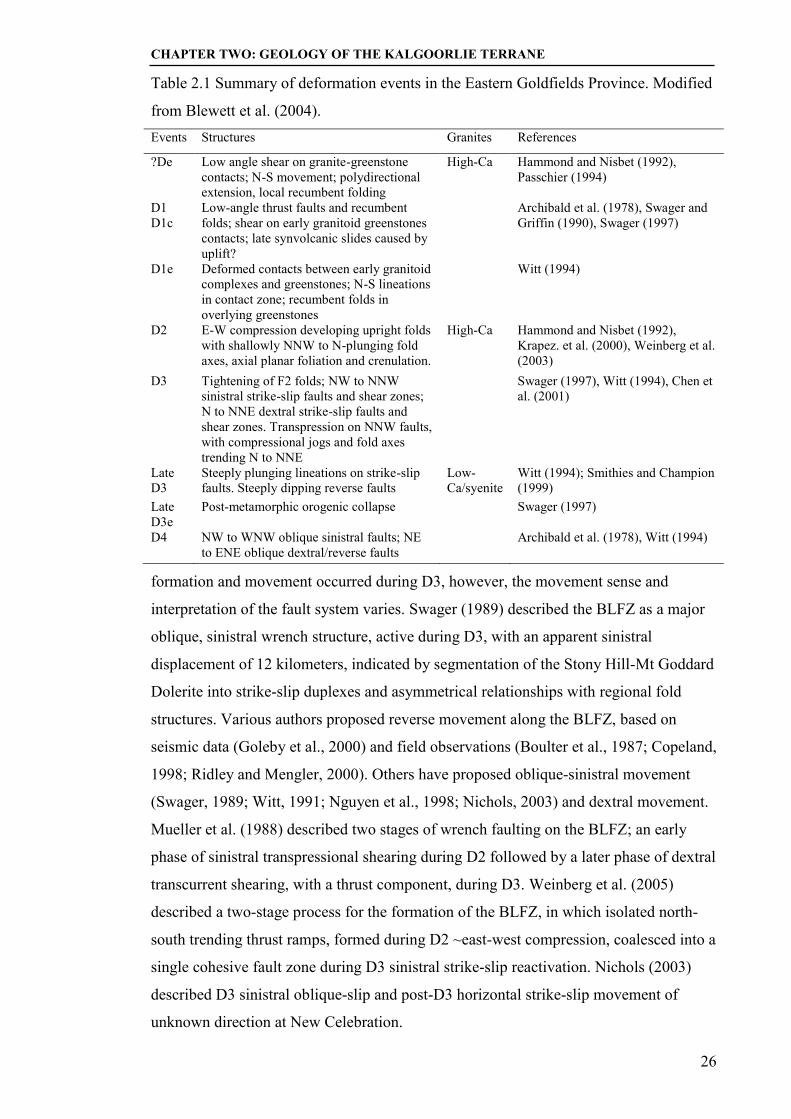
Table 2.1 Summary of deformation events in the Eastern Goldfields Province. Modified
from Blewett et al. (2004). Events Structures Granites References
?De Low angle shear on granite-greenstone contacts; N-S movement; polydirectional extension, local recumbent folding
High-Ca Hammond and Nisbet (1992), Passchier (1994)
D1 D1c
Low-angle thrust faults and recumbent folds; shear on early granitoid greenstones contacts; late synvolcanic slides caused by uplift?
Archibald et al. (1978), Swager and Griffin (1990), Swager (1997)
D1e Deformed contacts between early granitoid complexes and greenstones; N-S lineations in contact zone; recumbent folds in overlying greenstones
Witt (1994)
D2 E-W compression developing upright folds with shallowly NNW to N-plunging fold axes, axial planar foliation and crenulation.
High-Ca Hammond and Nisbet (1992), Krapez. et al. (2000), Weinberg et al. (2003)
D3 Tightening of F2 folds; NW to NNW sinistral strike-slip faults and shear zones; N to NNE dextral strike-slip faults and shear zones. Transpression on NNW faults, with compressional jogs and fold axes trending N to NNE
Swager (1997), Witt (1994), Chen et al. (2001)
Late D3
Steeply plunging lineations on strike-slip faults. Steeply dipping reverse faults
Low-Ca/syenite
Witt (1994); Smithies and Champion (1999)
Late D3e
Post-metamorphic orogenic collapse Swager (1997)
D4 NW to WNW oblique sinistral faults; NE to ENE oblique dextral/reverse faults
Archibald et al. (1978), Witt (1994)
formation and movement occurred during D3, however, the movement sense and
interpretation of the fault system varies. Swager (1989) described the BLFZ as a major
oblique, sinistral wrench structure, active during D3, with an apparent sinistral
displacement of 12 kilometers, indicated by segmentation of the Stony Hill-Mt Goddard
Dolerite into strike-slip duplexes and asymmetrical relationships with regional fold
structures. Various authors proposed reverse movement along the BLFZ, based on
seismic data (Goleby et al., 2000) and field observations (Boulter et al., 1987; Copeland,
1998; Ridley and Mengler, 2000). Others have proposed oblique-sinistral movement
(Swager, 1989; Witt, 1991; Nguyen et al., 1998; Nichols, 2003) and dextral movement.
Mueller et al. (1988) described two stages of wrench faulting on the BLFZ; an early
phase of sinistral transpressional shearing during D2 followed by a later phase of dextral
transcurrent shearing, with a thrust component, during D3. Weinberg et al. (2005)
described a two-stage process for the formation of the BLFZ, in which isolated north-
south trending thrust ramps, formed during D2 ~east-west compression, coalesced into a
single cohesive fault zone during D3 sinistral strike-slip reactivation. Nichols (2003)
described D3 sinistral oblique-slip and post-D3 horizontal strike-slip movement of
unknown direction at New Celebration.

CHAPTER TWO: GEOLOGY OF THE KALGOORLIE TERRANE
27
Figure 2.2 Geological map of the New Celebration district illustrating the Celebration
anticline and major deposits (redrawn from Swager, 1989).

APPENDICES 28
28
There are a number of factors contributing to discrepancies between authors
when describing the kinematic history of the BLFZ. The fault has a strike length of over
200km although along most of its length the fault trace is poorly exposed, and is
complicated by a number of different splays (Griffin, 1990). Further, some authors (e.g.
Swager, 1989) consider the Boulder fault to the north, and the Lefroy fault to the south,
as separate entities. Outcrops are sparse and there are few locations where structural
measurements and observations can be taken directly from within the fault.
Additionally, the fault has had a long-lived and complex deformation history and has
been active in various forms throughout orogenesis.
2.4 Distribution and Timing of Gold Mineralization
The Yilgarn craton has produced over 2,500 tonnes of gold from over 10,000
deposits in the last 120 years (Townsend et al., 2000). A significant number of those
deposits occur in the Kalgoorlie Terrane and the largest are associated with the BLFZ.
The BLFZ hosts the New Celebration gold deposits (2 million ounces) and is spatially
correlated with the Golden Mile deposit, which at >50 million ounces contained gold
(Bateman and Hagemann, 2004) is the largest orogenic lode gold deposit in the world,
and St Ives (>8 million ounces production, pers. comm. Justin Osborne, 2007). Both
these deposits occur within second- and third-order structures adjacent to the main trace
of the BLFZ. Weinberg et al. (2005) noted that the major gold mining districts along the
BLFZ were distributed 30 to 40 kilometers apart, and that the more gold-endowed
districts were flanked by the least endowed districts adjacent along strike. Further, the
largest gold deposits (Golden Mile, New Celebration, St Ives) coincide with the
exposure of regionally significant anticlinal cores.
The timing of gold mineralization in the Yilgarn craton is contentious.
Traditional models consider that gold mineralization within Archean terranes occurred
late in the evolution of the host terrane (Colvine et al., 1988; Groves et al., 1989;
Kerrich and Cassidy, 1994) during the final stages of volcanism and coincident with
spikes in plutonism and deformation (Robert et al., 2005). Within the regional structural
framework of Swager (1989), published age determinations constrain gold
mineralization in the Yilgarn craton to the period 2660 to 2625 Ma (Groves et al., 2000;
Mueller, 2007), over a restricted time interval during late D3, post-peak metamorphism
and associated with reactivation of crustal-scale deformation zones (Groves, 1993). A
number of different deposits in the Kalgoorlie terrane associated with the BLFZ, such as

APPENDICES 29
29
Victory, (Clark et al., 1986); Revenge (Nguyen, 1997) and New Celebration Stage I
(Nichols, 2003) appear consistent with this hypothesis. The Golden Mile, however,
which is the largest gold deposit in the EGP, and at least one stage of mineralization at
New Celebration, appear to contradict this model.
In Kalgoorlie, Groves (1993) considered the Fimiston lodes at the Golden Mile
to be syn-D3 (2660 to 2632 Ma, Nelson, 1997; Swager et al., 1997). Recent work on the
Golden Mile deposit however, based on structural relationships and dating of
intermineral dikes, indicates that the Fimiston and Oroya lodes may be much older,
possibly late D1 to early D2 (Bateman et al., 2001; Bateman and Hagemann, 2004;
Gauthier et al., in revision). Further, structural evidence indicates that the Mt Charlotte
lodes at the Golden Mile formed during D4 brittle-ductile faulting. Bateman et al.
(2001) and Bateman and Hagemann (2004) interpreted all of these data as indicating
that gold mineralization in the Kalgoorlie camp was a protracted event, which occurred
over a period of approximately 50 Ma and which formed different deposit styles.
Nichols (2003) also identified a late-stage mineralization event at New Celebration
associated with brittle-ductile deformation and interpreted, based on cross-cutting
relationships, those as post-D3 (likely D4) but otherwise unconstrained.
CHAPTER THREE: GEOLOGY OF THE NEW CELEBRATION GOLD DEPOSIT
30
3 CHAPTER THREE: GEOLOGY OF THE NEW CELEBRATION GOLD DEPOSIT
3.1 Mine Stratigraphy
The New Celebration gold deposit is hosted within a sequence of folded and
sheared komatiites, differentiated dolerites and felsic volcaniclastic rocks, which have
been intruded by several generations of felsic and lamprophyric dikes and truncated by
the BLFZ. Langsford (1989) established the stratigraphy of the New Celebration deposit
and correlated it to the stratigraphic sequence established for the Kalgoorlie-Kambalda
corridor by Gresham and Loftus-Hills (1981), Swager (1989), Swager et al. (1995) and
Watchorn (1998) (Table 3.1). The 200-metre thick Kambalda Komatiite comprises the
basal stratigraphic unit (Fig. 3.1) at New Celebration and forms the footwall in the
Hampton-Boulder and Jubilee open pits. Typically, this unit is fine-grained,
equigranular and homogeneous (Watchorn, 1998) and serpentine, tremolite, chlorite and
talc replace primary mineralogy. Low-strain zones preserve relict primary spinifex and
cumulate textures pseudomorphed by magnetite and talc (Copeland, 1998). The upper
contact of the Kambalda Komatiite is conformable with the overlying differentiated
dolerite and is intensely sheared and hydrothermally altered in the BLFZ.
The hanging wall at the New Celebration deposit is a differentiated mafic unit,
locally termed the Jubilee Dolerite but stratigraphically equivalent to the regional
Pernatty Dolerite (Langsford, 1989; Norris, 1990; Archibald, 1992; Copeland, 1998).
Six main zones comprise the Pernatty Dolerite: (1) a 50-200m thick basal cumulate
pyroxenite; which grades into (2) a melanocratic dolerite characterized by coarse-
grained (up to 20 mm long) pyroxene phenocrysts in a fine-grained plagioclase
groundmass; (3) equigranular magnetite-rich dolerite; (4) equigranular magnetite-rich
granophyre; (5) fine-grained oxide-rich dolerite with characteristic bladed pyroxene
phenocrysts; and (6) a fine-grained chill zone (Archibald, 1992). The mafic rocks show
metamorphic mineral assemblages typical of greenschist facies metamorphism (1994),
however, the original igneous textures are preserved (cf. Gresham and Loftus-Hills,
1981).
Nichols (2003) recognized two major magmatic events at New Celebration,
based on mineralogy, deformation style and cross-cutting relationships. Early intensely
carbonate-biotite-magnetite altered plagioclase porphyry dikes are

CHAPTER THREE: GEOLOGY OF THE NEW CELEBRATION GOLD DEPOSIT
31
Table 3.1 Stratigraphy of the New Celebration deposits correlated with the regional frameworks
established for Kalgoorlie and Kambalda
Kalgoorlie (Swager, 1989, Swager et al. 1995) New Celebration (Langsford, 1989) St Ives (Watchorn, 1998)
Kurrawang Formation: Alluvial, fluviatile and shallow-marine coarse clastic sandstone deposited within locally fault-bounded synclines parallel to regional tectonic trend
Merougil Conglomerate Merougil Conglomerate
Black Flag Group: Felsic volcanic and volcaniclastic sedimentary sequence, >1km thick, coarsening upwards
Black Flag Group Black Flag Group
Golden Mile Dolerite: Differentiated tholeiitic dolerite, divided into 10 petrographic units, 800m thick
Triumph Gabbro Condensor and Junction Dolerites
Kalgoorlie Group Paringa Basalt: Up to 1500m thick, high Mg, variolitic, pillowed, cherty interflow sediments
Kyarra Basalt Paringa Basalt
Williamstown Dolerite: Up to 300m thick, fractionated
Pernatty Dolerite, 300-500m thick, basal cumulate pyroxenite
Defiance Dolerite
Kapai Slate: Marker horizon, 5-25m thick, pyritic graphitic slate to magnetite-bearing chert
Kapai Slate Kapai Slate
Devon Consols Basalt: 60-100m thick, high Mg variolitic basalt
Mutooroo Basalt, 100-200m thick Devon Consols Basalt
Hannan's Lake Serpentinite: 800-1200m thick, serpentinized ultramafic lavas grading upward to high Mg basalt
Kambalda Komatiite Kambalda Komatiite
Lunnon Basalt: >200m thick, pillowed tholeiites with thin interflow sediments
denoted M1 and have a penetrative foliation. These intrusions are crosscut by weakly
albite-carbonate-magnetite-hematite altered, nonfoliated to weakly foliated quartz-
feldspar porphyry dikes, designated M2, which preserve primary igneous textures. The
M2 porphyries are up to 80m thick, extend over 400m along strike and down dip
(Copeland, 1998) and are boudinaged along strike and down dip. Other intrusive phases
such as quartz-phyric felsic porphyry dikes, lamprophyres (Nichols, 2003) and shear-
parallel intermediate porphyries (Williams, 1994) are associated with gold
mineralization but are volumetrically insignificant. The mine sequence, with the
exception of the M2 porphyries, is metamorphosed to upper greenschist facies (Norris,
1990).

CHAPTER THREE: GEOLOGY OF THE NEW CELEBRATION GOLD DEPOSIT
32
Figure 3.1 Lithostratigraphy of the New Celebration deposit, modified from Nichols (2003)
3.2 Mine Deformation Events and Regional Correlation
Nichols (2003) identified three main deformation events at New Celebration,
and tentatively correlated them with regional deformation events (Table 3.2). For clarity
Nichols (2003) marked or denoted the local New Celebration events with the subscript
NC; this convention is maintained throughout the thesis. An event correlating to
regional D1 was not recognized at the New Celebration gold deposits. Vertically tilted
conformable stratigraphic contacts characterize D2NC, the earliest recognized
deformation event at New Celebration. This event corresponds to the regional D2
upright folding of Swager (2003) and Swager and Griffin (1989). Steeply southwest-
and west-southwest-dipping, northwest- trending S-C fabrics, south-southwest-plunging
mineral elongation lineations and sigmoidal quartz grains constrain movement on the
BLFZ during D3NC as sinistral oblique slip, west-block-down to the southwest (Nichols,

CHAPTER THREE: GEOLOGY OF THE NEW CELEBRATION GOLD DEPOSIT
33
2003). This tentatively correlates with regional D3 ENE-WSW compression and
sinistral strike- and dip-slip faulting (Nichols, 2003; Nichols et al., 2004). Northwest-
dipping structures and a second penetrative northeast-trending, northwest-dipping S-C
fabric, which crosscut S3NC, represent D4NC and constrain fault movement during D4NC
as sinistral strike slip. Quartz-carbonate-chlorite-epidote veins that crosscut D3NC
foliation are also assigned to D4NC. Late curviplanar faults that crosscut all other
structures are assigned to D4+NC. In contrast, Weinberg et al. (2005) identified two
phases of movement at New Celebration (Table 3.2), an early phase of movement
characterized by crustal shortening and vertical extension during D2 and a later
movement phase characterized by clockwise rotation of the maximum shortening axis
from east-northeast–west-southwest to east-southeast–west-northwest and reactivation
of north-northwest–trending thrust planes by sinistral shear zones, during D3.
3.3 Gold Mineralization and Hydrothermal Alteration
The New Celebration gold deposit comprises six open pits (Hampton-Boulder,
Jubilee, Mutooroo, Celebration, Golden Hope, and Early Bird) and the Hampton
Decline underground operation, which comprises four ore zones (Southern, Central,
Northern, and B40). Collectively the deposits produced approximately 1.5 million
ounces of gold between 1987 and 1997, with the majority of the gold exploited in open
pits from the Hampton-Boulder (7.4Mt @ 2.34 g/t Au for 560,000 oz (Dielemans,
2000)) and Jubilee (10.3Mt @ 2.09 g/t Au for 693,000 oz) deposits. These two deposits,
which since December 2007 have comprised a single resource under the ownership of
Dioro Exploration NL, are the focus of this study.
Mafic schists, mylonites and sheared intermediate porphyritic intrusions and
felsic porphyries host gold mineralization within brittle-ductile shear zones and brittle
quartz breccias (Swager, 1989; Swager and Griffin, 1990). Ore zones are located in the
hanging wall of a steeply dipping, deformed contact between mafic and ultramafic
rocks, and are spatially associated with, and hosted within, intermediate and quartz-
feldspar porphyry dikes that intruded the contact along the BLFZ (Williams, 1994;
Nichols, 2003) (Figs. 3.2, 3.3). Nichols (2003) identified two mineralizing events, Stage
I and Stage II, and four mineralization styles (Mylonite, Porphyry, Contact and
Fracture) classified according to the host rocks and their mode of occurrence . Stage I
gold mineralization is associated with ductile deformation and is hosted within fine-
grained deformed pyrite along foliation planes in mylonitized and deformed
intermediate M1 porphyry and mafic schists. Stage II gold mineralization is associated
CHAPTER THREE: GEOLOGY OF THE NEW CELEBRATION GOLD DEPOSIT
34
.
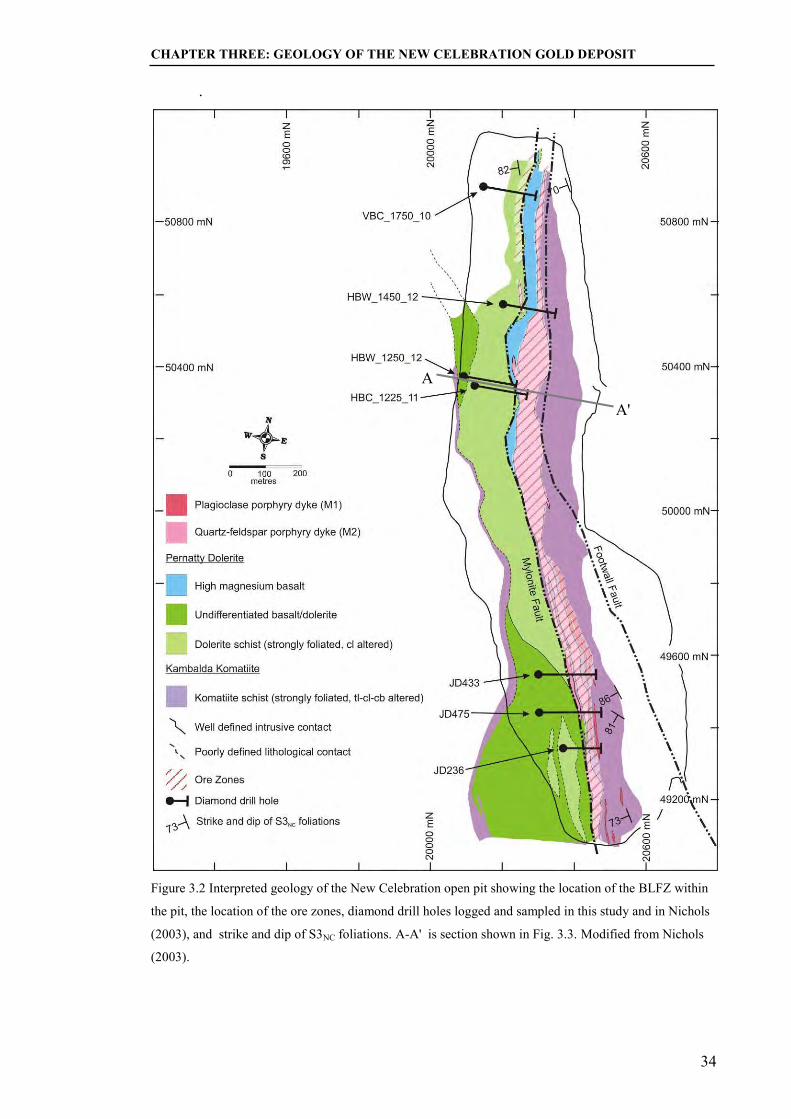
Figure 3.2 Interpreted geology of the New Celebration open pit showing the location of the BLFZ within
the pit, the location of the ore zones, diamond drill holes logged and sampled in this study and in Nichols
(2003), and strike and dip of S3NC foliations. A-A' is section shown in Fig. 3.3. Modified from Nichols
(2003).
A
A'

CHAPTER THREE: GEOLOGY OF THE NEW CELEBRATION GOLD DEPOSIT
35
Table 3.2 Deformation of the New Celebration deposits correlated with regional deformation events and the deformation sequences established for Kalgoorlie and Kambalda
Age Regional Deformation Kalgoorlie Gold Camp (Bateman and Hagemann, 2004)
New Celebration Gold Camp (Nichols, 2003)
Kambalda Gold Camp (Archibald, 1985; Swager, 1989; Nguyen, 1997)
<2640 (Swager, 1997)
D4 dextral shear on NNE-SSW trending shear zones
D4 Right lateral oblique-slip movement on NNE striking faults
D4NC Strike slip movement on the BLFZ. Movement sense unconstrained
D4 NE-SW shortening. Reactivation of pre-existing faults and development of brittle NE and NW faults
2663-2645 (Nelson, 1997; Swager, 1997)
D3 Strike-slip shear with dextral and sinistral movement
D3 Broad scale left lateral transpression resulting in sinistral strike-slip movement on the BLFZ and BS and local scale antithetic right lateral strike slip movement on NNE striking, steeply NW dipping faults
D3NC Sinistral oblique-slip west block down to the SW movement on the BLFZ
D3 ESE-WNW shortening. Sinistral movement on N-trending faults, tightening of D2 folds, reactivation of D2 faults and development of new faults subsidiary to D2 faults
2675-2657 (Nelson, 1997)
D2 ENE-WSW regional shortening, upright foliation and folds (Swager, 1997; Witt and Swager, 1989; Nelson, 1997; Ridley and Mengler, 2000)
D2 NE-SW compression. Development of NNW striking thrust faults, upright folds and NS striking, subvertical axial planar cleavage
D2NC Tilting of conformable sub-units of the Pernatty dolerite to vertical orientations
D2 ENE-WSW shortening,. Development of open upright folds such as the Kambalda Dome, and development of main upright (S2) foliation
>2675 (Swager 1997)
D1 Low angle shears, thrusting, stratigraphic repetition, recumbent folds (Swager, 1989; Passchier, 1994, 1995; Swager and Nelson 1997)
D1 (local)
NE-SW compression. Development of N-trending, NE over SW thrust faults and Kalgoorlie Anticline
D1 N-S compression. Development of E-W-trending thrust faults and recumbent folds such as the Foster, Tramways and Republican thrusts.
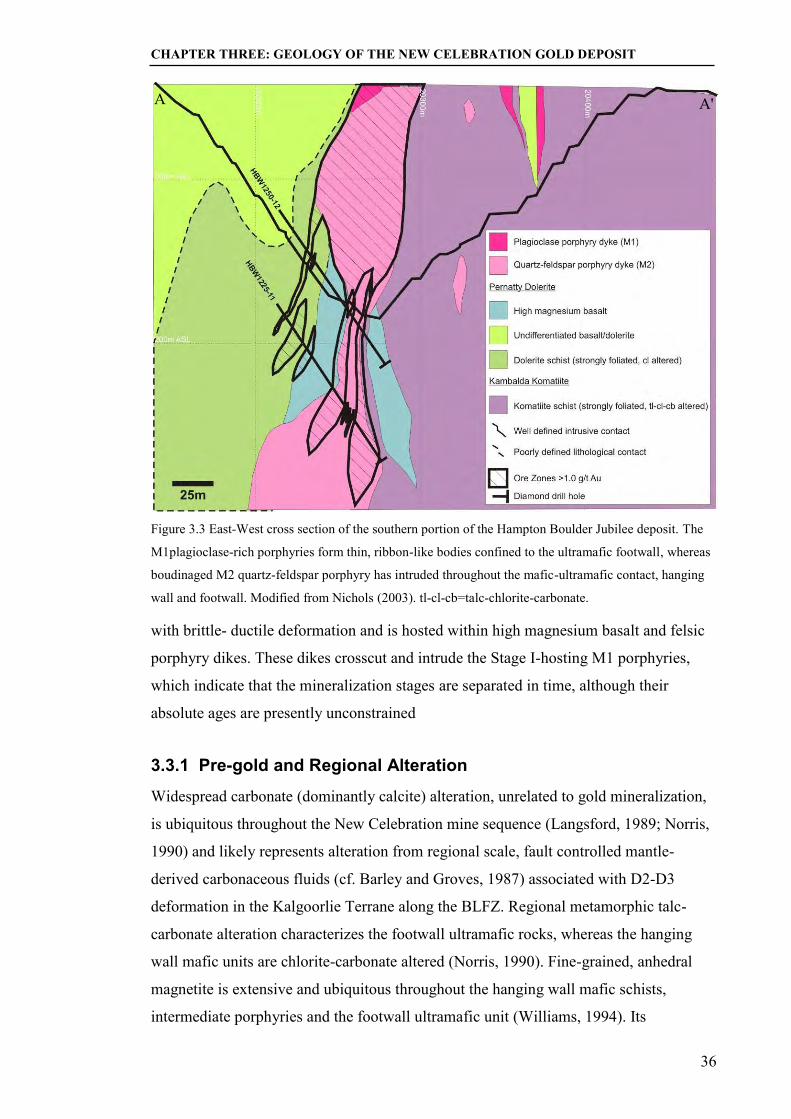
CHAPTER THREE: GEOLOGY OF THE NEW CELEBRATION GOLD DEPOSIT
36
Figure 3.3 East-West cross section of the southern portion of the Hampton Boulder Jubilee deposit. The
M1plagioclase-rich porphyries form thin, ribbon-like bodies confined to the ultramafic footwall, whereas
boudinaged M2 quartz-feldspar porphyry has intruded throughout the mafic-ultramafic contact, hanging
wall and footwall. Modified from Nichols (2003). tl-cl-cb=talc-chlorite-carbonate.
with brittle- ductile deformation and is hosted within high magnesium basalt and felsic
porphyry dikes. These dikes crosscut and intrude the Stage I-hosting M1 porphyries,
which indicate that the mineralization stages are separated in time, although their
absolute ages are presently unconstrained
3.3.1 Pre-gold and Regional Alteration
Widespread carbonate (dominantly calcite) alteration, unrelated to gold mineralization,
is ubiquitous throughout the New Celebration mine sequence (Langsford, 1989; Norris,
1990) and likely represents alteration from regional scale, fault controlled mantle-
derived carbonaceous fluids (cf. Barley and Groves, 1987) associated with D2-D3
deformation in the Kalgoorlie Terrane along the BLFZ. Regional metamorphic talc-
carbonate alteration characterizes the footwall ultramafic rocks, whereas the hanging
wall mafic units are chlorite-carbonate altered (Norris, 1990). Fine-grained, anhedral
magnetite is extensive and ubiquitous throughout the hanging wall mafic schists,
intermediate porphyries and the footwall ultramafic unit (Williams, 1994). Its
A A'
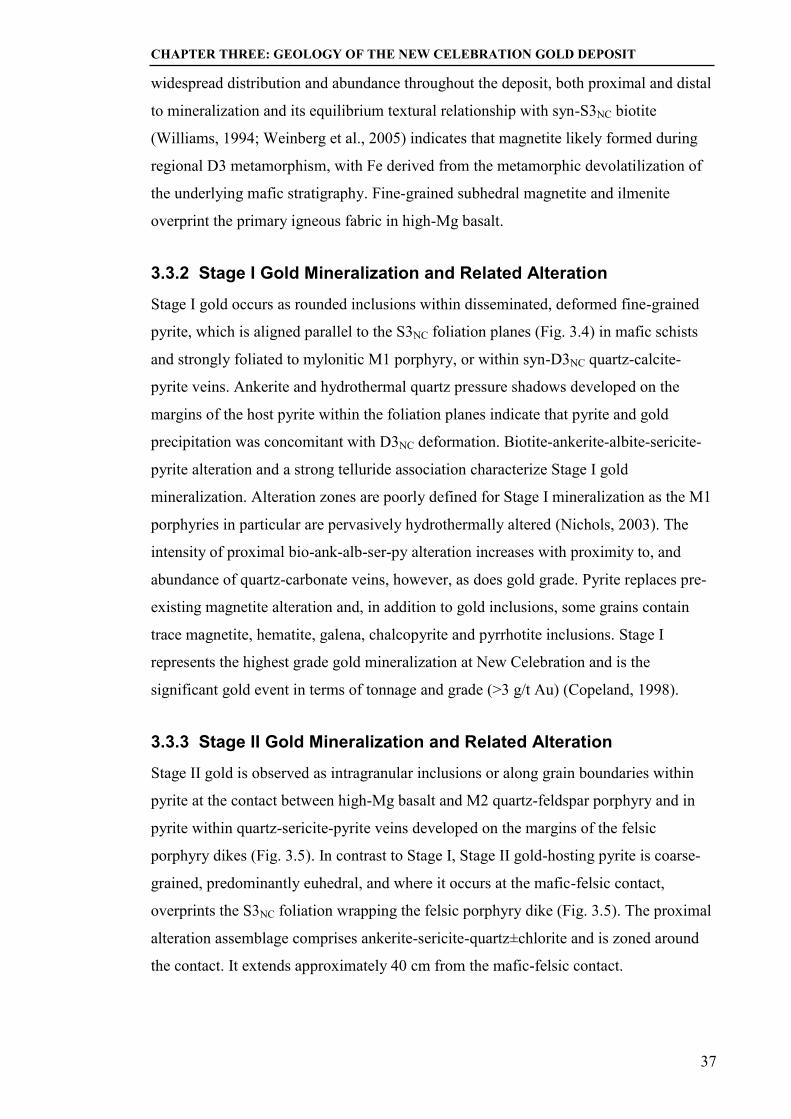
CHAPTER THREE: GEOLOGY OF THE NEW CELEBRATION GOLD DEPOSIT
37
widespread distribution and abundance throughout the deposit, both proximal and distal
to mineralization and its equilibrium textural relationship with syn-S3NC biotite
(Williams, 1994; Weinberg et al., 2005) indicates that magnetite likely formed during
regional D3 metamorphism, with Fe derived from the metamorphic devolatilization of
the underlying mafic stratigraphy. Fine-grained subhedral magnetite and ilmenite
overprint the primary igneous fabric in high-Mg basalt.
3.3.2 Stage I Gold Mineralization and Related Alteration
Stage I gold occurs as rounded inclusions within disseminated, deformed fine-grained
pyrite, which is aligned parallel to the S3NC foliation planes (Fig. 3.4) in mafic schists
and strongly foliated to mylonitic M1 porphyry, or within syn-D3NC quartz-calcite-
pyrite veins. Ankerite and hydrothermal quartz pressure shadows developed on the
margins of the host pyrite within the foliation planes indicate that pyrite and gold
precipitation was concomitant with D3NC deformation. Biotite-ankerite-albite-sericite-
pyrite alteration and a strong telluride association characterize Stage I gold
mineralization. Alteration zones are poorly defined for Stage I mineralization as the M1
porphyries in particular are pervasively hydrothermally altered (Nichols, 2003). The
intensity of proximal bio-ank-alb-ser-py alteration increases with proximity to, and
abundance of quartz-carbonate veins, however, as does gold grade. Pyrite replaces pre-
existing magnetite alteration and, in addition to gold inclusions, some grains contain
trace magnetite, hematite, galena, chalcopyrite and pyrrhotite inclusions. Stage I
represents the highest grade gold mineralization at New Celebration and is the
significant gold event in terms of tonnage and grade (>3 g/t Au) (Copeland, 1998).
3.3.3 Stage II Gold Mineralization and Related Alteration
Stage II gold is observed as intragranular inclusions or along grain boundaries within
pyrite at the contact between high-Mg basalt and M2 quartz-feldspar porphyry and in
pyrite within quartz-sericite-pyrite veins developed on the margins of the felsic
porphyry dikes (Fig. 3.5). In contrast to Stage I, Stage II gold-hosting pyrite is coarse-
grained, predominantly euhedral, and where it occurs at the mafic-felsic contact,
overprints the S3NC foliation wrapping the felsic porphyry dike (Fig. 3.5). The proximal
alteration assemblage comprises ankerite-sericite-quartz±chlorite and is zoned around
the contact. It extends approximately 40 cm from the mafic-felsic contact.

CHAPTER THREE: GEOLOGY OF THE NEW CELEBRATION GOLD DEPOSIT
38
Figure 3.4 Photographs and photomicrographs of representative Stage I gold mineralization samples
illustrating proximal gold-related alteration and gold location. A. Quartz-ankerite and biotite-sericite
alteration defining S3NC foliation with syn-S3NC gold-hosting pyrite from Mylonite-style mineralization.
B. Biotite defining S3NC foliation in M1 porphyry. C. Pyrite in textural equilibrium with S3NC foliation,
defined by biotite, in Porphyry-style mineralization. D. Back-scattered electron image of a rounded gold
bleb within syn-S3NC pyrite from Mylonite-style mineralization. A, B and D from Nichols (2003).
Bt=biotite, Ab=albite, Ser=sericite, Ank=ankerite, Py=pyrite, Qz=quartz.
Pyrite abundance and gold concentration increases with proximity to the mafic-felsic
contact. Tellurides were not observed in Stage II gold mineralization. The location of
Stage II gold mineralization within undeformed M2 porphyries, which crosscut Stage I
gold-hosting M1 porphyries, and the occurrence of gold in euhedral pyrite that
overprints the S3NC foliation, indicate that Stage II post-dates Stage I and is interpreted,
therefore, to post date D3NC. Gold grade in Stage II is inversely proportional to the
width of the M2 porphyry, i.e. the highest grades are developed where the porphyry is at
its narrowest, and where the density of type 3 quartz-pyrite and type 4 sericite-pyrite
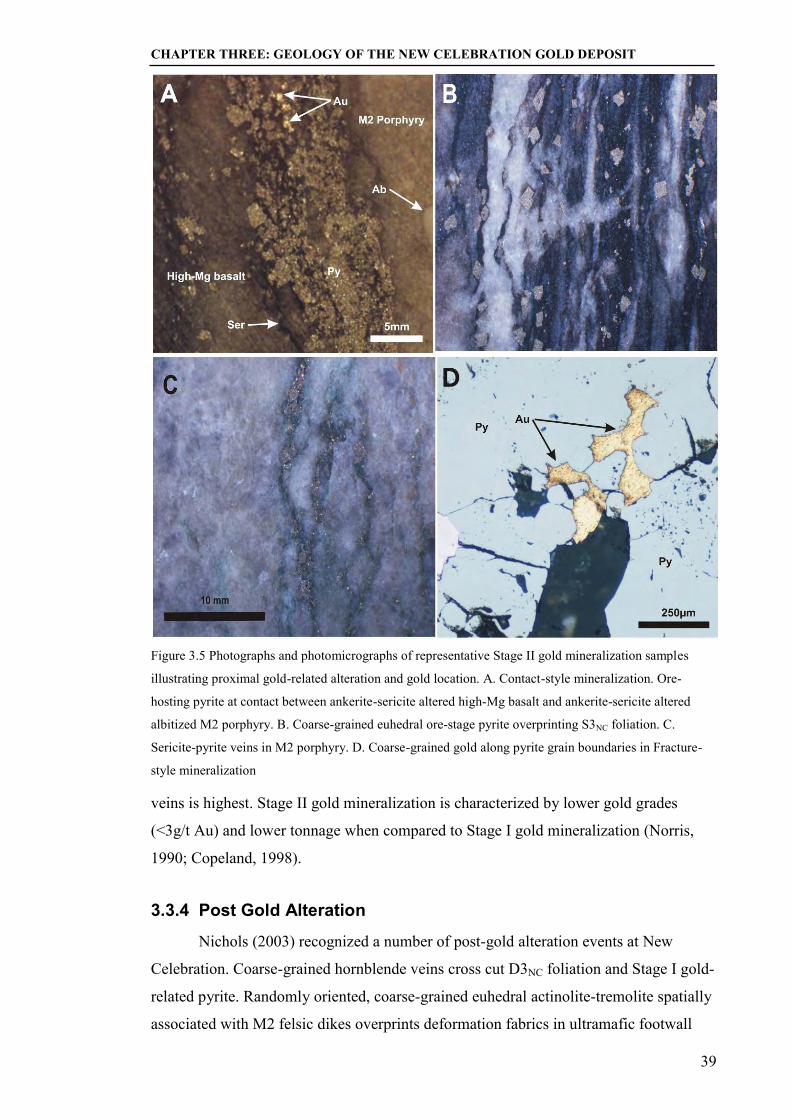
CHAPTER THREE: GEOLOGY OF THE NEW CELEBRATION GOLD DEPOSIT
39
Figure 3.5 Photographs and photomicrographs of representative Stage II gold mineralization samples
illustrating proximal gold-related alteration and gold location. A. Contact-style mineralization. Ore-
hosting pyrite at contact between ankerite-sericite altered high-Mg basalt and ankerite-sericite altered
albitized M2 porphyry. B. Coarse-grained euhedral ore-stage pyrite overprinting S3NC foliation. C.
Sericite-pyrite veins in M2 porphyry. D. Coarse-grained gold along pyrite grain boundaries in Fracture-
style mineralization
veins is highest. Stage II gold mineralization is characterized by lower gold grades
(<3g/t Au) and lower tonnage when compared to Stage I gold mineralization (Norris,
1990; Copeland, 1998).
3.3.4 Post Gold Alteration
Nichols (2003) recognized a number of post-gold alteration events at New
Celebration. Coarse-grained hornblende veins cross cut D3NC foliation and Stage I gold-
related pyrite. Randomly oriented, coarse-grained euhedral actinolite-tremolite spatially
associated with M2 felsic dikes overprints deformation fabrics in ultramafic footwall

CHAPTER THREE: GEOLOGY OF THE NEW CELEBRATION GOLD DEPOSIT
40
rocks. Late-stage coarse-grained euhedral carbonate overprints the actinolite-tremolite
and is in turn overprinted by fine-grained euhedral magnetite. Williams (1994)
described ubiquitous, heterogeneously distributed hematite staining throughout the
southern ore zone. He noted that flat-lying quartz-carbonate-chlorite veins (also
observed by Nichols, 2003), which crosscut mineralized veins and associated alteration,
controlled the distribution of hematite alteration. Figure 3.6 summarizes the
deformation, mineralization and alteration paragenesis of New Celebration

CHAPTER THREE: GEOLOGY OF THE NEW CELEBRATION GOLD DEPOSIT
41
De Emplacent of volcano-sedimentary sequence
D1 No recorded event at New Celebration
D2NC East-west oriented compression Tilting of stratigraphic contacts to vertical Formation of proto-BLFZ
Early D3NC Development of BLFZ as mantle tapping structure Emplacement of M1 porphyry Widespread mantle C alteration Type 1 Qz-cc boudinaged veins
Mid D3NC Peak metamorphism Magnetite alteration
Mid-Late D3NC Type 2 qz-cc-py veins Stage I Au bi-ank-ser-ab-py alteration Au, py, cpy, gn, po
Late D3NC Hornblende veins overprinting Au mineralization
Late D3NC-Early D4NC Emplacement of M2 porphyry Type 3 qz±cb, ser, py veins Type 4 ser-py veins Stage II Au ank-ser-qz-chl-py alteration Au, py
Post D4NC Actinolite-tremolite alteration Carbonate overprint Late magnetite

CHAPTER THREE: GEOLOGY OF THE NEW CELEBRATION GOLD DEPOSIT
42
Figure 3.6 (Previous Page) Deformation, alteration and mineralization paragenesis of the New
Celebration gold deposit
3.4 Vein Paragenesis and Petrography
3.4.1 Vein Types
Four major vein groups that correlate with specific deformation events and gold
mineralization styles were identified at New Celebration (Fig. 3.7, Table 3.3). Type 1
quartz-calcite boudinaged veins formed prior to D3NC and predate gold mineralization.
Type 2 quartz, calcite and quartz-calcite veins developed during D3NC and were
synchronous with Stage I gold mineralization. Type 3 quartz breccia veins developed
during late D3NC or post D3NC and crosscut Stage I gold mineralization. Type 4 sericite-
pyrite veins formed during D4NC and host Stage II gold mineralization.
3.4.2 Vein Mineralogy and Textures
Type 1 veins are foliation-parallel quartz-calcite veins, which occur in mylonites
and strongly foliated M1 plagioclase porphyries (Fig. 3.7a). Quartz and calcite grains
exhibit undulose extinction and have undergone complete dynamic recrystallization by
grain boundary migration and sub-grain rotation.
Type 2 veins comprise predominantly quartz and calcite with accessory pyrite
and ankerite. They may be parallel or perpendicular to S3NC foliation and are interpreted
to have formed synchronous with D3NC deformation, and therefore Stage I
mineralization, based on mutually cross-cutting relationships with the foliation planes in
veins that formed perpendicular to S3NC foliation (Fig. 3.7b). Vein density and
abundance increases with gold grade, as does pyrite abundance, with up to 10%
disseminated pyrite and 5-7% type 2 veins observed in higher grade zones. Type 2 veins
are typically surrounded by wide (20-50 mm) ankerite alteration zones and clusters of
large, inclusion-rich pyrite grains along the vein selvedges. These pyrite grains typically
exhibit a “dirty”, inclusion-rich core surrounded by a “clean”, inclusion-free rim.
Inclusions comprise abundant silicates, minor sulfides (galena, sphalerite), iron oxides
(magnetite, hematite, ilmenite) and rare gold blebs. Quartz grains in type 2 veins have
undergone partial dynamic recrystallization by grain boundary migration and sub-grain
rotation. Grain boundaries are commonly highly irregular and protrude into neighboring
grains, although the degree to which individual samples have been recrystallized varies.
Sub-grain development is minor and is predominantly concentrated along the outer vein

CHAPTER THREE: GEOLOGY OF THE NEW CELEBRATION GOLD DEPOSIT
43
Figure 3.7 Photographs of dominant vein types. A. Type 1 foliation-parallel quartz±calcite veins. B. Type
2 zoned quartz-calcite veins showing mutually cross-cutting relationship with S3NC foliation. C. Type 3
coarse-grained quartz veins cross-cutting contact between M2 quartz-feldspar porphyry and high Mg
basalt. D. Thin Type 4 sericite-pyrite veins in M2 quartz-feldspar porphyry.
Table 3.3 Summary of main vein type characteristics, deformation, structure and timing.
Vein Type
Deformation Event Timing Mineralogy Width
(mm) Mineralization Structure Alteration Halo
1 D2NC Syn-D2NC Quartz, carbonate 2-10 Deformed, boudinaged recrystallized veins parallel to D3NC foliation
Ankerite?
2 D3NC Syn-D3NC Quartz, calcite, pyrite
2-30 Py, Cpy, Sl, Gn, Au, Tell
Thin veins, show mutually cross-cutting relationships with D3NC foliation
Ankerite
3 D3NC or D4NC Late D3NC or D4NC. Cross-cut D3NC foliation
Quartz, (carbonate, sericite, pyrite)
5-50 Py, Form brittle vein arrays
None
4 D3NC or D4NC Late D3NC or D4NC. Cross-cut D3NC foliation
Sericite, pyrite 1-3 Py, Au Thin veinlets None

CHAPTER THREE: GEOLOGY OF THE NEW CELEBRATION GOLD DEPOSIT
44
edge. Relict grains locally exhibit undulose extinction and lattice-preferred orientation
(cf. Passchier and Trouw, 1996).
Type 3 veins comprise quartz, calcite and sericite with minor coarse-grained
subhedral to euhedral pyrite. The veins are composed almost entirely of coarse-grained
(1-5 mm) clear quartz overprinted by accessory calcite and rare sericite. The veins
brecciate the host M2 quartz-feldspar porphyries and crosscut S3NC foliation (Fig. 3.7c).
They can be distinguished from type 2 veins by their coarse grain size, minor amount of
calcite and lack of an alteration selvedge. Locally, some quartz grains within these veins
have diffuse and highly irregular grain boundaries indicating partial dynamic
recrystallization by grain boundary migration.
Type 4 veins, which host Fracture-style mineralization, are composed of sericite,
chlorite and pyrite, and form thin (1-2 mm) stringer veins (Fig. 3.7d). These veins are
only located in M2 quartz-feldspar porphyries. Where type 4 veins crosscut earlier
quartz breccia veins, they have generally developed along the quartz grain boundaries.
Pyrite occurs as large (up to 2 mm) subhedral to euhedral grains or as aggregates of fine
subhedral to euhedral crystals, and commonly contains abundant silicate and sulfide
inclusions. Pyrite hosts gold as rounded inclusions within grains and localized along
pyrite grain boundaries
3.5 Summary
Host rocks, vein and sulfide mineralogy and cross cutting relationships separate
gold mineralization at New Celebration into two distinct events: Stage I associated with
ductile strike-slip deformation at the BLFZ, after peak metamorphism, and Stage II
associated with brittle-ductile reactivation of the BLFZ.
Stage I gold mineralization took place after regional peak metamorphism during
D3NC deformation (Witt, 1993a; Copeland, 1998; Nichols, 2003) and formed within
ductile, oblique-slip, shear zones, hosted within magnetite-altered intermediate
composition plagioclase (M1) porphyry and mylonitized mafic schists. Gold
mineralization is associated with type 2 syn-deformational quartz-calcite-pyrite veins
and proximal biotite-albite-ankerite-sericite-pyrite alteration. Gold typically formed as
rounded blebs within deformed pyrite in textural equilibrium with D3NC foliation planes
and is commonly associated with both Au- and non Au-bearing tellurides. Vein
abundance and density and pyrite abundance increases with increasing gold grade

CHAPTER THREE: GEOLOGY OF THE NEW CELEBRATION GOLD DEPOSIT
45
within the ore zones, and the development of proximal alteration assemblages appears
to be directly correlated to the presence and abundance of type 2 veins.
The development of metamorphic magnetite in M1 porphyries and mafic schists
appears to be a significant factor in the development of gold mineralization in these
otherwise Fe-poor rocks during Stage I. The strong positive correlation between
increasing gold grade and modal pyrite abundance, and the replacement of metamorphic
magnetite with pyrite in M1 porphyries and mafic schists indicate that gold precipitated
by sulfidation of wall rock iron oxides. The development of metamorphic magnetite
enriched the host rock in iron, which facilitated the sulfidation process (cf. Phillips,
1986) and led to the development of Stage I gold mineralization
Stage II mineralization formed during brittle reactivation of the BLFZ during
late D3NC and early D4NC (Nichols, 2003). Gold mineralization is associated with the
emplacement of M2 quartz-Kspar phyric felsic porphyry into the BLFZ, which took
place after the onset of peak metamorphism, as evidenced by the lack of D3NC foliation
within the porphyry and the absence of metamorphic minerals (Nichols, 2003). Gold
formed at the contact between M2 porphyry and high-Mg basalt, and associated with
type 3 quartz and type 4 sericite-pyrite veins within the porphyry. Replacement of wall
rock oxides by pyrite in high-Mg basalt along the contacts of the porphyry indicate that
sulfidation reactions were a significant component in forming Stage II gold, at least for
Contact style mineralization.
Table 3.4 Summary and comparison of characteristics of Stage I and Stage II gold mineralization at New Celebration
Event Timing Structural Regime
Host Rocks Veins Grain Size
Alteration assemblage
Associated sulfides
Stage I D3NC Ductile M1 porphyry and mafic schist
type 2 qz-cc-py
1-2 µm
bio-ank-alb-ser-py
gn, cpy, po, sl
Stage II Late D3NC-D4NC
Brittle-ductile
M2 porphyry and high-Mg basalt-porphyry contact
type 3 qz and type 4 ser-py
250 µm
ank-ser-qz±cl
gn, cpy, sl
CHAPTER FOUR: INTEGRATED FLUID STUDY
46
4 CHAPTER FOUR: INTEGRATED FLUID STUDY Archean orogenic lode-gold deposits worldwide typically show a close spatial
relationship with first-order, crustal-scale shear zones (Eisenlohr et al., 1989; Neumayr
et al., 2000), however, at camp- to deposit- scales, , second- and third-order splays host
the majority of world class (>100t Au) orogenic lode gold deposits (Eisenlohr et al.,
1989; Groves, 1990). There has been very little research undertaken on the P-T-X-t
evolution of hydrothermal fluids in first order system, predominantly because they
mostly do not directly host gold mineralization , but is also due to the poor exposure of
first order fault systems. Given its location within the BLFZ, an interpreted first-order
crustal-scale fault zone spatially correlated with one giant and two world-class gold
camps, New Celebration provides a unique opportunity to study the P-T-X-t-d evolution
of hydrothermal fluids in a crustal-scale fault zone and evaluate the role regional
structures play in focusing mineralizing and non-mineralizing fluids.
The integrated fluid study of the New Celebration deposit was undertaken to: (1)
document the fluid evolution in pressure-temperature-composition (P-T-X) space of the
western segment of the Boulder Lefroy Fault Zone at the New Celebration gold deposit;
(2) establish a paleohydrothermal fluid model for the New Celebration gold deposit; (3)
characterize the metal content of mineralizing and non-mineralizing fluids at the New
Celebration gold deposit; and (4) evaluate potential fluid source(s) for both the
mineralizing and non-mineralizing fluids;.
4.1 Sample Selection, Preparation and Analytical Procedures
4.1.1 Sample Selection and Preparation
Seven diamond drill holes within the Hampton-Boulder and Jubilee open pits
and underground workings were logged and sampled for this study. The chosen holes
were selected because they intersected the hanging wall, ore zones and footwall at
depths from the present surface to 250 m below the pit floor, they all contained high-
grade (>3.0 g/t Au) ore zones and more than one mineralization style was represented in
each hole. Approximately 70 samples representing the different mineralization styles
and stages were collected for further analysis. Of these, 18 quartz and calcite vein
samples were prepared as 80 µm double-polished thick sections and then
petrographically examined for quartz textures and fluid inclusions. Six samples
representing type 1 (one), type 2 (two), type 3 (two) and quartz-carbonate alteration
CHAPTER FOUR: INTEGRATED FLUID STUDY
47
associated with Contact-style mineralization (one) contained fluid inclusions large
enough (>5 µm) to conduct detailed microthermometric and laser Raman analyses.
The samples were examined petrographically prior to microthermometric
analysis in order to categorize the morphology, distribution and relative timing of fluid
inclusions with respect to the host quartz and carbonate crystals. These petrographic
observations in conjunction with low-temperature microthermometry and laser Raman
analyses were used to determine the fluid inclusion types and to identify fluid inclusion
assemblages (Goldstein and Reynolds, 1994). Over 500 microthermometric
measurements on fluid inclusions were collected in quartz from type 2 quartz-calcite
veins, type 3 quartz veins, and from quartz alteration associated with Stage II gold
mineralization. Type 1 boudinaged veins contained only rare inclusions suitable for
analysis due to the almost complete dynamic recrystallization of the quartz. Suitable
inclusions in calcite (type 2 quartz-calcite veins) did not appear to have undergone any
post-entrapment modifications; therefore, they were also measured. Fluid inclusions in
all samples typically ranged in size from <1 µm to approximately 30 µm and varied in
morphology from highly irregular to rounded to negative crystal shaped.
4.1.2 Microthermometry Procedures
Microthermometric data were collected using a fully automated Linkham
THMSG heating and freezing stage, which has a temperature range of -196 °C to +600
°C. The stage was calibrated against the melting point of pure CO2 (-56.6 °C) and pure
H2O (0.0 °C), and the critical point of pure H2O (374.1 °C) using SynFlinc synthetic
fluid inclusion standards. Accuracy of the stage during low-temperature (<32 °C)
measurements was between ± 0.1 °C and ±0.4 °C and during high temperature
measurements (>100 °C) was ±4.0 °C, while precision was to 0.1 °C at all temperatures.
In order to observe low temperature phase transitions in all inclusion types, inclusions
were first super-cooled to around -50 °C for aqueous inclusions, -110 °C for carbon
dioxide bearing inclusions and -196 °C for methane inclusions, then reheated slowly at
1 °C/minute near expected phase transitions. During heating experiments, fluid
inclusion chips were heated at 5 °C/minute below 200 °C and 1 °C/minute above 200
°C.
Data collected included homogenization temperature of CH4 (Th CH4), melting
and homogenization temperatures of CO2 (TmCO2 and ThCO2, respectively), eutectic
temperature (TE), ice melting temperature (TmICE), clathrate melting temperature

CHAPTER FOUR: INTEGRATED FLUID STUDY
48
(TmCLATH), total homogenization temperature of the inclusion (ThTOT ), and
decrepitation temperature (ThDECREP). The cycling technique of Goldstein and Reynolds
(1994) was employed during heating and freezing experiments in order to obtain
accurate phase transition temperatures. Salinity ( wt.% NaCl equiv.), bulk composition
and density were calculated using MacFlinCor (Brown and Hagemann, 1995) and the
equations of state for H2O-NaCl-KCl (Bodnar and Vityk, 1994) , and H2O-CO2-CH4-
NaCl and CO2-CH4 (Jacobs and Kerrick, 1981). The graphical methods of Swanenberg
(1979) and Thiery et al. (1994) were used to estimate the molar proportions of CO2 and
CH4. Laser Raman spectroscopy was used to quantify the content of the gas phases in
types I (methane), II (aqueous-carbonic) and III (carbonic) inclusions, and to identify
the nature of the daughter crystals. The relative proportions of CO2 and CH4 are
reported in mole percent (%) and density is reported in grams per cubic centimeter
(g/cm3).
4.1.3 Laser Raman Procedures
Laser Raman spectra of fluid inclusions were recorded at Geoscience Australia
on a Dilor SuperLabram spectrometer equipped with a holographic notch filter, 600
and 1800 g/mm gratings, and a liquid N2 cooled, 2000 x 450 pixel CCD detector. The
inclusions were illuminated with 514.5 nm laser excitation from a Melles Griot 543
argon ion laser, using 5 mW power at the samples, and a single 30 second accumulation.
A 100X Olympus microscope objective was used to focus the laser beam and collect the
scattered light. The focused laser spot on the samples was approximately 1 m in
diameter. Wave numbers are accurate to 1 cm-1 as determined by plasma and neon
emission lines. For the analysis of CO2, O2, N2, H2S and CH4 in the vapor phase, spectra
were recorded from 1000 to 3800 cm-1 using a single 20 second integration time per
spectrum. The detection limits are dependent upon the instrumental sensitivity, the
partial pressure of each gas, and the optical quality of each fluid inclusion. Raman
detection limits (Wopenka and Pasteris, 1987) are estimated to be around 0.1 mole
percent for CO2, O2 and N2, and 0.03 mole percent for H2S and CH4 and errors in the
calculated gas concentrations are generally less than 1 mole percent.
4.1.4 In Situ Fluid Inclusion Laser Ablation-ICP-MS Procedures
Selected single H2O-CO2 and H2O-rich fluid inclusions from types 2 and 3 veins
and quartz alteration were analyzed by laser ablation inductively coupled mass
spectrometry at the University of Leeds using an ArF 193nm Geolas Q Plus excimer

CHAPTER FOUR: INTEGRATED FLUID STUDY
49
laser equipped with imaging optics (Gunther et al., 1997; Gunther et al., 1998). Double
polished thick section fluid inclusion wafers were glued onto glass slides and placed
into the sample chamber, which was evacuated of air then filled with He. Samples were
analyzed over a 90-second collection time, during which several inclusions could be
breached and analyzed. Dwell times were varied according to the number of elements
analysed in any given analysis, from 0.10 seconds (Na, Mg, K, Cu, Zn, Sr, Ag, Ba, Pb),
0.15 seconds (Na, K, Mn, As, Sb, Bi), 0.30 seconds (Au) and 0.40 seconds (Au). The
entire contents of the inclusion (liquid and solid daughter crystals) were transported to
the plasma as an aerosol using He carrier gas, then the samples were analyzed with an
Agilent 7500c quadrupole ICP-MS equipped with an octopole reaction cell. Fluid
inclusion analyses were calibrated using NIST SRM 610 and 612, an in-house EMPA
glass standard and glass capillaries filled with standard solutions. Signal data were
processed using a graphical user-interfaced software package developed at the
University of Leeds (Allan et al., 2005). In order to ensure that the results represented
the fluid inclusion contents and not host vein mineral concentrations, only spectra with
coincident Na and other cation peaks were processed. Inclusion-free quartz was check
analyzed for interference and produced no signal. The absolute element concentrations
of fluids in individual fluid inclusions were determined by charge balancing against the
H2O-NaCl equivalent chloride molality of each fluid inclusion population, as
determined by microthermometric heating/freezing experiments prior to the laser ICP-
MS analysis. Analytical precision for most elements is typically between 15 and 30%
RSD (relative standard deviation). Detection limits vary according to inclusion volume
but for most elements is 1 to 100µg/g. For a detailed description of the laser ICP-MS
analytical process refer to Allan et al. (2005).
4.2 Fluid Inclusion Petrography
4.2.1 Fluid Inclusion Classifications and Assemblages
Fluid inclusions are classified according to their origin as primary, secondary or
pseudosecondary (Roedder, 1979, 1984). Primary fluid inclusions are those whose
origins can be unequivocally tied to the formation of a crystal growth zone. Secondary
inclusions form as planar arrays or trails within healed microfractures that cross cut
crystal growth zones and grain boundaries. Pseudosecondary inclusions are essentially
identical to secondary inclusions except that they do not cross cut all mineral growth
zones or grain boundaries.

CHAPTER FOUR: INTEGRATED FLUID STUDY
50
A fluid inclusion assemblage (FIA, Goldstein and Reynolds, 1994) comprises a
finely discriminated group of petrographically related inclusions that can be
demonstrated to have formed at the same time. The purposes of measuring fluid
inclusions within the context of FIA’s are twofold: (1) it allows for the identification of
post entrapment modifications to inclusions such as necking or thermal reequilibration,
which may render the microthermometric data uninterpretable, and (2) it is vital to the
identification of contemporaneously trapped immiscible fluids. The best examples of
FIA’s are secondary or pseudosecondary inclusions within a single healed fracture, or
primary inclusions within a crystal growth zone. For a more detailed description of fluid
inclusion petrography and the concept of fluid inclusion assemblages see Goldstein and
Reynolds (1994) and Reynolds (2003).
4.2.2 Fluid Inclusion Types
Fluid inclusions are abundant in quartz and calcite and occur as clusters within
single grains and along healed fractures both entirely within and cross-cutting grain
boundaries. Detailed petrography of fluid inclusions trapped in type 2 zoned quartz-
carbonate veins in Porphyry- and Mylonite- style mineralization samples, quartz-calcite
alteration associated with Contact-style mineralization, and type 3 quartz breccia veins
in Fracture-style mineralization samples revealed four inclusion types, which were
classified according to their phase ratios at room temperature: (I) CH4, (II) H2O-CO2,
(III) CO2-rich, and (IV) H2O-rich (Figure 4.1). These inclusion types were further
subdivided based on their behavior during heating and freezing runs and their
composition. Phase ratios of liquid water (LW), carbonic liquid (LC) and vapor at room
temperature (~22 °C) were estimated visually using the volumetric chart of Shepherd et
al. (1985). Microthermometry and laser Raman spectroscopy determined fluid inclusion
composition.
Type I CH4 inclusions are dark, generally rounded, and are always monophase at
room temperature. These inclusions are subdivided further based on their mode of
occurrence. Type Ia inclusions occur as clusters of small (~10 µm), negative crystal
shaped inclusions, and are restricted to the calcite selvedge of type 2 zoned quartz-
carbonate veins related to Stage I gold mineralization. Type Ib inclusions are ubiquitous
to both gold mineralizing events and occur as secondary trails of large (10-30 µm)
irregular inclusions, elongate in the trail orientation, in both type 2 and 3 veins. Laser
Raman analysis confirmed these as CH4±C2H6±C3H8 inclusions.

CHAPTER FOUR: INTEGRATED FLUID STUDY
51
Type II H2O-CO2 inclusions are two- or three-phase at room temperature, and
are the most common inclusion type in both type 2 and type 3 veins and quartz-
carbonate alteration. They are typically small, ranging in size from 5-15 µm, and are
usually sub-rounded, except when they occur in calcite, where they are negative-crystal
shaped. Type II inclusions are trapped as clusters or internal trails that do not cross-cut
grain boundaries and are therefore considered pseudo-secondary. They typically display
constant phase ratios between CO2 and H2O of 0.3 to 0.4 in a single trail or cluster
within Type 2 veins, but have varied phase ratios, from 0.2 to 0.9 within a single trail or
cluster in Type 3 veins.
Type III CO2-rich inclusions are one- or two-phase at room temperature. They
are ovoid to sub rounded, typically occur in clusters or trails that cross cut grain
boundaries and are interpreted as secondary in origin. Inclusions range in size from 5-10
µm. Within a single trail or cluster, two-phase inclusions display constant phase ratios
around 0.9. Although these inclusions are described as H2O absent, they may contain up
to 20 percent invisible H2O in a thin film along inclusion walls (Roedder, 1972).

CHAPTER FOUR: INTEGRATED FLUID STUDY
52
Figure 4.1 Fluid inclusion photomicrographs from representative samples at New Celebration. A. Clusters
of negative crystal shaped methane fluid inclusions in calcite from type 2 quartz-calcite veins. B.
Irregularly shaped, single phase (at room temperature) methane inclusions in quartz from type 2 quartz-
calcite vein. C. Cluster of type II aqueous-carbonic inclusions in quartz from type 2 veins. Two inclusions
contain a tiny rounded or triangular opaque daughter crystal. D. Transparent nahcolite (NaHCO3)
daughter crystal in type II aqueous-carbonic inclusions in quartz from type 2 vein. E. Type III CO2-
dominant inclusion from quartz-calcite alteration associated with Contact-style mineralization. F.
Secondary trail of type IV high salinity aqueous fluid inclusions in quartz from type 3 veins and quartz-
calcite alteration. In both vein types approximately 30% of inclusions contain tiny (<1 µm) rounded,
cubic or triangular opaque daughter crystals of unknown compositions and rarely (<5%) may contain
larger (up to 5 µm) ovoid or rod-shaped transparent nahcolite (NaHCO3, determined by laser Raman
analysis) daughter crystals.

CHAPTER FOUR: INTEGRATED FLUID STUDY
53
Type IV H2O-rich aqueous inclusions are two-phase at room temperature. Some
inclusions in type 3 veins contain small amounts (less than 2.2 molal, (Ellis and
Golding, 1963; Roedder, 1984; Hedenquist and Henley, 1985) dissolved CO2,
evidenced by the formation of clathrate during freezing experiments and a double jerk
of the bubble during freezing cycles despite the absence of a separate liquid carbonic
phase at temperatures below the CO2 critical point. Distribution and occurrence of the
aqueous inclusions defined two inclusion populations: (1) irregularly shaped inclusions
containing rare opaque daughter minerals that were observed in either clusters or trails
within single crystals, which were interpreted as pseudosecondary, and (2) rounded to
ovoid shaped inclusions that occupied extensive fracture zones that cross cut quartz
grain boundaries and formed broad secondary trails. Inclusions of both populations are
typically very small (1-10 µm) and contain between 5 and 10 percent vapor.
4.3 Relative Timing Constraints
The relative timing relationships of fluid inclusion assemblages were
constrained based on cross-cutting relationships between host veins and structural
fabrics described in Chapter 3, and between cross-cutting relationships of various fluid
inclusion trails and clusters.
The earliest observed inclusion assemblages are interpreted to be those that are
located in the calcite margins of zoned type 2 quartz-calcite veins. These comprise type
I CH4 inclusions and type II H2O-CO2 inclusions, both of which form discrete clusters.
Assemblages of both fluid inclusion types formed in the calcite selvedge of zone quartz-
calcite veins associated with Porphyry style mineralization. Although there are no direct
cross-cutting relationships observed between assemblages of these fluid inclusion types,
the location of these assemblages in the calcite selvedge of the earliest studied vein
suggests that paragenetically they pre-date all other observed fluid inclusion
assemblages.
Assemblages of aqueous-carbonic and aqueous inclusion, which were trapped in
pseudosecondary trails and clusters in type 2 quartz-calcite veins within M1 porphyries,
are interpreted to post-date the assemblages trapped in the calcite selvedge of the same
veins as the zoning of these type 2 veins would suggest that the calcite selvedge formed
before the quartz.
Assemblages of aqueous-carbonic inclusions forming pseudosecondary trails
and clusters, and assemblages of carbonic only inclusions forming in M2 porphyry-
CHAPTER FOUR: INTEGRATED FLUID STUDY
54
hosted type 3 veins are interpreted to post-date assemblages trapped in type 2 veins.
This is based on the observations that (1) M2 porphyries cross cut M1 porphyries, and
(2) type 3 veins cross cut D3NC foliation whereas type 2 veins are deformed by D3NC
foliation. The timing relationship between the aqueous-carbonic and the carbonic
assemblages cannot be determined as cross cutting relationships were not observed.
Assemblages comprising secondary trails of H2O-rich inclusions crosscut the aqueous-
carbonic and carbonic inclusion assemblages in both type 2 and 3 veins, and in quartz
and calcite alteration associated with Stage II Contact-style gold mineralization and are
therefore interpreted to post-date these assemblages. Secondary trails of CH4-rich
inclusions crosscut all other inclusion assemblages and are the latest inclusion
assemblages observed.
4.4 Microthermometry and Laser Raman Results
Microthermometric results were obtained for fluid inclusions within
petrographically defined fluid inclusion assemblages (Goldstein and Reynolds, 1994)
and are summarized in Table 4.1 and Figures 4.2 and 4.3. Where more than one
assemblage is measured, data are reported as ranges of means ± 1σ. All data are
contained in Appendices IV and V.
4.4.1 Type 1 CH4 Inclusions
Methane inclusions in calcite and quartz did not freeze at the lower temperature
limit of the Linkham stage (-196 °C). Primary inclusions in the calcite selvedge of type
2 veins formed a vapor bubble at low temperatures (-100 °C) ; upon warming these
inclusions homogenized to liquid between -76 °C and -73 °C (n=4). The composition of
these inclusions was not confirmed by laser Raman analysis. Secondary methane
inclusions in types 2 and 3 quartz veins also formed a vapor bubble at low temperatures,
but in contrast to the primary calcite-hosted inclusions, homogenized to liquid at around
-90 °C (n=5). Laser Raman analyses on secondary quartz-hosted inclusions confirmed
them as methane-dominant (95-100 mole % CH4) with minor N2 (up to 3 mole %) and
trace (1 mole %) C2H6 (ethane) and C3H8 (propane). These inclusions had densities of
0.26 ±0.00 g/cm3 (n=5) (Table 4.1).
4.4.2 Type 2 H2O-CO2 Inclusions
Aqueous-carbonic inclusions in the calcite selvedge of type 2 veins either
homogenized to liquid (ThTOT (L)) at 270 °C ± 1.0 °C (n=3) or decrepitated via

CHAPTER FOUR: INTEGRATED FLUID STUDY
55
expansion of the vapor phase (ThCREP (V)) at 267 °C ± 0.4 °C (n=5). Melting of the
carbonic phase (TmCO2) ranged between -56.8 °C and -56.6 °C (n=9) (Fig. 4.2)
indicating that the gas phase comprised nearly pure CO2. Clathrate melting temperatures
(TmCLATH) ranged between 7.6 and 9.3 °C (n=9) (Fig. 4.3), giving calculated salinities
between 1.4 and 4.6 weight percent NaCl equivalent. In aqueous-carbonic inclusions
methane forms mixed hydrates with CO2. These hydrates have a higher Tm than CO2
clathrate, which gives a higher estimate when calculating salinity solely using clathrate
melting temperature (Collins, 1979), however, MacFlinCor (Brown and Hagemann,
1995), using the equations of state of Swanenberg (1979) and
Table 4.1 Summary of fluid inclusion microthermometric and laser Raman data from types 1, 2 and 3
veins. Salinities are reported as weight percent NaCl equivalent.
Type I CH4
Type II H2O-CO2-CH4-NaCl
Type III CO2-CH4
Type IV H2O
Type
1
Qua
rtz
Pseudosecondary TmCO2: -56.6 °C ThCO2: 28.1±1.0 °C XCH4: 0 mole% Bulk Density: 0.64 ± 0.05 g/cm4
Pseudosecondary H2O-NaCl TmICE: -7.8 °C ± 0.9 °C to -7.6 °C ± 1.2 °C ThTOT (L): 173.0 °C ± 29.2 °C to 192.0 °C ± 14.1 °C Salinity: 11.17 ± 1.59 to 11.39 ± 1.09 wt.% Bulk Density: 0.96 ± 0.2 to 0.97 ± 0.2 g/cm3
Type
2
Cal
cite
Pseudosecondary ThTOT (L): -76.4 – -73.0 °C
Pseudosecondary TmCO2: -56.73 °C±0.05 °C ThCO2: 29.58 °C±0.68 °C TmCLATH: 8.64 °C±0.53 °C ThDECREP (V): 267..23 °C ± 0.40 °C ThTOT (L): 269.58 °C ± 1.01 °C Salinity: 2.67 ± 0.99 wt.% XCO2: 16 ± 6 mole% XCH4: 0 mole% Bulk Density: 0.78± 0.04 g/cm3
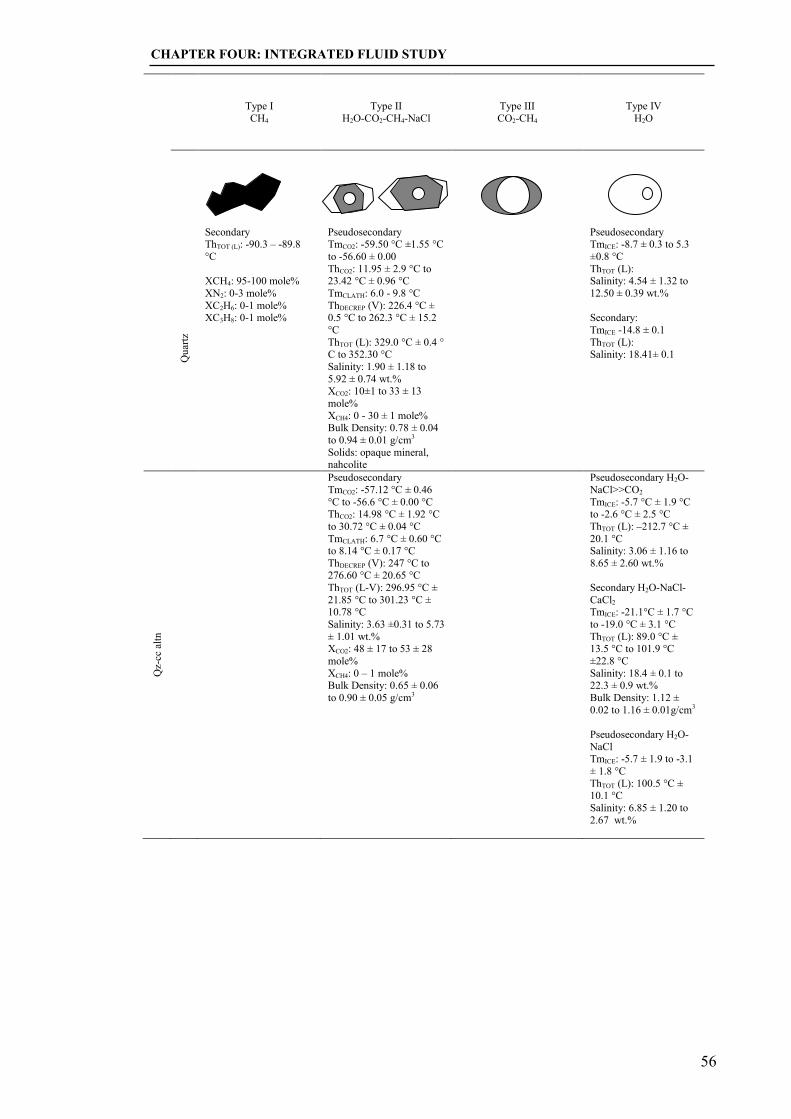
CHAPTER FOUR: INTEGRATED FLUID STUDY
56
Type I CH4
Type II H2O-CO2-CH4-NaCl
Type III CO2-CH4
Type IV H2O
Qua
rtz
Secondary ThTOT (L): -90.3 – -89.8 °C XCH4: 95-100 mole% XN2: 0-3 mole% XC2H6: 0-1 mole% XC3H8: 0-1 mole%
Pseudosecondary TmCO2: -59.50 °C ±1.55 °C to -56.60 ± 0.00 ThCO2: 11.95 ± 2.9 °C to 23.42 °C ± 0.96 °C TmCLATH: 6.0 - 9.8 °C ThDECREP (V): 226.4 °C ± 0.5 °C to 262.3 °C ± 15.2 °C ThTOT (L): 329.0 °C ± 0.4 ° C to 352.30 °C Salinity: 1.90 ± 1.18 to 5.92 ± 0.74 wt.% XCO2: 10±1 to 33 ± 13 mole% XCH4: 0 - 30 ± 1 mole% Bulk Density: 0.78 ± 0.04 to 0.94 ± 0.01 g/cm3
Solids: opaque mineral, nahcolite
Pseudosecondary TmICE: -8.7 ± 0.3 to 5.3 ±0.8 °C ThTOT (L): Salinity: 4.54 ± 1.32 to 12.50 ± 0.39 wt.% Secondary: TmICE -14.8 ± 0.1 ThTOT (L): Salinity: 18.41± 0.1
Qz-
cc a
ltn
Pseudosecondary TmCO2: -57.12 °C ± 0.46 °C to -56.6 °C ± 0.00 °C ThCO2: 14.98 °C ± 1.92 °C to 30.72 °C ± 0.04 °C TmCLATH: 6.7 °C ± 0.60 °C to 8.14 °C ± 0.17 °C ThDECREP (V): 247 °C to 276.60 °C ± 20.65 °C ThTOT (L-V): 296.95 °C ± 21.85 °C to 301.23 °C ± 10.78 °C Salinity: 3.63 ±0.31 to 5.73 ± 1.01 wt.% XCO2: 48 ± 17 to 53 ± 28 mole% XCH4: 0 – 1 mole% Bulk Density: 0.65 ± 0.06 to 0.90 ± 0.05 g/cm3
Pseudosecondary H2O-NaCl>>CO2 TmICE: -5.7 °C ± 1.9 °C to -2.6 °C ± 2.5 °C ThTOT (L): –212.7 °C ± 20.1 °C Salinity: 3.06 ± 1.16 to 8.65 ± 2.60 wt.% Secondary H2O-NaCl-CaCl2 TmICE: -21.1°C ± 1.7 °C to -19.0 °C ± 3.1 °C ThTOT (L): 89.0 °C ± 13.5 °C to 101.9 °C ±22.8 °C Salinity: 18.4 ± 0.1 to 22.3 ± 0.9 wt.% Bulk Density: 1.12 ± 0.02 to 1.16 ± 0.01g/cm3
Pseudosecondary H2O-NaCl TmICE: -5.7 ± 1.9 to -3.1 ± 1.8 °C ThTOT (L): 100.5 °C ± 10.1 °C Salinity: 6.85 ± 1.20 to 2.67 wt.%

CHAPTER FOUR: INTEGRATED FLUID STUDY
57
Type I CH4
Type II H2O-CO2-CH4-NaCl
Type III CO2-CH4
Type IV H2O
Type
3
Pseudosecondary TmCO2: -57.82 °C ± 0.04 to -56.6 °C ThCO2: 14.90 °C ± 0.83 °C to 29.20 °C ± 2.08°C TmCLATH: 7.00 °C ± 0.10 ° C to 8.60 °C ± 0.41 °C ThDECREP (V): 247.0 °C to 276.6 ± 20.65 °C ThTOT (L-V): 297.0 °C ± 21.90 to 301.23 °C ± 10.78°C Salinity: 4.97 ±0.54 to 5.68 ± 0.17 wt.% XCO2: 16± 3 to 26 ± 8 mole% XCH4: 0 – 1 mole% Bulk Density: 0.74 ± 0.11 to 0.95 ± 0.01 g/cm3
Primary & pseudosecondary TmCO2: -57.0 ± 0.2 to -56.6 °C ThCO2: 10.3 °C ± 3.1 °C to 28.1 °C ± 1.0 °C XCH4: 0 – 3 mole% Bulk Density: 0.72 ± 0.03 to 0.85 ± 0.05 g/cm3
Pseudosecondary TmICE: -5.7 ± 1.9 to -3.1 ± 1.8 °C ThTOT (L): 100.5 °C ± 10.1 °C Salinity: 6.85 ± 1.20 to 2.67 wt.% Secondary H2O-NaCl-CaCl2 TmICE: -19.0°C ± 3.1 °C ThTOT (L Salinity: 21.0 ± 1.9 wt % Bulk Density:
Thiery et al. (1994) take the molar proportion of CH4 into account when calculating
salinity therefore providing an accurate representation of salinity in the system H2O-
CO2-NaCl-CH4. The CO2 phase homogenized to liquid between 29 and 31 °C (n=9)
(Fig. 6). Inclusions contained between 8 and 27 mole percent CO2 and have calculated
bulk densities ranging between 0.73 and 0.86 g/cm3 (Table 4.1). In both types 2 and 3
veins and quartz-calcite alteration most of the aqueous-carbonic inclusions decrepitated
before final homogenization. In type 2 veins, inclusions invariably decrepitated via
expansion of the vapor phase at temperatures ranging from 226 °C ± 1 °C to 277 °C ± 0
°C. In type 3 veins, fluid inclusions decrepitated by expansion of either the liquid or
vapor phase at temperatures between 247 °C ± 0.00 °C and 277 °C ± 21 °C. In one
assemblage in quartz-calcite alteration, inclusions decrepitated by expansion of either
the liquid or the vapor phase at 186 °C ± 0 °C. Where inclusions homogenized,
homogenization
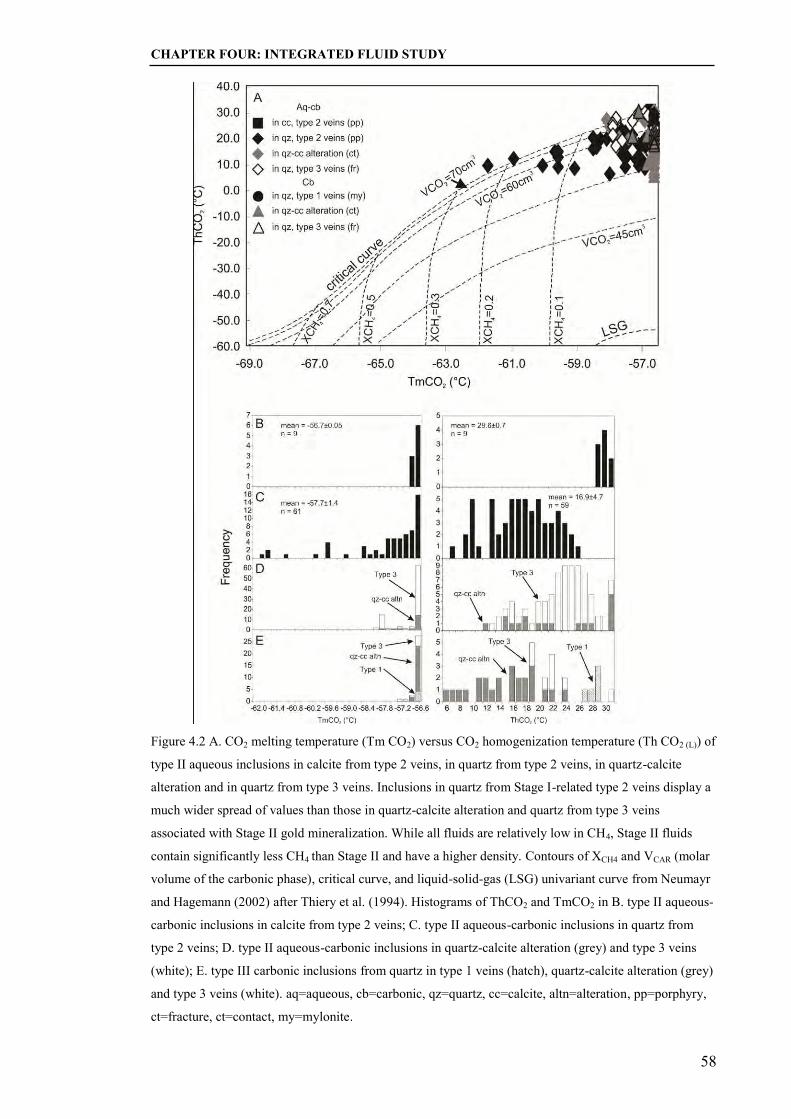
CHAPTER FOUR: INTEGRATED FLUID STUDY
58
Figure 4.2 A. CO2 melting temperature (Tm CO2) versus CO2 homogenization temperature (Th CO2 (L)) of
type II aqueous inclusions in calcite from type 2 veins, in quartz from type 2 veins, in quartz-calcite
alteration and in quartz from type 3 veins. Inclusions in quartz from Stage I-related type 2 veins display a
much wider spread of values than those in quartz-calcite alteration and quartz from type 3 veins
associated with Stage II gold mineralization. While all fluids are relatively low in CH4, Stage II fluids
contain significantly less CH4 than Stage II and have a higher density. Contours of XCH4 and VCAR (molar
volume of the carbonic phase), critical curve, and liquid-solid-gas (LSG) univariant curve from Neumayr
and Hagemann (2002) after Thiery et al. (1994). Histograms of ThCO2 and TmCO2 in B. type II aqueous-
carbonic inclusions in calcite from type 2 veins; C. type II aqueous-carbonic inclusions in quartz from
type 2 veins; D. type II aqueous-carbonic inclusions in quartz-calcite alteration (grey) and type 3 veins
(white); E. type III carbonic inclusions from quartz in type 1 veins (hatch), quartz-calcite alteration (grey)
and type 3 veins (white). aq=aqueous, cb=carbonic, qz=quartz, cc=calcite, altn=alteration, pp=porphyry,
ct=fracture, ct=contact, my=mylonite.

CHAPTER FOUR: INTEGRATED FLUID STUDY
59
Figure 4.3 Histograms of TmCLATH or TmICE for A) primary type II aqueous-carbonic inclusions in calcite
from type 2 veins; B) type II aqueous-carbonic inclusions in quartz from type 2 veins; C) type II aqueous-
carbonic inclusions in quartz-calcite alteration (grey) and type 3 veins (white); D) type IV aqueous
inclusions with trace CO2 in quartz-calcite alteration (grey) and type 3 veins (white); E) type IV low
salinity aqueous inclusions without CO2 in type 1 veins (hatch), quartz in type 2 veins (black)and type 3
veins (white); and F) secondary type IV high salinity aqueous inclusion from quartz in type 2 veins
(black), quartz-calcite alteration (grey) and type 3 veins (white). Qz-cc altn=quartz-calcite alteration.
occurred between 329 °C ± 0.4 °C and 352 °C in inclusion assemblages in type 2 veins,
297 °C ± 22 °C and 301 °C ± 11 °C in type 3 vein assemblages and at 304 °C ± 17 °C in
quartz-calcite alteration. Melting of the carbonic phase (TmCO2) in inclusions from type
2 veins occurred at slightly lower temperatures (-59.5 °C ± 1.6 °C to -56.6 °C ± 0.0 °C)
than inclusions in quartz-calcite alteration and type 3 veins (-57.8 °C ± 0.04 °C to -56.6
°C) (Fig. 4.2), which indicates they contained higher concentrations of other gases, such
as methane. Laser Raman analysis, which identified up to 39 mole% CH4 in aqueous-
carbonic inclusions from type 2 veins, confirmed this (Table 4.1). Homogenization of
the carbonic phase to liquid occurred from 12.0 °C ± 1.6 °C to 23.4 °C ±1.0 °C in
inclusions in type 2 veins and 14.9 °C ± 0.8 °C to 30.7 °C ± 0.04 °C in inclusions
hosted in quartz-calcite alteration and type 3 veins (Fig. 4.2, Table 4.1). Fluid densities,
calculated using the graphical methods of Swanenberg (1979) ranged between 0.65
g/cm3 ± 0.06 g/cm3 and 0.95 g/cm3 ±0.01 g/cm3, although inclusions in type 2 veins had
a narrower range (Table 4.1). Final clathrate melting temperatures ranged between 6.9
C° ± 0.4 °C and 9.1 °C ± 0.6 °C (Fig. 4.3) in assemblages from both vein types and
CHAPTER FOUR: INTEGRATED FLUID STUDY
60
quartz-calcite alteration, equating to average salinities between 1.9 ± 1.2 weight percent
NaCl and 5.9 ± 0.7 weight percent NaCl equivalent, calculated using MacFlinCor
(Brown and Hagemann, 1995) and the equation of state for H2O-CO2-CH4-NaCl (Jacobs
and Kerrick, 1981). Where recorded, eutectic temperatures, which were difficult to
measure given the small size and dark color of the inclusions, were around -85 °C,
indicating the presence of cations other than Na+.
Type II inclusions commonly contained nahcolite and/or opaque daughter
crystals. Neither of these minerals showed any change in their shape during heating
experiments.
4.4.3 Type III CO2-Rich Inclusions
In assemblages of CO2-rich inclusions from type 3 veins, melting temperatures
of the carbonic phase ranged from -57.0 °C ± 0.2 °C to -56.6 °C (Fig. 4.2) indicating
that the inclusions were essentially almost pure CO2. Homogenization temperatures
(ThCO2) ranged from 10.3 °C ± 3.1 °C to 28.1 °C ± 1.0 °C (Fig. 4.2), although most of
the inclusions returned ThCO2 values > 18 °C. Calculated densities of the carbonic phase
varied from 0.64 g/cm3 ± 0.05 g/cm3 to 0.85 g/cm3 ±0.05 g/cm3. Methane contents
ranged between 0 and 3 mole percent CH4 (Table 4.1).
4.4.4 Type IV H2O-Rich Inclusions
Assemblages of aqueous inclusions containing trace dissolved CO2 (as
evidenced by the formation of clathrate during freezing measurements) in quartz-calcite
alteration and type 3 veins displayed eutectic temperatures (TE) between -20 °C and -24
°C indicating that the fluids were H2O-NaCl dominated (Borisenko, 1977; Crawford,
1981). All but three inclusions homogenized to liquid between 140 °C and 267 °C. The
remaining inclusions decrepitated via expansion of the liquid phase at 229 °C and 236
°C or via expansion of the vapor phase at 252 °C. Ice melting temperatures ranged
between -5.7 °C ± 1.9 °C and -2.6 °C ±2.5 °C (Fig. 4.3). The presence of CO2 affects
the salinity measurements, as low levels of CO2 will depress the ice melting temperature
by up to 1.5 °C (Hedenquist and Henley, 1985), however, clathrate melting
temperatures in the absence of liquid CO2 invalidate salinity calculations using TmCLATH
(Diamond, 1992). Calculated apparent salinities (maximum salinity) of type IIb
inclusions ranged between 3.06 ± 1.16 weight percent NaCl equivalent and 8.65 ± 2.60
weight percent NaCl equivalent and fluid densities ranged between 0.89 ± 0.04 g/cm3
and 0.91 ± 0.9 g/cm3 (Table 4.1).

CHAPTER FOUR: INTEGRATED FLUID STUDY
61
Pseudosecondary aqueous inclusions without dissolved CO2 also had eutectic
temperatures around -20 °C, indicating that these fluids were also within the H2O-NaCl
system. Ice melting temperature of inclusions in type 2 quartz veins ranged between -
8.7 °C ± 0.3 °C and -5.3 °C ± 0.8 °C (Fig. 4.3) correlating to calculated salinities
between 4.54 ± 1.32 and 12.5 ± 0.39 weight percent NaCl equivalent and densities
between 0.85 ± 0.08 g/cm3 and 0.97 ± 0.02 g/cm3. In type 3 quartz veins, final
homogenization occurred at much lower temperatures, at 100.5 °C ± 10.1 °C, in the
only assemblage upon which ThTOT was collected. Ice melting temperatures ranged
between -5.7 °C ± 1.9 °C and -3.1 °C ± 1.8 °C (Fig. 4.3). Calculated salinities ranged
between 6.85 ± 1.20 to 6.03 ± 2.67 weight percent NaCl equivalent. densities in all
assemblages clustered around 0.97 ± 0.01 g/cm3 (Table 4.1).
Secondary H2O-rich inclusions in both types 2 and 3 veins had eutectic
temperatures around -55 °C placing them in the H2O-NaCl-CaCl2 system (Borisenko,
1977; Crawford, 1981). Inclusions in all assemblages homogenized to liquid at
temperatures between 89.0 °C ± 13.5 °C and 101.9 °C ± 22.8 °C. Ice melting
temperatures in type 3 veins ranged between -21.1 °C ± 1.7 and -17.7 °C ± 1.7 °C, but
were slightly higher in type 2 veins(Fig. 4.3). Calculated salinities ranged between 18.4
± 0.1 weight percent NaCl equivalent and 22.3 ± 0.9 weight percent NaCl equivalent
and densities between 1.12 g/cm3 ± 0.02 g/cm3 and 1.16 g/cm3 ± 0.01 g/cm3 (Table
4.1).
4.4.5 Interpretation of Laser Raman and Microthermometry Results
4.4.5.1 Evidence for Fluid Immiscibility
Given the broad two-phase field in the H2O-CO2-NaCl system (Takenouchi and
Kennedy, 1965; Gehrig et al., 1980), it is important to determine whether the different
fluid inclusion assemblages observed at New Celebration could have resulted from
phase immiscibility processes. This may occur as a consequence of sudden pressure
reduction due to fault movement (Cox et al., 1995), fluids ascending to higher crustal
levels or fluid interaction with carbon (Naden and Shepherd, 1989). Fluid inclusions in
the CO2-H2O system were either trapped from a homogeneous fluid in the single phase
field, or they were trapped from a heterogeneous fluid in the two-phase field (Diamond,
2001). In theory, the state of entrapment of cogenetically trapped inclusions should be
readily distinguishable by applying the principle of uniformity of phase volume
proportions (Sorby, 1858; Roedder, 1984). Inclusions trapped contemporaneously in
CHAPTER FOUR: INTEGRATED FLUID STUDY
62
the single phase field should have similar compositions, bulk molar volumes and phase
proportions. Conversely, inclusions trapped in the two phase field will show highly
variable bulk compositions, bulk molar volumes and phase proportions (Loucks, 2000;
Diamond, 2001).
Within individual fluid inclusion assemblages, Type II inclusions in type 2 veins
show very little variation of phase proportions, bulk composition or molar volume.
Inclusions within individual assemblages do not display liquid-rich and vapour-rich
end-members, suggesting that phase separation did not occur (c.f. Diamond, 2001) and
was not a factor in the development of Stage I gold mineralization.
Phase proportions, bulk compositions and molar volumes of Type II inclusions
in Stage II mineralisation show more diversity within a single cluster or trail than those
trapped in Stage I. In locations where both liquid-rich and vapor-rich fluid inclusions
occur in a cogenetic assemblage, Ramboz et al. (1982) have outlined three criteria to
determine whether phase separation has taken place. These are:
(1) “The two types of inclusions must occur in the same regions of the same
sample” i.e. the same internal trail or three-dimensional cluster, “and there must
be good evidence for their contemporaneous trapping”.
(2) “The two types of inclusions must homogenise at the same temperature, or more
realistically within the same range of temperature (because trapping is not an
instantaneous and strictly isothermal-isobaric process). One type must
homogenize into a liquid (V + L→L), the other must homogenize into a vapor
(V + L→V)”.
(3) “Upon heating, the pressures in the two types of inclusions before
homogenization are different (because of the difference in their compositions
and densities). The pressures reach the same value (trapping pressure) at
homogenization temperature. Therefore, if one inclusion type decrepitates
before homogenizing, the other type must behave similarly.”
Most inclusion assemblages in type 3 veins and quartz-calcite alteration
contained only liquid-rich aqueous-carbonic inclusions, which could possibly represent
the parental, unmodified hydrothermal fluid (c.f. Robert and Kelly, 1987), however, at
least six assemblages displayed liquid and vapor-rich inclusions within the same trail or
cluster. Aqueous-carbonic inclusion assemblages from Stage II-related type 3 quartz
veins and quartz-calcite alteration did display some evidence for local fluid

CHAPTER FOUR: INTEGRATED FLUID STUDY
63
immiscibility including: (a) liquid and vapor-rich end members in some coeval
assemblages, (b) variable bulk compositions and molar volumes within an individual
inclusion assemblage, (c) total homogenization into liquid and vapor at the same
temperature of at least some of the inclusions within a single fluid inclusion assemblage
and (d) decrepitation of both liquid- and vapor-rich inclusions at similar temperatures
within any given assemblage.
Many of the vapor-rich aqueous-carbonic fluid inclusions decrepitated,
However, most vapor-rich inclusions homogenized to vapor before decrepitating. The
observation that several, albeit limited assemblages, display vapor and liquid-rich end
members, and that many vapor-rich fluid inclusions homogenized into vapor before
decripitation suggests that, at least locally, the fluid inclusions were trapped during fluid
immiscibility, thereby likely facilitating the precipitation of pyrite and gold during Stage
II mineralization.
4.4.5.2 Trapping Conditions
In hydrothermal systems where phase separation has not taken place, pressures
derived from homogenization temperatures represent minimum values, and independent
pressure and temperature estimates must be applied to determine the trapping conditions
of these fluids (cf. Roedder, 1984). Where phase separation has occurred,
homogenization temperatures represent trapping temperatures. The lack of evidence for
phase separation in fluid inclusion assemblages means that independent pressure
estimates must be applied in order to constrain the trapping conditions. At New
Celebration independent pressure estimates are provided by: (a) phengite geobarometry
on sericite alteration that is in equilibrium with sulfides of Stage I gold mineralization in
the Southern Ore Zone, and (b) regional greenschist facies metamorphism interpreted to
be broadly contemporaneous with orogenic gold mineralization in the Kalgoorlie-
Norseman corridor (McNaughton et al., 1990; Witt, 1991).
The underground Southern Ore Zone produced approximately 140,000 oz of
gold from M1 porphyry and was the primary source of Stage I gold at New Celebration
(Newcrest Mining Limited Internal Report, 2000). Phengite geobarometry on gold-
related sericite alteration constrains formation pressures to between 3.2 and 4.2 kbars
(Williams, 1994). Recent metamorphic studies in the eastern Yilgarn craton by
Goscombe et al. (2007; 2009) revealed that preceding hydrothermal alteration and
orogenic gold mineralization a regional M2 metamorphism linked to compression and

CHAPTER FOUR: INTEGRATED FLUID STUDY
64
minor crustal thickening was characterized by temperatures of 300-500°C and pressures
of 3.5-4.0 kbars. Based on equilibrium petrographic relationships between gold-hosting
pyrite, type 2 quartz-calcite veins and S3NC fabrics, the timing of Stage I gold
mineralization at New Celebration is interpreted to be syn- to immediately post-peak
metamorphism, contemporaneous with peak metamorphic conditions (Nichols, 2003),
therefore the regional metamorphic conditions described by Goscombe et al. (2007;
2009) can be used as a maximum P-T constraint on gold mineralization at the New
Celebration gold deposits.
Figure 4.4 illustrates representative median isochores calculated from fluid
inclusions trapped during the different hydrothermal events at New Celebration.
Isochores were constructed in MacFlinCor (Brown and Hagemann, 1995) using freezing
point depression, volume fraction vapor and ThTOT , and the equations of state of Bodnar
and Vityk (1994) for H2O-NaCl-(KCl) inclusions, TmCO2, volume fraction vapor at
TmCO2, ThCO2, and the equations of state of Thiery et al. (1994) and Swanenberg (1979)
for CO2-CH4 inclusions, and TmCO2, TmCLATH, ThCO2, ThTOT and the equations of state
of Thiery et al. (1994) and Swanenberg (1979) for H2O-CO2-CH4-NaCl inclusions.
Minimum trapping pressures for assemblages where phase immiscibility was not
demonstrated were derived from the intersection of the minimum homogenization
temperature of an inclusion type with its respective representative median isochore:
maximum P-T conditions are constrained by independent pressure estimates. At New
Celebration these are imposed by the limits of upper greenschist facies regional
metamorphism (c.f. Goscombe et al., 2007; 2009) and an independent P-T estimate for
Southern Ore Zone mineralization derived from the chlorite solid-solution
geothermometer and phengite geobarometer (Williams, 1994). In assemblages where
phase separation is demonstrated, homogenization temperatures represent trapping
conditions.
Using pressures derived from minimum homogenization temperatures of
different inclusion types, and the independent geothermobarometric constraints outlined
above, an approximate P-T-t path for the hydrothermal fluids circulating through the
Boulder-Lefroy fault segment, thus constraining the fluid evolution of the New
Celebration gold deposits, is illustrated in figure 4.5. Pressure-temperature boxes
illustrated in figure 4.5 were constructed using homogenization temperatures derived
from microthermometric analysis and independent pressure estimates, described above.

CHAPTER FOUR: INTEGRATED FLUID STUDY
65
Figure 4.4 P-T diagram showing representative median isochores from different fluid inclusion types in
types 2 and 3 veins and quartz-calcite alteration. (A) secondary late methane inclusions in all vein types;
(B) primary aqueous-carbonic inclusions in calcite from type 2 veins: (C), Stage II pseudo-secondary
aqueous-carbonic inclusions from type 3 veins and quartz-calcite alteration; (D) Stage I pseudosecondary
aqueous-carbonic inclusions from type 2 veins; and (E) late secondary aqueous inclusions from all vein
types. Minimum trapping pressures for assemblages where phase immiscibility was not demonstrated
were derived from the intersection of the minimum homogenization temperature of an inclusion type and
its respective representative isochore, shown on the diagram as lines with filled circles at each end.
Maximum P-T conditions are constrained by independent pressure estimates. At New Celebration these
are imposed by the limits of upper greenschist facies regional metamorphism (c.f. Goscombe et al., 2007;
2009) and an independent P-T estimate for Southern Ore Zone mineralization derived from the chlorite
solid-solution geothermometer and phengite geobarometer (Williams, 1994). The minimum
homogenization temperature of aqueous-carbonic fluid inclusions from quartz in type 2 veins, associated
with Stage I gold mineralization, constrains the minimum trapping pressure of these inclusions to
approximately 3.2 kbars. Maximum pressure constraints imposed by the limits of regional metamorphism
constrains the upper temperature of formation of Stage I mineralization to 390 °C. Stage II mineralization
formed at similar temperatures, but much lower pressures, with minimum formation conditions of 300 °C
and 1 kbar. The representative isochores for late secondary methane inclusions (A) and late secondary
aqueous inclusions (F) show P-T relationships outside of the range for gold mineralization, indicating that
these inclusions formed in a different P-T environment and are unlikely to be gold related.
The earliest observed aqueous-carbonic inclusions in calcite from type 2 quartz-
calcite veins, and by inference, the early carbonic inclusions within the same calcite
selvedge, formed between 270 °C and 500 °C at 1 to 3 kbars assuming lithostatic fluid
pressures. The minimum homogenization temperature of aqueous-carbonic fluid
inclusions from quartz in type 2 veins associated with Stage I gold mineralization (330
°C), constrains the minimum trapping pressure of these inclusions to approximately 3.2

CHAPTER FOUR: INTEGRATED FLUID STUDY
66
kilobars. Maximum pressure constraints imposed by the limits of regional
metamorphism constrains the upper temperature of formation of Stage I mineralization
to 390 °C. Stage I gold mineralization is therefore interpreted to have formed beween
330 °C and 390 °C at pressures between 3.2 and 4.0 kbars. This corresponds to a
paleodepth of 10-15km (Brown and Hagemann, 1995), assuming lithostatic conditions
and lies between the mesozonal and hypozonal classifications of Gebre-Mariam et al.
(1995) and Groves et al. (1998).
In assemblages where phase separation has taken place homogenization
temperature represents trapping conditions. Homogenization temperatures of aqueous-
carbonic inclusions from quartz in type 3 veins related to Stage II mineralization
constrain minimum trapping pressures to 0.8 kbars. Upper limits for the boiling
assemblages are constrained by homogenization temperatures around 320 °C, which
correlates to trapping pressures of 1.2 kbars. For Stage II assemblages where boiling
was not demonstrated, maximum trapping pressures can only be constrained by regional
metamorphism, giving a maximum trapping pressure of 3.2 kbars. Stage II
mineralization is therefore interpreted to have formed at temperatures between 280 °C
and 320 °C and pressures between 0.8 and 3.2 kbars, which corresponds to crustal
depths between 4 and 10 kilometers(Brown and Hagemann, 1995) at lithostatic
conditions. In conjunction with fluid inclusion evidence for local fluid immiscibility,
this variation in pressure may represent pressure fluctuations due to fault valve
seismogenic cyclic fault valve behavior (Sibson et al., 1988; Sibson, 2004) in a brittle
tectonic regime.
Carbonic inclusions, interpreted as trapped during the final phases of Stage II
gold mineralization, have estimated trapping conditions between 280 °C and 360 °C and
0.8 to 1.6 kbars. High salinity aqueous inclusions, and methane inclusions trapped in all
vein types and quartz-calcite alteration formed at temperatures around 100-180 °C and
pressures estimated to range between 0.4-1.0 kbars.The representative isochores for late
secondary methane inclusions (A) and late secondary aqueous inclusions (F) show P-T
relationships outside of the range for gold mineralization, indicating that these
inclusions formed in a different P-T environment and are unlikely to be gold related.

CHAPTER FOUR: INTEGRATED FLUID STUDY
67
Figure 4.5 Pressure-temperature diagram illustrating the P-T conditions of formation of different fluid
inclusion assemblages in various vein types, the P-T path through time, the likely pressure constraints
imposed by peak metamorphism (from Spears, 1995) and the independent P-T estimate of Williams
(1994) for Southern Ore Zone mineralization at New Celebration derived from the chlorite solid-solution
geothermometer and phengite geobarometer. Interpretation of the P-T conditions recorded by the different
fluid inclusion assemblages indicates a protracted and complex fluid and tectonic history for the BLFZ.
Early fluids were emplaced in the fault at or around peak metamorphism; Stage I gold mineralization
formed post-peak metamorphism at high temperatures and pressures. Stage II mineralization formed
during a period of waning temperature and fluctuating pressure, possibly induced by fault valve behavior.
Late fluid assemblages (highly saline aqueous fluids, and methane-dominated fluids) were emplaced
during a period of low temperature and pressure, likely during uplift and erosion of the orogen
4.4.5.3 Fluid Mixing
The distribution of data in a conventional bivariate plot of homogenization
temperature (Th TOT) versus salinity ( wt.% NaCl equiv.) for fluid inclusions trapped
during both stages of gold mineralization (Fig. 4.6) does not indicate that fluid mixing
was a significant fluid process (cf. Wilkinson, 2001). The relationship expressed in
Figure 4.6, however, does not take into account the possibility of mixing aqueous or
aqueous-dominated fluids with one or more gaseous fluids. Fluid inclusion evidence
indicates the presence of a CO2 dominated fluid in type 3 quartz veins. These inclusions
may reflect partial mixing between aqueous-carbonic ore fluids and CO2-dominated
fluids; however, the paragenetic relationship between the H2O-CO2 and CO2-rich
inclusion populations is unclear. The source of the CO2-dominated fluid is
unconstrained, however, the close spatial association of the New Celebration deposit to
felsic porphyry dikes points towards a potential granite source at depth

CHAPTER FOUR: INTEGRATED FLUID STUDY
68
Figure 4.6 Salinity (wt. % NaCl equiv.) versus total homogenization temperature (ThTOT) for types II
(H2O-CO2- filled symbols) and IVa (H2O-NaCl – open symbols) fluid inclusions from Stage I (A) and
Stage II (B) gold mineralization. Type IVb (high salinity H2O-NaCl-CaCl2 – asterisks) fluid inclusions
are included on both plots for comparison. There is no evidence for either isothermal fluid mixing or
dilution of the ore fluids with surface fluids in either Stage I or Stage II gold mineralization. The late,
highly saline aqueous fluids form a discrete population and do not appear to be related to the earlier
fluids. However, these diagrams do not take into account the possibility of mixing aqueous or aqueous-
carbonic fluids with one or more gaseous fluids. Boiling and mixing lines from Wilkinson (2001).
(cf. granite underlying the area south of Kalgoorlie, Stolz et al., 2004). This granite, if
contemporaneous with ore formation, could exsolve highly oxidized hot CO2-rich fluids
that mixed with the ore fluids ascending the BLFZ.
There is also fluid inclusion evidence for methane-dominated fluids within the
BLFZ hydrothermal system. Fluid mixing between CH4 and CO2-bearing ore-fluids
CHAPTER FOUR: INTEGRATED FLUID STUDY
69
could trigger phase immiscibility (Naden and Shepherd, 1989) by pushing the solvus
towards higher temperatures and pressures and increasing the two-phase field in the
H2O-CO2 system (McCuaig and Kerrich, 1998). If this was the case, the ore-related
H2O-CO2 fluid inclusions should be expected to contain higher concentrations of CH4,
however, except for rare inclusions, the mole fraction of CH4 in H2O-CO2 inclusions
was less than 0.03.
4.5 LA-ICP-MS Results
Mixed aqueous-carbonic and aqueous inclusions from types 2 and 3 veins, and
quartz-calcite alteration were analyzed by laser ablation inductively coupled plasma
mass spectrometry (LA-ICP-MS) to determine the metal concentrations in mineralizing
and non-mineralizing fluids. Inclusions of all fluid types contained Na, K, Ca, Mg and
Fe as major components, and contained trace to minor concentrations of other metals
such as Cu, Pb, Zn, As, Ag and Au. Element ratios in mixed inclusions with daughter
minerals did not show any systematic variations from those without daughter minerals.
Comparisons of element ratios (to Na, figure 4.7) and concentrations (figure 4.8)
between the different inclusion types revealed a number of differences. Aqueous-
carbonic inclusions in type 2 veins (n=174) were composed of fluids characterized by
Na>Ca>K> Mg and K/Ca <1 (table 4.2), whereas inclusions in type 3 veins (n=95) and
quartz-calcite alteration associated with Contact-style mineralization (n=88) were
characterized by Na>Mg>K>>Ca fluids and K/Ca >1 (table 4.2). Low salinity aqueous
inclusions in type 3 veins were Na>>K>Mg; Ca was not analysed in these inclusions.
Late, high salinity aqueous inclusions, reported in all vein types and quartz-cc alteration
were Na>K>>Ca, with only minor Mg.
Metal concentrations were generally low in all inclusions from both vein types,
and were commonly below detection although mixed inclusions in all hosts contained
up to 163 ppm Cu, 75 ppm Zn and 43 ppm As (c.f. Olivo et al., 2006; Pudack et al.,
2009). Bar plots of mean element ratios (figure 4.9) and concentrations (figure 4.10)
illustrate the differences between the fluid types. Analyses of stage I gold-related
aqueous-carbonic fluid inclusions from type 2 veins returned lower values than Stage II
aqueous-carbonic fluids from type 3 veins and quartz-calcite alteration for all metals
except Cu and Sn. Aqueous-carbonic fluids in quartz-calcite alteration (Stage II,
Contact style) returned lower values for all metals except Sn than the same fluids in
type 3 veins (Stage II, Fracture style). Low salinity aqueous fluids in type 3 veins

CHAPTER FOUR: INTEGRATED FLUID STUDY
70
returned similar metal ratios and concentrations to aqueous-carbonic fluids in the same
veins. Interestingly, high salinity aqueous inclusions, which are interpreted to post-date
gold mineralization, returned Cu concentrations up to 800 ppm and Ag up to 48 ppm.
4.5.1 Gold
Gold was analysed separately from other elements in order to increase the dwell
time (to 0.30 or 0.40 seconds), which serves to reduce background interference and
decreases limits of detection (LOD). In many inclusions gold was below detection,
however, individual aqueous-carbonic inclusions contained up to 51 ppm Au. Average
Au concentrations (figure 4.10) from both vein types and quartz-calcite alteration
showed little variation, with mixed inclusions returning mean values of 4.76 ppm (type
2 veins, n=76), 5.12 ppm (type 3 veins, n=40) and 6.26 ppm (quartz-calcite alteration,
n=21).
The Au values reported from both types 2 and 3 veins and quartz-calcite
alteration are consistent with the experimental work of Mikucki and Ridley (1993) and
Mikucki (1998), who determined that at temperatures between 300 °C and 550 °C, gold
transported as a bisulfide complex (Au(HS)2-) could have solubilities exceeding 10-
10,000 ppb Au. They also exceed the minimum 5 ppb Au concentration required to
form an ore fluid capable of forming a gold deposit (Heinrich et al., 1989).

CHAPTER FOUR: INTEGRATED FLUID STUDY
71
Figure 4.7 Bar graph of mean Mg, K and Ca ratios (to Na) of New Celebration fluids illustrating the
differences between Stages I and II gold mineralization, and post mineralization fluids.
Figure 4.8 Bar graph of mean Mg, K and Ca concentrations of New Celebration fluids illustrating the
differences between Stages I and II gold mineralization, and post mineralization fluids.

CHAPTER FOUR: INTEGRATED FLUID STUDY
72
Figure 4.9 Mean ratios of some metals (to Na) in fluid inclusions from the New Celebration deposit
illustrating the difference in metal abundances between Stages I and II gold and post-Au fluids
Figure 4.10 Mean ratios of some metals (to Na) in fluid inclusions from the New Celebration deposit
illustrating the difference in metal abundances between Stages I and II gold and post-Au fluids

CHAPTER FOUR: INTEGRATED FLUID STUDY
73
4.5.2 Interpretation of In Situ Laser Ablation ICP-MS Results
4.5.2.1 Potential Fluid Sources
Based on the characterization of sedimentary-derived brines as Na-Ca
dominated (Taylor et al., 1983; Haynes and Kesler, 1987; Haynes, 1988), and magmatic
fluids as Na-K dominated (Roedder, 1971; Kilinc and Burnham, 1972; Eastoe, 1978;
Burnham, 1979; Wilson et al., 1980; Whitney et al., 1985; Quan et al., 1987), Haynes
and Kesler (1988) suggested that K/Ca could be used to evaluate magmatic fluid
contributions to ore mineralization. They suggested that K/Ca ratios >1 indicated a
dominantly magmatic fluid source, or a fluid that had equilibrated with granitic rocks,
whereas K/Ca ratios <1 indicated a dominantly non-magmatic, basinal-derived fluid
source. At New Celebration Stage I-related fluid inclusions from type 2 quartz-
carbonate veins have K/Ca ratios < 1, whereas Stage II-related fluid inclusions trapped
in quartz-calcite alteration and type 3 quartz veins, and high salinity aqueous inclusions
which are trapped in the same veins but post-date gold mineralization have K/Ca ratios
>1. This indicates that a switch in fluid sources may have occurred between the Stage I
and Stage II gold mineralizing events, from a non-magmatic, likely metamorphic, fluid
that circulated during Stage I gold mineralization, to dominantly magmatic fluids during
Stage II.
4.6 Comparisons with Other Hydrothermal Systems
Hydrothermal fluids recorded at New Celebration are for the most part similar to
fluids reported from orogenic deposits around the world. Goldfarb et al. (2005, and
references therein) reported that the majority of orogenic lode gold deposits formed
from near-neutral pH fluids containing 4-30 mole percent CO2 with salinities ranging
between 3 and 12 weight percent NaCl equivalent. Most fluid inclusions from gold-
bearing veins contained some CH4±N2, with CH4 and/or N2 concentrations ranging from
trace amounts to concentrations greater than the total amount of CO2. Various workers
have reported highly saline aqueous fluids from orogenic lode gold deposits, although
their relationship to mineralization remains contentious. Some highly saline fluids (e.g.
Sigma, Robert and Kelly, 1987; Victory-Defiance, Clark et al., 1989) are considered to
be the end-members of fluid unmixing. Others (e.g. Abitibi subprovince, Boullier et al.,
1998) clearly post-date gold mineralization and are interpreted to represent late shield
brines (Guha and Kanwar, 1987). Methane dominant fluids are less common but have

CHAPTER FOUR: INTEGRATED FLUID STUDY
74
been observed in a number of deposits in the Yilgarn craton, such as the Oroya lodes at
Golden Mile (Ho, 1987), Wiluna (Hagemann et al., 1996), Mt Charlotte (Mernagh,
1996) and Victory (Polito et al., 2001). For the most part, the presence of methane-rich
fluids is attributed to carbonaceous wall rocks either hosting or adjacent to the deposits,
however, others, such as New Celebration and Junction, have no associated
carbonaceous units. Polito et al. (2001) considered Fischer-Tropsch reactions between
light hydrocarbons and wall rock Fe-oxides under reducing conditions to be the
mechanism by which the methane-rich inclusions formed at Junction. Alternatives
include phase immiscibility (Naden and Shepherd, 1989), post-entrapment hydrogen
diffusion (Hall and Bodnar, 1990; Ridley and Hagemann, 1996) or a primary methane-
dominated (possibly mantle) source.

CHAPTER FOUR: INTEGRATED FLUID STUDY
75
Table 4.2 Mean, standard deviation and maximum concentrations of fluid inclusions from different vein types at New Celebration. Analyses are grouped as inclusion populations according to mineralization event, host rock, host vein inclusion type and salinity.
Concentrations are reported in parts per million (ppm). Salinity, XCO2, XCH4 and bulk density were obtained from microthermometric analyses. Standard deviations are reported to 1σ. Altn=alteration, Qz = quartz, cc=quartz-calcite, fsp=feldspar, aq=aqueous,
cb=carbonic.
Min. Stage
Host Rock
Vein Type
Sample No
Inclusion Type
Salinity wt.% NaCl equiv.
XCO2 (mole
%)
XCH4 (mole
%) Bulk Density (g/cm3) Na K Mg Ca Cu Pb Zn Sr Au Ag As Sb Bi Sn W Mo Ba U Th Cs Mn Fe K/Ca
1 M1 porphyry 2 1213279 Aq-cb 3.05
10 ± 1 to 33 ± 13
0 to 30 ±
1 0.78 ± 0.04 to 0.94 ± 0.01 11988
mean 1582 1147 2812 163 3 75 5 5 3 43 20 7 20 5 6 18 4 1 1 28 230 0.56 sd 809 660 1564 105 1 50 3 9 2 29 13 5 11 4 4 14 2 1 1 11 133
max 3240 2284 5110 350 6 173 12 52 9 108 45 16 42 12 13 70 10 3 3 43 422
2 M2 qz-
fsp porphyry
Qz-cc
altn
HBW-1250-
12-018 Aq-cb 4.51
48 ± 17 to 53 ± 28
0 to 1 0.65 ± 0.06 to 0.90 ± 0.05 17742 mean 3638 3704 574 66 30 106 56 6
1 118 31 30 20 309 6 55 3 3 2 39 584
6.34 sd 1745 519 384 53 13 87 57 10 149 27 29 14 197 5 44 2 2 2 28 384 max 6447 4172 1434 147 47 237 137 33 1 224 83 76 44 656 12 120 6 6 6 77 1204
3
133541 Aq-cb 5.12
16 ± 3 to 26 ±
8
0 to1 0.74 ± 0.11 to 0.95 ± 0.01 20142 mean 5406 2046 628 224 137 179 11 5 7 202 66 72 23 4 12 44 0 1 2 108 37
8.61 sd 3421 2436 448 133 88 149 6 7 6 156 82 68 14 4 9 36 0 1 1 36 max 11318 5926 1073 453 299 429 23 17 17 406 319 149 42 9 20 100 0 2 3 108 77
1213359 Aq-cb 3.8 17 ± 11 0 0.95 ± 0.03 14949
mean 5284 1061 5 25 16 22 3 1 1 3 1 5 457 4.98 sd 2328 671 6 12 16 9 2 1 1 1 1 2 181
max 2147 17 41 44 36 6 2 2 5 2 9 682
1213359 Aq (low salinity) 8.36 23888
mean 7098 1091 152 106 197 54 13 260 31 sd 2610 662 75 78 122 33 3 187 14
max 11570 1908 265 258 389 89 16 537 49
Post Au
M2 qz-fsp
porphyry
Qz-cc
altn
HBW-1250-
12-018
Aq (high salinity) 21
63998 mean 15127 2549 363 165
9 30 31 419
sd 13867 1655 390 138 21 26 406 max 29027 4440 805 323 9 53 48 869
3 133541 Aq (high salinity) 20.6 1.12 ± 0.02 to 1.16 ± 0.01 47714
mean 30990 420 5202 169 19 49 5 2 86 8 10 47 4 14 6 1 65 162 5.96
sd 4890 147 1299 74 10 37 2 2 44 3 15 33 2 7 2 1 51 57 max 45683 639 7163 360 37 87 8 3 144 11 39 93 6 24 7 3 147 233
CHAPTER FOUR: INTEGRATED FLUID STUDY
76
There are few published data of metal concentrations in hydrothermal fluids
from orogenic lode gold deposits, and the majority of those published present bulk
crush-leach analytical techniques. Diamond (1990) and Yardley (1993) examined the
fluid characteristics of metamorphic gold-quartz veins from Brusson, in NW Italy and
Pike (1993) studied low-salinity gas-rich fluids in pegmatites from the Muiane deposit,
Mozambique. More recently Olivo et al. (2006) employed single inclusion laser
ablation-time of flight-inductively coupled plasma-mass spectrometry (LA-TOF-
ICPMS), in conjunction with crush-leach and microthermometry, to evaluate the fluid
compositions in barren and gold-bearing veins from the Sigma deposit in Canada. None
of these studies presented gold data. Relative to aqueous-carbonic fluids from Muiane
or Brusson, K, Mg, Cu, Mn and Fe concentrations in gold-related aqueous carbonic
fluid inclusions at New Celebration are elevated, whereas Na concentrations are lower.
Minor element/Na ratios of New Celebration fluids are generally an order of magnitude
lower than those from the Sigma deposit, with the exception of As, which is higher at
New Celebration. Major element/Na ratios (Mg, K, Ca), however, are up to an order of
magnitude higher in the New Celebration fluids.
More single inclusion data are available from porphyry systems (e.g. Audetat et
al., 1998; Audetat et al., 2000; Ulrich and Gunther, 2002; Klemm et al., 2007; Audetat
et al., 2008; Pudack et al., 2009), generally because sodium is used as the internal
standard for calculating absolute element concentrations (Allan et al., 2005) and fluid
salinities are higher in porphyry systems, although there is still a significant dearth of in
situ Au analyses. Low-salinity fluids from the Butte porphyry system (Rusk et al.,
2004), contain Na, K, Pb, Zn and Mn in similar concentrations to gold-related fluids
from New Celebration. Ulrich et al. (1999) publish Au concentrations averaging up to
10 ppm in vapor inclusions from the Grasberg porphyry Cu-Mo-Au deposit, and
Williams-Jones and Heinrich (2005) reported concentrations up to 57 ppm Au,
however, these Au concentrations were analyzed from high-salinity inclusions. Pudack
et al. (2009) reported Au concentrations up to 13 ppm in low-salinity aqueous-carbonic
fluid inclusion assemblages from deep porphyry and transitional zones at the Nevados
de Famantina porphyry Cu-Mo-Au system in Argentina.
The post-gold hydrothermal fluids at New Celebration are low temperature, high
salinity fluids with a characteristic Na, K , Mg and Ca signature. When comparing these
fluids with data sets from Canadian shield brines, sedimentary basin fluids,
metamorphic fluids, and geothermal fluids (Yardley, 2005 and references therein), it is

CHAPTER FOUR: INTEGRATED FLUID STUDY
77
evident that the shield brines and basin fluids show no similarities to the New
Celebration post-gold fluids. The metamorphic, geothermal and magmatic fluids,
however, exhibit a number of similarities; Na, K and Mg concentrations are comparable
in all fluid types, whereas Ca and Cu concentrations in the New Celebration fluids are
most similar to magmatic fluids. Lead and Zn concentrations are more closely aligned
with metamorphic or geothermal fluids (Yardley, 2005 and references therein).

CHAPTER FIVE: SULFUR ISOTOPIC COMPOSITION AND MINERAL CHEMISTRY
78
5 CHAPTER FIVE: SULFUR ISOTOPIC COMPOSITION AND MINERAL CHEMISTRY OF SULFIDES, OXIDES AND GOLD
The isotopic and trace element composition of ore-stage sulfides can provide
valuable clues to potential fluid sources and the processes by which ore deposits form.
Pyrite grains associated with both mineralization stages were analyzed to determine
their sulfur isotope and trace element composition. Metamorphic and primary magnetite
grains in host rocks were analyzed to ascertain possible trace element contributions to
ore-stage sulfides.
5.1 Sulfur Isotopic Composition of Pyrite
5.1.1 Sample Selection and Analytical Procedure
The δ34S isotopic composition of pyrite from fifteen samples representing Stage
I and Stage II gold mineralizing events and four mineralization styles were analyzed by
either Nd-YAG laser ablation of in situ sulfides (Huston et al., 1995a) or conventional
techniques for pyrite separates (Robinson and Kusakabe, 1975) at the Central Science
Laboratory (CSL), at the University of Tasmania. Thirty in situ analyses and nine
conventional analyses were collected for this study. The conventional analyses
represented an initial reconnaissance study to evaluate the potential for a detailed in situ
analysis of ore-related sulfide. All results are reported in parts per thousand (per mil, ‰)
relative to the Canyon Diablo Troilite (CDT). Precision of the standards is typically
±0.1 per mil CDT for in situ analyses and ±0.3 per mil CDT for homogeneous mineral
separates. Pyrite grains were typically too small to investigate the possibility of isotopic
zonation therefore all in situ analyses were taken from the sulfide grain centers.
In situ samples were prepared as double-polished thick sections either at the
University of Tasmania or by Pontifex Associates in Adelaide. Samples were mounted
onto a glass slide with super-glue then polished to a thickness of approximately 200 µm.
Prior to analysis, the samples were soaked off the slides with acetone and ultrasonically
cleaned sequentially in warm soapy water, distilled water and acetone, then oven dried
at approximately 80 °C. Samples were then mounted on a glass pedestal and placed into
the sample chamber, which was evacuated to a vacuum better than 10-2 torr. Sulfide
grains were ablated in an oxygen atmosphere for 2 seconds by an 18 watt Quantronix
CHAPTER FIVE: SULFUR ISOTOPIC COMPOSITION AND MINERAL CHEMISTRY
79
model 117 Nd:YAG laser. Ablation produces a small amount of SO2, which is removed
from the oxygen atmosphere prior to analysis by circulating the SO2/O2 mixture through
a liquid nitrogen trap, where SO2 condenses and O2 is pumped away. Carbon dioxide,
produced by carbonate-bearing samples, was removed by cold-finger separation through
an N-Pentane trap. The purified SO2 gas was analyzed by a VG Sira Series II mass
spectrometer.
A laboratory-dependent correction factor and a fractionation factor were applied
to the raw 34S data into 34SCDT values. Standards from Rosebery and Broken Hill were
run daily prior to sample analysis in order to determine the laboratory dependent
correction factor. Fractionation factors for pyrite and pyrrhotite are 4.75 per mil and
4.12 per mil respectively.
For conventional analyses, sulfide mineral separates (8-25 milligrams,
depending on sulfide species, purity and anticipated SO2 yield) were ground with 150
milligrams of cuprous oxide in an agate mortar, placed in a pre-ignited mullite ceramic
boat and ignited in vacuo (Robinson and Kusakabe, 1975). The use of excess Cu2O in
this method ensured the low pO2 favorable for SO2 production, and that negligible SO3
was produced. All gases from the combustion were condensed into a Pyrex glass trap
held under liquid nitrogen. Contaminant H2O was frozen out at the freezing point of
acetone (-95 °C), and CO2 was removed from the condensed SO2 at the freezing point
of n-pentane (-131 °C). Purified SO2 was collected into a Pyrex glass gas bottle under
liquid nitrogen and then connected to the sample inlet of the mass spectrometer for
isotope ratio analysis. Isotopic analysis of the extracted SO2 was performed with a VG
SIRA 10, Series 2 triple-collector mass spectrometer, using reference gas SO2 calibrated
against NBS 123 sphalerite, IAEA-S-1, Broken Hill galena and Rosebery galena as
working standards to establish a calibration curve.
5.1.2 Results
The majority of both Stage I and Stage II gold-related pyrites at New
Celebration had negative δ34S values (Table 5.1, Fig. 5.1), although the range of values
both within and between mineralization styles varied widely. Results of laser ablation
analyses of Stage I gold related samples ranged from -7.6 to +3.8 per mil (mean -2.6 ‰;
n=18) whereas Stage II gold related samples ranged from -10.6 to -3.2 per mil (mean -
7.1 ‰; n=21). The data define three discrete populations (Fig. 5.1) with little overlap

CHAPTER FIVE: SULFUR ISOTOPIC COMPOSITION AND MINERAL CHEMISTRY
80
Figure 5.1 Total range of δ34S values from ore-related pyrite from all mineralization styles at New
Celebration (this study, Hodkiewicz, 2003) and potential sulfur sources. Blue bars = Stage I
mineralization; red bars = Stage II mineralization. Vertical dashes = mean. The gray shaded area
corresponds to average δ34S values of pyrite from other Yilgarn gold deposits (summarized by
Hodkiewicz, 2003). Values for I-type granite from Ohmoto (1986), Yilgarn crust from Lambert et al.
(1984) and Archean seawater from Ohmoto and Goldhaber (1997).
Table 5.1 Sulfur isotopic composition of pyrites from New Celebration Stage I and Stage II gold
mineralization samples as determined by laser ablation ICP-MS analysis. Samples with an asterisk (*) are
from Hodkiewicz (2003)
Sample No Min. Event
Min. Style Sample Description Pyrite Description Method δ34S (‰) Precision
1213279 Stage I Porphyry M1 carbonate altered plagioclase porphyry
Anhedral, grains intergrown, 1000μm
LA -4.14 0.006
1213279 Stage I Porphyry M1 carbonate altered plagioclase porphyry
Anhedral, several grains in foliation plane, 300μm
LA -5.72 0.005
1213279 Stage I Porphyry M1 carbonate altered plagioclase porphyry
Anhedral, elongate, located in foliation plane, 500μm
LA -6.26 0.018
1213279 Stage I Porphyry M1 carbonate altered plagioclase porphyry
Euhedral, disseminated, 300μm
LA -3.15 0.010
133542 Stage I Porphyry M1 carbonate altered plagioclase porphyry
Anhedral, disseminated, 250μm
LA -7.36 0.020
133542 Stage I Porphyry M1 carbonate altered plagioclase porphyry
Euhedral, disseminated, 300μm
LA -6.06 0.003
133542 Stage I Porphyry M1 carbonate altered plagioclase porphyry
Subhedral-euhedral, disseminated, 100-200μm
LA -7.49 0.004
133542 Stage I Porphyry M1 carbonate altered plagioclase porphyry
Fine-grained, anhedral, located in S3NC foliation planes
LA -6.90 0.008
1213226 Stage I Mylonite Quartz-carbonate mylonite Anhedral, sheared, located in S3NC foliation planes, 400μm
LA 3.77 0.220
1213226 Stage I Mylonite Quartz-carbonate mylonite Anhedral, aligned along S3NC foliation planes, 200μm
LA 0.57 0.011
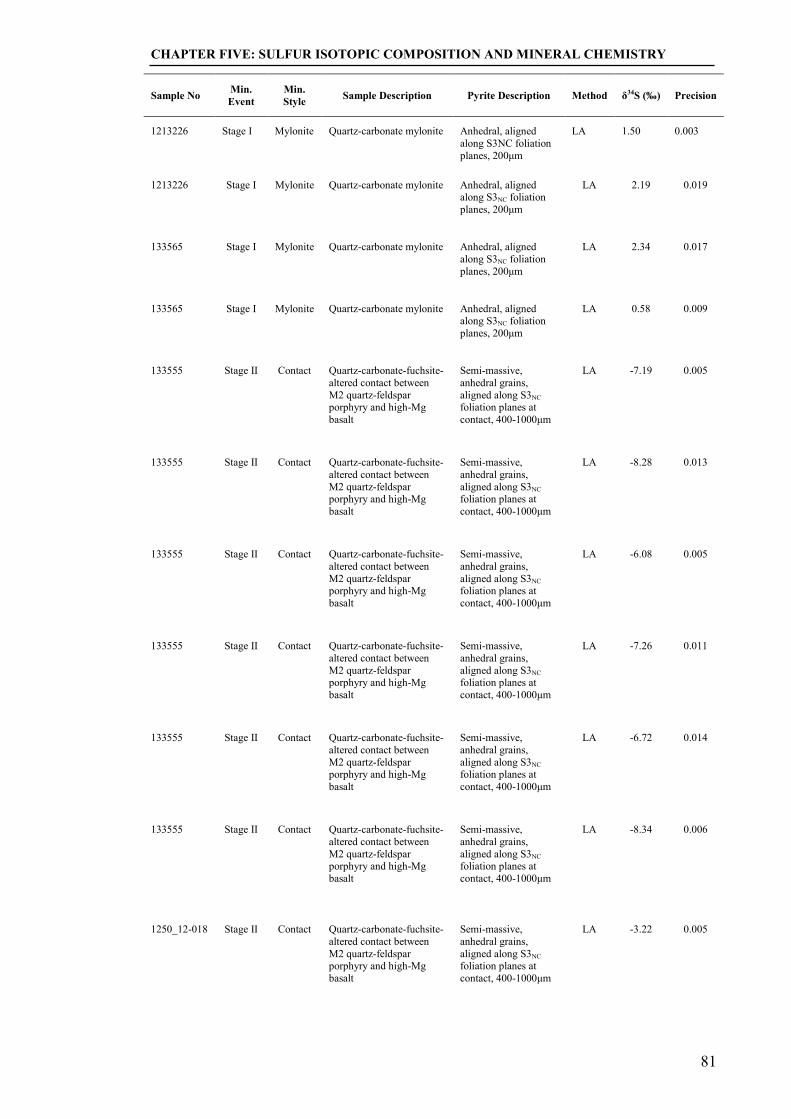
CHAPTER FIVE: SULFUR ISOTOPIC COMPOSITION AND MINERAL CHEMISTRY
81
Sample No Min. Event
Min. Style Sample Description Pyrite Description Method δ34S (‰) Precision
1213226 Stage I Mylonite Quartz-carbonate mylonite Anhedral, aligned along S3NC foliation planes, 200μm
LA 1.50 0.003
1213226 Stage I Mylonite Quartz-carbonate mylonite Anhedral, aligned along S3NC foliation planes, 200μm
LA 2.19 0.019
133565 Stage I Mylonite Quartz-carbonate mylonite Anhedral, aligned along S3NC foliation planes, 200μm
LA 2.34 0.017
133565 Stage I Mylonite Quartz-carbonate mylonite Anhedral, aligned along S3NC foliation planes, 200μm
LA 0.58 0.009
133555 Stage II Contact Quartz-carbonate-fuchsite-altered contact between M2 quartz-feldspar porphyry and high-Mg basalt
Semi-massive, anhedral grains, aligned along S3NC foliation planes at contact, 400-1000μm
LA -7.19 0.005
133555 Stage II Contact Quartz-carbonate-fuchsite-altered contact between M2 quartz-feldspar porphyry and high-Mg basalt
Semi-massive, anhedral grains, aligned along S3NC foliation planes at contact, 400-1000μm
LA -8.28 0.013
133555 Stage II Contact Quartz-carbonate-fuchsite-altered contact between M2 quartz-feldspar porphyry and high-Mg basalt
Semi-massive, anhedral grains, aligned along S3NC foliation planes at contact, 400-1000μm
LA -6.08 0.005
133555 Stage II Contact Quartz-carbonate-fuchsite-altered contact between M2 quartz-feldspar porphyry and high-Mg basalt
Semi-massive, anhedral grains, aligned along S3NC foliation planes at contact, 400-1000μm
LA -7.26 0.011
133555 Stage II Contact Quartz-carbonate-fuchsite-altered contact between M2 quartz-feldspar porphyry and high-Mg basalt
Semi-massive, anhedral grains, aligned along S3NC foliation planes at contact, 400-1000μm
LA -6.72 0.014
133555 Stage II Contact Quartz-carbonate-fuchsite-altered contact between M2 quartz-feldspar porphyry and high-Mg basalt
Semi-massive, anhedral grains, aligned along S3NC foliation planes at contact, 400-1000μm
LA -8.34 0.006
1250_12-018 Stage II Contact Quartz-carbonate-fuchsite-altered contact between M2 quartz-feldspar porphyry and high-Mg basalt
Semi-massive, anhedral grains, aligned along S3NC foliation planes at contact, 400-1000μm
LA -3.22 0.005

CHAPTER FIVE: SULFUR ISOTOPIC COMPOSITION AND MINERAL CHEMISTRY
82
Sample No Min. Event
Min. Style Sample Description Pyrite Description Method δ34S (‰) Precision
1250_12-018 Stage II Contact Quartz-carbonate-fuchsite-altered contact between M2 quartz-feldspar porphyry and high-Mg basalt
Semi-massive, anhedral grains, aligned along S3NC foliation planes at contact, 400-1000μm
LA -3.28 0.017
1250_12-018 Stage II Contact Quartz-carbonate-fuchsite-altered contact between M2 quartz-feldspar porphyry and high-Mg basalt
Semi-massive, anhedral grains, aligned along S3NC foliation planes at contact, 400-1000μm
LA -4.71 0.011
1213371 Stage II Contact Quartz-carbonate-fuchsite-altered contact between M2 quartz-feldspar porphyry and high-Mg basalt
Semi-massive, anhedral grains, aligned along S3NC foliation planes at contact, 400-1000μm
LA -3.89 0.007
1213359 Stage II Fracture M2 albite-carbonate altered quartz-feldspar phyric porphyry
Anhedral, 200-500μm LA -10.61 0.031
1213359 Stage II Fracture M2 albite-carbonate altered quartz-feldspar phyric porphyry
Anhedral, 200-500μm LA -10.26 0.034
1213359 Stage II Fracture M2 albite-carbonate altered quartz-feldspar phyric porphyry
Anhedral, 200-500μm LA -9.39 0.010
1213359 Stage II Fracture M2 albite-carbonate altered quartz-feldspar phyric porphyry
Anhedral, 200-500μm LA -7.40 0.023
1213359 Stage II Fracture M2 albite-carbonate altered quartz-feldspar phyric porphyry
Anhedral, 200-500μm LA -8.55 0.007
1213359 Stage II Fracture M2 albite-carbonate altered quartz-feldspar phyric porphyry
Anhedral, 200-500μm LA -7.62 0.019
121763* Sericite-altered sheared porphyritic intrusion
Subhedral, 100μm LA -1.41 0.12
121766* Biotite-dolomite-chlorite-altered ultramafic schist
Subhedral, 100μm LA 3.92 0.015
121776* Chlorite-calcite-albite-altered mafic schist
Euhedral, 300μm LA 5.54 0.038
121784* Albite-hematite-altered sheared felsic porphyry
Euhedral, 800μm LA -8.64 0.032
121784* Albite-hematite-altered sheared felsic porphyry
Euhedral, 300μm LA -6.78 0.026
121784* Albite-hematite-altered sheared felsic porphyry
Subhedral, 500μm LA -6.04 0.012
121788* K-feldspar-albite-ankerite-altered tholeiitic mafic schist
Euhedral, 500μm LA -4.84 0.046
121788* K-feldspar-albite-ankerite-altered tholeiitic mafic schist
Euhedral, 1000μm LA -5.49 0.016

CHAPTER FIVE: SULFUR ISOTOPIC COMPOSITION AND MINERAL CHEMISTRY
83
between populations and may provide indications to potential sulfur sources and
processes.
5.1.3 Interpretation of Results
The sulfide sulfur isotopic values collected during this study contrast with the
predominantly positive δ34S values (0-5 ‰) reported by Golding et al. (1990c),
Hodkiewicz (2003 and references therein) and Hodkiewicz et al. (2009), for ore-related
pyrites from most gold deposits in the Eastern Goldfields (with the exception of the
Porphyry, Golden Mile and Victory-Defiance deposits) and 0-9 per mil for ore-related
sulfides in Archean orogenic lode gold deposits worldwide (with the exception of
Hemlo, Lakeshore/Macassa, Canadian Arrow and Kelore, which have much larger δ34S
ranges) reported by Colvine et al. (1988) but are consistent with previous analyses of
ore-stage pyrite from New Celebration undertaken by Hodkiewicz (2003) and
Hodkiewicz et al. (2009).
The hydrothermal fluids that precipitated gold-stage pyrite at New Celebration
were significantly more oxidized than the average Archean lode gold deposit (cf.
McCuaig and Kerrich, 1998). Either they were intrinsically oxidized from their source
or they were oxidized during gold precipitation by: (1) in situ fluid oxidation due to
reaction with iron-rich wall rocks (Couture and Pilote, 1993), (2) fluid mixing (Uemoto
et al., 2002) or (3) fluid oxidation during phase separation (Drummond and Ohmoto,
1985).
5.1.3.1 Sulfur Sources
Potential sulfur sources for Archean lode-gold ore fluids in the Yilgarn include:
1) sulfides in the host greenstone sequences; 2) dissolved seawater sulfur (in deposits
where there is potential for significant seawater water infiltration); 3) sulfur-bearing
magmatic volatiles, or 4) fluids that have equilibrated with magmatic sulfides (Kerrich,
1986). Sulfides in mafic, ultramafic and sedimentary rocks of the Yilgarn Craton have
δ34S values between +1 and +5 per mil (Donnelly et al., 1978; Seccombe et al., 1981;
Lambert et al., 1984), and Archean seawater sulfate likely had values ranging between
+2 and +10 per mil (Ohmoto and Goldhaber, 1997) (Fig. 5.1). There are no available
data on the sulfur isotopic composition of Yilgarn granites; however, Witt and Swager
(1989) described most southeastern Yilgarn granitoids as being either biotite
monzogranite or monzogranite with I-type affinities. I-type granites worldwide have

CHAPTER FIVE: SULFUR ISOTOPIC COMPOSITION AND MINERAL CHEMISTRY
84
δ34S values between -5 and +7 per mil (Ohmoto, 1986). Significant overlap in these data
sets means that sulfur isotopes are not by themselves diagnostic of a source. They may
provide, however, some information about processes.
5.1.3.2 Ore Forming Processes and their Influence on the Sulfur Isotopic Composition of Pyrite
Gold mineralization occurs in response to changing chemical conditions of the
ore fluid, typically the fluid redox state or pH, which takes place due to physical
changes to the ore fluid, such as fluid immiscibility, fluid mixing or interaction with
reactive wall rocks (Seward, 1973, 1984; Mikucki and Groves, 1990; Mikucki, 1998).
Most researchers agree that gold in orogenic lode gold systems is transported as a
sulfide complex (Phillips and Groves, 1983; Mikucki, 1998; Loucks and Mavrogenes,
1999), and as such, the sulfur isotopic composition of sulfides precipitated from gold-
bearing hydrothermal fluids reflects the sulfur source and/or the in situ physic-chemical
conditions during mineralization, such as temperature, pressure, pH and the oxidations
state of the host rocks (Ohmoto and Rye, 1979; Ohmoto and Goldhaber, 1997).
According to Lambert et al. (1984), Phillips et al. (1986) and Golding et al. (1990c) an
increase in the redox state of the fluid lowers gold solubility significantly, thereby
creating conditions that favor gold precipitation (Fig. 5.2).
Interaction between the ore fluids and iron-rich wall rocks likely facilitated
much of the gold mineralization at New Celebration. In all mineralization styles pyrite
hosts gold, and gold enrichment shows a close correlation with increasing pyrite
(Williams, 1994; Nichols, 2003). Additionally, gold is located predominantly within the
iron-rich wall rock in all mineralization styles except Fracture-style, where narrow
sericite-filled cracks contain the gold-bearing pyrite. Extensive ankerite alteration
accompanies all gold mineralization styles, and pyrite replaces magnetite with
increasing proximity to mineralization. The unaltered intermediate and felsic porphyry
host rocks likely did not provide enough iron to facilitate wall rock reactions, however,
extensive pre-mineralization magnetite and hematite alteration (Nichols, 2003) resulted
in a significant increase in the amount of modal iron which would facilitate fluid-rock
desulfidation according to the following reactions:.
Fe2O3 + 4H2S0 = 2FeS2(py) + 3H2O + H2 (1)
or
(Fe2+2Fe3+)O4 + 6H2S = 3FeS2 + 4H2O + 2H2 (2)

CHAPTER FIVE: SULFUR ISOTOPIC COMPOSITION AND MINERAL CHEMISTRY
85
which could cause gold precipitation according to the following reaction
Au(H2S)2- + H+ + 1/2H2(g) = Au + 2H2S0 (3)
Palin and Xu (2000), however, indicated that this reaction would not effect a change to
the oxidation state of the dissolved sulfur species, therefore there would be no shift to
the isotopic composition of pyrite. An alternative reaction that causes gold to precipitate
in the wall rocks is the carbonation of magnetite to form iron-bearing carbonates
(Phillips et al., 1996). This results in significant fluid oxidation via the following
reactions:
(Fe2+2Fe3+)O4 + 3CO2 = 3Fe2+CO3 + 0.5O2 (4)
and
H2S + 2O2 = SO42- + 2H+ (5)
These reactions destabilize the reduced gold bisulfide complexes and promote gold
precipitation by the following reaction
2(Fe2+2Fe3+)O4 + 6HAu(HS)2 + 0.5O2 = 6Au + 6Fe2+S2 + 9H2O (6)

CHAPTER FIVE: SULFUR ISOTOPIC COMPOSITION AND MINERAL CHEMISTRY
86
Figure 5.2 Plot of oxygen fugacity (log fO2) vs. pH showing gold solubility contours (0.01, 0.1, 1.0 and
10.0 ppm) for gold–bisulfide complexes (Hodkiewicz et al., 2009). Oxidation of fluid to higher ƒO2 is
the most efficient method of removing gold from solution.
Lambert et al. (1984) and Phillips et al. (1986; 1996) suggested that the
extensive carbonate alteration halo around the Golden Mile deposit indicated that
reduced ore fluids became oxidized by magnetite carbonation adjacent to the gold lodes.
Palin and Xu (2000) and Couture and Pilote (1993) also suggested the same mechanism
for gold precipitation and accompanying fluid oxidation at Victory (Western Australia)
and Francoeur 3 (Quebec), respectively. Hodkiewicz (2003) determined a broad
negative correlation (r2=0.73, n=5) between gold grade and sulfide sulfur isotopic
composition at New Celebration and interpreted this as evidence for in situ ore fluid
oxidation and gold precipitation by carbonate alteration of host rock magnetite,
however, this interpretation was based on a very small, statistically meaningless sample
population. In contrast, this study found no correlation between sulfide sulfur isotopic
composition and gold grade (r2=0.10, n=28). Further, Mikucki (2000, 2001, unpublished
AMIRA reports), using quantitative reaction flow modeling of reduced lode gold fluids
with a number of greenstone sequence host rocks, showed that this model for in situ
fluid oxidation was not viable at high fluid-rock ratios except where CO2-CH4 exchange
is chemically inhibited. As neither precipitation mechanism would facilitate in situ
CHAPTER FIVE: SULFUR ISOTOPIC COMPOSITION AND MINERAL CHEMISTRY
87
oxidation of the ore fluid, the sulfur isotopic composition of Stage I and Stage II
Contact-style ore-stage pyrite may likely reflect the composition of the ore fluids.
Fluid inclusion petrography suggests intermittent phase immiscibility during
Stage II gold mineralization. During phase separation reduced gases (H2S, CH4 and H2)
are preferentially partitioned into the gas phase, thus the liquid becomes more oxidizing.
As a result, some of the remaining reduced species in the liquid, such as H2S, will be
oxidized to HSO4-, which is enriched in 34S. Consequently, the reduced sulfur left
behind is depleted in 34S, therefore sulfides that precipitate from the residual liquid
phase are also 34S depleted (Drummond and Ohmoto, 1985). Phase separation is
consistent with the observations made from type 3 quartz veins and quartz and
carbonate alteration related to Stage II gold mineralization and accounts for both the
negative sulfur isotopic composition and the spread in δ34S ratios observed in Stage II
ore-related pyrites. Hodkiewicz et al. (2009), in their detailed study of the Victory
deposit in Kambalda, indicated that fault-induced phase separation, particularly in
shallowly-dipping dilational structures, and back-mixing of modified fluids would lead
to negative sulfide sulfur isotopic compositions and wide spreads in observed values.
They postulated that host structures exerted the greatest control over the isotopic
composition of ore-hosting sulfides and discounted the need for intrinsically oxidized
ore fluids. Depleted sulfur isotopic signatures may also result from fluid mixing (cf.
Neumayr et al., 2008), either by the addition of an oxidized CO2-dominated fluid to
reduced aqueous-carbonic inclusions, or by the addition of CH4 to the ore fluids, which
would drive the solvus towards higher temperatures and pressures and increase the two-
phase field in the H2O-CO2 system (McCuaig and Kerrich, 1998) (see section 4.4.5.2,
Chapter 4).
Light sulfur may also be contributed by pyritic black shales, such as the Kapai
slate, a prominent marker horizon in the Kalgoorlie-Kambalda terrane (Swager, 1989;
Swager et al., 1995). Kapai slate is, however, volumetrically insignificant in the New
Celebration area and immediate surrounds (Langsford, 1989).
5.1.4 Summary
The stable isotopic compositions of sulfides from New Celebration define three
populations: pyrites from Stage I Mylonite-style, which have the least depleted isotopic
signature, sulfides from Stage I Porphyry-style and Stage II Contact-style, which show
considerable overlap in values and range, and pyrites from Stage II Fracture-style,
CHAPTER FIVE: SULFUR ISOTOPIC COMPOSITION AND MINERAL CHEMISTRY
88
which display the most depleted signature. A strong positive correlation between gold
grade and pyrite abundance (Williams, 1994; Nichols, 2003) in all mineralization styles
except Fracture-style, which indicates that wall rock reaction was the mechanism by
which gold precipitated, and evidence for fluid immiscibility and fluid mixing in Stage
II mineralization, suggests that the variability in sulfide sulfur isotopic composition
observed in the different mineralization styles reflects the different ore-forming
processes and/or fluid sources. As wall rock reactions, either by magnetite sulfidation or
carbonation, do not facilitate in situ fluid oxidation, the sulfur isotopic composition of
sulfides associated with Stage I mineralization, likely represents the composition of the
sulfur, and by association, the fluid source. The fluid source is at present unconstrained,
however, the most likely sources are from devolatilized metamorphic crust or felsic
magmatic crust. Contributions from carbonaceous shale units postulated by other
authors to be potential sources of C, S and Au for orogenic deposits (e.g. Junction;Polito
et al., 2001; Golden Mile (Oroya lodes) Bateman and Hagemann, 2004; Carlin, Sukhoi
LogLarge et al., 2009) are considered unlikely at New Celebration given the
volumetrically insignificant amounts of carbonaceous units in the vicinity.
The sulfide sulfur isotopic composition of Stage II mineralization, for which
there is evidence of fluid mixing between oxidized CO2-rich fluids and mixed aqueous-
carbonic fluids, and evidence for at least local phase immiscibility, likely reflects an
interplay between the source of the hydrothermal fluids and in situ oxidation of the ore
fluids during gold mineralization. Evidence for CO2-rich fluids in the fluid inclusion
record suggest a possible magmatic contribution to the hydrothermal fluid system.
5.1.5 Comparisons with other Hydrothermal Mineral Systems
5.1.5.1 Orogenic Lode Gold Deposits
McCuaig and Kerrich (1998) considered that the majority of 34S(sulfide, sulfate)
values from Archean orogenic lode gold deposits around the world ranged between 0
and +9 per mil. They interpreted these values to indicate that ore fluid redox states were
below the SO2/H2S boundary and that sulfur was derived from a uniform source with a
34S composition between -1 and +8 per mil. Potential sulfur sources include dissolved
sulfur in seawater, sulfur-rich magmatic gases or sulfides within the host succession
(Kerrich, 1986), all of which have published sulfur isotopic compositions between 0 and
+10 per mil (Donnelly et al., 1978; Seccombe et al., 1981; Lambert et al., 1984; Ohmoto
and Goldhaber, 1997). Sulfur isotopic ratios are more varied in deposits hosted within
CHAPTER FIVE: SULFUR ISOTOPIC COMPOSITION AND MINERAL CHEMISTRY
89
Proterozoic rocks (Partington and Williams, 2000) and cluster around 0 per mil in
Phanerozoic deposits (Bierlein and Crowe, 2000). There are, however, a number of
studies on deposits with sulfide sulfur isotopic signatures that vary significantly from
mean values (down to -27‰), and whose isotopic compositions possibly reflect the
input from alternative sulfur sources or in situ modification by various ore-forming
processes. Australian examples include the giant Golden Mile deposit (Phillips et al.,
1986; Hagemann et al., 1999), the small (11 t Au), monzonite-hosted Porphyry deposit
(Hodkiewicz, 2003; Hodkiewicz et al., 2009) and the Victory-Defiance deposit in
Kambalda (Palin and Xu, 2000; Hodkiewicz, 2003; Hodkiewicz et al., 2009).
International examples include Hemlo (Thode et al., 1991), Canadian Arrow and
Lakeshore/Macassa (Cameron and Hattori, 1987), gold-related sulfides of the Ashanti
belt (Oberthuer et al., 1996), the Alaska range (Goldfarb et al., 1991) and Donlin Creek
(Goldfarb et al., 2004).
5.1.5.1.1 Eastern Goldfields Province
The sulfur isotopic values of ore-related pyrites from orogenic lode gold
deposits of the Eastern Goldfields Province range between -10.2 and + 12.7 per mil,
with average mean values between -4.0 and +4.0 per mil (Hodkiewicz et al., 2009 and
references therein). Sulfides from most deposits have positive mean values and narrow
ranges (Hodkiewicz et al., 2009), however, some deposits, such as New Celebration
(Hodkiewicz, 2003; Hodkiewicz et al., 2009; Hodge et al., in revision), Porphyry
(Hodkiewicz, 2003; Hodkiewicz et al., 2009), Golden Mile (Phillips et al., 1986;
Hagemann et al., 1999), and to a lesser extent, Victory-Defiance (Hagemann and
Cassidy, 2000; Palin and Xu, 2000; Hodkiewicz, 2003; Hodkiewicz et al., 2009), have
negative mean values and broad ranges. At New Celebration, Porphyry, and Victory,
Hodkiewicz et al. (2009) established a negative correlation between gold grade and
sulfide sulfur isotopic composition, suggesting that pyrites with more depleted values
correlated with higher gold grades, however this correlation was not borne out at New
Celebration by this study. At New Celebration, Hodkiewicz et al. (2009) concluded that
the depleted isotopic composition of ore-stage pyrite resulted from carbonation of wall
rock iron oxides by CO2-bearing hydrothermal fluids. This interpretation does not stand
up to rigorous examination as, firstly, the most depleted values are reported from
sulfides hosted within M2 feldspar-phyric porphyries, which do not contain Fe-oxide
minerals, and secondly, in situ fluid oxidation by carbonate alteration of wall rock
magnetite is not viable in environments with high fluid-rock ratios (Mikucki, 2000;

CHAPTER FIVE: SULFUR ISOTOPIC COMPOSITION AND MINERAL CHEMISTRY
90
2001), such as those expected in a large fault system like the BLFZ. Generally,
however, Hodkiewicz et al. (2009) concluded that the isotopic composition of ore
related pyrites around the Yilgarn resulted from fluid oxidation due to faulting-induced
phase separation in gently dipping dilational structures and back-mixing of modified ore
fluids. They concluded that this process would lead to negative 34S(py) values and
extreme ranges of values without invoking the need for an intrinsically oxidized ore
fluid, such as that derived from magmatic sources, or any meteoric water contributions.
At the Golden Mile, Bateman and Hagemann (2004) concluded that the depleted values
(<-10 ‰) and extreme range (22 ‰ from Fimiston-style mineralization) in 34S values
recorded in sulfides from Fimiston and Oroya lodes resulted from a combination of
sulfur sources (igneous, sedimentary and seawater) and multiple mineralization
processes, such as phase separation and fluid mixing. In contrast, Phillips et al. (1986)
considered that the depleted sulfur isotopic composition of Golden Mile pyrites resulted
from locally oxidizing environments induced by wall rock reactions within ductile shear
zones in differentiated host rocks. Evans et al. (2006), using HCh fluid modeling,
demonstrated that the negative 34S(pyrite) values at Golden Mile could have been
generated by reactions between an Fe3+-bearing mafic wall rock and a sulfur-CO2-Au-
bearing ore fluid, without the need for an external oxidized fluid source.
5.1.5.1.2 Global Examples
As with Eastern Goldfields Province, there are a number of deposits worldwide,
and particularly in North America, which contain sulfides that are systematically
depleted in 34S. An example is the Hemlo deposit, where Thode et al. (1991) concluded
that the wide range of values (-15.9 to +1.0 ‰) observed in ore-stage pyrites resulted
from fluid rock reactions and isotopic exchange between pyrite and sedimentary barite.
Other examples include Canadian Arrow (34S= -12 to -10 ‰ ) and Lakeshore/Macassa
(34S= -14.4 to -9.1 ‰), the isotopic compositions of which Cameron and Hattori
(1987) attributed to a magmatic fluid source. Oberthuer et al. (1996) reported negative
compositions (-10.2 to -5.3 ‰) from gold-related sulfides from the Ashanti belt in
Ghana, and attributed these values to result from pyrite formation from metamorphic
fluids that had equilibrated with the host sedimentary sequence. The 34S values from
gold-related sulfides from the Eocene Juneau belt deposits of Alaska range between -
17.8 and +1.2 per mil and are among the most depleted of orogenic lode gold deposits
worldwide. Goldfarb et al. (1991) considered that the ore forming fluid was
unequivocally of metamorphic derivation with an inferred regional 34S estimate of -7
CHAPTER FIVE: SULFUR ISOTOPIC COMPOSITION AND MINERAL CHEMISTRY
91
to -5 per mil. They attributed the highly variable sulfide sulfur isotopic values to reflect
the composition of additional sulfur derived locally, within and immediately adjacent to
the host rocks, with the most depleted values reflecting a black phyllite host and the
most enriched values reflecting relatively oxidized igneous host rocks. The late
Cretaceous Donlin Creek deposit in southwestern Alaska also contains gold-related
sulfides with very depleted values, ranging between -27.2 and -7.3 per mil (Goldfarb et
al., 2004). Goldfarb et al. (2004) considered that these values reflected the values of
diagenetic pyrite from the host flysch basin and that the ore fluid was derived from
either regional-scale metamorphic devolatilization of the basin above rising mantle
melts or from intrusions with a significant flysch component.
5.1.5.2 Other Gold Mineral Systems
The 34S composition of ore stage sulfides (pyrite, marcasite, arsenopyrite) in
Carlin-type gold deposits ranges between 0.0 and 17.0 per mil, which at 200 °C
indicates an ore fluid composition between -1.0 and +19.0 per mil (Hofstra and Cline,
2000). Hofstra and Cline (2000) noted that this range was similar to diagenetic pyrite
and organic sulfur in lower Paleozoic sedimentary rocks of the Carlin trend and
interpreted this to indicate that at least some of the sulfur was derived from dissolved
pyrite or the metamorphic desulfidation of pyrite. They also concluded that the heaviest
34S values likely resulted from sulfur derived from barite or anhydrite, whereas the
lightest values may have resulted from sulfur derivation from magmatic fluids. In high
sulfidation epithermal deposits, light isotopic compositions of ore-stage sulfides ranging
between -10 and -1 per mil and are generally interpreted to indicate magmatic ore fluids
(Cooke and Simmons, 2000). Light sulfur isotopic signatures generally characterize
alkaline-hosted epithermal and porphyry deposits (Ahmad et al., 1987a; Richards and
Kerrich, 1993; Thompson, 1998), which possibly indicate sulfur contributions from
alkaline magmatic systems, or represent progressive oxidation of the ore fluids by
processes such as phase separation (Richards and Kerrich, 1993). The isotopic
composition of ore-related sulfides in intrusion-related deposits generally ranges
between -5.0 and +5.0 per mil (Thompson and Newberry, 2000, and references therein),
which is typically interpreted to represent contributions from magmatic sulfur. Some
deposits, however, have sulfides with significantly lighter values, e.g., Donlin Creek, (-
22 to -12 per mil, Szumigala et al., 2000) and Scheelite Dome (Mair et al., 2006, -15 to -
10 per mil), which in both cases were interpreted to reflect sulfur derived from adjacent
metasedimentary country rocks.
CHAPTER FIVE: SULFUR ISOTOPIC COMPOSITION AND MINERAL CHEMISTRY
92
5.2 Sulfide, Oxide and Gold Mineral Chemistry
5.2.1 Sample Selection, Preparation and Analytical Procedure
Eleven samples representing Stage I and Stage II ore-related pyrites, and
metamorphic and hydrothermal magnetites and ilmenites were analyzed by laser
ablation inductively coupled plasma mass spectrometry (LA-ICP-MS). The samples
were collected from diamond drill core from within the Hampton-Boulder and Jubilee
open pit and underground deposits. The purpose of these analyses was to chemically
fingerprint oxides, sulfides and gold from different host rocks, mineralization stages and
mineralizing events, and to compare trace element compositions of hydrothermal fluids
(as determined by LA-ICP-MS of individual fluid inclusions) with ore-stage pyrite and
gold grains to evaluate potential metal sources and constrain ore-forming processes.
Analyses were conducted at the ARC Centre of Excellence in Ore Deposits in Hobart
under the supervision of Leonid Danyushevsky and Sarah Gilbert.
Samples were mounted into a one-inch diameter epoxy block and polished with
aluminum oxide powder. The samples were then photographed, to identify suitable
sulfide and oxide grains, and circled with a fine tipped marker to enable easier location
of the grains once in the sample chamber. Grains were ablated in a high-purity He
atmosphere by a New Wave UP-213 Nd:YAG Q-switched Laser Ablation System.
MEOLaser 213 software controlled all laser parameters including spot-size, laser
energy, pulse rate, and laser firing. A 40 µm diameter beam at 40Hz and 60% power
ablated most grains, although smaller grains required a smaller diameter beam. A
mixture of He and Ar carried the ablated material to the Agilent HP4500 Quadrapole
ICP-MS. Each spot analysis took 90 seconds, including an initial 30 seconds during
which no ablated material was analyzed in order to establish background counts. The
ICP-MS was tuned daily using NIST-612 glass, and an in-house standard (STDGL2b-2)
was run every 90 minutes to calculate concentrations of unknowns and to correct for
instrument drift. Selected integration intervals were then converted from counts per
second to concentration using stoichiometric iron (for sulfides and oxides) and gold as
an internal standard (Appendix 7).
Pyrite, magnetite, ilmenite and gold were analyzed for Ti, Cr, Mn, Fe, Co, Ni,
Cu, Zn, As, Se, Zr, Mo, Ag, Cd, Sn, Sb, Te, Ba, La, W, Au, Tl, Pb, Bi, Th, and U. For
ease of comparison on extended multi-element diagrams, concentrations were
normalized to average lithospheric abundances (Clarke values) using the values of

CHAPTER FIVE: SULFUR ISOTOPIC COMPOSITION AND MINERAL CHEMISTRY
93
Taylor (1964) and Vinogradov (1964, all elements except Te), taken from Rosler and
Lange (1972, p.230-231).
5.2.2 Results
Trace elements are hosted in pyrite either as mineral inclusions (e.g. Cu, Pb, Zn,
Ba, Bi, Ag, Sb) or as non-stoichiometric (e.g. As, Tl, Au, Mo) or stoichiometric (e.g.
Co, Ni for Fe or Se, Te for S) lattice substitutions (Huston et al., 1995b). Metamorphic
and hydrothermal recrystallization will remove those elements incorporated either as
inclusions or non-stoichiometric substitutions, but the concentrations of those elements
incorporated in pyrite as stoichiometric substitutions are unaffected (Huston et al.,
1995b). In magnetite, the substitution of various elements (Ti, Al, Mn, Mg, Cr, Zn, Ga,
Ni) for Fe2+ or Fe3+, is dependent on temperature, oxygen fugacity, the availability of
elements in the melt or hydrothermal solution and the order of crystallization (in the
case of primary igneous magnetite (Hodge, 1997)). The location of trace elements
within the host minerals can be determined by comparing the analytical results with
petrographic observations and by observing peak widths on individual mineral spectra.
Elements which are elevated in pyrite, such as Ni and Co, and are analyzed at relatively
constant levels, (i.e. they have a very broad peak, Fig. 5.4), but are not incorporated in
Ni or Co sulfides, likely occur as stoichiometric substitutions within the pyrite or oxide
crystal lattice. In contrast, elements such as Te or Pb-Bi, which are typically analyzed at
erratic levels and form spikes on the mineral spectra, likely occur as mineral inclusions
(e.g., tellurides or galena, respectively) within the pyrite or oxide.
5.2.2.1 Pyrite
Mineral spectra of individual analyses illustrate a number of differences (and
similarities) between pyrites from the different ore stages and mineralization styles.
Pyrites from both mineralizing stages and all mineralization styles contained measurable
Ni and Co incorporated within the pyrite crystal lattice (Fig. 5.4). Nickel

CHAPTER FIVE: SULFUR ISOTOPIC COMPOSITION AND MINERAL CHEMISTRY
94
Figure 5.3 LA-ICP-MS spectrum of ubiquitous Ni and Co incorporated in a Stage I ore-stage pyrite as a
stoichiometric substitution within the pyrite lattice.
and Co are the most common elements found in pyrite (Loftus-Hills and Solomon,
1967) and exhibit complete isomorphous solid solution with Fe in pyrite at temperatures
below 400 °C (Moh, 1980). Stage I ore-stage pyrites also contained Ti, W, Pb, Zn, Cr,
Co, and As within the pyrite crystal structure. Titanium, Mn, Cr, Zn, Cu, W, Mo, Au,
Ag, As Te, Sb, Bi, U, Th, La, and Zr were commonly observed as inclusions in both
Stage I and Stage II pyrites, typically in specific combinations. Gold, Ag, Te and Pb
(Fig. 5.5) were observed together reflecting the presence of Au-Ag-Pb tellurides, which
is consistent with Nichols’ (2003) petrographic observations. Lead and Bi were
typically observed in tandem, reflecting galena and/or bismuthinite inclusions, also
consistent with petrographic observations. Zirconium, U, Th and La were observed
together, probably reflecting silicate inclusions such as zircon or thorite within the
sulfides.
5.2.2.2 Fe-oxides
Mineral spectra from metamorphic fine-grained magnetite in Stage I-related
mylonitized monzonite, pre-mineralization hydrothermal magnetite in high-Mg basalt,
and hydrothermal ilmenite in dolerite show a number of contrasts between the different
Fe-oxides. The hydrothermal magnetites and ilmenites were compositionally simple and

CHAPTER FIVE: SULFUR ISOTOPIC COMPOSITION AND MINERAL CHEMISTRY
95
comprised Fe, Mn, Co, Cr, Ni, Ti, and Zn, and Ti, Mn, Fe, Co, Zn, Ni, and W,
respectively. In contrast, metamorphic magnetites comprised lattice-bound Fe, Ni,
Figure 5.4 LA-ICP-MS spectrum of gold-silver-lead telluride inclusion in a Stage II ore stage pyrite from
the New Celebration deposit.
and Co, but also contained Ti, Cr, Zn, As, Bi, and W in variable proportions within the
crystal lattice. The hydrothermal magnetites and ilmenites typically only contained
zircon inclusions, although rare grains also contained Pb-Ti, Sn, Ba, and Mo-bearing
inclusions, whereas metamorphic magnetite contained abundant poly-metallic (Pb, Ti,
Cr, Bi, Ba, Sb, W, Mn, Zn-bearing) and zircon inclusions.
5.2.2.3 Gold
Gold analyses revealed minor chemical differences between Stage I (Porphyry-
style, 3 grains analyzed) and Stage II (Contact- and Fracture-style, 1 grain and 4 grains
analyzed, respectively). Stage I gold contained only gold and silver within the lattice,
and contained rare Cu, Pb, Ba-Ti and Pb-Bi inclusions, whereas Stage II gold contained
trace amounts of Pb and Cu, in addition to Au and Ag, within the crystal lattice. Stage II
grains also hosted rare Pb-Bi (Fig. 5.6) and Ba-bearing inclusions. These likely
represent sulfide (galena and/or bismuthinite) and sulfate (barite) inclusions within the
gold grains, which is consistent with petrographic and scanning electron microscopy
(SEM) observations (Nichols, 2003) on these samples.

CHAPTER FIVE: SULFUR ISOTOPIC COMPOSITION AND MINERAL CHEMISTRY
96
Figure 5.5 LA-ICP-MS spectrum of a gold-silver grain with a gold-silver-lead-bismuth inclusion
5.2.3 Interpretation of Mineral Chemistry
Figure 5.7 illustrates the abundances of all the elements analyzed, except Fe,
relative to average crustal abundances (data from Rosler and Lange, 1972) in pyrites
from Stage I (Mylonite- and Porphyry-style) and Stage II (Contact- and Fracture-style)
mineralization, in addition to metamorphic magnetite from mylonitized monzonite and
hydrothermal Fe-oxides from high-Mg basalt and dolerite. It clearly illustrates that
pyrites from Stage II Fracture-style mineralization show markedly different trace
element patterns than those pyrites related to both Stage I mineralization styles and
Stage II Contact-style mineralization. They display significant depletion of Ni, Co, Mn,
Cr, and Zn but enrichment of Pb and Bi relative to Stage I and Stage II Contact-style
pyrites, which may reflect the influences of felsic versus mafic and intermediate host
rocks, ore forming processes, fluid sources or a combination of these factors (cf. Phillips
et al., 1988; Carew et al., 2006).
5.2.3.1 Tellurium
Using both standard microscopy and SEM, Nichols (2003) observed calaverite
(AuTe2), petzite (Ag3AuTe2), hessite (AgTe2), tetradymite (Bi2Te2S) melonite (NiTe2),
and altaite (PbTe) associated with Stage I gold mineralization, but did not report
tellurides from Stage II. It is notable that pyrites from both mineralizing stages
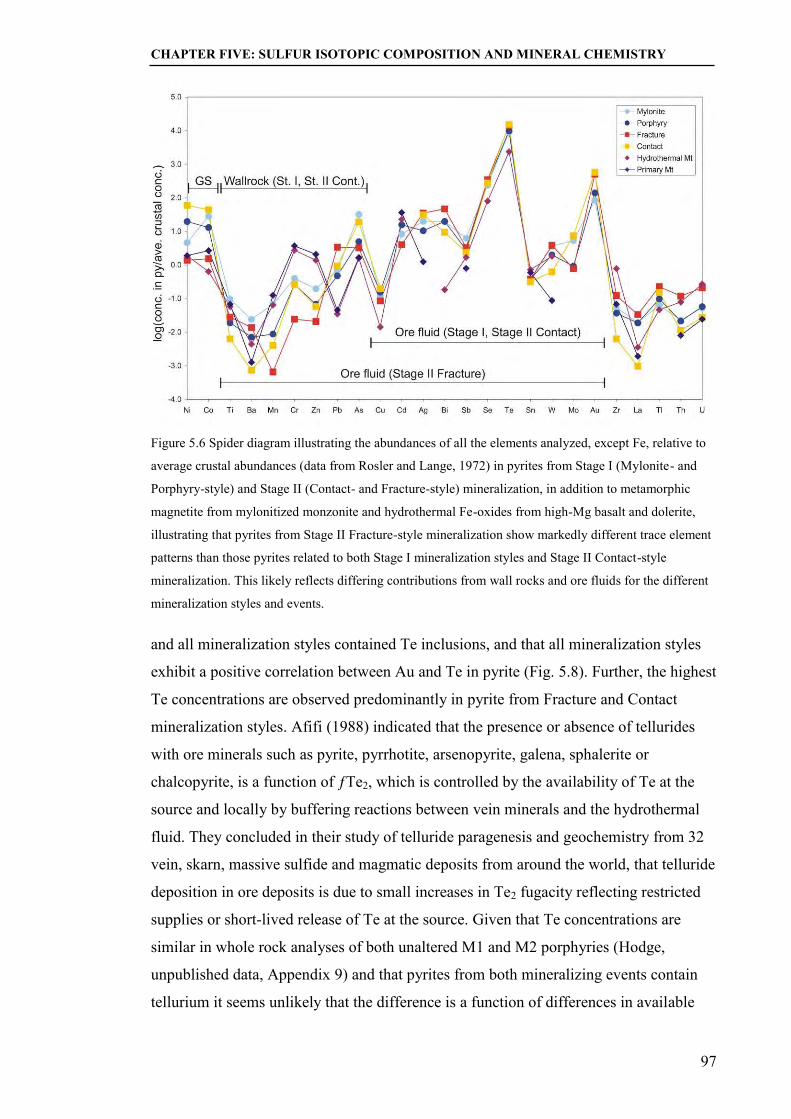
CHAPTER FIVE: SULFUR ISOTOPIC COMPOSITION AND MINERAL CHEMISTRY
97
Figure 5.6 Spider diagram illustrating the abundances of all the elements analyzed, except Fe, relative to
average crustal abundances (data from Rosler and Lange, 1972) in pyrites from Stage I (Mylonite- and
Porphyry-style) and Stage II (Contact- and Fracture-style) mineralization, in addition to metamorphic
magnetite from mylonitized monzonite and hydrothermal Fe-oxides from high-Mg basalt and dolerite,
illustrating that pyrites from Stage II Fracture-style mineralization show markedly different trace element
patterns than those pyrites related to both Stage I mineralization styles and Stage II Contact-style
mineralization. This likely reflects differing contributions from wall rocks and ore fluids for the different
mineralization styles and events.
and all mineralization styles contained Te inclusions, and that all mineralization styles
exhibit a positive correlation between Au and Te in pyrite (Fig. 5.8). Further, the highest
Te concentrations are observed predominantly in pyrite from Fracture and Contact
mineralization styles. Afifi (1988) indicated that the presence or absence of tellurides
with ore minerals such as pyrite, pyrrhotite, arsenopyrite, galena, sphalerite or
chalcopyrite, is a function of ƒTe2, which is controlled by the availability of Te at the
source and locally by buffering reactions between vein minerals and the hydrothermal
fluid. They concluded in their study of telluride paragenesis and geochemistry from 32
vein, skarn, massive sulfide and magmatic deposits from around the world, that telluride
deposition in ore deposits is due to small increases in Te2 fugacity reflecting restricted
supplies or short-lived release of Te at the source. Given that Te concentrations are
similar in whole rock analyses of both unaltered M1 and M2 porphyries (Hodge,
unpublished data, Appendix 9) and that pyrites from both mineralizing events contain
tellurium it seems unlikely that the difference is a function of differences in available

CHAPTER FIVE: SULFUR ISOTOPIC COMPOSITION AND MINERAL CHEMISTRY
98
Figure 5.7 X-Y plot of Au versus Te in pyrite showing a positive correlation between the two elements,
and the high concentrations of Te in Contact- and Fracture-style ore-stage pyrites. Tellurium
predominantly forms gold telluride inclusions in pyrite.
tellurium. Their reported absence from Stage II gold mineralization by Nichols (2003)
was, therefore, likely a function of sample selection.
5.2.3.2 Ore Forming Processes and Mineral Chemistry
Replacement of magnetite by pyrite and the positive correlation between
increasing pyrite abundance and increasing gold grade indicate that Stage I and Stage II
Contact-style mineralization occurred predominantly by wall-rock reaction with iron-
rich wall rock; Stage I by fluid reactions with pre-existing metamorphic magnetite
alteration, and Stage II Contact-style by reactions with primary igneous magnetite. In
contrast, the lack of evidence for oxide replacement by sulfide and the fluid inclusion
evidence for fluid immiscibility suggest that Stage II Fracture-style mineralization
occurred by phase separation, with possible contributions from other fluids.
Stage I ore-forming pyrites contain a number of different elements within the
crystal lattice. The early metamorphic magnetites in Stage I contain a number of
different elements within the crystal lattice, but also contain abundant poly-metallic
inclusions. In contrast, pyrite from Stage II Contact-style mineralization contains only
Ni and Co within its lattice, and the primary magnetite from least-altered high Mg basalt
contains only minor zircon and rare poly-metallic mineral inclusions.
It is likely that the poly-metallic composition of Stage I ore-related pyrites at
least partially reflects the inclusion composition of the pre-cursor magnetite. As
magnetite altered to pyrite, these inclusions were dissolved in the hydrothermal solution
and their elements re-incorporated as stoichiometric or non-stoichiometric substitutions
for iron within the pyrite lattice. This is consistent with the observations of Phillips et al.

CHAPTER FIVE: SULFUR ISOTOPIC COMPOSITION AND MINERAL CHEMISTRY
99
(1986; 1988) who concluded that the composition of pyrite in the Golden Mile reflected
the composition of host rock silicates and iron oxides; i.e. dissolution of these mineral
phases led to the incorporation of chalcophile elements into the hydrothermal fluid
which subsequently precipitated pyrite. By the same principle, the relatively simple
chemical composition of Stage II Contact-style pyrite reflects the inclusion free primary
magnetite of the host high-Mg basalt. Elements such as Bi, Te, Mo, Ag, and Au, which
were absent in primary and metamorphic magnetites but present in Stage I and Stage II
Contact–style pyrites, were not contributed by sulfidation reactions with host rock oxide
minerals, but rather came from the ore fluid.
In comparison, the presence of poly-metallic sulfide inclusions within Stage II
Fracture-style gold-related pyrites most likely originated from the hydrothermal fluid, as
Stage II Fracture-style pyrite formed by phase separation and not by replacement of pre-
existing oxide minerals. This is in agreement with the findings of Carew et al. (2006)
who considered that the composition of pyrite which formed in veins without
contributions from wall-rock reactions reflected the composition of the ore fluid.
5.2.4 Comparisons with other Hydrothermal Gold Mineral Systems
There are very few published analyses of hydrothermal pyrite and magnetite
trace element geochemistry in the scientific literature, particularly from orogenic lode
gold deposits. Ho et al. (1994) analyzed pyrites from the Victory deposit in Kambalda,
by acid digest and inductively coupled plasma mass spectrometry (ICP-MS) or
inductively coupled plasma optical emission spectroscopy (ICP-OES). They reported
generally lower Co, Ni, and As, but significantly higher Cu, Zn, Mo and Au
concentrations than those observed at New Celebration. Phillips et al. (1988) analyzed
pyrites from the Golden Mile and Mt Charlotte, by atomic absorption spectroscopy
(AAS), to determine their trace element composition. They did not publish
concentration values, but demonstrated that only the chalcophile and siderophile
elements were enriched in pyrite relative to average crustal abundances. More recently,
unpublished in situ LA-ICP-MS analyses on sulfides and oxides from the New
Celebration and Golden Mile deposits by Hodge et al. (UWA internal report) illustrate
similarities between New Celebration and St Ives ore stage pyrites, but significant
differences in mineral chemistry between these deposits and the Golden Mile. Pyrites
from Golden Mile were ubiquitously high in As (up to 75,500ppm) relative to New
Celebration, and contained high concentrations of Sb (up to 5,700ppm). This is
consistent with the observations of Phillips et al. (1988), who reported Sb enrichment at

CHAPTER FIVE: SULFUR ISOTOPIC COMPOSITION AND MINERAL CHEMISTRY
100
the expense of Bi, and Amaro (1985) who reported high As, Sb and Te and trace levels
of Bi from Golden Mile and Mt Charlotte ore-stage pyrites. Golden Mile pyrites also
contained tellurium in concentrations up to 2400ppm. Ore –stage pyrites from St Ives
had trace element concentrations more comparable with those observed at New
Celebration. They contained ubiquitous Ni and Co, with very little As (maximum
2200ppm) and Bi (up to 5000ppm) enrichment at the expense of Sb. Tellurium
concentrations at St Ives were significantly lower than those observed at Golden Mile,
but were similar to concentrations in pyrite from New Celebration.
CHAPTER SIX: HYDROTHERMAL FLUID MODEL FOR NEW CELEBRATION
101
6 CHAPTER SIX: HYDROTHERMAL FLUID MODEL FOR THE NEW CELEBRATION SYSTEM
6.1 Ore Forming Processes
Gold precipitates as a function of changing physico-chemical conditions of the
ore fluid, such as temperature, fluid redox or pH. Processes that efficiently facilitate
gold precipitation include phase separation, fluid mixing or wall rock reactions (Seward,
1973, 1984; Mikucki and Groves, 1990; Mikucki, 1998), which can include sulfidation
of iron-rich host rocks (Groves and Phillips, 1987; Mernagh and Bierlein, 2008), CO2
metasomatism (Kishida and Kerrich, 1987) or fluid reduction during reactions with
graphitic host rocks (Naden and Shepherd, 1989; McCuaig and Kerrich, 1998).
6.1.1 Wall Rock Reaction
The reaction of gold-bearing hydrothermal fluids with chemically favorable host
rocks is the preferred mechanism for gold deposition in a significant percentage of
orogenic lode gold deposits, particularly where wall-rock alteration haloes host the
majority of the gold (Groves and Phillips, 1987). Increasing gold grades, therefore,
typically display a positive correlation with sulfide abundance (Goldfarb et al., 2005),
although sulfidation haloes may represent low-grade (<5 g/t Au on average, but can
locally be much higher) selvedges around higher-grade quartz-gold veins.
Predominantly, gold precipitation occurs during desulfidation reactions with Fe-rich
wall rocks according to the following reactions, modified from Phillips et al. (1996):
Fe2O3 + 4H2S0 = 2FeS2(py) + 3H2O + H2 (1)
or
(Fe2+2Fe3+)O4 + 6H2S = 3FeS2 + 4H2O + 2H2 (2)
which causes gold precipitation according to the following reaction
Au(HS)2- + H2 = Au + 2H2S (3)
Pyrite hosts gold, and higher gold grades show a positive correlation with the
increased abundance of modal pyrite in all mineralization styles at New Celebration
(Williams, 1994; Nichols, 2003) except Fracture-style. Additionally, gold is most
abundant in iron-rich wall rocks in all mineralization styles except Fracture-style.
Ankerite alteration accompanies gold mineralization and pyrite replaces magnetite.
Extensive pre-mineralization metamorphic magnetite (Williams, 1994; Hodkiewicz,

CHAPTER SIX: HYDROTHERMAL FLUID MODEL FOR NEW CELEBRATION
102
2003; Hodkiewicz et al., 2009) in otherwise Fe-poor intermediate porphyry host rocks
facilitated fluid-rock desulfidation reactions and consequent gold precipitation. The
majority of gold mineralization at New Celebration is considered to have resulted from
the reaction of gold-bearing hydrothermal fluids with chemically favorable host rocks.
An alternative reaction that may facilitate gold precipitation in chemically
favorable wall rocks is CO2 metasomatism (Kishida and Kerrich, 1987), which
promotes gold mineralization by releasing H2 into the ore fluid, thereby reducing the
fluid pH via the following reaction (modified from Phillips et al., 1996), which
describes the carbonation of magnetite to form Fe-carbonates:
(Fe2+2Fe3+)O4 + 3CO2 = 3Fe2+CO3 + 0.5O2 (4)
and
H2S + 2O2 = SO42- + 2H+ (5)
which destabilize the reduced gold bisulfide complexes and promote gold precipitation
by the following reaction:
2(Fe2+2Fe3+)O4 + 6HAu(HS)2 + 0.5O2 = 6Au + 6Fe2+S2 + 9H2O (6)
Ankerite is abundant in the New Celebration deposit, and is commonly
associated with type 2 ore-stage veins; however, there is no petrographic evidence to
suggest that carbonation of wall-rock magnetite was a significant process at New
Celebration (cf. Hodkiewicz, 2003).
6.1.2 Phase Immiscibility
Phase separation arises from pressure fluctuations caused by seismic-induced
fault-valve behavior (Cox et al., 2001; Sibson, 2001) or the addition of volatiles such as
CH4 or N2 to ore fluids (Naden and Shepherd, 1989). Pressure variations cause acid
volatiles such as H2S, CO2 and SO2 to partition into the vapor phase, resulting in an
increase in fluid pH, but can also cause an increase in fluid ƒO2, as reduced species
(CH4, H2S, H2) partition more readily into the vapor phase than their oxidized
counterparts (Drummond and Ohmoto, 1985; Naden and Shepherd, 1989; Mikucki and
Groves, 1990; Bowers, 1991). As these two processes can have a competing effect, the
ability of phase immiscibility to precipitate gold is dependent on the initial ore fluid pH
and ƒO2 and the magnitude of the increases in these parameters (McCuaig and Kerrich,
1998). Gold precipitation during phase separation is also influenced by the magnitude of
sulfur loss to the vapor phase. Gold in lode gold fluids is typically transported as a gold
CHAPTER SIX: HYDROTHERMAL FLUID MODEL FOR NEW CELEBRATION
103
bisulfide (Au(HS)2-) ligand (Mikucki, 1998) and precipitates upon sulfur loss via
reactions such as:
Au(HS)2- + H+ + 1/2H2(g) = Au + 2H2S0
The addition of volatiles such as N2 or CH4 (Naden and Shepherd, 1989) can
also induce phase separation and consequent gold precipitation by increasing the vapor
field and driving the liquid-vapor solvus to higher temperatures and pressures (McCuaig
and Kerrich, 1998).
There is no evidence for phase separation in type 2 quartz veins associated with
Stage I mineralization at New Celebration. However, the presence of liquid-rich and
vapor-rich end members in some pseudosecondary clusters or trails, total
homogenization into liquid and vapor at the same temperature of at least some of these
inclusions, and variable bulk compositions and molar volumes within individual trails
or clusters of H2O-NaCl-CO2±CH4 inclusions in type 3 veins (Fig. 4.4, Chapter 4)
indicate that at least intermittent phase separation did occur during Stage II
mineralization. The extent to which fluid immiscibility influenced gold mineralization
during Stage II is unclear, as free gold within type 3 veins is rare and the evidence for
significant phase immiscibility is limited. However, the negative sulfur isotopic
composition (-10.6‰ to -3.2‰, refer to Table 5.1 and Figure 5.1, Chapter 5) and spread
of values observed in gold-associated pyrite suggests that phase separation was at least a
partial contributor to gold mineralization during Stage II (cf. Hodkiewicz et al., 2009).
6.1.3 Fluid Mixing
Fluid mixing destabilizes gold in solution either by the addition of a cooler fluid
or by changing the pH or oxygen fugacity of the ore fluid through the addition of either
a more oxidized or more reduced fluid and may result from the mixing of two externally
derived fluids or back-mixing of internally derived end-member fluids (cf. Uemoto et
al., 2002). A number of authors consider that fluid mixing is unlikely in orogenic lode
gold deposits given the uniform fluid conditions observed in broadly disparate deposits
(McCuaig and Kerrich, 1998), however mixing of meteoric fluids with deeply derived
hydrothermal fluids has been proposed for some sub-greenschist facies deposits (e.g.
Hagemann et al., 1994; Gebre-Mariam et al., 1997).
A plot of homogenization temperature vs. salinity of aqueous-carbonic fluid
inclusions assemblages trapped in type 2 and type 3 veins (Fig. 5.3, Chapter 5) does not
indicate that fluid mixing with cooler meteoric water was a significant fluid process (cf.
CHAPTER SIX: HYDROTHERMAL FLUID MODEL FOR NEW CELEBRATION
104
Wilkinson, 2001), and the depth of formation at meso- to hypozonal crustal levels (6 to
14 km depth) would also suggest that this was unlikely. However this relationship does
not take into account the possibility of mixing aqueous or aqueous-dominated fluids
with one or more gas-rich fluids. Neumayr et al. (2008) proposed that gold
mineralization at St Ives formed due to a progressive change of redox conditions
brought about by mixing a reduced, vapor-rich lower crust or mantle derived fluid with
a more oxidized fluid derived locally from felsic and intermediate granitic stocks, and
argued that this mechanism would also explain the presence of gold-bearing sulfides
with depleted sulfur isotopic values. At New Celebration, CO2 –rich fluid inclusions in
type 3 quartz-carbonate veins indicate the presence of carbonic fluids in the
hydrothermal system at some point, so in theory, there may have been mixing between a
CO2-rich fluid and the H2O-CO2 ore fluids. However the temporal relationship between
CO2-rich inclusions and the ore-related inclusions is unclear. The CO2-rich inclusions
are observed in the same veins as the gold related inclusions, but not in the same
inclusion trails or clusters as the H2O-CO2 inclusions. The petrographic and genetic
relationships between these two fluids therefore cannot be determined. Alternatively,
the addition of CH4 to the ore fluids would trigger gold precipitation by initiating phase
separation, and there is abundant evidence (see Chapter 4, Figure 4.1a) for long-lived
methane dominated fluids within the New Celebration hydrothermal fluids. The
majority of aqueous-carbonic fluid inclusions measured in type 2 and type 3 veins,
however, contained only trace amounts of methane, and there was no evidence for
methane-rich fluid inclusions in the same clusters or trails as the gold-related inclusions
in either vein type. Based on these observations, it does not appear that fluid mixing was
a significant factor in gold mineralization.
6.2 Constraints on Fluid and Metal Sources
As with many orogenic lode gold deposits around the world the source of the
hydrothermal fluids and metals at New Celebration remain unconstrained. Potassium,
Mg and Ca over Na ratios, and high base metal concentrations in Stage II related fluids,
relative to Stage I, indicate that at least two different gold-bearing fluids were
responsible for gold mineralization at different times. Traditional models for Archean
orogenic lode gold deposits invoke a hydrothermal ore fluid generated during
metamorphic devolatilization of carbonate-bearing mafic rocks at the greenschist-
amphibolite facies transition (Phillips and Groves, 1983; Powell et al., 1991). The 34S
values of Stage I ore-related pyrites, which range between -7.6‰ and +3.2‰, and ore
CHAPTER SIX: HYDROTHERMAL FLUID MODEL FOR NEW CELEBRATION
105
fluid K/Ca ratios <1 are consistent with a non-magmatic (cf. Haynes and Kesler, 1988),
likely metamorphic fluid source, however, depleted 34S values of ore-stage pyrites and
contrasting hydrothermal fluid chemistry suggest an alternative fluid source for Stage II
mineralization. Ridley and Diamond (2000) suggested that the only viable fluid sources
for the formation of orogenic gold deposits were those derived from metamorphic
devolatilization (Powell et al., 1991) or magmatic fluid derived from granitoids (e.g.
Burrows and Spooner, 1986; Cameron and Hattori, 1987; Mueller et al., 1991; Qiu and
McNaughton, 1999; Mueller, 2007). Other potential fluid sources include the deep
circulation of seawater (Thébaud et al., 2006), modification of CO2-rich mantle fluids
during lower crustal granulite facies metamorphism (Cameron, 1988, 1993),
devolatilization of the crust during prograde metamorphism (Powell et al., 1991), and
devolatilization of felsic magmatic crust (Burrows and Spooner, 1986; Cameron and
Hattori, 1987; Mueller et al., 1991; Qiu and McNaughton, 1999) and/or shoshonitic
lamprophyres (Rock and Groves, 1988a; Rock et al., 1989).
Fluids with a surface (meteoric and/or seawater) origin have been reported from
a number of orogenic lode gold deposits (e.g. Racetrack, Gebre-Mariam et al., 1993;
Wiluna, Hagemann et al., 1994; Golden Kilometre, Gebre-Mariam et al., 1997) and
greenstone belts (e.g. Warrawoona Syncline, Pilbara Craton, Thébaud et al., 2006)
although most orogenic gold deposits are considered to have formed too deep in the
crust for significant surface water influx. In most cases where surface waters were
reported, they were interpreted to have infiltrated the hydrothermal system late in its
evolution (e.g. Taylor et al., 1991) and did not represent primary ore fluids. Exceptions
include Wiluna, where Hagemann et al. (1994) proposed a two-fluid model, in which
shallow surface waters mixed with deeply derived ore-fluids and early stage gold-
pyrite-arsenopyrite mineralization precipitated in equilibrium with the mixed fluid, and
Racetrack, where Gebre-Mariam (1997) proposed mixing of the ore fluid with
infiltrating surface waters as the mechanism by which gold precipitated.
Cameron (1988) proposed upward streaming of mantle CO2 along crustal scale
shear zones during granulite facies metamorphism of amphibolitic lower crust as a
mechanism by which large volumes of fluid and metals could have been transported to
the middle crust to form orogenic lode gold deposits. This was based on the apparent
contemporaneity of lode gold formation and crustal thickening with associated granulite
formation during the Archean, the association of juvenile 13C haloes with gold-related
major crustal breaks, and depletion of large ion lithophiles (LIL) in the lower crust.
CHAPTER SIX: HYDROTHERMAL FLUID MODEL FOR NEW CELEBRATION
106
Whether CO2 flux is the cause of granulite facies metamorphism, however, has been
questioned by Hoernes and van Reenen (1992), as has the ability of granulite facies
metamorphism to induce LIL depletion (Knudsen and Andersen, 1999). Further, studies
of tectonic evolution and gold mineralization in the Yilgarn have concluded that
carbonate alteration with juvenile mantle isotopic signatures associated with the BLFZ
were not associated with the gold mineralization, but rather, predated it (e.g. Bartram
and McCall, 1971; Barley and Groves, 1987; Norris, 1990).
Devolatilization of shoshonitic lamprophyres during crystallization has been
proposed as a possible source of gold in orogenic lode gold deposits (Rock and Groves,
1988a, b; Rock et al., 1989), based on the close spatial association between lamprophyre
dikes and gold mineralization observed in Archean greenstone terranes (Kerrich and
Wyman, 1994), e.g. Golden Mile (Mueller et al., 1988; McNaughton et al., 2005), New
Celebration (Williams, 1994) and Darlot (Kenworthy and Hagemann, 2005).
Lamprophyres, however, are not intrinsically Au-rich, nor are they volumetrically
significant in orogenic gold deposits, and their temporal and spatial relationship is
considered to reflect formation in a common geodynamic setting (Kerrich and Wyman,
1994), rather than a viable source for gold mineralization (e.g. Darlot, Kenworthy and
Hagemann, 2005) in orogenic lode gold deposits.
A number of authors (Burrows et al., 1986; Cameron and Hattori, 1987) have
proposed the devolatilization of felsic magmas during crystallization as a possible
source of fluids and/or metals for orogenic lode gold mineralization, based on C and S
stable isotope compositions, petrographic and isotopic evidence for oxidized ore fluids
and similarities between lode-gold and granite-hosted ore deposits. Potential sources
include tonalite-trondhjemite-granodiorite (TTG) suites (Burrows and Spooner, 1987),
oxidized alkaline magmas (Cameron and Hattori, 1987), evolved igneous complexes
(Qiu and McNaughton, 1999), low-Ca granites (Blewett and Hitchman, 2006) and
reduced Sn-W granites (Thompson et al., 1999). Opponents of the magmatic fluid
model cite the absence of outcropping granites coeval with gold mineralization, and the
expected production of high-salinity aqueous fluids from crystallizing magmas as the
main reasons against a granitic source, however, a number of authors have put forth
compelling arguments supporting a magmatic fluid model. Modeling of hydrothermal
fluid evolution during crystallization of granitic magma by Cline and Bodnar (1991)
demonstrated that high salinity fluids, such as those recorded in porphyry-type deposits,
were not predicted when crystallization took place at pressures above 1.3kbars. Further,
CHAPTER SIX: HYDROTHERMAL FLUID MODEL FOR NEW CELEBRATION
107
Eggler and Kadik (1979) proposed that the exsolution of mixed H2O-CO2 fluids from
granites crystallizing at solidus temperatures was entirely feasible at pressures above
3kbar, due to the increased solubility of CO2 at higher pressures. Recent work by
Landtwing et al. (2002) and Redmond et al. (2004) on the Bingham Canyon porphyry
copper deposit reported that the earliest magmatic fluid, prior to phase separation at
higher crustal levels, was single-phase, CO2 bearing, and of low to moderate (2-7 wt.%
NaCl equiv.) salinity. Mair et al. (2006) also reported low-salinity magmatic fluids from
the Scheelite Dome intrusion related gold deposit in the Tintina gold belt, Yukon.
The major argument rejecting a magmatic source for Archean orogenic lode-
gold ore fluids is the lack of outcropping coeval granites in or near most deposits
(Groves, 1993). Recent work by Bucci et al. (2002; 2004), however, indicates a genetic
relationship between gold mineralization and temporally and spatially related granitoid
magmatism at the Chalice deposit in the Yilgarn Craton. At New Celebration, felsic
intrusions host gold mineralization, which although not large enough themselves to
generate the fluid volumes required for a deposit the size of New Celebration, must
reflect an underlying granitic magma source at depth. This is consistent with the recent
findings of Mueller (2007) who described biotite and sericite alteration and magnetite-
hematite-pyrite gold lodes, which are mineralogically identical to wall rock alteration
described for parts of the Golden Mile (Clout et al., 1990; Bateman and Hagemann,
2004), and for the New Celebration (Norris, 1990) and Kambalda (Watchorn, 1998)
deposits, in his paper on the association between Cu-Au endoskarns and high-Mg
monzodiorite-tonalite intrusions at Mt Shea, located approximately halfway between the
Golden Mile and New Celebration deposits. Mueller (2007) concluded that the Mt Shea,
and by inference, Golden Mile and possibly other deposits spatially associated with the
BLFZ, formed from oxidized magmatic fluids generated from buried sanukitoid series
plutons.
Seismic investigations of the crustal structure of the Yilgarn craton (e.g. Goleby
et al., 2000; Goleby et al., 2002; Stolz et al., 2004; Blewett and Hitchman, 2006; Goleby
et al., 2006) identified large volumes of low-Ca granite underlying the craton. Recent
seismic surveys at St Ives gold mine, located approximately 30 kilometers south of New
Celebration along the Boulder Lefroy Fault Zone, indicate that large granite bodies are
localized within the greenstone belts (Stolz et al., 2004), although the timing of these
granites with respect to gold mineralization is poorly constrained. Neumayr et al. (2008)
consider fluids derived from these granites to be critical to their fluid mixing model for
CHAPTER SIX: HYDROTHERMAL FLUID MODEL FOR NEW CELEBRATION
108
the St Ives gold deposits. More specifically, Blewett and Hitchman (2006) identified a
number of domal structures, two of which are underlain by granite laccoliths or sills that
correspond to the locations of the world class St Ives and Kanowna Belle deposits.
6.3 Integrated Model for the Evolution of the New Celebration
Gold Mineral System within the BLFZ
Detailed fluid inclusion, sulfide and oxide geochemistry and sulfur isotope
analyses of veins, sulfides and oxides associated with pre- syn- and post-gold
mineralization hydrothermal events point towards a complex hydrothermal fluid system
through time within the western segment of the BLFZ. Combining the structural,
hydrothermal alteration and fluid chronology outlined in chapters 3-5, a three-stage
model for the development of the New Celebration gold deposits (Fig 6.1) is proposed.
6.3.1 Early Evolution (D1-D2)
Subsequent to the emplacement of the regional volcano-sedimentary sequence
and N-S directed regional D1 deformation but prior to the onset of peak metamorphism
and gold mineralization at New Celebration, formation of a proto-BLFZ was initiated
by the development of north-south-striking, east and west-dipping discrete thrust faults
during regional D2 east northeast-west southwest-oriented shortening and crustal
thickening (Weinberg et al., 2005). At New Celebration, regional D2 manifested in the
upright tilting of conformable stratigraphic units (Nichols, 2003).

CHAPTER SIX: HYDROTHERMAL FLUID MODEL FOR NEW CELEBRATION
109
Figure 6.1 Hydrothermal fluid flow model for the Boulder Lefroy Fault Zone (BLFZ) at New Celebration.
A. During early D3NC ENE-WSW shortening, M1 plagioclase porphyry is emplaced into the BLFZ and
metamorphosed, which included the development of metamorphic magnetite. Methane dominated fluids
of possible deep crustal or mantle origin circulate through the fault zone. B. Stage I gold mineralization
occurred at or around peak metamorphism by wall rock sulfidation of magnetite (i) in M1 porphyries
from CO2 dominated fluids of likely metamorphic origin. C. M2 quartz-feldspar porphyries were
emplaced in the BLFZ. Stage II gold mineralization occurred due to a combination of fault-valve induced
phase separation of CO2-bearing magmatic fluids and sulfidation of iron oxides at the contact between
high-magnesium basalt and M2 porphyry; D. The fault experienced a period of uplift and erosion during
which highly saline fluids potentially of magmatic origin were emplaced and the fault returned to steady
state with long-lived methane-rich fluids again dominating.
6.3.2 Early D3NC
Reactivation of the early thrust faults during early D3 ESE-WNW-directed
shortening led to sinistral shearing and the linking of these faults to form a coalescent
multi-stranded major crustal fault system (Weinberg et al., 2005) extending from
Kalgoorlie to Kambalda. The presence of deformed lamprophyres adjacent to and
within the BLFZ at New Celebration (Williams, 1994) suggest that at some point the

CHAPTER SIX: HYDROTHERMAL FLUID MODEL FOR NEW CELEBRATION
110
fault had a connection to the deep crust or mantle (cf. Rock and Groves, 1988a; Rock
and Groves, 1988b; Rock, 1990).
Sinistral, oblique-slip, west-block-down to the south-southwest movement
characterized D3 deformation at New Celebration and resulted in the development of a
penetrative north-northwest trending, steeply west-southwest dipping S3NC foliation
(Nichols, 2003). Emplacement of the M1 intermediate plagioclase-phyric porphyritic
dike into the fault zone coincided with the onset of D3NC and peak metamorphism, and
led to the development of metamorphic magnetite in an otherwise iron-poor intrusive
rock of intermediate composition. Type 1 foliation parallel quartz veins display highly
deformed and recrystallized quartz, suggesting formation and deformation prior to the
onset of peak metamorphism. Type 2 quartz-calcite veins emplaced during the early
formation of the BLFZ trapped methane and aqueous-carbonic fluid inclusions in the
calcite margin between 270 °C and 500 °C and pressures between 1.1 and 3.1 kbars
(Fig. 6.1a). Development of the BLFZ as a regionally extensive deep-crustal structure
likely coincided with the introduction of potentially mantle-derived methane into the
hydrothermal system at New Celebration, evidenced by primary, early, pre-gold
methane inclusions in type 2 quartz-carbonate veins.
6.3.3 Stage I Gold Mineralization (D3NC)
Stage I mineralization took place after peak metamorphism during D3NC
deformation (Witt, 1993a; Copeland, 1998; Nichols, 2003). Stage I Au formed within
ductile, oblique-slip, shear-related fabrics in magnetite-altered intermediate plagioclase
(M1) porphyry and mylonitized mafic schist from gold-bearing, aqueous-carbonic
fluids characterized by low- to moderate salinity (2-8 wt.% equiv. NaCl), low to
medium XCO2 (0.03-0.3) and trace methane (XCH4 = 0.0-0.04). Single inclusion laser
ablation analyses indicate that the ore fluid was Na-Ca dominant, with subordinate Mg
and K, and K/Ca ratios <1, consistent with a non-magmatic (cf. Haynes and Kesler,
1988) likely metamorphic fluid origin, and contained ppm level Au, Fe, Cu, Zn, and As.
Formation temperatures and pressures ranged between 330 °C and 500 °C and 2.4 and
4.2 kilobars, respectively, which corresponds to crustal paleodepths between 10 and 14
kilometers (cf. Brown and Hagemann, 1995). The strong positive correlation between
increasing gold grade and modal pyrite abundance, and the replacement of metamorphic
magnetite with pyrite in M1 porphyries and mafic schists indicate that gold precipitated
by wall rock reaction between sulfur-bearing hydrothermal fluids and magnetite-bearing
wall rocks. The lack of phase ratio variability in gold-bearing fluid inclusion trails and

CHAPTER SIX: HYDROTHERMAL FLUID MODEL FOR NEW CELEBRATION
111
clusters in type 2 quartz-calcite veins (Fig. 4.1, Table 4.1, Chapter 4), and the lack of
free gold in these veins indicate that phase immiscibility was not a factor for gold
precipitation during Stage I at New Celebration.
6.3.4 Stage II Gold Mineralization (Late D3NC-Early D4NC)
Stage II mineralization occurred post-D3NC (Nichols, 2003) during brittle
reactivation of the BLFZ at the end of D3NC and during early D4NC (Nichols et al.,
submitted). Stage II gold mineralization formed within the M2 porphyry and at the
contact between the porphyry and high magnesium basalt (Fig. 3.5. Chapter 3) and it is
likely that the emplacement of the porphyry into the fault facilitated fluid movement by
creating pore space along the contacts. Stage II gold mineralization formed from a low
salinity (1.1 to 7.7 wt. % NaCl equiv.) aqueous-carbonic fluid with variable carbon
dioxide contents (XCO2= 0.03 to 0.76) and trace methane. Stage II ore-forming fluids
were Na-Mg-K dominant, with lesser Ca (K/Ca >1), consistent with a magmatic fluid
source (cf. Haynes and Kesler, 1988) in addition to ppm level Au, Fe, Cu, Pb, Zn, and
As. Interpretation of fluid inclusion microthermometry indicate that Stage II gold
mineralization at New Celebration occurred at temperatures and pressures between 280
and 360° C, and 1 to 3.5 kbars, which corresponds to formation depths between 4 and
10km. Temperatures and pressures recorded from Stage II are shallower and cooler than
those recorded from Stage I (Fig. 4.6, Chapter 4), suggesting that a period of uplift and
erosion may have separated the two mineralizing events. Replacement of wall rock
oxides by pyrite in high-Mg basalt along the contacts of the porphyry indicate that
sulfidation reactions were a significant component in forming Stage II gold, at least for
Contact-style mineralization, and fluid inclusion evidence suggests that phase separation
and/or fluid mixing were at least partial contributors to gold mineralization during Stage
II.
6.3.5 Post-gold evolution (>D4)
Secondary post-gold fluid inclusions in types 2 and 3 quartz veins (Fig. 4.1f)
record at least three distinct phases of fault zone reactivation at New Celebration. Low
salinity aqueous fluids without dissolved CO2 had salinities between 0.8 and 13.8
weight percent NaCl equivalent and densities between 0.76 and 1.04 g/cm3. In type 2
quartz veins, inclusions homogenized to liquid between 173 and 351 °C, whereas in
type 3 quartz veins, final homogenization were recorded at much lower temperatures,
between 90 and 152 °C. Calculated isochores indicate that these inclusions were trapped
CHAPTER SIX: HYDROTHERMAL FLUID MODEL FOR NEW CELEBRATION
112
at about 260 °C and a maximum of 3.5 kbars (Figs. 4.5, 4.6, Chapter 4). High salinity
aqueous inclusions in secondary trails in both types 2 and 3 veins had salinities ranging
between 18.4 and 23.2 equivalent weight percent NaCl and densities between 1.09 and
1.17 g/cm3 (Table 4.1, Chapter 4). These inclusions homogenized to liquid between 55
°C and 118 °C. Laser Raman analysis indicated that the petrographically latest observed
inclusions comprised almost pure methane with minor N2 and trace C2H6 and C3H8.
These inclusions homogenized to liquid at around -90 °C and had densities around 0.26
g/cm3. Isochores calculated from the high salinity aqueous inclusions, indicate that they
were trapped at temperatures between 100 and 180 °C and pressures estimated to be
between 0.4 and 1.0kbars (Fig. 4.6). These very low temperatures and pressures indicate
emplacement in a very low P-T tectonic regime, suggesting significant uplift and
erosion took place during the final reactivation stages of the BLFZ.
6.4 Comparisons with other Orogenic Lode Gold Systems
Table 6.1 summarizes the characteristics of orogenic lode gold deposits
including granitoid-hosted orogenic lode gold deposits, intrusion-related gold deposits
and orogenic lode gold deposits hosted within first-order crustal scale fault systems
world wide, as described by a number of authors (Kerrich and Cassidy, 1994; Groves et
al., 1998; McCuaig and Kerrich, 1998; Hagemann and Cassidy, 2000; Goldfarb et al.,
2001; Groves et al., 2003). The following sections compare the New Celebration
deposit with other orogenic lode gold deposits around the world.
6.4.1 Host Rocks and their Role in Gold Precipitation
Stage I mineralization at New Celebration is located within M1 intermediate plagioclase
phyric porphyritic intrusions, whereas Stage II mineralization is hosted in the hanging
wall and foot wall contacts between M2 quartz-feldspar porphyry and tholeiitic basalt,
and within the M2 porphyry. Felsic intrusions commonly host orogenic lode gold
mineralization in the Abitibi subprovince of eastern Canada (Hodgson and Troop,
1988), and granitoids host many orogenic lode gold deposits in Australia (e.g. Granny
Smith (Ojala et al., 1993; Ojala, 1995; Ojala et al., 1995), Lady Bountiful (Bartch, 1990;
Cassidy and Bennett, 1993), Chalice (Bucci et al., 2002; Bucci et al., 2004)). In the
Yilgarn craton, however, iron-rich mafic lithologies are by far the most volumetrically
significant host of orogenic lode gold deposits (Groves, 1990). The M1 intermediate
plagioclase porphyritic intrusions and mylonitized intrusions that host Stage I
mineralization are not intrinsically iron-rich; however, they do contain abundant pre-

CHAPTER SIX: HYDROTHERMAL FLUID MODEL FOR NEW CELEBRATION
113
mineralization metamorphic magnetite. This is, besides the structural control, likely a
key contributing factor in the location of the New Celebration deposits, as petrographic
relationships between pyrite and magnetite in the New Celebration ore zones indicate
that most of the gold at New Celebration formed by the replacement of wall rock
magnetite by gold-bearing pyrite. This is compatible with the accepted theory that the
most common precipitation mechanism for gold at most orogenic lode gold deposits is
precipitation by wall rock sulfidation of iron-rich lithologies (Groves and Phillips, 1987;
Colvine et al., 1988; Groves et al., 2003; Mernagh and Bierlein, 2008)}.
Felsic porphyritic intrusive rocks and the contact between the porphyry and
high-Mg basalt host Stage II mineralization, with the emplacement of the porphyry
stock into the fault zone likely facilitated contemporaneous fluid flow up the fault and
into the depositional site. The correlation between wall rock pyrite abundance and
increasing gold grade (Williams, 1994), and the replacement of iron oxides by pyrite in
the high-Mg basalt indicate that wall rock sulfidation was the major process forming
Contact-style gold during Stage II. However, gold that precipitated in brittle fractures
within the felsic porphyry did not form by wall rock sulfidation reactions. Firstly, there
is not enough iron in the felsic porphyry to facilitate such reactions, as evidenced by the
lack of replacement of oxides by pyrite, and secondly, evidence for phase separation in
type 3 quartz veins, which indicates that at least some of the gold precipitated by
unmixing. Phase separation was likely caused by failure-induced pressure reduction (cf.
Cox et al., 1995; Sibson, 2004) during the intense non-coaxial deformation within the
shear zone, which resulted in extensive brittle fracturing of the felsic porphyry (Norris,
1990), during late D3NC and D4NC.
6.4.2 Methane-rich and Highly Saline Aqueous Fluids
The aqueous-carbonic, low to moderate salinity ore-forming fluids at New
Celebration are typical and representative of orogenic lode gold fluids worldwide
(Hagemann and Cassidy, 2000). The presence of methane (± trace hydrocarbon)
inclusions, however, although not unique, is not a feature of typical orogenic lode gold
deposits. Polito et al. (2001) reported methane inclusions from the Junction deposit near
Kambalda and postulated that they were not part of the ore fluid, but were introduced
later. Methane-dominant fluids both pre- and post-date the ore-related fluids at New
Celebration and, if they are of the same source, appear to be very long lived within the
fault zone. The origin of the methane-dominated fluids at New Celebration is unknown;
however, in deposits such as the Paringa lode (Golden Mile), Lancefield (Laverton) and

CHAPTER SIX: HYDROTHERMAL FLUID MODEL FOR NEW CELEBRATION
114
Table 6.1 Summary of hydrothermal fluid characteristics from orogenic gold deposits, granitoid-hosted gold deposits, intrusion related gold deposits and orogenic deposits hosted in first
order fault zones. ab=albite, ank=ankerite, aspy=arsenopyrite, bio=biotite, bis=bismuthinite, cb=carbonate, cc=calcite, chl=chlorite, cpy=chalcopyrite, fl=fluorite, fuch=fuchsite, ga=galena,
hm=hematite, il=ilmenite, kf=K feldspar, mo=molybdenite, ms=muscovite, mt=magnetite, po=pyrrhotite, py=pyrite, qz=quartz, ru=rutile, sch=scheelite, sid=siderite, sph=sphalerite,
tell=tellurides, tlc=talc, tm=tourmaline, van=vanadian mica.
Orogenic Lode Gold Deposits Granitoid-Hosted Orogenic Lode Gold Deposits Intrusion-Related Gold Deposits Deposits in First Order
Fault Systems New Celebration Golden Mile Victory Hollinger-McIntyre Sigma Lamaque Lady Bountiful Granny Smith Porphyry Kidston Timbarra Kerr-Addison
Resources (tonnes Au)
78 2400 265 1000 290 141.8 11.4 49.5 10.6 94 12.4 340
Mineralization Age
Oroya: 2638±6 Fimiston: 2630 Mt Charlotte: 2600
2627±14 <2679 2682±8 (zircons) 2682±8 (rutile) 2579±9 (muscov) 2596±33 (scheel)
2648±6 2665±4 2667±4 332 2675-2670
Host Rocks tholeiitic basalt intermediate plagioclase-phyric porphyry quartz-feldspar porphyry
Golden Mile Dolerite Defiance Dolerite Paringa Basalt Tripod Hill Komatiite Kapai Slate
tholeiitic basalt andesitic flows volcaniclastic rocks subvolcanic porphyritic diorite
quartz-monzodiorite /granodiorite stock Intermediate-mafic volcanic rocks
biotite granodiorite gabbronorite Mt Pleasant mafic sill
quartz diorite-granodiorite sedimentary ± volcanic rocks
biotite ± hornblende quartz monzonite felsic volcanic rocks
metamorphic rocks, granodiorite, rhyolite porphyry
leucomonzogranite
komatiite and Fe-tholeiite schists diorite dykes
Crustal Depth Stage I: 10-15km Stage II: 4-10km
<6km 5-12km <5-7km <5-7km <5-7km <5-8km 5-10km 3.5km <4km
Metamorphic Grade
mid-upper greenschist
greenschist upper greenschist-lower amphibolite
lower-mid greenschist
greenschist greenschist lower-mid greenschist
mid-upper greenschist
mid-upper greenschist
greenschist
Mineralization Timing
post-peak metamorphism
Oroya and Fimiston: syn-peak metamorphism Mt Charlotte: post-peak metamorphism
post-peak metamorphism
post-peak metamorphism?
post-peak metamorphism
post-peak metamorphism
post-peak metamorphism
post-contact metamorphism
post-peak metamorphism
post-peak metamorphism
Structural Regime brittle-ductile to brittle
brittle-ductile to brittle brittle-ductile brittle-ductile brittle brittle brittle in granitoid brittle in granitoid
brittle-ductile brittle-ductile
Deposit Style Stage I: wall rock hosted Au in sheared and mylonitized intermediate porphyries and basalts Stage II: brittle qz-ser-py veins in felsic porphyry
Fimiston: brittle-ductile fault-hosted lodes Oroya: breccia Mt Charlotte: sheeted veins and stockworks
brittle-ductile shear zones, quartz breccia zones and brittle quartz vein arrays
quartz-carbonate vein and wall rock hosted Au
quartz veins quartz veins sets/stockworks
massive to laminated quartz veins ± breccia zones
conjugate fracture/vein sets, breccias, shear zones
shear zone ± quartz veins
breccia hosted disseminated and veins
vein hosted quartz stockwork and disseminated pyrite
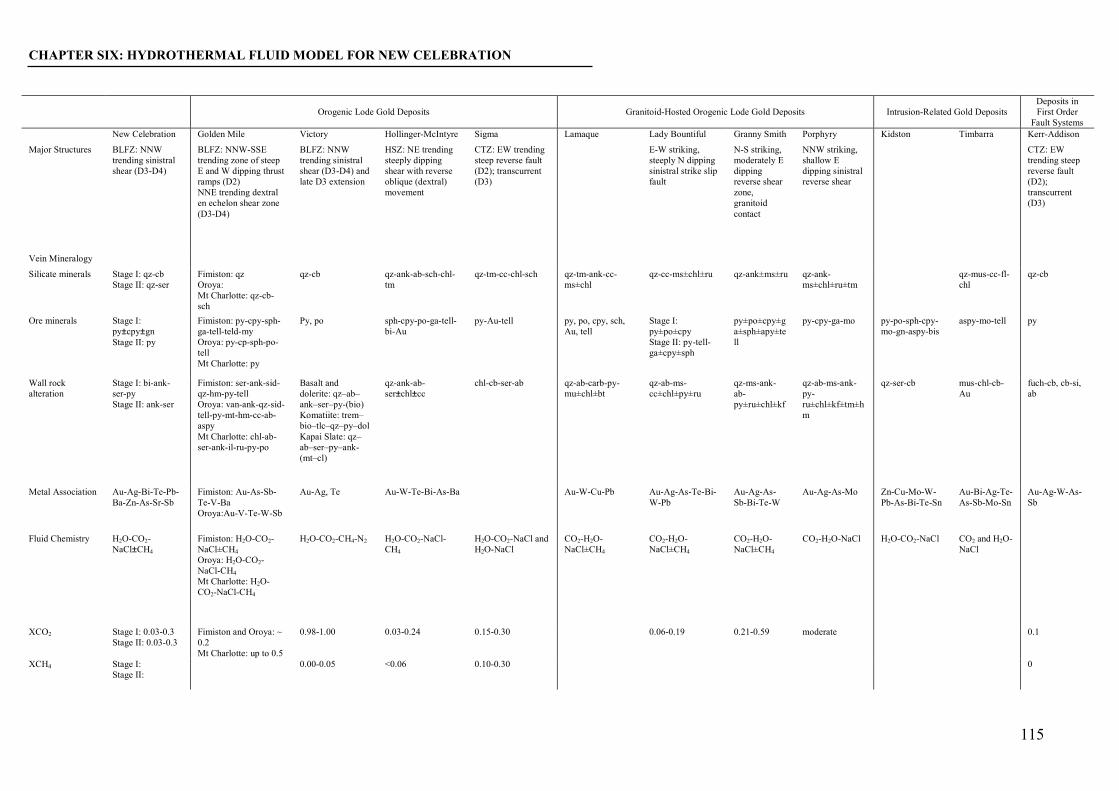
CHAPTER SIX: HYDROTHERMAL FLUID MODEL FOR NEW CELEBRATION
115
Orogenic Lode Gold Deposits Granitoid-Hosted Orogenic Lode Gold Deposits Intrusion-Related Gold Deposits Deposits in First Order
Fault Systems New Celebration Golden Mile Victory Hollinger-McIntyre Sigma Lamaque Lady Bountiful Granny Smith Porphyry Kidston Timbarra Kerr-Addison
Major Structures BLFZ: NNW trending sinistral shear (D3-D4)
BLFZ: NNW-SSE trending zone of steep E and W dipping thrust ramps (D2) NNE trending dextral en echelon shear zone (D3-D4)
BLFZ: NNW trending sinistral shear (D3-D4) and late D3 extension
HSZ: NE trending steeply dipping shear with reverse oblique (dextral) movement
CTZ: EW trending steep reverse fault (D2); transcurrent (D3)
E-W striking, steeply N dipping sinistral strike slip fault
N-S striking, moderately E dipping reverse shear zone, granitoid contact
NNW striking, shallow E dipping sinistral reverse shear
CTZ: EW trending steep reverse fault (D2); transcurrent (D3)
Vein Mineralogy
Silicate minerals Stage I: qz-cb Stage II: qz-ser
Fimiston: qz Oroya: Mt Charlotte: qz-cb-sch
qz-cb qz-ank-ab-sch-chl-tm
qz-tm-cc-chl-sch qz-tm-ank-cc-ms±chl
qz-cc-ms±chl±ru qz-ank±ms±ru qz-ank-ms±chl±ru±tm
qz-mus-cc-fl-chl
qz-cb
Ore minerals Stage I: py±cpy±gn Stage II: py
Fimiston: py-cpy-sph-ga-tell-teld-my Oroya: py-cp-sph-po-tell Mt Charlotte: py
Py, po sph-cpy-po-ga-tell-bi-Au
py-Au-tell py, po, cpy, sch, Au, tell
Stage I: py±po±cpy Stage II: py-tell-ga±cpy±sph
py±po±cpy±ga±sph±apy±tell
py-cpy-ga-mo py-po-sph-cpy-mo-gn-aspy-bis
aspy-mo-tell py
Wall rock alteration
Stage I: bi-ank-ser-py Stage II: ank-ser
Fimiston: ser-ank-sid-qz-hm-py-tell Oroya: van-ank-qz-sid-tell-py-mt-hm-cc-ab-aspy Mt Charlotte: chl-ab-ser-ank-il-ru-py-po
Basalt and dolerite: qz–ab–ank–ser–py-(bio) Komatiite: trem–bio–tlc–qz–py–dol Kapai Slate: qz–ab–ser–py–ank-(mt–cl)
qz-ank-ab-ser±chl±cc
chl-cb-ser-ab qz-ab-carb-py-mu±chl±bt
qz-ab-ms-cc±chl±py±ru
qz-ms-ank-ab-py±ru±chl±kf
qz-ab-ms-ank-py-ru±chl±kf±tm±hm
qz-ser-cb mus-chl-cb-Au
fuch-cb, cb-si, ab
Metal Association Au-Ag-Bi-Te-Pb-Ba-Zn-As-Sr-Sb
Fimiston: Au-As-Sb-Te-V-Ba Oroya:Au-V-Te-W-Sb
Au-Ag, Te Au-W-Te-Bi-As-Ba Au-W-Cu-Pb Au-Ag-As-Te-Bi-W-Pb
Au-Ag-As-Sb-Bi-Te-W
Au-Ag-As-Mo Zn-Cu-Mo-W-Pb-As-Bi-Te-Sn
Au-Bi-Ag-Te-As-Sb-Mo-Sn
Au-Ag-W-As-Sb
Fluid Chemistry H2O-CO2-NaCl±CH4
Fimiston: H2O-CO2-NaCl±CH4 Oroya: H2O-CO2-NaCl-CH4 Mt Charlotte: H2O-CO2-NaCl-CH4
H2O-CO2-CH4-N2 H2O-CO2-NaCl-CH4
H2O-CO2-NaCl and H2O-NaCl
CO2-H2O-NaCl±CH4
CO2-H2O-NaCl±CH4
CO2-H2O-NaCl±CH4
CO2-H2O-NaCl H2O-CO2-NaCl CO2 and H2O-NaCl
XCO2 Stage I: 0.03-0.3 Stage II: 0.03-0.3
Fimiston and Oroya: ~ 0.2 Mt Charlotte: up to 0.5
0.98-1.00 0.03-0.24 0.15-0.30 0.06-0.19 0.21-0.59 moderate 0.1
XCH4 Stage I: Stage II:
0.00-0.05 <0.06 0.10-0.30 0

CHAPTER SIX: HYDROTHERMAL FLUID MODEL FOR NEW CELEBRATION
116
Orogenic Lode Gold Deposits Granitoid-Hosted Orogenic Lode Gold Deposits Intrusion-Related Gold Deposits Deposits in First Order
Fault Systems New Celebration Golden Mile Victory Hollinger-McIntyre Sigma Lamaque Lady Bountiful Granny Smith Porphyry Kidston Timbarra Kerr-Addison
Salinity Stage I: 2.0-8.0 wt.% NaCl equiv. Stage II: 1.5-7.5 equiv.wt.% NaCl
Fimiston and Oroya: <6 wt.% NaCl equiv. Mt Charlotte: 2.0-5.5 equiv.wt.% NaCl
8-9 wt.% NaCl equiv.
6 wt.% NaCl equiv. <10 wt.% NaCl equiv. (aq-cb) 25-34 wt.% NaCl equiv.
low salinity 7-10 wt.% NaCl equiv.
<2.0 wt.% NaCl equiv.
low-moderate 2-10 wt.% NaCl equiv.
5-7 wt.% NaCl equiv.
pH 6.0-8.0 5.3-5.6 5.9 5.0 - 6.0
Temperature Stage I: 330-500 °C Stage II: 280-360 °C
Fimiston and Oroya: 250-350 °C Mt Charlotte: 120-440 °C
370-390 °C 380-480 °C (no phase separation) 277±48 °C (phase separation)
285-395 °C (aq-cb) 60-295 °C (aq)
~400 °C Stage I: 300±50 °C Stage II: 250±50 °C
325±50 350±50 °C 170-350 °C 270-300 (isotopic equilibrium) 300-350
Pressure Stage I: 2.4-4.2 kbars Stage II: 1.5-3.5 kbars
Fimiston: 1.0-2.2 kbar Oroya: 1.0-2.0 kbar Mt Charlotte: 1.5-2.3 kbar
1.7-2.0 kbar 1.8-2.6 kbars (no phase separation) 0.8-1.6 kbars (phase separation)
1.5-2.5 kbar Stage II: ~0.5-2.0 kbar
0.7-2.6 kbar ~2.0kbar
δ34S Stage I: -6.0 to +3.9‰ Stage II: -8.7 - +2.2‰
Fimiston: -10.0 - +12.6‰ Oroya: -3.1 - +5.8‰ Mt Charlotte: -4.2 - +4.3‰
-6.3-+5.1‰ -0.7 - +7.0‰ -1.1 - +9.5‰ +0.3 - +4.5‰ -10.2 - +10.0‰
Gold deposition mechanism
Stage I: wall rock sulfidation Stage II: phase separation and fluid mixing
Fimiston: Phase immiscibility, sulfidation, mixing Oroya: Phase immiscibility Mt Charlotte: wall rock sulfidation
Phase immiscibility, wall rock reaction
phase separation? wall rock reaction
phase separation wall rock reaction Stage II: Phase separation
sulfidation ± phase separation
fluid-wall rock interaction
phase separation Flow Ore: Wall rock sulfidation of tholeiite and albitite Green Cb Ore: Phase separation
References Nichols (2003), Weinberg et al. (2005), this study
Mikucki and Heinrich (1993), Ho (1987), Ho et al. (1990), Mernagh (1996), Golding et al. (1990), Clout (1989), Hagemann et al. (1999), Phillips (1986), Larcombe (1912), Bateman and Hagemann (2004), Hagemann and Cassidy (2000), Weinberg et al. (2005)
Hodkiewicz, (2003); Hodkiewicz et al. (2009), Clark et al., (1989), Neumayr et al., (2008), Palin and Xu, (2000), Petersen et al., (2006)
Hagemann and Cassidy (2000), Smith et al. (1984), Wood et al. (1986a, b), Spooner et al. (1987), Channer and Spooner (1991), Hagemann and Brown (1996)
Robert and Brown (1986), Robert and Kelly (1986)
Burrows and Spooner (1989)
Cassidy (1992), Cassidy and Bennett (1993), Hodkiewicz (2003)
Ojala et al. (1993, 1995), Ojala (1995)
Allen (1987), Cassidy (1992), Hill (1992)
Baker and Andrew (1991), Baker and Tullemans (1990), Thompson et al. (1999)
Mustard (2001), Simmons et al. (1996)
Kishida and Kerrich (1987), Robert and Poulsen (1997)
CHAPTER SIX: HYDROTHERMAL FLUID MODEL FOR NEW CELEBRATION
117
Water Tank Hill (Kambalda) they result from fluid reactions with carbonaceous
sedimentary rocks or the devolatilization of graphitic rocks (Ho, 1987). Black shales,
which are a ubiquitous component of the Kalgoorlie Terrane may be the source of the
methane-dominated fluids, however, black shales do not outcrop within the New
Celebration open pits or underground workings, or any of the adjacent satellite deposits
and therefore are unlikely to be volumetrically significant enough in the immediate
vicinity to contribute to the methane dominated fluids.
Polito et al. (2001) postulated that the presence of methane at the Junction
deposit in Kambalda was the result of Fischer-Tropsch type synthesis of light
hydrocarbons from reactions between a CO2-rich fluid, hydrogen, and titanomagnetite
or ilmenite in the Junction dolerite under reduced conditions. Such reactions have also
been invoked to account for the presence of methane and other hydrocarbons in
orogenic lode gold deposits in Canada (Graney and Kesler, 1995) and South Africa
(Bray et al., 1991; de-Ronde et al., 1992). Sensitive gas chromatographic analyses of
light hydrocarbons aside from methane and ethane were outside of the scope of this
study, however, laser Raman analyses detected only trace amounts of ethane and
propane in monophase CO2-CH4 inclusions. Given that other evidence such as light
sulfide sulfur isotopes and the lack of pyrrhotite in the deposit suggest an oxidized
rather than reduced ore-forming environment, it is unlikely that these types of reactions
led to the presence of methane at New Celebration. Phase separation (Naden and
Shepherd, 1989) and post-entrapment hydrogen diffusion (Hall and Bodnar, 1990;
Ridley and Hagemann, 1996) can also account for methane-rich inclusions. At New
Celebration, phase separation of the gold-bearing fluids did not occur until late in the
fault zone evolution, thereby precluding it as a possible source of the pre-gold methane
inclusions. Post-entrapment changes to CO2-CH4 fluid inclusions should result in highly
variable methane contents of individual inclusions within any given cluster or trail,
(Hall and Bodnar, 1990) as not all inclusions would be modified to the same degree.
Laser Raman analyses demonstrate that this is not the case at New Celebration (see
Table 4.1, Chapter 4, Appendix 5), and that the methane inclusions display remarkable
homogeneity. This implies a primary methane dominated source for these fluids. Duan
(1992) determined that fluids above 400 °C could transport significant volumes of CH4
in solution, which suggests that methane-bearing fluids could have a deep crustal or
even mantle source (Polito et al., 2001). This is consistent with the observations of
Kendrick et al. (2008), who, using noble gas analyses of CH4 fluid inclusions at St Ives,

CHAPTER SIX: HYDROTHERMAL FLUID MODEL FOR NEW CELEBRATION
118
determined that methane inclusions from pyrrhotite-bearing quartz veins had argon
ratios and concentrations consistent with a mantle input. In the absence of evidence for
any other mechanism by which methane could have formed at New Celebration, and the
deep crustal and potentially mantle-tapping nature of the BLFZ, the mantle is
considered the most likely origin for methane-bearing fluids at New Celebration.
Highly saline (18-24 wt.% NaCl equiv.) aqueous fluid inclusions, such as those
observed at New Celebration have also been reported from other orogenic lode gold
deposits, however, the origin of these fluids in orogenic lode-gold deposits is
contentious. Unlike some deposits where highly saline aqueous inclusions are
potentially coeval with mineralization-related aqueous-carbonic fluids and likely are the
result of phase immiscibility (Val d'Or, Kerrich and King, 1993) the late highly saline
inclusions recorded in this study only form secondary trails that crosscut and thus post-
date all other inclusion trails and clusters (see Chapter 4) and are therefore
unequivocally post-mineralization. Previous authors (e.g. Boullier et al., 1998) have
suggested that secondary saline inclusions observed in other orogenic lode gold deposits
are crustal shield brines, however, K/Ca ratios >1, derived from LA-ICP-MS analyses
of these inclusions at New Celebration (Table 4.2, Chapter 4) show that these fluids are
likely compatible with magmatic fluids (cf. Yardley, 2005 and references therein)
associated with granitic intrusions late in the evolution of the orogen (cf. Champion and
Sheraton, 1997).
6.4.3 Cation Ratios and Metal Concentrations in Hydrothermal Fluids
There are few published data of metal concentrations in hydrothermal fluids
from orogenic lode gold deposits, and the majority of those published present bulk
crush-leach analytical techniques. Diamond (1990) and Yardley (1993) examined the
fluid characteristics of metamorphic gold-quartz veins from Brusson in NW Italy and
Pike (1993) studied low-salinity, gas-rich fluids in pegmatites from the Muiane deposit,
Mozambique. More recently Olivo et al. (2006) employed single inclusion laser
ablation-time of flight-inductively coupled plasma-mass spectrometry (LA-TOF-ICP-
MS), in conjunction with crush-leach and microthermometry, to evaluate the fluid
compositions in barren and gold-bearing veins from the Sigma deposit in Canada. None
of these studies presented gold data. Relative to aqueous-carbonic fluids from Muiane
or Brusson, K, Mg, Cu, Mn and Fe concentrations in gold-related aqueous carbonic
fluid inclusions at New Celebration are elevated, whereas Na concentrations are lower.

CHAPTER SIX: HYDROTHERMAL FLUID MODEL FOR NEW CELEBRATION
119
Minor element/Na ratios of New Celebration fluids are generally an order of magnitude
lower than those from the Sigma deposit, with the exception of As, which is higher at
New Celebration.
More single inclusion data are available from porphyry systems, generally
because fluid salinities are higher and elemental concentrations are determined for each
individual inclusion based on their ratio to Na. Small or dilute inclusions that contain
Na near or below the detection limit will have poor accuracy and precision, something
that hampered individual inclusion analysis in the small, dilute fluid inclusions
characteristic of orogenic lode gold deposits prior to the development of new
technologies used to analyze the New Celebration fluid inclusions. Despite new
advances in technology, which have allowed for smaller beam diameters and analyses
that are more sensitive, there is still a significant dearth of in situ Au analyses. Fluids
from the Butte porphyry system (Rusk et al., 2004), contain Na, K, Pb, Zn and Mn in
similar concentrations to gold-related fluids from New Celebration. Ulrich et al. (1999)
published Au concentrations averaging up to 10 ppm in vapor inclusions from the
Grasberg porphyry Cu-Mo-Au deposit, however, these Au concentrations were
analyzed from high-salinity inclusions.
The post-gold hydrothermal fluids at New Celebration are low temperature, high
salinity fluids with a Na>K>>Mg signature. When comparing these fluids
characteristics with Canadian shield brines, sedimentary basin, metamorphic, and
geothermal fluids (Yardley, 2005 and references therein), it is evident that the shield
brines and basin fluids show no similarities to the New Celebration post-gold fluids.
The metamorphic, geothermal and magmatic fluids, however, exhibit a number of
similarities; Na, K and Mg concentrations are comparable in all fluid types, whereas Ca
and Cu concentrations in the New Celebration fluids are most similar to magmatic
fluids. Lead and Zn concentrations are more closely aligned with metamorphic or
geothermal fluids.
As with many orogenic lode gold deposits around the world, the source of the
hydrothermal fluids and metals at New Celebration remain unconstrained. Potassium,
Mg and Ca over Na ratios, and high base metal concentrations in Stage II related fluids
relative to Stage I indicate that at least two different gold-bearing fluids were
responsible for gold mineralization at New Celebration at different times. The origins of
these fluids are likely metamorphic or magmatic (Ridley and Diamond, 2000), or a
CHAPTER SIX: HYDROTHERMAL FLUID MODEL FOR NEW CELEBRATION
120
combination of the two, and maybe locally or regionally derived, however their exact
sources are equivocal.
The presence of Cu, Pb and Zn in the ore fluids and the corresponding lack of
base metal sulfides in the New Celebration gold deposits require an explanation.
Analytical error can be discounted as daily calibration using NIST and in-house
standards assured that precision and accuracy of the analyses were within acceptable
limits. In order to ensure that the results represented the fluid inclusion contents and not
host vein mineral concentrations, only spectra with coincident Na and other cation
peaks were processed. Inclusion-free quartz was check analyzed for interference and
produced no signal.
Significant amounts of base metals do not typically characterize orogenic lode
gold deposits (Kerrich and Hodder, 1982; Hagemann and Cassidy, 2000), and the
geochemistry of base metal-bisulfide complexes is poorly understood (Wood and
Samson, 1998); however, recent advances in single-inclusion laser-ablation inductively
coupled plasma mass spectrometry have allowed detailed investigations of ore fluid
compositions. Olivo et al. (2006) reported Cu/Na, Pb/Na and Zn/Na ratios up to an
order of magnitude higher than those reported in this study, without any associated base
metal mineralization. This would suggest that base metals in lode gold fluids maybe
more common than previously anticipated. The lack of significant base metal sulfides in
orogenic lode gold deposits therefore, suggests either that the physico-chemical
conditions for the precipitation of base metals are not favorable, or that they precipitated
elsewhere in the hydrothermal system.
Base metals are transported as bisulfide or chloride complexes and precipitate
due to changing pH and cooling (Reed, 1998). In orogenic lode gold deposits at mid-
crustal levels, such as the New Celebration gold deposit, wall rock assemblages buffer
ore-fluid pH to near-neutral or slightly alkaline values, and high fluid-rock ratios ensure
that fluid compositions remain constant (Mikucki, 1998). Phase separation can increase
fluid pH as acidic volatiles such as H2S, CO2 and SO2 partition into the vapor phase
(Drummond and Ohmoto, 1985; Naden and Shepherd, 1989; Mikucki and Groves,
1990; Bowers, 1991), however, except in Stage II, Fracture style, phase separation was
not significant at New Celebration. There is also no evidence for either K or CO2
metasomatism, both of which promote gold mineralization by reducing fluid pH, and
the lack of H2 detected in the ore fluids by laser Raman methods indicate that there was
no variability in fluid pH. The lack of distinct cooling and pH changes at New

CHAPTER SIX: HYDROTHERMAL FLUID MODEL FOR NEW CELEBRATION
121
Celebration suggests unfavorable conditions for base metal precipitation. It is, therefore,
most likely that the reason for the absence of base metals at New Celebration is that
base metals did not precipitate out of solution but instead discharged through the
outflow zone of the hydrothermal system. If base metal sulfides were precipitated at
New Celebration, they either formed above the current level of the gold deposit and
were exposed and eroded during uplift, or precipitated below the deposit and have not
been intersected by deep diamond drilling, which currently penetrates about 250m
below the pit floor. According to Reed (1998) in high sulfidation epithermal gold
systems that undergo boiling, base metal sulfides will precipitate prior to gold
formation. However, given that the New Celebration gold deposit does not show any
characteristics of an epithermal deposit, and that a boiling horizon has not been
identified, this possibility remains highly unlikely. Further single inclusion laser
ablation –ICP-MS analyses of lode gold hydrothermal fluids from other deposits may
indicate whether base metals are a characteristic of orogenic lode gold deposits, or
whether they are unique to New Celebration only.
6.4.4 Sulfur Isotopes
McCuaig and Kerrich (1998) considered that most Archean orogenic gold
deposits worldwide had sulfide sulfur isotopic compositions between 0 and 9 per mil,
and that this indicated a uniform fluid sulfur source with an isotopic composition
between -1 and +8 ‰ and a fluid redox state below the H2S-SO2 boundary. More
recently, Hodkiewicz et al. (2009) compiled sulfide sulfur isotopic data from orogenic
gold deposits of the Eastern Goldfields Province and reported a range of values between
-10.2 per mil and + 12.7 per mil, with average mean values between -4.0 per mil and
+4.0 per mil. There are a number of deposits both in Australia and around the world,
including the New Celebration deposit, which contain ore-stage pyrites with sulfur
isotopic signatures that are systematically depleted relative to the mostly uniform -1 to
+8 per mil values referenced by McCuaig and Kerrich (1998) and consequently there
are a range of hypotheses proposed to explain these negative values.
Results of some North American studies (e.g. Goldfarb et al., 1991; Thode et al.,
1991) have indicated that the composition of pyrites in some deposits with
systematically 34S enriched or depleted sulfides correlate with the composition of their
host sediments. Sulfides from vein deposits within the orogenic mesothermal Juneau
gold belt in Alaska have significantly depleted and widely variable 34S values relative
to other deposits, with compositions ranging between -17.8 and +1.2‰. Goldfarb et al.

CHAPTER SIX: HYDROTHERMAL FLUID MODEL FOR NEW CELEBRATION
122
(1991) attributed the depleted sulfide values to local contributions of sulfur to the ore
fluid at the depositional site. At the Hemlo deposit in Ontario, Canada, Thode et al.
(1991) concluded that the depleted 34S values and wide range of values (-15.9 to +1‰)
observed in gold-related pyrites resulted from fluid-rock reactions and isotopic
exchange between hydrothermal pyrite and sedimentary barite in the host rocks.,
The Fimiston and Oroya lodes of the giant Golden Mile deposit have negative
mean values and broad intra-deposit ranges, up to 22 per mil from Fimiston Lode
mineralization (Hagemann et al., 1999; Bateman and Hagemann, 2004). Hagemann et
al. (1999) and Bateman and Hagemann (2004) concluded that the depleted values and
extreme range in 34S recorded at the Golden Mile resulted from a combination of
diverse mineralization processes, such as phase immiscibility and fluid mixing, and
multiple (igneous, sedimentary, seawater) fluid sources.
In a detailed study of eight vein and shear-hosted orogenic lode gold deposits of
the EGP, including New Celebration, Hodkiewicz (2003) and Hodkiewicz et al. (2009)
indicated that structural style was the most important factor controlling the distribution
of 34S(py) values. In their regional study, Hodkiewicz et al. (2009) concluded that
fault-induced phase separation in gently dipping dilational structures would lead to fluid
oxidation, and that mixing of these modified fluids with original unmodified fluids
would lead to negative 34S(py) values and extreme ranges of values without invoking
the need for magmatic fluid sources or meteoric water contributions. At New
Celebration, which is hosted in a steeply dipping compressional structure, they
established a negative correlation (r2=0.73, n=5) between whole rock gold values and
the sulfur isotopic composition of pyrite to propose that the negative isotopic
compositions of pyrite resulted from in situ oxidation of the ore fluid by carbonation
reactions with pre-existing magnetite and hematite.
Mikucki (2000, 2001, unpublished AMIRA reports), demonstrated that the
magnetite carbonation model for in situ fluid oxidation was not viable at high fluid-rock
ratios except where CO2-CH4 exchange was chemically inhibited. Further, this study
revealed no such correlation between gold grade and 34S values (r2=0.10, n=28), and
that there was no petrographic evidence for carbonation of Fe-oxides. The strong
positive correlation between pyrite abundance and gold grade indicates that wall rock
sulfidation reactions between gold-bearing hydrothermal fluids and host rock Fe-oxides
was the major factor in focusing gold mineralization at New Celebration. Given that
neither carbonation nor sulfidation of wall rock magnetite will lead to in situ oxidation

CHAPTER SIX: HYDROTHERMAL FLUID MODEL FOR NEW CELEBRATION
123
of the mineralizing fluid (Mikucki, 2000; Palin and Xu, 2000; Mikucki, 2001), the
depleted sulfur isotopic composition of ore-stage pyrite at New Celebration, therefore,
reflects either the initial composition of the sulfur (Stage I Mylonite and Porphyry-style
and Stage II Contact-style) or oxidation of the ore fluid by phase separation (Fracture-
style Stage II).
6.4.5 Structural Setting
The relationship between Archean orogenic lode gold deposits and first-order
crustal scale fault systems is well established (Eisenlohr et al., 1989; Neumayr et al.,
2000), but these faults themselves do not, for the most part, host the ore deposits.
Rather, at camp- to deposit- scale, distinct second- and higher-order splays branching
off the major crustal-scale structures host the majority of world class (>100t Au)
orogenic lode gold deposits (Eisenlohr et al., 1989; Groves, 1990). An exception to this
is the first-order Larder Lake-Cadillac deformation zone in the southern Abitibi belt of
Canada, which hosts the world-class Kerr-Addison-Chesterville lode gold deposit, in
addition to a number of other deposits and known gold occurrences (Channer and
Spooner, 1991; Smith et al., 1993). Limited research on other major crustal fault zones
around the world, however, indicate that these structures are, for the most part, barren
(e.g. Neumayr and Hagemann, 2002). The Bardoc Tectonic Zone (BTZ) to the north of
Kalgoorlie in the Eastern Goldfields Province is linked to the BLFZ and hosts a number
of small gold deposits and occurrences, however gold production from the BTZ is an
order of magnitude lower than that of the BLFZ (Morey et al., 2007). Morey et al.
(2007) considered that the lack of gold endowment of the BTZ was due to its structural
simplicity, i.e., no secondary splays or large scale antiforms, and its attenuated
deformation history relative to the BLFZ.
6.5 Key factors in the Location of the New Celebration
Deposit
In contrast to most other crustal scale fault systems around the world, the BLFZ
is unique in that it hosts the New Celebration gold deposit within the first-order segment
of the fault and not within adjacent higher-order splays. The key factors in the location
of the New Celebration deposits within the BLFZ appear to be: (1) the long-lived and
complex deformation history of the fault starting with the development of the fault as
discrete N-S-striking steeply dipping thrust faults during D2 compression, followed by
at least two periods of reactivation during D3 and D4; (2) its exposure to a number of
CHAPTER SIX: HYDROTHERMAL FLUID MODEL FOR NEW CELEBRATION
124
different fluids such as possible mantle sourced methane, aqueous-carbonic fluids from
two chemically differing crustal reservoirs, and high-salinity aqueous fluids possibility
reflecting magmatic or hydrothermal fluids; and (3) lithological complexity resulting
from the intrusion of brittle, felsic porphyry intrusive rocks into ductile deformed mafic
and intermediate rocks along the BLFZ, which provided appropriate chemical (Stage I
and II) and rheological (Stage II) conditions favorable for gold mineralization. The fluid
inclusion record at New Celebration indicates that fluid flow through the BLFZ
continued over an extended length of time during a number of deformation events and
included several chemically different fluids of potentially diverse origins, at least two of
which contained gold and other metals and contributed to gold mineralization at New
Celebration
The presence of iron-rich mafic host rocks and the pre-mineralization
metamorphic magnetite alteration of otherwise chemically unfavorable iron-poor
intermediate host rocks (cf. Groves, 1990; Hodgson, 1993) significantly enhanced the
potential for the BLFZ to host gold mineralization at New Celebration. There is
abundant evidence for magnetite replacement by ore-stage pyrite, which indicates that
sulfidation of the wall rock by the ore-fluid was the most important gold mineralizing
process during Stage I and that the metamorphic magnetite was critical to the formation
of Stage I gold.
Dilation of the shear zone and an anti-clockwise change in the orientation of the
shear zone away from the average trend of the BLFZ (Hodkiewicz, 2003) during late
D3NC and early D4NC provided space for the emplacement of the M2 porphyry into the
fault, which in turn likely facilitated increased fluid flow up the contacts of the
porphyry. The high stress regime within the shear zone resulted in extensive brittle
fracturing of the felsic porphyry (Norris, 1990), during late D3NC and D4NC relative to
other less competent units, and gold mineralization occurred, in part, through failure-
induced pressure reduction and consequent phase separation (Cox et al., 1995; Sibson,
2004). The emplacement of the M2 quartz-feldspar porphyry within the BLFZ was,
therefore, likely a key factor by firstly, focusing the ore-fluid along the high-Mg basalt
contact, which induced Contact-style mineralization, and secondly, by providing a
brittle host, which fractured instead of undergoing ductile deformation during fault
movement, for Fracture-style mineralization. Intrusion of the M2 porphyry may also
have coincided with an influx of a second gold-bearing fluid, possibly of magmatic
origin, into the shear zone.

CHAPTER SIX: HYDROTHERMAL FLUID MODEL FOR NEW CELEBRATION
125
6.6 Outstanding Questions
6.6.1 Fluid and Metal Source
The source of hydrothermal fluids and metals remains one of the most
contentious and divisive issues facing researchers and explorers studying and exploring
for orogenic lode gold deposits around the world. This study determined that the
mineralizing events at New Celebration were the result of two distinct fluids circulating
through the BLFZ at separate times and in different hydrothermal P-T regimes. Cation
ratios and base metal concentrations of hydrothermal ore fluids indicate that a switch in
fluid source took place between Stage I and Stage II, and K/Ca ratios indicate that the
Stage II New Celebration fluids have closer affinities to magmatic fluids than to
metamorphic (see Table 4.2, Chapter 4). Sulfur isotopic compositions of ore-stage
pyrite, even though unable to demonstrate unequivocally the source of the ore fluids,
indicate that they are more oxidized than those encountered in most orogenic lode gold
deposits, and as such, may reflect contributions from oxidized granitic sources. Trace
element geochemistry of oxides and ore-stage sulfides support the conclusions that
Stage I and Stage II formed from chemically distinct ore fluids and from different ore
forming processes.
Advances in new techniques such as noble gas (He, Ne, Ar, Kr, Xe), and
halogen (Br, Cl, I) analyses of well constrained methane and aqueous-carbonic fluid
inclusions, in addition to existing techniques such as carbon isotopic analyses on
methane and carbonic inclusions, as well as nitrogen isotopic analyses of
mineralization-related mica alteration, are allowing new interpretations of genetic
models for orogenic lode gold deposits. Noble gases have well constrained isotopic
compositions that vary by orders of magnitude between the mantle and the crust, they
have low abundances and are inert (Ozima and Posodek, 2002). Their rarity means that
they are transported in volatile phases, such as H2O, CO2 and CH4, which are important
for metal transport. Their isotopic composition provides constraints on, and in some
cases, definitive proof of, mantle fluid involvement in gold mineralization (Simmons et
al., 1987), and concentration modifications that take place during wall rock reactions
and phase separation provide information on ore forming processes (Kendrick et al.,
2001; Kendrick et al., 2006). In their recent study of H2O-CO2 and CH4 fluid inclusions
at St Ives, Kendrick et al. (2008) determined that H2O-CO2 inclusions from oxidized
pyrite-bearing quartz veins had 40Ar/36Ar ratios and Ar concentrations consistent with
magmatic fluids, and that CH4 inclusions from reduced pyrrhotite-bearing quartz veins
CHAPTER SIX: HYDROTHERMAL FLUID MODEL FOR NEW CELEBRATION
126
had argon ratios and concentrations consistent with a mantle input. Carbon isotopic
analysis of carbon in fluid inclusions, which provides direct evidence for the
composition of ore forming fluids, was attempted at New Celebration but was
unsuccessful due to the small size of the fluid inclusions (typically <10 µm) and low
abundance of inclusions in quartz veins.
Recent advances in the analysis of the nitrogen isotopic composition of gold-
related mica mineralization may also help resolve the issue of hydrothermal fluid
source. Ammonium (NH4) substitutes for K in potassium silicate minerals (Honma and
Itihara, 1981) and the 15N composition of various crustal and mantle rocks are well
constrained (Jia and Kerrich, 1999 and references therein). Studies on the nitrogen
isotope systematics of micas in orogenic gold-bearing quartz veins of the North
American Cordillera (Jia et al., 2003), quartz veins systems in the Bendigo Gold Field
of Eastern Australia (Jia et al., 2001) and intrusion-hosted deposits of the Charters
Towers Goldfield, Northern Queensland (Kreuzer, 2005), in conjunction with, C, H and
O isotopes, have provided better constraints on the possible sources (metamorphic,
magmatic, meteoric, mantle of hydrothermal fluids within these systems. The
application of newly developed techniques, such as noble gas, halogen and nitrogen
isotope analyses, to well constrained fluid inclusions, may help clarify the source (or
sources) of hydrothermal fluids in orogenic gold systems.
6.6.2 Timing of mineralization
The absolute timing of gold deposition at New Celebration, and the time gap
between the two mineralizing stages is also unconstrained. Pressure-temperature
estimates of 280-360 °C and 1.0-3.5kbars indicate that Stage II mineralization occurred
after a period of interpreted uplift and erosion (Fig. 4.6, Chapter 4) and during a change
from a ductile to a brittle deformational regime during crustal cooling or increasing
strain rate (Weinberg et al., 2005). However, it is unknown how much time separated
these two events. This could be resolved by U-Pb SHRIMP (sensitive-high resolution
ion microprobe dating of zircons within the host M1 and M2 porphyry dikes or ore-
related hydrothermal monazite, traces of which were observed petrographically and by
using a scanning electron microscope (SEM; Nichols, 2003). The Re/Os dating of ore-
stage pyrite as well as Ar/Ar dating of sericite included in ore-stage pyrite could
potentially constrain mineralization ages (Phillips and Miller, 2006).

CHAPTER SIX: HYDROTHERMAL FLUID MODEL FOR NEW CELEBRATION
127
6.7 Summary
The paleohydrothermal evolution of the BLFZ and New Celebration gold
deposits is characterized by discrete pulses of gold-bearing and barren hydrothermal
fluids infiltrating the fault as a consequence of distinct deformation events (D3NC to
D4+NC). At least two gas-rich fluid events are recorded that cannot be conclusively
linked to gold mineralization. These comprise: (1) CH4-dominant fluids, which appear
to span the life of the hydrothermal system, and may be mantle derived, evidenced by
the presence of lamprophyres within the fault at New Celebration, and the lack of
evidence for contributions from carbonaceous country rocks or post-entrapment
modification of H2O-CO2 inclusions; and (2) CO2-dominant fluids, whose petrographic
relationship to the gold related fluids is unclear, but which may represent magmatic
volatiles (cf. Neumayr et al., 2008). The gold mineralization stages are characterized by
low salinity (0.4-7.4 wt. % NaCl equiv.) aqueous-carbonic inclusions (XCO2=0.05-
0.73) with NaCl, KCl, CaCl2 and rare CH4 and as such are similar to many other gold-
bearing fluids observed in many orogenic gold deposits worldwide. There is no fluid
inclusion evidence for significant surface water infiltration into the BLFZ (cf.
Hagemann et al., 1993), and remobilization of gold from carbonaceous sedimentary
rocks (c.f. Large et al., 2009) therefore, the switch in K/Ca ratios may relate to a change
in “deep” fluid sources such as magmatic, metamorphic or mantle fluids. Further
investigations on the gold-bearing and gas rich fluids should include detailed analyses
of the stable (H, C, O, N) and radiogenic (40Ar/36Ar) isotopes, in addition to noble gas
and halogen contents to elucidate further the nature of the “deep” fluid sources.
CHAPTER SEVEN: GOLD MINERALIZATION AND THE BLFZ
128
7 CHAPTER SEVEN: PROTRACTED GOLD MINERALIZATION IN THE KALGOORLIE-KAMBALDA CORRIDOR AND ITS RELATIONSHIP TO THE BOULDER-LEFROY FAULT ZONE, EASTERN GOLDFIELDS PROVINCE, WESTERN AUSTRALIA
J.L. Hodge*, S.G. Hagemann, T.C. McCuaig, P. Neumayr
School of Earth and Environment, University of Western Australia, 35 Stirling
Highway, Crawley, WA 6009, Australia
* Corresponding Author: 3502-188 Keefer Place, Vancouver, BC, V6B 0J1, Canada,
This chapter has been prepared for submission as a paper to Ore Geology Reviews and
as such follows the format required by the journal, including American English. The
references are combined with the references from chapters 1-6 and chapter 8, and
presented in a consistent list at the end of the thesis. In situ sulfur isotope and laser
ablation ICP-MS mineral chemistry methodologies are presented as Appendix 10.
Sulfide sulfur isotopic compositions and sulfide, oxide and gold mineral chemistry
analyses are contained in Appendices 7 and 8 of the thesis, respectively. The first author
conducted the laser ablation ICP-MS mineral chemistry analyses and the in situ sulfur
isotopic analyses not specifically referenced to other researchers. The first author also
conducted the literature research and wrote first draft of the paper. Co-authors S.
Hagemann, T.C. McCuaig and P. Neumayr read drafts of this paper and made scientific
and editorial comments.
ABSTRACT
New geochemical data from the giant Golden Mile and world-class New
Celebration and St Ives gold deposits (>2000 t Au total), in conjunction with data
collected during almost 100 years of research on the gold deposits of the Kalgoorlie-
Kambalda corridor, indicate that the Fimiston and Oroya mineralization styles are
unrelated to the crustal-scale Boulder Lefroy Fault Zone (BLFZ), or to other gold
deposits in this corridor. The unique Au, Te, Sb association observed in ore-stage pyrite
in the Fimiston and Oroya lodes, in conjunction with extensive roscoelite alteration and
the abundance and diversity of syn-mineralization telluride minerals suggests a link to
CHAPTER SEVEN: GOLD MINERALIZATION AND THE BLFZ
129
alkalic magmatism and emplacement at shallow crustal depths (<6km) at temperatures
below 300° C. Structural evidence indicates that these lodes formed during D1 prior to
the establishment of the BLFZ during the change from extension to compression across
the orogen. Similar ore-stage sulfide trace element chemistry from the New Celebration
and St Ives deposits, and their structural location relative to the BLFZ, indicate that
these deposits formed during the same D3 deformation event, and that the hydrothermal
fluids were sourced from the same crustal fluid reservoirs. At the Golden Mile,
underlying rift architecture likely facilitated the movement of gold-rich fluids to the
upper crust where ideal physico-chemical conditions resulted in the formation of the
richest square mile of gold on earth.
1. INTRODUCTION
The Boulder Lefroy Fault Zone (BLFZ), which is located in the central portion
of the 60 km long by 15 km wide Kalgoorlie-Kambalda corridor, is spatially related to
one giant (> 1000t Au), two world-class (>100 t Au) and numerous smaller gold
deposits which together have produced about 2000 tonnes of gold in the last 110 years.
This makes the BLFZ likely the richest gold-endowed fault system on earth.
Researchers have been studying the various gold deposits within this corridor almost
since the initial discovery of gold in Kalgoorlie in 1893; however, no project has drawn
together the abundant available structural, mineralogical and geochemical data to
evaluate the exact role of the BLFZ with respect to the location of gold mineralization
within the Kalgoorlie-Kambalda corridor. This study presents a synthesis of the
existing, and new geological data (Mueller, 2007; Miller et al., 2009; Hodge et al., in
revision), to evaluate the potential role of the BLFZ in forming the giant and world-
class deposits that make the Kalgoorlie-Kambalda corridor so unique.
In the Eastern Goldfields province of Western Australia, the conventional model
for gold mineralization in the Kalgoorlie Terrane is that the bulk of Au mineralization
was introduced during mid- to late regional D3 metamorphism at approximately 2630
Ma (Kent and McDougall, 1995) and is genetically associated with the activation and
reactivation of the Boulder Lefroy Fault Zone (e.g. Clark et al., 1986; Norris, 1990;
Phillips et al., 1996; Nguyen, 1997; Copeland, 1998; Weinberg et al., 2005)
Recent work on the Golden Mile, however, has highlighted discrepancies in the
traditionally accepted syn-D3 mineralization age, and suggests that gold mineralization
episodes, at least at Kalgoorlie, occurred over a far more protracted time period,
CHAPTER SEVEN: GOLD MINERALIZATION AND THE BLFZ
130
possibly as long as 50 Ma (Bateman et al., 2001; Bateman and Hagemann, 2004;
Gauthier et al., 2004; Gauthier et al., in revision). New fluid inclusion data from the
New Celebration deposit, indicate a more complex fluid history at the New Celebration
deposit in the BLFZ, (Hodge et al., in revision), than previously postulated, and recent
investigations at the St Ives camp indicate a far more protracted structural and
hydrothermal history associated with gold mineralization (Neumayr et al., 2008; Miller
et al., 2009) than traditional models postulate. In conjunction with new mineral
chemistry data obtained during this study, these findings suggest that the structural and
hydrothermal history of the BLFZ is more complicated than previous models suggest.
This has highlighted the need for an integrated appraisal of regional scale structural and
hydrothermal fluid systems operating during the Archean.
The Golden Mile, New Celebration and St Ives deposits were chosen to evaluate
similarities and differences in ore mineralogy, alteration systematics and fluid chemistry
for three reasons: (1) they are giant (Golden Mile) and world-class (New Celebration, St
Ives) deposits, which have been studied in detail; (2) both deposits, in addition to New
Celebration, are spatially (and genetically?) related to the crustal-scale BLFZ (Fig. 1);
and (3) well-constrained sample material was readily accessible. Samples for sulfur
isotopic and LA-ICP-MS mineral chemistry analyses from the Golden Mile were
chosen to characterize the different mineralization styles (Fimiston and Oroya),
different lode systems (East and West), different chronological events within a single
lode system (Fimiston Stages I-IV), and shallow versus deep (>600 m below current
surface) gold mineralization (Hagemann et al., 1999). The New Celebration samples
were chosen to represent early and late gold mineralization stages (Hodge et al., in
revision; Nichols et al., in revision), and the St Ives samples were chosen to represent
reduced, pre-gold hydrothermal assemblages, oxidized main-stage gold-related
assemblages and late gold-related hydrothermal assemblages described by Petersen et
al. (2006) and Neumayr et al. (2008).
This paper presents a review of existing structural, hydrothermal alteration,
mineralogical and geochemical from the Golden Mile, New Celebration and St Ives
gold deposits, with new data on the sulfur isotopic composition and mineral chemistry
of hydrothermal oxides, ore-stage pyrites and gold, and integrates the data into a
regional-scale hydrothermal evolution model for the Kalgoorlie-Kambalda corridor.

CHAPTER SEVEN: GOLD MINERALIZATION AND THE BLFZ
131
2. REGIONAL GEOLOGY
The late Archean Eastern Goldfields Province (EGP, Fig. 7.1) is located at the
eastern margin of the Yilgarn craton. The Kalgoorlie Terrane (Fig. 7.1) is a 6 to 9
kilometer thick, elongate, NNW trending volcano-sedimentary sequence which is
bounded to the east and west by wide (up to 1km) anastamosing shear zones (Swager,
1997). The volcano-sedimentary greenstone sequence, which correlates across the
terrane (Table 7.1), comprises basalt, komatiite and felsic volcanic and volcaniclastic
rocks, as well as a number of different granitoid suites. Coarse clastic basins, which
unconformably overlie the greenstone sequence, commonly bury major boundary faults
and are the youngest rocks (Swager, 1997). Regionally, the terrane is metamorphosed to
upper greenschist facies, with locally higher metamorphic grades (up to amphibolite
facies) recorded along the margins of, and adjacent to, granitoid plutons (Witt, 1991;
Mikucki and Ridley, 1993). Swager and Nelson (1997) recognized four main
compressive deformation episodes (D1-D4, Table 7.2) in the Kalgoorlie Terrane, each
preceded by extensional periods. The earliest extensional phase was accompanied by the
emplacement of the mafic-ultramafic volcanic succession, (Williams and Currie, 1993;
Passchier, 1994), which was accompanied by widespread hydrothermal sea floor
alteration (Golding et al., 1987; Clout, 1989) and the formation of the Black Flag
Group, during bimodal mafic-felsic volcanism. This was followed by D1 (> 2675 Ma),
which in Kambalda is interpreted to be a period of south over north compression that
resulted in widespread structural repetition and thrust faulting (Swager and Nelson,
1997). In Kalgoorlie, Swager (1995) and Bateman and Hagemann (2004) interpreted D1
as an east-west compressive event, represented by the Golden Mile

CHAPTER SEVEN: GOLD MINERALIZATION AND THE BLFZ
132
Figure 7.1 Geological map of the Yilgarn Craton showing the Eastern Goldfields Province, the location of
major gold camps and deposits, the location of the New Celebration, Golden Mile (Kalgoorlie) and St
Ives (Kambalda) gold camps, and the terranes of the Eastern Goldfields Province. Modified from
Bateman and Hagemann (2004). K = Kalgoorlie Terrane, U = Kurnalpi Terrane, G = Gindalbie Terrane,
E = Edjudina Terrane, L = Laverton Terrane, N = Norseman Terrane, BLFZ = Boulder Lefroy Fault
Zone.
Fault. A second extensional phase followed and was accompanied by the formation of
coarse clastic basin sequences (e.g., the Merougil Conglomerate and Kurrawang
Formation) and widespread granitoid intrusion (Weinberg et al., 2003). Regional D2

CHAPTER SEVEN: GOLD MINERALIZATION AND THE BLFZ
133
shortening at around 2675-2657 Ma (Nelson, 1997) was approximately east-west and
resulted in north-northwest-south-southeast trending upright folds and penetrative
foliation (Swager, 1989; Swager and Griffin, 1990; Weinberg et al., 2003). During D3
(2663-2645 Ma) and D4 (<2640 Ma) (Nelson, 1997; Swager, 1997), deformation
became strike-slip in nature and progressed from a ductile to a brittle regime (Mueller et
al., 1988; Bateman et al., 2001).
Table 7.1 Correlation between the stratigraphy of the Golden Mile, New Celebration and St Ives gold
camps
Golden Mile (Swager, 1989, Swager et al. 1995) New Celebration (Langsford, 1989) St Ives (Watchorn, 1998)
Kurrawang Formation: Alluvial, fluviatile and shallow-marine coarse clastic sandstone deposited within locally fault-bounded synclines parallel to regional tectonic trend
Merougal Conglomerate Merougal Conglomerate
Black Flag Group: Felsic volcanic and volcaniclastic sedimentary sequence, >1km thick, coarsening upwards
Black Flag Group Black Flag Group
Golden Mile Dolerite: Differentiated tholeiitic dolerite, divided into 10 petrographic units, 800m thick
Triumph Gabbro Condensor and Junction Dolerites
Kalgoorlie Group Paringa Basalt: Up to 1500m thick, high Mg, variolitic, pillowed, cherty interflow sediments
Kyarra Basalt Paringa Basalt
Williamstown Dolerite: Up to 300m thick, fractionated
Pernatty Dolerite, 300-500m thick, basal cumulate pyroxenite
Defiance Dolerite
Kapai Slate: Marker horizon, 5-25m thick, pyritic graphitic slate to magnetite-bearing chert
Kapai Slate Kapai Slate
Devon Consols Basalt: 60-100m thick, high Mg variolitic basalt
Mutooroo Basalt, 100-200m thick Devon Consols Basalt
Hannan's Lake Serpentinite: 800-1200m thick, serpentinized ultramafic lavas grading upward to high Mg basalt
Kambalda Komatiite Kambalda Komatiite
Lunnon Basalt: >200m thick, pillowed tholeiites with thin interflow sediments

CHAPTER SEVEN: GOLD MINERALIZATION AND THE BLFZ
134
Table 7.2 Regional deformation of the Kalgoorlie terrane and correlated events reported from the Golden Mile, New Celebration and St Ives gold camps
Age Regional Deformation Golden Mile Gold Camp (Bateman and Hagemann, 2004)
New Celebration Gold Camp (Nichols, 2003)
St Ives Gold Camp (Archibald, 1985; Swager, 1989; Nguyen, 1997
<2640 (Swager, 1997)
D4 dextral shear on NNE-SSW trending shear zones
D4 Right lateral oblique-slip movement on NNE striking faults
D4NC Strike slip movement on the BLFZ. Movement sense unconstrained
D4 NE-SW shortening. Reactivation of pre-existing faults and development of brittle NE and NW faults
2663-2645 (Nelson, 1997; Swager, 1997)
D3 Strike-slip shear with dextral and sinistral movement
D3 Broad scale left lateral transpression resulting in sinistral strike-slip movement on the BLFZ and BS and local scale antithetic right lateral strike slip movement on NNE striking, steeply NW dipping faults
D3NC Sinistral oblique-slip west block down to the SW movement on the BLFZ
D3 ESE-WNW shortening. Sinistral movement on N-trending faults, tightening of D2 folds, reactivation of D2 faults and development of new faults subsidiary to D2 faults
2675-2657 (Nelson, 1997)
D2 ENE-WSW regional shortening, upright foliation and folds (Swager, 1997; Witt and Swager, 1989; Nelson, 1997; Ridley and Mengler, 2000)
D2 NE-SW compression. Development of NNW striking thrust faults, upright folds and NS striking, subvertical axial planar cleavage
D2NC Tilting of conformable subunits of the Pernatty dolerite to vertical orientations
D2 ENE-WSW shortening,. Development of open upright folds such as the Kambalda Dome, and development of main upright (S2) foliation
>2675 (Swager 1997)
D1 Low angle shears, thrusting, stratigraphic repetition, recumbent folds (Swager, 1989; Passchier, 1994, 1995; Swager and Nelson 1997)
D1 (local)
NE-SW compression. Development of N-trending, NE over SW thrust faults and Kalgoorlie Anticline
D1 N-S compression. Development of E-W-trending thrust faults and recumbent folds such as the Foster, Tramways and Republican thrusts.

CHAPTER SEVEN: GOLD MINERALIZATION AND THE BLFZ
135
2.1 The Boulder-Lefroy Fault Zone The BLFZ occupies the hinge of a regional D2 anticlinal structure (Swager,
1989) and has a complicated history. There are a number of different interpretations
regarding its movement sense and evolution through time (Fig. 7.3). Swager (1989)
described it as a major oblique sinistral wrench structure, active during D3, based on
asymmetrical relationships with several regional fold structures and segmentation of the
Stony Hill-Mt Goddard Dolerite into strike-slip duplexes. While most authors agree that
the major period of fault formation and movement took place during D3, various
movement senses have been interpreted including reverse movement based on seismic
data (Goleby et al., 2000) and field observations (Boulter et al., 1987; Copeland, 1998;
Ridley and Mengler, 2000), oblique-sinistral movement (Swager, 1989; Witt, 1991;
Nguyen et al., 1998; Nichols, 2003) and dextral movement. Mueller et al. (1988)
described two stages of wrench faulting on the BLFZ; an early phase of sinistral
transpressional shearing during D2 followed by a later phase of dextral transcurrent
shearing, with a thrust component, during D3. Weinberg et al. (2005) also described a
two-stage process for the formation of the BLFZ. However, in their interpretation,
isolated north-south trending thrust ramps, which formed during D2 ~east-west
compression, coalesced into a single cohesive fault zone during sinistral strike-slip
reactivation during D3. Nichols (2003) described D3 sinistral oblique-slip and post-D3
horizontal strike-slip movement of unknown direction on the fault from the New
Celebration open pits where the western segment of the BLFZ is exposed. There are a
number of reasons for the discrepancies between authors when describing the kinematic
history of the BLFZ. For example, the fault has a strike length extending over 200 km,
and in places the fault trace is poorly defined due to limited exposure and extensive
transported cover. Outcrop is generally poor throughout the Kalgoorlie-Kambalda
corridor and there are only limited exposures where observations can be taken directly
from within the fault.
3. HISTORY OF GOLD MINERALIZATION IN THE KALGOORLIE-
KAMBALDA CORRIDOR
Prospectors first discovered gold in Kalgoorlie in 1893 and since then the region
has been in continuous production. Much of the gold mineralization is classified as
orogenic

CHAPTER SEVEN: GOLD MINERALIZATION AND THE BLFZ
136
Figure 7.2 Correlation between regional deformation events and gold mineralization and those reported
from the Golden Mile, New Celebration and St Ives camps. From Weinberg et al. (2005).
lode gold, and accounts for most of the gold production in the region. For the first 96
years of production, a number of companies mined the deposit from small pits and
underground
operations. In 1989, these were all combined into a single resource under the
management of Kalgoorlie Consolidated Gold Mines (KCGM), a joint venture between
Newmont Australia and Barrick Gold Corporation. The orogenic gold camp is one of
the largest in the world and has produced over 1,500 tonnes of gold since 1893
(Bateman and Hagemann, 2004).
Gold was initially discovered in the New Celebration area in the 1890’s
(Gresham, 1991), however, mining of any significance did not take place until after
World War I, when the Celebration, Dawns Hope and White Hope mines were
discovered. Rising production costs in the late 1920’s put an end to gold mining in the
area, and exploration did not recommence until the early 1980’s, when the Hampton
Boulder and Jubilee deposits (now comprising the single New Celebration open pit
CHAPTER SEVEN: GOLD MINERALIZATION AND THE BLFZ
137
deposit) were discovered (Copeland, 1998). The New Celebration deposit has produced
over 100 tonnes of gold in the modern mining era (Norris, 1990; Copeland, 1998).
Minor copper-gold mineralization (0.257 Mt at 5 g/t Au for 41,300 ounces) is
also located 10 km to the south of the Golden Mile, at the Hannan South and Shea
deposits (Schiller and Ivey, 1990). These deposits are described as Cu-Au oxidized
epidote endoskarns by Mueller (2007) and are associated with calc-alkaline
monzodiorite and tonalite intrusions adjacent to the BLFZ.
Prospectors discovered gold at Red Hill in Kambalda in 1897. Production
continued for 10 years, then recommenced again in 1919 for another 7 years. The region
was largely ignored until the late 1970’s, when an increasing gold price spurred on
renewed exploration efforts. Gold production recommenced in 1981 (Gresham, 1991)
and has continued to the present day . As of January 2007, the Kambalda gold camp had
produced over 265 tonnes of gold (Neumayr et al., 2008).
4. GEOLOGY OF THE MAJOR GOLD CAMPS IN THE KALGOORLIE-
KAMBALDA CORRIDOR
4.1 Deposit Geology 4.1.1 Golden Mile
The giant Golden Mile camp comprises a number of deposits that in 1989 were
combined under the ownership of Kalgoorlie Consolidated Gold Mines (KCGM) to
form the single Golden Mile deposit (Fig. 7.4). The deposit comprises three major styles
of gold mineralization: the Fimiston and Oroya gold-telluride lodes, which together
have produced the majority of the gold from the Golden Mile, and the Mt Charlotte gold
lodes. All gold mineralization styles are predominantly hosted within the Golden Mile
Dolerite, a 700m thick differentiated tholeiitic sill that intruded the contact between
Paringa Basalt and overlying Black Flag Group metasedimentary rocks. Fimiston
mineralization, forms narrow (<2m) laterally and vertically extensive lodes (Gauthier et
al., in revision) that, are separated into Eastern and Western Lodes by the D1 Golden
Mile fault. Open space fill textures, such as comb, cockade, crack-seal and banded veins
characterize Fimiston-style mineralization. Oroya lodes, which are defined by their high
abundance of telluride minerals and “green leader” V-rich mica alteration (Larcombe,
1912), crosscut Fimiston lodes (Bateman et al., 2001; Bateman and Hagemann, 2004).
Mt Charlotte style

CHAPTER SEVEN: GOLD MINERALIZATION AND THE BLFZ
138
Figure 7.3 Geology of the Golden Mile camp (Bateman and Hagemann, 2004
sheeted quartz-carbonate±scheelite mineralization locally overprints all other lodes at
the Golden Mile, and formed predominantly within unit 8 of the Golden Mile Dolerite.
The Mt Charlotte deposit is the type locality for this mineralization style, however,
Charlotte-type mineralization is observed throughout the Golden Mile. In all
mineralization styles at the Golden Mile, wall-rock reaction of sulfur- and gold-bearing
hydrothermal fluids with iron-rich wall rocks precipitated gold however, phase
separation was locally important, and the high quartz content of unit 8 in the Golden
Mile Dolerite, which imparted a significant competency contrast between it and
surrounding country rocks, was fundamental in the location of the Mt Charlotte
stockwork veins (Bateman et al., 2001; Bateman and Hagemann, 2004).
4.1.2 New Celebration
The New Celebration gold camp comprises six open pits (Hampton-Boulder,
Jubilee, Mutooroo, Celebration, Golden Hope and Early Bird) and four underground ore
zones within the Hampton Decline operation. The Hampton-Boulder and Jubilee open
pits, which until 2001 were separately owned, were amalgamated into a single resource
now referred to as the New Celebration deposit. Gold mineralization at the New
Celebration deposit is hosted within the Boulder Lefroy Fault Zone, in the sheared-out
hinge of the Celebration Anticline. Gold mineralization is located in a sequence of
mafic and ultramafic volcanic rocks intruded by a number of felsic and intermediate
porphyry dikes (Fig. 7.5). The mine sequence, from footwall to hanging wall, comprises
serpentine-tremolite-chlorite-talc altered Kambalda Komatiite, high-Mg basalt schist
and a differentiated dolerite unit, which is schistose proximal to the fault. The contacts

CHAPTER SEVEN: GOLD MINERALIZATION AND THE BLFZ
139
between the komatiite, high Mg basalt and dolerite are conformable, and are intensely
sheared and hydrothermally altered at the BLFZ (Norris, 1990; Williams, 1994;
Copeland, 1998). Two major porphyry stages intrude this contact along the BLFZ: an
early intermediate porphyry, denoted M1 by Nichols (2003), which is strongly
deformed and biotite-ankerite-albite-sericite altered, and a later feldspar-phyric
porphyry (M2), which is boudinaged along strike and down dip, and attains widths of
up to 80m in places. Ore zones are located in the hanging wall of the contact between
the ultramafic and mafic rocks, and are located within and immediately adjacent to the
M1 and M2 porphyries, which intrude the contact along the BLFZ (Norris, 1990;
Williams, 1994; Copeland, 1998; Nichols, 2003). Deformed and mylonitized M1
intermediate porphyries and mafic schists host Stage I gold mineralization (Nichols,
2003), which formed by sulfidation reactions with metamorphic magnetite (Hodge et
al., in revision). Stage II gold mineralization, which is hosted in M2 porphyry dikes and
the contact between the dikes and high Mg basalt (Nichols, 2003) formed by a
combination of wall rock reaction and phase immiscibility (Hodge et al., in revision)
4.1.3 St Ives
The St Ives gold camp) is the second largest in the Kalgoorlie-Kambalda
corridor after the Golden Mile. It is located approximately 30km south of Kambalda,
and incorporates the Victory, Revenge, Defiance, Britannia, Sirius, Orchin, Thunderer,
Phoebe, Leviathin, Junction and Argo deposits (Fig. 7.6 (Hagemann and Cassidy,
2001). The St Ives gold camp is bounded by the BLFZ to the east and the Zuleika shear
zone to the west, and gold mineralization is dominantly controlled by the Playa shear
zone, interpreted as a second-order splay off the BLFZ (Nguyen et al., 1998; Watchorn,
1998). Mafic (Paringa Basalt, Devon Consols Basalt, Defiance Dolerite), ultramafic
(Tripod Hill Komatiite) interflow sedimentary (Kapai Slate) rocks, and minor felsic
porphyries, all metamorphosed to upper-greenschist and lower amphibolite facies, host
the majority of gold mineralization at St Ives, which is located in quartz breccia zones,
brittle-ductile shear zones and brittle quartz vein arrays (Clark et al., 1986). A number
of mechanisms have been proposed for

CHAPTER SEVEN: GOLD MINERALIZATION AND THE BLFZ
140
Figure 7.4 Geology of the New Celebration gold deposit. From Nichols (2003)
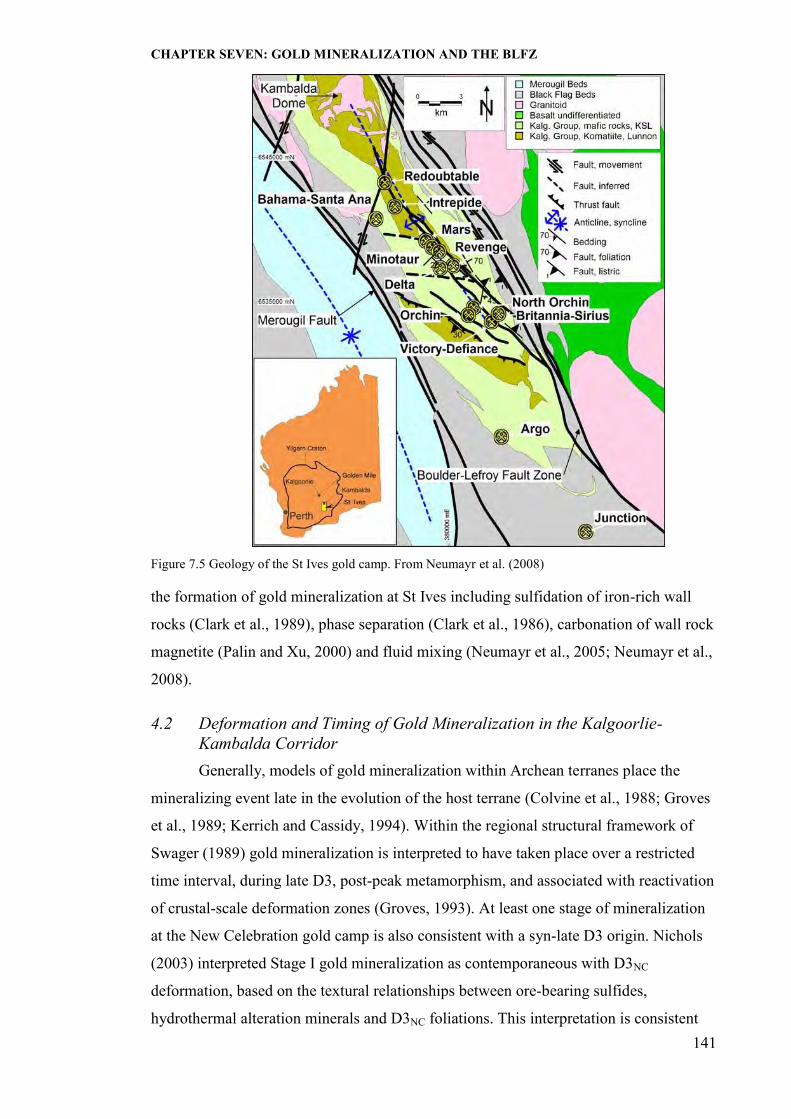
CHAPTER SEVEN: GOLD MINERALIZATION AND THE BLFZ
141
Figure 7.5 Geology of the St Ives gold camp. From Neumayr et al. (2008)
the formation of gold mineralization at St Ives including sulfidation of iron-rich wall
rocks (Clark et al., 1989), phase separation (Clark et al., 1986), carbonation of wall rock
magnetite (Palin and Xu, 2000) and fluid mixing (Neumayr et al., 2005; Neumayr et al.,
2008).
4.2 Deformation and Timing of Gold Mineralization in the Kalgoorlie-Kambalda Corridor Generally, models of gold mineralization within Archean terranes place the
mineralizing event late in the evolution of the host terrane (Colvine et al., 1988; Groves
et al., 1989; Kerrich and Cassidy, 1994). Within the regional structural framework of
Swager (1989) gold mineralization is interpreted to have taken place over a restricted
time interval, during late D3, post-peak metamorphism, and associated with reactivation
of crustal-scale deformation zones (Groves, 1993). At least one stage of mineralization
at the New Celebration gold camp is also consistent with a syn-late D3 origin. Nichols
(2003) interpreted Stage I gold mineralization as contemporaneous with D3NC
deformation, based on the textural relationships between ore-bearing sulfides,
hydrothermal alteration minerals and D3NC foliations. This interpretation is consistent

CHAPTER SEVEN: GOLD MINERALIZATION AND THE BLFZ
142
with the observations of other authors (Witt, 1993b; Copeland, 1998; Weinberg et al.,
2005) who also proposed a D3 origin for gold mineralization at New Celebration.
At St Ives, observations made on a number of different deposits indicate that
gold mineralization formed during D4. Clark et al. (1986) established that auriferous
veins and breccias at the Victory deposit were associated with retrograde carbonation of
peak metamorphic assemblages and constrained mineralization to late in the mine-scale
deformation history. The 40Ar/39Ar dating of metasomatic biotite alteration associated
with gold mineralization initially constrained the minimum age of gold mineralization
to 2601±3 Ma (1) (Clark, 1987), however, recalculation of these data (T.C. McCuaig,
unpublished data) indicated that there was an approximately 1 percent error (26 Ma)
indicating a minimum age of 2627±3 Ma. Nguyen (1998) indicated that mineralization
at Revenge took place late in the tectonic evolution of the camp and obtained a U/Pb
date for gold-related hydrothermal monazite mineralization of 2631±4 Ma. They
considered monazite precipitation synchronous with D3 and interpreted that the gold
mineralization was associated with reverse shear zones formed during D3 oblique-slip
faulting on the BLFZ. Nichols (2003)identified a second, brittle-ductile mineralization
event, at New Celebration, and based on cross-cutting relationships between M1 and
M2 gold-hosting porphyries, interpreted this event as late D3NC or early D4NC
Groves (1993) considered the Fimiston lodes at the Golden Mile to be syn-D3
(2660 to 2632 Ma, Nelson, 1997; Swager et al., 1997), consistent with the crustal
continuum model, whereby gold mineralization occurs over a restricted time period late
in the structural evolution of the host Archean terrane. Recent evidence, however,
indicates that the Fimiston and Oroya lodes are much older. Bateman et al. (2001) and
Bateman and Hagemann (2004) used the relative structural timing of a number of key
structures to constrain Golden Mile mineralization to late D1 early D2. These authors
provided the following evidence for this interpretation: (1) Fimiston lodes are cut by all
structures, including the D1 Golden Mile Fault; (2) the Oroya shoot resides within a
dilational jog between the D2 Oroya hanging wall and footwall shears, which
themselves crosscut the Fimiston lodes; (3) the Adelaide fault, the major regional D3
structure, cuts the Lake View (part of the Fimiston group) lode; and (4) D3 faults have
deformed the lodes consistent with east over west reverse movement. More recently,
Gauthier et al. (in revision) dated an andesite dike suite interpreted as being
contemporaneous with Fimiston lodes at 2663±11 Ma, constraining Fimiston-style
mineralization to the period 2674 to 2652 Ma.

CHAPTER SEVEN: GOLD MINERALIZATION AND THE BLFZ
143
Structural evidence indicates that the Mt Charlotte lodes formed during D4
brittle-ductile faulting. The Mt Charlotte quartz veins crosscut, and are crosscut by
brittle-ductile D4 faults, and reactivated D2 faults indicating contemporaneous fault
movement and vein formation during D4. Kent and McDougall (1995) dated
hydrothermal sericite (40Ar/39Ar) from alteration haloes around gold-bearing quartz
veins at 2602±8 Ma (recalculated to 2625 Ma by L. Snee: Bateman et al., 2001), and
Phillips and Miller (2006) calculated an 40Ar/39Ar date of 2594±8 Ma (2) for
muscovite inclusions within pyrite from Mt Charlotte. Bateman et al. (2001) and
Bateman and Hagemann (2004) interpreted all of these data as indicating that gold
mineralization in the Kalgoorlie camp was a protracted event, which took place over a
period of approximately 50 Ma and which formed distinct and diverse mineralization
styles.
4.3 Hydrothermal Alteration Mineralogy Spatially and/or Temporally Related to Gold Mineralization A laterally extensive zone of chlorite-carbonate alteration extending up to 1 km
from the deposit surrounds the Golden Mile, which Phillips (1986) interpreted as gold
mineralization-related. Clout (1989) described three main alteration types associated
with the Fimiston and Oroya lodes: (1) distal ankerite-sericite-quartz-pyrite, containing
0.1 to 3.0 g/t Au; (2) proximal ankerite-siderite-quartz-hematite-pyrite-
tellurides±albite±tourmaline±magnetite, containing up to 50 g/t Au; and (3) “green
leader”(Larcombe, 1912; Nickel, 1977) roscoelite-ankerite-quartz-siderite-hematite-
pyrite-tellurides, containing up to 100,000 g/t Au.
Gauthier et al. (in revision) further differentiated Fimiston lodes into four
paragenetic stages, based on cross-cutting relationships and alteration assemblages.
Stage I predates gold mineralization and comprises cockade and crustiform carbonate-
magnetite±chlorite and hematite veins and breccias. Stages 2 to 4 are the gold bearing
stages and comprise the following: (Stage 2) gold- and telluride-hosting pyrite-
tourmaline-magnetite-chlorite-carbonate replacement veins; (Stage 3) gold- and
telluride-hosting banded quartz-carbonate extension veins with open-space filling
textures, and pervasive quartz replacement; and (Stage 4) thick quartz-carbonate veins
with a gold and telluride-bearing sericite-carbonate-pyrite vein selvedge, although the
gold content of these veins decreases distal to the deposit.
Three distinct alteration types (Mikucki and Heinrich, 1993), which vary with
depth and which crosscut the earlier chlorite carbonate alteration, characterize the Mt

CHAPTER SEVEN: GOLD MINERALIZATION AND THE BLFZ
144
Charlotte quartz-carbonate-scheelite vein deposit. At shallow levels, <450m depth
below contemporary ground level, type 1 alteration comprises ankerite-sericite-pyrite-
siderite-rutile in the inner zone, and albite-chlorite-magnetite-pyrite in the outer zone.
Type 2 alteration (600-800m depth) comprises proximal ankerite-sericite-pyrite-
siderite-rutile-(pyrrhotite) and distal albite-chlorite-magnetite-pyrrhotite, and is
transitional to type 3 alteration (>800m depth), which comprises proximal ankerite-
sericite-albite-pyrrhotite-siderite-rutile-(pyrite) and distal albite-chlorite-magnetite-
pyrrhotite. Pyrrhotite increases in abundance at the expense of pyrite with increasing
depth and temperature, and proximity to the ore bodies.
A number of different alteration events at different scales are recognized at St
Ives. The earliest recognized event is syn-volcanic to early deformation-related (De to
D1) seawater spilitization of the greenstone sequence, particularly in the Foster thrust
area (Nguyen, 1997), to the south of Kambalda. Regional carbonate alteration
associated with D2-D3 deformation along the BLFZ is ubiquitous to the region
(Bartram and McCall, 1971; Phillips, 1986; Barley and Groves, 1987). Neumayr et al.
(2008) recognized a pre-gold skarn-type epidote-magnetite-pyrite-chalcopyrite-quartz
assemblage spatially associated with, and forming a contact aureole to, barren porphyry
stocks. At the deposit scale, Neumayr et al. (2008) described three gold-related
alteration assemblages:(1) Stage 2a reduced pyrrhotite-carbonate-amphibole-biotite ±
quartz ± arsenopyrite ± pyrite; (2) Stage 2b oxidized plagioclase-Fe-carbonate-pyrite-
chalcopyrite ± Au ± magnetite ± hematite, and (3) late- to post-main gold quartz (vein)
± pyrite ± chlorite ± Au ± carbonate. Clark et al. (1986) described post-D3 metasomatic
biotite and retrograde carbonate alteration associated with gold mineralization at the
Victory deposit.
Widespread carbonate (dominantly calcite) alteration, unrelated to gold
mineralization, is ubiquitous throughout the New Celebration mine sequence (Norris,
1990) and likely represents regional scale, fault controlled mantle carbonate associated
with D2-D3 deformation on the BLFZ (cf. Bartram and McCall, 1971; Phillips, 1986;
Barley and Groves, 1987). At the deposit scale, early metamorphic magnetite alteration,
hosted within S3NC (NC denotes the regional equivalent at New Celebration) foliation
planes and associated with D3NC deformation, (Nichols, 2003) pre-dates Stage I
mineralization. Nichols (2003) identified two gold-related alteration assemblages: (1)
Stage I gold-related ankerite-biotite-pyrite ± albite alteration; and (2) Stage II Au-
related albite-ankerite-sericite-pyrite ± magnetite ± hematite alteration. Nichols (2003)
CHAPTER SEVEN: GOLD MINERALIZATION AND THE BLFZ
145
and Nichols et al. (in revision) recognized a number of post-gold alteration
assemblages: (1) coarse-grained, anhedral, elongate hornblende locally developed in
fractures with M1 porphyry dikes; (2) coarse-grained, euhedral, disseminated actinolite-
tremolite overprinting D3 deformation fabrics and closely associated with the M2
porphyry margins, and (3) coarse-grained, euhedral carbonate, which overprints all
other alteration assemblages.
4.4 Hydrothermal Fluid Chemistry Associated with Gold Mineral Systems in the Kalgoorlie-Kambalda Corridor A number of fluid inclusion studies have been undertaken at the New
Celebration, Kalgoorlie and St Ives deposits. The results of these studies are
summarized in Table 7.3 and Fig. 7.7.
Ho (1987) and Ho et al. (1990) reported mixed (30-50 mole % CO2) low salinity
(<5.5 equiv. wt. % NaCl) fluid inclusions from both Fimiston and Oroya-style
mineralization, and noted that the inclusions associated with the Oroya lodes contained
significant methane. They postulated formation pressures and temperatures between 1.0
to 4.0 kbars and 90 to 230° C for Fimiston-style mineralization and 3.1 to 3.4 kbars and
225-335° C for Oroya-style mineralization. In contrast, Clout (1989) reported much
lower formation pressures, between 0.3 and 0.5 kbars, from concomitant aqueous,
mixed and CO2-rich inclusions, which he interpreted to represent 2 episodes of phase
separation. This formed the basis of his hypothesis that the Fimiston and Oroya lodes
were of epithermal genetic origin. Bateman et al. (2001) and Bateman and Hagemann
(2004) later questioned Clout’s calculations of paleopressures as no L/V ratios were
documented and questionable equations of states for isochore calculations were used.
Fluid inclusion, mineral equilibria, and calcite-dolomite geothermometry
indicate that gold mineralization at the Victory deposit in St Ives occurred at
temperatures and pressures between 340° C and 430° C and 1.7 to 2.0 kbars,
respectively (Clark et al., 1989). K. Petersen (pers. com. 2007) analyzed fluid inclusions
from a number of St Ives deposits and inferred formation conditions of 440-510° C and
1.7-
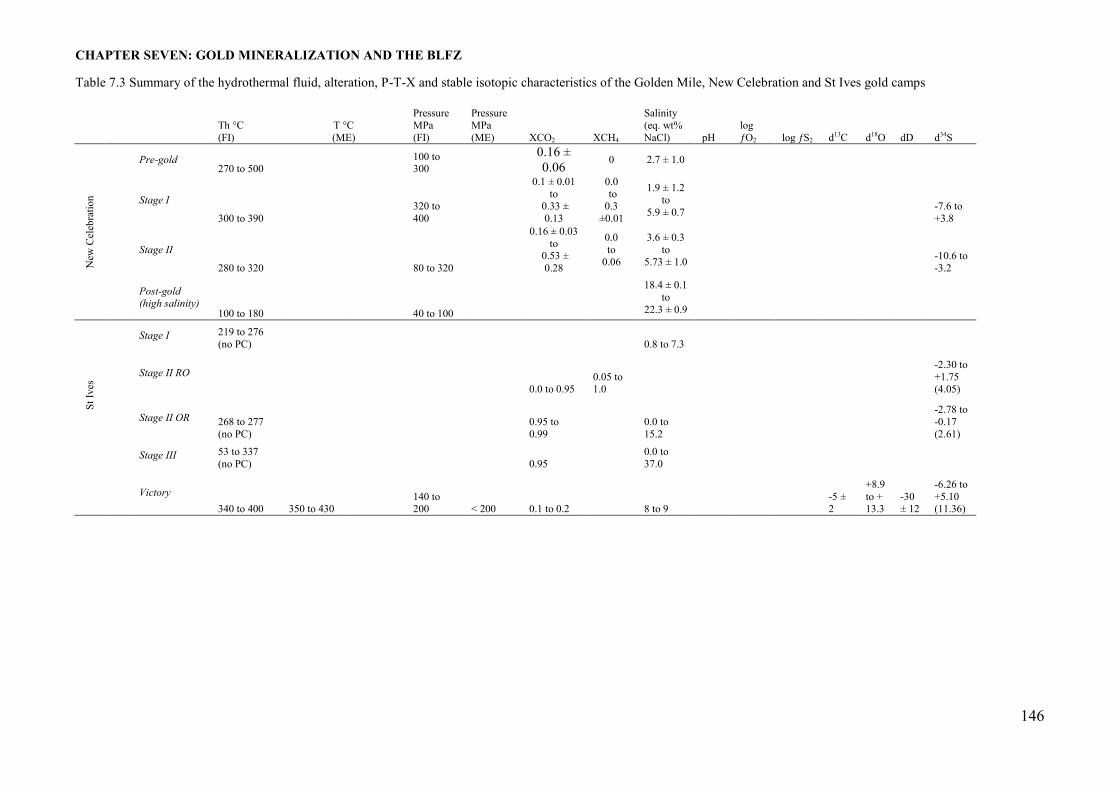
CHAPTER SEVEN: GOLD MINERALIZATION AND THE BLFZ
146
Table 7.3 Summary of the hydrothermal fluid, alteration, P-T-X and stable isotopic characteristics of the Golden Mile, New Celebration and St Ives gold camps Th °C
(FI) T °C (ME)
Pressure MPa (FI)
Pressure MPa (ME) XCO2 XCH4
Salinity (eq. wt% NaCl) pH
log ƒO2 log ƒS2 d13C d18O dD d34S
New
Cel
ebra
tion
Pre-gold 270 to 500
100 to 300
0.16 ± 0.06 0 2.7 ± 1.0
Stage I
300 to 390
320 to 400
0.1 ± 0.01 to
0.33 ± 0.13
0.0 to 0.3
±0.01
1.9 ± 1.2 to
5.9 ± 0.7
-7.6 to +3.8
Stage II
280 to 320
80 to 320
0.16 ± 0.03 to
0.53 ± 0.28
0.0 to
0.06
3.6 ± 0.3 to
5.73 ± 1.0
-10.6 to -3.2
Post-gold (high salinity)
100 to 180 40 to 100
18.4 ± 0.1 to
22.3 ± 0.9
St Iv
es
Stage I 219 to 276 (no PC)
0.8 to 7.3
Stage II RO
0.0 to 0.95
0.05 to 1.0
-2.30 to +1.75 (4.05)
Stage II OR 268 to 277 (no PC)
0.95 to 0.99
0.0 to 15.2
-2.78 to -0.17 (2.61)
Stage III 53 to 337 (no PC)
0.95
0.0 to 37.0
Victory 340 to 400 350 to 430
140 to 200 < 200 0.1 to 0.2 8 to 9
-5 ± 2
+8.9 to + 13.3
-30 ± 12
-6.26 to +5.10 (11.36)
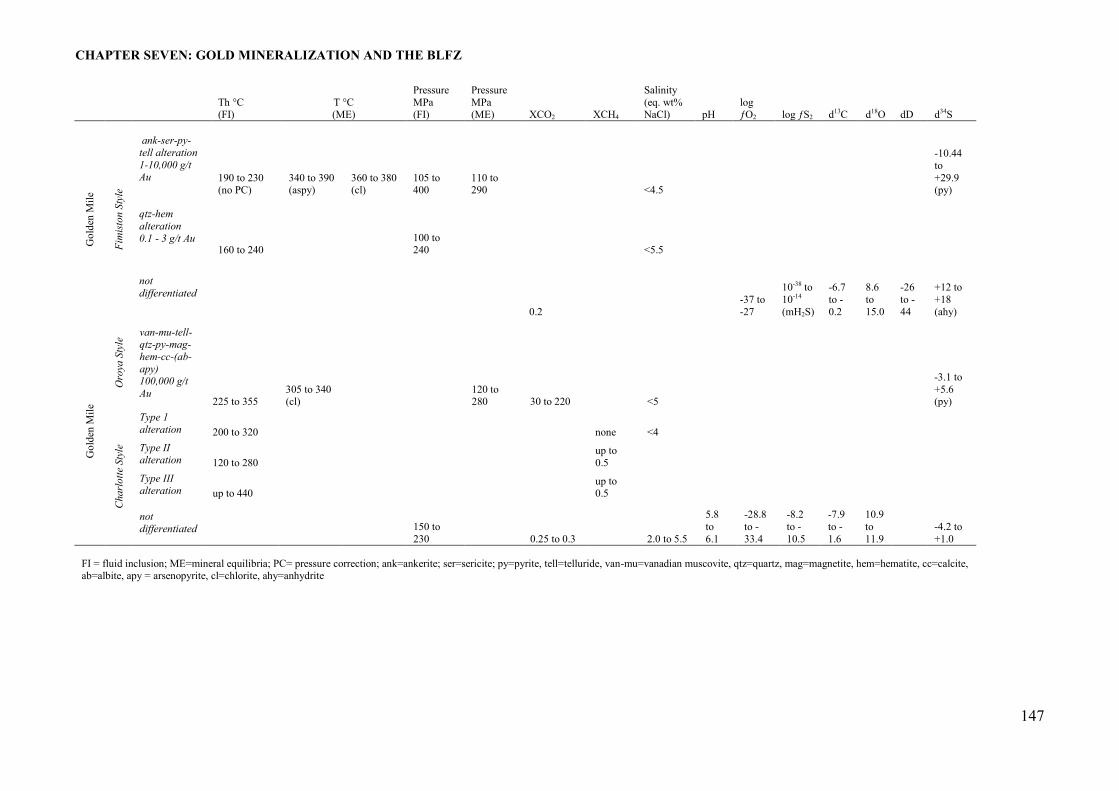
CHAPTER SEVEN: GOLD MINERALIZATION AND THE BLFZ
147
Gol
den
Mile
Oro
ya S
tyle
van-mu-tell-qtz-py-mag-hem-cc-(ab-apy) 100,000 g/t Au
225 to 355 305 to 340 (cl)
120 to 280 30 to 220
<5
-3.1 to +5.6 (py)
Cha
rlotte
Sty
le
Type 1 alteration 200 to 320
none <4
Type II alteration 120 to 280
up to 0.5
Type III alteration up to 440
up to 0.5
not differentiated
150 to 230
0.25 to 0.3
2.0 to 5.5
5.8 to 6.1
-28.8 to -33.4
-8.2 to -10.5
-7.9 to -1.6
10.9 to 11.9
-4.2 to +1.0
FI = fluid inclusion; ME=mineral equilibria; PC= pressure correction; ank=ankerite; ser=sericite; py=pyrite, tell=telluride, van-mu=vanadian muscovite, qtz=quartz, mag=magnetite, hem=hematite, cc=calcite, ab=albite, apy = arsenopyrite, cl=chlorite, ahy=anhydrite
Th °C (FI)
T °C (ME)
Pressure MPa (FI)
Pressure MPa (ME) XCO2 XCH4
Salinity (eq. wt% NaCl) pH
log ƒO2 log ƒS2 d13C d18O dD d34S
Gol
den
Mile
Fim
iston
Sty
le
ank-ser-py-tell alteration 1-10,000 g/t Au 190 to 230
(no PC) 340 to 390 (aspy)
360 to 380 (cl)
105 to 400
110 to 290
<4.5
-10.44 to +29.9 (py)
qtz-hem alteration 0.1 - 3 g/t Au
160 to 240
100 to 240
<5.5
not differentiated
0.2
-37 to -27
10-38 to 10-14 (mH2S)
-6.7 to -0.2
8.6 to 15.0
-26 to -44
+12 to +18 (ahy)

CHAPTER SEVEN: GOLD MINERALIZATION AND THE BLFZ
148
Figure 7.6 Trapping conditions for ore-stage fluids from the Golden Mile, New Celebration and St Ives
gold camps. All show declining pressure and temperature with time
4.0 kbars for pre-gold Stage 1, 205-310° C and 0.7-2.1 kbars for the gold related Stage
2a and 2b events and 120-300° C and 0.1-1.6 kbars for the post-gold Stage 3 fluids,
based on analyses of low salinity (<7 equiv. wt. % NaCl) aqueous and moderate salinity
(up to 15 wt.% NaCl equiv.) aqueous-carbonic inclusions.
Hodge et al. (in revision) demonstrated a complex and protracted fluid history
for the New Celebration gold deposit (Table 7.3, Fig. 7.7). Pre-gold methane and
aqueous-carbonic inclusions indicate formation temperatures and pressures between 270
to 500° C and 1 to 3 kbars. Stage I gold mineralization formed from a mixed H2O-CO2-
NaCl fluid at temperatures and pressures between 330 °C and 390 ° C and 3.2 to 4.0
kbars, respectively. Stage II gold mineralization formed from mixed aqueous-carbonic
fluids at temperatures and pressures between 280 to 320° C and 0.8 to 3.2 kbars,
respectively. Coeval vapor- and liquid-rich fluid inclusions with similar homogenization
temperatures and variable bulk compositions and molar volumes indicated that Stage II
fluids underwent at least some phase separation. Aqueous and methane-dominated
fluids that post-date gold mineralization formed at temperatures and pressures between
100 to 180° C and 0.4 to 1.0 kbar, indicating that they formed in a different P-T
environment to the gold-related inclusions, likely after a period of uplift and erosion,
and significantly after gold mineralization ceased.

CHAPTER SEVEN: GOLD MINERALIZATION AND THE BLFZ
149
All three deposits show declining temperatures and pressures with time (Fig.
7.7), presumably reflecting the changing P-T conditions of the terrane as it evolved.
Hodge et al. (submitted) and Clark et al. (1989) concluded that the later stages of gold
mineralization at the New Celebration and St Ives deposits, respectively, took places
significantly later than the earlier stages, after a period of uplift and erosion, indicating
protracted gold mineralization during the evolution of the orogen.
4.5 Carbon, Oxygen and Hydrogen Stable Isotopes The following section summarizes the stable isotopic data of Golding (1982,
1984), Clout (1989) and Golding et al. (1990a; 1990b) from the Golden Mile and Mt
Charlotte deposits in Kalgoorlie and the Victory deposit in Kambalda (Table 7.3). There
are no available data on the C, O or H isotopic compositions from New Celebration.
Golding (1982, 1984) analyzed the carbon isotopic composition of gold-related
carbonates from the Golden Mile and Mt Charlotte deposits in Kalgoorlie and the
Victory deposit in Kambalda. She concluded that the recalculated ore-fluid values fell
within the range of magmatic carbon and that the likely fluid source for both the
Kalgoorlie and Kambalda deposits was most consistent with a magmatic CO2 reservoir.
Oxygen and hydrogen stable isotope data from the Golden Mile are sparse,
contradictory and poorly constrained. Golding et al. (1990a; 1990b), calculated the
18Ofluid composition from quartz vein, vein carbonate and wall rock quartz and
carbonate alteration from the Golden Mile No. 4 Lode, and from the Mt Charlotte
deposit. Using a model formation temperature of 350±50° C, they postulated either a
metamorphic or a magmatic origin for the ore fluids at both the Golden Mile and Mt
Charlotte, but could not differentiate further. Clout (1989) calculated the 18Ofluid and
Dfluid of ore-related quartz veins and muscovite for Fimiston style mineralization at
180° C. In combination with his fluid inclusion data, he used these data to infer that the
Fimiston ore fluids were of seawater or low-latitude meteoric water origin, which
underwent isotopic exchange with wall rocks or a magmatic fluid, and proposed a near-
surface epithermal origin for the Fimiston and Oroya deposits.
At Victory, Golding et al. (1990b) calculated the 18Ofluid for gold-bearing veins
and gold-bearing wall rocks, and Golding and Wilson (1987) analyzed chlorite in
mineralized Defiance Dolerite from the Victory deposit. They both noted that the
calculated oxygen and hydrogen isotopic compositions of the ore fluids at Kalgoorlie
and Kambalda were within the field of overlap between magmatic and metamorphic
CHAPTER SEVEN: GOLD MINERALIZATION AND THE BLFZ
150
waters. Importantly, however, Golding et al. (1990a) noted that the calculated isotopic
composition of ore fluids at Victory was significantly enriched in D relative to the D
of hornblende and phlogopite in Kambalda lamprophyres (Rock et al., 1989). For this
reason, Golding et al. (1990a) rejected magmatic fluids derived from these
lamprophyres as a potential mineralizing fluid source, but did not discount a distal
magmatic source. The stable isotopic evidence presented above suggests a magmatic
contribution to the hydrothermal system at both deposits.
4.6 Sulfur Isotopic Composition and Comparison with Previous Studies The sulfur isotopic composition of syn-sedimentary and ore-stage sulfides from
the Golden Mile and New Celebration was determined to complement existing isotopic
data sets and to further constrain compositions based on newly developed paragenetic
sequences. Thirty-one in situ pyrite and pyrrhotite analyses from nine Golden Mile and
three St Ives samples were analyzed by Nd-YAG laser ablation, following the procedure
of Huston et al. (1995a) at the Central Science Laboratory (CSL), University of
Tasmania. These samples represent synvolcanic sulfide from Kalgoorlie, four
paragenetic stages of Fimiston type gold mineralization (Golden Mile), and different
hydrothermal alteration assemblages from the Conqueror and Revenge deposits (St
Ives). All results are reported in parts per thousand (per mil, ‰) relative to the Canyon
Diablo Troilite (CDT). The results of this study are compared with previous studies on
sulfides from the Golden Mile (Lambert et al., 1984; Clout, 1989; Hagemann et al.,
1999; Bateman et al., 2001; Bateman and Hagemann, 2004), New Celebration (Hodge
et al., in revision) and St Ives (Palin and Xu, 2000; Hodkiewicz, 2003; Walshe et al.,
2006; Neumayr et al., 2008) (Table 4).
4.6.1 Golden Mile
The results of this study on pre-gold and four paragenetic stages of Fimiston-
style gold mineralization showed a broad range of δ34S values (Table 7.4, Fig. 7.8), both
within and between samples, and displayed significant variability according to host
rock, alteration assemblage and paragenetic relationship. Synvolcanic pyrite had sulfur
isotopic ratios from +3.2 to +4.2 per mil (n=2). Fimiston sulfides showed the broadest
range in values, -10.4 to

CHAPTER SEVEN: GOLD MINERALIZATION AND THE BLFZ
151
Table 7.4 Summary of the sulfur isotopic compositions of sulfides from Golden Mile (GM), New
Celebration (NC) and St Ives (SI)
Deposit Style Mean/Std Dev Min/Max/Spread
Method Source
NC Mylonite +1.83 ± 1.22 +0.57 to +3.77 (3.2) LA Hodge et al. (in revision)
Porphyry -5.89 ± 1.54 -7.49 to -3.15 (4.3) LA Hodge et al. (in revision)
Contact -5.90 ± 1.98 -8.34 to -3.22 (5.12) LA Hodge et al. (in revision)
Fracture -8.97 ± -1.34 -10.61 to -7.40 (3.21) LA
Hodge et al. (in revision)
-3.0 ± 5.2 -8.64 to +5.54 (14.8) LA Hodkiewicz (2009)
GM Synvolcanic sulfide +4.10 ± 0.72
+3.59 to +4.61 (1.02) LA This study
Fimiston Stage I +2.40 ± 0.81 +1.82 to +2.97 (1.15) LA This study
Fimiston Stage II +5.33 ± 8.95 -7.21 to +15.68 (22.89) LA This study
Fimiston Stage III -7.63 ± 1.89
-10.44 to -4.65 (5.79) LA This study
Fimiston Stage IV -0.92 ± 2.74
-2.87 to +2.21 (5.08) LA This study
Depth-HG +1.3 ± 4.8 -4.7 to +10.3 (15.0) LA Bateman et al. (2000) GBM - HG +4.0 ± 5.5 -3.8 to + 9.2 13.0) LA Bateman et al. (2000) GBM - Prox +2.7 ± 3.4 -3.5 to + 8.2 (11.7) LA Bateman et al. (2000) GBM - Dist +2.9 ± 1.9 -1.6 to +4.2 (5.8) LA Bateman et al. (2000) LV - HG -3.3 ± 2.3 -8.8 to + 1.0 (9.8) LA Bateman et al. (2000) LV - Prox -4.2 ± 2.5 -7.9 to -2.1 (5.8) LA Bateman et al. (2000) LV - DP -4.2 ± 1.6 -6.0 to -3.2 (2.8) LA Bateman et al. (2000) LV - Dist +1.8 ± 2.1 0.0 to +4.9 (4.9) LA Bateman et al. (2000) Oroya - HG +3.6 ± 1.4 +2.3 to +5.1 (2.8) LA Bateman et al. (2000) Oroya - Prox +2.2 ± 2.7 -3.1 to- +4.9 (8.0) LA Bateman et al. (2000) Oroya - Dist +3.3 ± 2.5 -0.9 to +5.6 (6.5) LA Bateman et al. (2000) Mt Charlotte +3.0 ± 0.9 +2.2 to +4.3 (2.3) Golding et al. (1990)
SI Revenge Reduced +0.2 ± 1.8
-2.30 to +1.75 (4.05) LA This study
Revenge Oxidized -1.6 ± 1.0 -2.78 to -0.17 (2.61) LA This study
Victory -0.3 ±2.6 -4.4 to +5.1 (9.5) LA Palin and Xu (2001)
Victory-Defiance -3.8 ± 1.5 -6.26 to -1.16 (5.1) LA Hodkiewicz et al. (2009)
Victory-Defiance 3.1 ± 1.4 -5.5 to -1.5 (4.0) LA Ho et al. (1994) Victory-Defiance -4.1 ± 1.4 -6.3 to -1.2 (5.1) CONV Ho et al. (1994)

CHAPTER SEVEN: GOLD MINERALIZATION AND THE BLFZ
152
Figure 7.7 Composition of sulfides from different lodes and different paragenetic events at Golden Mile,
different alteration assemblages at St Ives and different mineralization stages at New Celebration

CHAPTER SEVEN: GOLD MINERALIZATION AND THE BLFZ
153
+15.7 ‰ (n=19) with the most depleted values coming from a gold-telluride quartz-
carbonate vein (Stage III of Gauthier et al. (in revision)) and the most enriched from a
pyrite-tourmaline vein fragment within a mafic dike (Stage II of Gauthier et al. (in
revision). Lambert et al. (1984), Phillips et al. (1986) and Clout (1989) also established
significantly depleted sulfur isotopic compositions (< -10 ‰) of pyrite, using
conventional bulk sulfur isotopic analytical methods, for Fimiston-style gold
mineralization at the Golden Mile.
The results of this study indicate that sulfide formation and gold precipitation at
Fimiston took place during fluctuating and highly variable ƒO2 conditions, likely either
as a combination of ore-forming processes and/or involving a number of different sulfur
sources (Bateman et al., 2001; Bateman and Hagemann, 2004). The significantly
depleted isotopic compositions reported from the Fimiston lodes suggest an oxidized
magmatic fluid source, (cf. Cameron and Hattori (1987) and Clout (1989), who
proposed an intrinsically oxidized, magmatic ore fluid to account for the isotopic
variation reported from the Fimiston lodes, and are consistent with those of Hagemann
and Bateman (2001), who concluded that gold precipitation at the Golden Mile occurred
as the consequence of wall rock sulfidation and phase immiscibility and that sulfur
likely was derived from several sources. They concluded that the pyrite isotopic
composition of the Oroya lodes, in particular, was consistent with formation by mixing
an oxidized magmatic fluid with heavy sulfur derived from the metasedimentary units
within the Paringa Basalt.
4.6.2 New Celebration
Hodkiewicz (2003), Hodkiewicz et al. (2009) and Hodge et al. (in revision),
reported predominantly depleted sulfur isotopic values from ore-stage pyrites at New
Celebration. Sulfur isotope values from Stage I-related pyrites ranged between -7.6 per
mil and +3.8 per mil (n=14) and Stage II pyrites ranged between -10.6 per mil and -3.2
per mil (n=16). Hodkiewicz (2003) and Hodkiewicz et al. (2009) documented a broad
negative correlation between 34S and gold grade (r2=0.73, n=5) at New Celebration and
concluded that carbonation reactions between the ore-fluid and wall rock magnetite and
hematite initiated fluid oxidation, however Hodge et al. (in revision) using a much
larger database demonstrated no such correlation (r2=0.10, n=30). Further, Mikucki
(E.J. Mikucki unpub. report, 2001) has shown that magnetite carbonation would only
lead to ore fluid oxidation at very low fluid/rock ratios, which is incompatible with the
significant hydrothermal fluid flow and high fluid/rock ratios expected within a crustal
CHAPTER SEVEN: GOLD MINERALIZATION AND THE BLFZ
154
scale fault system such as the BLFZ. Hodge et al. (in revision) confirmed that the
sulfidation of iron-rich wall rocks was the mechanism by which all of Stage I, and at
least part of Stage II gold, precipitated at New Celebration. As this mechanism would
not effect a change to the oxidation state of the dissolved sulfur species (Palin and Xu,
2000), Hodge et al. (in revision) concluded that the sulfur isotopic composition of the
majority of ore-stage pyrite at New Celebration reflected the ore fluid composition, and
that the negative isotopic composition suggested possible magmatic contributions to the
ore fluid, at least during Stage II. Hodge et al. (in revision) documented intermittent
phase immiscibility during Stage II gold mineralization and concluded that fluid
oxidation during phase separation accounted for both the negative sulfur isotopic
composition and the spread in δ34S ratios observed in Stage II ore-related pyrites.
4.6.3 St Ives
The results of this study did not differentiate the pre-gold and syn-gold samples
based on their isotopic composition (Fig. 7.8, Table 7.4). Pyrite from both the pre-gold
amphibole-pyrrhotite veins and the Stage 2b ore zone related alteration assemblages
showed significant overlap, with δ34S values ranging from -2.3 to +1.8 per mil and -2.8
to -0.8 per mil respectively. These values are, however, within the range of reported
average means of sulfides from Yilgarn Craton deposits (Hodkiewicz, 2003;
Hodkiewicz et al., 2009) and well within the ranges reported by other researchers (Ho et
al., 1994; Palin and Xu, 2000; Hodkiewicz, 2003; Hodkiewicz et al., 2009) in the St
Ives gold field.
Palin and Xu (2000) ,Hodkiewicz (2003) and Hodkiewicz et al. (2009)
documented a negative correlation between total gold concentration and 34S in pyrite.
Palin and Xu (2000) concluded that fluid oxidation occurred in situ during gold
mineralization by carbonation reactions between wall rock magnetite and the ore fluid.
Hodkiewicz (2003) documented different isotopic compositions in differently oriented
structures – isotopically depleted pyrites were observed in gently dipping structures,
whereas enriched pyrites were observed in the steep structures. He invoked large-scale
pressure fluctuations in the more dilatant shallow dipping structures to account partially
for the depleted isotopic compositions. Neumayr et al. (2008) reported 34S ranges in
pyrite, chalcopyrite and pyrrhotite (in situ LA-ICP-MS analyses) from -8.4 to +5.1 per
mil at the St Ives gold camp. The most negative 34S values were associated with an
oxidized magnetite domain (determined by a geographical information systems (GIS)
interpretation of the drill core database) and the most positive values with a reduced

CHAPTER SEVEN: GOLD MINERALIZATION AND THE BLFZ
155
pyrrhotite domain. They postulated that gold mineralization was consistent with mixing
between an oxidized, magmatic-derived fluid and a reduced hydrothermal fluid and
concomitant sulfate reduction and methane oxidation. Results of these studies indicate
that a significant magmatic fluid component was a factor in gold mineralization at all
three deposits.
4.7 Mineral Chemistry of Sulfides, Oxides and Gold Associated with Gold Mineral Systems in the Kalgoorlie-Kambalda Corridor Thirty-seven samples from the Golden Mile, representing syn-volcanic sulfides,
different mineralization styles (Fimiston and Oroya), different lode systems (East, West
and Aberdare), different chronological events within a single lode system (Fimiston
Stages I-IV), and shallow vs. deep > (600m below current surface) samples, 11 samples
from New Celebration representing Stage I and Stage II ore-related sulfides, gold and
Fe-oxides, and 11 samples from St Ives, representing different hydrothermal alteration
fluid systems, were analyzed at the ARC Centre for Excellence in Ore Deposits at the
University of Tasmania, using the method described in Appendix 8. The samples were
analyzed for 26 major and trace elements to identify similarities and differences of gold
mineralization at the Golden Mile, New Celebration and Kambalda deposits and within
different paragenetic and/or mineralization stages within individual deposits.
4.7.1 Golden Mile
Pyrites from all lodes in the Golden Mile are high in As relative to Ni and Co
(Fig. 7.9). Fimiston Stage II pyrites contain the lowest average As concentrations, and
pyrites from the deepest lodes (>600 m below the current surface) contain the highest
average As concentrations. Broad peaks for Au, Ag and Te in pyrites from the Lake
View and Aberdare lodes, and the deep lodes indicate that these elements are contained
primarily within the pyrite lattice, either as stoichiometric or non-stoichiometric
substitutions for Fe (Au, Ag) or S (Te). Pyrites from these lodes also had the lowest
average Ag and Te concentrations of all the Golden Mile pyrites, and contained only
rare poly-metallic sulfide inclusions. Pyrite from other lodes contained Au, Ag and Te
as mineral inclusions, as evidenced by narrow spiky peaks, and had higher average Ag
and Te concentrations than those in which gold was contained within the pyrite crystal
lattice. Fimiston Stages II and IV pyrites showed strong positive correlations between
Au and As, which were not evident in pyrites from any other lode.

CHAPTER SEVEN: GOLD MINERALIZATION AND THE BLFZ
156
Gold grain analyses from Fimiston and Oroya style mineralization revealed that
Au commonly contains Cu and also showed that Te is not part of the Au crystal
structure, but instead occurs as inclusions within the grains, commonly with Pb and Sb
Iron oxides from the Fimiston, Lake View, Aberdare and deep lodes had
complex chemical compositions, and were commonly zoned with respect to Ti, W, Sb
and Co. They also contained Zr inclusions. Magnetites from the Great Boulder Main
lode had very simple chemical composition, with no trace element enrichment evident
in the analyses either as inclusions or as substitution. Pyrites in the Fimiston, Lake
View, Aberdare and the deep lodes showed corresponding enrichments in the same
elements evident in the oxides, suggesting that dissolution of magnetite during wall rock
sulfidation reactions contributed significantly to the chemical signature of the ore-stage
pyrite. Pyrites from the Great Boulder Main lode were also geochemically very simple,
reflecting the lack of trace elements in magnetite, however, the pyrite had elevated As
concentrations not evident in the magnetite, suggesting that As was contributed to the
pyrite by the ore forming fluid.
4.7.2 New Celebration
New Celebration ore-stage pyrites from both Stage I and Stage II contain Ni and
Co, but trace to no As (Fig. 7.9). Stage I ore-stage pyrites also contained lattice bound
Ti, W, Pb, Zn, Cr, and minor As. Titanium, Mn, Cr, Zn, Cu, W, Mo, Au, Ag, As Te, Sb,
Bi, U, Th, La and Zr commonly occurred as inclusions in both Stage I and Stage II
pyrites, which also contained Au, Ag, Te and Pb associated together, reflecting the
presence of Au-Ag-Pb tellurides. This is consistent with petrographic and SEM
observations of Nichols (2003) who reported hessite (AgTe2), altaite (PbTe), melonite
(Ni2Te) and tetradymite (Bi2Te2) from Stage I ore-stage pyrites.
Gold analyses revealed minor chemical differences between Stage I and Stage II.
Stage I gold contained only silver within the lattice, whereas Stage II gold contained Pb
and Cu, in addition to Ag, within the crystal lattice. Gold and Ag showed a strong
positive correlation with each other in all mineralization styles except Stage I Mylonite-
style. Stage II Contact-style pyrite showed a strong positive correlation between Au and
Te, which was not observed in any other mineralization style. Stage II gold grains

CHAPTER SEVEN: GOLD MINERALIZATION AND THE BLFZ
157
Figure 7.8 Ternary Ni-Co-As plot for pyrites from the Golden Mile (left), New Celebration (center) and
St Ives (right). Golden Mile pyrites contain relatively more arsenic than those from New Celebration or St
Ives.
also hosted rare Pb-Bi and Ba-bearing inclusions, which likely represent sulfide (galena)
and sulfate (barite) inclusions within the gold grains, consistent with petrographic
observations made in this study and (Nichols, 2003).
Metamorphic magnetite from Stage I mineralization-hosting sheared
intermediate porphyries comprised ubiquitous Ni and Co, in addition to Ti, Cr, Zn, As,
Bi and W in variable proportions within the magnetite crystal lattice. They also
contained abundant poly-metallic (Pb, Ti, Cr, Bi, Ba, Sb, W, Mn, Zn-bearing) and
zircon inclusions. In contrast, hydrothermal magnetites and ilmenites in mafic volcanic
rocks were compositionally simple and typically contained only zircon inclusions.
A spider diagram (Fig. 7.10) of elemental abundances relative to average crustal
abundances in pyrites from all mineralization styles, metamorphic magnetite and
hydrothermal Fe oxides from high Mg basalt and dolerite, clearly illustrates that the
trace element composition of pyrites from Stage II Fracture-style mineralization are
markedly different from Stage I or Stage II Contact-style pyrites. Petrographic and fluid
inclusion evidence (Hodge et al., in revision) indicate that all of Stage I, and Stage II
Contact-style mineralization formed by reaction of gold- and sulfur-bearing ore fluids
with iron-rich wall rocks whereas Stage II Fracture-style gold precipitated via phase
immiscibility. The variability observed in the different ore stage pyrites therefore likely
reflects different degrees of influence from wall rock oxides and ore fluids. The
composition of those pyrites that formed by reactions with magnetite and ilmenite (i.e.
Stage I and Stage II Contact-style) reflects the composition of the oxides, whereas the
composition of Stage II Fracture-style pyrites more closely reflects the composition of
the ore fluid. This is consistent with the observations of Phillips et al. (1986; 1988) from
the Golden Mile, who

CHAPTER SEVEN: GOLD MINERALIZATION AND THE BLFZ
158
Figure 7.9 Spider diagram illustrating the abundances of all the elements analyzed, except Fe, relative to
average crustal abundances (data from Rosler and Lange, 1972) in pyrites from Stage I (Mylonite- and
Porphyry-style) and Stage II (Contact- and Fracture-style) mineralization, in addition to metamorphic
magnetite from mylonitized monzonite and hydrothermal Fe-oxides from high-Mg basalt and dolerite,
illustrating that pyrites from Stage II Fracture-style mineralization show markedly different trace element
patterns than those pyrites related to both Stage I mineralization styles and Stage II Contact-style
mineralization. This likely reflects differing contributions from wall rocks and ore fluids for the different
mineralization styles and events.
concluded that the composition of pyrite that precipitated from fluids that had dissolved
oxides or carbonates would reflect the composition of those oxides or carbonates.
4.7.3 St Ives
St Ives pyrites contain ubiquitous Ni and Co, however, in contrast to the Golden
Mile samples, St Ives pyrites contain less As relative to Ni and Co (Fig.7.9). Post-gold
Stage 3 pyrites contain only Fe and Co, whereas porphyry-related Stage 1 pyrites, and
gold-related Stage 2B pyrites also contain Ni and As in varying proportions. Gold, Ag,
Te and other elements are present only in low concentrations, and Au does not correlate
with either Ag or Te. Zonation of inclusions is evident in some ore-stage sulfides;
inclusion rich cores contain Au, Ag, Te and other poly-metallic sulfides, whereas
inclusion-free rims contain only Fe, Ni and Co.

CHAPTER SEVEN: GOLD MINERALIZATION AND THE BLFZ
159
4.7.4 Discussion
Nickel and cobalt are ubiquitous in all pyrites analyzed, however, pyrites from
the Fimiston and Oroya lodes show a number of contrasts in other trace element
abundances to those analyzed at New Celebration and St Ives. Fimiston and Oroya lode
pyrites contain abundant As relative to Ni and Co, which is not observed in New
Celebration or St Ives pyrites. Fimiston and Oroya pyrites are high in Sb, but contain
little or no Bi, and Te occurs in Fimiston and Oroya pyrites at concentrations several
orders of magnitude higher than in pyrites from either New Celebration or St Ives.
Nickel and cobalt are contributed by the wall rock, and concentrations correspond
directly to the host rock, for example, at New Celebration, pyrites from Contact-style
mineralization, which formed by wall-rock reaction with oxides in high-Mg basalt, have
higher Ni and Co concentrations than pyrites from Fracture-style mineralization, which
formed by phase separation. Evidence from New Celebration also indicates that the
composition of ore forming pyrites is in part controlled by the composition of wall rock
iron oxides, at least where wall rock reaction is the dominant ore forming process. Other
elements, such as Au, Ag, Bi, Pb, As and Te are contributed by the ore fluid (Ho et al.,
1995).
Thermodynamic modeling by Cooke and McPhail (2001) predicted that Te is
most readily transported in magmatic hydrothermal vapors, therefore, the high Te
concentrations reported at the Golden Mile suggest a magmatic fluid source. Cooke and
McPhail (2001) determined that the solubility of aqueous Te species (H2Te(aq), HTe-
and H2TeO3 (aq)) is low in aqueous fluids and maintain that the only viable mechanism
for depositing Te-rich ores is via the condensation of Te2(g) and H2Te(g) from
magmatic vapors into precious metal brines where they react with aqueous gold-bearing
complexes (Au(HS)–2 or Au(HS)) to form gold-telluride deposits.
Fimiston and Oroya ore-related pyrites at the Golden Mile contain
characteristically high concentrations of As and Sb. Antimony enrichment is common in
terranes dominated by metasedimentary sequences and has been recognized in the
Phanerozoic orogenic lode gold deposits in the South Island of New Zealand (Pitcairn et
al., 2006) and the North American Cordillera (Goldfarb et al., 1993), in Archean
mesothermal gold deposits of the Superior Province in Canada (Colvine, 1989), the
Kwetke region of Zimbabwe (Buchholz et al., 2007) and in the epizonal Wiluna deposit
in the Yilgarn Craton (Hagemann et al., 1993; Hagemann and Lüders, 2003). Both As
and Sb are highly soluble in hydrothermal solutions as hydroxoantimonite or oxyanions

CHAPTER SEVEN: GOLD MINERALIZATION AND THE BLFZ
160
over a broad range of temperature, pH and ƒO2 conditions. Generally, antimony
precipitates at shallow crustal levels (Nesbitt et al., 1986; Nesbitt and Muehlenbachs,
1989; McCuaig and Kerrich, 1998) and enrichment of pyrite in Sb takes place at
temperatures between 200 and 300° C (Pitcairn et al., 2006). The source of Sb in
deposits around the world remain equivocal; Buchholz et al. (2007) considered that
local metabasalts and metasedimentary rocks provided the As and Sb at Kwetke,
whereas Pitcairn et al.(2006) determined that As and Sb in the Otago schist-hosted
deposits of New Zealand was derived from the surrounding country rock during
prograde metamorphism. Regardless of the source, the presence of Sb in Fimiston and
Oroya pyrites suggests emplacement at epizonal crustal levels and at temperatures
<300° C.
5. EVOLUTION OF THE BOULDER-LEFROY FAULT ZONE AND ITS
POTENTIAL ROLE IN THE LOCATION OF GOLD
MINERALIZATION IN THE KALGOORLIE-KAMBALDA CORRIDOR
Despite over 100 years of gold exploration in the Kalgoorlie-Kambalda corridor,
and almost as many years of study into the geology of the deposits comprising one of
the richest gold endowed areas of the world, no research projects have drawn together
the abundant available structural, mineralogical and geochemical data to evaluate the
exact role of the BLFZ with respect to the location of gold mineralization within the
Kalgoorlie-Kambalda corridor. This section presents a synthesis of the existing data
(Figs. 7.10-7.16), and new data presented in section 4, to evaluate the potential role of
the BLFZ in forming the giant and world-class deposits that make the Kalgoorlie-
Kambalda corridor so unique.
5.1 D1- early D2 (>2675 – 2670) The early history of the BLFZ is contentious. Gee et al.(1981) considered that
the BLFZ originated during early, E-W extension (De), as a feeder fault for greenstone
belt volcanism. Other authors, for example Swager (1989) and Weinberg et al. (2005)
did not consider that the BLFZ was active as a regional scale crustal structure prior to
regional D2. Swager (1989) argued that: (1) the fault occupies the axial plane of the
regional D2 Celebration anticline, therefore faulting alone cannot account for the
change in younging direction across the fault; (2) at Kambalda the BLFZ crosscuts the
eastern limb of the Kambalda anticline; and (3) the BLFZ offsets the D1 Feysville and
Mt Hunt faults south of Kalgoorlie. Weinberg et al. (2005) observed that: (4) the earliest
CHAPTER SEVEN: GOLD MINERALIZATION AND THE BLFZ
161
recognized deformation phase of the BLFZ at New Celebration was steeply dipping
north-south oriented thrust faulting; and (5) that the interpretation of seismic images in
the Kalgoorlie area indicated that the BLFZ formed as a series of unconnected north-
south oriented thrust ramps arranged roughly along the strike of the present BLFZ.
Recent work by the Predictive Mineral Discovery Cooperative Research Centre
(pmd*CRC) in Australia (Miller et al., 2009) indicates that the Lefroy segment of the
fault at Kambalda originated as an east-dipping extensional fault, that formed at least
during the formation of the Black Flag Group rocks, and possibly as early as syn-mafic-
ultramafic volcanism during pre-D1 extension. This interpretation raises a discrepancy
in orientation on the fault system, i.e. the BLFZ dips to the east at St Ives, but changes
orientation to become west dipping at New Celebration and Kalgoorlie (Goleby et al.
2000). This raises the question as to whether the Boulder fault west of the Golden Mile
and the Lefroy Fault east of St. Ives have been correctly linked.
Bateman et al. (2001) and Bateman and Hagemann (2004) proposed a late D1
timing for the Fimiston lodes at Kalgoorlie based on the following: (1) Fimiston lodes
are crosscut by all structures except for the felsic dikes, which are themselves
mineralized; (2) D2 faults clearly cut Fimiston lodes; (3) the regional D3 Adelaide fault
cuts the Fimiston Lake View lode. The findings of Gauthier et al. (2004; in revision),
based on a detailed structural analysis of several underground levels at the Golden Mile
and geochronology of intermineral dike suites supported the early timing of Golden
Mile mineralization. They based their conclusions on the following: (1) the Adelaide
fault cross cuts the pre-D3 Australia East fault, which itself offsets the Fimiston lodes;
and (2) pre-ore feldspar porphyry dikes are dated at 2676±3 Ma (U-Pb TIMS on
zircons) and hornblende-phyric andesite dikes, which crosscut Fimiston ore dated at
2663±11 Ma (U-Pb TIMS on zircons), constraining Fimiston-style gold mineralization
to between 2674 and 2652 Ma. Based on this evidence Fimiston gold lodes formed
much earlier than previously postulated, during D1-D2 compression and potentially
prior to the establishment of the BLFZ as a singular, regionally extensive, crustal-scale
shear zone.
Lungan (1986), Bateman et al. (2001) and Bateman and Hagemann (2004)
proposed an early D2 origin for the Oroya shoot based on the following evidence: (1)
Oroya lode-related faults crosscut and deform the Fimiston-style lodes; and (2) the Main
Lode, Kalgurli and North Kalgurli regional D3 faults offset the Oroya shear zone and
deformed the lodes. In contrast, McNaughton et al. (2005) interpreted a late D3 origin

CHAPTER SEVEN: GOLD MINERALIZATION AND THE BLFZ
162
for Oroya-style mineralization based on a Pb-Pb zircon age of 2642±6 Ma of a
lamprophyre dike that was interpreted to be emplaced synchronous with the mineralized
tension veins and associated Oroya hanging wall shear zone. However, critical
examination of these data indicate that the dike crosscut Oroya-style mineralization and
was itself cut by Charlotte-style mineralization, therefore, constraining it to be an
intermineral dike (i.e. between two discrete mineralization events), not an
intramineralization dike as McNaughton et al. (2005) had interpreted it.
Fimiston-style gold mineralization (Fig. 7.11) was accompanied by widespread
outer chlorite-carbonate alteration that formed a 1-3km radius halo around the lodes
(Phillips, 1986; Clout, 1989). Clout (1989) constrained this alteration event at 290 to
350° C from a variable salinity (0-23 wt.% NaCl equiv.), low XCO2 (0.02 to 0.06)
mixed aqueous-carbonic fluid, which was likely trapped at the solvus. The broad, low-
grade (<2 g/t Au) haloes in wall rocks adjacent to the Fimiston lodes formed by the
reaction between sulfur-rich ore fluids and wall rock magnetite and iron silicates
(Groves and Phillips, 1987). Pressure-T-X conditions of this alteration event are at
present not constrained. Ho (1987), Clout (1989) and Ho et al. (1990) reported low to
moderate salinity (0-13 wt.% NaCl equiv.) mixed aqueous-carbonic fluid with variable
CO2 contents (XCO2=<0.05 to 1.0), with formation temperatures and pressures between
160 to 250° C and 1 and 3 kbars. These data reflect the formation conditions of the
sericite-ankerite-siderite-quartz-hematite-telluride alteration (type 2 of Clout, 1989) and
roscoelite-ankerite-quartz-siderite-hematite-pyrite-tellurides alteration (type 3 of Clout,
1989). According to Clout (1990) these alteration types are correlated to the narrow
(<1m wide), very high grade (50 to 10,000 g/t Au and locally up to 100,000 g/t Au)
Fimiston lodes.
The Oroya lode and associated Oroya-style mineralization (Fig. 7.12) (Lungan,
1986; Bateman and Hagemann, 2004) formed at temperatures and pressures between
225 and 355° C (Ho, 1987; Ho et al., 1990) and 0.3 to 2.8 kbars (Ho, 1987; Clout, 1989;
Ho et al., 1990), respectively, from a low salinity (< 5.0 equiv. wt. % NaCl) mixed
aqueous-carbonic fluid, which, in contrast to Fimiston-style fluids, contained significant
methane. The origin of methane associated with Oroya style mineralization is at present
equivocal. The methane may be of deep crustal or mantle origin (cf. Duan, 1992) or
may be related to black shale interflow sedimentary rocks, commonly observed
associated with Oroya style mineralization (Scantlebury, 1983; Lungan, 1986; Clout et
al., 1990). If the methane is mantle or deep crustal related, its influx into the Oroya
CHAPTER SEVEN: GOLD MINERALIZATION AND THE BLFZ
163
hydrothermal fluid system may reflect the establishment of a mantle connection with the
Golden Mile, either with the formation of the BLFZ in the Kalgoorlie area, or via
another deep crustal structure that has not yet been located or mapped. This deep mantle
connection (cf. Rock and Groves, 1988a, b; Rock, 1990) is supported by the
emplacement of lamprophyre dikes in the Oroya shoot (Mueller et al., 1988;
McNaughton et al., 2005). This interpretation is compatible with the occurrence of
early, pre-gold methane fluid inclusions, observed within the BLFZ at the New
Celebration gold deposit (Hodge et al., in revision)
Brecciation and open-space textures within the lodes, low-temperature silver-
rich tellurides (petzite and hessite, Shackleton et al., 2003)), anhydrite, and the
contemporaneity of high-level andesite dikes with Fimiston-style mineralization
(Gauthier et al., in revision) and depths constrained by the fluid inclusion data of Ho et
al. (1990) indicate that the Fimiston and Oroya lodes formed at paleo-crustal depths of
about 4 to 6 km (cf. Brown and Hagemann, 1995; Gauthier et al., in revision)
The source of the mineralizing fluids at the Golden Mile is poorly constrained at
present, as for orogenic gold deposits in general (cf. Ridley and Diamond, 2000),
however in the absence of a coherent deep-crustal structure, the fluid may have been
derived locally, within, or directly beneath, the Kalgoorlie greenstone terrane. A local
derivation is consistent with the findings of McNaughton et al. (1993) who interpreted
that the Pb isotopic signatures of gold deposits between Menzies and Kambalda, which
were unrelated to major shear zones, reflected derivation from discrete crustal segments
within the greenstone belt sequence. Kent et al. (1995) used Sm-Nd isotopes to invoke a
komatiitic gold source for the Mt Charlotte deposit, again calling upon a locally derived
gold source. Phillips and Groves (1983), Phillips et al. (1987) and Stuwe et al. (1993)
proposed that gold bearing ore fluids in orogenic gold deposits of the Yilgarn craton
resulted from the devolatilization of Archean greenstone belts (i.e. the metamorphic
replacement model). For the Golden Mile, these authors proposed that the greenschist
facies metamorphism in the Kalgoorlie terrane was broadly synchronous with gold
mineralization and provided the hydrothermal fluids and the metals. However, results of
mineral chemistry presented in this paper suggest a magmatic fluid source.
Results of laser ablation ICP-MS analyses on the ore-hosting sulfides in the
Fimiston and Oroya lodes demonstrate a Au-Cu-Te-Sb association, which suggests a
possible felsic magmatic origin (cf. Callaghan, 2001) for the hydrothermal fluids and/or
the metals. The connection to felsic magmatic fluid is consistent with abundant high-Ca
CHAPTER SEVEN: GOLD MINERALIZATION AND THE BLFZ
164
and mafic granitoid magmatism in the Kalgoorlie area (Champion and Sheraton, 1997),
which is associated with terrane accretion (cf.Guillemette and Williams-Jones, 1993),
postulated during the time of Fimiston-style gold mineralization. Further evidence for a
link between felsic magmatism and gold mineralization in Kalgoorlie is provided by
Gauthier et al. (in revision) who established that subduction-related calc-alkaline
intermineralization andesite dikes are synchronous with Fimiston-style gold
mineralization.
At Kambalda, D1 deformation involved north-south compression and resulted in
the formation of westerly trending thrust faults and recumbent folds (Archibald et al.,
1978; Swager, 1997). There was no gold mineralization associated with this event at
Kambalda. At the New Celebration gold camp, Nichols (2003), Weinberg et al. (2005)
and Nichols et al. (in revision) did not recognize an event correlating to regional D1.
Based on the current evidence, late D1 and early D2 was the most significant
period for gold mineralization in the evolution of the orogen, with the giant Fimiston
and Oroya lodes formed at the Golden Mile, potentially prior to the establishment of the
BLFZ at Kalgoorlie.
5.2 Late D2 (2670 – 2660) Approximately east-west oriented compression during regional D2 and D3 led to
the upright tilting of conformable stratigraphic units at New Celebration (Nichols, 2003)
and Kambalda (Nguyen et al., 1998), and initiated the formation of the BLFZ at
Kalgoorlie and New Celebration in two stages: firstly, by the development of discrete
approximately north-south trending, east and west dipping thrusts during D2, and
secondly, the reactivation of those thrusts into a single, cohesive, NNW trending,
sinistral oblique-slip shear zone (Weinberg et al., 2005). At Kambalda, D2 deformation
involved the inversion of east-dipping structures formed during rifting and extension
(Miller et al., 2009). Lamprophyres immediately adjacent to, and deformed by, the
BLFZ at New Celebration (Williams, 1994) suggest that the fault was a deep-crustal or
mantle-tapping structure (cf. Rock and Groves, 1988a, b; Rock, 1990). The
development of a regionally extensive deep crustal structure may have been the time
when deep mantle-derived methane was introduced into the hydrothermal system.
Evidence for this includes: (1) primary early, pre-gold methane inclusions in quartz
veins at New Celebration; (2) the appearance of methane in the Oroya ore fluids
(Scantlebury, 1983; Ho, 1986) and; (3) early, pre-gold methane-dominated inclusions at
Kambalda (K. Petersen, personal communication, 2007; Petersen et al., submitted).
CHAPTER SEVEN: GOLD MINERALIZATION AND THE BLFZ
165
Widespread high-Ca and mafic granitoid magmatism in the Kambalda area
(Champion and Sheraton, 1997) accompanied compression, and led to the development
of skarn-type epidote-calcite-magnetite-pyrite-chalcopyrite-quartz alteration in mafic
rocks adjacent to intermediate porphyry stocks at Kambalda (Neumayr et al., 2004).
Mueller noted similar hydrothermal alteration associated with high-Mg monzodiorite-
tonalite intrusions at the Hannan South mine and Shea prospect, which he described as
Cu-Au endoskarns. He noted that biotite-sericite alteration and oxidized ore-related
mineral assemblages at Mt Shea were identical to magnetite-hematite bearing gold lodes
at Kambalda and the Golden Mile and considered that they formed due to oxidized
magmatic fluids ascending from buried subduction-related monzodiorite-tonalite
plutons. This style of skarn-type alteration and mineralization was not observed
associated with the ore-hosting M1 and M2 porphyry dikes at New Celebration.
5.3 D3 (2660-2647 Ma) -D4 (<2640 Ma) Deformation The onset of regional D3 deformation marked a change in the evolution of the
BLFZ from discrete thrust ramps to a continuous, crustal-scale strike-slip fault system
(Weinberg et al., 2005). This event was associated with the onset of significant gold
mineralization at New Celebration (Figs. 7.13 and 7.14) and Kambalda (Fig. 7.15).
Importantly, however, the D3 right and left-lateral and oblique reverse faults at the
Golden Mile are not associated with gold mineralization or significant hydrothermal
alteration and cut earlier Fimiston and Oroya lodes (Bateman and Hagemann, 2004).
Gold mineralization at New Celebration and Kambalda during D3 and early D4
took place in at least two stages; the first associated with ductile strike-slip deformation
on the BLFZ, and the second, associated with brittle-ductile reactivation of the BLFZ
and following a period of significant uplift and erosion. The first ductile deformation-
related mineralization event in the Kalgoorlie-Kambalda corridor was restricted to New
Celebration (Stage I Au, Fig 7.13) and involved the formation of gold mineralization
within ductile, oblique-slip, shear-related fabrics in magnetite-altered intermediate
plagioclase porphyry and mylonitized mafic schist (Nichols, 2003). The gold-bearing,
aqueous-carbonic fluids are characterized by low- to moderate salinity (2-7 wt.% NaCl
equiv.), low to medium XCO2 (0.03-0.3) and trace methane (XCH4 = 0.0-0.04), and had
K/Ca ratios of <1. Formation temperatures and pressures ranged between 330 and 500°
C and 2.4 and 4.2 kbars, respectively, which corresponds to crustal paleodepths between
10 and 14 kilometers (cf. Brown and Hagemann, 1995). Gold precipitated by wall rock
reaction between sulfur-bearing hydrothermal fluids and magnetite-bearing wall rocks.

CHAPTER SEVEN: GOLD MINERALIZATION AND THE BLFZ
166
The second brittle-ductile deformation-related Au event was observed at New
Celebration (Stage II Au, Fig. 7.14), Kambalda (Fig. 7.15) and Kalgoorlie (Mt Charlotte
Au, Fig. 7.16) gold camps. The reactivation of the BLFZ and associated hydrothermal
alteration and fluid flow controlled gold mineralization at New Celebration and
Kambalda and with right-lateral oblique slip faults at Kalgoorlie. There are significant
commonalities between the ore fluids at all camps. Gold mineralization at New
Celebration formed from a low salinity (3 to 7 wt.% NaCl equiv.) aqueous-carbonic
fluid with variable carbon dioxide contents (XCO2= 0.03 to 0.76), and Clark et al.
(1989) documented similar fluids (8 to 9 wt.% NaCl equiv. and XCO2=0.1 to 0.2)
associated with gold related metasomatism at the Victory deposit. Aqueous-carbonic,
low-salinity (2.0 to 5.5 equiv. wt. % NaCl) fluids characterized Mt Charlotte Gold
mineralization. Stage II gold mineralization at New Celebration occurred at
temperatures and pressures between 280 and 360° C, and 1 to 3.5 kbars, respectively
from a combination of: (1) phase immiscibility; and (2) wall rock sulfidation reactions
(this study), and possibly a fluid mixing component. Potassium/Ca ratios of the Stage II
ore fluids are greater than 1, which indicates that a switch in fluid source took place
between Stage I and Stage II gold mineralization at New Celebration. Clark et al. (1989)
proposed that gold mineralization at the Victory deposit was related to wall rock
metasomatic reactions at 390±40° C and 1.7 to 2.0 kbars. They concluded that gold
mineralization occurred at significantly lower temperatures and pressures than those
estimated for peak metamorphism (2.5 to 3.5 kbars and 450 to 570° C, (Archibald,
1985)) and, therefore, took place after a period of significant uplift and erosion.
In a recent, on-going, Kambalda camp-scale investigation on the hydrothermal
fluid flow and gold mineralization, Neumayr et al. (2004; 2008) and Petersen et al.
(2005) concluded that gold mineralization formed at zones of redox gradient due to the
influx of magmatic sulfate-bearing CO2-dominated (oxidized) fluids into the existing
reduced (CH4-N2±CO2) hydrothermal fluid system. They theorized that the oxidized
CO2-rich fluid entered the hydrothermal system via intermittent tapping of deeper
crustal CO2 reservoirs or CO2-rich magmas during fault movement (cf. Cox and
Ruming, 2004).
Charlotte-style sheeted quartz vein deposits (Ridley and Mengler, 2000;
Bateman and Hagemann, 2004) characterize gold mineralization associated with right-
lateral, oblique slip D4 faults. The type example is the Mt Charlotte deposit at the
northern end of the Kalgoorlie gold camp, but significant Charlotte-style mineralization

CHAPTER SEVEN: GOLD MINERALIZATION AND THE BLFZ
167
also occurs throughout the Golden Mile (Harbi, 1997; Bateman et al., 2001; Bateman
and Hagemann, 2004). Sheeted quartz-carbonate±scheelite veins in the granophyric
Unit 8 of the Golden Mile Dolerite in the footwall of closely-spaced D4 strike-slip faults
(Clark, 1980) characterize the Mt Charlotte deposit. Gold related hydrothermal
alteration adjacent to the veins is zoned both laterally and vertically, with albite, chlorite
and magnetite replacing ankerite, sericite, pyrite, siderite and rutile proximal to the
veins, and pyrrhotite progressively replacing pyrite with increasing depth (Clark, 1980;
Mikucki and Heinrich, 1993). Hydrothermal fluid chemistry varies slightly with depth,
but is characterized mainly by aqueous-carbonic, low-salinity (2.0 to 5.5 equiv. wt. %
NaCl) fluids. There is a distinct vertical gradient (Mernagh, 1996) in fluid temperature
(200-440° C), which corresponds with the changing alteration assemblages with depth.
The highest homogenization temperatures are observed in quartz veins at more than
800m depth below the present-day surface (Mernagh, 1996). The majority of the gold is
located within the wall rocks, and not within the veins, indicating that wall rock
sulfidation was the dominant ore forming process, although Mernagh (1996) proposed
cooling and oxidation of the ore-bearing fluid as it reacted with host rocks as an
alternative gold precipitation mechanism (Clark, 1980; Phillips, 1986; Ho et al., 1990).
Fluid inclusion evidence from Mt Charlotte (Clark, 1980; Ho et al., 1990) indicate that
phase separation was also a contributing factor to gold precipitation within the quartz
veins.
Movement along the BLFZ during the regional D4 deformation event is
contentious. At New Celebration, Nichols (2003) documented post-D3 horizontal
slickenlines on the BLFZ, indicating strike-slip movement of unknown direction and
displacement. At Kalgoorlie, there is no direct evidence for fault zone movement at the
BLFZ during regional D4 (Swager, 1989). Regional D4 at Kalgoorlie is expressed by a
series of north north-easterly striking dextral faults that offset all previous structures
(Swager, 1989; Bateman and Hagemann, 2004). The precise geometry of their
interaction with the BLFZ is not known. One possibility is that the oblique faults are
secondary features controlled by a reversal of shear direction, from sinistral to dextral,
along the pre-existing BLFZ. Evidence for this hypothesis is that the D4 Golden Pike
fault is deflected at its intersection with the BLFZ (Woodall, 1965). The observation
that the Golden Pike fault curves, for a considerable length, from an oblique to a strike
parallel orientation, is an argument in favor of this shear reversal. Alternatively, the D4
oblique dextral faults are unrelated to the BLFZ.

CHAPTER SEVEN: GOLD MINERALIZATION AND THE BLFZ
168
The D3 and D4 events saw the establishment of the BLFZ as a single cohesive
fault on a regional scale, and the introduction of widespread gold mineralization
throughout the Kalgoorlie-Kambalda corridor. Mineralogical and geochemical evidence
indicates that this episode of gold mineralization was unrelated to formation of the
earlier Fimiston and Oroya lodes. The New Celebration and St Ives deposits are
unequivocally linked to the western segment and the Lefroy segment of the BLFZ,
respectively, however, the relationship between gold at Mt Charlotte and the BLFZ is
less certain. It is likely that gold at the Mt Charlotte deposit formed from the same
crustal fluid reservoir as New Celebration and St Ives, however, hydrothermal fluid
movement at the latter two was focused via the BLFZ, whereas the hydrothermal fluids
that formed Mt Charlotte Au exploited the same (and as yet unidentified?) regional
crustal structures that facilitated Fimiston and Oroya mineralization.
5.4 Post-D4 There is presently no evidence for post-D4 structures, or deformation along the
BLFZ in the Kalgoorlie-Kambalda corridor, other than east-west trending Proterozoic
dikes
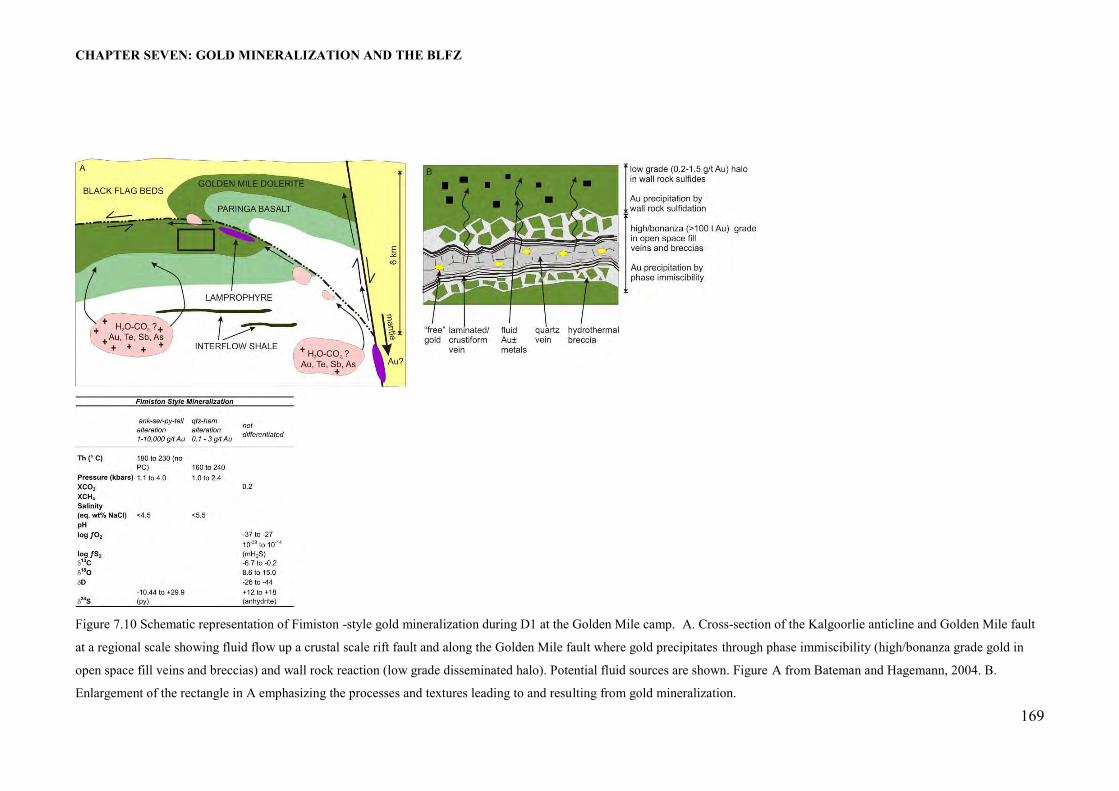
CHAPTER SEVEN: GOLD MINERALIZATION AND THE BLFZ
169
Figure 7.10 Schematic representation of Fimiston -style gold mineralization during D1 at the Golden Mile camp. A. Cross-section of the Kalgoorlie anticline and Golden Mile fault
at a regional scale showing fluid flow up a crustal scale rift fault and along the Golden Mile fault where gold precipitates through phase immiscibility (high/bonanza grade gold in
open space fill veins and breccias) and wall rock reaction (low grade disseminated halo). Potential fluid sources are shown. Figure A from Bateman and Hagemann, 2004. B.
Enlargement of the rectangle in A emphasizing the processes and textures leading to and resulting from gold mineralization.

CHAPTER SEVEN: GOLD MINERALIZATION AND THE BLFZ
170
Figure 7.11 Schematic representation of Oroya -style gold mineralization during D2 at the Golden Mile camp. A. Cross-section of the Kalgoorlie anticline and Golden Mile fault at a
regional scale reoriented and tilted upright during regional E-W deformation. From Bateman and Hagemann, 2004. B Schematic representation of ore textures and distribution of
high and low grade zones in Oroya lodes.

CHAPTER SEVEN: GOLD MINERALIZATION AND THE BLFZ
171
Figure 7.12 A. Schematic cross-section through the New Celebration gold deposit showing potential fluid and metal sources and the location of gold mineralization during the
formation of Stage I gold mineralization and D3NC deformation. B. Enlargement of oblong in A illustrating the ore forming processes and the distribution of mineralization adjacent
to the BLFZ.
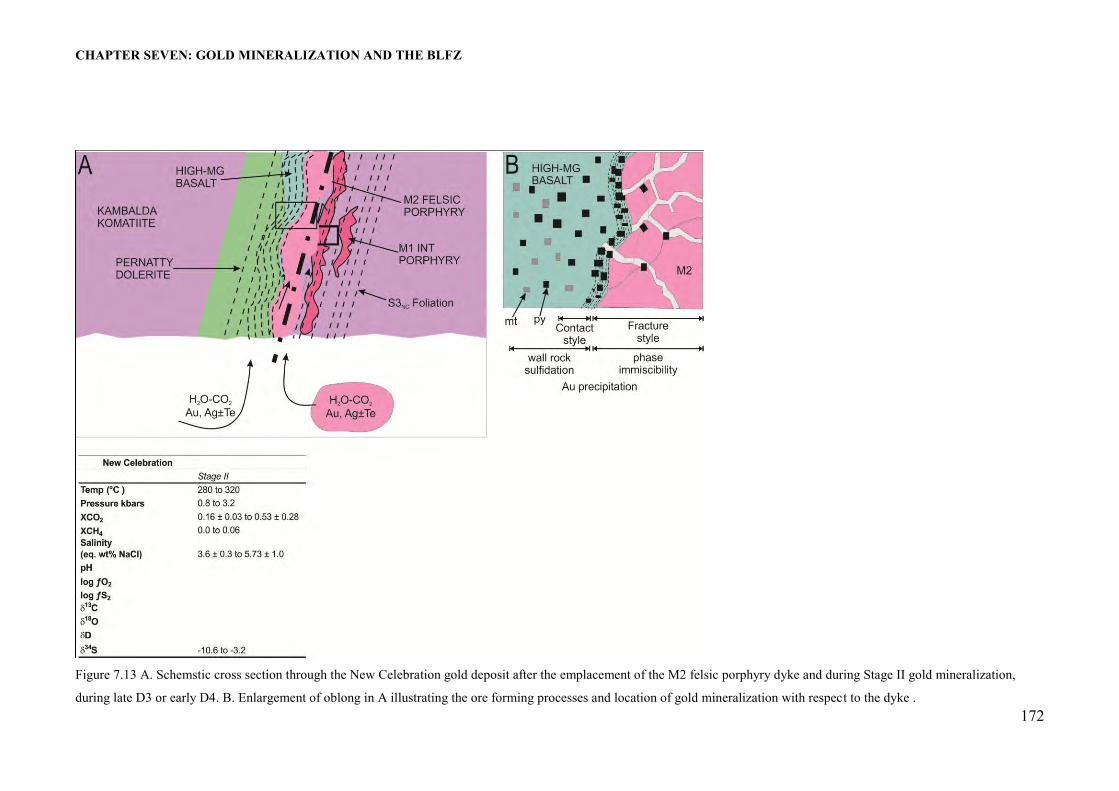
CHAPTER SEVEN: GOLD MINERALIZATION AND THE BLFZ
172
Figure 7.13 A. Schemstic cross section through the New Celebration gold deposit after the emplacement of the M2 felsic porphyry dyke and during Stage II gold mineralization,
during late D3 or early D4. B. Enlargement of oblong in A illustrating the ore forming processes and location of gold mineralization with respect to the dyke .

CHAPTER SEVEN: GOLD MINERALIZATION AND THE BLFZ
173
Figure 7.14 A. Schematic cross section through the St Ives gold camp showing the relationship of gold mineralization to the BLFZ and the second order Playa fault. B. Location of
gold mineralization and gold precipitation mechanisms. Fig. B from Nguyen et al. 1998
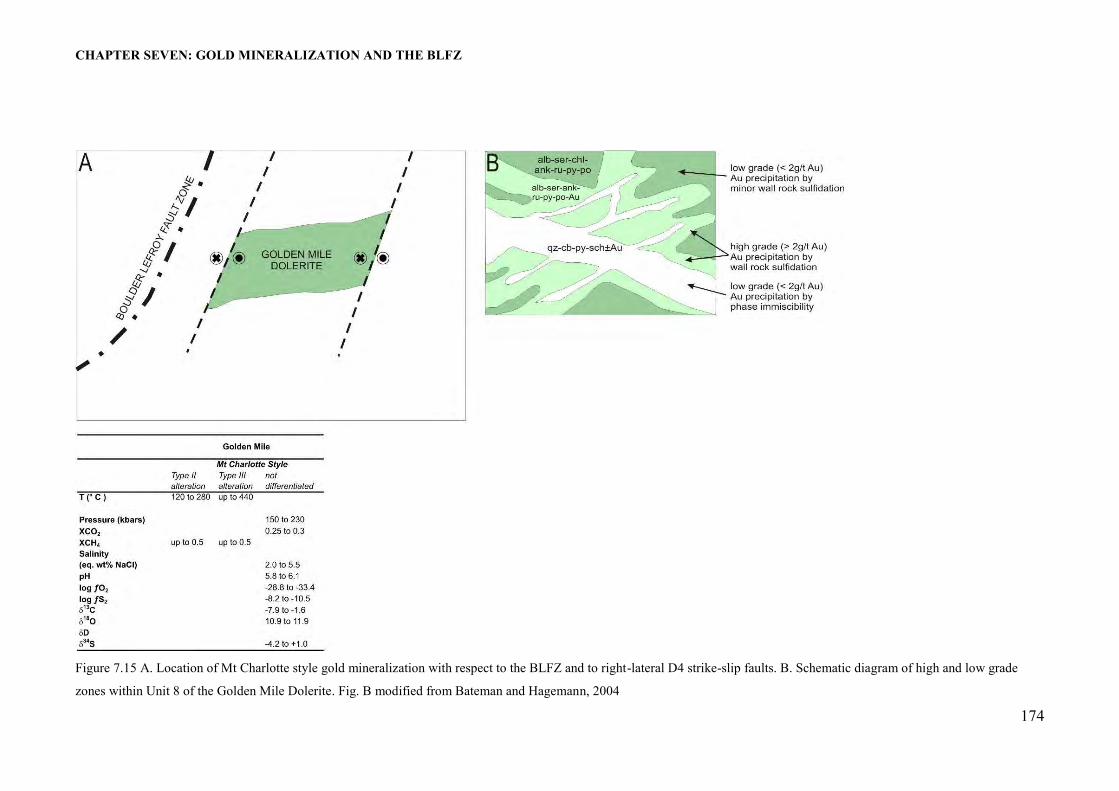
CHAPTER SEVEN: GOLD MINERALIZATION AND THE BLFZ
174
Figure 7.15 A. Location of Mt Charlotte style gold mineralization with respect to the BLFZ and to right-lateral D4 strike-slip faults. B. Schematic diagram of high and low grade
zones within Unit 8 of the Golden Mile Dolerite. Fig. B modified from Bateman and Hagemann, 2004

CHAPTER SEVEN: GOLD MINERALIZATION AND THE BLFZ
175
that intruded tensional fractures. Williams (1994) and Nichols (2003) observed quartz-
calcite-chlorite veins that crosscut D3 foliation, gold mineralization and post-D3NC
slickenline orientations, which Nichols (2003) assigned to D4NC. In addition, various
workers throughout the Kalgoorlie-Kambalda corridor observed fluid inclusion trails
that crosscut earlier gold-related quartz crystals and associated fluid inclusion
assemblages, suggesting significant hydrothermal fluid circulation after the cessation of
gold mineralization throughout the region. Unfortunately, in most studies, these fluid
inclusion trails cannot be correlated with deformation events; therefore, they remain
temporally unconstrained.
Widespread high salinity (18-37 wt.% NaCl equiv.) aqueous fluids, trapped as
secondary fluid inclusions in trails that crosscut quartz grain boundaries, are reported
from New Celebration (Hodge et al., in revision) and Kambalda (Clark et al., 1989). At
New Celebration, Hodge et al. (in revision) calculated minimum formation temperatures
and pressures of 100 °C-180 °C and 0.4 to 1 kbar, indicating that these fluids were
trapped at significantly higher crustal levels than the ore forming fluids. They
considered that these fluids were likely unrelated to the ore fluids, and were well after
mineralization took place, and after a period of uplift and erosion. Potassium-calcium
ratios and trace element compositions indicate a potential magmatic source for these
fluids. In contrast, Clark et al. (1989) interpreted these secondary fluid inclusions at
Kambalda to be the consequence of phase separation of the earlier moderately saline
CO2-bearing fluids during the late stages of mineralization (cf. Robert and Kelly, 1987).
It is worth noting that Bouiller et al. (1998), in their work on lode gold deposits of the
Archean Abitibi belt, disproved Robert and Kelly's (1987) work on the Sigma mine and
demonstrated that the saline inclusions were unrelated to gold mineralization and were
likely crustal shield brines. It is possible that Clark et al's (1989) interpretation of the
saline inclusions at Kambalda is also incorrect, and that they post-date mineralization
and are related to similar inclusions at New Celebration. At New Celebration, the latest
observed fluid inclusion assemblages contain predominantly methane, with minor
ethane (C2H6) and propane (C3H8), and, are interpreted as the latest stage fluid
circulating within the BLFZ. The timing of these fluids is again unconstrained; they
may have been introduced immediately after gold mineralization and by implication
when the BLFZ potentially was connected to the mantle, or millions of years later. At
New

CHAPTER SEVEN: GOLD MINERALIZATION AND THE BLFZ
176
Figure 7.16 Timing chart summarizing the geological, deformational and mineralization history of the Kalgoorlie-Kambalda corridor

CHAPTER SEVEN: GOLD MINERALIZATION AND THE BLFZ
177
Celebration, it is noteworthy that these reduced methane-rich fluids characterize the first
and last observed fluid events (Hodge et al. in revision).
6. DISCUSSION
The giant Golden Mile and world-class New Celebration and St Ives deposits,
all spatially associated with the BLFZ, show a number of similarities with regard to
their mineralogy and hydrothermal fluids. They are: (1) at all deposits, the ore-forming
fluids are low to moderate salinity (<1 to ~15 wt.% NaCl equiv.) mixed aqueous-
carbonic (XCO2 = 0.03-0.3 but locally up to 1.0) fluids with minor methane (XCH4=0.0
to 0.04); (2) the dominant ore-forming mechanism at each deposit is wall rock reaction
between gold and sulfur bearing ore fluids and Fe-oxides, and (3) gold mineralization at
all camps is accompanied by broadly similar hydrothermal alteration mineralogy, such
as ankerite, siderite, albite and pyrite. However, there are a number of discrepancies
evident between the different deposits.
6.1 Geochemistry Geochemically, there are a number of significant differences between the
Fimiston and Oroya lodes at the Golden Mile, and all other gold mineralization in the
corridor. These are: (1) the Fimiston and Oroya styles of gold mineralization at the
Golden Mile are associated with vanadian-rich minerals, which are not observed
elsewhere in the Kalgoorlie-Kambalda corridor; (2) gold mineralization at the Golden
Mile is commonly associated with extensive telluride mineralization not observed
elsewhere in the corridor; and (3) a number of textural and fluid characteristics at the
Golden Mile suggest mineralization took place at much shallower crustal levels than at
New Celebration or St Ives.
Results of this study have further differentiated Fimiston and Oroya lodes from
other gold mineralization in the corridor on the basis of their sulfide geochemistry,
which distinguished these lodes from the New Celebration and St Ives deposits by their
high As and Sb concentrations, and extremely high Te concentrations in pyrite, which
are orders of magnitude higher than those measured in New Celebration and St Ives
pyrites. These aspects of the detailed evolution of the BLFZ and associated gold
mineralization warrant further discussion.
(1) The Fimiston and Oroya lodes contain V associated with the ore fluid,
evidenced by the presence of V-rich muscovite (roscoelite), which is not reported from

CHAPTER SEVEN: GOLD MINERALIZATION AND THE BLFZ
178
either New Celebration or Kambalda. Roscoelite is rare in mesothermal lode gold
deposits, however it is a relatively common in epithermal gold-telluride deposits (e.g.
Cripple Creek, Colorado: (Jensen and Barton, 2000); Emperor, Fiji: (Ahmad et al.,
1987b); and Porgera, Papua New Guinea: (Cameron et al., 1995; Cameron, 1998))
where the presence of vanadium is usually linked to alkalic igneous rocks spatially
related to the gold deposits (e.g. Ahmad et al., 1987b; Zhang and Spry, 1994; Pals and
Spry, 2003).
(2) The Fimiston and Oroya lodes contain nineteen identified tellurides
(Shackleton et al., 2003 and references therein) and Te concentrations in Fimiston and
Oroya pyrites range up to 2400 ppm. Thermodynamic modeling predicts Te
transportation in magmatic hydrothermal vapors (Cooke and McPhail, 2001) therefore,
the high Te concentrations reported at the Golden Mile imply a magmatic fluid source.
(3) A number of features of the Golden Mile Fimiston and Oroya deposits
suggest formation at significantly shallower crustal levels (<~6km) than other deposits
in the region. There is a high abundance of open space-fill ore textures at the Golden
Mile that are not observed anywhere else in the Kalgoorlie-Kambalda corridor.
(4) New evidence from this study reveals high As and Sb concentrations in
Fimiston and Oroya ore-stage pyrites. This supports a magmatic fluid source for these
lodes, and the presence of Sb in Fimiston and Oroya pyrites suggests emplacement of
these lodes at epizonal crustal levels and at temperatures <300° C (Pitcairn et al., 2006).
6.2 Timing There are also a number of timing issues surrounding the formation of gold
mineralization in the Kalgoorlie-Kambalda corridor and its relationship to the BLFZ.
The early timing of Fimiston and Oroya mineralization at the Golden Mile and the
potential absence during these mineralization events of a coherent BLFZ appears to
preclude the BLFZ as a feeder zone for hydrothermal fluid migration and suggests that
mineralization at the Golden Mile is unrelated to the BLFZ, and other deposits in the
corridor. Seismic interpretations on the nature of the crust beneath the Golden Mile
indicate that the BLFZ dips to the west in this area (Goleby et al., 2002). This would
place the Golden Mile deposit in the footwall of the BLFZ, and there is no structural
evidence to suggest that the Golden Mile was ever linked to the BLFZ. A new study on
the structural architecture of the St Ives deposits by Miller et al. (2009) indicates that at
Kambalda, the Lefroy segment of the BLFZ exploited structures formed during rifting
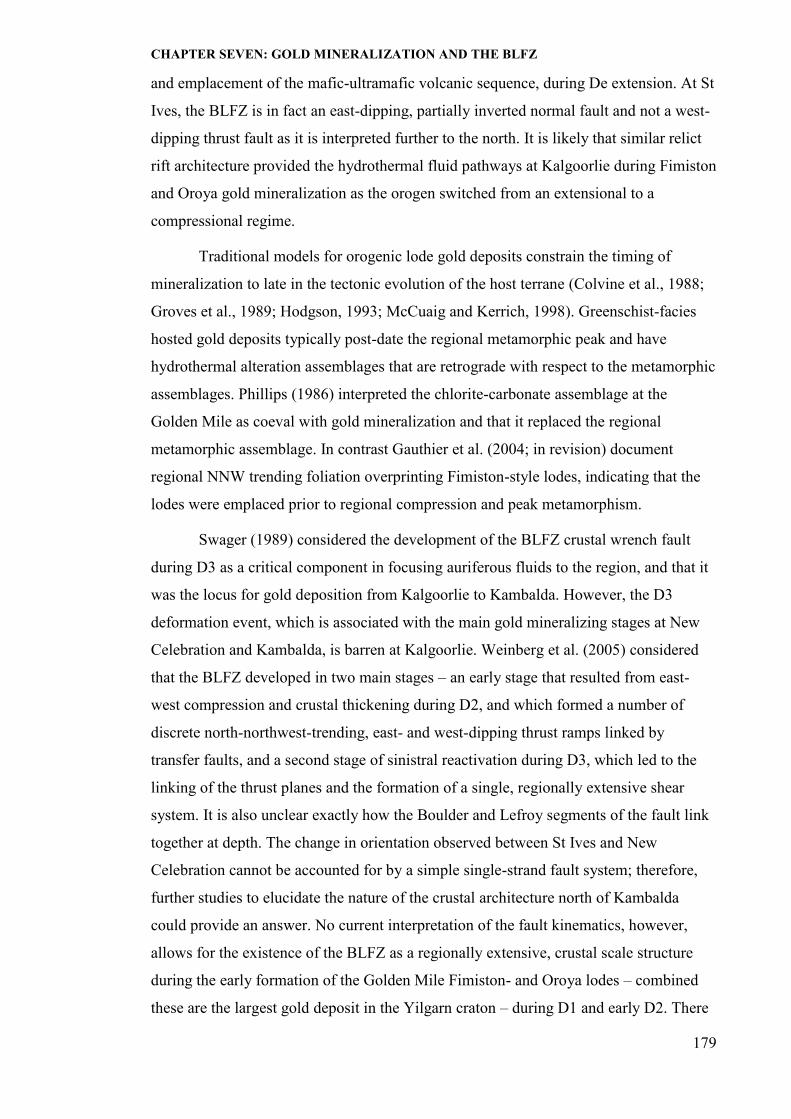
CHAPTER SEVEN: GOLD MINERALIZATION AND THE BLFZ
179
and emplacement of the mafic-ultramafic volcanic sequence, during De extension. At St
Ives, the BLFZ is in fact an east-dipping, partially inverted normal fault and not a west-
dipping thrust fault as it is interpreted further to the north. It is likely that similar relict
rift architecture provided the hydrothermal fluid pathways at Kalgoorlie during Fimiston
and Oroya gold mineralization as the orogen switched from an extensional to a
compressional regime.
Traditional models for orogenic lode gold deposits constrain the timing of
mineralization to late in the tectonic evolution of the host terrane (Colvine et al., 1988;
Groves et al., 1989; Hodgson, 1993; McCuaig and Kerrich, 1998). Greenschist-facies
hosted gold deposits typically post-date the regional metamorphic peak and have
hydrothermal alteration assemblages that are retrograde with respect to the metamorphic
assemblages. Phillips (1986) interpreted the chlorite-carbonate assemblage at the
Golden Mile as coeval with gold mineralization and that it replaced the regional
metamorphic assemblage. In contrast Gauthier et al. (2004; in revision) document
regional NNW trending foliation overprinting Fimiston-style lodes, indicating that the
lodes were emplaced prior to regional compression and peak metamorphism.
Swager (1989) considered the development of the BLFZ crustal wrench fault
during D3 as a critical component in focusing auriferous fluids to the region, and that it
was the locus for gold deposition from Kalgoorlie to Kambalda. However, the D3
deformation event, which is associated with the main gold mineralizing stages at New
Celebration and Kambalda, is barren at Kalgoorlie. Weinberg et al. (2005) considered
that the BLFZ developed in two main stages – an early stage that resulted from east-
west compression and crustal thickening during D2, and which formed a number of
discrete north-northwest-trending, east- and west-dipping thrust ramps linked by
transfer faults, and a second stage of sinistral reactivation during D3, which led to the
linking of the thrust planes and the formation of a single, regionally extensive shear
system. It is also unclear exactly how the Boulder and Lefroy segments of the fault link
together at depth. The change in orientation observed between St Ives and New
Celebration cannot be accounted for by a simple single-strand fault system; therefore,
further studies to elucidate the nature of the crustal architecture north of Kambalda
could provide an answer. No current interpretation of the fault kinematics, however,
allows for the existence of the BLFZ as a regionally extensive, crustal scale structure
during the early formation of the Golden Mile Fimiston- and Oroya lodes – combined
these are the largest gold deposit in the Yilgarn craton – during D1 and early D2. There

CHAPTER SEVEN: GOLD MINERALIZATION AND THE BLFZ
180
are three alternatives to explain this (1) the BLFZ was active much earlier than
previously interpreted, at least during D1; (2) gold mineralization at the Golden Mile
was in fact late in the tectonic evolution of the terrane and the interpretations of D1
mineralization by Bateman et al. (2001) and Bateman and Hagemann (2004) are
erroneous; or (3) Golden Mile mineralization is unrelated to the BLFZ.
(1) Gee (1981) considered that the deep crustal scale faults in the Yilgarn
originated during extension as feeder faults for early volcanism., There is no evidence at
Kalgoorlie or New Celebration for the existence of, or movement along, the BLFZ
during D1, however, a recent study by Miller et al. (2009) which used seismic profiles
and dolerite thickness isopachs at St Ives to delineate the underlying structures indicates
that at least at St Ives, the original rift architecture had a strong influence on the
formation of crustal structures during post-extensional compression, and that a proto-
BLFZ was in place at Kambalda at least during D1 and likely during De. Similar
detailed investigations have not yet been carried out in the Kalgoorlie or New
Celebration areas, but there is currently no evidence for pre-D2 movement on the BLFZ
at either of these localities (Nichols, 2003; Weinberg et al., 2005; Nichols et al., in
revision). Option 2 is considered unlikely. Recent age determinations by Gauthier et al.
(2004) and Gauthier et al. (submitted) support the detailed structural studies carried out
by a number of authors (Bailly et al., 2000; Bateman et al., 2001; Bateman and
Hagemann, 2004) who consider that mineralization at the Golden Mile occurred early in
the tectonic evolution of the belt. This interpretation is consistent with the recent work
of Morey (2007), who evaluated gold mineralization and structural controls within the
Bardoc Tectonic Zone (BTZ), immediately to the north of Kalgoorlie. He concluded
that mineralization along the BTZ was associated with early D2 E-W compressional
tectonics and that the D3 strike-slip event was insignificant. Further, seismic evidence
for a west-dipping BLFZ in Kalgoorlie (Goleby et al., 2002) places the Golden Mile in
the footwall of the fault, which would be unlikely if the BLFZ was actually related to
Golden Mile gold mineralization. If we accept that Fimiston mineralization at the
Golden Mile took place early in the deformational history of the terrane then it was not
associated with the BLFZ. The evidence from this study, in conjunction with recent
work done on the Golden Mile and Kambalda deposits, suggest that option three is most
likely i.e. gold mineralization at the Golden Mile is unrelated to either the BLFZ, or to
gold mineralization at New Celebration or Kambalda.

CHAPTER SEVEN: GOLD MINERALIZATION AND THE BLFZ
181
In contrast, there is abundant evidence that the New Celebration and St Ives
deposits are related to each other and to the BLFZ. Gold mineralization at both areas
took place later in the orogen, when the BLFZ was established as a cohesive, single,
crustal scale shear zone (Weinberg et al., 2005). Both deposits show a direct connection
with the BLFZ – New Celebration gold mineralization is hosted directly within the
western segment of the fault and the St Ives deposit formed within the Playa fault – a
second order splay in the footwall of the BLFZ. Stage I gold mineralization at New
Celebration is hosted in pyrite, which is in textural equilibrium with S3 foliation planes
(Nichols, 2003), and Stage II gold mineralization is hosted within a boudinaged felsic
porphyry emplaced directly into the fault (Norris, 1990; Copeland, 1998). Both the New
Celebration and St Ives deposits show fluid inclusion evidence for methane within the
hydrothermal system, consistent with the development of the hydrothermal system in an
environment with a mantle connection, evidenced by the presence of lamprophyres
contemporaneous with gold mineralization at both camps (cf. Rock and Groves, 1988a;
Rock, 1990).
7. CONCLUSIONS
Recent work on the Kalgoorlie-Kambalda corridor challenges the traditionally
held interpretations that the gold deposits of the region are temporally and genetically
related to each other and to the BLFZ. If we accept that Fimiston- and Oroya-style gold
mineralization at the Golden Mile took place during D1 and D2, and predated peak
metamorphism (cf. Gauthier et al., 2004), then the widely accepted metamorphic
devolatilization model (Phillips et al., 1987) used to explain the source of hydrothermal
fluids and metals including gold has to be called in to question. Clout (1989) proposed a
significant surface water component to the Fimiston and Oroya lodes and, based on
oxygen, hydrogen and sulfur isotopes, and in conjunction with the textural features,
classified the Golden Mile as a near-surface epithermal Au-Te deposit. The presence of
vanadium in roscoelite, extremely rare in mesozonal orogenic gold deposits, but
characteristic of low sulfidation epithermal Au-Te deposits, suggests an alkalic
magmatic origin for the Golden Mile. Bateman et al. (2001) related gold mineralization
to east-over-west thrusts on the Golden Mile fault, and it is possible that this fault
tapped a magmatic fluid reservoir, which led to the formation of the Golden Mile
deposits in a shallow crustal, epizonal environment prior to the development of the
crustal scale BLFZ. A magmatic origin for the Golden Mile is consistent with the
interpretations of Bateman et al. (2001), who concluded that the sulfur isotopic

CHAPTER SEVEN: GOLD MINERALIZATION AND THE BLFZ
182
compositions of sulfides from the Oroya-style lode were consistent with mixing an
oxidized magmatic fluid with heavy sulfur-bearing metasedimentary units within the
Paringa Basalt, and with Clout (1989) who postulated a shallow epithermal origin for
the Golden Mile deposit based on the open space ore textures and oxygen isotopes of
gold-related quartz veins, which indicated a meteoric water component to the ore fluid.
Gauthier et al. (in revision) also postulated a magmatic association, based on the
contemporaneity of Fimiston-style lodes with intermineral andesite dikes.
Increased methane contents ore fluids from Oroya-style lodes, which formed
during early D2, may reflect the onset of faulting along the BLFZ trend, which
introduced deep crustal or mantle methane into the hydrothermal fluid system. Ductile
and brittle-ductile related gold mineralization at New Celebration and Kambalda,
associated with D3 sinistral strike-slip and oblique-slip movement on the BLFZ was
related to the formation of, and deformation along, the BLFZ and reflects separate
processes and fluid sources to the Golden Mile deposits. The results of this study, and
evidence from other researchers (Hagemann et al., 1999; Bateman et al., 2001; Nichols,
2003; Bateman and Hagemann, 2004; Gauthier et al., 2004; Neumayr et al., 2004;
Petersen et al., 2005; Petersen et al., 2006; Walshe et al., 2006; Neumayr et al., 2008;
Miller et al., 2009; Gauthier et al., in revision) leads to the following conclusions:
1. Fimiston and Oroya style gold mineralization took place at the Golden Mile prior
to regional peak metamorphism and the formation of the BLFZ. It is unrelated to
the fault, or to either the New Celebration or Kambalda deposits, and likely
formed from magmatic fluid and/or metal sources in a shallow crustal
environment.
2. The New Celebration and Kambalda deposits show a number of similarities,
including fluid chemistry, alteration mineralogy, and sulfide composition. They
appear to be genetically related, i.e. they formed during the same D3 deformation
event and the hydrothermal fluids for each deposit were likely sourced from the
same crustal fluid reservoirs and transported via the BLFZ and its higher order
splays
3. The Golden Mile deposit, which is one of the largest in the world, is unique and
distinctive to the region and is unrelated to the BLFZ.
If the Golden Mile deposit is unrelated to the BLFZ, the question remains, what
then, facilitated the movement of such immense volumes of hydrothermal fluid into an

CHAPTER SEVEN: GOLD MINERALIZATION AND THE BLFZ
183
area that generated one of the world’s richest gold deposits? Evidence from Kambalda
that indicates that syn-mineralization structures exploited a crustal architecture
established as much as 70 million years earlier might provide the answer. The
Kalgoorlie gold deposits formed during the change from extension, accompanied by
mafic-ultramafic and bimodal mafic-felsic volcanism, to compression. At this point, the
deep crustal rift structures would still have been connected to the deep crust and upper
mantle, and could have provided the hydrothermal fluid pathways that facilitated the
movement of magmatic fluids, enriched in gold, tellurium and vanadium, to the upper
crust, which provided ideal physico-chemical conditions for the formation of the giant
Golden Mile deposit. This structure has yet to be identified in the Kalgoorlie region, but
could lie along the eastern margin of the current Kalgoorlie camp.
ACKNOWLEDGEMENTS
This paper was conceived and written during the first author’s PhD research at
the University of Western Australia. The first author (JLH) acknowledges the support of
an Australian Postgraduate Award and a pmd*CRC supplementary scholarship. The
pmd*CRC is also thanked for providing research funding, and Dr R. Hayden (CEO) is
thanked for permission to publish. Analytical facilities were provided by the University
of Tasmania, and particular thanks go to Sarah Gilbert, for assistance with LA-ICP-MS
mineral chemistry analyses, and Garry Davidson and Keith Harris for sulfur isotope
analyses

CHAPTER EIGHT: CONCLUSIONS
184
8 CHAPTER EIGHT: CONCLUSIONS The Boulder-Lefroy fault zone is spatially correlated with one giant (>1000 t
Au) and two world-class (>100 t Au) gold deposits, in addition to a number of smaller
deposits, which together have produced in excess of 2000 t of gold since it was first
discovered in 1893. The relationship between major crustal breaks and orogenic gold
deposits has long been recognized, however, the first-order segments of these fault
systems are in general poorly researched, mostly due to a lack of exposure, but also
because most gold endowment is contained in higher order splays, and not within the
first order segments themselves. The New Celebration gold deposit, which exposes the
BLFZ in the open pit, provides a unique opportunity not only to study a major crustal
break located in one of the world’s most richly gold endowed corridors, but also to
study a world-class deposit located directly within the fault.
The major objectives of this thesis were to: (1) document the pressure-
temperature-composition characteristics of the mineralizing and non-mineralizing
hydrothermal fluids in the BLFZ at New Celebration, (2) determine the metal content of
gold-bearing and barren fluids within the New Celebration hydrothermal system, (3)
characterize the major and trace element composition of hydrothermal oxides, ore-stage
sulfides and gold, and the sulfur isotopic composition of ore-stage pyrites, (4) to
critically evaluate these datasets with a view to evaluating the potential source (or
sources) of these fluids, and (5) integrate all the available data into a hydrothermal fluid
model for the evolution of the BLFZ and related gold mineralization at New
Celebration. An additional aim was to compare and contrast the three major gold camps
(Golden Mile, New Celebration, St Ives) of the Kalgoorlie-Kambalda corridor in terms
of their geochemistry, hydrothermal alteration, stable isotopic signatures and
mineralization styles, and evaluate the role of the BLFZ in forming one of the richest
gold mineralized corridors on earth.
8.1 New Celebration Hydrothermal Fluid System
Petrographic, fluid inclusion and isotopic analyses of the pre- and syn-gold
related veins and ore-related host sulfides at New Celebration indicate that: (1) the two
stages of gold mineralization at New Celebration formed from differing hydrothermal
fluids from different processes under differing P-T conditions during the evolution of
the Boulder-Lefroy fault zone, and (2) the BLFZ was the conduit for a variety of fluids
CHAPTER EIGHT: CONCLUSIONS
185
at different times during its evolution and had a protracted (mid D3 to D4, ~ 20 million
years) and complex fluid history.
8.1.1 Gold Mineralization
Aqueous-carbonic fluid inclusions trapped in syn-D3NC type 2 quartz-carbonate
veins indicate that Stage I gold mineralization took place at temperatures between 330
°C and 390 °C and between 3.2 and 4.0 kbars at a crustal depth between 10 and 15
kilometers (assuming lithostatic fluid pressures) during ductile deformation. The ore-
forming fluids were H2O-CO2 dominant, with salinities between 1.9 ± 1.2 and 5.9 ± 0.7
wt. percent NaCl equiv. They contained 10 ±1 to 33 ± 13 mole percent CO2 and up to
33 ± 1 mole percent CH4. Gold precipitated as a consequence of sulfidation reactions
with iron-rich wall rocks in which pre-existing hydrothermal magnetite alteration
provided sufficient iron to facilitate gold precipitation by wall rock sulfidation in an
otherwise iron-poor host rock. There was no fluid inclusion evidence for phase
separation or fluid mixing during Stage I gold mineralization.
Stage II mineralization, as evidenced by aqueous and aqueous-carbonic
inclusions trapped in post-D3NC type 3 quartz veins, formed at temperatures (between
280 °C and 320 °C) and pressures (between 0.8 and 3.2kbar), corresponding to crustal
depths between 4 and 10 kilometers (assuming lithostatic fluid pressures) during brittle-
ductile deformation. Stage II hydrothermal fluids were H2O-CO2 dominant, with
calculated salinities between 3.6 ± 0.3 and 5.7 ± 1.0 wt. percent NaCl equiv. and
between 16 ± 3 and 76 mole % CO2. Sulfidation reactions between sulfur-bearing gold-
rich fluids and iron oxides in high magnesium basalt facilitated gold precipitation for
Contact-style mineralization along the contacts of the M2 felsic porphyry dike. The
presence of liquid-rich and vapor-rich end member fluid inclusions, total
homogenization into liquid and vapor at the same temperature and variable bulk
compositions and molar volumes of inclusions within individual trails or clusters in type
3 quartz veins, and the lack of petrographic evidence for wall rock sulfidation in the M2
porphyry dike indicate that phase separation was the likely cause of gold precipitation in
Fracture-style mineralization. Vapor-rich carbonic inclusions, observed in type 3 quartz
veins, indicate the presence of a CO2-rich fluid at some point in the hydrothermal
evolution of New Celebration. The paragenetic relationship between these CO2-rich
inclusions and the gold-bearing aqueous-carbonic inclusions are unclear, due to a lack
of observed cross-cutting relationships, however, their presence in the system suggests
CHAPTER EIGHT: CONCLUSIONS
186
that there may have been a degree of fluid mixing between gas-rich and gold bearing
fluids during the evolution of the hydrothermal system.
Laser ablation-ICP-MS analyses on individual fluid inclusions revealed that
gold-related aqueous carbonic fluid inclusions contained up to 51ppm Au and
significant concentrations of other metals such as Cu, Pb and Zn. The H2O-CO2
inclusions in type 2 veins were Na-Ca dominant, with subordinate K and Mg, and had
K/Ca ratios <1. Individual fluid inclusions contained up to 51ppm gold although
average concentrations were around 5ppm (n=80). Concentrations of other metals were
generally low, although these inclusions did contain up to 163ppm Cu, 75ppm Zn and
43ppm As. The H2O-CO2 inclusions in type 3 veins and quartz alteration associated
with Contact style mineralization contained higher Na, Mg and K concentrations, but
lower Ca (K/Ca >1) than those in type 2 veins. Stage II fluids had up to 33ppm Au
(n=60), and generally contained higher concentrations of Cu, Pb, Zn, Sr, As, Sb, Bi, Sn,
Mn and Fe than fluids associated with Stage I gold mineralization.
The change in K/Ca ratios and variable metal concentrations from Stage I to
Stage II indicate that a switch in fluid source occurred between Stage I and Stage II
mineralization. The source of both the metals and fluids is currently unconstrained;
however, the change in fluid characteristics from a Na-Ca dominated fluid to a Na-K
dominated fluid possibly represents a switch from metamorphic fluids, derived from the
devolatilization of deep crustal rocks undergoing regional scale metamorphism, to fluids
of magmatic origin, coinciding with the emplacement of the M2 porphyries.
The sulfur isotopic composition of ore-stage pyrites also illustrated differences
between the two mineralizing events, and reinforced the interpretation that
mineralization at New Celebration took place by different processes and from different
fluid sources. Stage I pyrites had 34S values between -7.6 and +3.8 per mil, whereas
Stage II pyrites had more negative values, between -10.6 and -3.2 per mil. These values
are generally more negative than typically reported from orogenic lode gold deposits in
both Australia and Canada (McCuaig and Kerrich, 1998). The isotopic composition of
Stage I pyrites is interpreted to reflect the sulfur composition of the ore fluid, as the
replacement of wall rock magnetite by pyrite will not result in in situ fluid oxidation
during gold precipitation (Palin and Xu, 2000). Fluid inclusion evidence indicates that
Stage II mineralization formed at least partially due to phase immiscibility. This process
does lead to fluid oxidation (Drummond and Ohmoto, 1985) and depletion of 34S in the

CHAPTER EIGHT: CONCLUSIONS
187
residual liquid and partially accounts for the negative values to -10.6 per mil and the
spread of values between -10.6 and -3.2 per mil observed in Stage II ore-related pyrites.
Trace element analyses of sulfides and oxides revealed that pyrites from Stage II
Fracture-style mineralization showed markedly different trace element patterns than
those pyrites related to both Stage I mineralization styles and Stage II Contact-style
mineralization. They showed depletion of Ni, Co, Mn, Cr, and Zn but enrichment of Pb
and Bi relative to Stage I and Stage II Contact-style pyrites, and a far higher proportion
of poly-metallic inclusions within the pyrite grain compared to Stage I and Stage II
Contact style pyrites. This likely reflects the differing ore-forming processes and fluid
sources between the mineralization styles and stages where Stage I and Stage II Contact
style pyrites reflect the composition of wall rock magnetites from which the pyrites
formed whereas the composition of Stage II pyrites reflects fluid composition
8.1.2 Hydrothermal Evolution
Pressures and temperatures calculated from all fluid inclusion types analyzed at
New Celebration, and independent geothermobarometric constraints, such as chlorite
geothermometry and phengite geobarometry (Williams, 1994), describe an
anticlockwise P-T path. These data, in conjunction with sulfur isotopic and major and
trace element compositions of ore-stage pyrites, and the trace element composition of
auriferous and barren hydrothermal fluids, as determined by single fluid inclusion
analyses, point towards a complex hydrothermal fluid system within the western
segment of the BLFZ. The two gold mineralizing stages were separated by a period of
uplift and erosion, and secondary post-gold fluid inclusions in types 2 and 3 quartz
veins record at least three distinct phases of fault zone reactivation at New Celebration.
High salinity aqueous inclusions, which are interpreted to post-date all other inclusion
populations except the latest methane inclusions, have pressure and temperature
trapping estimates that are significantly lower than for all previous fluid inclusion
assemblages (100° -180 °C, 0.4-1.0 kbars), suggesting significant uplift and erosion
during the final reactivation stages of the BLFZ.
The hydrothermal evolution of the BLFZ and New Celebration gold deposits is
characterized by discrete pulses of gold-bearing and barren hydrothermal fluids
infiltrating the fault as a consequence of distinct deformation events (D3NC to D4+NC)
including several reactivation events. At least two gas-rich fluid events are recorded that
cannot be linked to gold mineralization. The gold mineralization stages are

CHAPTER EIGHT: CONCLUSIONS
188
characterized by aqueous-carbonic inclusions and as such are similar to many other
gold-bearing fluids observed in many orogenic gold deposits worldwide (cf. Phillips
and Groves, 1983; Wood et al., 1986; Robert and Kelly, 1987; Colvine, 1989; Groves et
al., 1989; Ho et al., 1990; Groves et al., 1992; Ho et al., 1992; Groves, 1993; Groves
and Foster, 1993; Hodgson, 1993; Mikucki and Ridley, 1993; Hagemann and Cassidy,
2000; Ridley and Diamond, 2000). Cation ratios indicate a fluid source switch between
Stage I and Stage II fluids. There is no fluid inclusion evidence for significant surface
water infiltration into the BLFZ at New Celebration (cf. Hagemann et al., 1993),
therefore, the switch in K/Ca ratios may relate to a change in deep fluid sources such as
magmatic or metamorphic fluids or a combination of the two. Methane-rich fluids are
evident throughout the evolution of the New Celebration hydrothermal system, and in
the absence of any outcropping black shales in the New Celebration deposit area, or
evidence for post-entrapment modification of fluid inclusions, or for Fischer-Tropsch-
type synthesis in reducing conditions, are interpreted to indicate mantle contributions.
8.2 Regional Hydrothermal Fluid System
The results of this study on the nature of the fluids in the BLFZ at New
Celebration and the new data on sulfur isotopic and geochemical composition of
sulfides from the Golden Mile, New Celebration and St Ives, in conjunction with
evidence from other researchers (Hagemann et al., 1999; Bateman et al., 2001; Nichols,
2003; Bateman and Hagemann, 2004; Gauthier et al., 2004; Neumayr et al., 2004;
Petersen et al., 2005; Petersen et al., 2006; Walshe et al., 2006; Neumayr et al., 2008;
Gauthier et al., in revision) challenge the traditionally held interpretations that the gold
deposits of the region are temporally and genetically related to each other and to the
BLFZ.
The Golden Mile is distinctive from other deposits in the Kalgoorlie-Kambalda
corridor, particularly in terms of its geochemistry and ore-related alteration
assemblages, but also in its relative timing to the formation of the orogen, the
development of the BLFZ as a cohesive fault system, and the timing of gold formation
at other centers in the corridor. The characteristic vanadian mica associated with the
Fimiston and Oroya lodes, and the abundance of telluride mineralization that formed
with gold, differentiate them from all other gold deposit styles in the Kalgoorlie-
Kambalda corridor. These features are more common in deposits that are spatially
related to alkalic igneous rocks and therefore imply a significant magmatic fluid
CHAPTER EIGHT: CONCLUSIONS
189
contribution to the Fimiston and Oroya lodes. Antimony-rich ore-stage pyrites, which
are not observed at deposits elsewhere in the corridor, indicate formation temperatures
for the Fimiston and Oroya lodes of less than 300 °C, and in conjunction with open
space fill textures reported from these lodes, imply a low P-T epizonal setting for their
formation. Recent work by Bateman et al. (2001), Bateman and Hagemann (2004) and
Gauthier et al. (2004; in revision) indicates that the Fimiston and Oroya lodes at the
Golden Mile formed much earlier than originally proposed, prior to peak
metamorphism, during regional D1/D2. Recent work by Miller et al. (2009) at the St
Ives deposit, has postulated an early timing for the formation of the BLFZ in Kambalda,
perhaps as early as De, and consider that it reflects the underlying rift architecture active
during extension-related bimodal volcanism. Weinberg et al. (2005), however, indicated
that the BLFZ as a regional crustal scale structure did not exist prior to D2, and there is
no evidence for movement of the BLFZ during D1 or D2 at either Kalgoorlie or New
Celebration. Given the location of the Fimiston and Oroya lodes in the footwall of the
BLFZ, the lack of structural connectivity between the lodes and the fault, and the
apparent absence of an active BLFZ in the Golden Mile during the period that gold
mineralization took place, it therefore seems unlikely that gold mineralization is related
to deformation or fluid flow along the BLFZ. It is more likely that the hydrothermal
fluids, which formed the richest square mile on earth, exploited an existing underlying
crustal architecture emplaced during rifting, such as that observed at Kambalda (Miller
et al., 2009) but located somewhere to the east of the BLFZ and as yet unidentified.
In contrast, the New Celebration and Kambalda deposits show a number of
similarities to each other, including fluid chemistry, alteration mineralogy, and sulfide
composition, and appear to be unequivocally related to the BLFZ. St Ives gold
mineralization is located within the Playa fault, a second-order splay in the footwall of
the BLFZ, and the New Celebration deposit is located directly within the fault, either in
S3NC foliation planes or in boudinaged felsic porphyry. Mineralization at both deposits
formed late in the development of the orogen, when the BLFZ was a single cohesive
fault system, and both show direct connections to the BLFZ. Both show an abundance
of lamprophyres and methane-rich fluids inclusions, suggesting direct connectivity to
the mantle at some point (cf. Rock and Groves, 1988a, b; Rock et al., 1989).

CHAPTER EIGHT: CONCLUSIONS
190
8.3 Exploration Implications
Although the role of crustal scale faults as vectors towards lode gold
mineralization in higher order structures has long been recognized (e.g. Eisenlohr et al.,
1989), crustal scale faults have been largely ignored as primary exploration targets.
Historically, most lode gold deposits have been discovered in higher order splays, which
are considered more advantageous sites for gold deposition due to their geological
complexity (Hodkiewicz, 2003), favorable dilational characteristics (Eisenlohr et al.,
1989; Groves et al., 1989; Kerrich, 1989; Robert, 1990) and localization of gold-bearing
ore fluids (Neumayr and Hagemann, 2002).
Gold mineralization at New Celebration clearly relates to the influx of gold-
bearing CO2-rich fluids into the western segment of the Boulder-Lefroy crustal-scale
fault zone during D3NC and D4NC deformation, where gold precipitated due to the
reaction of the hydrothermal fluids with magnetite-bearing intermediate and felsic wall
rocks (Stage I) and phase separation (Stage II). The New Celebration deposits are not
typical orogenic lode gold deposits in that they are hosted within a primary crustal scale
structure within predominantly intermediate and felsic intrusive rocks; a geological
setting mostly considered unfavorable for exploration in the Yilgarn Craton, where
mafic rocks host the majority of orogenic lode gold deposits (Groves, 1990). This study
illustrates that first-order fault systems do have the potential to host significant gold
mineralization where the physico-chemical parameters are favorable and should be
evaluated when exploring in both brownfields and greenfields terrains.
8.4 Future Work
This study provided better constraints on the metal composition of orogenic lode
gold fluids and demonstrates that a switch in fluid source took place between Stage I
and Stage II mineralization at New Celebration, however, the source (or sources) of the
mineralizing, and other, fluids within the hydrothermal system are still poorly
understood. Stable isotopic tracers do not unequivocally differentiate between source,
however, crustal reservoirs (mantle, magmatic, metamorphic) have unique noble gas
and halogen concentrations, which do allow differentiation between them. This
technique has recently been used to differentiate between magmatic and mantle CO2 and
CH4 reservoirs at St Ives (Kendrick et al., 2006). Noble gas and halogen analyses of
aqueous and aqueous-carbonic fluid inclusions from New Celebration are in progress at
the University of Melbourne and the results may provide better constraints on the
CHAPTER EIGHT: CONCLUSIONS
191
source(s) of mineralizing and non-mineralizing fluids. Stable isotopic analysis of carbon
in methane and aqueous-carbonic fluid inclusions may also provide better constraints on
the origin of hydrothermal fluids. This technique was tried at New Celebration but was
unsuccessful due to the small fluid inclusion size and low concentrations of CO2 and
CH4.
Geochronological constraints on the timing of gold mineralization were outside
the scope of this study and therefore the ages of granite stock emplacement and gold
mineralization are yet undetermined. Fluid inclusion evidence from this study indicates
that Stage II mineralization took place at lower temperatures and shallower crustal
levels than Stage I, suggesting that the two events were separated by a period of uplift
and erosion, of unknown duration. Maximum ages of gold mineralization could be
resolved by U-Pb SHRIMP (sensitive-high resolution ion microprobe) dating of zircons
within the host M1 (Stage I) and M2 (Stage II) porphyry dikes. Absolute mineralization
ages could be constrained by Pb/Pb dating of mineralization-related hydrothermal
monazite (cf. Nguyen, 1997, Revenge deposit, St Ives), by Re/Os dating of ore-stage
pyrite, or by Ar/Ar dating of sericite inclusions in ore-stage pyrite (Phillips and Miller,
2006).

REFERENCES
192
REFERENCES
Afifi, A. M., Kelly, W. C., and Essene, E. J., 1988, Phase relations among tellurides, sulfides, and oxides; Pt. II, Applications to telluride-bearing ore deposits: Economic Geology, v. 83, p. 395-404.
Ahmad, M., Solomon, M., and Walshe, J. L., 1987a, The formation of the quartz-gold-telluride veins of the Emporor mine, Fiji, in Brennan, E., ed., Pacific Rim Congress '87, An International Congress on the Geology, Structure, Mineralization and Economics of the Pacific Rim, Australasian Institute of Mining and Metallogeny, p. 1-14.
Ahmad, M., Solomon, M., and Walshe, J. L., 1987b, Mineralogical and geochemical studies of the Emperor gold telluride deposit, Fiji: Economic Geology, v. 83, p. 345-370.
Allan, M. M., Yardley, B. W. D., Forbes, L. J., Shmulovich, K. I., Banks, D. A., and Shepherd, T. J., 2005, Validation of LA-ICP-MS fluid inclusion analysis with synthetic fluid inclusions: American Mineralogist, v. 90, p. 1767-1775.
Amaro, D., 1985, Pyrite morphology, grainsize distribution and trace element content as indicators of gold mineralisation processes: Unpub. BSc (Hons) thesis, University of Western Australia.
Archibald, N. J., 1985, The stratigraphy and tectono-metamorphic history of the Kambalda-Tramways area, Western Australia, Western Mining Corporation Unpublished Report, p. 66.
Archibald, N. J., 1992, Jubilee gold deposit; geology, structure and mineralisation: Unpublished company report, p. 10.
Archibald, N. J., Bettenay, L. F., Binns, R. A., Groves, D. I., and Gunthorpe, R. J., 1978, The evolution of Archaean greenstone terrains, Eastern Goldfields Province, Western Australia: Precambrian Research, v. 6, p. 103-131.
Audetat, A., Gunther, D., and Heinrich, C. A., 1998, Formation of a Magmatic-Hydrothermal Ore Deposit: Insights with LA-ICP-MS Analysis of Fluid Inclusions: Science, v. 279, p. 2091-2094.
Audetat, A., Gunther, D., and Heinrich, C. A., 2000, Causes for Large-Scale Metal Zonation around Mineralized Plutons: Fluid Inclusion LA-ICP-MS Evidence from the Mole Granite, Australia: Economic Geology, v. 95, p. 1563-1581.
Audetat, A., Pettke, T., Heinrich, C. A., and Bodnar, R. J., 2008, Special Paper: The Composition of Magmatic-Hydrothermal Fluids in Barren and Mineralized Intrusions: Economic Geology, v. 103, p. 877-908.
Baggott, M. S., Vielreicher, N., Groves, D. I., McNaughton, N. J., and Gebre-Mariam, M., in press, Evidence for post ca 2.66 Ga Archean lode-gold mineralization in the Yandal belt, Western Australia, from the high-level, brittle-style Jundee-Nimary gold deposits: Economic Geology.
Bailly, L., Bouchot, V., Beny, C., and Milesi, J.-P., 2000, Fluid inclusion study of stibnite using infrared microscopy: an example from the Brouzils antimony deposit (Vendee, Armorican Massif, France): Economic Geology, v. 95, p. 221-226.
Barley, M. E., and Groves, D. I., 1987, Hydrothermal alteration of Archaean supracrustal sequences in the central Norseman-Wiluna belt, in Ho, S. E., and Groves, D. I., eds., Recent advances in understanding Precambrian gold deposits, University of Western Australia, Geology Department and University Extension, Publication No. 11, p. 51-66.
REFERENCES
193
Bartch, R. D., 1990, Lady Bountiful gold deposit, in Hughes, F. E., ed., Geology of the Mineral Deposits of Australia and Papua New Guinea, Australian Institute of Mining and Metallurgy Monograph 14, p. 401-404.
Bartram, G. D., and McCall, G. J. H., 1971, Wall-rock alteration associated with auriferous lodes in the Golden Mile, Kalgoorlie: Geological Society of Australia Special Publications, v. 3, p. 191-199.
Bateman, R. J., and Hagemann, S. G., 2004, Gold mineralisation throughout about 45 Ma of Archaean orogenesis: protracted flux of gold in the Golden Mile, Yilgarn Craton, Western Australia: Mineralium Deposita, v. 39, p. 536-559.
Bateman, R. J., Hagemann, S. G., McCuaig, T. C., and Swager, C., 2001, Protracted gold mineralisation throughout Archaean orogenesis in the Kalgoorlie camp, Yilgarn Craton, Western Australia: structural, mineralogical and geochemical evolution, in Hagemann, S. G., Neumayr, P., and Witt, W. K., eds., World-class Gold Camps and Deposits in the Eastern Yilgarn Craton, Western Australia, with Special Emphasis on the Eastern Goldfields Province, Record 2001/17, Western Australian Geological Survey, p. 63-98.
Benning, L. G., and Seward, T. M., 1996, Hydrosulphide complexing of gold(I) in hydrothermal solutions from 150 to 500°C and 500 to 1500 bars: Geochimica et Cosmochimica Acta, v. 60, p. 1849-1871.
Bierlein, F., and Crowe, D., 2000, Phanerozoic orogenic lode gold deposits, in Hagemann, S. G., and Brown, P. E., eds., Gold in 2000, Reviews in Economic Geology, v. 13, p. 103-139.
Blewett, R. S., Cassidy, K. F., Champion, D. C., Henson, P. A., Goleby, B. S., Jones, L., and Groenewald, P. B., 2004, The Wangkathaa Orogeny: an example of episodic regional `D2' in the late Archaean Eastern Goldfields Province, Western Australia: Precambrian Research, v. 130, p. 139 - 159.
Blewett, R. S., and Hitchman, A. P., 2006, 3D Geological models of the eastern Yilgarn Craton Project Y2, Geoscience Australia Record 2006/05, p. 276.
Bodnar, R. J., and Vityk, M. O., 1994, Interpretation of microthermometric data for H2O-NaCl inclusions, in De Vivo, B., and Frezzotti, M. L., eds., Fluid Inclusions in Minerals: Methods and Applications, Virginia Polytechnic Institute Press, p. 117-130.
Borisenko, A. S., 1977, Study of the salt composition of solutions in gas-liquid inclusions in minerals by the cryometric method: Soviet Geology and Geophysics, v. 18, p. 11-19.
Boullier, A., Firdaous, K., and Robert, F., 1998, On the significance of aqueous fluid inclusions in gold-bearing quartz vein deposits from the Southeastern Abitibi subprovince (Quebec, Canada): Economic Geology, v. 93, p. 216-223.
Boulter, C. A., Fotios, M. G., and Phillips, G. N., 1987, The Golden Mile, Kalgoorlie: A giant gold deposit localized in ductile shear zones by structurally induced infiltration of an auriferous metamorphic fluid: Economic Geology, v. 82, p. 1661-1678.
Bowers, T. S., 1991, The deposition of gold and other metals: Pressure-induced fluid immiscibility and associated stable isotope signatures: Geochimica et Cosmochimica Acta, v. 55, p. 2417.
Bray, C. J., Spooner, E. T. C., and Thomas, A. V., 1991, Fluid inclusion volatile analysis by heated crushing, on-line gas chromatography: application to Archaean fluids: Journal of Geochemical Exploration, v. 42, p. 167-192
Brown, P. E., and Hagemann, S. E., 1995, MacFlinCor and its application to fluids in
Archean lode-gold deposits: Geochimica et Cosmochimica Acta, v. 59, p. 3943-3952.
REFERENCES
194
Bucci, L. A., Hagemann, S. G., Groves, D. I., and Standing, J. G., 2002, The Archean Chalice gold deposit: a record of complex, multistage, high-temperature hydrothermal activity and gold mineralisation associated with granitic rocks in the Yilgarn Craton, Western Australia: Ore Geology Reviews, v. 19, p. 23.
Bucci, L. A., McNaughton, N. J., Fletcher, I. R., Groves, D. I., Kositcin, N., Stein, H. J., and Hagemann, S. G., 2004, Timing and Duration of High-Temperature Gold Mineralization and Spatially Associated Granitoid Magmatism at Chalice, Yilgarn Craton, Western Australia: Economic Geology, v. 99, p. 1123-1144.
Buchholz, P., Oberthur, T., Luders, V., and Wilkinson, J., 2007, Multistage Au-As-Sb Mineralization and Crustal-Scale Fluid Evolution in the Kwekwe District, Midlands Greenstone Belt, Zimbabwe: A Combined Geochemical, Mineralogical, Stable Isotope, and Fluid Inclusion Study: Economic Geology, v. 102, p. 347-378.
Burnham, C. W., 1979, Magmas and hydrothermal fluids, in Barnes, H. L., ed., Geochemistry of hydrothermal ore deposits: New York, Wiley Interscience, p. 71-136.
Burrows, D. R., and Spooner, E. T. C., 1986, The McIntyre Cu-Au deposit, Timmins, Ontario, Canada, in Macdonald, A. J., ed., Proceedings of Gold '86, an international symposium on the Geology of Gold Deposits: Toronto, p. 23-39.
Burrows, D. R., and Spooner, E. T. C., 1987, Generation of a magmatic H2O-CO2 fluid enriched in Mo, Au, and W within an Archean sodic granodiorite stock, Mink Lake, northwestern Ontario: Economic Geology, v. 82, p. 1931-1957.
Burrows, D. R., Wood, P. C., and Spooner, E. T. C., 1986, Carbon isotope evidence for a magmatic origin for Archaean gold-quartz vein deposits: Nature, v. 321, p. 851-854.
Callaghan, T., 2001, Geology and Host-Rock Alteration of the Henty and Mount Julia Gold Deposits, Western Tasmania: Economic Geology, v. 96, p. 1073-1088.
Cameron, E. M., 1988, Archean gold: relation to granulite formation and redox zoning in the crust: Geology, v. 16, p. 109-112.
Cameron, E. M., 1993, Precambrian Gold: perspectives from the top and bottom of shear-zones: Canadian Mineralogist, v. 31, p. 917-944.
Cameron, E. M., and Hattori, K., 1987, Archean gold mineralization and oxidized hydrothermal fluids: Economic Geology, v. 82, p. 1177-1191.
Cameron, G., 1998, The hydrothermal evolution and genesis of the Porgera gold deposit, Papua New Guinea: Unpub. PhD thesis, Australian National University, 137 p.
Cameron, G., Wall, V. J., Walshe, J. L., and Heinrich, C. A., 1995, Gold mineralization at the the Porgera deposit, Papua New Guinea, in response to fluid mixing: PACRIM '95 Conference, Auckland, New Zealand, 1995, p. 99-100.
Carew, M. J., Mark, G., Oliver, N. H. S., and Pearson, N., 2006, Trace element geochemistry of magnetite and pyrite in Fe oxide (±Cu–Au) mineralised systems: Insights into the geochemistry of ore-forming fluids: Geochimica et Cosmochimica Acta, v. 70, p. A83.
Cassidy, K., and Bennett, J., 1993, Gold mineralisation at the Lady Bountiful Mine, Western Australia: An example of a granitoid-hosted Archaean lode gold deposit: Mineralium Deposita, v. 28, p. 388.
Champion, D. C., and Sheraton, J. W., 1997, Geochemistry and Nd isotope systematics of Archaean granites of the Eastern Goldfields, Yilgarn Craton, Australia: implications for crustal growth processes: Precambrian Research, v. 83, p. 109.
Channer, D. M. D., and Spooner, E. T. C., 1991, Grant 364. Multiple fluid inclusion generations in variably deformed quartz: Hollinger-McIntyre and Ker Addison-
REFERENCES
195
Chesterville Archean gold-bearing quartz-vein systems, Northern Ontario: Ontario Geological Survey Miscellaneous Paper 156, p. 47-64.
Clark, M. E., 1980, Localization of gold, Mt Charlotte, Kalgoorlie, Western Australia: Unpub. BSc (Honours) thesis, University of Western Australia, 128 p.
Clark, M. E., 1987, The geology of the Victory gold mine, Kambalda, Western Australia: Unpub. PhD thesis, Queen's University
199 p. Clark, M. E., Archibald, N. J., and Hodgson, C. J., 1986, The structural and
metamorphic setting of the Victory gold mine, Kambalda, Western Australia, in Macdonald, A. J., ed., Gold '86: Willowdale, Ontario, Konsult International Incorporated, p. 243-254.
Clark, M. E., Carmichael, D. M., Hodgson, C. J., and Fu, M., 1989, Wall-rock alteration, Victory gold mine, Kambalda, Western Australia: Processes and P-T-X(CO2) conditions of metasomatism: Economic Geology Monograph, v. 6, p. 445-459.
Cline, J. S., and Bodnar, R. J., 1991, Can economic porphyry copper mineralization be generated by a typical calc-alkaline melt?: Journal of Geophysical Research, v. 96, p. 8113-8126.
Clout, J. M. F., 1989, Structural and isotopic studies of the Golden Mile gold-telluride deposit, Kalgoorlie, W.A.: Unpub. PhD thesis, Monash University, Melbourne, Australia.
Clout, J. M. F., Cleghorn, J. H., and Eaton, P. C., 1990, Geology of the Kalgoorlie Gold Field, in Hughes, F. E., ed., Geology of the Mineral Deposits of Australia and Papua New Guinea: Melbourne, Australasian Institute of Mining and Metallurgy, p. 411-431.
Collins, P. L. F., 1979, Gas hydrates in CO2-bearing fluid inclusions and the use of freezing for estimation of salinity: Economic Geology, v. 74, p. 1435-1444.
Colvine, A. C., 1989, An empirical model for the formation of Archean gold deposits: Products of final cratonization of the Superior Province, Canada, in Keays, R. R., Ramsay, W. R. H., and Groves, D. I., eds., The geology of gold deposits; the perspective in 1988, Economic Geology Monograph Volume 6, p. 37-53.
Colvine, A. C., Fyon, J. A., Heather, K. B., Marmont, S., Smith, P. M., and Troop, D. G., 1988, Archean Lode Gold Deposits in Ontario, Ontario Geological Survey Miscellaneous Paper 139, p. 136.
Cooke, D. R., and McPhail, D. C., 2001, Epithermal Au-Ag-Te Mineralization, Acupan, Baguio District, Philippines: Numerical Simulations of Mineral Deposition: Economic Geology, v. 96, p. 109-131.
Cooke, D. R., and Simmons, S. F., 2000, Characteristics and genesis of epithermal gold deposits: SEG Reviews, v. 13, p. 221-244.
Copeland, I. K., 1998, Jubilee gold deposit, Kambalda: Australasian Institute of Mining and Metallurgy Monograph 22, p. 219-224.
Couture, J. F., and Pilote, P., 1993, The geology and alteration patterns of a disseminated, shear zone-hosted mesothermal gold deposit: the Francoeur 3 Deposit, Rouyn-Noranda, Quebec
Economic Geology, v. 88, p. 1664-1684. Cox, S. F., Knackstedt, M. A., and Braun, J., 2001, Principles of Structural Control on
Permeability and Fluid Flow in Hydrothermal Systems, in Richards, J. P., and Tosdal, R. M., eds., Structural Controls on Ore Genesis, SEG Reviews, v. 14, p. 1-24.
Cox, S. F., and Ruming, K., 2004, The St Ives mesothermal gold system, Western Australia - a case of golden aftershocks?: Journal of Structural Geology, v. 26, p. 1109-1125.
REFERENCES
196
Cox, S. F., Sun, S. S., Etheridge, M. A., Wall, V. J., and Potter, T. F., 1995, Structural and geochemical controls on the development of turbidite-hosted gold quartz vein deposits, Wattle Gully Mine, Central Victoria, Australia: Economic Geology, v. 90, p. 1722-1746.
Crawford, M. L., 1981, Phase equilibria in aqueous fluid inclusions, in Hollister, L. S., and Crawford, M. L., eds., Short Course in Fluid Inclusions: Applications to Petrology, 6, Mineralogical Association of Canada, p. 75-100.
de-Ronde, C. E. J., Spooner, E. T. C., de-Wit, M. J., and Bray, C. J., 1992, Shear Zone-related, Au Quartz Vein Deposits in the Barberton Greenstone Belt, South Africa: Field and Petrographic Characteristics, Fluid Properties, and Light Stable Isotope Geochemistry: Economic Geology, v. 87, p. 366-402.
Diamond, L. W., 1990, Fluid inclusion evidence for P-V-T-X evolution of hydrothermal solutions in late alpine gold-quartz veins at Brusson, Val d'ayas, Northwest Italian Alps: American Journal of Science, v. 290, p. 912-958.
Diamond, L. W., 1992, Stability of clathrate hydrate + CO2 liquid + CO2 vapour + aqueous KCl-NaCl solutions: Experimental determination and application to salinity estimates of fluid inclusions: Geochimica et Cosmochimica Acta, v. 56.
Diamond, L. W., 2001, Review of the systematics of CO2-H2O fluid inclusions: Lithos, v. 55, p. 69-99.
Dielemans, P., 2000, Structural controls on gold mineralisation in the Southern Ore Zone of the Hampton-Boulder deposit, New Celebration gold mine, Western Australia: Unpub. MSc. thesis, University of Western Australia, 185 p.
Donnelly, T. H., Lambert, I. B., Oehler, D. Z., Hallberg, J. A., Hudson, D. R., Smith, J. W., Bavinton, O. A., and Golding, L. Y., 1978, A reconnaissance study of stable isotope ratios in Archean rocks from the Yilgarn block, Western Australia: Journal of the Geological Society of Australia, v. 24.
Drummond, S. E., and Ohmoto, H., 1985, Chemical evolution and mineral deposition in boiling hydrothermal systems: Economic Geology, v. 80, p. 126-147.
Duan, Z., 1992, An equation of state for the CH4-CO2-H2O system: II. Mixtures from 50-1000°C and 0-1000 bar: Geochimica et Cosmochimica Acta, v. 56, p. 2619-2631.
Eastoe, C. J., 1978, A fluid inclusion study on the Panguna porphyry copper deposit, Bougainville, Papua New Guinea: Economic Geology, v. 73, p. 721-748.
Eggler, D. H., and Kadik, A. A., 1979, The system NaAlSiO3O8-H2O-CO2 to 20 kbar pressure: I. Compositional and thermodynamic relations of liquids and vapors coexisting with albite: American Mineralogist, v. 64, p. 1036-1048.
Eilu, P., and Groves, D. I., 2001, Primary geochemical dispersion haloes around Archaean orogenic gold deposits in the Yilgarn Craton. , in Cassidy, K. F., Dunphy, J. M., and van Kranendonk, M. J., eds., Fourth international Archaean symposium; extended abstracts, Australian Geological Survey Organisation, Report # 2001/37, p. 385-387.
Eisenlohr, B. N., Groves, D. I., and Partington, G. A., 1989, Crustal scale shear zones and their significance to Archaean gold mineralisation in Western Australia: Mineralium Deposita, v. 24, p. 1-8.
Ellis, A. J., and Golding, R. M., 1963, The solubility of carbon dioxide above 100°C in water and in sodium chloride solutions: American Journal of Science, v. 261, p. 47-60.
Evans, K. A., Phillips, G. N., and Powell, R., 2006, Rock-Buffering of Auriferous Fluids in Altered Rocks Associated with the Golden Mile-Style Mineralization, Kalgoorlie Gold Field, Western Australia: Economic Geology, v. 101, p. 805-817.

REFERENCES
197
Gauthier, L., Hagemann, S. G., Cassidy, K. F., Champion, D. C., and Robert, F., in revision, Inter-mineral hornblende-plagioclase-phyric andesite dyke suite associated with Fimiston-style mineralisation at the Golden Mile, Yilgarn craton, Western Australia
Gauthier, L., Hagemann, S. G., Robert, F., and Pickens, G., 2004, New constraints on the architecture and timing of the giant Golden Mile gold deposit, Kalgoorlie, Western Australia, in Muhling, J. R., Goldfarb, R. J., Vielreicher, N., Bierlein, F., Stumpfl, E., Groves, D. I., and Kenworthy, S., eds., SEG 2004: Predictive Mineral Discovery Under Cover; Extended Abstracts, Centre for Global Metallogeny, The University of Western Australia, Publication No. 33, p. 353-356.
Gebre-Mariam, M., Groves, D. I., and McNaughton, N. J., 1997, Aqueous and CO2- and CH4- rich inclusions at the Archean Golden Kilometre gold deposit: Multiple fluid sources and depositional mechanisms: Chronique de la Recherce Miniere, v. 529, p. 59-73.
Gebre-Mariam, M., Groves, D. I., McNaughton, N. J., and Vearncombe, J. A., 1993, Archaean Au−Ag mineralisation at Racetrack, near Kalgoorlie, Western Australia: a high crustal-level expression of the Archaean composite lode-gold system Mineralium Deposita, v. 28, p. 375-387.
Gebre-Mariam, M., Hagemann, S. G., and Groves, D. I., 1995, A classification scheme for epigenetic Archean lode-gold deposits: Mineralium Deposita, v. 30, p. 408-410.
Gee, R. D., Baxter, J. L., and Wilde, S. A., 1981, Crustal development in the Archaean Yilgarn Block, Western Australia: Geological Society of Australia Special Publication, v. 7, p. 43-56.
Gehrig, M., Lentz, H., and Franck, E. U., 1980, Phase equilibria and pVT of binary and ternary mixtures of water, carbon dioxide and sodium chloride up to 3 kb and 550 degrees C: Mineralogical Society Bulletin, v. 49, p. 6.
Gemuts, I., and Theron, A., 1975, The Archean between Coolgardie and Norseman-stratigraphy and mineralization, in Knight, C. L., ed., Economic Geology of Australia and Papua New Guinea, Volume 1, Metals Parkville, Australia,, The Australasian Institute of Mining and Metallurgy, Monograph 5, p. 66-74
Goldfarb, R. J., Ayuso, R., Miller, M. L., Ebert, S. W., Marsh, E. E., Petsel, S. A.,
Miller, L. D., Bradley, D., Johnson, C., and McClelland, W., 2004, The Late Cretaceous Donlin Creek Gold Deposit, Southwestern Alaska: Controls on Epizonal Ore Formation: Economic Geology, v. 99, p. 643-671.
Goldfarb, R. J., Baker, T., Dube, B., Groves, D. I., Hart, C. J. R., and Gosselin, P., 2005, Distribution, character, and genesis of gold deposits in metamorphic terranes, in Hedenquist, J. W., Thompson, J. F. H., Goldfarb, R. J., and Richards, J. P., eds., Economic Geology 100th Anniversary Volume, Society of Economic Geologists, p. 407-450.
Goldfarb, R. J., Groves, D. I., and Gardoll, S., 2001, Orogenic gold and geologic time: a global synthesis: Ore Geology Reviews, v. 18, p. 1.
Goldfarb, R. J., Newberry, R. J., Pickthorn, W. J., and Gent, C. A., 1991, Oxygen, hydrogen, and sulphur isotope studies in the Juneau gold belt, southeastern Alaska: constraints on the origin of hydrothermal fluids: Economic Geology, v. 86, p. 66-80.
Goldfarb, R. J., Snee, L. W., and Pickthorn, W. J., 1993, Orogenesis, high-T thermal events, and gold vein formation within metamorphic rocks of the Alaskan cordillera: Mineralogical Magazine, v. 57, p. 375-394.

REFERENCES
198
Golding, S. D., 1982, An isotopic and geochemical study of gold mineralization in the Kalgoorlie-Norseman region, Western Australia: Unpub. PhD thesis, University of Queensland.
Golding, S. D., 1984, Stable isotope and geochemical studies of porphyry-related gold mineralization, Kambalda, Western Mining Corporation, Unpublished Report.
Golding, S. D., Barley, M. E., Cassidy, K., Groves, D. I., Ho, S. E., Hronsky, J. M. A., McNaughton, N. J., Sang, J. H., and Turner, J. V., 1990a, Oxygen and hydrogen isotope studies, in Ho, S. E., Groves, D. I., and Bennett, J., eds., Gold deposits of the Archaean Yilgarn block, Western Australia: Nature, genesis and exploration guides, Geology Department (Key Centre) and University Extension, the University of Western Australia, Publication No. 20, p. 252-258.
Golding, S. D., Clark, M. E., Keele, R. A., Wilson, A. F., and Keays, R. R., 1990b, Geochemistry of Archaean epigenetic gold deposits in the Eastern Goldfields Province, Western Australia, in Herbert, H. K., and Ho, S. E., eds., Stable Isotopes and Fluid Processes in Mineralization, Geology Department and University Extension, the University of Western Australia, Publication No. 23, p. 141-176.
Golding, S. D., Groves, D. I., McNaughton, N. J., Barley, M. E., and Rock, N. M., 1987, Carbon isotopic composition of carbonates from contrasting alteration styles in supracrustal rocks of the Norseman-Wiluna belt, Yilgarn Block, Western Australia: Their significance to the source of archaean auriferous fluids, in Ho, S. E., and Groves, D. I., eds., Recent Advances in Understanding Precambrian Gold Deposits, The Geology Department and University Extension, The University of Western Australia, Publication No. 11, p. 215-238.
Golding, S. D., Groves, D. I., McNaughton, N. J., Mikucki, E., and Sang, J. H., 1990c, Sulfur isotope studies, in Ho, S. E., Groves, D. I., and Bennett, J., eds., Gold deposits of the Yilgarn Block, Western Australia: Nature, genesis and exploration guides, University of Western Australia, Geology Department and University Extension, v. 20p. 259-262.
Golding, S. D., and Wilson, A. F., 1987, Oxygen and hydrogen isotope relationships in Archaean gold deposits of the Eastern Goldfields Province, Western Australia: Constraints on the source of Archaean gold-bearing fluids, in Ho, S. E., and Groves, D. I., eds., Recent Advances in Understanding Precambrian Gold Deposits, The Geology Department and University Extension, The University of Western Australia, Publication No. 11, p. 203-213.
Goldstein, R. M., and Reynolds, T. J., 1994, Systematics of fluid inclusions in diagenetic minerals: SEPM Short Course 31, Society for Sedimentary Geology, 199 p.
Goleby, B. R., Blewett, R. S., Fomin, T., Fishwick, S., Reading, A. M., Henson, P. A., Kennett, B. L. N., Champion, D. C., Jones, L., Drummond, B. J., and Nicoll, M., 2006, An integrated multi-scale 3D seismic model of the Archaean Yilgarn Craton, Australia: Tectonophysics, v. 420, p. 75.
Goleby, B. R., Korsch, R. J., Fomin, T., Bell, B., Nicoll, M. G., Drummond, B. J., and Owen, A. J., 2002, Preliminary 3-D geological model of the Kalgoorlie region, Yilgarn Craton, Western Australia, based on deep seismic-reflection and potential-field data: Australian Journal of Earth Sciences, v. 49, p. 917-933.
Goleby, B. R., Korsch, R. J., Fomin, T., Owen, A. J., and Bell, B., 2000, The AGCRC's 1999 Yilgarn deep seismic survey, Australian Geological Survey Organisation, 2000/34, p. 52-64.
Goscombe, B., 2009, Metamorphic evolution and integrated terrane analysis of the eastern Yilgarn Craton; rationale, methods, outcomes and interpretation, Geoscience Australia Record 2009/23, 270 p.

REFERENCES
199
Goscombe, B., Blewett, R. S., K., C., Maas, R., and Groenewald, B. A., 2007, Broad thermo-barometric evolution of the Eastern Goldfields Superterrane, in Bierlein, F. P., and Knox-Robinson, C. M., eds., Proceedings of Geoconferences (WA) Inc. Kalgoorlie '07 Conference, Kalgoorlie '07; old ground, new knowledge, Geoscience Australia Record 2007/14, p. 33-38.
Graney, J. R., and Kesler, S. E., 1995, Gas composition of fluid in ore deposits: is there a relation to magmas?, in H, T. J. F., ed., Magmas, Fluids and Ore Deposits, Mineralogical Association of Canada Short Course Series 23., p. 221–245.
Gresham, J. J., 1991, Kambalda: history of a mining town: Melbourne, Western Mining Corporation Limited, 114 p.
Gresham, J. J., and Loftus-Hills, G. D., 1981, The geology of the Kambalda Nickel Field, Western Australia: Economic Geology, v. 76, p. 1373-1416.
Griffin, T. J., 1990, Geology of the granite-greenstone terrane of the Lake Lefroy and Cowan 1:100 000 sheets, Western Australia, Geological Survey of Western Australia, Report 32, p. 44.
Groves, D. I., 1990, Excursion no. 3: Eastern Goldfields mineral deposits. 1: Overview of gold mineralization in the Norseman-Wiluna belt, in Ho, S. E., Glover, J. E., and Muhling, J. R., eds., Third international Archaean symposium excursion guidebook, Geology Department and University Extension, University of Western Australia , Publication no. 21, p. 307-317.
Groves, D. I., 1993, The crustal continuum model for late-Archean lode-gold deposits of the Yilgarn Block, Western Australia: Mineralium Deposita, v. 28, p. 366-374.
Groves, D. I., Barley, M. E., Barnicoat, A. C., Cassidy, K., Fare, R. J., Hagemann, S. G., Ho, S. E., Hronsky, J. M. A., Mikucki, E., Mueller, A. G., McNaughton, N. J., Perring, C. S., Ridley, J. R., and Vearncombe, J. A., 1992, Sub-greenschist to granulite-hosted Archaean lode-gold deposits of the Yilgarn Craton: a depositional continuum from deep-sourced hydrothermal fluids in crustal-scale plumbing systems, in Glover, J. E., and Ho, S. E., eds., The Archean: Terrains, Processes and Metallogeny: Perth, Geology Department (Key Centre) and University Extension, University of Western Australia, Publication No. 22, p. 325-337.
Groves, D. I., Barley, M. E., and Ho, S. E., 1989, Nature, genesis and tectonic setting of mesothermal gold mineralisation in the Yilgarn Block, Western Australia, in Keays, R. R., Ramsay, W. R. H., and Groves, D. I., eds., The Geology of Gold Deposits: The Perspective in 1988. Economic Geology Monograph 6, p. 71-85.
Groves, D. I., and Foster, R. P., 1993, Archaean lode gold deposits, in Foster, R. P., ed., Gold Metallogeny and Exploration: Glasgow, Blackie and Son, p. 63-103
Groves, D. I., Goldfarb, R. J., Gebre-Mariam, M., Hagemann, S. G., and Robert, F.,
1998, Orogenic gold deposits: A proposed classification in the context of their crustal distribution and relationship to other gold deposit types: Ore Geology Reviews, v. 13, p. 7.
Groves, D. I., Goldfarb, R. J., Knox-Robinson, C. M., Ojala, J., Gardoll, S., Yun, G. Y., and Holyland, P., 2000, Late-kinematic timing of orogenic gold deposits and significance for computer-based exploration techniques with emphasis on the Yilgarn Block, Western Australia: Ore Geology Reviews, v. 17, p. 1.
Groves, D. I., Goldfarb, R. J., Robert, F., and Hart, C. J. R., 2003, Gold Deposits in Metamorphic Belts: Overview of Current Understanding, Outstanding Problems, Future Research, and Exploration Significance: Economic Geology, v. 98, p. 1-29.

REFERENCES
200
Groves, D. I., and Phillips, G. N., 1987, The genesis and tectonic controls on Archaean gold deposits of the Western Australian shield: A metamorphic-replacement model: Ore Geology Reviews, v. 2, p. 287-322.
Guha, J., and Kanwar, R., 1987, Vug brines - fluid inclusions: A key to understanding of secondary gold enrichment processes and the evolution of deep brines in the Canadian Shield, in Fritz, P., and Frape, S. K., eds., Saline water and gases in the crystalline rocks, Geological Association of Canada Special Paper v. 33, p. 95-101.
Guillemette, N., and Williams-Jones, A. E., 1993, Genesis of the Sb-W-Au deposits at Ixtahuacan, Guatemala: evidence from fluid inclusions and stable isotopes Mineralium Deposita, v. 28, p. 167-180.
Gunther, D., Audetat, A., Frischknecht, R., and Heinrich, C. A., 1998, Quantitative analysis of major, minor and trace elements in fluid inclusions using laser ablation-inductively coupled plasma-mass spectrometry (LA-ICP-MS): Journal of Analytical Atomic Spectroscopy, v. 13, p. 263-270.
Gunther, D., Frischknecht, R., Heinrich, C. A., and Kahlert, H.-J., 1997, Capabilities of an argon fluoride 193 nm Excimer laser for laser ablation inductively coupled plasma mass spectrometry microanalysis of geological materials: Journal of Analytical Atomic Spectroscopy, v. 12, p. 939-944.
Hagemann, S. E., and Cassidy, K., 2000, Archean orogenic lode gold deposits, in Hagemann, S. E., and Brown, P. E., eds., Gold in 2000, SEG Reviews v. 13, p. 9-68.
Hagemann, S. G., Bateman, R. J., Crowe, D., and Vielreicher, R. M., 1999, In situ sulfur isotope composition of pyrites from the Fimiston- and Oroya-style gold lodes in the Golden Mile Camp, Kalgoorlie; implications for sulfur source(s) and depositional processes: Geological Society of America Annual Conference Abstracts, v. 31, p. A-245.
Hagemann, S. G., and Cassidy, D. F., 2001, World-class gold camps and deposits in the Eastern Goldfields Province, Yilgarn Craton: diversity in host rocks, structural controls and mineralization styles, in Hagemann, S. G., Neumayr, P., and Witt, W. K., eds., World-class Gold Camps and Deposits in the Eastern Yilgarn Craton, Western Australia, with Special Emphasis on the Eastern Goldfields Province, p. 7-44.
Hagemann, S. G., Gebre-Mariam, M., and Groves, D. I., 1994, Surface-water influx in shallow-level Archaean lode gold deposits in Western Australia: Geology, v. 22, p. 1067-1070.
Hagemann, S. G., Groves, D. I., Ridley, J. R., and Vearncombe, J. A., 1993, The Archean lode gold deposits at Wiluna, Western Australia: High-level brittle-style mineralization in a strike-slip regime: Economic Geology, v. 87, p. 1022-1053.
Hagemann, S. G., and Lüders, V., 2003, P-T-X conditions of hydrothermal fluids and precipitation mechanism of stibnite-gold mineralization at the Wiluna lode-gold deposits, Western Australia: Conventional and infrared microthermometric constraints: Mineralium Deposita, v. 38, p. 936-952.
Hall, D. L., and Bodnar, R. J., 1990, Methane in fluid inclusions from granulites: A product from hydrogen diffusion?: Geochimica et Cosmochimica Acta, v. 54, p. 641-651.
Harbi, H., 1997, Origin of the stockwork mineralization at Kalgoorlie, Western Australia: Unpub. PhD thesis, University of Western Australia.
Haynes, F. M., 1988, Fluid inclusion evidence of basinal brines in Archean basement, Thunder Bay Pb-Zn-Ba district, Ontario, Canada: Canadian Journal of Earth Sciences, v. 25, p. 1884-1894.

REFERENCES
201
Haynes, F. M., and Kesler, S. E., 1987, Chemical evolution of brines during Mississippi Valley-type mineralization: Evidence from East Tennessee and Pine Point: Economic Geology, v. 82, p. 53-71.
Haynes, F. M., and Kesler, S. E., 1988, Compositions and sources of mineralizing fluids for chimney and manto limestone-replacement ores in Mexico: Economic Geology, v. 83, p. 1985-1992.
Hedenquist, J. W., and Henley, R. W., 1985, The importance of CO2 on freezing point measurements of fluid inclusions: evidence from active geothermal systems and implications for epithermal ore deposition: Economic Geology, v. 80, p. 1379-1406.
Heinrich, C. A., Henley, R. W., and Seward, T. M., 1989, Hydrothermal Systems: Adelaide, Australian Mineral Foundation, 74 p.
Ho, S. E., 1986, A fluid inclusion study of Archaean gold deposits of the Yilgarn Block, Western Australia: Unpub. PhD thesis, University of Western Australia, 90 p.
Ho, S. E., 1987, Fluid inclusions: Their potential as an exploration tool for Archaean gold deposits, in Ho, S. E., and Groves, D. I., eds., Recent advances in understanding Precambrian gold deposits, Publication no. 11, Geology Department and University Extension, University of Western Australia, p. 239-263.
Ho, S. E., Bennett, J., Cassidy, K., Hronsky, J. M. A., Mikucki, E., and Sang, J. H., 1990, Nature of ore fluid, and transportational and depositional conditions in sub-amphibolite facies deposits, in Ho, S. E., Groves, D. I., and Bennett, J., eds., University of Western Australia, Geology Department (Key Centre) and University Extension, Publication 20, p. 198-211.
Ho, S. E., Groves, D. I., McNaughton, N. J., and Mikucki, E. J., 1992, The source of ore fluids and solutes in Archaean lode-gold deposits of Western Australia: Journal of Volcanology and Geothermal Research, v. 50, p. 173-196.
Ho, S. E., McNaughton, N. J., and Groves, D. I., 1994, Criteria for determining initial lead isotopic compositions of pyrite in Archean lode-gold deposits: a case study at Victory, Kambalda, Western Australia: Chemical Geology, v. 111, p. 57-84.
Ho, S. E., McQueen, K. G., McNaughton, N. J., and Groves, D. I., 1995, Lead isotope systematics and pyrite trace element geochemistry of two granitoid-associated mesothermal gold deposits in the southeastern Lachlan fold belt: Economic Geology, v. 90, p. 1818-1830.
Hodge, J. L., 1997, Geochemistry of magnetite from volcanic rocks of the North Island, New Zealand: Unpub. MSc thesis, University of Auckland, 138 p.
Hodge, J. L., Hagemann, S. G., Neumayr, P., Davidson, G., and Banks, D., in revision, The New Celebration Gold Deposit: P-T-X-t Fluid Evolution and Two Stages of Gold Mineralization within the Crustal-scale Boulder-Lefroy Fault Zone, Yilgarn Craton, Western Australia.
Hodgson, C. J., 1993, Mesothermal lode-gold deposits, in Kirkham, R. V., Sinclair, W. D., Thorpe, R. I., and Duke, J. M., eds., Mineral Deposit Modeling, Special Paper 40, Geological Association of Canada, p. 635-678.
Hodgson, C. J., and Troop, D. G., 1988, A new computer aided methodology for area selection in gold exploration: A case study from the Abitibi greenstone belt: Economic Geology, v. 83, p. 952-977.
Hodkiewicz, P., 2003, The Interplay Between Physical and Chemical Processes in the Formation of World-Class Orogenic Gold Deposits in the Eastern Goldfields Province, Western Australia: Unpub. PhD thesis, University of Western Australia, 198 p.
Hodkiewicz, P., Groves, D. I., Davidson, G., Weinberg, R. F., and Hagemann, S. G., 2009, Influence of structural setting on sulphur isotopes in Archean orogenic

REFERENCES
202
gold deposits, Eastern Goldfields Province, Yilgarn, Western Australia: Mineralium Deposita, v. 44, p. 129-150.
Hoernes, S., and van Reenen, D. D., 1992, The oxygen isotopic composition of granulites and regressed granulites from theLimpopo bet as a monitor of fluid-rock interaction: Precambrian Research, v. 55, p. 353-364.
Hofstra, A. H., and Cline, J. S., 2000, Characteristics and models for Carlin-type gold deposits: SEG Reviews, v. 13, p. 163-220.
Honma, H., and Itihara, Y., 1981, Distribution of ammonium in minerals of metamorphic and granitic rocks: Geochimica et Cosmochimica Acta, v. 45, p. 983-988.
Huston, D. L., Power, M., Gemmell, J. B., and Large, R. R., 1995a, Design, calibration and geological application of the first operational Australian laser ablation sulphur isotope microprobe: Australian Journal of Earth Sciences, v. 42, p. 549-555.
Huston, D. L., Sie, S. H., Suter, G. F., Cooke, D. R., and Both, R. A., 1995b, Trace elements in sulfide minerals from eastern Australian volcanic-hosted massive sulfide deposits; Part I, Proton microprobe analyses of pyrite, chalcopyrite, and sphalerite, and Part II, Selenium levels in pyrite; comparison with delta 34 S values and implications for the source of sulfur in volcanogenic hydrothermal systems: Economic Geology, v. 90, p. 1167-1196.
Jacobs, G. K., and Kerrick, D. M., 1981, Methane: An equation of state with application to the ternary system H2O-CO2-CH4: Geochimica et Cosmochimica Acta, v. 45, p. 607-614.
Jensen, E., and Barton, M., 2000, Gold deposits related to alkaline magmatism: Reviews in Economic Geology, v. 13, p. 279-314.
Jia, Y., and Kerrich, R., 1999, Nitrogen isotope systematics of mesothermal lode gold deposits: Metamorphic, granitic, meteoric water, or mantle origin?: Geology, v. 27, p. 1051-1054.
Jia, Y., Kerrich, R., and Goldfarb, R., 2003, Metamorphic Origin of Ore-Forming Fluids for Orogenic Gold-Bearing Quartz Vein Systems in the North American Cordillera: Constraints from a Reconnaissance Study of {delta}15N, {delta}D, and {delta}18O: Economic Geology, v. 98, p. 109-123.
Jia, Y., Li, X. I. A., and Kerrich, R., 2001, Stable Isotope (O, H, S, C, and N) Systematics of Quartz Vein Systems in the Turbidite-Hosted Central and North Deborah Gold Deposits of the Bendigo Gold Field, Central Victoria, Australia: Constraints on the Origin of Ore-Forming Fluids: Economic Geology, v. 96, p. 705-721.
Kendrick, M. A., Burgess, R., Pattrick, R. A. D., and Turner, G., 2001, Fluid inclusion noble gas and halogen evidence on the origin of Cu-porphyry mineralising fluids: Geochimica et Cosmochimica Acta, v. 65, p. 2651-2668.
Kendrick, M. A., Duncan, R., and Phillips, D., 2006, Noble gas and halogen constraints on mineralizing fluids of metamorphic versus surficial origin: Mt Isa, Australia: Chemical Geology, v. 235, p. 325-351.
Kendrick, M. A., Walshe, J. L., Mark, G., Petersen, K. J., Baker, T., Phillips, D., Honda, M., Oliver, N. H. S., Fisher, L., Gillen, D., Williams, P. J., and Fu, B., 2008, Sources and reservoirs; noble gases as tools for constraining a mantle connection during orogenic-gold and IOCG mineralisation, in Korsch, R. J., and Barnicoat, A. C., eds., New perspectives; the foundations and future of Australian exploration; abstracts for the June 2008 pmd*CRC conference. Geoscience Australia Record 2008/09, p. 48-54.
Kent, A. J. R., Campbell, I. H., and McCulloch, M. T., 1995, Sm-Nd systematics of hydrothermal scheelite from the Mount Charlotte mine, Kalgoorlie, Western
REFERENCES
203
Australia: an isotopic link between gold mineralization and komatiites: Economic Geology, v. 90, p. 2329-2335.
Kent, A. J. R., and McDougall, I., 1995, 40Ar-39Ar and U-Pb age constraints on the timing of gold mineralization in the Kalgoorlie goldfields, Western Australia: Economic Geology, v. 90.
Kenworthy, S., and Hagemann, S. G., 2005, Decoupled lamprophyric magmatism and gold mineralization at the Archean Darlot lode gold deposit, Western Australia, in Mao, J., and Bierlein, F. P., eds., Mineral deposit research; meeting the global challenge: Proceedings of the Biennial SGA Society for Geology Applied to Mineral Deposits Meeting 8, v. 2, p. 987-990.
Kerrich, R., 1986, The stable isotope geochemistry of Au-Ag vein deposits in metamorphic rocks, in Kyser, T. K., ed., Short Course in Stable Isotope Geochemistry of Low Temperature Fluids, 13, Mineralogical Association of Canada, p. 287-336.
Kerrich, R., 1989, Geodynamic setting and hydraulic regimes: Shear zones and mesothrmal gold deposits, in Bursnall, J. T., ed., Mineralization and shear zones, Geological Association of Canada, Short Course Notes, 6, p. 89-128.
Kerrich, R., and Cassidy, K., 1994, Temporal relationships of lode gold mineralization to accretion, magmatism, metamorphism and deformation - Archean to present: A review: Ore Geology Reviews, v. 9, p. 263-310.
Kerrich, R., and Hodder, R. W., 1982, Archean lode gold and base metal deposits - chemical evidence for metal fractionation into independent hydrothermal reservoirs: Canadian Institute of Mining and Metallurgy Special Volume, v. 24, p. 144-160.
Kerrich, R., and King, R., 1993, Hydrothermal zircon and baddeleyite in Val d'Or Archean mesothermal gold deposits: Characteristics, compositions and fluid inclusion properties: Canadian Journal of Earth Sciences, v. 30, p. 2334-2351.
Kerrich, R., and Wyman, D., 1994, The mesothermal gold lamprophyre association: significance for an accretionary geodynamic setting, supercontinent cycles and metallogenic processes: Mineralogy and Petrology, v. 51, p. 147-172.
Kilinc, I. A., and Burnham, C. W., 1972, Partitioning of chloride between a silicate melt and coexisting aqueous phase from 2 to 8 kilobars: Economic Geology, v. 67, p. 231-235.
Kishida, A., and Kerrich, R., 1987, Hydrothermal alteration zoning and gold concentration at the Kerr-Addison Archean lode gold deposit, Kirkland Lake, Ontario: Economic geology and the bulletin of the Society of Economic Geologists, v. 82, p. 649-690.
Klemm, L. M., Pettke, T., Heinrich, C. A., and Campos, E., 2007, Hydrothermal Evolution of the El Teniente Deposit, Chile: Porphyry Cu-Mo Ore Deposition from Low-Salinity Magmatic Fluids: Economic Geology, v. 102, p. 1021-1045.
Knudsen, T.-L., and Andersen, T., 1999, Petrology and geochemistry of the Tromøy Gneiss Complex, South Norway, an alleged example of Proterozoic depleted lower continental crust: Journal of Petrology, v. 40, p. 909-933.
Kreuzer, O. P., 2005, Intrusion-Hosted Mineralization in the Charters Towers Goldfield, North Queensland: New Isotopic and Fluid Inclusion Constraints on the Timing and Origin of the Auriferous Veins: Economic Geology, v. 100, p. 1583-1603.
Lambert, I. B., Phillips, G. N., and Groves, D. I., 1984, Sulphur isotope compositions and genesis of Archaean gold mineralization, Australia and Zimbabwe, in Foster, R. P., ed., Gold '82: the Geology, Geochemistry and Genesis of Gold Deposits: Rotterdam, A.A. Balkema
p. 373-387.

REFERENCES
204
Landtwing, M. R., Heinrich, C. A., Halter, W. E., Pettke, T., Redmond, P. B., and Einaudi, M. T., 2002, Fluid evolution at the Bingham Cu-Au-Mo-Ag porphyry deposit: Geochimica et Cosmochimica Acta, v. 66, p. A430.
Langsford, N., 1989, Stratigraphy of Locations 48 and 50, Kalgoorlie Gold Workshop, p. 6.
Larcombe, C. O. G., 1912, The geology of Kalgoorlie: Australian Institute Mining Engineering, Transactions, v. 14, p. 1-327.
Large, R. R., Danyushevsky, L., Hollit, C., Maslennikov, V., Meffre, S., Gilbert, S., Bull, S., Scott, R., Emsbo, P., Thomas, H., Singh, B., and Foster, J., 2009, Gold and Trace Element Zonation in Pyrite Using a Laser Imaging Technique: Implications for the Timing of Gold in Orogenic and Carlin-Style Sediment-Hosted Deposits: Economic Geology, v. 104, p. 635-668.
Loftus-Hills, G., and Solomon, M., 1967, Cobalt, nickel and selenium as indicators of ore genesis: Mineralium Deposita, v. 2, p. 228-242.
Loucks, R. R., 2000, Precise geothermometry on fluid inclusion populations that trapped mixtures of immiscible fluids.: American Journal of Science, v. 300, p. 23-59.
Loucks, R. R., and Mavrogenes, J. A., 1999, Gold solubility in supercritical hydrothermal brines measured in synthetic fluid inclusions: Science, v. 284, p. 2159-2163.
. Lungan, A., 1986, The structural controls of the Oroya shoot: implications for the
structure of the Kalgorlie region, Western Australia: Unpub. BSc Honours thesis, University of Western Australia.
Mair, J. L., Goldfarb, R. J., Johnson, C. A., Hart, C. J. R., and Marsh, E. E., 2006, Geochemical constraints on the genesis of the Scheelite Dome intrusion-related gold deposit, Tombstone gold belt, Yukon, Canada: Economic Geology, v. 101, p. 523-553.
McCuaig, T. C., and Kerrich, R., 1998, P-T-t-deformation-fluid characteristics of lode gold deposits: evidence from alteration systematics: Ore Geology Reviews, v. 12, p. 381-453.
McNaughton, N. J., Cassidy, K., Groves, D. I., and Perring, C. S., 1990, Timing of mineralization, in Ho, S. E., Groves, D. I., and Bennett, J., eds., Gold Deposits of the Yilgarn Block Western Australia: Nature, Genesis and Exploration Guides: Perth, Department of Geology and University Extension, University of Western Australia Publication No. 20, p. 221-225.
McNaughton, N. J., Groves, D. I., and Witt, W. K., 1993, The source of lead in Archaean lode gold deposits of the Menzies-Kalgoorlie-Kambalda region, Yilgarn Block, Western Australia: Mineralium Deposita, v. 28, p. 495-502.
McNaughton, N. J., Mueller, A. G., and Groves, D. I., 2005, The Age of the Giant Golden Mile Deposit, Kalgoorlie, Western Australia: Ion-Microprobe Zircon and Monazite U-Pb Geochronology of a Synmineralization Lamprophyre Dike: Economic Geology, v. 100, p. 1427-1440.
Mernagh, T., 1996, Gold mineralisation at Mount Charlotte: evidence for fluid oxidation from fluid inclusions: Geological Society of Australia, abstracts, v. 41, p. 292.
Mernagh, T. P., and Bierlein, F. P., 2008, Transport and Precipitation of Gold in Phanerozoic Metamorphic Terranes from Chemical Modeling of Fluid-Rock Interaction: Economic Geology, v. 103, p. 1613-1640.
Mikucki, E., and Groves, D. I., 1990, Nature of ore fluid, and transportational and depositional conditions in sub-amphibolite facies deposits: Mineralogical constraints, in Ho, S. E., Groves, D. I., and Bennett, J., eds., Gold deposits of the

REFERENCES
205
Archean Yilgarn block, Western Australia: Nature, genesis and exploration guides: Perth, Geology Department (Key Centre) and University Extension, the University of Western Australia, Publication No. 20, p. 212-220.
Mikucki, E., and Heinrich, C. A., 1993, Vein- and mine-scale wall-rock alteration and gold mineralization in the Archaean Mount Charlotte Deposit, Kalgoorlie, Western Australia: Kalgoorlie '93 extended abstracts, Australian Geological Survey Organisation, Record 1993/54, p. 135-140.
Mikucki, E., and Ridley, J., 1993, The hydrothermal fluid of Archaean lode-gold deposits at different metamorphic grades: compositional constraints from ore and wallrock alteration assemblages: Mineralium Deposita, v. 28, p. 469.
Mikucki, E. J., 1998, Hydrothermal transport and depositional processes in Archean lode-gold systems: A review: Ore Geology Reviews, v. 13, p. 307.
Mikucki, E. J., 2000, Thermochemical models for ore-genesis and ore-fluid formation and evolution in the Golden Mile system: Part I. Role of fluid-rock reaction and pre-lode carbonation, AMIRA Project P511, p. 34
Mikucki, E. J., 2001, Thermochemical models for ore-genesis and ore-fluid evolution in Archean lode-gold systems: Follow-up on host-rock buffering of ore fluid oxidation states, AMIRA Project P511, p. 45.
Miller, J., Blewett, R., Tunjic, J., and Cassidy, K., 2009, The role of early formed structures on the development of the world-class St Ives gold camp, Yilgarn, WA: CET Quarterly News Letter, p. 1-7.
Moh, G. H., 1980, Ore syntheses, phase equilibria studies and applications: Neues Jahrbuch für Mineralogie. Abhandlungen, v. 139, p. 114-154.
Morey, A., 2007, Controls on gold endowment within the Bardoc Tectonic Zone, Eastern Goldfields Province, Western AustraliaAnthony: Unpub. PhD thesis, Monash University, 118 p.
Morey, A., Weinberg, R. F., and Bierlein, F., 2007, The structural controls of gold mineralization within the Bardoc Tectonic Zone, Eastern Goldfields Province, Western Australia: implications for gold endowments in shear systems: Mineralium Deposita, v. 42, p. 583-600.
Mueller, A. G., 2007, Copper-gold endoskarns and high-Mg monzodiorite-tonalite intrusions at Mt. Shea, Kalgoorlie, Australia: implications for the origins of gold-pyrite-tennantite mineralization in the Golden Mile: Mineralium Deposita, v. 42, p. 737-769.
Mueller, A. G., de Laeter, J. R., and Groves, D. I., 1991, Strontium Isotope Systematics of Hydrothermal Minerals from Epigenetic Archean Gold Deposits in the Yilgarn Block, Western Australia: Economic Geology, v. 86, p. 780-809.
Mueller, A. G., and Groves, D. I., 1991, The classification of Western Australian greenstone-hosted gold deposits accordeing to wallrock-alteration mineral assemblages: Ore Geology Reviews, v. 6, p. 291-331.
Mueller, A. G., Harris, L. B., and Lungan, A., 1988, Structural control of greenstone-hosted gold mineralization by transcurrent shearing: A new interpretation of the Kalgoorlie Mining District, Western Australia: Ore Geology Reviews, v. 3, p. 359-387.
Naden, J., and Shepherd, T. J., 1989, Role of methane and carbon dioxide in gold deposition: Nature, v. 342, p. 793-795.
Nelson, D. R., 1997, Evolution of the Archaean granite-greenstone terranes of the Eastern Goldfields, Western Australia: SHRIMP U-Pb zircon constraints: Precambrian Research, v. 83, p. 57-81.
Nesbitt, B. E., and Muehlenbachs, K., 1989, Geology, geochemistry and genesis of mesothermal lode gold deposits of the Canadian Cordillera: evidence for ore formation from evolved meteoric water. , in Keays, R. R., Ramsay, W. R. H.,

REFERENCES
206
and Groves, D. I., eds., The geology of gold deposits: The perspective in 1988, Economic Geology Monograph 6, p. 553-563.
Nesbitt, B. E., Murowchick, J. B., and Muehlenbachs, K., 1986, Dual origins of lode gold deposits in the Canadian Cordillera: Geology v. 14, p. 506-509.
Neumayr, P., and Hagemann, S. E., 2002, Hydrothermal fluid evolution within the Cadillac Tectonic Zone, Abitibi Greenstone Belt, Canada: Relationship to auriferous fluids in adjacent second- and third-order shear zones: Economic Geology, v. 97, p. 1203-1225.
Neumayr, P., Hagemann, S. E., Banks, D. A., Yardley, B. W. D., Couture, J. F., Landis, G. P., and Rye, R., 2007, Fluid Chemistry and Evolution of Hydrothermal Fluids in an Archaean Transcrustal Fault Zone Network: the Case of the Cadillac Tectonic Zone, Abitibi Greenstone Belt, Canada: Canadian Journal of Earth Sciences, v. 44, p. 745-773.
Neumayr, P., Hagemann, S. G., and Couture, J. F., 2000, Structural setting, textures, and timing of hydrothermal vein systems in the Val d'Or Camp, Abitibi, Canada; implications for the evolution of transcrustal, second- and third-order fault zones and gold mineralization: Canadian journal of earth sciences, v. 37, p. 95.
Neumayr, P., Petersen, K. J., Gauthier, L., Hodge, J. L., Hagemann, S. G., Walshe, J. L., Prendergast, K., Conners, K., Horn, L., Frikken, P., Roache, A., and Blewett, R., 2005, Mapping of hydrothermal alteration and geochemical gradients as a tool for conceptual targeting: St. Ives gold camp, Western Australia, in Mao J, B. F., ed., Mineral deposit research: meeting the global challenge. Proceedings of the Eighth Biennial SGA Meeting, Beijing: Heidelberg, Springer, p. 1479-1482.
Neumayr, P., Walshe, J. L., Connors, K., Cox, S. F., Morrison, R. S., and Stolz, E., 2004, Gold mineralization in the St Ives camp near Kambalda, in Neumayr, P., Harris, M., and Beresford, S. W., eds., Gold and nickel deposits in the Archaean Norseman-Wiluna greenstone belt, Yilgarn Craton, Western Australia - a field guide, Geological Survey of Western Australia, Record 2004/16, p. 23-45.
Neumayr, P., Walshe, J. L., Hagemann, S. G., Petersen, K. J., Roache, A., Frikken, P., Horn, L., and Halley, S., 2008, Oxidized and reduced mineral assemblages in greenstone belt rocks of the St. Ives gold camp, Western Australia: vectors to high-grade ore bodies in Archaean gold deposits? : Mineralium Deposita, v. 43, p. 363-371.
Nguyen, P. T., 1997, Structural controls on gold mineralization at the Revenge mine and its tectonic setting in the Lake Lefroy area, Kambalda, WA: Unpub. PhD thesis, University of Western Australia, 195 p.
Nguyen, P. T., Cox, S. F., Harris, L. B., and Powell, C. M., 1998, Fault-valve behaviour in optimally oriented shear zones: An example at the Revenge gold mine, Kambalda, Western Australia: Journal of Structural Geology, v. 20.
Nichols, S., 2003, Structural control, hydrothermal alteration and relative timing of gold mineralisation at the New Celebration gold deposits, Kalgoorlie, Western Australia: Unpub. BSc (Hons) thesis, University of Western Australia, 62 p.
Nichols, S. J., Hagemann, S. G., and Neumayr, P., in revision, Structural and hydrothermal alteration evidence for early and late stages of gold mineralisation at the New Celebration gold deposits in Western Australia.
Nichols, S. J., Hagemann, S. G., Neumayr, P., and Humphries, M., 2004, Structural control, hydrothermal alteration and relative timing of gold mineralisation at the Archaean New Celebration gold deposits, Kalgoorlie, Western Australia. , in McPhie, J., and McGoldrick, P., eds., Dynamic Earth; past, present and future. Abstracts - Geological Society of Australia, p. 105.

REFERENCES
207
Nickel, E. H., 1977, Mineralogy of the "green leader" gold ore at Kalgoorlie, Western Australia: Australasian Institute of Mining and Metallurgy, v. 263, p. 9-13.
Norris, N. D., 1990, New Celebration gold deposits, in Hughes, F. E., ed., Geology of the mineral deposits of Australia and Papua New Guinea, Melbourne, , Monograph 14, Australasian Institute of Mining and Metallurgy, p. 449-454.
Oberthuer, T., Mumm, A. S., Vetter, U., Simon, K., and Amanor, J. A., 1996, Gold mineralization in the Ashanti Belt of Ghana; genetic constraints of the stable isotope geochemistry: Economic Geology, v. 91, p. 289-301.
Ohmoto, H., 1986, Stable isotope geochemistry of ore deposits, in Valley, J. W., Taylor, H. P., and O'Neil, J. R., eds., Stable isotopes in high temperature geological processes, Mineralogical Society of America Reviews in Mineralogy v. 16
p. 491-560. Ohmoto, H., and Goldhaber, M. B., 1997, Sulfur and carbon isotopes, in Barnes, H. L.,
ed., Geochemistry of Hydrothermal Ore Deposits: New York, John Wiley and Sons, p. 517-612.
Ohmoto, H., and Rye, R., 1979, Isotopes of Sulphur and Carbon, in Barnes, H. L., ed., Geochemistry of Hydrothermal Ore Deposits: New York, Wiley, p. 509-567.
Ojala, J., 1995, Structural and depositional controls on gold mineralization at the Granny Smith Mine, Laverton, Western Australia: Unpub. PhD thesis, University of Western Australia, 184 p.
Ojala, J., Groves, D. I., and Ridley, J. R., 1995, Hydrogen isotope fractionation factors between hydrous minerals and ore fluids at low temperatures: evidence from the Granny Smith gold deposit, Western Australia: Mineralium Deposita, v. 30, p. 328-331.
Ojala, J., Ridley, J. R., Groves, D. I., and Hall, G. C., 1993, The Granny Smith gold deposit: the role of heterogeneous stress distribution at an irregular granitoid contact in a greenschist facies terrane: Mineralium Deposita, v. 28, p. 409-419.
Olivo, G. R., Chang, F., and Kyser, T. K., 2006, Formation of the auriferous and barren North Dipper veins in the Sigma mine, Val d'Or, Canada: Constraints from structural, mineralogical, fluid inclusion and isotopic data: Economic Geology, v. 101, p. 607-631.
Ozima, M., and Posodek, F. A., 2002, Noble Gas Geochemistry, Cambridge University Press, 300 p.
Palin, J. M., and Xu, Y., 2000, Gilt by Association? Origins of Pyritic Gold Ores in the Victory Mesothermal Gold Deposit, Western Australia: Economic Geology, v. 95, p. 1627-1634.
Pals, D., and Spry, P. G., 2003, Telluride mineralogy of the low-sulfidation epithermal Emperor gold deposit, Vatoukola, Fiji: Journal of Mineralogy and Petrology, v. 79, p. 285-307.
Partington, G. A., and Williams, P. J., 2000, Proterozoic lode gold and (iron)-copper-gold deposits: A comparison of Australian and global examples: Reviews in Economic Geology, v. 13, p. 69-101.
Passchier, C. W., 1994, Structural geology across a proposed terrane boundary in the eastern Yilgarn craton, Western Australia: Precambrian Research, v. 68, p. 43-64.
Passchier, C. W., and Trouw, R. A. J., 1996, Microtectonics, Springer. Petersen, K. J., Neumayr, P., Hagemann, S. G., and Walshe, J. L., 2005,
Paleohydrologic evolution of the St. Ives gold camp, in Mao, J., and Bierlein, F., eds., Mineral Deposit Research: Meeting the Global Challenge, Proceedings of the Eighth Biennial SGA Meeting, Beijing, China, 18-21 August 2005, p. 573-576.

REFERENCES
208
Petersen, K. J., Neumayr, P., Walshe, J. L., and Hagemann, S. G., 2006, Types of fluid compositions and evolution at the St Ives gold camp, in Anonymous, ed., Geochimica et Cosmochimica Acta, 70, p. A485.
Phillips, D., and Miller, J., 2006, 40Ar/39Ar dating of mica-bearing pyrite from thermally overprinted Archean gold deposits: Geology, v. 34, p. 397-400.
Phillips, G. N., 1986, Geology and alteration in the Golden Mile, Kalgoorlie: Economic Geology, v. 81, p. 779-808.
Phillips, G. N., and Groves, D. I., 1983, The nature of Archaean gold-bearing fluids as deduced from gold deposits of Western Australia: Geological Society of Australia Journal, v. 30, p. 25-39.
Phillips, G. N., Groves, D. I., Amaro, D., Hallbauer, D. K., and Fotios, M. G., 1988, Morphology and trace-element compositions of pyrites from Kalgoorlie gold deposits: sensitive indicators of syndeformational fluid regimes and depositional processes, in Ho, S. E., and Groves, D. I., eds., Advances in Understanding Precambrian Gold Deposits, Volume II: Perth, Geology Department and University Extension, the University of Western Australia, Publication 12, p. 217-226.
Phillips, G. N., Groves, D. I., and Brown, I. J., 1987, Source requirements for the Golden Mile, Kalgoorlie: Significance to the metamorphic replacement model for Archean gold deposits: Canadian Journal of Earth Sciences, v. 24, p. 1643-1651.
Phillips, G. N., Groves, D. I., and Kerrich, R., 1996, Factors in the formation of the giant Kalgoorlie gold deposit: Ore Geology Reviews, v. 10, p. 295.
Phillips, G. N., Groves, D. I., Neall, F. B., Donnelly, T. H., and Lambert, I. B., 1986, Anomalous sulfur isotope composition in the Golden Mile, Kalgoorlie: Economic Geology, v. 81, p. 2008-2015.
Pike, S., 1993, The chemistry of granite derived pegmatite fluids: Unpub. PhD thesis, University of Leeds, 244 p.
Pitcairn, I. K., Teagle, D. A. H., Craw, D., Olivo, G. R., Kerrich, R., and Brewer, T. S., 2006, Sources of Metals and Fluids in Orogenic Gold Deposits: Insights from the Otago and Alpine Schists, New Zealand: Economic Geology, v. 101, p. 1525-1546.
Polito, P. A., Bone, Y., Clarke, J. D. A., and Mernagh, T., 2001, Compositional zoning of fluid inclusions in the Archaean Junction gold deposit, Western Australia: a process of fluid-wall-rock interaction?: Australian Journal of Earth Sciences, v. 48, p. 833-855.
Powell, R., Will, T. M., and Phillips, G. N., 1991, Metamorphism in Archaean greenstone belts: Calculated fluid compositions for gold mineralization: Journal of Metamorphic Geology, v. 9, p. 141-150.
Pudack, C., Halter, W. E., Heinrich, C. A., and Pettke, T., 2009, Evolution of Magmatic Vapor to Gold-Rich Epithermal Liquid: The Porphyry to Epithermal Transition at Nevados de Famatina, Northwest Argentina: Economic Geology, v. 104, p. 449-477.
Qiu, Y., and McNaughton, N. J., 1999, Source of Pb in orogenic lode-gold mineralisation: Pb isotope constraints from deep crustal rocks from the southwestern Archaean Yilgarn Craton, Australia: Mineralium Deposita, v. 34, p. 366.
Quan, R. A., Cloke, P. L., and Kesler, S. E., 1987, Chemical analyses of halite trend inclusions from the Granisle porphyry copper deposit, British Columbia: Economic Geology, v. 82, p. 1912-1930.

REFERENCES
209
Ramboz, C., Pichavant, M., and Weisbrod, A., 1982, Fluid immiscibility in natural processes: Use and misuse of fluid inclusion data II. Interpretation of fluid inclusion data in terms of immiscibility: Chemical Geology, v. 37, p. 29-48.
Redmond, P. B., Einaudi, M. T., Inan, E. E., Landtwing, M. R., and Heinrich, C. A., 2004, Copper deposition by fluid cooling in intrusion-centered systems: New insights from the Bingham porphyry ore deposit, Utah: Geology, v. 32, p. 217-220.
Reed, M. H., 1998, Calculation of simultaneous chemical equilibria in aqueous-mineral-gas systems and its application to modeling hydrothermal processes, in Richards, J. P., and Larson, P. B., eds., Techniques in hydrothermal ore deposits geology, Reviews in Economic Geology v.10, p. 109-124.
Richards, J. P., and Kerrich, R., 1993, The Porgera gold mine, Papua New Guinea: Magmatic hydrothermal to epithermal evolution of an alkalic-type precious metal deposit: Economic Geology, v. 88, p. 1017-1052.
Ridley, J., and Mengler, F., 2000, Lithological and structural controls on the form and setting of vein stockwork orebodies at the Mount Charlotte gold deposit, Kalgoorlie: Economic Geology, v. 95, p. 85-98.
Ridley, J. R., and Diamond, L. W., 2000, Fluid chemistry of lode gold deposits, and implications for genetic models, in Hagemann, S. G., and Brown, P. E., eds., Gold in 2000, Reviews in Economic Geology, v. 13, p. 141-162.
Ridley, J. R., and Hagemann, S. G., 1996, Fluid inclusions in Archean high-temperature gold deposits; can we evaluate post-entrapment modification?, in Brown, P. E., and Hagemann, S. G., eds., PACROFI VI; Sixth biennial Pan-American conference on Research on fluid inclusions; program and abstracts, p. 104-106.
Robert, F., 1989, Internal structure of the Cadillac tectonic zone southeast of Val d'or, Abitibi greenstone belt, Quebec: Canadian Journal of Earth Sciences, v. 26, p. 2661-2675.
Robert, F., 1990, An overview of gold deposits in the eastern Abitibi subprovince: Canadian Institute of Mining and Metallurgy Special Volume, v. 43, p. 93-105.
Robert, F., and Kelly, W. C., 1987, Ore-forming fluids in Archean gold-bearing quartz veins at the Sigma Mine, Abitibi Greenstone Belt, Quebec, Canada: Economic Geology, v. 82, p. 1464-1482.
Robert, F., and Poulsen, K. H., 1997, World-class gold deposits in Canada: an overview: Australian Journal of Earth Sciences, v. 44, p. 329-351.
Robert, F., Poulsen, K. H., Cassidy, K., and Hodgson, C. J., 2005, Gold metallogeny of the Superior and Yilgarn cratons: economic Geology 100th Anniversary Volume, p. 1001-1033.
Roberts, R. G., 1988, Archean lode gold deposits, in Roberts, R. G., and Sheahan, P. A., eds., Ore Deposit Models, Reprint Series 3, Geoscience Canada, p. 1-19.
Robinson, B. W., and Kusakabe, M., 1975, Quantitative preparation of sulfur dioxide for 34S/32S analyses from sulfides by combustion with cuprous oxide: Analytical Chemistry, v. 47, p. 1179-1181.
Rock, N. M., 1990, Lamprophyres: Glascow, Blackies, 285 p. Rock, N. M., and Groves, D. I., 1988a, Can lamprophyres resolve the genetic
controversy over mesothermal gold deposits: Geology, v. 16, p. 538-541. Rock, N. M., and Groves, D. I., 1988b, Do lamprophyres carry gold as well as
diamonds?: Nature, v. 253, p. 253-255. Rock, N. M., Groves, D. I., Perring, C. S., and Golding, S. D., 1989, Gold,
lamprophyres and porphyries: what does their association mean?, in Keays, R. R., Ramsay, W. R. H., and Groves, D. I., eds., The Geology of Gold Deposits: The Perspective in 1988. Economic Geology Monograph 6, p. 609-625.
REFERENCES
210
Roedder, E., 1971, Fluid inclusion studies on the porphyry-type ore deposits at Bingham, Utah, Butte, Montana, and Climax, Colorado: Economic Geology, v. 66, p. 98-120.
Roedder, E., 1972, Compositions of fluid inclusions: US Geological Survey Professional Paper 440-JJ p. 1-64.
Roedder, E., 1979, Fluid inclusions as samples of ore fluids, in Barnes, H. L., ed., Geochemistry of Hydrothermal Ore Deposits, 2nd Edition: New York, Wiley, p. 684-737.
Roedder, E., 1984, Fluid Inclusions, Mineralogical Society of America, 644 p. Rosler, H. J., and Lange, H., 1972, Geochemical Tables: Amsterdam, Elsevier, 468 p. Rusk, B. G., Reed, M. H., Dilles, J. H., Klemm, L. M., and Heinrich, C. A., 2004,
Compositions of magmatic hydrothermal fluids determined by LA-ICP-MS of fluid inclusions from the porphyry copper-molybdenum deposit at Butte, MT: Chemical Geology, v. 210, p. 173-199.
Scantlebury, G. M., 1983, The characterization and origin of the gold lodes in and around the Brownhill syncline, Golden Mile, Kalgoorlie, Western Australia: Unpub. BSc (Honours) thesis, University of Western Australia, 90 p.
Schiller, J. C., and Ivey, M. E., 1990, Hannan South gold deposit, in Hughes, F. E., ed., Geology of the Mineral Deposits of Australia and Papua New Guinea, The Australasian Institute of Mining and Metallurgy, Melbourne, p. 443-447.
Seccombe, P. K., Groves, D. I., Marston, R. J., and Barrett, F. M., 1981, Sulfide paragenesis and sulfur mobility in Fe-Ni-Cu sulfide ores at Lunnon and Juan Main Shoots, Kambalda: Textural and sulfur isotopic evidence: Economic Geology, v. 76, p. 1675-1685.
Seward, T. M., 1973, Thio complexes of gold and the transport of gold in hydrothermal ore solutions: Geochimica et Cosmochimica Acta, v. 37, p. 379.
Seward, T. M., 1984, The transport and deposition of gold in hydrothermal systems, in Foster, R. P., ed., Gold '82: The Geology, Geochemistry and Genesis of Gold Deposits: Rotterdam, A.A. Balkema, p. 165-182.
Shackleton, J. M., Spry, P. G., and Bateman, R. J., 2003, Telluride mineralogy of the Golden Mile deposit, Kalgoorlie, Western Australia: Canadian Mineralogist, v. 41, p. 1503-1524.
Shepherd, T. J., Rankin, A. H., and Alderton, D. H. M., 1985, A practical guide to fluid inclusion studies: Glasgow, Blackie, 239 p.
Sibson, R. H., 2001, Seismogenic framework for hydrothermal transport and ore deposition, in Richards, J. P., and Tosdal, R. M., eds., Structural Controls on Ore Genesis, SEG Reviews, v. 14, p. 25-50.
Sibson, R. H., 2004, Controls on maximum fluid overpressure defining conditions for mesozonal mineralisation: Journal of Structural Geology, v. 26, p. 1127-1136.
Sibson, R. H., Robert, F., and Poulsen, K. H., 1988, High angle reverse faults, fluid-pressure cycling, and mesothermal gold-quartz deposits: Geology v. 16, p. 551-555.
Simmons, S. F., Sawkins, F. J., and Schlutter, D. J., 1987, Mantle derived helium in two Peruvian hydrothermal ore deposits: Nature, v. 329, p. 429-432.
Smith, J. R., Spooner, E. T. C., Broughton, D. W., and Ploeger, F. R., 1993, Archean Au-Ag-(W) Quartz Vein/Disseminated mineralisation within the Larder Lake - Cadillac Break, Kerr Addison - Chesterville System, North East Ontario, Canada, Ontario Geoscience Research Grant Program, Grant No. 364; Ontario Geological Survey, Open File Report 5831, p. 310.
Sorby, H. C., 1858, On the microscopical structure of crystals indication the origin of rocks and minerals: Quarterly Journal of the Geological Society of London, v. 14, p. 453-500.

REFERENCES
211
Stolz, E., Urosevic, M., and Connors, K., 2004, Reflection seismic surveys at St Ives Gold Mine, WA, in Australian Society of Exploration Geophysicists, P., Western Australia, Australia, Petroleum Exploration Society of Australia, Sydney, N.S.W., Australia ed., Integrated exploration in a changing world; 17th ASEG-PESA geophysical conference and exhibition; extended abstracts.
Stuwe, K., Will, T. M., and Zhou, S., 1993, On the timing relationship between fluid production and metamorphism in metamorphic piles: some implications for the origin of post-metamorphic gold mineralization: Earth and Planetary Science Letters, v. 114, p. 417-430.
Swager, C., 1989, Structure of Kalgoorlie greenstones - regional deformation history and implications for the structural setting of the Golden Mile gold deposits, Geological Society of Western Australia Report 25, p. 59-84.
Swager, C., 1997, Tectono-stratigraphy of late Archaean greenstone terranes in the southern Eastern Goldfields, Western Australia: Precambrian Research, v. 83, p. 11-42.
Swager, C., and Griffin, T. J., 1990, Geology of the Archaean Kalgoorlie Terrane (northern and southern sheets), Western Australian Geological Survey, 1:250,000 Geological Map.
Swager, C., Griffin, T. J., Witt, W. K., Wyche, S., Ahmat, A. L., Hunter, W. M., and McGoldrick, P. J., 1995, Geology of the Archean Kalgoorlie Terrane - an explanatory note, 26 p.
Swager, C., and Nelson, D. R., 1997, Extensional emplacement of a high-grade granite gneiss complex into low-grade greenstones, Eastern Goldfields, Yilgarn Craton, Western Australia: Precambrian Research, v. 83, p. 203-219.
Swager, C. P., Goleby, B. R., Drummond, B. J., Rattenbury, M. S., and Williams, P. R., 1997, Crustal structure of granite-greenstone terranes in the Eastern Goldfields, Yilgarn Craton, as revealed by seismic reflection profiling: Precambrian Research, v. 83, p. 43.
Swager, C. P., Witt, W. K., Griffin, T. J., Ahmat, A. L., Hunter, W. M., McGoldrick, P. J., and Wyche, S., 1992, Late Archaean granite-greenstones of the Kalgoorlie Terrane, Yilgarn Craton, Western Australia, in Glover, J. E., and Ho, S. E., eds., The Archaean: Terrains, processes and Metallogeny, Geology Department (Key Centre) and University Extension, the University of Western Australia, Publication No. 22, p. 107-122.
Swanenberg, H. E. C., 1979, Phase equilibria in carbonic systems, and their application to freezing studies of fluid inclusions: Contributions to Mineralogy and Petrology, v. 68, p. 303-306.
Szumigala, D. J., Dodd, S. L., and Arribas, A. P., 2000, Geology and gold mineralization at the Donlin Creek prospects, southwest Alaska, in Pinney, D. S., ed., Short Notes on Alaskan Geology, Alaska Division of Geological and Geophysical Surveys Professional Report, p. 104-122.
Takenouchi, S., and Kennedy, G. C., 1965, The solubility of carbon dioxide in NaCl solutions at high temperatures and pressures: American Journal of Science, v. 263, p. 445-454.
Taylor, B. E., Robert, F., Ball, M., and Leitch, C. H. B., 1991, Mesozoic "Mother Lode Type" gold deposits in North America: Primary vs. secondary (meteoric) fluids (abs): Geological Society of America Abstracts with Programs, v. 23(6), p. 174.
Taylor, H. P., Kesler, S. E., Cloke, P. L., and Kelly, W. C., 1983, Fluid inclusion evidence for fluid mixing, Mascot-Jefferson City zinc district, Tennessee: Economic Geology, v. 78, p. 1425-1439.
Taylor, S. R., 1964, Chondritic earth model: Nature, v. 202, p. 281-282.

REFERENCES
212
Thébaud, N., Philippot, P., Rey, P., and Cauzid, J., 2006, Composition and origin of fluids associated with lode gold deposits in a Mesoarchean greenstone belt (Warrawoona Syncline, Pilbara Craton, Western Australia) using synchrotron radiation X-ray fluorescence: Contributions to Mineralogy and Petrology, v. 152, p. 485-503
Thiery, R., van den Kerkhof, A. M., and Dubessy, J., 1994, vX properties modeling of CH4-CO2 and CO2-N2 fluid inclusions (T<31°C, P<400 bar): European Journal of Mineralogy, v. 6, p. 753-771.
Thode, H. G., Ding, T., and Crockett, J. H., 1991, Sulphur-isotope and elemental geochemistry studies of the Hemlo gold mineralization, Ontario: sources of sulphur and implications for the mineralization process: Canadian Journal of Earth Sciences, v. 28, p. 13-25.
Thompson, J. F. H., and Newberry, R. J., 2000, Gold deposits related to reduced granitic intrusions: SEG Reviews, v. 13, p. 377-400.
Thompson, J. F. H., Sillitoe, R. H., Baker, T., Lang, J. R., and Mortensen, J. K., 1999, Intrusion-related gold deposits associated with tungsten-tin provinces: Mineralium deposita, v. 34, p. 323.
Thompson, T. B., 1998, Cripple Creek, a world-class gold-bearing diatreme-alkalic complex, Colorado, USA: Geological Society of America Abstracts with Programs, v. 30, p. 301.
Townsend, D. B., Mai, G., and Morgan, W. R., 2000, Mines and mineral deposits of Western Australia: digital extract from MINEDEX - an explanatory note, Geological Survey of Western Australia, Record 2000/13, p. 28.
Uemoto, T., Ridley, J., Mikucki, E., Groves, D. I., and Kusakabe, M., 2002, Fluid Chemical Evolution as a Factor in Controlling the Distribution of Gold at the Archean Golden Crown Lode Gold Deposit, Murchison Province, Western Australia: Economic Geology, v. 97, p. 1227-1248.
Ulrich, T., and Gunther, D., 2002, The Evolution of a Porphyry Cu-Au Deposit, Based on LA-ICP-MS Analysis of Fluid Inclusions: Bajo de la Alumbrera, Argentina: Economic Geology, v. 97, p. 1889-1920.
Ulrich, T., Gunther, D., and Heinrich, C. A., 1999, Gold concentrations of magmatic brines and the metal budget of porphyry copper deposits: Nature, v. 399, p. 676.
Walshe, J. L., Neumayr, P., and Petersen, K. J., 2006, Scale-integrated, architectural and geodynamic controls on alteration and geochemistry of gold systems in the Eastern Goldfields Province, Yilgarn Craton, Final Report 256, Minerals and Energy Research Institute of Western Australia, p. 289.
Watchorn, R. B., 1998, Kambalda-St Ives gold deposits, in Berkman, D. A., and McKenzie, D. H., eds., Geology of Australia and Papua New Guinea mineral deposits, Monograph Series, 22, Australasian Institute of Mining and Metallurgy, p. 243-254.
Weinberg, R. F., Moresi, L., and van der Borgh, P., 2003, Timing of deformation in the Norseman-Wiluna Belt, Yilgarn Craton, Western Australia: Precambrian Research, v. 120, p. 219-239.
Weinberg, R. F., Van der Borgh, P., Bateman, R. J., and Groves, D. I., 2005, Kinematic History of the Boulder-Lefroy Shear Zone System and Controls on Associated Gold Mineralization, Yilgarn Craton, Western Australia: Economic Geology, v. 100, p. 1407-1426.
Whitney, J. A., Hemley, J. J., and Simon, F. O., 1985, Fluid inclusion geochemistry of the Granisle and Bell porphyry copper deposits, British Columbia: Economic Geology, v. 75, p. 45-61.
Wilkinson, J. J., 2001, Fluid inclusions in hydrothermal ore deposits: Lithos, v. 55, p. 229-272.
REFERENCES
213
Wilkinson, L., Cruden, A. R., and Krogh, T. E., 1999, Timing and kinematics of post-Timiskaming deformation within the Larder Lake-Cadillac deformation zone, southwest Abitibi greenstone belt, Ontario, Canada: Canadian Journal of Earth Sciences, v. 36, p. 627-647.
Williams-Jones, A. E., and Heinrich, C. A., 2005, 100th Anniversary Special Paper: Vapor Transport of Metals and the Formation of Magmatic-Hydrothermal Ore Deposits: Economic Geology, v. 100, p. 1287-1312.
Williams, H., 1994, The lithological setting and controls on gold mineralization in the Southern Ore Zone of the Hampton-Boulder gold deposit, New Celebration Gold Mine, Western Australia: Unpub. BSc (Hons) thesis, University of Western Australia.
Williams, P. R., and Currie, K. L., 1993, Character and regional implication of the sheared Archaean granite-greenstone contact near Leonora, Western Australia: Precambrian Research, v. 62, p. 343-365.
Williams, T., 1991, A structural and lithological investigation of the Jubilee gold mine with particular attention to fault structures: Unpub. BSc (Hons) thesis, Western Australian School of Mines.
Wilson, J. W. J., Kesler, S. E., Cloke, P. L., and Kelly, W. C., 1980, Fluid inclusion geochemistry of the Granisle and Bell porphyry copper deposits, British Columbia: Economic Geology, v. 75, p. 45-61.
Witt, W. K., 1991, Regional metamorphic controls on alteration associated with gold mineralization in the Eastern Goldfields province, Western Australia: Implications for the timing and origin of Archean lode-gold deposits: Geology, v. 19, p. 982-985.
Witt, W. K., 1993a, Gold deposits of the Kalgoorlie-Kambalda-St Ives area, Western Australia: Part 3 of a systematic study of the gold mines of the Menzies-Kambalda region, Geological Survey of Western Australia Record 1992/15, 108 p.
Witt, W. K., 1993b, Lithological and structural controls on gold mineralization in the Archaean Menzies-Kambalda area, Western Australia: Australian Journal of Earth Sciences, v. 40, p. 65-86.
Witt, W. K., and Swager, C., 1989, Structural setting and geochemistry of Archaean I-type granites in the Bardoc-Coolgardie area of the Norseman Wiluna belt, Western Australia: Precambrian Research, v. 44, p. 323-351.
Witt, W. K., and Vanderhor, F., 1998, Diversity within a unified model for Archaean gold mineralization in the Yilgarn Craton of Western Australia: An overview of the late-orogenic, structurally-controlled gold deposits: Ore Geology Reviews, v. 13, p. 29-64.
Wood, P. C., Burrows, D. R., Thomas, A. V., and Spooner, E. T. C., 1986, The Hollinger-McIntyre Au-quartz vein system, Timmins, Ontario, Canada; geologic characteristics, fluid properties and light stable isotope geochemistry, in Macdonald, A. J., ed., Gold '86, an International Symposium on the Geology of Gold Deposits: Toronto, p. 56-80.
Wood, S. A., and Samson, I. M., 1998, Solubility of ore minerals and complexation of ore metals in hydrothermal solutions, in Richards, J. P., and Larson, P. B., eds., Techniques in hydrothermal ore deposits geology, Reviews in Economic Geology v. 10, p. 33-80.
Woodall, R. W., 1965, Structure of the Kalgoorlie goldfield, in McAndrew, J., ed., Geology of Australian ore deposits. Second Edition: Melbourne, Eightth Emporial Mining and Metallurgical Congress, p. 71-79.

REFERENCES
214
Wopenka, B., and Pasteris, J. D., 1987, Raman intensities and detection limits of geochemically relevant gas mixtures for a laser Raman microprobe: Analytical Chemistry, v. 59, p. 2165-2170.
Yardley, B. W. D., 2005, Metal concentrations in crustal fluids and their relationship to ore formation: Economic Geology, v. 100, p. 613-632.
Yardley, B. W. D., Banks, D. A., Bottrell, S. H., and Diamond, L. W., 1993, Postmetamorphic gold-quartz veins from N.W. Italy: The composition and origin of the ore fluid: Mineralogical Magazine, v. 57, p. 407-422.
Yeats, C. J., Kohler, E. A., McNaughton, N. J., and Tkatchyk, L. J., 2001, SHRIMP U-Pb geochronological constraints on Archean volcanic-hosted massive sulfide and lode gold mineralization at Mount Gibson, Yilgarn craton, Western Australia: Economic Geology, v. 91, p. 1354-1371.
Zhang, X., and Spry, P. G., 1994, Petrological, mineralogical, fluid inclusion and stable isotope studies of the Gies gold-silver-telluride deposit, Judith Mountains, Montana: Economic Geology, v. 89, p. 602-627.

APPENDICES
215
APPENDIX 1: “The New Celebration Gold Deposits: P-T-X Fluid
Evolution and Two Stages of Gold Mineralization within the Crustal-scale Boulder-Lefroy Shear Zone, Yilgarn
Craton, Western Australia”
1
The New Celebration Gold Deposits: P-T-X Fluid Evolution and Two Stages of Gold Mineralization within the Crustal-scale Boulder-Lefroy Shear Zone, Yilgarn Craton, Western Australia Joanna L. Hodge1*, Steffen G. Hagemann1, Peter Neumayr1, Garry Davidson2 and David Banks3
1Centre for Exploration Targeting School of Earth and Environment University of Western Australia 35 Stirling Highway Crawley, WA 6009 AUSTRALIA 2CODES/Department of Earth Sciences University of Tasmania Private Bag 79 Hobart, TAS 7001, Australia 3School of Earth and Environment University of Leeds Leeds, LS2 9JT United Kingdom Corresponding author: e-mail [email protected] * Present address: Copper Ridge Explorations Incorporated 500-625 Howe Street, Vancouver, BC V6C 2T6, Canada

2
Abstract
The western segment of the first-order, crustal scale Boulder-Lefroy fault zone hosts the
Archean New Celebration orogenic lode gold deposits. This setting contrasts with the majority of
orogenic lode gold deposits worldwide, which are typically located in higher order splays. Gold
mineralization took place in two stages at New Celebration: Stage I, which is related to ductile, sinistral
oblique slip fault movement and Stage II, which is related to brittle-ductile and brittle strike-slip fault
movement.
Quartz and quartz-calcite shear and extension veins concomitant with Stage I gold
mineralization contain primary and pseudo-secondary 2- and 3-phase aqueous-carbonic inclusions with
salinities between 2 and 8 wt percent (NaCl equiv), which homogenized to liquid or decrepitated via
expansion of the vapor phase between 226°C and 350°C. Pressure-temperature estimates indicate that
these inclusions were trapped between 300 and 500°C and 2.5 and 4.2 kilobars. Mixed aqueous-
carbonic inclusions with variable phase ratios and salinities of 1.8 to 7.7 weight percent (NaCl
equivalent) trapped in quartz-sericite-pyrite and quartz-calcite-pyrite veins associated with Stage II
gold mineralization typically homogenized or decrepitated between 250 and 300°C. Co-existing
aqueous>>carbonic inclusions with apparent maximum salinities between 0.8 and 9.3 weight percent
(NaCl equivalent) homogenized or decrepitated to liquid between 140 and 267°C. Pressure-temperature
estimates indicate that the Stage II gold-related fluids were trapped between 280 and 360°C and 1.5 to
3.5 kilobars, lower than the formation conditions of Stage I gold. Highly variable phase ratios, variable
bulk compositions and molar volumes of inclusions within the same trail or cluster and total
homogenization into liquid or vapor at the same temperature indicate that entrapment occurred during
phase separation. Secondary high-salinity (18.4 to 23.3 weight percent NaCl equivalent) aqueous
inclusions, trapped in both the Stage I and Stage II-related veins, invariably homogenized to liquid
below 100°C and along with secondary methane inclusions, were trapped between 80 and 250°C and
pressures around 1 kilobar.
Single inclusion laser ablation inductively coupled plasma mass spectrometry (LA-ICP-MS)

3
analyses on aqueous and aqueous-carbonic inclusions indicate that the Stage I gold related fluids were
Ca dominant and contained lower concentrations of K, Mg, Cu, Pb, Zn, As, Sn and W than Stage II
fluids, which were Mg-K dominant. The K/Ca ratios vary by an order of magnitude between the two
mineralizing stages. This potentially indicates different K-Ca fluid sources for each mineralizing event
and suggests that a switch occurred in fluid and/or metal sources between Stage I and Stage II, possibly
from a metamorphic to a magmatic source.
Sulfur δ34S isotope ratios in ore-stage pyrite range between -7.6 per mil and +3.8 per mil from
Stage I mineralization, and between -10.6 per mil and -3.2 per mil from Stage II mineralization. These
values are predominantly within the documented range for orogenic lode gold deposits worldwide,
although the lightest values are amongst the most depleted values reported. In situ oxidation of the ore
fluid is discounted for Stage I mineralization therefore the isotopic composition of the ore stage pyrites
reflects the redox state of the ore-forming fluids. The depleted values of Stage II ore-related pyrite and
the spread of observed values is attributed to fluid oxidation during phase separation.
Pressure-temperature estimates describe an anticlockwise path and indicate that Stage I gold
mineralization occurred at temperatures and pressures similar to peak regional metamorphism, whereas
Stage II gold formed at lower temperatures and fluctuating pressures, likely during a period of uplift,
erosion and fault movement. Pyrite-magnetite and pyrite-gold petrography suggest that sulfidation
reactions with Fe-oxides were the main cause of gold mineralization in both mineralizing stages and
the sole cause of gold mineralization during Stage I. Fluid inclusion evidence suggests that phase
separation contributed to Stage II gold formation. The variety of fluids recorded within the BLFZ and
their diverse formation conditions suggest that the BLFZ was the main conduit for gold-related and
unrelated fluids in the region over a protracted period. Further, it appears that during the evolution of
the BLFZ it tapped at least two geochemically distinct crustal fluid reservoirs, which led to the
development of two gold mineralization stages at New Celebration with differing geochemical
characteristics.

4
Introduction The Boulder-Lefroy fault zone (BLFZ) is an interpreted crustal-scale fault zone (e.g. Swager,
1989) located on the eastern margin of the Kalgoorlie Terrane (Fig. 1) in the Eastern Goldfields
Province of the Yilgarn craton, Western Australia. The BLFZ hosts the New Celebration gold deposits,
and is spatially correlated with the world-class Golden Mile and St Ives gold camps, both of which are
hosted in adjacent second- and third-order splays. Archean orogenic lode-gold camps world wide
typically show a close spatial correlation with first-order crustal scale fault zones (Eisenlohr et al.,
1989; Neumayr et al., 2000). In detail, however, higher-order splays host the majority of world class
(>100t Au) gold deposits (Eisenlohr et al., 1989; Groves et al., 1990). Much research into the P-T-X
evolution of the gold-endowed second- and third-order systems has been undertaken; however, only
sparse research is available on first-order structures. This is partly because most first-order systems are
barren and research has focused on the adjacent gold mineralized higher-order systems, but is also due
to the poor exposure of crustal scale structures worldwide. Recent work on first-order systems has
focused on the structure (Robert, 1989; Wilkinson et al., 1999), timing of mineralization (Robert, 1990;
Neumayr et al., 2000), hydrothermal fluid evolution (Neumayr and Hagemann, 2002) and tectonic
evolution (Neumayr et al., 2007) of the Cadillac Tectonic Zone in the Abitibi greenstone belt but there
has been very little research on similar structures in the Yilgarn craton.
The New Celebration gold deposits comprise six open pits (Hampton-Boulder, Jubilee,
Mutooroo, Celebration, Golden Hope and Early Bird) and the Hampton Decline underground operation
comprising four ore zones (Southern, Central, Northern and B40). Collectively the deposits produced
approximately 1.5 million ounces of gold between 1987 and 1997, with the majority of the gold coming
from the Hampton-Boulder (7.4Mt @ 2.34 g/t Au for 560,000 oz) and Jubilee (10.3Mt @ 2.09 g/t Au
for 1,325,000 oz) open pit deposits. These two deposits, which now comprise a single resource under
the ownership of Dioro Exploration NL are the focus of this study.
Previous workers at New Celebration have focused on the structural (Dielemans, 2000) and
lithological controls (Williams, 1994) of the Southern Ore Zone, whereas more recently Nichols
5
(2003), Nichols et al. (2004) and Nichols et al. (in revision) evaluated the structural controls,
hydrothermal alteration and timing of gold mineralization of the New Celebration gold deposits.
Weinberg et al. (2005), evaluated the kinematic history of the BLFZ, whereas Hodkiewicz (2003)
evaluated the sulfur isotopic composition of ore-related sulfides from a number of Yilgarn deposits,
including those at New Celebration, as part of a more regional Yilgarn-scale study.
Orogenic gold deposits hosted in first-order fault systems are rare, therefore, the New
Celebration gold deposits provides a unique opportunity to study the fluid pressure-temperature-
composition (P-T-X) evolution, evaluate the role regional scale structures play in focusing mineralizing
and non-mineralizing fluids and potentially determine the source, or sources of fault zone fluids. This
paper builds on the structural and hydrothermal alteration assessments of Nichols (2003), Nichols et al.
(2004) and Nichols et al. (in revision) and presents the results of detailed petrographic, fluid inclusion,
stable isotope and LA-ICP-MS studies into the nature, composition, timing and source of fault zone
fluids in the BLFZ at the New Celebration deposits.
Geology of the Kalgoorlie Terrane The Kalgoorlie Terrane (Fig. 1) is a 6-9 kilometer thick, elongate, NNW trending volcano-
sedimentary sequence which is bounded to the east and west by wide (up to 1km) anastamosing shear
zones (Swager, 1997). The volcano-sedimentary greenstone belt sequence comprises basalt, komatiite
and felsic volcanic and volcaniclastic rocks, as well as a number of different granitoid suites. Coarse
clastic basin sequences, which unconformably overlie the greenstone belt sequence and commonly
bury major boundary faults are the youngest rocks (Swager, 1997). Regionally the terrane is
metamorphosed to upper greenschist facies, with locally higher metamorphic grades (up to amphibolite
facies) recorded along the margins of, and adjacent to granitoid plutons (Witt, 1991). Swager and
Nelson (1997) recognized four main compressive deformation episodes (D1-D4) in the Kalgoorlie
Terrane, each preceded by extensional periods. The volcano-sedimentary sequence was deposited
during the earliest extensional phase (Williams and Currie, 1993; Passchier, 1994) and was followed by
D1, a period of south over north compression, which occurred > 2675 Ma and resulted in widespread

6
structural repetition and thrust faulting (Swager and Nelson, 1997). A second extensional phase
followed in which the coarse clastic sequences were deposited and widespread granitoid intrusion took
place (Weinberg et al., 2003). Regional D2 shortening at around 2675-2657 Ma (Nelson, 1997) was
approximately E-W and resulted in NNW-SSE trending upright folds and penetrative foliation
(Swager, 1989; Swager and Griffin, 1990; Weinberg et al., 2003). During D3 (2663-2645 Ma) and D4
(<2640 Ma) (Nelson, 1997; Swager, 1997), deformation became strike-slip in nature and progressed
from a ductile to a brittle regime (Mueller et al., 1988; Bateman et al., 2001)..
At New Celebration, the BLFZ occupies the hinge of the Celebration Anticline and has a
complicated history with a number of different interpretations regarding its movement sense. Swager
(1989) described it as a major oblique sinistral wrench structure, whereas several other authors inferred
reverse movement based on seismic data (Goleby et al., 2000) and field observations (Boulter et al.,
1987; Copeland, 1998; Ridley and Mengler, 2000), and dextral movement (Mueller et al., 1988). Most
recently, Weinberg et al. (2005) described the BLFZ as having formed by earlier thrust ramps linked
during sinistral strike-slip movement.
There are a number of reasons for the controversy surrounding the kinematic history of the
BLFZ. The fault is large, with a strike length extending over 200km, and in places the fault trace is
poorly defined. Outcrop is poor and there are only limited exposures where observations can be taken
directly from within the fault. In addition, the fault has been active with a number of different
movement senses throughout orogenesis, and therefore has had a long-lived and complex
deformational history. These factors have led to a number of discrepancies between authors when
describing the kinematic history of the shear system.
Geological Setting of the New Celebration Gold Deposits Previous workers have studied the geology, structural evolution and hydrothermal alteration of
the New Celebration deposits. The following section summarizes the geological descriptions of
Langsford (1989), Norris (1990), Williams (1994), Copeland (1998), Nichols (2003), Nichols et al.
(2004) and Nichols et al. (in revision) and the observations made during this study.

7
Lithostratigraphy, deformation and magmatism
The New Celebration gold deposits are hosted within a sequence of folded and sheared
komatiites, differentiated dolerites and felsic volcaniclastic rocks, which have been intruded by several
generations of felsic and lamprophyric dikes and truncated by the BLFZ (Fig. 2). Regionally, the
sequence is metamorphosed to upper greenschist facies (Norris, 1990), although for simplicity the
prefix meta- is omitted from the geological descriptions in this paper. Gold mineralization is located
within or immediately adjacent to the shear zone (Norris, 1990; Copeland, 1998), in the hanging wall
of a steeply dipping, deformed contact between mafic and ultramafic rocks, within mafic schist, and
within and adjacent to strongly foliated to mylonitic intermediate plagioclase and felsic quartz-feldspar
porphyry dikes that intruded the contact along the BLFZ (Williams, 1994, Fig. 2a, 2b).
Nichols (2003) identified three main deformation events at New Celebration, and tentatively
correlated them with regional deformation events. For clarity Nichols (2003) identified the local New
Celebration events with the subscript NC; this convention is maintained throughout the manuscript. An
event correlating to regional D1 was not recognized at the New Celebration gold deposits. The earliest
recognized deformation event is D2NC, which is characterized by conformable stratigraphic contacts
that have been tilted to vertical. This event corresponds to the regional D2 upright folding of Swager
(1989) and Swager and Griffin (1990). The NW trending S-C fabrics (350/82W and 309/87W,
respectively), SSW-plunging mineral elongation lineations and sigmoidal quartz grains constrain
movement on the BLFZ during D3NC as sinistral oblique slip, west block down to the southwest
(Nichols, 2003; Nichols et al., 2004). This tentatively correlates with regional D3 ENE-WSW
compression and sinistral strike- and dip-slip faulting (Swager, 1989; Swager and Griffin, 1990).
Northwest dipping structures and a second penetrative S-C fabric (042/81W, 012/58W), which crosscut
S3NC, represent D4NC and constrain fault movement during D4NC as sinistral strike slip. Late
curviplanar faults that crosscut all other structures are assigned to D4+NC.
Nichols (2003) recognized two major magmatic events at New Celebration, based on
mineralogy, deformation style and crosscutting relationships. Early intensely carbonate-biotite-

8
magnetite altered plagioclase porphyry dikes are denoted M1 and have a penetrative S3NC foliation.
These intrusions are crosscut by weakly albite-carbonate-magnetite-hematite altered, unfoliated to
weakly foliated quartz-feldspar porphyry dikes, designated M2, which preserve primary porphyritic
igneous textures. The M2 porphyries are boudinaged along strike and down dip, within the S3NC
foliation.
Ore bodies, hydrothermal alteration and gold mineralization
Mafic schists, mylonites and sheared intermediate porphyritic intrusions and felsic porphyries
host gold mineralization within brittle-ductile shear zones and quartz breccias (Williams, 1994;
Nichols, 2003). Ore zones are located in the hanging wall of a steeply dipping, deformed contact
between mafic and ultramafic rocks, and are spatially associated with, and hosted within, intermediate
and quartz-feldspar porphyry dikes that intruded the contact along the BLFZ (Williams, 1994). Nichols
(2003) identified two mineralizing events, Stage I and Stage II, and four mineralization styles classified
according to their mode of occurrence and host rocks. Stage I gold mineralization is associated with
ductile deformation and is hosted within fine-grained, deformed pyrite along foliation planes in
mylonitized and deformed intermediate M1 porphyry and mafic schists. Stage II is associated with
brittle-ductile deformation and hosted within high magnesium basalt and felsic porphyry that cross-cut
and intrude Stage I-hosting M1 porphyries, indicating that the mineralization events are separated in
time, although the absolute dates are unconstrained.
Stage I gold occurs as rounded inclusions within disseminated and deformed fine grained pyrite
aligned parallel to the S3NC foliation planes (Fig. 3) in mafic schists and strongly foliated to mylonitic
M1 porphyry, or within syn-D3NC quartz-calcite-pyrite veins. Ankerite and hydrothermal quartz
pressure shadows developed on the margins of the host pyrite within the foliation planes indicate that
pyrite and gold precipitated synchronous with D3NC deformation. Biotite-ankerite-albite-sericite-pyrite
alteration and a strong telluride association characterize Stage I gold mineralization. Pyrite replaces
pre-existing magnetite alteration, and in addition to gold inclusions contains rare (<1%) magnetite,
hematite, galena, chalcopyrite and pyrrhotite inclusions. Stage I is the significant gold event in terms of

9
grade (4.7g/t Au) and tonnage (84.5 Mt) at New Celebration.
Stage II gold occurs as intragranular inclusions or along grain boundaries within pyrite at the
contact between high-Mg basalt and M2 quartz-feldspar porphyry and in pyrite within quartz-sericite-
pyrite veins developed on the margins of the felsic porphyry (Fig. 3). In contrast to Stage I, Stage II
gold-hosting pyrite is coarse-grained, predominantly euhedral, and where it is located at the mafic-
felsic contact, overprints the S3NC foliation, which wraps around the felsic porphyry (Fig. 3). The
proximal alteration assemblage to mineralization comprises ankerite-sericite-quartz±chlorite. Pyrite
abundance and gold concentration increases with proximity to the mafic-felsic contact. Tellurides were
not observed in Stage II gold mineralization. The location of Stage II gold mineralization within and
associated with undeformed M2 porphyries, which crosscut Stage I gold-hosting M1 porphyries, and
the location of gold in euhedral pyrite that overprints the S3NC foliation, indicate that Stage II post-
dates Stage I and is therefore interpreted to have occurred post-D3NC. Stage II gold mineralization is
characterized by lower gold grades (1.8g/t Au) and tonnage (10.4 Mt) when compared to Stage I gold
mineralization.
Vein Paragenesis
Vein types
Four major vein groups, correlated with specific deformation events and gold mineralization
styles, were identified at New Celebration (Fig. 4, Table 1). Type 1 quartz-calcite boudinaged veins
formed prior to D3NC and predate gold mineralization. Type 2 quartz±calcite veins developed during
D3NC and are synchronous with Stage I gold mineralization. Type 3 quartz breccia veins developed
during late D3NC or post D3NC and crosscut Stage I gold mineralization. Type 4 sericite-pyrite veins
developed during late D3NC or D4NC and host Stage II gold mineralization.
Vein mineralogy
The earliest observed Type 1 veins are foliation-parallel, quartz-calcite boudinaged veins,
which are situated in mylonites and strongly foliated M1 plagioclase porphyries (Fig. 4a). Quartz and

10
calcite grains within these veins exhibit undulose extinction and have undergone complete dynamic
recrystallization by grain boundary migration and sub-grain rotation (c.f. Passchier and Trouw, 1996).
Type 2 veins comprise predominantly quartz-calcite± pyrite±ankerite and occur either parallel
or perpendicular to S3NC foliation. The veins that are located perpendicular to foliation show mutually
crosscutting relationships with the foliation planes (Fig. 4b) and are interpreted to have occurred
synchronous with S3NC and therefore to the Stage I gold mineralizing event. Zoned quartz-calcite veins
are interpreted to have formed via multiple opening stages, therefore the calcite margins of these veins
are considered older than the quartz cores. Type 2 veins are commonly, although not always,
surrounded by wide (20-50mm) ankerite alteration zones and clusters of large, inclusion-rich pyrite
grains along the vein selvedges. These pyrite grains typically exhibit a “dirty”, mineral inclusion-rich
core surrounded by a “clean”, inclusion free rim. Mineral inclusions comprise abundant silicates, minor
sulfides (e.g. galena, sphalerite), iron oxides (e.g. magnetite, hematite, ilmenite) and rare gold blebs.
Quartz grains in Type 2 veins have undergone partial dynamic recrystallization by grain boundary
migration and sub-grain rotation. Grain boundaries are often highly irregular and protrude into
neighboring grains, although the degree to which individual samples were recrystallized varies. Sub-
grain development is minor and is predominantly concentrated along the outer vein edge. Relict grains
locally exhibit undulose extinction and lattice-preferred orientation (c.f. Passchier and Trouw, 1996).
Type 3 veins comprise quartz, (Fig. 4c) with or without minor calcite and sericite. The veins are
composed almost entirely of coarse-grained (1-5mm) clear quartz overprinted by accessory calcite and
rare sericite. The veins form breccias within M2 quartz-feldspar porphyries and can be distinguished
from Type 2b veins by their coarse grain size, minor calcite and lack of an alteration selvedge. Quartz
grains within these veins show evidence that they have undergone partial dynamic recrystallization by
grain boundary migration. This evidence includes diffuse and highly irregular grain boundaries.
Type 4 veins, which host Fracture-style mineralization, are composed of sericite, chlorite and
pyrite , form thin (20-200µm) stringer veins (Fig. 4d), and only occur in M2 quartz-feldspar porphyries.
Pyrite is located as large subhedral to euhedral grains or as aggregates of fine subhedral to euhedral
11
crystals, and commonly contains abundant silicate and sulfide inclusions. Pyrite hosts gold as rounded
inclusions within grains and localized along pyrite grain boundaries.
Fluid Inclusion Analytical Procedures The first author logged seven diamond drill holes within the Hampton-Boulder and Jubilee open
pits and underground workings. The chosen holes were selected because they intersected the hanging
wall, ore zones and footwall at depths from the present surface to 250m below the pit floor, they all
contained high-grade (>3.0 g/t Au) ore zones and more than one mineralization style was represented in
each hole. Approximately 70 samples representing the different mineralization styles and stages were
collected for further analysis. Of these, 18 quartz and calcite vein samples were prepared as 80µm
double-polished thick sections and then petrographically examined for quartz textures and fluid
inclusions. Six samples representing type 1 (one), type 2 (two), type 3 (two) and quartz-carbonate
alteration associated with contact style mineralization contained fluid inclusions large enough (>5µm)
to conduct detailed microthermometric and laser Raman analyses. These samples were examined
petrographically prior to microthermometric analysis in order to determine the types of inclusions
present in the samples, to describe their morphology, distribution, relative timing, and identify fluid
inclusion assemblages (c.f Goldstein and Reynolds, 1994) in order to assess whether inclusions had
undergone post-entrapment modification or were the result of fluid immiscibility. Over 500 fluid
inclusion measurements were collected in quartz from Type 2 quartz-calcite veins and Type 3 quartz
veins, and from quartz alteration associated with Stage II gold mineralization. Type 1 boudinaged veins
contained only rare inclusions suitable for analysis due to the almost complete dynamic
recrystallization of the quartz. Suitable inclusions in calcite (Type 2 quartz-calcite veins) did not appear
to have undergone any post-entrapment modifications, therefore were also measured. Fluid inclusions
in all samples typically ranged in size from <1µm to approximately 30µm and varied in morphology
from highly irregular to rounded to negative crystal shaped. Most inclusions selected for
microthermometric analysis ranged between 3µm and 15µm in the longest dimension; unusually large

12
or highly irregular inclusions were not analyzed as these inclusions are commonly subject to post-
entrapment modification (Roedder, 1984).
Microthermometric data were collected using a fully automated Linkham THMSG heating and
freezing stage, which has a temperature range of -196° to +600°C. The stage was calibrated against the
melting point of pure CO2 (-56.6) and pure H2O (0.0°C), and the critical point of pure H2O (374.1°C)
using SynFlinc synthetic fluid inclusion standards. Accuracy of the stage during low-temperature
(<32°C) measurements was between ± 0.1° and ±0.4°C and during high temperature measurements
(>100°C) was ±4.0°C, whereas precision was to 0.1°C at all temperatures. In order to observe low
temperature phase transitions in all inclusion types, inclusions were first super-cooled to around -70°C
for aqueous inclusions, -110°C for aqueous-carbonic inclusions, and -196°C for methane inclusions,
then reheated slowly at 1°/minute near expected phase transitions. During heating experiments, fluid
inclusion chips were heated at 5°C/minute below 200°C and 1°C/minute above 200°C; measurements
were obtained firstly from liquid-rich then vapor-rich inclusions in order to avoid destroying vapor-rich
inclusions prior to obtaining homogenization temperatures.
The cycling technique of Goldstein and Reynolds (Goldstein and Reynolds, 1994) was
employed during heating and freezing experiments in order to obtain accurate phase transition
temperatures. Salinity (equiv. wt% NaCl), bulk composition and density were calculated using
MacFlinCor (Brown and Hagemann, 1995) and the equations of state for H2O-NaCl-KCl (Bodnar and
Vityk, 1994), and H2O-CO2-CH4-NaCl and CO2-CH4 (Jacobs and Kerrick, 1981). The graphical
methods of Swanenberg (1979) and Thiery et al. (1994) were used to estimate the molar proportions of
CO2 and CH4. The relative proportions of CO2 and CH4 are reported in mole percent (%) and density is
reported in grams per cubic centimeter (g/cm3).
Laser Raman spectroscopy was used to quantify the content of the gas phases in fluid
inclusions, and to identify the nature of the daughter crystals. Laser Raman spectra were recorded at
Geoscience Australia on a Dilor® SuperLabram spectrometer equipped with a holographic notch filter,
600 and 1800 g/mm gratings, and a liquid N2 cooled, 2000 x 450 pixel CCD detector. The inclusions
13
and daughter crystals were illuminated with 514.5 nm laser excitation from a Melles Griot 543 argon
ion laser, using 5 mW power at the samples, and a single 30 second accumulation. A 100X Olympus
microscope objective was used to focus the laser beam and collect the scattered light. The focused laser
spot on the samples was approximately 1 μm in diameter. Wave numbers are accurate to ± 1 cm-1 as
determined by plasma and neon emission lines. For the analysis of CO2, O2, N2, H2S and CH4 in the
vapor phase, spectra were recorded from 1000 to 3800 cm-1 using a single 20-second integration time
per spectrum. The detection limits are dependent upon the instrumental sensitivity, the partial pressure
of each gas, and the optical quality of each fluid inclusion. Raman detection limits (Wopenka and
Pasteris, 1987) are estimated to be around 0.1 mole percent for CO2, O2 and N2, and 0.03 mole percent
for H2S and CH4. Errors in the calculated gas ratios are generally less than 1 mole percent.
Fluid Inclusion Study
Location, composition and petrography of fluid inclusions
Fluid inclusions are abundant in quartz and calcite and occur as clusters within single grains and
along healed fractures both entirely within and cross-cutting grain boundaries. Detailed petrography
revealed four compositional fluid inclusion types: (I) CH4, (II) H2O-CO2, (III) CO2-rich, and (IV) H2O-
rich. (Fig. 5).
Type I CH4 inclusions are dark, generally rounded, and are always monophase at room
temperature. These inclusions are subdivided further based on their mode of occurrence. Type Ia
inclusions (Fig. 5a) are located within clusters as small (~10µm), negative crystal shaped primary
inclusions, and are restricted to the calcite selvedge of Type 2a zoned quartz-carbonate veins. Type Ib
(Fig. 5b) inclusions occur as secondary trails of large (10-30µm) irregular inclusions, elongate in the
trail orientation, in both Type 2 and 3 veins. Laser Raman analysis confirmed these as
CH4±C2H6±C3H8.inclusions.
Type II H2O-CO2 (Fig. 5c, 5d) inclusions are two- or three-phase at room temperature, and are
the most common inclusion in Types 2 and 3 veins, and in quartz and calcite alteration. They are
typically small, ranging in size from 5-15µm, and are usually sub-rounded, except when they are
14
trapped in calcite, where they are negative-crystal shaped. Type II inclusions are situated in primary
clusters or pseudo-secondary trails and typically display constant phase ratios of 0.3 to 0.4 in a single
trail or cluster within Type 2 veins, but have varied phase ratios, from 0.2 to 0.9 within a single trail or
cluster in Type 3 veins. In both vein types approximately 30% of inclusions contain tiny (<1µm)
rounded, cubic or triangular opaque daughter crystals (Fig. 5c) of unknown compositions and rarely
(<5% of inclusions) may contain larger (up to 5µm) ovoid or rod-shaped transparent nahcolite
(NaHCO3, determined by laser Raman analysis) daughter crystals (Fig. 5d).
Type III CO2±CH4 inclusions (Fig. 5e) are one phase at room temperature and within a single
trail or cluster display constant phase ratios around 0.9. They are ovoid to sub rounded, typically occur
in primary clusters or secondary trails, and range in size from 5-10µm. Up to 20 percent of invisible
H2O may form a thin film along inclusion walls (Roedder, 1972).
Type IV H2O-rich aqueous inclusions (Fig. 5f) are two phase at room temperature. Some
inclusions in Type 3 veins contain small amounts (less than 2.2 molal, (Ellis and Golding, 1963;
Roedder, 1984; Hedenquist and Henley, 1985) dissolved CO2, evidenced by the formation of clathrate
during freezing experiments and a double jerk of the bubble during freezing cycles despite the absence
of a separate liquid carbonic phase at temperatures below the CO2 critical point. Distribution and
occurrence of the aqueous inclusions defined two inclusion populations: (1) irregularly shaped
inclusions that occurred rarely in primary clusters or more commonly in pseudosecondary trails, and
which rarely contained opaque daughter minerals, and (2) rounded to ovoid shaped inclusions that
occupy extensive fracture zones and form broad secondary trails. The volume percent vapor of both
populations is typically between 5 and 10 percent. Inclusions of both populations are typically very
small (1-10µm), and are mostly elongate in the direction of the trail.
Relative timing constraints
The earliest measured inclusions are interpreted to be those that are located in the calcite
margins of zoned Type 2 quartz-calcite veins. These comprise Type I CH4 inclusions and Type II H2O-
CO2 inclusions, which occur in discrete primary mono-inclusion clusters. There are no cross-cutting

15
relationships observed between these two fluid inclusion types, therefore it is unclear how they relate to
each other paragenetically.
Aqueous-carbonic and aqueous inclusions in Type 2 veins, which are found in M1 intermediate
porphyries and formed synchronous with D3NC deformation, are interpreted to predate those in Type 3
veins, which cross-cut D3NC foliation. Carbonic inclusions, observed in Type 3 veins only, likely post-
date the aqueous-carbonic inclusions, however there are no direct cross-cutting relationships observed
between these two inclusion populations. Secondary trails of high-salinity H2O-rich inclusions crosscut
the aqueous-carbonic inclusions in both Type 2 and 3 veins, and in quartz and calcite alteration
associated with Stage II Contact-style gold mineralization. Secondary trails of CH4-rich inclusions
cross-cut all other inclusion types.
Microthermometry and laser Raman data and interpretation
Type I CH4 fluid inclusions: Methane inclusions in calcite and quartz did not freeze at the lower
temperature limit of the Linkham stage (-196°C). Primary inclusions in calcite formed a vapor bubble
at low temperatures (-100°C); upon warming these inclusions homogenized to liquid between -76°C
and -73°C. The composition of these inclusions was not confirmed by laser Raman analysis. Secondary
inclusions in Types 2 and 3 quartz veins also formed a vapor bubble at low temperatures, but in
contrast to the primary calcite-hosted inclusions, they homogenized to liquid at around -90°C. Laser
Raman analyses on secondary quartz-hosted inclusions confirmed them as methane-dominant (95-100
mole % CH4) with minor N2 (up to 3 mole %) and trace (1 mole %) C2H6 (ethane) and C3H8 (propane).
These inclusions had densities of 0.26 g/cm3 (Table 2).
Type II H2O-CO2 fluid inclusions: Aqueous-carbonic inclusions in calcite from Type 2 veins are
located in primary clusters. Inclusions either homogenized to liquid (ThTOT (L)) at 270°C ± 1.0°C or
decrepitated via expansion of the vapor phase (ThCREP (V)) at 267°C ± 0.4°C. Melting of the carbonic
phase (TmCO2) ranged between -56.8°C and -56.6°C (Fig. 6) indicating that the gas phase comprised
nearly pure CO2. Clathrate melting temperatures (TmCLATH) ranged between 7.6 and 9.3°C (Fig. 7),
giving calculated salinities between 1.4 and 4.6 weight percent NaCl equivalent. The CO2 phase

16
homogenized to liquid between 28.9 and 30.8°C (Fig. 6). Inclusions contained between 8 and 27 mole
percent CO2 and had calculated bulk densities ranging between 0.73 and 0.86 g/cm3 (Table 2).
In both Types 2 and 3 veins most of the aqueous-carbonic inclusions in quartz decrepitated
before final homogenization. Where observed, homogenization to the liquid phase occurred between
330°C and 350°C (mean 337°C ± 15°C) in Type 2 veins and between 180°C and 365°C, (mean 295°C
± 44°C) in Type 3 veins. Melting of the carbonic phase (TmCO2) in inclusions from Type 2 veins
occurred at slightly lower temperatures (-62.0 to -56.6°C) than in inclusions from quartz-calcite
alteration and Type 3 veins (-58.1 to -56.6°C) (Fig. 6), which indicates they contained higher
concentrations of other gases, for example methane. Laser Raman analysis, which identified up to 39
mole% CH4 in aqueous-carbonic inclusions from Type 2 veins, confirmed this (Table 2).
Homogenization of the carbonic phase to liquid occurred from 6.5° to 25.8°C in inclusions from Type
2 veins and 11.8° to 30.8°C in inclusions from quartz-calcite alteration and Type 3 veins (Fig. 6, Table
2). Fluid densities, calculated using the graphical methods of Swanenberg (1979) ranged between 0.6
and 1.0g/cm3, although inclusions in Type 3 veins had a narrower range (Table 2). Final clathrate
melting temperatures ranged between 5.8° and 9.8°C (Fig. 7) in inclusions from both vein types and
quartz-calcite alteration, equating to average salinities between 0.4 and 7.4 weight percent NaCl
equivalent, calculated using MacFlinCor (Brown and Hagemann, 1995) and the equations of state for
H2O-NaCl-KCl (Bodnar and Vityk, 1994), and H2O-CO2-CH4-NaCl (Jacobs and Kerrick, 1981).
Type III CO2-rich fluid inclusions: Melting temperature of the carbonic phase in CO2-rich
inclusions from Type 3 veins ranged from -57.3°C to -56.6°C (Fig. 6) indicating that the inclusions
were essentially almost pure CO2, with less than 0.05 mole % of other gases. The ThCO2 ranged from
6.2°C to 30.8°C (Fig. 6), although 51 percent of the inclusions clustered between 15°C and 24°C.
Calculated densities of the carbonic phase varied from 0.5 to 0.9 g/cm3 with less than 3 mole percent
CH4 (Table 2).
Type IV H2O-rich fluid inclusions: Aqueous inclusions containing trace dissolved CO2 in
quartz-calcite alteration and Type 3 veins displayed eutectic temperatures (TE) between -20 and -24°C

17
indicating that the fluids were H2O-NaCl dominated (Borisenko, 1977; Crawford, 1981). All but three
inclusions homogenized to liquid between 140°C and 267°C. The remaining inclusions decrepitated to
liquid at 229°C and 236°C or via expansion of the vapor phase at 252°C. The TmICE ranged between -
6.1 and -0.5°C (Fig. 7). The presence of CO2 affects the salinity measurements, as low levels of CO2
will depress the ice melting temperature by up to 1.5°C (Hedenquist and Henley, 1985), however,
clathrate melting temperatures in the absence of liquid CO2 invalidate salinity calculations using
TmCLATH (Diamond, 1992). Calculated apparent salinities (maximum salinity) of Type IIb inclusions
ranged between 0.8°C and 9.3 equivalent weight percent NaCl and densities ranged between 0.8 and
1.0 g/cm3 (Table 2).
Aqueous inclusions without dissolved CO2 also had eutectic temperatures around -20°C,
indicating that these fluids were also within the H2O-NaCl system. Inclusions in Type 2 quartz veins
homogenized to liquid between 173° and 351°C (Fig. 6). The TmICE ranged between -9.9°C and -0.3°C
(Fig. 7) correlating to calculated salinities between 0.8 and 13.8 weight percent NaCl equivalent and
densities between 0.76 and 1.04 g/cm3. In Type 3 quartz veins, final homogenization occurred at much
lower temperatures, between 90° and 152°C (Fig. 6). Ice melting temperatures ranged between -7.0°
and -0.2°C (Fig. 7) correlating to calculated salinities between 0.3 and 10.5 weight percent NaCl
equivalent and densities of 1.0 g/cm3 (Table 2).
Secondary H2O-rich inclusions in both Types 2 and 3 veins had eutectic temperatures around -
55°C placing them in the H2O-NaCl-CaCl2 system (Borisenko, 1977; Crawford, 1981). Total
homogenization to liquid for all inclusions took place between 55°C and 118°C. The TmICE ranged
between -22.9°C and -15.2°C (Fig. 7). Calculated salinity ranged between 18.4 and 23.2 equivalent
weight percent NaCl and density between 1.09 and 1.17 g/cm3 (Table 2).
Trapping Conditions Given the broad two-phase field in the H2O-CO2-NaCl system (Takenouchi and Kennedy,
1965; Gehrig et al., 1980), it is important to determine whether the mixed H2O-CO2 inclusions
observed at New Celebration could have resulted from phase immiscibility processes. Mixed aqueous-
18
carbonic inclusions in calcite and quartz from Type 2 veins did not display liquid- and vapor-rich end
members within individual trails or clusters, and exhibited only minor variation in bulk composition or
molar volumes, thereby ruling them out as the product of phase separation (c.f. Ramboz et al., 1982). In
contrast, aqueous-carbonic inclusions from Stage II-related Type 3 quartz veins and quartz-calcite
alteration did display partial evidence for fluid immiscibility including: (a) liquid-rich and vapor-rich
end members in some primary clusters or pseudosecondary trails (Fig. 8), (b) total homogenization into
liquid and vapor at the same temperature of at least some of the inclusions, and (c) variable bulk
compositions and molar volumes within an individual trail or cluster.
The lack of conclusive evidence for fluid immiscibility associated with H2O-CO2 inclusions in
Type 2 quartz veins means that independent pressure and temperature estimates must be applied to
determine the trapping conditions of these fluids (c.f. Roedder, 1984), as homogenization temperatures
represent minimum trapping temperatures. Phengite geobarometry on gold-related alteration zones of
the Southern Ore Zone constrains formation pressures to between 3.2 and 4.2 kilobars (Williams,
1994). Regional greenschist facies metamorphism, interpreted to be broadly contemporaneous with
orogenic gold mineralization in the Kalgoorlie-Norseman corridor (McNaughton et al., 1990; Witt,
1991), constrains formation conditions to between 300 and 500°C and a minimum of 2 kilobars (c.f.
Spear, 1995).
Figure 9 illustrates isochores calculated using MacFlinCor (Brown and Hagemann, 1995) from
the different fluid inclusion types at New Celebration. Using the isochores in Figure 9 and the
independent geothermobarometric constraints outlined above, an approximate P-T-t path for the
hydrothermal fluids circulating through the Boulder-Lefroy fault segment is displayed in Figure 10.
The earliest observed aqueous-carbonic inclusions in calcite and by inference, the early primary
methane inclusions formed between 270° and 500°C at 1 to 3 kilobars. Aqueous-carbonic inclusions in
Type 2 veins constrains Stage I gold mineralization to between 300° and 500°C and 2.5 to 4.2 kilobars,
which corresponds to crustal depths between 10 and 15 kilometers below the surface. The intersection
between the isochores and the solvus for aqueous-carbonic inclusions in Type 3 veins constrain Stage

19
II gold mineralization to temperatures between 280° and 360°C and pressures between 1 and 3.5
kilobars, corresponding to crustal depths between 4 and 10 kilometers. Carbonic inclusions, interpreted
as trapped during the final phases of Stage II gold mineralization, have estimated trapping temperatures
between 280° and 360°C and trapping pressures between 0.8 and 1.6 kilobars. Pressure corrected (c.f.
Potter, 1977) low salinity secondary aqueous inclusions are trapped at about 260°C and a maximum of
3.5 kilobars. Maximum trapping temperatures and pressures for high salinity secondary aqueous
inclusions and methane inclusions, observed in all vein types in addition to quartz and calcite
alteration, formed at temperatures around 100-180°C and pressures estimated to range from 0.4 to 1.0
kilobars.
In situ Fluid Inclusion Laser-Ablation ICP-MS Methodology Selected single H2O-CO2 and H2O-rich fluid inclusions from Types 2 and 3 veins and quartz
alteration were analyzed at the University of Leeds using an ArF 193nm Geolas Q Plus excimer laser
equipped with imaging optics (Gunther et al., 1997; Gunther et al., 1998). The entire contents of the
inclusion (liquid, vapor and solid daughter crystals where trapped) were transported to the plasma as an
aerosol using He carrier gas, then the samples were analyzed with an Agilent 7500c quadrupole ICP-
MS equipped with an octopole reaction cell. Fluid inclusion analyses were calibrated using NIST SRM
610 and 612, an in-house EMPA glass standard and capillaries filled with standard solutions. Signal
data were processed using a graphical user-interfaced software package developed at the University of
Leeds (Allan et al., 2005). In order to ensure that the results represented the fluid inclusion contents and
not host vein mineral concentrations, only spectra with coincident Na and other cation peaks were
processed. Inclusion-free quartz was check analyzed for interference and produced no signal. The
absolute element concentrations of fluids in individual fluid inclusions were determined by charge
balancing against the H2O-NaCl equivalent chloride molality of each fluid inclusion population, as
determined by microthermometric heating/freezing experiments prior to the laser ICP-MS analysis. For
a detailed description of the laser ICP-MS analytical process refer to Allan et al. (2005).
20
In situ Fluid Inclusion Laser-Ablation ICP-MS Results Gold at concentrations up to 51ppm were recorded in aqueous-carbonic fluid inclusions
associated with gold mineralization. Analyses also revealed that gold-related fluid inclusions contained
significant concentrations of other metals such as Cu, Pb and Zn (Table 3).
Type 2 veins – Stage I gold-related fluids
The H2O-CO2 inclusions in Type 2 veins are Na-Ca dominant, with subordinate K and Mg.
Individual fluid inclusions contained up to 51ppm gold although average concentrations were around
5ppm (n=80). Concentrations of other metals were generally low, although these inclusions did contain
up to 163ppm Cu, 75ppm Zn and 43ppm As.
Type 3 veins and quartz alteration – Stage II gold-related fluids
The H2O-CO2 inclusions in Type 3 veins and quartz alteration associated with Contact style
mineralization contained higher Na, Mg and K concentrations, but lower Ca than those in Type 2 veins.
Stage II fluids had up to 33ppm Au, and generally contained higher concentrations of Cu, Pb, Zn, Sr,
As, Sb, Bi, Sn, Mn and Fe than fluids associated with Stage I gold mineralization. The H2O-rich
inclusions from Type 3 veins were Na-Mg dominant, with lesser K than the mixed inclusions.
The Au values reported from both Types 2 and 3 veins are consistent with the experimental
work of Mikucki and Ridley (1993) and Mikucki (1998), who determined that at temperatures between
300° and 550°C, gold transported as a bisulfide complex (Au(HS)2-) could have solubilities exceeding
10-10,000 ppb Au. They also exceed the minimum 5ppb Au concentration required to form an ore fluid
capable of forming a gold deposit (Heinrich et al., 1989).
Post-gold fluids
High salinity H2O-rich fluids measured in Type 3 veins are Na-K-Ca-dominated (K/Ca and
Na/K ratios of 5.9 and 3.2, respectively), with subordinate Mg (Table 3). They contain elevated Cu, Pb,
Sn, Ba and Mn relative to the H2O-CO2 inclusions, whereas Fe and Zn are lower. Silver and gold occur
at concentrations of up to 85.7 ppm and 1.6 ppm (n=9), respectively.

21
Comparison of New Celebration Metal and Cation signatures with other hydrothermal fluid systems
There are few published data of metal concentrations in hydrothermal fluids from orogenic lode
gold deposits, and the majority of those published present bulk crush-leach analytical techniques.
Diamond (1990) and Yardley (1993) examined the fluid characteristics of metamorphic gold-quartz
veins from Brusson, in NW Italy and Pike (1993) studied low-salinity gas-rich fluids in pegmatites
from the Muiane deposit, Mozambique. More recently Olivo et al. (2006) employed single inclusion
laser ablation-time of flight-inductively coupled plasma-mass spectrometry (LA-TOF-ICPMS), in
conjunction with crush-leach and microthermometry, to evaluate the fluid compositions in barren and
gold-bearing veins from the Sigma deposit in Canada. None of these studies presented gold data.
Relative to aqueous-carbonic fluids from Muiane or Brusson, K, Mg, Cu, Mn and Fe concentrations in
gold-related aqueous carbonic fluid inclusions at New Celebration are elevated, whereas Na
concentrations are lower. Minor element/Na ratios of New Celebration fluids are generally an order of
magnitude lower than those from the Sigma deposit, with the exception of As, which is higher at New
Celebration. Major element/Na ratios (Mg, K, Ca), however, are up to an order of magnitude higher in
the New Celebration fluids.
More single inclusion data are available from porphyry systems, generally because the fluid
salinities are higher, although there is still a significant dearth of in situ Au analyses. Fluids from the
Butte porphyry system (Rusk et al., 2004), contain Na, K, Pb, Zn and Mn in similar concentrations to
gold-related fluids from New Celebration. Ulrich et al. (1999) publish Au concentrations averaging up
to 10 ppm in vapor inclusions from the Grasberg porphyry Cu-Mo-Au deposit, however, these Au
concentrations were analyzed from high-salinity inclusions. Something about intrusion related gold
systems in here.
The post-gold hydrothermal fluids at New Celebration are low temperature, high salinity fluids
with a characteristic Na, K and Mg signature. When comparing these fluids with data sets from
Canadian shield brines, sedimentary basin fluids, metamorphic fluids, and geothermal fluids (Yardley,
2005 and references therein), it is evident that the shield brines and basin fluids show no similarities to
22
the New Celebration post-gold fluids. The metamorphic, geothermal and magmatic fluids, however,
exhibit a number of similarities; Na, K and Mg concentrations are comparable in all fluid types,
whereas Ca and Cu concentrations in the New Celebration fluids are most similar to magmatic fluids.
Lead and Zn concentrations are more closely aligned with metamorphic or geothermal fluids.
Sulfur Isotope Geochemistry The δ34S isotopic composition of pyrite from fifteen samples representing Stage I and Stage II
gold mineralizing events and four mineralization styles were analyzed by either Nd-YAG laser ablation
of in situ sulfides (Huston et al., 1995) or conventional techniques for pyrite separates (Robinson and
Kusakabe, 1975) at the Central Science Laboratory (CSL), at the University of Tasmania. Thirty in situ
analyses and nine conventional analyses were collected for this study. The conventional analyses
represented an initial reconnaissance study to evaluate the potential for a detailed in situ analysis of
ore-related sulfide. All results are reported in parts per thousand (‰) relative to the Canyon Diablo
Troilite (CDT).
The majority of both Stage I and II gold-related pyrites at New Celebration had negative δ34S
values, (Table 4, Fig. 11) although the range of values both within and between mineralization styles
varied widely. Stage I gold related samples ranged from -7.6 per mil to +3.8 per mil (mean -2.6‰)
whereas Stage II gold related samples ranged from -10.6 per mil to -3.2 per mil (mean -7.1‰).
These values contrast with the predominantly positive δ34S values (0-5‰) reported by Golding
et al. (1990) and Hodkiewicz (2003 and references therein), for ore-related pyrites from most gold
deposits in the Eastern Goldfields (with the exception of Porphyry, the Golden Mile, and Victory-
Defiance) and 0-9 per mil for ore-related sulfides in Archean orogenic lode gold deposits worldwide
(with the exception of Hemlo, Lakeshore/Macassa, Canadian Arrow, and Kelore, which have much
larger δ34S ranges) reported by Colvine et al. (1988) and McCuaig and Kerrich (1998), but are
consistent with previous analyses of ore-stage pyrite from New Celebration undertaken by Hodkiewicz
(2003). Clearly, the fluids that formed the New Celebration deposits were significantly more oxidized
than the average Archean lode gold deposit (c.f. McCuaig and Kerrich, 1998). Either they were

23
intrinsically oxidized from source or they were oxidized during gold precipitation; by in-situ fluid
oxidation due to reaction with iron-rich wall rocks (Couture and Pilote, 1993), by fluid mixing
(Uemoto et al., 2002) or by fluid oxidation during phase separation (Drummond and Ohmoto, 1985).
Fluid Redox and Ore Precipitation Gold mineralization occurs in response to changing chemical conditions of the ore fluid,
typically the fluid redox state or pH, which takes place due to physical changes to the ore fluid, such as
fluid immiscibility, fluid mixing or interaction with reactive wall rocks (Seward, 1973, 1984; Mikucki
and Groves, 1990; Mikucki, 1998). According to Lambert et al., (1984), Phillips et al., (1986) and
Golding et al., (1990) an increase in the redox state of the fluid lowers gold solubility significantly,
thereby creating conditions that favor gold precipitation.
Interaction between the ore fluids and iron-rich wall rocks likely facilitated much of the gold
mineralization at New Celebration. In all mineralization styles pyrite hosts gold, and gold enrichment
shows a close correlation with increasing pyrite (Williams, 1994; Nichols, 2003). Additionally, gold is
located predominantly within the iron-rich wall rock in all mineralization styles except Fracture-style,
where narrow sericite-filled cracks contain the gold-bearing pyrite. Extensive ankerite alteration
accompanies all gold mineralization styles, and pyrite replaces magnetite with increasing proximity to
mineralization. The unaltered intermediate and felsic porphyry host rocks likely did not provide enough
iron to facilitate wall rock reactions, however, extensive pre-mineralization magnetite and hematite
alteration (Nichols, 2003; Nichols et al., submitted) resulted in a significant increase in the amount of
modal iron. The correlation between pyrite abundance and gold enrichment (Nichols et al., in revision)
suggests that sulfidation of iron-rich wall rocks was the mechanism by which the majority of gold
precipitated at New Celebration. Palin and Xu (2000) indicated that this would not effect a change to
the oxidation state of the dissolved sulfur species, therefore there would be no shift to the isotopic
composition of pyrite. This suggests that the sulfur isotopic composition of ore-stage pyrite reflects the
composition of the ore fluids. Sulfur isotope and LA-ICP-MS evidence point to different origins for
Stage I and Stage II ore fluids and suggest a fluid source switch between the two gold mineralizing

24
events from an early likely dominantly metamorphic derived fluid to a later possibly magmatic fluid,
coinciding with the emplacement of the M2 felsic porphyries and their inferred underlying magma
chambers. This is consistent with the recent findings of Mueller (2007) who considers that the giant
Golden Mile deposit, located to the north of New Celebration along strike of the BLFZ formed due to
oxidized magmatic fluids ascending from buried subduction-related monzodiorite-tonalite plutons.
An alternative is that gold mineralization took place due to in situ fluid oxidation, either by wall
rock reaction or fluid immiscibility. Hodkiewicz (2003) determined a broad negative correlation (r2-
0.73, n=5) between gold grade and sulfide sulfur isotopic composition at New Celebration and
interpreted this as evidence for in situ ore fluid oxidation and gold precipitation by carbonate alteration
of host rock magnetite. In contrast, this study found no correlation between sulfide sulfur isotopic
composition and gold grade (r2=0.10, n=28). Further, magnetite carbonation is a poor mechanism for
oxidizing ore fluids as typical lode-gold ore fluids contain high concentrations of CO2 and CH4, which
provides substantial buffering capacity, and only leads to ore fluid oxidation at very low fluid/rock
ratios (E.J. Mikucki unpub. report, 2001). This is not compatible with the significant hydrothermal
fluid flow and high fluid/rock ratios expected within a crustal scale fault system such as the BLFZ and,
therefore can be discounted as a mechanism to precipitate gold or oxidize ore fluids at New
Celebration. Fluid inclusion petrography indicates at least intermittent phase immiscibility during Stage
II gold mineralization. During phase separation reduced gases (H2S, CH4 and H2) are preferentially
partitioned into the gas phase (Drummond and Ohmoto, 1985), thus the liquid becomes more oxidizing.
As a result, some of the remaining reduced species in the liquid, such as H2S, will be oxidized to HSO4-
which is enriched in 34S. Consequently, the reduced sulfur left behind is depleted in 34S therefore
sulfides that precipitate from the residual liquid phase are also 34S depleted. Phase separation is
consistent with the observations made from Type 3 quartz veins and quartz and carbonate alteration
related to Stage II gold mineralization and accounts for both the negative sulfur isotopic composition
and the spread in δ34S ratios observed in Stage II ore-related pyrites.
At least two ore-forming processes acting either contemporaneously or sequentially have

25
potentially influenced gold precipitation during the two gold mineralizing stages at New Celebration.
Fluid-wall rock reaction appears to be the dominant process by which gold precipitated, although it did
not cause fluid oxidation, and phase immiscibility is locally important, at least during Stage II
mineralization.
Discussion
Hydrothermal Fluid Model
Detailed fluid inclusion and sulfur isotope analyses of veins associated with pre- syn- and post-
gold mineralization hydrothermal events point towards a complex hydrothermal fluid system within the
western segment of the BLFZ. Combining the structural and hydrothermal chronology outlined in
previous sections, we propose a three-stage model for the development of the New Celebration gold
deposits (Fig.12).
Early Evolution: The formation of the BLFZ occurred subsequent to the emplacement of the
regional volcano-sedimentary sequence, and to regional D1 N-S oriented thrust faulting, during D2NC
ENE-WSW-oriented shortening and crustal thickening (Nichols, 2003; Nichols et al., 2004; Nichols et
al., submitted; Weinberg et al., 2005). The formation of the NNW-trending, sinistral BLFZ during
ESE-WNW-directed shortening (Nichols, 2003; Nichols et al., 2004; Nichols et al., submitted), and (2)
the emplacement of the M1 intermediate plagioclase-phyric porphyritic dike into the fault zone
characterized the onset of D3NC and peak metamorphism. Type 2 quartz-calcite veins emplaced during
the early formation of the BLFZ trapped methane and aqueous-carbonic fluid inclusions in the calcite
margin between 270°C and 500°C and pressures between 1.1 and 3.1 kilobars (Fig. 10).
Syn-gold evolution: Stage I mineralization took place after peak metamorphism during (early)
D3NC deformation (Witt, 1993; Copeland, 1998; Nichols, 2003). Gold precipitated at approximately 10
to 15 kilometers below the surface in a ductile structural regime predominantly by sulfidation of wall
rock magnetite. Characteristically these fluids were Na-dominant, with lesser Ca, K and Mg (K/Ca <1),
and contained ppm level Au, Fe, Cu, Zn and As. Stage II mineralization occurred post-D3NC (Nichols,
2003) during brittle reactivation of the BLFZ at the end of D3NC and during early D4NC (Nichols et al.,
26
submitted). Mineralization took place at shallower levels than Stage I, between approximately 4 and 10
km, likely due to a combination of wall rock sulfidation and phase immiscibility. The hydrothermal
fluids were Na dominant, with lesser Mg, K and Ca (K/Ca >1) in addition to ppm level Au, Fe, Cu, Pb,
Zn, and As. The change in fluid characteristics from Stage I to Stage II suggest a switch in fluid source,
possibly from a metamorphic origin to a magmatic origin, coinciding with the emplacement of the M2
porphyries, although this remains equivocal at present.
Post-gold evolution: Secondary post-gold fluid inclusions in Types 2 and 3 quartz veins record
at least three distinct phases of fault zone reactivation at New Celebration. Low-salinity aqueous fluids
were followed by the infiltration of highly saline aqueous fluids which themselves were followed by
methane fluids. Pressure and temperature trapping estimates for the high salinity and methane fluids are
significantly lower than for all previous fluid inclusion assemblages, suggesting significant uplift and
erosion during the final reactivation stages of the BLFZ.
In summary, the paleohydrothermal evolution of the BLFZ and New Celebration gold deposits
is characterized by discrete pulses of gold-bearing and barren hydrothermal fluids infiltrating the fault
as a consequence of distinct deformation events (D3NC to D4+NC) including several reactivation events.
At least two gas-rich fluid events are recorded that cannot be linked to gold mineralization. The gold
mineralization stages are characterized by aqueous-carbonic inclusions and as such are similar to many
other gold-bearing fluids observed in many orogenic gold deposits worldwide. Cation ratios indicate a
fluid source switch between Stage I and Stage II fluids. There is no fluid inclusion evidence for
significant surface water infiltration into the BLFZ at New Celebration (c.f. Hagemann et al., 1993),
therefore, the switch in K/Ca ratios may relate to a change in deep fluid sources such as magmatic or
metamorphic fluids or a combination of the two.
Key factors in the location of the New Celebration deposits
In contrast to most other first order crustal scale fault systems around the world, the BLFZ is
unique in that it hosts the world class New Celebration gold deposits directly within the fault and not
within adjacent higher-order splays. The key factors in the location of the New Celebration deposits

27
within the BLFZ appear to be: (1) the long-lived and complex deformation history of the fault, (2) its
exposure to a number of different fluids, and (3) lithological complexity, which provided appropriate
chemical (Stage I and II) and rheological (Stage II) conditions conducive to gold mineralization.
The fluid inclusion record at New Celebration indicates that fluid flow through the BLFZ
continued over an extended length of time during a number of deformation events and included several
chemically different fluids of potentially diverse origins, at least two of which contained gold and other
metals and contributed to gold mineralization at New Celebration. This is in contrast to other first-order
crustal scale shear zones, such as the Cadillac Tectonic Zone (CTZ) in the Abitibi greenstone belt of
Canada. The CTZ, which is spatially associated with a number of world-class gold deposits hosted
within second- and third-order splays, contains, where fluid inclusions were analyzed, only CO2-
dominated fluids (Neumayr et al., 2007) and is poorly gold endowed. The BLFZ appears to be the most
critical factor in the location of the New Celebration gold deposits as it tapped a number of different
crustal fluids during its long-lived history and facilitated the movement these fluids into zones that
provided the necessary physical and chemical environment for significant gold mineralization.
The presence of iron-rich mafic host rocks and the pre-mineralization hydrothermal magnetite
alteration of otherwise chemically unfavorable iron-poor intermediate host rocks (c.f. Groves, 1990;
Hodgson, 1993) significantly enhanced the potential for the BLFZ to host gold mineralization at New
Celebration. Dilation of the shear zone and an anti-clockwise change in the orientation of the shear
zone away from the average trend of the BLFZ (Hodkiewicz, 2003) during late D3NC and early D4NC
provided space for the emplacement of the M2 porphyry into the fault. This provided a favorable host
for Stage II mineralization during brittle reactivation of the fault, associated failure-induced pressure
reduction and consequent phase separation. Intrusion of the M2 porphyry may also have coincided with
an influx of a second gold-bearing fluid, possibly of magmatic origin, into the shear zone.
Fluid and metal source
As with many orogenic lode gold deposits around the world, the source of the hydrothermal
fluids and metals at New Celebration remain unconstrained. Potassium, Mg and Ca over Na ratios, and
28
high base metal concentrations in Stage II related fluids relative to Stage I indicate that at least two
different gold-bearing fluids were responsible for gold mineralization at New Celebration at different
times. The origins of these fluids are likely metamorphic, or magmatic (Ridley and Diamond, 2000), or
a combination of the two, and maybe locally or regionally derived, however their exact sources are
equivocal.
The relatively high concentrations of the base metals Cu, Pb and Zn in the ore fluids (Table 3),
and the lack of base metal sulfides in the New Celebration gold deposits require an explanation.
Significant amounts of base metals do not typically characterize orogenic lode gold deposits, and the
geochemistry of base metal-bisulfide complexes is poorly understood (Wood and Samson, 1998);
however, recent advances in single-inclusion laser-ablation inductively coupled plasma mass
spectrometry have allowed detailed investigations of ore fluid compositions. Olivo et al (2006) reported
Cu/Na, Pb/Na and Zn/Na ratios up to an order of magnitude higher than those reported in this study,
without any associated base metal mineralization. This would suggest that base metals in lode gold
fluids maybe more common than previously anticipated, but that physico-chemical conditions for the
precipitation of base metals is not favourable. Either the base metal sulfides precipitated at higher or
lower crustal levels in the system than the gold, and were eroded away or not yet exposed or they did
not precipitate at all and instead reached the paleo-surface in the outflow zone of the hydrothermal
system. Further single inclusion analyses of lode gold hydrothermal fluids from other deposits may
indicate whether base metals are a characteristic of orogenic lode gold deposits, or whether they are
unique to New Celebration only.
Timing of mineralization
The absolute timing of gold deposition at New Celebration, and the time gap between the two
mineralizing stages is also unconstrained. Pressure-temperature estimates indicate that Stage II
mineralization occurred after a significant period of interpreted uplift and erosion and during a change
from a ductile to a brittle deformational regime during crustal cooling or increasing strain rate

29
(Weinberg et al., 2005). Whether gold precipitated during two discrete pulses or during continuous
tectonic and fluid evolution of the BLFZ remains presently unclear.
Conclusions Petrographic, fluid inclusion and isotopic analyses of the pre- and syn-gold related veins and
ore-related host sulfides at New Celebration indicate that two stages of gold mineralization formed
from differing hydrothermal fluids under differing P-T conditions during the evolution of the Boulder-
Lefroy fault zone. Stage I gold mineralization took place due to wall rock reaction with pre-existing
magnetite alteration during a ductile deformation regime from low to moderate salinity aqueous-
carbonic fluids trapped at temperatures between 330 and 500°C and pressures between 2.4 and 4.2kbar.
In contrast, Stage II gold mineralization formed due to fault-triggered phase immiscibility, wall-rock
reaction and possible fluid mixing during a brittle-ductile to brittle deformation from low to moderate
salinity aqueous-carbonic fluids trapped at temperatures between 280°C and 360°C and pressures
between 1.5 and 3.5kbar. Cation ratios and metal concentrations indicate that a switch in fluid source
occurred between Stage I and Stage II mineralization, possibly as a consequence of the evolving fault
system tapping a different fluid reservoir at depth. The source of the hydrothermal ore fluids and metals
remains unconstrained; however, they likely originated from the devolatilization of deep crustal rocks
undergoing regional scale metamorphism, from magmatic bodies, or a combination of the two.
This study conclusively illustrates that a first order crustal-scale shear zone contained gold-
bearing fluids during part of its deformation history. Although the role of crustal scale faults as vectors
towards lode gold mineralization in higher order structures has long been recognized (e.g. Eisenlohr et
al., 1989), crustal scale faults have been largely ignored as primary exploration targets. Gold
mineralization at New Celebration clearly relates to the influx of gold-bearing CO2-rich fluids into the
western segment of the Boulder-Lefroy crustal-scale fault zone, where gold precipitated due to the
reaction of the hydrothermal fluids with magnetite-bearing intermediate and felsic wall rocks and phase
separation. The New Celebration deposits are not typical orogenic lode gold deposits in that they are
hosted within a primary crustal scale structure within predominantly intermediate and felsic intrusive
30
rocks; a geological setting mostly considered unfavorable for exploration. This study illustrates that
first-order fault systems do have the potential to host significant gold mineralization where the physico-
chemical parameters are favorable and should be evaluated when exploring in both brownfields and
greenfields terrains.
Acknowledgements This work forms part of the first authors PhD research, undertaken through the Centre for
Exploration Targeting at the University of Western Australia and under the auspices of the Predictive
Mineral Discovery Cooperative Research Centre. JLH gratefully acknowledges receipt of an Australian
Postgraduate Award and a pmd*CRC supplementary scholarship. We would like to thank Mike
Humphries and Sian Nichols of Harmony Gold Mining Company Ltd (South Kal Mines) for providing
technical and logistical support and Bob Hayden, CEO of the pmd*CRC for permission to publish. We
would also like to thank Rich Goldfarb and an anonymous reviewer for their detailed and constructive
comments, which immensely improved the manuscript.
References Allan, M. M., Yardley, B. W. D., Forbes, L. J., Shmulovich, K. I., Banks, D. A., and Shepherd, T. J.,
2005, Validation of LA-ICP-MS fluid inclusion analysis with synthetic fluid inclusions: American Mineralogist, v. 90, p. 1767-1775.
Bateman, R. J., Hagemann, S. G., McCuaig, T. C., and Swager, C., 2001, Protracted gold mineralisation throughout Archaean orogenesis in the Kalgoorlie camp, Yilgarn Craton, Western Australia: structural, mineralogical and geochemical evolution, in Hagemann, S. G., Neumayr, P., and Witt, W. K., eds., World-class Gold Camps and Deposits in the Eastern Yilgarn Craton, Western Australia, with Special Emphasis on the Eastern Goldfields Province, Record 2001/17, Western Australian Geological Survey, p. 63-98.
Bodnar, R. J., and Vityk, M. O., 1994, Interpretation of microthermometric data for H2O-NaCl inclusions, in De Vivo, B., and Frezzotti, M. L., eds., Fluid Inclusions in Minerals: Methods and Applications, Virginia Polytechnic Institute Press, p. 117-130.
Borisenko, A. S., 1977, Study of the salt composition of solutions in gas-liquid inclusions in minerals by the cryometric method: Soviet Geology and Geophysics, v. 18, p. 11-19.
Boulter, C. A., Fotios, M. G., and Phillips, G. N., 1987, The Golden Mile, Kalgoorlie: A giant gold deposit localized in ductile shear zones by structurally induced infiltration of an auriferous metamorphic fluid: Economic Geology, v. 82, p. 1661-1678.
Brown, P. E., and Hagemann, S. E., 1995, MacFlinCor and its application to fluids in Archean lode-gold deposits: Geochimica et Cosmochimica Acta, v. 59, p. 3943-3952.
Colvine, A. C., Fyon, J. A., Heather, K. B., Marmont, S., Smith, P. M., and Troop, D. G., 1988, Archean Lode Gold Deposits in Ontario, Ontario Geological Survey Miscellaneous Paper 139, p. 136.
Copeland, I. K., 1998, Jubilee gold deposit, Kambalda: Australasian Institute of Mining and Metallurgy Monograph 22, p. 219-224.
31
Couture, J. F., and Pilote, P., 1993, The geology and alteration patterns of a disseminated, shear zone-hosted mesothermal gold deposit: the Francoeur 3 Deposit, Rouyn-Noranda, Quebec: Economic Geology, v. 88, p. 1664-1684.
Crawford, M. L., 1981, Phase equilibria in aqueous fluid inclusions, in Hollister, L. S., and Crawford, M. L., eds., Short Course in Fluid Inclusions: Applications to Petrology, 6, Mineralogical Association of Canada, p. 75-100.
Diamond, L. W., 1990, Fluid inclusion evidence for P-V-T-X evolution of hydrothermal solutions in late alpine gold-quartz veins at Brusson, Val d'ayas, Northwest Italian Alps: American Journal of Science, v. 290, p. 912-958.
Diamond, L. W., 1992, Stability of clathrate hydrate + CO2 liquid + CO2 vapour + aqueous KCl-NaCl solutions: Experimental determination and application to salinity estimates of fluid inclusions: Geochimica et Cosmochimica Acta, v. 56.
Dielemans, P., 2000, Structural controls on gold mineralisation in the Southern Ore Zone of the Hampton-Boulder deposit, New Celebration gold mine, Western Australia: Unpub. MSc. thesis, University of Western Australia, 185 p.
Drummond, S. E., and Ohmoto, H., 1985, Chemical evolution and mineral deposition in boiling hydrothermal systems: Economic Geology, v. 80, p. 126-147.
Eisenlohr, B. N., Groves, D. I., and Partington, G. A., 1989, Crustal scale shear zones and their significance to Archaean gold mineralisation in Western Australia: Mineralium Deposita, v. 24, p. 1-8.
Ellis, A. J., and Golding, R. M., 1963, The solubility of carbon dioxide above 100°C in water and in sodium chloride solutions: American Journal of Science, v. 261, p. 47-60.
Gehrig, M., Lentz, H., and Franck, E. U., 1980, Phase equilibria and pVT of binary and ternary mixtures of water, carbon dioxide and sodium chloride up to 3 kb and 550 degrees C: Mineralogical Society Bulletin, v. 49, p. 6.
Golding, S. D., Groves, D. I., McNaughton, N. J., Mikucki, E., and Sang, J. H., 1990, Sulfur isotope studies, in Ho, S. E., Groves, D. I., and Bennett, J., eds., Gold deposits of the Yilgarn Block, Western Australia: Nature, genesis and exploration guides, University of Western Australia, Geology Department and University Extension, v. 20, p. 259-262.
Goldstein, R. M., and Reynolds, T. J., 1994, Systematics of fluid inclusions in diagenetic minerals: SEPM Short Course 31, Society for Sedimentary Geology, 199 p.
Goleby, B. R., Korsch, R. J., Fomin, T., Owen, A. J., and Bell, B., 2000, The AGCRC's 1999 Yilgarn deep seismic survey, Australian Geological Survey Organisation, 2000/34, p. 52-64.
Groves, D. I., 1990, Excursion no. 3: Eastern Goldfields mineral deposits. 1: Overview of gold mineralization in the Norseman-Wiluna belt, in Ho, S. E., Glover, J. E., and Muhling, J. R., eds., Third international Archaean symposium excursion guidebook, Geology Department and University Extension, University of Western Australia, Publication no. 21, p. 307-317.
Groves, D. I., Barley, M. E., and Ho, S. E., 1990, Nature, genesis and tectonic setting of mesothermal gold mineralisation in the Yilgarn Block, Western Australia: Economic Geology Monograph, v. 6, p. 71-85.
Gunther, D., Audetat, A., Frischknecht, R., and Heinrich, C. A., 1998, Quantitative analysis of major, minor and trace elements in fluid inclusions using laser ablation-inductively coupled plasma-mass spectrometry (LA-ICP-MS): Journal of Analytical Atomic Spectroscopy, v. 13, p. 263-270.
Gunther, D., Frischknecht, R., Heinrich, C. A., and Kahlert, H.-J., 1997, Capabilities of an argon fluoride 193 nm Excimer laser for laser ablation inductively coupled plasma mass spectrometry microanalysis of geological materials: Journal of Analytical Atomic Spectroscopy, v. 12, p. 939-944.
Hagemann, S. G., Groves, D. I., Ridley, J. R., and Vearncombe, J. A., 1993, The Archean lode gold deposits at Wiluna, Western Australia: High-level brittle-style mineralization in a strike-slip regime: Economic Geology, v. 87, p. 1022-1053.

32
Hedenquist, J. W., and Henley, R. W., 1985, The importance of CO2 on freezing point measurements of fluid inclusions: evidence from active geothermal systems and implications for epithermal ore deposition: Economic Geology, v. 80, p. 1379-1406.
Heinrich, C. A., Henley, R. W., and Seward, T. M., 1989, Hydrothermal Systems: Adelaide, Australian Mineral Foundation, 74 p.
Hodgson, C. J., 1993, Mesothermal lode-gold deposits, in Kirkham, R. V., Sinclair, W. D., Thorpe, R. I., and Duke, J. M., eds., Mineral Deposit Modeling, Special Paper 40, Geological Association of Canada, p. 635-678.
Hodkiewicz, P., 2003, The Interplay Between Physical and Chemical Processes in the Formation of World-Class Orogenic Gold Deposits in the Eastern Goldfields Province, Western Australia: Unpub. PhD thesis, University of Western Australia, 198 p.
Huston, D. L., Power, M., Gemmell, J. B., and Large, R. R., 1995, Design, calibration and geological application of the first operational Australian laser ablation sulphur isotope microprobe: Australian Journal of Earth Sciences, v. 42, p. 549-555.
Jacobs, G. K., and Kerrick, D. M., 1981, Methane: An equation of state with application to the ternary system H2O-CO2-CH4: Geochimica et Cosmochimica Acta, v. 45, p. 607-614.
Lambert, I. B., Phillips, G. N., and Groves, D. I., 1984, Sulphur isotope compositions and genesis of Archaean gold mineralization, Australia and Zimbabwe, in Foster, R. P., ed., Gold '82: the Geology, Geochemistry and Genesis of Gold Deposits: Rotterdam, A.A. Balkema, p. 373-387.
Langsford, N., 1989, Stratigraphy of Locations 48 and 50, Kalgoorlie Gold Workshop, p. 6. McCuaig, T. C., and Kerrich, R., 1998, P-T-t-deformation-fluid characteristics of lode gold deposits:
evidence from alteration systematics: Ore Geology Reviews, v. 12, p. 381-453. McNaughton, N. J., Cassidy, K., Groves, D. I., and Perring, C. S., 1990, Timing of mineralization, in
Ho, S. E., Groves, D. I., and Bennett, J., eds., Gold Deposits of the Yilgarn Block Western Australia: Nature, Genesis and Exploration Guides: Perth, Department of Geology and University Extension, University of Western Australia Publication No. 20, p. 221-225.
Mikucki, E., and Groves, D. I., 1990, Nature of ore fluid, and transportational and depositional conditions in sub-amphibolite facies deposits: Mineralogical constraints, in Ho, S. E., Groves, D. I., and Bennett, J., eds., Gold deposits of the Archean Yilgarn block, Western Australia: Nature, genesis and exploration guides: Perth, Geology Department (Key Centre) and University Extension, the University of Western Australia, Publication No. 20, p. 212-220.
Mikucki, E., and Ridley, J., 1993, The hydrothermal fluid of Archaean lode-gold deposits at different metamorphic grades: compositional constraints from ore and wallrock alteration assemblages: Mineralium Deposita, v. 28, p. 469.
Mikucki, E. J., 1998, Hydrothermal transport and depositional processes in Archean lode-gold systems: A review: Ore Geology Reviews, v. 13, p. 307.
Mueller, A. G., 2007, Copper-gold endoskarns and high-Mg monzodiorite-tonalite intrusions at Mt. Shea, Kalgoorlie, Australia: implications for the origins of gold-pyrite-tennantite mineralization in the Golden Mile: Mineralium Deposita, v. 42, p. 737-769.
Mueller, A. G., Harris, L. B., and Lungan, A., 1988, Structural control of greenstone-hosted gold mineralization by transcurrent shearing: A new interpretation of the Kalgoorlie Mining District, Western Australia: Ore Geology Reviews, v. 3, p. 359-387.
Nelson, D. R., 1997, Evolution of the Archaean granite-greenstone terranes of the Eastern Goldfields, Western Australia: SHRIMP U-Pb zircon constraints: Precambrian Research, v. 83, p. 57-81.
Neumayr, P., and Hagemann, S. E., 2002, Hydrothermal fluid evolution within the Cadillac Tectonic Zone, Abitibi Greenstone Belt, Canada: Relationship to auriferous fluids in adjacent second- and third-order shear zones: Economic Geology, v. 97, p. 1203-1225.
Neumayr, P., Hagemann, S. E., Banks, D. A., Yardley, B. W. D., Couture, J. F., Landis, G. P., and Rye, R., 2007, Fluid Chemistry and Evolution of Hydrothermal Fluids in an Archaean Transcrustal Fault Zone Network: the Case of the Cadillac Tectonic Zone, Abitibi Greenstone Belt, Canada: Canadian Journal of Earth Sciences, v. 44, p. 745-773.

33
Neumayr, P., Hagemann, S. G., and Couture, J. F., 2000, Structural setting, textures, and timing of hydrothermal vein systems in the Val d'Or Camp, Abitibi, Canada; implications for the evolution of transcrustal, second- and third-order fault zones and gold mineralization: Canadian journal of earth sciences, v. 37, p. 95.
Nichols, S., 2003, Structural control, hydrothermal alteration and relative timing of gold mineralisation at the New Celebration gold deposits, Kalgoorlie, Western Australia: Unpub. BSc (Hons) thesis, University of Western Australia, 62 p.
Nichols, S. J., Hagemann, S. G., Neumayr, P., and Humphries, M., 2004, Structural control, hydrothermal alteration and relative timing of gold mineralisation at the Archaean New Celebration gold deposits, Kalgoorlie, Western Australia., in McPhie, J., and McGoldrick, P., eds., Dynamic Earth; past, present and future. Abstracts - Geological Society of Australia, p. 105.
Norris, N. D., 1990, New Celebration gold deposits, in Hughes, F. E., ed., Geology of the mineral deposits of Australia and Papua New Guinea, Melbourne, Monograph 14, Australasian Institute of Mining and Metallurgy, p. 449-454.
Olivo, G. R., Chang, F., and Kyser, T. K., 2006, Formation of the auriferous and barren North Dipper veins in the Sigma mine, Val d'Or, Canada: Constraints from structural, mineralogical, fluid inclusion and isotopic data: Economic Geology, v. 101, p. 607-631.
Palin, J. M., and Xu, Y., 2000, Gilt by Association? Origins of Pyritic Gold Ores in the Victory Mesothermal Gold Deposit, Western Australia: Economic Geology, v. 95, p. 1627-1634.
Passchier, C. W., 1994, Structural geology across a proposed terrane boundary in the eastern Yilgarn craton, Western Australia: Precambrian Research, v. 68, p. 43-64.
Passchier, C. W., and Trouw, R. A. J., 1996, Microtectonics, Springer. Phillips, G. N., Groves, D. I., Neall, F. B., Donnelly, T. H., and Lambert, I. B., 1986, Anomalous
sulfur isotope composition in the Golden Mile, Kalgoorlie: Economic Geology, v. 81, p. 2008-2015.
Pike, S., 1993, The chemistry of granite derived pegmatite fluids: Unpub. PhD thesis, University of Leeds, 244 p.
Potter, R. W., 1977, Pressure corrections for fluid inclusion homogenization temperatures based on the volumetric properties of the system H2O-NaCl: Journal of Research of the U.S Geological Survey, v. 5, p. 603-607.
Ramboz, C., Pichavant, M., and Weisbrod, A., 1982, Fluid immiscibility in natural processes: Use and misuse of fluid inclusion data II. Interpretation of fluid inclusion data in terms of immiscibility: Chemical Geology, v. 37, p. 29-48.
Ridley, J., and Mengler, F., 2000, Lithological and structural controls on the form and setting of vein stockwork orebodies at the Mount Charlotte gold deposit, Kalgoorlie: Economic Geology, v. 95, p. 85-98.
Ridley, J. R., and Diamond, L. W., 2000, Fluid chemistry of lode gold deposits, and implications for genetic models, in Hagemann, S. G., and Brown, P. E., eds., Gold in 2000, Reviews in Economic Geology, v. 13, p. 141-162.
Robert, F., 1989, Internal structure of the Cadillac tectonic zone southeast of Val d'or, Abitibi greenstone belt, Quebec: Canadian Journal of Earth Sciences, v. 26, p. 2661-2675.
Robert, F., 1990, An overview of gold deposits in the eastern Abitibi subprovince: Canadian Institute of Mining and Metallurgy Special Volume, v. 43, p. 93-105.
Robinson, B. W., and Kusakabe, M., 1975, Quantitative preparation of sulfur dioxide for 34S/32S analyses from sulfides by combustion with cuprous oxide: Analytical Chemistry, v. 47, p. 1179-1181.
Roedder, E., 1972, Compositions of fluid inclusions: US Geological Survey Professional Paper 440-JJ, p. 1-64.
Roedder, E., 1984, Fluid Inclusions, Mineralogical Society of America, 644 p.

34
Rusk, B. G., Reed, M. H., Dilles, J. H., Klemm, L. M., and Heinrich, C. A., 2004, Compositions of magmatic hydrothermal fluids determined by LA-ICP-MS of fluid inclusions from the porphyry copper-molybdenum deposit at Butte, MT: Chemical Geology, v. 210, p. 173-199.
Seward, T. M., 1973, Thio complexes of gold and the transport of gold in hydrothermal ore solutions: Geochimica et Cosmochimica Acta, v. 37, p. 379.
Seward, T. M., 1984, The transport and deposition of gold in hydrothermal systems, in Foster, R. P., ed., Gold '82: The Geology, Geochemistry and Genesis of Gold Deposits: Rotterdam, A.A. Balkema, p. 165-182.
Spear, F. S., 1995, Metamorphic phase equilibria and Pressure-Temperature-Time paths: Washington, Mineralogical Society of America, 799 p.
Swager, C., 1989, Structure of Kalgoorlie greenstones - regional deformation history and implications for the structural setting of the Golden Mile gold deposits, Geological Society of Western Australia Report 25, p. 59-84.
Swager, C., 1997, Tectono-stratigraphy of late Archaean greenstone terranes in the southern Eastern Goldfields, Western Australia: Precambrian Research, v. 83, p. 11-42.
Swager, C., and Griffin, T. J., 1990, Geology of the Archaean Kalgoorlie Terrane (northern and southern sheets), Western Australian Geological Survey, 1:250,000 Geological Map.
Swager, C., and Nelson, D. R., 1997, Extensional emplacement of a high-grade granite gneiss complex into low-grade greenstones, Eastern Goldfields, Yilgarn Craton, Western Australia: Precambrian Research, v. 83, p. 203-219.
Swanenberg, H. E. C., 1979, Phase equilibria in carbonic systems, and their application to freezing studies of fluid inclusions: Contributions to Mineralogy and Petrology, v. 68, p. 303-306.
Takenouchi, S., and Kennedy, G. C., 1965, The solubility of carbon dioxide in NaCl solutions at high temperatures and pressures: American Journal of Science, v. 263, p. 445-454.
Thiery, R., van den Kerkhof, A. M., and Dubessy, J., 1994, vX properties modeling of CH4-CO2 and CO2-N2 fluid inclusions (T<31°C, P<400 bar): European Journal of Mineralogy, v. 6, p. 753-771.
Uemoto, T., Ridley, J., Mikucki, E., Groves, D. I., and Kusakabe, M., 2002, Fluid Chemical Evolution as a Factor in Controlling the Distribution of Gold at the Archean Golden Crown Lode Gold Deposit, Murchison Province, Western Australia: Economic Geology, v. 97, p. 1227-1248.
Ulrich, T., Gunther, D., and Heinrich, C. A., 1999, Gold concentrations of magmatic brines and the metal budget of porphyry copper deposits: Nature, v. 399, p. 676.
Weinberg, R. F., Moresi, L., and van der Borgh, P., 2003, Timing of deformation in the Norseman-Wiluna Belt, Yilgarn Craton, Western Australia: Precambrian Research, v. 120, p. 219-239.
Weinberg, R. F., Van der Borgh, P., Bateman, R. J., and Groves, D. I., 2005, Kinematic History of the Boulder-Lefroy Shear Zone System and Controls on Associated Gold Mineralization, Yilgarn Craton, Western Australia: Economic Geology, v. 100, p. 1407-1426.
Wilkinson, L., Cruden, A. R., and Krogh, T. E., 1999, Timing and kinematics of post-Timiskaming deformation within the Larder Lake-Cadillac deformation zone, southwest Abitibi greenstone belt, Ontario, Canada: Canadian Journal of Earth Sciences, v. 36, p. 627-647.
Williams, H., 1994, The lithological setting and controls on gold mineralization in the Southern Ore Zone of the Hampton-Boulder gold deposit, New Celebration Gold Mine, Western Australia: Unpub. BSc (Hons) thesis, University of Western Australia.
Williams, P. R., and Currie, K. L., 1993, Character and regional implication of the sheared Archaean granite-greenstone contact near Leonora, Western Australia: Precambrian Research, v. 62, p. 343-365.
Witt, W. K., 1991, Regional metamorphic controls on alteration associated with gold mineralization in the Eastern Goldfields province, Western Australia: Implications for the timing and origin of Archean lode-gold deposits: Geology, v. 19, p. 982-985.

35
Witt, W. K., 1993, Gold deposits of the Kalgoorlie-Kambalda-St Ives area, Western Australia: Part 3 of a systematic study of the gold mines of the Menzies-Kambalda region, Geological Survey of Western Australia Record 1992/15, 108 p.
Wood, S. A., and Samson, I. M., 1998, Solubility of ore minerals and complexation of ore metals in hydrothermal solutions, in Richards, J. P., and Larson, P. B., eds., Techniques in hydrothermal ore deposits geology. Reviews in Economic Geology, Volume 10, Society of Economic Geology, p. 33-77.
Wopenka, B., and Pasteris, J. D., 1987, Raman intensities and detection limits of geochemically relevant gas mixtures for a laser Raman microprobe: Analytical Chemistry, v. 59, p. 2165-2170.
Yardley, B. W. D., 2005, Metal concentrations in crustal fluids and their relationship to ore formation: Economic Geology, v. 100, p. 613-632.
Yardley, B. W. D., Banks, D. A., Bottrell, S. H., and Diamond, L. W., 1993, Postmetamorphic gold-quartz veins from N.W. Italy: The composition and origin of the ore fluid: Mineralogical Magazine, v. 57, p. 407-422.


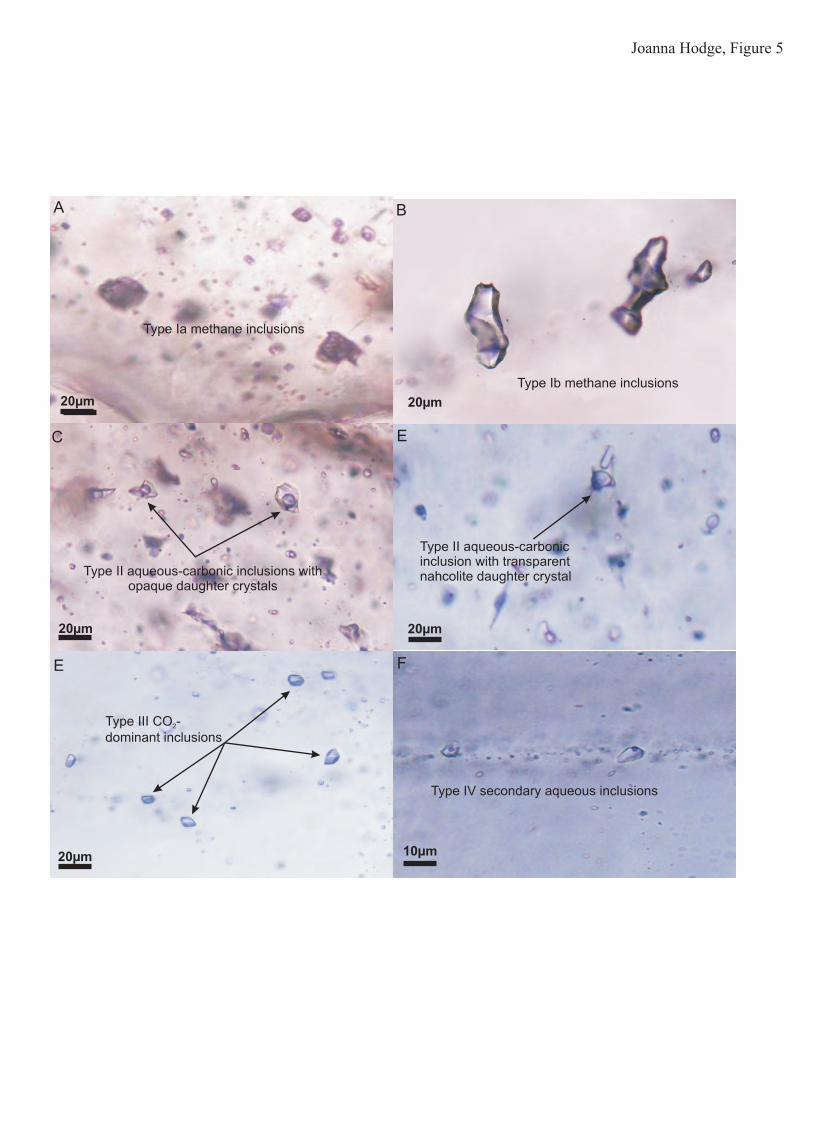


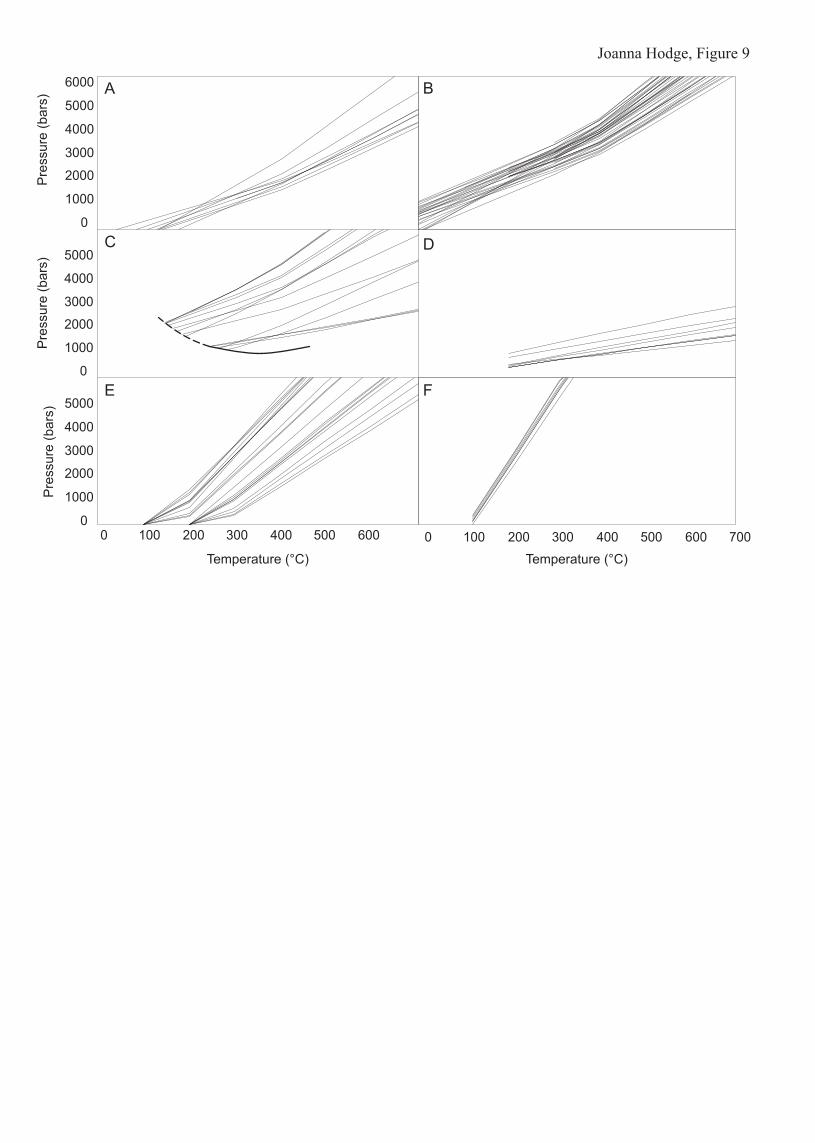


Vein Type
Deformation Event
Timing Mineralogy Structure Alteration Halo
1 D2NC Syn-D2NC Quartz, carbonate Deformed, boudinaged recrystallized veins parallel to D3NC
foliation
Ankerite?
2 D3NC Syn-D3NC Quartz, calcite, pyrite Thin veins, show mutually cross-cutting relationships with D3NC
foliation
Ankerite
3 D4NC Late D3NC or D4NC. Cross-cut D3NC
foliation
Quartz, (carbonate, sericite) Form brittle vein arrays None
4 D4NC Late D3NC or D4NC. Cross-cut D3NC
foliation
Sericite, pyrite Thin veinlets None
Joanna Hodge Table 1

Type I CH4
Type IIH2O-CO2-CH4-NaCl
Type IIICO2-CH4
Type IVH2O
Type 1
Primary & pseudosecondary TmCO2: -56.6ThCO2: 26.8 – 29.0 XCH4: 0 mole%CO2 Density: 0.60 – 0.72 g/cm3
Bulk Density: 0.60 – 0.72 g/cm4
Pseudosecondary H2O-NaCl TmICE: -9.3 - -5.0°CThTOT (L): 122 – 202°CSalinity: 7.8 – 13.2 wt%Bulk Density: 0.94 – 1.00 g/cm3
Calcite
Primary ThTOT (L): -76.4 – -73.0°C
Primary TmCO2: -56.8 – -56.7°CThCO2: 28.9 –- 30.8°CTmCLATH: 7.6 - 9.3°CThDECREP (V): 267.0 – 267.7°CThTOT (L): 268.5 – 270.7°CSalinity: 1.42 – 4.62 wt%XCO2: 8 – 27 mole%XCH4: 0 mole%CO2 Density: 0.40 – 0.60 g/cm3
Bulk Density: 0.73 – 0.86 g/cm3
Quartz
Secondary ThTOT (L): -90.3 – -89.8°C
XCH4: 95-100 mole%XN2: 0-3 mole%XC2H6: 0-1 mole%XC3H8: 0-1 mole%
Primary TmCO2: -61.8 – -56.6°CThCO2: 6.5 –- 25.8°CTmCLATH: 6.0 - 9.8°CThDECREP (V): 226 – 277°CThTOT (L): 328 – 352°CSalinity: 0.42 – 7.38 wt%XCO2: 5 – 73 mole%XCH4: 0 - 39 mole%CO2 Density: 0.49 – 0.87 g/cm3
Bulk Density: 0.76 – 0.97 g/cm3
Solids: opaques, nahcolite
Pseudosecondary H2O-NaClTmICE: -9.9 - -0.5°CThTOT (L): 174 – 272°CSalinity: 0.8 – 13.8 wt%Bulk Density: 0.76 – 0.94 g/cm3
Secondary H2O-NaCl-CaCl2TmICE: -14.8 - -14.7°CThTOT (L): Salinity: 18.4 – 18.5 wt%Bulk Density:
Qz-cc altn
Primary & pseudosecondary TmCO2: -57.8 – -56.6°CThCO2: 11.8 –- 30.8°CTmCLATH: 5.8 - 8.4°C ThDECREP (V): 186 – 364°CThTOT (L-V): 285 – 316°CSalinity: 3.15 – 7.70 wt%XCO2: 10 – 76 mole%XCH4: 0 – 3 mole%CO2 Density: 0.54 – 0.85 g/cm3
Bulk Density: 0.59 – 0.97 g/cm3
Pseudosecondary H2O-NaCl>>CO2
TmICE: -7.0 - -0.2°CThTOT (L): 89 - 117°CSalinity: 0.3 – 10.5 wt%Bulk Density: 0.96 – 0.99 g/cm3
Secondary H2O-NaCl-CaCl2TmICE: -22.9 - -15.4°CThTOT (L): Salinity: 18.7 – 23.2 wt%Bulk Density:
Pseudosecondary H2O-NaCl>>CO2TmICE: -5.8 - -1.1°CThTOT (L): 123 - 152°CSalinity: 1.8 – 8.9 wt%Bulk Density: 0.95 – 0.97 g/cm3
Type 3
Primary & pseudosecondary TmCO2: -58.1 – -56.6°CThCO2: 12.9 –- 30.5°CTmCLATH: 5.9 - 9.1°C ThDECREP (V): 247 – 291°CThTOT (L-V): 181 – 365°CSalinity: 1.81 – 7.54 wt%XCO2: 3 – 73 mole%XCH4: 0 – 3 mole%CO2 Density: 0.40 – 0.84 g/cm3
Bulk Density: 0.60 – 0.99 g/cm3
Primary & pseudosecondary TmCO2: -57.3 – -56.6ThCO2: 6.0 –- 30.8XCH4: 0 – 3 mole%CO2 Density: 0.53 – 0.89 g/cm3
Bulk Density: 0.45 – 0.89 g/cm4
Pseudosecondary TmICE: -9.0 - -0.3°CThTOT (L): 72 – 180°CSalinity: 1.2 – 15.0 wt%Bulk Density: 0.93 – 1.04 g/cm3
Secondary TmICE: -22.8 - -15.2°CThTOT (L): 55 – 118°CSalinity: 18.6 – 23.2 wt%Bulk Density: 1.09 – 1.17 g/cm3
Type 2
Joanna Hodge Table 2

Vein Type Inclusion Type
Salinity wt% NaCl
equivNa K Mg Ca Cu Pb Zn Sr Au Ag As Sb Bi Sn W Mo Ba U Th Cs Mn Fe K/Ca
Type 2 Aq-cb 4.01.5 5841 1581
8081147660
28121564
163105
31
7550
53
59
32
4329
2013
75
2011
54
64
1814
42
11
11
2811
230133 0.56
Qz-cc alteration Aq-cb 4.511.1 8365 3638
17453704519
574384
6653
3013
10687
5657
58 1 118
1493127
3029
2014
309197
65
5544
32
32
22
3928
584384 6.34
Aq-cb 4.931.1
90762486
57032695
20462436
1314961
224133
13788
179149
116
57
76
202156
6682
7268
3014
43
78
4436
11
32
21
3450
463384 4.34
Aq 5.93.7 23888 7098
26101091662
15275
10678
197122
5433
13 3
260187
3114
Qz-cc alteration Aq 21.01.9 63998 15127
1386725491655
363390
165138 9 30
213126
419406
Type 3 Aq 20.60.8 47714 30142
9464420147
52021299
16974
1910
4937
52
22
8644
83
1015
4733
42
147
62
11
6551
16257 5.79
Type 3
Joanna Hodge Table 3

Stage Style Sample No δ34S (‰)Analytical
Precision (‰) Method
1213279 -2.41 Bulk133543 -3.29 Bulk133552 -1.44 Bulk1213279 -4.14 0.006 LA1213279 -5.72 0.005 LA1213279 -6.26 0.018 LA1213279 -3.15 0.010 LA133542 -7.36 0.020 LA133542 -6.06 0.003 LA133542 -7.49 0.004 LA133542 -6.90 0.008 LA
1213226 2.03 Bulk1213226 3.77 0.220 LA1213226 0.57 0.011 LA1213226 1.50 0.003 LA1213226 2.19 0.019 LA133565 2.34 0.017 LA133565 0.58 0.009 LA
1213371 1.14 Bulk133555 -7.19 0.005 LA133555 -8.28 0.013 LA133555 -6.08 0.005 LA133555 -7.26 0.011 LA133555 -6.72 0.014 LA133555 -8.34 0.006 LA1250_12-018 -3.22 0.005 LA1250_12-018 -3.28 0.017 LA1250_12-018 -4.71 0.011 LA1213371 -3.89 0.007 LA
1149198 -2.90 Bulk1213359 -7.12 Bulk133540 -7.12 Bulk133541 -5.43 Bulk1213359 -10.61 0.031 LA1213359 -10.26 0.034 LA1213359 -9.39 0.010 LA1213359 -7.40 0.023 LA1213359 -8.55 0.007 LA1213359 -7.62 0.019 LA
Stag
e I
Stag
e II
Porp
hyry
Myl
onite
Con
tact
Frac
ture
Joanna Hodge Table 4

Figure Captions
FIG. 1. Boulder-Lefroy Fault Zone with the location of the New Celebration gold deposit and other
spatially correlated gold deposits (redrawn from Eisenlohr et al., 1989)
FIG. 2a. Geology of the New Celebration gold deposit illustrating ore zones (>2.6g/t Au), diamond drill
holes sampled in this study and strike and dip of S3NC foliations within the pit. Coordinates are in local
mine grid; north arrow indicates true north. Modified from Nichols, 2003. Abbreviations; cl = chlorite; tl =
talc; cb = carbonate.
FIG. 2b. East-West cross section of the southern portion of the Hampton Boulder Jubilee deposit. The M1
plagioclase-rich porphyries form thin, ribbon-like bodies confined to the ultramafic footwall whereas
boudinaged M2 quartz-feldspar porphyry has intruded throughout the mafic-ultramafic contact, hangingwall
and footwall. Modified from Nichols, 2003
FIG. 3. Photographs and photomicrographs of illustrating the structural and timing relationships of Stage I
and Stage II gold mineralization. A. Mylonite-style mineralization. Quartz-ankerite and biotite-sericite
alteration defining S3NC foliation with syn-S3NC gold-hosting pyrite. B. Porphyry-style mineralization. Ore-
stage pyrite in syn-S3NC biotite. C. Contact-style mineralization. Coarse-grained euhedral ore-stage pyrite
overprinting S3NC foliation. D. Fracture-style mineralization. Coarse-grained pyrite in sericite veinlets
within M2 porphyry.
FIG. 4. Photographs of dominant vein types. A. Type 1 foliation-parallel quartz±calcite veins. B. Type 2
zoned quartz-calcite veins showing mutually cross-cutting relationship with S3NC foliation defined by
biotite. C. Type 3 coarse-grained quartz veins cross-cutting contact between M2 quartz-felspar porphyry
and high Mg basalt. D. Thin sericite-pyrite veins in M2 quartz-feldspar porphyry.

FIG. 5. Fluid inclusion photomicrographs from representative samples at New Celebration. A. Primary
clusters of negative crystal shaped methane fluid inclusions in calcite from type 2 quartz-calcite veins. B.
Secondary trail of irregularly shaped, single phase (at room temperature) methane inclusions in quartz from
type 2 quartz-calcite vein. C. Primary cluster of type II aqueous-carbonic inclusions in quartz from type 2
veins. Two inclusions contain a tiny rounded or triangular opaque daughter crystal. D. Transparent
nahcolite (NaHCO3) daughter crystal in primary type II aqueous-carbonic inclusions in quartz from type 2
vein. E. Type III CO2-dominant inclusion from quartz-calcite alteration associated with contact-style
mineralization. F. Secondary trail of type IV high salinity aqueous fluid inclusions in quartz from type 3
vein.
FIG 6: A. CO2 melting temperature (Tm CO2) versus CO2 homogenization temperature (Th CO2 (L)) of type
II aqueous inclusions in calcite from type 2 veins, in quartz from type 2 veins, in quartz-calcite alteration
and in quartz from type 3 veins. Inclusions in quartz from Stage I-related type 2 veins display a much wider
spread of values than those in quartz-calcite alteration and quartz from type 3 veins associated with Stage II
gold mineralization. While all fluids are relatively low in CH4, Stage II fluids contain significantly less CH4
than Stage II and have a higher density. After Neumayr and Hagemann (2002). Histograms of ThCO2 and
TmCO2 in B. type II aqueous-carbonic inclusions in calcite from type 2 veins; C. type II aqueous-carbonic
inclusions in quartz from type 2 veins; D. type II aqueous-carbonic inclusions in quartz-calcite alteration
(grey) and type 3 veins (white); E. type III carbonic inclusions from quartz in type 1 veins (hatch), quartz-
calcite alteration (grey) and type 3 veins (white).
FIG. 7. Histograms of TmCLATH or TmICE for A) primary type II aqueous-carbonic inclusions in calcite from
type 2 veins; B) primary and pseudo-secondary type II aqueous-carbonic inclusions in quartz from type 2
veins; C) type II aqueous-carbonic inclusions in quartz-calcite alteration (grey) and type 3 veins (white); D)
type IV aqueous inclusions with trace CO2 in quartz-calcite alteration (grey) and type 3 veins (white); E)
type IV low salinity aqueous inclusions without CO2 in type 1 veins (hatch), quartz in type 2 veins (black)
and type 3 veins (white); and F) secondary type IV high salinity aqueous inclusion from quartz in type 2
veins (black), quartz-calcite alteration (grey) and type 3 veins (white).
Fig. 8. Liquid- and vapor-rich end members type II aqueous-carbonic inclusions in quartz-calcite alteration
associated with fracture-style mineralization indicating phase separation.
FIG. 9. Isochors from A. type II aqueous-carbonic inclusions in calcite from type 2 veins; B. type II
aqueous-carbonic inclusions in quartz from type 2 veins associated with Stage I gold mineralization; C.
type II aqueous-carbonic inclusions in quartz-calcite alteration and type 3 veins associated with Stage II
gold mineralization; D. type III carbonic inclusions in types 1 and 3 veins, and quartz-calcite alteration; E.
type IV low salinity aqueous inclusions from types 1, 2 and 3 veins and F. type IV salinity aqueous
inclusions from types 2 and 3 veins and quartz-calcite alteration.
FIG. 10. Pressure-temperature diagram illustrating the P-T conditions of formation of different fluid
inclusion types in various vein types, the P-T path through time, the likely pressure constraints imposed by
peak metamorphism (from Spears, 1995) and the independent P-T estimate of Williams (1994) for
Southern Ore Zone mineralization at New Celebration derived from the chlorite solid-solution
geothermometer and phengite geobarometer. Interpretation of the P-T conditions recorded by the different
fluid inclusion assemblages indicate a protracted and complex fluid and tectonic history for the BLFZ.
Early fluids were emplaced in the fault at or around peak metamorphism; Stage I gold mineralization
occurred post-peak metamorphism at high temperatures and pressures. Stage II mineralization occurred
during a period of waning temperature and fluctuating pressure, possibly induced by fault valve behavior.
Late fluid assemblages (highly saline aqueous fluids, and methane-dominated fluids) were emplaced during
a period of low temperature and pressure, likely during uplift and erosion of the orogen.
FIG. 11. Total range of δ34S values from ore-related pyrite from all mineralization styles at New
Celebration (this study, Hodkiewicz, 2003) and potential sulfur sources. Vertical dashes = mean. The gray
shaded area corresponds to average δ34S values of pyrite from other Yilgarn gold deposits (summarized by
Hodkiewicz, 2003). Values for I-type granite from Ohmoto (1986), Yilgarn crust from Lambert et al.
(1984) and Archean seawater from Ohmoto and Goldhaber (1997).

FIG. 12. Hydrothermal fluid flow model for the Boulder Lefroy Fault Zone (BLFZ) at New Celebration. A.
During early D3NC ENE-WSW shortening, M1 plagioclase porphyry is emplaced into the BLFZ and
undergoes hydrothermal magnetite alteration. Methane dominated fluids of possible deep crustal or mantle
origin circulate through the fault zone. B. Stage I gold mineralization occurred at or around peak
metamorphism by wall rock sulfidation of magnetite (i) in M1 porphyries from CO2 dominated fluids of
likely metamorphic origin. C. M2 quartz-feldspar porphyries were emplaced in the BLFZ. Stage II gold
mineralization occurred due to a combination of fault-valve induced phase separation of CO2-bearing
magmatic fluids and sulfidation of iron oxides at the contact between high-magnesium basalt and M2
porphyry; D. The fault experienced a period of uplift and erosion during which highly saline fluids
potentially of magmatic origin were emplaced and the fault returned to steady state with long-lived
methane-rich fluids again dominating.
Table Captions
Table 1. Summary table of main vein type characteristics, deformation, structure and timing.
Table 2. Summary of fluid inclusion microthermometric and laser Raman data from types 1, 2 and 3 veins
and quartz-calcite alteration at New Celebration
Table 3. Average composition of fluid inclusions from different vein types at New Celebration. All
elemental concentrations are ppm. Numbers in italics are 1 standard deviation.
Table 4. Sulfur isotopic composition of pyrites from New Celebration Stage I and Stage II gold
mineralization samples.
APPENDICES
272
APPENDIX 2 Sample Data
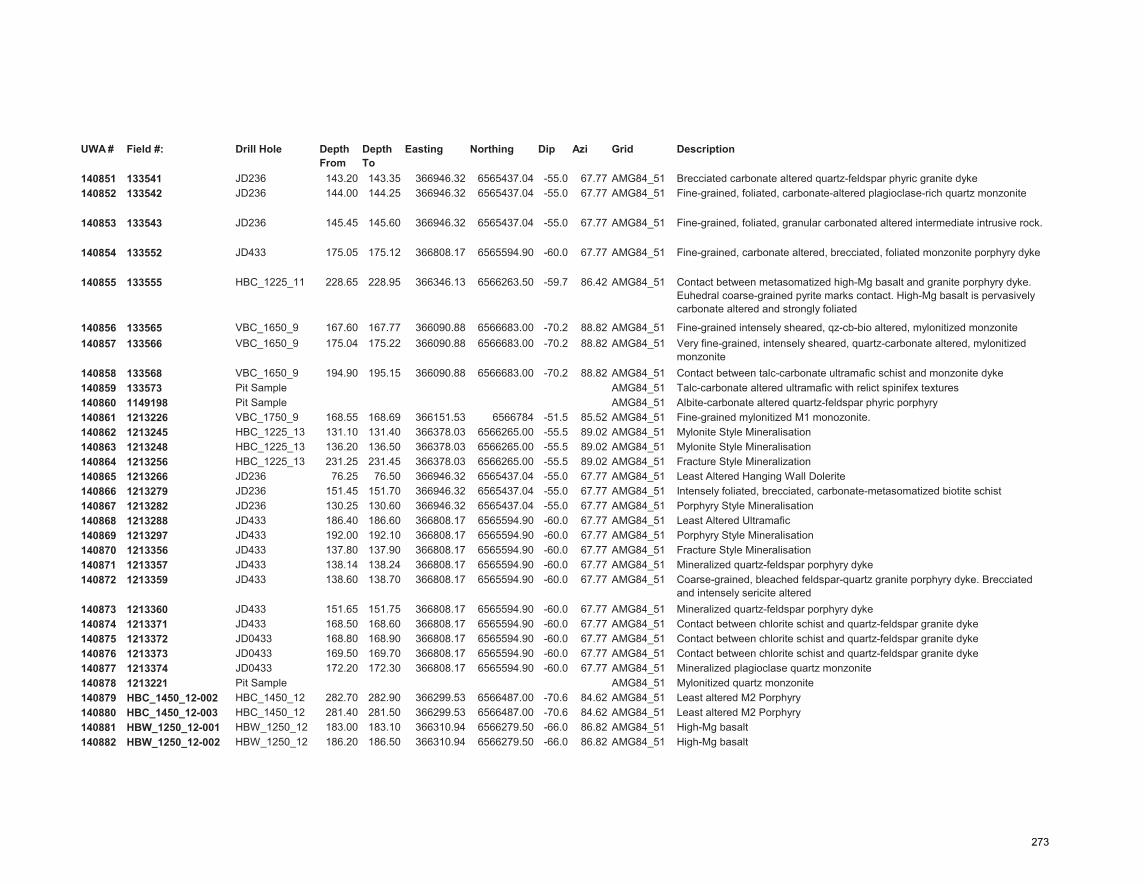
UWA # Field #: Drill Hole Depth From
Depth To
Easting Northing Dip Azi Grid Description
140851 133541 JD236 143.20 143.35 366946.32 6565437.04 -55.0 67.77 AMG84_51 Brecciated carbonate altered quartz-feldspar phyric granite dyke140852 133542 JD236 144.00 144.25 366946.32 6565437.04 -55.0 67.77 AMG84_51 Fine-grained, foliated, carbonate-altered plagioclase-rich quartz monzonite
140853 133543 JD236 145.45 145.60 366946.32 6565437.04 -55.0 67.77 AMG84_51 Fine-grained, foliated, granular carbonated altered intermediate intrusive rock.
140854 133552 JD433 175.05 175.12 366808.17 6565594.90 -60.0 67.77 AMG84_51 Fine-grained, carbonate altered, brecciated, foliated monzonite porphyry dyke
140855 133555 HBC_1225_11 228.65 228.95 366346.13 6566263.50 -59.7 86.42 AMG84_51 Contact between metasomatized high-Mg basalt and granite porphyry dyke. Euhedral coarse-grained pyrite marks contact. High-Mg basalt is pervasively carbonate altered and strongly foliated
140856 133565 VBC_1650_9 167.60 167.77 366090.88 6566683.00 -70.2 88.82 AMG84_51 Fine-grained intensely sheared, qz-cb-bio altered, mylonitized monzonite 140857 133566 VBC_1650_9 175.04 175.22 366090.88 6566683.00 -70.2 88.82 AMG84_51 Very fine-grained, intensely sheared, quartz-carbonate altered, mylonitized
monzonite140858 133568 VBC_1650_9 194.90 195.15 366090.88 6566683.00 -70.2 88.82 AMG84_51 Contact between talc-carbonate ultramafic schist and monzonite dyke140859 133573 Pit Sample AMG84_51 Talc-carbonate altered ultramafic with relict spinifex textures140860 1149198 Pit Sample AMG84_51 Albite-carbonate altered quartz-feldspar phyric porphyry140861 1213226 VBC_1750_9 168.55 168.69 366151.53 6566784 -51.5 85.52 AMG84_51 Fine-grained mylonitized M1 monozonite. 140862 1213245 HBC_1225_13 131.10 131.40 366378.03 6566265.00 -55.5 89.02 AMG84_51 Mylonite Style Mineralisation140863 1213248 HBC_1225_13 136.20 136.50 366378.03 6566265.00 -55.5 89.02 AMG84_51 Mylonite Style Mineralisation140864 1213256 HBC_1225_13 231.25 231.45 366378.03 6566265.00 -55.5 89.02 AMG84_51 Fracture Style Mineralization140865 1213266 JD236 76.25 76.50 366946.32 6565437.04 -55.0 67.77 AMG84_51 Least Altered Hanging Wall Dolerite140866 1213279 JD236 151.45 151.70 366946.32 6565437.04 -55.0 67.77 AMG84_51 Intensely foliated, brecciated, carbonate-metasomatized biotite schist140867 1213282 JD236 130.25 130.60 366946.32 6565437.04 -55.0 67.77 AMG84_51 Porphyry Style Mineralisation140868 1213288 JD433 186.40 186.60 366808.17 6565594.90 -60.0 67.77 AMG84_51 Least Altered Ultramafic140869 1213297 JD433 192.00 192.10 366808.17 6565594.90 -60.0 67.77 AMG84_51 Porphyry Style Mineralisation140870 1213356 JD433 137.80 137.90 366808.17 6565594.90 -60.0 67.77 AMG84_51 Fracture Style Mineralisation140871 1213357 JD433 138.14 138.24 366808.17 6565594.90 -60.0 67.77 AMG84_51 Mineralized quartz-feldspar porphyry dyke140872 1213359 JD433 138.60 138.70 366808.17 6565594.90 -60.0 67.77 AMG84_51 Coarse-grained, bleached feldspar-quartz granite porphyry dyke. Brecciated
and intensely sericite altered140873 1213360 JD433 151.65 151.75 366808.17 6565594.90 -60.0 67.77 AMG84_51 Mineralized quartz-feldspar porphyry dyke140874 1213371 JD433 168.50 168.60 366808.17 6565594.90 -60.0 67.77 AMG84_51 Contact between chlorite schist and quartz-feldspar granite dyke140875 1213372 JD0433 168.80 168.90 366808.17 6565594.90 -60.0 67.77 AMG84_51 Contact between chlorite schist and quartz-feldspar granite dyke140876 1213373 JD0433 169.50 169.70 366808.17 6565594.90 -60.0 67.77 AMG84_51 Contact between chlorite schist and quartz-feldspar granite dyke140877 1213374 JD0433 172.20 172.30 366808.17 6565594.90 -60.0 67.77 AMG84_51 Mineralized plagioclase quartz monzonite140878 1213221 Pit Sample AMG84_51 Mylonitized quartz monzonite140879 HBC_1450_12-002 HBC_1450_12 282.70 282.90 366299.53 6566487.00 -70.6 84.62 AMG84_51 Least altered M2 Porphyry140880 HBC_1450_12-003 HBC_1450_12 281.40 281.50 366299.53 6566487.00 -70.6 84.62 AMG84_51 Least altered M2 Porphyry140881 HBW_1250_12-001 HBW_1250_12 183.00 183.10 366310.94 6566279.50 -66.0 86.82 AMG84_51 High-Mg basalt140882 HBW_1250_12-002 HBW_1250_12 186.20 186.50 366310.94 6566279.50 -66.0 86.82 AMG84_51 High-Mg basalt
273
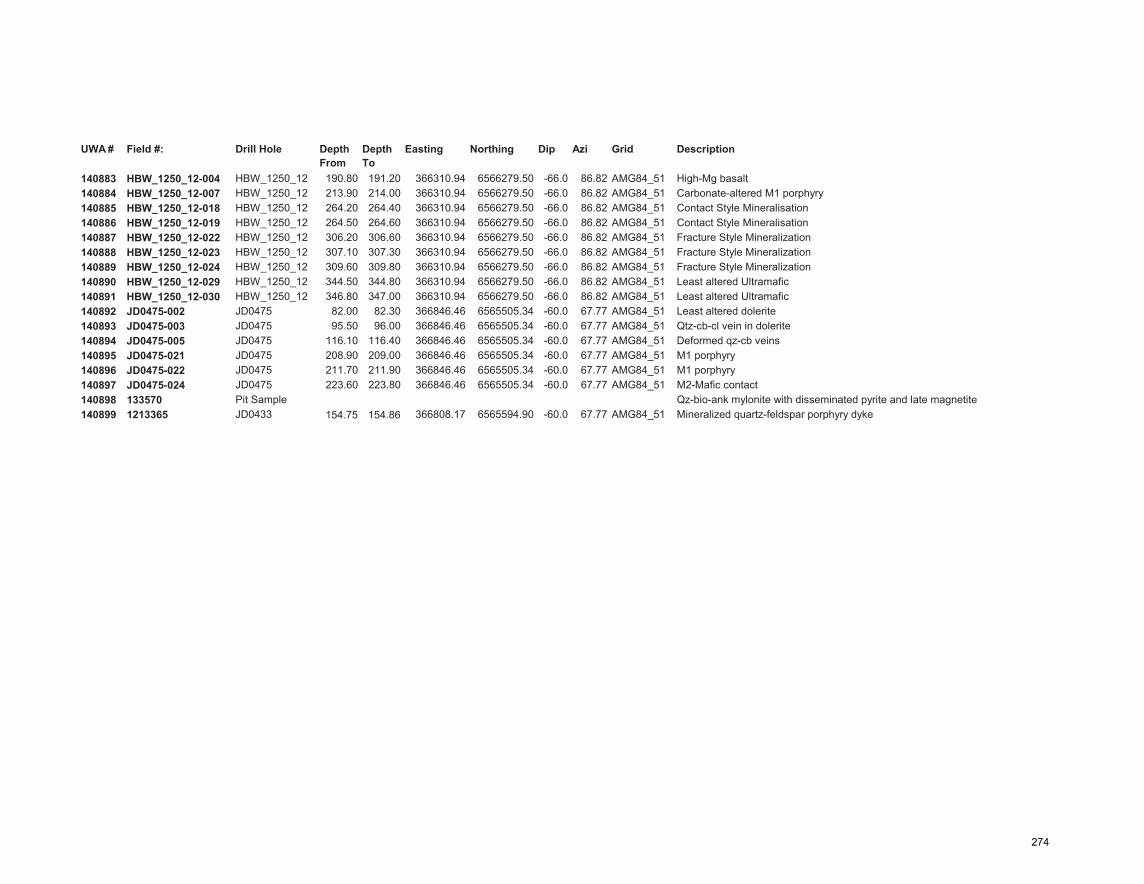
UWA # Field #: Drill Hole Depth From
Depth To
Easting Northing Dip Azi Grid Description
140883 HBW_1250_12-004 HBW_1250_12 190.80 191.20 366310.94 6566279.50 -66.0 86.82 AMG84_51 High-Mg basalt 140884 HBW_1250_12-007 HBW_1250_12 213.90 214.00 366310.94 6566279.50 -66.0 86.82 AMG84_51 Carbonate-altered M1 porphyry140885 HBW_1250_12-018 HBW_1250_12 264.20 264.40 366310.94 6566279.50 -66.0 86.82 AMG84_51 Contact Style Mineralisation140886 HBW_1250_12-019 HBW_1250_12 264.50 264.60 366310.94 6566279.50 -66.0 86.82 AMG84_51 Contact Style Mineralisation140887 HBW_1250_12-022 HBW_1250_12 306.20 306.60 366310.94 6566279.50 -66.0 86.82 AMG84_51 Fracture Style Mineralization140888 HBW_1250_12-023 HBW_1250_12 307.10 307.30 366310.94 6566279.50 -66.0 86.82 AMG84_51 Fracture Style Mineralization140889 HBW_1250_12-024 HBW_1250_12 309.60 309.80 366310.94 6566279.50 -66.0 86.82 AMG84_51 Fracture Style Mineralization140890 HBW_1250_12-029 HBW_1250_12 344.50 344.80 366310.94 6566279.50 -66.0 86.82 AMG84_51 Least altered Ultramafic140891 HBW_1250_12-030 HBW_1250_12 346.80 347.00 366310.94 6566279.50 -66.0 86.82 AMG84_51 Least altered Ultramafic140892 JD0475-002 JD0475 82.00 82.30 366846.46 6565505.34 -60.0 67.77 AMG84_51 Least altered dolerite140893 JD0475-003 JD0475 95.50 96.00 366846.46 6565505.34 -60.0 67.77 AMG84_51 Qtz-cb-cl vein in dolerite140894 JD0475-005 JD0475 116.10 116.40 366846.46 6565505.34 -60.0 67.77 AMG84_51 Deformed qz-cb veins140895 JD0475-021 JD0475 208.90 209.00 366846.46 6565505.34 -60.0 67.77 AMG84_51 M1 porphyry140896 JD0475-022 JD0475 211.70 211.90 366846.46 6565505.34 -60.0 67.77 AMG84_51 M1 porphyry140897 JD0475-024 JD0475 223.60 223.80 366846.46 6565505.34 -60.0 67.77 AMG84_51 M2-Mafic contact140898 133570 Pit Sample Qz-bio-ank mylonite with disseminated pyrite and late magnetite140899 1213365 JD0433 154.75 154.86 366808.17 6565594.90 -60.0 67.77 AMG84_51 Mineralized quartz-feldspar porphyry dyke
274

APPENDICES
275
APPENDIX 3 Petrographic Descriptions

133541 UWA Number: 140851Drill Hole ID: JD236 Depth: 143.20-143.35
% Mineral Description60 qz
35 plg
3 cb
1 py
1 bio
tr sl
tr gl
% Mineral Description90 qz10 cb
qz veinscb altnpyritebio
Sketches & Photographs
fine elongate tabular grains defining very weak foliation.fine-grained anhedral grains occurring as inclusions in pyrite. Some show chalcopyrite disease. Yellow internal reflections- Fe-poor
Sample No:
Description:
coarse-grained (20-50µm) anhedral carbonate grains forming patches in the groundmasscoarse-grained (50-100µm) subhedral pyrite grains occupying sericite-chlorite filled fractures cross-cutting quartz veins
Brecciated carbonate altered quartz-feldspar phyric granite dyke
fine-grained anhedral recrystallized interlocking quartz forming large (20-30µm) euhedral plagioclase phenocrysts altered (saussuritised) to sericite-carbonate
Host Rock Mineralogy:
rare rounded galena blebs occurring as inclusions hosted within pyrite.
fine-grained to coarse-grained polycrystalline quartz forming coarse-grained anhedral patches intergrown with quartz
Pyrite grains are dirty, inclusion rich and form aggregates developing in fractures occupied by sercite±chlorite. No gold observed in this sample. Silicates, sphalerite, galena form inclusions within pyrite
Vein Mineralogy:
Paragenesis:
Comments:
276

133542 UWA Number: 140852Drill Hole ID: JD236 Depth: 144.00-144.25
% Mineral Description60 plg12 cb
15 bio
10 qz
2 py
tr sl
tr cpy
tr Au
% Mineral Description60 qz
40 cb
Sketches & Photographs
Rare anhedral sphalerite grains, disseminated although sometimes occurring with pyrite
Coarse-grained anhedral carbonate predominantly occurring qz-cb veins S3NC (bio+py+slf) later qz±cb veins
S3NC foliation defined by aligned biotite laths. Plagioclase show partial alignment with foliation. Pyrite intimately associated with biotite - syn D3NC
Comments:
Rare tiny anhedral grains, disseminated, possibly associated with Au
Sample No:
Description: Fine-grained, foliated, carbonate-altered plagioclase-rich quartz monzonite
Host Rock Mineralogy:
Coarse-grained euhedral (cubic) to subhedral grains, often with inclusions. Possibly zoned. Grains are typically enclosed within biotite bands or have biotite crystals growing parallel to grain boundaries synchronous with foliation
Fine-grained euhedral plagioclase laths form bulk of rock. Fine-grained anhedral carbonate forming masses which overprint fabric - lateEuhedral elongate crystal forming bands and defining foliation planes. Grains wrap around pyrite grains and also along edges of early quartz-carbonate veins.Minor anhedral quartz, medium grained, interlocking. Form patches which may be relict veins or recrystallized quartz alteration.
Paragenesis:
Vein Mineralogy:
Very tiny grain adjacent to chalcopyrite crystal
Coarse-grained anhedral polycrystalline qz veins. Occur sub-parallel/oblique to foliation but are edged by aligned biotite grains. Possibly two quartz vein stages - early qz-cb, later
277

133543 UWA Number: 140853Drill Hole ID: JD236 Depth: 145.45-145.60
% Mineral Description50 plg30 cb
3 bio
7 py
10 qz
tr sl
tr Au
% Mineral Description99 qz1 cb
Sketches & Photographs
Sample No:
Description: Fine-grained, foliated, granular carbonated altered intermediate intrusive rock.
Host Rock Mineralogy:
Fine-grained, euhedral tablar crystals, partially aligned with Fine-grained subhedral intergranular carbonate. Also occurs defining foliation planesFine-grained elongate platy crystals partially developing bands foliation. Borders quartz veins. Bimodal pyrite distribution. Fine-grained euhedral intergranular pyrite and coarse-grained subhedral pyrite associated with biotite bands. Some pyrite zoned with dirty inclusion-rich cores and clean inclusion-free rimsFine-grained granular quartz, possibly relict veins. Occur approximately parallel to foliationTiny anhedral sphalerite grains disseminatd through matrix and also occurring as inclusions within pyriteSmall grain hosted within pyrite on edge of silicate inclusion
Paragenesis:
Comments:
Vein Mineralogy:
early qz veins S3 (bio-qz-cb-py)
Anhedral, granular interlocking quartzSmall, anhedral, intergranular
Foliation defined by partial alignment of feldspar and byn qz-cb-bio-py bands. Possible early quartz veins. Bimodal pyrite distribution - two separate events. Large pyrite hosting Au zoned.
278
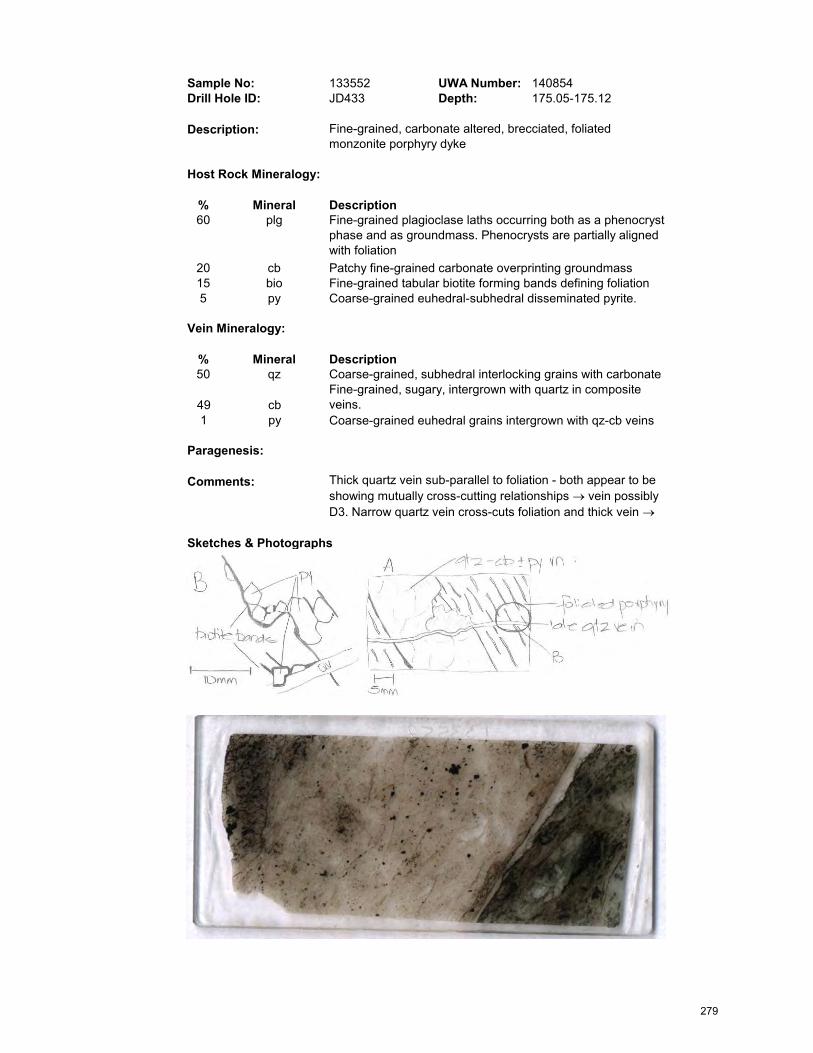
133552 UWA Number: 140854Drill Hole ID: JD433 Depth: 175.05-175.12
% Mineral Description60 plg
20 cb15 bio5 py
% Mineral Description50 qz
49 cb1 py
Sketches & Photographs
Comments: Thick quartz vein sub-parallel to foliation - both appear to be showing mutually cross-cutting relationships vein possibly D3. Narrow quartz vein cross-cuts foliation and thick vein
Sample No:
Description: Fine-grained, carbonate altered, brecciated, foliated monzonite porphyry dyke
Host Rock Mineralogy:
Patchy fine-grained carbonate overprinting groundmassFine-grained tabular biotite forming bands defining foliation
Fine-grained plagioclase laths occurring both as a phenocryst phase and as groundmass. Phenocrysts are partially aligned with foliation
Coarse-grained euhedral-subhedral disseminated pyrite.
Paragenesis:
Coarse-grained, subhedral interlocking grains with carbonate Fine-grained, sugary, intergrown with quartz in composite veins.
Vein Mineralogy:
Coarse-grained euhedral grains intergrown with qz-cb veins
279
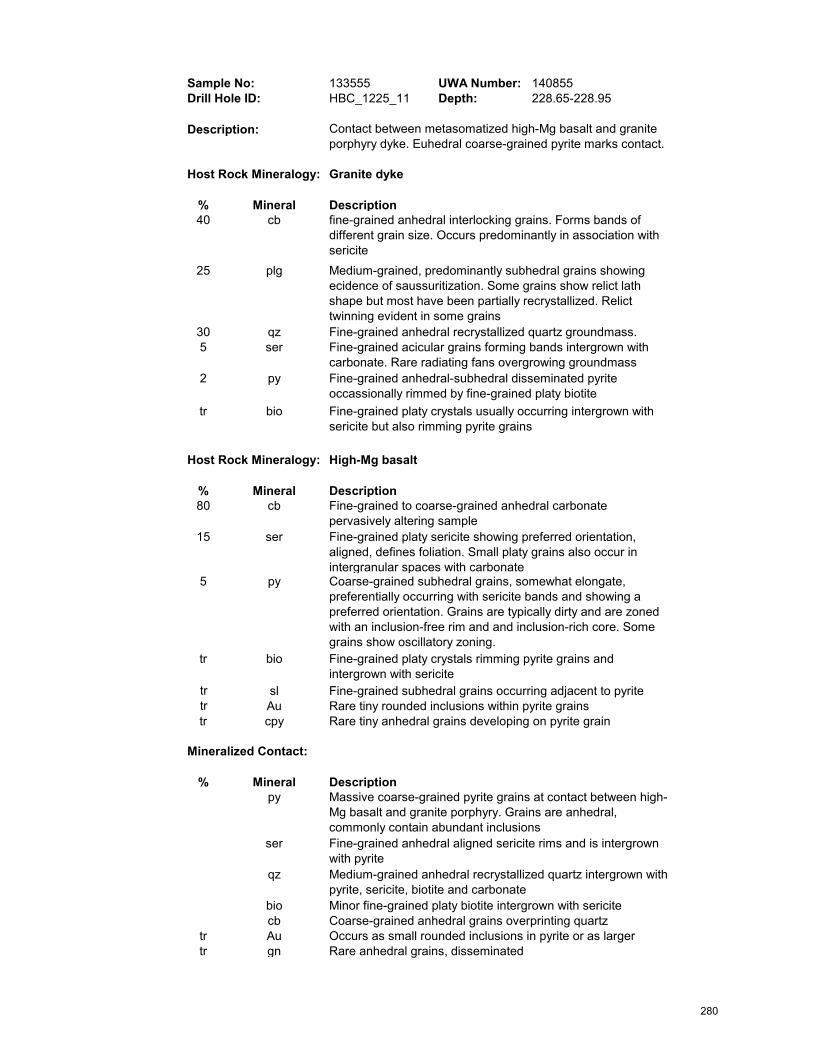
133555 UWA Number: 140855Drill Hole ID: HBC_1225_11 Depth: 228.65-228.95
Granite dyke
% Mineral Description40 cb
25 plg
30 qz5 ser
2 py
tr bio
High-Mg basalt
% Mineral Description80 cb
15 ser
5 py
tr bio
tr sltr Autr cpy
% Mineral Descriptionpy
ser
qz
biocb
tr Autr gn
Coarse-grained subhedral grains, somewhat elongate, preferentially occurring with sericite bands and showing a preferred orientation. Grains are typically dirty and are zoned with an inclusion-free rim and and inclusion-rich core. Some grains show oscillatory zoning.Fine-grained platy crystals rimming pyrite grains and intergrown with sericite
Contact between metasomatized high-Mg basalt and granite porphyry dyke. Euhedral coarse-grained pyrite marks contact.
fine-grained anhedral interlocking grains. Forms bands of different grain size. Occurs predominantly in association with sericite
Massive coarse-grained pyrite grains at contact between high-Mg basalt and granite porphyry. Grains are anhedral, commonly contain abundant inclusions
Medium-grained, predominantly subhedral grains showing ecidence of saussuritization. Some grains show relict lath shape but most have been partially recrystallized. Relict twinning evident in some grainsFine-grained anhedral recrystallized quartz groundmass.Fine-grained acicular grains forming bands intergrown with carbonate. Rare radiating fans overgrowing groundmassFine-grained anhedral-subhedral disseminated pyrite occassionally rimmed by fine-grained platy biotiteFine-grained platy crystals usually occurring intergrown with sericite but also rimming pyrite grains
Fine-grained to coarse-grained anhedral carbonate pervasively altering sample
Sample No:
Description:
Host Rock Mineralogy:
Host Rock Mineralogy:
Fine-grained platy sericite showing preferred orientation, aligned, defines foliation. Small platy grains also occur in intergranular spaces with carbonate
Fine-grained subhedral grains occurring adjacent to pyriteRare tiny rounded inclusions within pyrite grains
Mineralized Contact:
Rare tiny anhedral grains developing on pyrite grain
Occurs as small rounded inclusions in pyrite or as larger Rare anhedral grains, disseminated
Medium-grained anhedral recrystallized quartz intergrown with pyrite, sericite, biotite and carbonateMinor fine-grained platy biotite intergrown with sericiteCoarse-grained anhedral grains overprinting quartz
Fine-grained anhedral aligned sericite rims and is intergrown with pyrite
280
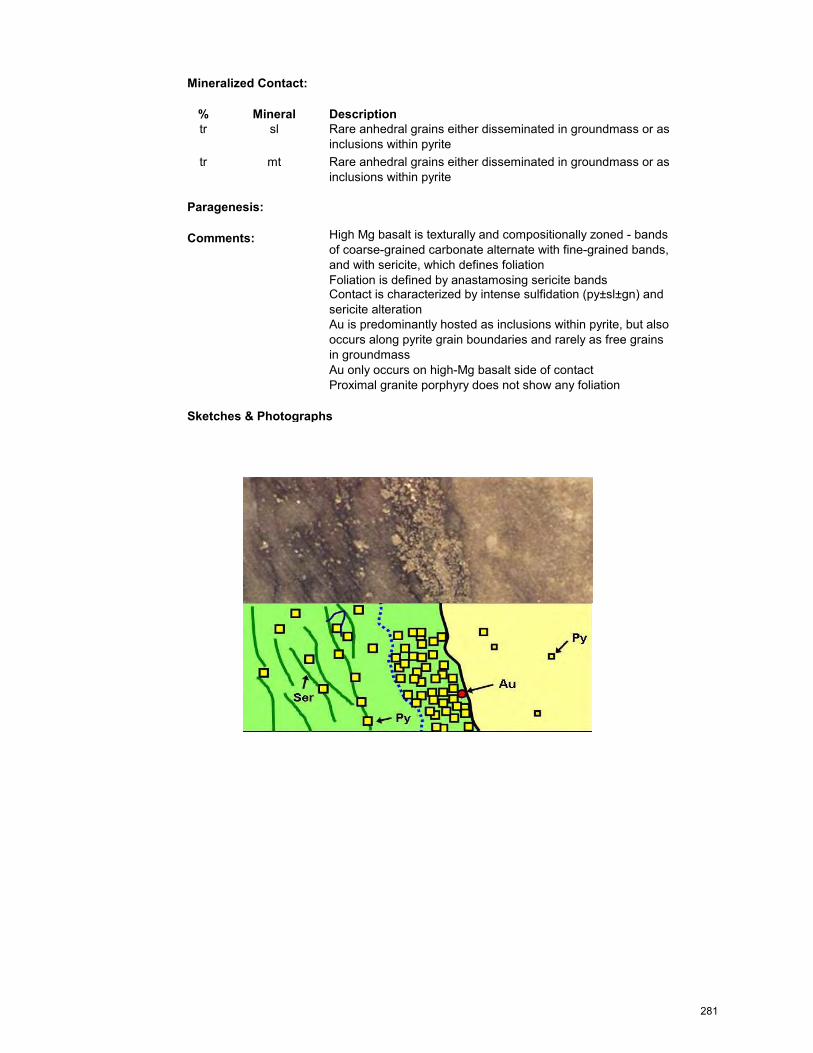
% Mineral Descriptiontr sl
tr mt
Sketches & Photographs
Mineralized Contact:
High Mg basalt is texturally and compositionally zoned - bands of coarse-grained carbonate alternate with fine-grained bands, and with sericite, which defines foliationFoliation is defined by anastamosing sericite bandsContact is characterized by intense sulfidation (py±sl±gn) and sericite alteration
Au only occurs on high-Mg basalt side of contactProximal granite porphyry does not show any foliation
Au is predominantly hosted as inclusions within pyrite, but also occurs along pyrite grain boundaries and rarely as free grains in groundmass
Paragenesis:
Comments:
Rare anhedral grains either disseminated in groundmass or as inclusions within pyriteRare anhedral grains either disseminated in groundmass or as inclusions within pyrite
281

133565 UWA Number: 140856Drill Hole ID: VBC_1650_9 Depth: 167.60-167.77
% Mineral Description35 qz
35 cb
20 bio
7 mt
3 py
% Mineral Description8020
qzcb
Magnetite syn-D3NC
Sketches & Photographs
Sample No:
Description: Fine-grained intensely sheared, qz-cb-bio altered, mylonitized monzonite
Fine-grained subhedral to euhedral carbonate forms groundmass with interlocking quartz grains. Larger subhedral grains occur in quartz-carbonate "boudins"
Host Rock Mineralogy:
Fine-grained anhedral recrystallised quartz comprises groundmass. Minor larger interlocking quartz grains form foliation-parallel "boudins" with coarse-grained carbonate possibly relict early veins
Fine-grained to medium-grained prismatic crystals forming bands and defining foliationFine- to medium-grained. Occurring with biotite along foliation planes. Commonly replaced by pyrite
Paragenesis:
Fine-grained to medium-grained anhedral to subhedral pyrite developed with biotite along foliation planes. Replacing magnetite
Wide (5mm) clear quartz carbonate veins obliquely cross-cutting foliation. Grains are coarse and interlocking. Vein shows minor displacement of foliation planes suggesting that formation was contemporaneous with D3NC
Comments:
Vein Mineralogy:
Foliation parallel quartz-carbonate boudin veins possibly pre-D3NC
282

Sketches & Photographs
283
133566 UWA Number: 140857Drill Hole ID: VBC_1650_009 Depth: 175.04-175.22
% Mineral Description30 qz
25 bio
40 cb
3 cl
2 mt
tr py
% Mineral Description80 qz17 cb3 cl
At least two pyrite populations in this sample. Fine-grained sub-euhedral pyrite occurs disseminated in groundmass approximately conformable with foliation ie. syn-D3NC. Coarse-grained euhedral pyrite overprints foliation (post D3NC).
Large euhedral-subhedral dirty grains with numerous inclusions including magnetite, pyrrhotite and chalcopyrite
Fine-grained, elongate, euhedral prismatic biotite delineating foliation planesFine-grained sub-euhedral prismatic grains intergrown with quartz and forming groundmass. Grains show some alignment with foliationRare anhedral-subhedral elongate grains (10-20µm) occurring sub-parallel to foliationFine-grained, subhederal, possibly two stages - anhedral grains (10-20µm) overprinting fabric and finer-grained anhedral grains (2-4µm) preferentially occuring with biotite along foliation planes
Fine-grained chlorite forming thin chlorite-carbonate veinlet
Thick quartz vein appears to be approximately synchronous with D3NC foliation. Vein mostly crosscuts foliaton but in places is offset by it
Paragenesis:
Comments:
Vein Mineralogy:
qz-cb boudins D3NC+qz-cb veins cl-cb veinlets
Strong foliation delineated by aligned prismatic biotite grains and quartz. Small islands of coarser-grained interlocking quartz±carbonate form foliation-parallel boudins
Coarse-grained (15-20µm) subhedral interlocking quartz Coarse-grained (15-20µm) euhedral interlocking carbonate,
Two apparent magnetite stages - early, fine-grained, incorporated into biotite foliation bands, and later, coarser grained, overprinting fabric.
Sample No:
Description:
Host Rock Mineralogy:
Very fine-grained, intensely sheared, quartz-carbonate altered, mylonitized monzonite
Fine-grained, anhedral recrystallized quartz, intergrown with carbonate and forming groundmass. Minor larger grains, anhedral, interlocking, forming foliation parllel quartz "boudins", possibly relict pre-D3NC veins
284

Sketches & Photographs
A B
A
B
285
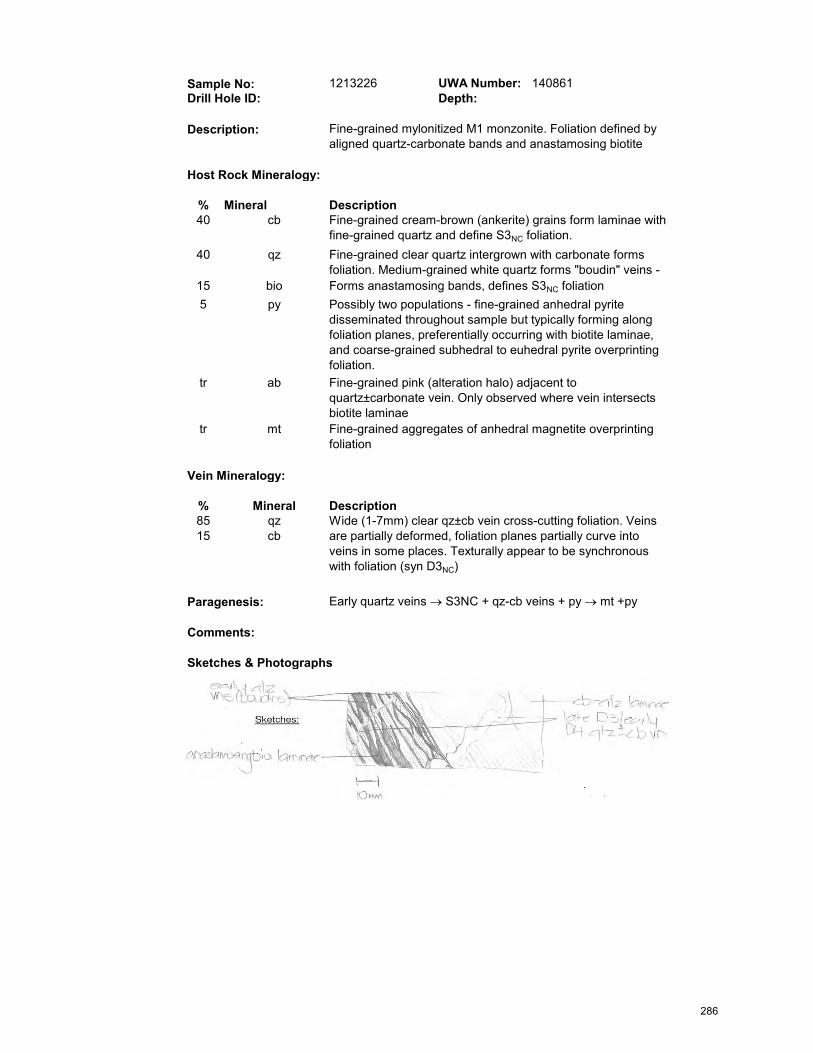
1213226 UWA Number: 140861Drill Hole ID: Depth:
% Mineral Description40 cb
40 qz
15 bio5 py
tr ab
tr mt
% Mineral Description8515
qzcb
Sketches & Photographs
Sample No:
Description: Fine-grained mylonitized M1 monzonite. Foliation defined by aligned quartz-carbonate bands and anastamosing biotite
Fine-grained clear quartz intergrown with carbonate forms foliation. Medium-grained white quartz forms "boudin" veins -
Host Rock Mineralogy:
Fine-grained cream-brown (ankerite) grains form laminae with fine-grained quartz and define S3NC foliation.
Forms anastamosing bands, defines S3NC foliationPossibly two populations - fine-grained anhedral pyrite disseminated throughout sample but typically forming along foliation planes, preferentially occurring with biotite laminae, and coarse-grained subhedral to euhedral pyrite overprinting foliation.Fine-grained pink (alteration halo) adjacent to quartz±carbonate vein. Only observed where vein intersects biotite laminae
Comments:
Vein Mineralogy:
Early quartz veins S3NC + qz-cb veins + py mt +py
Fine-grained aggregates of anhedral magnetite overprinting foliation
Wide (1-7mm) clear qz±cb vein cross-cutting foliation. Veins are partially deformed, foliation planes partially curve into veins in some places. Texturally appear to be synchronous with foliation (syn D3NC)
Paragenesis:
286

Sketches & Photographs
287

1213279 UWA Number: 140867Drill Hole ID: JD236 Depth: 151.45-151.70
% Mineral Description30 ank
40 bio
20 qz10 py
% Mineral Description100 qz
100 qz
Sketches & Photographs
Sample No:
Description: Intensely foliated, brecciated, carbonate-metasomatized biotite schist
Fine-grained, elongate play grains, form long lines delineating foliation planes
Host Rock Mineralogy:
Fine-grained subhedral ankerite, forms froundmass with recrystallised quartz and albite/plagioclase. Shows some preferred orientation
Fine-grained recrystallised quartz groundmassCoarse-grained euhedral-anhedral pyrite, possibly two generations. Very large anhedral grains, flattened, elongate, occur with biotite in foliation planes. Finer grained euhedral pyrite overprints fabric
Thin veins of clear to milky quartz, occur parallel to foliation. Veins have been boudinaged and are edged with biotite
Vein Mineralogy:
Ptygmatic clear coarse-grained quartz veins showing mutually cross-cutting relationships with foliation. Veins have been deformed and fractured where they intersect foliation. Syn-D3NC. Surrounded by carbonate alteration halo
Sample intensely pervasively carbonate-quartz alteredTwo pyrite generations - early, coarse-grained, dirty, syn-D3NC, Au-related, and late, finer grained, cubic, overprinting fabric
Paragenesis:
Comments:
288

Sketches & Photographs
289

1213359 UWA Number: 140873Drill Hole ID: Depth:
% Mineral Description40 fsp
30 qz
30 sertr py
% Mineral Description90 qz
10 py
Sketches & Photographs
Fine-grained sericite altering from feldspar. PervasiveRare coarse-grained disseminated euhedral pyrite
Paragenesis:
Sample No:
Description: Coarse-grained, bleached feldspar-quartz granite porphyry dyke. Brecciated and intensely sericite altered
Coarse-grained interlocking quartz overprinting primary porphyritic texture
Host Rock Mineralogy:
Matrix predominantly alkali feldspar. Relict phenocryst laths observed in quartz alteration. Feldspar altering to sericite
Comments:
Vein Mineralogy:
Several quartz vein phases, wide (1-5mm) clear white bucky quartz veinsThick py±qz veins cross cutting breccia. May themselves be crosscut by later thin quartz veins but relationship is unclear. Pyrite is coarse-grained, massive within vein
Porphyry has been completely bleached and altered. No primary mafic minerals remain. Quartz has extensively overprinted primary minerals and fabric; only rare phenocrysts remain. Matrix has been pervasively altered to sericite (and albite).
290

HBW_1250_12-004 UWA Number: 140884Depth: 190.8-191.2
% Mineral Description70 plg
20 bio
7 py
3 mt
Vein 1
% Mineral Description955tr
qzcl
bio
Vein 2
% Mineral Description991
qzpy
Narrow (1-2mm) single stage opening fracture vein. Quartz dominant but where
Sketches & Photographs
Sample No:
Description: Fine-grained, dark green-grey massive magnetic high-Mg basalt. Weakly brecciated with several vein sets
Host Rock Mineralogy:
Fine-grained, anhedral with diffuse grain boundaries. Intergrown with biotite
Vein Mineralogy:
Vein Mineralogy:
Narrow (2-5mm) diffuse deformed zoned qz-cl±bio veins. Chlorite on edges of growth zones (multiple opening veins). Biotite typically associated with chlorite. Possible trace sericite.
Paragenesis:
Comments: Both vein sets appear to crosscut magnetite(±pyrite) alteration events. In core, magnetism decreases with increasing vein intensity
Fine to medium-grained, subhedral, typically stubby grains. Likely altered from amphibole or pyroxene. Fine-grained, anhedral, disseminated. Overprints matrixFine-grained, anhedral, disseminated. Also overprints matrix
291

HBW_1250_12-018 UWA Number: 140886Drill Hole ID: HBW_1250_12 Depth: 264.2-264.4
% Mineral Description42 plg
30 bio
20 cb
7 py
% Mineral Description991
cbfc
Sketches & Photographs
Sample No:
Description: Fine-grained, dark grey strongly sheared, brecciated carbonate-pyrite-fuchsite altered high Mg basalt.
Fine-grained, platy. Defines shear planes in sample. Edges some deformed carbonate veins.
Host Rock Mineralogy:
Fine-grained anhedral diffuse grain boundaries, likely almost completely carbonate (albite) altered. Forms boudinaged domains between biotite-rich shear planes ie. rock compositionally zoned.
Paragenesis:
Comments:
Fine-grained light brown (ankerite?). Occurs as alteration of plagioclase and as narrow halo around some carbonate veins. Alteration patchy, variable intensity. Intensity increases adjacent to thin deformed qz-cb veinsCoarse-grained, anhedral. Typically occurs with biotite along shear planes and against margins of thick deformed calcite veins. Grains commonly deformed. Do not occur in thick calcite veins but do overprint thin quartz-carbonate veins
Vein Mineralogy:
Thin-thick (3mm->50mm) carbonate-fuchsite veins. Deformed, wrapped by shear fabric. Commonly have carbonate (ankerite)±fuchsite alteration halo of variable with and intensity. Veins are typically rimmed by biotite+pyrite but pyrite is rarely observed within the vein
292

HBW1250_12-019 UWA Number: 140887Drill Hole ID: HBW1250_12 Depth: 264.4-264.6
Granite Porphyry
% Mineral Description50 cb
4 fc
1 py
45 qz
High-Mg basalt
% Mineral Descriptionplg
bio
cb
10 py
% Mineral Descriptionqzcbpyfc
Sample No:
Description: High-Mg basalt - M2 granite porphyry contact. Both units highly atered and sheared. Pyrite abundant at contact, decreasing with decreasing proximity to contact. Mgb strongly biotite-carbonate altered; Fp strongly carbonate-fuchsite altered. Coarse-grained carbonate-fuchsite vein occupies immediate contact. Primary ingnous textures in both Mgb and Fp destroyed
Fine-grained, platy. Defines shear planes. Forms compositional zones with altered plagioclase
Host Rock Mineralogy:
Light brown finegrained ankerite intergrown with calcite and quartzFine-grained, elongate. Defines shear planes in granite porphyryTrace anhedral medium grained pyrite. Occurs with fuchsite along foliation planesFine-grained, intergrown with carbonate completely altering primary mineralogy
Comments:
Vein Mineralogy:
Thick laminated sheared vein parallel to contact. Calcite is fine-grained, subhedral, interlocking. Intergrown with rare anhedral clear quartz grains. Fuchsite forms trails parallel to shear and contact, pyrite coarse-grained, anhedral, deformed and occurs exclusively along fuchsite planes within vein
Host Rock Mineralogy:
Paragenesis:
Fine-grained, euhedral. Dark brown (ankerite). Patchy alteration, typically adjacent to quartz-carbonate veinsCoarse-grained, anhedral, commonly deformed. Typically occurs with biotite along shear planes and wraps around thick calcite veins. Rarely overprints veins and decreases in abundance where carbonate alteration is most intense
Fine-grained, anhedral, diffuse grain boundaries. Mostly altered to carbonate and albite
293

Sketches & Photographs
294
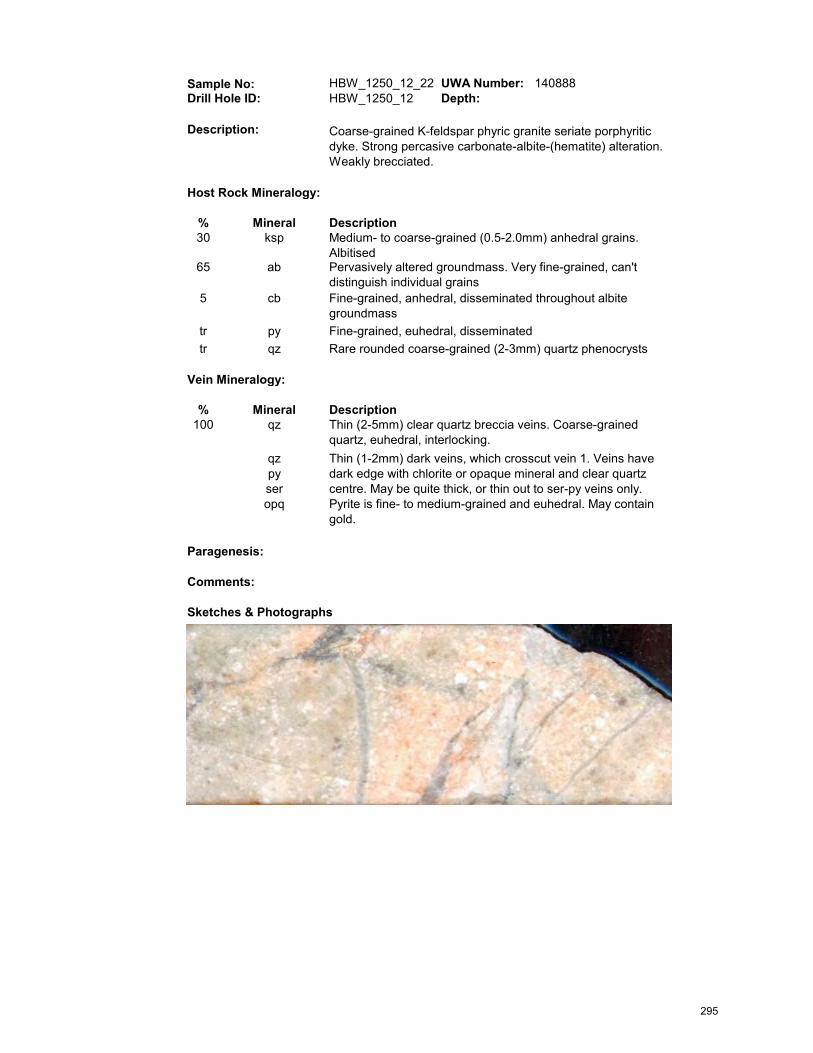
HBW_1250_12_22 UWA Number: 140888Drill Hole ID: HBW_1250_12 Depth:
% Mineral Description30 ksp
65 ab
5 cb
tr pytr qz
% Mineral Description100 qz
qzpyseropq
Fine-grained, anhedral, disseminated throughout albite groundmassFine-grained, euhedral, disseminated
Vein Mineralogy:
Rare rounded coarse-grained (2-3mm) quartz phenocrysts
Sample No:
Description: Coarse-grained K-feldspar phyric granite seriate porphyritic dyke. Strong percasive carbonate-albite-(hematite) alteration. Weakly brecciated.
Pervasively altered groundmass. Very fine-grained, can't distinguish individual grains
Host Rock Mineralogy:
Medium- to coarse-grained (0.5-2.0mm) anhedral grains. Albitised
Thin (2-5mm) clear quartz breccia veins. Coarse-grained quartz, euhedral, interlocking.
Paragenesis:
Comments:
Thin (1-2mm) dark veins, which crosscut vein 1. Veins have dark edge with chlorite or opaque mineral and clear quartz centre. May be quite thick, or thin out to ser-py veins only. Pyrite is fine- to medium-grained and euhedral. May contain gold.
Sketches & Photographs
295

HBW_1250_12-023 UWA Number: 140889Drill Hole ID: HBW_1250_12 Depth: 307.1-307.3
% Mineral Description40 ksp
58 ab2 cbtr py
% Mineral Description9010tr
qzbioser
ab-cb bx bio-qz
Sample No:
Description: Brecciated pervasively carbonate-albite altered seriate porphyritic quartz-K-feldspar granite dyke
Thick (5-50mm) zoned breccia veins. Biotite fine grained, platy, typcially rims vein. Quartz coarse-grained, granular, interlocking. Sericite rare, coarse-grained, anhedral, interlocking with quartz. No alteration halo.
Host Rock Mineralogy:
Coarse-grained, anhedral to euhedral. Seriate grain size distribution. Rare zoned phenocrysts. Strong pervasive albite alteration
Paragenesis:
Comments:
Vein Mineralogy:
Very fine grained pervasively altered groundmassFine-grained anhedral, disseminated throughout groundmassFine-grained, euhdral, disseminated
Sketches & Photographs
296

HBW_1250_12-024 UWA Number: 140890Drill Hole ID: HBW_1250_12 Depth: 309.6-309.8
High Mg basalt
% Mineral Description25 bio
50 plg
15 cb
10 py
M2 Porphyry
% Mineral Description55 ab40 ksp
5 bio
tr pytr cb
Vein 1
% Mineral Description100 qz
Vein 2
% Mineral Description8020tr
qzcbser
Rare fine- to medium-grained subhedral to anhedral pyrite
Vein Mineralogy:
Thin zoned veins, 1-2mm wide. Undeformed. Typically fine- to medium-grained, outer carbonate-sericite, inner quartz. Commonly have narrow alteration halo. May contain trace Au in outer carbonate zone?
Vein Mineralogy:
Sample No:
Description: Contact between M2 granite porphyry and high Mg basalt. Basalt is fine-grained, massive, pervasively strongly to intensely biotite-carbonate-pyrite altered. Pyrite is coarse-grained, euhedral, disseminated, although at contact is less idiomorphic than other pyrite. M2 granite porphyry is coarse-grained, K-feldspar-phyric. Phenocrysts are subhedral, fractured. Unit is intensely albite altered. Late thick undeformed quartz veins with no alteration halo cut contact
Fine-grained, subhedral, typically forms clusters. Partially altered to albite. Partially intergrown with biotite and carbonate
Host Rock Mineralogy:
Very fine grained, forms groundmass. Likely alteration of primary mafic phases. Platy, commonly edges quartz-carbonate-sericite veins. Increases in abundance at M2-Mgb contact
Host Rock Mineralogy:
Moderate patchy ankerite alteration overprinting plagioclase-biotite groundmass. Typically associated with quartz-carbonate-sericite veinsCoarse-grained euhedral-cubic disseminated pyrite overprinting groundmass. Rarely overprints ceins. Rare skeletal grains. Increased abundance at M2-Mgb contact
Rare patchy carbonate overprinting fabric
Fine-grained, opaque milky quartz veins. Deformed, possibly pre-D3NC. Rare. Crosscut by contact
Very fine-grained, forms ground massSubhedral to euhedral feldspar laths. Some appear partially resorbed. Coarse-grained. Rare fractured grainsFine-grained, typically forming thin stringers into porphyry perpindicular to contact
297

Vein 3
% Mineral Description100 qz
Vein 4
% Mineral Description955trtr
serpyclAu
Vein 1 intrusion vein 2 vein 3 vein 4
Sketches & Photographs
Vein Mineralogy:
Wide massive buck quartz veins. Cross-cut contact and S3NC foliation
Thin fine-grained sericite stringers which crosscut veins 2 and 3
Paragenesis:
Comments:
Vein Mineralogy:
298

JD0475-003 UWA Number: 140896Drill Hole ID: JD0475 Depth: 95.5-96.0
% Mineral Description70 plg
25 bio
5 cc
tr py
% Mineral Description9010tr
cbclqz
Sketches & Photographs
Paragenesis:
Comments:
Vein Mineralogy:
Fine-grained platy grains replacing primary mafic minerals. Rare larger clusters. Intergrown with plagioclaseMedium grained white anhedral grains. Typically replace plagioclase but may also replace mafic minerals. May occur with biotite rimming replaced mafic mineralFine-grained anhedral disseminated pyrite overprints fabric
Wide (>30mm) replacement vein with diffuse vein margins. Vein is fibrous and minerals are oriented oblique to vein. Calcite and chlorite are fine-grained, fibrous; quartz is fine-grained, anhedral, with no preferred orientation. Vein has wide calcite-chlorite halo, also with preferred orientation - sheared or deformed vein
Sample No:
Description: Dark green, fine-grained cumulate dolerite. Unit is moderately pervasively carbonate altered and primary mafic minerals
Host Rock Mineralogy:
Fine-grained euhedral stubby laths, cumulate, interlocking with mafic minerals. Pervasively carbonate altered.
299

JD075-005 UWA Number: 140897Drill Hole ID: JD075 Depth: 116.1-116.4
% Mineral Description60 plg
10 bio
10 cb
10 mt
5 cl
15 act
tr py
% Mineral Description955tr
ccclpy
Sketches & Photographs
Sample No:
Description: Dark grey-green, fine- to medium-grained massive dolerite. Unit has been moderately pervasively carbonate altered and primary mafic minerals are biotite±carbonate altered. Actinolite
Host Rock Mineralogy:
Fine-grained subhedral plagioclase, percasively carbonate altered. Cumulate matrix
Paragenesis:
Comments:
Vein Mineralogy:
Fine-grained euhedral, platy. Typically occurs partially replacing primary mafic minerals - relict phenocryst shapes observed. Fine-grained, anhedral. Often skeletal, with magnetite cores. Possibly replacing phenocrystsFine-grained, anhedral, granular. Typically occurs with carbonate as cores to skeletal calcite grains but also occurs along edges of carbonate-chlorite veinsFine-grained, anhedral, typically occurs with carbonate in carbonate-chlorite±quartz vein halosCoarse-grained, acicular. Randomly oriented, overprinting fabricFine-grained, anhedral, disseminated
Wide (2-20mm) weakly deformed breccia veins. Calcite fine-grained, granular, interlocking. Chlorite fine-grained subhedral, forms patches and zones in vein. Vein partially zoned, possibly multiple stage opening vein. Veins have narrow carbonate-chlorite alteration halo. Trace pyrite (fine-grained, anhedral) always associated with chlorite
300
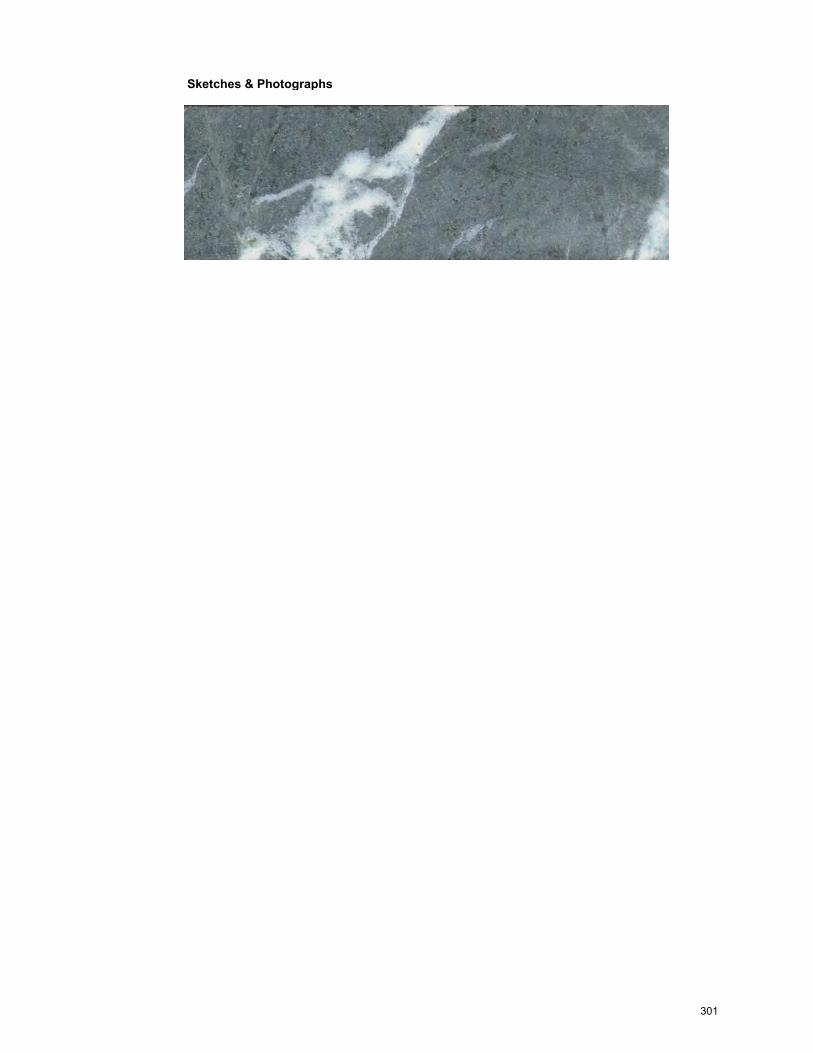
Sketches & Photographs
301

APPENDICES
302
APPENDIX 4 Fluid Inclusion Microthermometry

H2O-CO2-CH4-NaCl
Sample No.
Min
Stage Min Style Vein Type
Inclusion
type No
1213279 1 Porphyry 2 aq-cb 9 -57.34 ± 0.30 7.8 ± 0.70 12.1 ± 3.2 1.03 ± 0.01 0.76 ± 0.23 4.24 ± 1.21 0.01 ± 0.00
1213279 1 Porphyry 2 aq-cb 6 -56.60 ± 0.10 7.8 ± 0.40 15.8 ± 3.1 1.03 ± 0.01 0.77 ± 0.14 4.28 ± 0.71 0.01 ± 0.00
1213279 1 Porphyry 2 aq-cb 5 -59.30 ± 1.70 8.3 ± 0.70 16.1 ± 5.2 1.02 ± 0.01 0.59 ± 0.23 3.32 ± 1.22 0.01 ± 0.00
1213279 1 Porphyry 2 aq-cb 4 -58.00 ± 0.50 8.3 ± 0.10 21.7 ± 1.7 1.02 ± 0.00 0.61 ± 0.04 3.40 ± 0.22 0.01 ± 0.00
1213279 1 Porphyry 2 aq-cb 4 -59.50 ± 1.70 9.3 ± 0.60 14.9 ± 4.3 1.00 ± 0.01 0.25 ± 0.19 1.46 ± 1.08 0.00 ± 0.00
1213279 1 Porphyry 2 aq-cb 4 -59.50 ± 1.70 8.7 ± 0.60 14.3 ± 5.1 1.01 ± 0.01 0.49 ± 0.19 2.80 ± 1.02 0.01 ± 0.00
1213279 1 Porphyry 2 aq-cb 4 -57.00 ± 0.20 7.4 ± 0.30 19.4 ± 2.3 226.4 ± 0.5 1.03 ± 0.00 0.89 ± 0.10 4.93 ± 0.53 0.02 ± 0.00
1213279 1 Porphyry 2 aq-cb 4 -56.90 ± 0.30 7.0 ± 0.40 16.6 ± 1.7 239.9 ± 9.6 1.04 ± 0.00 1.04 ± 0.13 5.72 ± 0.68 0.02 ± 0.00
1213279 1 Porphyry 2 aq-cb 3 -56.80 ± 0.10 7.7 ± 1.20 19.9 ± 1.3 226.4 ± 0.5 352.3 1.03 ± 0.02 0.78 ± 0.39 4.33 ± 2.07 0.01 ± 0.01
1213279 1 Porphyry 2 aq-cb 3 -58.80 ± 2.10 7.3 ± 0.10 12.4 ± 3.9 1.03 ± 0.00 5.21 ± 0.20 0.02 ± 0.00
1213279 1 Porphyry 2 aq-cb 2 -57.50 ± 0.10 7.8 ± 0.30 17.2 ± 0.1 1.03 ± 0.00 0.76 ± 0.10 4.25 ± 0.51 0.01 ± 0.00
1213279 1 Porphyry 2 aq-cb 5 -56.60 ± 0.00 7.1 ± 0.90 23.4 ± 1.0 1.03 ± 0.01 0.99 ± 0.31 5.47 ± 1.61 0.02 ± 0.01
1213279 1 Porphyry 2 aq-cb 6 -56.90 ± 0.30 7.8 ± 0.50 20.7 ± 4.0 262.3 ± 15.2 329.0 ± 0.4 1.03 ± 0.01 0.78 ± 0.15 4.34 ± 0.82 0.01 ± 0.00
1213279 1 Porphyry 2 aq-cb 2 -58.90 ± 1.80 8.4 ± 0.00 11.9 ± 2.9 277.2 1.02 ± 0.00 0.56 3.15 ± 0.00 0.01 ± 0.00
1213279 1 Porphyry 2 aq-cb 9 -56.70 ± 0.00 8.6 ± 0.50 29.6 ± 0.7 267.2 ± 0.4 269.6 ± 1.0 1.01 ± 0.01 0.47 ± 0.18 2.67 ± 0.99 0.01 ± 0.00
HBW_1250_12-018 2 Contact qz-cb altn aq-cb 6 -57.10 ± 0.50 7.9 ± 0.00 23.6 ± 3.3 1.02 ± 0.00 0.69 ± 0.01 3.92 ± 0.07 0.01 ± 0.00
HBW_1250_12-018 2 Contact qz-cb altn aq-cb 1 -56.60 7.3 17.9 1.03 0.93 5.15 0.02
HBW_1250_12-018 2 Contact qz-cb altn aq-cb 6 -56.60 7.0 ± 0.60 15.0 ± 1.9 186.4 1.04 ± 0.08 1.04 ± 0.20 5.73 ± 1.01 0.02 ± 0.00
HBW_1250_12-018 2 Contact qz-cb altn aq-cb 5 -56.60 8.1 ± 0.17 30.7 ± 0.0 304.0 ± 16.7 1.02 ± 0.00 0.64 ± 0.06 3.63 ± 0.31 0.01 ± 0.00
1213359 2 Fracture 3 aq-cb 5 -57.00 ± 0.44 7.4 ± 0.89 24.3 ± 6.1 1.03 ± 0.01 0.90 ± 0.30 4.98 ± 1.59 0.02 ± 0.01
1213359 2 Fracture 3 aq-cb 3 -57.10 ± 0.20 7.4 ± 0.55 29.2 ± 2.1 1.03 ± 0.01 0.91 ± 0.19 5.03 ± 0.99 0.02 ± 0.00
1213359 2 Fracture 3 aq-cb 4 -56.60 8.0 ± 0.38 15.8 ± 3.4 1.02 ± 0.01 0.68 ± 0.13 3.84 ± 0.70 0.01 ± 0.00
1213359 2 Fracture 3 aq-cb 4 -56.67 ± 0.60 8.6 ± 0.40 14.9 ± 0.8 247.0 297.0 ± 21.8 1.01 ± 0.01 0.49 ± 0.14 2.76 ± 0.77 0.01 ± 0.00
1213359 2 Fracture 3 aq-cb 1 -58.00 8.2 24.8 1.02 0.62 3.52 0.01
1213359 2 Fracture 3 aq-cb 1 -58.10 8.2 27.6 1.02 0.62 3.52 0.01
133541 2 Fracture 3 aq-cb 7 -56.60 7.3 ± 0.21 22.4 ± 1.7 1.03 ± 0.00 0.93 ± 0.07 5.15 ± 0.37 0.02 ± 0.00
133541 2 Fracture 3 aq-cb 5 -56.60 ± 0.00 7.0 ± 0.10 24.2 ± 1.3 1.04 ± 0.00 1.03 ± 0.03 5.68 ± 0.17 0.02 ± 0.00
133541 2 Fracture 3 aq-cb 4 -56.60 ± 0.00 7.2 ± 0.20 22.2 ± 3.5 1.03 ± 0.00 0.97 ± 0.07 5.39 ± 0.37 0.02 ± 0.00
133541 2 Fracture 3 aq-cb 8 -56.60 ± 0.00 7.1 ± 0.30 22.9 ± 0.9 1.03 ± 0.01 1.00 ± 0.12 5.53 ± 0.60 0.02 ± 0.00
133541 2 Fracture 3 aq-cb 15 -56.61 ± 0.00 7.2 ± 0.60 23.9 ± 2.6 1.03 ± 0.01 0.95 ± 0.20 5.23 ± 1.03 0.02 ± 0.00
133541 2 Fracture 3 aq-cb 13 -57.82 ± 0.00 7.4 ± 0.30 24.8 ± 2.7 276.6 ± 20.6 301.2 ± 10.8 1.03 ± 0.00 0.91 ± 0.10 5.05 ± 0.53 0.02 ± 0.00
Tm CO2 Tm Clath Th CO2 L-V Th Crep Th Total Aq Density Molal NaCl Wt% NaCl X(NaCl)
303

H2O-CO2-CH4-NaCl
Sample No.
1213279
1213279
1213279
1213279
1213279
1213279
1213279
1213279
1213279
1213279
1213279
1213279
1213279
1213279
1213279
HBW_1250_12-018
HBW_1250_12-018
HBW_1250_12-018
HBW_1250_12-018
1213359
1213359
1213359
1213359
1213359
1213359
133541
133541
133541
133541
133541
133541
0.82 ± 0.03 52.92 ± 1.71 0.97 ± 0.01 0.03 ± 0.01 0.78 ± 0.05 0.20 ± 0.05 0.011 ± 0.003 0.01 ± 0.00 0.94 ± 0.01 25.36 ± 1.52
0.81 ± 0.03 54.10 ± 1.78 1.00 ± 0.00 0.00 ± 0.00 0.80 ± 0.03 0.19 ± 0.03 0.011 ± 0.001 0.00 ± 0.00 0.94 ± 0.01 25.06 ± 0.99
0.71 ± 0.08 62.78 ± 7.10 0.92 ± 0.06 0.08 ± 0.06 0.88 ± 0.01 0.10 ± 0.01 0.009 ± 0.004 0.01 ± 0.01 0.93 ± 0.02 23.00 ± 0.26
0.65 ± 0.13 70.12 ± 15.59 0.96 ± 0.03 0.04 ± 0.03 0.87 ± 0.05 0.11 ± 0.05 0.009 ± 0.001 0.01 ± 0.01 0.88 ± 0.11 24.71 ± 4.73
0.67 ± 0.05 63.54 ± 6.03 0.89 ± 0.07 0.11 ± 0.07 0.88 ± 0.04 0.10 ± 0.03 0.004 ± 0.003 0.01 ± 0.02 0.92 ± 0.01 23.10 ± 1.51
0.68 ± 0.11 64.03 ± 13.17 0.89 ± 0.02 0.11 ± 0.02 0.83 ± 0.05 0.14 ± 0.04 0.008 ± 0.002 0.02 ± 0.01 0.88 ± 0.10 25.85 ± 4.51
0.77 ± 0.01 56.63 ± 0.77 0.99 ± 0.01 0.01 ± 0.01 0.69 ± 0.29 0.30 ± 0.29 0.011 ± 0.005 0.01 ± 0.01 0.91 ± 0.06 29.70 ± 11.11
0.80 ± 0.02 54.57 ± 1.31 0.99 ± 0.01 0.01 ± 0.01 0.75 ± 0.03 0.23 ± 0.03 0.014 ± 0.002 0.00 ± 0.00 0.93 ± 0.02 26.56 ± 1.36
0.76 ± 0.00 57.20 ± 0.00 0.99 ± 0.00 0.01 ± 0.00 0.69 ± 0.10 0.30 ± 0.11 0.010 ± 0.006 0.00 ± 0.00 0.88 ± 0.03 29.92 ± 4.18
0.69 ± 0.19 62.26 ± 14.02 0.90 ± 0.10 0.10 ± 0.10 0.80 ± 0.05 0.17 ± 0.06 0.014 ± 0.002 0.02 ± 0.01 0.90 ± 0.06 26.00 ± 1.70
0.76 ± 0.01 56.99 ± 0.30 0.97 ± 0.00 0.03 ± 0.00 0.53 ± 0.40 0.44 ± 0.39 0.008 ± 0.006 0.01 ± 0.01 0.86 ± 0.09 35.84 ± 15.47
0.73 ± 0.01 60.01 ± 1.06 1.00 ± 0.00 0.00 ± 0.00 0.83 ± 0.05 0.16 ± 0.05 0.015 ± 0.005 0.00 ± 0.00 0.92 ± 0.03 24.78 ± 1.99
0.75 ± 0.05 58.21 ± 4.65 0.99 ± 0.01 0.01 ± 0.01 0.76 ± 0.04 0.22 ± 0.04 0.011 ± 0.002 0.00 ± 0.00 0.90 ± 0.02 27.12 ± 0.79
0.74 ± 0.08 56.61 ± 3.29 0.91 ± 0.08 0.09 ± 0.08 0.84 ± 0.05 0.14 ± 0.05 0.009 ± 0.001 0.01 ± 0.01 0.94 ± 0.00 23.76 ± 1.31
0.50 ± 0.06 88.69 ± 10.56 0.99 ± 0.01 0.01 ± 0.01 0.83 ± 0.06 0.16 ± 0.06 0.007 ± 0.002 0.00 ± 0.00 0.78 ± 0.04 29.04 ± 2.70
0.68 ± 0.05 63.96 ± 5.60 0.98 ± 0.02 0.02 ± 0.01 0.49 ± 0.23 0.49 ± 0.23 0.006 ± 0.003 0.01 ± 0.01 0.79 ± 0.06 40.46 ± 10.05
0.80 55.32 1.00 0.00 0.81 0.18 0.014 0.00 0.94 24.76
0.82 ± 0.16 53.58 ± 1.06 1.00 0.00 0.52 ± 0.29 0.46 ± 0.29 0.010 ± 0.005 0.00 0.90 ± 0.05 34.29 ± 9.83
0.55 ± 0.00 79.72 ± 0.63 1.00 0.00 0.44 ± 0.17 0.51 ± 0.17 0.006 ± 0.020 0.00 0.65 ± 0.06 49.64 ± 10.78
0.67 ± 0.08 66.35 ± 8.44 0.99 ± 0.02 0.01 ± 0.01 0.47 ± 0.16 0.52 ± 0.17 0.008 ± 0.004 0.01 ± 0.01 0.74 ± 0.11 44.49 ± 11.71
0.48 ± 0.13 96.94 ± 23.19 0.99 ± 0.01 0.01 ± 0.01 0.87 ± 0.03 0.11 ± 0.02 0.014 ± 0.003 0.00 0.80 ± 0.10 27.25 ± 3.93
0.81 ± 0.03 54.13 ± 2.14 1.00 ± 0.00 0.00 0.82 ± 0.11 0.17 ± 0.11 0.010 ± 0.001 0.00 0.95 ± 0.03 24.01 ± 3.70
0.82 ± 0.00 53.52 ± 0.41 1.00 ± 0.00 0.00 0.84 ± 0.03 0.16 ± 0.03 0.008 ± 0.002 0.00 0.95 ± 0.01 23.62 ± 1.17
0.63 69.86 0.97 0.03 0.84 0.14 0.009 0.00 0.86 25.78
0.40 110.02 0.96 0.04 0.89 0.10 0.010 0.00 0.77 27.26
0.75 ± 0.02 59.07 ± 1.48 1.00 ± 0.00 0.00 0.80 ± 0.07 0.19 ± 0.07 0.013 ± 0.001 0.00 0.91 ± 0.02 25.62 ± 2.68
0.72 ± 0.02 60.91 ± 1.60 1.00 ± 0.00 0.00 ± 0.00 0.72 ± 0.07 0.26 ± 0.08 0.013 ± 0.001 0.00 ± 0.00 0.87 ± 0.04 29.53 ± 3.72
0.75 ± 0.05 59.19 ± 3.81 1.00 ± 0.00 0.00 ± 0.00 0.77 ± 0.05 0.21 ± 0.05 0.013 ± 0.002 0.00 ± 0.00 0.90 ± 0.00 26.78 ± 1.20
0.74 ± 0.01 59.42 ± 0.99 1.00 ± 0.00 0.00 ± 0.00 0.81 ± 0.05 0.17 ± 0.05 0.015 ± 0.002 0.00 ± 0.00 0.92 ± 0.02 25.22 ± 1.99
0.72 ± 0.04 60.95 ± 3.33 1.00 ± 0.00 0.00 ± 0.00 0.77 ± 0.16 0.22 ± 0.17 0.013 ± 0.004 0.00 ± 0.00 0.90 ± 0.05 27.36 ± 6.49
0.57 ± 0.12 80.19 ± 17.61 0.95 ± 0.01 0.05 ± 0.01 0.84 ± 0.06 0.14 ± 0.06 0.014 ± 0.001 0.01 ± 0.00 0.85 ± 0.05 26.29 ± 2.72
Carb MVCarb Den Bulk Den Bulk MVCarb XCO2 Carb XCH4 Bulk XH2O Bulk XCO2 Bulk XNaCl Bulk XCH4
304
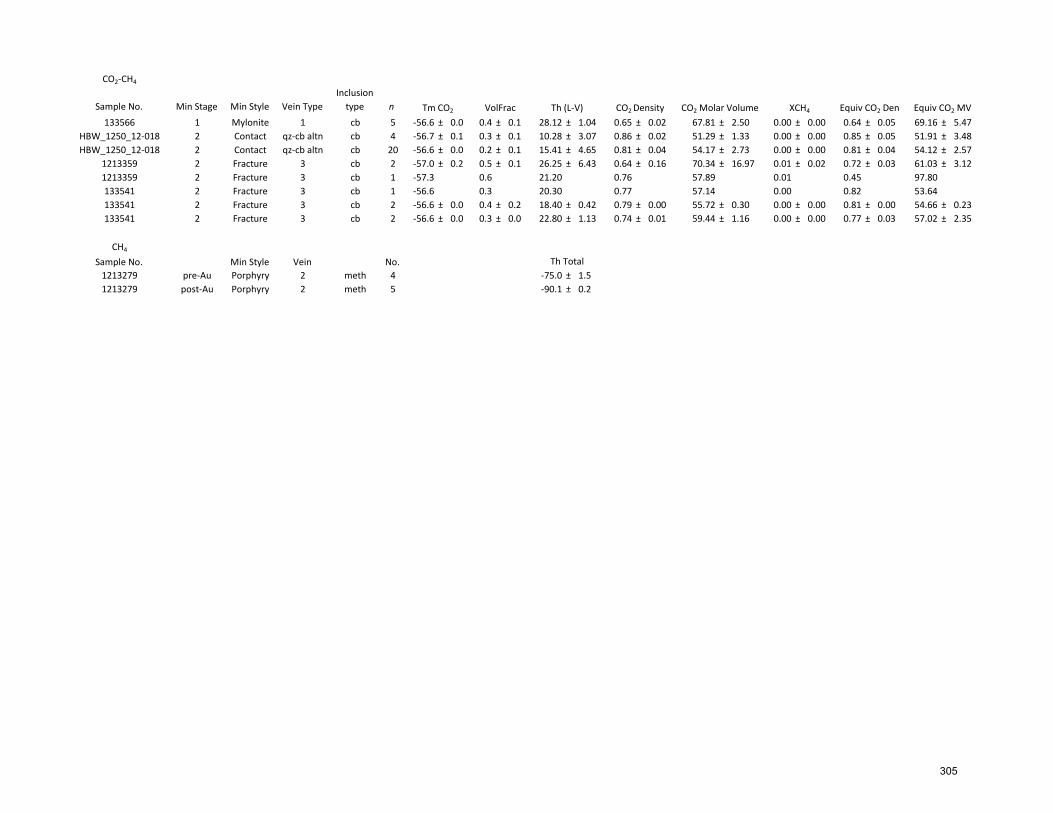
CO2-CH4
Sample No. Min Stage Min Style Vein Type
Inclusion
type n
133566 1 Mylonite 1 cb 5 -56.6 ± 0.0 0.4 ± 0.1 28.12 ± 1.04 0.65 ± 0.02 67.81 ± 2.50 0.00 ± 0.00 0.64 ± 0.05 69.16 ± 5.47
HBW_1250_12-018 2 Contact qz-cb altn cb 4 -56.7 ± 0.1 0.3 ± 0.1 10.28 ± 3.07 0.86 ± 0.02 51.29 ± 1.33 0.00 ± 0.00 0.85 ± 0.05 51.91 ± 3.48
HBW_1250_12-018 2 Contact qz-cb altn cb 20 -56.6 ± 0.0 0.2 ± 0.1 15.41 ± 4.65 0.81 ± 0.04 54.17 ± 2.73 0.00 ± 0.00 0.81 ± 0.04 54.12 ± 2.57
1213359 2 Fracture 3 cb 2 -57.0 ± 0.2 0.5 ± 0.1 26.25 ± 6.43 0.64 ± 0.16 70.34 ± 16.97 0.01 ± 0.02 0.72 ± 0.03 61.03 ± 3.12
1213359 2 Fracture 3 cb 1 -57.3 0.6 21.20 0.76 57.89 0.01 0.45 97.80
133541 2 Fracture 3 cb 1 -56.6 0.3 20.30 0.77 57.14 0.00 0.82 53.64
133541 2 Fracture 3 cb 2 -56.6 ± 0.0 0.4 ± 0.2 18.40 ± 0.42 0.79 ± 0.00 55.72 ± 0.30 0.00 ± 0.00 0.81 ± 0.00 54.66 ± 0.23
133541 2 Fracture 3 cb 2 -56.6 ± 0.0 0.3 ± 0.0 22.80 ± 1.13 0.74 ± 0.01 59.44 ± 1.16 0.00 ± 0.00 0.77 ± 0.03 57.02 ± 2.35
CH4
Sample No. Min Style Vein No.
1213279 pre-Au Porphyry 2 meth 4 -75.0 ± 1.5
1213279 post-Au Porphyry 2 meth 5 -90.1 ± 0.2
Equiv CO2 Den Equiv CO2 MV
Th Total
Tm CO2 VolFrac Th (L-V) CO2 Density CO2 Molar Volume XCH4
305

H2O-NaCl-(KCl)
Aqueous Gold Related
Sample No Min Stage Min Style Vein type Inclusion Type n
HBW_1250_12-018 2 Contact qz-cb altn aq>>cb 2 -5.7 ± 1.9 0.1 ± 0.0 1.63 ± 0.53 8.65 ± 2.60 0.03 ± 0.01
HBW_1250_12-018 2 Contact qz-cb altn aq>>cb 5 -3.1 ± 2.2 0.1 ± 0.0 0.90 ± 0.65 6.03 ± 2.67 0.02 ± 0.01
HBW_1250_12-018 2 Contact qz-cb altn aq>>cb 7 -2.3 ± 2.0 0.1 ± 0.0 100.5 ± 10.1 0.48 ± 0.48 4.52 ± 3.03 0.01 ± 0.01 0.97 ± 0.01 18.81 ± 0.23
1213359 2 Fracture 3 aq>>cb 5 -3.1 ± 1.8 0.2 ± 0.1 139.9 ± 16.9 160.5 ± 0.7 0.89 ± 0.53 6.85 ± 1.20 0.02 ± 0.01 0.96 ± 0.01 19.42 ± 0.11
Low Salinity Aqueous Post Gold
133566 post-Au Mylonite 1 aq (low sal) 7 -7.6 ± 1.2 0.2 ± 0.3 173.0 ± 29.2 169.1 ± 2.4 2.16 ± 0.34 11.17 ± 1.59 0.04 ± 0.00 0.97 ± 0.02 20.14 ± 0.44
133568 post-Au Mylonite 1 aq (low sal) 11 -7.8 ± 0.9 0.1 ± 0.0 192.0 ± 14.1 2.20 ± 0.24 11.39 ± 1.09 0.04 ± 0.00 0.96 ± 0.02 20.30 ± 0.10
1213279 post-Au Porphyry 2 aq (low sal) 2 -6.4 0.1 1.84 ± 9.71 0.03
1213279 post-Au Porphyry 2 aq (low sal) 5 -5.3 ± 0.8 1.53 ± 0.24 8.22 ± 1.16 0.03 ± 0.00
1213279 post-Au Porphyry 2 aq (low sal) 1 -6.2 1.79 9.45 0.03
1213279 post-Au Porphyry 2 aq (low sal) 1 -7.2 0.1 2.06 10.73 0.04
1213279 post-Au Porphyry 2 aq (low sal) 5 -5.0 ± 2.6 0.1 ± 0.0 1.21 ± 0.80 7.63 ± 3.61 0.02 ± 0.01
1213279 post-Au Porphyry 2 aq (low sal) 2 -2.8 ± 0.8 0.1 ± 0.0 0.82 ± 0.25 4.54 ± 1.32 0.02 ± 0.01
1213279 post-Au Porphyry 2 aq (low sal) 6 -7.8 ± 1.9 2.19 ± 0.50 11.30 ± 2.30 0.04 ± 0.01
1213279 post-Au Porphyry 2 aq (low sal) 3 -8.7 ± 0.3 2.45 ± 0.09 12.51 ± 0.39 0.04 ± 0.00
1213279 post-Au Porphyry 2 aq (low sal) 7 -5.7 ± 2.2 233.9 ± 43.5 179.2 ± 17.7 1.41 ± 0.78 6.98 ± 1.09 0.02 ± 0.02 0.85 ± 0.08 22.50 ± 2.05
1213359 post-Au Fracture 3 aq (low sal) 2 -3.3 ± 1.5 0.1 ± 0.0 0.95 ± 0.43 5.21 ± 2.27 0.02 ± 0.01
1213359 post-Au Fracture 3 aq (low sal) 1 -0.7 0.1 0.20 1.16 0.00
1213359 post-Au Fracture 3 aq (low sal) 8 -2.2 ± 1.2 0.1 ± 0.0 117.6 ± 40.6 162.5 ± 2.5 0.63 ± 0.34 3.96 ± 1.57 0.01 ± 0.01 0.97 ± 0.03 19.17 ± 0.70
1213362 post-Au Fracture 3 aq (low sal) 4 -5.8 ± 3.1 0.1 ± 0.0 107.5 ± 51.0 171.3 ± 4.0 2.39 ± 0.69 12.21 ± 3.15 0.04 ± 0.01 1.02 ± 0.03 19.41 ± 0.81
133541 post-Au Fracture 3 aq (low sal) 2 -4.0 ± 1.6
1213359 post-Au Fracture 3 aq (low sal) 3 -3.2 ± 1.8
1213359 post-Au Fracture 3 aq (low sal) 2 -3.3 ± 1.5
133541 post-Au Fracture 3 aq (low sal) 5 -6.6 ± 1.8
1213362 post-Au Fracture 3 aq (low sal) 8 -3.1 ± 2.4
H2O-NaCl-CaCl2
High Salinity Aqueous Post Gold
1213279 post-Au Porphyry 2 aq (high sal) 3 -14.8 ± 0.1 0.1 ± 0.0 3.25 ± 1.06 18.41 ± 0.06 0.06 ± 0.02
HBW_1250_12-018 post-Au Contact qz-cb altn aq (high sal) 11 -19.0 ± 3.1 2.40 ± 0.27 21.02 ± 1.87 0.04 ± 0.00
133541 post-Au Fracture 3 aq (high sal) 6 -21.1 ± 1.7 101.9 ± 22.8 2.59 ± 0.13 22.31 ± 0.89 0.04 ± 0.00 1.16 ± 0.01 19.17 ± 0.12
133541 post-Au Fracture 3 aq (high sal) 9 -19.9 ± 2.3 2.49 ± 0.20 21.63 ± 1.39 0.04 ± 0.00 1.15 ± 0.01 19.14 ± 0.05
1213359 post-Au Fracture 3 aq (high sal) 9 -17.7 ± 1.7 0.1 ± 0.0 89.0 ± 13.5 4.46 ± 0.34 20.66 ± 1.26 0.07 ± 0.01 1.12 ± 0.02 18.72 ± 0.34
X(NaCl) Bulk Den Bulk MVTm ice VolFrac Vap Th L-V ThCREP Molal NaCl Wt% NaCl
306
APPENDICES
307
APPENDIX 5 Laser Raman Analyses

Sample Mineralization Analysis SO2 CO2 CO2 N2 H2S C3H8 CH4 C2H6 NH3 H2 SO2 CO2 N2 H2S C3H8 CH4 C2H6 NH3 H2
Number Style Number 1151 cm-1 1285 cm-1 1388 cm-1 2331 cm-1 2611 cm-1 2899 cm-1 2917 cm-1 2954 cm-1 3334 cm-1 4161 cm-1 mol % mol % mol % mol % mol % mol % mol % mol % mol %
1213279 Porphyry 279_1 1913 3002 619 0 96 0 0 0 4 0 0 01213279 Porphyry 279_2 1767 2919 10497 0 61 0 0 0 39 0 0 01213279 Porphyry 279_3 456 827 0 100 0 0 0 0 0 0 01213279 Porphyry 279_4 300 0 100 0 0 0 0 0 0 01213279 Porphyry 279_5 423 537 0 100 0 0 0 0 0 0 01213279 Porphyry 279_6 378 837 179.5 0 96 0 0 0 4 0 0 01213279 Porphyry 279_7 395 740 137 0 97 0 0 0 3 0 0 01213279 Porphyry 279_8 68.5 392.5 0 100 0 0 0 0 0 0 01213279 Porphyry 279_9 4218 7521.5 1546.5 0 96 0 0 0 4 0 0 01213279 Porphyry 279_10 2196 3965.5 3316 0 86 0 0 0 14 0 0 01213279 Porphyry 279_11 4028 8679 730 0 98 0 0 0 2 0 0 01213279 Porphyry 279_12 650.5 702 0 100 0 0 0 0 0 0 01213279 Porphyry 279_13 734.5 1467 0 100 0 0 0 0 0 0 01213279 Porphyry 279_14 1996.5 2223 0 100 0 0 0 0 0 0 01213279 Porphyry 279_15 11328 0 0 0 0 0 100 0 0 01213279 Porphyry 279_16 15533.5 0 0 0 0 0 100 0 0 01213279 Porphyry 279_17 830 0 0 0 0 0 100 0 0 01213279 Porphyry 279_18 37408.5 0 0 0 0 0 100 0 0 01213279 Porphyry 279_19 55372 0 0 0 0 0 100 0 0 01213279 Porphyry 279_20 318.8 767 68457 1367 0 0 3 0 1 95 1 0 01213279 Porphyry 279_21 26168 0 0 0 0 0 100 0 0 01213279 Porphyry 279_31 13319.5 23900 0 100 0 0 0 0 0 0 0HBW-1250-12-018 Contact 12-18_1 1021.5 3190 0 100 0 0 0 0 0 0 0HBW-1250-12-018 Contact 12-18_2 8065.5 15414 0 100 0 0 0 0 0 0 0HBW-1250-12-018 Contact 12-18_3 3585 6960 0 100 0 0 0 0 0 0 0HBW-1250-12-018 Contact 12-18_4 1559 2990 0 100 0 0 0 0 0 0 0HBW-1250-12-018 Contact 12-18_5 758.5 939 0 100 0 0 0 0 0 0 0HBW-1250-12-018 Contact 12-18_6 246 418.5 0 100 0 0 0 0 0 0 0133541 Fracture 541_1 305.5 654.5 0 100 0 0 0 0 0 0 0133541 Fracture 541_2 3206 5460 0 100 0 0 0 0 0 0 0133541 Fracture 541_3 545 733 0 100 0 0 0 0 0 0 0133541 Fracture 541_4 105 1851 0 100 0 0 0 0 0 0 0133541 Fracture 541_5 12034.5 24037 0 100 0 0 0 0 0 0 0133541 Fracture 541_6 8402.5 15704 0 100 0 0 0 0 0 0 0133541 Fracture 541_7 4911 9759.5 0 100 0 0 0 0 0 0 0133541 Fracture 541_8 4526 9563 0 100 0 0 0 0 0 0 0133541 Fracture 541_9 2246 4953 0 100 0 0 0 0 0 0 0133541 Fracture 541_10 10437 20670.5 0 100 0 0 0 0 0 0 0133541 Fracture 541_11 25450.5 49492 0 100 0 0 0 0 0 0 0133541 Fracture 541_12 929 1991.5 0 100 0 0 0 0 0 0 0133541 Fracture 541_13 4137 7583 0 100 0 0 0 0 0 0 0133541 Fracture 541_14 9474 16197 0 100 0 0 0 0 0 0 0
308

APPENDICES
309
APPENDIX 6 LA-ICP-MS Fluid Inclusion Analyses

Sample NoMin
StageVein Type
Inclusion
Type
Salinity
(equiv. wt %
NaCl
Mg/Na K/Na Cu/Na Zn/Na As/Na Sr/Na Ag/Na Ba/Na Pb/Na
1213279 I 2 aq-cb 3.05 0.028097 0.0007091213279 I 2 aq-cb 3.05 0.102929 0.194728 0.042546 0.000531 0.0005971213279 I 2 aq-cb 3.05 0.261015 0.071338 0.004984 0.000139 0.006633 0.0002451213279 I 2 aq-cb 3.05 0.128909 0.059892 0.0158901213279 I 2 aq-cb 3.05 0.0069431213279 I 2 aq-cb 3.05 0.202924 0.008094 0.003840 0.000246 0.000108 0.001913 0.0004891213279 I 2 aq-cb 3.05 0.149608 0.000225 0.000893 0.0031571213279 I 2 aq-cb 3.05 0.000526 0.001682 0.0004501213279 I 2 aq-cb 3.05 0.0350081213279 I 2 aq-cb 3.05 0.053482 0.069080 0.029639 0.000720 0.000368 0.002955 0.0009071213279 I 2 aq-cb 3.05 0.096602 0.028783 0.007310 0.000194 0.011923 0.0009571213279 I 2 aq-cb 3.05 0.069243 0.019671 0.000726 0.000140 0.0011931213279 I 2 aq-cb 3.05 0.007201 0.001668 0.000634 0.001317 0.0003761213279 I 2 aq-cb 3.05 0.007843 0.000586 0.002283 0.0007251213279 I 2 aq-cb 3.05 0.233990 0.130006 0.007989 0.001552 0.000305 0.0005491213279 I 2 aq-cb 3.05 0.014218 0.000163 0.0003031213279 I 2 aq-cb 3.05 0.005942 0.001558 0.000571 0.002156 0.0004111213279 I 2 aq-cb 3.05 0.098652 0.321233 0.0006871213279 I 2 aq-cb 3.051213279 I 2 aq-cb 3.05 0.361304 0.053635 0.009867 0.004415 0.000813 0.0014671213279 I 2 aq-cb 3.05 0.382257 0.006977 0.000551 0.0067811213279 I 2 aq-cb 3.05 0.151359 0.006897 0.001970 0.005719 0.0004021213279 I 2 aq-cb 3.05 0.406243 0.044501 0.0214931213279 I 2 aq-cb 3.05 0.394739 0.048872 0.0020811213279 I 2 aq-cb 3.05 0.002042 0.0013001213279 I 2 aq-cb 3.05 0.391012 0.071021 0.046828 0.006899 0.003725 0.0002851213279 I 2 aq-cb 3.05 0.249105 0.454627 0.022430 0.001105 0.000476 0.0034261213279 I 2 aq-cb 3.05 0.554715 0.0002371213279 I 2 aq-cb 3.05 0.356242 0.133949 0.053923 0.005757 0.018537 0.000441 0.0015221213279 I 2 aq-cb 3.05 0.013133 0.004571 0.010588 0.000209 0.0041721213279 I 2 aq-cb 3.05 0.265913 0.246106 0.013190 0.015190 0.002734 0.0016871213279 I 2 aq-cb 3.05 0.312217 0.171426 0.031619 0.010254 0.000571 0.0020411213279 I 2 aq-cb 3.05 0.100857 0.329980 0.014443 0.002545 0.000412 0.0029171213279 I 2 aq-cb 3.05 0.233837 0.224473 0.016104 0.028755 0.004406 0.001058 0.0041581213279 I 2 aq-cb 3.05 0.077791 0.478202 0.0006111213279 I 2 aq-cb 3.05 0.445825 0.042267 0.000287 0.0010661213279 I 2 aq-cb 3.05 0.227009 0.025295 0.004710 0.000293 0.0012731213279 I 2 aq-cb 3.05 0.079839 0.434813 0.023545 0.000571 0.000813 0.0034391213279 I 2 aq-cb 3.051213279 I 2 aq-cb 3.051213279 I 2 aq-cb 3.05 0.0090061213279 I 2 aq-cb 3.05 0.100243 0.000813 0.000212 0.001890 0.0004111213279 I 2 aq-cb 3.05 0.440472 0.006091 0.0124831213279 I 2 aq-cb 3.05 0.108768 0.517036 0.003044 0.000599 0.000462
310
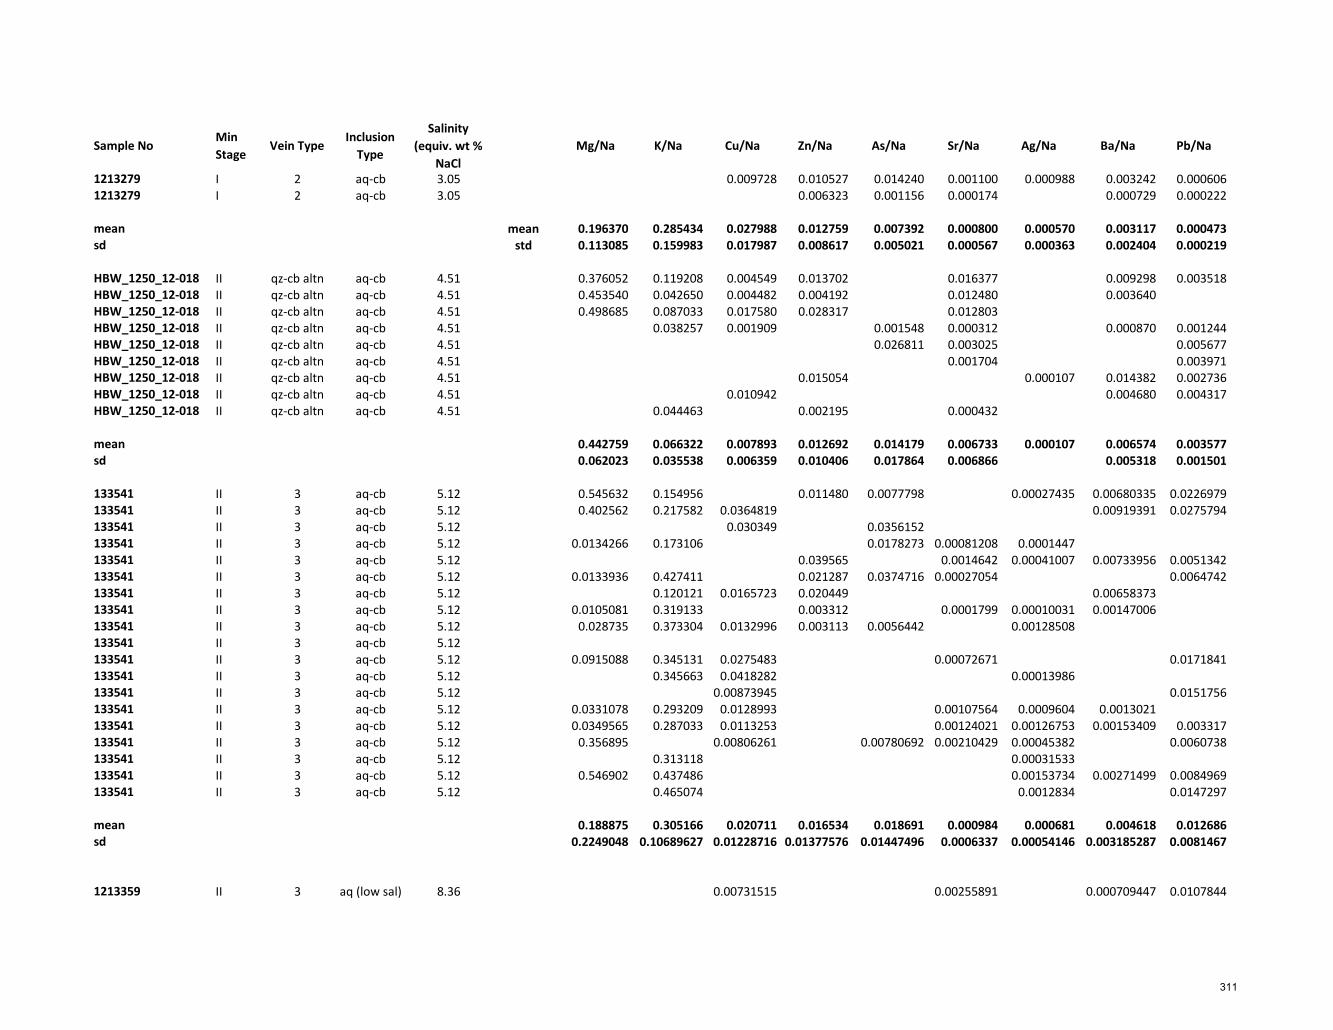
Sample NoMin
StageVein Type
Inclusion
Type
Salinity
(equiv. wt %
NaCl
Mg/Na K/Na Cu/Na Zn/Na As/Na Sr/Na Ag/Na Ba/Na Pb/Na
1213279 I 2 aq-cb 3.05 0.009728 0.010527 0.014240 0.001100 0.000988 0.003242 0.0006061213279 I 2 aq-cb 3.05 0.006323 0.001156 0.000174 0.000729 0.000222
mean mean 0.196370 0.285434 0.027988 0.012759 0.007392 0.000800 0.000570 0.003117 0.000473sd std 0.113085 0.159983 0.017987 0.008617 0.005021 0.000567 0.000363 0.002404 0.000219
HBW_1250_12-018 II qz-cb altn aq-cb 4.51 0.376052 0.119208 0.004549 0.013702 0.016377 0.009298 0.003518HBW_1250_12-018 II qz-cb altn aq-cb 4.51 0.453540 0.042650 0.004482 0.004192 0.012480 0.003640HBW_1250_12-018 II qz-cb altn aq-cb 4.51 0.498685 0.087033 0.017580 0.028317 0.012803HBW_1250_12-018 II qz-cb altn aq-cb 4.51 0.038257 0.001909 0.001548 0.000312 0.000870 0.001244HBW_1250_12-018 II qz-cb altn aq-cb 4.51 0.026811 0.003025 0.005677HBW_1250_12-018 II qz-cb altn aq-cb 4.51 0.001704 0.003971HBW_1250_12-018 II qz-cb altn aq-cb 4.51 0.015054 0.000107 0.014382 0.002736HBW_1250_12-018 II qz-cb altn aq-cb 4.51 0.010942 0.004680 0.004317HBW_1250_12-018 II qz-cb altn aq-cb 4.51 0.044463 0.002195 0.000432
mean 0.442759 0.066322 0.007893 0.012692 0.014179 0.006733 0.000107 0.006574 0.003577sd 0.062023 0.035538 0.006359 0.010406 0.017864 0.006866 0.005318 0.001501
133541 II 3 aq-cb 5.12 0.545632 0.154956 0.011480 0.0077798 0.00027435 0.00680335 0.0226979133541 II 3 aq-cb 5.12 0.402562 0.217582 0.0364819 0.00919391 0.0275794133541 II 3 aq-cb 5.12 0.030349 0.0356152133541 II 3 aq-cb 5.12 0.0134266 0.173106 0.0178273 0.00081208 0.0001447133541 II 3 aq-cb 5.12 0.039565 0.0014642 0.00041007 0.00733956 0.0051342133541 II 3 aq-cb 5.12 0.0133936 0.427411 0.021287 0.0374716 0.00027054 0.0064742133541 II 3 aq-cb 5.12 0.120121 0.0165723 0.020449 0.00658373133541 II 3 aq-cb 5.12 0.0105081 0.319133 0.003312 0.0001799 0.00010031 0.00147006133541 II 3 aq-cb 5.12 0.028735 0.373304 0.0132996 0.003113 0.0056442 0.00128508133541 II 3 aq-cb 5.12133541 II 3 aq-cb 5.12 0.0915088 0.345131 0.0275483 0.00072671 0.0171841133541 II 3 aq-cb 5.12 0.345663 0.0418282 0.00013986133541 II 3 aq-cb 5.12 0.00873945 0.0151756133541 II 3 aq-cb 5.12 0.0331078 0.293209 0.0128993 0.00107564 0.0009604 0.0013021133541 II 3 aq-cb 5.12 0.0349565 0.287033 0.0113253 0.00124021 0.00126753 0.00153409 0.003317133541 II 3 aq-cb 5.12 0.356895 0.00806261 0.00780692 0.00210429 0.00045382 0.0060738133541 II 3 aq-cb 5.12 0.313118 0.00031533133541 II 3 aq-cb 5.12 0.546902 0.437486 0.00153734 0.00271499 0.0084969133541 II 3 aq-cb 5.12 0.465074 0.0012834 0.0147297
mean 0.188875 0.305166 0.020711 0.016534 0.018691 0.000984 0.000681 0.004618 0.012686sd 0.2249048 0.10689627 0.01228716 0.01377576 0.01447496 0.0006337 0.00054146 0.003185287 0.0081467
1213359 II 3 aq (low sal) 8.36 0.00731515 0.00255891 0.000709447 0.0107844
311

Sample NoMin
StageVein Type
Inclusion
Type
Salinity
(equiv. wt %
NaCl
Mg/Na K/Na Cu/Na Zn/Na As/Na Sr/Na Ag/Na Ba/Na Pb/Na
1213359 II 3 aq (low sal) 8.36 0.1329941213359 II 3 aq (low sal) 8.36 0.0685528 0.270384 0.010582 0.000687251213359 II 3 aq (low sal) 8.36 0.0798921 0.3924 0.00644777 0.00946374 0.00103713 0.000595 0.00196211213359 II 3 aq (low sal) 8.36 0.272685 0.00163653 0.005596 0.0224773 0.00092989 0.00259431213359 II 3 aq (low sal) 8.36 0.0501835 0.209951 0.00592022 0.009226 0.00227697 0.00208971213359 II 3 aq (low sal) 8.36 0.272014 0.002971 0.0143143 0.000240871213359 II 3 aq (low sal) 8.36 0.00837466 0.0141742 0.00366726 0.000878225 0.00154891213359 II 3 aq (low sal) 8.36 0.0237979 0.484319 0.00813597 0.008389 0.00094207 0.00064816 0.00181437 0.00672311213359 II 3 aq (low sal) 8.36 0.0399475 0.232845 0.011101 0.016299 0.00398419 0.0037135 0.001655451213359 II 3 aq (low sal) 8.36 0.077152 0.426661 0.00462747 0.015170 0.000467181213359 II 3 aq (low sal) 8.36 0.0129497 0.261816 0.00103492 0.00352161213359 II 3 aq (low sal) 8.36 0.232947 0.00246622 0.000446671213359 II 3 aq (low sal) 8.36 0.0127851 0.465794 0.00318029 0.004744 0.00031976 0.000482106 0.00635041213359 II 3 aq (low sal) 8.36 0.20771 0.003456 0.00204146 0.0017976
mean 0.0456576 0.29711692 0.0063443 0.00823124 0.01089263 0.00224911 0.00052734 0.001278663 0.0044263sd 0.10928612 0.00314978 0.00512447 0.00781618 0.00139673 0.00013997 0.000589259 0.0032563
133541 Post Au 3 aq (high sal) 20.60 0.0116738 0.669757 0.00423093 8.44E-05 0.00045464 0.000509804 0.0006023133541 Post Au 3 aq (high sal) 20.60 0.0066753 0.551605 0.00416912 0.00012706 0.00018708 0.0007023133541 Post Au 3 aq (high sal) 20.60 0.0134009 0.605239 0.00016667 0.000272639133541 Post Au 3 aq (high sal) 20.60 0.642002 0.0037855 0.00191329 0.000337524 0.0007702133541 Post Au 3 aq (high sal) 20.60 0.0128196 0.576761 0.00484161 0.00012336 0.00252964 0.00038539 0.0001235133541 Post Au 3 aq (high sal) 20.60 0.0122512 0.66139 0.00176193 9.11E-05 0.0003028133541 Post Au 3 aq (high sal) 20.60 0.0096019 0.00296798 0.000287 9.81E-05 0.00073218 0.0004009133541 Post Au 3 aq (high sal) 20.60 0.0078167 0.00287035 0.000956 7.25E-05 0.00301395 0.000120544 0.0003849133541 Post Au 3 aq (high sal) 20.60 0.0075319 0.00235274 0.00013507 0.00177072 0.0002238133541 Post Au 3 aq (high sal) 20.60 0.0069164 0.58278 0.00332403 9.83E-05 0.0003594133541 Post Au 3 aq (high sal) 20.60 0.0036667 0.823269 0.00251524 7.55E-05133541 Post Au 3 aq (high sal) 20.60 0.0071198 0.856597 0.001822 0.00215617 0.0002558133541 Post Au 3 aq (high sal) 20.60 0.552908 0.00225278 1.83E-05133541 Post Au 3 aq (high sal) 20.60 0.0060826 0.622222 0.00754104 0.00013485 0.0002701
mean 0.64950273 0.0035511 0.00102157 0.00010211 0.0017958 0.000302164 0.0003996sd 0.10249481 0.00155899 0.00076999 3.8701E-05 0.00092166 0.000140281 0.0002063
HBW_1250_12-018 Post Au qz-cb altn aq (high sal) 21.00 0.028771 0.050000 0.001053 0.000145 0.000828 0.000018 0.001252 0.001566HBW_1250_12-018 Post Au qz-cb altn aq (high sal) 21.00 0.021329 0.391930 0.000751 0.013576 0.005051HBW_1250_12-018 Post Au qz-cb altn aq (high sal) 21.00 0.050000 0.003389 0.000406 0.004822HBW_1250_12-018 Post Au qz-cb altn aq (high sal) 21.00 0.069384 0.453569 0.012583 0.000189 0.000676 0.001096
mean 0.0150027 0.52011921 0.00380874 0.00083351 0.00016403 0.00139438 0.001991437 0.0007947sd 0.21667324 0.00609534 0.00032482 0.00040317 0.006340856 0.0021606
312

Sample NoMin
StageVein Type
Inclusion
Type
Salinity
(equiv. wt
% NaCl
Ca/Na Mn/Na Fe/Na Mo/Na Sn/Na Cs/Na W/Na Th/Na U/Na
1213279 I 2 aq-cb 3.05 0.280817 0.000453 0.0002266 0.0001353
1213279 I 2 aq-cb 3.05 0.452375 0.000202 0.001327
1213279 I 2 aq-cb 3.05 0.874771 0.021779 0.0005572
1213279 I 2 aq-cb 3.05 0.060310 0.003007 0.0004472
1213279 I 2 aq-cb 3.05 0.596489
1213279 I 2 aq-cb 3.05 0.014312 0.001161 0.0003291
1213279 I 2 aq-cb 3.05 0.004796 0.037043 0.0001459 0.0000351 0.0005316
1213279 I 2 aq-cb 3.05 0.002295 0.0003262 0.0005096
1213279 I 2 aq-cb 3.05 0.007439 0.011083 0.0011115
1213279 I 2 aq-cb 3.05 0.000756 0.0002405
1213279 I 2 aq-cb 3.05 0.002938 0.028199 0.0000130 0.0008503
1213279 I 2 aq-cb 3.05 0.003959 0.001415 0.0001947 0.0020055 0.0007981
1213279 I 2 aq-cb 3.05 0.001830 0.0004560
1213279 I 2 aq-cb 3.05 0.0003719 0.0020432 0.0006098
1213279 I 2 aq-cb 3.05
1213279 I 2 aq-cb 3.05 0.032000 0.000524 0.000919 0.0000410 0.0001374
1213279 I 2 aq-cb 3.05 0.022451 0.0000539 0.0001089 0.0000161
1213279 I 2 aq-cb 3.05 0.056738 0.004780 0.0000746 0.0005909 0.0001745
1213279 I 2 aq-cb 3.05 0.072320 0.000658 0.002117 0.0007289 0.0002870
1213279 I 2 aq-cb 3.05 0.058473 0.001390 0.0003088 0.0001823
1213279 I 2 aq-cb 3.05 0.202766 0.063975 0.000785 0.003677 0.0000826 0.0006113 0.0003610
1213279 I 2 aq-cb 3.05 0.000623 0.002963 0.0004424 0.0001408
1213279 I 2 aq-cb 3.05 0.002125 0.0000360 0.0003555
1213279 I 2 aq-cb 3.05 0.006342 0.007162 0.0007913
1213279 I 2 aq-cb 3.05 0.0014680 0.0017526
1213279 I 2 aq-cb 3.05 0.065712 0.004488 0.0002902
1213279 I 2 aq-cb 3.05
1213279 I 2 aq-cb 3.05 0.006145 0.0004289 0.0002533 0.0002560
1213279 I 2 aq-cb 3.05 0.004445 0.0011669 0.0004644
mean 0.481444 0.004783 0.039338 0.000994 0.003409 0.0001685 0.0008070 0.0002043 0.0006419
sd 0.26772145 0.00192676 0.0228528 0.00064935 0.0019371 0.0001461 0.0006564 0.0001379 0.0004152
HBW_1250_12-018 II qz-cb altn aq-cb 4.51 0.015691 0.000000 0.0254157
HBW_1250_12-018 II qz-cb altn aq-cb 4.51 0.023103 0.000262 0.000543 0.0000344 0.0337053 0.0004918
HBW_1250_12-018 II qz-cb altn aq-cb 4.51 0.168246 0.001719 0.091019 0.001342 0.003385 0.0000975
HBW_1250_12-018 II qz-cb altn aq-cb 4.51 0.084938 0.002458 0.037214 0.001358 0.003506 0.0645274 0.0004245
HBW_1250_12-018 II qz-cb altn aq-cb 4.51 0.039993 0.019833 0.001435 0.001565 0.0200940 0.0002991
HBW_1250_12-018 II qz-cb altn aq-cb 4.51 0.026597 0.000176 0.0132113
HBW_1250_12-018 II qz-cb altn aq-cb 4.51 0.009255 0.005236
313
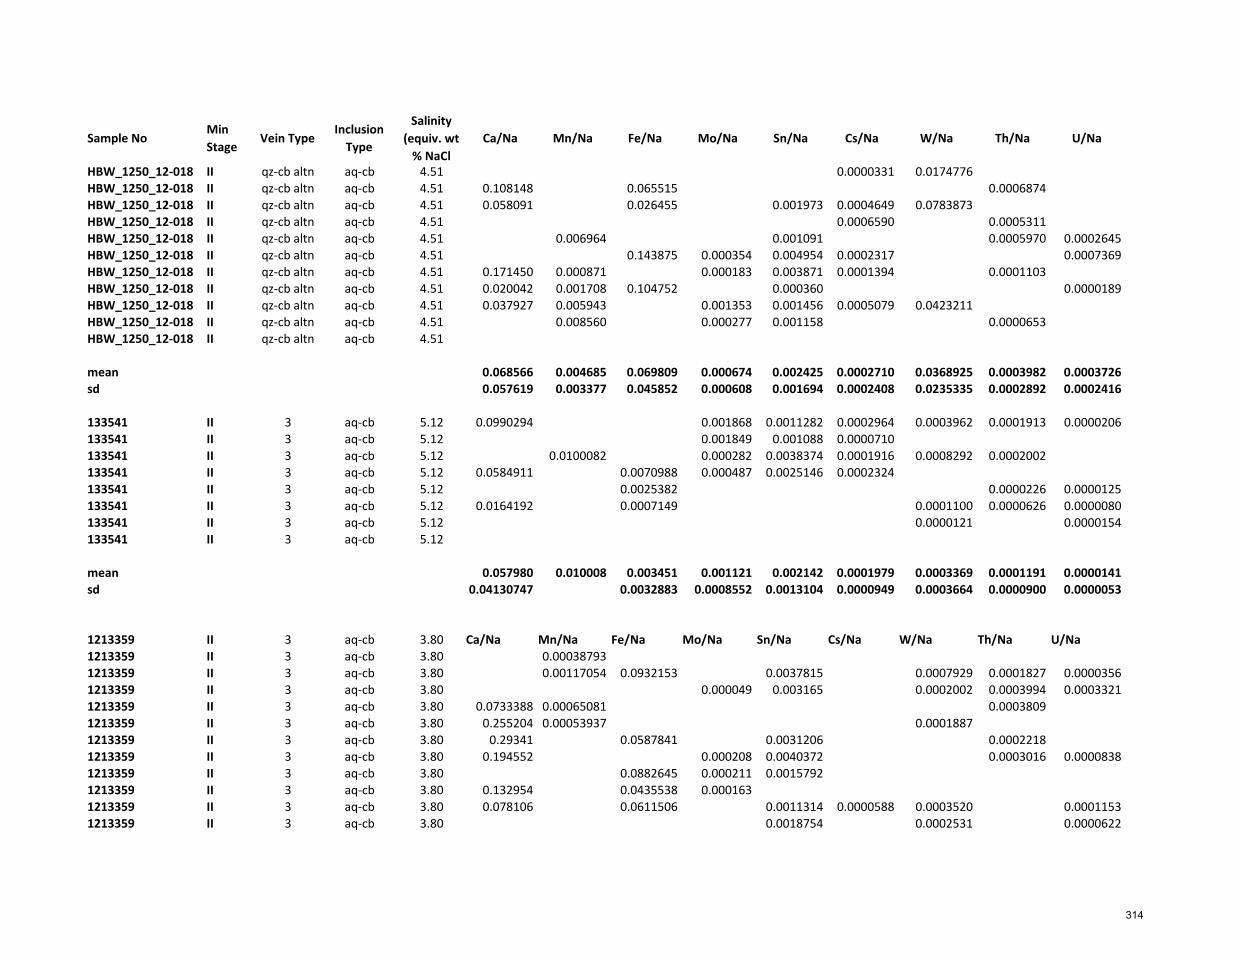
Sample NoMin
StageVein Type
Inclusion
Type
Salinity
(equiv. wt
% NaCl
Ca/Na Mn/Na Fe/Na Mo/Na Sn/Na Cs/Na W/Na Th/Na U/Na
HBW_1250_12-018 II qz-cb altn aq-cb 4.51 0.0000331 0.0174776
HBW_1250_12-018 II qz-cb altn aq-cb 4.51 0.108148 0.065515 0.0006874
HBW_1250_12-018 II qz-cb altn aq-cb 4.51 0.058091 0.026455 0.001973 0.0004649 0.0783873
HBW_1250_12-018 II qz-cb altn aq-cb 4.51 0.0006590 0.0005311
HBW_1250_12-018 II qz-cb altn aq-cb 4.51 0.006964 0.001091 0.0005970 0.0002645
HBW_1250_12-018 II qz-cb altn aq-cb 4.51 0.143875 0.000354 0.004954 0.0002317 0.0007369
HBW_1250_12-018 II qz-cb altn aq-cb 4.51 0.171450 0.000871 0.000183 0.003871 0.0001394 0.0001103
HBW_1250_12-018 II qz-cb altn aq-cb 4.51 0.020042 0.001708 0.104752 0.000360 0.0000189
HBW_1250_12-018 II qz-cb altn aq-cb 4.51 0.037927 0.005943 0.001353 0.001456 0.0005079 0.0423211
HBW_1250_12-018 II qz-cb altn aq-cb 4.51 0.008560 0.000277 0.001158 0.0000653
HBW_1250_12-018 II qz-cb altn aq-cb 4.51
mean 0.068566 0.004685 0.069809 0.000674 0.002425 0.0002710 0.0368925 0.0003982 0.0003726
sd 0.057619 0.003377 0.045852 0.000608 0.001694 0.0002408 0.0235335 0.0002892 0.0002416
133541 II 3 aq-cb 5.12 0.0990294 0.001868 0.0011282 0.0002964 0.0003962 0.0001913 0.0000206
133541 II 3 aq-cb 5.12 0.001849 0.001088 0.0000710
133541 II 3 aq-cb 5.12 0.0100082 0.000282 0.0038374 0.0001916 0.0008292 0.0002002
133541 II 3 aq-cb 5.12 0.0584911 0.0070988 0.000487 0.0025146 0.0002324
133541 II 3 aq-cb 5.12 0.0025382 0.0000226 0.0000125
133541 II 3 aq-cb 5.12 0.0164192 0.0007149 0.0001100 0.0000626 0.0000080
133541 II 3 aq-cb 5.12 0.0000121 0.0000154
133541 II 3 aq-cb 5.12
mean 0.057980 0.010008 0.003451 0.001121 0.002142 0.0001979 0.0003369 0.0001191 0.0000141
sd 0.04130747 0.0032883 0.0008552 0.0013104 0.0000949 0.0003664 0.0000900 0.0000053
1213359 II 3 aq-cb 3.80 Ca/Na Mn/Na Fe/Na Mo/Na Sn/Na Cs/Na W/Na Th/Na U/Na
1213359 II 3 aq-cb 3.80 0.00038793
1213359 II 3 aq-cb 3.80 0.00117054 0.0932153 0.0037815 0.0007929 0.0001827 0.0000356
1213359 II 3 aq-cb 3.80 0.000049 0.003165 0.0002002 0.0003994 0.0003321
1213359 II 3 aq-cb 3.80 0.0733388 0.00065081 0.0003809
1213359 II 3 aq-cb 3.80 0.255204 0.00053937 0.0001887
1213359 II 3 aq-cb 3.80 0.29341 0.0587841 0.0031206 0.0002218
1213359 II 3 aq-cb 3.80 0.194552 0.000208 0.0040372 0.0003016 0.0000838
1213359 II 3 aq-cb 3.80 0.0882645 0.000211 0.0015792
1213359 II 3 aq-cb 3.80 0.132954 0.0435538 0.000163
1213359 II 3 aq-cb 3.80 0.078106 0.0611506 0.0011314 0.0000588 0.0003520 0.0001153
1213359 II 3 aq-cb 3.80 0.0018754 0.0002531 0.0000622
314
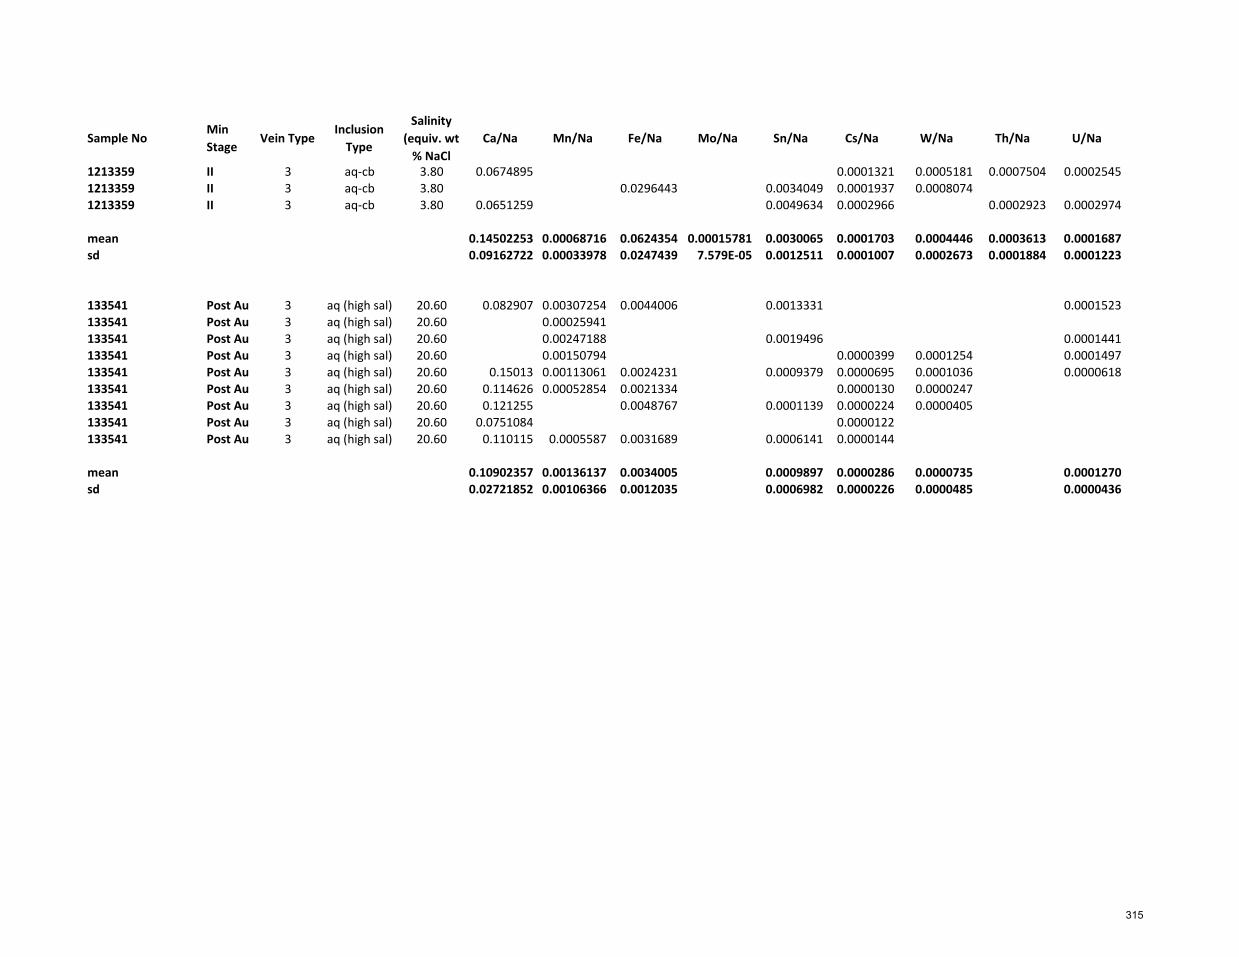
Sample NoMin
StageVein Type
Inclusion
Type
Salinity
(equiv. wt
% NaCl
Ca/Na Mn/Na Fe/Na Mo/Na Sn/Na Cs/Na W/Na Th/Na U/Na
1213359 II 3 aq-cb 3.80 0.0674895 0.0001321 0.0005181 0.0007504 0.0002545
1213359 II 3 aq-cb 3.80 0.0296443 0.0034049 0.0001937 0.0008074
1213359 II 3 aq-cb 3.80 0.0651259 0.0049634 0.0002966 0.0002923 0.0002974
mean 0.14502253 0.00068716 0.0624354 0.00015781 0.0030065 0.0001703 0.0004446 0.0003613 0.0001687
sd 0.09162722 0.00033978 0.0247439 7.579E-05 0.0012511 0.0001007 0.0002673 0.0001884 0.0001223
133541 Post Au 3 aq (high sal) 20.60 0.082907 0.00307254 0.0044006 0.0013331 0.0001523
133541 Post Au 3 aq (high sal) 20.60 0.00025941
133541 Post Au 3 aq (high sal) 20.60 0.00247188 0.0019496 0.0001441
133541 Post Au 3 aq (high sal) 20.60 0.00150794 0.0000399 0.0001254 0.0001497
133541 Post Au 3 aq (high sal) 20.60 0.15013 0.00113061 0.0024231 0.0009379 0.0000695 0.0001036 0.0000618
133541 Post Au 3 aq (high sal) 20.60 0.114626 0.00052854 0.0021334 0.0000130 0.0000247
133541 Post Au 3 aq (high sal) 20.60 0.121255 0.0048767 0.0001139 0.0000224 0.0000405
133541 Post Au 3 aq (high sal) 20.60 0.0751084 0.0000122
133541 Post Au 3 aq (high sal) 20.60 0.110115 0.0005587 0.0031689 0.0006141 0.0000144
mean 0.10902357 0.00136137 0.0034005 0.0009897 0.0000286 0.0000735 0.0001270
sd 0.02721852 0.00106366 0.0012035 0.0006982 0.0000226 0.0000485 0.0000436
315
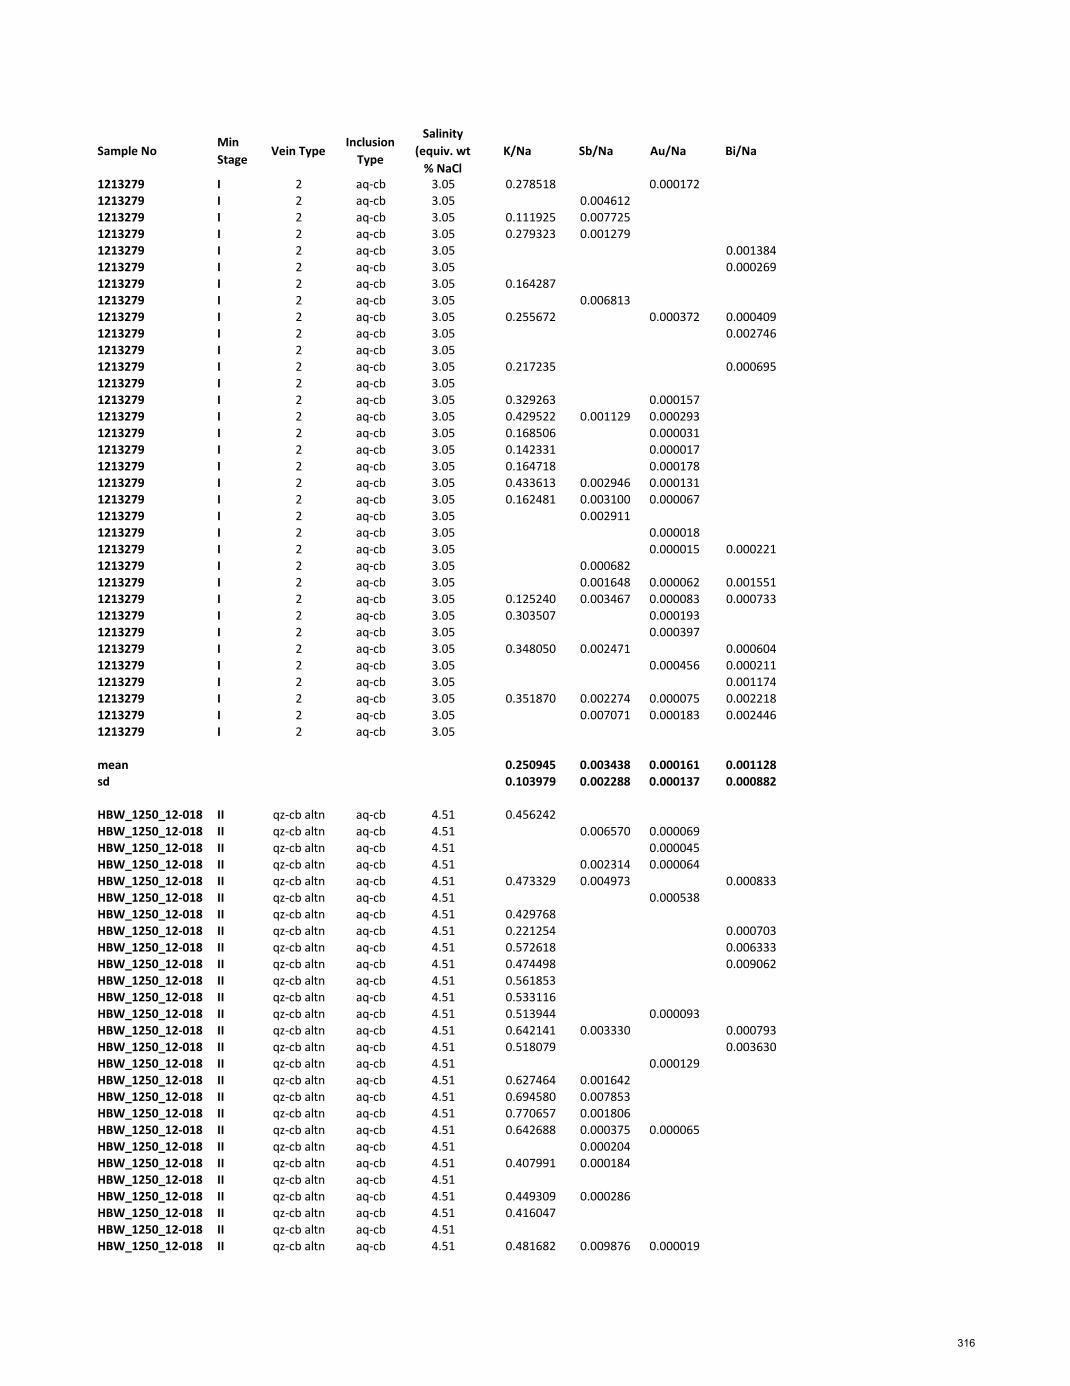
Sample NoMin
StageVein Type
Inclusion
Type
Salinity
(equiv. wt
% NaCl
K/Na Sb/Na Au/Na Bi/Na
1213279 I 2 aq-cb 3.05 0.278518 0.000172
1213279 I 2 aq-cb 3.05 0.004612
1213279 I 2 aq-cb 3.05 0.111925 0.007725
1213279 I 2 aq-cb 3.05 0.279323 0.001279
1213279 I 2 aq-cb 3.05 0.001384
1213279 I 2 aq-cb 3.05 0.000269
1213279 I 2 aq-cb 3.05 0.164287
1213279 I 2 aq-cb 3.05 0.006813
1213279 I 2 aq-cb 3.05 0.255672 0.000372 0.000409
1213279 I 2 aq-cb 3.05 0.002746
1213279 I 2 aq-cb 3.05
1213279 I 2 aq-cb 3.05 0.217235 0.000695
1213279 I 2 aq-cb 3.05
1213279 I 2 aq-cb 3.05 0.329263 0.000157
1213279 I 2 aq-cb 3.05 0.429522 0.001129 0.000293
1213279 I 2 aq-cb 3.05 0.168506 0.000031
1213279 I 2 aq-cb 3.05 0.142331 0.000017
1213279 I 2 aq-cb 3.05 0.164718 0.000178
1213279 I 2 aq-cb 3.05 0.433613 0.002946 0.000131
1213279 I 2 aq-cb 3.05 0.162481 0.003100 0.000067
1213279 I 2 aq-cb 3.05 0.002911
1213279 I 2 aq-cb 3.05 0.000018
1213279 I 2 aq-cb 3.05 0.000015 0.000221
1213279 I 2 aq-cb 3.05 0.000682
1213279 I 2 aq-cb 3.05 0.001648 0.000062 0.001551
1213279 I 2 aq-cb 3.05 0.125240 0.003467 0.000083 0.000733
1213279 I 2 aq-cb 3.05 0.303507 0.000193
1213279 I 2 aq-cb 3.05 0.000397
1213279 I 2 aq-cb 3.05 0.348050 0.002471 0.000604
1213279 I 2 aq-cb 3.05 0.000456 0.000211
1213279 I 2 aq-cb 3.05 0.001174
1213279 I 2 aq-cb 3.05 0.351870 0.002274 0.000075 0.002218
1213279 I 2 aq-cb 3.05 0.007071 0.000183 0.002446
1213279 I 2 aq-cb 3.05
mean 0.250945 0.003438 0.000161 0.001128
sd 0.103979 0.002288 0.000137 0.000882
HBW_1250_12-018 II qz-cb altn aq-cb 4.51 0.456242
HBW_1250_12-018 II qz-cb altn aq-cb 4.51 0.006570 0.000069
HBW_1250_12-018 II qz-cb altn aq-cb 4.51 0.000045
HBW_1250_12-018 II qz-cb altn aq-cb 4.51 0.002314 0.000064
HBW_1250_12-018 II qz-cb altn aq-cb 4.51 0.473329 0.004973 0.000833
HBW_1250_12-018 II qz-cb altn aq-cb 4.51 0.000538
HBW_1250_12-018 II qz-cb altn aq-cb 4.51 0.429768
HBW_1250_12-018 II qz-cb altn aq-cb 4.51 0.221254 0.000703
HBW_1250_12-018 II qz-cb altn aq-cb 4.51 0.572618 0.006333
HBW_1250_12-018 II qz-cb altn aq-cb 4.51 0.474498 0.009062
HBW_1250_12-018 II qz-cb altn aq-cb 4.51 0.561853
HBW_1250_12-018 II qz-cb altn aq-cb 4.51 0.533116
HBW_1250_12-018 II qz-cb altn aq-cb 4.51 0.513944 0.000093
HBW_1250_12-018 II qz-cb altn aq-cb 4.51 0.642141 0.003330 0.000793
HBW_1250_12-018 II qz-cb altn aq-cb 4.51 0.518079 0.003630
HBW_1250_12-018 II qz-cb altn aq-cb 4.51 0.000129
HBW_1250_12-018 II qz-cb altn aq-cb 4.51 0.627464 0.001642
HBW_1250_12-018 II qz-cb altn aq-cb 4.51 0.694580 0.007853
HBW_1250_12-018 II qz-cb altn aq-cb 4.51 0.770657 0.001806
HBW_1250_12-018 II qz-cb altn aq-cb 4.51 0.642688 0.000375 0.000065
HBW_1250_12-018 II qz-cb altn aq-cb 4.51 0.000204
HBW_1250_12-018 II qz-cb altn aq-cb 4.51 0.407991 0.000184
HBW_1250_12-018 II qz-cb altn aq-cb 4.51
HBW_1250_12-018 II qz-cb altn aq-cb 4.51 0.449309 0.000286
HBW_1250_12-018 II qz-cb altn aq-cb 4.51 0.416047
HBW_1250_12-018 II qz-cb altn aq-cb 4.51
HBW_1250_12-018 II qz-cb altn aq-cb 4.51 0.481682 0.009876 0.000019
316
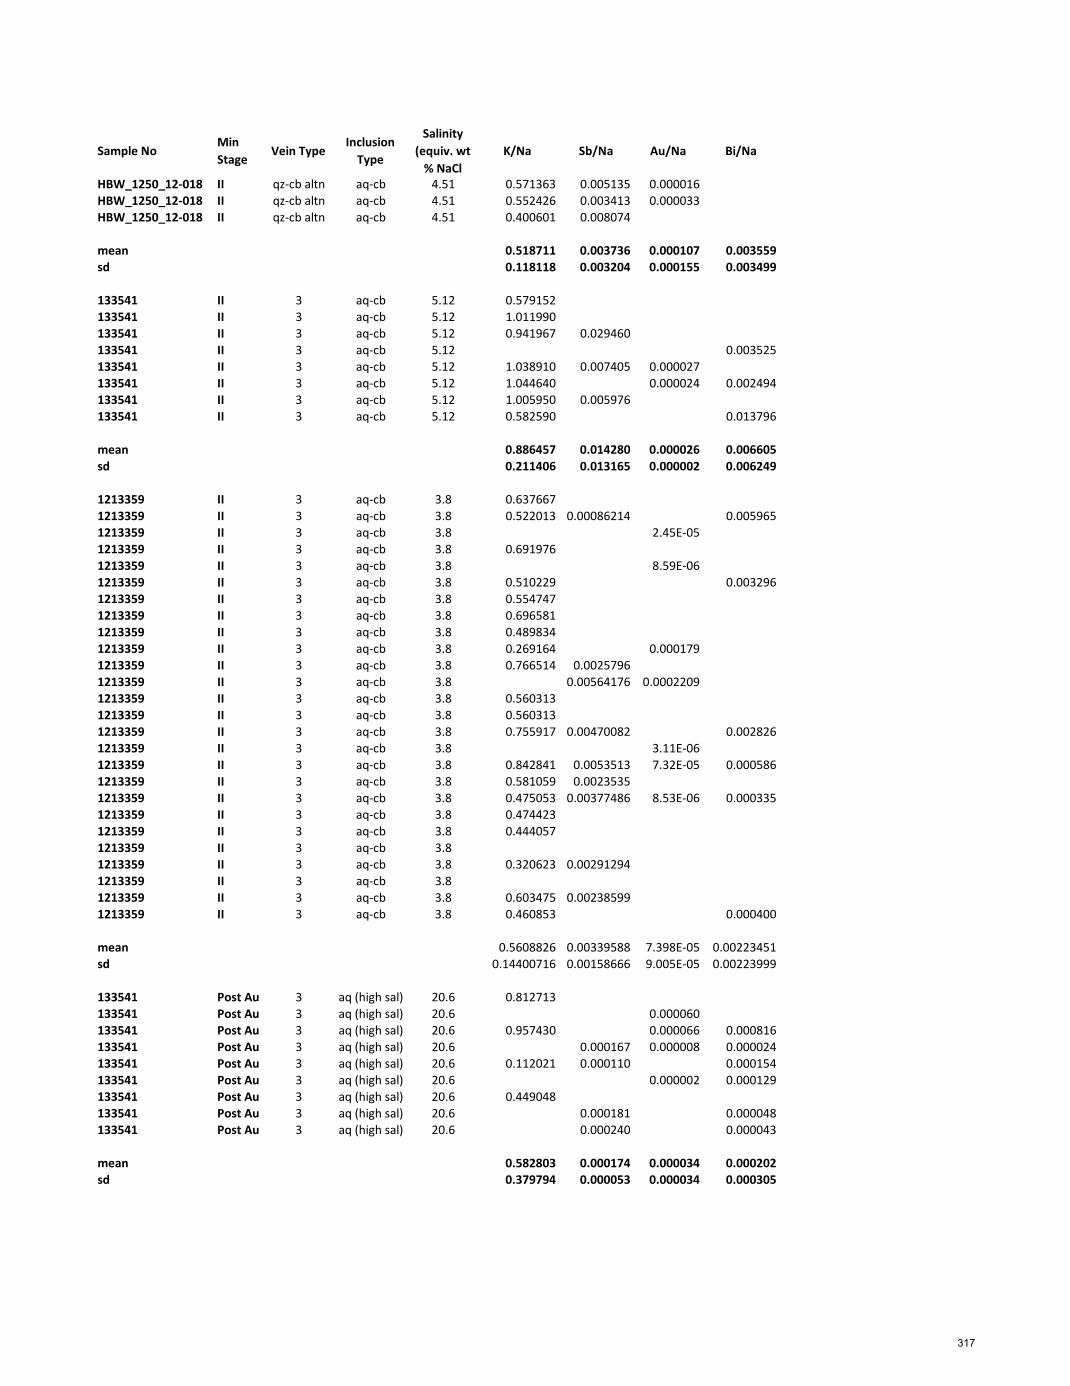
Sample NoMin
StageVein Type
Inclusion
Type
Salinity
(equiv. wt
% NaCl
K/Na Sb/Na Au/Na Bi/Na
HBW_1250_12-018 II qz-cb altn aq-cb 4.51 0.571363 0.005135 0.000016
HBW_1250_12-018 II qz-cb altn aq-cb 4.51 0.552426 0.003413 0.000033
HBW_1250_12-018 II qz-cb altn aq-cb 4.51 0.400601 0.008074
mean 0.518711 0.003736 0.000107 0.003559
sd 0.118118 0.003204 0.000155 0.003499
133541 II 3 aq-cb 5.12 0.579152
133541 II 3 aq-cb 5.12 1.011990
133541 II 3 aq-cb 5.12 0.941967 0.029460
133541 II 3 aq-cb 5.12 0.003525
133541 II 3 aq-cb 5.12 1.038910 0.007405 0.000027
133541 II 3 aq-cb 5.12 1.044640 0.000024 0.002494
133541 II 3 aq-cb 5.12 1.005950 0.005976
133541 II 3 aq-cb 5.12 0.582590 0.013796
mean 0.886457 0.014280 0.000026 0.006605
sd 0.211406 0.013165 0.000002 0.006249
1213359 II 3 aq-cb 3.8 0.637667
1213359 II 3 aq-cb 3.8 0.522013 0.00086214 0.005965
1213359 II 3 aq-cb 3.8 2.45E-05
1213359 II 3 aq-cb 3.8 0.691976
1213359 II 3 aq-cb 3.8 8.59E-06
1213359 II 3 aq-cb 3.8 0.510229 0.003296
1213359 II 3 aq-cb 3.8 0.554747
1213359 II 3 aq-cb 3.8 0.696581
1213359 II 3 aq-cb 3.8 0.489834
1213359 II 3 aq-cb 3.8 0.269164 0.000179
1213359 II 3 aq-cb 3.8 0.766514 0.0025796
1213359 II 3 aq-cb 3.8 0.00564176 0.0002209
1213359 II 3 aq-cb 3.8 0.560313
1213359 II 3 aq-cb 3.8 0.560313
1213359 II 3 aq-cb 3.8 0.755917 0.00470082 0.002826
1213359 II 3 aq-cb 3.8 3.11E-06
1213359 II 3 aq-cb 3.8 0.842841 0.0053513 7.32E-05 0.000586
1213359 II 3 aq-cb 3.8 0.581059 0.0023535
1213359 II 3 aq-cb 3.8 0.475053 0.00377486 8.53E-06 0.000335
1213359 II 3 aq-cb 3.8 0.474423
1213359 II 3 aq-cb 3.8 0.444057
1213359 II 3 aq-cb 3.8
1213359 II 3 aq-cb 3.8 0.320623 0.00291294
1213359 II 3 aq-cb 3.8
1213359 II 3 aq-cb 3.8 0.603475 0.00238599
1213359 II 3 aq-cb 3.8 0.460853 0.000400
mean 0.5608826 0.00339588 7.398E-05 0.00223451
sd 0.14400716 0.00158666 9.005E-05 0.00223999
133541 Post Au 3 aq (high sal) 20.6 0.812713
133541 Post Au 3 aq (high sal) 20.6 0.000060
133541 Post Au 3 aq (high sal) 20.6 0.957430 0.000066 0.000816
133541 Post Au 3 aq (high sal) 20.6 0.000167 0.000008 0.000024
133541 Post Au 3 aq (high sal) 20.6 0.112021 0.000110 0.000154
133541 Post Au 3 aq (high sal) 20.6 0.000002 0.000129
133541 Post Au 3 aq (high sal) 20.6 0.449048
133541 Post Au 3 aq (high sal) 20.6 0.000181 0.000048
133541 Post Au 3 aq (high sal) 20.6 0.000240 0.000043
mean 0.582803 0.000174 0.000034 0.000202
sd 0.379794 0.000053 0.000034 0.000305
317

Sample NoMin
StageVein Type
Inclusion
Type
Salinity
(equiv. wt
% NaCl
Au/Na
1213279 I 2 aq-cb 3.05 0.001927
1213279 I 2 aq-cb 3.05 0.001799
1213279 I 2 aq-cb 3.05 0.000384
1213279 I 2 aq-cb 3.05 0.000444
1213279 I 2 aq-cb 3.05 0.000145
1213279 I 2 aq-cb 3.05 0.000180
1213279 I 2 aq-cb 3.05 0.000287
1213279 I 2 aq-cb 3.05 0.000073
1213279 I 2 aq-cb 3.05 0.000721
1213279 I 2 aq-cb 3.05 0.000381
1213279 I 2 aq-cb 3.05 0.000416
1213279 I 2 aq-cb 3.05 0.000139
1213279 I 2 aq-cb 3.05 0.000111
1213279 I 2 aq-cb 3.05 0.001554
1213279 I 2 aq-cb 3.05 0.000716
1213279 I 2 aq-cb 3.05 0.000276
1213279 I 2 aq-cb 3.05 0.000458
1213279 I 2 aq-cb 3.05 0.008821
1213279 I 2 aq-cb 3.05 0.002366
1213279 I 2 aq-cb 3.05 0.000092
1213279 I 2 aq-cb 3.05 0.000530
1213279 I 2 aq-cb 3.05 0.001004
1213279 I 2 aq-cb 3.05 0.001262
1213279 I 2 aq-cb 3.05 0.001062
1213279 I 2 aq-cb 3.05 0.000452
1213279 I 2 aq-cb 3.05 0.000280
1213279 I 2 aq-cb 3.05 0.002712
1213279 I 2 aq-cb 3.05 0.000422
1213279 I 2 aq-cb 3.05 0.004642
1213279 I 2 aq-cb 3.05 0.000108
1213279 I 2 aq-cb 3.05 0.000888
1213279 I 2 aq-cb 3.05 0.000560
1213279 I 2 aq-cb 3.05 0.000097
1213279 I 2 aq-cb 3.05 0.000135
1213279 I 2 aq-cb 3.05 0.000026
1213279 I 2 aq-cb 3.05 0.000043
1213279 I 2 aq-cb 3.05 0.000607
1213279 I 2 aq-cb 3.05 0.000542
1213279 I 2 aq-cb 3.05 0.000221
1213279 I 2 aq-cb 3.05 0.000111
1213279 I 2 aq-cb 3.05 0.003680
1213279 I 2 aq-cb 3.05 0.006658
1213279 I 2 aq-cb 3.05 0.000040
1213279 I 2 aq-cb 3.05 0.000308
1213279 I 2 aq-cb 3.05 0.000172
1213279 I 2 aq-cb 3.05 0.000372
1213279 I 2 aq-cb 3.05 0.000157
1213279 I 2 aq-cb 3.05 0.000293
1213279 I 2 aq-cb 3.05 0.000031
1213279 I 2 aq-cb 3.05 0.000017
1213279 I 2 aq-cb 3.05 0.000178
1213279 I 2 aq-cb 3.05 0.000131
1213279 I 2 aq-cb 3.05 0.000067
1213279 I 2 aq-cb 3.05 0.000018
1213279 I 2 aq-cb 3.05 0.000015
1213279 I 2 aq-cb 3.05 0.000062
1213279 I 2 aq-cb 3.05 0.000083
1213279 I 2 aq-cb 3.05 0.000193
1213279 I 2 aq-cb 3.05 0.000397
1213279 I 2 aq-cb 3.05 0.000456
1213279 I 2 aq-cb 3.05 0.000075
1213279 I 2 aq-cb 3.05 0.000183
mean 0.000816
sd 0.0015559
HBW_1250_12-018 II qz-cb altn aq-cb 4.51 0.000051
HBW_1250_12-018 II qz-cb altn aq-cb 4.51 0.000863
HBW_1250_12-018 II qz-cb altn aq-cb 4.51 0.001620
HBW_1250_12-018 II qz-cb altn aq-cb 4.51 0.000162
HBW_1250_12-018 II qz-cb altn aq-cb 4.51 0.000234
318

Sample NoMin
StageVein Type
Inclusion
Type
Salinity
(equiv. wt
% NaCl
Au/Na
HBW_1250_12-018 II qz-cb altn aq-cb 4.51 0.003996
HBW_1250_12-018 II qz-cb altn aq-cb 4.51 0.003536
HBW_1250_12-018 II qz-cb altn aq-cb 4.51 0.000362
HBW_1250_12-018 II qz-cb altn aq-cb 4.51 0.001397
HBW_1250_12-018 II qz-cb altn aq-cb 4.51 0.000828
HBW_1250_12-018 II qz-cb altn aq-cb 4.51 0.001591
HBW_1250_12-018 II qz-cb altn aq-cb 4.51 0.000069
HBW_1250_12-018 II qz-cb altn aq-cb 4.51 0.000045
HBW_1250_12-018 II qz-cb altn aq-cb 4.51 0.000064
HBW_1250_12-018 II qz-cb altn aq-cb 4.51 0.000538
HBW_1250_12-018 II qz-cb altn aq-cb 4.51 0.000093
HBW_1250_12-018 II qz-cb altn aq-cb 4.51 0.000129
HBW_1250_12-018 II qz-cb altn aq-cb 4.51 0.000065
HBW_1250_12-018 II qz-cb altn aq-cb 4.51 0.000019
HBW_1250_12-018 II qz-cb altn aq-cb 4.51 0.000016
HBW_1250_12-018 II qz-cb altn aq-cb 4.51 0.000033
mean 0.000748
sd 0.0011358
133541 II 3 aq-cb 5.12 0.001537
133541 II 3 aq-cb 5.12 0.001607
133541 II 3 aq-cb 5.12 0.000320
133541 II 3 aq-cb 5.12 0.001109
133541 II 3 aq-cb 5.12 0.000280
133541 II 3 aq-cb 5.12 0.000198
133541 II 3 aq-cb 5.12 0.000005
133541 II 3 aq-cb 5.12 0.000157
133541 II 3 aq-cb 5.12 0.000019
133541 II 3 aq-cb 5.12 0.000575
133541 II 3 aq-cb 5.12 0.001326
133541 II 3 aq-cb 5.12 0.000033
133541 II 3 aq-cb 5.12 0.000128
133541 II 3 aq-cb 5.12 0.000330
133541 II 3 aq-cb 5.12 0.000028
133541 II 3 aq-cb 5.12 0.001407
133541 II 3 aq-cb 5.12 0.000023
133541 II 3 aq-cb 5.12 0.000067
133541 II 3 aq-cb 5.12 0.000081
mean 0.0004858
sd 0.0005843
1213359 II 3 aq-cb 3.8 0.000118
1213359 II 3 aq-cb 3.8 0.000509
1213359 II 3 aq-cb 3.8 0.001193
1213359 II 3 aq-cb 3.8 0.000213
1213359 II 3 aq-cb 3.8 0.000270
1213359 II 3 aq-cb 3.8 0.000117
1213359 II 3 aq-cb 3.8 0.000118
1213359 II 3 aq-cb 3.8 0.000083
1213359 II 3 aq-cb 3.8 0.002107
1213359 II 3 aq-cb 3.8 0.001450
1213359 II 3 aq-cb 3.8 0.000083
1213359 II 3 aq-cb 3.8 0.000122
1213359 II 3 aq-cb 3.8 0.002151
1213359 II 3 aq-cb 3.8 0.000187
1213359 II 3 aq-cb 3.8 0.001944
1213359 II 3 aq-cb 3.8 0.000822
1213359 II 3 aq-cb 3.8 0.000079
1213359 II 3 aq-cb 3.8 0.000105
1213359 II 3 aq-cb 3.8 0.002386
1213359 II 3 aq-cb 3.8 0.000091
1213359 II 3 aq-cb 3.8 0.000185
mean 0.000587
sd 0.0006991
319

APPENDICES
320
APPENDIX 7 Sulfur Isotopic Analyses
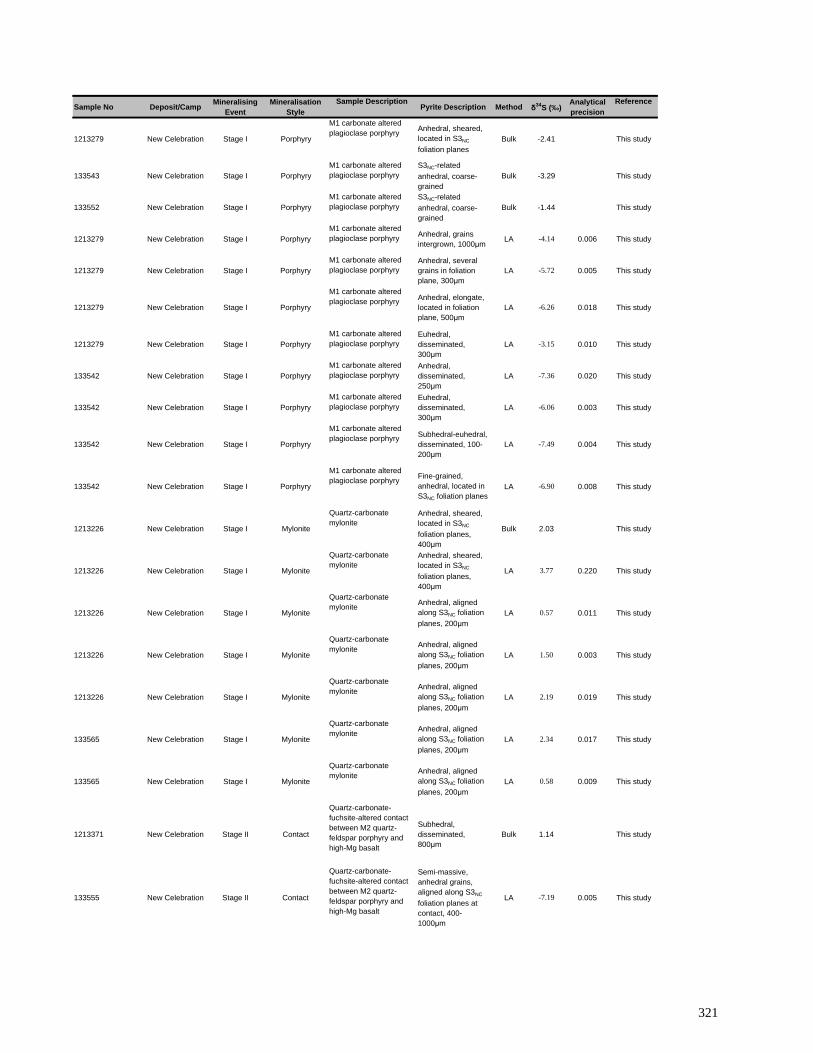
Sample No Deposit/Camp Mineralising Event
Mineralisation Style
Sample DescriptionPyrite Description Method δ34S (‰)
Analytical precision
Reference
1213279 New Celebration Stage I Porphyry
M1 carbonate altered plagioclase porphyry Anhedral, sheared,
located in S3NC
foliation planesBulk -2.41 This study
133543 New Celebration Stage I PorphyryM1 carbonate altered plagioclase porphyry
S3NC-related anhedral, coarse-grained
Bulk -3.29 This study
133552 New Celebration Stage I PorphyryM1 carbonate altered plagioclase porphyry
S3NC-related anhedral, coarse-grained
Bulk -1.44 This study
1213279 New Celebration Stage I PorphyryM1 carbonate altered plagioclase porphyry Anhedral, grains
intergrown, 1000μmLA -4.14 0.006 This study
1213279 New Celebration Stage I PorphyryM1 carbonate altered plagioclase porphyry
Anhedral, several grains in foliation plane, 300μm
LA -5.72 0.005 This study
1213279 New Celebration Stage I Porphyry
M1 carbonate altered plagioclase porphyry Anhedral, elongate,
located in foliation plane, 500μm
LA -6.26 0.018 This study
1213279 New Celebration Stage I PorphyryM1 carbonate altered plagioclase porphyry
Euhedral, disseminated, 300μm
LA -3.15 0.010 This study
133542 New Celebration Stage I PorphyryM1 carbonate altered plagioclase porphyry
Anhedral, disseminated, 250μm
LA -7.36 0.020 This study
133542 New Celebration Stage I PorphyryM1 carbonate altered plagioclase porphyry
Euhedral, disseminated, 300μm
LA -6.06 0.003 This study
133542 New Celebration Stage I Porphyry
M1 carbonate altered plagioclase porphyry Subhedral-euhedral,
disseminated, 100-200μm
LA -7.49 0.004 This study
133542 New Celebration Stage I Porphyry
M1 carbonate altered plagioclase porphyry Fine-grained,
anhedral, located in S3NC foliation planes
LA -6.90 0.008 This study
1213226 New Celebration Stage I Mylonite
Quartz-carbonate mylonite
Anhedral, sheared, located in S3NC
foliation planes, 400μm
Bulk 2.03 This study
1213226 New Celebration Stage I Mylonite
Quartz-carbonate mylonite
Anhedral, sheared, located in S3NC
foliation planes, 400μm
LA 3.77 0.220 This study
1213226 New Celebration Stage I Mylonite
Quartz-carbonate mylonite Anhedral, aligned
along S3NC foliation planes, 200μm
LA 0.57 0.011 This study
1213226 New Celebration Stage I Mylonite
Quartz-carbonate mylonite Anhedral, aligned
along S3NC foliation planes, 200μm
LA 1.50 0.003 This study
1213226 New Celebration Stage I Mylonite
Quartz-carbonate mylonite Anhedral, aligned
along S3NC foliation planes, 200μm
LA 2.19 0.019 This study
133565 New Celebration Stage I Mylonite
Quartz-carbonate mylonite Anhedral, aligned
along S3NC foliation planes, 200μm
LA 2.34 0.017 This study
133565 New Celebration Stage I Mylonite
Quartz-carbonate mylonite Anhedral, aligned
along S3NC foliation planes, 200μm
LA 0.58 0.009 This study
1213371 New Celebration Stage II Contact
Quartz-carbonate-fuchsite-altered contact between M2 quartz-feldspar porphyry and high-Mg basalt
Subhedral, disseminated, 800μm
Bulk 1.14 This study
133555 New Celebration Stage II Contact
Quartz-carbonate-fuchsite-altered contact between M2 quartz-feldspar porphyry and high-Mg basalt
Semi-massive, anhedral grains, aligned along S3NC
foliation planes at contact, 400-1000μm
LA -7.19 0.005 This study
321

Sample No Deposit/Camp Mineralising Event
Mineralisation Style
Sample DescriptionPyrite Description Method δ34S (‰)
Analytical precision
Reference
133555 New Celebration Stage II Contact
Quartz-carbonate-fuchsite-altered contact between M2 quartz-feldspar porphyry and high-Mg basalt
Semi-massive, anhedral grains, aligned along S3NC
foliation planes at contact, 400-1000μm
LA -8.28 0.013 This study
133555 New Celebration Stage II Contact
Quartz-carbonate-fuchsite-altered contact between M2 quartz-feldspar porphyry and high-Mg basalt
Semi-massive, anhedral grains, aligned along S3NC
foliation planes at contact, 400-1000μm
LA -6.08 0.005 This study
133555 New Celebration Stage II Contact
Quartz-carbonate-fuchsite-altered contact between M2 quartz-feldspar porphyry and high-Mg basalt
Semi-massive, anhedral grains, aligned along S3NC
foliation planes at contact, 400-1000μm
LA -7.26 0.011 This study
133555 New Celebration Stage II Contact
Quartz-carbonate-fuchsite-altered contact between M2 quartz-feldspar porphyry and high-Mg basalt
Semi-massive, anhedral grains, aligned along S3NC
foliation planes at contact, 400-1000μm
LA -6.72 0.014 This study
133555 New Celebration Stage II Contact
Quartz-carbonate-fuchsite-altered contact between M2 quartz-feldspar porphyry and high-Mg basalt
Semi-massive, anhedral grains, aligned along S3NC
foliation planes at contact, 400-1000μm
LA -8.34 0.006 This study
1250_12-018 New Celebration Stage II Contact
Quartz-carbonate-fuchsite-altered contact between M2 quartz-feldspar porphyry and high-Mg basalt
Semi-massive, anhedral grains, aligned along S3NC
foliation planes at contact, 400-1000μm
LA -3.22 0.005 This study
1250_12-018 New Celebration Stage II Contact
Quartz-carbonate-fuchsite-altered contact between M2 quartz-feldspar porphyry and high-Mg basalt
Semi-massive, anhedral grains, aligned along S3NC
foliation planes at contact, 400-1000μm
LA -3.28 0.017 This study
1250_12-018 New Celebration Stage II Contact
Quartz-carbonate-fuchsite-altered contact between M2 quartz-feldspar porphyry and high-Mg basalt
Semi-massive, anhedral grains, aligned along S3NC
foliation planes at contact, 400-1000μm
LA -4.71 0.011 This study
1213371 New Celebration Stage II Contact
Quartz-carbonate-fuchsite-altered contact between M2 quartz-feldspar porphyry and high-Mg basalt
Semi-massive, anhedral grains, aligned along S3NC
foliation planes at contact, 400-1000μm
LA -3.89 0.007 This study
1149198 New Celebration Stage II Fracture
M2 albite-carbonate altered quartz-feldspar phyric porphyry
Coarse-grained, euhedral
Bulk -2.90 This study
1213359 New Celebration Stage II Fracture
M2 albite-carbonate altered quartz-feldspar phyric porphyry
Coarse-grained, euhedral
Bulk -7.12 This study
133540 New Celebration Stage II Fracture
M2 albite-carbonate altered quartz-feldspar phyric porphyry
Coarse-grained, subhedral to euhedral, zoned
Bulk -7.12 This study
133541 New Celebration Stage II Fracture
M2 albite-carbonate altered quartz-feldspar phyric porphyry
Coarse-grained, subhedral to euhedral.
Bulk -5.43 This study
1213359 New Celebration Stage II Fracture
M2 albite-carbonate altered quartz-feldspar phyric porphyry
Anhedral, 200-500μm
LA -10.61 0.031 This study
1213359 New Celebration Stage II Fracture
M2 albite-carbonate altered quartz-feldspar phyric porphyry
Anhedral, 200-500μm
LA -10.26 0.034 This study
322

Sample No Deposit/Camp Mineralising Event
Mineralisation Style
Sample DescriptionPyrite Description Method δ34S (‰)
Analytical precision
Reference
1213359 New Celebration Stage II Fracture
M2 albite-carbonate altered quartz-feldspar phyric porphyry
Anhedral, 200-500μm
LA -9.39 0.010 This study
1213359 New Celebration Stage II Fracture
M2 albite-carbonate altered quartz-feldspar phyric porphyry
Anhedral, 200-500μm
LA -7.40 0.023 This study
1213359 New Celebration Stage II Fracture
M2 albite-carbonate altered quartz-feldspar phyric porphyry
Anhedral, 200-500μm
LA -8.55 0.007 This study
1213359 New Celebration Stage II Fracture
M2 albite-carbonate altered quartz-feldspar phyric porphyry
Anhedral, 200-500μm
LA -7.62 0.019 This study
121763 New CelebrationSericite-altered sheared porphyritic intrusion Subhedral, 100μm LA -1.41 0.12 Hodkiewicz,
2003
121766 New CelebrationBiotite-dolomite-chlorite-altered ultramific schist Subhedral, 100μm LA 3.92 0.015 Hodkiewicz,
2003
121776 New CelebrationChlorite-calcite-albite-altered mafic schist Euhedral, 300μm LA 5.54 0.038 Hodkiewicz,
2003
121784 New CelebrationAlbite-hematite-altered sheared felsic porphyry Euhedral, 800μm LA -8.64 0.032 Hodkiewicz,
2003
121784 New CelebrationAlbite-hematite-altered sheared felsic porphyry Euhedral, 300μm LA -6.78 0.026 Hodkiewicz,
2003
121784 New CelebrationAlbite-hematite-altered sheared felsic porphyry Subhedral, 500μm LA -6.04 0.012 Hodkiewicz,
2003
121788 New CelebrationK-feldspar-albite-ankerite-altered tholeiitic mafic schist
Euhedral, 500μm LA -4.84 0.046 Hodkiewicz, 2003
121788 New CelebrationK-feldspar-albite-ankerite-altered tholeiitic mafic schist
Euhedral, 1000μm LA -5.49 0.016 Hodkiewicz, 2003
LG106 Golden Mile Synvolcanic sulfide
Chlorite altered Paringa Basalt
Coarse-grained, anhedral massive
LA 3.59 0.023 This study
LG106 Golden Mile Synvolcanic sulfide
Chlorite altered Paringa Basalt
Coarse-grained, anhedral massive
LA 4.61 0.037 This study
UG1
Golden Mile Fimiston Stage IQuartz-carbonate-chlorite altered Golden Mile Dolerite (U8)
Medium-grained, subhedral, glomerocrystic grains, 500µm
LA 1.82 0.013 This study
UG1
Golden Mile Fimiston Stage IQuartz-carbonate-chlorite altered Golden Mile Dolerite (U8)
Fine-grained, subhedral, glomerocrystic grains, 300µm
LA 2.97 0.020 This study
233
Golden Mile Fimiston Stage II
Foliated carbonate-albite±quartz altered mafic dyke in Golden Mile Dolerite
Fine-grained, euhedral pyrite, 300µm
LA 14.28 0.010 This study
233
Golden Mile Fimiston Stage II
Foliated carbonate-albite±quartz altered mafic dyke in Golden Mile Dolerite
Very fine-grained pyrite glomerocrysts, 20µm
LA 8.73 0.099 This study
233
Golden Mile Fimiston Stage II
Foliated carbonate-albite±quartz altered mafic dyke in Golden Mile Dolerite
Fine-grained, euhedral pyrite, 300µm
LA 15.68 0.011 This study
233
Golden Mile Fimiston Stage II
Foliated carbonate-albite±quartz altered mafic dyke in Golden Mile Dolerite
Fine-grained, euhedral pyrite, 300µm
LA 13.39 0.008 This study
52280
Golden Mile Fimiston Stage IIPyrite-tourmaline vein in Golden Mile Dolerite (U8)
Coarse-grained, anhedral, inclusions-rich pyrite, 500µm
LA -1.49 0.003 This study
52280Golden Mile Fimiston Stage II
Pyrite-tourmaline vein in Golden Mile Dolerite (U8)
Fine-grained euhedral pyrite, 200µm
LA 3.39 0.004 This study
52299
Golden Mile Fimiston Stage IIPyrite-magnetite-chlorite-tourmaline veins in chlorite-carbonate altered Paringa Basalt
Coarse-grained, anhedral, inclusions-rich pyrite, 500µm
LA -7.21 0.008 This study
323

Sample No Deposit/Camp Mineralising Event
Mineralisation Style
Sample DescriptionPyrite Description Method δ34S (‰)
Analytical precision
Reference
52299
Golden Mile Fimiston Stage IIPyrite-magnetite-chlorite-tourmaline veins in chlorite-carbonate altered Paringa Basalt
Coarse-grained, anhedral, inclusions-rich pyrite, 500µm
LA -4.16 0.067 This study
52198
Golden Mile Fimiston Stage IIIPyrite-sericite-carbonate vein selvedge in Golden Mile Dolerite (U6)
Medium-grained, anhedral (skeletal) pyrite, 300µm
LA -7.38 0.007 This study
52198
Golden Mile Fimiston Stage IIIPyrite-sericite-carbonate vein selvedge in Golden Mile Dolerite (U6)
Medium-grained, euhedral, inclusion-rich grains, 300µm
LA -10.44 0.008 This study
LGX
Golden Mile Fimiston Stage III
Pyrite-tellurides in quartz-carbonate veinlet in Golden Mile Dolerite (U9)
Coarse-grained, anhedral, 800µm
LA -7.00 0.004 This study
LGX
Golden Mile Fimiston Stage III
Pyrite-tellurides in quartz-carbonate veinlet in Golden Mile Dolerite (U9)
Fine-grained, anhedral, 200µm
LA -8.37 0.008 This study
UG10
Golden Mile Fimiston Stage IIIPyrite-sericite-carbonate vein selvedge in Golden Mile Dolerite (U6)
Coarse-grained, euhedral, 800µm
LA -4.65 0.008 This study
UG10
Golden Mile Fimiston Stage IIIPyrite-sericite-carbonate vein selvedge in Golden Mile Dolerite (U6)
Coarse-grained, framboidal, skeletal, 500µm
LA -7.93 0.015 This study
UG3Golden Mile Fimiston Stage IV
Pyrite-sericite selvedge to banded carbonate±quartz vein
Fine-grained, euhedral pyrite, 200µm
LA 2.21 0.031 This study
UG3Golden Mile Fimiston Stage IV
Pyrite-sericite selvedge to banded carbonate±quartz vein
Fine-grained, subhedral, 200µm
LA -2.10 0.011 This study
UG3Golden Mile Fimiston Stage IV
Pyrite-sericite selvedge to banded carbonate±quartz vein
Fine-grained, subhedral, 200µm
LA -2.87 0.004 This study
CD2949 169.45
St Ives 1OR Pre-goldAmphibole-pyrrhotite vein in epidote-magnetite altered mafic rock
Very coarse-grained anhedral pyrrhotite, 1500µm
LA 1.21 0.016 This study
CD2949 169.45
St Ives 1OR Pre-gold Amphibole-pyrrhotite vein in epidote-magnetite altered mafic rock
Medium-grained subhedral pyrite within above pyrrhotite grain, 400µm
LA -0.04 0.007 This study
CD2949 169.45
St Ives 1OR Pre-goldAmphibole-pyrrhotite vein in epidote-magnetite altered mafic rock
Very coarse-grained anhedral pyrrhotite, 1500µm
LA -2.30 0.007 This study
CD2949 169.45
St Ives 1OR Pre-goldAmphibole-pyrrhotite vein in epidote-magnetite altered mafic rock
Very coarse-grained anhedral pyrrhotite, 1500µm
LA 1.75 0.004 This study
LD7113A 135.5St Ives 2OR Main gold stage Feldspar-carbonate-
pyrite altered porphyry
Medium-grained, zoned, inclusion rich pyrite, 500µm
LA -2.13 0.008 This study
LD7113A 135.5St Ives 2OR Main gold stage Feldspar-carbonate-
pyrite altered porphyry
Coarse-grained, zoned, inclusion rich pyrite, 900µm
LA -2.03 0.008 This study
LD7113A 135.5St Ives 2OR Main gold stage Feldspar-carbonate-
pyrite altered porphyry
Fine-grained, subhedral pyrite, 200µm
LA -2.78 0.002 This study
LD70026A 317.15St Ives 2OR Main gold stage Feldspar-carbonate-
pyrite altered porphyry
Fine-grained euhedral pyrite, 200µm
LA -0.17 0.009 This study
LD70026A 317.15St Ives 2OR Main gold stage Feldspar-carbonate-
pyrite altered porphyry
Fine-grained euhedral pyrite, 200µm
LA -0.58 0.011 This study
LD70026A 317.15St Ives 2OR Main gold stage Feldspar-carbonate-
pyrite altered porphyry
Fine-grained euhedral pyrite, 200µm
LA -1.79 0.006 This study
324
APPENDICES
325
APPENDIX 8 LA-ICP-MS Mineral Chemistry

Location Event Style Sample No Ti49 Cr53 Mn55 Fe57 Co59 Ni60 Cu65 Zn66 As75 Se82 Zr90 Mo95
New Celebration Stage I Mylonite 133565_1-1 Conc. (ppm) 438.71 6.26 9.82 465000.00 3295.45 329.63 50.10 5.56 200.39 18.56 25.71 1.60DL 0.40 0.70 0.50 6.19 0.05 0.19 0.73 0.31 0.52 3.97 0.01 0.54Precision(%) 9.54 12.01 10.99 3.35 5.33 4.49 18.18 11.27 4.63 10.89 5.98 17.73
New Celebration Stage I Mylonite 133565_5-1 Conc. (ppm) 729.22 56.05 117.28 465000.00 92.73 147.00 8.85 26.13 5.37 8.51 5.83 BDDL 0.37 0.51 0.42 22.40 0.05 0.14 0.46 0.20 0.40 3.70 0.01 0.45Precision(%) 16.03 25.14 29.76 5.08 10.21 10.38 17.36 24.45 8.31 19.22 25.25
New Celebration Stage I Mylonite 133565_5-2 Conc. (ppm) 114.87 23.74 71.94 465000.00 3957.66 174.51 1.88 11.57 110.38 7.55 0.85 BDDL 0.32 0.57 0.33 5.87 0.04 0.12 0.38 0.14 0.46 3.08 0.02 0.44Precision(%) 23.22 25.28 39.50 4.25 4.63 3.87 19.02 24.66 4.42 18.93 20.76
New Celebration Stage I Mylonite 133565_6-1 Conc. (ppm) 2167.63 20.27 144.03 465000.00 257.15 432.17 13.41 10.21 11.20 14.42 25.80 40.87DL 0.23 0.50 0.38 11.99 0.05 0.19 0.41 0.25 0.50 2.89 0.03 0.50Precision(%) 15.53 9.72 16.92 5.66 9.81 5.04 13.36 13.22 8.43 11.24 11.14 44.93
New Celebration Stage I Mylonite 133565_7-1 Conc. (ppm) 14529.14 89.44 32.38 465000.00 328.61 359.66 138.80 11.68 14.88 18.60 15.14 BDDL 0.31 0.49 0.47 9.24 0.04 0.18 0.40 0.32 0.44 3.30 0.01 0.44Precision(%) 15.90 13.76 17.70 3.73 6.91 5.97 24.90 14.83 7.21 9.08 22.99
New Celebration Stage I Mylonite 133565_7-2 Conc. (ppm) 673.01 9.46 38.50 465000.00 1336.12 421.90 5.93 2.68 50.60 19.80 209.88 BDDL 0.54 0.40 0.36 11.44 0.07 0.11 0.47 0.32 0.36 2.83 0.02 0.44Precision(%) 10.67 8.85 26.81 4.25 4.98 5.08 13.20 14.84 6.83 8.38 33.22
New Celebration Stage I Mylonite 133566_1-1 Conc. (ppm) 806.04 135.54 320.17 465000.00 577.61 186.62 2.24 42.84 54.92 7.79 12.64 BDDL 0.42 0.64 0.49 7.33 0.06 0.13 0.57 0.29 0.46 3.84 0.01 0.55Precision(%) 9.91 9.38 7.53 2.93 4.47 3.15 12.87 6.10 3.25 19.64 14.42
New Celebration Stage I Mylonite 133566_1-2 Conc. (ppm) 44.65 34.01 21.86 465000.00 365.11 640.20 0.74 5.78 102.21 10.08 1.34 BDDL 0.63 0.55 0.38 9.43 0.06 0.21 0.49 0.31 0.36 3.74 0.01 0.44Precision(%) 11.18 15.13 15.40 3.87 3.62 4.71 29.09 12.29 3.86 15.39 19.62
New Celebration Stage I Mylonite 133566_2-1 Conc. (ppm) 157.36 82.50 584.69 465000.00 647.25 490.30 2.04 77.32 270.44 9.53 2.28 BDDL 0.60 0.56 0.44 19.04 0.07 0.17 0.51 0.31 0.48 2.55 0.02 0.44Precision(%) 10.92 9.68 7.81 3.99 4.82 5.01 13.72 7.74 9.17 12.04 15.86
New Celebration Stage I Mylonite 133566_2-2 Conc. (ppm) 532.98 175.59 20.58 465000.00 1759.51 809.04 4.84 22.34 273.67 12.02 8.14 BDDL 0.51 0.65 0.40 19.57 0.05 0.19 0.60 0.38 0.42 3.04 0.01 0.44Precision(%) 10.86 11.94 7.41 4.20 7.15 6.11 81.79 10.25 5.76 11.95 22.46
New Celebration Stage I Porphyry 1213279_1-1 Conc. (ppm) 179.92 32.74 1334.00 465000.00 621.90 683.71 2.45 20.71 6.92 13.35 14.66 2.74DL 0.42 0.89 0.60 9.18 0.08 0.19 0.68 0.58 0.69 5.75 0.02 0.58Precision(%) 14.41 14.27 12.03 6.41 5.94 7.30 14.44 8.56 8.85 18.77 33.04 25.94
New Celebration Stage I Porphyry 1213279_3-1 Conc. (ppm) 106.89 333.24 9.05 465000.00 281.81 1378.60 4.40 105.51 8.60 10.57 1.68 BDDL 0.44 0.60 0.52 7.58 0.05 0.30 0.61 0.23 0.57 4.19 0.01 0.47Precision(%) 28.59 9.63 31.94 3.51 8.27 6.62 10.44 9.09 8.99 17.07 26.25
New Celebration Stage I Porphyry 1213279_4-1 Conc. (ppm) 7.71 BD BD 465000.00 749.63 1571.14 BD BD 2.59 20.15 BD BDDL 0.47 0.62 0.56 6.56 0.06 0.18 0.73 0.35 0.63 3.95 0.01 0.47Precision(%) 6.69 3.23 4.91 3.26 52.43 11.83 9.12
New Celebration Stage I Porphyry 1213279_5-4 Conc. (ppm) 138.22 5.78 0.28 465000.00 481.97 2169.29 BD 0.67 8.84 15.50 9.68 1.13DL 0.65 0.95 0.79 11.45 0.09 0.25 1.17 0.52 0.66 6.30 0.02 0.73Precision(%) 27.25 23.14 109.51 13.78 14.02 14.37 38.27 13.25 20.63 27.72 33.17
New Celebration Stage I Porphyry 1213279_5-5 Conc. (ppm) 468.15 77.82 5.41 465000.00 420.66 1940.23 2.38 8.49 12.67 14.37 49.34 3.96DL 0.53 0.63 0.50 10.07 0.07 0.18 0.72 0.31 0.39 4.17 0.01 0.44Precision(%) 16.95 12.70 9.87 3.62 3.93 5.48 14.62 10.93 5.24 13.29 19.70 16.47
New Celebration Stage I Porphyry 1213279_6-1 Conc. (ppm) 3615.71 95.59 1.80 465000.00 671.24 2465.31 23.22 5.99 12.96 13.48 6.52 0.98DL 0.49 0.76 0.48 6.12 0.04 0.20 0.70 0.48 0.45 3.30 0.02 0.44Precision(%) 11.23 8.79 17.25 3.62 7.77 6.94 70.35 14.10 8.45 11.63 48.24 39.35
New Celebration Stage I Porphyry 133542_1-1 Conc. (ppm) 2072.44 828.97 42.68 465000.00 379.55 1297.82 10.51 77.70 5.57 12.22 155.52 1.03DL 0.71 0.69 0.64 7.87 0.07 0.26 0.83 0.36 0.66 5.05 0.03 0.51Precision(%) 13.15 11.41 20.85 8.88 10.60 10.82 31.37 11.01 11.45 19.81 17.72 27.32
326

Sample No
133565_1-1 Conc. (ppm)DLPrecision(%)
133565_5-1 Conc. (ppm)DLPrecision(%)
133565_5-2 Conc. (ppm)DLPrecision(%)
133565_6-1 Conc. (ppm)DLPrecision(%)
133565_7-1 Conc. (ppm)DLPrecision(%)
133565_7-2 Conc. (ppm)DLPrecision(%)
133566_1-1 Conc. (ppm)DLPrecision(%)
133566_1-2 Conc. (ppm)DLPrecision(%)
133566_2-1 Conc. (ppm)DLPrecision(%)
133566_2-2 Conc. (ppm)DLPrecision(%)
1213279_1-1 Conc. (ppm)DLPrecision(%)
1213279_3-1 Conc. (ppm)DLPrecision(%)
1213279_4-1 Conc. (ppm)DLPrecision(%)
1213279_5-4 Conc. (ppm)DLPrecision(%)
1213279_5-5 Conc. (ppm)DLPrecision(%)
1213279_6-1 Conc. (ppm)DLPrecision(%)
133542_1-1 Conc. (ppm)DLPrecision(%)
Ag107 Cd111 Sn118 Sb121 Te125 Ba137 La139 W182 Au197 Tl205 Pb208 Bi209 Th232 U238
39.71 BD 0.76 4.69 77.13 25.54 3.88 4.89 1.39 0.03 21.57 14.87 2.21 0.550.14 2.26 0.15 0.09 1.28 0.06 0.01 0.05 0.05 0.02 0.03 0.01 0.01 0.01
16.20 9.38 4.19 9.49 9.48 19.04 11.15 6.90 34.71 3.85 3.28 12.03 9.001.86 BD 0.65 1.68 10.13 29.23 0.28 6.65 0.26 0.05 6.26 3.34 0.07 0.050.08 2.54 0.10 0.06 1.22 0.05 0.01 0.05 0.03 0.01 0.03 0.01 0.01 0.01
25.07 9.87 8.79 10.51 25.51 30.02 14.36 14.46 25.80 12.90 9.40 21.07 26.96BD 1.67 0.56 0.58 BD 7.27 0.22 0.33 0.04 0.02 3.69 0.67 0.02 0.02
0.06 1.50 0.10 0.06 1.30 0.09 0.01 0.03 0.02 0.01 0.02 0.01 0.01 0.0139.34 9.60 22.47 25.75 24.50 40.86 28.56 36.27 21.75 20.25 30.52 28.21
0.94 BD 0.65 4.07 9.63 1.72 0.69 56.30 0.33 BD 9.81 5.08 0.38 0.260.08 2.19 0.10 0.07 1.58 0.10 0.01 0.03 0.03 0.01 0.03 0.01 0.01 0.019.70 9.49 7.72 11.50 14.85 14.84 18.04 12.26 6.81 7.57 12.39 13.101.95 BD 2.05 10.92 28.73 3.93 1.09 316.90 0.63 0.02 10.86 8.16 0.34 0.170.08 2.25 0.12 0.07 1.39 0.07 0.01 0.03 0.03 0.01 0.02 0.01 0.01 0.018.06 13.20 10.99 7.79 16.52 12.67 15.35 18.74 25.17 7.06 5.90 12.55 9.790.41 BD 0.55 1.36 4.37 0.17 2.13 11.36 0.14 BD 4.50 1.43 2.17 1.300.07 2.09 0.12 0.07 1.21 0.04 0.01 0.04 0.03 0.01 0.03 0.01 0.01 0.01
13.13 10.36 7.81 14.31 17.99 47.69 8.48 16.79 6.02 6.17 31.94 32.171.04 BD 0.93 1.08 6.65 79.70 1.87 12.42 0.84 0.04 21.86 4.33 0.85 0.280.08 2.56 0.12 0.11 1.48 0.11 0.01 0.04 0.04 0.01 0.03 0.01 0.01 0.01
19.76 8.75 8.66 12.08 12.74 15.59 11.99 16.49 20.95 4.37 6.00 10.63 11.63BD BD 0.51 0.17 2.01 19.56 BD 0.45 BD 0.02 3.33 1.31 0.03 0.04
0.09 2.35 0.10 0.06 1.20 0.06 0.01 0.04 0.03 0.01 0.03 0.02 0.01 0.0110.45 16.93 28.78 12.56 12.42 24.42 9.49 8.47 27.85 46.14
0.27 BD 0.64 0.60 4.48 16.48 0.02 2.15 0.07 BD 13.09 5.91 0.07 0.060.07 2.82 0.11 0.08 1.26 0.09 0.01 0.04 0.04 0.01 0.03 0.01 0.01 0.00
21.93 9.30 9.71 15.85 9.10 31.03 13.02 40.11 11.83 9.83 18.91 14.700.89 BD 0.69 0.33 7.32 79.65 BD 0.92 1.93 0.05 11.73 3.21 0.14 0.170.08 2.05 0.10 0.06 1.63 0.06 0.01 0.04 0.02 0.02 0.02 0.01 0.01 0.01
28.82 9.17 13.36 15.60 12.53 11.47 63.34 17.45 13.95 8.04 13.75 20.190.27 BD 1.18 1.50 5.96 74.99 7.61 BD 0.17 BD 43.82 8.53 0.07 0.200.10 2.99 0.15 0.09 1.85 0.09 0.01 0.06 0.06 0.02 0.04 0.02 0.01 0.01
26.80 8.51 11.33 18.18 14.90 22.94 23.22 9.68 8.43 24.18 36.232.39 BD 0.61 0.97 11.23 6.03 8.42 1.77 2.86 BD 39.20 11.23 0.14 0.060.09 1.97 0.13 0.06 1.13 0.07 0.01 0.04 0.06 0.02 0.04 0.01 0.01 0.01
26.18 11.51 9.27 12.93 50.82 42.37 30.32 40.01 16.84 6.47 29.07 25.150.12 BD 0.42 BD 1.16 BD BD BD 0.12 BD 0.11 0.19 BD BD0.08 2.80 0.12 0.08 1.08 0.06 0.01 0.04 0.04 0.01 0.03 0.02 0.01 0.01
34.70 15.13 40.09 25.56 17.42 10.200.38 BD 1.30 0.31 3.13 7.09 0.03 4.90 0.42 0.02 8.31 2.25 0.15 0.140.19 3.86 0.24 0.16 2.24 0.13 0.01 0.09 0.12 0.02 0.05 0.02 0.01 0.01
41.08 13.51 28.97 33.77 21.38 32.58 29.09 35.78 44.73 19.48 17.58 54.37 23.050.35 BD 0.90 1.42 18.31 60.90 0.14 7.76 0.46 0.03 42.98 15.95 0.27 0.450.13 2.78 0.16 0.07 1.46 0.06 0.01 0.03 0.07 0.02 0.02 0.01 0.01 0.01
25.47 8.48 10.19 7.84 15.84 13.40 25.35 24.70 32.04 13.81 7.53 17.20 19.471.21 BD 1.17 1.54 32.86 0.65 69.45 13.84 1.17 BD 154.47 31.38 4.39 0.540.13 2.48 0.13 0.07 1.00 0.09 0.01 0.04 0.06 0.02 0.04 0.01 0.01 0.01
12.65 7.92 9.18 7.87 21.70 21.47 15.62 15.26 24.70 7.03 25.54 15.981.34 BD 1.47 0.51 7.94 462.89 0.17 1.63 2.10 0.17 15.19 2.19 0.55 1.480.11 3.22 0.16 0.09 1.38 0.09 0.01 0.06 0.05 0.02 0.04 0.01 0.01 0.01
15.61 10.15 15.66 15.16 13.83 26.30 20.68 14.58 16.76 12.57 10.31 26.49 24.98
327

Location Event Style Sample No Ti49 Cr53 Mn55 Fe57 Co59 Ni60 Cu65 Zn66 As75 Se82 Zr90 Mo95New Celebration Stage I Porphyry 133542_1-2 Conc. (ppm) 1180.30 167.74 3.22 465000.00 312.99 425.54 29.12 3.16 12.12 9.59 15.75 BD
DL 0.43 0.57 0.42 13.21 0.06 0.13 0.67 0.35 0.43 4.05 0.02 0.36Precision(%) 28.65 23.90 19.36 3.74 9.85 5.74 34.50 14.06 11.80 17.61 25.65
New Celebration Stage I Porphyry 133542_2-1 Conc. (ppm) 111.83 BD 0.46 465000.00 478.70 1506.46 1.00 0.88 3.33 11.19 12.75 BDDL 0.38 0.70 0.43 8.25 0.05 0.18 0.75 0.39 0.53 4.02 0.03 0.50Precision(%) 40.91 39.00 3.65 3.78 3.70 88.79 23.97 9.24 15.94 28.10
New Celebration Stage I Porphyry 133542_3-1 Conc. (ppm) 35.16 6.45 BD 465000.00 333.36 2336.49 4.44 4.50 3.34 7.27 6.91 BDDL 0.39 0.86 0.58 5.88 0.05 0.22 0.71 0.42 0.54 4.49 0.01 0.43Precision(%) 32.87 27.07 3.96 6.88 3.52 11.05 22.91 8.90 25.10 37.18
New Celebration Stage I Porphyry 133542_4-1 Conc. (ppm) 1225.89 30.56 BD 465000.00 161.69 1573.42 29.44 1.41 9.94 12.78 26.57 BDDL 0.67 0.78 0.57 7.70 0.05 0.19 0.85 0.42 0.62 5.09 0.00 0.47Precision(%) 6.33 9.52 3.53 5.99 4.51 21.56 16.99 5.64 16.73 12.01
New Celebration Stage I Porphyry 133542_5-1 Conc. (ppm) 7.92 1.27 3.90 465000.00 197.98 3460.98 4.99 1.28 10.54 20.65 0.16 0.57DL 0.54 0.72 0.45 9.14 0.06 0.29 0.95 0.43 0.70 5.01 0.03 0.44Precision(%) 8.00 34.54 20.73 5.91 13.61 9.24 12.23 19.70 8.98 12.56 26.54 36.58
New Celebration Stage I Porphyry 133543_1C Conc. (ppm) 8.61 3.38 409.53 465000.00 242.20 3471.50 2.10 13.64 17.77 12.77 0.02 BDDL 0.55 0.55 0.41 5.71 0.04 0.13 0.44 0.22 1.97 6.64 0.01 0.60Precision(%) 8.57 14.45 11.54 6.39 6.84 6.99 11.90 9.96 7.34 23.11 33.64
New Celebration Stage I Porphyry 133543_1R Conc. (ppm) 9.38 1.36 BD 465000.00 167.41 2908.68 1.63 1.11 17.33 BD 0.10 BDDL 0.31 0.71 0.46 4.69 0.03 0.12 0.37 0.25 1.56 10.66 0.02 0.45Precision(%) 7.72 43.20 3.77 8.98 5.50 12.16 14.70 5.88 26.62
New Celebration Stage I Porphyry 133543_2C Conc. (ppm) 8.29 BD 0.58 465000.00 1098.88 622.85 210.72 1.36 11.78 14.07 70.75 BDDL 0.39 0.74 0.31 4.77 0.03 0.09 0.52 0.25 1.71 4.33 0.01 0.52Precision(%) 5.49 21.75 2.59 6.41 3.48 38.32 12.80 6.87 13.32 23.18
New Celebration Stage I Porphyry 133543_2R Conc. (ppm) 7.51 BD BD 465000.00 5.07 289.28 5.93 1.40 16.45 34.66 BD BDDL 0.53 0.80 0.40 5.30 0.04 0.15 0.44 0.22 1.97 4.08 0.01 0.51Precision(%) 6.73 3.84 4.15 3.79 31.63 12.77 7.78 6.58
New Celebration Stage I Porphyry 133543_4 Conc. (ppm) 2463.90 35.10 59.60 465000.00 2094.64 2583.70 184.43 18.26 13.96 27.83 62.06 BDDL 0.40 0.52 0.33 6.79 0.04 0.17 0.52 0.27 2.36 4.51 0.01 0.68Precision(%) 16.57 13.66 10.81 3.89 7.69 7.02 21.77 29.06 9.03 8.28 18.69
New Celebration Stage II Contact 1213371_1-1 Conc. (ppm) 230.34 7.62 BD 465000.00 3261.77 12464.69 1.29 1.34 24.43 8.61 2.37 BDDL 0.25 0.70 0.38 6.15 0.07 0.17 0.57 0.42 0.50 4.65 0.01 0.43Precision(%) 11.12 12.79 310.17 3.96 8.50 3.92 19.72 18.42 4.30 22.60 33.23 81.12
New Celebration Stage II Contact 1213371_1-2 Conc. (ppm) 2475.54 90.57 0.10 465000.00 440.39 11649.64 0.86 1.72 28.40 5.38 13.43 13.22DL 0.45 0.88 0.47 6.93 0.08 0.19 0.58 0.32 0.49 5.19 0.01 0.35Precision(%) 13.47 9.83 184.59 3.64 3.81 3.53 32.05 13.42 4.33 39.84 14.07 22.00
New Celebration Stage II Contact 1213371_1-3 Conc. (ppm) 451.39 22.62 BD 465000.00 3028.28 15803.98 30.98 1.40 42.92 12.70 0.10 BDDL 0.35 0.61 0.49 6.89 0.06 0.38 0.45 0.36 0.53 4.43 0.01 0.39Precision(%) 15.85 13.62 3.67 8.51 3.26 17.69 14.86 4.72 15.79 30.06
New Celebration Stage II Contact 1213371_1-4 Conc. (ppm) 10.24 13.71 BD 465000.00 350.10 7656.89 BD 1.00 6.64 BD BD BDDL 0.47 0.59 0.49 7.56 0.06 0.19 0.60 0.43 0.51 5.61 0.02 0.40Precision(%) 6.54 17.56 351.17 3.72 13.11 4.59 102.67 19.83 6.63 50.11
New Celebration Stage II Contact 1213371_2-1 Conc. (ppm) 430.73 127.88 216.70 465000.00 2192.40 12600.75 2.96 10.49 123.91 72.30 15.20 4.38DL 0.23 0.73 0.53 8.29 0.07 0.17 0.68 0.65 0.50 5.13 0.01 0.46Precision(%) 19.02 11.38 10.41 4.82 4.80 5.98 19.08 9.56 4.38 16.06 21.33 28.86
New Celebration Stage II Contact 1213371_2-2 Conc. (ppm) 11.90 28.43 BD 465000.00 1239.04 11979.29 BD 1.48 31.97 9.40 BD BDDL 0.44 0.67 0.43 12.54 0.10 0.59 0.63 0.32 0.47 4.85 0.01 0.43Precision(%) 9.00 14.23 119.77 3.67 4.21 4.18 14.37 3.94 22.10
New Celebration Stage II Contact 1213371_3-1 Conc. (ppm) 53.37 123.80 0.64 465000.00 1730.62 10884.40 3.63 16.25 47.57 7.82 20.21 0.58DL 0.44 0.46 0.42 8.29 0.05 0.16 0.66 0.35 0.58 4.36 0.01 0.47Precision(%) 15.66 13.42 26.98 3.20 5.91 4.87 24.05 16.92 5.84 23.73 47.39 58.00
New Celebration Stage II Contact 1213371_3-2 Conc. (ppm) 56.02 13.86 BD 465000.00 1335.30 11648.46 31.73 6.89 85.24 6.14 6.68 BD
328

Sample No133542_1-2 Conc. (ppm)
DLPrecision(%)
133542_2-1 Conc. (ppm)DLPrecision(%)
133542_3-1 Conc. (ppm)DLPrecision(%)
133542_4-1 Conc. (ppm)DLPrecision(%)
133542_5-1 Conc. (ppm)DLPrecision(%)
133543_1C Conc. (ppm)DLPrecision(%)
133543_1R Conc. (ppm)DLPrecision(%)
133543_2C Conc. (ppm)DLPrecision(%)
133543_2R Conc. (ppm)DLPrecision(%)
133543_4 Conc. (ppm)DLPrecision(%)
1213371_1-1 Conc. (ppm)DLPrecision(%)
1213371_1-2 Conc. (ppm)DLPrecision(%)
1213371_1-3 Conc. (ppm)DLPrecision(%)
1213371_1-4 Conc. (ppm)DLPrecision(%)
1213371_2-1 Conc. (ppm)DLPrecision(%)
1213371_2-2 Conc. (ppm)DLPrecision(%)
1213371_3-1 Conc. (ppm)DLPrecision(%)
1213371_3-2 Conc. (ppm)
Ag107 Cd111 Sn118 Sb121 Te125 Ba137 La139 W182 Au197 Tl205 Pb208 Bi209 Th232 U23811.16 BD 1.59 1.84 43.19 1.38 1.34 73.84 10.70 BD 10.42 3.67 0.17 0.110.11 2.60 0.11 0.08 1.04 0.08 0.01 0.03 0.04 0.01 0.03 0.01 0.00 0.01
43.76 16.87 19.89 15.48 20.77 24.18 32.13 22.87 11.09 13.00 34.95 19.52BD BD 0.66 0.09 BD BD 0.04 1.29 0.09 BD 0.40 0.07 0.15 0.19
0.12 3.19 0.12 0.09 1.02 0.08 0.01 0.05 0.03 0.02 0.03 0.02 0.01 0.009.01 45.47 46.52 22.08 44.05 18.84 23.50 28.23 26.79
1.19 BD 0.72 BD 5.91 BD 0.06 1.21 1.55 BD 1.62 1.16 0.12 0.030.08 2.34 0.14 0.09 1.21 0.07 0.01 0.03 0.05 0.02 0.03 0.02 0.01 0.01
10.23 9.56 13.83 47.69 36.74 16.88 8.47 7.05 32.17 40.78BD BD 0.81 1.80 8.06 0.12 1.08 26.17 2.08 BD 7.65 2.59 0.57 0.13
0.13 2.38 0.15 0.07 1.37 0.09 0.01 0.06 0.04 0.02 0.03 0.01 0.01 0.019.30 7.80 12.75 35.79 13.26 7.50 15.03 4.35 6.32 11.42 14.80
1.10 BD 0.60 0.21 14.71 0.08 BD BD 0.61 BD 5.96 2.47 0.01 BD0.14 2.18 0.14 0.09 1.41 0.04 0.01 0.05 0.04 0.02 0.03 0.02 0.00 0.01
12.36 11.66 24.08 10.25 41.99 12.56 14.88 6.01 39.100.53 BD 0.72 1.03 14.07 0.59 0.09 BD 0.21 BD 7.76 15.33 BD 0.000.10 2.71 0.12 0.08 1.83 0.08 0.01 0.03 0.04 0.01 0.02 0.01 0.01 0.00
14.68 9.64 12.98 9.54 18.73 13.49 17.29 5.98 7.60 36.020.50 3.16 0.49 0.10 18.42 BD BD BD 0.35 BD 0.98 3.21 0.01 BD0.07 1.94 0.13 0.02 1.00 0.05 0.01 0.03 0.03 0.02 0.02 0.01 0.00 0.00
15.61 25.82 11.18 18.11 7.45 19.39 12.13 10.22 43.950.99 BD 0.41 0.23 36.68 BD BD 0.07 0.50 BD 6.23 23.44 1.26 0.400.08 1.96 0.09 0.04 1.34 0.07 0.01 0.04 0.03 0.01 0.02 0.01 0.00 0.017.88 9.37 13.76 7.19 29.86 8.79 5.04 5.96 20.82 22.420.55 BD 0.47 BD 14.90 0.62 BD BD 0.30 BD 0.57 1.68 BD BD0.06 2.54 0.11 0.08 1.27 0.09 0.01 0.03 0.03 0.02 0.02 0.01 0.01 0.00
15.59 11.54 8.45 107.37 16.48 11.86 9.040.28 BD 0.66 BD 1.74 2.14 1.06 0.61 0.09 BD 12.45 5.98 1.47 0.520.09 2.40 0.12 0.07 1.48 0.08 0.01 0.03 0.05 0.01 0.02 0.01 0.01 0.01
23.31 10.29 35.19 12.55 16.93 15.74 33.49 11.19 5.84 17.64 14.720.13 BD 0.59 0.37 BD BD BD 2.98 0.11 BD 0.77 0.49 0.07 0.060.10 2.43 0.10 0.05 1.28 0.08 0.01 0.02 0.04 0.01 0.03 0.01 0.01 0.01
34.63 9.30 12.55 13.38 34.59 7.37 6.08 28.87 27.305.25 BD 0.69 2.41 20.79 0.23 0.05 27.24 12.37 BD 5.49 1.45 0.45 0.550.10 2.38 0.13 0.06 1.31 0.06 0.00 0.03 0.04 0.02 0.03 0.01 0.01 0.01
28.49 9.78 11.86 18.80 23.28 16.14 10.37 31.30 16.10 10.17 11.63 11.2915.23 BD 0.64 1.80 54.90 BD BD 11.79 33.67 BD 8.17 5.21 0.04 0.030.12 2.46 0.12 0.08 1.48 0.06 0.01 0.04 0.03 0.02 0.03 0.01 0.00 0.01
23.07 10.02 9.25 21.93 27.21 25.16 15.86 11.60 19.90 23.600.30 BD 0.63 0.16 BD 0.12 BD BD 0.36 BD 1.12 0.12 BD BD0.09 2.45 0.13 0.08 1.54 0.08 0.01 0.04 0.04 0.02 0.03 0.01 0.01 0.01
25.65 10.20 28.85 36.18 36.69 15.55 14.809.34 BD 1.03 1.91 50.38 1.01 0.03 11.14 9.33 0.14 13053.16 48.18 0.14 0.170.12 3.48 0.16 0.08 1.60 0.08 0.01 0.05 0.07 0.02 0.05 0.02 0.01 0.01
14.04 8.57 7.96 9.36 12.69 29.90 19.32 27.49 18.77 20.74 12.99 16.33 16.14BD BD 0.56 BD 2.55 0.31 BD 0.05 0.32 BD BD 0.16 BD BD
0.13 2.12 0.12 0.09 1.68 0.06 0.01 0.04 0.04 0.02 0.74 0.01 0.01 0.0111.40 31.36 19.59 50.90 36.14 13.45
15.83 BD 0.61 2.18 68.59 0.40 BD 0.39 30.77 BD 258.16 10.81 0.13 0.150.09 2.49 0.12 0.06 1.26 0.09 0.01 0.03 0.05 0.01 0.03 0.02 0.01 0.01
15.76 10.06 12.40 14.64 22.36 11.75 23.45 30.22 17.75 46.89 42.004.56 BD 0.49 2.54 12.04 0.19 0.03 0.87 2.66 BD 11.53 5.15 0.10 0.05
329

Location Event Style Sample No Ti49 Cr53 Mn55 Fe57 Co59 Ni60 Cu65 Zn66 As75 Se82 Zr90 Mo95DL 0.57 0.63 0.43 9.36 0.09 0.61 0.69 0.57 0.47 5.89 0.01 0.46Precision(%) 22.05 18.61 3.68 5.12 4.57 23.91 21.77 3.72 36.89 19.31
New Celebration Stage II Contact 1250_12-18_1-2 Conc. (ppm) 13.56 186.11 8.19 465000.00 1464.35 2874.31 13.59 9.78 55.13 11.86 0.05 BDDL 0.21 0.71 0.53 7.91 0.06 0.19 0.51 0.42 0.47 4.81 0.02 0.40Precision(%) 9.38 17.68 18.31 3.45 3.89 6.16 40.74 16.34 4.05 17.87 30.77
New Celebration Stage II Contact 1250_12-18_1-3 Conc. (ppm) 7.66 0.92 1.02 465000.00 12.63 727.62 60.91 1.52 1.12 28.97 BD BDDL 0.55 0.83 0.53 6.20 0.06 0.16 0.65 0.31 0.52 4.42 0.02 0.57Precision(%) 7.56 39.20 27.07 3.42 14.81 14.59 30.52 29.34 20.45 8.17
New Celebration Stage II Contact 1250_12-18_2-1 Conc. (ppm) 11.66 481.53 56.50 465000.00 3020.00 380.41 1.02 88.53 33.68 12.28 0.20 BDDL 0.42 0.62 0.52 8.65 0.06 0.20 0.60 0.31 0.56 3.86 0.02 0.55Precision(%) 7.44 17.99 15.14 2.80 8.89 4.90 24.68 18.18 9.24 15.16 87.48
New Celebration Stage II Contact 1250_12-18_2-2 Conc. (ppm) 8.58 4.47 0.53 465000.00 1857.26 4503.72 BD 1.10 44.13 14.80 0.02 BDDL 0.40 0.56 0.50 9.18 0.10 0.24 0.69 0.37 0.65 3.65 0.01 0.37Precision(%) 7.12 33.69 39.86 3.45 4.82 5.29 19.23 3.95 12.02 44.37
New Celebration Stage II Contact 1250_12-18_3-1 Conc. (ppm) 9.66 15.10 BD 465000.00 881.82 4502.64 BD 1.17 38.21 7.93 BD BDDL 0.53 0.67 0.47 17.90 0.09 0.44 0.80 0.40 0.66 4.69 0.01 0.44Precision(%) 7.37 18.08 3.55 10.61 7.34 23.50 7.38 24.65
New Celebration Stage II Contact 1250_12-18_4-1 Conc. (ppm) 20.72 76.96 29.76 465000.00 3130.63 514.91 11.40 2.91 21.53 6.50 BD BDDL 0.52 0.53 0.54 11.09 0.06 0.27 0.69 0.36 0.52 4.87 0.01 0.40Precision(%) 8.02 11.38 11.76 2.85 4.79 6.69 28.31 17.79 6.01 28.67
New Celebration Stage II Contact 1250_12-18_5-1 Conc. (ppm) 9.99 11.01 4.64 465000.00 973.85 3730.96 1028.33 20.40 284.27 57.11 0.13 BDDL 0.51 1.25 0.82 13.28 0.10 0.29 1.15 0.70 0.96 9.49 0.02 0.88Precision(%) 14.11 17.87 18.89 15.55 15.36 15.55 16.38 18.39 15.05 13.70 24.99
New Celebration Stage II Contact 1250_12-18_5-2 Conc. (ppm) 9.60 8.45 1.45 465000.00 1965.18 2271.71 22.68 9.26 55.12 37.90 12.67 455.38DL 0.78 0.95 0.98 16.22 0.10 0.20 1.32 1.06 0.95 9.34 0.02 0.89Precision(%) 19.73 20.50 55.72 18.28 18.41 18.12 34.23 32.08 18.08 18.19 41.02 37.50
New Celebration Stage II Fracture 1213357_1-1 Conc. (ppm) 67.60 BD 0.08 465000.00 45.72 82.05 3.31 0.56 2.62 20.90 2.71 BDDL 0.38 0.64 0.46 8.22 0.05 0.21 0.62 0.34 0.53 6.38 0.02 0.41Precision(%) 29.28 229.02 4.02 10.41 6.92 9.82 28.53 11.68 13.52 26.37
New Celebration Stage II Fracture 1213357_1-2 Conc. (ppm) 9.16 BD BD 465000.00 76.44 399.93 BD 0.79 2.29 14.47 0.05 BDDL 0.39 0.59 0.45 24.28 0.06 0.19 0.53 0.40 0.67 5.06 0.02 0.43Precision(%) 6.12 4.18 4.97 5.03 26.87 14.58 15.42 66.34
New Celebration Stage II Fracture 1213357_1-3 Conc. (ppm) 535.79 2.23 BD 465000.00 16.82 26.04 1.74 1.10 1.82 17.86 63.51 BDDL 0.40 0.74 0.53 23.16 0.09 0.20 0.56 0.31 0.60 6.37 0.01 0.42Precision(%) 23.31 22.29 4.14 6.74 6.14 28.27 16.40 16.12 15.11 34.34
New Celebration Stage II Fracture 1213357_2-1 Conc. (ppm) 63.96 BD BD 465000.00 335.03 156.18 1.26 0.64 3.63 26.59 1.18 BDDL 0.26 0.58 0.41 0.00 0.05 0.16 0.49 0.29 0.48 5.25 0.02 0.37Precision(%) 20.74 5.84 5.90 5.73 21.71 22.81 8.96 9.96 24.92
New Celebration Stage II Fracture 1213357_3-1 Conc. (ppm) 3716.19 5.27 0.25 465000.00 3.27 8.92 5.63 1.67 73.92 18.53 360.41 BDDL 0.30 0.50 0.51 11.06 0.07 0.16 0.53 0.33 0.62 5.44 0.02 0.43Precision(%) 21.25 19.48 77.65 4.05 5.14 5.15 6.99 14.65 4.14 13.18 12.23
New Celebration Stage II Fracture 1213357_3-2 Conc. (ppm) 38.50 BD BD 465000.00 29.37 107.29 0.57 1.13 5.60 16.81 0.60 BDDL 0.57 0.64 0.48 11.60 0.06 0.19 0.56 0.30 0.55 6.36 0.02 0.43Precision(%) 24.01 4.07 4.69 4.32 40.75 16.48 9.43 16.35 25.11
New Celebration Stage II Fracture 1213357_3-3 Conc. (ppm) 2616.28 10.48 BD 465000.00 163.17 239.31 10.09 2.63 4.40 21.92 140.81 BDDL 0.54 0.55 0.46 14.53 0.07 0.15 0.52 0.42 0.58 4.05 0.03 0.46Precision(%) 12.37 16.92 3.99 3.89 4.46 19.67 17.55 10.74 11.15 15.43
New Celebration Stage II Fracture 1213357_4-1 Conc. (ppm) 854.87 11.35 0.73 465000.00 102.34 66.05 5.58 4.94 5.58 15.62 4.63 BDDL 0.33 0.39 0.31 0.00 0.05 0.17 0.40 0.27 0.34 5.76 0.01 0.39Precision(%) 18.43 19.62 53.20 8.89 14.91 12.14 20.89 21.87 18.28 16.19 19.32
New Celebration Stage II Fracture 1213357_4-2 Conc. (ppm) 100.72 1.21 BD 465000.00 16.73 27.29 14.11 38.22 1.80 11.11 2.58 BDDL 0.45 0.36 0.34 0.00 0.06 0.18 0.36 0.25 0.52 5.31 0.00 0.37
330

Sample NoDLPrecision(%)
1250_12-18_1-2 Conc. (ppm)DLPrecision(%)
1250_12-18_1-3 Conc. (ppm)DLPrecision(%)
1250_12-18_2-1 Conc. (ppm)DLPrecision(%)
1250_12-18_2-2 Conc. (ppm)DLPrecision(%)
1250_12-18_3-1 Conc. (ppm)DLPrecision(%)
1250_12-18_4-1 Conc. (ppm)DLPrecision(%)
1250_12-18_5-1 Conc. (ppm)DLPrecision(%)
1250_12-18_5-2 Conc. (ppm)DLPrecision(%)
1213357_1-1 Conc. (ppm)DLPrecision(%)
1213357_1-2 Conc. (ppm)DLPrecision(%)
1213357_1-3 Conc. (ppm)DLPrecision(%)
1213357_2-1 Conc. (ppm)DLPrecision(%)
1213357_3-1 Conc. (ppm)DLPrecision(%)
1213357_3-2 Conc. (ppm)DLPrecision(%)
1213357_3-3 Conc. (ppm)DLPrecision(%)
1213357_4-1 Conc. (ppm)DLPrecision(%)
1213357_4-2 Conc. (ppm)DL
Ag107 Cd111 Sn118 Sb121 Te125 Ba137 La139 W182 Au197 Tl205 Pb208 Bi209 Th232 U2380.10 2.22 0.14 0.09 1.18 0.09 0.01 0.05 0.04 0.02 0.03 0.01 0.01 0.01
14.78 13.18 6.66 13.39 34.79 68.52 24.61 20.29 19.71 5.92 28.45 17.95106.89 BD 0.66 0.20 848.88 0.12 BD BD 144.39 0.03 4076.32 50.75 BD BD
0.17 2.74 0.14 0.08 0.97 0.09 0.01 0.04 0.48 0.01 0.04 0.02 0.01 0.0122.67 10.17 24.46 17.02 39.98 22.54 23.18 17.34 17.80
0.49 BD 0.68 0.07 2.83 0.22 BD BD 2.52 BD 8.18 0.37 BD BD0.13 2.73 0.11 0.05 1.55 0.05 0.01 0.04 0.05 0.02 0.04 0.02 0.01 0.01
38.26 9.70 39.20 27.16 25.21 62.63 12.75 11.474.36 BD 0.67 0.22 118.98 0.11 0.03 BD 12.06 BD 2.85 5.80 BD BD0.14 2.67 0.12 0.07 1.75 0.06 0.01 0.02 0.05 0.02 0.04 0.01 0.01 0.01
26.73 10.04 18.84 36.93 35.72 21.95 30.28 12.10 14.890.23 BD 0.51 BD 1.82 BD 0.01 BD 1.58 BD 0.31 0.16 BD BD0.11 2.46 0.13 0.07 1.46 0.10 0.00 0.04 0.04 0.02 0.03 0.02 0.01 0.01
26.03 11.62 33.70 42.56 59.21 11.51 11.640.20 BD 0.61 BD 2.66 BD BD BD 0.48 BD 0.67 0.26 BD BD0.10 2.75 0.15 0.06 1.17 0.09 0.01 0.05 0.05 0.02 0.03 0.01 0.01 0.01
40.68 10.58 28.40 47.21 26.63 15.39BD BD 0.51 0.17 3.07 0.18 0.03 0.03 0.23 BD 4.84 0.95 BD 0.01
0.11 2.72 0.14 0.11 1.02 0.05 0.01 0.03 0.06 0.02 0.03 0.01 0.01 0.0012.15 31.03 18.23 22.24 21.77 47.72 45.75 8.60 6.39 33.05
9.08 BD 0.63 0.34 13.88 2.60 0.08 0.09 0.92 0.12 15.35 1.99 BD 0.040.23 4.92 0.27 0.13 2.42 0.11 0.02 0.07 0.07 0.03 0.06 0.03 0.01 0.01
27.38 21.78 23.43 18.25 36.28 29.46 43.62 35.69 21.96 15.38 14.52 26.680.29 BD 0.83 0.19 5.09 0.92 BD BD 0.19 0.04 4.97 1.19 0.08 0.200.24 4.52 0.25 0.16 3.06 0.15 0.02 0.09 0.10 0.03 0.06 0.03 0.02 0.01
47.57 21.99 41.79 29.79 44.75 36.66 42.71 23.38 19.60 53.36 40.812.62 0.61 0.59 0.21 5.69 BD 0.02 1.65 2.27 0.03 4.98 2.83 0.02 0.020.10 2.03 0.13 0.11 1.37 0.08 0.01 0.03 0.04 0.01 0.04 0.01 0.01 0.01
10.39 136.57 11.75 28.82 15.78 40.47 24.15 10.87 29.20 11.57 10.87 32.11 27.58BD BD 0.55 BD BD BD BD BD BD BD BD 0.19 BD BD
0.09 1.73 0.15 0.09 1.06 0.06 0.01 0.06 0.05 0.02 0.04 0.02 0.01 0.0112.50 9.47
0.14 BD 0.88 0.55 2.48 95.52 1.98 8.80 0.11 BD 3.20 0.40 1.14 0.710.14 2.16 0.15 0.10 1.11 0.10 0.01 0.03 0.05 0.03 0.02 0.01 0.01 0.01
41.16 9.78 12.49 24.22 49.30 65.25 9.16 28.69 5.93 9.38 20.97 21.58BD BD 0.57 0.12 5.42 1.48 0.04 0.88 0.27 0.02 17.55 4.39 0.07 0.04
0.11 2.39 0.12 0.08 0.99 0.08 0.01 0.05 0.03 0.01 0.05 0.02 0.01 0.0112.75 34.83 14.07 33.30 20.72 20.64 25.51 39.19 16.37 10.34 23.34 22.87
3.80 BD 2.46 8.29 21.67 0.84 1.49 90.84 2.48 0.18 58.67 20.69 36.68 11.520.10 2.12 0.13 0.09 1.23 0.07 0.01 0.05 0.03 0.01 0.03 0.02 0.01 0.019.71 16.42 6.00 10.45 23.23 19.06 20.42 15.42 7.23 4.33 9.86 14.06 12.140.66 BD 0.45 0.14 1.91 BD BD 0.51 0.83 BD 2.76 0.77 0.08 0.030.09 2.12 0.14 0.08 1.70 0.07 0.01 0.06 0.05 0.02 0.04 0.01 0.01 0.00
16.02 14.56 29.90 40.00 22.47 26.36 18.83 10.88 36.46 29.515.45 BD 1.36 1.61 1282.98 38.36 1.46 33.00 1.60 0.04 246.39 1670.74 5.07 2.340.11 2.22 0.13 0.08 1.10 0.06 0.01 0.04 0.03 0.02 0.03 0.01 0.00 0.01
31.97 12.06 16.04 29.91 60.29 21.92 13.29 13.93 32.16 25.74 30.03 20.14 14.901.56 BD 1.19 0.82 31.50 54.87 2.69 35.20 1.60 BD 211.12 17.33 0.86 0.220.09 1.97 0.12 0.06 0.99 0.07 0.01 0.05 0.04 0.02 0.03 0.01 0.01 0.01
15.11 13.35 17.21 19.56 26.46 33.47 17.64 19.43 25.23 21.41 23.24 18.911.26 BD 0.48 0.51 7.28 2.38 0.11 2.73 0.66 BD 7.32 3.31 0.08 0.050.08 1.86 0.11 0.08 1.00 0.09 0.01 0.04 0.04 0.02 0.03 0.02 0.01 0.01
331

Location Event Style Sample No Ti49 Cr53 Mn55 Fe57 Co59 Ni60 Cu65 Zn66 As75 Se82 Zr90 Mo95Precision(%) 15.53 21.86 9.57 16.41 14.29 53.57 52.24 21.82 20.17 41.79
New Celebration Stage II Fracture 1213357_4-3 Conc. (ppm) 43.63 BD BD 465000.00 22.23 62.13 10.38 0.70 16.08 22.20 2.47 0.28DL 0.44 0.65 0.41 0.00 0.07 0.18 0.52 0.41 0.61 6.17 0.01 0.34Precision(%) 12.60 6.50 6.96 10.14 8.76 26.22 6.11 12.68 36.32 49.02
New Celebration Stage II Fracture 1213359_1-2 Conc. (ppm) 124.56 1.20 0.59 465000.00 17.34 60.67 3.88 0.83 14.07 10.42 91.68 BDDL 0.39 0.73 0.55 10.16 0.09 0.23 0.53 0.44 0.58 4.42 0.01 0.52Precision(%) 17.66 27.97 45.86 4.24 6.82 4.16 10.32 24.10 6.65 18.52 23.85
New Celebration Stage II Fracture 1213359_1-4 Conc. (ppm) 112.71 0.80 0.49 465000.00 212.41 1155.43 5.32 0.90 9.10 16.65 90.28 BDDL 0.26 0.59 0.37 8.26 0.05 0.20 0.63 0.38 0.65 3.74 0.01 0.37Precision(%) 23.61 36.85 32.46 3.59 5.39 4.71 8.33 22.04 17.88 12.58 24.67
New Celebration Stage II Fracture 1213359_1-5 Conc. (ppm) 9.14 BD BD 465000.00 30.90 147.25 4.15 0.95 1.21 14.24 306.77 BDDL 0.32 0.84 0.52 7.31 0.06 0.24 0.68 0.53 0.59 3.74 0.02 0.47Precision(%) 16.72 3.46 5.80 4.55 28.09 23.67 21.89 13.90 27.11
New Celebration Stage II Fracture 1213359_2-2 Conc. (ppm) 6.66 BD BD 465000.00 47.99 141.88 1.92 1.33 0.99 14.00 91.49 BDDL 0.37 0.69 0.45 7.64 0.05 0.20 0.63 0.33 0.50 4.77 0.02 0.46Precision(%) 7.37 3.49 7.31 5.77 19.57 16.64 22.29 15.08 22.60
New Celebration Stage II Fracture 1213359_2-3 Conc. (ppm) 261.68 1.90 0.38 465000.00 204.60 308.00 BD 0.91 1.25 20.39 2.35 BDDL 0.44 0.63 0.53 6.87 0.07 0.20 0.81 0.42 0.51 5.03 0.01 0.52Precision(%) 12.82 21.21 53.99 3.87 6.78 5.34 22.71 19.61 11.07 36.21
New Celebration Stage II Fracture 1213359_2-4 Conc. (ppm) 887.78 3.24 BD 465000.00 16.67 25.59 1.82 0.92 9.85 18.40 81.43 1.39DL 0.44 0.80 0.45 7.31 0.06 0.20 0.60 0.62 0.73 6.02 0.02 0.50Precision(%) 13.24 16.88 3.77 7.60 4.59 16.54 29.52 7.14 13.96 18.91 65.39
New Celebration Stage II Fracture 1213359_3-2 Conc. (ppm) 236.83 0.98 2.15 465000.00 69.23 210.08 13.72 1.51 8.18 31.25 187.25 BDDL 0.33 0.63 0.49 8.64 0.07 0.27 0.49 0.30 0.51 4.98 0.01 0.41Precision(%) 10.98 31.75 33.32 3.81 8.45 10.58 21.29 14.27 8.70 13.43 15.24
New Celebration Stage II Fracture 1213359_3-3 Conc. (ppm) 112.60 0.70 1.60 465000.00 12.46 25.40 1.36 1.00 8.70 17.14 31.54 BDDL 0.43 0.69 0.51 6.13 0.07 0.14 0.58 0.37 0.52 5.19 0.02 0.41Precision(%) 21.42 41.83 19.08 4.10 10.88 11.21 19.78 21.91 10.54 13.40 23.20
New Celebration Stage II Fracture 1213359_3-4 Conc. (ppm) 117.00 BD BD 465000.00 3.79 33.74 7.44 1.01 16.78 15.95 66.12 BDDL 0.56 0.76 0.44 7.14 0.06 0.24 0.67 0.32 0.55 5.55 0.02 0.49Precision(%) 10.19 131.69 4.20 6.53 4.21 7.14 19.34 5.65 15.84 16.03
New Celebration Stage II Fracture 1213359_4-2 Conc. (ppm) 203.91 0.89 BD 465000.00 9.63 43.23 4.60 0.75 14.49 12.24 5.25 BDDL 0.45 0.63 0.49 7.11 0.08 0.15 0.55 0.37 0.48 5.31 0.02 0.42Precision(%) 14.95 36.92 3.69 13.86 7.22 11.25 24.89 6.88 18.31 26.74
New Celebration Stage II Fracture 1213359_4-3 Conc. (ppm) 2227.69 9.13 0.59 465000.00 55.12 720.42 6.73 0.96 4.13 11.28 153.67 1.90DL 0.65 0.61 0.50 8.50 0.07 0.20 0.50 0.39 0.54 4.78 0.01 0.44Precision(%) 8.99 9.86 33.16 3.72 10.87 16.09 7.03 20.11 8.16 18.16 14.70 36.00
New Celebration Stage II Fracture 1213359_4-4 Conc. (ppm) 364.19 5.05 2.74 465000.00 195.97 1058.71 117.57 24.39 45.85 26.84 419.83 2.44DL 0.43 0.67 0.49 10.76 0.05 0.18 0.65 0.43 0.51 4.86 0.02 0.49Precision(%) 15.65 17.11 13.36 6.85 7.58 7.40 72.98 12.25 13.11 11.57 16.43 18.99
New Celebration JD0475-5_4-3 Conc. (ppm) 16159.13 4.51 384.79 465000.00 10788.34 1007.88 34.08 72.22 847.91 47.20 84.47 BDDL 65.37 0.71 0.47 6.77 0.06 0.19 0.64 0.27 0.66 4.86 0.02 0.56Precision(%) 9.93 15.69 13.53 11.78 13.04 9.62 30.37 13.84 12.05 12.77 19.15
New Celebration JD0475-5_4-4 Conc. (ppm) 10504.48 3.90 504.19 465000.00 7680.38 728.55 1.71 59.85 909.65 49.21 4.73 BDDL 0.46 0.64 0.39 6.26 0.05 0.17 0.46 0.24 0.51 4.09 0.02 0.52Precision(%) 14.19 15.94 14.86 6.54 7.29 5.29 16.18 14.55 6.57 7.86 23.31
Golden Mile Chron. Samples Synvolcanic sulfide 3765_1-1 Conc. (ppm) 1541.71 26.55 1631.59 465000.00 84.89 3470.48 41535.53 253.86 37.80 50.63 76.90 BDDL 0.33 0.87 0.57 15.68 0.05 0.33 1.75 0.30 0.53 4.42 0.03 0.55Precision(%) 10.08 9.61 8.00 4.96 9.21 9.72 14.92 9.99 6.60 7.64 4.43
Golden Mile Chron. Samples Synvolcanic sulfide 3765_2-1 Conc. (ppm) 1528.28 11.91 106.09 465000.00 222.34 1903.11 BD 2.97 1.78 27.03 43.01 BDDL 0.61 0.73 0.60 22.59 0.06 0.27 0.64 0.53 0.49 4.83 0.01 0.71Precision(%) 11.70 7.27 13.62 2.55 2.71 2.83 15.48 24.64 9.17 4.62
332

Sample NoPrecision(%)
1213357_4-3 Conc. (ppm)DLPrecision(%)
1213359_1-2 Conc. (ppm)DLPrecision(%)
1213359_1-4 Conc. (ppm)DLPrecision(%)
1213359_1-5 Conc. (ppm)DLPrecision(%)
1213359_2-2 Conc. (ppm)DLPrecision(%)
1213359_2-3 Conc. (ppm)DLPrecision(%)
1213359_2-4 Conc. (ppm)DLPrecision(%)
1213359_3-2 Conc. (ppm)DLPrecision(%)
1213359_3-3 Conc. (ppm)DLPrecision(%)
1213359_3-4 Conc. (ppm)DLPrecision(%)
1213359_4-2 Conc. (ppm)DLPrecision(%)
1213359_4-3 Conc. (ppm)DLPrecision(%)
1213359_4-4 Conc. (ppm)DLPrecision(%)
JD0475-5_4-3 Conc. (ppm)DLPrecision(%)
JD0475-5_4-4 Conc. (ppm)DLPrecision(%)
3765_1-1 Conc. (ppm)DLPrecision(%)
3765_2-1 Conc. (ppm)DLPrecision(%)
Ag107 Cd111 Sn118 Sb121 Te125 Ba137 La139 W182 Au197 Tl205 Pb208 Bi209 Th232 U23811.40 12.98 13.88 17.02 33.22 21.13 14.85 14.09 10.76 20.88 18.37 29.86
1.75 BD 0.54 0.46 28.46 12.39 0.37 1.36 1.10 BD 14.49 28.18 0.12 0.050.10 2.52 0.13 0.04 1.51 0.07 0.01 0.05 0.04 0.03 0.03 0.02 0.01 0.018.09 11.97 9.77 7.73 31.30 23.58 17.76 8.88 5.81 6.28 18.96 49.281.90 0.34 0.58 1.39 25.00 1.12 1.00 2.62 1.10 BD 87.59 9.90 0.82 1.040.09 2.40 0.17 0.09 1.03 0.10 0.01 0.04 0.05 0.02 0.03 0.01 0.01 0.018.70 276.59 13.35 7.91 9.02 25.86 35.63 17.15 14.07 19.07 7.81 17.68 20.883.29 BD 0.53 1.12 5.29 59.23 2.75 4.10 0.55 0.56 3392.60 66.61 7.19 5.040.13 2.44 0.14 0.07 1.20 0.06 0.01 0.06 0.05 0.02 0.03 0.02 0.01 0.01
10.97 12.39 25.81 14.14 25.68 56.03 24.34 24.14 10.80 12.26 7.39 23.35 24.65245.96 BD 0.54 BD 252.28 0.70 BD BD 558.28 BD 29.20 4.82 36.32 11.80
0.11 2.78 0.15 0.09 1.20 0.09 0.01 0.05 0.02 0.02 0.03 0.01 0.01 0.0137.27 12.98 41.02 23.12 31.81 15.57 13.99 29.06 22.55
0.13 2.50 0.56 BD 2.41 0.15 0.02 BD 0.15 BD 54.47 2.66 0.66 1.320.10 1.83 0.15 0.08 1.40 0.09 0.01 0.05 0.08 0.02 0.04 0.01 0.01 0.01
44.70 32.64 12.55 27.31 30.55 25.79 33.04 16.95 15.17 20.86 29.291.17 BD 0.80 0.21 1.49 BD 2.42 6.05 1.24 BD 3.19 0.55 1.00 0.060.12 1.94 0.15 0.07 1.67 0.09 0.01 0.04 0.09 0.02 0.03 0.01 0.01 0.01
14.80 9.71 23.43 46.39 34.66 13.68 15.80 17.57 7.79 29.83 29.910.92 BD 0.93 1.22 10.86 0.30 3.57 16.72 0.96 BD 14.60 2.30 2.54 1.190.10 2.67 0.12 0.06 1.22 0.09 0.01 0.04 0.07 0.02 0.03 0.02 0.01 0.01
21.88 8.88 11.40 11.26 27.78 33.71 11.66 37.06 10.51 7.24 18.19 18.245.15 BD 0.61 0.39 30.20 17.27 3.98 7.31 0.99 0.25 3448.37 259.62 3.46 2.590.10 1.84 0.13 0.09 1.22 0.05 0.01 0.06 0.05 0.02 0.03 0.02 0.01 0.01
16.78 11.53 16.71 13.91 31.53 40.74 12.03 9.47 22.97 22.14 24.82 12.97 13.8658.65 BD 0.56 0.26 11.98 BD 2.08 1.90 482.72 BD 14.76 1.63 0.76 0.440.12 2.05 0.13 0.08 1.32 0.08 0.01 0.04 0.05 0.02 0.46 0.02 0.01 0.00
30.19 12.28 18.99 13.49 57.54 17.58 18.16 12.17 7.44 24.35 20.920.74 BD 0.62 0.31 23.00 2.83 0.86 2.37 0.65 BD 16.84 10.58 1.35 0.930.13 2.82 0.15 0.08 1.25 0.10 0.01 0.06 0.07 0.02 0.04 0.02 0.01 0.01
11.26 11.28 15.64 7.33 18.47 25.22 14.60 10.89 7.18 5.63 15.83 15.011.44 BD 0.58 0.79 13.63 31.60 1.61 4.90 1.06 0.08 176.75 23.80 0.53 0.100.51 2.68 0.12 0.08 1.48 0.09 0.01 0.06 0.06 0.02 0.04 0.02 0.01 0.01
15.27 10.44 10.84 9.84 20.74 19.37 15.37 11.74 17.25 17.04 9.97 18.06 22.811.07 BD 1.79 1.94 10.27 0.37 14.50 58.00 0.98 BD 23.12 11.29 6.56 3.220.14 2.38 0.12 0.08 1.40 0.08 0.01 0.04 0.05 0.02 0.04 0.02 0.01 0.019.59 7.22 7.97 10.92 19.98 21.26 8.47 12.15 9.85 7.45 16.16 16.20
53.61 BD 1.90 4.08 38.29 1351.46 32.90 13.31 559.63 0.24 760.03 126.51 18.94 14.440.20 2.41 0.15 0.07 1.43 0.08 0.01 0.07 0.04 0.02 0.03 0.02 0.01 0.01
28.10 9.01 14.36 13.34 14.49 31.96 12.05 41.62 12.60 12.22 14.27 19.20 11.190.89 BD 26.45 4.36 4.77 1.24 0.10 2.98 BD BD 4.30 3.76 0.06 0.040.14 4.00 0.15 0.09 1.59 0.10 0.01 0.04 0.05 0.02 0.04 0.01 0.01 0.01
25.86 55.33 10.19 19.21 15.79 15.40 13.16 10.34 12.01 20.58 17.340.28 BD 2.96 1.03 2.68 0.43 BD 0.94 0.03 BD 0.97 1.05 0.01 0.010.08 2.32 0.09 0.07 1.18 0.08 0.01 0.03 0.02 0.01 0.03 0.01 0.00 0.00
20.96 64.10 10.47 22.67 20.07 14.46 38.11 10.33 11.48 30.38 23.9710.69 BD 1.66 47.37 BD 9.11 19.47 3.51 BD 3.50 60.00 0.03 3.00 0.980.09 2.42 0.16 0.07 1.33 0.06 0.01 0.04 0.06 0.02 0.04 0.01 0.01 0.00
23.97 6.49 6.74 8.99 23.53 8.19 22.57 5.31 25.26 15.04 5.070.81 BD 1.06 2.93 BD 21.13 0.12 3.53 BD 0.09 3.24 BD 0.60 0.590.09 2.46 0.14 0.08 1.30 0.10 0.01 0.04 0.05 0.02 0.02 0.01 0.01 0.01
10.66 7.61 5.95 6.81 12.46 9.09 14.00 3.75 5.18 5.25
333

Location Event Style Sample No Ti49 Cr53 Mn55 Fe57 Co59 Ni60 Cu65 Zn66 As75 Se82 Zr90 Mo95Golden Mile Chron. Samples Synvolcanic sulfide 3765_3-1 Conc. (ppm) 1221.38 11.22 BD 465000.00 108.43 136.93 3.91 1.41 1368.98 15.07 37.00 BD
DL 0.86 1.54 0.99 15.49 0.07 0.30 1.30 0.63 1.35 8.77 0.06 0.98Precision(%) 19.23 21.97 4.47 7.31 5.89 15.66 38.34 3.91 23.57 6.39
Golden Mile Chron. Samples Synvolcanic sulfide 3765_3-2 Conc. (ppm) 1037.75 6.84 BD 465000.00 140.74 153.18 0.74 0.72 1220.69 19.83 34.69 0.58DL 0.27 0.54 0.46 6.41 0.05 0.17 0.52 0.21 0.48 4.50 0.02 0.49Precision(%) 17.91 17.35 62.17 3.73 5.97 3.57 30.20 18.74 5.47 10.67 6.44 39.85
Golden Mile Chron. Samples Synvolcanic sulfide 3765_4-1 Conc. (ppm) 343.16 1.48 1.84 465000.00 60.60 173.48 60.44 171.01 954785.06 299.67 11.51 3.98DL 0.53 0.85 0.62 17.72 0.06 0.15 0.90 0.40 0.00 5.16 0.03 0.73Precision(%) 10.78 25.78 13.52 2.56 4.99 2.83 11.58 16.41 4.98 3.86 4.73 9.75
Golden Mile Chron. Samples Synvolcanic sulfide 3765_4-2 Conc. (ppm) 293.16 BD 30.65 465000.00 37.14 103.66 22.08 6.78 740242.95 177.67 9.07 BDDL 0.35 0.62 0.46 10.90 0.03 0.17 0.59 0.33 0.00 2.88 0.02 0.37Precision(%) 10.50 17.08 4.21 5.58 3.68 16.31 12.76 5.54 4.05 8.72
Golden Mile Chron. Samples Synvolcanic sulfide 3765_4-3 Conc. (ppm) 109.24 1.26 173.44 465000.00 105.58 88.34 14.37 9.64 1922.77 15.61 20.05 BDDL 0.45 0.73 0.58 9.75 0.06 0.12 0.71 0.35 24.02 4.22 0.02 0.59Precision(%) 15.29 30.77 14.28 3.81 5.51 3.64 10.18 13.40 5.13 13.82 10.12
Golden Mile Chron. Samples Synvolcanic sulfide 3765_4-4 Conc. (ppm) 40.40 0.42 67.35 465000.00 231.94 129.97 14.02 11.39 2175.51 20.50 6.52 BDDL 0.42 0.62 0.53 10.77 0.04 0.11 0.53 0.31 17.67 3.13 0.02 0.48Precision(%) 14.46 62.43 9.36 3.44 4.51 4.43 7.72 24.49 4.77 7.61 12.00
Golden Mile Chron. Samples Synvolcanic sulfide LG106_1-3 Conc. (ppm) 7.71 14.27 6.14 465000.00 83.39 384.72 332.29 4.39 2555.06 9.50 5.53 BDDL 0.33 0.65 0.51 7.02 0.05 0.20 0.55 0.33 0.46 4.52 0.02 0.48Precision(%) 6.34 9.11 12.84 3.51 4.07 3.27 7.21 20.79 6.50 20.61 21.10
Golden Mile Chron. Samples Synvolcanic sulfide LG106_1-4 Conc. (ppm) 8.64 9.01 11.10 465000.00 135.19 227.14 130.20 2.93 8079.23 15.96 27.76 BDDL 0.55 0.62 0.50 6.99 0.06 0.21 0.74 0.46 0.70 4.82 0.02 0.65Precision(%) 7.06 14.37 10.95 4.57 8.39 4.16 11.60 12.46 10.01 14.58 10.93
Golden Mile Chron. Samples Synvolcanic sulfide LG106_2-1 Conc. (ppm) 10.63 5.37 23.04 465000.00 41.95 139.45 31.48 2.97 2796.45 11.42 4.35 BDDL 0.45 0.93 0.51 9.07 0.05 0.13 0.63 0.49 0.84 4.20 0.01 0.53Precision(%) 21.15 14.23 16.30 3.75 9.32 8.68 10.11 50.18 7.56 16.21 19.55
Golden Mile Chron. Samples Synvolcanic sulfide LG106_2-2 Conc. (ppm) 7.45 17.31 7.23 465000.00 54.77 216.74 336.04 9.16 4741.09 12.04 22.84 BDDL 0.49 0.73 0.60 12.69 0.06 0.18 0.71 0.50 0.69 3.83 0.01 0.50Precision(%) 6.68 11.47 13.21 3.51 7.07 8.61 15.55 22.52 5.54 14.54 24.14
Golden Mile Chron. Samples Synvolcanic sulfide LG106_2-3 Conc. (ppm) 7.32 1.49 35.24 465000.00 68.71 531.89 1.32 1.12 1712.38 16.51 0.05 BDDL 0.49 0.62 0.57 8.83 0.05 0.18 0.63 0.38 0.77 5.24 0.01 0.57Precision(%) 7.43 36.78 53.33 3.96 4.83 5.60 21.56 19.73 4.25 14.38 46.01
Golden Mile Chron. Samples Synvolcanic sulfide LG106_2-4 Conc. (ppm) 6.86 14.51 319.93 465000.00 52.43 85.69 103.01 2.55 2527.83 10.14 15.92 BDDL 0.55 0.71 0.59 21.79 0.06 0.24 0.78 0.50 0.63 4.81 0.02 0.59Precision(%) 7.35 7.20 9.38 3.63 4.37 4.27 28.48 12.47 7.92 20.01 18.33
Golden Mile Chron. Samples Synvolcanic sulfide LG106_3-1 Conc. (ppm) 7.97 12.28 9.45 465000.00 11.93 95.62 129.52 2.58 4397.09 8.34 5.95 BDDL 0.53 0.73 0.57 6.89 0.06 0.18 0.71 0.37 0.68 4.37 0.03 0.60Precision(%) 7.02 10.90 15.80 3.17 6.26 8.88 18.49 16.13 6.53 21.37 19.06
Golden Mile Chron. Samples Pre-gold sulfide JOGD11-2_1-1 Conc. (ppm) 7.11 BD 1.93 465000.00 4160.83 1.29 BD 0.88 115.35 35.22 BD BDDL 0.37 0.66 0.54 7.91 0.06 0.15 0.67 0.49 0.55 3.34 0.02 0.56Precision(%) 6.92 19.27 3.65 3.67 10.51 26.21 3.50 5.78
Golden Mile Chron. Samples Pre-gold sulfide JOGD11-2_2-1 Conc. (ppm) 65.60 BD 78.13 465000.00 2433.41 6.34 108.63 3.99 117.62 51.98 BD BDDL 0.51 0.81 0.72 36.08 0.21 0.28 0.75 0.49 0.58 4.74 0.01 0.63Precision(%) 18.75 11.55 5.77 14.79 10.71 26.07 14.04 10.53 6.71
Golden Mile Chron. Samples Pre-gold sulfide JOGD11-2_3-1 Conc. (ppm) 18.41 BD 1.65 465000.00 5085.64 0.83 2.42 1.85 152.83 27.94 0.37 BDDL 0.48 0.76 0.50 16.18 0.19 0.15 0.93 0.50 0.73 3.69 0.01 0.54Precision(%) 5.80 13.57 3.76 7.38 13.38 17.10 14.70 3.83 7.27 17.35
Golden Mile Chron. Samples Pre-gold sulfide JOGD11-2_4-1 Conc. (ppm) 6.08 BD BD 465000.00 2736.84 2.66 BD 0.99 140.81 38.28 BD BDDL 0.43 0.74 0.59 11.12 0.10 0.19 0.75 0.37 0.49 3.00 0.02 0.48Precision(%) 6.85 3.78 3.31 10.14 20.70 3.76 5.38
Golden Mile Chron. Samples Pre-gold sulfide JOGD11-2_4-2 Conc. (ppm) 6.47 BD BD 465000.00 2286.97 22.00 1.71 0.67 59.29 70.69 BD BD
334

Sample No3765_3-1 Conc. (ppm)
DLPrecision(%)
3765_3-2 Conc. (ppm)DLPrecision(%)
3765_4-1 Conc. (ppm)DLPrecision(%)
3765_4-2 Conc. (ppm)DLPrecision(%)
3765_4-3 Conc. (ppm)DLPrecision(%)
3765_4-4 Conc. (ppm)DLPrecision(%)
LG106_1-3 Conc. (ppm)DLPrecision(%)
LG106_1-4 Conc. (ppm)DLPrecision(%)
LG106_2-1 Conc. (ppm)DLPrecision(%)
LG106_2-2 Conc. (ppm)DLPrecision(%)
LG106_2-3 Conc. (ppm)DLPrecision(%)
LG106_2-4 Conc. (ppm)DLPrecision(%)
LG106_3-1 Conc. (ppm)DLPrecision(%)
JOGD11-2_1-1 Conc. (ppm)DLPrecision(%)
JOGD11-2_2-1 Conc. (ppm)DLPrecision(%)
JOGD11-2_3-1 Conc. (ppm)DLPrecision(%)
JOGD11-2_4-1 Conc. (ppm)DLPrecision(%)
JOGD11-2_4-2 Conc. (ppm)
Ag107 Cd111 Sn118 Sb121 Te125 Ba137 La139 W182 Au197 Tl205 Pb208 Bi209 Th232 U2380.55 BD 1.02 12.38 BD BD 0.04 2.68 BD BD 5.45 0.17 0.53 0.540.11 4.80 0.25 0.14 2.20 0.11 0.01 0.09 0.05 0.02 0.05 0.03 0.01 0.01
15.04 12.01 7.34 46.20 17.80 8.94 13.35 7.63 6.95BD BD 0.64 2.63 BD BD 1.08 1.89 BD BD 0.97 0.12 0.98 0.52
0.05 1.65 0.12 0.06 0.74 0.09 0.01 0.04 0.02 0.02 0.03 0.02 0.00 0.019.34 6.79 45.90 15.47 7.54 93.33 23.78 7.05
0.72 BD 1.08 615.97 9.86 0.40 1.14 0.49 0.30 0.82 33.25 2.45 0.52 0.250.14 2.87 0.18 0.12 1.59 0.07 0.00 0.04 0.04 0.02 0.03 0.01 0.01 0.01
12.34 8.17 3.08 10.02 15.44 16.54 14.61 12.83 9.04 3.72 3.80 19.56 6.240.80 BD 1.01 237.04 4.29 0.35 2.39 0.79 0.15 1.35 27.94 0.98 0.93 0.200.04 2.32 0.14 0.10 0.89 0.05 0.01 0.04 0.03 0.01 0.02 0.01 0.00 0.019.69 7.92 3.76 12.54 14.16 23.70 50.62 13.59 11.59 7.09 6.69 42.39 11.441.00 BD 0.97 26.56 BD 0.83 0.07 0.25 BD 1.42 29.28 0.46 0.40 0.300.08 2.14 0.14 0.07 1.46 0.04 0.01 0.04 0.04 0.01 0.02 0.00 0.01 0.019.28 8.50 3.89 39.01 20.76 18.25 16.26 5.61 5.72 10.87 8.561.45 BD 0.71 32.18 BD 0.14 0.02 0.10 BD 2.76 27.76 0.59 0.14 0.120.08 2.12 0.13 0.06 0.88 0.12 0.01 0.02 0.03 0.01 0.03 0.01 0.01 0.017.83 9.46 6.20 38.67 20.02 19.11 11.20 6.22 6.74 10.41 11.705.82 BD 1.06 70.55 5.28 0.15 0.03 0.07 0.97 0.10 130.99 61.41 0.02 BD0.09 2.28 0.14 0.06 1.36 0.06 0.01 0.03 0.03 0.01 0.02 0.01 0.01 0.016.41 8.22 3.28 14.94 33.87 26.51 31.79 8.50 10.44 3.70 4.47 32.153.25 BD 0.86 27.91 4.88 0.09 BD BD 0.51 0.10 54.44 42.18 0.04 0.100.11 3.26 0.13 0.08 1.81 0.08 0.01 0.04 0.05 0.01 0.04 0.01 0.01 0.015.78 8.90 5.60 17.15 46.68 10.88 12.94 6.39 4.93 14.17 12.080.76 BD 0.80 32.85 2.46 0.18 0.93 0.11 0.10 BD 71.33 14.31 0.02 0.020.11 2.69 0.15 0.08 1.37 0.09 0.01 0.03 0.03 0.02 0.03 0.01 0.00 0.01
14.04 9.24 16.09 26.21 30.92 14.94 47.70 20.38 15.06 13.31 25.01 28.133.78 BD 0.76 23.76 5.70 0.24 0.04 0.05 0.28 0.05 35.80 42.35 0.02 0.060.11 3.01 0.15 0.07 1.45 0.07 0.01 0.04 0.04 0.02 0.02 0.01 0.01 0.017.00 9.62 4.96 14.88 44.85 41.62 39.93 12.78 16.67 8.65 5.75 30.70 26.56
BD BD 0.68 1.46 BD BD 0.06 BD 0.03 BD 0.56 0.56 BD BD0.12 2.74 0.15 0.09 1.42 0.07 0.01 0.03 0.02 0.01 0.03 0.01 0.01 0.01
10.68 39.40 39.51 40.07 36.78 34.031.14 BD 0.76 12.18 2.52 0.18 0.06 0.07 0.15 BD 23.34 31.03 0.02 0.050.10 3.04 0.14 0.07 1.56 0.10 0.01 0.04 0.05 0.02 0.03 0.01 0.00 0.018.92 9.69 3.97 28.86 28.94 14.91 40.39 17.10 5.09 3.85 24.36 22.312.13 BD 0.96 19.44 2.07 BD BD 0.13 0.42 0.18 30.16 26.60 0.02 0.020.10 2.38 0.14 0.09 1.69 0.09 0.01 0.04 0.02 0.01 0.03 0.01 0.01 0.01
11.46 8.21 5.92 33.74 37.71 9.20 9.81 7.90 4.90 27.09 29.85BD BD 0.76 1.12 BD BD BD BD BD BD 0.24 0.25 BD BD
0.10 3.00 0.14 0.06 1.60 0.07 0.01 0.03 0.03 0.01 0.03 0.01 0.00 0.019.33 8.17 11.10 7.51
0.68 BD 2.70 21.01 2.03 131.45 0.04 853.70 0.23 0.14 3.99 3.00 BD BD0.12 3.75 0.14 0.07 1.54 0.07 0.01 0.04 0.04 0.01 0.04 0.02 0.01 0.01
16.11 14.95 7.71 34.50 20.95 23.09 38.23 15.19 17.54 9.53 8.040.12 BD 1.14 22.47 8.70 2.23 BD BD 0.13 BD 4.10 4.82 BD BD0.08 3.28 0.17 0.06 1.45 0.04 0.01 0.09 0.03 0.01 0.03 0.01 0.01 0.01
29.00 7.60 4.16 10.82 9.72 16.00 4.62 4.37BD BD 0.65 0.66 BD BD BD BD BD BD 0.16 0.14 BD BD
0.09 2.60 0.14 0.08 1.23 0.09 0.01 0.04 0.03 0.01 0.03 0.01 0.01 0.0110.38 11.43 11.44 10.66
BD BD 0.76 0.86 BD 0.21 BD BD BD BD 0.15 0.17 BD BD
335

Location Event Style Sample No Ti49 Cr53 Mn55 Fe57 Co59 Ni60 Cu65 Zn66 As75 Se82 Zr90 Mo95DL 0.46 0.77 0.48 21.87 0.09 0.18 0.67 0.42 0.48 2.83 0.02 0.55Precision(%) 7.01 3.78 4.97 15.07 84.05 29.64 7.73 6.65
Golden Mile Chron. Samples Fimiston Stage I UG1_1-1 Conc. (ppm) 8.46 BD 164.46 465000.00 555.95 38.24 1054.28 9.44 612.71 25.18 BD 13.80DL 0.39 0.64 0.70 6.15 0.06 0.14 0.76 0.32 0.63 4.73 0.02 0.51Precision(%) 6.71 9.77 3.64 6.96 9.10 10.31 6.85 8.32 8.70 11.70
Golden Mile Chron. Samples Fimiston Stage I UG1_2-1 Conc. (ppm) 25.00 BD 41.97 465000.00 475.82 47.85 213.08 6.78 2551.11 14.05 BD 8.77DL 0.99 1.54 0.86 13.37 0.08 0.38 1.27 0.59 0.99 6.82 0.03 1.05Precision(%) 13.98 22.13 12.05 15.10 11.70 15.21 13.25 11.84 23.32 34.74
Golden Mile Chron. Samples Fimiston Stage I UG1_3-1 Conc. (ppm) 8.98 BD 94.80 465000.00 488.55 32.19 2292.56 51.23 5914.73 15.53 BD 0.94DL 0.89 0.73 0.58 7.74 0.05 0.18 0.75 0.41 0.56 3.33 0.02 0.75Precision(%) 7.15 14.63 3.33 4.04 4.02 7.69 8.32 3.90 9.93 31.35
Golden Mile Chron. Samples Fimiston Stage II 233-1-1 Conc. (ppm) 10.88 BD 59.44 465000.00 323.82 70.54 142.86 6.73 990.28 12.61 0.39 1.13DL 0.44 0.74 0.57 6.95 0.06 0.17 0.75 0.43 0.58 3.34 0.01 0.55Precision(%) 5.40 4.43 3.37 4.35 4.16 11.38 8.08 3.43 12.53 25.86 20.47
Golden Mile Chron. Samples Fimiston Stage II 233-2-1 Conc. (ppm) 567.56 BD 210.26 465000.00 240.28 107.13 102.34 29.09 2504.26 11.76 12.69 1.52DL 0.57 0.79 0.58 7.95 0.06 0.15 0.78 0.53 0.59 3.13 0.01 0.58Precision(%) 11.77 10.33 3.29 4.54 8.17 8.41 28.08 6.82 13.47 7.20 19.01
Golden Mile Chron. Samples Fimiston Stage II 233-2-2 Conc. (ppm) 29.75 BD 890.13 465000.00 288.96 88.19 64.78 15.11 839.69 8.32 1.08 1.65DL 0.96 0.54 0.59 54.78 0.09 0.22 0.73 0.44 0.74 4.09 0.20 0.46Precision(%) 6.91 4.09 3.06 3.83 3.68 3.97 5.06 3.17 19.77 13.34 13.93
Golden Mile Chron. Samples Fimiston Stage II 233-3-1 Conc. (ppm) 293.00 5.56 27.56 465000.00 1033.94 199.17 229.75 16.68 721.58 21.38 169.19 0.62DL 0.68 0.80 0.54 16.35 0.07 0.19 0.96 0.50 0.60 3.31 0.02 0.57Precision(%) 11.76 10.77 14.75 3.35 5.27 4.61 9.93 15.14 3.69 7.97 5.69 38.78
Golden Mile Chron. Samples Fimiston Stage II 233-4-1 Conc. (ppm) 352.21 1.93 16.80 465000.00 1545.42 387.43 101.57 19.03 1401.55 19.83 9.32 2.04DL 0.41 0.60 0.66 17.51 0.05 0.07 0.79 0.39 0.70 3.99 0.02 0.54Precision(%) 12.18 18.01 15.61 3.40 3.11 4.44 8.69 5.26 3.88 9.50 8.76 19.96
Golden Mile Chron. Samples Fimiston Stage II 3766_1 Conc. (ppm) 6.89 BD 0.58 465000.00 558.76 806.69 BD 0.72 39.49 14.94 BD BDDL 0.42 0.83 0.38 6.79 0.03 0.12 0.47 0.24 2.21 4.86 0.02 0.54Precision(%) 6.82 27.40 3.46 4.15 4.21 19.33 5.10 14.70
Golden Mile Chron. Samples Fimiston Stage II 3766_2 Conc. (ppm) 504.36 1.50 0.44 465000.00 212.43 561.98 29.41 1.06 26.83 13.55 9.57 BDDL 0.39 0.56 0.37 6.05 0.03 0.15 0.52 0.24 2.77 3.43 0.02 0.72Precision(%) 17.49 23.71 35.21 3.49 9.33 11.93 13.49 16.23 5.48 12.43 10.63
Golden Mile Chron. Samples Fimiston Stage II 3766_3 Conc. (ppm) 269.60 18.82 447.13 465000.00 298.90 796.24 21.78 29.63 111.77 15.39 28.36 3.20DL 0.60 0.89 0.52 7.70 0.06 0.16 0.47 0.30 3.43 4.63 0.02 0.77Precision(%) 16.54 11.84 11.23 5.56 5.61 6.98 17.65 10.04 9.46 14.53 7.52 18.12
Golden Mile Chron. Samples Fimiston Stage II 3766_4 Conc. (ppm) 123.24 41.15 107.99 465000.00 98.81 361.18 117.12 12.62 63.28 8.70 13.72 2.98DL 0.54 0.66 0.46 19.90 0.04 0.11 0.49 0.33 2.90 4.73 0.02 0.69Precision(%) 9.73 10.34 16.59 4.52 7.21 5.16 18.54 10.69 5.70 22.87 13.48 18.10
Golden Mile Chron. Samples Fimiston Stage II 52280_1-1 Conc. (ppm) 1044.19 BD BD 465000.00 17.81 7.44 24.38 2.34 9033.48 14.44 5.08 0.64DL 0.64 0.73 0.62 9.29 0.05 0.22 0.70 0.43 0.44 3.64 0.02 0.58Precision(%) 27.51 3.77 13.09 7.13 8.31 18.20 6.41 11.30 28.25 38.57
Golden Mile Chron. Samples Fimiston Stage II 52280_1-2 Conc. (ppm) 9.12 BD 475.76 465000.00 12.45 7.93 52.23 22.80 7847.98 15.97 0.06 0.48DL 0.51 0.74 0.48 20.07 0.04 0.18 0.68 0.42 0.93 3.62 0.03 0.44Precision(%) 7.39 16.63 2.50 5.80 5.99 7.03 12.09 3.65 10.53 38.06 37.97
Golden Mile Chron. Samples Fimiston Stage II 52280_2-1 Conc. (ppm) 6.42 BD 24.09 465000.00 1.84 2.30 41.01 2.02 24235.20 13.60 BD BDDL 1.20 0.73 0.61 7.31 0.04 0.08 0.75 0.41 0.61 3.21 0.02 0.51Precision(%) 9.31 14.07 3.62 14.60 8.06 5.40 15.16 3.77 12.10
Golden Mile Chron. Samples Fimiston Stage II 52280_2-3 Conc. (ppm) 17.78 BD 410.67 465000.00 2.27 1.64 18.31 7.10 15975.14 17.43 1.10 BDDL 0.91 1.21 1.17 14.38 0.10 0.31 1.39 0.75 1.38 6.74 0.03 0.95Precision(%) 7.02 11.45 3.88 7.33 15.24 6.56 14.10 4.01 17.60 12.38
Golden Mile Chron. Samples Fimiston Stage II 52299_1-1 Conc. (ppm) 647.71 119.03 44.87 465000.00 31.99 153.33 2.78 6.69 44.94 BD 24.21 BDDL 0.59 0.73 0.52 14.97 0.08 0.20 0.85 0.38 0.63 3.59 0.01 0.53
336
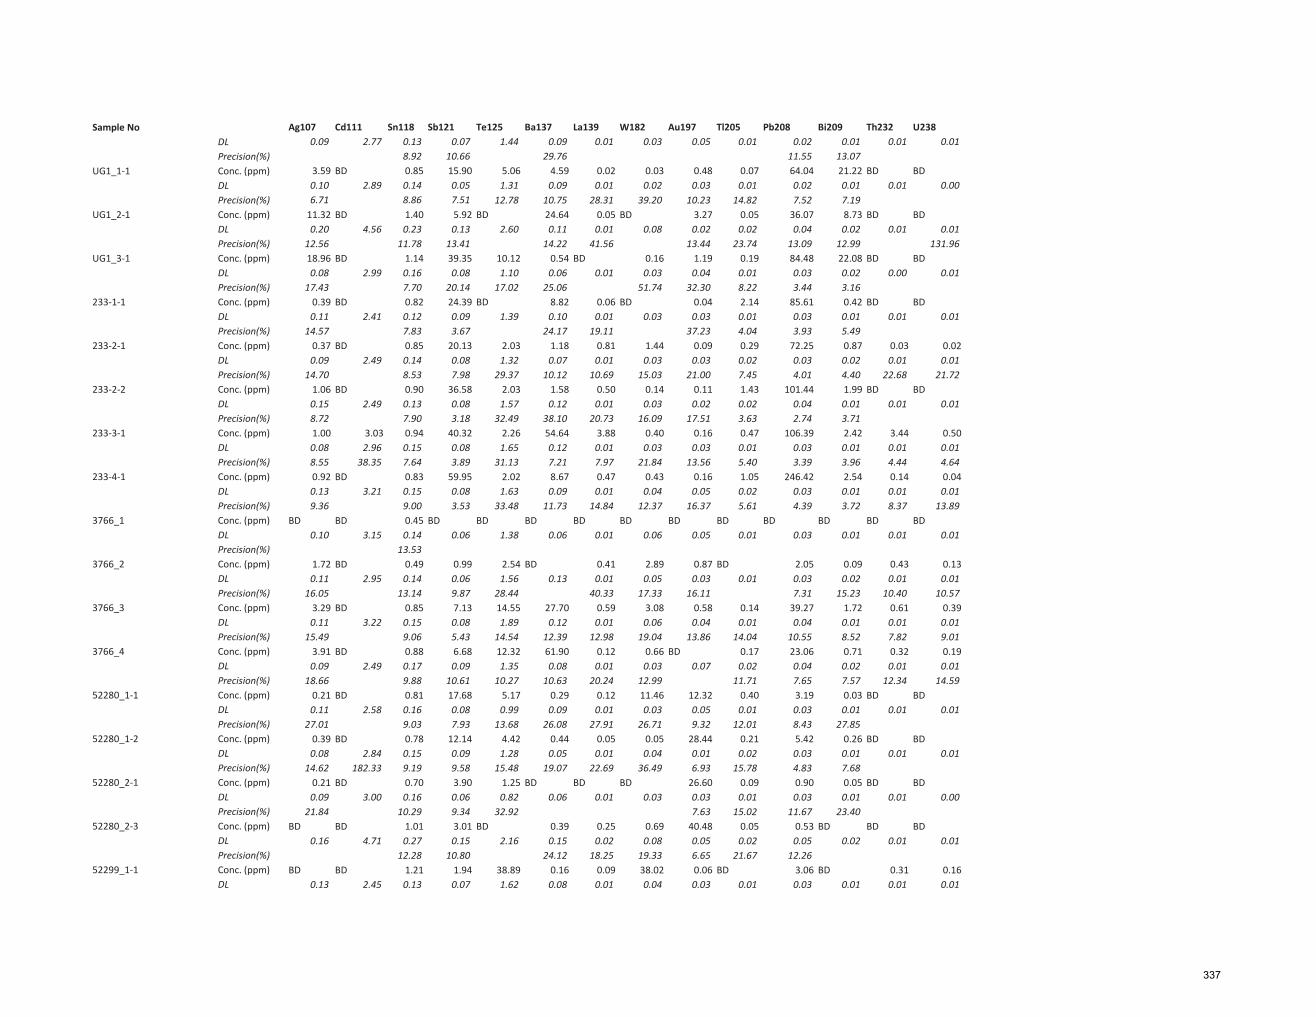
Sample NoDLPrecision(%)
UG1_1-1 Conc. (ppm)DLPrecision(%)
UG1_2-1 Conc. (ppm)DLPrecision(%)
UG1_3-1 Conc. (ppm)DLPrecision(%)
233-1-1 Conc. (ppm)DLPrecision(%)
233-2-1 Conc. (ppm)DLPrecision(%)
233-2-2 Conc. (ppm)DLPrecision(%)
233-3-1 Conc. (ppm)DLPrecision(%)
233-4-1 Conc. (ppm)DLPrecision(%)
3766_1 Conc. (ppm)DLPrecision(%)
3766_2 Conc. (ppm)DLPrecision(%)
3766_3 Conc. (ppm)DLPrecision(%)
3766_4 Conc. (ppm)DLPrecision(%)
52280_1-1 Conc. (ppm)DLPrecision(%)
52280_1-2 Conc. (ppm)DLPrecision(%)
52280_2-1 Conc. (ppm)DLPrecision(%)
52280_2-3 Conc. (ppm)DLPrecision(%)
52299_1-1 Conc. (ppm)DL
Ag107 Cd111 Sn118 Sb121 Te125 Ba137 La139 W182 Au197 Tl205 Pb208 Bi209 Th232 U2380.09 2.77 0.13 0.07 1.44 0.09 0.01 0.03 0.05 0.01 0.02 0.01 0.01 0.01
8.92 10.66 29.76 11.55 13.073.59 BD 0.85 15.90 5.06 4.59 0.02 0.03 0.48 0.07 64.04 21.22 BD BD0.10 2.89 0.14 0.05 1.31 0.09 0.01 0.02 0.03 0.01 0.02 0.01 0.01 0.006.71 8.86 7.51 12.78 10.75 28.31 39.20 10.23 14.82 7.52 7.19
11.32 BD 1.40 5.92 BD 24.64 0.05 BD 3.27 0.05 36.07 8.73 BD BD0.20 4.56 0.23 0.13 2.60 0.11 0.01 0.08 0.02 0.02 0.04 0.02 0.01 0.01
12.56 11.78 13.41 14.22 41.56 13.44 23.74 13.09 12.99 131.9618.96 BD 1.14 39.35 10.12 0.54 BD 0.16 1.19 0.19 84.48 22.08 BD BD0.08 2.99 0.16 0.08 1.10 0.06 0.01 0.03 0.04 0.01 0.03 0.02 0.00 0.01
17.43 7.70 20.14 17.02 25.06 51.74 32.30 8.22 3.44 3.160.39 BD 0.82 24.39 BD 8.82 0.06 BD 0.04 2.14 85.61 0.42 BD BD0.11 2.41 0.12 0.09 1.39 0.10 0.01 0.03 0.03 0.01 0.03 0.01 0.01 0.01
14.57 7.83 3.67 24.17 19.11 37.23 4.04 3.93 5.490.37 BD 0.85 20.13 2.03 1.18 0.81 1.44 0.09 0.29 72.25 0.87 0.03 0.020.09 2.49 0.14 0.08 1.32 0.07 0.01 0.03 0.03 0.02 0.03 0.02 0.01 0.01
14.70 8.53 7.98 29.37 10.12 10.69 15.03 21.00 7.45 4.01 4.40 22.68 21.721.06 BD 0.90 36.58 2.03 1.58 0.50 0.14 0.11 1.43 101.44 1.99 BD BD0.15 2.49 0.13 0.08 1.57 0.12 0.01 0.03 0.02 0.02 0.04 0.01 0.01 0.018.72 7.90 3.18 32.49 38.10 20.73 16.09 17.51 3.63 2.74 3.711.00 3.03 0.94 40.32 2.26 54.64 3.88 0.40 0.16 0.47 106.39 2.42 3.44 0.500.08 2.96 0.15 0.08 1.65 0.12 0.01 0.03 0.03 0.01 0.03 0.01 0.01 0.018.55 38.35 7.64 3.89 31.13 7.21 7.97 21.84 13.56 5.40 3.39 3.96 4.44 4.640.92 BD 0.83 59.95 2.02 8.67 0.47 0.43 0.16 1.05 246.42 2.54 0.14 0.040.13 3.21 0.15 0.08 1.63 0.09 0.01 0.04 0.05 0.02 0.03 0.01 0.01 0.019.36 9.00 3.53 33.48 11.73 14.84 12.37 16.37 5.61 4.39 3.72 8.37 13.89
BD BD 0.45 BD BD BD BD BD BD BD BD BD BD BD0.10 3.15 0.14 0.06 1.38 0.06 0.01 0.06 0.05 0.01 0.03 0.01 0.01 0.01
13.531.72 BD 0.49 0.99 2.54 BD 0.41 2.89 0.87 BD 2.05 0.09 0.43 0.130.11 2.95 0.14 0.06 1.56 0.13 0.01 0.05 0.03 0.01 0.03 0.02 0.01 0.01
16.05 13.14 9.87 28.44 40.33 17.33 16.11 7.31 15.23 10.40 10.573.29 BD 0.85 7.13 14.55 27.70 0.59 3.08 0.58 0.14 39.27 1.72 0.61 0.390.11 3.22 0.15 0.08 1.89 0.12 0.01 0.06 0.04 0.01 0.04 0.01 0.01 0.01
15.49 9.06 5.43 14.54 12.39 12.98 19.04 13.86 14.04 10.55 8.52 7.82 9.013.91 BD 0.88 6.68 12.32 61.90 0.12 0.66 BD 0.17 23.06 0.71 0.32 0.190.09 2.49 0.17 0.09 1.35 0.08 0.01 0.03 0.07 0.02 0.04 0.02 0.01 0.01
18.66 9.88 10.61 10.27 10.63 20.24 12.99 11.71 7.65 7.57 12.34 14.590.21 BD 0.81 17.68 5.17 0.29 0.12 11.46 12.32 0.40 3.19 0.03 BD BD0.11 2.58 0.16 0.08 0.99 0.09 0.01 0.03 0.05 0.01 0.03 0.01 0.01 0.01
27.01 9.03 7.93 13.68 26.08 27.91 26.71 9.32 12.01 8.43 27.850.39 BD 0.78 12.14 4.42 0.44 0.05 0.05 28.44 0.21 5.42 0.26 BD BD0.08 2.84 0.15 0.09 1.28 0.05 0.01 0.04 0.01 0.02 0.03 0.01 0.01 0.01
14.62 182.33 9.19 9.58 15.48 19.07 22.69 36.49 6.93 15.78 4.83 7.680.21 BD 0.70 3.90 1.25 BD BD BD 26.60 0.09 0.90 0.05 BD BD0.09 3.00 0.16 0.06 0.82 0.06 0.01 0.03 0.03 0.01 0.03 0.01 0.01 0.00
21.84 10.29 9.34 32.92 7.63 15.02 11.67 23.40BD BD 1.01 3.01 BD 0.39 0.25 0.69 40.48 0.05 0.53 BD BD BD
0.16 4.71 0.27 0.15 2.16 0.15 0.02 0.08 0.05 0.02 0.05 0.02 0.01 0.0112.28 10.80 24.12 18.25 19.33 6.65 21.67 12.26
BD BD 1.21 1.94 38.89 0.16 0.09 38.02 0.06 BD 3.06 BD 0.31 0.160.13 2.45 0.13 0.07 1.62 0.08 0.01 0.04 0.03 0.01 0.03 0.01 0.01 0.01
337

Location Event Style Sample No Ti49 Cr53 Mn55 Fe57 Co59 Ni60 Cu65 Zn66 As75 Se82 Zr90 Mo95Precision(%) 15.02 21.93 16.65 3.89 7.27 6.63 18.40 17.65 5.89 10.88
Golden Mile Chron. Samples Fimiston Stage II 52299_1-2 Conc. (ppm) 25.50 14.22 24.62 465000.00 130.19 146.61 650.38 41.76 213.35 3.92 80.85 BDDL 0.59 0.73 0.55 13.50 0.05 0.24 0.81 0.42 0.48 3.52 0.02 0.48Precision(%) 12.50 8.70 6.71 3.42 4.09 3.94 13.73 8.24 8.47 37.24 9.41
Golden Mile Chron. Samples Fimiston Stage II 52299_2-1 Conc. (ppm) 7.77 1.01 0.60 465000.00 231.38 367.85 102.59 1.33 171.51 10.20 6.95 BDDL 0.45 0.59 0.56 42.53 0.06 0.17 0.77 0.46 0.71 4.43 0.03 0.49Precision(%) 11.14 29.81 36.85 3.62 4.23 3.65 10.96 17.37 3.50 17.00 9.82
Golden Mile Chron. Samples Fimiston Stage II 52299_2-2 Conc. (ppm) 13.39 11.09 21.11 465000.00 203.01 284.18 171.97 16.77 129.44 BD 1.79 BDDL 0.55 0.77 0.59 28.45 0.08 0.25 0.64 0.66 0.61 3.07 0.01 0.54Precision(%) 9.41 10.20 8.44 3.45 11.53 7.97 10.27 12.38 10.76 10.95
Golden Mile Chron. Samples Fimiston Stage II 52299_3-1 Conc. (ppm) 10.17 BD BD 465000.00 235.49 534.50 BD 0.82 273.36 16.00 20.59 BDDL 0.31 0.87 0.60 8.55 0.06 0.14 0.88 0.32 0.60 3.55 0.02 0.58Precision(%) 20.04 3.85 5.16 3.98 21.57 3.98 11.14 21.39
Golden Mile Chron. Samples Fimiston Stage II 52299_3-2 Conc. (ppm) 17.21 2.98 3.78 465000.00 86.59 133.50 263.34 5.49 447.72 BD 2.96 BDDL 0.49 0.63 0.51 13.55 0.07 0.23 0.76 0.31 0.64 4.28 0.01 0.50Precision(%) 22.87 13.59 12.03 3.92 4.64 4.70 12.93 8.70 6.61 10.72
Golden Mile Chron. Samples Fimiston Stage II 52299_4-1 Conc. (ppm) 46.47 1.17 1.07 465000.00 99.07 59.07 54.99 3.21 110.21 BD 48.81 0.57DL 0.40 0.66 0.52 8.54 0.06 0.15 0.81 0.31 0.57 3.81 0.01 0.49Precision(%) 12.40 26.78 20.85 3.74 7.52 4.46 17.60 10.95 5.68 12.38 37.57
Golden Mile Chron. Samples Fimiston Stage II 52299_4-2 Conc. (ppm) 62.36 11.79 5138.20 465000.00 531.10 211.79 7.21 169.68 188.90 6.93 31.08 BDDL 0.90 0.96 0.78 19.03 0.07 0.22 0.96 0.56 0.99 5.75 0.04 0.67Precision(%) 14.88 14.68 10.35 9.74 14.64 10.38 13.55 10.43 12.18 35.84 15.82
Golden Mile Chron. Samples Fimiston Stage III 52198_1 Conc. (ppm) 108.54 0.88 1.16 465000.00 100.46 487.33 2.29 1.33 178.06 6.37 7.73 BDDL 0.29 0.82 0.50 7.72 0.04 0.14 0.52 0.33 2.37 4.22 0.01 0.57Precision(%) 16.45 40.41 21.81 3.78 7.64 5.01 24.57 14.14 15.03 28.76 38.37
Golden Mile Chron. Samples Fimiston Stage III 52198_2 Conc. (ppm) 10.09 BD 7.09 465000.00 358.42 188.55 372.88 25.02 143.64 14.80 0.04 BDDL 0.40 0.78 0.46 17.38 0.06 0.21 0.46 0.30 2.51 3.08 0.01 0.58Precision(%) 6.01 9.92 3.58 4.37 5.37 15.58 40.51 6.31 12.53 40.15
Golden Mile Chron. Samples Fimiston Stage III 52198_3 Conc. (ppm) 1530.80 2.63 63.51 465000.00 296.61 178.90 22.01 3.39 624.76 6.05 2.11 BDDL 0.57 0.61 0.38 30.57 0.05 0.16 0.47 0.31 2.30 3.72 0.02 0.67Precision(%) 10.88 14.95 21.58 3.25 5.71 4.27 12.40 21.61 11.94 25.50 12.26
Golden Mile Chron. Samples Fimiston Stage III 52198_4 Conc. (ppm) 604.06 9.96 5.03 465000.00 104.82 268.74 105.75 4.44 2159.83 8.45 0.51 BDDL 0.51 0.71 0.55 19.68 0.07 0.17 0.50 0.33 2.01 4.10 0.02 0.58Precision(%) 8.35 8.98 10.87 3.19 5.36 5.37 14.90 21.58 8.56 20.59 8.96
Golden Mile Chron. Samples Fimiston Stage III LGX_2-1 Conc. (ppm) 20.25 BD 0.83 465000.00 58.74 3.97 2.27 0.92 35.06 39.15 28.97 BDDL 0.40 0.61 0.34 12.03 0.05 0.13 0.52 0.23 1.93 4.59 0.01 0.67Precision(%) 12.25 27.91 3.62 8.22 5.99 14.26 16.47 6.30 6.97 9.67
Golden Mile Chron. Samples Fimiston Stage III LGX_2-2 Conc. (ppm) 54674.46 BD 84.02 465000.00 68.89 4.83 151.37 14.14 769.45 9.84 56.01 0.79DL 0.44 0.74 0.33 8.32 0.04 0.09 0.53 0.34 1.94 5.79 0.02 0.63Precision(%) 10.96 14.10 4.02 3.99 7.01 15.79 14.32 6.50 24.47 6.85 32.78
Golden Mile Chron. Samples Fimiston Stage III LGX_2-3 Conc. (ppm) 691.96 BD 51.38 465000.00 81.51 6.38 24.99 325.52 295.94 27.12 52.05 BDDL 0.67 0.63 0.31 9.34 0.04 0.17 0.44 0.18 1.51 4.20 0.01 0.61Precision(%) 7.93 21.27 2.88 6.55 6.39 6.69 43.10 10.37 8.98 8.75
Golden Mile Chron. Samples Fimiston Stage III LGX_5-1 Conc. (ppm) 6.99 0.17 BD 465000.00 5.16 11.47 BD 0.62 55.66 27.48 BD BDDL 0.26 0.81 0.34 5.17 0.04 0.15 0.43 0.20 1.70 5.30 0.01 0.48Precision(%) 5.76 177.40 3.74 7.96 7.85 19.02 4.68 9.78
Golden Mile Chron. Samples Fimiston Stage III LGX_5-2 Conc. (ppm) 6.18 BD BD 465000.00 116.29 21.34 0.64 0.87 39.65 31.00 BD BDDL 0.43 0.75 0.35 4.51 0.02 0.14 0.50 0.20 1.70 5.12 0.01 0.63Precision(%) 6.21 3.69 10.55 10.32 42.43 15.89 9.70 9.67
Golden Mile Chron. Samples Fimiston Stage III UG10_1 Conc. (ppm) 16487.61 2.37 23.91 465000.00 250.88 250.99 296.66 3.29 1448.66 9.03 14.45 BDDL 0.45 0.76 0.44 8.14 0.05 0.21 0.46 0.38 2.39 4.86 0.02 0.70Precision(%) 17.67 22.06 17.92 4.98 9.87 9.46 17.92 13.54 7.82 23.64 12.34
338
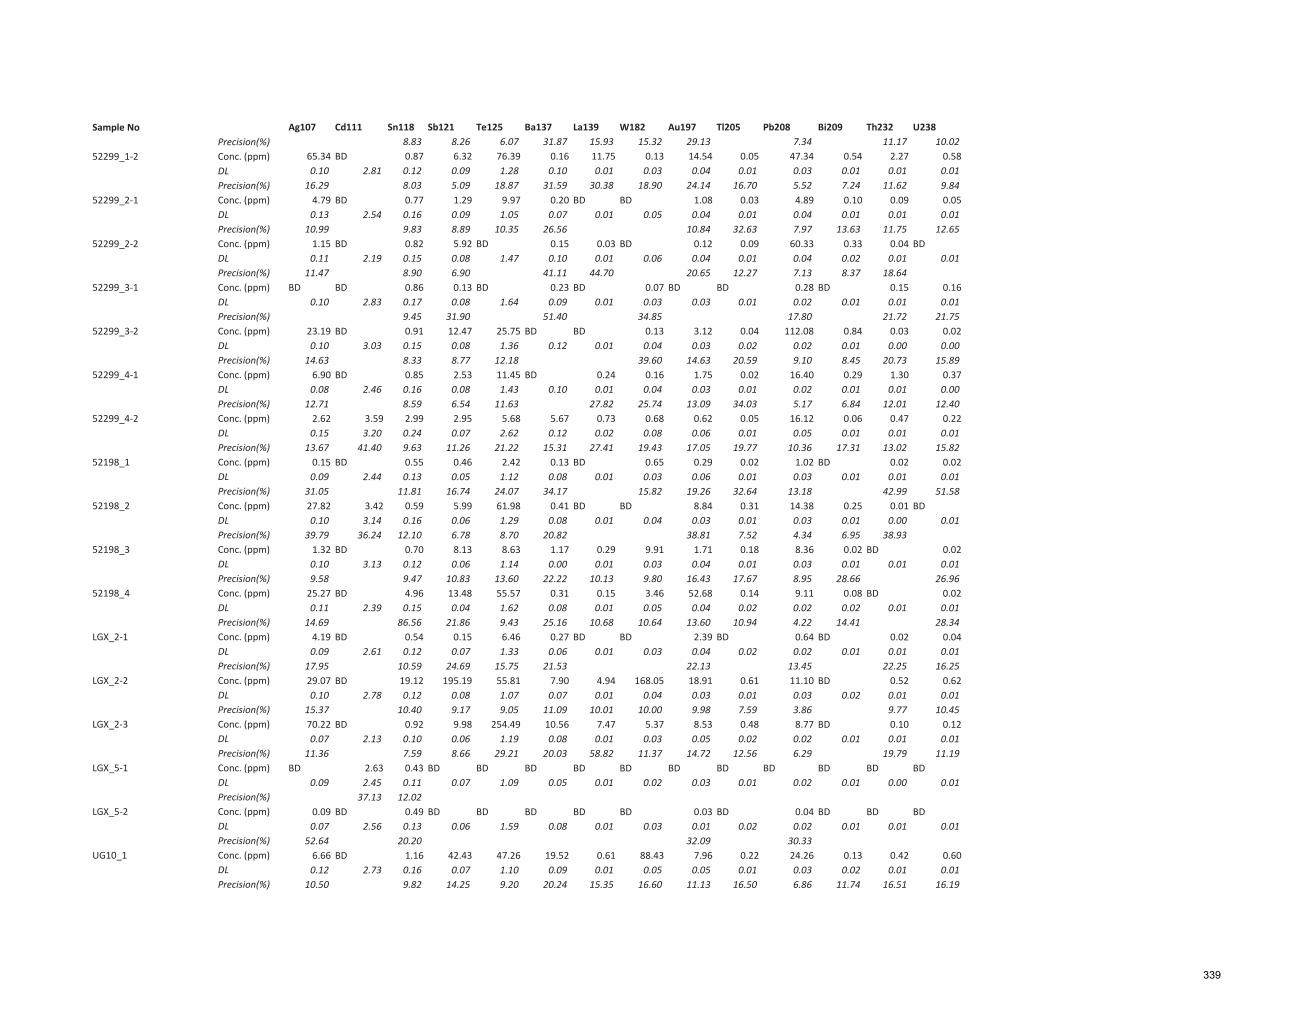
Sample NoPrecision(%)
52299_1-2 Conc. (ppm)DLPrecision(%)
52299_2-1 Conc. (ppm)DLPrecision(%)
52299_2-2 Conc. (ppm)DLPrecision(%)
52299_3-1 Conc. (ppm)DLPrecision(%)
52299_3-2 Conc. (ppm)DLPrecision(%)
52299_4-1 Conc. (ppm)DLPrecision(%)
52299_4-2 Conc. (ppm)DLPrecision(%)
52198_1 Conc. (ppm)DLPrecision(%)
52198_2 Conc. (ppm)DLPrecision(%)
52198_3 Conc. (ppm)DLPrecision(%)
52198_4 Conc. (ppm)DLPrecision(%)
LGX_2-1 Conc. (ppm)DLPrecision(%)
LGX_2-2 Conc. (ppm)DLPrecision(%)
LGX_2-3 Conc. (ppm)DLPrecision(%)
LGX_5-1 Conc. (ppm)DLPrecision(%)
LGX_5-2 Conc. (ppm)DLPrecision(%)
UG10_1 Conc. (ppm)DLPrecision(%)
Ag107 Cd111 Sn118 Sb121 Te125 Ba137 La139 W182 Au197 Tl205 Pb208 Bi209 Th232 U2388.83 8.26 6.07 31.87 15.93 15.32 29.13 7.34 11.17 10.02
65.34 BD 0.87 6.32 76.39 0.16 11.75 0.13 14.54 0.05 47.34 0.54 2.27 0.580.10 2.81 0.12 0.09 1.28 0.10 0.01 0.03 0.04 0.01 0.03 0.01 0.01 0.01
16.29 8.03 5.09 18.87 31.59 30.38 18.90 24.14 16.70 5.52 7.24 11.62 9.844.79 BD 0.77 1.29 9.97 0.20 BD BD 1.08 0.03 4.89 0.10 0.09 0.050.13 2.54 0.16 0.09 1.05 0.07 0.01 0.05 0.04 0.01 0.04 0.01 0.01 0.01
10.99 9.83 8.89 10.35 26.56 10.84 32.63 7.97 13.63 11.75 12.651.15 BD 0.82 5.92 BD 0.15 0.03 BD 0.12 0.09 60.33 0.33 0.04 BD0.11 2.19 0.15 0.08 1.47 0.10 0.01 0.06 0.04 0.01 0.04 0.02 0.01 0.01
11.47 8.90 6.90 41.11 44.70 20.65 12.27 7.13 8.37 18.64BD BD 0.86 0.13 BD 0.23 BD 0.07 BD BD 0.28 BD 0.15 0.16
0.10 2.83 0.17 0.08 1.64 0.09 0.01 0.03 0.03 0.01 0.02 0.01 0.01 0.019.45 31.90 51.40 34.85 17.80 21.72 21.75
23.19 BD 0.91 12.47 25.75 BD BD 0.13 3.12 0.04 112.08 0.84 0.03 0.020.10 3.03 0.15 0.08 1.36 0.12 0.01 0.04 0.03 0.02 0.02 0.01 0.00 0.00
14.63 8.33 8.77 12.18 39.60 14.63 20.59 9.10 8.45 20.73 15.896.90 BD 0.85 2.53 11.45 BD 0.24 0.16 1.75 0.02 16.40 0.29 1.30 0.370.08 2.46 0.16 0.08 1.43 0.10 0.01 0.04 0.03 0.01 0.02 0.01 0.01 0.00
12.71 8.59 6.54 11.63 27.82 25.74 13.09 34.03 5.17 6.84 12.01 12.402.62 3.59 2.99 2.95 5.68 5.67 0.73 0.68 0.62 0.05 16.12 0.06 0.47 0.220.15 3.20 0.24 0.07 2.62 0.12 0.02 0.08 0.06 0.01 0.05 0.01 0.01 0.01
13.67 41.40 9.63 11.26 21.22 15.31 27.41 19.43 17.05 19.77 10.36 17.31 13.02 15.820.15 BD 0.55 0.46 2.42 0.13 BD 0.65 0.29 0.02 1.02 BD 0.02 0.020.09 2.44 0.13 0.05 1.12 0.08 0.01 0.03 0.06 0.01 0.03 0.01 0.01 0.01
31.05 11.81 16.74 24.07 34.17 15.82 19.26 32.64 13.18 42.99 51.5827.82 3.42 0.59 5.99 61.98 0.41 BD BD 8.84 0.31 14.38 0.25 0.01 BD0.10 3.14 0.16 0.06 1.29 0.08 0.01 0.04 0.03 0.01 0.03 0.01 0.00 0.01
39.79 36.24 12.10 6.78 8.70 20.82 38.81 7.52 4.34 6.95 38.931.32 BD 0.70 8.13 8.63 1.17 0.29 9.91 1.71 0.18 8.36 0.02 BD 0.020.10 3.13 0.12 0.06 1.14 0.00 0.01 0.03 0.04 0.01 0.03 0.01 0.01 0.019.58 9.47 10.83 13.60 22.22 10.13 9.80 16.43 17.67 8.95 28.66 26.96
25.27 BD 4.96 13.48 55.57 0.31 0.15 3.46 52.68 0.14 9.11 0.08 BD 0.020.11 2.39 0.15 0.04 1.62 0.08 0.01 0.05 0.04 0.02 0.02 0.02 0.01 0.01
14.69 86.56 21.86 9.43 25.16 10.68 10.64 13.60 10.94 4.22 14.41 28.344.19 BD 0.54 0.15 6.46 0.27 BD BD 2.39 BD 0.64 BD 0.02 0.040.09 2.61 0.12 0.07 1.33 0.06 0.01 0.03 0.04 0.02 0.02 0.01 0.01 0.01
17.95 10.59 24.69 15.75 21.53 22.13 13.45 22.25 16.2529.07 BD 19.12 195.19 55.81 7.90 4.94 168.05 18.91 0.61 11.10 BD 0.52 0.620.10 2.78 0.12 0.08 1.07 0.07 0.01 0.04 0.03 0.01 0.03 0.02 0.01 0.01
15.37 10.40 9.17 9.05 11.09 10.01 10.00 9.98 7.59 3.86 9.77 10.4570.22 BD 0.92 9.98 254.49 10.56 7.47 5.37 8.53 0.48 8.77 BD 0.10 0.120.07 2.13 0.10 0.06 1.19 0.08 0.01 0.03 0.05 0.02 0.02 0.01 0.01 0.01
11.36 7.59 8.66 29.21 20.03 58.82 11.37 14.72 12.56 6.29 19.79 11.19BD 2.63 0.43 BD BD BD BD BD BD BD BD BD BD BD
0.09 2.45 0.11 0.07 1.09 0.05 0.01 0.02 0.03 0.01 0.02 0.01 0.00 0.0137.13 12.02
0.09 BD 0.49 BD BD BD BD BD 0.03 BD 0.04 BD BD BD0.07 2.56 0.13 0.06 1.59 0.08 0.01 0.03 0.01 0.02 0.02 0.01 0.01 0.01
52.64 20.20 32.09 30.336.66 BD 1.16 42.43 47.26 19.52 0.61 88.43 7.96 0.22 24.26 0.13 0.42 0.600.12 2.73 0.16 0.07 1.10 0.09 0.01 0.05 0.05 0.01 0.03 0.02 0.01 0.01
10.50 9.82 14.25 9.20 20.24 15.35 16.60 11.13 16.50 6.86 11.74 16.51 16.19
339
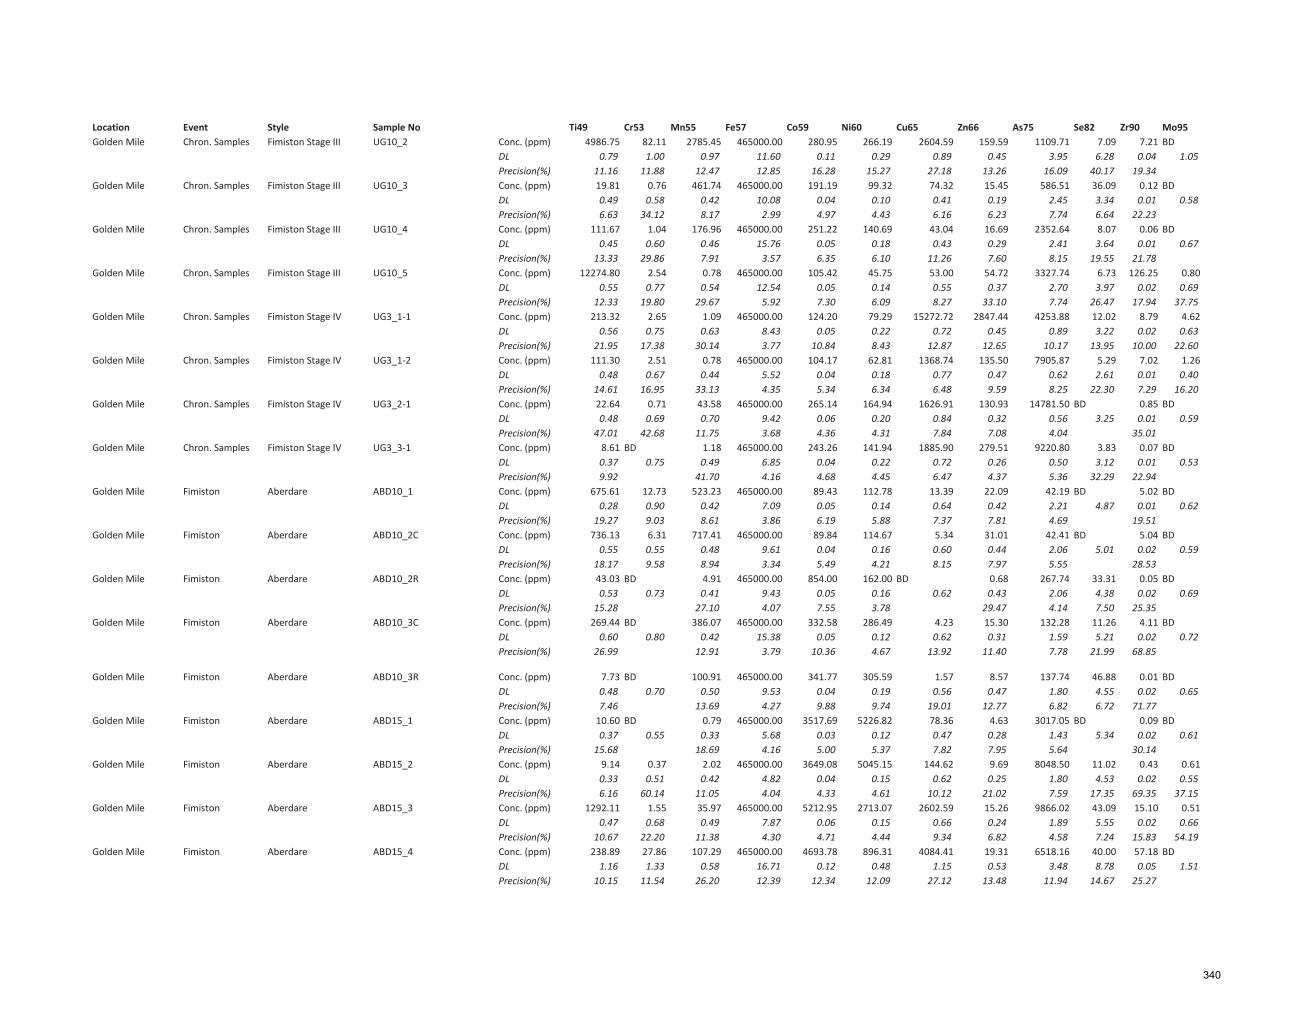
Location Event Style Sample No Ti49 Cr53 Mn55 Fe57 Co59 Ni60 Cu65 Zn66 As75 Se82 Zr90 Mo95Golden Mile Chron. Samples Fimiston Stage III UG10_2 Conc. (ppm) 4986.75 82.11 2785.45 465000.00 280.95 266.19 2604.59 159.59 1109.71 7.09 7.21 BD
DL 0.79 1.00 0.97 11.60 0.11 0.29 0.89 0.45 3.95 6.28 0.04 1.05Precision(%) 11.16 11.88 12.47 12.85 16.28 15.27 27.18 13.26 16.09 40.17 19.34
Golden Mile Chron. Samples Fimiston Stage III UG10_3 Conc. (ppm) 19.81 0.76 461.74 465000.00 191.19 99.32 74.32 15.45 586.51 36.09 0.12 BDDL 0.49 0.58 0.42 10.08 0.04 0.10 0.41 0.19 2.45 3.34 0.01 0.58Precision(%) 6.63 34.12 8.17 2.99 4.97 4.43 6.16 6.23 7.74 6.64 22.23
Golden Mile Chron. Samples Fimiston Stage III UG10_4 Conc. (ppm) 111.67 1.04 176.96 465000.00 251.22 140.69 43.04 16.69 2352.64 8.07 0.06 BDDL 0.45 0.60 0.46 15.76 0.05 0.18 0.43 0.29 2.41 3.64 0.01 0.67Precision(%) 13.33 29.86 7.91 3.57 6.35 6.10 11.26 7.60 8.15 19.55 21.78
Golden Mile Chron. Samples Fimiston Stage III UG10_5 Conc. (ppm) 12274.80 2.54 0.78 465000.00 105.42 45.75 53.00 54.72 3327.74 6.73 126.25 0.80DL 0.55 0.77 0.54 12.54 0.05 0.14 0.55 0.37 2.70 3.97 0.02 0.69Precision(%) 12.33 19.80 29.67 5.92 7.30 6.09 8.27 33.10 7.74 26.47 17.94 37.75
Golden Mile Chron. Samples Fimiston Stage IV UG3_1-1 Conc. (ppm) 213.32 2.65 1.09 465000.00 124.20 79.29 15272.72 2847.44 4253.88 12.02 8.79 4.62DL 0.56 0.75 0.63 8.43 0.05 0.22 0.72 0.45 0.89 3.22 0.02 0.63Precision(%) 21.95 17.38 30.14 3.77 10.84 8.43 12.87 12.65 10.17 13.95 10.00 22.60
Golden Mile Chron. Samples Fimiston Stage IV UG3_1-2 Conc. (ppm) 111.30 2.51 0.78 465000.00 104.17 62.81 1368.74 135.50 7905.87 5.29 7.02 1.26DL 0.48 0.67 0.44 5.52 0.04 0.18 0.77 0.47 0.62 2.61 0.01 0.40Precision(%) 14.61 16.95 33.13 4.35 5.34 6.34 6.48 9.59 8.25 22.30 7.29 16.20
Golden Mile Chron. Samples Fimiston Stage IV UG3_2-1 Conc. (ppm) 22.64 0.71 43.58 465000.00 265.14 164.94 1626.91 130.93 14781.50 BD 0.85 BDDL 0.48 0.69 0.70 9.42 0.06 0.20 0.84 0.32 0.56 3.25 0.01 0.59Precision(%) 47.01 42.68 11.75 3.68 4.36 4.31 7.84 7.08 4.04 35.01
Golden Mile Chron. Samples Fimiston Stage IV UG3_3-1 Conc. (ppm) 8.61 BD 1.18 465000.00 243.26 141.94 1885.90 279.51 9220.80 3.83 0.07 BDDL 0.37 0.75 0.49 6.85 0.04 0.22 0.72 0.26 0.50 3.12 0.01 0.53Precision(%) 9.92 41.70 4.16 4.68 4.45 6.47 4.37 5.36 32.29 22.94
Golden Mile Fimiston Aberdare ABD10_1 Conc. (ppm) 675.61 12.73 523.23 465000.00 89.43 112.78 13.39 22.09 42.19 BD 5.02 BDDL 0.28 0.90 0.42 7.09 0.05 0.14 0.64 0.42 2.21 4.87 0.01 0.62Precision(%) 19.27 9.03 8.61 3.86 6.19 5.88 7.37 7.81 4.69 19.51
Golden Mile Fimiston Aberdare ABD10_2C Conc. (ppm) 736.13 6.31 717.41 465000.00 89.84 114.67 5.34 31.01 42.41 BD 5.04 BDDL 0.55 0.55 0.48 9.61 0.04 0.16 0.60 0.44 2.06 5.01 0.02 0.59Precision(%) 18.17 9.58 8.94 3.34 5.49 4.21 8.15 7.97 5.55 28.53
Golden Mile Fimiston Aberdare ABD10_2R Conc. (ppm) 43.03 BD 4.91 465000.00 854.00 162.00 BD 0.68 267.74 33.31 0.05 BDDL 0.53 0.73 0.41 9.43 0.05 0.16 0.62 0.43 2.06 4.38 0.02 0.69Precision(%) 15.28 27.10 4.07 7.55 3.78 29.47 4.14 7.50 25.35
Golden Mile Fimiston Aberdare ABD10_3C Conc. (ppm) 269.44 BD 386.07 465000.00 332.58 286.49 4.23 15.30 132.28 11.26 4.11 BDDL 0.60 0.80 0.42 15.38 0.05 0.12 0.62 0.31 1.59 5.21 0.02 0.72Precision(%) 26.99 12.91 3.79 10.36 4.67 13.92 11.40 7.78 21.99 68.85
Golden Mile Fimiston Aberdare ABD10_3R Conc. (ppm) 7.73 BD 100.91 465000.00 341.77 305.59 1.57 8.57 137.74 46.88 0.01 BDDL 0.48 0.70 0.50 9.53 0.04 0.19 0.56 0.47 1.80 4.55 0.02 0.65Precision(%) 7.46 13.69 4.27 9.88 9.74 19.01 12.77 6.82 6.72 71.77
Golden Mile Fimiston Aberdare ABD15_1 Conc. (ppm) 10.60 BD 0.79 465000.00 3517.69 5226.82 78.36 4.63 3017.05 BD 0.09 BDDL 0.37 0.55 0.33 5.68 0.03 0.12 0.47 0.28 1.43 5.34 0.02 0.61Precision(%) 15.68 18.69 4.16 5.00 5.37 7.82 7.95 5.64 30.14
Golden Mile Fimiston Aberdare ABD15_2 Conc. (ppm) 9.14 0.37 2.02 465000.00 3649.08 5045.15 144.62 9.69 8048.50 11.02 0.43 0.61DL 0.33 0.51 0.42 4.82 0.04 0.15 0.62 0.25 1.80 4.53 0.02 0.55Precision(%) 6.16 60.14 11.05 4.04 4.33 4.61 10.12 21.02 7.59 17.35 69.35 37.15
Golden Mile Fimiston Aberdare ABD15_3 Conc. (ppm) 1292.11 1.55 35.97 465000.00 5212.95 2713.07 2602.59 15.26 9866.02 43.09 15.10 0.51DL 0.47 0.68 0.49 7.87 0.06 0.15 0.66 0.24 1.89 5.55 0.02 0.66Precision(%) 10.67 22.20 11.38 4.30 4.71 4.44 9.34 6.82 4.58 7.24 15.83 54.19
Golden Mile Fimiston Aberdare ABD15_4 Conc. (ppm) 238.89 27.86 107.29 465000.00 4693.78 896.31 4084.41 19.31 6518.16 40.00 57.18 BDDL 1.16 1.33 0.58 16.71 0.12 0.48 1.15 0.53 3.48 8.78 0.05 1.51Precision(%) 10.15 11.54 26.20 12.39 12.34 12.09 27.12 13.48 11.94 14.67 25.27
340
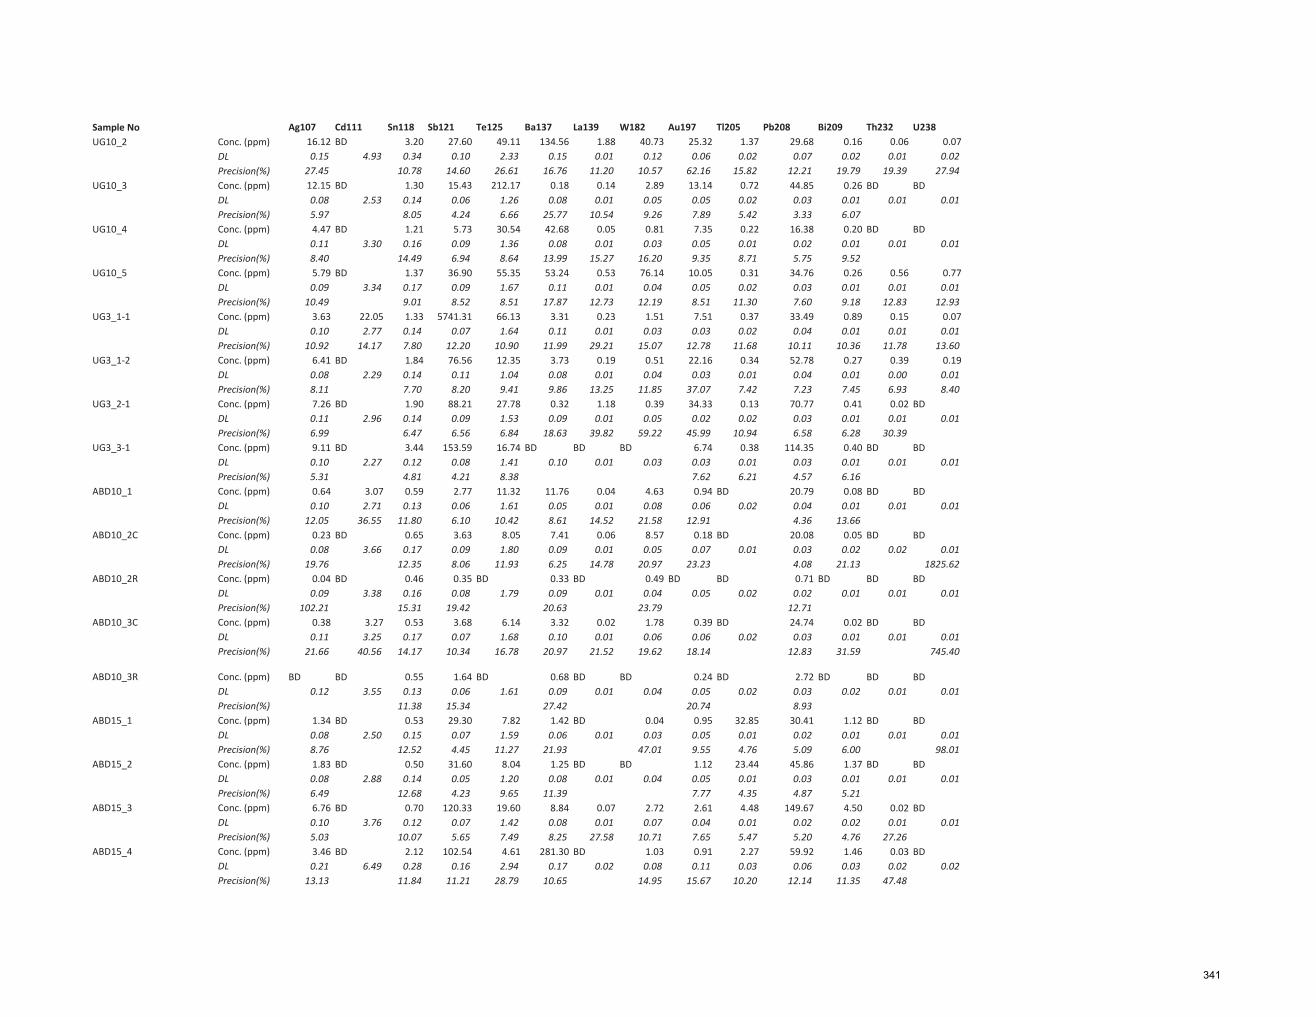
Sample NoUG10_2 Conc. (ppm)
DLPrecision(%)
UG10_3 Conc. (ppm)DLPrecision(%)
UG10_4 Conc. (ppm)DLPrecision(%)
UG10_5 Conc. (ppm)DLPrecision(%)
UG3_1-1 Conc. (ppm)DLPrecision(%)
UG3_1-2 Conc. (ppm)DLPrecision(%)
UG3_2-1 Conc. (ppm)DLPrecision(%)
UG3_3-1 Conc. (ppm)DLPrecision(%)
ABD10_1 Conc. (ppm)DLPrecision(%)
ABD10_2C Conc. (ppm)DLPrecision(%)
ABD10_2R Conc. (ppm)DLPrecision(%)
ABD10_3C Conc. (ppm)DLPrecision(%)
ABD10_3R Conc. (ppm)DLPrecision(%)
ABD15_1 Conc. (ppm)DLPrecision(%)
ABD15_2 Conc. (ppm)DLPrecision(%)
ABD15_3 Conc. (ppm)DLPrecision(%)
ABD15_4 Conc. (ppm)DLPrecision(%)
Ag107 Cd111 Sn118 Sb121 Te125 Ba137 La139 W182 Au197 Tl205 Pb208 Bi209 Th232 U23816.12 BD 3.20 27.60 49.11 134.56 1.88 40.73 25.32 1.37 29.68 0.16 0.06 0.070.15 4.93 0.34 0.10 2.33 0.15 0.01 0.12 0.06 0.02 0.07 0.02 0.01 0.02
27.45 10.78 14.60 26.61 16.76 11.20 10.57 62.16 15.82 12.21 19.79 19.39 27.9412.15 BD 1.30 15.43 212.17 0.18 0.14 2.89 13.14 0.72 44.85 0.26 BD BD0.08 2.53 0.14 0.06 1.26 0.08 0.01 0.05 0.05 0.02 0.03 0.01 0.01 0.015.97 8.05 4.24 6.66 25.77 10.54 9.26 7.89 5.42 3.33 6.074.47 BD 1.21 5.73 30.54 42.68 0.05 0.81 7.35 0.22 16.38 0.20 BD BD0.11 3.30 0.16 0.09 1.36 0.08 0.01 0.03 0.05 0.01 0.02 0.01 0.01 0.018.40 14.49 6.94 8.64 13.99 15.27 16.20 9.35 8.71 5.75 9.525.79 BD 1.37 36.90 55.35 53.24 0.53 76.14 10.05 0.31 34.76 0.26 0.56 0.770.09 3.34 0.17 0.09 1.67 0.11 0.01 0.04 0.05 0.02 0.03 0.01 0.01 0.01
10.49 9.01 8.52 8.51 17.87 12.73 12.19 8.51 11.30 7.60 9.18 12.83 12.933.63 22.05 1.33 5741.31 66.13 3.31 0.23 1.51 7.51 0.37 33.49 0.89 0.15 0.070.10 2.77 0.14 0.07 1.64 0.11 0.01 0.03 0.03 0.02 0.04 0.01 0.01 0.01
10.92 14.17 7.80 12.20 10.90 11.99 29.21 15.07 12.78 11.68 10.11 10.36 11.78 13.606.41 BD 1.84 76.56 12.35 3.73 0.19 0.51 22.16 0.34 52.78 0.27 0.39 0.190.08 2.29 0.14 0.11 1.04 0.08 0.01 0.04 0.03 0.01 0.04 0.01 0.00 0.018.11 7.70 8.20 9.41 9.86 13.25 11.85 37.07 7.42 7.23 7.45 6.93 8.407.26 BD 1.90 88.21 27.78 0.32 1.18 0.39 34.33 0.13 70.77 0.41 0.02 BD0.11 2.96 0.14 0.09 1.53 0.09 0.01 0.05 0.02 0.02 0.03 0.01 0.01 0.016.99 6.47 6.56 6.84 18.63 39.82 59.22 45.99 10.94 6.58 6.28 30.399.11 BD 3.44 153.59 16.74 BD BD BD 6.74 0.38 114.35 0.40 BD BD0.10 2.27 0.12 0.08 1.41 0.10 0.01 0.03 0.03 0.01 0.03 0.01 0.01 0.015.31 4.81 4.21 8.38 7.62 6.21 4.57 6.160.64 3.07 0.59 2.77 11.32 11.76 0.04 4.63 0.94 BD 20.79 0.08 BD BD0.10 2.71 0.13 0.06 1.61 0.05 0.01 0.08 0.06 0.02 0.04 0.01 0.01 0.01
12.05 36.55 11.80 6.10 10.42 8.61 14.52 21.58 12.91 4.36 13.660.23 BD 0.65 3.63 8.05 7.41 0.06 8.57 0.18 BD 20.08 0.05 BD BD0.08 3.66 0.17 0.09 1.80 0.09 0.01 0.05 0.07 0.01 0.03 0.02 0.02 0.01
19.76 12.35 8.06 11.93 6.25 14.78 20.97 23.23 4.08 21.13 1825.620.04 BD 0.46 0.35 BD 0.33 BD 0.49 BD BD 0.71 BD BD BD0.09 3.38 0.16 0.08 1.79 0.09 0.01 0.04 0.05 0.02 0.02 0.01 0.01 0.01
102.21 15.31 19.42 20.63 23.79 12.710.38 3.27 0.53 3.68 6.14 3.32 0.02 1.78 0.39 BD 24.74 0.02 BD BD0.11 3.25 0.17 0.07 1.68 0.10 0.01 0.06 0.06 0.02 0.03 0.01 0.01 0.01
21.66 40.56 14.17 10.34 16.78 20.97 21.52 19.62 18.14 12.83 31.59 745.40
BD BD 0.55 1.64 BD 0.68 BD BD 0.24 BD 2.72 BD BD BD0.12 3.55 0.13 0.06 1.61 0.09 0.01 0.04 0.05 0.02 0.03 0.02 0.01 0.01
11.38 15.34 27.42 20.74 8.931.34 BD 0.53 29.30 7.82 1.42 BD 0.04 0.95 32.85 30.41 1.12 BD BD0.08 2.50 0.15 0.07 1.59 0.06 0.01 0.03 0.05 0.01 0.02 0.01 0.01 0.018.76 12.52 4.45 11.27 21.93 47.01 9.55 4.76 5.09 6.00 98.011.83 BD 0.50 31.60 8.04 1.25 BD BD 1.12 23.44 45.86 1.37 BD BD0.08 2.88 0.14 0.05 1.20 0.08 0.01 0.04 0.05 0.01 0.03 0.01 0.01 0.016.49 12.68 4.23 9.65 11.39 7.77 4.35 4.87 5.216.76 BD 0.70 120.33 19.60 8.84 0.07 2.72 2.61 4.48 149.67 4.50 0.02 BD0.10 3.76 0.12 0.07 1.42 0.08 0.01 0.07 0.04 0.01 0.02 0.02 0.01 0.015.03 10.07 5.65 7.49 8.25 27.58 10.71 7.65 5.47 5.20 4.76 27.263.46 BD 2.12 102.54 4.61 281.30 BD 1.03 0.91 2.27 59.92 1.46 0.03 BD0.21 6.49 0.28 0.16 2.94 0.17 0.02 0.08 0.11 0.03 0.06 0.03 0.02 0.02
13.13 11.84 11.21 28.79 10.65 14.95 15.67 10.20 12.14 11.35 47.48
341

Location Event Style Sample No Ti49 Cr53 Mn55 Fe57 Co59 Ni60 Cu65 Zn66 As75 Se82 Zr90 Mo95Golden Mile Fimiston Aberdare ADGD1/12_1-1 Conc. (ppm) 285.89 1.09 38.62 465000.00 50.22 46.44 13.77 4.21 5456.80 21.43 4.92 BD
DL 0.29 0.53 0.41 5.71 0.03 0.14 0.38 0.20 3.36 3.72 0.01 0.42Precision(%) 12.56 25.67 15.37 3.59 4.92 4.15 10.31 18.04 3.50 8.67 35.77
Golden Mile Fimiston Aberdare ADGD1/12_1-2 Conc. (ppm) 551.77 1.55 227.98 465000.00 77.47 42.03 23.81 14.94 6608.62 21.15 3.93 BDDL 0.38 0.40 0.25 5.07 0.03 0.14 0.47 0.30 3.57 3.67 0.02 0.42Precision(%) 25.39 21.70 28.55 3.75 7.42 8.47 32.30 15.87 4.23 8.80 22.07
Golden Mile Fimiston Aberdare ADGD1/12_1-5 Conc. (ppm) 42.80 BD 7.50 465000.00 164.05 91.66 23.02 82.89 1567.45 17.12 0.86 BDDL 0.25 0.51 0.27 16.52 0.04 0.17 0.42 0.24 1.96 4.09 0.01 0.37Precision(%) 5.36 13.35 3.44 7.75 7.14 9.50 4.80 7.16 13.50 11.76
Golden Mile Fimiston Aberdare ADGD1/12_2-1 Conc. (ppm) 7.13 BD 5.81 465000.00 92.15 21.52 328.61 2.54 75.67 4.89 BD BDDL 0.25 0.45 0.21 18.15 0.03 0.11 0.40 0.18 1.53 2.93 0.01 0.29Precision(%) 5.80 7.76 3.76 4.26 4.05 9.13 9.32 5.07 25.15
Golden Mile Fimiston Aberdare ADGD1/12_2-2 Conc. (ppm) 13.45 BD 694.72 465000.00 116.17 72.06 17.40 41.15 39.79 37.93 0.03 BDDL 0.46 0.67 0.31 32.89 0.05 0.14 0.45 0.26 2.31 4.38 0.01 0.48Precision(%) 11.51 23.67 3.08 7.18 7.53 18.20 24.80 7.84 7.11 41.64
Golden Mile Fimiston Aberdare ADGD1/19_1 Conc. (ppm) 741.78 33.35 21.77 465000.00 457.84 328.35 498.33 63.41 75523.11 15.35 1.51 0.64DL 0.23 0.47 0.27 7.74 0.04 0.10 0.29 0.19 1.48 3.82 0.01 0.41Precision(%) 8.53 8.07 7.43 3.98 7.68 3.93 5.70 13.20 9.93 11.39 9.27 25.81
Golden Mile Fimiston Aberdare ADGD1/6_1-1 Conc. (ppm) 38.84 BD 2.21 465000.00 532.80 979.77 76.02 12.42 1765.07 3.11 0.29 BDDL 0.37 0.54 0.31 5.99 0.04 0.13 0.51 0.23 1.91 6.12 0.01 0.56Precision(%) 35.39 12.95 3.63 5.22 9.57 10.40 14.67 6.36 73.43 17.73
Golden Mile Fimiston Aberdare ADGD1/6_1-2 Conc. (ppm) 1956.09 5.40 5.50 465000.00 418.99 574.82 378.82 2.32 11501.93 10.17 3.48 BDDL 0.26 0.38 0.32 4.86 0.04 0.15 0.46 0.21 1.84 3.35 0.01 0.41Precision(%) 6.14 13.13 13.41 3.04 6.94 9.82 6.80 9.59 4.59 15.19 7.26
Golden Mile Fimiston Aberdare ADGD1/6_2-1 Conc. (ppm) 726.62 0.81 1170.26 465000.00 625.46 618.03 437.23 71.25 8608.00 9.20 6.20 BDDL 0.54 0.73 0.46 11.63 0.06 0.27 0.84 0.40 3.31 4.84 0.02 0.76Precision(%) 14.51 38.62 10.25 10.12 10.63 10.84 23.29 9.36 10.93 24.49 13.83
Golden Mile Fimiston Aberdare ADGD1/6_2-2 Conc. (ppm) 267.15 BD 140.65 465000.00 572.69 1111.63 1380.00 26.18 19106.76 BD 5.88 BDDL 0.42 0.55 0.32 11.87 0.03 0.15 0.46 0.21 2.34 4.09 0.01 0.56Precision(%) 12.76 10.10 3.08 5.08 5.82 9.40 8.01 4.68 9.22
Golden Mile Fimiston Aberdare ADGD1/6_2-3 Conc. (ppm) 93.69 BD 809.78 465000.00 967.16 1084.46 1592.14 64.59 10960.53 12.01 44.55 1.05DL 0.36 0.61 0.32 12.44 0.05 0.16 0.62 0.29 2.37 5.03 0.02 0.56Precision(%) 9.99 11.44 5.00 6.03 7.29 14.10 7.44 7.82 18.22 13.08 25.37
Golden Mile Fimiston Aberdare ADGD2/22_1 Conc. (ppm) 81.90 17.49 0.61 465000.00 371.78 16.84 1.36 2.37 399.31 BD 5.13 BDDL 0.58 0.82 0.51 6.98 0.05 0.22 0.64 0.21 2.11 6.09 0.01 0.86Precision(%) 10.73 12.40 32.40 9.51 11.42 9.94 23.97 10.97 9.69 22.97
Golden Mile Fimiston Aberdare ADGD2/22_2 Conc. (ppm) 7.59 BD BD 465000.00 5.31 4.15 BD 1.56 178.37 BD BD BDDL 0.30 0.53 0.36 4.78 0.04 0.14 0.46 0.24 1.22 3.91 0.01 0.38Precision(%) 5.34 3.22 10.52 9.82 15.74 5.65
Golden Mile Fimiston Aberdare ADGD2/22_3 Conc. (ppm) 16.21 1.73 BD 465000.00 131.49 31.69 1.15 1.63 643.14 6.25 4.50 BDDL 0.40 0.55 0.41 7.92 0.03 0.13 0.43 0.20 1.25 4.91 0.02 0.46Precision(%) 7.87 19.33 3.33 6.59 5.42 16.82 10.16 3.79 30.31 23.23
Golden Mile Fimiston Aberdare ADGD2/22_4 Conc. (ppm) 25.66 4.01 52.34 465000.00 1.97 14.50 1.42 12.58 18.91 BD 0.10 BDDL 0.37 0.58 0.35 6.40 0.05 0.11 0.42 0.36 1.48 4.65 0.01 0.59Precision(%) 7.84 14.30 7.70 4.49 5.66 6.36 14.99 9.36 10.66 34.20
Golden Mile Fimiston Aberdare ADGD2/3_1 Conc. (ppm) 1125.23 2.64 56.38 465000.00 3927.45 2200.93 503.61 40.11 2783.24 11.89 8.87 1.36DL 0.33 0.92 0.40 6.98 0.05 0.17 0.41 0.15 1.19 5.03 0.01 0.58Precision(%) 9.71 16.85 7.09 5.54 5.83 6.44 15.38 11.86 5.96 18.11 7.83 29.92
Golden Mile Fimiston Aberdare ADGD2/4_1-1 Conc. (ppm) 18.24 2.15 39.59 465000.00 207.24 343.18 68.45 3.51 16599.89 21.02 1.47 BDDL 0.21 0.64 0.33 6.49 0.02 0.12 0.42 0.21 1.59 4.70 0.01 0.49Precision(%) 8.76 19.06 11.46 3.48 5.58 4.81 14.04 11.03 5.93 11.27 29.36
Golden Mile Fimiston Aberdare ADGD2/4_1-2 Conc. (ppm) 6253.17 104.06 23.06 465000.00 141.26 120.41 104.47 8.62 13580.58 19.98 8.29 BD
342

Sample NoADGD1/12_1-1 Conc. (ppm)
DLPrecision(%)
ADGD1/12_1-2 Conc. (ppm)DLPrecision(%)
ADGD1/12_1-5 Conc. (ppm)DLPrecision(%)
ADGD1/12_2-1 Conc. (ppm)DLPrecision(%)
ADGD1/12_2-2 Conc. (ppm)DLPrecision(%)
ADGD1/19_1 Conc. (ppm)DLPrecision(%)
ADGD1/6_1-1 Conc. (ppm)DLPrecision(%)
ADGD1/6_1-2 Conc. (ppm)DLPrecision(%)
ADGD1/6_2-1 Conc. (ppm)DLPrecision(%)
ADGD1/6_2-2 Conc. (ppm)DLPrecision(%)
ADGD1/6_2-3 Conc. (ppm)DLPrecision(%)
ADGD2/22_1 Conc. (ppm)DLPrecision(%)
ADGD2/22_2 Conc. (ppm)DLPrecision(%)
ADGD2/22_3 Conc. (ppm)DLPrecision(%)
ADGD2/22_4 Conc. (ppm)DLPrecision(%)
ADGD2/3_1 Conc. (ppm)DLPrecision(%)
ADGD2/4_1-1 Conc. (ppm)DLPrecision(%)
ADGD2/4_1-2 Conc. (ppm)
Ag107 Cd111 Sn118 Sb121 Te125 Ba137 La139 W182 Au197 Tl205 Pb208 Bi209 Th232 U2380.36 BD 0.48 1.58 BD 0.18 0.07 0.57 BD BD 4.51 0.20 BD 0.010.05 2.21 0.09 0.04 1.14 0.05 0.00 0.04 0.03 0.01 0.02 0.01 0.00 0.00
11.03 9.02 7.81 44.29 15.68 12.37 4.40 7.51 44.63BD BD 0.73 1.43 BD 0.28 0.03 3.46 BD BD 4.49 0.09 BD BD
0.08 2.15 0.10 0.06 1.20 0.05 0.01 0.02 0.03 0.01 0.02 0.01 0.01 0.0110.57 15.16 24.12 25.51 28.54 11.85 15.17
0.51 BD 0.52 6.22 BD 0.09 0.01 0.82 0.04 BD 21.40 0.82 BD 0.010.08 2.09 0.08 0.04 1.32 0.05 0.00 0.04 0.02 0.01 0.02 0.01 0.01 0.00
14.24 8.70 7.42 35.21 29.06 8.84 30.21 8.05 8.38 29.130.42 BD 0.48 1.91 BD 0.16 BD BD BD 1.58 3.62 0.22 BD BD0.06 1.57 0.07 0.03 0.99 0.06 0.00 0.02 0.02 0.01 0.02 0.01 0.00 0.00
10.45 8.19 5.38 21.77 5.47 4.17 6.16BD BD 0.57 1.02 BD 0.92 0.05 0.18 BD BD 10.10 0.06 BD BD
0.10 2.62 0.10 0.06 1.34 0.06 0.01 0.02 0.05 0.01 0.02 0.01 0.01 0.019.28 12.92 34.58 29.42 25.97 16.69 15.77 76.56
5.86 BD 0.64 1754.56 BD 7.29 0.46 11.08 6.07 49.06 39.32 0.06 BD BD0.08 2.11 0.09 0.04 0.92 0.07 0.00 0.04 0.02 0.02 0.02 0.01 0.01 0.003.94 8.47 7.68 8.67 37.52 9.28 15.35 4.91 3.74 15.210.42 BD 0.58 51.26 4.77 18.25 BD 0.45 0.40 2.15 11.85 0.05 BD 0.040.07 2.60 0.10 0.06 1.10 0.04 0.01 0.04 0.03 0.01 0.02 0.01 0.01 0.00
16.29 9.58 12.00 16.07 20.43 43.66 10.29 18.74 8.73 17.28 16.390.52 0.90 0.65 350.01 2.31 1.01 0.11 6.81 5.32 24.16 31.67 0.02 0.03 0.020.11 2.67 0.10 0.07 1.11 0.08 0.01 0.03 0.03 0.01 0.01 0.01 0.00 0.01
12.68 113.28 8.53 8.22 23.12 13.91 16.21 6.01 6.23 8.75 8.18 24.31 15.46 21.740.90 BD 1.00 116.74 14.55 244.27 2.18 2.71 0.71 4.15 19.59 0.13 0.25 0.010.16 3.64 0.12 0.10 2.13 0.07 0.02 0.05 0.04 0.02 0.05 0.01 0.01 0.01
16.35 10.09 13.78 14.74 11.11 59.84 12.96 14.11 13.72 10.97 14.02 52.51 37.291.37 BD 0.49 311.57 24.72 2.39 0.13 0.50 1.23 17.32 24.61 0.13 0.06 BD0.05 2.27 0.10 0.04 1.05 0.07 0.01 0.03 0.03 0.01 0.02 0.01 0.01 0.017.66 10.17 3.73 5.99 7.68 18.16 13.48 6.28 4.08 3.78 7.66 11.791.93 BD 0.62 84.21 17.01 32.40 0.16 1.93 1.91 2.59 27.07 0.21 0.07 0.330.08 2.45 0.11 0.08 1.44 0.07 0.01 0.04 0.04 0.01 0.02 0.01 0.01 0.01
11.40 10.18 10.96 9.74 16.27 10.08 10.58 10.79 12.96 7.99 11.27 13.60 13.120.29 BD 0.99 9.70 BD 157.21 BD 0.52 0.16 0.48 9.92 0.87 BD BD0.10 3.43 0.14 0.09 1.84 0.13 0.01 0.04 0.05 0.02 0.04 0.02 0.01 0.01
23.69 11.46 7.92 12.03 13.69 25.58 11.73 9.39 8.79 94.69BD BD 0.53 BD BD BD BD BD BD BD 0.04 BD BD BD
0.06 2.14 0.10 0.04 1.12 0.06 0.00 0.03 0.02 0.01 0.02 0.01 0.01 0.0025.63 27.01
0.09 BD 0.57 5.59 1.22 20.59 BD 0.07 0.04 0.07 5.63 0.24 BD 0.010.07 3.03 0.09 0.06 1.01 0.06 0.00 0.03 0.03 0.01 0.02 0.01 0.01 0.00
37.69 9.28 7.42 38.93 12.87 27.66 35.89 14.26 11.32 10.13 40.82BD BD 0.61 12.49 1.84 32.87 BD 0.12 BD 0.21 19.57 0.33 BD BD
0.08 2.99 0.11 0.09 1.44 0.06 0.01 0.03 0.04 0.01 0.04 0.01 0.01 0.019.90 5.82 35.02 12.08 18.62 10.56 5.43 8.18
2.51 2.71 1.04 51.47 5.32 12.83 0.13 8.89 0.65 0.26 77.25 0.53 0.44 BD0.08 2.31 0.09 0.05 1.17 0.07 0.01 0.02 0.03 0.01 0.02 0.02 0.01 0.016.68 34.30 7.16 5.43 12.63 9.54 16.20 14.66 17.29 7.69 4.90 6.36 86.441.21 BD 0.50 116.99 0.90 4.97 BD 0.23 16.69 6.64 16.72 0.01 BD BD0.09 2.01 0.10 0.06 0.86 0.07 0.01 0.02 0.03 0.01 0.02 0.01 0.01 0.00
12.85 10.32 7.59 39.11 21.10 14.53 10.37 10.86 16.75 38.39 104.940.85 BD 1.40 97.43 BD 480.11 0.09 70.04 3.42 3.23 16.89 0.02 0.02 0.01
343

Location Event Style Sample No Ti49 Cr53 Mn55 Fe57 Co59 Ni60 Cu65 Zn66 As75 Se82 Zr90 Mo95DL 0.74 0.89 0.64 13.15 0.08 0.26 0.81 0.43 3.75 8.65 0.02 1.01Precision(%) 15.00 12.10 13.04 14.25 13.64 13.83 21.99 12.04 14.36 23.08 14.14
Golden Mile Fimiston Aberdare ADGD2/4_2-1 Conc. (ppm) 425.52 2.92 2.20 465000.00 540.47 440.05 30.10 2.10 11061.86 18.14 26.88 BDDL 0.47 0.41 0.37 4.41 0.04 0.08 0.53 0.24 1.98 4.21 0.02 0.59Precision(%) 6.82 15.04 16.39 4.06 12.38 5.99 16.31 9.72 3.94 11.17 6.03
Golden Mile Fimiston Aberdare ADGD2/4_2-2 Conc. (ppm) 4612.65 8.10 4.50 465000.00 315.20 431.68 31.32 2.61 14953.23 18.88 30.10 BDDL 0.31 0.44 0.37 4.92 0.03 0.12 0.57 0.26 2.07 4.49 0.01 0.41Precision(%) 35.09 22.23 26.94 4.21 8.26 6.36 5.55 16.92 3.64 10.97 13.99
Golden Mile Fimiston Depth D1_1-1 Conc. (ppm) 225.96 BD 46.41 465000.00 37.34 40.27 529.77 14.12 6458.27 BD 0.15 BDDL 0.43 0.79 0.60 7.59 0.05 0.13 0.60 0.32 4.92 4.51 0.02 0.47Precision(%) 21.82 19.61 4.00 4.74 6.90 14.00 22.54 5.06 19.03
Golden Mile Fimiston Depth D1_2-1 Conc. (ppm) 6.20 BD BD 465000.00 0.57 1.02 4.77 0.58 5366.79 BD BD BDDL 0.61 0.83 0.74 9.52 0.05 0.24 0.73 0.49 5.00 4.65 0.02 0.52Precision(%) 7.66 3.11 8.00 14.48 9.72 38.31 5.16
Golden Mile Fimiston Depth D1_3-1 Conc. (ppm) 51.49 BD 1.41 465000.00 95.59 28.52 61.58 1.95 4151.91 BD 0.06 BDDL 0.15 0.89 0.64 8.11 0.05 0.07 0.56 0.37 4.96 4.74 0.01 0.52Precision(%) 14.31 18.65 3.54 3.77 4.92 12.09 14.50 5.36 17.60
Golden Mile Fimiston Depth D1_4-1 Conc. (ppm) 297.73 BD 3.17 465000.00 763.06 87.02 414.49 15.12 2660.91 BD 8.34 BDDL 0.50 0.89 0.62 21.58 0.07 0.16 0.62 0.37 5.61 4.17 0.02 0.57Precision(%) 10.07 11.42 3.73 6.01 12.05 12.24 9.47 4.79 19.70
Golden Mile Fimiston Depth D1_5-1 Conc. (ppm) 932.92 BD 59.04 465000.00 364.19 90.32 51.59 6.46 465.32 20.67 8.24 BDDL 0.35 0.80 0.47 22.73 0.06 0.24 0.60 0.24 4.96 3.30 0.02 0.52Precision(%) 9.61 6.98 2.84 6.65 6.16 9.46 7.67 5.14 8.53 7.21
Golden Mile Fimiston Depth d12_4 Conc. (ppm) 168.15 1.60 23.15 465000.00 204.12 331.01 71.98 21.89 5616.35 6.22 1.19 BDDL 0.40 0.64 0.55 8.03 0.04 0.20 0.77 0.16 4.45 4.38 0.02 0.49Precision(%) 30.35 19.18 12.28 3.09 3.42 4.65 4.79 4.21 4.16 28.04 33.73
Golden Mile Fimiston Depth d12_5 Conc. (ppm) 41.91 BD 24723.05 465000.00 7.19 119.64 BD 449.53 178.15 BD BD BDDL 25.07 39.90 41.53 515.51 2.96 10.79 33.45 21.20 264.11 304.84 2.09 40.64Precision(%) 34.74 13.04 12.81 23.65 13.88 12.21 61.69
Golden Mile Fimiston Depth d12_5-2 Conc. (ppm) 64.78 3.40 145.97 465000.00 537.59 551.48 131.16 12.99 2730.20 11.54 3.61 BDDL 0.57 1.31 0.86 11.19 0.06 0.34 1.00 0.51 7.30 6.07 0.03 0.81Precision(%) 13.56 24.52 16.49 11.03 9.74 10.14 15.74 12.10 12.74 24.60 17.06
Golden Mile Fimiston Depth D12-1 Conc. (ppm) 33.55 6.14 135.99 465000.00 186.80 537.85 747.96 25.56 5206.93 11.85 1.14 BDDL 0.42 0.65 0.44 6.57 0.06 0.19 0.59 0.43 3.60 4.49 0.01 0.44Precision(%) 13.02 16.72 8.48 3.52 3.82 4.24 17.12 5.70 5.90 15.56 17.73
Golden Mile Fimiston Depth D12-1A Conc. (ppm) 6.59 BD 13.39 465000.00 10.48 183.44 70.84 41.13 4712.45 BD 0.04 BDDL 0.30 0.81 0.53 6.21 0.04 0.14 0.75 0.29 3.49 6.26 0.02 0.45Precision(%) 9.40 12.95 3.60 4.25 5.84 10.77 4.76 5.75 47.31
Golden Mile Fimiston Depth D12-2 Conc. (ppm) 1102.35 1.02 194.69 465000.00 367.87 591.05 347.29 26.64 3784.86 8.36 19.56 BDDL 0.46 0.79 0.53 7.76 0.06 0.16 0.69 0.35 4.25 5.34 0.02 0.50Precision(%) 12.52 34.26 10.44 3.40 3.54 5.34 6.17 4.97 4.05 25.91 9.84
Golden Mile Fimiston Depth D14_1 Conc. (ppm) 6.56 BD BD 465000.00 16.52 60.72 253.26 1.38 1270.04 23.85 BD BDDL 0.46 0.96 0.55 8.05 0.04 0.23 0.73 0.33 4.46 5.63 0.01 0.49Precision(%) 6.65 3.43 10.25 10.88 9.23 27.50 4.42 11.67
Golden Mile Fimiston Depth D14_2C Conc. (ppm) 5.53 BD BD 465000.00 13.92 157.72 387.41 1.55 223.36 115.92 BD BDDL 0.62 0.73 0.58 7.45 0.05 0.21 0.71 0.28 4.28 4.54 0.02 0.51Precision(%) 8.61 3.64 3.52 3.95 8.78 12.82 3.96 4.67
Golden Mile Fimiston Depth D14_2R Conc. (ppm) 7.89 BD 123.90 465000.00 4.31 175.45 560.43 15.38 4755.80 54.27 BD BDDL 0.44 0.81 0.55 9.09 0.04 0.17 0.77 0.34 4.47 4.65 0.03 0.55Precision(%) 6.18 17.12 3.52 8.49 4.67 5.37 15.24 4.55 6.60
Golden Mile Fimiston Depth D14_3C Conc. (ppm) 9.41 BD BD 465000.00 9.69 251.63 381.12 2.12 1198.01 24.65 BD BDDL 0.45 0.76 0.50 9.79 0.07 0.16 0.62 0.41 3.75 3.95 0.02 0.48
344

Sample NoDLPrecision(%)
ADGD2/4_2-1 Conc. (ppm)DLPrecision(%)
ADGD2/4_2-2 Conc. (ppm)DLPrecision(%)
D1_1-1 Conc. (ppm)DLPrecision(%)
D1_2-1 Conc. (ppm)DLPrecision(%)
D1_3-1 Conc. (ppm)DLPrecision(%)
D1_4-1 Conc. (ppm)DLPrecision(%)
D1_5-1 Conc. (ppm)DLPrecision(%)
d12_4 Conc. (ppm)DLPrecision(%)
d12_5 Conc. (ppm)DLPrecision(%)
d12_5-2 Conc. (ppm)DLPrecision(%)
D12-1 Conc. (ppm)DLPrecision(%)
D12-1A Conc. (ppm)DLPrecision(%)
D12-2 Conc. (ppm)DLPrecision(%)
D14_1 Conc. (ppm)DLPrecision(%)
D14_2C Conc. (ppm)DLPrecision(%)
D14_2R Conc. (ppm)DLPrecision(%)
D14_3C Conc. (ppm)DL
Ag107 Cd111 Sn118 Sb121 Te125 Ba137 La139 W182 Au197 Tl205 Pb208 Bi209 Th232 U2380.12 4.40 0.19 0.10 2.23 0.13 0.02 0.06 0.03 0.02 0.03 0.01 0.01 0.01
17.28 13.32 13.04 12.04 21.47 14.81 17.14 13.55 13.20 32.84 29.88 43.541.45 1.94 0.60 10.43 BD 13.17 0.01 1.91 33.21 0.11 9.73 BD 0.08 0.010.09 2.59 0.09 0.09 0.94 0.07 0.01 0.02 0.03 0.01 0.02 0.01 0.01 0.01
33.92 50.27 8.17 5.91 14.90 31.01 7.24 32.62 12.01 7.37 8.76 28.221.42 BD 0.67 34.23 BD 6.59 0.38 68.74 43.03 BD 37.21 0.04 0.32 0.050.08 2.66 0.11 0.04 1.20 0.06 0.01 0.03 0.04 0.02 0.02 0.01 0.01 0.00
17.12 11.26 9.86 23.40 30.97 35.28 17.94 5.75 15.57 28.08 22.02105.81 BD 0.82 16.91 171.22 1.96 0.04 1.78 200.06 0.15 35.82 0.10 BD BD
0.09 2.63 0.11 0.06 1.33 0.09 0.01 0.00 0.03 0.01 0.02 0.02 0.01 0.0119.47 8.59 9.96 13.47 15.54 19.95 14.84 55.05 7.93 4.89 12.17
0.11 BD 1.06 2.14 BD BD BD BD 0.71 BD 5.67 BD BD BD0.10 2.48 0.16 0.08 1.47 0.10 0.01 0.03 0.04 0.02 0.03 0.01 0.01 0.01
47.31 7.33 8.56 10.71 8.313.01 BD 0.99 19.28 24.13 6.51 0.02 0.76 7.70 0.18 28.34 0.02 BD BD0.09 2.99 0.14 0.07 1.41 0.07 0.01 0.03 0.03 0.02 0.03 0.01 0.01 0.017.00 7.17 4.26 8.78 18.98 57.06 20.05 7.11 9.48 3.44 24.303.70 BD 1.01 16.12 29.94 4.32 0.05 3.11 8.87 0.27 45.28 0.04 0.04 BD0.12 3.20 0.16 0.08 1.69 0.14 0.01 0.04 0.05 0.01 0.04 0.01 0.01 0.017.33 7.88 5.76 7.30 13.36 18.30 13.06 7.44 8.55 5.94 17.57 24.131.53 BD 0.83 15.87 9.93 1.14 0.17 1.16 0.86 0.75 73.51 0.03 BD BD0.08 2.55 0.14 0.05 1.29 0.08 0.01 0.03 0.04 0.01 0.03 0.00 0.01 0.019.27 9.05 4.72 11.31 8.64 12.78 14.15 11.52 5.51 4.54 17.273.91 BD 3.01 19.14 3.28 0.24 0.02 2.50 0.91 0.02 26.28 3.57 BD BD0.10 2.36 0.16 0.09 1.30 0.08 0.01 0.04 0.04 0.01 0.03 0.01 0.01 0.014.54 4.51 3.09 19.98 26.55 33.64 45.99 7.78 34.38 2.80 3.14
BD BD 31.34 BD BD BD 0.91 3.98 BD BD 35.17 1.27 BD BD5.84 199.76 11.28 6.48 93.53 5.35 0.57 1.59 1.59 1.23 1.66 0.81 0.40 0.47
17.46 36.46 28.36 16.53 31.902.80 BD 2.82 11.35 BD 0.13 0.14 1.22 0.47 0.04 15.48 1.50 4.85 BD0.12 4.07 0.25 0.11 2.11 0.11 0.02 0.08 0.05 0.02 0.05 0.02 0.01 0.02
46.02 16.69 11.31 41.82 25.71 12.34 16.55 33.07 10.10 13.29 100.612.40 BD 2.05 18.66 3.57 BD 0.73 0.77 0.66 0.06 31.97 2.33 0.01 BD0.10 2.34 0.14 0.05 1.23 0.12 0.01 0.04 0.04 0.01 0.03 0.01 0.00 0.015.98 5.44 7.52 18.18 27.20 22.80 8.15 14.06 7.33 4.02 30.800.63 BD 2.22 4.17 1.57 BD BD 0.07 0.42 0.02 3.61 0.59 BD BD0.09 2.59 0.13 0.05 1.11 0.08 0.01 0.03 0.04 0.01 0.03 0.01 0.01 0.01
10.96 5.48 5.79 32.19 32.88 11.60 32.75 5.26 6.602.07 BD 4.60 17.91 BD 0.64 0.07 41.65 0.79 0.10 19.90 2.24 BD BD0.12 2.11 0.15 0.06 1.12 0.09 0.01 0.05 0.05 0.02 0.03 0.01 0.01 0.016.12 5.80 3.62 14.64 31.95 21.21 7.92 13.52 3.89 4.173.09 2.47 1.36 1.59 131.02 0.04 BD BD 4.97 0.04 3.31 0.35 BD BD0.10 2.20 0.16 0.04 1.43 0.11 0.01 0.03 0.03 0.01 0.03 0.02 0.01 0.008.62 36.18 7.12 13.70 9.39 132.30 10.90 20.58 8.47 18.21
18.64 BD 1.22 2.25 296.27 BD BD BD 35.60 BD 5.05 0.53 BD BD0.10 3.01 0.17 0.05 1.25 0.10 0.01 0.02 0.06 0.01 0.02 0.01 0.01 0.005.23 7.51 6.40 5.49 6.90 3.85 6.60
45.03 BD 0.97 7.44 2157.98 BD 0.06 BD 507.60 0.05 16.97 1.66 BD BD0.12 2.61 0.14 0.07 1.40 0.12 0.01 0.04 0.05 0.01 0.03 0.01 0.01 0.016.10 7.84 4.81 6.25 20.74 7.22 16.03 4.28 8.312.17 BD 1.08 2.03 154.59 1.23 BD BD 7.01 0.17 6.32 0.95 BD BD0.11 2.41 0.18 0.06 1.45 0.08 0.01 0.04 0.04 0.01 0.03 0.01 0.01 0.00
345
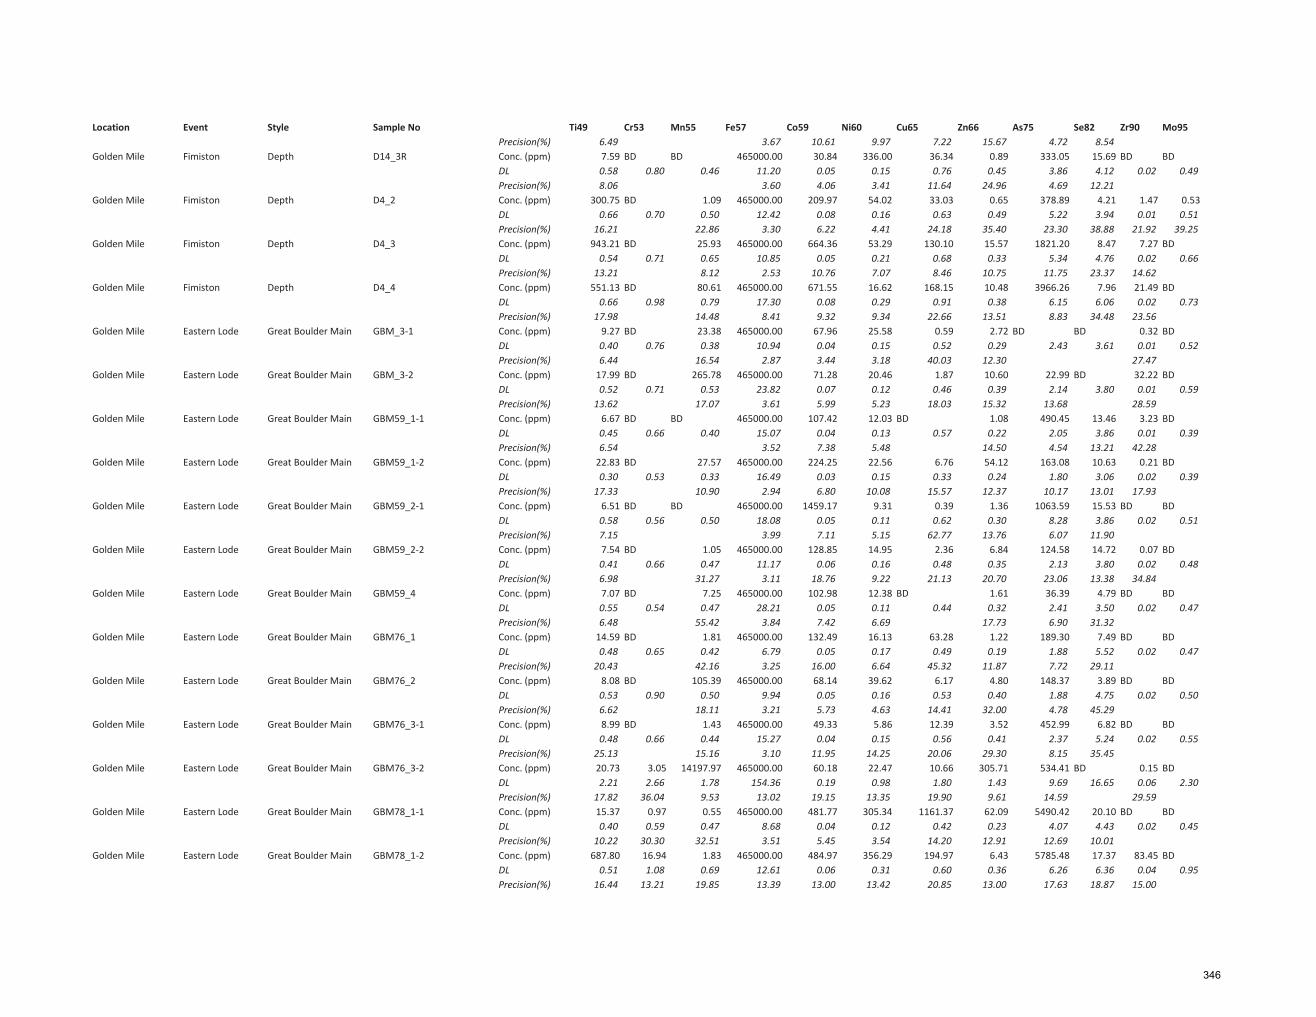
Location Event Style Sample No Ti49 Cr53 Mn55 Fe57 Co59 Ni60 Cu65 Zn66 As75 Se82 Zr90 Mo95Precision(%) 6.49 3.67 10.61 9.97 7.22 15.67 4.72 8.54
Golden Mile Fimiston Depth D14_3R Conc. (ppm) 7.59 BD BD 465000.00 30.84 336.00 36.34 0.89 333.05 15.69 BD BDDL 0.58 0.80 0.46 11.20 0.05 0.15 0.76 0.45 3.86 4.12 0.02 0.49Precision(%) 8.06 3.60 4.06 3.41 11.64 24.96 4.69 12.21
Golden Mile Fimiston Depth D4_2 Conc. (ppm) 300.75 BD 1.09 465000.00 209.97 54.02 33.03 0.65 378.89 4.21 1.47 0.53DL 0.66 0.70 0.50 12.42 0.08 0.16 0.63 0.49 5.22 3.94 0.01 0.51Precision(%) 16.21 22.86 3.30 6.22 4.41 24.18 35.40 23.30 38.88 21.92 39.25
Golden Mile Fimiston Depth D4_3 Conc. (ppm) 943.21 BD 25.93 465000.00 664.36 53.29 130.10 15.57 1821.20 8.47 7.27 BDDL 0.54 0.71 0.65 10.85 0.05 0.21 0.68 0.33 5.34 4.76 0.02 0.66Precision(%) 13.21 8.12 2.53 10.76 7.07 8.46 10.75 11.75 23.37 14.62
Golden Mile Fimiston Depth D4_4 Conc. (ppm) 551.13 BD 80.61 465000.00 671.55 16.62 168.15 10.48 3966.26 7.96 21.49 BDDL 0.66 0.98 0.79 17.30 0.08 0.29 0.91 0.38 6.15 6.06 0.02 0.73Precision(%) 17.98 14.48 8.41 9.32 9.34 22.66 13.51 8.83 34.48 23.56
Golden Mile Eastern Lode Great Boulder Main GBM_3-1 Conc. (ppm) 9.27 BD 23.38 465000.00 67.96 25.58 0.59 2.72 BD BD 0.32 BDDL 0.40 0.76 0.38 10.94 0.04 0.15 0.52 0.29 2.43 3.61 0.01 0.52Precision(%) 6.44 16.54 2.87 3.44 3.18 40.03 12.30 27.47
Golden Mile Eastern Lode Great Boulder Main GBM_3-2 Conc. (ppm) 17.99 BD 265.78 465000.00 71.28 20.46 1.87 10.60 22.99 BD 32.22 BDDL 0.52 0.71 0.53 23.82 0.07 0.12 0.46 0.39 2.14 3.80 0.01 0.59Precision(%) 13.62 17.07 3.61 5.99 5.23 18.03 15.32 13.68 28.59
Golden Mile Eastern Lode Great Boulder Main GBM59_1-1 Conc. (ppm) 6.67 BD BD 465000.00 107.42 12.03 BD 1.08 490.45 13.46 3.23 BDDL 0.45 0.66 0.40 15.07 0.04 0.13 0.57 0.22 2.05 3.86 0.01 0.39Precision(%) 6.54 3.52 7.38 5.48 14.50 4.54 13.21 42.28
Golden Mile Eastern Lode Great Boulder Main GBM59_1-2 Conc. (ppm) 22.83 BD 27.57 465000.00 224.25 22.56 6.76 54.12 163.08 10.63 0.21 BDDL 0.30 0.53 0.33 16.49 0.03 0.15 0.33 0.24 1.80 3.06 0.02 0.39Precision(%) 17.33 10.90 2.94 6.80 10.08 15.57 12.37 10.17 13.01 17.93
Golden Mile Eastern Lode Great Boulder Main GBM59_2-1 Conc. (ppm) 6.51 BD BD 465000.00 1459.17 9.31 0.39 1.36 1063.59 15.53 BD BDDL 0.58 0.56 0.50 18.08 0.05 0.11 0.62 0.30 8.28 3.86 0.02 0.51Precision(%) 7.15 3.99 7.11 5.15 62.77 13.76 6.07 11.90
Golden Mile Eastern Lode Great Boulder Main GBM59_2-2 Conc. (ppm) 7.54 BD 1.05 465000.00 128.85 14.95 2.36 6.84 124.58 14.72 0.07 BDDL 0.41 0.66 0.47 11.17 0.06 0.16 0.48 0.35 2.13 3.80 0.02 0.48Precision(%) 6.98 31.27 3.11 18.76 9.22 21.13 20.70 23.06 13.38 34.84
Golden Mile Eastern Lode Great Boulder Main GBM59_4 Conc. (ppm) 7.07 BD 7.25 465000.00 102.98 12.38 BD 1.61 36.39 4.79 BD BDDL 0.55 0.54 0.47 28.21 0.05 0.11 0.44 0.32 2.41 3.50 0.02 0.47Precision(%) 6.48 55.42 3.84 7.42 6.69 17.73 6.90 31.32
Golden Mile Eastern Lode Great Boulder Main GBM76_1 Conc. (ppm) 14.59 BD 1.81 465000.00 132.49 16.13 63.28 1.22 189.30 7.49 BD BDDL 0.48 0.65 0.42 6.79 0.05 0.17 0.49 0.19 1.88 5.52 0.02 0.47Precision(%) 20.43 42.16 3.25 16.00 6.64 45.32 11.87 7.72 29.11
Golden Mile Eastern Lode Great Boulder Main GBM76_2 Conc. (ppm) 8.08 BD 105.39 465000.00 68.14 39.62 6.17 4.80 148.37 3.89 BD BDDL 0.53 0.90 0.50 9.94 0.05 0.16 0.53 0.40 1.88 4.75 0.02 0.50Precision(%) 6.62 18.11 3.21 5.73 4.63 14.41 32.00 4.78 45.29
Golden Mile Eastern Lode Great Boulder Main GBM76_3-1 Conc. (ppm) 8.99 BD 1.43 465000.00 49.33 5.86 12.39 3.52 452.99 6.82 BD BDDL 0.48 0.66 0.44 15.27 0.04 0.15 0.56 0.41 2.37 5.24 0.02 0.55Precision(%) 25.13 15.16 3.10 11.95 14.25 20.06 29.30 8.15 35.45
Golden Mile Eastern Lode Great Boulder Main GBM76_3-2 Conc. (ppm) 20.73 3.05 14197.97 465000.00 60.18 22.47 10.66 305.71 534.41 BD 0.15 BDDL 2.21 2.66 1.78 154.36 0.19 0.98 1.80 1.43 9.69 16.65 0.06 2.30Precision(%) 17.82 36.04 9.53 13.02 19.15 13.35 19.90 9.61 14.59 29.59
Golden Mile Eastern Lode Great Boulder Main GBM78_1-1 Conc. (ppm) 15.37 0.97 0.55 465000.00 481.77 305.34 1161.37 62.09 5490.42 20.10 BD BDDL 0.40 0.59 0.47 8.68 0.04 0.12 0.42 0.23 4.07 4.43 0.02 0.45Precision(%) 10.22 30.30 32.51 3.51 5.45 3.54 14.20 12.91 12.69 10.01
Golden Mile Eastern Lode Great Boulder Main GBM78_1-2 Conc. (ppm) 687.80 16.94 1.83 465000.00 484.97 356.29 194.97 6.43 5785.48 17.37 83.45 BDDL 0.51 1.08 0.69 12.61 0.06 0.31 0.60 0.36 6.26 6.36 0.04 0.95Precision(%) 16.44 13.21 19.85 13.39 13.00 13.42 20.85 13.00 17.63 18.87 15.00
346
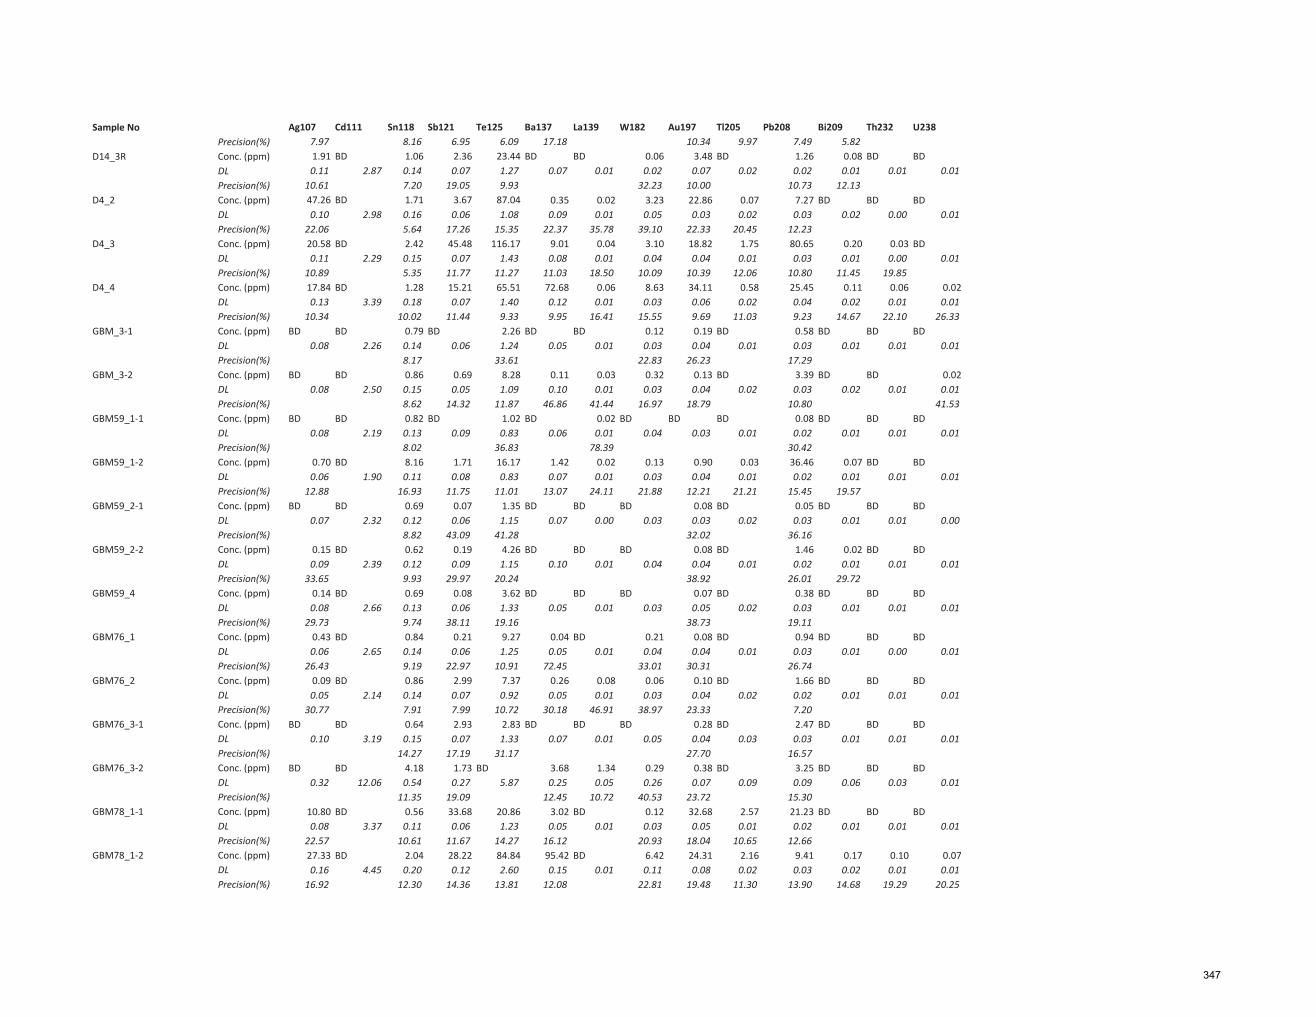
Sample NoPrecision(%)
D14_3R Conc. (ppm)DLPrecision(%)
D4_2 Conc. (ppm)DLPrecision(%)
D4_3 Conc. (ppm)DLPrecision(%)
D4_4 Conc. (ppm)DLPrecision(%)
GBM_3-1 Conc. (ppm)DLPrecision(%)
GBM_3-2 Conc. (ppm)DLPrecision(%)
GBM59_1-1 Conc. (ppm)DLPrecision(%)
GBM59_1-2 Conc. (ppm)DLPrecision(%)
GBM59_2-1 Conc. (ppm)DLPrecision(%)
GBM59_2-2 Conc. (ppm)DLPrecision(%)
GBM59_4 Conc. (ppm)DLPrecision(%)
GBM76_1 Conc. (ppm)DLPrecision(%)
GBM76_2 Conc. (ppm)DLPrecision(%)
GBM76_3-1 Conc. (ppm)DLPrecision(%)
GBM76_3-2 Conc. (ppm)DLPrecision(%)
GBM78_1-1 Conc. (ppm)DLPrecision(%)
GBM78_1-2 Conc. (ppm)DLPrecision(%)
Ag107 Cd111 Sn118 Sb121 Te125 Ba137 La139 W182 Au197 Tl205 Pb208 Bi209 Th232 U2387.97 8.16 6.95 6.09 17.18 10.34 9.97 7.49 5.821.91 BD 1.06 2.36 23.44 BD BD 0.06 3.48 BD 1.26 0.08 BD BD0.11 2.87 0.14 0.07 1.27 0.07 0.01 0.02 0.07 0.02 0.02 0.01 0.01 0.01
10.61 7.20 19.05 9.93 32.23 10.00 10.73 12.1347.26 BD 1.71 3.67 87.04 0.35 0.02 3.23 22.86 0.07 7.27 BD BD BD0.10 2.98 0.16 0.06 1.08 0.09 0.01 0.05 0.03 0.02 0.03 0.02 0.00 0.01
22.06 5.64 17.26 15.35 22.37 35.78 39.10 22.33 20.45 12.2320.58 BD 2.42 45.48 116.17 9.01 0.04 3.10 18.82 1.75 80.65 0.20 0.03 BD0.11 2.29 0.15 0.07 1.43 0.08 0.01 0.04 0.04 0.01 0.03 0.01 0.00 0.01
10.89 5.35 11.77 11.27 11.03 18.50 10.09 10.39 12.06 10.80 11.45 19.8517.84 BD 1.28 15.21 65.51 72.68 0.06 8.63 34.11 0.58 25.45 0.11 0.06 0.020.13 3.39 0.18 0.07 1.40 0.12 0.01 0.03 0.06 0.02 0.04 0.02 0.01 0.01
10.34 10.02 11.44 9.33 9.95 16.41 15.55 9.69 11.03 9.23 14.67 22.10 26.33BD BD 0.79 BD 2.26 BD BD 0.12 0.19 BD 0.58 BD BD BD
0.08 2.26 0.14 0.06 1.24 0.05 0.01 0.03 0.04 0.01 0.03 0.01 0.01 0.018.17 33.61 22.83 26.23 17.29
BD BD 0.86 0.69 8.28 0.11 0.03 0.32 0.13 BD 3.39 BD BD 0.020.08 2.50 0.15 0.05 1.09 0.10 0.01 0.03 0.04 0.02 0.03 0.02 0.01 0.01
8.62 14.32 11.87 46.86 41.44 16.97 18.79 10.80 41.53BD BD 0.82 BD 1.02 BD 0.02 BD BD BD 0.08 BD BD BD
0.08 2.19 0.13 0.09 0.83 0.06 0.01 0.04 0.03 0.01 0.02 0.01 0.01 0.018.02 36.83 78.39 30.42
0.70 BD 8.16 1.71 16.17 1.42 0.02 0.13 0.90 0.03 36.46 0.07 BD BD0.06 1.90 0.11 0.08 0.83 0.07 0.01 0.03 0.04 0.01 0.02 0.01 0.01 0.01
12.88 16.93 11.75 11.01 13.07 24.11 21.88 12.21 21.21 15.45 19.57BD BD 0.69 0.07 1.35 BD BD BD 0.08 BD 0.05 BD BD BD
0.07 2.32 0.12 0.06 1.15 0.07 0.00 0.03 0.03 0.02 0.03 0.01 0.01 0.008.82 43.09 41.28 32.02 36.16
0.15 BD 0.62 0.19 4.26 BD BD BD 0.08 BD 1.46 0.02 BD BD0.09 2.39 0.12 0.09 1.15 0.10 0.01 0.04 0.04 0.01 0.02 0.01 0.01 0.01
33.65 9.93 29.97 20.24 38.92 26.01 29.720.14 BD 0.69 0.08 3.62 BD BD BD 0.07 BD 0.38 BD BD BD0.08 2.66 0.13 0.06 1.33 0.05 0.01 0.03 0.05 0.02 0.03 0.01 0.01 0.01
29.73 9.74 38.11 19.16 38.73 19.110.43 BD 0.84 0.21 9.27 0.04 BD 0.21 0.08 BD 0.94 BD BD BD0.06 2.65 0.14 0.06 1.25 0.05 0.01 0.04 0.04 0.01 0.03 0.01 0.00 0.01
26.43 9.19 22.97 10.91 72.45 33.01 30.31 26.740.09 BD 0.86 2.99 7.37 0.26 0.08 0.06 0.10 BD 1.66 BD BD BD0.05 2.14 0.14 0.07 0.92 0.05 0.01 0.03 0.04 0.02 0.02 0.01 0.01 0.01
30.77 7.91 7.99 10.72 30.18 46.91 38.97 23.33 7.20BD BD 0.64 2.93 2.83 BD BD BD 0.28 BD 2.47 BD BD BD
0.10 3.19 0.15 0.07 1.33 0.07 0.01 0.05 0.04 0.03 0.03 0.01 0.01 0.0114.27 17.19 31.17 27.70 16.57
BD BD 4.18 1.73 BD 3.68 1.34 0.29 0.38 BD 3.25 BD BD BD0.32 12.06 0.54 0.27 5.87 0.25 0.05 0.26 0.07 0.09 0.09 0.06 0.03 0.01
11.35 19.09 12.45 10.72 40.53 23.72 15.3010.80 BD 0.56 33.68 20.86 3.02 BD 0.12 32.68 2.57 21.23 BD BD BD0.08 3.37 0.11 0.06 1.23 0.05 0.01 0.03 0.05 0.01 0.02 0.01 0.01 0.01
22.57 10.61 11.67 14.27 16.12 20.93 18.04 10.65 12.6627.33 BD 2.04 28.22 84.84 95.42 BD 6.42 24.31 2.16 9.41 0.17 0.10 0.070.16 4.45 0.20 0.12 2.60 0.15 0.01 0.11 0.08 0.02 0.03 0.02 0.01 0.01
16.92 12.30 14.36 13.81 12.08 22.81 19.48 11.30 13.90 14.68 19.29 20.25
347

Location Event Style Sample No Ti49 Cr53 Mn55 Fe57 Co59 Ni60 Cu65 Zn66 As75 Se82 Zr90 Mo95Golden Mile Eastern Lode Great Boulder Main GBM78_2-1 Conc. (ppm) 1604.73 44.08 4.51 465000.00 699.92 376.87 150.23 18.95 3787.28 19.52 5.44 BD
DL 0.47 0.83 0.55 14.07 0.10 0.16 0.73 0.39 4.44 6.75 0.03 0.84Precision(%) 12.03 13.60 57.30 10.26 13.65 11.53 19.36 35.39 14.38 18.30 14.80
Golden Mile Eastern Lode Great Boulder Main GBM78_2-2 Conc. (ppm) 100.86 20.77 16.64 465000.00 174.93 103.11 227.97 63.94 3916.24 15.45 0.13 BDDL 0.71 0.65 0.56 19.53 0.05 0.21 0.51 0.19 4.69 5.14 0.02 0.76Precision(%) 11.30 13.02 21.55 7.13 14.32 8.03 16.43 16.43 7.53 15.04 17.28
Golden Mile Eastern Lode Great Boulder Main GBM78_3-1 Conc. (ppm) 6.55 BD 0.90 465000.00 10.88 549.72 1.13 0.79 89.98 21.50 BD BDDL 0.48 0.60 0.43 6.18 0.03 0.10 0.38 0.24 3.53 4.45 0.01 0.50Precision(%) 7.73 26.37 3.93 12.76 9.61 18.67 18.83 5.77 9.35
Golden Mile Eastern Lode Great Boulder Main GBM78_3-2 Conc. (ppm) 7.05 BD 0.78 465000.00 118.89 324.88 BD 0.86 422.74 27.78 BD BDDL 0.45 0.72 0.45 5.54 0.06 0.19 0.48 0.39 3.69 5.11 0.02 0.58Precision(%) 6.66 22.23 3.77 4.52 4.71 21.07 5.90 8.68
Golden Mile Eastern Lode Great Boulder Main GBM96_1-1 Conc. (ppm) 1703.30 102.00 3393.91 465000.00 210.59 320.25 139.88 154.81 1374.95 14.38 6.95 BDDL 0.67 1.31 0.65 13.96 0.08 0.33 0.81 0.72 5.85 7.97 0.03 0.81Precision(%) 20.13 12.57 11.85 13.98 17.48 16.56 26.02 12.42 19.31 26.53 22.85
Golden Mile Eastern Lode Great Boulder Main GBM96_1-2 Conc. (ppm) 427.29 67.90 3684.80 465000.00 521.20 232.06 116.10 60.01 4567.36 10.55 6.70 BDDL 0.76 1.93 1.07 16.09 0.12 0.44 0.89 0.66 8.79 11.83 0.03 1.34Precision(%) 18.27 14.58 14.55 18.02 21.63 20.02 24.57 15.34 20.88 49.71 21.95
Golden Mile Eastern Lode Great Boulder Main GBM96_2-1 Conc. (ppm) 50.64 7.57 3634.26 465000.00 536.29 386.52 62.31 64.97 3393.68 18.74 0.29 BDDL 0.58 1.30 0.90 12.60 0.06 0.30 1.02 0.64 6.61 8.59 0.04 0.97Precision(%) 14.96 17.82 14.66 16.59 18.83 18.02 19.94 14.81 17.96 27.49 19.41
Golden Mile Eastern Lode Great Boulder Main GBM96_2-2 Conc. (ppm) 229.22 21.15 3015.43 465000.00 360.45 463.29 313.42 85.00 5414.72 12.98 10.46 BDDL 0.64 1.35 0.81 9.75 0.05 0.21 0.63 0.61 4.97 7.88 0.02 0.88Precision(%) 14.93 14.04 14.27 15.32 17.13 17.31 33.44 12.66 17.19 28.25 34.93
Golden Mile Eastern Lode Great Boulder Main GBM96_3-1 Conc. (ppm) 1614.00 3.05 1.42 465000.00 616.67 332.28 97.31 12.63 2575.32 18.72 12.87 BDDL 0.25 0.54 0.39 5.84 0.04 0.13 0.37 0.29 2.17 3.40 0.02 0.69Precision(%) 10.30 19.49 17.38 4.54 7.22 6.34 14.63 55.66 9.14 9.65 19.34
Golden Mile Eastern Lode Great Boulder Main GBM96_3-2 Conc. (ppm) 667.55 7.42 231.77 465000.00 898.75 330.47 18.46 5.29 1515.13 16.21 3.41 BDDL 0.45 0.62 0.44 6.07 0.04 0.16 0.42 0.21 3.36 4.37 0.03 0.57Precision(%) 11.26 13.13 11.90 3.89 4.14 4.23 16.45 8.04 4.28 11.95 41.38
Golden Mile Eastern Lode Great Boulder Main GBM97_1-1 Conc. (ppm) 15.71 BD 87.64 465000.00 121.83 147.72 301.87 10.07 13470.89 28.03 5.58 BDDL 0.38 0.60 0.31 6.12 0.03 0.10 0.36 0.24 2.32 4.18 0.01 0.62Precision(%) 6.85 10.72 3.17 4.55 3.79 12.32 14.82 4.22 7.82 28.07
Golden Mile Eastern Lode Great Boulder Main GBM97_1-2 Conc. (ppm) 24.85 6.25 21.69 465000.00 41.87 98.43 591.58 14.52 9982.95 37.80 0.07 6.80DL 0.44 0.51 0.42 6.36 0.08 0.15 0.44 0.25 2.40 3.82 0.02 0.49Precision(%) 17.57 13.09 11.65 2.98 7.04 5.38 13.65 10.16 6.60 9.42 25.11 12.60
Golden Mile Eastern Lode Great Boulder Main GBM97_2-1 Conc. (ppm) 10.72 0.65 22.02 465000.00 147.53 111.56 103.00 9.40 6622.39 140.47 0.38 BDDL 0.30 0.47 0.46 6.06 0.04 0.15 0.42 0.30 2.56 4.22 0.01 0.56Precision(%) 8.09 33.50 7.61 2.81 5.32 3.90 6.54 6.91 5.34 4.73 19.96
Golden Mile Eastern Lode Great Boulder Main GBM97_2-2 Conc. (ppm) 50.65 BD 70.53 465000.00 203.02 178.24 300.29 15.69 12106.71 106.99 0.41 0.73DL 0.51 0.78 0.46 18.30 0.05 0.17 0.44 0.24 2.96 4.62 0.01 0.50Precision(%) 15.24 10.78 3.10 6.94 5.00 15.15 12.25 10.02 7.47 25.89 34.35
Golden Mile Eastern Lode Great Boulder Main GBM97_3 Conc. (ppm) 137.13 BD 14.33 465000.00 228.29 92.66 205.42 10.52 1947.19 93.08 3.34 0.85DL 0.43 0.56 0.39 13.56 0.04 0.17 0.41 0.24 3.18 4.73 0.02 0.54Precision(%) 13.90 8.27 3.59 5.45 7.48 18.47 9.81 11.07 5.15 25.87 27.23
Golden Mile Western Lode Lake View LV27_2 Conc. (ppm) 127.10 BD 2.79 465000.00 275.20 161.26 108.50 8.30 627.95 20.03 4.30 BDDL 0.43 0.88 0.63 10.49 0.05 0.17 0.85 0.38 4.73 5.65 0.02 0.73Precision(%) 19.23 11.08 5.43 5.82 4.55 17.06 10.23 8.42 12.27 13.12
Golden Mile Western Lode Lake View LV27-1 Conc. (ppm) 509.11 0.77 17.65 465000.00 203.78 179.40 185.59 64.16 269.78 14.65 0.46 BDDL 0.83 0.64 0.62 10.36 0.06 0.20 1.00 0.49 5.39 4.82 0.03 0.73Precision(%) 34.65 39.23 17.00 8.35 8.57 8.23 8.89 17.42 8.75 15.41 25.57
Golden Mile Western Lode Lake View LV27-3 Conc. (ppm) 101.11 BD 1.28 465000.00 1077.21 461.94 26.80 6.13 287.90 26.42 9.26 BD
348

Sample NoGBM78_2-1 Conc. (ppm)
DLPrecision(%)
GBM78_2-2 Conc. (ppm)DLPrecision(%)
GBM78_3-1 Conc. (ppm)DLPrecision(%)
GBM78_3-2 Conc. (ppm)DLPrecision(%)
GBM96_1-1 Conc. (ppm)DLPrecision(%)
GBM96_1-2 Conc. (ppm)DLPrecision(%)
GBM96_2-1 Conc. (ppm)DLPrecision(%)
GBM96_2-2 Conc. (ppm)DLPrecision(%)
GBM96_3-1 Conc. (ppm)DLPrecision(%)
GBM96_3-2 Conc. (ppm)DLPrecision(%)
GBM97_1-1 Conc. (ppm)DLPrecision(%)
GBM97_1-2 Conc. (ppm)DLPrecision(%)
GBM97_2-1 Conc. (ppm)DLPrecision(%)
GBM97_2-2 Conc. (ppm)DLPrecision(%)
GBM97_3 Conc. (ppm)DLPrecision(%)
LV27_2 Conc. (ppm)DLPrecision(%)
LV27-1 Conc. (ppm)DLPrecision(%)
LV27-3 Conc. (ppm)
Ag107 Cd111 Sn118 Sb121 Te125 Ba137 La139 W182 Au197 Tl205 Pb208 Bi209 Th232 U23812.91 BD 1.22 21.83 65.50 84.33 0.03 9.50 22.24 1.54 9.12 0.03 BD BD0.15 4.56 0.21 0.08 1.60 0.09 0.01 0.04 0.05 0.02 0.03 0.02 0.01 0.01
11.03 10.89 11.33 11.65 15.20 24.94 11.73 15.60 12.91 11.35 28.4127.24 BD 1.20 18.96 69.80 48.81 BD 0.91 26.95 0.81 3.17 0.08 BD BD0.09 3.69 0.12 0.08 1.98 0.08 0.01 0.04 0.05 0.02 0.02 0.01 0.01 0.01
10.17 9.13 12.09 9.58 12.56 12.11 8.37 9.19 8.05 15.768.42 BD 0.47 0.22 14.25 BD BD BD 2.67 BD 1.14 0.06 BD BD0.11 2.84 0.13 0.08 1.63 0.07 0.01 0.04 0.03 0.02 0.02 0.01 0.01 0.01
34.53 13.04 21.19 14.16 18.11 7.58 17.58BD BD 0.44 BD BD BD BD BD BD BD BD BD BD BD
0.11 2.88 0.13 0.06 1.35 0.04 0.01 0.04 0.03 0.01 0.03 0.01 0.01 0.0113.05
5.00 BD 2.17 8.36 49.57 86.46 1.75 8.46 13.99 0.68 3.06 BD 0.03 BD0.18 5.72 0.24 0.12 2.70 0.14 0.02 0.06 0.12 0.03 0.05 0.02 0.02 0.02
20.59 12.06 17.50 19.83 13.92 14.57 20.61 20.74 13.27 13.17 28.636.98 BD 2.76 45.72 62.90 116.77 0.22 2.99 14.22 1.30 6.97 BD BD BD0.27 7.35 0.24 0.11 3.01 0.22 0.02 0.04 0.16 0.04 0.08 0.03 0.02 0.02
20.33 14.91 22.54 20.32 14.65 15.76 19.11 22.52 16.55 17.877.89 BD 1.55 11.96 84.32 30.65 0.19 0.15 14.52 1.62 4.92 BD BD BD0.19 5.97 0.22 0.14 1.99 0.10 0.03 0.09 0.14 0.03 0.05 0.03 0.01 0.01
19.66 13.99 18.06 18.78 16.84 17.39 33.05 19.41 17.11 17.359.80 BD 2.45 21.08 82.41 75.23 0.46 1.16 16.60 1.32 5.34 0.04 BD BD0.13 4.24 0.22 0.13 2.03 0.15 0.01 0.08 0.08 0.02 0.05 0.02 0.02 0.01
20.11 12.33 25.31 18.66 13.11 15.48 19.33 19.26 13.92 16.73 32.0512.52 BD 0.47 8.92 71.78 4.18 0.03 3.89 36.97 0.32 2.22 BD 0.07 0.030.08 2.36 0.12 0.05 1.31 0.06 0.00 0.04 0.05 0.01 0.03 0.02 0.01 0.019.44 13.39 10.44 7.94 30.75 16.11 9.96 13.02 10.64 8.35 29.66 22.31
80.94 BD 0.60 3.98 105.85 21.66 0.03 2.32 38.70 0.27 3.12 0.02 0.02 BD0.10 2.26 0.13 0.06 1.53 0.08 0.01 0.04 0.04 0.02 0.02 0.01 0.01 0.01
26.54 12.31 13.74 18.60 15.61 19.34 12.39 17.62 9.07 5.94 33.38 30.217.19 BD 0.81 29.59 BD 3.91 0.02 0.06 3.16 0.08 41.73 0.22 BD BD0.08 2.53 0.13 0.06 1.29 0.07 0.01 0.04 0.05 0.01 0.03 0.01 0.01 0.016.59 8.67 17.29 10.76 34.26 33.78 6.20 9.31 4.51 6.959.70 BD 0.70 71.96 1.54 0.12 BD BD 2.48 0.20 122.41 0.44 BD BD0.10 2.62 0.10 0.04 1.03 0.08 0.01 0.05 0.04 0.01 0.02 0.02 0.01 0.01
13.05 8.46 15.34 33.07 35.39 10.20 11.75 9.70 8.523.87 BD 0.83 52.42 2.71 0.23 BD BD 1.94 0.14 211.90 0.64 BD BD0.07 2.82 0.12 0.07 1.72 0.08 0.01 0.04 0.04 0.02 0.02 0.01 0.01 0.016.45 7.66 4.68 27.42 20.28 19.41 9.05 4.24 6.123.89 BD 0.85 45.22 2.27 5.54 0.02 0.04 2.12 0.09 83.41 0.43 BD BD0.08 2.46 0.11 0.05 1.06 0.09 0.01 0.03 0.04 0.01 0.03 0.01 0.01 0.01
11.83 7.43 11.77 23.67 30.61 23.92 37.25 13.52 15.69 7.19 11.033.81 BD 0.85 69.13 1.60 0.74 BD 0.06 0.69 0.18 233.31 1.98 0.01 BD0.10 2.50 0.14 0.07 1.54 0.09 0.01 0.04 0.06 0.01 0.02 0.01 0.01 0.01
12.27 8.26 12.53 39.37 11.94 33.37 12.35 10.72 9.69 7.37 43.690.41 BD 0.84 3.14 BD 22.98 BD 0.34 0.95 0.15 5.67 0.60 BD BD0.11 3.60 0.20 0.07 1.98 0.10 0.01 0.03 0.06 0.02 0.02 0.02 0.01 0.01
15.38 11.33 7.34 13.16 22.12 10.10 10.47 5.04 5.851.77 BD 0.99 9.85 BD 48.67 BD 0.66 3.80 0.27 20.89 2.50 BD BD0.11 3.14 0.18 0.09 1.58 0.13 0.01 0.04 0.04 0.02 0.03 0.01 0.01 0.01
11.69 10.45 8.70 15.64 24.48 12.35 11.86 8.67 9.07BD BD 1.11 0.85 BD 11.46 BD 0.34 0.14 0.07 0.92 0.12 0.11 0.01
349

Location Event Style Sample No Ti49 Cr53 Mn55 Fe57 Co59 Ni60 Cu65 Zn66 As75 Se82 Zr90 Mo95DL 0.76 0.79 0.57 8.89 0.07 0.21 0.88 0.24 5.02 4.25 0.02 0.68Precision(%) 14.78 20.08 6.97 8.02 6.42 14.51 14.87 7.75 9.85 18.87
Golden Mile Western Lode Lake View LV29_1 Conc. (ppm) 8.85 BD 143.84 465000.00 513.30 285.73 42.39 7.12 5892.44 21.73 0.02 BDDL 0.53 0.84 0.55 7.50 0.05 0.17 0.69 0.38 3.99 5.86 0.01 0.53Precision(%) 16.63 18.33 3.76 3.90 4.20 7.11 16.79 4.18 11.55 42.89
Golden Mile Western Lode Lake View LV29_2-1A Conc. (ppm) 53884.65 2.01 10.36 465000.00 488.95 83.18 566.41 15.71 1813.28 7.19 123.22 BDDL 0.61 0.52 0.64 10.18 0.06 0.27 0.89 0.44 4.39 6.68 0.03 0.77Precision(%) 8.82 15.65 9.06 4.82 5.76 5.87 9.07 8.93 6.06 37.04 20.35
Golden Mile Western Lode Lake View LV29_2-1B Conc. (ppm) 3569.95 BD 241.99 465000.00 259.13 37.32 353.74 119.32 5414.86 BD 4.01 BDDL 1.17 1.21 1.00 14.77 0.09 0.40 1.07 0.67 6.45 8.74 0.04 0.85Precision(%) 16.38 15.06 13.85 12.90 14.57 16.95 13.88 14.91 26.67
Golden Mile Western Lode Lake View LV29_3 Conc. (ppm) 1068.84 BD 19.44 465000.00 8706.20 294.88 90.24 26.59 14622.76 11.78 9.68 BDDL 0.59 0.58 0.53 9.43 0.07 0.18 0.78 0.54 3.96 4.49 0.02 0.62Precision(%) 10.95 24.65 4.43 10.55 9.68 14.70 26.24 11.67 18.13 14.18
Golden Mile Western Lode Lake View LV37_1-1 Conc. (ppm) 162.50 BD 63.99 465000.00 199.38 115.09 281.65 14.40 8985.63 BD 5.95 BDDL 0.46 0.68 0.51 10.00 0.06 0.16 0.53 0.17 3.82 5.24 0.03 0.53Precision(%) 6.94 4.84 3.35 3.84 3.59 13.06 5.16 3.94 16.08
Golden Mile Western Lode Lake View LV37_1-2 Conc. (ppm) 13.62 BD 3542.38 465000.00 685.18 233.78 16.63 81.94 470.19 21.47 1.81 0.75DL 0.78 0.91 0.75 12.95 0.07 0.38 0.94 0.43 5.17 6.63 0.03 0.72Precision(%) 13.97 11.03 9.41 10.77 11.75 14.27 10.71 13.51 17.91 26.67 37.82
Golden Mile Western Lode Lake View LV37_2-1 Conc. (ppm) 497.88 BD 180.42 465000.00 53.92 106.84 139.76 5.43 2747.85 10.80 17.75 BDDL 0.54 0.85 0.59 9.22 0.06 0.15 0.71 0.56 3.46 5.68 0.02 0.70Precision(%) 7.95 14.38 3.58 5.17 6.37 18.92 12.31 7.61 21.83 11.55
Golden Mile Western Lode Lake View LV37_2-2 Conc. (ppm) 168.62 BD 59.22 465000.00 727.79 296.46 8.69 128.53 692.73 27.95 2.07 BDDL 0.61 0.81 0.87 11.98 0.07 0.25 0.99 0.54 3.75 6.28 0.04 0.62Precision(%) 10.93 20.09 7.01 10.59 7.66 31.11 15.70 10.80 12.40 33.63
Golden Mile Western Lode Lake View LV37_3-1 Conc. (ppm) 1711.85 BD 94.92 465000.00 106.64 83.73 191.90 21.66 2179.17 7.31 10.56 BDDL 0.62 0.96 0.62 8.58 0.06 0.27 0.74 0.50 4.25 5.15 0.01 0.62Precision(%) 10.34 9.60 4.11 5.27 4.04 18.18 13.06 5.25 30.32 19.73
Golden Mile Western Lode Lake View LV37_3-2 Conc. (ppm) 322.08 BD 31.95 465000.00 107.79 104.61 85.03 2.27 3875.78 10.82 2.65 BDDL 0.69 0.74 0.60 9.43 0.05 0.20 0.79 0.44 3.46 4.39 0.02 0.67Precision(%) 14.71 16.08 3.44 6.12 6.47 8.85 11.65 5.74 18.34 26.94
Golden Mile Western Lode Lake View LV46_1 Conc. (ppm) 37.44 BD 277.07 465000.00 564.58 61.18 208.54 15.50 580.17 22.86 3.27 0.67DL 0.48 0.97 0.61 7.05 0.04 0.12 0.77 0.34 2.87 4.50 0.02 0.58Precision(%) 23.02 10.45 2.81 12.91 4.64 19.97 25.15 5.26 12.02 57.99 37.52
Golden Mile Western Lode Lake View LV46_2-1 Conc. (ppm) 30.68 BD 929.31 465000.00 50.12 14.53 6.97 37.94 395.99 39.82 20.02 BDDL 0.53 0.96 0.75 10.18 0.06 0.26 0.98 0.39 4.56 6.53 0.03 0.78Precision(%) 11.79 14.76 7.65 9.44 8.36 12.17 14.71 8.19 10.66 18.84
Golden Mile Western Lode Lake View LV46_2-2 Conc. (ppm) 37.66 BD 14.18 465000.00 97.43 8.65 41.21 2.85 630.77 25.36 22.79 BDDL 0.44 0.91 0.64 9.41 0.04 0.20 0.70 0.44 3.12 6.66 0.02 0.67Precision(%) 19.43 25.65 3.57 5.47 5.72 12.40 16.33 6.68 11.68 22.33
Golden Mile Western Lode Lake View LV46_3 Conc. (ppm) 1984.09 BD 3.73 465000.00 394.94 18.50 663.45 3.35 173.47 8.59 253.10 BDDL 0.50 0.83 0.58 7.13 0.05 0.12 0.77 0.33 3.18 5.77 0.01 0.67Precision(%) 5.42 16.68 3.50 13.18 7.25 14.50 13.96 5.25 28.13 5.21
Golden Mile Western Lode Lake View LV47_1-1 Conc. (ppm) 6.98 BD 1.41 465000.00 162.34 9.56 70.61 1.14 5678.70 17.01 BD BDDL 0.34 0.53 0.41 7.74 0.04 0.14 0.59 0.18 2.88 3.47 0.02 0.53Precision(%) 6.84 14.05 3.35 14.74 58.99 11.28 13.95 4.41 10.48
Golden Mile Western Lode Lake View LV47_1-2 Conc. (ppm) 6.73 BD BD 465000.00 3.09 10.46 3.85 1.41 18.30 29.78 0.03 BDDL 0.75 1.12 0.62 29.44 0.07 0.26 0.83 0.42 4.15 5.01 0.02 0.88Precision(%) 8.15 2.40 10.70 4.18 11.32 18.41 9.82 8.86 41.65
Golden Mile Western Lode Lake View LV47_2-1 Conc. (ppm) 6.32 BD 0.70 465000.00 3.47 3.52 BD 0.97 8.02 20.83 BD BDDL 0.40 0.68 0.42 8.07 0.05 0.19 0.72 0.43 3.22 4.57 0.02 0.47
350
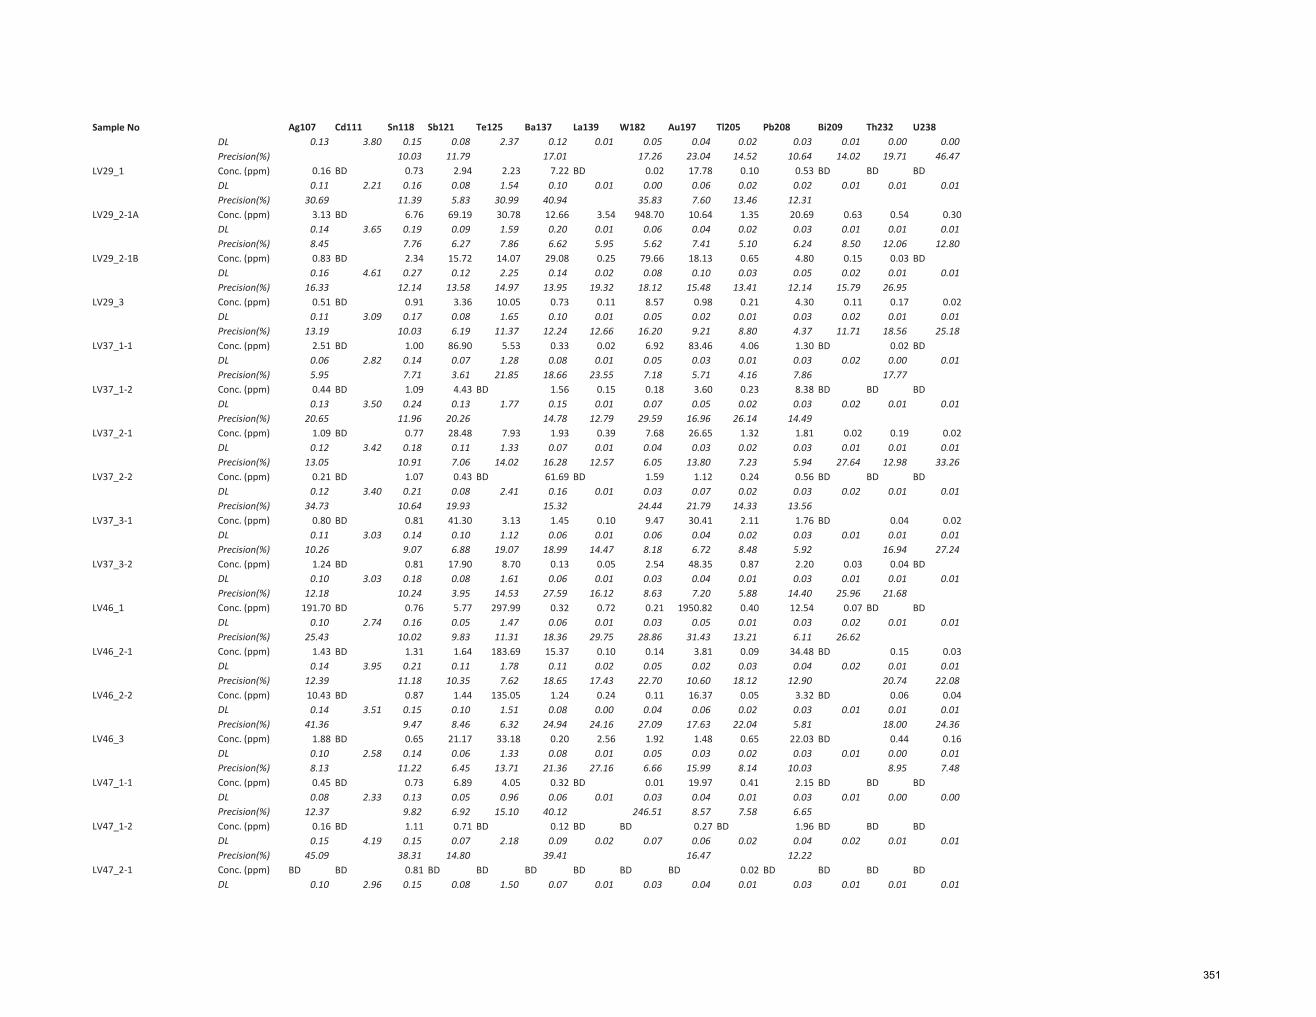
Sample NoDLPrecision(%)
LV29_1 Conc. (ppm)DLPrecision(%)
LV29_2-1A Conc. (ppm)DLPrecision(%)
LV29_2-1B Conc. (ppm)DLPrecision(%)
LV29_3 Conc. (ppm)DLPrecision(%)
LV37_1-1 Conc. (ppm)DLPrecision(%)
LV37_1-2 Conc. (ppm)DLPrecision(%)
LV37_2-1 Conc. (ppm)DLPrecision(%)
LV37_2-2 Conc. (ppm)DLPrecision(%)
LV37_3-1 Conc. (ppm)DLPrecision(%)
LV37_3-2 Conc. (ppm)DLPrecision(%)
LV46_1 Conc. (ppm)DLPrecision(%)
LV46_2-1 Conc. (ppm)DLPrecision(%)
LV46_2-2 Conc. (ppm)DLPrecision(%)
LV46_3 Conc. (ppm)DLPrecision(%)
LV47_1-1 Conc. (ppm)DLPrecision(%)
LV47_1-2 Conc. (ppm)DLPrecision(%)
LV47_2-1 Conc. (ppm)DL
Ag107 Cd111 Sn118 Sb121 Te125 Ba137 La139 W182 Au197 Tl205 Pb208 Bi209 Th232 U2380.13 3.80 0.15 0.08 2.37 0.12 0.01 0.05 0.04 0.02 0.03 0.01 0.00 0.00
10.03 11.79 17.01 17.26 23.04 14.52 10.64 14.02 19.71 46.470.16 BD 0.73 2.94 2.23 7.22 BD 0.02 17.78 0.10 0.53 BD BD BD0.11 2.21 0.16 0.08 1.54 0.10 0.01 0.00 0.06 0.02 0.02 0.01 0.01 0.01
30.69 11.39 5.83 30.99 40.94 35.83 7.60 13.46 12.313.13 BD 6.76 69.19 30.78 12.66 3.54 948.70 10.64 1.35 20.69 0.63 0.54 0.300.14 3.65 0.19 0.09 1.59 0.20 0.01 0.06 0.04 0.02 0.03 0.01 0.01 0.018.45 7.76 6.27 7.86 6.62 5.95 5.62 7.41 5.10 6.24 8.50 12.06 12.800.83 BD 2.34 15.72 14.07 29.08 0.25 79.66 18.13 0.65 4.80 0.15 0.03 BD0.16 4.61 0.27 0.12 2.25 0.14 0.02 0.08 0.10 0.03 0.05 0.02 0.01 0.01
16.33 12.14 13.58 14.97 13.95 19.32 18.12 15.48 13.41 12.14 15.79 26.950.51 BD 0.91 3.36 10.05 0.73 0.11 8.57 0.98 0.21 4.30 0.11 0.17 0.020.11 3.09 0.17 0.08 1.65 0.10 0.01 0.05 0.02 0.01 0.03 0.02 0.01 0.01
13.19 10.03 6.19 11.37 12.24 12.66 16.20 9.21 8.80 4.37 11.71 18.56 25.182.51 BD 1.00 86.90 5.53 0.33 0.02 6.92 83.46 4.06 1.30 BD 0.02 BD0.06 2.82 0.14 0.07 1.28 0.08 0.01 0.05 0.03 0.01 0.03 0.02 0.00 0.015.95 7.71 3.61 21.85 18.66 23.55 7.18 5.71 4.16 7.86 17.770.44 BD 1.09 4.43 BD 1.56 0.15 0.18 3.60 0.23 8.38 BD BD BD0.13 3.50 0.24 0.13 1.77 0.15 0.01 0.07 0.05 0.02 0.03 0.02 0.01 0.01
20.65 11.96 20.26 14.78 12.79 29.59 16.96 26.14 14.491.09 BD 0.77 28.48 7.93 1.93 0.39 7.68 26.65 1.32 1.81 0.02 0.19 0.020.12 3.42 0.18 0.11 1.33 0.07 0.01 0.04 0.03 0.02 0.03 0.01 0.01 0.01
13.05 10.91 7.06 14.02 16.28 12.57 6.05 13.80 7.23 5.94 27.64 12.98 33.260.21 BD 1.07 0.43 BD 61.69 BD 1.59 1.12 0.24 0.56 BD BD BD0.12 3.40 0.21 0.08 2.41 0.16 0.01 0.03 0.07 0.02 0.03 0.02 0.01 0.01
34.73 10.64 19.93 15.32 24.44 21.79 14.33 13.560.80 BD 0.81 41.30 3.13 1.45 0.10 9.47 30.41 2.11 1.76 BD 0.04 0.020.11 3.03 0.14 0.10 1.12 0.06 0.01 0.06 0.04 0.02 0.03 0.01 0.01 0.01
10.26 9.07 6.88 19.07 18.99 14.47 8.18 6.72 8.48 5.92 16.94 27.241.24 BD 0.81 17.90 8.70 0.13 0.05 2.54 48.35 0.87 2.20 0.03 0.04 BD0.10 3.03 0.18 0.08 1.61 0.06 0.01 0.03 0.04 0.01 0.03 0.01 0.01 0.01
12.18 10.24 3.95 14.53 27.59 16.12 8.63 7.20 5.88 14.40 25.96 21.68191.70 BD 0.76 5.77 297.99 0.32 0.72 0.21 1950.82 0.40 12.54 0.07 BD BD
0.10 2.74 0.16 0.05 1.47 0.06 0.01 0.03 0.05 0.01 0.03 0.02 0.01 0.0125.43 10.02 9.83 11.31 18.36 29.75 28.86 31.43 13.21 6.11 26.62
1.43 BD 1.31 1.64 183.69 15.37 0.10 0.14 3.81 0.09 34.48 BD 0.15 0.030.14 3.95 0.21 0.11 1.78 0.11 0.02 0.05 0.02 0.03 0.04 0.02 0.01 0.01
12.39 11.18 10.35 7.62 18.65 17.43 22.70 10.60 18.12 12.90 20.74 22.0810.43 BD 0.87 1.44 135.05 1.24 0.24 0.11 16.37 0.05 3.32 BD 0.06 0.040.14 3.51 0.15 0.10 1.51 0.08 0.00 0.04 0.06 0.02 0.03 0.01 0.01 0.01
41.36 9.47 8.46 6.32 24.94 24.16 27.09 17.63 22.04 5.81 18.00 24.361.88 BD 0.65 21.17 33.18 0.20 2.56 1.92 1.48 0.65 22.03 BD 0.44 0.160.10 2.58 0.14 0.06 1.33 0.08 0.01 0.05 0.03 0.02 0.03 0.01 0.00 0.018.13 11.22 6.45 13.71 21.36 27.16 6.66 15.99 8.14 10.03 8.95 7.480.45 BD 0.73 6.89 4.05 0.32 BD 0.01 19.97 0.41 2.15 BD BD BD0.08 2.33 0.13 0.05 0.96 0.06 0.01 0.03 0.04 0.01 0.03 0.01 0.00 0.00
12.37 9.82 6.92 15.10 40.12 246.51 8.57 7.58 6.650.16 BD 1.11 0.71 BD 0.12 BD BD 0.27 BD 1.96 BD BD BD0.15 4.19 0.15 0.07 2.18 0.09 0.02 0.07 0.06 0.02 0.04 0.02 0.01 0.01
45.09 38.31 14.80 39.41 16.47 12.22BD BD 0.81 BD BD BD BD BD BD 0.02 BD BD BD BD
0.10 2.96 0.15 0.08 1.50 0.07 0.01 0.03 0.04 0.01 0.03 0.01 0.01 0.01
351
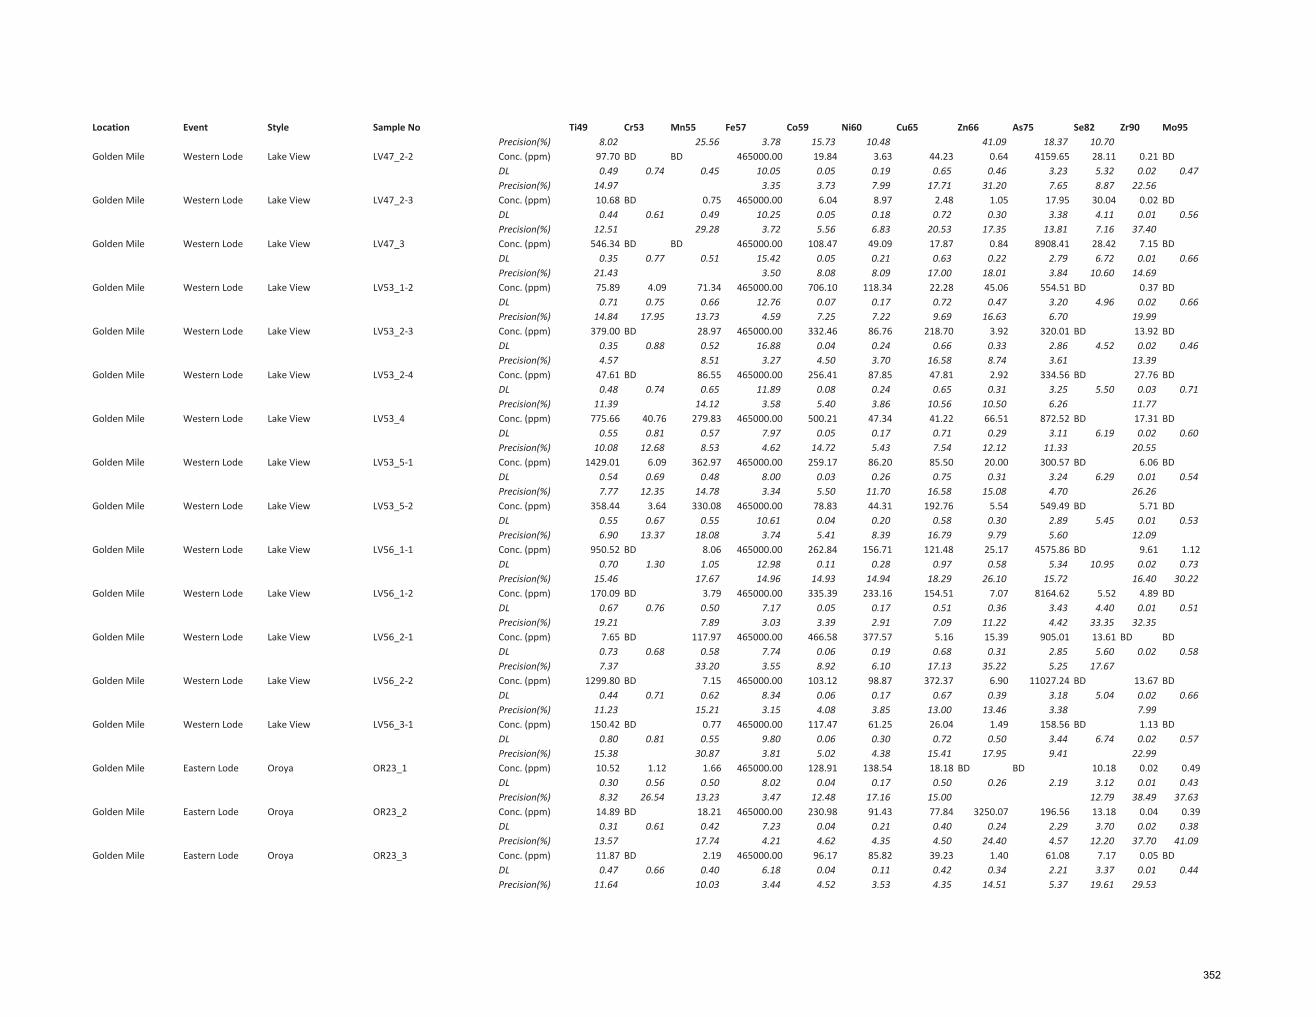
Location Event Style Sample No Ti49 Cr53 Mn55 Fe57 Co59 Ni60 Cu65 Zn66 As75 Se82 Zr90 Mo95Precision(%) 8.02 25.56 3.78 15.73 10.48 41.09 18.37 10.70
Golden Mile Western Lode Lake View LV47_2-2 Conc. (ppm) 97.70 BD BD 465000.00 19.84 3.63 44.23 0.64 4159.65 28.11 0.21 BDDL 0.49 0.74 0.45 10.05 0.05 0.19 0.65 0.46 3.23 5.32 0.02 0.47Precision(%) 14.97 3.35 3.73 7.99 17.71 31.20 7.65 8.87 22.56
Golden Mile Western Lode Lake View LV47_2-3 Conc. (ppm) 10.68 BD 0.75 465000.00 6.04 8.97 2.48 1.05 17.95 30.04 0.02 BDDL 0.44 0.61 0.49 10.25 0.05 0.18 0.72 0.30 3.38 4.11 0.01 0.56Precision(%) 12.51 29.28 3.72 5.56 6.83 20.53 17.35 13.81 7.16 37.40
Golden Mile Western Lode Lake View LV47_3 Conc. (ppm) 546.34 BD BD 465000.00 108.47 49.09 17.87 0.84 8908.41 28.42 7.15 BDDL 0.35 0.77 0.51 15.42 0.05 0.21 0.63 0.22 2.79 6.72 0.01 0.66Precision(%) 21.43 3.50 8.08 8.09 17.00 18.01 3.84 10.60 14.69
Golden Mile Western Lode Lake View LV53_1-2 Conc. (ppm) 75.89 4.09 71.34 465000.00 706.10 118.34 22.28 45.06 554.51 BD 0.37 BDDL 0.71 0.75 0.66 12.76 0.07 0.17 0.72 0.47 3.20 4.96 0.02 0.66Precision(%) 14.84 17.95 13.73 4.59 7.25 7.22 9.69 16.63 6.70 19.99
Golden Mile Western Lode Lake View LV53_2-3 Conc. (ppm) 379.00 BD 28.97 465000.00 332.46 86.76 218.70 3.92 320.01 BD 13.92 BDDL 0.35 0.88 0.52 16.88 0.04 0.24 0.66 0.33 2.86 4.52 0.02 0.46Precision(%) 4.57 8.51 3.27 4.50 3.70 16.58 8.74 3.61 13.39
Golden Mile Western Lode Lake View LV53_2-4 Conc. (ppm) 47.61 BD 86.55 465000.00 256.41 87.85 47.81 2.92 334.56 BD 27.76 BDDL 0.48 0.74 0.65 11.89 0.08 0.24 0.65 0.31 3.25 5.50 0.03 0.71Precision(%) 11.39 14.12 3.58 5.40 3.86 10.56 10.50 6.26 11.77
Golden Mile Western Lode Lake View LV53_4 Conc. (ppm) 775.66 40.76 279.83 465000.00 500.21 47.34 41.22 66.51 872.52 BD 17.31 BDDL 0.55 0.81 0.57 7.97 0.05 0.17 0.71 0.29 3.11 6.19 0.02 0.60Precision(%) 10.08 12.68 8.53 4.62 14.72 5.43 7.54 12.12 11.33 20.55
Golden Mile Western Lode Lake View LV53_5-1 Conc. (ppm) 1429.01 6.09 362.97 465000.00 259.17 86.20 85.50 20.00 300.57 BD 6.06 BDDL 0.54 0.69 0.48 8.00 0.03 0.26 0.75 0.31 3.24 6.29 0.01 0.54Precision(%) 7.77 12.35 14.78 3.34 5.50 11.70 16.58 15.08 4.70 26.26
Golden Mile Western Lode Lake View LV53_5-2 Conc. (ppm) 358.44 3.64 330.08 465000.00 78.83 44.31 192.76 5.54 549.49 BD 5.71 BDDL 0.55 0.67 0.55 10.61 0.04 0.20 0.58 0.30 2.89 5.45 0.01 0.53Precision(%) 6.90 13.37 18.08 3.74 5.41 8.39 16.79 9.79 5.60 12.09
Golden Mile Western Lode Lake View LV56_1-1 Conc. (ppm) 950.52 BD 8.06 465000.00 262.84 156.71 121.48 25.17 4575.86 BD 9.61 1.12DL 0.70 1.30 1.05 12.98 0.11 0.28 0.97 0.58 5.34 10.95 0.02 0.73Precision(%) 15.46 17.67 14.96 14.93 14.94 18.29 26.10 15.72 16.40 30.22
Golden Mile Western Lode Lake View LV56_1-2 Conc. (ppm) 170.09 BD 3.79 465000.00 335.39 233.16 154.51 7.07 8164.62 5.52 4.89 BDDL 0.67 0.76 0.50 7.17 0.05 0.17 0.51 0.36 3.43 4.40 0.01 0.51Precision(%) 19.21 7.89 3.03 3.39 2.91 7.09 11.22 4.42 33.35 32.35
Golden Mile Western Lode Lake View LV56_2-1 Conc. (ppm) 7.65 BD 117.97 465000.00 466.58 377.57 5.16 15.39 905.01 13.61 BD BDDL 0.73 0.68 0.58 7.74 0.06 0.19 0.68 0.31 2.85 5.60 0.02 0.58Precision(%) 7.37 33.20 3.55 8.92 6.10 17.13 35.22 5.25 17.67
Golden Mile Western Lode Lake View LV56_2-2 Conc. (ppm) 1299.80 BD 7.15 465000.00 103.12 98.87 372.37 6.90 11027.24 BD 13.67 BDDL 0.44 0.71 0.62 8.34 0.06 0.17 0.67 0.39 3.18 5.04 0.02 0.66Precision(%) 11.23 15.21 3.15 4.08 3.85 13.00 13.46 3.38 7.99
Golden Mile Western Lode Lake View LV56_3-1 Conc. (ppm) 150.42 BD 0.77 465000.00 117.47 61.25 26.04 1.49 158.56 BD 1.13 BDDL 0.80 0.81 0.55 9.80 0.06 0.30 0.72 0.50 3.44 6.74 0.02 0.57Precision(%) 15.38 30.87 3.81 5.02 4.38 15.41 17.95 9.41 22.99
Golden Mile Eastern Lode Oroya OR23_1 Conc. (ppm) 10.52 1.12 1.66 465000.00 128.91 138.54 18.18 BD BD 10.18 0.02 0.49DL 0.30 0.56 0.50 8.02 0.04 0.17 0.50 0.26 2.19 3.12 0.01 0.43Precision(%) 8.32 26.54 13.23 3.47 12.48 17.16 15.00 12.79 38.49 37.63
Golden Mile Eastern Lode Oroya OR23_2 Conc. (ppm) 14.89 BD 18.21 465000.00 230.98 91.43 77.84 3250.07 196.56 13.18 0.04 0.39DL 0.31 0.61 0.42 7.23 0.04 0.21 0.40 0.24 2.29 3.70 0.02 0.38Precision(%) 13.57 17.74 4.21 4.62 4.35 4.50 24.40 4.57 12.20 37.70 41.09
Golden Mile Eastern Lode Oroya OR23_3 Conc. (ppm) 11.87 BD 2.19 465000.00 96.17 85.82 39.23 1.40 61.08 7.17 0.05 BDDL 0.47 0.66 0.40 6.18 0.04 0.11 0.42 0.34 2.21 3.37 0.01 0.44Precision(%) 11.64 10.03 3.44 4.52 3.53 4.35 14.51 5.37 19.61 29.53
352

Sample NoPrecision(%)
LV47_2-2 Conc. (ppm)DLPrecision(%)
LV47_2-3 Conc. (ppm)DLPrecision(%)
LV47_3 Conc. (ppm)DLPrecision(%)
LV53_1-2 Conc. (ppm)DLPrecision(%)
LV53_2-3 Conc. (ppm)DLPrecision(%)
LV53_2-4 Conc. (ppm)DLPrecision(%)
LV53_4 Conc. (ppm)DLPrecision(%)
LV53_5-1 Conc. (ppm)DLPrecision(%)
LV53_5-2 Conc. (ppm)DLPrecision(%)
LV56_1-1 Conc. (ppm)DLPrecision(%)
LV56_1-2 Conc. (ppm)DLPrecision(%)
LV56_2-1 Conc. (ppm)DLPrecision(%)
LV56_2-2 Conc. (ppm)DLPrecision(%)
LV56_3-1 Conc. (ppm)DLPrecision(%)
OR23_1 Conc. (ppm)DLPrecision(%)
OR23_2 Conc. (ppm)DLPrecision(%)
OR23_3 Conc. (ppm)DLPrecision(%)
Ag107 Cd111 Sn118 Sb121 Te125 Ba137 La139 W182 Au197 Tl205 Pb208 Bi209 Th232 U2389.41 32.42
0.36 BD 0.69 11.95 11.10 0.60 BD 0.58 26.84 0.61 4.61 BD BD BD0.12 2.55 0.12 0.08 1.11 0.09 0.01 0.03 0.04 0.02 0.02 0.01 0.01 0.01
20.48 9.67 12.88 13.80 30.22 22.91 9.75 14.92 10.1724.83 BD 0.71 0.12 BD BD BD BD 868.62 BD 0.41 BD BD BD0.09 2.29 0.16 0.08 1.11 0.09 0.01 0.04 0.04 0.02 0.03 0.02 0.01 0.01
26.60 10.61 33.72 20.74 25.470.15 BD 0.61 5.29 35.15 0.36 0.15 2.56 1.81 0.18 2.96 BD 0.02 BD0.07 2.86 0.13 0.07 1.07 0.06 0.01 0.03 0.03 0.01 0.03 0.02 0.01 0.01
38.33 11.00 12.37 6.27 27.60 35.26 26.79 7.13 12.23 10.70 23.710.84 BD 1.01 2.20 4.06 0.13 0.03 1.25 0.48 0.04 3.28 0.02 BD BD0.17 3.58 0.20 0.08 1.48 0.11 0.01 0.03 0.04 0.02 0.03 0.01 0.01 0.01
12.05 10.70 11.10 18.69 41.22 32.60 28.02 12.59 23.41 6.14 31.042.97 BD 0.63 9.88 4.42 0.41 0.04 1.48 0.46 0.06 12.28 0.08 0.02 BD0.09 2.93 0.18 0.07 1.47 0.09 0.01 0.02 0.04 0.02 0.02 0.01 0.01 0.016.94 12.62 3.43 16.33 17.68 23.39 6.34 12.35 13.97 3.36 12.76 32.771.27 BD 0.76 6.24 3.42 0.13 BD 0.13 0.39 0.09 6.34 0.05 0.03 BD0.13 3.18 0.17 0.07 0.97 0.12 0.01 0.05 0.05 0.01 0.03 0.01 0.01 0.018.69 426.75 10.36 5.58 18.03 41.25 20.79 12.36 13.94 4.95 18.25 19.482.06 2.64 1.74 5.02 7.24 1.75 0.82 125.67 0.43 0.23 5.19 0.08 0.01 BD0.12 2.55 0.14 0.06 1.20 0.12 0.01 0.04 0.03 0.02 0.04 0.01 0.00 0.019.58 39.25 7.15 7.15 11.70 12.79 48.86 19.36 13.78 9.77 6.47 12.40 30.461.37 BD 0.96 4.64 3.86 17.97 0.18 167.77 15.33 0.17 2.85 0.04 BD BD0.08 2.81 0.15 0.07 1.20 0.10 0.01 0.05 0.04 0.02 0.03 0.01 0.00 0.01
12.92 20.75 5.41 16.25 72.44 10.00 7.87 75.06 9.70 4.26 18.381.91 BD 0.70 14.61 3.64 1.52 0.28 3.95 3.62 0.13 4.22 BD 0.02 BD0.07 2.55 0.19 0.08 1.40 0.00 0.01 0.04 0.03 0.01 0.03 0.02 0.01 0.018.58 12.21 4.90 22.10 14.64 26.84 9.93 49.40 10.78 5.99 31.500.93 BD 1.22 34.97 4.79 122.81 0.31 3.55 2.28 2.49 7.47 BD 0.04 BD0.23 5.42 0.29 0.10 1.57 0.15 0.01 0.08 0.04 0.04 0.05 0.03 0.02 0.01
20.02 16.23 15.03 22.51 15.38 59.79 15.95 18.97 13.23 15.17 33.642.26 BD 0.81 78.87 7.38 0.63 BD 1.06 6.64 4.04 18.88 0.06 BD BD0.09 2.54 0.16 0.09 1.20 0.06 0.01 0.04 0.03 0.01 0.02 0.01 0.01 0.016.34 9.53 3.87 10.35 17.26 15.00 8.20 7.06 5.86 12.600.11 BD 0.74 1.66 BD BD BD BD 0.36 0.11 0.81 BD BD BD0.10 2.73 0.15 0.08 1.35 0.07 0.01 0.04 0.04 0.02 0.03 0.02 0.01 0.01
40.60 10.74 15.26 15.15 17.32 13.612.34 BD 0.75 41.15 7.68 0.72 0.46 5.52 49.34 2.07 8.47 0.06 0.07 BD0.08 2.64 0.18 0.05 1.22 0.06 0.01 0.03 0.04 0.02 0.03 0.01 0.01 0.015.88 11.09 6.26 10.91 10.85 29.80 11.70 7.50 4.25 5.85 15.66 15.280.45 BD 0.83 2.05 3.35 BD BD 1.14 0.39 0.05 5.45 0.05 BD BD0.11 2.89 0.17 0.07 1.79 0.09 0.01 0.05 0.05 0.02 0.04 0.01 0.01 0.01
15.44 10.42 7.27 23.56 66.40 12.64 20.79 5.10 14.610.70 1.10 0.63 BD 1.32 2.13 BD BD 0.08 0.16 9.07 0.55 BD BD0.08 2.55 0.14 0.07 1.19 0.08 0.01 0.05 0.04 0.01 0.02 0.01 0.01 0.01
14.98 86.44 10.78 41.31 22.74 28.56 10.28 18.63 12.468.89 6.00 0.65 653.56 17.70 BD BD BD 0.83 0.64 630.38 11.21 BD BD0.07 1.99 0.12 0.05 1.14 0.06 0.01 0.04 0.03 0.01 0.03 0.01 0.01 0.01
20.98 28.28 9.89 20.04 9.23 7.29 5.23 20.85 16.310.60 BD 0.58 13.80 3.77 BD BD BD 0.34 0.79 2.71 0.65 BD BD0.07 2.23 0.15 0.06 1.07 0.06 0.01 0.03 0.05 0.01 0.03 0.01 0.01 0.019.57 11.55 6.08 14.41 10.72 4.79 5.45 6.90
353

Location Event Style Sample No Ti49 Cr53 Mn55 Fe57 Co59 Ni60 Cu65 Zn66 As75 Se82 Zr90 Mo95Golden Mile Eastern Lode Oroya OR23_4-1 Conc. (ppm) 372.61 32.38 22.26 465000.00 745.61 172.58 28.10 16.71 347.71 17.16 13.73 4.28
DL 0.54 0.81 0.53 8.06 0.04 0.16 0.59 0.32 3.38 4.16 0.02 0.81Precision(%) 23.03 9.94 10.68 8.49 9.79 8.95 11.01 13.60 10.17 13.18 13.12 42.04
Golden Mile Eastern Lode Oroya OR23_4-2 Conc. (ppm) 105.28 1.55 26.78 465000.00 519.56 162.66 13.93 2.00 296.49 22.04 20.62 8.06DL 0.46 0.44 0.46 6.34 0.03 0.16 0.45 0.27 2.29 3.76 0.02 0.44Precision(%) 27.54 15.52 16.01 3.79 7.44 6.05 8.24 12.02 7.69 8.94 20.66 31.73
Golden Mile Eastern Lode Oroya OR25_1 Conc. (ppm) 22.65 1.47 20.30 465000.00 110.09 87.02 26.70 2.46 414.71 BD BD 0.71DL 0.45 0.64 0.39 7.56 0.04 0.16 0.47 0.31 1.81 3.61 0.02 0.47Precision(%) 10.35 21.89 12.22 3.64 7.02 4.87 5.71 10.02 9.69 26.71
Golden Mile Eastern Lode Oroya OR25_2-1 Conc. (ppm) 185.43 26.81 5.36 465000.00 398.73 383.88 60.44 6.01 695.31 21.02 15.24 2.04DL 0.42 0.79 0.53 7.71 0.03 0.15 0.60 0.40 2.20 4.16 0.01 0.48Precision(%) 14.42 7.06 7.99 4.33 4.32 5.78 21.65 7.92 5.05 10.09 11.94 13.83
Golden Mile Eastern Lode Oroya OR25_2-2 Conc. (ppm) 139.26 3.33 15.80 465000.00 998.75 459.79 22.09 5.52 476.12 62.80 5.48 1.09DL 0.46 0.67 0.45 7.22 0.04 0.11 0.46 0.35 1.90 3.12 0.02 0.53Precision(%) 14.29 12.59 4.42 3.91 4.07 3.80 8.54 8.61 4.20 5.00 12.22 25.11
Golden Mile Eastern Lode Oroya OR25_3-1 Conc. (ppm) 1510.02 119.57 447.96 465000.00 221.70 656.39 17.51 18.30 6584.79 16.00 26.26 BDDL 0.47 0.85 0.71 19.37 0.09 0.20 0.70 0.48 3.43 5.35 0.02 0.68Precision(%) 13.41 11.19 12.18 10.90 9.86 10.65 33.63 11.17 11.67 16.54 12.28
Golden Mile Eastern Lode Oroya OR25_3-2 Conc. (ppm) 2048.00 156.63 2.90 465000.00 293.42 814.31 28.78 5.72 9944.68 11.27 53.10 BDDL 1.58 1.63 1.64 32.42 0.12 0.49 1.34 0.84 6.46 11.12 0.05 1.21Precision(%) 22.37 16.28 35.86 17.28 17.49 17.71 17.60 18.64 20.92 44.23 18.86
Golden Mile Eastern Lode Oroya OR25_3-3 Conc. (ppm) 1998.96 60.25 1.03 465000.00 375.02 846.99 135.29 264.22 5859.33 15.70 30.43 BDDL 0.43 0.72 0.50 21.52 0.05 0.18 0.60 0.29 2.30 3.86 0.03 0.58Precision(%) 8.89 8.05 23.00 7.08 6.91 6.89 23.72 26.80 7.58 12.45 11.37
Golden Mile Eastern Lode Oroya OR3_1-1 Conc. (ppm) 491.34 25.99 62.66 465000.00 261.26 324.83 24.14 17.30 1488.46 37.28 10.05 BDDL 0.49 0.73 0.67 9.11 0.06 0.23 0.65 0.36 3.29 5.55 0.03 0.65Precision(%) 9.47 10.36 8.77 3.96 15.79 4.27 8.96 5.89 4.03 7.98 8.51
Golden Mile Eastern Lode Oroya OR3_1-2 Conc. (ppm) 1778.29 27.97 204.90 465000.00 99.94 214.83 41.16 12.31 8248.76 6.85 26.02 BDDL 0.48 0.77 0.62 9.00 0.05 0.25 0.83 0.39 3.05 4.96 0.02 0.55Precision(%) 4.30 6.82 7.98 3.51 4.53 3.46 10.35 6.13 4.25 30.68 9.18
Golden Mile Eastern Lode Oroya OR3_1-3 Conc. (ppm) 17.39 BD 3.43 465000.00 41.40 36.32 6.94 1.43 58.03 53.42 0.08 BDDL 0.48 0.76 0.67 14.32 0.06 0.22 0.67 0.33 3.17 5.04 0.02 0.55Precision(%) 9.80 10.28 3.91 6.79 6.22 7.02 13.68 7.92 6.20 19.23
Golden Mile Eastern Lode Oroya OR3_2-1 Conc. (ppm) 8.36 BD 185.23 465000.00 19.44 54.88 379.96 4.34 2044.77 88.82 BD BDDL 0.27 0.52 0.52 8.16 0.02 0.16 0.35 0.23 2.18 3.32 0.02 0.39Precision(%) 10.91 16.03 3.44 4.58 6.51 6.07 12.97 6.46 5.03
Golden Mile Eastern Lode Oroya OR3_2-2 Conc. (ppm) 7.42 BD 36.01 465000.00 17.55 55.26 997.40 1.44 1502.00 85.15 BD BDDL 0.44 0.60 0.46 10.76 0.03 0.15 0.40 0.26 2.08 3.60 0.02 0.36Precision(%) 8.44 12.02 3.31 23.70 5.55 7.87 15.21 5.74 6.22
Golden Mile Eastern Lode Oroya OR3_4-1 Conc. (ppm) 5560.40 171.55 4.46 465000.00 552.17 583.05 146.24 9.61 4355.37 23.32 88.79 BDDL 0.34 0.76 0.56 14.82 0.05 0.14 0.58 0.27 3.10 5.12 0.02 0.57Precision(%) 12.78 17.03 39.43 11.31 13.55 14.37 12.64 11.76 14.20 14.27 13.27
Golden Mile Eastern Lode Oroya OR3_4-2 Conc. (ppm) 4975.14 633.59 25.80 465000.00 617.06 415.73 142.35 79.94 3156.18 24.98 64.52 BDDL 0.63 1.03 0.99 23.69 0.09 0.26 0.71 0.74 4.47 7.45 0.03 0.68Precision(%) 17.14 11.46 15.93 13.15 14.44 13.55 17.49 14.40 16.15 18.35 19.70
Golden Mile Eastern Lode Oroya OR9_1-1 Conc. (ppm) 3637.07 9.92 14.50 465000.00 236.13 1117.56 144.74 4.86 1504.85 10.52 26.14 BDDL 0.41 0.54 0.48 6.59 0.04 0.10 0.44 0.27 2.02 3.76 0.02 0.47Precision(%) 5.30 6.82 18.89 3.67 4.21 4.45 10.93 14.14 4.88 14.78 5.36
Golden Mile Eastern Lode Oroya OR9_1-2 Conc. (ppm) 5719.31 39.31 6.17 465000.00 685.99 667.34 361.00 19.36 5126.93 4.86 46.11 BDDL 0.51 0.51 0.51 7.79 0.05 0.11 0.41 0.25 1.78 3.05 0.02 0.46Precision(%) 3.82 7.00 5.10 3.20 7.97 2.93 14.04 6.90 3.48 25.10 5.55
Golden Mile Eastern Lode Oroya OR9_2-1 Conc. (ppm) 2951.62 14.85 7.95 465000.00 49.18 188.01 88.93 10.83 1972.22 4.59 29.96 BD
354

Sample NoOR23_4-1 Conc. (ppm)
DLPrecision(%)
OR23_4-2 Conc. (ppm)DLPrecision(%)
OR25_1 Conc. (ppm)DLPrecision(%)
OR25_2-1 Conc. (ppm)DLPrecision(%)
OR25_2-2 Conc. (ppm)DLPrecision(%)
OR25_3-1 Conc. (ppm)DLPrecision(%)
OR25_3-2 Conc. (ppm)DLPrecision(%)
OR25_3-3 Conc. (ppm)DLPrecision(%)
OR3_1-1 Conc. (ppm)DLPrecision(%)
OR3_1-2 Conc. (ppm)DLPrecision(%)
OR3_1-3 Conc. (ppm)DLPrecision(%)
OR3_2-1 Conc. (ppm)DLPrecision(%)
OR3_2-2 Conc. (ppm)DLPrecision(%)
OR3_4-1 Conc. (ppm)DLPrecision(%)
OR3_4-2 Conc. (ppm)DLPrecision(%)
OR9_1-1 Conc. (ppm)DLPrecision(%)
OR9_1-2 Conc. (ppm)DLPrecision(%)
OR9_2-1 Conc. (ppm)
Ag107 Cd111 Sn118 Sb121 Te125 Ba137 La139 W182 Au197 Tl205 Pb208 Bi209 Th232 U2381.20 BD 1.47 164.17 2.72 100.78 0.05 1.15 0.29 0.49 139.60 2.89 0.32 0.140.11 2.98 0.16 0.12 1.33 0.09 0.01 0.07 0.06 0.01 0.03 0.02 0.01 0.01
10.60 9.06 10.25 23.65 12.31 35.20 29.55 14.56 7.94 10.55 10.13 17.06 16.730.64 BD 0.65 61.14 3.13 1.37 0.20 0.46 0.17 0.34 66.88 1.33 2.94 0.140.06 2.59 0.12 0.06 0.99 0.08 0.01 0.05 0.05 0.01 0.03 0.01 0.01 0.01
10.78 9.47 6.36 16.73 18.66 54.62 28.08 17.19 11.51 7.41 6.49 95.57 19.571.02 BD 0.54 20.57 11.39 0.43 BD BD 0.92 0.58 14.25 0.15 BD BD0.06 2.04 0.13 0.07 1.17 0.08 0.01 0.04 0.03 0.01 0.03 0.01 0.01 0.018.17 11.16 4.36 9.11 16.50 7.27 7.56 4.69 9.122.54 BD 0.91 119.77 56.33 51.91 0.75 0.18 1.61 0.72 69.50 0.60 0.18 0.100.10 2.23 0.17 0.06 1.21 0.07 0.01 0.04 0.05 0.02 0.03 0.01 0.01 0.016.48 9.07 4.94 6.28 6.73 19.47 21.50 6.65 5.58 4.68 5.80 11.99 13.082.21 BD 0.63 115.58 49.96 44.61 0.12 0.10 1.70 2.08 52.25 0.48 0.05 0.040.08 1.98 0.14 0.06 0.79 0.06 0.01 0.03 0.04 0.02 0.02 0.01 0.01 0.015.39 10.71 3.25 5.03 26.67 12.35 23.97 5.83 4.90 3.35 5.10 14.52 17.055.75 BD 2.89 27.14 25.60 112.26 0.10 4.18 1.67 0.81 16.41 0.19 1.30 0.160.12 3.78 0.20 0.07 1.32 0.07 0.01 0.05 0.06 0.02 0.03 0.01 0.01 0.01
25.72 36.22 10.78 13.93 11.80 14.40 15.40 13.82 8.74 9.76 14.13 85.17 14.561.54 BD 1.16 36.33 24.71 158.04 BD 8.27 3.18 1.93 11.72 0.15 0.29 0.240.20 6.93 0.40 0.17 4.12 0.25 0.03 0.12 0.10 0.05 0.10 0.03 0.02 0.03
21.49 21.12 17.85 27.67 16.65 27.21 18.55 14.73 17.19 21.62 20.05 20.161.83 BD 1.03 34.44 24.37 60.03 0.06 5.60 2.71 0.90 17.06 0.25 0.17 0.190.10 3.07 0.13 0.08 1.65 0.10 0.01 0.04 0.05 0.02 0.04 0.02 0.01 0.01
10.46 9.44 8.44 8.86 8.84 17.91 9.53 9.55 8.03 8.56 9.82 12.54 11.393.53 BD 1.29 5.16 72.85 37.05 0.06 3.10 4.20 0.14 3.57 0.31 0.07 0.080.13 2.67 0.19 0.10 1.10 0.06 0.01 0.05 0.06 0.02 0.02 0.01 0.01 0.016.43 7.81 5.68 6.44 10.62 16.28 10.09 9.99 12.42 4.61 9.94 12.42 12.83
16.19 2.91 1.27 104.03 120.64 12.83 0.61 9.24 38.78 0.64 96.66 0.27 0.25 0.100.10 2.58 0.18 0.08 1.08 0.09 0.01 0.05 0.03 0.02 0.03 0.01 0.01 0.01
11.33 36.55 7.03 3.77 6.23 6.31 11.28 3.92 8.70 5.52 4.65 8.42 8.24 10.024.70 BD 0.95 10.98 25.11 0.23 BD 0.07 3.25 2.14 4.22 0.06 BD BD0.13 3.14 0.19 0.07 1.30 0.09 0.01 0.04 0.05 0.01 0.03 0.01 0.01 0.01
11.04 9.88 4.51 7.51 25.45 31.36 10.87 4.95 5.42 15.7891.94 BD 0.85 50.61 433.53 5.56 0.01 BD 74.29 0.14 41.82 0.24 BD BD0.06 1.70 0.12 0.05 0.87 0.07 0.00 0.04 0.02 0.01 0.02 0.01 0.01 0.01
19.29 7.91 17.11 9.99 43.29 33.22 16.65 9.64 14.80 21.9919.02 BD 0.73 9.49 243.00 2.15 0.01 BD 14.44 0.04 32.31 0.09 BD BD0.05 1.63 0.13 0.05 0.67 0.10 0.00 0.04 0.03 0.02 0.02 0.01 0.01 0.01
27.38 10.31 19.84 9.16 70.51 30.39 29.67 30.37 34.66 21.99169.57 BD 1.53 134.22 2376.18 195.35 0.24 15.25 97.24 1.93 98.10 1.40 1.14 0.53
0.06 2.22 0.15 0.08 1.07 0.10 0.01 0.03 0.04 0.02 0.03 0.01 0.01 0.0117.42 10.98 12.45 26.31 16.47 17.72 11.77 13.62 9.12 13.17 13.91 26.05 11.65
131.58 BD 3.78 95.27 1316.26 696.75 0.63 19.88 120.61 5.65 69.30 2.77 0.73 0.270.15 3.74 0.21 0.15 2.26 0.18 0.01 0.08 0.08 0.02 0.05 0.02 0.01 0.01
17.23 10.30 14.89 16.15 10.82 39.69 15.39 17.81 11.66 14.72 12.59 17.53 18.040.66 2.11 0.58 17.29 21.08 2.75 0.60 5.79 0.59 0.06 12.09 0.11 0.25 0.100.06 1.80 0.14 0.05 1.18 0.08 0.01 0.05 0.02 0.01 0.03 0.01 0.01 0.019.92 34.67 11.45 4.61 7.46 7.71 6.23 4.76 11.46 13.96 4.38 10.00 6.21 7.762.97 BD 0.78 139.77 154.62 11.18 1.25 7.99 3.95 0.59 112.70 0.64 0.59 0.190.04 1.77 0.11 0.04 1.08 0.06 0.01 0.05 0.03 0.01 0.02 0.01 0.01 0.005.06 8.19 3.37 5.09 6.04 4.23 4.28 6.02 4.60 4.35 5.26 4.73 6.390.68 BD 0.64 37.67 19.19 3.27 0.53 7.73 0.56 0.15 12.18 0.14 0.36 0.14
355

Location Event Style Sample No Ti49 Cr53 Mn55 Fe57 Co59 Ni60 Cu65 Zn66 As75 Se82 Zr90 Mo95DL 0.50 0.51 0.52 6.38 0.04 0.13 0.42 0.32 1.93 2.64 0.02 0.44Precision(%) 6.34 6.23 7.86 3.52 8.14 3.89 32.43 12.54 9.67 24.64 5.89
Golden Mile Eastern Lode Oroya OR9_2-2 Conc. (ppm) 2777.89 4.60 3.13 465000.00 76.42 89.90 35.48 2.31 488.19 10.64 36.85 1.28DL 0.83 0.57 0.55 8.24 0.04 0.15 0.44 0.40 1.99 3.39 0.02 0.41Precision(%) 6.68 9.38 10.54 3.65 12.85 4.39 8.63 11.58 5.96 14.19 5.96 16.91
Golden Mile Eastern Lode Oroya OR9_3-1 Conc. (ppm) 8.02 0.60 BD 465000.00 219.20 662.94 12.45 1.04 770.49 BD 0.11 BDDL 0.33 0.57 0.52 6.98 0.03 0.11 0.40 0.27 2.07 3.93 0.02 0.43Precision(%) 6.50 42.62 4.51 6.47 7.18 19.52 17.53 3.82 77.46
Golden Mile Eastern Lode Oroya OR9_3-2 Conc. (ppm) 11.21 BD 3.01 465000.00 64.65 161.01 169.67 9.74 79.45 25.59 BD BDDL 0.41 0.74 0.53 14.77 0.04 0.22 0.45 0.21 2.97 3.43 0.02 0.47Precision(%) 6.39 9.35 5.39 6.23 7.13 23.01 50.20 5.55 8.78
Golden Mile Eastern Lode Oroya OR9_3-3 Conc. (ppm) 11.85 5.04 1.61 465000.00 54.60 26.47 15.16 1.14 44.17 41.89 1.36 BDDL 0.56 0.69 0.52 7.79 0.05 0.15 0.38 0.31 2.78 4.02 0.02 0.46Precision(%) 14.01 39.54 15.51 4.67 6.50 8.10 8.44 14.51 10.62 6.92 39.78
Golden Mile Eastern Lode Oroya OR9_4-1 Conc. (ppm) 2864.03 15.77 16.54 465000.00 53.96 158.05 336.74 4.03 748.71 12.34 42.91 0.29DL 0.42 0.56 0.53 6.55 0.03 0.07 0.50 0.24 2.22 4.07 0.01 0.33Precision(%) 4.79 6.68 20.77 3.49 6.13 4.50 21.48 11.92 4.24 13.81 5.42 51.07
Golden Mile Eastern Lode Oroya OR9_4-2 Conc. (ppm) 1888.26 8.88 11.23 465000.00 15.62 128.31 32.28 1.62 91.44 12.45 19.43 BDDL 0.49 0.70 0.42 6.94 0.03 0.09 0.52 0.38 2.17 3.36 0.01 0.47Precision(%) 4.76 7.72 18.98 3.43 6.05 8.65 7.32 12.83 8.45 12.43 5.25
St Ives LD8122_108.0_1-1 Conc. (ppm) 24.22 16.10 0.74 465000.00 99.22 802.76 1.24 1.02 39.69 11.96 BD BDDL 0.33 0.54 0.53 6.51 0.05 0.18 0.58 0.30 11.80 2.72 0.02 0.44Precision(%) 9.24 10.77 29.08 3.92 4.78 4.08 20.81 17.17 12.09 11.21
St Ives LD8122_108.0_1-2 Conc. (ppm) 398.31 51.90 0.73 465000.00 356.37 123.46 1.64 1.24 31.47 49.32 208.42 BDDL 0.47 0.73 0.50 9.23 0.05 0.20 0.57 0.30 10.02 2.22 0.01 0.43Precision(%) 20.88 16.01 27.99 4.15 6.61 5.58 16.29 16.08 14.12 7.03 22.84
St Ives LD8122_108.0_1-3 Conc. (ppm) 457.19 8.82 BD 465000.00 471.99 1278.39 BD 1.07 68.93 15.25 0.73 BDDL 0.50 0.66 0.51 10.32 0.05 0.19 0.55 0.38 9.00 2.09 0.02 0.48Precision(%) 20.57 13.22 3.87 7.09 4.20 18.78 10.15 8.67 16.94
St Ives LD8122_108.0_2-1 Conc. (ppm) 1179.24 90.41 BD 465000.00 376.22 768.91 3.48 1.63 30.99 5.26 8.77 BDDL 0.43 0.62 0.58 22.01 0.05 0.18 0.68 0.52 10.10 3.34 0.02 0.58Precision(%) 18.12 12.95 3.89 7.51 4.21 12.00 36.53 13.55 25.62 41.84
St Ives LD7113A_135.5_1-1 Conc. (ppm) 6.04 BD 0.50 465000.00 948.34 393.48 BD 0.91 2.95 16.80 BD BDDL 0.30 0.62 0.37 5.31 0.05 0.17 0.43 0.27 0.40 3.99 0.02 0.42Precision(%) 6.61 28.99 4.10 4.06 3.72 17.10 8.04 10.58
St Ives LD7113A_135.5_1-2 Conc. (ppm) 7.79 0.64 56.48 465000.00 16.27 27.73 223.08 1.73 14.28 67.77 BD 16.10DL 0.45 0.50 0.45 6.73 0.06 0.17 0.56 0.41 0.47 3.65 0.01 0.53Precision(%) 6.10 36.36 26.61 3.78 3.99 5.32 33.84 14.23 4.36 4.67 9.95
St Ives LD7113A_135.5_2-1 Conc. (ppm) 6.88 BD BD 465000.00 70.68 157.30 BD 0.92 8.06 105.04 BD BDDL 0.40 0.64 0.45 6.72 0.05 0.11 0.47 0.30 0.43 4.03 0.02 0.51Precision(%) 6.67 3.94 9.62 3.63 20.13 5.64 5.68
St Ives LD7113A_135.5_2-2 Conc. (ppm) 6.86 BD BD 465000.00 410.63 499.92 0.93 0.72 73.98 79.39 BD BDDL 0.51 0.61 0.55 7.80 0.05 0.14 0.43 0.37 0.50 3.66 0.01 0.50Precision(%) 7.07 3.96 3.75 4.70 22.17 24.67 5.93 4.60
St Ives LD7113A_135.5_3-1 Conc. (ppm) 20.26 19.42 6.56 465000.00 619.32 722.48 46.07 4.77 61.88 47.15 BD BDDL 0.47 0.60 0.52 10.60 0.07 0.18 0.49 0.35 0.48 4.44 0.01 0.45Precision(%) 8.26 16.25 14.26 3.54 5.53 4.13 28.53 15.31 6.19 5.73
St Ives LD7113A_135.5_3-2 Conc. (ppm) 6.43 BD 0.63 465000.00 206.77 1020.34 449.85 2.17 39.01 40.45 BD BDDL 0.51 0.67 0.46 18.00 0.05 0.13 0.47 0.28 0.42 3.96 0.01 0.42Precision(%) 8.94 31.30 3.58 8.10 5.75 23.00 15.16 10.14 9.75
St Ives CD2949_169.45_3-2 Conc. (ppm) 5.87 BD BD 465000.00 15035.37 11.76 BD 1.07 31.09 33.30 BD BDDL 0.36 0.49 0.36 0.00 0.00 0.12 0.34 0.21 0.35 3.94 0.02 0.45
356

Sample NoDLPrecision(%)
OR9_2-2 Conc. (ppm)DLPrecision(%)
OR9_3-1 Conc. (ppm)DLPrecision(%)
OR9_3-2 Conc. (ppm)DLPrecision(%)
OR9_3-3 Conc. (ppm)DLPrecision(%)
OR9_4-1 Conc. (ppm)DLPrecision(%)
OR9_4-2 Conc. (ppm)DLPrecision(%)
LD8122_108.0_1-1 Conc. (ppm)DLPrecision(%)
LD8122_108.0_1-2 Conc. (ppm)DLPrecision(%)
LD8122_108.0_1-3 Conc. (ppm)DLPrecision(%)
LD8122_108.0_2-1 Conc. (ppm)DLPrecision(%)
LD7113A_135.5_1-1 Conc. (ppm)DLPrecision(%)
LD7113A_135.5_1-2 Conc. (ppm)DLPrecision(%)
LD7113A_135.5_2-1 Conc. (ppm)DLPrecision(%)
LD7113A_135.5_2-2 Conc. (ppm)DLPrecision(%)
LD7113A_135.5_3-1 Conc. (ppm)DLPrecision(%)
LD7113A_135.5_3-2 Conc. (ppm)DLPrecision(%)
CD2949_169.45_3-2 Conc. (ppm)DL
Ag107 Cd111 Sn118 Sb121 Te125 Ba137 La139 W182 Au197 Tl205 Pb208 Bi209 Th232 U2380.07 1.70 0.12 0.06 1.00 0.07 0.01 0.04 0.01 0.01 0.02 0.01 0.01 0.00
14.71 9.23 6.56 9.76 8.04 5.80 6.15 15.05 9.92 5.72 10.24 6.82 7.190.45 BD 0.62 9.69 18.21 1.34 0.31 9.44 1.78 0.05 7.54 0.04 0.37 0.230.07 2.28 0.14 0.06 0.81 0.06 0.01 0.04 0.04 0.01 0.02 0.01 0.00 0.01
10.53 10.86 5.86 6.63 10.04 6.88 5.79 9.23 16.31 4.63 21.28 6.37 5.610.30 BD 0.56 8.71 18.76 0.57 BD BD 0.55 BD 4.77 0.08 BD BD0.07 1.83 0.14 0.04 1.26 0.10 0.01 0.03 0.03 0.02 0.02 0.01 0.01 0.00
15.65 11.99 5.19 7.61 14.77 10.27 5.25 12.170.41 BD 0.71 10.25 19.43 2.43 BD BD 0.51 1.47 4.53 0.07 BD 0.000.09 2.23 0.16 0.07 1.26 0.07 0.01 0.03 0.03 0.01 0.02 0.01 0.01 0.01
13.02 10.34 5.03 7.77 15.46 9.50 6.73 5.48 13.62 168.400.24 BD 0.68 3.29 9.69 3.97 BD BD 0.22 0.44 2.36 0.03 BD BD0.06 2.56 0.16 0.06 1.00 0.07 0.00 0.04 0.03 0.01 0.03 0.01 0.01 0.01
18.03 11.36 21.30 18.80 38.24 15.37 7.22 18.71 31.050.97 0.07 0.67 24.46 17.70 2.51 0.58 7.08 0.44 0.14 12.50 0.16 0.39 0.150.08 2.11 0.12 0.06 1.15 0.07 0.01 0.06 0.03 0.01 0.02 0.01 0.01 0.018.23 1093.29 9.30 5.10 8.97 6.96 6.23 5.18 11.15 14.29 4.40 8.51 6.29 7.560.73 BD 0.73 7.69 12.46 1.09 0.71 7.54 0.66 0.05 20.47 0.07 0.23 0.080.05 2.22 0.13 0.06 1.21 0.08 0.01 0.04 0.03 0.01 0.03 0.01 0.01 0.018.67 9.22 4.17 7.42 9.69 37.50 4.39 9.31 15.34 3.85 12.44 6.61 9.460.18 BD 0.52 BD 1.71 13.48 BD 0.17 0.04 BD 1.41 5.76 BD BD0.07 2.17 0.15 0.06 1.25 0.06 0.01 0.03 0.03 0.01 0.04 0.01 0.01 0.00
19.91 12.51 32.31 12.28 15.90 46.69 7.64 7.620.34 BD 0.68 0.27 2.69 36.66 0.04 0.67 0.09 0.02 1.48 11.31 0.51 1.280.09 2.31 0.16 0.06 1.30 0.08 0.01 0.04 0.04 0.01 0.03 0.01 0.01 0.00
17.50 11.22 18.29 21.83 17.99 21.54 18.96 29.23 26.68 6.73 6.19 35.31 21.500.09 BD 0.49 0.24 1.13 2.05 BD 1.56 BD BD 0.65 2.20 BD BD0.07 1.99 0.15 0.07 0.81 0.10 0.01 0.03 0.03 0.01 0.03 0.01 0.01 0.01
38.49 12.98 22.37 35.10 19.18 15.93 291.13 10.73 9.290.19 BD 0.81 0.64 3.24 15.33 0.02 4.54 0.37 BD 3.74 8.46 0.03 0.050.10 1.80 0.12 0.05 1.20 0.11 0.01 0.02 0.05 0.01 0.02 0.01 0.00 0.01
25.95 8.61 15.53 19.59 14.70 31.35 12.14 34.32 8.93 9.68 31.63 36.93BD BD 0.51 BD BD BD BD BD BD BD BD 0.04 BD BD
0.07 2.49 0.10 0.07 1.48 0.08 0.01 0.04 0.03 0.01 0.02 0.01 0.01 0.009.68 42.71
0.29 BD 0.58 0.15 359.24 BD BD 1478.90 0.15 BD 1.78 9.58 BD BD0.09 2.61 0.10 0.05 1.29 0.08 0.01 0.03 0.02 0.01 0.03 0.01 0.01 0.01
21.70 9.01 21.59 5.03 13.92 24.94 9.26 8.45 372.80BD BD 0.60 BD 69.27 BD BD BD BD BD BD 0.18 BD BD
0.09 2.34 0.12 0.07 1.28 0.08 0.01 0.05 0.03 0.01 0.03 0.01 0.01 0.009.63 6.15 9.02
BD BD 0.64 BD 601.98 BD BD 0.94 0.05 BD 0.08 1.45 BD BD0.08 2.87 0.11 0.10 1.64 0.06 0.01 0.03 0.04 0.01 0.03 0.01 0.01 0.00
9.11 4.86 18.47 68.72 19.74 14.500.59 BD 0.58 0.30 30.08 0.20 BD 0.05 0.58 BD 5.10 30.54 BD BD0.07 2.38 0.13 0.06 1.26 0.09 0.01 0.03 0.03 0.01 0.03 0.01 0.01 0.01
11.39 10.19 15.50 8.70 25.76 34.22 10.61 7.60 9.771.21 BD 0.43 BD 127.01 BD 0.02 BD 0.18 BD 2.27 65.70 BD BD0.09 2.56 0.11 0.08 1.32 0.11 0.01 0.02 0.04 0.01 0.02 0.01 0.01 0.01
27.32 14.60 11.13 103.63 24.65 43.33 25.270.14 BD 0.44 0.11 5.99 BD BD BD BD BD 1.11 1.73 BD BD0.08 2.12 0.10 0.06 1.02 0.08 0.01 0.03 0.02 0.01 0.03 0.01 0.00 0.00
357

Location Event Style Sample No Ti49 Cr53 Mn55 Fe57 Co59 Ni60 Cu65 Zn66 As75 Se82 Zr90 Mo95Precision(%) 8.44 9.08 7.70 12.36 17.16 10.73 9.58
St Ives LD8122_201.0_1-1 Conc. (ppm) 21.19 BD BD 465000.00 105.03 1078.84 4.52 1.02 125.89 9.22 0.60 BDDL 0.39 0.59 0.57 6.37 0.03 0.10 0.54 0.35 16.78 3.63 0.02 0.46Precision(%) 21.98 3.74 8.64 5.11 27.22 17.89 7.04 17.12 24.67
St Ives LD8122_201.0_2-1 Conc. (ppm) 6.44 BD BD 465000.00 786.62 1392.77 10.01 0.77 113.88 62.88 BD BDDL 0.43 0.72 0.56 7.31 0.06 0.11 0.52 0.35 13.79 3.23 0.02 0.45Precision(%) 7.22 3.67 4.31 4.06 29.83 22.72 6.58 4.53
St Ives LD8122_201.0_2-2 Conc. (ppm) 42.96 5.15 16.69 465000.00 77.70 1324.55 0.90 2.95 78.55 6.94 3.87 BDDL 0.40 0.54 0.60 10.16 0.05 0.19 0.48 0.29 15.27 3.77 0.01 0.43Precision(%) 10.39 22.88 11.44 3.60 5.07 3.51 24.42 10.62 9.03 22.46 15.66
St Ives LD8122_201.0_2-3 Conc. (ppm) 20.81 1.17 1.76 465000.00 317.00 881.41 27.36 1.12 63.68 19.67 5.00 BDDL 0.58 0.75 0.62 14.57 0.05 0.21 0.74 0.40 13.87 4.08 0.01 0.63Precision(%) 10.68 32.01 22.49 3.90 5.24 5.19 26.36 19.36 10.49 10.06 13.59
St Ives LD8122_201.0_2-4 Conc. (ppm) 43.56 0.60 BD 465000.00 736.42 1683.23 0.50 0.88 63.53 12.18 4.20 BDDL 0.51 0.58 0.54 9.04 0.05 0.15 0.49 0.41 10.45 3.35 0.02 0.46Precision(%) 52.43 87.46 3.87 4.87 4.98 43.05 23.72 8.66 14.27 52.38
St Ives LD8122_201.0_3-1 Conc. (ppm) 6.99 BD 0.48 465000.00 55.54 420.10 0.97 0.99 50.67 39.36 BD BDDL 0.45 0.68 0.47 6.70 0.06 0.25 0.52 0.25 10.90 3.17 0.00 0.50Precision(%) 16.25 39.49 3.79 15.81 10.97 26.32 14.95 9.88 6.28
St Ives LD8122_201.0_3-2 Conc. (ppm) 7.36 6.79 BD 465000.00 112.04 1373.47 BD 1.19 42.57 9.76 BD BDDL 0.55 0.72 0.61 6.24 0.06 0.15 0.65 0.28 10.03 2.88 0.02 0.52Precision(%) 7.45 27.76 3.74 4.22 3.40 16.73 10.54 13.38
St Ives LD7113A_310.4_1-1 Conc. (ppm) 7.84 1.43 28.56 465000.00 231.88 675.09 1.45 2.15 23.28 9.06 0.05 BDDL 0.45 0.62 0.65 7.54 0.06 0.25 0.63 0.39 7.11 3.87 0.03 0.56Precision(%) 6.85 27.03 19.18 4.06 4.31 3.87 25.38 14.88 13.64 18.42 31.11
St Ives LD7113A_310.4_1-2 Conc. (ppm) 31.58 59.20 15.18 465000.00 6500.68 1951.21 62.35 3.94 87.89 12.33 0.07 BDDL 0.43 0.79 0.72 13.57 0.07 0.26 0.66 0.42 8.95 4.26 0.02 0.67Precision(%) 7.50 11.28 11.39 6.66 7.03 7.24 28.56 13.37 9.04 15.70 23.78
St Ives LD7113A_310.4_1B-1 Conc. (ppm) 37.17 133.48 5.90 465000.00 194.58 959.91 1.60 2.21 15.23 14.28 0.07 BDDL 0.59 0.65 0.65 8.89 0.09 0.20 0.74 0.38 8.42 3.00 0.03 0.50Precision(%) 16.00 18.04 19.94 4.31 8.94 4.68 21.75 18.66 22.07 10.62 28.94
St Ives LD7113A_310.4_1B-2 Conc. (ppm) 7.69 7.23 0.67 465000.00 912.07 1669.78 BD 0.96 21.23 12.92 BD BDDL 0.43 0.65 0.53 9.62 0.05 0.14 0.67 0.43 7.99 3.55 0.01 0.55Precision(%) 7.23 20.35 33.41 4.12 6.83 4.01 44.96 23.27 15.11 12.45
St Ives LD7113A_310.4_1B-3 Conc. (ppm) 151.25 241.89 41.55 465000.00 212.31 643.00 40.12 6.73 15.40 18.05 0.41 BDDL 0.69 0.63 0.68 10.94 0.05 0.21 0.96 0.44 6.46 3.27 0.00 0.61Precision(%) 5.77 5.37 4.82 3.61 4.21 3.43 12.36 7.47 18.06 9.13 23.96
St Ives LD7113A_310.4_1B-4 Conc. (ppm) 18.54 33.74 4.73 465000.00 651.83 1069.01 13.17 1.47 25.74 29.57 BD 8.89DL 0.50 0.60 0.47 9.06 0.06 0.21 0.64 0.43 6.62 3.26 0.02 0.60Precision(%) 12.24 15.01 18.44 3.74 6.12 8.12 24.55 16.75 11.42 7.69 50.93
St Ives LD70026A_317.15_1-1 Conc. (ppm) 5.19 0.61 BD 465000.00 652.98 1496.45 BD 0.83 10.37 15.58 BD BDDL 0.31 0.60 0.43 7.16 0.05 0.14 0.43 0.26 0.38 4.60 0.02 0.43Precision(%) 6.88 40.10 3.66 3.38 3.50 18.50 4.63 13.36
St Ives LD70026A_317.15_1-2 Conc. (ppm) 6.01 BD BD 465000.00 198.28 159.27 1.69 0.84 0.99 5.11 BD BDDL 0.48 0.58 0.47 7.25 0.06 0.15 0.52 0.32 0.47 4.91 0.01 0.48Precision(%) 7.01 4.18 8.37 5.01 21.97 20.14 20.07 37.13
St Ives LD70026A_317.15_1-3 Conc. (ppm) 117.62 552.36 0.56 465000.00 2099.21 695.37 6.98 4.99 3.34 11.53 BD BDDL 0.65 0.66 0.54 16.13 0.05 0.23 0.58 0.44 0.42 5.08 0.01 0.53Precision(%) 8.01 8.76 37.67 5.39 8.09 5.81 12.22 9.08 9.29 19.67
St Ives LD70026A_317.15_2-1 Conc. (ppm) 42.11 BD 158.49 465000.00 4017.65 5543.48 276647.96 147.28 2262.03 226.98 BD BDDL 1.41 2.12 1.26 20.59 0.10 0.52 1.72 1.22 1.36 14.48 0.06 1.59Precision(%) 20.10 16.52 8.49 16.00 15.73 11.00 13.57 13.98 9.64
358

Sample NoPrecision(%)
LD8122_201.0_1-1 Conc. (ppm)DLPrecision(%)
LD8122_201.0_2-1 Conc. (ppm)DLPrecision(%)
LD8122_201.0_2-2 Conc. (ppm)DLPrecision(%)
LD8122_201.0_2-3 Conc. (ppm)DLPrecision(%)
LD8122_201.0_2-4 Conc. (ppm)DLPrecision(%)
LD8122_201.0_3-1 Conc. (ppm)DLPrecision(%)
LD8122_201.0_3-2 Conc. (ppm)DLPrecision(%)
LD7113A_310.4_1-1 Conc. (ppm)DLPrecision(%)
LD7113A_310.4_1-2 Conc. (ppm)DLPrecision(%)
LD7113A_310.4_1B-1 Conc. (ppm)DLPrecision(%)
LD7113A_310.4_1B-2 Conc. (ppm)DLPrecision(%)
LD7113A_310.4_1B-3 Conc. (ppm)DLPrecision(%)
LD7113A_310.4_1B-4 Conc. (ppm)DLPrecision(%)
LD70026A_317.15_1-1 Conc. (ppm)DLPrecision(%)
LD70026A_317.15_1-2 Conc. (ppm)DLPrecision(%)
LD70026A_317.15_1-3 Conc. (ppm)DLPrecision(%)
LD70026A_317.15_2-1 Conc. (ppm)DLPrecision(%)
Ag107 Cd111 Sn118 Sb121 Te125 Ba137 La139 W182 Au197 Tl205 Pb208 Bi209 Th232 U23830.55 12.17 31.38 19.66 18.77 21.08
BD BD 0.59 BD 0.94 BD BD 0.50 BD BD 1.31 0.58 0.03 0.020.07 2.38 0.15 0.07 0.88 0.09 0.01 0.03 0.03 0.02 0.03 0.01 0.01 0.01
12.15 42.90 33.27 11.41 20.39 26.35 37.620.08 BD 0.70 BD 5.17 BD BD BD 0.06 BD 0.54 1.80 BD BD0.07 2.09 0.15 0.06 1.37 0.11 0.01 0.03 0.04 0.01 0.03 0.01 0.01 0.00
38.85 9.90 14.12 31.81 10.41 7.56BD BD 0.66 BD BD 1.69 1.72 0.74 0.11 BD 1.31 1.34 0.28 0.14
0.08 1.85 0.13 0.06 1.07 0.07 0.01 0.05 0.04 0.02 0.03 0.01 0.00 0.0110.22 30.25 39.63 18.74 36.08 7.72 8.59 21.04 26.49
0.69 BD 0.66 0.17 46.42 70.65 0.18 0.08 0.87 BD 14.16 60.00 0.89 0.330.09 2.65 0.17 0.08 1.26 0.13 0.01 0.00 0.05 0.01 0.03 0.01 0.01 0.01
15.04 12.52 23.01 8.83 16.57 12.06 21.57 32.41 5.77 6.87 33.34 29.69BD BD 0.76 BD 1.03 BD BD 1.94 BD BD 0.29 0.38 0.10 0.09
0.06 2.39 0.14 0.07 0.94 0.09 0.01 0.05 0.03 0.01 0.03 0.01 0.01 0.018.88 42.79 54.62 30.73 25.28 54.27 52.12
BD BD 0.66 BD 36.84 BD BD BD BD BD 0.41 0.60 BD BD0.08 2.41 0.15 0.04 0.99 0.10 0.01 0.03 0.02 0.01 0.03 0.02 0.01 0.01
10.59 11.02 14.36 15.68BD BD 0.62 BD BD 1.29 BD BD BD BD 0.27 0.39 BD BD
0.10 2.52 0.16 0.06 1.34 0.08 0.01 0.05 0.04 0.01 0.03 0.00 0.01 0.0111.47 25.01 19.16 15.53
0.14 BD 0.87 BD 0.79 BD BD BD 0.08 BD 0.34 0.28 BD BD0.07 2.30 0.15 0.10 1.05 0.05 0.01 0.04 0.04 0.02 0.03 0.01 0.01 0.01
29.28 8.93 57.81 49.55 12.75 7.170.47 BD 0.73 0.17 13.90 4.46 BD BD 0.38 0.03 8.09 21.89 BD BD0.09 2.51 0.22 0.07 1.14 0.13 0.01 0.06 0.05 0.01 0.03 0.01 0.01 0.01
15.10 14.03 21.91 9.71 13.25 26.70 26.12 7.64 7.93BD BD 0.77 0.07 4.24 0.24 BD BD BD 0.02 7.07 3.24 BD BD
0.08 2.14 0.17 0.04 1.65 0.04 0.01 0.03 0.05 0.01 0.04 0.02 0.01 0.0010.33 31.71 21.76 22.41 32.06 12.56 10.57
BD BD 0.73 BD 2.17 BD BD BD BD BD 1.74 1.00 BD BD0.08 2.81 0.14 0.09 1.13 0.06 0.01 0.06 0.02 0.02 0.03 0.01 0.01 0.00
10.14 31.98 22.12 17.350.64 BD 0.91 0.47 31.38 3.30 BD 0.12 0.77 0.09 54.70 39.47 BD BD0.09 2.36 0.16 0.07 1.45 0.11 0.01 0.03 0.05 0.02 0.03 0.02 0.01 0.01
10.81 9.04 11.42 6.33 13.02 16.93 11.83 11.71 4.80 4.08BD BD 0.66 BD 29.11 BD BD BD 0.16 BD 11.90 8.78 BD BD
0.10 2.60 0.12 0.07 1.39 0.10 0.01 0.04 0.02 0.01 0.02 0.01 0.01 0.019.24 8.98 17.07 7.63 7.85
BD BD 0.68 BD BD BD BD BD 0.13 BD 0.06 0.37 BD BD0.09 2.65 0.10 0.06 1.37 0.07 0.01 0.03 0.02 0.01 0.03 0.01 0.01 0.00
8.55 24.94 23.79 7.58BD BD 0.65 BD BD BD BD 0.03 BD BD 0.06 0.22 BD BD
0.10 2.27 0.14 0.08 1.45 0.05 0.01 0.02 0.03 0.01 0.03 0.01 0.01 0.0110.30 44.69 21.14 7.51
0.25 BD 0.94 0.45 6.86 36.76 BD 3.85 0.34 0.18 4.47 11.77 BD BD0.13 2.39 0.13 0.06 1.54 0.09 0.01 0.04 0.02 0.02 0.03 0.01 0.01 0.01
26.27 8.09 11.35 13.28 8.75 8.69 17.69 10.01 5.77 7.66119.16 BD 2.01 2.68 212.32 0.25 BD 0.15 0.62 1.03 13.63 314.68 BD BD
0.30 7.49 0.35 0.24 4.55 0.14 0.03 0.12 0.09 0.03 0.06 0.02 0.02 0.0223.31 10.96 14.14 28.81 33.93 43.34 20.17 14.93 20.40 23.14
359
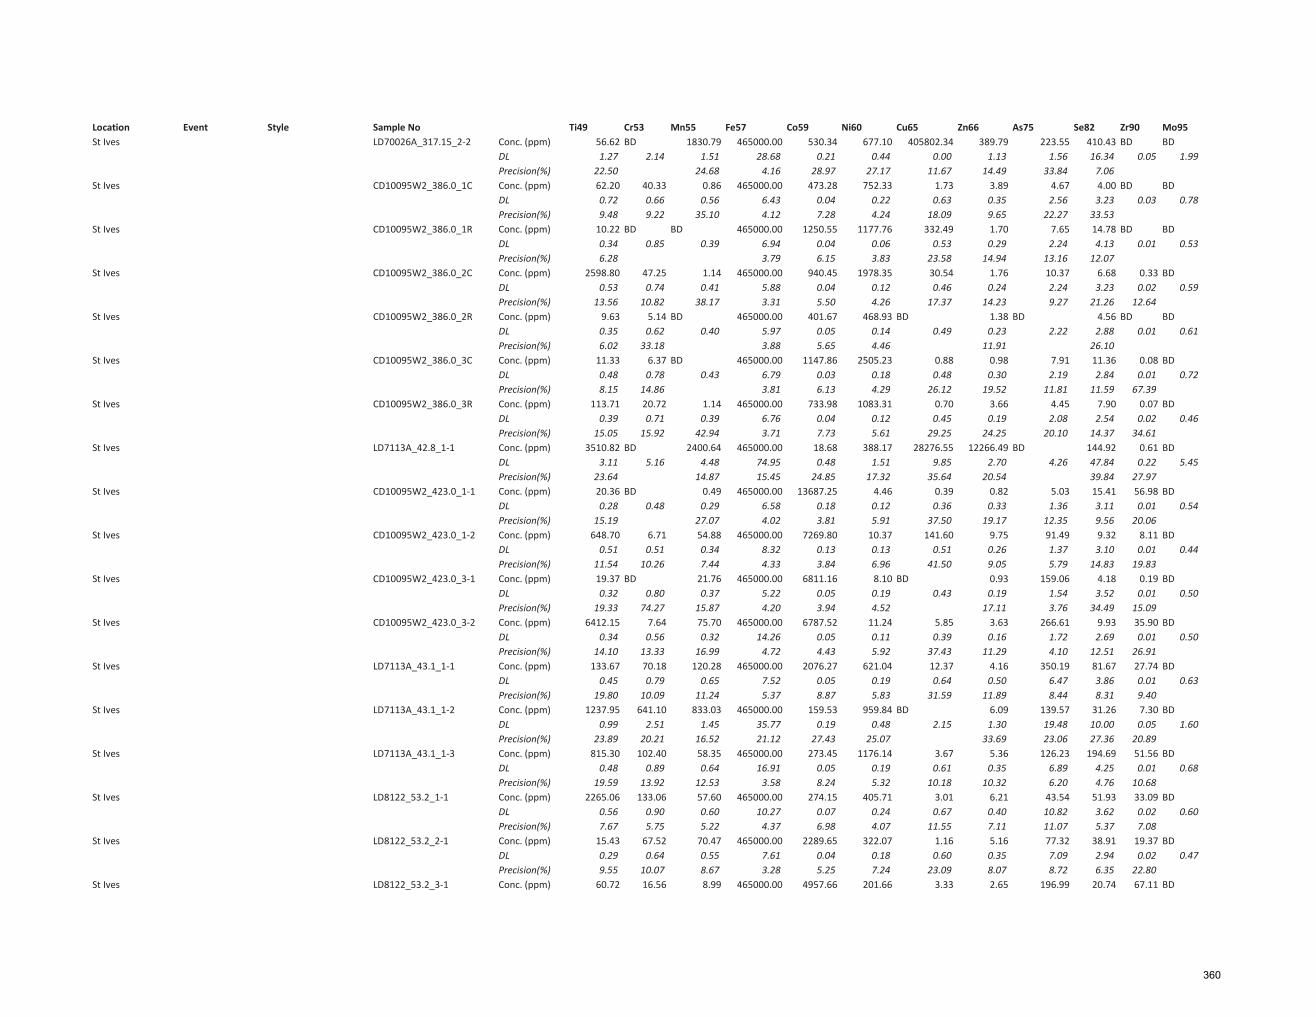
Location Event Style Sample No Ti49 Cr53 Mn55 Fe57 Co59 Ni60 Cu65 Zn66 As75 Se82 Zr90 Mo95St Ives LD70026A_317.15_2-2 Conc. (ppm) 56.62 BD 1830.79 465000.00 530.34 677.10 405802.34 389.79 223.55 410.43 BD BD
DL 1.27 2.14 1.51 28.68 0.21 0.44 0.00 1.13 1.56 16.34 0.05 1.99Precision(%) 22.50 24.68 4.16 28.97 27.17 11.67 14.49 33.84 7.06
St Ives CD10095W2_386.0_1C Conc. (ppm) 62.20 40.33 0.86 465000.00 473.28 752.33 1.73 3.89 4.67 4.00 BD BDDL 0.72 0.66 0.56 6.43 0.04 0.22 0.63 0.35 2.56 3.23 0.03 0.78Precision(%) 9.48 9.22 35.10 4.12 7.28 4.24 18.09 9.65 22.27 33.53
St Ives CD10095W2_386.0_1R Conc. (ppm) 10.22 BD BD 465000.00 1250.55 1177.76 332.49 1.70 7.65 14.78 BD BDDL 0.34 0.85 0.39 6.94 0.04 0.06 0.53 0.29 2.24 4.13 0.01 0.53Precision(%) 6.28 3.79 6.15 3.83 23.58 14.94 13.16 12.07
St Ives CD10095W2_386.0_2C Conc. (ppm) 2598.80 47.25 1.14 465000.00 940.45 1978.35 30.54 1.76 10.37 6.68 0.33 BDDL 0.53 0.74 0.41 5.88 0.04 0.12 0.46 0.24 2.24 3.23 0.02 0.59Precision(%) 13.56 10.82 38.17 3.31 5.50 4.26 17.37 14.23 9.27 21.26 12.64
St Ives CD10095W2_386.0_2R Conc. (ppm) 9.63 5.14 BD 465000.00 401.67 468.93 BD 1.38 BD 4.56 BD BDDL 0.35 0.62 0.40 5.97 0.05 0.14 0.49 0.23 2.22 2.88 0.01 0.61Precision(%) 6.02 33.18 3.88 5.65 4.46 11.91 26.10
St Ives CD10095W2_386.0_3C Conc. (ppm) 11.33 6.37 BD 465000.00 1147.86 2505.23 0.88 0.98 7.91 11.36 0.08 BDDL 0.48 0.78 0.43 6.79 0.03 0.18 0.48 0.30 2.19 2.84 0.01 0.72Precision(%) 8.15 14.86 3.81 6.13 4.29 26.12 19.52 11.81 11.59 67.39
St Ives CD10095W2_386.0_3R Conc. (ppm) 113.71 20.72 1.14 465000.00 733.98 1083.31 0.70 3.66 4.45 7.90 0.07 BDDL 0.39 0.71 0.39 6.76 0.04 0.12 0.45 0.19 2.08 2.54 0.02 0.46Precision(%) 15.05 15.92 42.94 3.71 7.73 5.61 29.25 24.25 20.10 14.37 34.61
St Ives LD7113A_42.8_1-1 Conc. (ppm) 3510.82 BD 2400.64 465000.00 18.68 388.17 28276.55 12266.49 BD 144.92 0.61 BDDL 3.11 5.16 4.48 74.95 0.48 1.51 9.85 2.70 4.26 47.84 0.22 5.45Precision(%) 23.64 14.87 15.45 24.85 17.32 35.64 20.54 39.84 27.97
St Ives CD10095W2_423.0_1-1 Conc. (ppm) 20.36 BD 0.49 465000.00 13687.25 4.46 0.39 0.82 5.03 15.41 56.98 BDDL 0.28 0.48 0.29 6.58 0.18 0.12 0.36 0.33 1.36 3.11 0.01 0.54Precision(%) 15.19 27.07 4.02 3.81 5.91 37.50 19.17 12.35 9.56 20.06
St Ives CD10095W2_423.0_1-2 Conc. (ppm) 648.70 6.71 54.88 465000.00 7269.80 10.37 141.60 9.75 91.49 9.32 8.11 BDDL 0.51 0.51 0.34 8.32 0.13 0.13 0.51 0.26 1.37 3.10 0.01 0.44Precision(%) 11.54 10.26 7.44 4.33 3.84 6.96 41.50 9.05 5.79 14.83 19.83
St Ives CD10095W2_423.0_3-1 Conc. (ppm) 19.37 BD 21.76 465000.00 6811.16 8.10 BD 0.93 159.06 4.18 0.19 BDDL 0.32 0.80 0.37 5.22 0.05 0.19 0.43 0.19 1.54 3.52 0.01 0.50Precision(%) 19.33 74.27 15.87 4.20 3.94 4.52 17.11 3.76 34.49 15.09
St Ives CD10095W2_423.0_3-2 Conc. (ppm) 6412.15 7.64 75.70 465000.00 6787.52 11.24 5.85 3.63 266.61 9.93 35.90 BDDL 0.34 0.56 0.32 14.26 0.05 0.11 0.39 0.16 1.72 2.69 0.01 0.50Precision(%) 14.10 13.33 16.99 4.72 4.43 5.92 37.43 11.29 4.10 12.51 26.91
St Ives LD7113A_43.1_1-1 Conc. (ppm) 133.67 70.18 120.28 465000.00 2076.27 621.04 12.37 4.16 350.19 81.67 27.74 BDDL 0.45 0.79 0.65 7.52 0.05 0.19 0.64 0.50 6.47 3.86 0.01 0.63Precision(%) 19.80 10.09 11.24 5.37 8.87 5.83 31.59 11.89 8.44 8.31 9.40
St Ives LD7113A_43.1_1-2 Conc. (ppm) 1237.95 641.10 833.03 465000.00 159.53 959.84 BD 6.09 139.57 31.26 7.30 BDDL 0.99 2.51 1.45 35.77 0.19 0.48 2.15 1.30 19.48 10.00 0.05 1.60Precision(%) 23.89 20.21 16.52 21.12 27.43 25.07 33.69 23.06 27.36 20.89
St Ives LD7113A_43.1_1-3 Conc. (ppm) 815.30 102.40 58.35 465000.00 273.45 1176.14 3.67 5.36 126.23 194.69 51.56 BDDL 0.48 0.89 0.64 16.91 0.05 0.19 0.61 0.35 6.89 4.25 0.01 0.68Precision(%) 19.59 13.92 12.53 3.58 8.24 5.32 10.18 10.32 6.20 4.76 10.68
St Ives LD8122_53.2_1-1 Conc. (ppm) 2265.06 133.06 57.60 465000.00 274.15 405.71 3.01 6.21 43.54 51.93 33.09 BDDL 0.56 0.90 0.60 10.27 0.07 0.24 0.67 0.40 10.82 3.62 0.02 0.60Precision(%) 7.67 5.75 5.22 4.37 6.98 4.07 11.55 7.11 11.07 5.37 7.08
St Ives LD8122_53.2_2-1 Conc. (ppm) 15.43 67.52 70.47 465000.00 2289.65 322.07 1.16 5.16 77.32 38.91 19.37 BDDL 0.29 0.64 0.55 7.61 0.04 0.18 0.60 0.35 7.09 2.94 0.02 0.47Precision(%) 9.55 10.07 8.67 3.28 5.25 7.24 23.09 8.07 8.72 6.35 22.80
St Ives LD8122_53.2_3-1 Conc. (ppm) 60.72 16.56 8.99 465000.00 4957.66 201.66 3.33 2.65 196.99 20.74 67.11 BD
360

Sample NoLD70026A_317.15_2-2 Conc. (ppm)
DLPrecision(%)
CD10095W2_386.0_1C Conc. (ppm)DLPrecision(%)
CD10095W2_386.0_1R Conc. (ppm)DLPrecision(%)
CD10095W2_386.0_2C Conc. (ppm)DLPrecision(%)
CD10095W2_386.0_2R Conc. (ppm)DLPrecision(%)
CD10095W2_386.0_3C Conc. (ppm)DLPrecision(%)
CD10095W2_386.0_3R Conc. (ppm)DLPrecision(%)
LD7113A_42.8_1-1 Conc. (ppm)DLPrecision(%)
CD10095W2_423.0_1-1 Conc. (ppm)DLPrecision(%)
CD10095W2_423.0_1-2 Conc. (ppm)DLPrecision(%)
CD10095W2_423.0_3-1 Conc. (ppm)DLPrecision(%)
CD10095W2_423.0_3-2 Conc. (ppm)DLPrecision(%)
LD7113A_43.1_1-1 Conc. (ppm)DLPrecision(%)
LD7113A_43.1_1-2 Conc. (ppm)DLPrecision(%)
LD7113A_43.1_1-3 Conc. (ppm)DLPrecision(%)
LD8122_53.2_1-1 Conc. (ppm)DLPrecision(%)
LD8122_53.2_2-1 Conc. (ppm)DLPrecision(%)
LD8122_53.2_3-1 Conc. (ppm)
Ag107 Cd111 Sn118 Sb121 Te125 Ba137 La139 W182 Au197 Tl205 Pb208 Bi209 Th232 U23891.02 BD 2.91 0.90 15.23 0.55 0.58 0.45 BD 0.10 3.55 13.40 BD BD0.31 8.97 0.52 0.26 5.54 0.32 0.02 0.08 0.09 0.05 0.10 0.05 0.02 0.035.61 10.95 30.35 30.71 47.74 44.52 31.20 37.53 16.07 25.30 237.75
BD 0.85 0.77 BD 6.45 5.46 BD 1.01 0.17 BD 1.84 2.93 BD BD0.11 3.01 0.16 0.09 1.74 0.10 0.01 0.05 0.02 0.02 0.03 0.01 0.01 0.01
136.69 10.33 15.43 10.59 11.64 18.10 7.89 6.114.19 BD 0.58 0.17 5.66 1.30 BD BD BD BD 1.12 1.48 BD BD0.08 3.16 0.13 0.07 1.50 0.08 0.01 0.05 0.05 0.01 0.02 0.02 0.01 0.01
31.10 11.77 35.53 34.51 23.25 12.31 12.66BD BD 0.87 1.07 4.88 2.95 0.20 11.79 0.19 0.03 3.96 5.06 0.20 0.16
0.09 2.83 0.13 0.07 1.12 0.07 0.01 0.03 0.05 0.01 0.02 0.01 0.01 0.019.07 11.14 14.89 17.51 13.24 12.96 27.49 37.00 7.93 6.93 13.43 14.26
BD BD 0.43 BD BD 0.10 BD BD BD BD 0.05 0.04 BD BD0.09 2.44 0.13 0.08 1.50 0.08 0.01 0.03 0.04 0.01 0.02 0.01 0.01 0.01
13.35 47.47 27.67 26.53 300.25BD BD 0.47 BD 0.78 0.57 BD 0.07 BD BD 0.92 1.03 BD BD
0.08 2.88 0.13 0.08 1.27 0.08 0.01 0.06 0.04 0.01 0.03 0.01 0.01 0.0113.43 71.34 19.11 67.69 8.83 5.94
0.21 BD 0.62 0.09 0.97 8.58 0.02 0.64 0.05 BD 1.58 1.37 BD BD0.08 2.39 0.12 0.06 1.53 0.08 0.01 0.06 0.04 0.01 0.03 0.01 0.01 0.01
43.23 10.41 36.26 62.44 25.41 34.79 15.94 50.36 8.77 9.9453.29 206.87 5.92 3.86 3915.45 4.91 0.12 18.64 BD 0.09 5.79 5046.12 BD 0.401.00 26.77 1.37 0.87 14.12 0.74 0.09 0.31 0.27 0.14 0.29 0.08 0.04 0.05
18.93 27.16 21.01 27.99 31.88 20.39 42.92 24.88 85.74 25.85 29.68 24.61BD BD 0.36 BD BD 0.59 0.13 BD BD BD 1.08 0.36 1.57 0.77
0.07 2.41 0.10 0.07 1.12 0.04 0.01 0.03 0.03 0.01 0.02 0.01 0.00 0.0113.07 19.43 39.04 9.88 11.56 16.23 16.76
4.63 BD 0.52 1.37 12.53 13.27 0.19 0.13 BD 0.02 8.15 13.50 0.32 0.130.08 2.46 0.13 0.06 1.38 0.06 0.01 0.03 0.04 0.01 0.02 0.01 0.00 0.00
12.65 12.46 7.61 13.84 15.78 14.79 20.58 26.94 9.78 7.13 23.00 15.76BD BD 0.25 0.10 BD BD BD BD BD BD 0.84 0.51 BD 0.00
0.07 2.49 0.16 0.05 1.18 0.07 0.01 0.04 0.04 0.01 0.02 0.01 0.01 0.0124.26 26.99 9.08 9.45 469.35
0.08 BD 1.38 0.85 BD 0.60 3.31 1.34 0.04 BD 5.37 2.86 1.26 1.240.07 2.20 0.13 0.06 1.41 0.03 0.01 0.03 0.03 0.01 0.03 0.02 0.01 0.01
46.32 12.10 11.83 15.82 19.89 14.37 43.53 7.32 5.73 18.77 18.972.77 BD 0.88 0.84 14.07 2.35 0.26 0.20 0.08 BD 1.93 30.13 0.17 0.040.11 3.22 0.15 0.07 1.73 0.09 0.01 0.04 0.03 0.02 0.03 0.01 0.01 0.01
10.90 8.94 13.05 9.18 16.20 13.98 17.16 23.94 8.05 8.18 8.63 17.020.78 BD 3.56 2.65 5.67 2.73 2.26 1.07 BD BD 4.96 16.51 0.24 0.170.35 7.76 0.44 0.19 4.00 0.32 0.04 0.09 0.11 0.02 0.11 0.04 0.03 0.03
49.55 17.91 34.73 40.60 18.63 18.69 22.03 17.06 43.72 22.30 21.780.45 BD 0.72 0.40 31.75 0.74 0.08 0.21 0.14 BD 3.55 17.63 0.16 0.070.10 2.42 0.16 0.07 1.50 0.08 0.02 0.03 0.03 0.01 0.03 0.01 0.00 0.01
13.56 9.59 16.36 6.60 18.01 24.35 14.52 19.61 4.73 5.60 8.86 15.760.31 BD 1.00 0.67 18.11 74.40 0.06 0.53 0.22 0.02 9.81 60.35 0.20 0.070.12 2.29 0.16 0.07 1.32 0.11 0.01 0.05 0.03 0.01 0.03 0.02 0.01 0.01
17.91 8.25 8.72 7.15 8.15 15.40 10.00 14.19 34.26 5.23 3.97 10.31 11.690.15 BD 0.71 0.22 8.04 0.18 BD BD BD BD 2.03 20.02 0.02 0.010.10 2.33 0.14 0.05 1.22 0.09 0.01 0.04 0.03 0.01 0.03 0.01 0.01 0.00
27.88 9.92 18.61 11.65 25.58 8.71 7.94 70.60 39.830.14 BD 0.98 0.26 11.08 0.55 BD 100.95 0.16 BD 1.29 17.22 0.14 0.10
361

Location Event Style Sample No Ti49 Cr53 Mn55 Fe57 Co59 Ni60 Cu65 Zn66 As75 Se82 Zr90 Mo95DL 0.49 0.57 0.64 10.68 0.14 0.15 0.66 0.32 8.14 3.27 0.01 0.52Precision(%) 13.75 14.31 8.81 4.29 4.38 4.58 22.25 11.46 5.82 8.74 9.77
St Ives LD8122_53.2_3-2 Conc. (ppm) 349.33 10.50 2.35 465000.00 4304.56 291.17 71.28 1.29 192.51 32.18 24.33 BDDL 0.59 0.75 0.64 6.56 0.05 0.17 0.60 0.35 7.93 2.83 0.03 0.53Precision(%) 15.62 12.63 13.52 4.06 4.49 3.57 51.28 17.36 5.77 6.26 12.47
St Ives LD8122_53.2_4-1 Conc. (ppm) 303.13 27.98 26.00 465000.00 3224.11 489.01 1.65 2.08 117.36 29.82 12.55 BDDL 0.53 0.70 0.51 12.78 0.07 0.18 0.50 0.48 6.95 3.22 0.02 0.55Precision(%) 19.38 10.82 12.27 3.88 7.36 15.14 24.04 15.99 7.26 7.08 19.56
362

Sample NoDLPrecision(%)
LD8122_53.2_3-2 Conc. (ppm)DLPrecision(%)
LD8122_53.2_4-1 Conc. (ppm)DLPrecision(%)
Ag107 Cd111 Sn118 Sb121 Te125 Ba137 La139 W182 Au197 Tl205 Pb208 Bi209 Th232 U2380.07 2.32 0.12 0.06 1.11 0.11 0.01 0.04 0.03 0.01 0.03 0.01 0.01 0.01
25.15 8.07 16.25 9.63 27.33 12.70 14.43 6.24 5.53 9.39 15.100.28 BD 2.99 0.18 5.29 0.49 BD 0.23 0.08 BD 2.76 11.12 0.07 0.020.08 2.51 0.14 0.06 1.09 0.11 0.01 0.02 0.03 0.02 0.02 0.01 0.01 0.01
26.16 65.42 20.04 13.39 22.56 14.51 29.79 10.54 5.34 11.83 22.110.17 1.17 0.72 0.29 18.32 0.25 BD 0.67 0.16 BD 1.12 30.25 0.02 BD0.10 2.30 0.13 0.04 1.26 0.09 0.01 0.03 0.02 0.01 0.03 0.01 0.01 0.01
30.43 77.97 9.90 15.68 18.91 42.40 16.98 18.99 9.95 15.60 26.76
363

Location Event Style Sample No Ti49 Cr53 Mn55 Fe57 Co59 Ni60 Cu65 Zn66 As75
New Celebration 1250_12-4_1A Conc. (ppm) 578.78 73.11 205.24 723000.00 73.83 149.93 BD 155.10 BDDL 0.74 1.35 0.70 14.93 0.12 0.30 1.27 0.47 1.03Precision(%) 6.59 5.54 2.78 2.68 2.79 2.93 15.16
New Celebration 1250_12-4_1B Conc. (ppm) 448.44 106.51 168.25 723000.00 77.25 157.88 BD 185.76 BDDL 0.68 1.32 0.85 14.05 0.14 0.37 1.31 0.46 1.03Precision(%) 4.34 8.59 2.83 2.65 2.83 2.95 8.66
New Celebration 1250_12-4_3-1 Conc. (ppm) 504.25 714.05 95.96 723000.00 72.92 133.63 BD 129.24 1.66DL 0.61 1.22 0.78 12.38 0.10 0.35 1.19 0.64 1.04Precision(%) 11.78 4.71 3.50 2.71 2.77 3.03 10.34 26.51
New Celebration 1250_12-4_3-2 Conc. (ppm) 322.91 1349.07 118.97 723000.00 72.31 132.82 BD 159.47 BDDL 0.99 1.33 1.11 26.47 0.10 0.40 1.37 0.67 1.36Precision(%) 3.23 5.56 3.13 2.82 2.98 3.18 3.51
New Celebration 1250_12-4_3-3 Conc. (ppm) 241.35 723.38 81.72 723000.00 70.22 130.09 BD 134.19 1.08DL 0.81 1.48 0.82 38.23 0.13 0.41 1.15 0.51 0.91Precision(%) 3.63 4.81 3.77 2.97 3.17 3.25 5.76 37.32
New Celebration 1250_12-4_4-1 Conc. (ppm) 412.66 403.14 123.28 723000.00 57.17 147.64 BD 192.44 BDDL 0.70 1.43 0.92 27.78 0.11 0.34 1.36 0.73 1.13Precision(%) 4.39 5.29 2.95 2.81 2.92 3.60 7.05
New Celebration 1250_12-4_4-2 Conc. (ppm) 314.48 445.58 86.84 723000.00 50.01 150.67 BD 89.34 BDDL 0.75 1.11 1.04 40.15 0.11 0.41 1.35 0.64 1.17Precision(%) 3.30 5.22 3.25 2.91 3.15 3.12 6.63
New Celebration 133565_1-2 Conc. (ppm) 202.15 623.26 23.04 723000.00 8.40 226.98 1.57 51.62 1.47DL 1.41 2.25 1.31 20.91 0.17 0.76 2.24 0.91 1.45Precision(%) 9.72 5.29 4.33 2.48 10.16 3.06 69.46 7.67 51.85
New Celebration Stage I Mylonite 133565_2-1 Conc. (ppm) 322.59 55.26 50.93 723000.00 17.43 141.24 0.39 117.60 1.08DL 1.25 1.56 1.32 16.14 0.17 0.57 1.81 0.96 1.03Precision(%) 3.15 7.12 3.26 2.50 3.21 3.08 175.72 3.72 39.42
New Celebration Stage I Mylonite 133565_3-1 Conc. (ppm) 300.78 206.64 37.20 723000.00 17.19 122.01 BD BD 1.29DL 0.72 1.26 0.79 13.19 0.12 0.42 1.22 0.78 0.88Precision(%) 4.39 6.34 3.98 3.08 3.44 3.37 29.27
New Celebration Stage I Mylonite 133565_3-2 Conc. (ppm) 645.31 632.24 593.85 723000.00 23.08 138.59 BD 131.69 BDDL 0.51 1.33 0.87 13.89 0.10 0.33 0.95 0.83 1.05Precision(%) 19.33 4.65 25.69 3.02 10.37 3.62 10.44
New Celebration Stage I Mylonite 133565_4-1 Conc. (ppm) 307.41 469.13 35.96 723000.00 16.17 122.17 BD 93.68 BDDL 0.68 1.42 1.03 16.78 0.12 0.33 1.10 0.62 1.01Precision(%) 3.32 4.14 3.49 2.90 3.49 3.34 4.18
New Celebration Stage I Mylonite 133565_4-2 Conc. (ppm) 350.18 211.68 55.37 723000.00 17.61 121.43 BD 118.46 BDDL 0.63 1.15 1.22 31.66 0.11 0.33 1.18 0.71 1.01Precision(%) 3.65 4.76 4.18 2.90 3.17 3.19 3.70
St Ives 169.45_5-1 Conc. (ppm) 8509.59 2850.82 8553.28 723000.00 332.91 400.36 BD 1685.85 BDDL 33.59 20.85 14.38 401.84 2.61 6.98 18.46 8.73 14.71Precision(%) 8.14 5.53 3.45 3.89 4.82 5.28 5.31
364
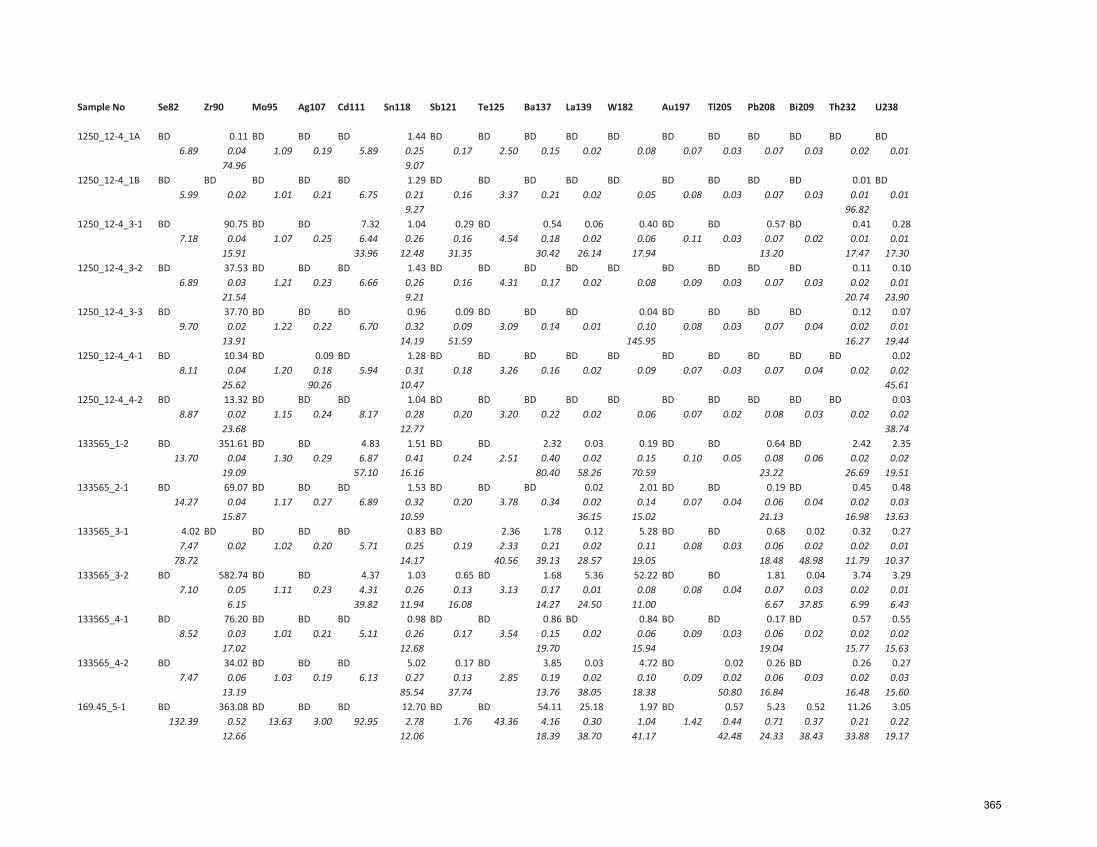
Sample No
1250_12-4_1A
1250_12-4_1B
1250_12-4_3-1
1250_12-4_3-2
1250_12-4_3-3
1250_12-4_4-1
1250_12-4_4-2
133565_1-2
133565_2-1
133565_3-1
133565_3-2
133565_4-1
133565_4-2
169.45_5-1
Se82 Zr90 Mo95 Ag107 Cd111 Sn118 Sb121 Te125 Ba137 La139 W182 Au197 Tl205 Pb208 Bi209 Th232 U238
BD 0.11 BD BD BD 1.44 BD BD BD BD BD BD BD BD BD BD BD6.89 0.04 1.09 0.19 5.89 0.25 0.17 2.50 0.15 0.02 0.08 0.07 0.03 0.07 0.03 0.02 0.01
74.96 9.07BD BD BD BD BD 1.29 BD BD BD BD BD BD BD BD BD 0.01 BD
5.99 0.02 1.01 0.21 6.75 0.21 0.16 3.37 0.21 0.02 0.05 0.08 0.03 0.07 0.03 0.01 0.019.27 96.82
BD 90.75 BD BD 7.32 1.04 0.29 BD 0.54 0.06 0.40 BD BD 0.57 BD 0.41 0.287.18 0.04 1.07 0.25 6.44 0.26 0.16 4.54 0.18 0.02 0.06 0.11 0.03 0.07 0.02 0.01 0.01
15.91 33.96 12.48 31.35 30.42 26.14 17.94 13.20 17.47 17.30BD 37.53 BD BD BD 1.43 BD BD BD BD BD BD BD BD BD 0.11 0.10
6.89 0.03 1.21 0.23 6.66 0.26 0.16 4.31 0.17 0.02 0.08 0.09 0.03 0.07 0.03 0.02 0.0121.54 9.21 20.74 23.90
BD 37.70 BD BD BD 0.96 0.09 BD BD BD 0.04 BD BD BD BD 0.12 0.079.70 0.02 1.22 0.22 6.70 0.32 0.09 3.09 0.14 0.01 0.10 0.08 0.03 0.07 0.04 0.02 0.01
13.91 14.19 51.59 145.95 16.27 19.44BD 10.34 BD 0.09 BD 1.28 BD BD BD BD BD BD BD BD BD BD 0.02
8.11 0.04 1.20 0.18 5.94 0.31 0.18 3.26 0.16 0.02 0.09 0.07 0.03 0.07 0.04 0.02 0.0225.62 90.26 10.47 45.61
BD 13.32 BD BD BD 1.04 BD BD BD BD BD BD BD BD BD BD 0.038.87 0.02 1.15 0.24 8.17 0.28 0.20 3.20 0.22 0.02 0.06 0.07 0.02 0.08 0.03 0.02 0.02
23.68 12.77 38.74BD 351.61 BD BD 4.83 1.51 BD BD 2.32 0.03 0.19 BD BD 0.64 BD 2.42 2.35
13.70 0.04 1.30 0.29 6.87 0.41 0.24 2.51 0.40 0.02 0.15 0.10 0.05 0.08 0.06 0.02 0.0219.09 57.10 16.16 80.40 58.26 70.59 23.22 26.69 19.51
BD 69.07 BD BD BD 1.53 BD BD BD 0.02 2.01 BD BD 0.19 BD 0.45 0.4814.27 0.04 1.17 0.27 6.89 0.32 0.20 3.78 0.34 0.02 0.14 0.07 0.04 0.06 0.04 0.02 0.03
15.87 10.59 36.15 15.02 21.13 16.98 13.634.02 BD BD BD BD 0.83 BD 2.36 1.78 0.12 5.28 BD BD 0.68 0.02 0.32 0.277.47 0.02 1.02 0.20 5.71 0.25 0.19 2.33 0.21 0.02 0.11 0.08 0.03 0.06 0.02 0.02 0.01
78.72 14.17 40.56 39.13 28.57 19.05 18.48 48.98 11.79 10.37BD 582.74 BD BD 4.37 1.03 0.65 BD 1.68 5.36 52.22 BD BD 1.81 0.04 3.74 3.29
7.10 0.05 1.11 0.23 4.31 0.26 0.13 3.13 0.17 0.01 0.08 0.08 0.04 0.07 0.03 0.02 0.016.15 39.82 11.94 16.08 14.27 24.50 11.00 6.67 37.85 6.99 6.43
BD 76.20 BD BD BD 0.98 BD BD 0.86 BD 0.84 BD BD 0.17 BD 0.57 0.558.52 0.03 1.01 0.21 5.11 0.26 0.17 3.54 0.15 0.02 0.06 0.09 0.03 0.06 0.02 0.02 0.02
17.02 12.68 19.70 15.94 19.04 15.77 15.63BD 34.02 BD BD BD 5.02 0.17 BD 3.85 0.03 4.72 BD 0.02 0.26 BD 0.26 0.27
7.47 0.06 1.03 0.19 6.13 0.27 0.13 2.85 0.19 0.02 0.10 0.09 0.02 0.06 0.03 0.02 0.0313.19 85.54 37.74 13.76 38.05 18.38 50.80 16.84 16.48 15.60
BD 363.08 BD BD BD 12.70 BD BD 54.11 25.18 1.97 BD 0.57 5.23 0.52 11.26 3.05132.39 0.52 13.63 3.00 92.95 2.78 1.76 43.36 4.16 0.30 1.04 1.42 0.44 0.71 0.37 0.21 0.22
12.66 12.06 18.39 38.70 41.17 42.48 24.33 38.43 33.88 19.17
365

Location Event Style Sample No Ti49 Cr53 Mn55 Fe57 Co59 Ni60 Cu65 Zn66 As75St Ives 301.0_1 Conc. (ppm) 763.55 18.50 1015.46 723000.00 28.54 43.92 1.27 43.07 BD
DL 0.82 1.60 0.91 15.43 0.09 0.25 0.89 0.62 3.89Precision(%) 3.61 9.63 7.54 2.57 3.51 3.15 33.80 4.36
St Ives 301.0_2 Conc. (ppm) 68408.80 108.01 10555.88 723000.00 56.94 72.88 3.75 178.60 7.75DL 0.90 2.53 1.06 30.55 0.09 0.49 1.49 0.54 5.19Precision(%) 14.01 7.98 8.62 8.14 7.24 6.56 19.53 8.18 27.06
St Ives 301.0_3 Conc. (ppm) 901.65 6.58 1125.99 723000.00 33.51 44.22 BD 43.29 5.80DL 0.35 1.61 0.93 13.22 0.10 0.35 1.08 0.45 3.58Precision(%) 3.11 12.85 9.84 2.77 3.89 3.19 3.65 23.29
St Ives 42.8_1-2 Conc. (ppm) 152.55 BD 377.41 723000.00 10.91 344.61 7.24 22.80 BDDL 4.03 6.03 3.90 67.81 0.46 1.17 5.23 2.15 5.87Precision(%) 13.29 12.00 11.68 12.65 11.65 45.88 13.75
St Ives 42.8_2-3 Conc. (ppm) 143.82 BD 391.46 723000.00 12.20 278.27 BD 23.40 BDDL 3.21 5.23 3.79 52.96 0.44 1.16 5.64 2.29 4.75Precision(%) 13.48 10.74 10.60 11.71 10.48 12.49
St Ives 42.8_2-4 Conc. (ppm) 157.64 BD 1048.04 723000.00 51.38 425.47 153.65 586.34 BDDL 2.81 3.52 3.01 48.33 0.40 1.00 4.09 2.34 3.36Precision(%) 10.25 9.93 5.93 21.84 7.49 30.66 19.38
St Ives 43.1_2-1 Conc. (ppm) 71.47 14911.41 416.46 723000.00 8.62 642.59 BD 61.59 BDDL 8.53 14.98 11.78 250.59 0.98 3.75 13.36 7.14 119.26Precision(%) 14.13 12.47 8.87 8.00 14.50 7.72 21.87
St Ives 43.1_2-2 Conc. (ppm) 667.58 8500.69 4438.70 723000.00 165.30 1798.12 BD 381.70 BDDL 22.36 65.84 37.63 596.10 3.13 10.76 38.43 23.14 326.04Precision(%) 17.85 30.58 17.24 22.92 17.40 16.65 17.78
St Ives 43.1_2-3 Conc. (ppm) 1229.31 22044.48 7519.20 723000.00 261.49 2370.62 BD 700.83 BDDL 29.51 78.45 47.39 788.51 3.15 16.18 54.50 22.16 487.72Precision(%) 18.92 32.58 18.30 25.06 18.22 18.15 21.12
Golden Mile Chron. Samples Fimiston Stage II 52280_1-3 Conc. (ppm) 2581673.92 BD 4959.45 723000.00 BD BD 46.85 497.77 2364.64DL 8.93 11.98 8.35 157.23 0.70 3.36 11.00 5.98 13.34Precision(%) 7.57 6.43 7.66 12.76 14.02 9.57
Golden Mile Chron. Samples Fimiston Stage II 52280_2-2 Conc. (ppm) 922848.25 BD 12440.41 723000.00 BD BD BD 976.57 559.87DL 36.96 17.45 13.59 200.62 1.05 3.67 17.28 10.18 23.18Precision(%) 6.40 6.49 5.79 7.02 6.51
Golden Mile Chron. Samples Fimiston Stage II 52280_2-4 Conc. (ppm) 212771.67 BD 3334.23 723000.00 131.14 15.86 38.71 246.35 860.62DL 13.01 5.93 4.78 70.91 0.48 2.02 6.24 4.15 7.51Precision(%) 15.12 11.40 8.31 12.58 13.18 13.03 11.16 11.75
Golden Mile Fimiston Aberdare ABD15_5 Conc. (ppm) 14620.65 7.67 31.17 723000.00 6184.36 5390.29 229.82 43.44 10371.52DL 6.58 1.55 1.02 15.97 0.11 0.41 1.30 0.80 4.36Precision(%) 11.74 21.68 13.07 5.51 5.59 9.74 10.00 12.10 7.51
Golden Mile Fimiston Aberdare ABD15_6 Conc. (ppm) 926466.21 134.59 978.74 723000.00 6358.36 3011.71 1094.72 198.24 13414.71DL 12.22 4.52 1.77 33.81 0.32 0.80 3.75 1.67 11.19Precision(%) 7.31 8.31 8.71 6.89 8.49 8.18 15.88 8.41 7.14
Golden Mile Fimiston Aberdare ABD9_1 Conc. (ppm) 63.53 1.90 169.23 723000.00 47.52 66.02 BD 103.79 6.42
366
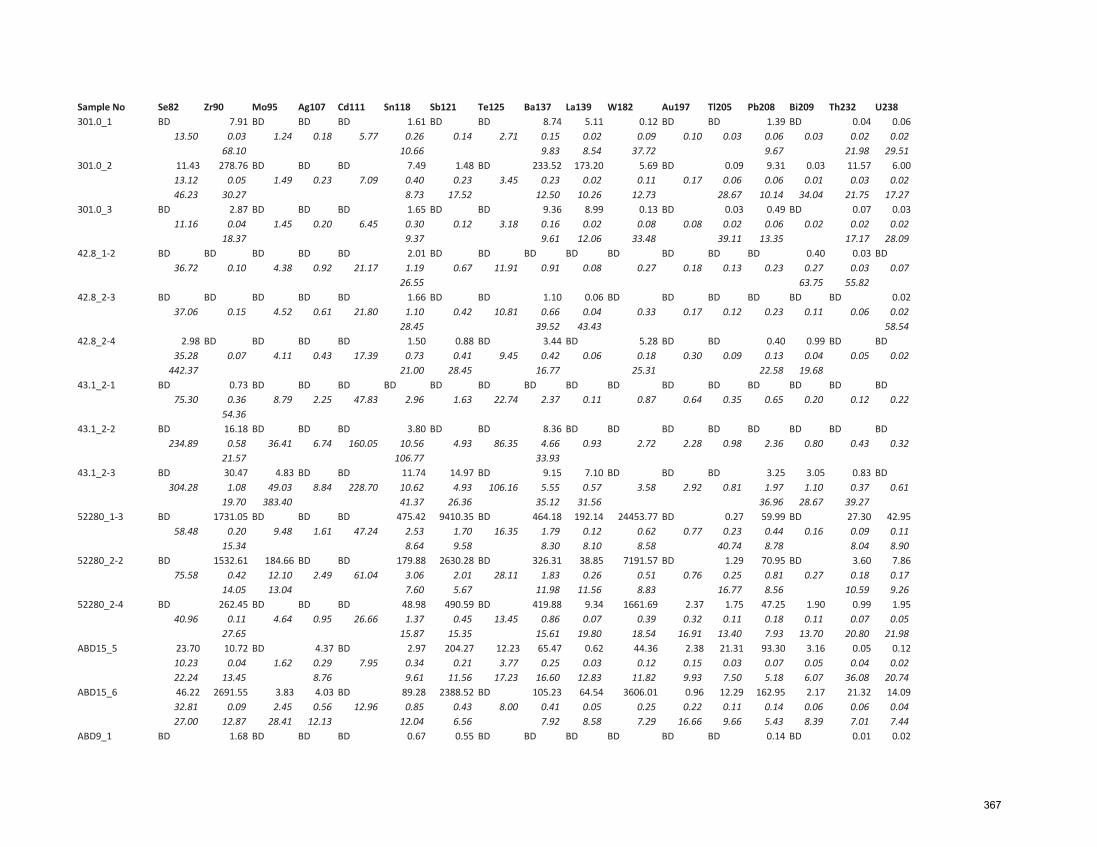
Sample No301.0_1
301.0_2
301.0_3
42.8_1-2
42.8_2-3
42.8_2-4
43.1_2-1
43.1_2-2
43.1_2-3
52280_1-3
52280_2-2
52280_2-4
ABD15_5
ABD15_6
ABD9_1
Se82 Zr90 Mo95 Ag107 Cd111 Sn118 Sb121 Te125 Ba137 La139 W182 Au197 Tl205 Pb208 Bi209 Th232 U238BD 7.91 BD BD BD 1.61 BD BD 8.74 5.11 0.12 BD BD 1.39 BD 0.04 0.06
13.50 0.03 1.24 0.18 5.77 0.26 0.14 2.71 0.15 0.02 0.09 0.10 0.03 0.06 0.03 0.02 0.0268.10 10.66 9.83 8.54 37.72 9.67 21.98 29.51
11.43 278.76 BD BD BD 7.49 1.48 BD 233.52 173.20 5.69 BD 0.09 9.31 0.03 11.57 6.0013.12 0.05 1.49 0.23 7.09 0.40 0.23 3.45 0.23 0.02 0.11 0.17 0.06 0.06 0.01 0.03 0.0246.23 30.27 8.73 17.52 12.50 10.26 12.73 28.67 10.14 34.04 21.75 17.27
BD 2.87 BD BD BD 1.65 BD BD 9.36 8.99 0.13 BD 0.03 0.49 BD 0.07 0.0311.16 0.04 1.45 0.20 6.45 0.30 0.12 3.18 0.16 0.02 0.08 0.08 0.02 0.06 0.02 0.02 0.02
18.37 9.37 9.61 12.06 33.48 39.11 13.35 17.17 28.09BD BD BD BD BD 2.01 BD BD BD BD BD BD BD BD 0.40 0.03 BD
36.72 0.10 4.38 0.92 21.17 1.19 0.67 11.91 0.91 0.08 0.27 0.18 0.13 0.23 0.27 0.03 0.0726.55 63.75 55.82
BD BD BD BD BD 1.66 BD BD 1.10 0.06 BD BD BD BD BD BD 0.0237.06 0.15 4.52 0.61 21.80 1.10 0.42 10.81 0.66 0.04 0.33 0.17 0.12 0.23 0.11 0.06 0.02
28.45 39.52 43.43 58.542.98 BD BD BD BD 1.50 0.88 BD 3.44 BD 5.28 BD BD 0.40 0.99 BD BD
35.28 0.07 4.11 0.43 17.39 0.73 0.41 9.45 0.42 0.06 0.18 0.30 0.09 0.13 0.04 0.05 0.02442.37 21.00 28.45 16.77 25.31 22.58 19.68
BD 0.73 BD BD BD BD BD BD BD BD BD BD BD BD BD BD BD75.30 0.36 8.79 2.25 47.83 2.96 1.63 22.74 2.37 0.11 0.87 0.64 0.35 0.65 0.20 0.12 0.22
54.36BD 16.18 BD BD BD 3.80 BD BD 8.36 BD BD BD BD BD BD BD BD
234.89 0.58 36.41 6.74 160.05 10.56 4.93 86.35 4.66 0.93 2.72 2.28 0.98 2.36 0.80 0.43 0.3221.57 106.77 33.93
BD 30.47 4.83 BD BD 11.74 14.97 BD 9.15 7.10 BD BD BD 3.25 3.05 0.83 BD304.28 1.08 49.03 8.84 228.70 10.62 4.93 106.16 5.55 0.57 3.58 2.92 0.81 1.97 1.10 0.37 0.61
19.70 383.40 41.37 26.36 35.12 31.56 36.96 28.67 39.27BD 1731.05 BD BD BD 475.42 9410.35 BD 464.18 192.14 24453.77 BD 0.27 59.99 BD 27.30 42.95
58.48 0.20 9.48 1.61 47.24 2.53 1.70 16.35 1.79 0.12 0.62 0.77 0.23 0.44 0.16 0.09 0.1115.34 8.64 9.58 8.30 8.10 8.58 40.74 8.78 8.04 8.90
BD 1532.61 184.66 BD BD 179.88 2630.28 BD 326.31 38.85 7191.57 BD 1.29 70.95 BD 3.60 7.8675.58 0.42 12.10 2.49 61.04 3.06 2.01 28.11 1.83 0.26 0.51 0.76 0.25 0.81 0.27 0.18 0.17
14.05 13.04 7.60 5.67 11.98 11.56 8.83 16.77 8.56 10.59 9.26BD 262.45 BD BD BD 48.98 490.59 BD 419.88 9.34 1661.69 2.37 1.75 47.25 1.90 0.99 1.95
40.96 0.11 4.64 0.95 26.66 1.37 0.45 13.45 0.86 0.07 0.39 0.32 0.11 0.18 0.11 0.07 0.0527.65 15.87 15.35 15.61 19.80 18.54 16.91 13.40 7.93 13.70 20.80 21.98
23.70 10.72 BD 4.37 BD 2.97 204.27 12.23 65.47 0.62 44.36 2.38 21.31 93.30 3.16 0.05 0.1210.23 0.04 1.62 0.29 7.95 0.34 0.21 3.77 0.25 0.03 0.12 0.15 0.03 0.07 0.05 0.04 0.0222.24 13.45 8.76 9.61 11.56 17.23 16.60 12.83 11.82 9.93 7.50 5.18 6.07 36.08 20.7446.22 2691.55 3.83 4.03 BD 89.28 2388.52 BD 105.23 64.54 3606.01 0.96 12.29 162.95 2.17 21.32 14.0932.81 0.09 2.45 0.56 12.96 0.85 0.43 8.00 0.41 0.05 0.25 0.22 0.11 0.14 0.06 0.06 0.0427.00 12.87 28.41 12.13 12.04 6.56 7.92 8.58 7.29 16.66 9.66 5.43 8.39 7.01 7.44
BD 1.68 BD BD BD 0.67 0.55 BD BD BD BD BD BD 0.14 BD 0.01 0.02
367
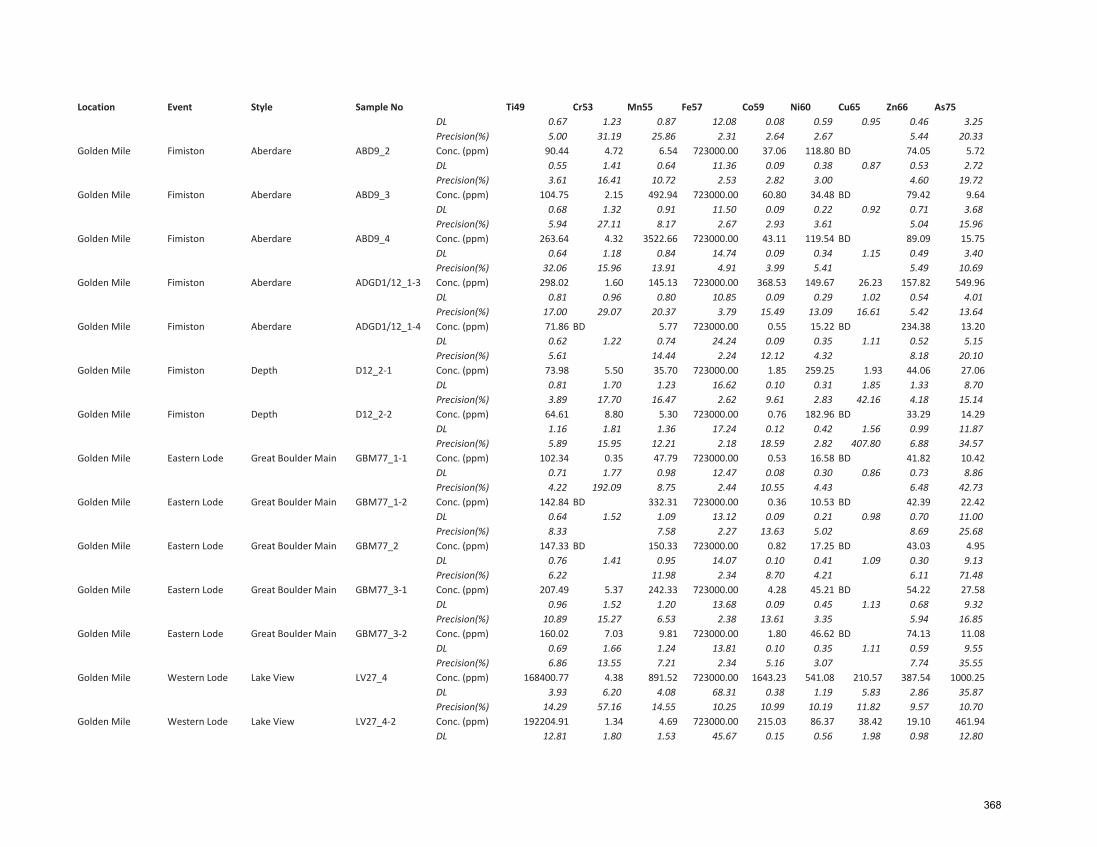
Location Event Style Sample No Ti49 Cr53 Mn55 Fe57 Co59 Ni60 Cu65 Zn66 As75DL 0.67 1.23 0.87 12.08 0.08 0.59 0.95 0.46 3.25Precision(%) 5.00 31.19 25.86 2.31 2.64 2.67 5.44 20.33
Golden Mile Fimiston Aberdare ABD9_2 Conc. (ppm) 90.44 4.72 6.54 723000.00 37.06 118.80 BD 74.05 5.72DL 0.55 1.41 0.64 11.36 0.09 0.38 0.87 0.53 2.72Precision(%) 3.61 16.41 10.72 2.53 2.82 3.00 4.60 19.72
Golden Mile Fimiston Aberdare ABD9_3 Conc. (ppm) 104.75 2.15 492.94 723000.00 60.80 34.48 BD 79.42 9.64DL 0.68 1.32 0.91 11.50 0.09 0.22 0.92 0.71 3.68Precision(%) 5.94 27.11 8.17 2.67 2.93 3.61 5.04 15.96
Golden Mile Fimiston Aberdare ABD9_4 Conc. (ppm) 263.64 4.32 3522.66 723000.00 43.11 119.54 BD 89.09 15.75DL 0.64 1.18 0.84 14.74 0.09 0.34 1.15 0.49 3.40Precision(%) 32.06 15.96 13.91 4.91 3.99 5.41 5.49 10.69
Golden Mile Fimiston Aberdare ADGD1/12_1-3 Conc. (ppm) 298.02 1.60 145.13 723000.00 368.53 149.67 26.23 157.82 549.96DL 0.81 0.96 0.80 10.85 0.09 0.29 1.02 0.54 4.01Precision(%) 17.00 29.07 20.37 3.79 15.49 13.09 16.61 5.42 13.64
Golden Mile Fimiston Aberdare ADGD1/12_1-4 Conc. (ppm) 71.86 BD 5.77 723000.00 0.55 15.22 BD 234.38 13.20DL 0.62 1.22 0.74 24.24 0.09 0.35 1.11 0.52 5.15Precision(%) 5.61 14.44 2.24 12.12 4.32 8.18 20.10
Golden Mile Fimiston Depth D12_2-1 Conc. (ppm) 73.98 5.50 35.70 723000.00 1.85 259.25 1.93 44.06 27.06DL 0.81 1.70 1.23 16.62 0.10 0.31 1.85 1.33 8.70Precision(%) 3.89 17.70 16.47 2.62 9.61 2.83 42.16 4.18 15.14
Golden Mile Fimiston Depth D12_2-2 Conc. (ppm) 64.61 8.80 5.30 723000.00 0.76 182.96 BD 33.29 14.29DL 1.16 1.81 1.36 17.24 0.12 0.42 1.56 0.99 11.87Precision(%) 5.89 15.95 12.21 2.18 18.59 2.82 407.80 6.88 34.57
Golden Mile Eastern Lode Great Boulder Main GBM77_1-1 Conc. (ppm) 102.34 0.35 47.79 723000.00 0.53 16.58 BD 41.82 10.42DL 0.71 1.77 0.98 12.47 0.08 0.30 0.86 0.73 8.86Precision(%) 4.22 192.09 8.75 2.44 10.55 4.43 6.48 42.73
Golden Mile Eastern Lode Great Boulder Main GBM77_1-2 Conc. (ppm) 142.84 BD 332.31 723000.00 0.36 10.53 BD 42.39 22.42DL 0.64 1.52 1.09 13.12 0.09 0.21 0.98 0.70 11.00Precision(%) 8.33 7.58 2.27 13.63 5.02 8.69 25.68
Golden Mile Eastern Lode Great Boulder Main GBM77_2 Conc. (ppm) 147.33 BD 150.33 723000.00 0.82 17.25 BD 43.03 4.95DL 0.76 1.41 0.95 14.07 0.10 0.41 1.09 0.30 9.13Precision(%) 6.22 11.98 2.34 8.70 4.21 6.11 71.48
Golden Mile Eastern Lode Great Boulder Main GBM77_3-1 Conc. (ppm) 207.49 5.37 242.33 723000.00 4.28 45.21 BD 54.22 27.58DL 0.96 1.52 1.20 13.68 0.09 0.45 1.13 0.68 9.32Precision(%) 10.89 15.27 6.53 2.38 13.61 3.35 5.94 16.85
Golden Mile Eastern Lode Great Boulder Main GBM77_3-2 Conc. (ppm) 160.02 7.03 9.81 723000.00 1.80 46.62 BD 74.13 11.08DL 0.69 1.66 1.24 13.81 0.10 0.35 1.11 0.59 9.55Precision(%) 6.86 13.55 7.21 2.34 5.16 3.07 7.74 35.55
Golden Mile Western Lode Lake View LV27_4 Conc. (ppm) 168400.77 4.38 891.52 723000.00 1643.23 541.08 210.57 387.54 1000.25DL 3.93 6.20 4.08 68.31 0.38 1.19 5.83 2.86 35.87Precision(%) 14.29 57.16 14.55 10.25 10.99 10.19 11.82 9.57 10.70
Golden Mile Western Lode Lake View LV27_4-2 Conc. (ppm) 192204.91 1.34 4.69 723000.00 215.03 86.37 38.42 19.10 461.94DL 12.81 1.80 1.53 45.67 0.15 0.56 1.98 0.98 12.80
368
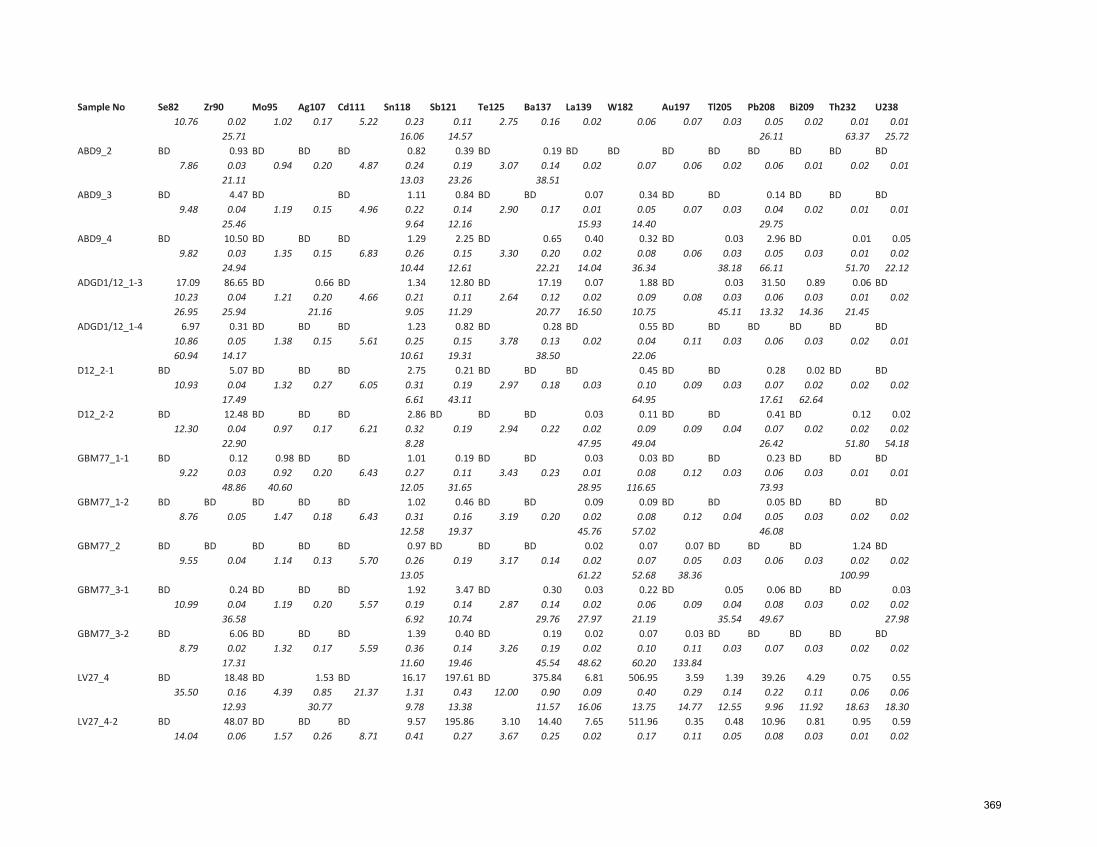
Sample No
ABD9_2
ABD9_3
ABD9_4
ADGD1/12_1-3
ADGD1/12_1-4
D12_2-1
D12_2-2
GBM77_1-1
GBM77_1-2
GBM77_2
GBM77_3-1
GBM77_3-2
LV27_4
LV27_4-2
Se82 Zr90 Mo95 Ag107 Cd111 Sn118 Sb121 Te125 Ba137 La139 W182 Au197 Tl205 Pb208 Bi209 Th232 U23810.76 0.02 1.02 0.17 5.22 0.23 0.11 2.75 0.16 0.02 0.06 0.07 0.03 0.05 0.02 0.01 0.01
25.71 16.06 14.57 26.11 63.37 25.72BD 0.93 BD BD BD 0.82 0.39 BD 0.19 BD BD BD BD BD BD BD BD
7.86 0.03 0.94 0.20 4.87 0.24 0.19 3.07 0.14 0.02 0.07 0.06 0.02 0.06 0.01 0.02 0.0121.11 13.03 23.26 38.51
BD 4.47 BD BD 1.11 0.84 BD BD 0.07 0.34 BD BD 0.14 BD BD BD9.48 0.04 1.19 0.15 4.96 0.22 0.14 2.90 0.17 0.01 0.05 0.07 0.03 0.04 0.02 0.01 0.01
25.46 9.64 12.16 15.93 14.40 29.75BD 10.50 BD BD BD 1.29 2.25 BD 0.65 0.40 0.32 BD 0.03 2.96 BD 0.01 0.05
9.82 0.03 1.35 0.15 6.83 0.26 0.15 3.30 0.20 0.02 0.08 0.06 0.03 0.05 0.03 0.01 0.0224.94 10.44 12.61 22.21 14.04 36.34 38.18 66.11 51.70 22.12
17.09 86.65 BD 0.66 BD 1.34 12.80 BD 17.19 0.07 1.88 BD 0.03 31.50 0.89 0.06 BD10.23 0.04 1.21 0.20 4.66 0.21 0.11 2.64 0.12 0.02 0.09 0.08 0.03 0.06 0.03 0.01 0.0226.95 25.94 21.16 9.05 11.29 20.77 16.50 10.75 45.11 13.32 14.36 21.45
6.97 0.31 BD BD BD 1.23 0.82 BD 0.28 BD 0.55 BD BD BD BD BD BD10.86 0.05 1.38 0.15 5.61 0.25 0.15 3.78 0.13 0.02 0.04 0.11 0.03 0.06 0.03 0.02 0.0160.94 14.17 10.61 19.31 38.50 22.06
BD 5.07 BD BD BD 2.75 0.21 BD BD BD 0.45 BD BD 0.28 0.02 BD BD10.93 0.04 1.32 0.27 6.05 0.31 0.19 2.97 0.18 0.03 0.10 0.09 0.03 0.07 0.02 0.02 0.02
17.49 6.61 43.11 64.95 17.61 62.64BD 12.48 BD BD BD 2.86 BD BD BD 0.03 0.11 BD BD 0.41 BD 0.12 0.02
12.30 0.04 0.97 0.17 6.21 0.32 0.19 2.94 0.22 0.02 0.09 0.09 0.04 0.07 0.02 0.02 0.0222.90 8.28 47.95 49.04 26.42 51.80 54.18
BD 0.12 0.98 BD BD 1.01 0.19 BD BD 0.03 0.03 BD BD 0.23 BD BD BD9.22 0.03 0.92 0.20 6.43 0.27 0.11 3.43 0.23 0.01 0.08 0.12 0.03 0.06 0.03 0.01 0.01
48.86 40.60 12.05 31.65 28.95 116.65 73.93BD BD BD BD BD 1.02 0.46 BD BD 0.09 0.09 BD BD 0.05 BD BD BD
8.76 0.05 1.47 0.18 6.43 0.31 0.16 3.19 0.20 0.02 0.08 0.12 0.04 0.05 0.03 0.02 0.0212.58 19.37 45.76 57.02 46.08
BD BD BD BD BD 0.97 BD BD BD 0.02 0.07 0.07 BD BD BD 1.24 BD9.55 0.04 1.14 0.13 5.70 0.26 0.19 3.17 0.14 0.02 0.07 0.05 0.03 0.06 0.03 0.02 0.02
13.05 61.22 52.68 38.36 100.99BD 0.24 BD BD BD 1.92 3.47 BD 0.30 0.03 0.22 BD 0.05 0.06 BD BD 0.03
10.99 0.04 1.19 0.20 5.57 0.19 0.14 2.87 0.14 0.02 0.06 0.09 0.04 0.08 0.03 0.02 0.0236.58 6.92 10.74 29.76 27.97 21.19 35.54 49.67 27.98
BD 6.06 BD BD BD 1.39 0.40 BD 0.19 0.02 0.07 0.03 BD BD BD BD BD8.79 0.02 1.32 0.17 5.59 0.36 0.14 3.26 0.19 0.02 0.10 0.11 0.03 0.07 0.03 0.02 0.02
17.31 11.60 19.46 45.54 48.62 60.20 133.84BD 18.48 BD 1.53 BD 16.17 197.61 BD 375.84 6.81 506.95 3.59 1.39 39.26 4.29 0.75 0.55
35.50 0.16 4.39 0.85 21.37 1.31 0.43 12.00 0.90 0.09 0.40 0.29 0.14 0.22 0.11 0.06 0.0612.93 30.77 9.78 13.38 11.57 16.06 13.75 14.77 12.55 9.96 11.92 18.63 18.30
BD 48.07 BD BD BD 9.57 195.86 3.10 14.40 7.65 511.96 0.35 0.48 10.96 0.81 0.95 0.5914.04 0.06 1.57 0.26 8.71 0.41 0.27 3.67 0.25 0.02 0.17 0.11 0.05 0.08 0.03 0.01 0.02
369

Location Event Style Sample No Ti49 Cr53 Mn55 Fe57 Co59 Ni60 Cu65 Zn66 As75Precision(%) 3.98 54.26 13.71 3.78 6.68 6.14 7.56 6.24 4.35
Golden Mile Western Lode Lake View LV27_5 Conc. (ppm) 44900.59 22.50 297.69 723000.00 35.13 43.67 5.37 78.10 67.97DL 1.10 1.43 1.38 17.40 0.11 0.52 1.85 0.72 11.10Precision(%) 20.38 13.58 16.67 3.41 16.63 6.92 20.93 6.96 11.52
Golden Mile Western Lode Lake View LV37_1-3 Conc. (ppm) 228809.76 9.16 45.51 723000.00 1079.47 340.69 916.13 30.14 8634.13DL 1.12 1.38 1.23 18.83 0.11 0.34 1.66 0.72 7.85Precision(%) 3.05 10.31 5.28 3.00 3.03 3.71 5.39 4.87 3.46
Golden Mile Western Lode Lake View LV37_1-4 Conc. (ppm) 217994.25 5.08 11.31 723000.00 1994.55 384.11 458.58 32.58 6076.92DL 1.16 1.24 1.00 18.08 0.10 0.33 1.24 0.75 7.99Precision(%) 3.32 13.31 11.38 2.52 2.89 3.57 3.95 4.06 3.91
Golden Mile Western Lode Lake View LV53_1-1 Conc. (ppm) 165.79 BD 8.66 723000.00 1.04 24.70 BD 26.97 9.46DL 1.12 2.14 1.41 56.19 0.15 0.55 1.67 1.13 6.70Precision(%) 4.92 7.15 2.56 9.40 4.33 6.27 29.79
Golden Mile Western Lode Lake View LV53_2-1 Conc. (ppm) 375.78 8.10 9.27 723000.00 0.35 30.95 BD 50.62 13.55DL 1.20 1.84 1.28 18.56 0.15 0.37 1.44 0.83 7.31Precision(%) 12.76 14.59 8.09 2.58 18.95 3.97 5.98 22.04
Golden Mile Western Lode Lake View LV53_2-2 Conc. (ppm) 94.20 BD 7.60 723000.00 8.11 26.73 BD 12.02 BDDL 1.12 2.23 1.42 24.74 0.12 0.38 1.81 1.11 7.76Precision(%) 5.37 8.36 2.58 3.51 4.05 7.37
370
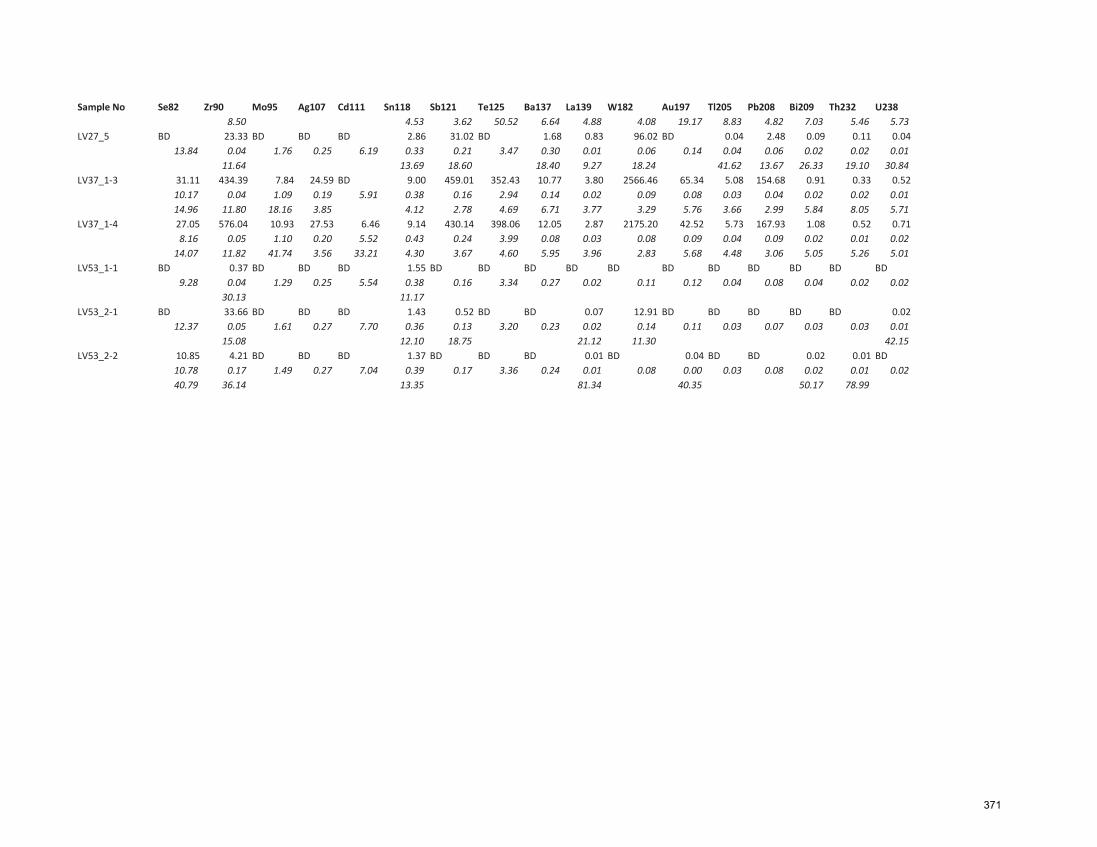
Sample No
LV27_5
LV37_1-3
LV37_1-4
LV53_1-1
LV53_2-1
LV53_2-2
Se82 Zr90 Mo95 Ag107 Cd111 Sn118 Sb121 Te125 Ba137 La139 W182 Au197 Tl205 Pb208 Bi209 Th232 U2388.50 4.53 3.62 50.52 6.64 4.88 4.08 19.17 8.83 4.82 7.03 5.46 5.73
BD 23.33 BD BD BD 2.86 31.02 BD 1.68 0.83 96.02 BD 0.04 2.48 0.09 0.11 0.0413.84 0.04 1.76 0.25 6.19 0.33 0.21 3.47 0.30 0.01 0.06 0.14 0.04 0.06 0.02 0.02 0.01
11.64 13.69 18.60 18.40 9.27 18.24 41.62 13.67 26.33 19.10 30.8431.11 434.39 7.84 24.59 BD 9.00 459.01 352.43 10.77 3.80 2566.46 65.34 5.08 154.68 0.91 0.33 0.5210.17 0.04 1.09 0.19 5.91 0.38 0.16 2.94 0.14 0.02 0.09 0.08 0.03 0.04 0.02 0.02 0.0114.96 11.80 18.16 3.85 4.12 2.78 4.69 6.71 3.77 3.29 5.76 3.66 2.99 5.84 8.05 5.7127.05 576.04 10.93 27.53 6.46 9.14 430.14 398.06 12.05 2.87 2175.20 42.52 5.73 167.93 1.08 0.52 0.718.16 0.05 1.10 0.20 5.52 0.43 0.24 3.99 0.08 0.03 0.08 0.09 0.04 0.09 0.02 0.01 0.02
14.07 11.82 41.74 3.56 33.21 4.30 3.67 4.60 5.95 3.96 2.83 5.68 4.48 3.06 5.05 5.26 5.01BD 0.37 BD BD BD 1.55 BD BD BD BD BD BD BD BD BD BD BD
9.28 0.04 1.29 0.25 5.54 0.38 0.16 3.34 0.27 0.02 0.11 0.12 0.04 0.08 0.04 0.02 0.0230.13 11.17
BD 33.66 BD BD BD 1.43 0.52 BD BD 0.07 12.91 BD BD BD BD BD 0.0212.37 0.05 1.61 0.27 7.70 0.36 0.13 3.20 0.23 0.02 0.14 0.11 0.03 0.07 0.03 0.03 0.01
15.08 12.10 18.75 21.12 11.30 42.1510.85 4.21 BD BD BD 1.37 BD BD BD 0.01 BD 0.04 BD BD 0.02 0.01 BD10.78 0.17 1.49 0.27 7.04 0.39 0.17 3.36 0.24 0.01 0.08 0.00 0.03 0.08 0.02 0.01 0.0240.79 36.14 13.35 81.34 40.35 50.17 78.99
371

Location Sample No Ti49 Cr53 Mn55 Fe57 Co59 Ni60 Cu65 Zn66 As75 Se82 Zr90 Mo95 Ag107 Cd111
New Celebration JD0475-5_1-1 Conc. (ppm) 415845.42 11.26 15319.37 500000.00 71.16 52.31 6.18 349.19 6.13 BD 8.11 1.62 BD BDDL 1.27 2.64 1.39 18.08 0.20 0.69 1.68 0.88 1.45 10.62 0.06 1.62 0.30 10.77Precision(%) 3.22 12.03 3.02 3.08 3.18 5.17 14.01 2.89 12.73 16.84 39.17
New Celebration JD0475-5_2-1 Conc. (ppm) 392601.58 15.19 14049.28 500000.00 106.41 133.53 10.24 382.30 4.99 BD 108.68 11.32 BD BDDL 6.85 1.65 1.52 23.31 0.20 0.64 1.39 1.36 1.63 12.50 0.04 1.70 0.41 9.21Precision(%) 4.27 10.21 3.74 3.18 3.69 12.29 14.80 3.60 16.15 19.31 48.36
New Celebration JD0475-5_2-2 Conc. (ppm) 411517.79 7.88 16516.40 500000.00 67.72 33.28 4.62 331.03 2.30 BD 5.89 BD BD BDDL 4.34 1.70 1.32 21.26 0.15 0.39 1.35 1.11 1.44 8.53 0.06 1.49 0.29 7.35Precision(%) 3.24 11.79 3.17 3.12 3.26 4.47 14.04 3.18 28.09 7.39
New Celebration JD0475-5_4-1 Conc. (ppm) 398055.50 7.97 14820.39 500000.00 46.03 335.30 8.98 384.39 4.88 BD 40.97 BD BD 9.29DL 11.89 2.48 1.39 23.99 0.17 0.47 1.84 0.91 0.97 11.91 0.05 1.46 0.35 8.66Precision(%) 3.30 15.30 3.23 3.20 3.38 4.75 31.51 2.89 12.12 13.36 38.18
New Celebration JD0475-5_4-2 Conc. (ppm) 393920.52 16.64 14446.52 500000.00 50.62 510.43 6.27 368.28 4.83 BD 8.13 BD BD BDDL 1.66 1.94 1.65 21.10 0.22 0.67 1.31 0.90 1.29 13.08 0.05 1.59 0.31 10.96Precision(%) 4.34 9.91 3.99 3.49 5.01 11.13 13.92 3.79 14.81 10.41
St Ives 169.45_4-1 Conc. (ppm) 430030.98 388.00 30086.19 500000.00 89.98 48.28 BD 261.43 BD BD 236.48 BD BD BDDL 44.90 6.95 4.97 82.11 0.55 1.49 4.51 2.71 3.55 38.13 0.28 3.89 0.77 17.45Precision(%) 7.15 13.40 6.22 5.24 5.52 14.41 9.77 12.93
St Ives 169.45_5-2 Conc. (ppm) 488056.32 209.29 31138.44 500000.00 98.62 32.65 BD 382.73 3.80 BD 106.81 4.42 BD BDDL 19.63 5.97 4.05 83.77 0.48 1.87 5.04 2.43 3.69 45.62 0.19 4.47 0.89 26.49Precision(%) 4.13 6.88 3.95 4.24 7.73 8.47 19.94 19.96 40.61
St Ives 317.15_2-1 Conc. (ppm) 286181.82 2442.11 23692.25 500000.00 145.01 194.71 BD 569.52 BD BD 103.74 BD BD BDDL 149.03 77.96 78.64 951.30 8.22 25.70 71.25 48.74 62.96 642.56 2.80 73.87 12.29 322.30Precision(%) 14.01 14.50 12.84 13.03 15.47 19.16 16.77 13.31
372

Sample No
JD0475-5_1-1
JD0475-5_2-1
JD0475-5_2-2
JD0475-5_4-1
JD0475-5_4-2
169.45_4-1
169.45_5-2
317.15_2-1
Sn118 Sb121 Te125 Ba137 La139 W182 Au197 Tl205 Pb208 Bi209 Th232 U238
6.85 5.57 BD 0.88 0.09 16.52 BD BD 0.74 0.07 0.04 0.070.43 0.23 6.69 0.23 0.04 0.15 0.11 0.05 0.08 0.04 0.02 0.025.33 5.99 22.33 34.72 4.49 10.28 28.66 39.24 22.067.25 5.13 BD 0.90 0.15 17.84 BD BD 1.10 0.05 0.05 0.150.40 0.26 5.98 0.31 0.03 0.14 0.14 0.05 0.09 0.04 0.02 0.027.38 6.74 18.30 21.12 5.34 7.67 38.50 25.19 13.765.57 4.53 BD 1.05 0.15 17.66 BD BD 2.19 0.06 0.02 0.190.35 0.14 4.28 0.28 0.03 0.13 0.11 0.04 0.07 0.03 0.02 0.025.29 6.15 15.79 13.67 3.71 7.72 28.20 37.30 9.45
15.95 5.11 BD 0.41 BD 17.37 0.04 BD 0.63 0.04 BD 0.050.44 0.23 5.24 0.30 0.02 0.12 0.11 0.06 0.09 0.03 0.02 0.02
60.87 6.02 34.23 3.95 144.16 9.60 35.56 19.0067.34 3.82 BD 16.11 0.03 12.33 BD 0.04 1.42 0.09 0.06 0.070.42 0.17 5.03 0.16 0.03 0.12 0.09 0.04 0.09 0.03 0.02 0.02
56.66 6.62 13.36 51.20 4.48 48.81 9.97 71.04 18.45 22.934.56 1.11 BD 3.70 0.31 10.54 BD BD 1.20 BD 0.74 0.700.96 0.75 11.89 0.61 0.09 0.41 0.21 0.11 0.21 0.09 0.07 0.06
10.73 31.87 16.75 20.05 9.43 15.30 12.47 12.636.00 3.02 BD 1.83 0.79 13.04 0.24 BD 1.72 0.58 0.44 0.701.35 0.60 14.00 0.75 0.11 0.35 0.16 0.12 0.20 0.06 0.09 0.06
10.43 12.68 26.68 14.53 6.45 39.65 25.36 15.75 19.10 16.3298.43 212.79 BD 14.54 30.04 BD BD BD 112.22 2.53 27.77 13.4717.81 10.86 235.06 9.45 1.26 58.69 4.49 1.96 3.69 1.17 1.14 1.0617.35 17.92 38.81 13.87 15.28 28.60 13.76 17.56
373
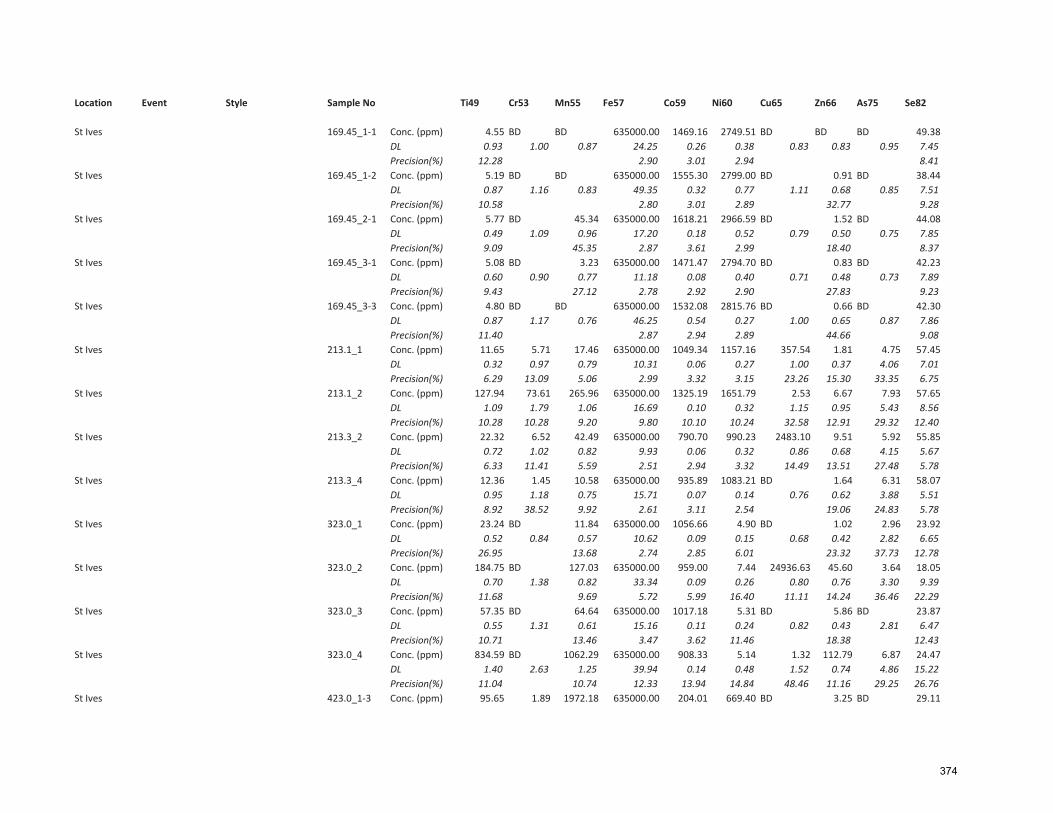
Location Event Style Sample No Ti49 Cr53 Mn55 Fe57 Co59 Ni60 Cu65 Zn66 As75 Se82
St Ives 169.45_1-1 Conc. (ppm) 4.55 BD BD 635000.00 1469.16 2749.51 BD BD BD 49.38DL 0.93 1.00 0.87 24.25 0.26 0.38 0.83 0.83 0.95 7.45Precision(%) 12.28 2.90 3.01 2.94 8.41
St Ives 169.45_1-2 Conc. (ppm) 5.19 BD BD 635000.00 1555.30 2799.00 BD 0.91 BD 38.44DL 0.87 1.16 0.83 49.35 0.32 0.77 1.11 0.68 0.85 7.51Precision(%) 10.58 2.80 3.01 2.89 32.77 9.28
St Ives 169.45_2-1 Conc. (ppm) 5.77 BD 45.34 635000.00 1618.21 2966.59 BD 1.52 BD 44.08DL 0.49 1.09 0.96 17.20 0.18 0.52 0.79 0.50 0.75 7.85Precision(%) 9.09 45.35 2.87 3.61 2.99 18.40 8.37
St Ives 169.45_3-1 Conc. (ppm) 5.08 BD 3.23 635000.00 1471.47 2794.70 BD 0.83 BD 42.23DL 0.60 0.90 0.77 11.18 0.08 0.40 0.71 0.48 0.73 7.89Precision(%) 9.43 27.12 2.78 2.92 2.90 27.83 9.23
St Ives 169.45_3-3 Conc. (ppm) 4.80 BD BD 635000.00 1532.08 2815.76 BD 0.66 BD 42.30DL 0.87 1.17 0.76 46.25 0.54 0.27 1.00 0.65 0.87 7.86Precision(%) 11.40 2.87 2.94 2.89 44.66 9.08
St Ives 213.1_1 Conc. (ppm) 11.65 5.71 17.46 635000.00 1049.34 1157.16 357.54 1.81 4.75 57.45DL 0.32 0.97 0.79 10.31 0.06 0.27 1.00 0.37 4.06 7.01Precision(%) 6.29 13.09 5.06 2.99 3.32 3.15 23.26 15.30 33.35 6.75
St Ives 213.1_2 Conc. (ppm) 127.94 73.61 265.96 635000.00 1325.19 1651.79 2.53 6.67 7.93 57.65DL 1.09 1.79 1.06 16.69 0.10 0.32 1.15 0.95 5.43 8.56Precision(%) 10.28 10.28 9.20 9.80 10.10 10.24 32.58 12.91 29.32 12.40
St Ives 213.3_2 Conc. (ppm) 22.32 6.52 42.49 635000.00 790.70 990.23 2483.10 9.51 5.92 55.85DL 0.72 1.02 0.82 9.93 0.06 0.32 0.86 0.68 4.15 5.67Precision(%) 6.33 11.41 5.59 2.51 2.94 3.32 14.49 13.51 27.48 5.78
St Ives 213.3_4 Conc. (ppm) 12.36 1.45 10.58 635000.00 935.89 1083.21 BD 1.64 6.31 58.07DL 0.95 1.18 0.75 15.71 0.07 0.14 0.76 0.62 3.88 5.51Precision(%) 8.92 38.52 9.92 2.61 3.11 2.54 19.06 24.83 5.78
St Ives 323.0_1 Conc. (ppm) 23.24 BD 11.84 635000.00 1056.66 4.90 BD 1.02 2.96 23.92DL 0.52 0.84 0.57 10.62 0.09 0.15 0.68 0.42 2.82 6.65Precision(%) 26.95 13.68 2.74 2.85 6.01 23.32 37.73 12.78
St Ives 323.0_2 Conc. (ppm) 184.75 BD 127.03 635000.00 959.00 7.44 24936.63 45.60 3.64 18.05DL 0.70 1.38 0.82 33.34 0.09 0.26 0.80 0.76 3.30 9.39Precision(%) 11.68 9.69 5.72 5.99 16.40 11.11 14.24 36.46 22.29
St Ives 323.0_3 Conc. (ppm) 57.35 BD 64.64 635000.00 1017.18 5.31 BD 5.86 BD 23.87DL 0.55 1.31 0.61 15.16 0.11 0.24 0.82 0.43 2.81 6.47Precision(%) 10.71 13.46 3.47 3.62 11.46 18.38 12.43
St Ives 323.0_4 Conc. (ppm) 834.59 BD 1062.29 635000.00 908.33 5.14 1.32 112.79 6.87 24.47DL 1.40 2.63 1.25 39.94 0.14 0.48 1.52 0.74 4.86 15.22Precision(%) 11.04 10.74 12.33 13.94 14.84 48.46 11.16 29.25 26.76
St Ives 423.0_1-3 Conc. (ppm) 95.65 1.89 1972.18 635000.00 204.01 669.40 BD 3.25 BD 29.11
374
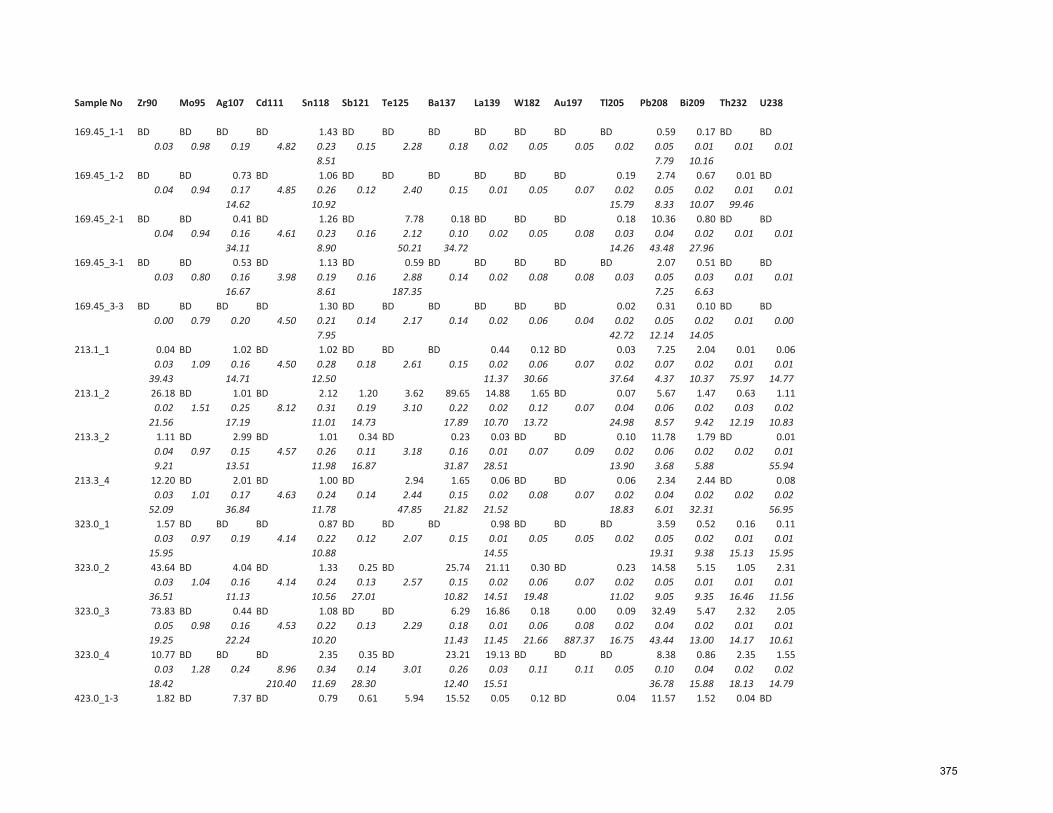
Sample No
169.45_1-1
169.45_1-2
169.45_2-1
169.45_3-1
169.45_3-3
213.1_1
213.1_2
213.3_2
213.3_4
323.0_1
323.0_2
323.0_3
323.0_4
423.0_1-3
Zr90 Mo95 Ag107 Cd111 Sn118 Sb121 Te125 Ba137 La139 W182 Au197 Tl205 Pb208 Bi209 Th232 U238
BD BD BD BD 1.43 BD BD BD BD BD BD BD 0.59 0.17 BD BD0.03 0.98 0.19 4.82 0.23 0.15 2.28 0.18 0.02 0.05 0.05 0.02 0.05 0.01 0.01 0.01
8.51 7.79 10.16BD BD 0.73 BD 1.06 BD BD BD BD BD BD 0.19 2.74 0.67 0.01 BD
0.04 0.94 0.17 4.85 0.26 0.12 2.40 0.15 0.01 0.05 0.07 0.02 0.05 0.02 0.01 0.0114.62 10.92 15.79 8.33 10.07 99.46
BD BD 0.41 BD 1.26 BD 7.78 0.18 BD BD BD 0.18 10.36 0.80 BD BD0.04 0.94 0.16 4.61 0.23 0.16 2.12 0.10 0.02 0.05 0.08 0.03 0.04 0.02 0.01 0.01
34.11 8.90 50.21 34.72 14.26 43.48 27.96BD BD 0.53 BD 1.13 BD 0.59 BD BD BD BD BD 2.07 0.51 BD BD
0.03 0.80 0.16 3.98 0.19 0.16 2.88 0.14 0.02 0.08 0.08 0.03 0.05 0.03 0.01 0.0116.67 8.61 187.35 7.25 6.63
BD BD BD BD 1.30 BD BD BD BD BD BD 0.02 0.31 0.10 BD BD0.00 0.79 0.20 4.50 0.21 0.14 2.17 0.14 0.02 0.06 0.04 0.02 0.05 0.02 0.01 0.00
7.95 42.72 12.14 14.050.04 BD 1.02 BD 1.02 BD BD BD 0.44 0.12 BD 0.03 7.25 2.04 0.01 0.060.03 1.09 0.16 4.50 0.28 0.18 2.61 0.15 0.02 0.06 0.07 0.02 0.07 0.02 0.01 0.01
39.43 14.71 12.50 11.37 30.66 37.64 4.37 10.37 75.97 14.7726.18 BD 1.01 BD 2.12 1.20 3.62 89.65 14.88 1.65 BD 0.07 5.67 1.47 0.63 1.110.02 1.51 0.25 8.12 0.31 0.19 3.10 0.22 0.02 0.12 0.07 0.04 0.06 0.02 0.03 0.02
21.56 17.19 11.01 14.73 17.89 10.70 13.72 24.98 8.57 9.42 12.19 10.831.11 BD 2.99 BD 1.01 0.34 BD 0.23 0.03 BD BD 0.10 11.78 1.79 BD 0.010.04 0.97 0.15 4.57 0.26 0.11 3.18 0.16 0.01 0.07 0.09 0.02 0.06 0.02 0.02 0.019.21 13.51 11.98 16.87 31.87 28.51 13.90 3.68 5.88 55.94
12.20 BD 2.01 BD 1.00 BD 2.94 1.65 0.06 BD BD 0.06 2.34 2.44 BD 0.080.03 1.01 0.17 4.63 0.24 0.14 2.44 0.15 0.02 0.08 0.07 0.02 0.04 0.02 0.02 0.02
52.09 36.84 11.78 47.85 21.82 21.52 18.83 6.01 32.31 56.951.57 BD BD BD 0.87 BD BD BD 0.98 BD BD BD 3.59 0.52 0.16 0.110.03 0.97 0.19 4.14 0.22 0.12 2.07 0.15 0.01 0.05 0.05 0.02 0.05 0.02 0.01 0.01
15.95 10.88 14.55 19.31 9.38 15.13 15.9543.64 BD 4.04 BD 1.33 0.25 BD 25.74 21.11 0.30 BD 0.23 14.58 5.15 1.05 2.310.03 1.04 0.16 4.14 0.24 0.13 2.57 0.15 0.02 0.06 0.07 0.02 0.05 0.01 0.01 0.01
36.51 11.13 10.56 27.01 10.82 14.51 19.48 11.02 9.05 9.35 16.46 11.5673.83 BD 0.44 BD 1.08 BD BD 6.29 16.86 0.18 0.00 0.09 32.49 5.47 2.32 2.050.05 0.98 0.16 4.53 0.22 0.13 2.29 0.18 0.01 0.06 0.08 0.02 0.04 0.02 0.01 0.01
19.25 22.24 10.20 11.43 11.45 21.66 887.37 16.75 43.44 13.00 14.17 10.6110.77 BD BD BD 2.35 0.35 BD 23.21 19.13 BD BD BD 8.38 0.86 2.35 1.550.03 1.28 0.24 8.96 0.34 0.14 3.01 0.26 0.03 0.11 0.11 0.05 0.10 0.04 0.02 0.02
18.42 210.40 11.69 28.30 12.40 15.51 36.78 15.88 18.13 14.791.82 BD 7.37 BD 0.79 0.61 5.94 15.52 0.05 0.12 BD 0.04 11.57 1.52 0.04 BD
375

Location Event Style Sample No Ti49 Cr53 Mn55 Fe57 Co59 Ni60 Cu65 Zn66 As75 Se82DL 0.74 1.29 0.74 13.33 0.25 0.25 1.16 0.61 2.72 7.10Precision(%) 25.13 39.77 14.19 3.35 3.45 3.43 19.65 10.84
St Ives 423.0_1-4 Conc. (ppm) 1381.03 25.31 226.70 635000.00 231.13 722.24 BD 21.06 BD 51.94DL 2.98 5.40 3.12 55.74 0.50 1.05 3.57 2.84 14.72 30.61Precision(%) 27.02 26.06 18.31 24.27 26.06 24.39 20.44 30.04
St Ives 423.0_2-1 Conc. (ppm) 6.28 BD 1.91 635000.00 160.72 559.40 BD 1.42 3.26 25.17DL 0.42 0.75 0.49 11.57 0.06 0.25 0.65 0.22 1.86 4.77Precision(%) 7.97 33.21 3.25 3.43 3.30 12.93 24.52 9.51
St Ives 423.0_2-2 Conc. (ppm) 68.97 0.31 3.37 635000.00 163.62 559.87 BD 1.29 2.90 31.42DL 0.74 1.12 0.55 11.55 0.06 0.99 0.83 0.43 2.45 6.12Precision(%) 8.86 152.04 41.07 3.25 3.32 3.31 21.36 38.81 10.68
St Ives 423.0_3-3 Conc. (ppm) 45.84 BD 18.17 635000.00 129.10 809.28 BD 1.20 4.19 26.83DL 0.54 1.25 0.64 10.16 0.05 0.21 0.67 0.51 3.07 6.01Precision(%) 14.81 14.55 2.82 3.01 2.98 22.04 28.26 10.21
Golden Mile Chron. Samples Synvolcanic sulfide LG106_1-1 Conc. (ppm) 7.37 BD 5039.45 635000.00 26.70 1122.73 2.85 6.84 319.06 30.34DL 0.80 1.65 1.01 16.50 0.15 0.42 1.69 0.77 1.29 13.94Precision(%) 11.48 10.46 6.08 25.83 7.50 24.99 14.09 14.29 19.68
Golden Mile Chron. Samples Synvolcanic sulfide LG106_1-2 Conc. (ppm) 48.60 99.07 182.82 635000.00 42.51 1089.01 6.51 70.62 1127.11 36.75DL 0.98 1.78 1.23 18.27 0.12 0.39 1.70 0.72 1.18 11.84Precision(%) 16.44 19.97 18.51 7.73 12.64 8.69 32.72 19.51 12.77 16.10
Golden Mile Chron. Samples Synvolcanic sulfide LG106_4-1 Conc. (ppm) 16.50 BD 8.37 635000.00 0.05 1289.84 1.75 1.15 BD 29.76DL 0.94 1.56 1.06 12.55 0.10 0.32 1.49 0.64 1.18 8.68Precision(%) 17.10 16.41 2.69 79.11 2.68 33.60 27.33 12.50
376

Sample No
423.0_1-4
423.0_2-1
423.0_2-2
423.0_3-3
LG106_1-1
LG106_1-2
LG106_4-1
Zr90 Mo95 Ag107 Cd111 Sn118 Sb121 Te125 Ba137 La139 W182 Au197 Tl205 Pb208 Bi209 Th232 U2380.05 1.02 0.12 3.81 0.29 0.11 2.58 0.10 0.01 0.06 0.06 0.02 0.06 0.03 0.01 0.02
39.81 27.32 15.40 14.09 35.47 25.02 19.54 32.55 27.17 5.19 5.47 32.97283.28 BD 0.78 BD 3.87 0.81 BD 407.37 7.69 0.49 BD 0.20 9.98 0.35 8.81 4.50
0.17 4.53 0.45 21.05 0.93 0.41 11.52 0.50 0.07 0.39 0.24 0.12 0.17 0.11 0.04 0.0630.78 36.08 20.50 31.50 19.98 24.19 44.43 34.32 18.10 30.47 28.35 27.72
0.06 BD 0.16 BD 0.76 BD BD 0.75 0.02 BD BD BD 1.01 0.15 BD BD0.03 0.75 0.13 3.69 0.14 0.12 1.77 0.10 0.01 0.04 0.05 0.02 0.04 0.01 0.01 0.01
35.14 33.35 9.35 24.96 41.93 6.90 9.380.02 BD 0.20 2.74 0.80 BD BD BD 0.02 0.11 BD 0.02 1.77 0.28 BD 0.020.03 0.78 0.14 3.30 0.14 0.14 1.88 0.17 0.01 0.05 0.06 0.02 0.05 0.02 0.01 0.01
80.55 42.67 54.81 11.45 49.57 37.92 50.26 10.30 13.63 66.0417.42 BD 0.31 1.27 0.48 0.21 BD 4.97 0.03 BD BD 0.05 3.83 0.49 0.57 0.280.02 0.86 0.18 3.56 0.19 0.09 2.19 0.14 0.02 0.06 0.07 0.02 0.05 0.02 0.01 0.01
29.49 26.20 114.77 17.80 25.18 20.84 30.24 22.64 13.26 8.39 31.67 31.3032.48 BD 2.14 BD 3.29 3.50 BD 0.63 1.37 0.16 1.21 BD 22.62 12.33 0.05 0.230.04 1.06 0.16 5.57 0.33 0.15 4.42 0.21 0.02 0.08 0.10 0.03 0.06 0.02 0.02 0.02
18.91 12.27 10.16 11.51 21.92 12.52 39.17 78.79 11.38 11.16 31.82 25.093.53 BD 2.41 7.41 1.67 2.57 BD 0.06 0.09 BD 0.25 BD 16.46 10.41 BD BD0.05 1.30 0.28 6.03 0.34 0.23 3.79 0.19 0.02 0.07 0.05 0.03 0.05 0.03 0.02 0.02
37.95 11.55 31.66 10.75 12.72 137.61 23.37 22.71 11.48 10.580.85 BD 0.43 BD 1.54 BD BD BD BD 0.12 0.05 BD 2.32 0.63 0.02 0.010.03 0.94 0.25 6.20 0.28 0.16 3.10 0.14 0.02 0.07 0.05 0.03 0.05 0.02 0.02 0.01
23.35 26.85 9.06 32.50 46.02 13.35 10.62 48.19 71.87
377

Location Event Style Sample No Ti49 Cr53 Mn55 Fe57 Co59 Ni60 Cu65 Zn66 As75 Se82
New Celebration Stage I Porphyry 1213279_5-1 Conc. (ppm) 5820.78 892.40 155.75 325633.11 255.56 1939.55 467.35 253.02 BD BDDL 16.73 64.17 35.02 466.06 3.90 16.78 51.60 30.37 39.05 321.03Precision(%) 20.04 20.26 20.94 18.66 19.53 18.01 24.86 20.16
New Celebration Stage I Porphyry 1213279_5-2 Conc. (ppm) 2579.06 568.53 40.87 19865.24 BD 362.70 613.88 114.02 BD BDDL 8.01 24.12 22.71 296.54 2.19 10.89 30.29 9.42 17.44 156.70Precision(%) 21.71 23.14 34.40 21.93 22.54 23.12 28.12
New Celebration Stage I Porphyry 1213279_5-3 Conc. (ppm) 154.21 135.68 BD 1596.21 BD BD 678.68 BD BD BDDL 51.22 125.90 105.69 1077.47 11.98 30.73 110.98 54.58 106.22 970.15Precision(%) 29.52 43.55 34.71 27.15
New Celebration Stage II Facture 1213359_1-1 Conc. (ppm) 17.88 BD BD 384965.50 176.45 735.44 78.95 BD BD BDDL 12.62 18.71 16.75 198.98 1.88 6.26 17.28 10.72 18.97 164.06Precision(%) 55.93 43.80 43.85 43.86 49.24
New Celebration Stage II Facture 1213359_2-1 Conc. (ppm) 486.59 BD BD 583068.25 16.22 57.43 145.22 BD BD BDDL 10.64 28.55 16.52 230.92 2.54 11.42 28.12 13.41 21.40 195.29Precision(%) 30.04 27.10 28.85 29.47 31.64
New Celebration Stage II Facture 1213359_3-1 Conc. (ppm) BD BD BD 363.12 BD BD 120.94 BD BD BDDL 18.80 33.60 25.22 328.24 3.18 11.50 33.50 27.00 30.10 314.27Precision(%) 40.01 26.79
New Celebration Stage II Facture 1213359_4-1 Conc. (ppm) BD BD BD 384710.90 32.83 99.99 230.32 BD BD BDDL 80.46 136.63 103.39 1215.46 10.64 40.49 122.50 64.21 86.58 953.85Precision(%) 17.44 26.11 26.37 26.25
New Celebration Stage II Contact 1250_12-18_5-1 Conc. (ppm) 8.24 BD BD 248826.33 300.46 2893.68 499.87 BD 18.89 BDDL 12.30 27.27 19.34 318.21 2.32 7.05 24.18 19.63 22.70 184.15Precision(%) 70.11 20.12 20.76 20.26 21.74 51.46
Golden Mile Fimiston Depth D14_1-1 Conc. (ppm) BD BD 9664.44 200477.95 BD 7.24 1226.60 203.21 BD BDDL 4.93 11.68 5.87 87.59 0.54 3.39 6.59 3.99 27.30 71.57Precision(%) 403.41 36.42 36.41 48.32 47.34 38.16
Golden Mile Fimiston Depth D14_1-2 Conc. (ppm) 54.05 BD BD 2314245.17 69.70 488.69 2739.54 120.02 8207.99 585.64DL 16.71 28.89 26.77 393.65 2.78 9.25 36.42 15.59 108.19 261.56Precision(%) 33.91 26.90 30.66 27.67 29.91 36.22 29.79 32.79
Golden Mile Fimiston Depth D14_1-3 Conc. (ppm) 5256.80 BD 75901.98 5361515.94 343.04 3077.14 4523.14 3649.57 13964.05 BDDL 199.34 271.15 177.53 2855.40 19.64 66.76 264.03 118.82 719.59 1794.52Precision(%) 17.75 15.72 12.54 16.95 14.62 16.12 13.32 16.40
Golden Mile Chron. Samples Fimiston Stage III LGX_1-1 Conc. (ppm) BD BD BD BD BD BD 913.89 BD BD BDDL 7.17 7.17 4.43 114.25 0.55 1.27 6.63 2.37 20.99 47.65Precision(%) 26.67
Golden Mile Chron. Samples Fimiston Stage III LGX_1-2 Conc. (ppm) 73.04 BD BD 1908.38 BD BD 384.75 12.81 14.97 BDDL 4.15 4.10 2.44 40.88 0.27 1.13 3.49 1.98 11.96 34.29Precision(%) 19.41 16.28 22.24 36.73
Golden Mile Chron. Samples Fimiston Stage III LGX_1-3 Conc. (ppm) 94.63 BD BD 2076.82 BD BD 664.65 11.34 BD 122.42DL 3.01 5.38 2.87 40.38 0.35 1.90 4.87 1.80 16.38 40.61Precision(%) 16.05 16.05 15.77 22.81 26.54
378

Sample No
1213279_5-1
1213279_5-2
1213279_5-3
1213359_1-1
1213359_2-1
1213359_3-1
1213359_4-1
1250_12-18_5-1
D14_1-1
D14_1-2
D14_1-3
LGX_1-1
LGX_1-2
LGX_1-3
Zr90 Mo95 Ag107 Cd111 Sn118 Sb121 Te125 Ba137 La139 W182 Au197 Tl205 Pb208 Bi209 Th232 U238
9.19 BD 68921.27 BD BD 34.35 134.45 2354.04 BD BD 900000.00 1.03 191.29 164.47 BD BD1.92 40.65 9.45 234.47 9.23 6.40 98.72 7.33 0.34 2.20 5.12 0.81 2.61 1.34 0.60 0.66
25.41 24.30 25.59 39.03 20.13 24.50 41.66 22.83 21.296.85 BD 69547.83 BD BD BD BD 771.40 BD BD 900000.00 BD 35.21 5.06 0.22 0.440.74 17.77 3.89 87.61 4.37 3.76 44.54 4.35 0.32 1.45 0.00 0.65 1.21 0.67 0.21 0.36
30.15 22.02 20.83 22.27 57.44 25.26 67.53 58.528.85 BD 57386.79 BD BD BD BD 77.86 BD BD 900000.00 BD 26.61 4.94 BD BD7.02 86.40 21.33 464.75 24.00 19.08 220.66 16.10 2.14 8.46 13.13 3.29 8.17 3.37 2.67 1.95
50.87 26.41 25.23 25.42 29.71 48.01BD BD 41496.53 BD BD BD BD BD BD BD 900000.00 BD 52.51 6.73 BD BD
0.42 12.68 3.38 62.59 3.86 2.77 42.21 2.42 0.27 1.20 0.00 0.45 1.38 0.42 0.31 0.2446.86 61.45 45.41 47.52
45.43 BD 76126.91 BD BD BD BD BD 2.01 32.01 900000.00 BD 40.65 44.88 1.73 0.730.61 21.29 4.90 96.20 4.91 3.01 54.18 2.45 0.31 1.77 0.00 0.67 1.66 0.57 0.37 0.29
34.11 30.47 57.45 30.79 37.66 29.06 28.42 46.40 43.9553.50 BD 87915.76 BD BD BD BD 1166.81 BD BD 900000.00 BD 87.17 288.93 1.79 3.311.43 18.69 5.91 96.64 7.32 4.59 56.67 4.31 0.43 1.77 2.08 1.07 1.62 0.93 0.36 0.46
30.02 17.07 17.15 16.37 17.17 20.81 22.77 19.9726.31 BD 70115.66 BD BD 16.56 BD BD BD BD 900000.00 BD 315.25 31.55 BD BD2.91 87.45 16.66 544.65 22.70 14.38 184.83 6.84 1.48 9.43 11.76 4.07 8.56 2.53 1.52 1.38
98.84 15.37 40.04 14.57 15.25 21.330.23 BD 79358.52 BD BD BD BD BD BD BD 900000.00 BD 2.24 5.23 BD BD0.00 18.09 15.63 118.91 6.45 3.08 61.09 3.99 0.25 1.43 0.00 0.82 1.58 0.94 0.41 0.38
52.58 21.02 25.10 38.21 23.89BD BD 70228.55 BD 2.34 BD 20.05 BD 0.25 BD 900000.00 BD 2.47 0.29 BD BD
0.13 8.31 1.39 41.25 1.97 0.99 24.23 0.86 0.12 0.57 0.00 0.19 0.37 0.20 0.07 0.1147.89 53.33 67.91 58.15 50.26 39.98 57.29
BD BD 76319.29 BD 11.85 21.76 4329.11 BD BD BD 900000.00 BD 44.13 5.97 BD BD1.16 34.29 7.29 157.04 6.36 4.12 98.49 6.35 0.69 1.70 96145.51 1.09 1.61 1.15 0.32 0.39
37.26 35.96 30.70 28.29 37.66 29.02 33.43BD BD 54802.29 BD BD 55.00 2473.30 BD 7.03 52.18 900000.00 BD 171.37 40.88 BD BD
6.64 336.87 51.23 1287.53 63.50 24.73 785.29 41.21 1.56 16.77 30.65 8.28 11.11 5.52 3.12 3.7913.03 28.92 24.48 22.91 46.46 14.03 17.46 17.67
BD BD 43290.82 BD 1.50 1.55 BD BD BD BD 900000.00 BD BD BD BD BD0.16 6.50 1.02 35.01 1.38 0.72 15.32 0.97 0.11 0.55 0.00 0.18 0.23 0.17 0.05 0.08
26.64 42.67 31.61 28.700.11 BD 50791.22 BD 4.15 2.63 BD 0.74 BD 0.52 900000.00 BD 0.83 BD BD BD0.08 4.85 1.18 18.04 0.94 0.36 9.19 0.39 0.05 0.15 0.00 0.09 0.22 0.12 0.04 0.06
43.11 15.46 22.20 21.12 45.47 26.32 17.65 21.740.41 BD 44887.93 BD 2.69 2.14 416058.54 71.78 BD BD 900000.00 0.57 14.59 BD BD 0.080.12 4.60 1.75 24.34 1.02 0.78 11.66 0.44 0.06 0.37 0.00 0.10 0.24 0.10 0.07 0.06
24.24 17.13 23.72 24.30 22.44 16.81 18.66 20.94 37.00 40.33
379

Location Event Style Sample No Ti49 Cr53 Mn55 Fe57 Co59 Ni60 Cu65 Zn66 As75 Se82Golden Mile Chron. Samples Fimiston Stage III LGX_1-4 Conc. (ppm) 12.44 BD BD 5144.76 BD BD 50788.53 7689.88 24290.86 83.20
DL 4.46 6.86 3.84 60.03 0.47 1.68 5.19 3.07 15.09 44.88Precision(%) 34.27 33.19 34.06 36.04 36.58 42.17
Golden Mile Western Lode Lake View LV46_3-1 Conc. (ppm) 111.34 6.85 15.29 17579.25 2.62 387.41 433.63 155.87 253.62 BDDL 1.52 2.34 1.01 18.33 0.16 0.59 1.78 0.94 5.75 19.43Precision(%) 22.96 26.26 20.01 15.50 19.01 21.77 15.99 22.27 19.33
Golden Mile Western Lode Lake View LV46_3-2 Conc. (ppm) 6.96 BD BD 251542.01 350.95 12.52 297.03 BD 275.76 BDDL 2.05 5.65 4.41 64.75 0.45 2.50 5.57 2.28 19.35 50.00Precision(%) 49.80 42.37 43.87 44.47 44.73 9292.65 42.82
Golden Mile Eastern Lode Oroya OR3_3 Conc. (ppm) BD BD BD 1671.18 2.16 527.38 203.52 BD BD BDDL 4.30 9.79 6.54 67.71 0.55 1.04 6.34 3.43 20.92 88.77Precision(%) 98.07 29.55 24.46 26.91
380

Sample NoLGX_1-4
LV46_3-1
LV46_3-2
OR3_3
Zr90 Mo95 Ag107 Cd111 Sn118 Sb121 Te125 Ba137 La139 W182 Au197 Tl205 Pb208 Bi209 Th232 U2380.27 BD 38653.57 47.67 1.63 6044.99 215381.00 9.80 BD BD 900000.00 0.28 10.65 0.81 BD BD0.20 5.52 2.78 26.71 1.24 0.67 26.59 0.94 0.12 0.58 0.00 0.20 0.20 0.13 0.08 0.06
45.17 27.23 33.41 37.80 35.72 37.14 26.28 29.87 44.51 31.39 37.171.33 BD 46129.25 BD 20.92 1.61 31.10 2.41 0.03 1.68 900000.00 BD 7.01 0.05 BD BD0.00 1.91 0.37 8.67 0.48 0.26 5.12 0.28 0.03 0.09 0.00 0.06 0.09 0.03 0.02 0.02
22.96 16.32 38.62 21.79 17.86 27.98 51.21 22.10 17.19 19.82 39.09BD BD 39235.27 BD BD BD 26.91 BD BD BD 900000.00 BD 8.70 BD BD BD
0.23 6.57 1.00 35.62 1.32 0.74 14.48 0.76 0.12 0.44 0.00 0.16 0.29 0.10 0.10 0.0844.57 51.37 56.62 43.16
BD BD 106435.99 BD 3.59 159077.09 530234.54 1.78 BD BD 900000.00 0.44 2400.31 0.41 BD BD0.21 7.14 1.45 37.97 1.68 0.79 13.08 0.82 0.14 0.59 6.18 0.18 0.36 0.16 0.13 0.07
26.88 26.06 24.94 24.18 39.12 24.01 34.80 25.26 33.12
381

APPENDICES
382
APPENDIX 9 Whole-Rock Geochemistry –
Methodology And Results

Lab Number Sample Number Drill Hole From (m) To (m) Comment Method SiO2 (%) Al2O3
(%)Fe2O3
(%)MgO (%) CaO (%)
Na2O (%)
K2O (%)
TiO2
(%)P2O5
(%)NCGCH-001 HBW_1250_12-018 HBW_1250_12 264.20 264.40 Contact Style Mineralisation 4A 10.90 4.71 12.19 17.79 21.63 0.14 2.50 0.35 0.02NCGCH-002 HBW_1250_12-019 HBW_1250_12 264.50 264.60 Contact Style Mineralisation 4A 10.93 4.46 11.38 17.59 22.44 0.25 2.19 0.29 0.01NCGCH-003 JD0475-024 JD0475 223.60 223.80 Contact Style Mineralisation 4A 57.46 11.39 4.06 4.21 6.17 6.67 0.20 0.48 0.05NCGCH-004 1213372 JD0433 168.80 168.90 Contact Style Mineralisation 4A 42.78 9.60 10.42 13.90 5.64 0.94 5.21 0.39 0.01NCGCH-005 JD0475-021 JD0475 208.90 209.00 Porphyry Style Mineralisation 4A 51.40 13.07 5.56 5.16 5.50 6.25 1.54 0.53 0.21NCGCH-006 JD0475-022 JD0475 211.70 211.90 Porphyry Style Mineralisation 4A 54.90 11.16 5.01 5.04 6.87 5.93 0.72 0.44 0.24NCGCH-007 HBW_1250_12-007 HBW_1250_12 213.90 214.00 Porphyry Style Mineralisation 4A 62.12 14.65 5.20 2.27 3.03 7.14 0.76 0.49 0.10NCGCH-008 1213374 JD0433 172.20 172.30 Porphyry Style Mineralisation 4A 56.21 9.80 4.22 4.97 7.80 5.61 0.24 0.37 0.04NCGCH-009 1213373 JD0433 169.50 169.70 Porphyry Style Mineralisation 4A 46.54 12.99 7.30 8.27 6.23 5.69 2.46 0.59 0.17NCGCH-010 1213297 JD0433 192.00 192.10 Porphyry Style Mineralisation 4A 54.03 14.39 5.54 4.93 5.45 8.25 0.49 0.65 0.20NCGCH-011 1213282 JD236 130.25 130.60 Porphyry Style Mineralisation 4A 49.70 13.76 6.87 6.31 5.68 6.76 1.74 0.60 0.26NCGCH-012 HBW_1250_12-022 HBW_1250_12 306.20 306.60 Fracture Style Mineralisation 4A 69.14 14.34 1.41 0.80 1.94 4.73 4.20 0.19 0.14NCGCH-013 HBW_1250_12-023 HBW_1250_12 307.10 307.30 Fracture Style Mineralisation 4A 65.69 13.33 1.48 1.55 3.25 4.79 3.97 0.17 0.39NCGCH-014 HBW_1250_12-024 HBW_1250_12 309.60 309.80 Fracture Style Mineralisation 4A 21.38 6.62 12.14 16.10 17.96 0.11 3.82 0.31 0.01NCGCH-015 1213256 HBC_1225_13 231.30 231.50 Fracture Style Mineralisation 4A 65.57 18.76 1.06 0.74 1.01 7.71 2.03 0.21 0.16NCGCH-016 1213356 JD433 137.80 137.90 Fracture Style Mineralisation 4A 69.68 15.16 0.98 0.73 1.29 6.34 3.62 0.19 0.11NCGCH-017 1213245 HBC_1225_13 131.10 131.40 Mylonite Style Mineralisation 4A 51.91 11.83 7.09 4.60 6.72 6.22 1.38 0.59 0.12NCGCH-018 1213221 Pit Sample Mylonite Style Mineralisation 4A 44.06 12.13 9.69 6.56 8.36 1.64 4.02 0.56 0.06NCGCH-019 1213248 HBC_1225_13 136.20 136.50 Mylonite Style Mineralisation 4A 44.70 12.84 14.98 5.89 4.17 5.10 3.74 1.60 0.42NCGCH-020 HBC_1450_12-002 HBC_1450_12-002 282.70 282.90 Least Altered M2 Porphyry 4A 71.03 15.24 1.34 0.63 1.36 7.00 1.25 0.19 0.09NCGCH-021 HBC_1450_12-003 HBC_1450_12-003 281.40 281.50 Least Altered M2 Porphyry 4A 72.11 14.58 1.55 0.66 1.31 5.87 1.52 0.18 0.09NCGCH-022 Pit Sample Least Altered M2 Porphyry 4A 74.21 13.63 1.14 0.76 1.10 5.51 1.57 0.18 0.17NCGCH-023 Pit Sample Least Altered M1 Porphyry 4A 51.28 12.36 6.65 6.66 6.15 5.12 2.32 0.58 0.34NCGCH-024 HBW_1250_12-029 HBW_1250_12 344.50 344.80 Least Altered Ultramafic 4A 44.13 8.05 11.13 21.34 7.22 0.26 1.04 0.33 0.04NCGCH-025 HBW_1250_12-030 HBW_1250_12 346.80 347.00 Least Altered Ultramafic 4A 41.66 6.82 10.17 21.59 7.97 0.63 0.35 0.28 0.04NCGCH-026 133573 Pit Sample Least Altered Ultramafic 4A 42.26 8.16 12.49 20.99 6.98 0.31 2.55 0.34 0.04NCGCH-027 1213288 JD433 186.40 186.60 Least Altered Ultramafic 4A 38.22 4.24 9.10 29.04 1.91 0.06 0.14 0.17 0.02NCGCH-028 1213266 JD236 76.25 76.50 Least Altered Hanging Wall Dolerite 4A 47.16 14.24 13.49 7.64 9.70 2.30 0.11 0.90 0.08NCGCH-029 JD0475-002 JD0475 82.00 82.30 Least Altered Hanging Wall Dolerite 4A 46.26 14.16 12.66 10.89 9.78 1.81 0.28 0.70 0.05NCGCH-030 JD0475-003 JD0475 95.50 96.00 Least Altered Hanging Wall Dolerite 4A 45.80 14.81 13.60 10.63 8.38 1.99 0.23 0.71 0.06NCGCH-031 HBW1250_12-001 HBW1250_12 183.00 183.10 Least Altered MgB 4A 42.39 12.68 15.17 4.81 8.31 2.99 2.16 1.73 0.24NCGCH-032 HBW1250_12-002 HBW1250_12 186.20 186.50 Least Altered MgB 4A 44.94 13.00 15.77 5.33 8.16 2.04 1.29 1.71 0.24NCGCH-033 HBW_1250_12-029 HBW_1250_12 344.50 344.80 Duplicates 4A 44.86 7.83 10.80 21.12 7.68 0.25 0.76 0.33 0.02NCGCH-034 1213245 HBC_1225_13 131.10 131.40 Duplicates 4A 55.37 13.52 7.93 3.64 3.05 7.67 0.50 0.87 0.27
RE NCGCH-027 Repeat 4A 37.94 4.18 9.20 29.25 1.93 0.06 0.13 0.17 0.02RRE NCGCH-027 Reject Repeat 4A 38.09 4.21 9.31 29.30 1.90 0.05 0.13 0.17 0.02STANDARD SO-18/R-2a/CSB 4A 57.74 14.34 7.82 3.30 6.37 3.80 2.14 0.68 0.83STANDARD SO-18/R-2a/CSB 4A 58.14 14.16 7.63 3.34 6.39 3.70 2.17 0.69 0.83
383
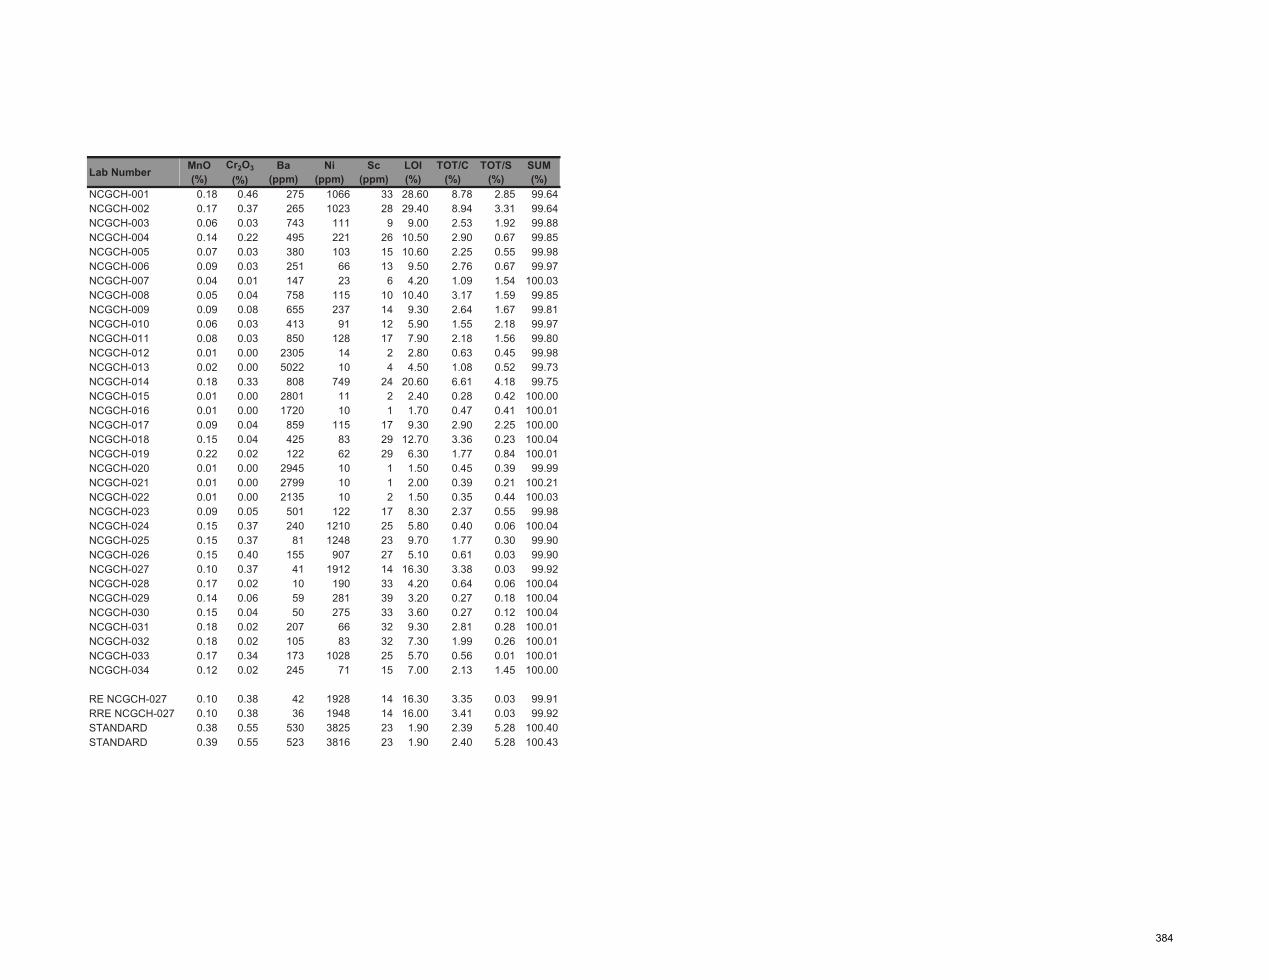
Lab Number
NCGCH-001NCGCH-002NCGCH-003NCGCH-004NCGCH-005NCGCH-006NCGCH-007NCGCH-008NCGCH-009NCGCH-010NCGCH-011NCGCH-012NCGCH-013NCGCH-014NCGCH-015NCGCH-016NCGCH-017NCGCH-018 NCGCH-019NCGCH-020NCGCH-021NCGCH-022 NCGCH-023 NCGCH-024NCGCH-025NCGCH-026 NCGCH-027NCGCH-028NCGCH-029NCGCH-030NCGCH-031NCGCH-032NCGCH-033NCGCH-034
RE NCGCH-027RRE NCGCH-027STANDARD STANDARD
MnO (%)
Cr2O3
(%)Ba
(ppm)Ni
(ppm)Sc
(ppm)LOI (%)
TOT/C (%)
TOT/S (%)
SUM (%)
0.18 0.46 275 1066 33 28.60 8.78 2.85 99.640.17 0.37 265 1023 28 29.40 8.94 3.31 99.640.06 0.03 743 111 9 9.00 2.53 1.92 99.880.14 0.22 495 221 26 10.50 2.90 0.67 99.850.07 0.03 380 103 15 10.60 2.25 0.55 99.980.09 0.03 251 66 13 9.50 2.76 0.67 99.970.04 0.01 147 23 6 4.20 1.09 1.54 100.030.05 0.04 758 115 10 10.40 3.17 1.59 99.850.09 0.08 655 237 14 9.30 2.64 1.67 99.810.06 0.03 413 91 12 5.90 1.55 2.18 99.970.08 0.03 850 128 17 7.90 2.18 1.56 99.800.01 0.00 2305 14 2 2.80 0.63 0.45 99.980.02 0.00 5022 10 4 4.50 1.08 0.52 99.730.18 0.33 808 749 24 20.60 6.61 4.18 99.750.01 0.00 2801 11 2 2.40 0.28 0.42 100.000.01 0.00 1720 10 1 1.70 0.47 0.41 100.010.09 0.04 859 115 17 9.30 2.90 2.25 100.000.15 0.04 425 83 29 12.70 3.36 0.23 100.040.22 0.02 122 62 29 6.30 1.77 0.84 100.010.01 0.00 2945 10 1 1.50 0.45 0.39 99.990.01 0.00 2799 10 1 2.00 0.39 0.21 100.210.01 0.00 2135 10 2 1.50 0.35 0.44 100.030.09 0.05 501 122 17 8.30 2.37 0.55 99.980.15 0.37 240 1210 25 5.80 0.40 0.06 100.040.15 0.37 81 1248 23 9.70 1.77 0.30 99.900.15 0.40 155 907 27 5.10 0.61 0.03 99.900.10 0.37 41 1912 14 16.30 3.38 0.03 99.920.17 0.02 10 190 33 4.20 0.64 0.06 100.040.14 0.06 59 281 39 3.20 0.27 0.18 100.040.15 0.04 50 275 33 3.60 0.27 0.12 100.040.18 0.02 207 66 32 9.30 2.81 0.28 100.010.18 0.02 105 83 32 7.30 1.99 0.26 100.010.17 0.34 173 1028 25 5.70 0.56 0.01 100.010.12 0.02 245 71 15 7.00 2.13 1.45 100.00
0.10 0.38 42 1928 14 16.30 3.35 0.03 99.910.10 0.38 36 1948 14 16.00 3.41 0.03 99.920.38 0.55 530 3825 23 1.90 2.39 5.28 100.400.39 0.55 523 3816 23 1.90 2.40 5.28 100.43
384

Lab Number Sample Number Drill Hole From (m) To (m) Comment Method Cs (ppm)
Ga (ppm)
Hf (ppm)
Nb (ppm)
Rb (ppm)
Sn (ppm)
Sr (ppm)
NCGCH-001 HBW_1250_12-018 HBW_1250_12 264.20 264.40 Contact Style Mineralisation 4B 7.5 20.8 0.9 1.3 76.0 1 2043.2NCGCH-002 HBW_1250_12-019 HBW_1250_12 264.50 264.60 Contact Style Mineralisation 4B 5.9 15.3 0.6 1.1 68.9 1 2227.5NCGCH-003 JD0475-024 JD0475 223.60 223.80 Contact Style Mineralisation 4B 0.3 17.6 3.1 3.0 5.4 <1 563.9NCGCH-004 1213372 JD0433 168.80 168.90 Contact Style Mineralisation 4B 2.5 9.5 0.8 0.7 83.5 <1 521.4NCGCH-005 JD0475-021 JD0475 208.90 209.00 Porphyry Style Mineralisation 4B 3.7 17.5 3.2 2.9 36.8 <1 702.2NCGCH-006 JD0475-022 JD0475 211.70 211.90 Porphyry Style Mineralisation 4B 1.5 15.7 2.4 2.1 15.9 <1 751.4NCGCH-007 HBW_1250_12-007 HBW_1250_12 213.90 214.00 Porphyry Style Mineralisation 4B 1.9 17.0 3.8 5.3 30.2 2 189.7NCGCH-008 1213374 JD0433 172.20 172.30 Porphyry Style Mineralisation 4B 0.2 15.1 2.3 2.1 4.6 <1 845.7NCGCH-009 1213373 JD0433 169.50 169.70 Porphyry Style Mineralisation 4B 0.8 18.1 4.1 3.4 36.3 <1 796.8NCGCH-010 1213297 JD0433 192.00 192.10 Porphyry Style Mineralisation 4B 1.1 21.1 4.2 4.0 12.1 <1 639.3NCGCH-011 1213282 JD236 130.25 130.60 Porphyry Style Mineralisation 4B 4.6 17.3 2.9 2.2 48.2 <1 970.6NCGCH-012 HBW_1250_12-022 HBW_1250_12 306.20 306.60 Fracture Style Mineralisation 4B 0.7 20.5 3.4 1.4 53.7 <1 680.8NCGCH-013 HBW_1250_12-023 HBW_1250_12 307.10 307.30 Fracture Style Mineralisation 4B 0.8 21.0 3.4 1.5 52.0 <1 2874.5NCGCH-014 HBW_1250_12-024 HBW_1250_12 309.60 309.80 Fracture Style Mineralisation 4B 3.1 16.7 0.6 0.6 81.5 <1 1422.8NCGCH-015 1213256 HBC_1225_13 231.30 231.50 Fracture Style Mineralisation 4B 1.2 30.5 3.8 1.7 34.5 <1 618.5NCGCH-016 1213356 JD433 137.80 137.90 Fracture Style Mineralisation 4B 0.4 22.6 3.3 1.6 37.4 <1 530.2NCGCH-017 1213245 HBC_1225_13 131.10 131.40 Mylonite Style Mineralisation 4B 1.7 17.6 2.6 2.6 14.5 1 408.7NCGCH-018 1213221 Pit Sample Mylonite Style Mineralisation 4B 5.0 13.5 1.7 2.6 109.1 <1 295.8NCGCH-019 1213248 HBC_1225_13 136.20 136.50 Mylonite Style Mineralisation 4B 0.8 17.0 3.3 5.2 53.4 <1 155.8NCGCH-020 HBC_1450_12-002 HBC_1450_12-002 282.70 282.90 Least Altered M2 Porphyry 4B 0.7 22.0 3.5 1.7 25.3 <1 724.3NCGCH-021 HBC_1450_12-003 HBC_1450_12-003 281.40 281.50 Least Altered M2 Porphyry 4B 1.0 21.7 3.0 1.6 34.2 <1 831.7NCGCH-022 Pit Sample Least Altered M2 Porphyry 4B 1.0 20.7 2.8 1.4 27.8 <1 481.7NCGCH-023 Pit Sample Least Altered M1 Porphyry 4B 12.1 16.7 3.1 3.3 71.2 <1 513.6NCGCH-024 HBW_1250_12-029 HBW_1250_12 344.50 344.80 Least Altered Ultramafic 4B 7.8 9.1 0.6 0.6 34.3 <1 84.3NCGCH-025 HBW_1250_12-030 HBW_1250_12 346.80 347.00 Least Altered Ultramafic 4B 2.3 7.8 0.6 0.6 10.4 <1 252.3NCGCH-026 133573 Pit Sample Least Altered Ultramafic 4B 24.2 8.7 0.7 <.5 75.1 <1 31.7NCGCH-027 1213288 JD433 186.40 186.60 Least Altered Ultramafic 4B 0.9 4.9 <.5 <.5 4.3 <1 34.3NCGCH-028 1213266 JD236 76.25 76.50 Least Altered Hanging Wall Dolerite 4B 0.1 17.3 1.7 2.1 0.8 <1 112.8NCGCH-029 JD0475-002 JD0475 82.00 82.30 Least Altered Hanging Wall Dolerite 4B 1.2 17.1 1.5 1.7 8.2 <1 130.5NCGCH-030 JD0475-003 JD0475 95.50 96.00 Least Altered Hanging Wall Dolerite 4B 0.8 16.0 1.4 1.6 6.4 <1 127.2NCGCH-031 HBW1250_12-001 HBW1250_12 183.00 183.10 Least Altered MgB 4B 3.1 16.7 3.5 5.2 62.8 <1 111.0NCGCH-032 HBW1250_12-002 HBW1250_12 186.20 186.50 Least Altered MgB 4B 1.7 17.6 3.8 5.1 37.6 <1 122.5NCGCH-033 HBW_1250_12-029 HBW_1250_12 344.50 344.80 Duplicates 4B 5.9 7.7 0.7 0.7 22.9 <1 100.2NCGCH-034 1213245 HBC_1225_13 131.10 131.40 Duplicates 4B 3.3 17.3 2.7 4.2 14.6 <1 229.7
RE NCGCH-027 Repeat 4B 1 5 <.5 <.5 3.9 <1 37.6RRE NCGCH-027 Reject Repeat 4B 1 5.6 <.5 <.5 4.4 <1 37.2STANDARD SO-18 4B 6.9 18 10.3 20.1 27.5 13 410.8STANDARD SO-18 4B 7.3 17.8 10.2 20.1 29.2 13 409.8
385
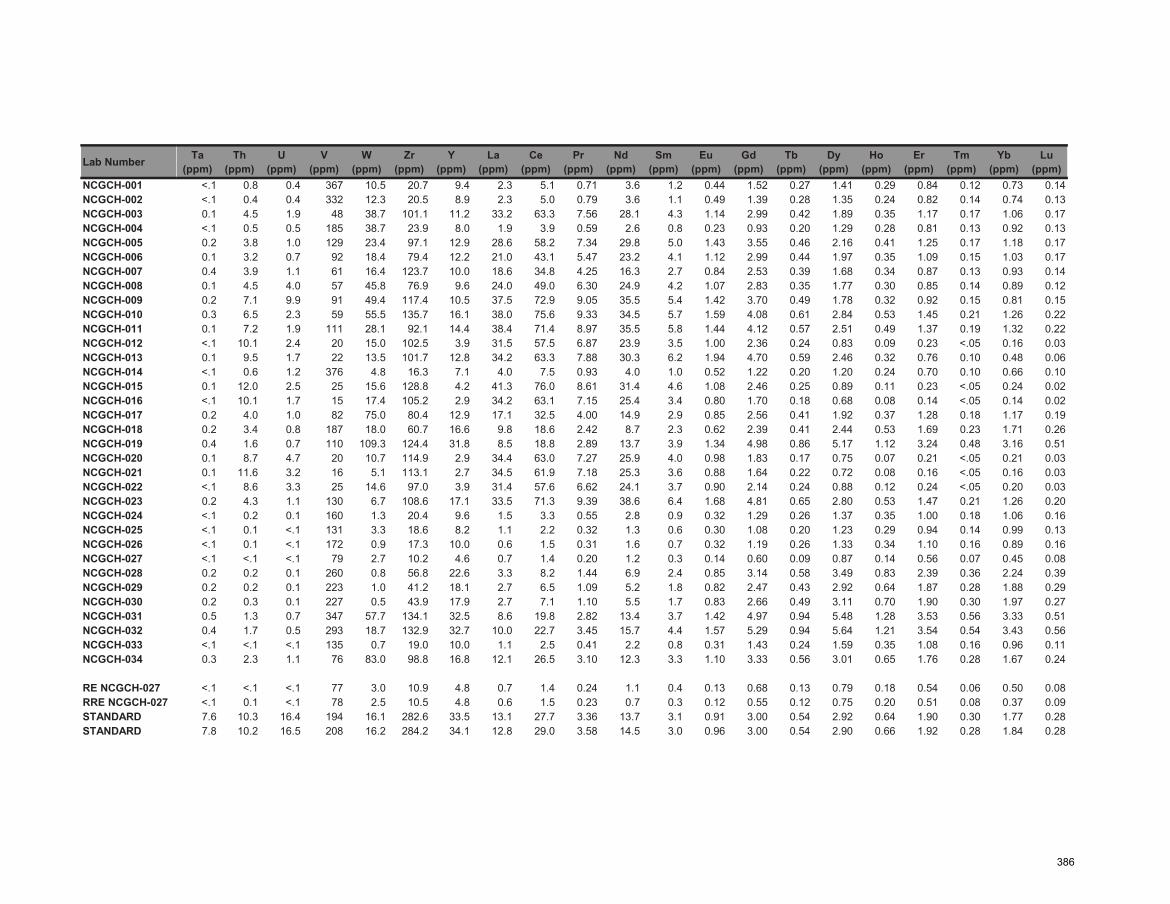
Lab Number
NCGCH-001NCGCH-002NCGCH-003NCGCH-004NCGCH-005NCGCH-006NCGCH-007NCGCH-008NCGCH-009NCGCH-010NCGCH-011NCGCH-012NCGCH-013NCGCH-014NCGCH-015NCGCH-016NCGCH-017NCGCH-018 NCGCH-019NCGCH-020NCGCH-021NCGCH-022 NCGCH-023 NCGCH-024NCGCH-025NCGCH-026 NCGCH-027NCGCH-028NCGCH-029NCGCH-030NCGCH-031NCGCH-032NCGCH-033NCGCH-034
RE NCGCH-027RRE NCGCH-027STANDARD STANDARD
Ta (ppm)
Th (ppm)
U (ppm)
V (ppm)
W (ppm)
Zr (ppm)
Y (ppm)
La (ppm)
Ce (ppm)
Pr (ppm)
Nd (ppm)
Sm (ppm)
Eu (ppm)
Gd (ppm)
Tb (ppm)
Dy (ppm)
Ho (ppm)
Er (ppm)
Tm (ppm)
Yb (ppm)
Lu (ppm)
<.1 0.8 0.4 367 10.5 20.7 9.4 2.3 5.1 0.71 3.6 1.2 0.44 1.52 0.27 1.41 0.29 0.84 0.12 0.73 0.14<.1 0.4 0.4 332 12.3 20.5 8.9 2.3 5.0 0.79 3.6 1.1 0.49 1.39 0.28 1.35 0.24 0.82 0.14 0.74 0.130.1 4.5 1.9 48 38.7 101.1 11.2 33.2 63.3 7.56 28.1 4.3 1.14 2.99 0.42 1.89 0.35 1.17 0.17 1.06 0.17<.1 0.5 0.5 185 38.7 23.9 8.0 1.9 3.9 0.59 2.6 0.8 0.23 0.93 0.20 1.29 0.28 0.81 0.13 0.92 0.130.2 3.8 1.0 129 23.4 97.1 12.9 28.6 58.2 7.34 29.8 5.0 1.43 3.55 0.46 2.16 0.41 1.25 0.17 1.18 0.170.1 3.2 0.7 92 18.4 79.4 12.2 21.0 43.1 5.47 23.2 4.1 1.12 2.99 0.44 1.97 0.35 1.09 0.15 1.03 0.170.4 3.9 1.1 61 16.4 123.7 10.0 18.6 34.8 4.25 16.3 2.7 0.84 2.53 0.39 1.68 0.34 0.87 0.13 0.93 0.140.1 4.5 4.0 57 45.8 76.9 9.6 24.0 49.0 6.30 24.9 4.2 1.07 2.83 0.35 1.77 0.30 0.85 0.14 0.89 0.120.2 7.1 9.9 91 49.4 117.4 10.5 37.5 72.9 9.05 35.5 5.4 1.42 3.70 0.49 1.78 0.32 0.92 0.15 0.81 0.150.3 6.5 2.3 59 55.5 135.7 16.1 38.0 75.6 9.33 34.5 5.7 1.59 4.08 0.61 2.84 0.53 1.45 0.21 1.26 0.220.1 7.2 1.9 111 28.1 92.1 14.4 38.4 71.4 8.97 35.5 5.8 1.44 4.12 0.57 2.51 0.49 1.37 0.19 1.32 0.22<.1 10.1 2.4 20 15.0 102.5 3.9 31.5 57.5 6.87 23.9 3.5 1.00 2.36 0.24 0.83 0.09 0.23 <.05 0.16 0.030.1 9.5 1.7 22 13.5 101.7 12.8 34.2 63.3 7.88 30.3 6.2 1.94 4.70 0.59 2.46 0.32 0.76 0.10 0.48 0.06<.1 0.6 1.2 376 4.8 16.3 7.1 4.0 7.5 0.93 4.0 1.0 0.52 1.22 0.20 1.20 0.24 0.70 0.10 0.66 0.100.1 12.0 2.5 25 15.6 128.8 4.2 41.3 76.0 8.61 31.4 4.6 1.08 2.46 0.25 0.89 0.11 0.23 <.05 0.24 0.02<.1 10.1 1.7 15 17.4 105.2 2.9 34.2 63.1 7.15 25.4 3.4 0.80 1.70 0.18 0.68 0.08 0.14 <.05 0.14 0.020.2 4.0 1.0 82 75.0 80.4 12.9 17.1 32.5 4.00 14.9 2.9 0.85 2.56 0.41 1.92 0.37 1.28 0.18 1.17 0.190.2 3.4 0.8 187 18.0 60.7 16.6 9.8 18.6 2.42 8.7 2.3 0.62 2.39 0.41 2.44 0.53 1.69 0.23 1.71 0.260.4 1.6 0.7 110 109.3 124.4 31.8 8.5 18.8 2.89 13.7 3.9 1.34 4.98 0.86 5.17 1.12 3.24 0.48 3.16 0.510.1 8.7 4.7 20 10.7 114.9 2.9 34.4 63.0 7.27 25.9 4.0 0.98 1.83 0.17 0.75 0.07 0.21 <.05 0.21 0.030.1 11.6 3.2 16 5.1 113.1 2.7 34.5 61.9 7.18 25.3 3.6 0.88 1.64 0.22 0.72 0.08 0.16 <.05 0.16 0.03<.1 8.6 3.3 25 14.6 97.0 3.9 31.4 57.6 6.62 24.1 3.7 0.90 2.14 0.24 0.88 0.12 0.24 <.05 0.20 0.030.2 4.3 1.1 130 6.7 108.6 17.1 33.5 71.3 9.39 38.6 6.4 1.68 4.81 0.65 2.80 0.53 1.47 0.21 1.26 0.20<.1 0.2 0.1 160 1.3 20.4 9.6 1.5 3.3 0.55 2.8 0.9 0.32 1.29 0.26 1.37 0.35 1.00 0.18 1.06 0.16<.1 0.1 <.1 131 3.3 18.6 8.2 1.1 2.2 0.32 1.3 0.6 0.30 1.08 0.20 1.23 0.29 0.94 0.14 0.99 0.13<.1 0.1 <.1 172 0.9 17.3 10.0 0.6 1.5 0.31 1.6 0.7 0.32 1.19 0.26 1.33 0.34 1.10 0.16 0.89 0.16<.1 <.1 <.1 79 2.7 10.2 4.6 0.7 1.4 0.20 1.2 0.3 0.14 0.60 0.09 0.87 0.14 0.56 0.07 0.45 0.080.2 0.2 0.1 260 0.8 56.8 22.6 3.3 8.2 1.44 6.9 2.4 0.85 3.14 0.58 3.49 0.83 2.39 0.36 2.24 0.390.2 0.2 0.1 223 1.0 41.2 18.1 2.7 6.5 1.09 5.2 1.8 0.82 2.47 0.43 2.92 0.64 1.87 0.28 1.88 0.290.2 0.3 0.1 227 0.5 43.9 17.9 2.7 7.1 1.10 5.5 1.7 0.83 2.66 0.49 3.11 0.70 1.90 0.30 1.97 0.270.5 1.3 0.7 347 57.7 134.1 32.5 8.6 19.8 2.82 13.4 3.7 1.42 4.97 0.94 5.48 1.28 3.53 0.56 3.33 0.510.4 1.7 0.5 293 18.7 132.9 32.7 10.0 22.7 3.45 15.7 4.4 1.57 5.29 0.94 5.64 1.21 3.54 0.54 3.43 0.56<.1 <.1 <.1 135 0.7 19.0 10.0 1.1 2.5 0.41 2.2 0.8 0.31 1.43 0.24 1.59 0.35 1.08 0.16 0.96 0.110.3 2.3 1.1 76 83.0 98.8 16.8 12.1 26.5 3.10 12.3 3.3 1.10 3.33 0.56 3.01 0.65 1.76 0.28 1.67 0.24
<.1 <.1 <.1 77 3.0 10.9 4.8 0.7 1.4 0.24 1.1 0.4 0.13 0.68 0.13 0.79 0.18 0.54 0.06 0.50 0.08<.1 0.1 <.1 78 2.5 10.5 4.8 0.6 1.5 0.23 0.7 0.3 0.12 0.55 0.12 0.75 0.20 0.51 0.08 0.37 0.097.6 10.3 16.4 194 16.1 282.6 33.5 13.1 27.7 3.36 13.7 3.1 0.91 3.00 0.54 2.92 0.64 1.90 0.30 1.77 0.287.8 10.2 16.5 208 16.2 284.2 34.1 12.8 29.0 3.58 14.5 3.0 0.96 3.00 0.54 2.90 0.66 1.92 0.28 1.84 0.28
386
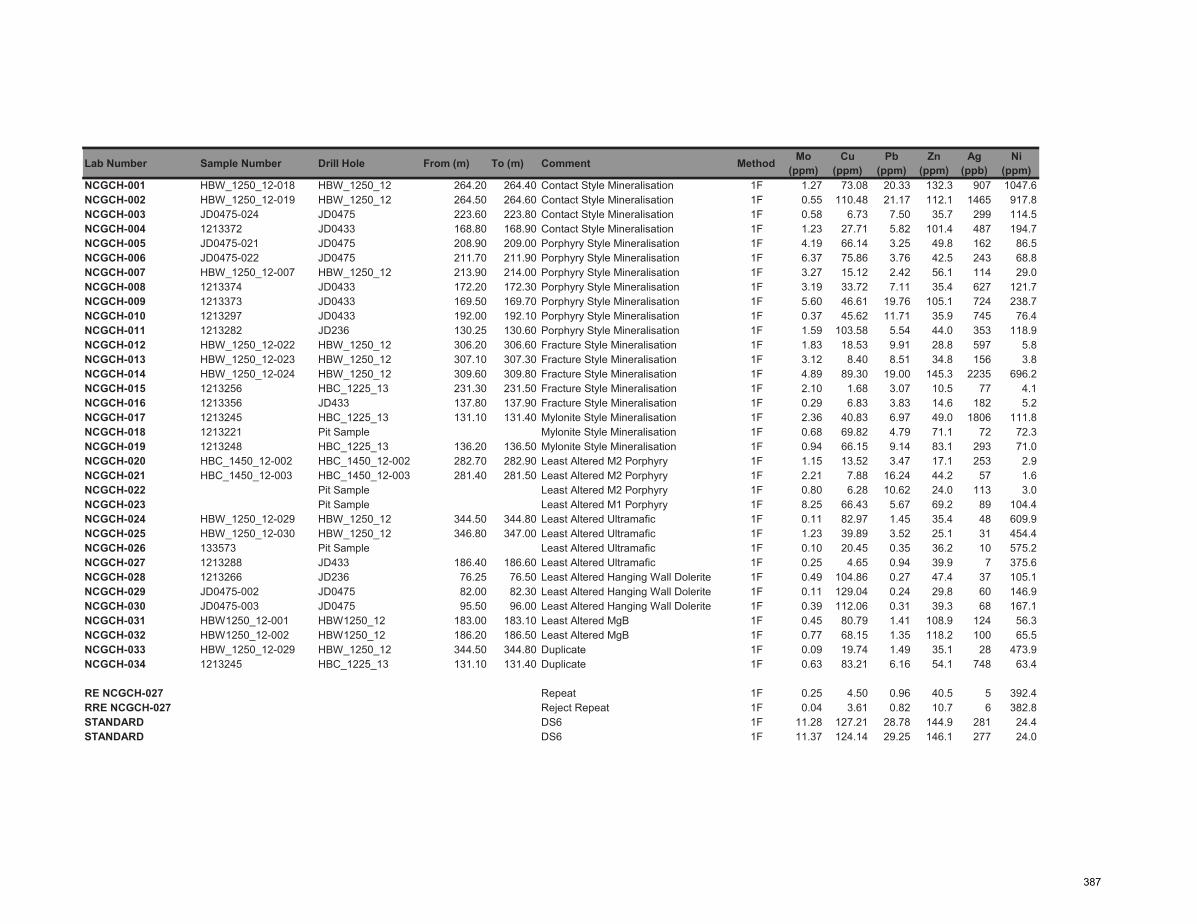
Lab Number Sample Number Drill Hole From (m) To (m) Comment Method Mo (ppm)
Cu (ppm)
Pb (ppm)
Zn (ppm)
Ag (ppb)
Ni (ppm)
NCGCH-001 HBW_1250_12-018 HBW_1250_12 264.20 264.40 Contact Style Mineralisation 1F 1.27 73.08 20.33 132.3 907 1047.6NCGCH-002 HBW_1250_12-019 HBW_1250_12 264.50 264.60 Contact Style Mineralisation 1F 0.55 110.48 21.17 112.1 1465 917.8NCGCH-003 JD0475-024 JD0475 223.60 223.80 Contact Style Mineralisation 1F 0.58 6.73 7.50 35.7 299 114.5NCGCH-004 1213372 JD0433 168.80 168.90 Contact Style Mineralisation 1F 1.23 27.71 5.82 101.4 487 194.7NCGCH-005 JD0475-021 JD0475 208.90 209.00 Porphyry Style Mineralisation 1F 4.19 66.14 3.25 49.8 162 86.5NCGCH-006 JD0475-022 JD0475 211.70 211.90 Porphyry Style Mineralisation 1F 6.37 75.86 3.76 42.5 243 68.8NCGCH-007 HBW_1250_12-007 HBW_1250_12 213.90 214.00 Porphyry Style Mineralisation 1F 3.27 15.12 2.42 56.1 114 29.0NCGCH-008 1213374 JD0433 172.20 172.30 Porphyry Style Mineralisation 1F 3.19 33.72 7.11 35.4 627 121.7NCGCH-009 1213373 JD0433 169.50 169.70 Porphyry Style Mineralisation 1F 5.60 46.61 19.76 105.1 724 238.7NCGCH-010 1213297 JD0433 192.00 192.10 Porphyry Style Mineralisation 1F 0.37 45.62 11.71 35.9 745 76.4NCGCH-011 1213282 JD236 130.25 130.60 Porphyry Style Mineralisation 1F 1.59 103.58 5.54 44.0 353 118.9NCGCH-012 HBW_1250_12-022 HBW_1250_12 306.20 306.60 Fracture Style Mineralisation 1F 1.83 18.53 9.91 28.8 597 5.8NCGCH-013 HBW_1250_12-023 HBW_1250_12 307.10 307.30 Fracture Style Mineralisation 1F 3.12 8.40 8.51 34.8 156 3.8NCGCH-014 HBW_1250_12-024 HBW_1250_12 309.60 309.80 Fracture Style Mineralisation 1F 4.89 89.30 19.00 145.3 2235 696.2NCGCH-015 1213256 HBC_1225_13 231.30 231.50 Fracture Style Mineralisation 1F 2.10 1.68 3.07 10.5 77 4.1NCGCH-016 1213356 JD433 137.80 137.90 Fracture Style Mineralisation 1F 0.29 6.83 3.83 14.6 182 5.2NCGCH-017 1213245 HBC_1225_13 131.10 131.40 Mylonite Style Mineralisation 1F 2.36 40.83 6.97 49.0 1806 111.8NCGCH-018 1213221 Pit Sample Mylonite Style Mineralisation 1F 0.68 69.82 4.79 71.1 72 72.3NCGCH-019 1213248 HBC_1225_13 136.20 136.50 Mylonite Style Mineralisation 1F 0.94 66.15 9.14 83.1 293 71.0NCGCH-020 HBC_1450_12-002 HBC_1450_12-002 282.70 282.90 Least Altered M2 Porphyry 1F 1.15 13.52 3.47 17.1 253 2.9NCGCH-021 HBC_1450_12-003 HBC_1450_12-003 281.40 281.50 Least Altered M2 Porphyry 1F 2.21 7.88 16.24 44.2 57 1.6NCGCH-022 Pit Sample Least Altered M2 Porphyry 1F 0.80 6.28 10.62 24.0 113 3.0NCGCH-023 Pit Sample Least Altered M1 Porphyry 1F 8.25 66.43 5.67 69.2 89 104.4NCGCH-024 HBW_1250_12-029 HBW_1250_12 344.50 344.80 Least Altered Ultramafic 1F 0.11 82.97 1.45 35.4 48 609.9NCGCH-025 HBW_1250_12-030 HBW_1250_12 346.80 347.00 Least Altered Ultramafic 1F 1.23 39.89 3.52 25.1 31 454.4NCGCH-026 133573 Pit Sample Least Altered Ultramafic 1F 0.10 20.45 0.35 36.2 10 575.2NCGCH-027 1213288 JD433 186.40 186.60 Least Altered Ultramafic 1F 0.25 4.65 0.94 39.9 7 375.6NCGCH-028 1213266 JD236 76.25 76.50 Least Altered Hanging Wall Dolerite 1F 0.49 104.86 0.27 47.4 37 105.1NCGCH-029 JD0475-002 JD0475 82.00 82.30 Least Altered Hanging Wall Dolerite 1F 0.11 129.04 0.24 29.8 60 146.9NCGCH-030 JD0475-003 JD0475 95.50 96.00 Least Altered Hanging Wall Dolerite 1F 0.39 112.06 0.31 39.3 68 167.1NCGCH-031 HBW1250_12-001 HBW1250_12 183.00 183.10 Least Altered MgB 1F 0.45 80.79 1.41 108.9 124 56.3NCGCH-032 HBW1250_12-002 HBW1250_12 186.20 186.50 Least Altered MgB 1F 0.77 68.15 1.35 118.2 100 65.5NCGCH-033 HBW_1250_12-029 HBW_1250_12 344.50 344.80 Duplicate 1F 0.09 19.74 1.49 35.1 28 473.9NCGCH-034 1213245 HBC_1225_13 131.10 131.40 Duplicate 1F 0.63 83.21 6.16 54.1 748 63.4
RE NCGCH-027 Repeat 1F 0.25 4.50 0.96 40.5 5 392.4RRE NCGCH-027 Reject Repeat 1F 0.04 3.61 0.82 10.7 6 382.8STANDARD DS6 1F 11.28 127.21 28.78 144.9 281 24.4STANDARD DS6 1F 11.37 124.14 29.25 146.1 277 24.0
387

Lab Number
NCGCH-001NCGCH-002NCGCH-003NCGCH-004NCGCH-005NCGCH-006NCGCH-007NCGCH-008NCGCH-009NCGCH-010NCGCH-011NCGCH-012NCGCH-013NCGCH-014NCGCH-015NCGCH-016NCGCH-017NCGCH-018 NCGCH-019NCGCH-020NCGCH-021NCGCH-022 NCGCH-023 NCGCH-024NCGCH-025NCGCH-026 NCGCH-027NCGCH-028NCGCH-029NCGCH-030NCGCH-031NCGCH-032NCGCH-033NCGCH-034
RE NCGCH-027RRE NCGCH-027STANDARD STANDARD
Co (ppm)
Mn (ppm)
As (ppm) Au (ppb) Cd
(ppm) Sb
(ppm) Bi
(ppm) Cr
(ppm) B
(ppm) Tl
(ppm) Hg
(ppm) Se
(ppm) Te
(ppm) Ge
(ppm) In
(ppm) Re
(ppb) Be
(ppm) Li
(ppm) Pd
(ppb)Pt
(ppb) Sample
(g)93.7 1469 1.8 3980.9 0.23 0.09 0.44 1917.7 <1 0.92 11 0.5 3.55 0.2 0.09 4 2.2 47.6 15 14 1580.4 1271 1.9 14926.2 0.25 0.08 0.58 1334.1 <1 0.70 13 0.7 3.03 0.2 0.06 2 1.3 35.4 15 8 3018.3 493 0.1 504.0 0.09 0.07 0.70 96.1 <1 0.05 <5 0.6 1.02 <.1 <.02 1 0.3 3.3 <10 <2 3053.5 1148 0.2 9128.4 0.10 0.17 0.10 1069.7 <1 0.87 10 0.3 0.23 0.4 0.06 4 2.3 37.2 <10 3 3023.7 617 0.2 747.1 0.08 0.07 0.19 215.3 <1 0.39 <5 0.3 0.12 0.1 0.03 1 0.7 17.3 <10 2 3018.6 792 0.1 847.9 0.05 0.08 0.24 175.3 <1 0.16 <5 0.3 0.11 0.2 0.02 3 0.4 11.6 <10 2 3017.6 368 1.2 955.3 0.07 0.22 0.27 29.6 <1 0.21 5 0.3 0.25 0.1 <.02 <1 0.1 17.8 <10 <2 3020.2 480 0.4 6464.2 0.08 0.22 0.22 96.0 <1 0.04 <5 0.6 0.33 <.1 0.02 1 0.7 4.0 <10 2 3035.6 771 0.4 13028.4 0.13 0.30 0.32 525.7 <1 0.40 <5 0.6 0.29 0.2 0.05 14 1.4 22.0 <10 4 3020.7 399 0.4 11441.5 0.07 0.11 0.56 112.4 <1 0.12 9 0.5 1.32 0.1 0.02 <1 0.3 8.1 16 2 3032.6 677 0.3 5511.9 0.09 0.06 0.71 202.3 <1 0.53 <5 0.6 0.40 0.2 0.04 3 0.9 20.5 <10 3 30
3.0 118 0.4 9313.7 0.04 0.05 0.45 10.2 1 0.03 11 0.1 0.18 <.1 <.02 <1 0.1 2.2 <10 <2 302.0 183 0.4 1426.9 0.06 0.09 0.22 12.1 <1 0.06 <5 0.2 0.21 <.1 <.02 <1 <.1 5.1 <10 <2 30
76.3 1430 0.6 33602.2 0.20 0.05 0.96 1888.8 <1 0.69 5 0.9 4.33 0.3 0.06 2 1.7 76.7 <10 9 301.7 69 0.2 347.9 0.04 0.04 0.10 11.5 2 0.05 <5 0.2 0.23 <.1 <.02 <1 0.1 6.3 15 <2 302.2 104 <.1 1298.3 0.06 0.04 0.28 14.4 1 <.02 9 0.1 0.18 <.1 <.02 <1 <.1 0.7 <10 3 30
26.5 795 2.4 16190.7 0.11 0.61 0.60 215.8 <1 0.10 6 0.9 2.26 0.1 0.04 1 0.4 10.6 <10 3 3036.1 1250 0.5 7.0 0.11 0.14 0.06 143.4 1 0.60 <5 0.2 0.05 0.1 <.02 1 0.5 29.5 17 9 3044.9 1765 2.0 1707.8 0.09 0.71 0.42 116.1 <1 0.63 13 0.6 0.29 0.2 0.08 2 1.3 20.8 <10 3 30
2.3 110 0.2 756.4 0.03 0.05 0.36 8.2 <1 0.03 12 0.1 0.06 <.1 <.02 <1 <.1 1.3 <10 4 302.0 105 0.2 113.4 0.05 0.04 0.14 8.7 1 0.03 <5 0.2 0.03 <.1 <.02 <1 0.1 2.0 <10 2 301.8 89 0.2 1061.1 0.03 0.06 0.24 10.8 1 0.04 <5 0.2 0.17 <.1 <.02 <1 0.1 3.2 17 2 30
28.6 805 0.1 10.5 0.07 0.05 0.12 394.1 1 0.87 <5 0.2 0.03 0.2 0.04 8 1.1 30.2 <10 3 3047.5 502 0.1 8.0 0.01 0.02 0.02 1912.4 <1 0.34 9 0.1 0.02 0.1 <.02 <1 <.1 45.5 <10 7 3045.0 930 1.4 12.0 0.04 0.02 0.12 1599.8 <1 0.10 <5 0.1 0.06 0.1 <.02 2 <.1 29.0 <10 4 3058.9 594 0.3 1.8 0.01 0.02 0.02 1739.8 <1 0.73 <5 0.1 <.02 0.1 <.02 1 <.1 75.6 <10 5 3033.1 852 0.2 3.8 0.03 0.68 <.02 1122.0 1 0.05 7 <.1 0.03 <.1 <.02 1 0.1 12.6 <10 6 3032.0 604 0.3 5.9 0.06 0.18 <.02 57.6 <1 <.02 6 0.1 <.02 0.1 <.02 1 <.1 19.8 <10 <2 3037.7 453 6.4 5.0 0.05 0.35 <.02 195.1 1 0.09 5 0.6 0.03 0.1 <.02 <1 <.1 19.8 <10 2 3042.8 557 1.1 7.8 0.04 0.21 <.02 180.1 <1 0.06 <5 0.5 0.02 0.1 <.02 2 <.1 24.7 <10 2 3039.2 1465 0.2 28.2 0.18 0.10 0.02 91.9 1 0.37 <5 0.3 0.09 0.1 0.03 2 <.1 29.4 10 <2 3038.3 1203 0.2 11.0 0.13 0.26 0.02 120.7 <1 0.34 <5 0.4 0.04 0.3 0.07 1 <.1 32.0 10 2 3040.0 533 0.1 4.0 0.02 0.03 0.03 1741.9 1 0.23 <5 <.1 0.03 0.1 <.02 1 0.1 47.0 <10 7 3026.3 954 5.6 6879.6 0.05 0.54 0.83 95.2 <1 0.14 7 0.6 1.01 0.1 0.05 <1 0.5 10.0 <10 <2 30
34.3 851 0.4 3.6 0.03 0.65 <.02 1202 1 0.04 <5 <.1 0.02 0.1 <.02 <1 0.1 14.1 <10 4 3033.5 812 <.1 5.7 0.02 0.03 <.02 1137.9 1 0.05 <5 <.1 0.02 <.1 <.02 <1 0.2 11.6 <10 2 3010.5 722 21.2 46.8 6.16 3.51 4.76 189.5 17 1.90 241 4.2 2.31 0.1 1.95 <1 2.4 15.7 162 42 3010.3 690 21.2 47.1 6.19 3.54 4.84 184.9 17 1.66 222 4.2 2.24 <.1 1.94 <1 2.3 16.1 167 44 30
388

852 East Hastings Street, Vancouver, BC Canada V6A 1R6 Phone (604) 253 3158 Fax (604) 253 1716 e-mail: [email protected]
Group 4A (e-mail versionv2.1) Revision Date: Feb 20, 2007
METHODS AND SPECIFICATIONS FOR ANALYTICAL PACKAGE GROUP 4A: WHOLE ROCK ANALYSIS BY ICP
Analytical Process
Receive Samples
Sort and Log Samples
Oven Dry at 60°C
Soils and Sediments Rocks and Core
Label and Sieve samples to –80 Mesh
Label, crush and pulverize to –150 Mesh
Weigh out 0.2 gm pulp into graphite crucibles. Add sample reference
materials and duplicates (rerun) to sequence.
Re-split
Mix with LiBO2/Li2B4O7
and fuse at 980°C
Dissolve bead in 0.5%
HNO3
Blanks, Calibration and Verification Standards
added to sequence
Analyse by ICP-ES Re-Analyze
No
Data correction and verification based on all
QC samples
Is data of acceptable
quality?
Data Entry, Checking and Analytical Report
Generation
Yes
Final Verification and
Certification
Comments
Sample Preparation
Soil or sediment is dried (60°C) and sieved to -80 mesh (-177 μm). Vegetation is dried (60°C) and pulverized or ashed (475°C). Moss-mat is dried (60°C), pounded and sieved to yield -80 mesh sediment. Rock and drill core is jaw crushed to 70% passing 10 mesh (2 mm), a 250 g aliquot is riffle split and pulverized to 95% passing 150 mesh (100 μm) in a mild-steel ring-and-puck mill.
Sample Digestion
A 0.2 g aliquot is weighed into a graphite crucible and mixed with 1.5 g of LiBO2/Li2B4O7 flux. Crucibles are placed in an oven and heated to 980°C for 30 minutes. The cooled bead is dissolved in 5% HNO3 (ACS grade nitric acid diluted in demineralised water). Calibration standards and reagent blanks are added to the sample sequence.
Sample Analysis
Sample solutions are aspirated into an ICP emission spectrograph (Spectro Ciros Vision) for the determination of the basic package consisting of the following 18 major oxides and elements: SiO2, Al2O3, Fe2O3, CaO, MgO, Na2O, K2O, MnO, TiO2, P2O5, Cr2O3, Ba, Nb, Ni, Sr, Sc, Y and Zr. The extended package also includes: Ce, Co, Cu, Ta and Zn. Loss on ignition (LOI) is determined for both packages by igniting a 1 g sample split at 950°C for 90 minutes then measuring the weight loss. Total Carbon and Sulphur are determined by the Leco method (Group 2A).
Quality Control and Data Evaluation
An Analytical Batch (1 page) comprises 36 samples. QA/QC protocol includes inserting a duplicate of pulp to measure analytical precision, a coarse (10 mesh) rejects duplicate to measure method precision (drill core samples only), an analytical blanks to measure background and an aliquot of in-house reference material SO-18 and CSC to measure accuracy in each analytical batch of 36 samples. STD SO-18 was certified in-house against Certified Reference Materials including CANMET SY-4 and USGS AGV-2, BCR-2, GSP-2 and W-2. Raw and final data from the ICP-ES undergoes a final verification by a British Columbia Certified Assayer who must sign the analytical report before release to the client.
852 East Hastings Street, Vancouver, BC Canada V6A 1R6 Phone (604) 253 3158 Fax (604) 253 1716 e-mail: [email protected]
Group 4B (e-mail versionv2.1) Revision Date: Feb 22, 2007
METHODS AND SPECIFICATIONS FOR ANALYTICAL PACKAGE GROUP 4B - WHOLE ROCK TRACE ELEMENTS BY ICP-MS
Analytical Process
Comments
Sample Preparation
All samples are dried at 60°C. Soil and sediment are sieved to -80 mesh (-177 μm). Moss-mats are disaggregated then sieved to yield -80 mesh sediment. Vegetation is pulverized or ashed (475°C). Rock and drill core is jaw crushed to 70% passing 10 mesh (2 mm), a 250 g riffle split is then pulverized to 95% passing 150 mesh (100 μm) in a mild-steel ring-and-puck mill.
Sample Digestion
A 0.2 g samples aliquot is weighed into a graphite crucible and mixed with 1.5 g of LiBO2/Li2B4O7 2 flux. The flux/sample charge is heated in a muffle furnace for 30 minutes at 980°C. The cooled bead is dissolved in 100 mL of 5% HNO3 (ACS grade nitric acid in de-mineralised water). An aliquot of the solution is poured into a polypropylene test tube. Calibration standards, verification standards and reagent blanks are included in the sample sequence.
Sample Analysis
Sample solutions are aspirated into an ICP mass spectrometer (Perkin-Elmer Elan 6000 or 9000) for the determination of the basic package consisting of the following 34 elements: Ba, Co, Cs, Ga, Hf, Nb, Rb, Sn, Sr, Ta, Th, Tl, U, V, W, Y, Zr, La, Ce, Pr, Nd, Sm, Eu, Gd, Tb, Dy, Ho, Er, Tm, Yb and Lu. A second sample split of 0.5 g is digested in Aqua Regia and analysed by ICP-MS (see Group 1DX) to determine: Au, Ag, As, Bi, Cd, Cu, Hg, Mo, Ni, Pb, Sb, Se, Tl and Zn.
Quality Control and Data Verification
An Analytical Batch comprises 36 samples. QA/QC protocol incorporates a sample-prep blank (G-1) carried through all stages of preparation and analysis as the first sample, a pulp duplicate to monitor analytical precision, a -10 mesh rejects duplicate to monitor sub-sampling variation (drill core only), a reagent blanks to measure background and an aliquot of in-house Standard Reference Materials like STD SO-18 to monitor accuracy. STD SO-18 was certified in-house against Certified Reference Materials including CANMET SY-4 and USGS AGV-2, G-2, BCR-2 and W-2.
Raw and final data undergo a final verification by a British Columbia Certified Assayer who signs the Analytical Report before it is released to the client.
Re-split
Re-analyse
Yes
No
Receive Samples
Sort and Log Samples
Soils & Sediments Vegetation
Label and Sieve samples to -80 Mesh
Rock and Core
Oven Dry at 60°C Ash at 475°C
Label, Crush & Pulverize to -150 mesh
Weigh out 0.2 g pulp into graphite crucibles. Sample
standards and pulp duplicates added to
sequence.
Mix with LiBO2/Li2B4O7 2 and fuse at 980°C
Add Calibration standards and reagent blanks to
sample sequence.
Sample solutions analysed by ICP-MS
LIMS system corrects data for interferences and drift. Operator reviews raw data
ICP-MS data and any other analyses combined as a final Analytical Report
Verification and Certification by a BC
Certified Assayer
Is data of acceptable
quality?
Dissolve bead in 0.5% HNO3

852 East Hastings Street, Vancouver, BC Canada V6A 1R6 Phone (604) 253 3158 Fax (604) 253 1716 e-mail: [email protected]
Group 1F-MS (e-mail version1.2) Revision Date: Feb 20, 2007
METHODS AND SPECIFICATIONS FOR ANALYTICAL PACKAGE GROUP 1F-MS – ULTRATRACE ICP-MS ANALYSIS • AQUA REGIA
Analytical Process
Comments Sample Preparation
All samples are dried at 60°C. Soil and sediment are sieved to -80 mesh (-177 μm). Moss-mats are disaggregated then sieved to yield -80 mesh sediment. Vegetation is pulverized or ashed (475°C). Rock and drill core is jaw crushed to 70% passing 10 mesh (2 mm), a 250 g riffle split is then pulverized to 95% passing 150 mesh (100 μm) in a mild-steel ring-and-puck mill. Pulp splits of 0.5 g are weighed into test tubes, 15 and 30 g splits are weighed into beakers.
Sample Digestion
A modified Aqua Regia solution of equal parts concentrated ACS grade HCl and HNO3 and de-mineralised H2O is added to each sample (6 mL/g) to leach in a hot-water bath (~95°C) for one hour. After cooling the solution is made up to a final volume with 5% HCl. Sample weight to solution volume ratio is 0.5 g per 10 mL.
Sample Analysis
Solutions aspirated into a Perkin Elmer Elan 6000 or 9000 ICP mass spectrometer are analysed for the Basic package comprising 37 elements: Au, Ag, Al, As, B, Ba, Bi, Ca, Cd, Co, Cr, Cu, Fe, Ga, Hg, K, La, Mg, Mn, Mo, Na, Ni, P, Pb, S, Sb, Sc, Se, Sr, Te, Th, Ti, Tl, U, V, W and Zn. The Full package adds the 14 following elements: Be, Ce, Cs, Ge, Hg, In, Li, Nb, Rb, Re, Sn, Ta, Ta, Y, Zr, Pd and Pt. Larger sample splits are recommended for better analytical precision on elements subject to nugget effects (eg. Au, Pt).
Quality Control and Data Verification
An Analytical Batch (1 page) comprises 36 samples. QA/QC protocol incorporates a sample-prep blank (G-1) carried through all stages of preparation and analysis as the first sample, a pulp duplicate to monitor analytical precision, a -10 mesh rejects duplicate to monitor sub-sampling variation (drill core only), a reagent blank to measure background and an aliquot of in-house Standard Reference Materials like STD DS7 to monitor accuracy.
Raw and final data undergo a final verification by a British Columbia Certified Assayer who signs the Analytical Report before it is released to the client.
Re-split
Re-analyse
Yes
No
Receive Samples
Sort and Log Samples
Soils & Sediments Vegetation
Label and Sieve samples to -80 Mesh
Rock and Core
Oven Dry at 60°C Ash at 475°C
Label, Crush & Pulverize to -150 mesh
Weigh 0.5 g into test tubes, (15 or 30 g weighed into beakers) add duplicates and reference material to
the sample sequence
Add Aqua Regia acid mixture to test tubes and digest in boiling (>95°C)
water bath for 60 minutes.
Calibration standards and reagent blanks added to
sample sequence.
Sample solutions analysed by ICP-MS
LIMS system corrects data for interferences and drift. Operator reviews raw data
ICP data and any other analyses combined as a final Analytical Report
Verification and Certification by a BC
Certified Assayer
Is data of acceptable
quality?