hydrology of the alluvium of the arkansas river, … of the alluvium of the arkansas river,...
TRANSCRIPT

Hydrology of the Alluvium of the Arkansas River, "luskogee, Oklahoma, to Tort Smith, Arkansas*y HARRY H. TANAKA and JERRALD R. HOLLOWELL
^ith a section on
CHEMICAL QUALITY OF THE WATER*y JOHN J. MURPHY
CONTRIBUTIONS TO THE HYDROLOGY OF THE UNITED STATES
GEOLOGICAL SURVEY WATER-SUPPLY PAPER 1809-T
Prepared in cooperation with the U.S. Army Corps of Engineers
"JNITED STATES GOVERNMENT PRINTING OFFICE, WASHINGTON : 1966

UNITED STATES DEPARTMENT OF THE INTERIOR
STEWART L. UDALL, Secretary
GEOLOGICAL SURVEY
William T. Pecora, Director
For sale by the Superintendent of Documents, U.S. Government Printing Office Washington, D.G. 20402
CONTENTS
Abstract______________________.___.._._._._____. TlIntroduction______________________________________________________ 2
Purpose and scope of the investigation. __________________________ 2Location and extent of the area________--_________-__-_--_-_____ 2Previous investigations...-_____________________________________ 3Methods of investigation. ______________________________________ 4Well-numbering system_____________________________-_-___-____ 5Acknowledgments-____________________________________________ 5
Geography______________________________________________________ 6Surface features and drainage.__________________________________ 6Climate._______________-____-_____-_-______-__-___---___---__ 7Population_________________________________________________ 7Agriculture, industry, and mineral resources ______________________ 9
Geology and water-bearing properties of the rocks___-______-__----___- 10Bedrock______________________________________ 10Terrace deposits.______________________________________________ 11Alluvium. ____________________________________________________ 12
Ground water in the alluvium_____________________________________ 14Principles of occuirence__-____________________-_--__-_-___----- 14Physical and hydrologic properties______________-________________ 16
Laboratory tests________________________________________ 16Aquifer tests_--_____-_______-________-___-_-___----__----- 18Relation of laboratory and field data_______________________ 19
Fluctuations of the piezometric surface.__________________________ 21Movement__________________________________________________ 23Recharge_____________________________________________________ 23Discharge.___________________________________________________ 27Storage_____________________________________ 28Utilization_________________________________-__ 28
Irrigation supplies____-_-_________-__--_-----_-___--------- 28Industrial and public supplies-__-__-----__----------___---_- 29Domestic and stock supplies- _______________________________ 30
Areas potentially favorable for development of ground water________ 30Chemical quality of the water, by John J. Murphy____________________ 31Effect of changed river conditions on the hydrologic system of the alluvium. 39Summary and conclusions___----_-___-____-------------_-_-_-_---_- 41Selected references.______________________________________________ 41
in

IV CONTENTS
ILLUSTRATIONS
[Plates are in pocket]
PLATE 1. Geologic map and sections of the Arkansas River valley be tween Muskogee and Fort Smith.
2. Hydrologic map of the Arkansas River valley between Muskogee and Fort Smith showing wells and piezometric contours.
3. Hydrologic map of the Arkansas River valley between Muskogee and Fort Smith showing areas favorable for development of ground water.
FIGURE 1. Index map of eastern Oklahoma showing report area_____2. Sketch of well-numbering system_________________________3. Graph of cumulative departure from average precipitation at
Webbers Falls_____,________ ____________4. Graph showing relation of median grain size to permeability 5. Hydrographs of wells in a profile normal to the Arkansas
River. ____________________________________6. Graph showing height of water-level rises at distances from
the river.___________________________________________
PageT3
5
820
22
24
TABLES
Page TABLE 1. Population, by communities, in the Arkansas River valley__ T9
2. Physical and hydrologic properties of the alluvium______ 173. Summary of the coefficients of transmissibility, permeability,
and storage determined by aquifer tests____ _________ 194. Permeabilities of the alluvium of the Arkansas River valley. _ 215. Recharge and discharge in selected areas of the Arkansas
River valley___________________________________ 266. Chemical analyses of water from wells in the alluvium along
the Arkansas River between Muskogee and Fort Smith. __ 327. Maximum, minimum, and modal concentrations of chemical
constituents in water from the alluvium between Muskogee and Fort Smith..________________.._____ 38

CONTRIBUTIONS TO THE HYDROLOGY OF THE UNITED STATES
HYDROLOGY OF THE ALLUVIUM OF THE ARKANSAS RIVER, MUSKOGEE, OKLAHOMA, TO FORT SMITH, ARKANSAS
By HARRY H. TANAKA and JEREALD K. HOLLOWELL
ABSTRACT
The alluvium along 110 miles of the Arkansas River between Muskogee, Okla., and Fort Smith, Ark., is the most important aquifer in this area.
The bedrock, which borders in part and underlies all the alluvial deposits, is well indurated thin- to massive-bedded sandstone, shale, siltstone, and limestone of Mississippian and Pennsylvanian age. The bedrock yields only a small amount of water to domestic and stock wells.
Terrace deposits, whose upper surfaces range from 20 to 120 feet above the flood plain, border the alluvium in segments on both sides of the Arkansas River. The deposits are composed mainly of silt, fine sand, and small amounts of coarse sand and. gravel near the base. The terrace deposits yield small to moderate supplies of water to domestic and stock wells.
The alluvium is the most important aquifer along the Arkansas River. It is formed in segments 1-3 miles wide and 3-11 miles long, the total area being about 140 square miles. The grain size of the alluvium generally ranges from gravel and coarse sand near the base to silt or clay near the surface. The total thickness averages 42 feet and the saturated thickness 25 feet. Recharge, mainly from precipitation, is estimated to average 9 inches, or about 67,000 acre-feet, per year. The amount of recharge from adjoining terrace deposits or bedrock is only a small fraction of the total recharge to the alluvium. Natural discharge is mainly by seepage into streams and by evapotranspiration. Dis charge by pumpage was estimated to be about 1,700 acre-feet in 1962. Under average conditions the alluvium has a storage capacity of about 450,000 acre-feet of water. In large areas that are potentially favorable for development of ground water, wells will yield as much as 600 gpm (gallons per minute).
The ground water in the alluvium is predominantly of the calcium, magnesium bicarbonate type, variable in dissolved-solids content, and hard. The quality is affected by the geology, water movement, and hydraulics of the alluvium. The water is suitable for irrigation and for domestic, stock, and limited industrial purposes.
A change in the river regimen as a result of the navigation project will raise water levels in the alluvium in most areas and lower it in others. This change
Tl

T2 CONTRIBUTIONS TO THE HYDROLOGY OF THE UNITED STATES
will alter the recharge-discharge relation in the alluvium, but the changes in most places will increase the potential ground-water resource.
INTRODUCTION
PURPOSE AND SCOPE OF THE INVESTIGATION
The investigation on which this report is based is part of a co operative program by the U.S. Army Corps of Engineers and the U.S. Geological Survey to study the ground water in the alluvium and to provide information which can be used as a basis for comparing ground-water conditions prior to and after completion of a series of navigation locks and dams on the Arkansas River from its mouth in southeast Arkansas to Muskogee, Okla., and on the Verdigris River from its mouth near Muskogee to Catoosa, Okla.
This report includes basic data obtained from a part of the study. Its purpose is to provide geologic and hydrologic information that can guide the development of ground water in alluvial deposits border ing the Arkansas River between Muskogee, Okla., and Fort Smith, Ark. The report is primarily concerned with the alluvium, the larg est source of ground water available along the Arkansas River. The bedrock and terrace deposits bordering the valley have little ground- water potential and are described only briefly. The quality of the ground water was studied to determine its relation to the hydrologic system and to evaluate the suitability of the water for various uses. Future changes in the hydrology of the alluvium resulting from changes in the river regimen are discussed in general terms.
LOCATION AND EXTENT OF THE AREA
The project area between Muskogee, Okla., and Fort Smith, Ark., includes the flood plain of the Arkansas River and the adjacent ter race deposits and bedrock formations. In this area (fig. 1) the Arkansas River traverses the Interior Highlands of Oklahoma. The rocks of the Interior Highlands are relatively resistant to erosion and generally confine the Arkansas River flood plain to a width of 1-3 miles. Bedrock, which in places borders the river on one or both sides, separates the flood plain into a series of distinct segments rang ing in length from 3 to 11 miles. Consolidated rocks and poorly indurated terrace deposits form the valley walls that rise abruptly 50 to more than 100 feet above the flood plain. Structural features and erosion have produced a series of alternating ridges and valleys in the bedrock which generally parallel the Arkansas River.

HYDROLOGY, ALLUVIUM, ARKANSAS RIVER T3
SEQUOYAH' ibber Falls \
FIGURE 1. Index map of eastern Oklahoma showing report area.
PREVIOUS INVESTIGATIONS
Several earlier investigations of the geology and water resources of parts of the project and adjacent areas have proved helpful in the preparation of this report.

T4 CONTRIBUTIONS TO THE HYDROLOGY OF THE UNITED STATES
Wilson (1937) included a short study of water resources in. a geo logic investigation of parts of Muskogee and Mclntosh Counties. Oakes and Knechtel (1948) primarily described the coal resources and the stratigraphic sections in Haskell County. Knechtel (1949) described the coal and natural gas resources of northern LeFlore County and included a description of the stratigraphic section of the area. Schoff and Keed (1951) made a detailed investigation of the ground water in the alluvium of the Arkansas River near, Fort Gib- son. Huffman (1958) described the geology and presented numerous measured sections and stratigraphic descriptions of the formations that border the Arkansas valley on the north.
METHODS OF INVESTIGATION
The data used in this report were collected in 1957-62.Information including total depth, depth to water, and yield of
domestic, stock, and irrigation wells was obtained from farmers and county agricultural agents. Data on the geologic and hydrologic properties of the alluvium were obtained from 250 observation wells augured in the alluvium and adjacent terrace deposits and cased with li/4- and %-inch pipe; 67 test holes were augured for additional geo logic information.
The permeability, porosity, specific yield, and grain size of samples collected at 18 sites were determined by laboratory analysis. Aquifer tests to determine transmissibility and storage coefficients of the allu vium were made at six locations.
All observation wells were measured quarterly in a "mass measure ment" during 1958, 1959, and part of 1960; from 1960 through 1962, all wells were measured semiannually. Measurements were made at monthly intervals in 62 wells along lines perpendicular to the river in order to relate fluctuations of ground-water levels to river stage and precipitation. Twelve large-diameter, wells were drilled for the installation of instruments to record continuous water-level fluctua tions.
Water samples collected from wells were analyzed in the U.S. Geological Survey laboratory in Oklahoma City.
Four gaging stations operated by the Corps of Engineers and one station operated by the U.S. Weather Bureau provided daily stage readings on the Arkansas River. These stations are on bridges cross ing the river at Muskogee, Webbers Falls, U.S. Highway 59, Red- lands, and Van Buren, Ark. Daily stage readings at Fort Smith were computed from stage-relation curves from the station at Van Buren.

HYDROLOGY, ALLUVIUM, ARKANSAS RIVER T5
WELL-NUMBERING SYSTEM
Wells and test holes are numbered in this report according to their location with respect to the Federal land-survey system used in Okla homa. The first numeral indicates the township, the second the range, and the third the section in which the well is located. The lowercase letters that follow the section number indicate the position of the well within the section; the first letter indicates the quarter section (160- acre tract); the second letter, the quarter-quarter section (40-acre tract); and the third letter, the quarter-quarter-quarter section (10- acre tract). These letters are assigned in a counterclockwise direc tion, beginning with "a" in the northeast quarter. Within each 10- acre tract the wells are numbered serially, as indicated by the final digit of the number. Thus well 12N-20E-13bcbl is the first well to be listed in the NW^SW^NW^ of sec. 13, T. 12 N., R. 20 E. (fig. 2).
ACKNOWLEDGMENTS
The authors acknowledge the cooperation and assistance by resi dents, well owners, and public officials in the area for providing infor mation on wells and in granting permission to drill test holes and to conduct aquifer tests on private and public property, and the aid furnished by the U.S. Army Corps of Engineers, Tulsa District, in the continuing program of ground-water investigations along the Arkansas and Verdigris Rivers.
Well 12N-20E-13bcbl
R. 20 E.
6
7
18
19
30
31
5
8
17
20
29
32
4
9
16
21
28
33
3
10
15
22
27
34
2
11
14
23
26
35
/
t-13
24
25
36
SEC. 13
b I a I b I a
- T D~ "* 3
b I a | | I c | d c |
jLd_L__ I--'
b a ' b I a
^ c--L- «L iI- r d H
d I c I d
6 miles 1 mile
FIGURE 2. Well-numbering system.
7186-090 O 65 2
T6 CONTRIBUTIONS TO THE HYDROLOGY OF THE UNITED STATES
GEOGRAPHY
SURFACE FEATURES AND DRAINAGE
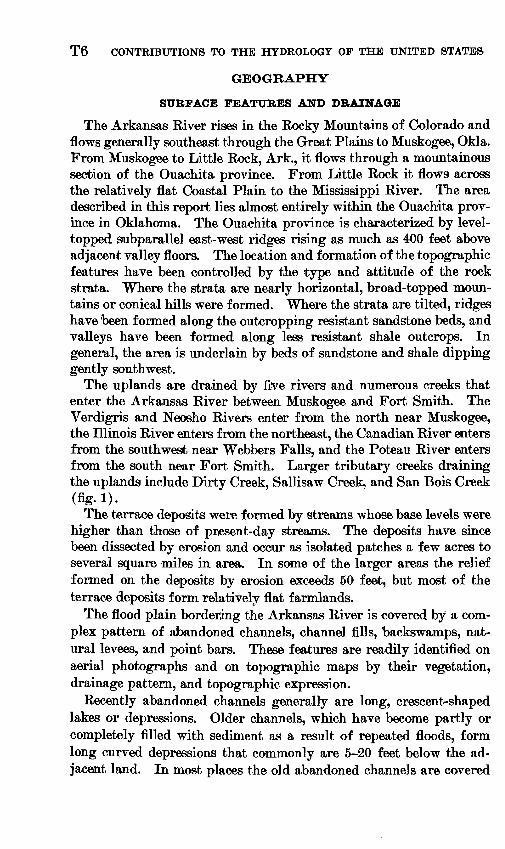
The Arkansas River rises in the Rocky Mountains of Colorado and flows generally southeast through the Great Plains to Muskogee, Okla. From Muskogee to Little Rock, Ark., it flows through a mountainous section of the Ouachita province. From Little Rock it flows across the relatively flat Coastal Plain to the Mississippi River. The area described in this report lies almost entirely within the Ouachita prov ince in Oklahoma. The Ouachita province is characterized by level- topped subparallel east- west ridges rising as much as 400 feet above adjacent valley floors. The location and formation of the topographic features have been controlled by the type and attitude of the rock strata. Where the strata are nearly horizontal, broad-topped, moun tains or conical hills were formed. Where the strata are tilted, ridges have 'been formed along the outcropping resistant sandstone beds, and valleys have been formed along less resistant shale outcrops. In general, the area is underlain by beds of sandstone and shale dipping gently southwest.
The uplands are drained by five rivers and numerous creeks that enter the Arkansas River between Muskogee and Fort Smith. The Verdigris and Neosho Rivers enter from the north near Muskogee, the Illinois River enters from the northeast, the Canadian River enters from the southwest near Webbers Falls, and the Poteau River enters from the south near Fort Smith. Larger tributary creeks draining the uplands include Dirty Creek, Sallisaw Creek, and San Bois Creek
The terrace deposits were formed by streams whose base levels were higher than those of present-day streams. The deposits have since been dissected by erosion and occur as isolated patches a few acres to several square miles in area. In some of the larger areas the relief formed on the deposits by erosion exceeds 50 feet, but most of the terrace deposits form relatively flat farmlands.
The flood plain bordering the Arkansas River is covered by a com plex pattern of abandoned channels, channel fills, backswamps, nat ural levees, and point bars. These features are readily identified on aerial photographs and on topographic maps by their vegetation, drainage pattern, and topographic expression.
Recently abandoned channels generally are long, crescent-shaped lakes or depressions. Older channels, which have become partly or completely filled with sediment as a result of repeated floods, form long curved depressions that commonly are 5-20 feet below the ad jacent land. In most places the old abandoned channels are covered

HYDROLOGY, ALLUVIUM, ARKANSAS RIVER T7
by dense growths of vegetation. Baokswamps are low-lying areas flooded during times of high water and bordered by natural levees. Natural levees are lenslike ridges along and parallel to the banks of present and former channels. They slop© steeply on the side facing the channel but characteristically slope gently away from the channel toward the adjacent backswamp areas. Point bars are characterized by a series of low, narrow swales and somewhat broader ridges which generally conform to the curvature of the channel bends. Surface drainage in areas covered by point bars is by small streams and sloughs, which follow the larger swales and unite at one or more points near, the downstream ends of the point bar.
CLIMATE
The climate of the Arkansas Kiver valley of eastern Oklahoma is characterized by small variations in seasonal and yearly temperature and precipitation averages. The mean annual temperature at Web- bers Falls is 61.5° F and the mean annual precipitation is 44.30 inches. During the 62-year period of record at Webbers Falls, the highest recorded temperature was 115° F and the lowest 15° F below zero; the greatest yearly precipitation was 72.00 inches in 1945 and the least was 20.17 inches in 1936. The mean monthly precipitation for May, the wettest month, is 5.8 inches; for July, the driest month, the mean monthly precipitation is 2.6 inches. The winters generally are mild. The mean annual snowfall at Webbers Falls is 4.7 inches. Snow occurs most frequently during January and February; the snowfall of an average storm generally is less than 2 inches. The average frost-free period is 224 days and the minimum recorded is 212 days.
Figure 3 shows the monthly precipitation and cumulative departure from average precipitation at Webbers Falls. The average monthly precipitation is computed for the period 1899-1962, and monthly de ficiencies or excesses with respect to this average have been added progressively for the period 1948-62. The downward trend of the cumulative-departure curve from 1952 through 1956 results from a deficiency of more than 40 inches from average precipitation; the upward trend of the curve from 1957 through 1961 results from an excess of more than 30 inches from average precipitation.
POPULATION
The rural and urban population in the report area is concentrated in small communities in the uplands on either side of the Arkansas River flood plain. The population on the flood plain is estimated to be about 1,500, of which more than half is concentrated near Webbers Falls and Fort Smith. Muskogee and Fort Smith, the larger cities

PR
EC
IPIT
AT
ION
, C
UM
ULA
TIV
E
DE
PA
RT
UR
E
FRO
M
AV
ER
AG
E
IN
INC
HE
S
OF
MO
NT
HLY
P
RE
CIP
ITA
TIO
N,
IN
INC
HE
S
I *^3
^oj±
01
p
oo
If
S3I.V
I.Saai
.10SB
M 0
.1 SM
Oiin
aiH
i^ro
o

HYDROLOGY, ALLUVIUM, ARKANSAS RIVER T9
in the project area have shown substantial gains in population during the past 20 years. The rural and ufban population in other parts of the area, with the exception of Spiro, has shown a decrease or little change. Census data for communities in or near the project area are shown in table 1.
TABLE 1. Population, ty communities, m the Arkansas River valley [From U.S. Bureau of Census]
City or town
Fort Smith. ___ ........ _ ....... _ . __ . .. ____ ........Muskogee _______________________________Spiro _ ____ ........... _ . ____ . ___ . ____ . _ .......Fort Gibson ____ .. ____ . __ . __________ . __ .. ...Webbers Falls.... ........... ................................ .......Moffett ........ -._.._ -. .--._.-..._.. __ --.-..... Gore.. . ... .............................................
1040
36,88432,332
1,0411,233
486538334392
Year
1950
47,94237,289
1,3651,496
489380387374
1960
52,99138,059
1,4501,407
441357334279
AGRICULTURE, INDUSTRY, AND MINERAL RESOURCES
The agricultural economy of the flood plain is characterized by farms averaging more than 200 acres, of which nearly all is under cultivation. The flood plain is intensively cultivated and almost half the land is double-cropped in most years. The principal crops are wheat, cotton, soybeans, alfalfa, corn, and produce largely beans and spinach. Upland areas bordering the valley are utilized chiefly as pasture for livestock.
The Arkansas River valley is favorably located with respect to market facilities. Canneries are at Spiro, Okla., and at several nearby towns in Arkansas. Local market outlets are at Muskogee and Fort Smith, the larger markets readily accessible by highways and railways.
The agricultural economy of the flood plain is not dependent upon irrigation, although it is aided by supplemental irrigation during the hot summer months at the peak of the growing season. The ad vantages of supplemental irrigation have been increasingly recognized by the farmers; hence, a few new irrigation wells are constructed each year.
Most industry along the Arkansas Eiver valley is concentrated in the larger cities and has little direct bearing on the economy of the rural areas. The only industries dependent upon the agricultural economy are the canneries, an alfalfa-dehydrating mill, and a fertilizer plant.
Mineral resources in or near the valley include natural gas, coal, sand, and gravel. Natural gas is recovered from the Cartersville

T10 CONTRIBUTIONS TO THE HYDROLOGY OF THE UNITED STATES
field in Tps. 9 and 10 N., Es. 24,25, and 26 E. Coal occurs in at least two bedrock formations that crop out along the valley margins. Sand and gravel are dredged from the bed of the Arkansas River north of Muskogee, and gravel is mined along the banks of the Neosho Eiver near Fort Gibson. Most of the sand and gravel used locally for construction purposes is derived from these sources.
GEOLOGY AND WATER-BEARING PROPERTIES OFTHE ROCKS
BEDROCK
The term "bedrock" is used in this report to include all consolidated sedimentary rocks of Mississippian and Pennsylvanian age that border or lie beneath the alluvial deposits of the Arkansas River between Muskogee and Fort Smith. The distribution of the bedrock in rela tion to the alluvial deposits is shown on plate 1.
The bedrock is made up of well-indurated thin- to massive-bedded sandstone, shale, siltstone, and limestone. The sandstone beds are hard and well cemented; their permeability is dependent on joints in the rock, on the weathered zone near, the surface, and locally on pri mary porosity. The shale and siltstone are compact and dense, and permeabilities are determined by fracture zones. The limestone is dense and crystalline, and permeability is dependent on joints in the rock and locally on solution channels. Because its permeability is low hi most of the area, the bedrock functions chiefly as a container for the alluvium and the water in it.
The bedrock includes, in ascending order, the Moorefield Forma tion, Hindsville Limestone, Fayetteville Shale, and Pitkin Limestone of Late Mississippian age; and the Hale and Bloyd Formations, of Early Pennsylvanian age, the Atoka Formation, Hartshorne Sand stone, McAlester Formation, Savanna Formation, and Boggy Shale of Middle Pennsylvania age. Detailed descriptions of these rocks are given by Wilson (1937), Oakes and Knechtel (1948), Knechtel (1949), and Huffman (1958).
The transmissibility of the bedrock is low, but a small amount of water is produced from each geologic formation throughout the re port area for domestic and stock use. According to the Oklahoma State Mineral Survey (1937), many domestic wells along the Arkansas River produce water from shale, even though shale ordinarily is too impermeable to transmit usable quantities of water to wells. Faults and folds in the bedrock are common in the area between Muskogee and Fort Smith, and some water probably is being transmitted to wells from fracture zones. Depths to water measured in 25 wells in

HYDROLOGY, ALLUVIUM, ARKANSAS RIVER Til
the bedrock range from 8 to 51 feet and average about 30 feet below land surface.
TERRACE DEPOSITS
Segments of terraces at two levels are found along both sides of the Arkansas River. The upper surface of the low terrace ranges from 20 to 50 feet above the flood plain; the surface of the high ter race ranges from 60 to 120 feet above the flood plain. In this report the deposits beneath the low and high terraces are mapped and de scribed as a single unit. Some of the larger areas of terrace deposits which contain significant amounts of ground water tfsed for domestic and stock purposes are discussed below.
The city of Muskogee (pi. 1) is in part on a terrace segment that extends north and east of the city to the bank of the Arkansas River. Thicknesses of the deposits ranging from 22 to 33 feet were pene trated in four test and observation wells that were augered north and east of the city. Samples taken from three wells consisted mostly of silt and fine sand, but test-well 15N-19E-33bbbl penetrated about 4 feet of coarse sand and fine to medium gravel.
Six test and observation wells in the terrace segment north of Muskogee and north of the Arkansas River in the south part of T. 16 N., R. 18 E., penetrated deposits ranging from 27 to 82 feet in thick ness. Samples taken from these wells were composed mostly of silt and very fine sand and small amounts of medium to coarse sand.
The terrace segment at Fort Gibson is about a mile wide and ex tends southeast for about 2i/£ miles. Information obtained from two test holes in these deposits indicates they are relatively thin and com posed mainly of silt and very fine sand.
The terrace segment on which the town: of Braggs is located covers an area of about 16 square miles and is one of the most extensive in the report area. The total thickness of the deposit is not known, but wells 13N-20E-8baal and 14N-20E-31cccl were augered to a depth of 92 feet without reaching bedrock. The data from nine test and observation wells augered in this area indicate that the terrace de posit ranges in thickness from a thin mantle near 'the bedrock inliers west of Braggs to more than 92 feet in sees. 5f 6, 7, and 8 in T. 13 N., R. 20 E. Samples taken from these wells ranged in size from silt to very coarse sand but were primarily medium sand.
The terrace segment north of the U.S. Highway 59 bridge across the Arkansas River covers an area of about 9 square miles. Five test and observation wells show that these deposits range from 5 to 57 feet in thickness. Samples taken from well 10N-24E-5bbcl were mostly medium to coarse sand but contained small amounts of fine to medium

T12 CONTRIBUTIONS TO THE HYDROLOGY OF THE UNITED STATES
gravel from, depths of 7 to 31 feet. Well 10N-24E-4cccl penetrated mostly medium sand but contained smaller amounts of finer and coarser sand from depths of 37 to 57 feet. Samples taken from the remaining test and observation wells were composed mainly of silt and very fine sand.
Three areas of relatively large segments of terrace deposits where no test holes were augered includes parts of sees. 1,2,11, and 12, T. 11 N., R. 22 E., and sees. 9-15, T. 10 N., R. 25 E., Sequoyah County; and an area northeast of the town of Spiro in T. 9 N., R. 26 E., LeFlore County.
The depths to water measured in 32 wells in the terrace deposits range from 6 to 48 feet and average about 30 feet. The large varia tion is due to the location of the wells on topographically high or low ground.
Except for small isolated patches which contain no appreciable amount of ground water, the terrace deposits along the Arkansas River yield small to moderate amounts of water adequate for most domestic and stock use. Wells of large yield probably cannot be developed in the terrace deposits.
ALLUVIUM
Deposits of Recent alluvium underlying the flood plain consist of clay, silt, sand, and gravel in proportions that vary locally but re main reasonably consistent throughout the flood plain for broad areal correlation. Alluvium generally is gradational from clay or silt at the top to sand and gravel at the base. It ranges in thickness from a featheredge at its contact with the terrace or bedrock formations to a maximum of 55 feet, and averages about 40 feet.
By interpretation of aerial photographs and surface mapping, the alluvium was subdivided into several types of flood-plain deposits, such as point-bar, natural-levee, backswamp, and channel-fill deposits, (pi. 1) (Waterways Experiment Station, 1951). Point bars repre sent deposits formed by lateral accretion; natural levee, backswamp, and channel fill represent deposits formed by vertical accretion or overbank flow. Basically, point bars originate within the confines of the channel; natural-levee, backswamp, and channel-fill deposits consist of material deposited as a result of flood water flowing or stand ing outside the channel (Wolman and Leopold, 1957, p. 91).
Point-bar deposits are formed on the convex bank or inside stream meanders by lateral accretion, as the meander curve increases in radius and migrates downstream. Deposition is related to the circular flow associated with the channel bend. Both the deposition on the convex bank and the simultaneous erosion on the concave bank tend to be
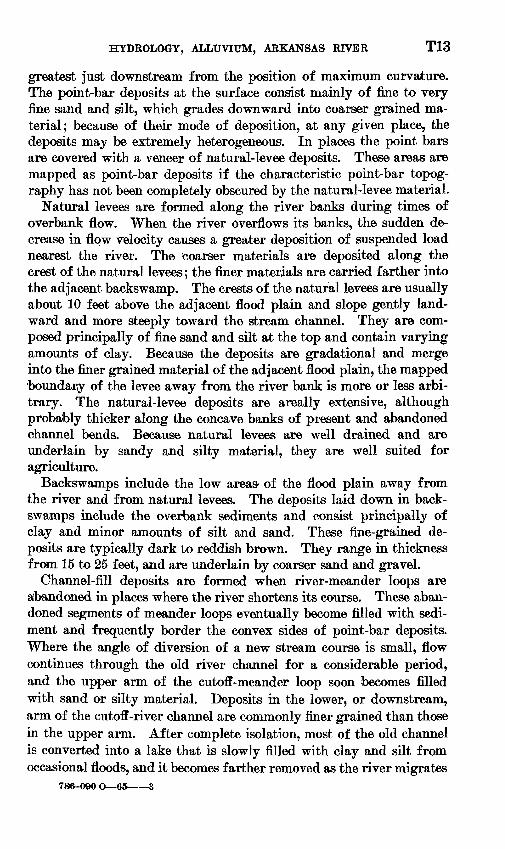
HYDROLOGY, ALLUVIUM, ARKANSAS RIVER T13
greatest just downstream from the position of maximum curvature. The point-bar deposits at the surface consist mainly of fine to very fine sand and silt, which grades downward into coarser grained ma terial; because of their mode of deposition, at any given place, the deposits may be extremely heterogeneous. In places the point bars are covered with a veneer of natural-levee deposits. These areas are mapped as point-bar deposits if the characteristic point-bar topog raphy has not been completely obscured by the natural-levee material.
Natural levees are formed along the river banks during times of overbank flow. When the river overflows its banks, the sudden de crease in flow velocity causes a greater deposition of suspended load nearest the river. The coarser materials are deposited along the crest of the natural levees; the finer materials are carried farther into the adjacent backswamp. The crests of the natural levees are usually about 10 feet above the adjacent flood plain and slope gently land ward and more steeply toward the stream channel. They are com posed principally of fine sand and silt at the top and contain varying amounts of clay. Because the deposits are gradational and merge into the finer grained material of the adjacent flood plain, the mapped boundary of the levee away from the river bank is more or less arbi trary. The natural-levee deposits are areally extensive, although probably thicker along the concave banks of present and abandoned channel bends. Because natural levees are well drained and are underlain by sandy and silty material, they are well suited for agriculture.
Backswamps include the low areas- of the flood plain away from the river and from natural levees. The deposits laid down in back- swamps include the overbank sediments and consist principally of clay and minor amounts of silt and sand. These fine-grained de posits are typically dark to reddish brown. They range in thickness from 15 to 25 feet, and are underlain by coarser sand and gravel.
Channel-fill deposits are formed when river-meander loops are abandoned in places where the river shortens its course. These aban doned segments of meander loops eventually become filled with sedi ment and frequently border the convex sides of point-bar deposits. Where the angle of diversion of a new stream course is small, flow continues through the old river channel for a considerable period, and the upper arm of the cutoff-meander loop soon becomes filled with sand or silty material. Deposits in the lower, or downstream, arm of the cutoff-river channel are commonly finer grained than those in the upper arm. After complete isolation, most of the old channel is converted into a lake that is slowly filled with clay and silt from occasional floods, and it becomes farther removed as the river migrates
78&-O90 O 65 3

T14 CONTRIBUTIONS TO THE HYDROLOGY OF THE UNITED STATES
away from the old channel. Central parts of filled channels are commonly called "clay plugs" because the deposits, composed largely of clay and silt, are relatively impermeable. Test holes in a filled channel southwest of Fort Smith (section C-C', pi. 1) show thickness of silt and clay to exceed 30 feet.
In places, alluvium of tributary streams draining into the Arkansas River flood plain forms the deposits described previously. Distinc tion of the various types is not made on an areal basis, and the de posits are mapped (pi. 1) as a single unit called "tributary alluvium." The tributary alluvium generally is composed of very fine grained sand, silt, and clay and has low permeability.
A general feature of the alluvium is the gradation in grain size from gravel, or coarse sand, near the base of the deposit to silt and clay near the surface. (See geologic sections pi. 1.) Because alluvial material of one grain size grades complexly into that of another, the line separating the upper and lower material is only approximate. In places the thickness of the upper part may exceed 40 feet, but it is typically 20-30 feet. The lower part of the alluvium, composed of sand and gravel, is the most permeable and is typically 10-20 feet thick.
Alluvium underlying the flood plain is the principal aquifer along the Arkansas River. The general character, distribution, and thick ness are shown on plate 1. Most of the alluvium has some coarse sand and gravel at its base, but large-capacity wells cannot be developed in some areas. These areas shown on the geologic map (pi. 1) as backswamp deposits, channel-fill deposits, or tributary alluvium gen erally have proportionately greater amounts of clay, silt, and fine sand and will not yield water readily to wells. Areas shown as point-bar deposits or natural-levee deposits generally have proportionately greater amounts of coarser materials which transmit water more readily and ordinarily yield moderate to large quantities of water.
Measured yields from four aquifer tests range from 130 to 860 gpm (gallons per minute). Yields of irrigations wells reported by farm ers range from 200 to 1,000 gpm. It is likely that yields ranging from 200 to 600 gpm can be obtained in large areas of alluvial point-bar and natural-level deposits, and yields of 100 to 200 gpm in most areas of backswamp deposits.
GROUND WATER IN THE ALLUVIUM
PRINCIPLES OF OCCURRENCE
Ground water in the alluvium is derived primarily from the in filtration of precipitation that falls as rain or snow. Part of the precipitation runs off directly into streams, a part evaporates, and a

HYDROLOGY, ALLUVIUM, ARKANSAS RIVER T15
part is transpired by vegetation. The part that escapes surface run off, evaporation, and transpiration percolates downward through the soils and alluvium into the zone of saturation.
Clay, silt, sand, and gravel of the alluvial deposits along the Arkansas River contain innumerable openings, called voids or in terstices. These openings are the receptacles that contain ground water. The ratio of the volume of open spaces or voids to the total volume of the material is the porosity of the material and is expressed as a percentage. A material is said to be saturated when all its in terstices are filled with water. Well-sorted deposits of uncemented gravel, sand, or silt have a high porosity, regardless of the size of the particles. Poorly sorted deposits have much lower porosities be cause the finer particles tend to fill or plug many of the interstices between the larger particles.
Porosity determines the amount of water that a material can hold, but the amount of water that a saturated material will yield when allowed to drain by gravity is less than the porosity of the material because some of the stored water is retained in the open spaces by capillarity. The specific yield of a water-bearing material is the ratio of the volume of water drained by gravity to the total volume of the material, and generally the ratio is stated as a percentage. Under water-table conditions the specific yield, is approximately equal to the coefficient of storage. The coefficient of storage may be defined as the volume of water an aquifer releases or takes into storage per unit surface area per unit change in the component of head normal to that surface. Because drainage from the finer materials in the upper part of the alluvium is slow, the coefficients of storage computed from aquifer tests usually are smaller than the specific yield determined from laboratory analyses of samples in a particular area. However, these coefficients of storage are believed to represent the response of the aquifer to short-term changes in head, and they are useful in analyzing the effects of pumping for short periods and the short-term effect on ground-water levels caused by variations in the river stage. The specific yield determined in the laboratory is useful in analyzing changes in storage that result from permanent or long-term change in water levels.
The rate at which an aquifer, transmits water depends upon the permeability of the aquifer. The coefficient of permeability is de fined as the volume of flow per unit time per unit hydraulic gradient through a unit area. The coefficient of permeability in meinzer units may be expressed as the rate of flow of water in gallons per day through a cross-sectional area of. 1 square foot under a hydraulic gradient of 100 percent at a temperature of 60° F. The field coeffi-

T16 CONTRIBUTIONS TO THE HYDROLOGY OF THE UNITED STATES
cient of permeability is denned as the number of gallons of water a day that percolates under prevailing conditions through each mile of water-bearing material under investigation (measured at right angles to the direction of flow) for each foot of thickness of the material and for each foot per mile of hydraulic gradient (Wenzel, 1M2, p. 7). Permeability is related not only to the number and size of openings in a material but also to the degree of interconnection of these open ings. For example, clay or, silt may have relatively high porosity, but, because of the small size of the particles, the voids between the particles are very small, and the water in these voids is held by molecular attraction as a thin layer on the surface of each particle. These layers of water are not free to move in fine-textured material; therefore, the permeability, or water-transmitting capacity, of the material is low even though its porosity, or water-bearing capacity, is high. The coefficient of transmissibility is equal to the field coeffi cient of permeability multiplied by the thickness (in feet) of the saturated part of the aquifer.
PHYSICAL AND HYDROLOGIC PROPERTIES
The quantity of water that an aquifer (a water-bearing material or rock) will yield depends upon the physical and hydrologic prop erties of its constituent materials. Detailed descriptions of the logs of test and observation wells drilled in the alluvium are useful in appraising its hydrologic properties. However, more accurate quan titative estimates require comprehensive analyses of the water-bearing materials by laboratory and aquifer tests. Laboratory tests of samples collected during drilling were made to determine their physical and hydrologic properties. Aquifer tests were made at four locations to determine the hydrologic properties of the alluvium under field condi tions. Hydrologic properties determined by laboratory methods in cluded porosity, specific yield, and permeability; those determined by aquifer tests included permeability, transmissibility, and storage.
LABORATORY TESTS
The physical and hydrologic properties of the alluvial sediments were determined by analyses of samples in the U.S. Geological Survey Hydrologic Laboratory at Denver, Colo. Work in the laboratory included tests to determine the dry-unit weight, porosity, specific yield, and permeability coefficients of disturbed samples. The samples were also analyzed mechanically to determine size, distribution, and percentages of constituent grains. The results of laboratory deter minations are summarized in table 2.

HYDROLOGY, ALLUVIUM, ARKANSAS RIVER T17
TABLE 2. Physical and hydrologic properties of the alluvium
Well Depth(feet)
Porosity(percent)
Specificyield
(percent)
Coefficientof permeability (gpdper sq ft)
LeFIore County
9N-25E-6dddL
12dcbl ... ...
9N-26E-labbl ....
6cbcl-
10N-24E-23dbal ... ... ... .... ... ... .... ... ..
10N-26E-34bdbl. ...
10N-27E-16bbbl - .... .....
20ccal
0- 77-12
12-17 17-22 22-27 27-32 32-37 37-39 7-22
22-32 32-37 37-48 2- 77-12
12-17 17-22 22-27 27-32 32-35 0- 77-12
12-17 17-22 22-27 27-32 32-37 37-42 42-45 12-2222-32 32-41
7-1212-17 17-42 42-46 2- 77-12
12-17 17-22 22-27 27-32 32-37 37-43 7-22
22-3232-37 37-42 42-47
47.546.8 43.8 34.7 36.2 32.8 33.2 28.7 44.635.1 30.9 30.0 55.154.7
, 45.3 42.6 34.3 32.1 32.1 49.844.5 39.6 36.2 37.4 36.2 34.7 32.8 31.3 37.834.0 27.9 42.533.2 32.0 33.8 47.944.2 40.8 39.2 33.6 32.5 32.5 32.8 52.3
46.6 39.7 33.8
25.530.4 30.9 29.2 31.9 29.2 30.7 25.6 29.429.7 27.0 25.3 10.825.8 24.2 31.9 29.0 26.1 25.4 21.930.4 25.2 27.2 29.5 30.1 32.7 29.6 26.4 28.928.7 22.7 35.225.6 29.1 28.8 41.035.7 38.6 38.2 32.5 31.9 31.9 31.7 10.6
18.3 31.5 28.8
15 7
85 120 170 180 140
1110 150 220 .00'
.1 1
23 310
81 98
.35 2
12 35 72
206 190 150 2290
160 100100 390 280
6011 41
130 200 340 310 310
0.07
.5 260 360
Seqnoyah County
10N-26E-22babl. ............
23bbbl _-
llN-27E-20dddl. . ........
0-77-12 12-15 15-17 17-22 22-27 27-32 32-37 37-42 7-1717-32 32-47 7-1212-17 17-22 22-27 27-32 32-37 37-42 42-44
47.247.2 43.4 44.2 39.6 27.2 31.3 30.9 32.5 43.042.9 34.2 50.947.9 47.2 39.6 41.9 43.4 43.8 32.8
28.225.0 32.4 40.5 36.4 25.0 30.1 29.7 26.2 28.334.1 29.8 13.833.9 37.7 31.3 32.3 31.2 34.1 31.7
0.61 4
160 56 55
200 220 300
731 79
.02314 10 22 8 11
430

T18 CONTRIBUTIONS TO THE HYDROLOGY OF THE UNITED STATES
TABLE 2. Physical and hydrologic properties of the .alluvium Continued
Well Depth (feet)
Porosity (percent)
Specificyield
(percent)
Coefficientof permea bility (gpdper sq ft)
Sequoyah County Continued
llN-27E-27bbbl_ -
30ddbl
0-1212-17 17-22 22-48 7-22
22-32 32-40
46.140.1 36.0 27.3 37.133.5 30.4
23.533.6 30.8 23.8 32.429.7 28.8
2130 120 330 280450 450
Haskell County
llN-22E-35dddl... .. . . . 4-1414-2424-34 31 n44-49
48.936.8 36.6 33.1 31.6
26.425.5 31.2 28.6 25.3
212 130 150 130
Muskogee County
12N-20E-llaaal .
24bbbl_
12N-21E-29ddbl.. ... .. . . ..
14N-19E-35dddl_.
12-1717-22 0- 77-12
12-17 17-22 22-27 27-32 32-37 37-42 42-47 7-17
17-27 27-37 37-42 7-32
32-37 37-45
38.229.9 49.149.1 50.6 49.4 43.8 35.5 36.6 37.4 32.8 45.538.6 35.4 32.2 44.732.2 33.8
30.825.5 20.720.6 20.5 19.6 25.5 29.3 31.8 32.1 27.4 30.220.7 36.6 19.5 18.824.1 23.0
60270
.2
.1
.1
.1 5
250 290 500 230 37
2 52 7 .3
300 125
AQUIFER TESTS
The field method for determining the coefficients of permeability, transmissibility, and storage ordinarily consists of pumping a well steadily at a known rate of discharge and measuring the drawdown of water levels during pumping and the recovery of water levels after pumping stops. Measurements are made in the pumped well and one or more observation wells. These methods are described by Wenzel (1942) and, more recently, by Ferris and others (1962).
Four aquifer tests were made in the alluvium during this investiga tion. During each test, with one exception, a well was pumped at a constant rate for 72 hours and the drawdown of the water level in the pumped well and its two or more observation wells was measured. After pumping was stopped, the recovery of the water was measured for 72 hours. The exception was pumped well HN-27E-30dacl, where measurements of water level could not be made; the pumping

HYDROLOGY, ALLUVIUM, ARKANSAS RIVER T19
rate of this well varied considerably during the drawdown phase of the test, and only the rate of water-level recovery in two observation wells was analyzed.
The drawdown and recovery data obtained from the aquifer tests were analyzed by means of the Theis nonequilibrium formula, the modified nonequilibrium formula, and the Theis recovery formula (Ferris and others, 1962, p. 92-102).
Table 3 summarizes the results obtained from six aquifer tests. In cluded in the table are results of two aquifer tests conducted by the U.S. Geological Survey in 1948 (Schoff and Eeed, 1951, p. 27) on wells in the alluvium about 3 miles southwest of Fort Gibson, OMa.
RELATION OF LABORATORY AND FTBU> DATA
Permeability values obtained from laboratory analyses (table 2) are much lower than permeability values computed from aquifer tests (table 3) in the same general area. The discrepancy is caused by the difficulty of bringing material having a high permeability to the sur face by drill, especially medium to coarse gravel. Thus, these samples did not represent the character of the material in place, and the per meabilities differed considerably from that determined on undisturbed material by aquifer tests.
To estimate the hydrologic properties for a large area, the aquifer properties must be known at many different points. Because it was not feasible to conduct sufficient aquifer tests to define in detail the hydrologic characteristics of the alluvium between Muskogee and Fort Smith, the aquifer tests were supplemented by laboratory tests and by careful examinations and interpretations of test- and observa tion-well cuttings to extrapolate known data to other parts of the area.
To determine the relation of grain size to permeability for. materials in the alluvium, laboratory data were used to graph (on logarithmic
TABLE 3. Summary of the coefficients of transmissibility, permeability, and storage determined 1>y aquifer tests
Well
LePlore County: 9N-25E-12dcbl ............. .................................
Sequoyah County: HN-27B-«OddbL............ .......... ......_. -
Muskogee County: 12N-21E-29ddbl... ..--_..-.-.-.-_..._.........._ ..- ._-..14N-19B-«Mddl.- . ...... ....- ........ . .- . .15N-19E-21dcdl i. ..............................................
23bddl >-. -..__ -- - ..-._._._-. . .
Coefficient oftrans-
missibility (gpd
per ft)
85,000
109,000
50,00083,00067,00079,000
Coefficient of permea
bility (gpd per sqft)
2,600
3,600
2,6004,1003,0002,800
Coefficient of storage
0.05
.20
.03
.004
i Schoff and Reed (1951).

T20 CONTRIBUTIONS TO THE HYDROLOGY OF THE UNITED STATES
paper) median grain size of samples against permeability (fig. 4). The point scatter shown on the graph is believed to be due to differ ences in sorting, character, and arrangement of grains, although the pattern shows a definite relation between sand sizes and permeability. This relation may be expressed as:
where the permeability, K, is directly proportional to some constant, <7, and the square of the median grain size, d (Jacob, 1950, p. 324).
This relation between grain size and permeability was used to re vise the permeabilities of well-log samples at sites where aquifer tests had been made to a range of values that would conform to permeabili ties obtained in the laboratory and in the aquifer tests. These values are given in table 4.
1000
oC/5
100
100.01 o.i
MEDIAN GRAIN SIZE, IN MILLIMETERS
1.0
FIGURE 4. Relation of median grain size to permeability of samples from Muskogee, Okla., to Fort Smith, Ark.
HYDROLOGY, ALLUVIUM, ARKANSAS RIVER T21
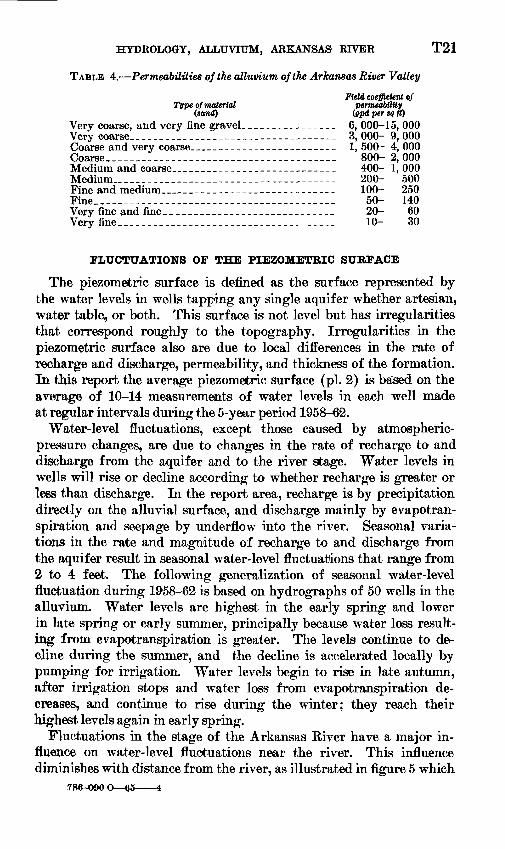
TABLE 4. Permeabilities of the alluvium of the Arkansas River Valley
Field coefficient ofType of material permeability
(sand) (gpd per tq ft)Very coarse, and very fine gravel._______________ 6, 000-15, 000Very coarse___________________.____ 3,000- 9,000Coarse and very coarse_______________________ 1,500- 4,000Coarse,.,___-_--_-----___----------_--------_ 800- 2,000Medium and coarse..__________________________ 400- 1, 000Medium____________________________ 200- 500Fine and medium___________________________ 100- 250Fine,. . - 50- 140Very fine and fine_______________________ 20- 60Very fine_________.__--__._-________ 10- 30
FLUCTUATIONS OF THE PIEZOMETRIC SURFACE
The piezometric surface is defined as the surface represented by the water levels in wells tapping any single aquifer whether artesian, water table, or both. This surface is not level but has irregularities that correspond roughly to the topography. Irregularities in the piezometric surface also are due to local differences in the rate of recharge and discharge, permeability, and thickness of the formation. In this report the average piezometric surface (pi. 2) is based on the average of 10-14 measurements of water levels in each well made at regular intervals during the 5-year period 1958-62.
Water-level fluctuations, except those caused by atmospheric- pressure changes, are due to changes in the rate of recharge to and discharge from the aquifer and to the river stage. Water levels in wells will rise or decline according to whether recharge is greater or less than discharge. In the report area, recharge is by precipitation directly on the alluvial surface, and discharge mainly by evapotran- spiration and seepage by underflow into the river. Seasonal varia tions in the rate and magnitude of recharge to and discharge from the aquifer result in seasonal water-level fluctuations that range from 2 to 4 feet. The following generalization of seasonal water-level fluctuation during 1958-62 is based on hydrographs of 50 wells in the alluvium. Water levels are highest in the early spring and lower in late spring or early summer, principally because water loss result ing from evapotranspiration is greater. The levels continue to de cline during the summer, and the decline is accelerated locally by pumping for irrigation. Water levels begin to rise in late autumn, after irrigation stops and water loss from evapotranspiration de creases, and continue to rise during the winter; they reach their highest levels again in early spring.
Fluctuations in the stage of the Arkansas River have a major in fluence on water-level fluctuations near the river. This influence diminishes with distance from the river, as illustrated in figure 5 which
786^090 O $5 4

- 466
LU 464
462
460
458
12N-20E-24bcbl - 7800 ft from river
12N-20E-24baal 5000 ft from river12N-21E-18bcbi 1000 ft from river
O
<
Arkansas River at Webbers Falls
1960 1961 1962
FIGURE 5. Hydrographs of three wells is a profile normal to the Arkansas River, stage of the Arkansas River, and5-day precipitation totals at Webbers Falls.

HYDROLOGY, ALLUVIUM, ARKANSAS RIVER T23
shows hydrographs of three wells in a profile normal to the Arkansas Eiver near Webbers Falls. Well 12N-21E-18bcbl is 1,000 feet from the river, 12N-20E-24baal is 5,000 feet from it, and 12N-20E-24bcbl is 7,800 feet. The water level in the well near the river responds quickly to fluctuations in river stage. The two distant wells along the profile reflect fluctuations that compare more closely to local precipi tation than to the stage of the river.
The diminishing effect of the river stage on water-level fluctuations with distance from the river is further illustrated by plotting1 the magnitude of the fluctuations of several wells at varying distances from the river during a period of exceptionally high flow in May 1961 (fig. 6). The distances from the river are shown on the abscissa and the height of water-level fluctuations in wells is shown on the ordinate. The curve indicates the rapid decrease in the influence of the river on water-level fluctuations as the distance from the river is increased. It shows that the influence of the river during this particular high stage did not extend much beyond 3,000 feet from the river.
MOVEMENT
Ground water moves down the hydraulic gradient from areas of recharge to areas of discharge. Plate 2 shows the configuration of the average piezometric surface of the ground-water body by contour lines that connect points of equal altitude on the average piezometric surface. The general direction of ground-water movement, which is at right angles to the contours, is toward the Arkansas River, and its main tributaries with a component of movement downstream.
The hydraulic gradient in the alluvium ranges from 2 to 20 feet per mile, but over most of the area averages about 10 feet per mile. The gradient is much steeper in areas of lower, permeabilities, such as near the confluemje of the Verdigris and the Arkansas Kivers north east of Muskogee and along the Poteau Kiver south of Fort Smith. The hydraulic gradient in the terrace deposit averages about 60 feet per mile north of Muskogee and near Braggs. Ground water moves toward and enters the alluvium, which is hydraulically connected to and topographically lower than the terrace deposit.
RECHARGE
Ground-water recharge is the addition of water to a ground-water reservoir. It may be accomplished by underflow from adjacent areas and aquifers, infiltration of excessive irrigation water, influent seep age from streams and ponds, and infiltration of precipitation. In filtration of precipitation is the most important source of recharge in the Arkansas River valley.

T24 CONTRIBUTIONS TO THE HYDROLOGY OF THE UNITED STATES
16y^River
14
10
WellA 12N-21E-18bcbl B 12N-21E-18acal C 10N-24E-13bcdl D 10N-25E-36cda2
0 500 1000 1500 2000 2500 3000
DISTANCE FROM RIVER, IN FEET
FIGURE 6. Height of water-level rises at distances from the river.
Average annual precipitation is about 43 inches, but only a part of this water reaches the saturated zone. The greatest part is lost through evapotranspiration and surface runoff, but a small part goes to ground-water recharge. Recharge is greatest in areas underlain

HYDROLOGY, ALLUVIUM, ARKANSAS RIVER T25
by more permeable surface materials, such as point-bar and natural- levee deposits (pi. 1). The amount of recharge varies with the amount and distribution of precipitation and the amount of water lost by evapotranspiration. Recharge usually is effective during late fall through early spring, when the amount of precipitation lost by evapo transpiration is low.
The piezometric surface in alluvium is affected by several hydrologic agents: a hydraulically connected stream that varies continually in head, recharge from precipitation, discharge by evapotranspiration, and pumping from wells. Because of the dynamic and interrelated action of these agents, the aquifer never achieves a stage of precise equilibrium, although under natural conditions the hydrologic system of the aquifer is in approximate equilibrium. The average piezo metric surface will be in approximate equilibrium with the average stream stage, and the amount of recharge will equal the amount of dis charge when recharge and discharge are normal over a long period of time.
The rate of recharge by infiltration of rainfall is computed at several places in the project area by analysis of the average piezo- metric-surface map (pi. 2). A part of the aquifer isolated by natural hydrologic boundaries was selected, and measurement of the flow of ground water into or out of the isolated area allowed the computa tion of recharge to or discharge from the area. Ground-water flow was indirectly measured on the basis of the average hydraulic gradi ent and transmissibility of the aquifer, and computed by a modifica tion of Darcy's law, which is expressed as
Q=TIL
where Q is the flow in gallons per day, T is the transmissibility of the aquifer in gallons per day per foot, / is the average hydraulic gradient in feet per mile, and L is the length of the line, in miles, across which the flow is being computed.
Approximate rates of recharge and discharge are tabulated in table 5 for about half the .total area of alluvium. Average recharge, in inches per year, is computed from average discharge figures because, as previously stated, recharge and discharge are equal when the aquifer is in a state of equilibrium. On the basis of data in table 5, it was estimated that the average annual recharge in the Arkansas River alluvium was equivalent to about 20 percent of the precipita tion for the period of record. Recharge varies from 8 to 12 inches and is greatest in areas underlain by permeable point-bar and natural- levee deposits, and least in areas underlain by backswamp and channel- fill deposits. Recharge to 140 square miles of alluvium between Mus-

T26 CONTRIBUTIONS TO THE HYDROLOGY OF THE UNITED STATES
TABLE 5. Recharge and discharge m selected areas of the Arkansas River valley
Area
Fort Qibson _________
Moffett ____ _____ ..
Approxi mate size
(sq mi)
108
131724
Estimatedaverage
transmis-sibility
(gpdperft)
70,00060,00050,00060,00060,000
Average slope
(ft per mi)
1088
1210
Approximate
length ofaquifer(miles)
811131217
Averagedaily
discharge(mgd)
5.64.45.27.2
10.2
Average recharge
(in.peryr)
1211899
kogee and Fort Smith was estimated, on the basis of an average re charge rate of 9 inches per year, to be about 60 mgd (million gallons per day).
The amount of underflow from adjacent terrace deposits and from bedrock is probably small because the permeabilities of those rocks are low. Information derived from 29 test and observation wells augered in terrace deposits indicate that most deposits in the report area consist of varying amounts of clay, silt, and very fine sand. Terrace deposits that are relatively thick and extend over large areas may contribute water in significant amounts to the alluvium. These deposits are near Braggs in T. 13 N., R. 20 E.; near Muskogee in T. 16 N., R. 18 E., in T. 10 N., R. 24 E., and in T. 11 N., R. 22 E.; and northeast of Spiro in T. 9 N., R. 26 E. No tests were made in bedrock units to determine their hydrologic properties, but their permeabili ties are believed to be small compared with the permeability of the alluvium, and consequently any exchange of water between alluvium and bedrock probably will be small and will occur along fractures and fissures in the bedrock.
Recharge resulting from infiltration of excessive irrigation water is not important because irrigation is limited at the time of writing (1963). Future development of irrigation in more favorable flood- plain areas may cause irrigation practices to become an important factor in recharge to the alluvium.
Recharge by influent seepage occurs only for relatively short periods of time and short distances from the river during periods of extreme high stages of the river. Normally, the ground-water gradient is toward the river. As the stage of the river rises, the natural ground- water gradient toward the river is decreased and ground-water dis charge into the river is reduced. As the river continues to rise, the ground-water gradient near the river is reversed temporarily and water from the river recharges the alluvium. When the stage of the river declines, the ground-water gradient near the river is again re versed ; water stored in the alluvium near the channel returns to the river and restores the normal water-table gradient. The amount of

HYDROLOGY, ALLUVIUM, ARKANSAS RIVER T27
recharge to the alluvium and the lateral distance that water levels are affected depend on the magnitude and duration of the rise in river stage.
DISCHARGE
When water derived from precipitation reaches the saturated zone, it becomes part of the ground-water body and moves in a direction determined by the hydraulic gradient to points of discharge. Ground water is discharged continuously from alluvium and terrace deposits by evapotranspiration, springs, wells, and seepage into streams.
Seepage into streams and evapotranspiration are the most im portant means of ground-water discharge. The rate at which ground water is discharged is influenced by the hydrologic properties of the aquifer, depth to water, slope of the piezometric surface, types and density of vegetation, and season of the year.
The general direction of movement of ground water in the alluvium is toward streams. The p-art that is not discharged by evapotran spiration, springs, and wells is discharged into streams by seepage. The total ground-water discharge into streams is not known, but the average discharge from selected areas was computed from the average piezometric surface map (table 5).
Evapotranspiration is the loss of water to the atmosphere by evap oration from land and water surfaces and by transpiration from plants. Ground water is discharged by evaporation in places where the water table or capillary zone is near the land surface. The degree that water will rise due to capillarity depends primarily upon the grain size of the material above the water table the finer grained the material, the greater the distance the water will rise. The thickness of the capillary zone will vary from a few inches in sand to several feet in silt and light clay. The depths to which plant roots reach for water varies greatly with the different plant species, the different soils, the depth to water, and the amount of precipitation. Ordinary grasses and field crops, except alfalfa, do not draw water from depths of more than a few feet. Alfalfa, a phreatophyte, sends its roots into the capillary zone to depths greater than 10 feet under certain conditions. In most places the natural vegetation occurs along streams and abandoned channelways. Common types of vegetation that use large quantities of ground water include cotton wood, willow, and saltcedar, which send their roots to the saturated zone and inter cept ground water that otherwise would be discharged into streams. Evapotranspiration of ground water is greatest where depths to water are least. In most parts of the flood plain the depth to water is about 15 feet, and discharge of ground water by evapotranspiration

T28 CONTRIBUTIONS TO THE HYDROLOGY OF THE UNITED STATES
is probably small. Most of the precipitation that falls within the area is discharged by evapotranspiration before it reaches the sat urated zone. It was estimated that about 20 percent of the precipita tion penetrates to the saturated zone. Much of the remainder is dis charged by evapotranspiration at or near the surface and by surface runoff into streams.
Most springs in the report area discharge at or near the base of high-terrace deposits. Yields from springs are probably small and are not an important source of ground-water discharge. A spring near Spiro, reported to be perennial, supplies drinking water for resi dents in that area, and its discharge is estimated to be about 3 gpm.
Water discharged by wells is used principally for irrigation, and in lesser amounts for domestic, public-supply, and industrial needs; these uses are listed in the order of the quantities pumped in 1962. The quantity pumped for each use is discussed in the section on "Utilization."
STORAGE
The storage capacity of alluvium along the Arkansas River valley depends upon the volume of saturated material and its specific yield. Alluvium between Muskogee and Fort Smith covers about 90,000 acres and the saturated material has an average thickness of about 25 feet. On the basis of the above dimensions and an assumed specific yield of 20 percent for the material, the average usable ground-water storage capacity is about 450,000 acre-feet.
UTILIZATION
In 1962 about 1,700 acre-feet of water was pumped from the allu vium. About 90 percent was used for irrigation, 5 percent for in dustry and public supply, and 5 percent for domestic and stock use.
IRRIGATION STTPPWES
Use of ground water for irrigation is small except in the Webbers Falls area, where 17 irrigation wells were inventoried. Total annual pumpage for irrigation varies from year to year, depending upon the amount and distribution of rainfall during the growing season. Ac cording to a survey of irrigation in Oklahoma in 1963 (Duffin, 1963, p. 3-5), the irrigated acreage in Muskogee, Sequoyah, Haskell, and LeFlore Counties, all of which are in the alluvium of the Arkansas River, totaled 1,180 acres. On this basis, the annual pumpage is estimated to be about 1,500 acre-feet. Pumpage for irrigation at the

HYDROLOGY, ALLUVIUM, ARKANSAS RIVER T29
present rate has very little effect upon the total volume of water stored in the alluvium.
Prior to 1959, surface centrifugal pumps were used as the most common method of lift. The centrifugal pump is connected by a manifold to three or more sandpoint wells, commonly 2 inches in diameter, which are driven about 10 feet apart in the alluvium. To lift water the pump must be within 20 feet of the pumping level of the water. The closer the pump is to the water level the more ef ficiently the pump will operate; therefore, many installations are below land surface in dug pits. Capacity of an installation of this type is estimated to be 200-500 gpm, depending on the size of the pump, number and diameter of wells, and permeability of alluvium pene trated by wells.
The increased installation of turbine pumps since 1959 indicates a growing preference by irrigators for the turbine over the centrifugal pump. Large-diameter wells used for irrigation are drilled by hydraulic-rotary or cable-tool methods, and most wells have 10- or 12-inch steel casings set on bedrock. Below the water table, wells have slotted casings or well screens and are completed with a 4- or 6-inch gravel-pack envelope. Discharge from a turbine-pump in stallation averages about 400 gpm for wells which were inventoried, although dicharge of individual wells varies considerably according to the size of pump, number of stages, size of screen and gravel pack, well development, and properties of alluvium penetrated by a wall. A properly constructed and developed well equipped with a large turbine pump, at a favorable location in alluvium, should pump about 600 gpm.
INDUSTRIAL AND PUBLIC SUPPLIES
The only known industrial well is owned by the Oklahoma Gas and Electric Co. The well (15N-19E-21bddl), which is in the al luvium of the Arkansas River east of Muskogee, pumped an average of 48,000 gpd (gallons per day) in 1962.
The only public-supply well (14N-20E-31daal) in the report area furnishes water to the town of Braggs. It is located about iy2 miles southwest of Braggs on a high-terrace deposit. The well is 47 feet deep, has an 18-inch-diameter tile casing, and was dug at the site of a former spring. The spring fills three underground storage tanks nearby, and this water is pumped into a 30,000-gallon elevated storage estimated to be about 1,500 acre-feet. Pumage for irrigation at the

T30 CONTRIBUTIONS TO THE HYDROLOGY OF THE UNITED STATES
average of 30,000 gpd. Webbers Falls and Moffett do not have public- supply systems but obtain their water supplies from individual small- diameter wells driven in the alluvium. Fort Gribson and Gore obtain their water supplies from the Neosho and Illinois Kivers.
DOMESTIC AND STOCK STJPPXJBS
Domestic and stock wells in the alluvial deposits along the Arkan sas Kiver are drilled or driven. Drilled wells are commonly cased with 6-inch galvanized steel, which is perforated below the water table. Generally the driven wells are constructed with 2-inch pipe and a drive point fitted with a sand screen that is driven 10-15 feet below the water table. Most domestic and stock wells are equipped with cylinder pumps. The cylinder is below land surface and lifts the water to the point of discharge by suction. A few domestic wells are equipped with jet pumps that lift water by a stream of water under pressure. Pumping is concentrated in and around Moffett and Webbers Falls, and in the rural areas surrounding Gore, Braggs, and Fort Gibson. An estimate of the population and the density of farm dwellings in the project area indicates that probably less than 100 acre-feet per year is pumped from the alluvium and terrace deposits for domestic and livestock purposes.
AREAS POTENTIALLY FAVORABLE FOB DEVELOPMENT OF GROUND WATER
Quantities of ground water adequate for domestic or stock use are available almost everywhere on the alluvial flood plain. Larger quan tities of water for irrigation, municipal, or industrial use are available in areas underlain by moderate thicknesses of permeable material. The permeable material is the principal water-bearing part of the aquifer and, as used in this report, is medium sand or coarser material. It is commonly 10-20 feet thick but may be as much as 40 feet thick. In most places the permeable material is predominantly medium to very coarse sand and gravel containing some finer sand, silt, or clay. However, where there is a high proportion of silt or clay mixed with the permeable material, the availability of water is reduced. The availability of water is increased if the permeable material is pre dominantly gravel or if the proportion of silt or clay is low. Com parison of well yields and thicknesses of permeable material at several pumping-test and irrigation-well sites indicate that where the thick ness of the permeable material is greater than 15 feet, wells capable of yielding 200-600 gpm can be developed.

HYDROLOGY, ALLUVIUM, ARKANSAS RIVER T31
The thickness of the alluvium and the permeable material at each test-hole site is shown on plate 3. Areas where the thickness of the permeable material is estimated to be 15 feet or more are shaded; how ever, the size and shape of the shaded areas are only approximate, owing to the heterogeneous character of the alluvium and to the lack of detailed geologic data in most of the area.
CHEMICAL QUALITY OF THE WATER
By JOHN J. MUBPHY
The suitability of water for beneficial use is dependent on its quality. Concentrations of calcium, sodium, sulfate, chloride, nitrate, fluoride, and dissolved solids, and hardness are some of the important characteristics of water that affect its use. This section discusses the quality of water in the alluvium, the suitability of the water for beneficial use, and the possible reasons for areal variations in water quality.
The significant factors that affect the quality of water in alluvium are the permeability and chemical composition of the surface and near-surface materials through which precipitation percolates, the chemical composition of the aquifer, seepage from adjacent or under lying formations, and the length of time the water is in contact with aquifer materials.
Because factors which affect water quality may act with varying intensities in different parts of the alluvium, samples were collected initially from more than 100 wells and test holes. To determine the variation in quality with time, wells selected from the initial group were sampled twice annually during 1960 and 1961.
Water from most wells in the alluvium is of the calcium, magnesium bicarbonate type, hard, and of moderate dissolved-solids content (table 6). Except at a few places, sulfate, chloride, and nitrate concen trations are low. Scattered data indicate that concentrations of fluoride are about 0.2 ppm (part per million) and that boron is gen erally less than 0.2 ppm.
The maximum, minimum, and modal concentrations of principal constituents determined.are shown in table 7. The modal, repre senting the concentration that occurs most often, is shown as a single value; different levels of dissolved-solids content occur so frequently that the central tendency of concentrations is a range rather than a single value. The specific conductance, an approximation of the dissolved-solids content, ranges from 160 to 2,870 micromhos and the modal conductance is 500 micromhos (table 7). The central tend ency, however, ranges from 250 to 750 micromhos.

T32
CO
NT
RIB
UT
ION
S T
O T
HE
HY
DR
OL
OG
Y O
F TH
E
UN
ITE
D
ST
AT
ES
I O
O-H
P»e>
» CO
P»CO»O
OS
P»iQtO
OO
OS
Ol^
rtOt
I 06060006 od
060606061^ oot^r-'t^t-^
061^ 06 061
DoSS »« soqroojoiro) j
2?§&f2S
aoireionpnoo ogioadg '
t-t-«<
"
'.-icO
'
rt
aoao aoos
Pioot^^G
O
t^. t- ao ao t~
nmipos jnaojej
-*
O5C
OO
O-*
O
-*CO
C»C
C
-HC
OO
-H t^-eo
* tc
t- *
io«
Ti<
c
a i
O O
>O W
3 QO
O W
O
O 0
0 O
O C
O
CO
QO
^ O
C*l
(O-BjodBA
a no anpi -saj) spiios paA
iossicr
(g) noaog
I («O
N)
O-H
OO
'
o
' '
OO
-H
O
CD
(IO)
** O i ( CO
b-
Oi-ieC
kO
kO
-H
^-H
-H
-H
^lrtc5rt-H
oo
^p
oo
CO
S) a»«Jing
(8OO
)
(8OO
H)(3
)
00
00
0
NO
tOtC
O
OO
OO
O
00
00
0
00
00
0
-*r»-*-*rt
i^-aooco rt
0
' i-i J
J
N
Nffl
tnmpog
u: c
ffi -HN
tC
fl ^H
1
ocS
oo
SK
oio
ioro
s?j28
« o.2 a
III!"0
3
3
CO
C
O C
O W
11111 iiiil 11111 11111 IIIW
Wfj
SS
§ &
§ g
o^sa^S
g§§o§'
sT5**
5"
to5"*!-!
co-52
88?8
«!«
<!»
P
«!
&5
5p
{2
gg
^ta
®«
O
i
5
>§c§
r P
N
N t
-
00 ^
» 0
0 M
2S
2 » ;
o>
t
^ t
coco
taco
co o>
oooo
,L,t5
S
so
00
O
O
O
O
OOOOOO OOOOO
OOl*.
CO OO OOO O OOO
co
o>
o
o
>h
~g
g-*
l O
OW
GO
GO
O
CO
CO
CO
O^
J
tO t
O W
> 5
O
CO
CO
OC
CO
Ol
pi
00
00
* 0
0
«O I
*.
O E
J
W I*.
p<
t
o
oo
oo
oat
oj-aojo
^i
ifc
o
0
to to
O>
CO
O>
oS
; i
3
to=>
g
j
n
C
» ito
7l 1
V] >3 i0 w s£
V]
i ! co i ! 1
g
0 i
10 eo i10 GO
ta to
| i
! !
M O
O
! !
I I
CD
>
*
O0
O
> 8 I* i
1 - 0
kd
OO
O
S O
O 00
O5
O
frO O
tO C
oooooo
gfe
cnS
So
H^
H^
H^
tOH
^
t-tO
Ot3>
-O
h'C
CO
O
OC
nC
CC
OC
OC
O^
l
tooooh
to
5 Co
coco
co
en i^
en
01 rf
CO C
O CO
CO
0000
0000
*^1
CO 0
0 00
CO
00
CO 0
0 00
CO
00
CO 0
0 CO
00
CO
CO 0
0 CO
00
CO
*!
00
CO 0
0 CO
»
! 00
*!
*! *
4 il^cotd
o
i->
cntd
cnco
tC
ttC
tCoco
o
to to to ton-
oi oto
i-'
toi C
TiW
i*.
cci->
oto
to
cccm
->-a
oo
28J,
H3A
IH
SV
Stf
VX
HV
'K
IUA
imv
'

T34
CO
NT
RIB
UT
ION
S T
O T
HE
HY
DR
OL
OG
Y
OF T
HE
U
NIT
ED
S
TA
TE
S
fe, e£«o»"CD <&> o
^II^ £ S
3!°e
-i1eto rf£!S§ £%0
0
^
ei»iiae
t** o
o
00000000
00
00
GO
00
00
0000000000
00
00
00
00
00
(OoBS V* soqraojojra) oraB
Jonpnoo oijioadg
OIIBJ noijdjospB-um
ipogO
QU
3P10Q
OQ
i-l CO
CO C
OO
ssgg
rampos jnaoje j
oo i-im
i-ioo o
oo
eot~
eo
i-i
Ia
(OoOSI V3 now
-ejodBA9 no anpt
-sej) spnos p9Aiossi(i
r-i^N
Mco
N
i-iNco
eo
(3) nojoa
(«ON
)
do)
CO
S)
(800
)
(8OO
H)
O
O
IM
(3) rantssBjoj
ranipog
(BQ)
o>eo>o to cc cc «
TH 0
0
O^
^O
CO
t*
to C
O
StO
(MM
-HrH
(M
IM
to to
o
TflO
OO
O
OO
OO
O
OO
OO
O
33
r-trlOO
0
0«
0
3 tc S3
'S
JD
SjD
.Q'rt
ort'O
'^'^
O
S'O
caosS
.o
S'O
oS
'O
JO
S
o3
t»t»
O
Di-H
03^3'Q
JO
'O'O
JO
O
UO
OT
fiC
O
«O
«O
O>
i-l»H
(N
CO
<-l "9
U9
O-*
100000
O>
«-n
-"-"
S5

to to
to *
* i *
* * i
*itk
rfkC
CC
CC
C
tOtO
dO
"g t
t2
22
O-c
r&o
" an
?s
& &&
&!
8 SSggg
Si
£Jn
| to
JO
K<
»
§£.
£82
S
3
t-1
- cc
y>
ooooo ooooo ooooo oooo
O
OO
CO
C5O
O
OO
OO
O
OO
OO
So
ocn
KS
iS
SS
^ic
n
Mcc
*.p
o*.
SS
D^I
WO
to
pi t
o po
Si
to
poo^
aoo
SS
fci^
f
<O<O
O>O
> O
rft
O
h t
OO
lrf^
O
5
CO
Itt
1to
to" 9 ^
M W O
to
to31 *.
3
M tow bO
i
to
p
w
to ^ i
§1 ] 1
i
o
co
pto
to
co
co Pff
O
tnrf
k
«S
! !
5e
D
h-^ X
1
! i
gg
JS ! i
»9
fcO s»
sii£
§ Bi
l^l
sss
en v
t ^ K
*O
OC
OO
OO
H^
CO
tO
h^ C
C CO
H^
CC fe
d *
* ^
- tO
* *
^-
Cn
^ C
C rf
^ O
Cb
VtC
CO
CC
bd
>-
* *
OO
O
OO
Cn
tO
OO
fCO
CO
O
tfe
tOrf
^O
C
CtO
OO
OO
to
O
CO
tO^
I O
OO
rf^
O&
O
CO
Oit
^tO
O
cc i
* en
to to
* * ^
to
cc
* *
to
co
oocccoo
oo
cnto
en
to
coCO
ccit
kfi
fk
to v
i to
en
CO
Soo
ovi
2£
S<
CC
Cni
Ctc
'tO
> -
) oo
cocc
tocn
to*-
1 co
cn
ccco
cc
oo
rf^r
f^-a
rf
^ecc
ocoe
c cc
i^c
- -
!$£ 0
0 rfk
IP?
td
cn
oc
; >; >
; >p°
r^
r^r^
r^r^
?0
oopo
oopo
po
<»
0000
0074
M
M<i
po^i
^i
popo
oopo
to
oio
oo
tocc
oirf
^cn
ecec
on^i
*^
o
en e
n-a-
a to
tooi
tj-a
oo
t-'to
toto
98X
SVSN
VSHV
'w
niA
niiv
'

T36
CO
NT
RIB
UT
ION
S T
O T
HE
H
YD
RO
LO
GY
O
F T
HE
U
NIT
ED
S
TA
TE
S
AMM!. *,. v,,, , *,, wwyavs uj wtMvrjrvrn tne aimmum atong me Arkansas River between Muskogee, Okla., and Fort Smith, Ark. Continued
S(OoSS *8 souraojojtn)
aonBjonpnoo onjoadg
OJJBJ nojidjospis-innipog
feT
OQ
mrn
rr
tatijpos inaojad
Hardness as CaCOa (ppm)
1
3So>' §§O
epnoqoBonoN
I
QO
t*» QO
t*» QO
Q
O
t*» t*» t*» 1
§8888 g 8861<N
«t<«t<«t<«t< «X
u
o
«d c
ST
flMC
5 '
'
sssss g as*!^S
SS
S
g
SO
D^O
«8
88
8
= =
Sg
|
88688 § 8SSi(QoOST 1B 10^
! I
i g
-uiooBAa no anpt
: !
| g
-saj) spuos paAiossja
1 !
!
(g) nojoa
(SON) *>BJ?TN
(^apiaonM
(TO) aPI-romo
(fos) *>?nns
(8OO
) »»BnoqjBO
(JOO
H) *>B
noqjBoia
(3)tn
n|SSB^
(BN) nm
ipog
(Wonusan^
(BO) tnnp^Bo
I
(j^^adtn
ax
111
Q> 0>
'oJ
1
8 S
S0
0
i i °
\ '< ',
<9 tO
O
N
>-
C6
ooooo
oooo
38838 8688
i |"22
; |
; ;
SS1K88
i
t»C
O
^H
^-I^
H
F
0sS
3
S
July 16, 1958 July
11, 1958...
Aug. 14, 1959..
NO
00
f
t
32bbbl 33ccbl..-2aaal .....
13N-19E-2cdcl.....
1 O
5O
5
sss
IM14N-19E-24abbl. 36baal....

HY
DR
OL
OG
Y,
AL
LU
VIU
M,
AR
KA
NSA
S R
IVE
R
t**00t**0
0
OO
OO
OD
OO
QO
0
00
00
00
00
0
OO
OO
t**
T37
OC
4U
3O
C4
O
O^
ION
O
OC
Ot
'oi
'-i
! !
N
I i
IN
r-l
OO
OO
O
O
OO
O
OO
O
raC^c&
c&c?
so oo S
jj ^
t*« 10
8 5
!
N
OT
N
000
s_3?
S'tSu'S 'S
'S'S
s'S
t5 'tStS
_ «
oo
o
ooo<
jo
o
loo
:o
-p-

T38 CONTRIBUTIONS TO THE HYDROLOGY OF THE UNITED STATES
TABLE 7. Maximum, minimum, and modal concentrations of chemical constit uents in water from the alluvium between MusTcogee and Fort Smith
[In parts per million]
County
Sequoyah...LeFlore- _HaskelL. ....Muskogee ....
Mode for
Sodium(Na)
Max
12915546
153
Min
0.99.36.241
16
Bicarbonate(HC03)
Max
600618546560
Min
8613213870
200
Sulfate(SOi)
Max
363199112198
Min
0.0.0
21.01.2
25
Chloride(Cl)
Max
100308
5645
Min
0.55.648.8
8.5
Nitrate(NO,)
Max
223853365
Min
0.0.0.0.0
0.8
Calcium,magnesium
hardness as CaCOs
Max
520950504640
Min
9611613864
225
Specificconductance(micromhos
at 25°C)
Max
1,0002,870
8901,040
Min
208254450160
500
More than 90 percent of the water samples collected in the area are of the calcium, magnesium bicarbonate type. Calcium and mag nesium hardness, expressed as CaCO3, ranges from 40 to 950 ppm. Of the two ions, calcium is dominant. The concentration of bicar bonate, which ranges from 70 to 618 ppm, comprises 80-90 percent of the total anion concentration. The maximum concentrations listed for sodium, sulfate, chloride, and nitrate are not indicative of typical water in the alluvium. In general, they represent temporary and localized conditions, which are caused by seepage from bedrock or adjacent formations or by contaminated seepage from the land surface.
The principal uses of 'ground water in this area are for domestic and irrigation supplies.
The U.S. Public Health Service Drinking Water Standards (1962) state that the following chemical substances should not be present in a water supply in excess of the listed concentrations, if, in the judg ment of the reporting agency and certifying authority, other suitable supplies are or can be made available.
Parts perConstituents million
Total dissolved solids_____,_____________________ 500 Chloride ____________________________________ 250 Sulfate ___________________________________ 250 Nitrate ____*_____________________________ 45
The chloride, sulfate, and nitrate contents of the water in only a few wells exceed the recommended maximum values. Wells in which the dissolved-solids content of the water exceeds 500 ppm are more numerous.
Hardness is an undesirable characteristic of water used for domestic purposes. The water in most wells is very hard, exceeding 181 ppm.
Quality of water used for irrigation of crops must be of acceptable standards. Excessive sodium and dissolved solids may result in in-

HYDROLOGY, ALLUVIUM, ARKANSAS RIVER T39
jury to crops. Because of the moderate to low sodium and dissolved- solids contents, most of the water in the alluvium is within the general "excellent to good" and "good to permissible" classifications for irri gation use (Wilcox, 1948).
Intense or prolonged pumping of wells adjacent to the river may induce water of poor quality from the river to enter the alluvium. In some areas prolonged pumping during periods of drought may reduce the hydraulic head sufficiently to induce water of poor quality from the bedrock. Under these conditions the concentrations of so dium, chloride, sulfate, and dissolved solids in the water would in crease and thereby impair the suitability of the water for beneficial use.
EFFECT OF CHANGED RIVER CONDITIONS ON THE HYDROLOGIC SYSTEM OF THE ALLUVIUM
The alluvial valley of the Arkansas River is a large hydrologic system in which the river, the alluvial deposits, and the bedrock under natural conditions are in hydraulic connection and in dynamic balance. The construction of navigational facilities on the Arkansas River will alter the natural river gradient to a series of stepped pools be tween each lock and dam. Ground-water levels in the alluvium will adjust to the changed boundary conditions by rising in most areas and lowering in others. A permanent change in the water level will alter the recharge and discharge relation of the alluvium. This change, where significant, will affect recharge by precipitation, discharge by seepage, discharge by evapotranspiration, water-level fluctuation, storage, and quality of the water in the alluvium. These changes in the alluvium are discussed briefly in relation to the change in water level and boundary conditions.
Recharge ~by precipitation. Recharge will decrease, by the amount of recharge rejected, where water levels are raised at or near the land surface. Recharge will increase, by the amount of recharge rejected presently, where present water levels at or near the surface are low ered. There will be no change in recharge where no recharge is rejected by changes in water levels.
Discharge by evapotranspiration. Discharge will increase where water levels are raised to within the root zone of plants, or close enough to the surface to allow loss to the atmosphere. Discharge will decrease where present water levels, subject to evapotranspiration, are lowered. Discharge will not change where changes in water levels are beyond the effective reach of evapotranspiration.
Discharge by seepage. Discharge will increase where water levels are raised and transmissibility is increased. Discharge will decrease

T40 CONTRIBUTIONS TO THE HYDROLOGY OF THE UNITED STATES
where water levels are lowered and transmissibility is decreased. In most areas water levels will rise in the fine-grained material of the alluvium having low permeability, and transmissibility and discharge by seepage will not be increased significantly.
Water-level -fluctuations. Water-level fluctuations near the river are influenced primarily by the stage of the river. This influence decreases with distance from the river. Under, changed river condi tions the river will become a series of reservoirs that will maintain a nearly constant stage and thus stabilize ground-water fluctuations near the river. At a distance from the river, water levels fluctuate mainly in response to recharge and discharge. Generally, where water levels are raised, fluctuations of water levels are greater in magnitude and respond more quickly to recharge and discharge.
Storage. Storage will change with adjustment in water levels. Where water levels are raised or lowered, storage in the alluvium will increase or decrease. In most areas between Muskogee and Fort Smith the water level in the alluvium will be raised to increase stor age and the potential amount of water, that can be withdrawn.
Quality of water. Changes in the quality of water in the alluvium initially will be related to the altered quality of the river water. When the locks and dams are closed, temporary seepage of river water into the alluvium near the pools is to be expected. The distance of pene tration of influent seepage will depend on the length of time it takes for the ground-water level to reach equilibrium with the new river level. After equilibrium and the hydraulic gradient toward the river are reestablished, the intruded river water will discharge into the alluvium.
Raising and lowering ground-water levels will cause some altera tion in quality of water in the alluvium. Baising water levels will have the temporary effect of increasing the dissolved-solids content through the solution of the more soluble mineral constituents in the silts and clays in the upper part of the alluvium. As evapotranspira- tion increases there will be some concentration of mineral constituents in the upper zone, which will increase the mineral content of the water slightly. Lowering water levels will tend to confine the water to the coarser grained part of the alluvium, where less mineral matter is available for solution. Neither of these conditions will alter the gen eral calcium, magnesium bicarbonate type water. In some areas a lowered water, level will decrease the hydraulic head and permit in creased seepage from adjacent or underlying bedrock formations, which generally will cause a deterioration in quality of the water.

HYDROLOGY, ALLUVIUM, ARKANSAS RIVER T41
SUMMARY AND CONCLUSIONS
The important aquifer along the Arkansas River between Muskogee and Fort Smith is the alluvium. Its total thickness averages 42 feet and its saturated thickness about 25 feet. Kecharge from rainfall is estimated to average 9 inches, or 67,000 acre-feet, per year. Most of the discharge is by seepage into streams and by evapotranspiration. Discharge by pumping for all purposes in 1962 was estimated at 1,700 acre-feet, which is insignificant in relation to the estimated 67,000 acre-feet of annual recharge and 450,000 acne-feet of storage in the alluvium.
Additional development of ground water is possible in large areas of the alluvium, which have the potential to yield as much as 600 gpm of water to wells.
Ground water in the alluvium is principally of the calcium, mag nesium bicarbonate type. The water is moderate in dissolved-solids content and hard, but is suitable for irrigation, domestic, and some industrial use.
Changes in the river system as a result of the navigation project on the Arkansas Kiver will be reflected in changes in the recharge and discharge relation of the alluvium. These changes in most places will result in an increase in the amount of ground water available from the alluvium.
SELECTED REFERENCES
Duffln, R. B., 1963, Survey of irrigation in Oklahoma: Agricultural ExtensionService, Oklahoma State University, 11 p.
Ferris, J. G., Knowles, D. B., Brown, R. H., and Stallman, R. W., 1962, Theoryof aquifer tests: U.S. Geol. Survey Water-Supply Paper 1536-E, 174 p.
Huffman, G. G., 1958, Geology of the flanks of the Ozark Uplift: Oklahoma Geol.Survey Bull. 77, 281 p.
Jacob, O. E., 1950, Ground water, in Rouse, Hunter, ed., 1950, Engineeringhydraulics: New York, John Wiley & Sons, p. 321-385.
Knechtel, M. M., 1949, Geology and coal and natural gas resources of northernLeFlore County, Oklahoma: Oklahoma Geol. Survey Bull. 68, 76 p.
Oakes, M. O., and Knechtel, M. M., 1948, Geology and mineral resources of HaskellCounty, Oklahoma: Oklahoma Geol. Survey Bull. 67, 134 p.
Schoff, S. L., and Reed, E. W., 1951, Ground-water resources of the ArkansasRiver flood plain near Fort Gibson, Muskogee County, Oklahoma: OklahomaGeol. Survey Circ. 28, 55 p.
U.S. Public Health Service, 1962, Drinking water standards, 1962: U.S. PublicHealth Service Pub. 956, 61 p.
Waterways Experiment Station, 1951, Geology of the lower Arkansas Riveralluvial valley, Pine Bluff, Ark., to mouth: U.S. Army Corps of EngineersTech. Memo. 3-332.
Wenzel, L. K., 1942, Methods for determining permeability of water-bearingmaterials with special reference to discharging-well methods, with a sec-

T42 CONTRIBUTIONS TO THE HYDROLOGY OF THE UNITED STATES
tion on direct laboratory methods and bibliography on permeability and lamniar flow, by V. C. Fishel: U.S. Geol. Survey, Water-Supply Paper 887, 192 p.
Wilcox, L. V., 1948, The quality of water for irrigation use: U.S. Dept. Agri culture Tech. BulL 962, 40 p.
Wilson, C. W., Jr., 1937, Geology of the Muskogee-Porum district, Muskogee and Mclntosh Counties, Oklahoma, with a chapter on carboniferous stratig raphy, by N. D. Newell: Oklahoma Geol. Stirvey Bull. 57, 184 p,
Wolman, M. G., and Leopold, L. B., 1957, River flood plains; some observations on their formation: U.S. Geol. Survey Prof. Paper 282-C, p. 87-109.
o