hydrologic forecast centre manitoba infrastructure ... · same time providing sufficient storage...
TRANSCRIPT

Page 1 of 26
Hydrologic Forecast Centre
Manitoba Infrastructure
Winnipeg, Manitoba
FEBRUARY FLOOD OUTLOOK REPORT FOR MANITOBA
February 27, 2020
Executive Summary
The February Outlook Report prepared by the Hydrologic Forecast Centre of Manitoba Infrastructure
reports the risk of major spring flooding in most Manitoba basins is low. The risk of major spring
flooding is low for the Assiniboine River, Souris River, Qu’Appelle River and Saskatchewan River. The
risk of major flooding is also low for the Interlake and northern Manitoba regions.
Due to the above normal to record high soil moisture at freeze-up in southern and parts of central
Manitoba and normal to above normal winter precipitation to the end of February in most parts of the
U.S. portion of the Red River basin, the Red River valley is at a higher risk of major flooding. Generally,
the risk of major spring flooding is moderate to high for southern and southeastern Manitoba, including
the Roseau River and the Pembina River. However, this could change depending on weather conditions
between now and the spring melt.
Most of the major lakes are near normal to slightly above normal levels for this time of the year, and the
risk for lake flooding in most areas is low at this time. The risk of major flooding in Whiteshell Lakes is
moderate to high.
Soil Moisture Conditions at Freeze up:
Southern Manitoba, including the Red River Valley and central, eastern and western Manitoba, have
above normal to record high soil moisture. Northern Manitoba, including The Pas region, and Interlake
regions have near normal soil moisture. The U.S. portion of the Red River and Souris River basins have
above normal to record high soil moisture at the time of freeze up.
Winter Precipitation:

Page 2 of 26
Winter precipitation has been below normal to well below normal throughout most of Manitoba. Some
areas, including western and southwestern Manitoba and eastern Saskatchewan have experienced near
record low winter precipitation since November. Winter precipitation has been well below normal for
most of the Assiniboine and Souris River watersheds in Manitoba. Winter precipitation has been normal
to above normal in southern portions of the Red River basin in the U.S. The Souris River basin and the
northern portion of the Red River basin in the U.S. received below normal to well below normal
precipitation.
Snow Water Equivalent (SWE):
Snow Water Equivalent (SWE) is the measure of the amount of water content in the snow. SWE for
Manitoba watersheds range between zero and 120 mm. The largest amount of SWE accumulation (i.e., 75
mm to 120 mm) is located at the southern end of the U.S. portion of the Red River basin. Snow surveys
were also conducted by Manitoba Infrastructure staff and indicate between 15 mm and 45 mm less snow
accumulation than normal. SWE records indicate most areas in Manitoba and Saskatchewan have been
very dry since November 2019.
Base Flows and Levels:
Base flows and levels indicate the amount of water available in the system prior to spring runoff. Higher
base flows indicate higher soil saturation levels and higher spring runoff potentials. Base flows and levels
in most rivers have been declining since the Fall of 2019. Base flows and levels range between normal to
much above normal for southern and northern Manitoba basins. Base flows and levels vary from near
normal to above normal in central Manitoba basins.
Soil Frost Depth:
Frost depth is generally near normal to below normal throughout most of Manitoba. Generally, below
normal frost depth means the soil can absorb more melting surface water and can potentially decrease the
amount of overland flooding whereas above normal frost depth means the soil absorbs less water and
contributes to increased runoff.
Future Weather:
There is no significant precipitation forecasted for the next 10 days for all Manitoba basins. Both the
National Weather Service and Environment and Climate Change Canada predict near normal temperature
and precipitation for March, April and May.
Page 3 of 26
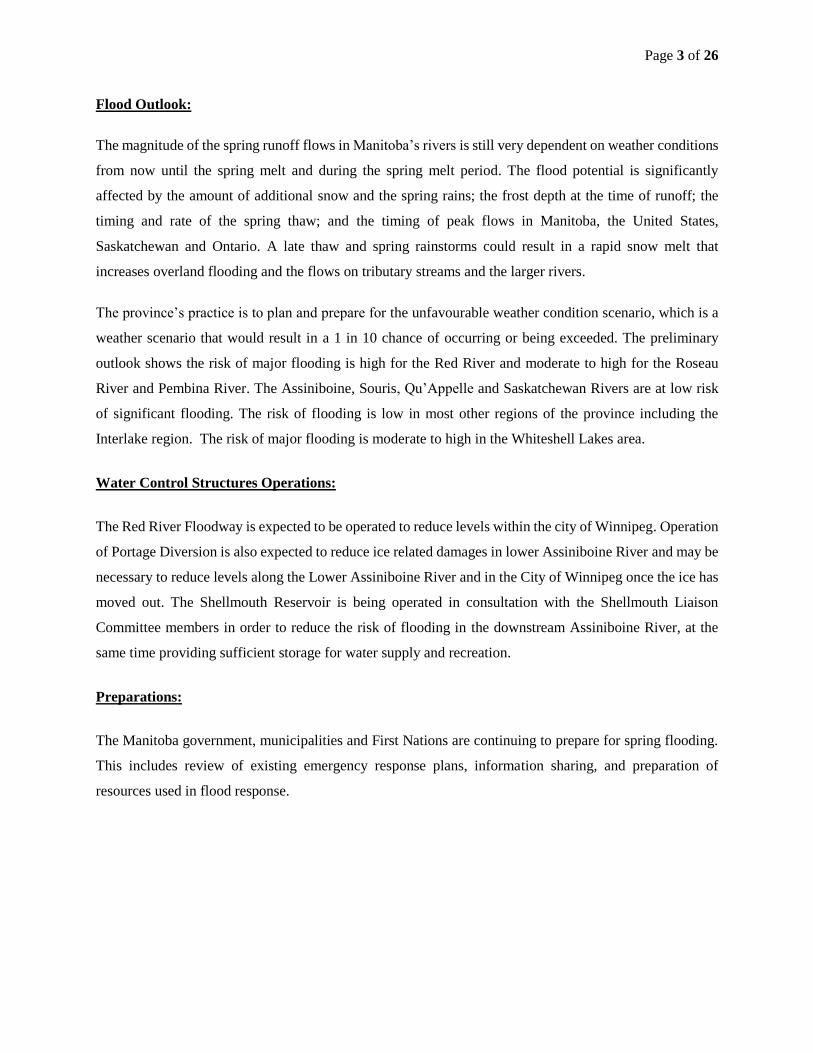
Flood Outlook:
The magnitude of the spring runoff flows in Manitoba’s rivers is still very dependent on weather conditions
from now until the spring melt and during the spring melt period. The flood potential is significantly
affected by the amount of additional snow and the spring rains; the frost depth at the time of runoff; the
timing and rate of the spring thaw; and the timing of peak flows in Manitoba, the United States,
Saskatchewan and Ontario. A late thaw and spring rainstorms could result in a rapid snow melt that
increases overland flooding and the flows on tributary streams and the larger rivers.
The province’s practice is to plan and prepare for the unfavourable weather condition scenario, which is a
weather scenario that would result in a 1 in 10 chance of occurring or being exceeded. The preliminary
outlook shows the risk of major flooding is high for the Red River and moderate to high for the Roseau
River and Pembina River. The Assiniboine, Souris, Qu’Appelle and Saskatchewan Rivers are at low risk
of significant flooding. The risk of flooding is low in most other regions of the province including the
Interlake region. The risk of major flooding is moderate to high in the Whiteshell Lakes area.
Water Control Structures Operations:
The Red River Floodway is expected to be operated to reduce levels within the city of Winnipeg. Operation
of Portage Diversion is also expected to reduce ice related damages in lower Assiniboine River and may be
necessary to reduce levels along the Lower Assiniboine River and in the City of Winnipeg once the ice has
moved out. The Shellmouth Reservoir is being operated in consultation with the Shellmouth Liaison
Committee members in order to reduce the risk of flooding in the downstream Assiniboine River, at the
same time providing sufficient storage for water supply and recreation.
Preparations:
The Manitoba government, municipalities and First Nations are continuing to prepare for spring flooding.
This includes review of existing emergency response plans, information sharing, and preparation of
resources used in flood response.

Page 4 of 26
Contents
Executive Summary ...................................................................................................................................... 1
Soil Moisture Conditions .............................................................................................................................. 5
Winter Precipitation ...................................................................................................................................... 5
Snow Water Content ..................................................................................................................................... 8
Base Flows and Level Conditions ............................................................................................................... 11
Soil Frost Depth .......................................................................................................................................... 12
Future Weather Outlook ............................................................................................................................. 12
Lake Level and River Flow Conditions ...................................................................................................... 14
River Ice Conditions and Ice Jamming ....................................................................................................... 15
Flood Outlook ............................................................................................................................................. 17
Red River ................................................................................................................................................ 17
Red River Floodway ........................................................................................................................... 18
Pembina River and Roseau River ........................................................................................................... 18
Assiniboine River.................................................................................................................................... 19
Portage Diversion ................................................................................................................................ 19
Shellmouth Dam ................................................................................................................................. 19
Souris River (South Western Region) ..................................................................................................... 20
Interlake Region ...................................................................................................................................... 20
Fairford River Water Control Structure .............................................................................................. 21
Eastern Region ........................................................................................................................................ 21
Manitoba Lakes ....................................................................................................................................... 21
Northern Manitoba and The Pas Regions ............................................................................................... 22
Flood Preparations ...................................................................................................................................... 22
Future Forecast Information ....................................................................................................................... 23
Appendix A: Definitions ............................................................................................................................. 24

Page 5 of 26
Soil Moisture Conditions
The soil moisture analysis is based on summer and fall precipitation. The analysis indicates near normal
soil moisture for northern Manitoba and most of Saskatchewan. Southwestern, central and southeastern
Manitoba and southern Saskatchewan have above normal to well above normal soil moisture (Figure 1).
Soil moisture is above normal to record high for the U.S. portions of the Red and Souris River basins.
Figure 1 – Soil moisture expressed as Antecedent Precipitation Index (API) for the fall of 2019.
Winter Precipitation
November to February precipitation has been below normal to well below normal throughout Manitoba and
Saskatchewan. The U.S. portion of the Red River basin received normal to above normal precipitation in
the southern portion of the basin and below normal precipitation in the northern portion of the basin (Figure
2). The U.S. portions of the Souris River and the Roseau River basins received normal to below normal
precipitation since November 1, 2019.

Page 6 of 26
Generally, Manitoba and most of Saskatchewan received 25 to 50 mm (1 to 2 inches) of precipitation from
November 1, 2019 to February 17, 2020, with up to 100 mm (4 inches) in the southeast corner of the
province. (Figure 3). The Souris River basin in the U.S. also received 25 to 50 mm (1 to 2 inches) while the
U.S portion of the Red River received 50 to 100 mm (2 to 4 inches).
Winter precipitation record in most of Manitoba and Saskatchewan has been tracking below 20 percent
when compared to past thirty years record (Figure 4). Figure 4 shows percent ranking plot - the percentage
of precipitation records since November – that it will equal or lower precipitation observed in the past thirty
years. Some areas in Saskatchewan and Manitoba have received record low precipitation during this time.
As can be seen in Figure 5, precipitation record as of February 17, 2020 indicates 15 to 45 mm less
precipitation than the normal amount of precipitation that would have been recorded at this time of the year.
Figure 2 - Percent of Normal Precipitation from November 1, 2019 to February 17, 2020.

Page 7 of 26
Figure 3 - Cumulative precipitation from November 1, 2019 to February 17, 2020.
Figure 4 – Percent ranking precipitation from November 1, 2019 to February 17, 2020, compared to historic record.

Page 8 of 26
Figure 5 - Precipitation from November 1, 2019 to February 17, 2020, deviation from normal in mm.
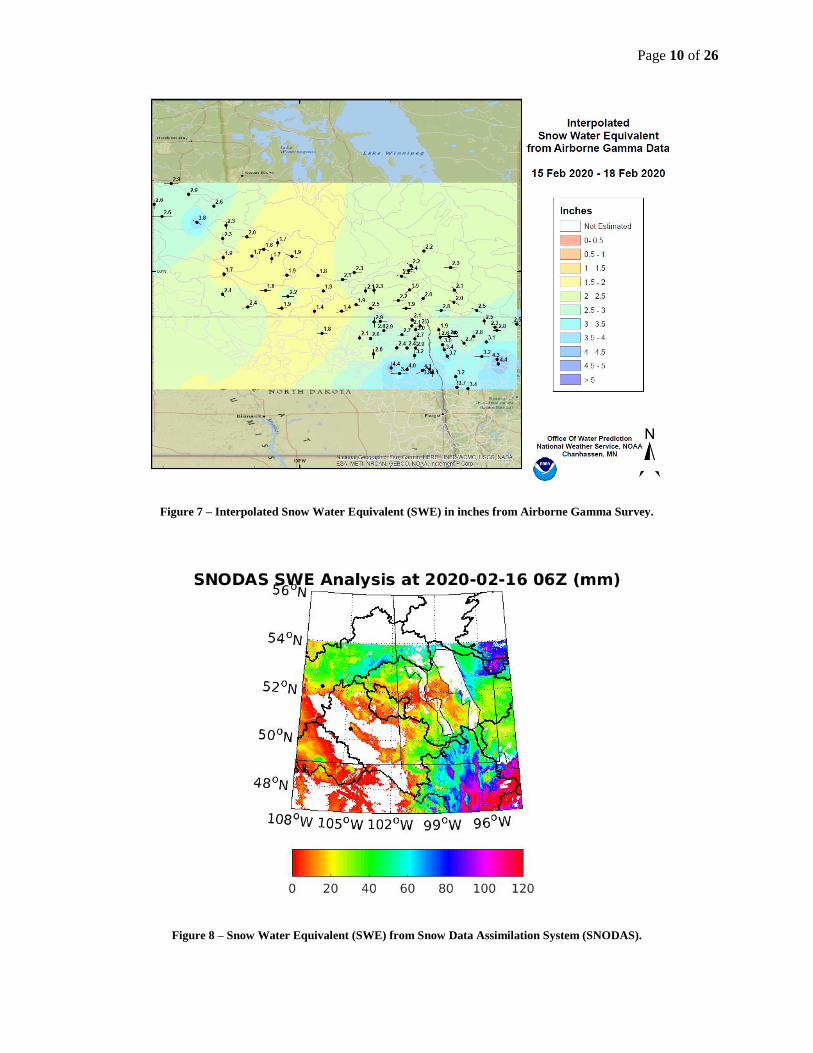
Snow Water Content
Snow water equivalent (SWE) estimates obtained from mid-February field measurements (Figure 6), the
gamma airborne survey (Figure 7), and Snow Data Assimilation System (SNODAS) (Figure 8) indicate
that the average water content in the snowpack is in the order of 25 to 60 mm (1 to 2.4 inches) in most of
southern, central and western Manitoba. Most of the dense SWE is in the U.S. portion of the Red River
basin where the SWE varies between 60 and 100 mm (2.4 to 4 inches). Northern Manitoba, including the
Saskatchewan River basin has approximately 65 to 85 mm (2.6 to 3.3 inches) of SWE.

Page 9 of 26
Figure 6 – Snow Water Equivalent (SWE) in mm from field measurements.
Page 10 of 26
Figure 7 – Interpolated Snow Water Equivalent (SWE) in inches from Airborne Gamma Survey.
Figure 8 – Snow Water Equivalent (SWE) from Snow Data Assimilation System (SNODAS).

Page 11 of 26
Base Flows and Level Conditions
Base flows and levels indicate the amount of water available in the system prior to the spring runoff. Higher
base flows indicate higher soil saturation levels and higher spring runoff potentials. Base flows and levels
in most rivers have been declining since the Fall of 2019. Base flows and levels range between normal to
much above normal for southern and northern Manitoba basins (Figure 9). Base flows and levels vary from
near normal to above normal in central Manitoba basins.
Figure 9 – Base flows and level conditions as of February 17, 2020.

Page 12 of 26
Soil Frost Depth
Soil frost depth is dependent on winter temperatures and the amount of snow cover insulation. The frost
depth is variable across the watersheds, but is generally considered to be normal to below normal throughout
most of the province. Figure 10 shows comparative measurement of frost depth at various locations across
the province. Frost depth was generally deeper in February 2018 and 2019 than it is now in February 2020.
Figure 10 – Frost depth in centimeters at various locations across the province.
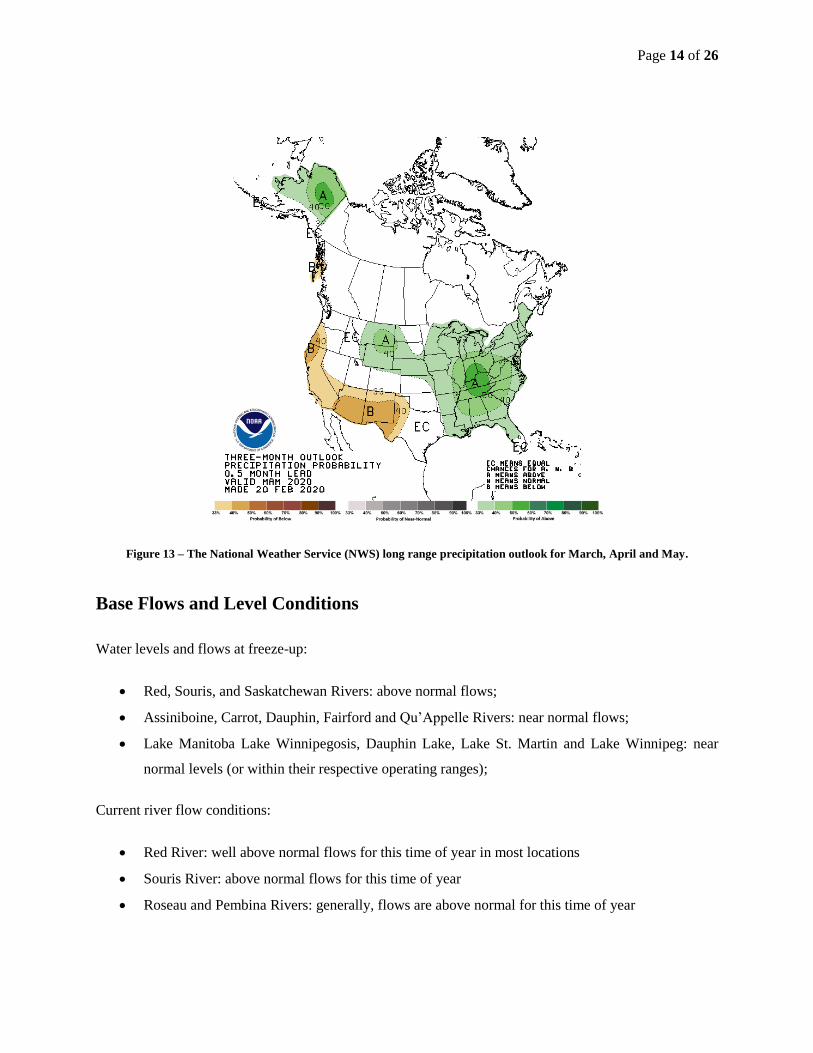
Future Weather Outlook
Future weather predictions are generally not reliable. Regardless, there is no significant precipitation
forecasted for the next 10 days for all Manitoba basins (Figure 11). In the longer range, both the National
Weather Service and Environment and Climate Change Canada predict near normal temperature and
precipitation for March, April and May (Figure 12 and 13).

Page 13 of 26
Figure 11 – Probability of receiving accumulated precipitation in excess of 10 mm between February 25th and March 6th.
Figure 12 – Environment and Climate Change Canada’s probabilistic long range precipitation outlook for March, April
and May.
Page 14 of 26
Figure 13 – The National Weather Service (NWS) long range precipitation outlook for March, April and May.
Base Flows and Level Conditions
Water levels and flows at freeze-up:
Red, Souris, and Saskatchewan Rivers: above normal flows;
Assiniboine, Carrot, Dauphin, Fairford and Qu’Appelle Rivers: near normal flows;
Lake Manitoba Lake Winnipegosis, Dauphin Lake, Lake St. Martin and Lake Winnipeg: near
normal levels (or within their respective operating ranges);
Current river flow conditions:
Red River: well above normal flows for this time of year in most locations
Souris River: above normal flows for this time of year
Roseau and Pembina Rivers: generally, flows are above normal for this time of year

Page 15 of 26
Northern rivers (including Red Deer, Saskatchewan, and Carrot Rivers): flows are above normal
for the Saskatchewan River but near normal for the Red Deer River and the Carrot River for this
time of the year
Assiniboine and Qu’Appelle Rivers: flows are near normal for this time of year
Interlake rivers (including the Waterhen, Fisher, and Fairford Rivers): flows are near normal for
this time of year
Current lake water levels:
The water levels on major lakes in Manitoba are near normal to slightly above normal heading into
the spring. Most lakes are within their respective operating ranges heading into the spring runoff.
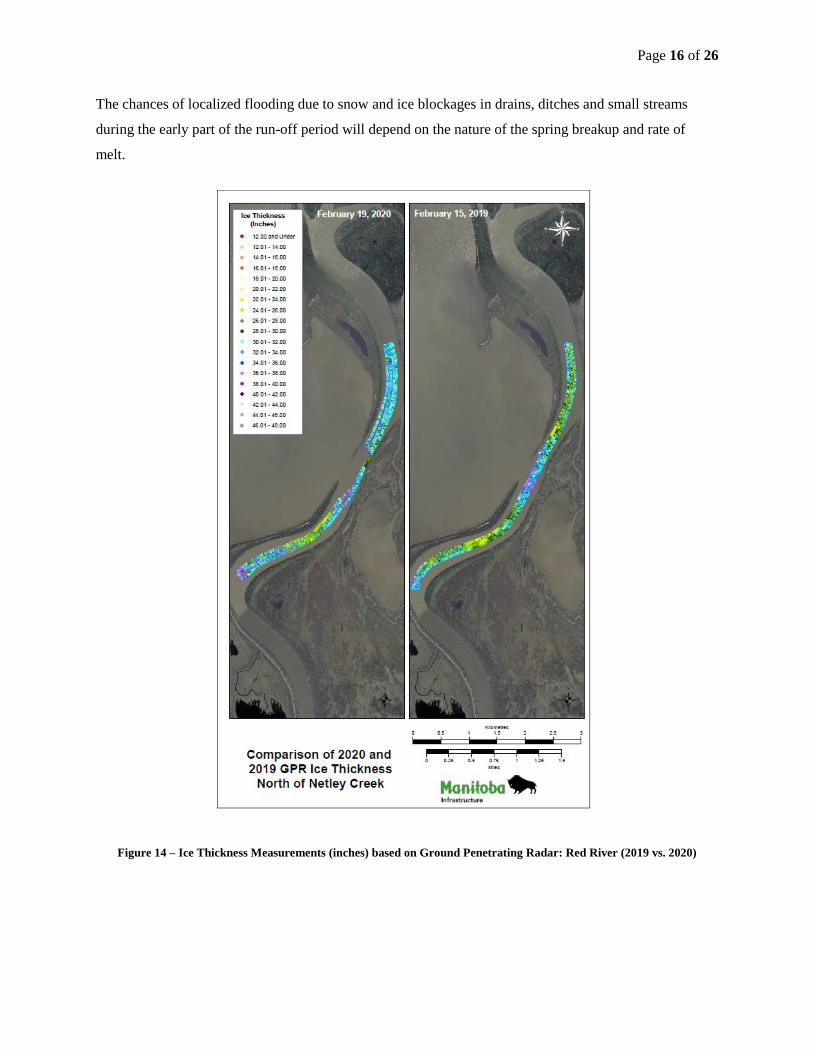
River Ice Conditions and Ice Jamming1
The Red River currently has a normal to slightly above normal ice thickness. Based on February
measurements this year, the ice thickness generally ranges between 56 cm (22 inches) and 132 cm (52
inches). The ice is slightly thicker than it was last year at this time (Figure 14). Normal ice thickness for
this time of the year varies according to the river flow velocity and the location of the river; it typically
ranges between 50 cm (20 inches) and 86 cm (34 inches).
Due to high flows at the time of freeze-up on many rivers, ice volume and thickness may be above normal
and could exacerbate ice jamming this spring.
Spring weather affects the timing and rate of the deterioration of the river ice, and will be a significant
factor in determining ice strength at break-up. It is difficult to predict the time of occurrence and extent of
ice jamming. However, with the ice cutting and breaking activities currently underway on the Red River,
the chance and severity of ice jamming and related flooding on the lower Red River should be reduced.
Localized flooding can occur when and where ice jams develop, even with below average river flows.
1 See Appendix A for ‘Ice Jam’ definition
Page 16 of 26
The chances of localized flooding due to snow and ice blockages in drains, ditches and small streams
during the early part of the run-off period will depend on the nature of the spring breakup and rate of
melt.
Figure 14 – Ice Thickness Measurements (inches) based on Ground Penetrating Radar: Red River (2019 vs. 2020)
Page 17 of 26
Flood Outlook2
Spring flood outlooks provide estimates of peak river flows and lake water levels that are based on current
basin conditions, and three possible future weather scenarios. These weather scenarios are: favourable,
normal, and unfavourable. The province’s practice is to plan and prepare for the unfavourable weather
scenario. For further information, see Appendix A: Definitions.
The extent of flooding is defined by three categories: major flooding, moderate flooding, and minor (no)
flooding. Major flooding is associated with property damages and significant economic impacts. Moderate
flooding is associated with flooding of agricultural lands and low-lying areas. In moderate flooding,
economic impacts are limited because flood levels are below the tops of most roads and are well below the
flood protection levels of community and individual flood protection works. Minor (no) flooding is
associated with no or very limited overland flows and peak river water levels generally remain within the
river banks.
A number of uncertainties exist with respect to the flood outlook. These include, but are not limited to, the
following:
future weather uncertainties (snowfall and spring rainfall);
winter snowpack, date of the onset of melt, and melt rate (i.e., timing and speed of snow melt);
uncertainty in meteorological and hydrometric data;
timing of the peak flows;
frost depth at the time of spring melt; and,
computer model prediction uncertainty.
Red River
There is a high risk of major spring flooding along the Red River main stem. The current soil
moisture is high throughout the basin. Winter precipitation has been below normal in Manitoba but
normal to above normal in most parts of the U.S.
2 See Appendix A for ‘Flood Outlook’, ‘Weather Scenarios’, ‘Favourable Weather’, ‘Normal Weather’, and ‘Unfavourable Weather’ definitions
7 See Appendix A for ‘Minor/Moderate/Major and Severe’ Flood risk definitions

Page 18 of 26
Favorable weather conditions, the risk of flooding is low
o Levels would be similar to spring peak levels observed in 2019 from Emerson to the Red
River Floodway Inlet.
Normal weather: high risk of moderate flooding
o Levels would be slightly lower than spring peak levels observed in 2011 from Emerson to
the Red River Floodway Inlet.
Unfavourable weather: high risk of major flooding
o Levels on the Red River main stem would be similar to 2009 from Emerson to Red River
Floodway Inlet
The risk of moderate flooding is high for the Red River’s southeast tributaries, such as the Rat and
Seine Rivers.
The flood protection level of the community dikes and the individual flood protection works within
the Red River basin are higher than the predicted peak levels, even in the unfavourable weather
scenario.
Red River Floodway
The Red River Floodway has been operated in 33 out of the 51 years since it has been constructed
for the purpose of providing flood protection to the City of Winnipeg.
Due to the expected high flows on the Red River, there is a very high probability that the Floodway
will be operated during the 2020 spring melt.
The ice-induced peak level at James Avenue could exceed the open water level.
Open water peak estimated levels at James Avenue are:
o Favourable weather: 5.55 m (18.2 ft)
o Normal weather: 5.8 m (19 ft)
o Unfavourable weather: 7.0 m (20.0 ft).
Pembina River and Roseau River
There is high risk of moderate flooding on the Pembina River and the Roseau River. Both basins
have received normal to below normal snowfall, but have above normal soil moisture.
o Favourable weather: low risk of flooding.
o Normal to unfavourable weather: high risk of moderate to major flooding.

Page 19 of 26
Assiniboine River
Very minor overbank flooding is expected on the Assiniboine River due to well below normal snow
water equivalent in the snowpack. Soil moisture in the watershed is normal to above normal.
o Favourable weather: low risk of flooding
Levels will be similar to 2019 levels from Shellmouth downstream to Brandon.
Levels will be similar to 2018 levels from Brandon to Portage la Prairie.
o Normal weather: high risk of moderate flooding
Levels will be similar to 2016 spring levels from Shellmouth downstream to
Brandon.
Levels will be slightly less than 2014 spring levels from Brandon to Portage la
Prairie.
o Unfavourable weather: high risk of moderate flooding
Levels will be similar to 2013 spring levels from Shellmouth downstream to
Brandon.
Levels will be similar to 1995 levels from Brandon to Portage la Prairie.
The preliminary flood outlook for the Qu’Appelle River at St. Lazare shows a low risk of flooding
even under unfavorable weather conditions.
Portage Diversion
The Portage Diversion has been operated 37 out of the 50 years since it was constructed to
preventice jamming on the Assiniboine River east of Portage la Prairie as well as to provide flood
protection to the City of Winnipeg and the areas along the Assiniboine River downstream of
Portage. Based on the runoff potential in the Assiniboine and Souris basins, operation of Portage
Diversion is expected to reduce ice related damages in lower Assiniboine River and may be
necessary to reduce levels along the Lower Assiniboine River and in the City of Winnipeg once the
ice has moved out.
Shellmouth Dam
The forecasted inflow volumes into the Shellmouth Reservoir for favourable, normal and
unfavourable conditions as of February 21, 2020 are 95,000 acre-feet, 200,000 acre-feet and
360,000 acre-feet, respectively.

Page 20 of 26
The Shellmouth Dam is being operated to provide storage capacity for reservoir inflows to reduce
flooding downstream as well as to ensure a sufficient reservoir level for recreation and water
supply. The current reservoir level as of February 21, 2020 is 425.42 m (1395.74 ft).
The Shellmouth Liaison Committee provides regular input into the Dam operations to meet the
target level of 427.33 m to 427.94 m (1402 ft to 1404 ft) after the spring runoff. The outflow from
the reservoir as of February 21, 2020 is 14.16 cms (cubic metres per second) or 500 cfs (cubic feet
per second).
Souris River (South Western Region)
Although the soil moisture within the Souris River basin is above normal, the snow accumulation
is below normal. Estimated flooding for the Souris River and its tributaries is as follows:
o Favourable weather: high risk of moderate flooding downstream of Minot along the main
stem of the Souris River.
Levels are expected to be generally similar to the 2009 spring levels.
o Normal weather: high risk of moderate flooding downstream of Minot along the main stem
of the Souris River.
Levels are generally expected to be between the 2009 spring and 2014 summer
levels.
o Unfavourable weather: high risk of moderate flooding downstream of Minot along the
main stem of the Souris River.
Levels are expected to be generally similar to the 2014 summer levels.
The existing dikes in the towns of Melita, Souris, and Wawanesa are at an elevation
which are high enough to protect against these flood levels.
Interlake Region
Soil moisture is near normal throughout the Interlake region with below normal snow
accumulation. There is low risk of flooding within the Interlake region.
As in most years, the risk of ice jamming is high for the Icelandic and Fisher Rivers.

Page 21 of 26
Fairford River Water Control Structure
The flow through the Fairford River Water Control Structure is currently operating at 62% of
maximum capacity. If and when the Lake Manitoba water level reaches 247.65 m (812.5 ft), the
structure will be fully opened, in accordance with the operating guidelines.
Eastern Region
The soil moisture is above normal and the accumulated snowpack is below normal for the Eastern
Region, including Winnipeg River. The potential risk of flooding is low in the eastern region.
Manitoba Lakes
Currently, most major lakes are within their operating ranges. Inflow into most Manitoba lakes is
normal to slightly above normal. Most lakes are expected to be within their normal operating range
after the spring runoff. The risk of spring flooding in most Manitoba lakes is low.
Lake Manitoba
Lake Manitoba’s current level is 247.32 m (811.42 ft).
The current level is 0.12 m (0.39 ft) below normal for this time of year, and is within the operating
range of 247.04 m (810.5 ft) to 247.65 m (812.5 ft).
After spring runoff, the lake level is expected to be within the operating range.
Lake St. Martin
Lake St. Martin is currently at 243.61 m (799.26 ft).
The current level is 0.32 m (1.05 ft) above normal for this time of year.
After spring runoff, the lake level is expected to be below flood protection works.
Lake Winnipeg
Lake Winnipeg’s current level is 217.83 m (714.68 ft).
The current level is 0.49 m (1.61 ft) above normal for this time of year and within the operating
range of 216.71 m (711 ft) to 217.93 m (715 ft).
Lake Winnipegosis

Page 22 of 26
Lake Winnipegosis is currently at 253.19 m (830.68 ft).
The current level is 0.04 m (0.13 ft) above normal for this time of year.
After spring runoff, the lake level is expected to be near normal levels.
Dauphin Lake
Dauphin Lake’s current level is 260.34 m (854.14 ft).
The current level is 0.02 m (0.07 ft) above normal for this time of year and within the operating
range of 260 m to 260.5 m (853 ft to 854.8 ft).
After spring runoff, the lake level is expected to be near normal levels.
Northern Manitoba and The Pas Regions
Soil moisture is generally near normal throughout the Saskatchewan River basin. The accumulated
snowpack is generally below normal for most of the basin. The peak open water level on the main
stem of the Saskatchewan River at The Pas is expected to be below bank full level in the
unfavourable weather scenario, although this will depend on future weather and the regulation of
Saskatchewan’s Tobin Lake outflows.
The risk of major flooding is low along the Saskatchewan River when considering all potential
weather scenarios.
The Carrot River near Turnberry and the Red Deer River near Erwood are both tracking above
normal streamflow conditions but have very low snow accumulation and therefore flooding is not
expected.
Similarly, Swan River is also not expected to experience flooding under normal weather conditions.
As in many other years, there is a risk of ice jam related flooding along the Saskatchewan and
Carrot Rivers.
Flood Preparations
As a matter of standard practice in the lead-up to the spring runoff season, the Manitoba government
and municipalities review existing emergency response plans, share information, and prepare flood
response resources.
The ice-jam mitigation program north of Winnipeg has commenced with ice cutters and ice
breaking equipment working along the Red River to break the ice from Selkirk to Netley Marsh.

Page 23 of 26
Future Forecast Information
If the spring melt and runoff has not yet begun, a second flood outlook will be published with updated
information towards the end of March when further precipitation and other weather details are available.
Page 24 of 26
Appendix A: Definitions
1 Ice Jam:
A blockage of ice on a river/stream which restricts flow, resulting in increased water levels
upstream.
Jams may occur due to changing river channel geometry, bends in the river channel, depth and
thickness of ice, rate of water level rise, or a solid section of ice downstream.
2 Runoff Potential:
Indication of how much water is expected to flow overland as opposed to being absorbed into the
ground.
Is based on soil moisture measurements at freeze up, most recent snowpack conditions, and
estimated future weather conditions.
Is a contributing factor into flood outlook determinations.
Described in comparison to normal historical runoffs (i.e., normal, near normal, slightly above
normal, etc.).
Can change significantly if future precipitation and melt rates differ from the average.
3 Flood Outlook:
Estimated spring peak water levels and flows provided before spring water flow begins.
Estimates are based on diverse information, such as soil moisture, winter precipitation, snowpack,
topography, current water level, channel capacity, and future weather condition scenarios
(precipitation, temperatures, etc.).
Estimates are provided for three weather scenarios (favourable, normal, and unfavourable) which
correspond to three different probabilities of occurrence (lower decile, median and upper decile).
3 Weather Scenarios:
Used to account for future weather such as additional snow, melt rates and spring rainfall. These
are determined by statistical analysis of the past 30 - 40 years of climate data.
Three scenarios used:
o Lower decile
There is a 10% chance of the weather being that ‘favourable’ or better. 90% of the
time the weather will be worse than this ‘favourable’ condition.
o Median
There is a 50% chance of the weather being ‘normal’ or better.
o Upper decile
There is a 10% chance of the weather being that ‘unfavourable’ or worse. 90% of
the time the weather will be better than this ‘unfavourable’ condition.
Province’s practice is to plan/prepare to the upper decile (i.e., unfavourable) condition.
3 Favourable Weather:
Characterized by little additional precipitation and a gradual snow melt.

Page 25 of 26
3 Normal Weather:
Characterized by normal rainfall and temperature.
Typically used to describe historic climate conditions.
3 Unfavourable Weather:
Significant wide-spread precipitation with a rapid snowmelt.
5Flow/Discharge [expressed in cubic feet per second (cfs) or cubic metres per second (cms)]:
The volume of water that passes a given location within a given period of time.
6 FPL – Flood Protection Level:
Is the water level of the greater of the flood of record or the 1-in-200-yr flood, plus a freeboard
allowance for a particular waterway (typically 2 ft) or water body (i.e., the freeboard is site
specific).
It is provided by the Hydrologic Forecasting and Water Management (HFWM) branch of MI on a
site-specific and structure-specific basis.
This is formally set by the Water Resources Administration Act for the Red River Designated Flood
Areas.
In non Designated Flood Areas, the province uses the determined FPLs. For other works or
developments, the FPL is recommended by the province, but ultimately regulated by the local
planning districts and/or municipalities.
7Definition for minor/moderate/major flooding:
Minor Flooding:
o Minimal or no property damage is expected, but there is potential for some public
impact, such as inundation of roads below the FPL7.
Moderate Flooding:
o Potential for flooding of agricultural and low-lying areas.
o Flood water levels are expected to be below the FPL.
Major Flooding:
o Potential for extensive inundation of buildings, structures and roads below the FPL
near drains, streams, rivers and lakes.
o Flood water levels could exceed the FPL.
o It likely will be required to evacuate some people and move movable property to
higher elevations or safer locations.
o Major highway closures associated with substantial economic impacts

Page 26 of 26
Additional terminology:
Operational Forecasts:
Estimated future crest water level, flow and date of occurrence provided once active melt and river
flow has begun.
Estimates are modelled based on observed flow, existing conditions (including channel capacity,
topography, and remaining snowpack) and normal future weather.
Observed conditions are monitored throughout the flood and compared against the historic climate
data used to generate the forecast.
Forecasts are updated when weather conditions are outside the range of historical climate data used
to generate the forecast.
A range of forecasted values is provided further in advance of an upcoming forecasted crest because
of unknowns in the basin conditions and river flows, and limitations in the modelling procedures.