hydrologic and hydraulic report - bureau of land … and hydraulic report 05:r 021214 wmr njb wmr...
TRANSCRIPT

C Hydrologic and Hydraulic Report
05:R 021214 WMR NJB WMR Revision RDM EECA.docx-02/14/14 C-1
1. Introduction
1.1. Objective The objective of this engineering analysis is to evaluate the hydrology of Red Devil Creek and examine alternatives to reduce sediment transport in Red Devil Creek. This effort was performed using available data and without a site visit. An array of alternatives that could be pursued at the site were analyzed and an order of magnitude cost was developed.
1.2. Project Description The Red Devil Mine is in a remote part of western Alaska, on the south side of the Kuskokwim River. It is approximately 250 miles west of Anchorage, 1.5 miles upstream from the village of Red Devil and approximately 8 miles downstream from Sleetmute. The mine occupies approximately 10 acres of BLM managed Land. An airstrip at the village of Red Devil provides access to the area. From the airstrip, the mine can be accessed by boat on the Kuskokwim River or along an unimproved road.
Red Devil Mine started producing mercury in 1933. At times, the mine was one of the largest producers of mercury in the United States. By 1971 the mine had ceased operations and by 1982 the mine was permanently closed.
At the end of its life, the mine consisted of a series of underground workings, open shafts and adits, mine process buildings, a power plant, above-ground fuel tanks, living quarters and a reservoir in the upper reach of Red Devil Creek. Over the last 20+ years, the BLM has closed the shafts and adits, demolished onsite buildings and tanks, and disposed of the demolition debris in onsite repositories. Tailings and waste rock deposited along Red Devil Creek as part of mining operations remain in place, along with extensive surface disturbance in the upper elevations on the northeast side of the mine process area and an old barge landing at the mouth of Red Devil Creek.
2. Hydrologic Analysis
2.1. Methodology Examination of the site topography allowed the site to be broken up into four drainages for evaluation. Hydrologic analyses were performed to determine the peak flows for various recurrence intervals within the project area. The Soil Conservation Service (SCS) discharge method was applied to all four basins in order to determine the peak flows for the 2, 5, 10, 25, 50 and 100-year events. The SCS method is based upon the United States Department of Agriculture (USDA) Natural Resources Conservation Service’s (NRCS). Technical Release 55: Urban Hydrology for Small Watersheds (TR-55). The input data required for the SCS Method includes the drainage areas, runoff curve numbers (RCNs), the time of concentration (Tc) and the associated precipitation values. The calculated peak flows were used to determine the shear stress and associated sediment movement with each recurrence interval.
1

Figure 1 Overview of Red Devil Mine Site and area of concern for this analysis
Precipitation values were acquired from the most recent precipitation frequency estimates published by the National Oceanographic and Atmospheric Administration (NOAA) for the State of Alaska (Perica & al., 2012). Precipitation frequency estimates used for this study are given in Table 1. TR-55 specifies that a Type I storm should be used for Alaska. The type I storm represents the Pacific Maritime climate with wet winters and dry summers. For hydrologic analysis run off for a 24 hour storm was developed using the latest published NWS values.
2
Table 1: Rainfall for 24-hour Storm Events NOAA Atlas 14, Volume 7, Version 2
Red Devil, Alaska Event Year Rainfall (Inches)
2 1.48 5 1.88
10 2.21 25 2.68 50 3.06
100 3.47
Old Detention Basin
Red Devil Creek
Area of concern for sediment transport
Potential additional area of excavation
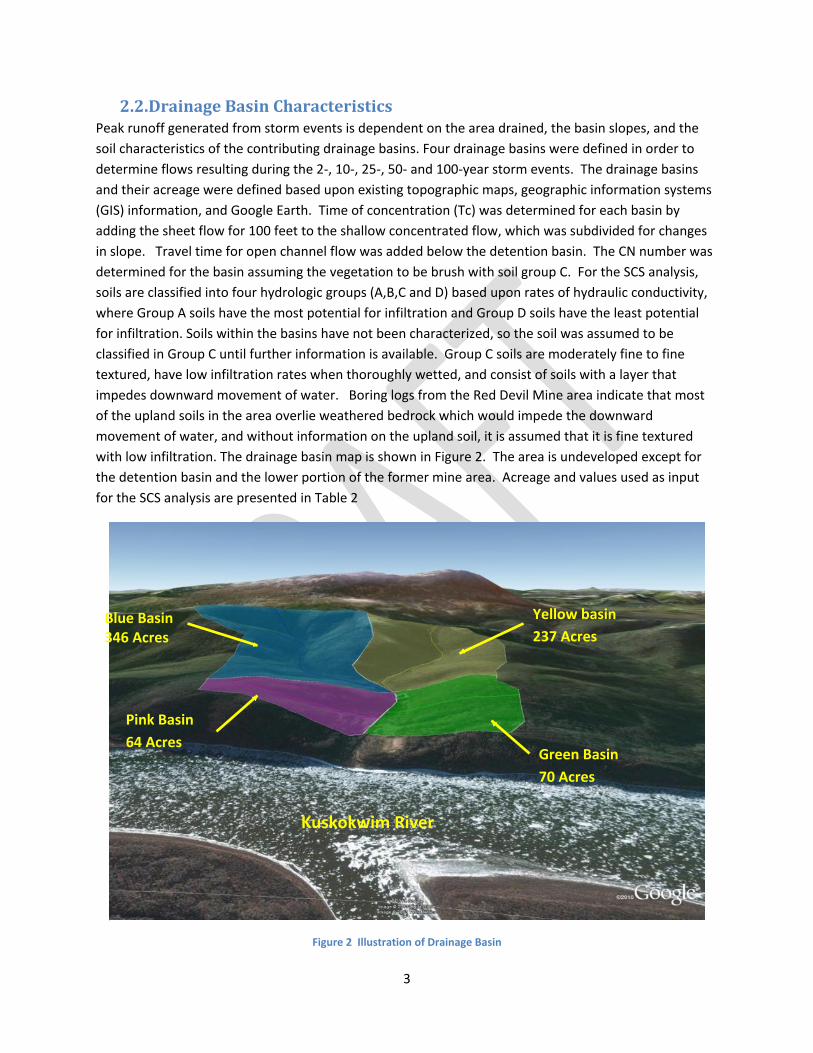
2.2. Drainage Basin Characteristics Peak runoff generated from storm events is dependent on the area drained, the basin slopes, and the soil characteristics of the contributing drainage basins. Four drainage basins were defined in order to determine flows resulting during the 2-, 10-, 25-, 50- and 100-year storm events. The drainage basins and their acreage were defined based upon existing topographic maps, geographic information systems (GIS) information, and Google Earth. Time of concentration (Tc) was determined for each basin by adding the sheet flow for 100 feet to the shallow concentrated flow, which was subdivided for changes in slope. Travel time for open channel flow was added below the detention basin. The CN number was determined for the basin assuming the vegetation to be brush with soil group C. For the SCS analysis, soils are classified into four hydrologic groups (A,B,C and D) based upon rates of hydraulic conductivity, where Group A soils have the most potential for infiltration and Group D soils have the least potential for infiltration. Soils within the basins have not been characterized, so the soil was assumed to be classified in Group C until further information is available. Group C soils are moderately fine to fine textured, have low infiltration rates when thoroughly wetted, and consist of soils with a layer that impedes downward movement of water. Boring logs from the Red Devil Mine area indicate that most of the upland soils in the area overlie weathered bedrock which would impede the downward movement of water, and without information on the upland soil, it is assumed that it is fine textured with low infiltration. The drainage basin map is shown in Figure 2. The area is undeveloped except for the detention basin and the lower portion of the former mine area. Acreage and values used as input for the SCS analysis are presented in Table 2
3
Figure 2 Illustration of Drainage Basin
Yellow basin 237 Acres
Pink Basin 64 Acres
Green Basin 70 Acres
Blue Basin 346 Acres
Kuskokwim River
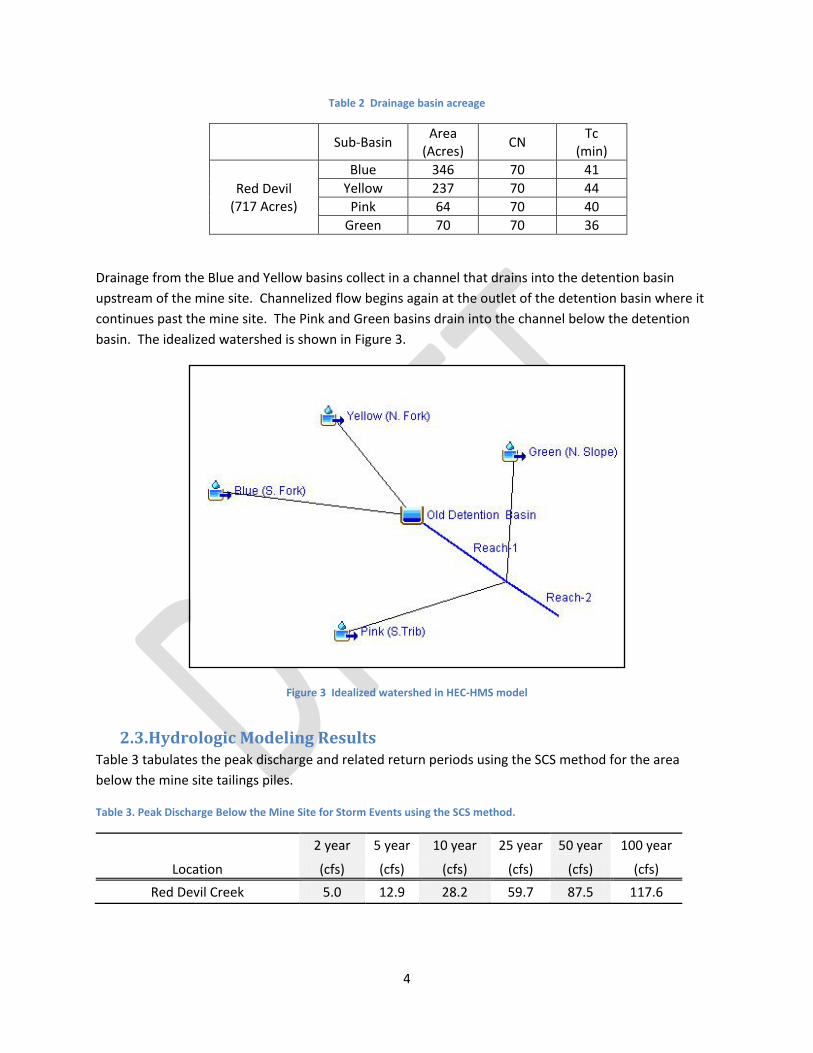
Table 2 Drainage basin acreage
4
Sub-Basin Area (Acres) CN Tc
(min)
Red Devil (717 Acres)
Blue 346 70 41 Yellow 237 70 44
Pink 64 70 40 Green 70 70 36
Drainage from the Blue and Yellow basins collect in a channel that drains into the detention basin upstream of the mine site. Channelized flow begins again at the outlet of the detention basin where it continues past the mine site. The Pink and Green basins drain into the channel below the detention basin. The idealized watershed is shown in Figure 3.
Figure 3 Idealized watershed in HEC-HMS model
2.3. Hydrologic Modeling Results Table 3 tabulates the peak discharge and related return periods using the SCS method for the area below the mine site tailings piles.
Table 3. Peak Discharge Below the Mine Site for Storm Events using the SCS method.
Location
2 year 5 year 10 year 25 year 50 year 100 year
(cfs) (cfs) (cfs) (cfs) (cfs) (cfs) Red Devil Creek 5.0 12.9 28.2 59.7 87.5 117.6

Results of this analysis were checked against flow measurements made by the BLM’s contractor, E&E, in the spring of 2012, and in the fall of 2011 and 2012. Flow results at E&E location RD06 were used for this comparison since it was located close to the bottom of the reach for the hydrologic analysis (Figure 4).
The E&E measurements at RD06 in the fall of 2011 and 2012 were 3.8 cfs and 6.8 cfs, respectively. This flow rate would correspond approximately to a 1-2 year event, and would be representative of the hydrologic cycle totally governed by rain. A flow of 14.5 cfs was measured at RD06 in May of 2012 and is representative of a higher flow due to snowmelt. If this flow rate were solely due to a rainfall event, it would correspond to approximately a 5 year return interval event. Return intervals and associated flows for rain on snow events were not evaluated for this analysis. These discharge measurements appear reasonable when compared to the field measurements.
The depth and velocity associated with the flow rates were calculated using an idealized cross section which set the hydraulic radius equal to the depth of water. This provides reasonable values in lieu of actual data. The idealized cross section was checked with the cross section measurements made by E&E, and compared well with the measurements at RD06. A constant slope of 5% was assumed based on E&E reports of the average creek slope, and a roughness value of 0.043 was used
5
1. Using Mannings equation for open channel flow, the depth and velocity were calculated for each measured flow and compared to the measured value. There was some variation between the calculated average depth and velocity and the field measurements, but for this quick engineering study of the site, the values were considered to be adequately representative for determination of incipient sediment movement.
Table 4. Flow depths associated with Storm Events using the SCS method and an idealized cross section.
August 2011
Spring 2012
Fall 2012
Cross Section Flow [ft^3/s] 6.81 14.47 3.80
E&E measured velocity [ft/s] 2.93 2.33 1.18
Calculated velocity [ft/s] 2.65 3.53 2.2 E&E measured average depth
[ft] 0.38 0.55 0.37
Calculated average depth [ft] 0.216 0.31 0.15
1 Roughness value obtained from Roughness Characteristics of Natural Channels, USGS Water Supply Paper 1849, Harry H. Barnes

Figure 4 Location of RD06 from E&E's Remedial Investigation Report
6
Location of RD06

Figure 5 Red Devil Creek in September 2012
The calculated depths were used as input to use Shields Diagram to determine sediment size for incipient transport and corresponding velocities. The creek flow rate and calculated velocity, depth, and sediment size that could be transported are shown in Table 5. Table 6 shows the sediment classification with the associated grain size.
Table 5. Flow depths associated with Storm Events using the SCS method and an idealized cross section.
7
2 year 5 year 10 year 25 year 50 year 100 year
(5.0 cfs) (12.9 cfs) (28.2 cfs) (59.7 cfs) (87.5 cfs) (117.6 cfs)
Red Devil Creek Velocity [ft/s] 2.6 3.6 4.8 6.2 7.32 7.7
Average Red Devil Creek depth [ft] 0.20 0.33 0.51 .72 .92 1.0
Sediment size transported [mm] <2.0 <3.0 <4.2 <7.0 <9.5* <11.0*
Very coarse sand
Very fine gravel
Very fine gravel
Fine gravel
Medium gravel
Medium gravel
*Estimated values beyond use of Shields curve

Table 6 Sediment classification with associated grain size
3. Project Alternatives
3.1. Partial Excavation
Excavation to 5 feet A partial excavation of the tailings pile to 5 feet would remove the sediment that is available for transport from the area of the creek to a depth of five feet or until bedrock is encountered. Depths and distances for excavation were based on information available in the E&E Remedial Investigation Report 2013, and consultation with the Bureau of Land Management. The length of the excavation would extend down the creek for a distance of 500 feet on the north side and 600 feet on the south side in the area of concern (Figure 1).The depth of excavation would extend down five feet or until weathered bedrock is encountered. The width of excavation on the north side of the creek would extend approximately 10 feet back from the creek centerline and then sloped back at a 2 horizontal to 1 vertical slope, and the south side excavation would extend 25 feet from the creek centerline and then slope back into the existing ground on a 3 horizontal to 1 vertical slope (Figure 7). The smaller excavation and steeper slope on the north side was necessary in order to avoid excavation into Monofill 1 (Figure 8). A shallow slope angle was used to prevent erosion from occurring. A cross section of the excavation and the geologic cross section is shown in Figure 7.
Restoration of the stream in the area of excavation is not part of this proposed action. Once excavation is complete, the stream will be allowed to meander through the excavated area. In order to prevent the stream from meandering and eroding the toe of the cut slope, protection will be placed at the toe up to two feet (>100 year return interval depth using an idealized cross section). For this assessment, it is assumed that the toe protection would be a single layer of small mesh gabions with imported fill. It is
8
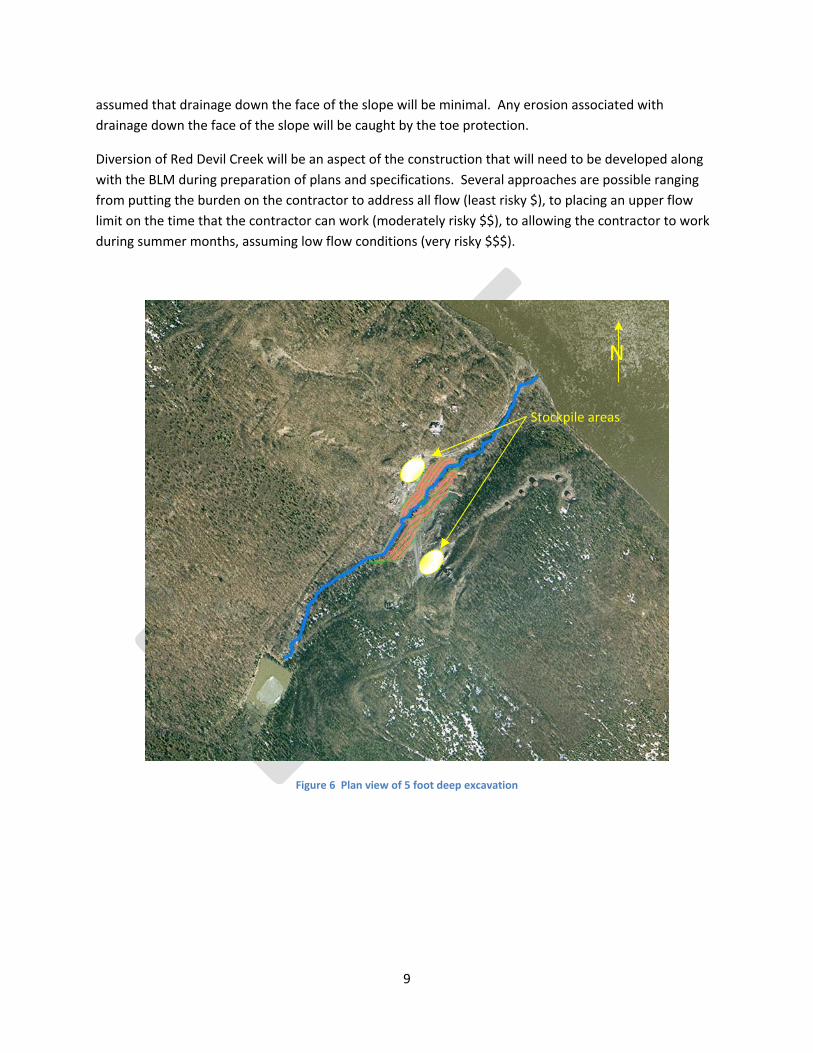
assumed that drainage down the face of the slope will be minimal. Any erosion associated with drainage down the face of the slope will be caught by the toe protection.
Diversion of Red Devil Creek will be an aspect of the construction that will need to be developed along with the BLM during preparation of plans and specifications. Several approaches are possible ranging from putting the burden on the contractor to address all flow (least risky $), to placing an upper flow limit on the time that the contractor can work (moderately risky $$), to allowing the contractor to work during summer months, assuming low flow conditions (very risky $$$).
Figure 6 Plan view of 5 foot deep excavation
9
N
Stockpile areas
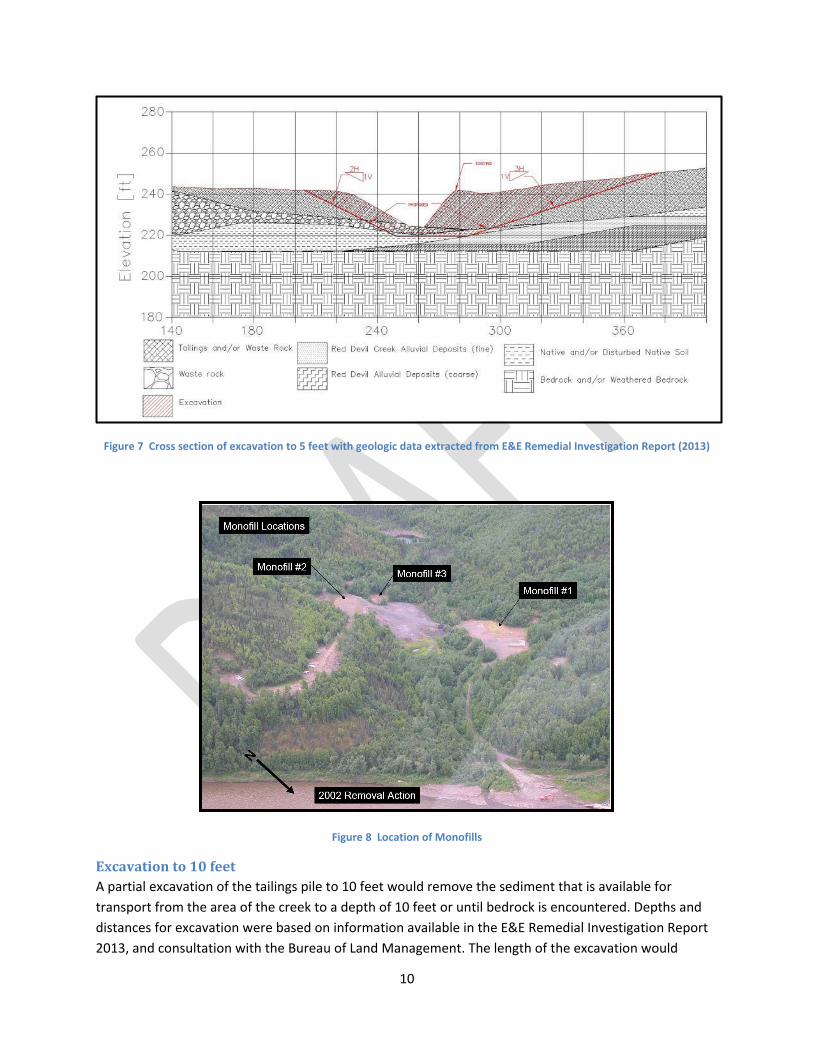
Figure 7 Cross section of excavation to 5 feet with geologic data extracted from E&E Remedial Investigation Report (2013)
Figure 8 Location of Monofills
Excavation to 10 feet A partial excavation of the tailings pile to 10 feet would remove the sediment that is available for transport from the area of the creek to a depth of 10 feet or until bedrock is encountered. Depths and distances for excavation were based on information available in the E&E Remedial Investigation Report 2013, and consultation with the Bureau of Land Management. The length of the excavation would
10

extend down the creek for a distance of 500 feet on the north side and 600 feet on the south side in the area of concern (Figure 1).The depth of excavation would extend down ten feet or until weathered bedrock is encountered. The width of excavation on the north and south sides of the creek would extend approximately 10 feet back from the creek centerline and then sloped back at a 2 horizontal to 1 vertical slope (Figure 10). The smaller excavation on the south side of the creek was an attempt to minimize the volume increase from excavating deeper (Figure 9).
Restoration of the stream in the area of excavation is not part of this proposed action. Once excavation is complete, the stream will be allowed to meander through the excavated area. In order to prevent the stream from meandering and eroding the toe of the cut slope, protection will be placed at the toe up to two feet (>100 year return interval depth using an idealized cross section). For this assessment, it is assumed that the toe protection would be a single layer of small mesh gabions with imported fill. It is assumed that drainage down the face of the slope will be minimal. Any erosion associated with drainage down the face of the slope will be caught by the toe protection.
Diversion of Red Devil Creek will be an aspect of the construction that will need to be developed along with the BLM during preparation of plans and specifications. Several approaches are possible ranging from putting the burden on the contractor to address all flow (least risky $), to placing an upper flow limit on the time that the contractor can work (moderately risky $$), to allowing the contractor to work during summer months, assuming low flow conditions (very risky $$$).
Another risk to be considered with this alternative is the location of the groundwater table. The deeper excavation estimate did not include any costs for dewatering the excavated area. According to the E& E RI, this excavation will extend below the water table. The groundwater hydrology was not evaluated for this exercise, so it has not been determined if the water table is seasonal and may be minimal during construction, or if extra measures such as dewatering will be needed to pursue this alternative. This would need to be evaluated further if this is the selected alternative.
11
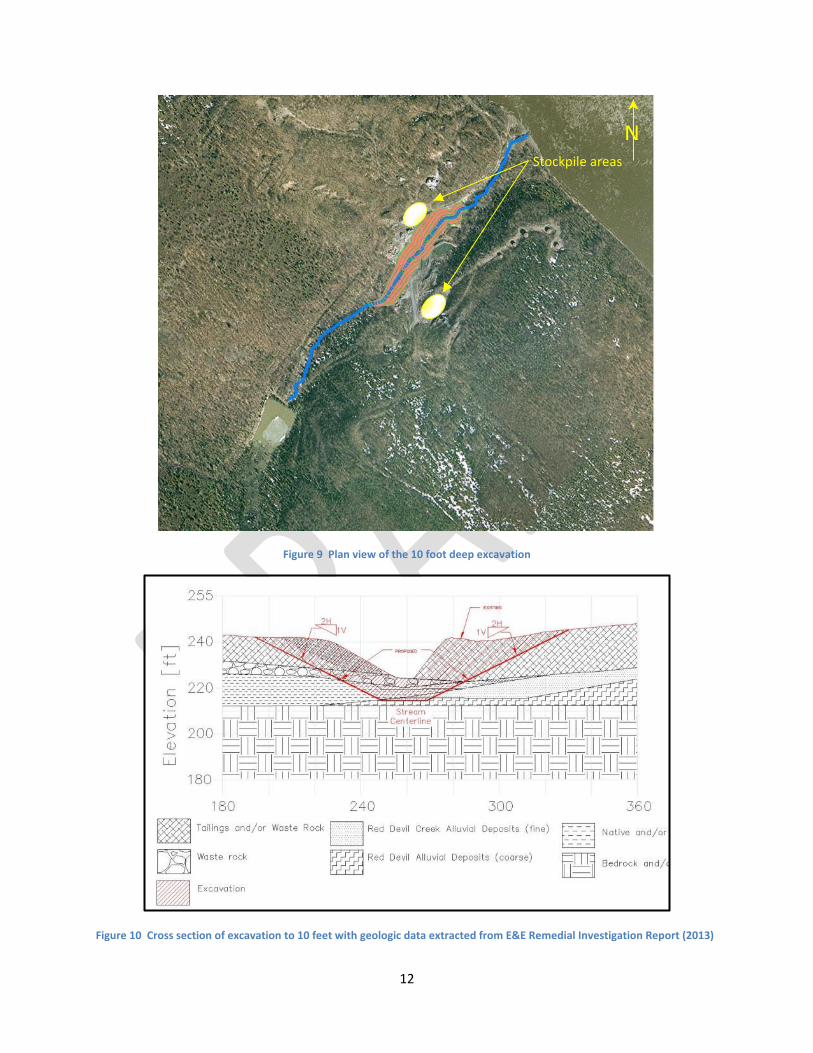
Figure 9 Plan view of the 10 foot deep excavation
Figure 10 Cross section of excavation to 10 feet with geologic data extracted from E&E Remedial Investigation Report (2013)
12
Stockpile areas
N

13
Cost: This alternative is estimated to cost between $3,750,000 to $4,430,000 depending on where the gravel for the gabion baskets is obtained. The excavation quantity did not vary much between the 5 foot and the 10 foot excavation. This is because the prism was changed to minimize any increases in excavation.
Risks: Need to make sure that Monofill 1 is left undisturbed. Need to address streamflow during construction. Will likely leave some amount of fine sediment in excavated area that will be transported. Water table could increase difficulty of excavation.
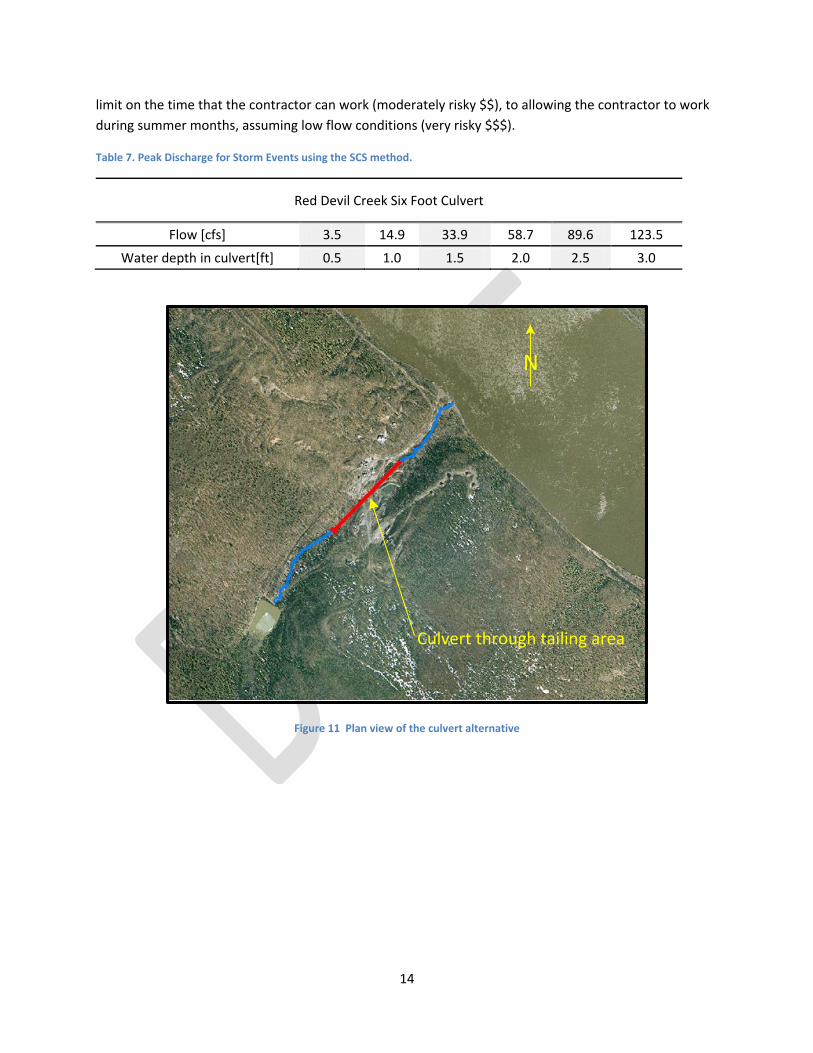
3.2. Line Creek with Culvert This alternative would entail lining 800 feet of the creek in the area of the tailings pile with a 6 foot diameter culvert (Figure 11). This alternative would break the contact between the creek and the tailings pile, allow for ice buildup in the winter months, prevent tailings from eroding into the stream, and allow easy access for performance inspection. Typically a culvert of this size is buried; however, this culvert will not be buried, so it is anticipated that it will be held in place with a series of straps anchored into the soil or bedrock. The spacing of the straps was estimated to be every 25 feet. Confirmation of the strap spacing would need to be performed if this is the chosen alternative. Excavation of the creek bed would be required in order to provide a uniform grade. The excavated material will be used where fill is required to construct the uniform grade or stockpiled on the tailings pile.
In addition to grading and laying the culvert, a headwall would be required at the upper end of the culvert to train the stream into the culvert. It is assumed that the headwall would be constructed of sheet pile or lined gabions. The headwall would also provide a location to establish control over the stream flow for future cleanup efforts at the site. A cross section of the culvert is shown in Figure 12
Annual inspection would be required for this alternative to check the culvert for beaver dams, damage from ice, abrasion from sediment, and performance of the straps. It is anticipated that inspection would be a visual inspection only.
The depth of water in the culvert was calculated for the 6 foot diameter pipe in six inch increments. The corresponding flows for the depths are shown in Table 7. For estimating purposes the culvert at the site was assumed to be a bolt up culvert that requires assembly on site. Further evaluation could also be performed to determine if the closed pipe culvert is necessary, or if a half pipe culvert (similar to a flume or ditch lining) would be adequate. Examples of half pipe ditch liners and trapezoidal ditch liners is shown in Figure 14.
Diversion of Red Devil Creek will be an aspect of the construction that will need to be developed along with the BLM during preparation of plans and specifications. Several approaches are possible ranging from putting the burden on the contractor to address all flow (least risky $), to placing an upper flow
limit on the time that the contractor can work (moderately risky $$), to allowing the contractor to work during summer months, assuming low flow conditions (very risky $$$).
Table 7. Peak Discharge for Storm Events using the SCS method.
14
Red Devil Creek Six Foot Culvert
Flow [cfs] 3.5 14.9 33.9 58.7 89.6 123.5
Water depth in culvert[ft] 0.5 1.0 1.5 2.0 2.5 3.0
Figure 11 Plan view of the culvert alternative
N
Culvert through tailing area

Figure 12 Idealized culvert cross section
Figure 13 Example of a ditch lined with a half pipe
15
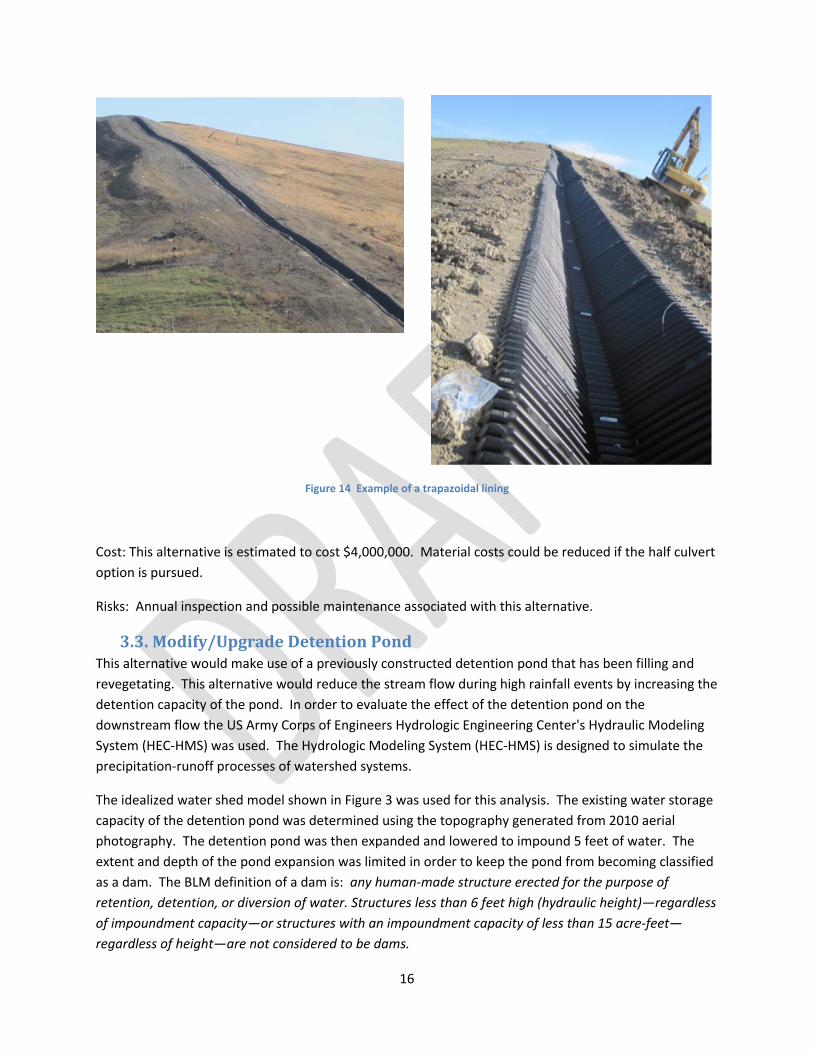
Figure 14 Example of a trapazoidal lining
Cost: This alternative is estimated to cost $4,000,000. Material costs could be reduced if the half culvert option is pursued.
Risks: Annual inspection and possible maintenance associated with this alternative.
3.3. Modify/Upgrade Detention Pond This alternative would make use of a previously constructed detention pond that has been filling and revegetating. This alternative would reduce the stream flow during high rainfall events by increasing the detention capacity of the pond. In order to evaluate the effect of the detention pond on the downstream flow the US Army Corps of Engineers Hydrologic Engineering Center's Hydraulic Modeling System (HEC-HMS) was used. The Hydrologic Modeling System (HEC-HMS) is designed to simulate the precipitation-runoff processes of watershed systems.
The idealized water shed model shown in Figure 3 was used for this analysis. The existing water storage capacity of the detention pond was determined using the topography generated from 2010 aerial photography. The detention pond was then expanded and lowered to impound 5 feet of water. The extent and depth of the pond expansion was limited in order to keep the pond from becoming classified as a dam. The BLM definition of a dam is: any human-made structure erected for the purpose of retention, detention, or diversion of water. Structures less than 6 feet high (hydraulic height)—regardless of impoundment capacity—or structures with an impoundment capacity of less than 15 acre-feet—regardless of height—are not considered to be dams.
16

The outlet of the pond would be modified in order to control the water surface. For estimation purposes a sheet pile notched weir was assumed to be the control structure. Other alternatives for weir construction include lined gabions or a grout filled mattress.
This alternative would not prevent the flow of water down Red Devil Creek, but it would reduce high flow events by detaining the water. Reducing high flow events would reduce the stream velocity limiting the transport of sediment downstream. The HEC-HMS model evaluated the peak flow in the stream during a 2, 5, 10, 25, 50, and 100 year rain event without the expanded detention basin. The model was then used to determine the effect of the expanded detention basin on peak flow. Results of that evaluation are shown in Table 8.
Diversion of Red Devil Creek will be an aspect of the construction that will need to be developed along with the BLM during preparation of plans and specifications. Several approaches are possible ranging from putting the burden on the contractor to address all flow (least risky $), to placing an upper flow limit on the time that the contractor can work (moderately risky $$), to allowing the contractor to work during summer months, assuming low flow conditions (very risky $$$).
Figure 15 Plan view of detention pond alternative
17
N
Expanded pond
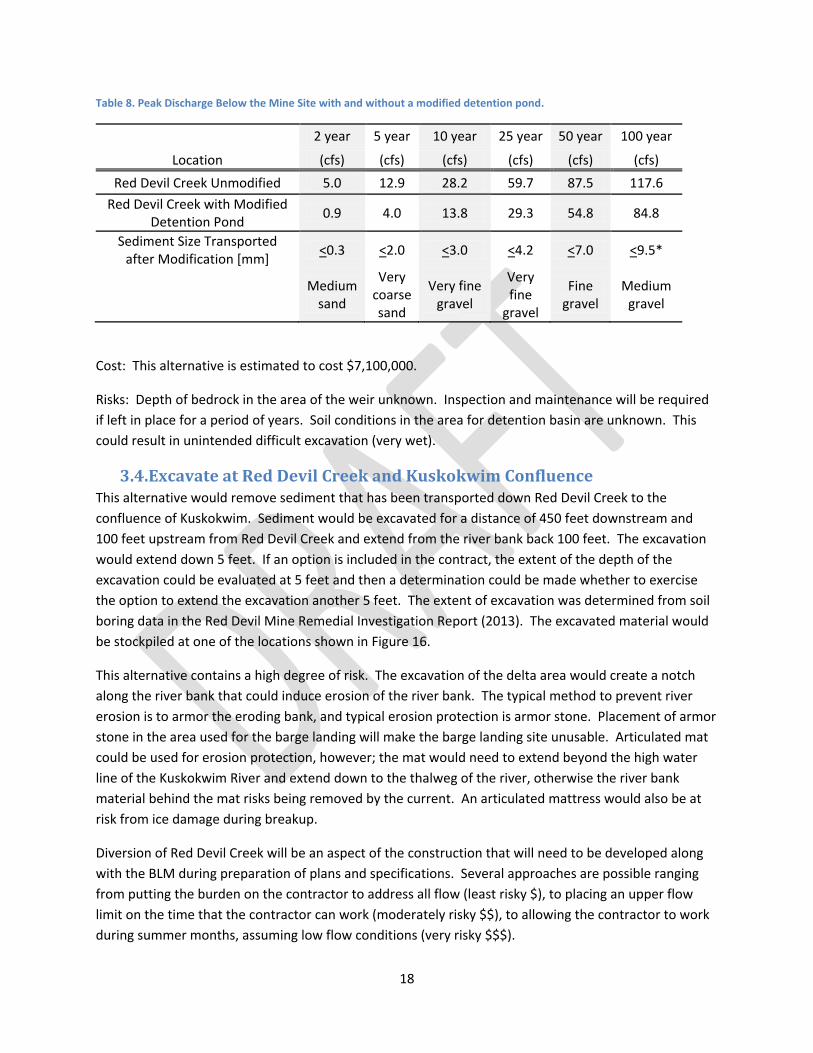
Table 8. Peak Discharge Below the Mine Site with and without a modified detention pond.
18
Location
2 year 5 year 10 year 25 year 50 year 100 year
(cfs) (cfs) (cfs) (cfs) (cfs) (cfs) Red Devil Creek Unmodified 5.0 12.9 28.2 59.7 87.5 117.6
Red Devil Creek with Modified Detention Pond 0.9 4.0 13.8 29.3 54.8 84.8
Sediment Size Transported after Modification [mm] <0.3 <2.0 <3.0 <4.2 <7.0 <9.5*
Medium sand
Very coarse sand
Very fine gravel
Very fine
gravel
Fine gravel
Medium gravel
Cost: This alternative is estimated to cost $7,100,000.
Risks: Depth of bedrock in the area of the weir unknown. Inspection and maintenance will be required if left in place for a period of years. Soil conditions in the area for detention basin are unknown. This could result in unintended difficult excavation (very wet).
3.4. Excavate at Red Devil Creek and Kuskokwim Confluence This alternative would remove sediment that has been transported down Red Devil Creek to the confluence of Kuskokwim. Sediment would be excavated for a distance of 450 feet downstream and 100 feet upstream from Red Devil Creek and extend from the river bank back 100 feet. The excavation would extend down 5 feet. If an option is included in the contract, the extent of the depth of the excavation could be evaluated at 5 feet and then a determination could be made whether to exercise the option to extend the excavation another 5 feet. The extent of excavation was determined from soil boring data in the Red Devil Mine Remedial Investigation Report (2013). The excavated material would be stockpiled at one of the locations shown in Figure 16.
This alternative contains a high degree of risk. The excavation of the delta area would create a notch along the river bank that could induce erosion of the river bank. The typical method to prevent river erosion is to armor the eroding bank, and typical erosion protection is armor stone. Placement of armor stone in the area used for the barge landing will make the barge landing site unusable. Articulated mat could be used for erosion protection, however; the mat would need to extend beyond the high water line of the Kuskokwim River and extend down to the thalweg of the river, otherwise the river bank material behind the mat risks being removed by the current. An articulated mattress would also be at risk from ice damage during breakup.
Diversion of Red Devil Creek will be an aspect of the construction that will need to be developed along with the BLM during preparation of plans and specifications. Several approaches are possible ranging from putting the burden on the contractor to address all flow (least risky $), to placing an upper flow limit on the time that the contractor can work (moderately risky $$), to allowing the contractor to work during summer months, assuming low flow conditions (very risky $$$).
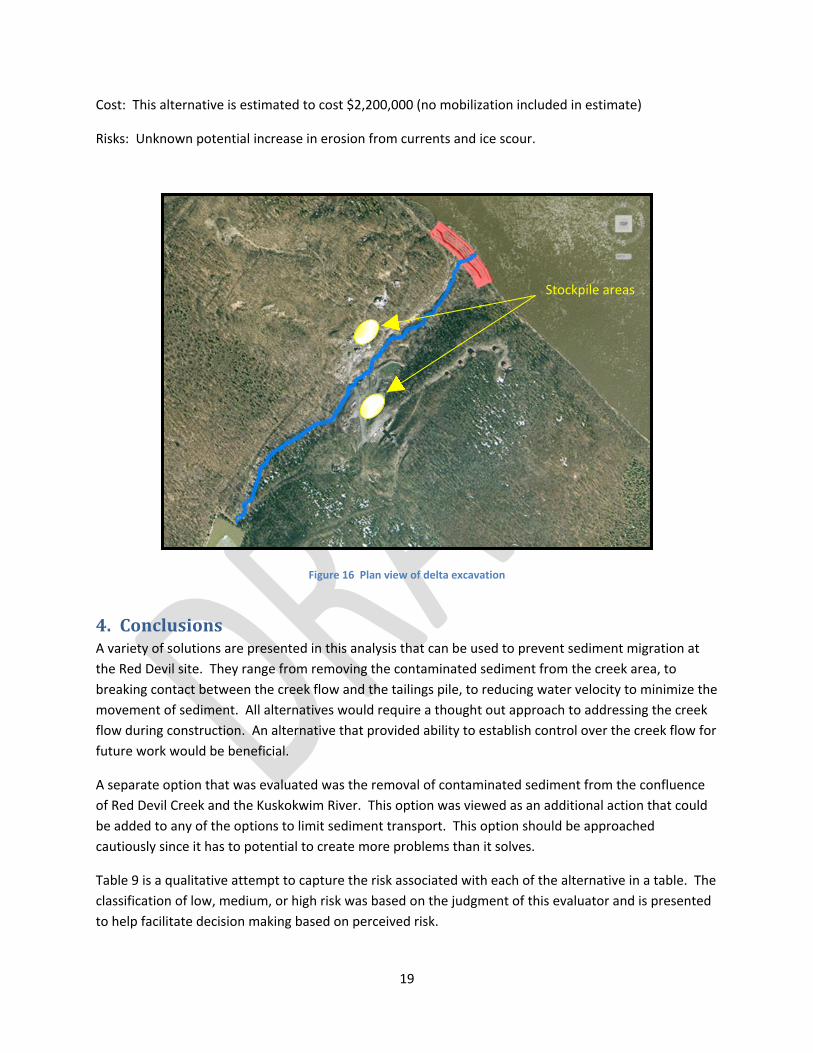
Cost: This alternative is estimated to cost $2,200,000 (no mobilization included in estimate)
Risks: Unknown potential increase in erosion from currents and ice scour.
Figure 16 Plan view of delta excavation
4. Conclusions A variety of solutions are presented in this analysis that can be used to prevent sediment migration at the Red Devil site. They range from removing the contaminated sediment from the creek area, to breaking contact between the creek flow and the tailings pile, to reducing water velocity to minimize the movement of sediment. All alternatives would require a thought out approach to addressing the creek flow during construction. An alternative that provided ability to establish control over the creek flow for future work would be beneficial.
A separate option that was evaluated was the removal of contaminated sediment from the confluence of Red Devil Creek and the Kuskokwim River. This option was viewed as an additional action that could be added to any of the options to limit sediment transport. This option should be approached cautiously since it has to potential to create more problems than it solves.
Table 9 is a qualitative attempt to capture the risk associated with each of the alternative in a table. The classification of low, medium, or high risk was based on the judgment of this evaluator and is presented to help facilitate decision making based on perceived risk.
19
Stockpile areas
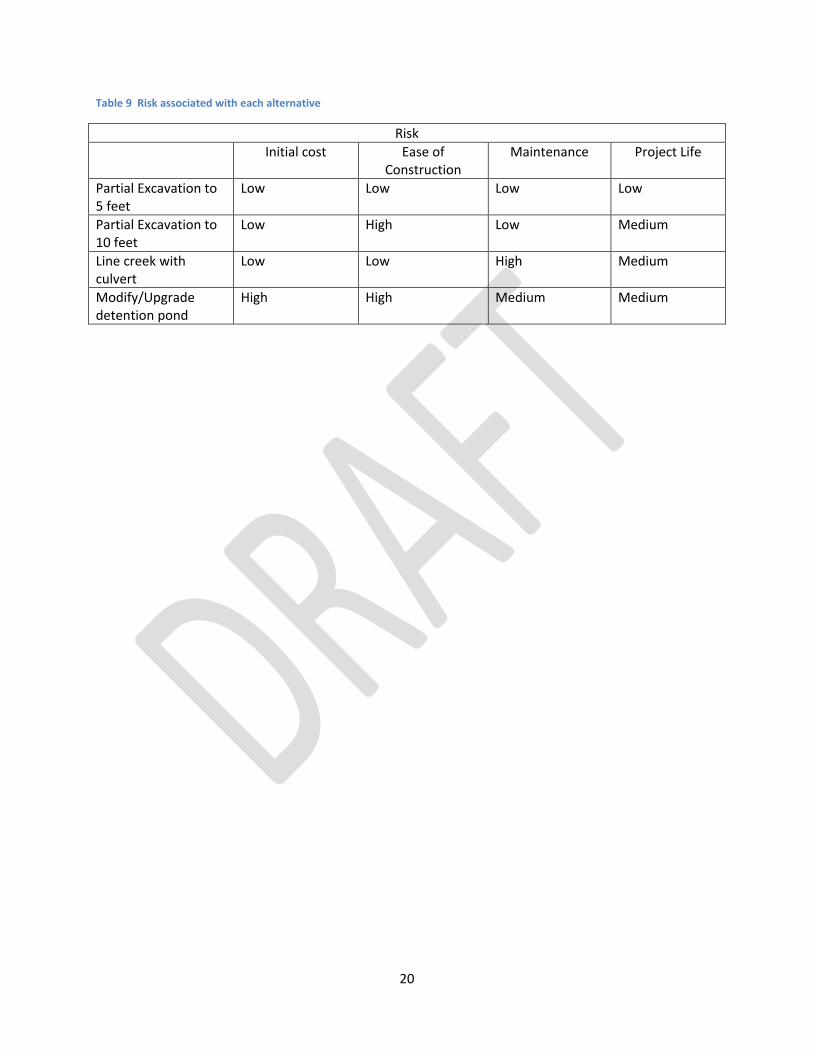
Table 9 Risk associated with each alternative
20
Risk Initial cost Ease of
Construction Maintenance Project Life
Partial Excavation to 5 feet
Low Low Low Low
Partial Excavation to 10 feet
Low High Low Medium
Line creek with culvert
Low Low High Medium
Modify/Upgrade detention pond
High High Medium Medium