hydrogeomorphic indexes in saga-gis for the ... · flooded areas in madre de dios, peru. alberto e....
TRANSCRIPT

International Journal of Applied Engineering Research ISSN 0973-4562 Volume 12, Number 19 (2017) pp. 9078-9086
© Research India Publications. http://www.ripublication.com
9078
Use of Hydrogeomorphic Indexes in SAGA-GIS for the Characterization of
Flooded Areas in Madre de Dios, Peru
Alberto E. García-Rivero 1, Jorge Olivera2, Eduardo Salinas3, Ricardo A. Yuli4 and Wilfredo Bulege5
1 ,4 ,5 Continental University, San Carlos Avenue 1980, San Antonio urbanization, distric Huancayo, Huancayo province, Zip code: 12000, Peru.
1Orcid: 0000-0002-8344-9529 2Institute of Tropical Geography, F Street 302, distric Vedado, Havana province, Zip code: 10400, Cuba.
3Federal University of Mato Grosso do Sul, João Rosa Góes Avenue 1761, Dourados, Mato Grosso do Sul State, Zip code: 79804, Brasil.
Abstract
The work aims to identify and cartographically represent
sensitive areas (scenarios) to river flooding in the lower section
of the Madre de Dios hydrographic unit in the Peruvian
Amazon, from the use of digital terrain models (DTM) and
System for Automated Geoscientific Analyses (SAGA-GIS)
free software, in version 2.2.5. It was produced a DTM with
cells of 30 x 30 m hydrologically corrected, obtaining different
maps of geomorphological factor (vertical distance from the
drainage network and closed depressions) and hydrological
factor (surface runoff, topographic wetness index, and modified
catchment area). Integrating all this information the contrast
index map was obtained, which once reclassified, allowed the
spatial delineation of the flood scenarios and their categories of
susceptibility.
Keywords: floods, hydrological and geomorphological
factors, SAGA-GIS, Madre de Dios
INTRODUCTION
The great deforestation, on the slopes of the Andean piedmont,
causes an intense process of sedimentation of the rivers of the
Amazon plain, which alters the morphology of its channels, the
fluvial dynamics and causes a greater number of overflows.
This process of deforestation accelerates flooding during the
rainy season and causes the rivers when they reach the Amazon
plain to be filled with sediments [1].
In Peru the so-called "artisanal mining" or "small-scale mining"
is particularly important in the Madre de Dios Region, but it is
also increasing in a disturbing way in other regions. In Madre
de Dios in 2011, the number of miners operating with
increasingly heavy and sophisticated equipment, such as front-
end loaders, trucks and dredges of various types, was estimated
at over 30,000, generating significant environmental and social
conflicts: % of mining operations are informal, and a number
well above the 1 500 mining petitions overlap with protected
natural areas, buffer zones and indigenous peoples' lands. It is
estimated that these operations had already destroyed more
than 32 000 ha by that date. of forests and severely
contaminated several rivers in the region with mercury and
other chemical compounds [2].
This gold mining alters the course of the rivers, by extracting
ore from the banks and pumping water from them, which
destroys the vegetation cover and modifies the parameters of
the river bed, in addition to producing a strong contamination
of its rivers. waters, mainly by mercury, arsenic and residues of
hydrocarbons. Among the most affected Peruvian Amazon
rivers are Huapetuhe, Colorado, Madre de Dios and
Malinowski.
Territorial expansion of gold mining also significantly
threatens the ecosystems of Madre de Dios, a global
biodiversity host that forms part of the Vilcabamba-Amboro
conservation corridor. Until 2013, gold mining has been
responsible for the deforestation of almost 50,000 hectares [3].
In order to illustrate the situation, in a study carried out in
Madre de Dios area by the Association for the Conservation of
the Amazon Basin, it was determined that only between
February and July 2015, 225 hectares of forest disappeared.
Similarly, between August 2014 and July 2015, 725 ha were
destroyed in La Pampa, an area within the buffer zone of the
important Tambopata National Reserve, which is considered to
be the center of the most illegal illegal mining of Peru and in
which other illegal activities, such as trafficking in women and
girls are developing in a collateral manner [4].

International Journal of Applied Engineering Research ISSN 0973-4562 Volume 12, Number 19 (2017) pp. 9078-9086
© Research India Publications. http://www.ripublication.com
9079
The Ombudsman's Office, in 2015, estimated that 44% of the
forest area in Madre de Dios is affected by illegal mining,
which amounts to some 50,000 hectares devastated.
This illegal gold mining, when operating with large quantities
of mercury, without the necessary technological and
environmental management conditions, contaminates the soils
and waters of the entire territory they occupy, as well as
downstream from the currents of the places where they operate.
The situation has reached a level such that on May 24, 2016,
the official newspaper "El Peruano", in an unprecedented act
issued an Alert in Madre de Dios, based on the negative impact
of gold mining in that territory, where 41% of the population
has levels of mercury contamination, chemical substance used
in this activity, which represents a public health issue that
deserves priority and immediate attention, reason why the
Executive declared the state of emergency for 60 days in eleven
districts with the aim of reversing this situation [5].
This process of environmental degradation occurs in a territory
whose Perhumid and Humid climate (total annual rainfall
between 1500 and 3000 mm) in the Eastern Cordillera-
Subandean and Humid and Subhumid Strip (total annual
rainfall of 1500 to 3000 mm), contributes to that the feasible
scenarios of flooding in these watersheds are increasing every
day, with the consequent socio-economic and environmental
impact.
Flooding is a constant threat and is a phenomenon that can be
triggered quickly and rapidly [6] causing numerous disasters
worldwide, causing thousands of deaths annually and millions
of dollars in economic losses from damage [7]. From an
anthropocentric perspective, floods can be generally defined as
the presence of water on the ground in places, forms and times
that are unsuitable for human activities, causing economic,
social and environmental effects [8].
Floods are potentially destructive recurrent hydrological
phenomena, which are part of the dynamics of evolution of a
stream. They can be produced by intense rains or not so intense
but of very long duration, which progressively increase the
flows of the currents and with it the height of the waters until
they exceed the limits that impose the banks of the channel.
Depending on many factors, but mainly the size, shape and
relief of the catchment basin, these floods will have a greater or
lesser time of occurrence from the beginning of the
precipitations. Circular watersheds (near-unity form factor),
with a very large area and high average slope, will develop very
rapid and extensive floods and floods.
Hence, in rivers running in flat areas, floods will be slow, with
daily increases in water levels of the order of centimeters and
generally affecting large areas, but should not cause major
human losses. Everything that happens in mountain or
mountain foothills, where due to its temporal dynamics, the
current velocity is high and cause numerous human losses,
although its area of affectation may be smaller, as well as the
time of permanence of the flooded areas, something that
authors share like [9], when considering that the greater the
speed of the current, although this is not very high, the greater
the damage.
According to [10], the relationship between the floods and the
occurrence of disasters does not occur equally in all places, in
some floods only make a physical process not considered
disaster, since it does not affect the people, however in other
such floods It impacts vulnerable communities, overcoming
their potential for recovery, becoming true human tragedies.
For this reason, the present study aimed to present a
methodology that allows, from the digital terrain model (DTM)
and the free software SAGA GIS in version 2.2.5, to map and
categorize the scenarios of hazards to river floods to intense and
/ or prolonged rains [11], [12] y [13].
The area selected for the application of this methodology was
the mid-lower sector of hydrographic unit number XIII-Madre
de Dios, which involves part Madre de Dios, Inambari, Manu,
Las Piedras and Tambopata rivers. This sector comprises four
basins and two inter-basins, in relation to the five rivers present
(figure 1).
Figure 1. Situation of the study area and detail of its
hydrography. (Source: ANA, 2012 [14]).
MATERIAL AND METHOD
At present there are a large number of methods and tools that
allow to model much of the hydrological and hydraulic
processes that are related to fluvial floods.
The development of hydrological modeling began at the
beginning of the 19th century and was used for the design of
hydraulic works mainly. In the 1960s, Crawford and Linsley's
Standford Watershed Model (SWM) emerged in 1966 to model
various aspects of the hydrological cycle, though due to the

International Journal of Applied Engineering Research ISSN 0973-4562 Volume 12, Number 19 (2017) pp. 9078-9086
© Research India Publications. http://www.ripublication.com
9080
development of digital tools, increased availability of
georeferenced spatial data and The creation of the first
Geographic Information Systems (GIS) is at the end of the
1990s, this discipline takes on a much greater boom, reaching
to the present day [15].
The models can be physical, with the representation of
watersheds or mathematical (numerical), those that use
empirical or conceptual equations to represent the response of
the hydrological unit under different hydrometeorological
conditions [16].
According to [17], it posible to distinguish four general types
of models: (a) deterministic that are formulated following the
laws of physics and/or chemical processes described by
differential equations; (b) probabilistic which, on the contrary,
are formulated according to the laws of chance or probability
and can be statistical or stochastic; (c) conceptual
representations that are simplified representations of physical
processes, such as mathematical descriptions that simulate
complex processes based on a few conceptual parameters, and
(d) parametric, empirical or black box, which are the simplest
and consist of an algebraic equation (or equations) containing
one or more parameters to be determined by data analysis or
other empirical means.
Nowadays, there is an important range of ways of
implementing many of these methods in several free software,
which allow the identification of potentially floodable areas in
the event of intense or prolonged rains, among which we
highlight the QGIS-SIG with a proven performance in
hydrological studies , which runs on most operating systems;
the HEC-RAS numerical model developed by the US Army
Corps of Engineers with hydraulic river models using the
gradient and topography to evaluate the tie rod, velocities and
flooded zones and the International River Interface Cooperative
(IRIC) which is a software developed with the purpose of
providing a complete riverbed simulation environment, the
results of which can be imported and used by users for analysis,
mitigation and disaster prevention purposes, by visualizing the
results of the simulation from the river.
Other software designed to simulate watershed hydrological
processes are: HEC-HMS, which includes traditional
hydrological analysis procedures such as infiltration events,
unit hydrographs, and hydrological routing; the PRMS
(Precipitation-Runoff Modeling System) is a modular, spatially
distributed parameter system that represents the physical
processes of a watershed and was developed by the United
States Geological Survey to evaluate the effects of various
combinations soil type and use, vegetation and climatic
parameters on the hydrological response of the basin.
SWAT is also available, a tool to assess soil and water at the
basin level, with special emphasis on precipitation-runoff
modeling and water and solutes transport across the surface,
allowing prediction of the impact of soil management practices
in water resources and sediments; a good part of the GIS has
tools and even complete modules for hydrological work, such
as SAGA-GIS, a GIS platform dedicated to spatial analysis,
with a great number of tools for hydrological modeling and a
programming strategy that prints a high speed to your
calculation procedures.
The methodology and materials used in the present study
respond to the undoubted advantages of the incorporation of
Geographic Information Systems (GIS), remote sensing and
digital image processing in hydrological modeling.
The great majority of authors agree that these tools provide a
more accurate calculation of the physical parameters necessary
to operate with hydrological models, there is an increase of
spatial working resolution at all levels, being possible the
analysis of the spatial variation of factors such as runoff
coefficients or similar, which until now were considered as
constant single value parameters [18].
In the same way, it is very important to analyze the spatial
variation of precipitation, which has hitherto been considered
as a constant and static element, which allows an analysis of the
different precipitation intensities for different points in a basin.
All this allowed the emergence of new approaches such as fully
distributed models, or new resources and techniques based on
the exhaustive knowledge of the physical environment, in
which hydrological phenomena are developed.
Within this type of study, the determination of scenarios or
areas susceptible to flooding in the face of intense and / or
prolonged rains, will have the relief as a fundamental factor,
since it controls in the first instance the direction of the flow of
water and spaces where they accumulate, as well as the time of
permanence of the same ones in the flooded area.
The methodology applied in this work (figure 2) takes these
considerations into account and based on the DTM and some
techniques and / or tools implemented in version 2.2.5 of the
SAGA, obtains the map of susceptibility to the river floods of
the studied territory.
In Figure 2 is presented the methodology used as a priority to
be able to count on a good quality DTM (precision) in
correspondence with the required work scale. This once
adjusted model is hydrologically corrected, which in many
studies is obviated and is largely responsible for the accuracy
and accuracy of the different products of model processing with
GIS tools.

International Journal of Applied Engineering Research ISSN 0973-4562 Volume 12, Number 19 (2017) pp. 9078-9086
© Research India Publications. http://www.ripublication.com
9081
Figure 2.-Methodological research scheme
(Source: Result of Analysis)
The applied methodological variant is based on the
fundamental assumption that the relief is the maximum
responsible for the distribution of the water in the surface of the
land and that from geomorphological and hydrological criteria
highly dependent on the relief, a series of factors or parameters
are selected which are calculated in the framework of the
SAGA-GIS version 2.2.5 options.
The criteria calculated and used to identify areas with the
highest susceptibility to flooding are:
Geomorphological criteria
1-Closed depressions (CD): Non-karstic relief depressions are
potentially susceptible areas to be flooded. These forms include
depressions within other depressions (nested depressions) or

International Journal of Applied Engineering Research ISSN 0973-4562 Volume 12, Number 19 (2017) pp. 9078-9086
© Research India Publications. http://www.ripublication.com
9082
flat type morphologies sunk above the general level and that in
the presence of intense or prolonged precipitations accumulate
runoff waters.
2-Vertical distance to the drainage network (VD): It is the
vertical distance from the drainage network to the adjacent
heights, from the geomorphological point of view can be
correlated with the different floodplains that can reach the
waters of the riverbeds, gives us according to its value the level
of proximity to the river bed.
Hydrological criteria
3-Modified catchment area (MCA): This is the area that
receives an amount of flow that accumulates per unit area,
making it a very important factor for describing floods.
4-Runoff-overland flow D8: It is formed when the
precipitations are superior to the capacity of infiltration of the
ground due to the high humidity of the ground that causes the
supersaturation. The relevance of this factor is corroborated by
the extensive literature on this subject, which is undoubtedly a
very important parameter for the analysis of flooding of the
terrain, since it represents the sheet of water that circulates on
the surface in a certain drainage basin.
5-Topographic wetness index (TW1): Its main use is related to
the production of runoff, assuming that it originates in the
presence of water saturation in the soil, when the water table
approaches the surface. These conditions are due to the
presence of extreme hydrometeorological phenomena with
intense or very prolonged rainfall.
Typing the data of each resulting map
With the hydrologically corrected model, the selected
geomorphological and hydrological factors are calculated.
Each of them is determined the fundamental statistical
parameters being typified according to the following
expression:
Typified Value = (Vi-μ) / σ (equation 1)
Vi-value of each raster map cell
μ-arithmetic mean of the values of all raster map cells
σ-standard deviation of the values of all raster map cells
With the typing it is possible to standardize the values of each
map and from its statisticians the values below the arithmetic
mean will be negative and above the average will be positive.
With all maps of the typed factors, the map of the
Hydromorphometric Contrast Index (HCI) is obtained from its
weighted linear sum (equation 2).
HCI= (CD + MCA +D8 +TW1- VD) (equation 2)
Where:
CD: Closed depressions
VD: Vertical distance to drainage network
MCA: Modified catchment area
D8: Runoff-overland flow
TW1: Topographic wetness index
With the values resulting from this Hydromorphometric
contrast index (HCI), histogram is constructed, if the
distribution of the data is not normal, we first use some of the
existing techniques for its normalization and like the one that
presents initial normality, using the method of the typical
deviations, summarized in table 1, establish the categories of
the degree of susceptibility of the final resulting map.
Table 1: Guide for the determination of the typical deviations for the reclassification of the data.
Category of
Susceptibility to Floods
Category Rank Calculation formula
From To
No susceptible Minimum value (Vmin) Mean value (µ) + one standard
deviations (σ)
Vmin - µ + (σ)
Poco susceptible Mean value (µ) + one standard
deviations (σ)
Mean value (µ) + two desviaciones
típicas (2σ)
µ + (σ) - µ + (2σ)
Medianamente
susceptible
Mean value (µ) + two standard
deviations (2σ)
Mean value (µ) + three standard
deviations (3σ)
µ + (2σ) - µ + (3σ)
Altamente susceptible Mean value (µ) + three standard
deviations (3σ)
Valor máximo (Vmax) µ + (3σ) - Vmax
(Source: Result of Analysis)

International Journal of Applied Engineering Research ISSN 0973-4562 Volume 12, Number 19 (2017) pp. 9078-9086
© Research India Publications. http://www.ripublication.com
9083
RESULTS AND DISCUSSION
From the processing of the hydrologically corrected DTM, the
maps corresponding to the geomorphological factors were
obtained. Figure 3A and 3B shows a detail area of the closed
depressions (CD) and the vertical distance to the drainage
network (VD) respectively.
The maps corresponding to the hydrological factor, represented
by the modified catchment area (MCA) (see figure 3C), the
runoff and the SAGA Topographic wetness index (figure 3D)
were then elaborated.
Then the values of these five maps were typified by
standardization and applying the weighted linear sum of them
to obtain the map of the Hydromorphometric Contrast Index
(HCI) showed in figure 3E, where the resulting values are
moved between 5 and -5, representing -5 the lowest
susceptibility and 5 the highest susceptibility to flooding.
In order to classify this synthetic map into representative
categories of the flood phenomenon, the statistical behavior of
its values was analyzed. In Figure 3F, the histogram
corresponding to them is shown, where a good normal
distribution of the data can be appreciated, which allowed to
apply the methodology of the standard deviations for its
categorization and to arrive at the final map of susceptibility to
the floods (See Figure 4).
A- Closed depressions (CD) B- Vertical distance to drainage network
(VD)
C- Modified catchment area -
(MCA)
F- Histogram of HCI values
D- SAGA topographic wetness index E-Hydromorphometric Contrast Index
(HCI)
Figure 3: Results of different maps obtained during processing, showing an area of detail in the vicinity of the city of Puerto
Maldonado (circle in yellow). (Source: Result of Analysis)
International Journal of Applied Engineering Research ISSN 0973-4562 Volume 12, Number 19 (2017) pp. 9078-9086
© Research India Publications. http://www.ripublication.com
9084
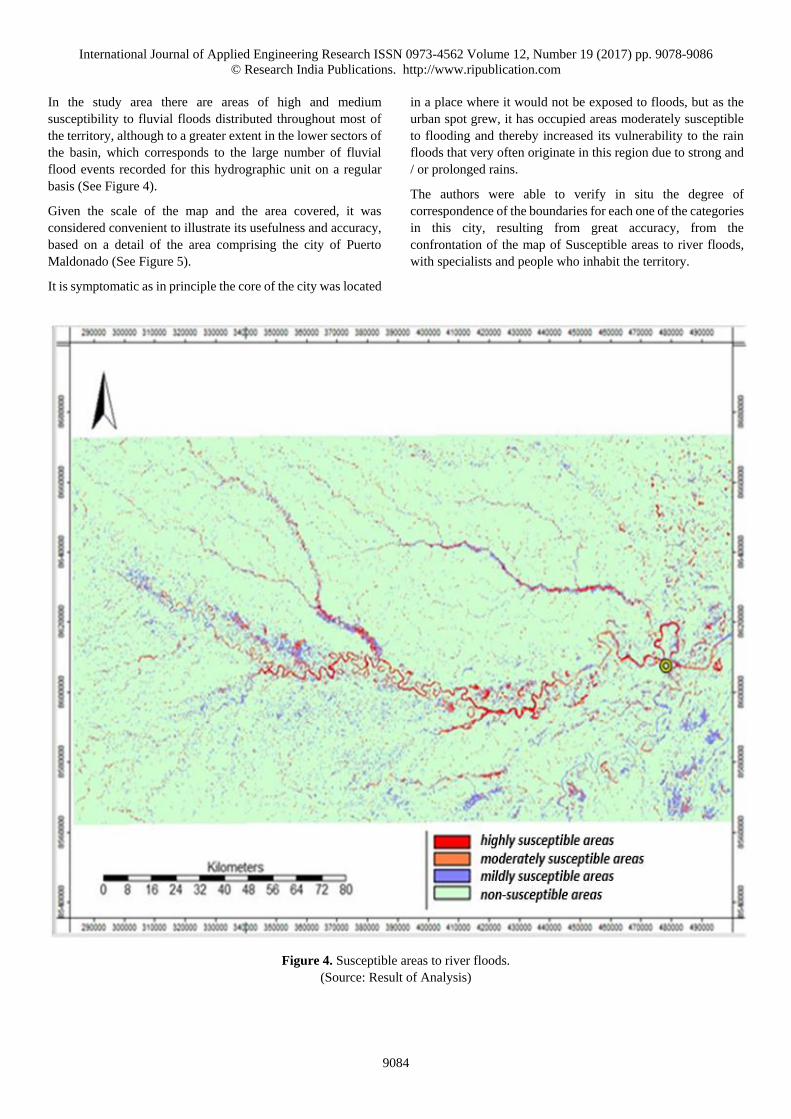
In the study area there are areas of high and medium
susceptibility to fluvial floods distributed throughout most of
the territory, although to a greater extent in the lower sectors of
the basin, which corresponds to the large number of fluvial
flood events recorded for this hydrographic unit on a regular
basis (See Figure 4).
Given the scale of the map and the area covered, it was
considered convenient to illustrate its usefulness and accuracy,
based on a detail of the area comprising the city of Puerto
Maldonado (See Figure 5).
It is symptomatic as in principle the core of the city was located
in a place where it would not be exposed to floods, but as the
urban spot grew, it has occupied areas moderately susceptible
to flooding and thereby increased its vulnerability to the rain
floods that very often originate in this region due to strong and
/ or prolonged rains.
The authors were able to verify in situ the degree of
correspondence of the boundaries for each one of the categories
in this city, resulting from great accuracy, from the
confrontation of the map of Susceptible areas to river floods,
with specialists and people who inhabit the territory.
Figure 4. Susceptible areas to river floods.
(Source: Result of Analysis)

International Journal of Applied Engineering Research ISSN 0973-4562 Volume 12, Number 19 (2017) pp. 9078-9086
© Research India Publications. http://www.ripublication.com
9085
Figure 5: Detail of the city of Puerto Maldonado and its different categories of susceptibility to fluvial flooding.
(Source: Result of Analysis)
CONCLUSIONS
The methodology proposed and used allowed to delimit with
accuracy the diverse scenarios of areas susceptible to the
floods, which was verified in the later field trips in the zone.
The high correspondence between the areas that traditionally
present fluvial floods in the city of Puerto Maldonado with
those categorized as medium and highly susceptible as a result
of the present study.
The criteria and factors used allowed to integrate the
information necessary and sufficient to delimit the areas
susceptible to rain floods, note that this methodological
approach only uses as a starting point the DTM, in contrast to
other more complex modeling, involving a considerable group
of variables, some of which are difficult to obtain or estimate.
In the studied area of Madre de Dios hydrographical unit, flood
events occur quite frequently, which is fully reflected in the
large number of areas categorized in the present study, such as
medium and high susceptibility to fluvial floods, which
indicates that there are geomorphological and hydrological
conditions so that in the presence of intense or prolonged rains
part of the territory can be under the waters.
ACKNOWLEDGMENT
The authors wish to express their gratitude to the Board of the
Geographical Society of Lima, Peru, for the possibility of
visiting the study area during August 2016 and carrying out the
relevant field checks and the authorities of the Continental
University of Huancayo, Peru, for the support provided during
the conduct of the investigation.
REFERENCES
[1] ANA-DCPRH-Aguas S, 2010, Diagnóstico hidrológico
de la cuenca Madre de Dios, Lima.
[2] Álvarez, J., V. Sotero, A. Brack, y C. A. Ipenza, C.
2011, Minería aurífera en Madre de Dios y
contaminación con mercurio. Una bomba de tiempo.

International Journal of Applied Engineering Research ISSN 0973-4562 Volume 12, Number 19 (2017) pp. 9078-9086
© Research India Publications. http://www.ripublication.com
9086
Lima: MINAM.
[3] Valencia, L. 2014, Madre de Dios: ¿podemos evitar la
tragedia? Políticas de ordenamiento de la minería
aurífera, Lima: SPDA
[4] Paz, G. 2016, Mineros ilegales arrasan área similar a
1,000 canchas de fútbol en Madre de Dios, Diario
Gestión (edición digital) 2015, Published
in:http://gestion.pe/politica/mineros-ilegales-arrasan-
area-similar-1000-canchas-futbol-madre-dios-2141843,
consulted: 4/09/2016
[5] Poder Ejecutivo Peruano, 2016, “Alerta en Madre de
Dios”, Diario El Peruano (edición digital) 2016,
Published in: www.elperuano.com.pe/eppo/noticia-
alerta-madre-dios-41249.aspx ,consulted: 4/05/ 2016
[6] UNEP & GEAS,2012, “Early Warning Systems: A State
of the Art Analysis and Future Directions”,
Environmental Development 4: 136-171.
[7] Chandrasekar, V. and R. Cifelli, 2012, “Concepts and
principles of rainfall estimation from radar: Multi-sensor
environment and data fusion”, Indian Journal of Radio
and Space Physics (41): 389-402.
[8] Paoli, C., U. C. Dondeynaz and C. Carmona-Moreno,
2015, Gestión integrada de crecidas. Guía y caso de
estudio, Joint Research Centre–Institute for
Environment and Sustainability, Report-EUR 27493 ES.
[9] Goerl, R.F. and M. Kobiyama, 2005, “Considerações
sobre as Inundações no Brasil”. Xvi Simpósio Brasileiro
De Recursos Hídricos, 2005, João Pessoa. Anais... Porto
Alegre, ABRH.
[10] Londe, L.; M. P. Coutinho, L. T. Di Gregório, L. B. L.
Santos and E. Soriano, 2014, “Water-related disasters in
Brazil: Perspectives and recommendations”, Ambiente
& Sociedade, São Paulo v. XVII, n. 4, out. -dez: 133-
152.
[11] Conrad, O., Bechtel, B., Bock, M., Dietrich, H., Fischer,
E., Gerlitz, L., Wehberg, J., Wichmann, V., and Böhner,
J.,2015, “System for Automated Geoscientific Analyses
(SAGA) v. 2.1.4”, Geosci. Model Dev., 8, 1991-2007,
Published in: https://doi.org/10.5194/gmd-8-1991-2015,
consulted: 22/09/2015.
[12] Fisher, R., Hobgen, S., Mandaya, I., Kaho, N.R. and
Zulkarnain, 2017, Satellite Image Analysis and Terrain
Modelling - A practical manual for natural resource
management, disaster risk and development planning
using free geospatial data and software. Published in:
https://sagatutorials.wordpress.com/training-manual/,
consulted: 3/07/2017
[13] Boehner, J., Selige, T.,2006, “Spatial Prediction of Soil
Attributes Using Terrain Analysis and Climate
Regionalisation” In: Boehner, J., McCloy, K.R., Strobl,
J.: 'SAGA - Analysis and Modelling Applications',
Goettinger Geographische Abhandlungen, Vol.115,
p.13-27
[14] ANA (2012): Delimitation and codification of the
hydrographic units of Peru. Directorate of Soil
Conservation and Improvement (in Spanish). Published
in:
http://es.calameo.com/read/0012719453af0e6eba3d7,
consulted: 4/02/2016
[15] Stehli, P. T.; J. F. Weber y L. R. Vestena, 2014, Revisión
del estado del arte y estrategias en la modelación
hidrológica distribuida en cuencas urbanas, Published
in: www.ina.gov.ar/ifrh-2014/Eje3/3.38.pdf, consulted:
3/04/2016
[16] Weber, J. F.; L. R. Vestena, P. T. Stehli y E.
Jorquera,2013, Modelación hidrológica distribuida de
la cuenca del río Caeté, SC, Brasil, Published in:
http://www.academia.edu/7893213/MODELACI%C3
%93N_HIDROL%C3%93GICA_DISTRIBUIDA_DE_
LA_CUENCA_DEL_R%C3%8DO_CAET%C3%89_S
C_BRASIL, consulted: 22/03/2017
[17] Ponce, V.M.,1994, Engineering Hydrology. Principles
and practices, London: Prentice Hall.
[18] Olaya, V. 2004. Hidrología Computacional y Modelos Digitales del Terreno-Teoría, práctica y filosofía de una nueva forma de análisis hidrológico, Published in:
http://heart.sf.net/textos , consulted: 7/02/2015.