hydrogeologic information on the glorieta sandstone … · hydrogeologic information on the...
TRANSCRIPT
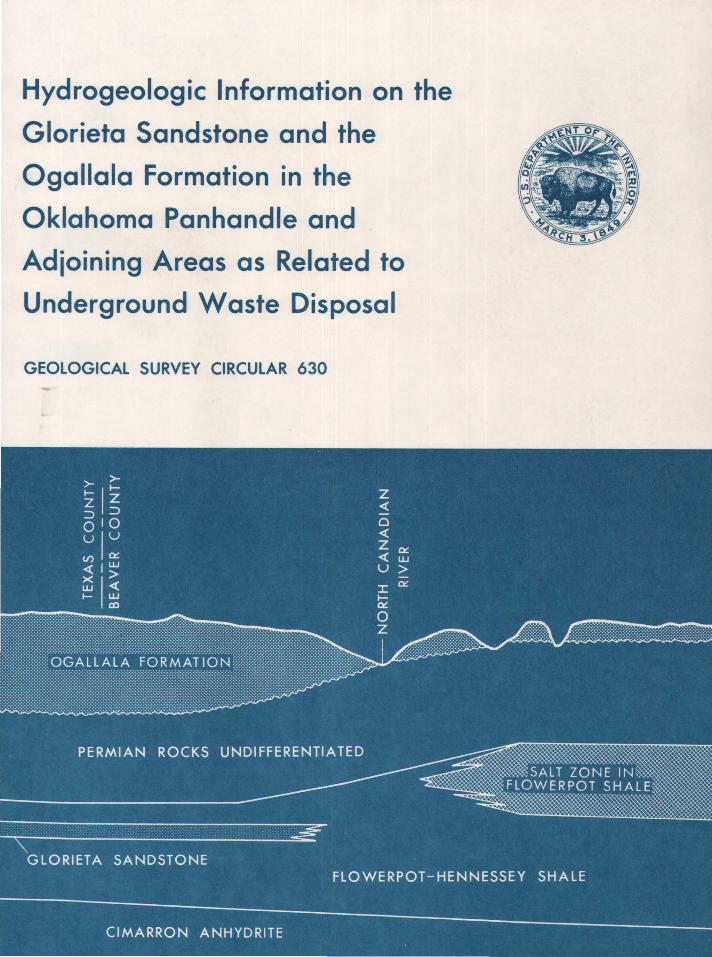
Hydrogeologic Information on the
Glorieta Sandstone and the
Ogallala Formation in the
Oklahoma Panhandle and
Adioining Areas as Related to
Underground Waste Disposal
GEOLOGICAL SURVEY CIRCULAR 630

Hydrogeologic Information on the
Glorieta Sandstone and the
Ogallala Formation in the
Oklahoma Panhandle and
Adioining Areas as Related to
Underground Waste Disposal
By James H. Irwin and Robert B. Morton
GEOLOGICAL SURVEY CIRCULAR 630
Washington 1969

United States Department of the Interior CECIL D. ANDRUS, Secretary
Geological Survey H. William Menard, Director
First printing 1969 Second printing 1978
Free on application to Branch ol Distribution, U.S. Geological Survey 1200 South Eads Street, Arlington, Va. 22202

CONTENTS
J\bstract --------------------------------------Introduction ____________ ----------------------Regional geologic setting -----------------------
Structure --------------------------------Subsurface rocks -------------------------
Rocks of Permian age -----------------Rocks of Triassic age -----------------Rocks of Jurassic age -----------------Rocks of Cretaceous age ---------------
Surface rocks ----------------------------Relation of the Glorieta Sandstone to the Ogallala
Formation -----------------------------Glorieta Sandstone ----------------.,.-------Ogallala Formation and younger sedimentary
rocks -----------------------------------
Page Page
1 Character of the strata between the Glorieta 1 Sandstone and the Ogallala Formation ----- 9 3 Hydrology ------------------------------------ 9 3 Ogallala Formation and younger rocks _______ 9 3 . Other aquifers ---------------------------- 10 6 Quality of water------------------------------- 11 6 Ogallala Formation ------------------------ 11 7 Other aquifers ---------------------------- 11 7 Rocks of Permian age ------.---------------- 11 7 Resource development -------------------------- 12
VVater resources --------------------------- 12 8 Oil and gas resources -------------------·--- 12 8 Disposal wells --------------------------------- 12
Summary and conclusions ---------------------- 15 8 Selected references ---------------------------- 16
ILLUSTRATIONS
[Plates are in pocket}
PLATE 1. Map showing extent of Ogallala Formation and Glorieta Sandstone and equivalents in the Oklahoma Panhandle and adjoining areas.
2. Geologic sections A-A' and B-B' of the Oklahoma Panhandle and adjoining areas. 3. Geologic section C-C' of the Oklahoma Panhandle. 4. Hydrologic map of the Oklahoma Panhandle and adjoining areas.
Page
FIGURE 1. Index map showing location of report area and relative positions of some of the principal tectonic features ---------------------------------------------------------------------- 2
2. Representative electric logs of wells showing- geologic correlations in the Oklahoma Panhandle ___ 4 3. Correlation chart showing geologic nomenclature ------------------------------------------- 5 4. Schematic diagram showing how waste water might enter a fresh-water aquifer through ab1.n-
doned wells ------------------------------------------------------------------------·--- 14
TABLES
Page
TABLE 1. Chemical analyses of ground water---------------------------------------------------------- 18 2. Information on wells or well sites where permits have been granted for injection into He
Glorieta Sandstone -------------------------------------------------------------------- 22 III

Hydrogeologic Information on the Glorieta Sandstone and the Ogollalr
Formation in the Oklahoma Panhandle and adioining areas os relate~
to underground waste disposal
By James H. Irwin and Robert B. Morton
Abstract
The Oklahoma Panhandle and adjacent areas in Texas, Kansas, Colorado, and New Mexico have prospered because of the development of supplies of fresh water and of oil and gas. The Ogallala and, in places, Cretaceous rocks produce fresh water for irrigation, public supply, and domestic and stock use through approximately 9,000 irrigation and publicsupply wells and a large but undetermined number of other wells. Disposal of oil-field brine and other wastes into the Glorieta Sandstone is of concern to many local residents because of the possibility of pollution of the overlying fresh-water aquifers, particularly the Ogallala Formation. Permits for 147 disposal wells into the Glorieta have been issued in this area.
This report summarizes the data on geology, hydrology, and water development currently available to the U.S. Geological Survey. Geologic information indicates that, in the report area, the Glorieta Sandstone lies at depths ranging from about 500 to 1,600 feet below the base of the Ogallala Formation. The rocks between those two formations are of relatively impermeable types, but solution and removal of salt has resulted in collapse of the rocks in some places. Collapse and fracturing of the rocks could result in increased vertical permeability. This might result in movement of brine under hydrostatic head from the Glorieta Sandstone into overlying fresh-water aquifers, in places where an upward hydraulic gradient exists or is created by an increase in pressure within the Glorieta. Abandoned or inadequately sealed boreholes also are possible conduits for such fluids.
The mixing of water in the fresh-water aquifers with brines injected into the Glorieta is not known to have occurred anywhere in the report area, but the information available is not adequate to show positively whether or not this may have occurred locally. Much additional information on the stratigraphy and hydrology-particularly, data on the potentiometric
1
surface of water in the Glorieta-needs to be collected and analyzed before conclusions can be drawn regarding the possibility of vertical movement of oil-field brines from the Glorieta to fresh-water aquifers above.
INTRODUCTION
The development of the natural resources of southwestern Kansas, the Oklahoma and Texas Panhandles, and the adjacent areas of Color:ado and New Mexico during the past few decades has brought a rich and thriving economy to the area. Oil and gas development brought vitality and wealth. The development of large quantities of water suitable to irrigate the semiarid land and to serve its population has led to a booming agricultural and cattle-ranch economy.
But, as so often is the case, progress through this development and beneficial use of natural resources has generated problems-pri11 c-ipally, potential depletion of the resources and possible adverse effects of wastes. Thus, among all who develop the land and its resources the"·e is a common concern to protect, where necessary, as well as to develop. In the area of .thir report the practice of disposal of certain wastes by injection into the earth has been citE'd as a possible threat to overlying fresh groun~-water supply. The anxiety of those who der~nd on this water has demonstrated the need for more geologic and hydrologic data pertinent to the problem.
Of immediate concern to many is the ouestion of whether or not injection of oil-field brines into the Glorieta Sandstone will poll·1te the

fresh water of the Ogallala Formation and other fresh-water aquifers that lie several hundred feet above the Glorieta Sandstone. The purpose of this report is to summarize the geologic and hydrologic data concerning the relation of the Glorieta Sandstone to the Ogallala Formation that are currently available to the U.S. Geological Survey.
The scope of the report is limited because no detailed study of the geology and hydrology of the Glorieta Sandstone (or its equivalent strata known by other names) in the report area has been made. The U.S. Geological Survey, in cooperation with various State agencies in Kansas, Oklahoma, Texas, Colorado, and New
102° 40°
38°
36°
34°
Mexico, has conducted studies of the freshwater aquifers, principally the Ogallala Formation, in most of the report area. Most of these studies have been published and are listed in the selected references.
This report, therefore, is based on data from published reports of the U.S. Geological Survey and State agencies; data from tl'~ files of the district offices of the Water Resources Division of the U.S. Geological Survey in the five States; and information obtained from records of the Oklahoma Corporation Commission, the Oklahoma Geological Survey, the OkJahoma Water Resources Board, the Texas Railroad Commission, the Kansas State Board of Health, and
100° 98° --------
KANSAS
0
OKLAHOMA
TEXAS
200 MILES
FIGURE !.-Location of report area (shaded) and relative positions of some of the principal te~~tonic features.
2
numerous oil companies that operate in the area. Acknowledgment is due these State agencies and oil companies, the Texas County Irrigation Association, the North Plains Irrigation District, Dumas, Tex., and many others for their help in compiling these data. Special recognition is due Peter R. Stevens, Austin, Tex., and Roy H. Bingham, Donald L. Hart, Jr., and Richard P. Orth, Oklahoma City, Okla., for their invaluable assistance in compiling data and preparing this report.
The report limits were selected to include the area where the Ogallala Formation and related deposits occur as a continuous aquifer in the five-State area and are shown in figure 1. The area is approximately 47,000 square miles. The northern boundary is the Arkansas River in Colorado and Kansas; the southern boundary is approximately the Canadian River in New Mexico, Texas, and Oklahoma. The western boundary is approximately long 104° W. in Colorado and New Mexico, and the eastern boundary is approximately long 99° W. in Kansas and Oklahoma.
REGIONAL GEOLOGIC SETTING
STRUCTURE
As shown on figure 1, the major positive structural features of the report area are the Amarillo and Sierra Grande uplifts, and the major negative structural features are the Anadarko and Raton basins. The Hugoton embayment is a northwestern extension of the Anadarko basin, and to a lesser degree the Dalhart basin probably is a western lobe of the Anadarko. The Keyes dome, Cimarron arch, and Stratford dome are alined roughly parallel to the Sierra Grande uplift and, as a group, may be part of a positive structural axis related but subordinate to the Sierra Grande. The Keyes-Stratford dome alinement forms an interrupted structural divide of low relief near the western extremity of the Anadarko basin. Most of the report area, therefore, is within the northwestern limits of the Anadarko basin. The Anadarko basin is asymmetrical ; its principal axis has a southeastward trend and lies only· a short distance northeast of, and parallel· to, the Amarillo uplift. The axis extends from the Texas and Oklahoma Panhandles southeastward toward
3
south-central Oklahoma. Over most of the report area, the rocks described occur at relatively shallow depths and are relatively undisturbed; consequently, the prevailing dip at shallow depth is to the southeast at an average rate of 1° or less.
SUBSURFACE ROCKS
During studies being conducted by the U.S. Geological Survey in cooperation with the Oklahoma Water Resources Board in the Oklahoma Panhandle, a series of geologic sections were prepared showing the relation of the Ogallala Formation to the underlying rocks. Two of the sections were extended to include the area of this report. Locations of these sections are shown on plate 1. Section A-A' (pl. 2) is about 168 miles long and extends from Colfax County, N. Mex., to Beaver County, Okla. Section B-B' (pl. 2) reaches from approximately the Arkansas River in Hamilton County, Kans., to about the Canadian River in Potter County, Tex., a straight-line distance of approximately 250 miles.
Geologic section C-C' (pl. 3) was prepared independently by David L. Vosburg for the Oklahoma Geologic;al Survey and was kindly made available by the author and the State Survey for use in this report. Section C-C' is from unpublished data and is subject to revision. It extends a straight-line distance of about 110 miles across Texas and Cimarron Counties, Okla. The stratigraphic nomenclature used on the geologic section does not necessarily follow that formally adopted by the U.S. Geological Survey. The location of section C-C' is shown on plate 3.
The geologic sections were prepared mostly by electric-log correlations and were verified in many instances by a study of sample logs of well cuttings. The correlations generally are straightforward; consequently, the sections are a valid representation of the regional geology. Examples of typical electric logs with correlations are shown in figure 2.
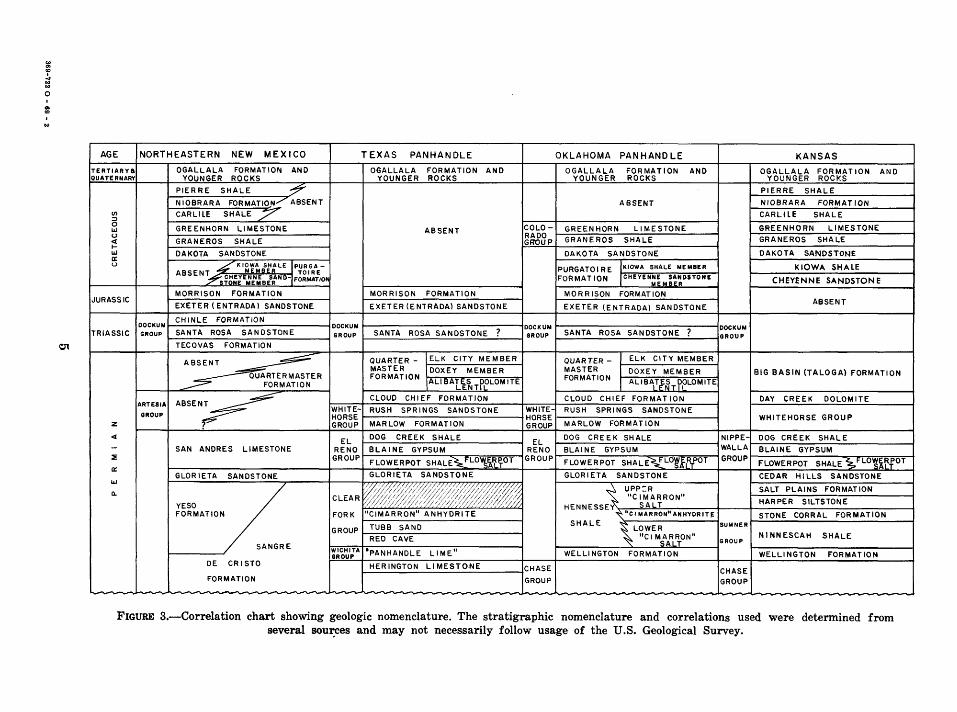
The correlation chart (fig. 3) shows equivalent or approximately equivalent rock units in the report area.
The following geologic observations have general application but are most appropriate
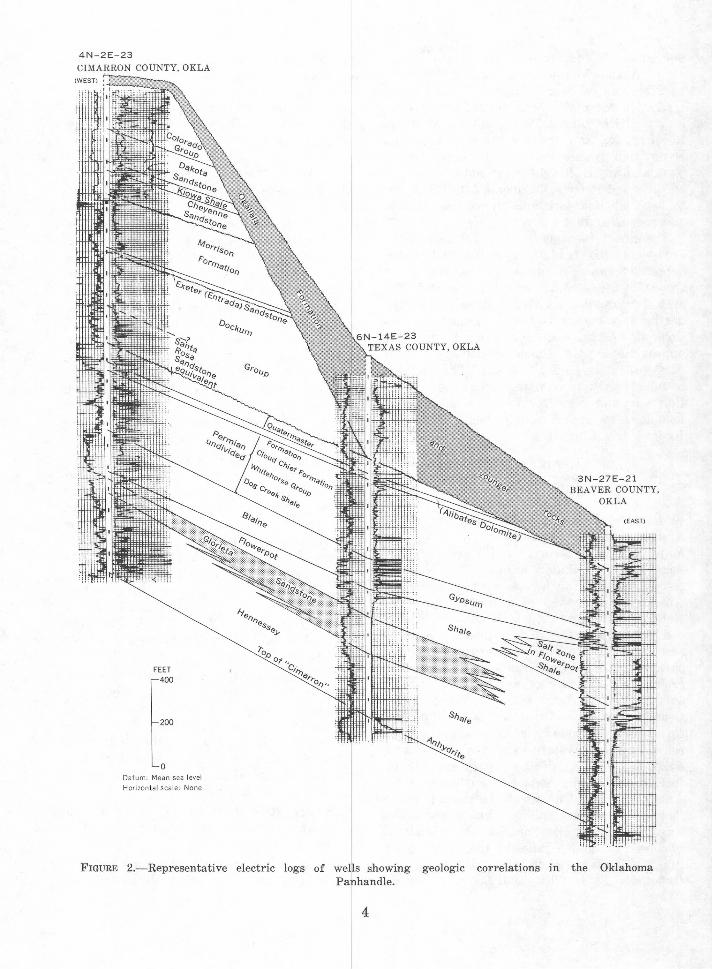
4N-2E-23
CIMARRON COUNTY, OKLA
200
0 Da tum : Mean sea level
Hori zon tal scal e: None
FIGURE 2.- Representative electric logs of wells showing geologic correlations in the Oklahoma Panhandle.
4
... "' "' I _, N N
0 I
"' "' ' N
01
AGE NORTHEASTERN NEW MEXICO TEXAS PANHANDLE OKLAHOMA PANHANDLE KANSAS
TERTIARY& OGALLALA FORMATION AND OGALLALA FORMATION AND OGALLALA FORMATION AND OGALLALA FORMATION AND QUATERNARY YOUNGER ROCKS YOUNGER ROCKS YOUNGER ROCKS YOUNGER ROCI<:S
PIERRE SHALE y PIERRE SHALE
NIOBRARA FORMATION/ ABSENT ABSENT NIOBRARA FORMAT ION J VI CARLILE SHALE Z_ CARLILE SHALE ;::) 0
GREENHORN LIMESTONE COLO- GREENHORN Ll ME STONE GREENHORN LIMESTONE w ABSENT (.) RADO
GRANEROS SHALE GRANEROS SHALE "' GRANEROS SHALE GROUP 1-
DAKOTA SANDSTONE w DAKOTA SANDSTONE DAKOTA SANDSTONE a:: u
ABSENT ~ Kl~~~:r:LE jP~~~G:E- PURGATOIRE KIOWA SHALE MEMBER KIOWA SHALE
~i~:JE::~strD-~FORIIIAT/0~ FORMAT ION CHEYENNE SANDSTONE CHEYENNE SANDSTONE MEMBER
MORRISON FORMATION MORRISON FORMATION MORRISON FORMATION JURASSIC
EXETER (ENTRADA) SANDSTONE EXETER(ENTRADAISANDSTONE ABSENT
EXETER (ENTRADA) SANDSTONE
DOCKUM CHINLE FORMATION
DOCKUM DOCKUM SANTA ROSA SANDSTONE ? DOCKUM
TRIASSIC GROUP SANTA ROSA SANDSTONE GROUP SANTA ROSA SANDSTONE ? GROUP GROUP
TECOVAS FORMATION
~ QUARTER- ELK CITY MEMBER QUARTER- ELK CITY MEMBER MASTER DOXEY MEMBER MASTER DOXEY MEMBER BIG BASIN (TALOGA) FORMATION FORMATION
ALIBAJ~~TP~LOMITE FORMATION
ALIBAC~~T~OLOMITE N ER
ABSE~ CLOUD CHIEF FORMATION CLOUD CHIEF FORMAT ION DAY CREEK DOLOMITE ARTESIA
WHITE- RUSH SPRINGS SANDSTONE WHITE- RUSH SPRINGS SANDSTONE GROUP HORSE HORSE WHITEHORSE GROUP
z GROUP MARLOW FORMATION GROUP MARLOW FORMAT ION
"' EL DOG CREEK SHALE
EL DOG CREEK SHALE NIPPE- DOG CREEK SHALE
- SAN ANDRES LIMESTONE RENO BLAINE GYPSUM RENO BLAINE GYPSUM WALLA BLAINE GYPSUM ~ GROUP
FLOWERPOT SHALE~FLO'l~~OT GROUP FLOWERPOT SHALE~LO'gf(YOT GROUP FLOWERPOT SHALE~FLO~i~tOT
a:: GLORIETA SANDSTONE GLORIETA SANDSTONE CEDAR HILLS SANDSTONE GLOR lETA SANDSTONE
1&.1
iffi~j{{fjj- ~ UPP:R SALT PLAINS FORMATION Q.
"CIMARRON" CLEAR HARPER SILTSTONE
YESO ~ HENNESS SALT FORMATION FORK "CIMARRON" ANHYDRITE . ~11 CI MARRON" ANHYD~ITE STONE CORRAL FORMATION
TUBB SAND SHALE \LOWER SUMNER GROUP
RED CAVE 11 CI MARRON" N INN ESCAH SHALE
SALT- GROUP SANGRE WICHITA "PANHANDLE LIME" GROUP WELLINGTON FORMATION WELLINGTON FORMATION
DE CRISTO HER lNG TON Ll MESTO.NE CHASE CHASE FORMATION GROUP GROUP
-------FIGURE 3.-Correlation chart showing geologic nomenclature. The stratigraphic nomenclature and correlations used were determined from
several sout:ces and may not necessarily follow usage of the U.S. Geological Survey.
to the Oklahoma Panhandle which is centrally located in the subject area. Thicknesses reported are determined from the geologic sections or from published reports.
Rocks of Permian Age
The undifferentiated Permian rocks shown below the Hennessey Shale, with the exception of the New Mexico section, consist mostly of the upper few hundred feet of the Chase Group and the Wellington Formation. The Wellington Formation consists typically of a lower salt-anhydrite unit, a mottled maroongreen shale unit, and an upper anhydrite unit and has a thickness of about 600 feet in the Oklahoma Panhandle.
The Hennessey Shale is a mixture of red and green shale with local stringers of anhydrite, gypsum, or dolomite and is approximately 300 feet thick. The equivalent rock interval in the Texas Panhandle is the Clear Fork Group and in northeastern New Mexico it is the Y eso Formation (fig. 3) .
The "Cimarron" anhydrite, the equivalent of the Stone Corral Formation of Kansas (Lee and Merriam, 1954, p. 3), is shown on sections A-A' and C-C'. The "Cimarron" consists of varying amounts of interbedded white anhydrite, finely crystalline buff-colored do]omite, and salt. Commonly, the "Cimarron" is 50 feet thick in the Oklahoma Panhandle, but locally it may be more than 100 feet, mostly because of a greater thickness of bedded salt. Elevations of the top of the "Cimarron" anhydrite are the most reliable data for determining structural dip.
The Glorieta Sandstone is the shallowest Permian sandstone of significant thickness and continuity in the report area and is equivalent to the Cedar Hills Sandstone of Kansas (fig. 3) . The Glorieta is discussed in more detail later in the report.
The Flowerpot Shale overlies the Glorieta Sandstone in most of the area, but it may be absent locally. The Flowerpot Shale is varicolored and gypsiferous ; the usual thickness is 30 to 35 feet but it increases locally to 125 feet.
The salt zone in the Flowerpot Shale occurs mostly in the extreme eastern part of the area as shown on section A-A' (pl. 2) ; how-
6
ever, section C-C' (pl. 3) shows k~al remnants of the salt zone as far west as Cimarron County, Okla. The salt zone generally consists of salt-bearing shale near the bas~ that grades upward into relatively pure salt near the top. Locally, the salt zone is nearly 500 feet thick, but more commonly it is about 350 feet.
The Blaine Gypsum in the subsurface commonly consists of six or seven distinct white gypsum or anhydrite beds separated by lesser amounts of red shale, dolomite, and salt. The Blaine ranges in thickness from slightly less than 100 feet to approximately 350 feet but generally is about 100 to 130 fe~~t thick. The thicker sections are the result of the deposition of additional anhydrite and salt at the top of the Blaine. On well logs the thic' .. section appears as a single lithologic unit, but the upper part may be an evaporite facies of the overlying Dog Creek Shale (Jorcan and Vosburg, 1963, p. 42).
The undifferentiated Permian rocks above the Blaine Gypsum include, wl·ere present, the Dog Creek Shale, Whitehorse Group, Cloud Chief Formation, and Q·lartermaster Formation. The undifferentiated Permian rocks range in thickness from approximah~ly 200 to 600 feet and consist m')stly of red shale and red to pink fine-grained sandstone or siltstone; varicolored shale, gyps·1m or anhydrite, dolomite, and salt are pre8,ent in lesser amounts.
The top of the Permian sectior is placed at the top of a red shale zone, generally 70 to 80 feet thick, overlying the Alib2.tes Dolomite Lentil of the Quartermaster Formation. The red shale interval shows a strong gamma-ray reading, and the Alibates is an excellent marker in samples and on most ele~tric logs.
In north-central Colfax County, N. Mex., the Permian section above the Glorieta apparently has thinned considerably and is represented by the San Andres Limestone (fig. 3) .
Rocks of Triassic Age
In the Oklahoma Panhandle and adjacent areas, rocks of Triassic age are. represented by the Dockum Group (Cummins, 1890, p. 189). The Dockum Group has an approximate maximum thickness of 650 feet and for the
convenience of this discussion is divided into lower and upper units.
The lower unit of the Dockum is mostly pink to red sandstone. The grains are of medium size and are subrounded. Polished loose sand grains ranging from fine to coarse are reported, and in places the sandstone is slightly micaceous and shaly. The aggregate thickness of sandstone in the lower unit ranges from approximately 50 to more than 200 feet and averages about 100 feet. The remaining part of the lower unit of the Dockum consists of thin layers of varicolored shale and siltstone interbedded with sandstone. The upper unit of the Dockum is principally red •and green shale and lesser amounts of thinly bedded, mostly fine-grained pink to red shaly sandstone.
Rocks of Jurassic Age
The Exeter Sandstone (Entrada Sandstone in Colorado, New Mexico, and Kansas) is the basal member of the Jurassic in the report area. Generally, the Exeter (Entrada) is a soft white to pink sandstone. The grains are medium sized, subrounded to rounded, and well sorted. In the Oklahoma Panhandle the sandstone ranges in thickness from zero at the subcrop limit to about 35 feet and, because of its thinness, is difficult to identify in the subsurface.
The Morrison Formation overlies the Exeter Sandstone and from its subcrop limit reaches a thickness of about 325 feet in the Oklahoma Panhandle and 550 feet in Union County, N. Mex. It consists principally of pale green and red shale and siltstone interbedded with lesser amounts of thin reddish shaly sandstone. Locally, it contains thin limestone and anhydrite.
Rocks of Cretaceous Age
The basal units of the Cretaceous System are referred to as the Cheyenne Sandstone and Kiowa Shale in Kansas, Oklahoma, Colorado, and New Mexico. In the latter three States these rocks are considered to be members of the Purgatoire Formation. The Kansas nomenclature, in which the Cheyenne and Kiowa are of formational rank, is used in this report. The Cheyenne Sandstone ranges in thickness from 0 to approximately 125 feet in the
7
Oklahoma Panhandle. In southeastern Colorado the Cheyenne is 0 to 250 feet thick. Typically, the Cheyenne is a white to brown san~stone. Grains are medium to coarse and are r'">unded to subrounded. Isolated erosional re:"Ylnants of Cretaceous rocks, probably the Cheyenne Sandstone, occur in the Oklahoma Panhandle.
The Kiowa Shale, which overlies the Cheyenne Sandstone, ranges in thickness from 0 to 65 feet in the Oklahoma Panhanc1le and commonly is about 30 feet thick. The Kiowa consists of dark-gray to black shale, is locally fossiliferous and calcareous, and in plac~s may contain thin beds of dense gray limestone. The Kiowa commonly grades upward into r. sandy shale or sandstone phase.
The Dakota Sandstone conformably overlies the Kiowa Shale. In most places the upper surface of the Dakota is an erosional surface; its thickness ranges from zero to more than 200 feet. In well samples, the Dakota is a light-gray to brown sandstone. Grains are fine to medium sized and subangular to rounded.
In the Oklahoma Panhandle, the Colorado Group consists of the Graneros Shale and the Greenhorn Limestone and ranges in tll ickness from 0 to approximately 175 feet. The lower unit, the Graneros Shale, is predorr.inantly a gray to black shale interbedded with thin layers of gray fossiliferous limestone; in places it is sandy. The upper unit, tJ:le Greenhorn Limestone, is a gray crystalline, fossiliferous limestone interbedded with almost equal amounts of gray shale.
The Cretaceous rocks in southwester""\ Kansas are undivided and range in thickne;-os from 0 to about 300 feet. The Cretaceous rocks are considerably thicker in the Raton b.~sin of New Mexico. Almost 3,000 feet of CrE:~.aceous sedimentary rocks are shown in the westernmost well in section A-A' (pl. 2). In northeastern New Mexico the rock interval mapped as Dakota Sandstone includes the Cl'~yenne Sandstone and Kiowa Shale of adjoining· areas.
SURF ACE ROCKS
The surface rocks in southwestern Kansas, in most of Baca and southern Prower~ Counties in the southeastern corner of C0lorado, and in the Oklahoma and Texas Panhandles
generally are Tertiary and Quaternary clastic deposits. The Tertiary and Quaternary rocks, including the Ogallala Formation, are discussed in detail later in the report. Older sedimentary rocks ranging in age from Permian to Cretaceous crop out locally along larger streams where erosion has removed the younger rocks. Most of the sedimentary rocks in Otero, Bent, northern Prowers, eastern Las Animas, and parts of western Baca Counties, Colo., are of Cretaceous age. Rocks ranging in age from Permian to Jurassic crop out Jocally along the major streams. In southeastern Las Animas County, Quaternary lava flows have formed a topographic feature called Mesa de Maya. The surface rocks of Union and Colfax Counties, N. Mex., range in age from Precambrian to Quaternary. Cretaceous and Tertiary sedimentary rocks predominate in Colfax County; lesser amounts of intrusive and extrusive igneous rocks, ranging from Cretaceous· to Quaternary in age, are present. The surface rocks of Union County are about evenly divided between consolidated sedimentary rocks of Jurassic to Cretaeous age, clastic deposits of Tertiary age, and lava flows of Tertiary and Quaternary age.
RELATION OF THE GLORIETA SANDSTONE TO THE OGALLALA FORMATION
GLORIETA SANDSTONE
The type locality of the Glorieta Sandstone is on Glorieta Mesa along the Pecos River in Santa Fe and San Miguel Counties, N. Mex., approximately 20 miles southeast of Santa Fe and southwest of the study ar.ea. The Glorieta Sandstone of this report occupies a position in the stratigraphic sequence similar to that of the type locality, and the following description of its physical characteristics in the subsurface resembles that of typical Glorieta Sandstone. Well samples show that it is usually a white to pink fine- to medium-grained slightly gypsiferous unconsolidated sand; the sand grains are rounded and polished. Owners of wells completed in the Glorieta report that entrance of sand into the well with the water is a common and serious problem.
The Glorieta commonly is 200 feet thick in Texas County, Okla., and in adjoining parts of the Texas Panhandle and probably averages
8
more than 100 feet where present in the report area. The Glorieta is slightly lenticular, however, and apparently is abs~nt locally 6 miles southeast of Boise City in Cimarron County, Okla.
In most places the Glorieta ir about 1,000 to 1,200 feet below land surface; however, beginning in eastern Cimarron County, Okla., the depth to the Glorieta increases westward and probably exceeds 4,000 feet in the Raton basin of New Mexico.
The regional stratigraphic relations of the Glorieta Sandstone in the subsurface are not clearly understood. The geologic sections show that the Glorieta undergoes a facies change into an evaporite sequence to the north and east. The Glorieta thins considerably over the Amarillo uplift to the south. To the west, the Glorieta crops out in the north-central part of New Mexico. The outcrop of Glorieta closest to the report area is in Mora County, N. Mex., about 45 miles southwest of the westernmost well on section A-A' (pl. 2). TJ·e Glorieta is correlated with the Cedar Hills Sandstone in Kansas and western Oklahom~L It is considered a member of the San Andres Limestone to the south of the report f.rea in Texas. Facies-change relations in the dE:~per parts of the basins in western Oklahoma and T.exas need further study. The approxiinate extent of the Glorieta is shown on plate 1.
OGALLALA FORMATION AND YOUNGER SEDIMENTARY ROCKS
In Kansas, Colorado, and parte; of the Oklahoma Panhandle, the Ogallala Formation is overlain by younger sedimentary rocks that are, in part, derived from erosion of the Ogallala and are not readily distinguisl·able from the Ogallala. Local residents commonly refer to all unconsolidated surface rocks as the Ogallala, although deposits younger than the Ogallala may be present. In the text of this report. the term Ogallala includes the Og·allala Formation of Tertiary age and, w~ere present, younger sedimentary rocks of Tertiary and Pleistocene age.
The Ogallala consists of interbedded sand, siltstone, clay, lenses of gravel, thin limestone, and caliche. The proportions of· the different

rock types composing the Ogallala change rapidly from place to place, but sand generally predominates. Rocks of the Ogallala generally are light tan, buff, or almost white, but locally may show pastel shades of almost any color. The Ogallala Formation was deposited on the eroded land surface that existed in Pliocene time. The Ogallala ranges in thickness from zero to more than 700 feet, and, as shown by the geologic sections, the base of the formation is in contact with rocks ranging in age from Permian through Cretaceous. Originally, the Ogallala Formation blanketed more of the High Plains region than it does today, but its original thickness and extent have been modified by erosion. Plate 1 shows the present extent of the Ogallala in the report area.
The younger deposits sometimes included in the Ogallala are primarily loess, dune sand, and alluvium. The loess and dune sand may have appreciable lateral extent. Loess deposits cover most of southwestern Kansas. Overlying the loess in southwestern Kansas is an estimated 1,500 square miles of dune sand. In the Oklahoma Panhandle an estimated 600 square miles of younger sediments, mostly dune sand, loess, and high terrace deposits, are present. Narrow alluvial deposits are associated with some of the larger streams in the report area, especially along the Arkansas, Cimarron, and North Canadian Rivers and their principal tributaries.
CHARACTER OF THE STRATA BETWEEN THE GLORIETA SANDSTONE AND THE OGALLALA FORMATION
The thickness of the interval between the base of the Ogallala and the top of the Glorieta Sandstone ranges roughly from 800 to 1,000 feet in Kansas, 600 to 700 feet in the western part of the Texas Panhandle, and 500 to 1,600 feet, or more, in the Oklahoma Panhandle. The thickest interval in Oklahoma is in western Cimarron County; however, in most of the Oklahoma Panhandle the Ogallala-Glorieta interval is 500 to 1,100 feet thick. The rocks in this interval, discussed previously in more detail by formation and group, include anhydrite and gypsum, shale, siltstone, sandstone, lesser amounts of dolomite, and in some places bedded salt. Water-soluble rocks such as salt
9
and gypsum occur in different amounts throughout the rocks of Permian age in this interval. One of the most significant watersoluble rock intervals is the salt zone in the Flowerpot Shale. Evidence shown on geologic sections A-A' (pl. 2) and C-C' (pl. 3) indicates that this salt zone originally WN3 more extensive. As mentioned previously, tre main salt body is now to the east, whereas thinner residual salt deposits occur locally to t~e west. The thick accumulation of Ogall2la and younger rocks in the eastern half of Texas County (s·ection A-A') occupies a de1ression on the Permian surface believed to h2ve been caused mostly by solution and removal of salt from the Flowerpot by migrating ground water prior to or during deposition of the Ogallala. Removal by solution of a largE. volume of salt from a body of rocks reduces their load strength and results in collapse of the overlying rocks. Rock failure under these conditions may occur slowly over a prr>longed period through gradual settling, or it may occur rapidly by sudden collapse of the o,.rerlying rocks into solution cavities. Recent sudden movement has occurred in Beaver County, Okla., and in Hamilton County, Kans., where the land surface subsided several feet over a period of a few months.
The amount and nature of the distortion of the collapsed rock is not known, but it is necessary to assume that fracturing of the rock may have occurred. According to the strength and rigidity of the rocks (their "competence"), the fractures may or may not have "healed" after the subsidence ceased and hundreds of feet of younger rocks were added.
In all known localities, the salt zone of the Flowerpot Shale appears to terminate 2 bruptly in a solution boundary. Interpreted locations of such solution boundaries are shown on geologic section C-C' (pl. 3) .
HYDROLOGY
OGALLALA FORMATION AND YOUNGER ROCKS
The Ogallala Formation is the principal aquifer in the area. The areal .extent of the Ogallala is shown on plate 1, and in most of this area wells in the Ogallala yield adequate
quantities of water suitable for irrigation, public supply, and other uses.
The depth to water in wells in the Ogallala ranges widely, from less than 50 feet in a few places to a maximum of about 400 feet locally in Ochiltree County, Tex. The depth to water in most of the report area is between 150 and 250 feet. Information on the depth to water in most of the area is available in published and open-file reports listed in the selected references of this report.
The saturated thickness (interval between the water table and the base of the aquifer) of the Ogallala ranges from zero to more than 600 feet in southeastern Stevens County, Kans., and northeastern Texas County, Okla. Assuming equal porosity, the amount of water in storage is greatest where the saturated thickness is at a maximum. Existing data indicate that a vast amount of ground water, roughly estimated as in excess of 370,000,000 acre-feet, is theoretically available from the Ogallala in the report area. This volume of water does not represent the amount that could be pumped economically because, as water levels decline and well yields decrease, extracting the lower 30 to 50 feet of available water might be impractical. Well yields from the Ogallala depend primarily upon saturated thickness, coarseness of the water-bearing sands, and type of well construction. Yields range from a few gallons per minute for windmills to more than 2,000 gpm (gallons per minute) for some irrigation wells. Yields of irrigation wells commonly are 500 gpm or more; specific capacities (yield per foot of dra wdown) range from about 6 gpm to 100 gpm and average about 20 gpm.
OTHER AQUIFERS
T_he Dakota Sandstone and the Cheyenne Sandstone, both of Cretaceous age, produce water for irrigation, public supply, and domestic and stock use in southeastern Colorado, southwestern Kansas, western Cimarron County, Okla., Union County, N. Mex., and northwestern Dallam County, Tex. In many parts of this area, these Cretaceous sandstones furnish part of the supply for many multiplescreen wells that obtain water also from the
overlying Ogallala. In Baca County, Colo., an estimated 75 percent of the irri~ation wells obtain all or part of their water from the Cheyenne Sandstone and 15 perc~nt obta:n all or part of their water from the Dakota Sandstone (U.S. Geological Survey, 1967, p. 16, 21).
Yields from the Cheyenne ran~e widely because of the lithology of the unit. Where the sandstone is fine grained and moderately well cemented, yields ar.e generally small (10 to 20 gpm or less) , but in localitie<;' in Colorado where the sandstone is friable and poorly cemented, yields of up to 3,000 g]lm have been reported. The average measured yield in Baca and southern Prowers Counties, Colo., is 500 gpm (Richards and others, 196-:l, p. 5), and in· Grant and Stanton Counties, Kans., yields up to 500 gpm are possible where the Cheyenne is predominantly sandstone ( Fad~r and others, 1964, p. 18). Wells tapping the Dakota Sandstone alone usually yield less th-ln 100 gpm, although yields as large as 500 gpm have been measured in southeastern Colorado.
10
The Santa Rosa Sandstone of the Dockum Group of Triassic age is an aquifer in New Mexico and in parts of the Texas Panhandle and is a potential aquifer in son1e other parts of the report area. The Dockmn Group is a source of irrigation water in southeastern Baca County, Colo. (Richards and others, 1968, p. 5) , where maximum well yields of as much as 2,500 gpm are re'ported. Well depths necessary to reach the base of the Dockum in the Oklahoma Panhandle range from a few hundred feet in Texas County to 1,200 feet in western Cimarron County. Water from t~is unit is under artesian pressure and may fl0w from wells on low ground.
The rocks of Permian age generally are not used as a source of water in the report area. Shallow Permian rocks in F~aver County, Okla., may be a source of water for stock and domestic use in those localities where water from other aquifers is. unavailat•~. This water contains high concentrations of dissolved minerals, and well yields are small. Water in these rocks is under artesian pressure and may flow from some wells.

QUALITY OF WATER
OGALLALA FORMATION
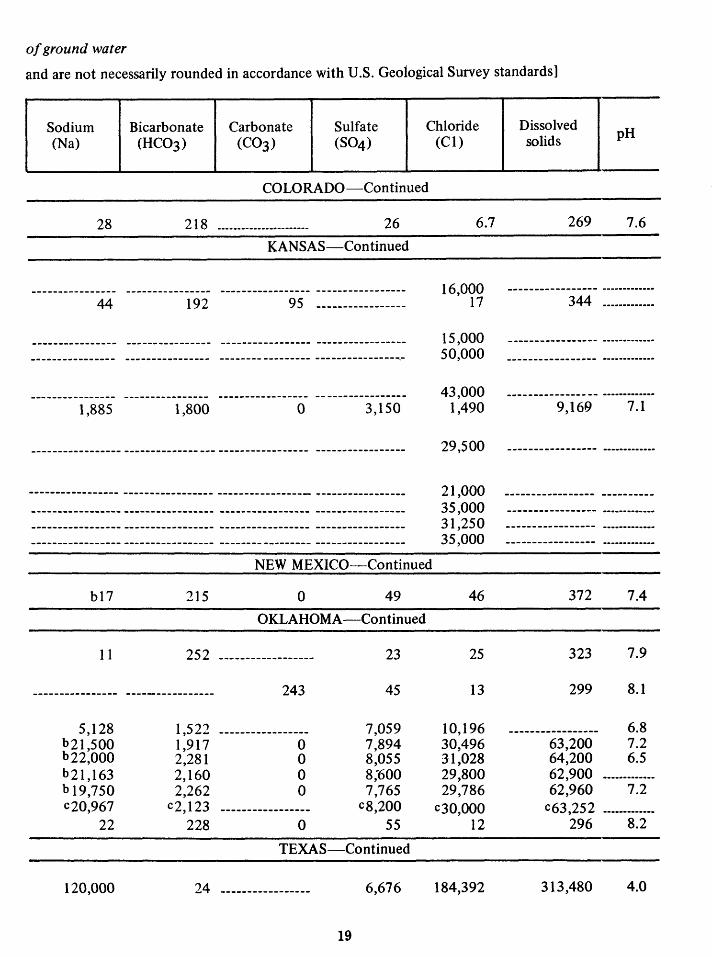
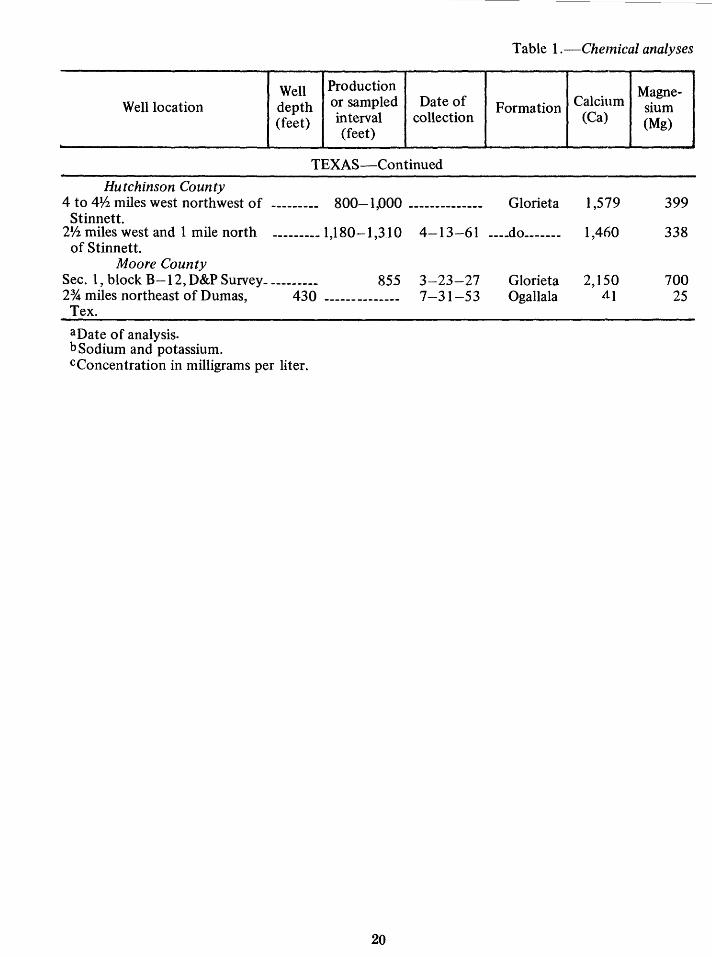
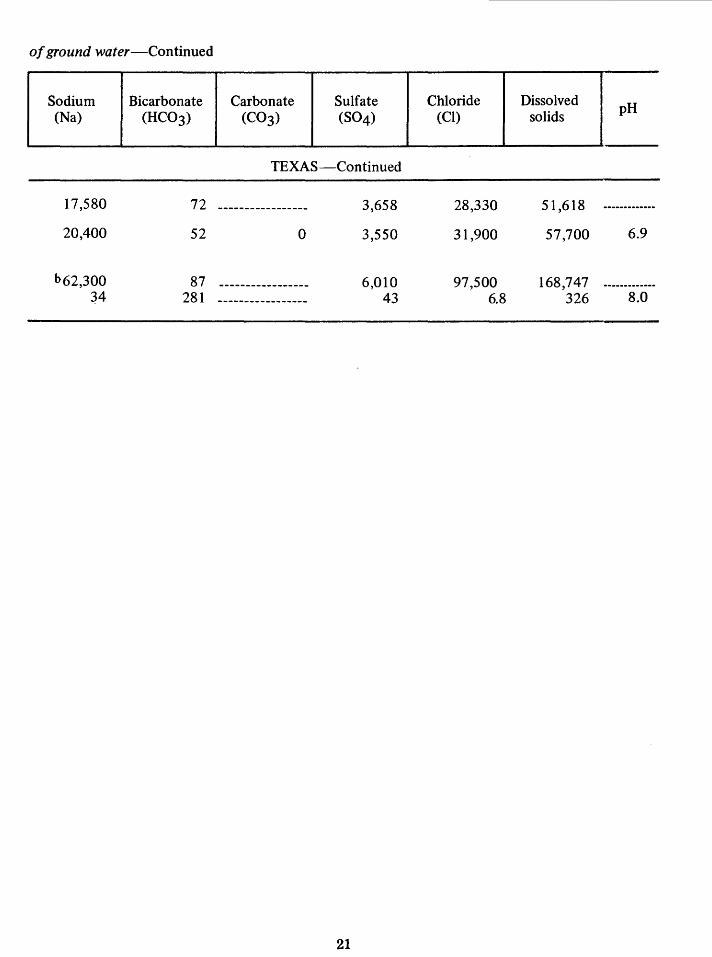
Water in the Ogallala Formation is· of relatively uniform quality throughout the report area. The water generally is of the calcium magnesium bicarbonate type and contains between 200 and 500 ppm (parts per million) of dissolved solids. Hardness of water ranges between 150 and 300 ppm as calcium carbonate, and the chloride content ranges between 5 and 50 ppm. Selected analyses of water in the Ogallala are shown in table 1. Bar graphs on plate 4 show the chloride and dissolvedsolids content of the water. This plate also shows the contrast between the dissolved-solids and chloride content of water in the Ogallala and water in the Glorieta Sandstone.
The chemical quality of water in the Ogallala is acceptable for most local uses and generally is ra.ted good for irrigation. Although hard, the water is used for municipal supply throughout the area without treatment other than chlorination. Locally, fluoride concentrations are higher than desirable.
OTHER AQUIFERS
Water in the Cheyenne Sandstone generally is of good quality and is suitable for irrigation and other uses. In most places it is of the calcium bicarbonate type. Locally, the sulfate content is high and exceeds the bicarbonate content. In southeastern Colorado the dissolved-solids concentrations range from 210 to 1,900 ppm (Richards and others, 1968, p. 5).
The quality of water in the Dakota Sandstone is variable. In some areas the water is undesirable for domestic use because of an excessive amount of dissolved solids, iron, and fluoride. Water from the Dakota in some localities is known to have a high sodium content, which may adversely affect the soil structure and drainage characteristics of finegrained soils. However, because much of the water from the Dakota that is used for irrigation is pumped from multiple-screen wells and is thereby mixed with water of better quality, the sodium hazard is reduced.
Water produced from wells in rocks of Triassic and Jurassic age ranges widely in chemical quaHty; in many areas the water contains
more than 1,000 ppm dissolved solids, hz~ high sodium and chloride contents, and may be undesirable for most uses.
ROCKS OF PERMIAN AGE
Although the base of fresh water in the ~eport area has not been mapped in detail, a few chemical analyses of water samp~es and interpretation of electric logs of many oil and gas tests in the Oklahoma Panhandle indicate that water of poor quality generally nay be expected in rocks of Permian age and also in younger rocks at depths greater than 1,200 feet below land surface. Water-solublQ, minerals, mainly salt and gypsum, are resprmsible for the poor water quality in rocks of Permian age. Water in the Permian rocks is generally of the sodium chloride or calcium sulfate type, but locally may be a mixture of both types. Leaching of evaporites from outcrops of Permian rocks results in a marked increase in the concentration of dissolved solids in the surface waters of Beaver County, Okla. T',us, in most of the report area, water in the Permian and older rocks contains dissolved solids in excess of 1,000 ppm and is unsuitable for most uses without treatment or dilution.
Water samples from the Glorieta Sandstone have not been analyzed chemically by ti"'e U.S. Geological Survey. However, records of analyses of 20 water samples from the Glorieta Sandstone in Kansas, Oklahoma, and Texas provided by several oil operators in tl'~ area are compiled in table 1. Information on collection methods was not available for most of the samples. The chloride concentrae·~ns in the 20 samples range from about 1,500 to 184,000 ppm; however, in about half of them the chloride concentrations range l~o.tween
20,000 and 32,000 ppm. Dissolved-solids concentrations range from 9,200 to 314,0('1 ppm. The chloride and dissolved-solids contents of water from the Glorieta Sandstone are shown on plate 4 by bar graphs, along with similar graphs for the Ogallala. These analysQ,S indicate that water in the Glorieta Sandstone in the report area is highly mineralized and, therefore, is not a source of water chemically suitable for ordinary use without extendve and costly treatment. Also brines and other waste
11

products have been disposed into the Glorieta for a number of years and locally may have degraded the quality of the water still further.
RESOURCE DEVELOPMENT
WATER RESOURCES
The report area is predominatly an agricultural and ranching region, a~d although the precipitation is relatively low ( 14 to 22 inches per year) nature has provided the area with a tremendous underground water supply in the Ogallala Formation. This ground-water reservoir supplies most of the water used for municipal, irrigation, domestic, and stock purposes. Development of this resource for irrigation farming has brought rapid growth and prosperity to the area.
Development of irrigation farming began on a limited basis in the 1930's in the northern High Plains of the Texas Panhandle, in the 1940's in southwestern Kansas and southeastern Colorado, and a little later in the Oklahoma Panhandle. Drought conditions in the early 1950's led to an accelerated development of wells in the report area. The number of irrigation wells in the Texas part of the area increased from 150 wells in 1952 to 1,206 wells in 1959 (Alexander, 1961). In Grant and Stanton Counties and adjacent areas in Kansas, less than 10 irrigation wells were in use in 1940; in 1965 this area had more than 700 irrigation wells. Rapid development of wells in the Oklahoma Panhandle has occurred in the 1960's; Cimarron County, Okla., had 26 irrigation wells in 1952, 92 in 1957, 149 in 1963, and 433 in 1966. Although· a number of irrigation wells produce from the Cretaceous sandstone alone (Cheyenne and Dakota Sandstones) , they are not shown on the map (pl. 4). In Baca and Prowers Counties, Colo., there are 26 irrigation wells in the Dakota Sandstone and 182 irrigation wells in the Cheyenne Sandstone. In Union county, N. Mex., about 10 irrigation wells produce from the Cretaceous rocks. Currently about 9,000 irrigation and public supply wells in the report area yield water from the Ogallala Formation and roeks of Cretaceous age.
OIL AND GAS RESOURCEf
The report area is one of the most important regions of oil and gas development in the United States. The major fields are in the western part of the Anadarko basin and include the Hugoton gas field in Kansas, Oklahoma, and Texas ; part of the Panhandle oil and gas field in Texas; the Greenwood gas field in Morton County, Kans., Baca County, Colo., and Texas County, Okla.; the Keyes gas field in Cimarron County, Okla.; the Hansford County gas field in Texas; the Lr.verne-Mocane oil and gas field in Beaver and Harper Counties, Okla. ; and the Camrick oil and gas field in Beaver and Texas Counties, OJ~Ja. Numerous smaller fields add significantly to the oil and gas production of the area.
The Hugoton field and the adjacent Panhandle field contain one of the vrorld's largest known gas reserves. Discovered in 1918, it is now being drained by more than 10,000 wells producing from rocks of Permian and Pennsylvanian age. The Hugoton-Panhandle field has produced a total of 24.5 trillion cubic feet of gas and has an estimated remaining reserve of about 28 trillion cubic feet (Mason, 1968) .
12
DISPOSAL WELLS
With the development of the oil industry, came the problem of disposal of oil-field brines and other wastes. Disposal of srch waste generally is to surface disposal pits or by subsurface injection. Because of the possible pollution of ground water by the infiltration of oil-field brines from the shallow pits, and pollution of surface runoff by breakouts from the pits, the practice of disposal of waste into subsurface formations through injection wells has increased throughout the area. Many disposal wells inject into the Glor~o.ta Sandstone in Kansas, Oklahoma, and Texas. Because the Glorieta Sandstone is as little as 500 feet below the overlying fresh-water form~ tions, this disposal practice has become the f'lbject of considerable controversy. Plate 4 shows the location of wells for which permits have been granted by the responsible State regulatory agencies in Kansas, Oklahoma, and Texas for disposal of wastes into the Glorieta Sandstone. Table 2 lists these wells and other per-
tinent information, such as maximum volume of waste that may be injected, pressures permitted, and injection intervals. These data were collected from the records of the Kansas State Board of Health, the Oklahoma Corporation Commission, and the Texas Water Development Board. Glorieta injection wells are not known to exist in Colorado and New Mexico. A total of 147 disposal locations were tabulated-29 in Kansas, 43 in Oklahoma, and 75 in Texas. A few of the injection-well permits may not have resulted, to date, in a wastedisposal operation. The locations shown on the map and listed in the table are for injections into the Glorieta only-many other injection wells utilize deeper formations.
State regulations for maximum injection pressure (measured 1 at land surface) are: Kansas, 0.6 psi per ft (pounds per square inch per foot of depth to disposal zone); Oklahoma, 0.5 psi per ft and Texas, 0.4 psi per ft. Most of the injection operations into the Glorieta are reportedly at zero pressure; that is, injection is by gravity flow.
Because the Glorieta is overlain by rocks that are relatively impermeable, water in the Glorieta is confined under pressure and will rise in a conduit, such as a well, to some point above the top of the formation. The potentiometric surface of the Glorieta is an imaginary plane connecting all points of maximum rise of water from the Glorieta and usually is referred to mean sea level and expressed in feet above or below mean sea level. A map of the potentiometric surface should show the level to which water of a particular density would rise; should the density change at a particular point, the water would rise less or more at that point (less if the density becomes greater, more if the density becomes less) . The upper limit of possible vertical movement of water from the Glorieta is determined by the position of the potentiometric surface. Information necessary for mapping the potentiometric surface of the water in the Glorieta is not available; therefore, the vertical distance that water from the Glorieta would be capable of rising above the formation is unknown. Vertical movement of injected fluids can occur either through natural openings, such as joints, faults, and solution channels, or artifical openings, such as well-
bores, or both. Such vertical movement to an overlying fresh-water zone may occur if a conduit and sufficient pressure are present. Water from a disposal zone could ascend as ilhstrated schematically in figure 4.
In figure 4, the permeable injecthn zone represents any waste-disposal zone, such as a sandstone or porous limestone, capable of receiving the injected liquids. The overlying rocks, usually shale, have low permeability and do not transmit liquids easily. Well A represents a waste-disposal well injecting liquid waste into the permeable injection zo"le. Well B is an abandoned well in which steel casing was set and bonded to the sides of the w·ell bore by a cement mixture. Well C represents an abandoned borehole in which no casing was set. Well C is most likely to provide a conduit for vertical movement of liquid between formations. A well such as C is likely to have caved in or become bridged in several places because the rocks, unsupported by casing, are not sufficiently rigid to resist collaps€ ; nevertheless, openings may remain in and around the well to transmit fluid.
The schematic presentation assumef that no cement plug was set within the casing below the base of the fresh-water aquifer ir wells B and C; or, if a plug was set, it did not seal the opening completely. It also assmnes that the cemented casing in well B did not seal the borehole adequately. If a well, like example B, has deteriorated with time by corrosive action of fluids inside or outside, per~orations
may have developed to the extent that fluids can pass through it laterally at various horizons.
13
A difference in hydrostatic head such as that shown between well A and wells F and C could be caused by the difference in altitude at the top of the injection zone at these .wells, by the injection pressure in well A, or both. If the head difference is sufficiently great, the potentiometric surface of the fluids in the injection zone may lie above the water table of the fresh-water aquifer. Under such conditions, if wells B and C have not be~n sealed completely, as described above, waf:·te fluids will rise in them and enter the fresh-water aquifer as shown. Waste fluids would then

1-l ~
WASTE-DISPOSAL WELL
I A
ABANDONED WELLS
I I WITH CASING
B
NO CASING
c
WATER-SUPPLY WELL
I D
WATER-SUPPLY WELL
I E
INTERVENING R 0 C K S
FIGURE 4.-Schematic diagram showing how waste water might enter a fresh-water aquifer through abandoned wells.
move laterally downgradient within the freshwater aquifer and a downgradient watersupply well such as well D in the diagram would contain a mixture of native and injected water. A downgradient well, such as E, eventually would be affected. Downgradient travel of the foreign fluid would continue even if the source of leakage were located and corrected. The significance of interformation leakage at any point of withdrawal would depend on such factors as degree of dispersion, extent of dilution, and quality of the foreign fluid.
SUMMARY AND CONCLUSIONS
The geologic, hydrologic, and development data related to the Glorieta Sandstone and fresh-water aquifers now available can be summarized as follows:
Geologic data
1. The Glorieta Sandstone lies at depths ranging from as little as 500 feet to 1,600 feet below the base of the Ogallala Formation.
2. The rocks lying between the Glorieta Sandstone and fresh-water aquifers are of relatively impermeable types, but they have been subjected to solution and removal of salt beds, resulting in collapse of the overlying rocks. Where fracturing resulted from collapse, passages for up•Ward movement of water from the Glorieta may exist. The extent of fracturing and the amount of subsequent closing of the fractures (as by chemical deposition or by gravitational settling of relatively soft rocks) is not known.
Hydrologic data
1. Because the hydrology of the Glorieta Sandstone has ·not been studied in detail, the position of the potentiometric surface of water in the Glorieta has not been determined. Knowledge of the potentiometric surface is necessary before the possibility of vertical movement of water within the Glorieta, and upward from the Glorieta, can be established.
2. Chemical analyses of water obtained from the Glorieta indicate that the water is
high in chloride and dissloved solids; most samples contain more than 20,000 ppm of chloride, the approximat~ chloride content of sea water.
3. Water in the Ogallala Formation and in rocks of Cretaceous age is of good quality and is suitable for most uses.
Development data
1. The Ogallala Formation and the r1cks of Cretaceous age are the major source of water for the area and provid~ water for irrigation, public supply, and d'lmestic and stock use through more than 9,000 irrigation and public-supply ·wells and a large but undetermined nurr.ber of other wells in the report area.
2. Permits have been issued for 147 disposal wells into the Glorieta Sandstone and most are in operation at this time.
3. Abandoned bQreholes of several types penetrating the Glorieta Sandstone ar~ present in the area. If improperly con~tructed initially, or if deteriorated since construction, these holes are possil: le conduits for the transmission of brine into overlying fresh-water zones, where the necessary upward hydraulic gradient exists or is created.
The data available to the U.S. Ge1logical Survey and presented in this report are not sufficient to prove or disprove the pres~nce of hydrologic interconnections between the Glorieta Sandstone and overlying fresh-water aquifers which might lead to undesirable mixing of the fluids they contain. The writers are unaware of any place in the report are2. where fresh-water aquifers have been affected by flow into them of injected brine or native: saline fluids from the Glorieta Sandstone. However, the question of whether or not the highly important Ogallala and other fres]' .. water aquifers might eventually be affected by waste injection would appear to be important enough to justify further study. Such studies should fnclude collection and interpretation of more comprehensive data on the following subjects:
15
1. Regional stratigraphy of the Glorieta Sand-stone and its equivalents and th~ overlying rocks of Permian age, with empha-
sis on facies changes and weathering and solution of evaporites such as salt and gypsum.
2. Configuration of the fresh-water base. 3. Relation of regional stratigraphy to lateral
movement of water within the basin. 4. Location of possible surface-discharge areas
of water from the Glorieta Sandstone or its stratigraphic equivalents.
5. Amount of water in storage and transmissivity of the Glorieta Sandstone.
6. Data on head and density of water in the Glorieta Sandstone.
7. Additional data on water quality, including a monitoring program to detect any change in quality in the fresh-water aquifers.
8. Injection volumes and pressures.
SELECTED REFERENCES Alexander, W. H., Jr., 1961, Geology and ground-water
resources of the northern High Plains of Texas, progress report no. 1: Texas Board of Water Engineers Bull. 6109, p. 39.
Baldwin, Brewster, and Bushman, F. X., 1957, Guides for development of irrigation wells near Clayton, Union County, New Mexico: New Mexico Inst. Mining and Technology, State Bur. Mines ahd Min. Resources Circ. 46.
Baldwin, Brewster, and Muehlberger, W. R., 1959, Geological studies of Union County, New Mexico: New Mexico Inst. of Mining and Technology, State Bur. of Mines and Mineral Resources Bull. 63.
Broom, M. E., and Irwin, J. H., 1963, Records, logs and water-level measurements of selected wells and test holes, and chemical analyses of ground water in Bent County, Colorado: Colorado Water Conserv. Board Basic-Data Rept. 14, 40 p.
Burbank, W. S., Lovering, T. S., Goddard, E. N., and Eckel, E. B., 1935, Geologic map of Colorado: U.S. Geol. Survey. Scale 1:500,000. (Reprinted 1959).
Byrne, F. E., and McLaughlin, T. G., 1948, Geology and ground-water resources of Seward County, Kansas: Kansas Geol. Survey Bull. 69, 140 p., 12 pls., 10 figs.
Cooper, J. B., and Davis, L. V., 1967, General occurrence and quality of ground water in Union County, New Mexico: New Mexico Inst. Mining and Technology, State Bur. Mines and Min. Resources Ground-Water Rept. 8, 168 p., 1 pl., 3 figs.
Cummins, W. F., 1890, The Permian of Texas and its overlying beds: Texas Geol. Survey, 1st Ann. Rept.
Dane, C. H., and Bachman, G. 0., 1965, Geologic map of New Mexico: U.S. Geol. Survey. Scale 1:500,000.
Darton, N. H., Stephenson, L. W., and Gardner, J. A., 1937, Geologic map of Texas: U.S. Geol. Survey. Scale 1:500,000.
Dover, T. B., Leonard, A. R., and Laine, L. L., 1968, Water for Oklahoma·: U.S. Geol. Survey Water-Supply Paper 1890, 107 p., 1 pl., 18 figs.
Fader, S. W., Gutentag, E. D., LobmeyP.r, D. H., and Meyer, W. R., 1964, Geohydrology of Grant and Stanton Counties, Kansas: Kansas Geol. Survey Bull. 1968, 147 p., 12 pls., 15 figs.
Frye, J. C., 1942, Geology and ground-vrater resources of Meade County, Kansas: Kansas Geol. Survey Bull. 45, 152 p., 12 pls., 13 figs.
16
Frye, J. C., and Fishel, V. C., 1949, Ground water in southwestern Kansas: Kansas Geol. Survey, 24 p., 2 pis., 5 figs.
Garbarini, G. S., and Veal, H. K., 19C8, Potential of Denver basin for disposal of liquid wastes: Subsurface disposal in geologic basins-a study of reservoir strata: Am. Assoc. Petro hum ·Geologists Mem. 10, p. 176-180.
Griggs, R. L., 1948, Geology and ground-water resources of eastern part of Colfax County, New Mexico: State Bur, of Mines and Min. Resources, Ground-Water Rept. 1, 180 p., 8 pls .. 10 figs.
Hood, J. W., and Kister, L. R., Jr., 19C'>, Saline water in New Mexico: U.S. Geol. Survey Water-Supply Paper 1601, 70 p., 8 pls., 5 figs.
Jewett, J. M., 1964, Geologic map of ransas: Kansas Geol. Survey. Scale 1:500,000.
Jordan, Louise, and Vosburg, D. L., 1963, Permian salt in the Anadarko basin: Oklaho--na Geol. Survey Bull. 102, 59 p., 3 pls., 15 figs.
Latta, B. F., 1941, Geology and ground-yrater resources of Stanton County, Kansas: Kans1'.S Geol. Survey Bull. 37, 119 p., 9 pls., 6 figs.
--- 1944, Geology and ground-water resources of Finney and Gray Counties, Kansas: Kansas Geol. Survey BulL 55, 272 p., 12 pis... 21 figs.
--- 1948, Geology and ground-water resources of Kiowa County, Kansas: Kansas Geol. Survey Bull. 65, 151 p., 11 pis., 10 figs.
Lee, Wallace, and Merriam, D. F., lf54~ Preliminary study of the structure of western Kansa:s: Kansas Geol. Survey Oil and Gas Inv., 11, ~3 p.
Lohman, S. W., and Burtis, V. M., 1953, Areas of principal ground-water investigat:~ons in the Arkansas, White, and Red River ba~ins: U.S. Geol. Survey Hydrol. Atlas 2, 1 map.
--- 1953a, General availability o:r ground water and depths to water level in the .A.rkansas, White, and Red River basins: U.S. Geol. Survey Hydrol. Atlas 3, 1 map.
McKee, E. D., Oriel, S. S., and others .. 1967, Paleotectonic Investigations of the Permian System in the United States: U.S. Geol. Survey Prof. Paper 515, 271 p., 6 pls., 84 figs.
McKee, E. D., Oriel, S. S., and others, ·1967a, Paleotectonic maps of the Permian System: U.S. Geol. Survey Misc. Geol. Inv. Map 1-450, 59 p., 200 pls., 12 figs.
McLaughlin, T. G., 1942, Geology and ground-water resources of Morton County, Kansas: Kansas Geol. Survey Bull. 40, 126 p., 9 pls., 6 figs.
--- 1943, Geology and ground-water resources of Hamilton and Kearney Counties, Kansas: Kansas Geol. Survey Bull. 49, 220 p., 17 pls., 18 figs.
--- 1946, Geology and ground-water resources of Grant, Haskell, and Stevens Counties, Kansas: Kansas Geol. Survey- Bull. 61, 221 p., 12 pls., 18 figs.
--- 1954, Geology and ground-water resources of Baca County, Colorado: U.S. Geol. Survey WaterSupply Paper 1256, 232 p., 2 pls., 54 figs.
, Marine, I. W., and Schoff, S. L., 1962, Ground-water resources of Beaver County, Oklahoma: Oklahoma Geol. Survey Bull. 97, 74 p., 2 pls., 12 figs.
Mason, J. W., 1968, Hugoton Panhandle Field, Kanas, Oklahoma, and Texas in natural gases of North America-a symposium in two volumes, vol. 2: Am. Assoc. Petroleum Geologists, p. 1539-154 7.
Miser, H. D., 1954, Geologic map of Oklahoma: U.S. Geol. Survey. Scale 1:500,000.
Richards, D. B., Hershey, L. A., Glanzman, R. K., 1968 Hydrogeologic data for Baca and southern Prowers
17
Counties, Colorado: Colorado Water Conserv. Board Basic-Data Release 19, 123 p., 1 rl., 1 fig.
Sapik; D. B., and Goemaat, R. L., 1969, Availability of ground water in Cimmarron County, Oklahoma: U.S. Geol. Survey open-file report: 3 maps.
Schoff, S. L., 1939, Geology and ground-water resources of Texas County, Oklahoma: Oklahoma Geol. Survey Bull. 59, 248 p., 5 pls., 13 fi~s.
--- 1955, Map showing ground-water reservoirs in Oklahoma: Oklahoma Geol. Survey Map 72-2.
Schoff, S. L., and Stovall, J. W., 1943, Geology and ground-water resources of Cimarron County, Oklahoma: Oklahoma Geol. Survey Bull. 64~ 317 p., 23 pls., 27 figs.
U.S. Geological Survey, 1967, Ground water in the Cimarron River Basin, New Mexico, Colora<lo, Kansas, and Oklahoma: U.S. Geol. Survey open-file report, 51 p., 5 pls., 8 figs.
Voegeli, P. T., Sr., and Hershey, L. A., 1965, Geology and ground-water resources of Prowers County, Colorado: U.S. Geol. Survey Water-Supp1y Paper 1772, 101 p., 6 pls., 32 figs.
Wood, P. R., and Hart, D. L., Jr., 1967, Availr.bility of ground water in Texas County, Oklahoma: U.S. Geol. Survey Hydrol. Atlas HA-250.
Wood, P. R., and Stacy, B. L., 1965, Geohgy and ground-water resources of Woodward County, Oklahoma: Oklahoma Water Resources Bull. 21, 70 p., 7 pls., 6 figs.
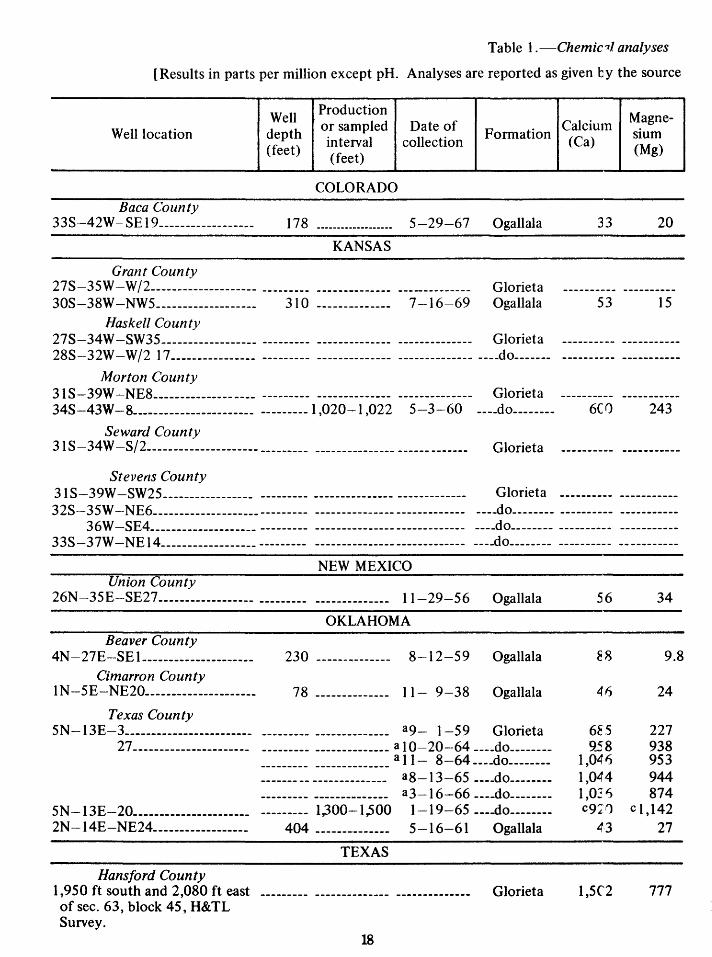
Table 1.-Chemic,z analyses
[Results in parts per million except pH. Analyses are reported as given by the source
Well location
Baca County 33S-42W --SE 19------------------
Grant County
Well depth (feet)
178
Production or sampled Date of interval collection (feet)
COLORADO
5-29-67
KANSAS
27S-35W-W /2-------------------- --------- -------------- --------------30S-38W -NW5___________________ 310 -------------- 7-16-69
Haskell County
Formation
Ogallala
Glorieta Ogallala
27S-34W -SW35------------------ --------- -------------- -------------- Glorieta 28S-32W -W /2 17---------------- --------- -------------- -------------- ----dO-------
Morton County 31 S-39W -NE8--------------- ---- --------- -------------- -------------- Glorieta 34S-43W -8----------------------- --------- 1 ,020~ 1 ,022 5-3-60 ----dO--------
Seward County 31 S-34W -S/2--------------------- --------- --------------- ------------- Glorieta
Stevens County
Magne-Calcium sium (Ca) (Mg)
33 20
53 15
6(() 243
31 S-39W -SW25----------------- --------- ------- .. ------- -------------32S-35W -NE6-------------------- --------- ----------------------------
36W -SE4-------------------- --------- ----------------------------33S-37W -NE 14------------------ --------- ----------------------------
Glorieta ---------- ---------------dO-------- ---------- ---------------dO-------- ---------- ---------------dO-------- ---------- -----------
NEW MEXICO Union County
26N-35E-SE27 ------------------ --------- -------------- 11-29-56 Ogallala
Beaver County 4N-27E-SE 1--------------------
Cimarron County 1 N -5E-NE20---------------------
Texas County
OKLAHOMA
230 -------------- 8-12-59 Ogallala
78 -------------- 11- 9-38 Ogallala
5N-13E-3------------------------ --------- -------------- a9_ 1-59 Glorieta 27---------------------- --------- -------------- a 10-20-64 ........ dO--------
--------- -------------- a 11- 8-64 ----dO--------------- __ -------·------ a8-13-65 ----dO----------------- -------------- a3-16-66 ----d0--------
5N-13E-20______________________ --------- 1,300-1,500 1-19-65 ----d0--------2N-14E-NE24------------------ 404 -------------- 5-16-61 Ogallala
Hansford County 1,950 ft south and 2,080 ft east of sec. 63, block 45, H&TL Survey.
TEXAS
Glorieta
18
56 34
~8 9.8
4f) 24
6~5 227 9.58 938
1 ,041) 953 1,044 944 1,07 I) 874 C97 11 c I ,142
4-3 27
1,5f2 777
of ground water
and are not necessarily rounded in accordance with U.S. Geological Survey standards]
Sodium Bicarbonate Carbonate Sulfate Chloride Dissolved pH (Na) (HC03) (COJ) (S04)
COLORADO-Continued
28 218 26
KANSAS-Continued
44 192 95 -----------------
1,885 1,800 0 3,150
----------------- ----------------- ------------------ ~----------------
NEW MEXICO-Continued
b17 215 0 49
OKLAHOMA-Continued
11 252 ------------------ 23
---------------- ----------------- 243 45
5,128 1,522 ----------------- 7,059 h21 ,500 1,917 0 7,894 h22,000 2,281 0 8,055 h21 ,163 2,160 0 8;600 b 19,750 2,262 0 7,765 C20,967 C2,123 ----------------- C8,200
22 228 0 55
TEXAS-Continued
120,000 24 ----------------- 6,676
19
(Cl) solids
6.7 269 7.6
16,000 ----------------- -------------1 7 344 -------------
15,000 50,000
43,000 1,490
29,500
21,000 35,000 31,250 35,000
46
25
13
10,196 30,496 31,028 29,800 29,786
CJ0,000 12
184,392
9, 16fJ 7.1
372 7.4
323 7.9
299 8.1
----------------- 6.8 63,200 7.2 64,200 6.5 6 2 '900 -------------62,960 7.2
c 63,25 2 -------------296 8.2
313,480 4.0
Well Production
Well location depth or sampled Date of
(feet) interval collection (feet)
TEXAS-Continued
Hutchinson County 4 to 4¥2 miles west northwest of --------- 800-1,000 -------------
Stinnett.
Table l.-Che1nical analyses
Magne-Formation Calcium sium
(Ca) (Mg)
Glorieta
2¥2 miles west and 1 mile north ---------l,l80-1,3JO 4-13-61 ____ do ______ _
1,579
1,460
399
338 of Stinnett.
Moore County Sec. 1, block B-12, D&P Survey_--------- 855 3-23-27 2% miles northeast of Dumas, 430 -------------- 7-31-53 Tex.
aDate of analysis. b Sodium and potassium. cconcentration in milligrams per liter.
20
Glorieta Ogallala
2,150 41
700 25
of ground water-Continued
Sodium Bicarbonate Carbonate Sulfate Chloride Dissolved pH (Na) (HC03) (C03) (S04) (Cl) solids
TEXAS-Continued
17,580 72 ----------------- 3,658 28,330 51,618 -------------20,400 52 0 3,550 31,900 57,700 6.9
b62,300 87 ----------------- 6,010 97,500 168,747 -------------34 281 ----------------- 43 6.8 326 8.0
21

Table 2.-lnformation on wells or well sites where permits have been granted for injection into the Glorieta Sandstone
[Wells 146 and 14 7 are industrial disposal wells; all others are oil-field brine dispor,lll wells]
Permitted disposal: 1 barrel equals 42 U.S. gallons of liquid. Data listed for Kansas is the average of the maximum and minimum reported on the permit application; data listed for Texa~ is the maximum permitted disposal per day.
Injection pressure used: Zero indicates disposal by gravity instead of pumping under pressure; liquid level is at or below land surface.
Disposal interval: Data listed for Kansas is the top of the disposal zone.
Permitted Barrels Permitted Injection
Well Year disposal injected injection pressure Disposal
N·o. Location permit (barrels per month pressure used (psi interval issued (psi at land at land (feet)
per day) (current) surface) surface)
KANSAS
Morton County l _____
31S-42W-3 1963 120 300 0 970 -------------2 _____ 15 1966 145 ------------- 150 35 1,072 3 _____ 32S-41W-24 1959 150 ------------- 500 0 750 4 _____ 42W-9 1968 400 ------------- 500 0 1,125 5 _____ 36 1969 500 ------------- 500 0 940 6 _____ 43W-17 1968 250 ------------- 500 0 1,200 7----- 33S-40W-8 1964 270 ------------- 0 0 1,088 8 _____ 41W-9 1965 275 ------------- 600 0 1,200 9 _____ 17 1965 125 ------------- 0 0 1,200
1 0 _____ 27 1968 40 ------------- 0 0 1,130 11 _____ 34S-40W-27 1968 50 ------------- 0 0 1,290 12 _____ 41W-33 1967 350 ------------- 600 0 1,030 13 _____ 42W-33 1965 260 ------------- 500 0 950 14 _____ 43W-20 1959 78 ------------- 150 0 910 15 _____ 29 1960 300 ------------- 500 0 825 16 _____ 35S-41W-18 1968 300 ------------- 450 0 1,130 17----- 43W-7 1963 400 ------------- 0 0 960
Stevens County 18 _____ 31S-35W-27 1967 575 ------------- 1,000 280 1,250 19 _____ 35S-36W-17 1967 275 ------------- 300 0 1,180 20 _____ 1 1969 200 ------------- 500 0 1,190
Seward County 21 _____ 32S-33W-27 1967 50 ------------- 500 0 1,005 22 _____ 33S-31W-23 1962 275 ------------- 600 0 1,100 23 _____ 36 1962 600 ------------- 500 210 1,000 24 _____ ---------------------------- 1963 275 ------------- 450 430 1,018 25 _____ 33W-27 1963 115 ------------- 0 0 990 26 _____ 28 1969 175 ------------- 100 0 1,220 27----- 34W-26 1961 225 ------------- 500 0 850 28 _____ 35S-31W-13 1967 1,250 ------------- 0 0 810 29 _____ 34W-4 1965 65 ------------- 100 0 1,140
22
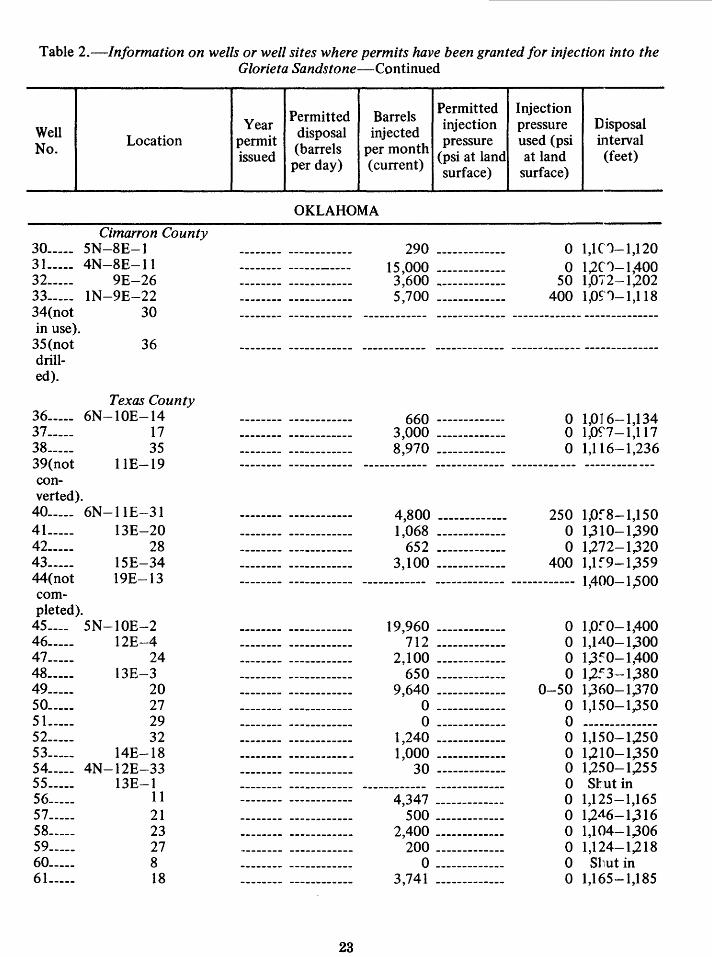
Table 2.-/nformation on wells or well sites where permits have been granted for injection into the Glorieta Sandstone-Continued
Well No.
3Q ____ _ 31 ____ _ 32 ____ _ 33 ____ _
34(not in use). 35(not drilled).
Location
Cimarron County 5N-8E-l 4N-8E-11
9E-26 1N-9E-22
30
36
Texas County 36_____ 6N -1 OE-14 37----- 17 38_____ 35 39(not 11E-19 con-verted).
4Q _____ 6N-11E-31
41-----42 ____ _ 43 ____ _ 44(not completed).
13E-20 28
15E-34 19E-13
45____ 5N-10E-2 46_____ 12E-4 47_____ 24 48_____ 13E-3 49_____ 20 5Q_____ 27 5 }_____ 29 52_____ 32 53_____ 14E-18 54_____ 4N-12E-33 55_____ 13E-1 56----- 11 57----- 21 58_____ 23 59_____ 27 6Q_____ 8 6 }_____ 18
Year permit issued
Permitted Barrels Permitted Injection
disposal injected injection pressure Disposal
(barrels per month pressure used (psi interval
(psi at land at land (feet) per day) (current) surface) surface)
OKLAHOMA
23
290 -------------15,000 -------------3,600 -------------5,700 -------------
660 -------------3,000 -------------8,970 -------------
0 l,lf1-1,120 0 1,2f1-1,400
50 1,072-1,202 400 1,05'1-1,118
0 1,016-1,134 0 1,05'7 -1,117 0 1,116-1,236
4,800 ------------- 250 1,0:8-1,150 1,068 ------------- 0 1,310-1,390
652 ------------- 0 1,272-1,320 3,100 ------------- 400 1,1:9-1,359
------------ ------------- ------------ 1,400-1,500
19,960 -------------712 -------------
2,100 -------------650 -------------
9,640 -------------0 -------------0 -------------
1 ,240 -------------1 ,000 -------------
30 -------------
4,347 -------------500 -------------
2,400 -------------200 -------------
0 -------------3 '7 41 -------------
0 1,0:0-1,400 0 1,1A0-1,300 0 1,3~0-1,400 0 1,2~3-1,380
0-50 1,360-1,370 0 1,150-1,350
0 --------------0 1,150-1,250 0 1,210-1,350 0 1,250-1,255 0 Shut in 0 1,125-1,165 0 1,2A6-1,316 0 1,104-1,306 0 1,124-1,218 0 SJ1ut in 0 1,165-1,185
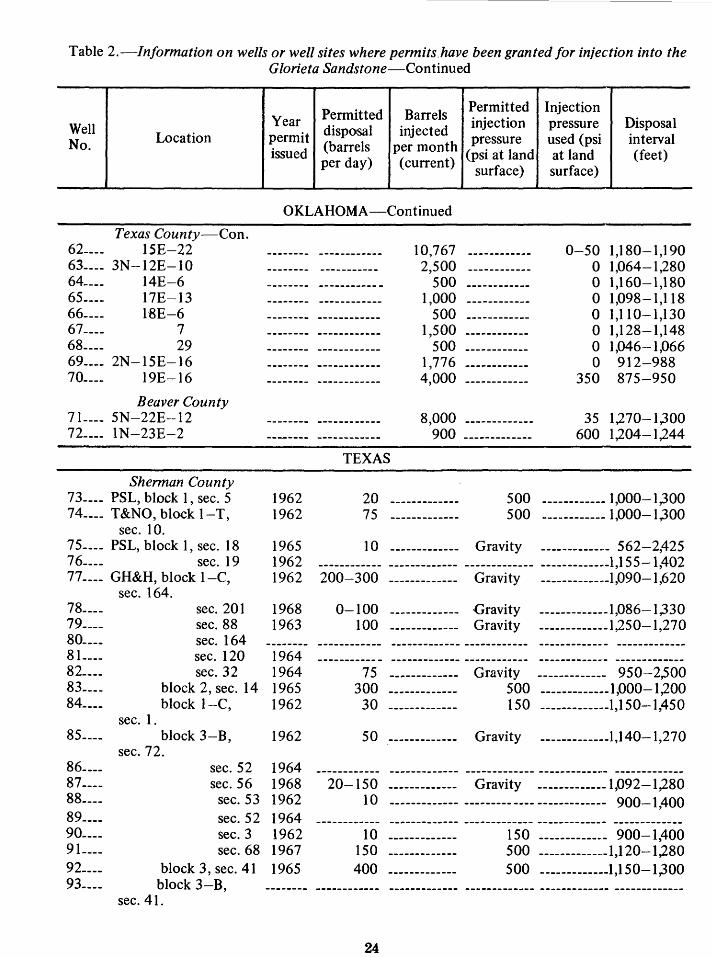
Table 2.-/nformation on wells or well sites where permits.have been granted for injection into the Glorieta Sandstone-Continued
Well No. Location
Texas County-Con. 62---- 15E-22 63 ____ 3N-12E-10 64---- 14E-6 65---- 17E-13 66---- 1-BE-6 61---- 7 68____ 29 69---- 2N-15E-16 7Q____ 19E-16
Beaver County 7 L--- 5N-22E--12 72 ____ 1N-23E-2
Sherman County 73 ____ PSL, block I, sec. 5 74 ____ T&NO, block 1-T,
sec. 10. 75 ____ PSL, block 1, sec. 18 7 6---- sec. 19 77---- GH&H, block 1-C,
78 ___ _ 79 ___ _ 8Q ___ _ 8L __ _ 82 ___ _ 83 ___ _ 84 ___ _
85----
86 ___ _
87----88 ___ _ 89 ___ _ 9Q ___ _ 91 ___ _ 92 ___ _ 93 ___ _
sec. 164.
sec. I.
sec. 201 sec. 88 sec. 164 sec. 120 sec. 32
block 2, sec. 14 block 1-C,
block 3-B, sec. 72.
sec. 52 sec. 56
sec. 53 sec. 52 sec. 3 sec. 68
block 3, sec. 41 block 3-B,
sec. 41.
Permitted Barrels Permitted Injection Year
disposal injected injection pressure Disposal permit
(barrels per month pressure used (psi interval issued (psi at land at land (feet) per day) (current) surface) surface)
OKLAHOMA-Continued
1962 1962
TEXAS
10,767 2,500
500 1,000
500 1,500
500 1,776 4,000
8,000 -------------900 -------------
0-50 1,180-1,190 0 1,064-1,280 0 1,160-1,180 0 1,098-1,118 0 1,110-1,130 0 1,128-1,148 0 1,046-1,066 0 912-988
350 875-950
35 1,270-1,300 600 1,204-1,244
20 ------------- 500 ------------ 1,000-1,300 500 ------------ 1,000-1,300 75
1965 10 ------------- Gravity -----------·- 562-2,425 1962 ------------ ------------- ------------- -----------·-1,155-1,402 1962 200-300 ------------- Gravity -----------·-1,090-1,620
1968 1963
1964 1964 1965 1962
1962
1964 1968 1962 1964 1962 1967 1965
0-100 ------------- ·Gravity -------------1,086-1,330 100 ------------- Gravity -------------1,250-1,270
75 300 30
Gravity ------------- 950-2,500 500 -------------1,000-1,200 150 -------------1,150-1,450
50 ------------- Gravity -------------1,140-1,270
20-150 ------------- Gravity -------------1,092-1,280 10 ------------- ------------- ------------- 900-1,400
10 -------------150 -------------400 -------------
24
150 -----------~- 900-1,400 500 -------------1,120-1,280 500 -------------1,150-1,300
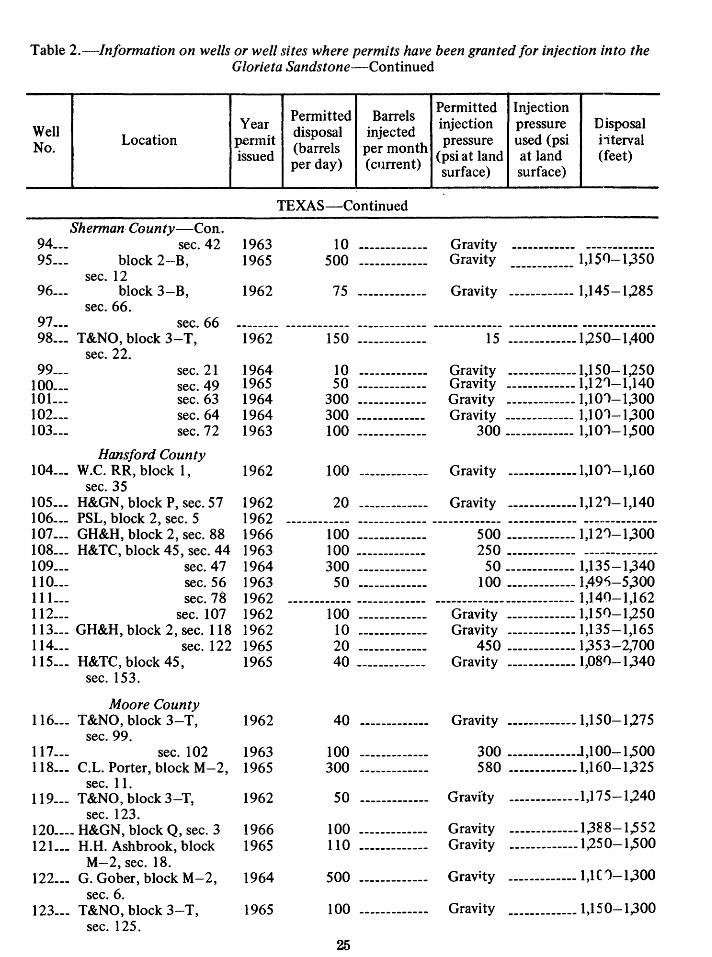
Table 2.-lnformation on wells or well sites where permits have been granted for injection into the Glorieta Sandstone-Continued
Well Year
No. Location permit issued
Sherman County-Con. 94___ sec. 42 1963 95___ block 2-B, 1965
sec. 12 96___ block 3-B, 1962
sec. 66. 97--- sec. 66
Permitted Barrels disposal injected (barrels per month per day) (current)
TEXAS-Continued
10 500
7 5 -------------
Permitted Injection injection pressure Disposal pressure used (psi i;terval
(psi at land at land (feet) surface) surface)
Gravity ------------ -------------Gravity ------------ 1,150-1,350
Gravity ------------ 1,145-1,285
98 ___ T&NO, block 3-T, 1962 150 15 -------------1,250-1,400
99 __ _ 100 __ _ 10}_ __ 102 __ _ 103 __ _
sec. 22. sec. 21 sec. 49 sec. 63 sec. 64 sec. 72
Hansford County 1 04___ W .C. RR, block 1 ,
sec. 35 105 ___ H&GN, block P, sec. 57 I 06___ PSL, block 2, sec. 5 107 ___ GH&H, block 2, sec. 88 108 ___ H&TC, block 45, sec. 44 109___ sec. 47 11 o___ sec. 56 11 }___ sec. 78 112___ sec. 107 113 ___ GH&H, block 2, sec. 118 114___ sec. 122 115 ___ H&TC, block 45,
sec. 153.
Moore County 116--- T&NO, block 3-T,
sec. 99. 117___ sec. 102 118 ___ C.L. Porter, block M-2,
sec. 11. 119--- T&NO, block3-T,
sec. 123. 120---- H&GN, block Q, sec. 3 12L-- H.H. Ashbrook, block
M-2, sec. 18. 122--- G. Gober, block M-2,
sec. 6. 123--- T&NO, block 3-T,
sec. 125.
1964 1965 1964 1964 1963
1962
1962 1962 1966 1963 1964 1963 1962 1962 1962 1965 1965
1962
1963 1965
1962
1966 1965
1964
1965
10 -------------50 -------------
300 -------------300 -------------100 -------------
100
Gravity -------------1,150-1,250 Gravity ------------- 1,121-1,140 Gravity ------------- 1,101-1,300 Gravity ------------- 1,101-1,300
300 ------------- 1,101-1,500
Gravity -------------1,101-1,160
20 ------------- Gravity -------------1,121-1,140
1 00 -------------100 -------------300 -------------
50 -------------
100 -------------10 -------------20 -------------40 -------------
40 -------------
100 -------------300 -------------
50 -------------
100 -------------110 -------------
500 -------------
100 -------------
25
500 ------------- 1,121-1,300 250 ------------- --------------
50 ------------- 1,135-1,340 100 ------------- 1,49'J-5,300
------------- ------------- 1,140-1,162 Gravity ------------- 1,150-1,250 Gravity ------------- 1,135-1,165
450 ------------- 1,353-2,700 Gravity ------------- 1,080-1,340
Gravity ------------- 1,15 0-1,27 5
300 _____________ J,1 00-1,500 580 -------------1,16 0-1,3 25
Gravfty -------------1,17 5-1,240
Gravity -------------1,38 8-1,552 Gravity -------------1,250-1,500
Grav1ty ------------- 1,1 ( 1-1,300
Gravity ------------- 1,150-1,300
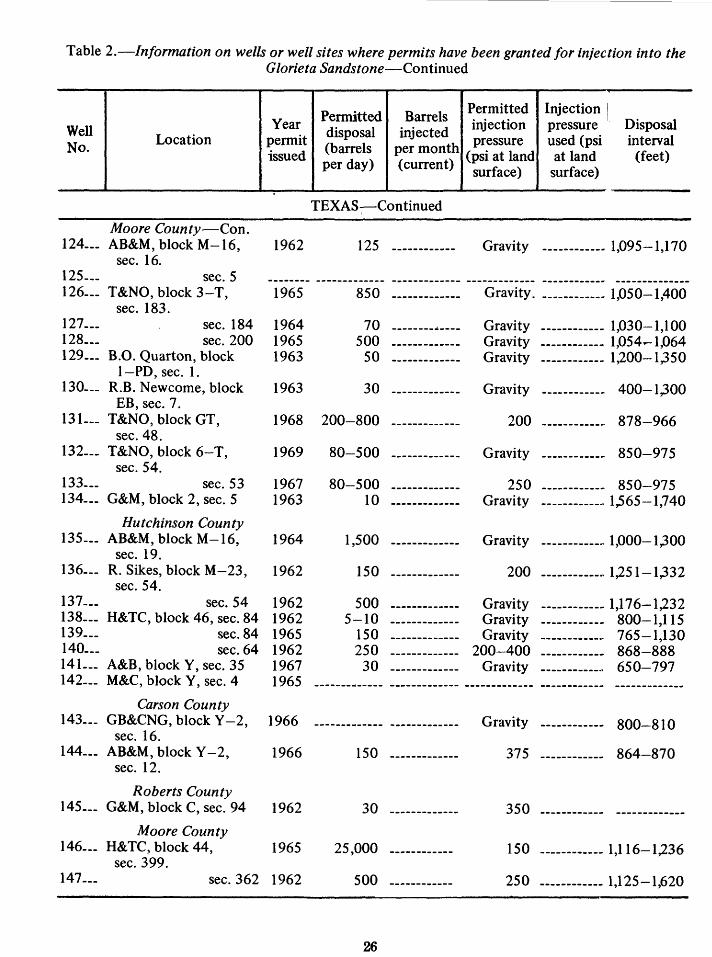
Table 2.-/nformation on wells or well sites where permits have been granted for injection into the Glorieta Sandstone-Continued
Well Year
No. Location permit issued
Moore County-Con. 124--- AB&M, block M-16, 1962
sec. 16. 125___ sec. 5 126--- T&NO, block 3-T,
sec. 183. 127--- sec. 184 128--- sec. 200 129 ___ B.O. Quarton, block
1-PD, sec. l. 130--- R.B. Newcome, block
EB, sec. 7. 131--- T&NO, block GT,
sec. 48. 132--- T&NO, block 6-T,
sec. 54. 133--- sec. 53 134 ___ G&M, block 2, sec. 5
Hutchinson County 135--- AB&M, block M-16,
sec. 19. 136--- R. Sikes, block M-23,
sec. 54. 137___ sec. 54 138___ H&TC, block 46, sec. 84 139___ sec. 84 140___ sec. 64 14L __ A&B, blockY, sec. 35 142 ___ M&C, blockY, sec. 4
Carson County 143 ___ GB&CNG, block Y-2,
sec. 16. 144 ___ AB&M, blockY -2,
sec. 12.
Roberts County
--------1965
1964 1965 1963
1963
1968
1969
1967 1963
1964
1962
1962 1962 1965 1962 1967 1965
1966
1966
145 ___ G&M, block C, sec. 94 1962
Moore County 146 ___ H&TC, block 44, 1965
sec. 399. 147 __ _ sec. 362 1962
Permitted Barrels Permitted Injection 1
disposal injected injection pressure Disposal
(barrels per month pressure used (psi interval (psi at land at land (feet) per day) (current) surface) surface)
TEXAS-, Continued
125 ------------ Gravity ------------ 1,095-1,170
------------- ------------- ------------- ------------ --------------850 ------------- Gravity. ------------ 1,050-1,400
70 --------·---- Gravity ------------ 1,030-1,100 500 ------------- Gravity ------------ 1,054-1,064 so ------------- Gravity
____ .. ______ .. 1,200-1,350
30 ------------- Gravity ------------ 400-1,300
200-800 ------------- 200 ------------ 878-966
80-500 ------------- Gravity ------------ 850-975
80-500 ------------- 250 ------------ 850-975 10 ------------- Gravity ------------ 1,565-1,740
1,500 ------------- Gravity ------------ 1,000-1,300
150 ------------- 200 ------------ 1,251-1,332
500 ------------- Gravity ------------ 1,176-1,232 5-10 ------------- Gravity ------------ 800-1,115
ISO ------------- Gravity -----------~
765-1,130 250 ------------- 200-400 ------------ 868-888
30 ------------- Gravity ___________ ..
650-797
------------- ------------- ------------- ------------ -------------
------------- ------------- Gravity ------------ 800-810
150 ------------- 375 ------------ 864-870
30 ------------- 350 ------------ -------------
25,000 ------------ 150 -----·------ 1,116-1,236
500 ------------ 250 ------------ 1,125-1,620
26

