hydrogen storage and carbon dioxide capture in an … storage and carbon dioxide capture in an...
TRANSCRIPT

S-1
Supporting Information for:
Hydrogen Storage and Carbon Dioxide Capture in an Iron-Based Sodalite-Type Metal-Organic Framework (Fe-BTT) Discovered via
High-Throughput Methods
Kenji Sumida, Satoshi Horike, Steven S. Kaye, Zoey R. Herm, Wendy L. Queen, Craig M.
Brown, Fernande Grandjean, Gary J. Long, Anne Dailly, Jeffrey R. Long*
Department of Chemistry, University of California, Berkeley, CA 94720-1460
Center for Neutron Research, National Institute of Standards and Technology,
Gaithersburg, MD 20899
Department of Materials Science and Engineering, University of Maryland,
College Park, MD 20742
Department of Physics, B5, University of Liège, B-4000 Sart-Tilman, Belgium
Department of Chemistry, Missouri University of Science and Technology,
University of Missouri, Rolla, Missouri 65409
Chemical and Environmental Sciences Laboratory, General Motors Company, Warren,
Michigan 48090
email: [email protected]
Chem. Sci.
Supplementary Material (ESI) for Chemical ScienceThis journal is (c) The Royal Society of Chemistry 2010

S-2
Experimental Details
Unless otherwise stated, all manipulations were performed under an inert dinitrogen or
helium atmosphere. 1,3,5-Tris(2H-tetrazol-5-yl)benzene hydrochloride (H3BTT·2HCl) was
prepared according to the literature procedure.1 All other reagents were obtained from
commercial vendors and used without further purification. Caution. Tetrazolate compounds are
potentially explosive, and should be handled with care. While we did not encounter any
difficulties in handling the free ligand H3BTT·2HCl or the frameworks derived therein, care
should be taken to avoid generating sparks or creating friction on the material. In particular, a
teflon-lined spatula should be used when handling the desolvated form of Fe-BTT.
Fe3[(Fe4Cl)3(btt)8]2·22DMF·32DMSO·11H2O (solvated FeBTT). Anhydrous ferrous
chloride (76 mg, 0.59 mmol), H3BTT·2HCl (58 mg, 0.20 mmol), DMF (5 mL), and DMSO (5
mL) were added to a 20 mL scintillation vial, and the vial was tightly sealed with a teflon-lined
cap. The reaction mixture was heated on a hotplate at 110 °C for 24 h, after which time small,
pale yellow crystals were formed on the vial walls. The solid was filtered and washed with DMF,
and isolated as a pale yellow-green solid (42 mg, 32%). IR (neat): 3391 (m br), 3002 (w), 2920
(w), 1654 (s), 1498 (w), 1435 (m), 1412 (s), 1389 (m), 1314 (w), 1253 (w), 1227 (w), 1194 (w),
1102 (w), 1014 (s), 951 (s), 904 (m), 788 (s), 749 (m), 661 (w). Anal. Calcd for
C274H416Cl6Fe27N214O65S32: C, 31.36; H, 4.00; N, 28.56. Found: C, 31.19; H, 4.05; N, 28.32. The
solvent composition was deduced using a combination of elemental analysis data and
thermogravimetric analysis. The DMF-solvated framework was generated by suspending 1
within DMF at 80 °C for 24 h, with exchanging of the solvent for fresh DMF each 8 h. IR (neat):
3178 (br s), 2927 (m), 2857 (m), 1656 (s) 1498 (m), 1437 (m), 1408 (s), 1385 (s), 1254 (m),
1090 (s), 1062 (m), 951 (w), 907 (w), 865 (w), 788 (m), 749 (w), 696 (w), 678 (w), 658 (s). The
methanol-solvated framework was generated by suspending the DMF-solvated material in
MeOH at 100 °C for 48 h, exchanging the solvent for fresh MeOH each 8 h. IR (neat): 3178 (br
s), 2943 (m), 2831 (m), 1416 (s), 1231 (w), 1194 (w), 1133 (w), 1069 (w), 1012 (s), 902 (w), 789
(s), 750 (m), 688 (w), 645 (w). The sample is air- and moisture-sensitive, and was stored in a
solvent-free glove box under dinitrogen.
Supplementary Material (ESI) for Chemical ScienceThis journal is (c) The Royal Society of Chemistry 2010

S-3
High-Throughput Experiments. High-throughput experiments were performed using a
robotic Symyx Core Module System equipped with powder- and liquid-dispensing functionality.
The main features of the robot deck are shown in Figure S1. The recipes for the screening
reactions were programmed from a client computer terminal using Symyx Library Studio version
7.1.7.14, and the automated dispensing protocols were executed through Symyx Automation
Studio version 1.1.1.8. These client-side software applications communicate to the Core Module
through a central server, which maintains a database containing all experimental parameters. The
Core Module is loaded within a Braun glovebox under a dinitrogen atmosphere, and the
pneumatic valves were operated using a dinitrogen supply with a pressure maintained at 80 psi.
Powder dispensing was performed by loading finely-ground metal salts and ligands into
plastic powder-dispensing hoppers. The solid was dispensed by automatic transfer of the
individual vials onto a Sartorius LP 1200.S balance on the Core Module deck with a
measurement error of less than 0.1 mg. Stability of the balance was achieved through sealing of
the balance headspace using a polymer membrane with a circular opening that allows for
lowering of the powder hopper to a position just above the aperture of the vial. Following taring
of the weight of the empty vial, the appropriate quantity of solid was dispensed by the robot arm.
The discrepancy between the mass dispensed and the programmed mass was typically within 2%.
Liquid dispensing was achieved by firstly placing vials filled with neat solvents on the
robot deck in positions as input in the Automation Studio protocol. The vials were sealed with
scepta to avoid cross-contamination or evaporation of the solvents. The liquids were aspirated
through a needle that is located on the right arm, and is connected to a series of three syringe
pumps with volumes of 0.5 mL, 3 mL, and 5 mL, respectively. The syringe used depended upon
the quantity of the liquid to be dispensed. Once the liquid is aspirated, the needle is moved to the
appropriate vials through movements of the right arm. The protocol was such that the needle was
thoroughly washed with methylene chloride following each solvent, to avoid cross-
contamination.
Automated dispensing of the products onto glass plates for powder X-ray analysis was
achieved by a protocol that firstly aspirates the mother liquid from the reaction product, and
replenishes it the vial with fresh DMF. This procedure was repeated three times, followed by a
similar washing procedure using methylene chloride. The crystals were then pulverized using the
automated shaker system on the robot deck with small ball bearings, and the resulting slurry was
Supplementary Material (ESI) for Chemical ScienceThis journal is (c) The Royal Society of Chemistry 2010
S-4
dispensed into individual wells of a crystallizer block attached to a glass plate. The methylene
chloride was then allowed to evaporate, and the crystallizer block was removed from the glass
plate. The plate was then mounted onto a metal frame, and subsequently transferred to the high-
throughput powder diffractometer.
X-ray Structure Determination. A block-shaped single-crystal of solvated Fe-BTT (0.1
mm × 0.1 mm × 0.1 mm) was coated in Paratone-N oil, attached to a Kapton loop, and mounted
on a Bruker X8 APEX diffractometer equipped with a Bruker MICROSTAR Cu rotating anode
X-ray source. The sample was cooled to 100 K under a stream of nitrogen, and preliminary cell
data were obtained to yield a cubic Laue group. A full hemisphere of data was collected over a
period of 24 h, after which time the crystal showed no significant decomposition or structural
distortion. Data were integrated and corrected for Lorentz, polarization, and absorption effects
within the APEX 2 software package. Crystal and refinement parameters are listed in Table S1.
Space group determinations were made based on systematic absences, E statistics, and successful
refinement of the structure. The structure solution was obtained using direct methods and the
SHELXS-97 software, and expanded through successive difference Fourier maps. Thermal
parameters for all non-hydrogen atoms were refined anisotropically, and hydrogen atoms were
assigned to ideal positions using the appropriate AFIX commands. Complete modeling of the
solvent within the pores was not possible due to disorder, hence the electron density within the
cavities was masked using the SQUEEZE routine within the PLATON software package.2
Accessible Surface Area Calculation. The source code for the accessible surface area
calculation program was obtained free of charge from the Internet.3 The crystallographic
information file (CIF) obtained from the single crystal X-ray structure was converted to the XYZ
file format using Mercury CSD 2.0. The XYZ file and UFF force field atomic parameters4 were
used as input for the simulation (atomic diameters (Å): H 2.571, C 3.431, N 3.260, O 3.118, Fe
2.594, Cl 3.516), and the accessible surface area was evaluated using a dinitrogen-sized probe
molecule (diameter = 3.681 Å) inserted at randomized points in the unit cell, and averaging the
resultant individual accessible surface area values after 5000 trials.
Mössbauer Spectroscopy. The Mössbauer spectrum of Fe-BTT was measured at various
temperatures between 10 and 295 K in a Janis Supervaritemp cryostat with a constant-
acceleration spectrometer which utilized a rhodium matrix cobalt-57 source, and was calibrated
at 295 K with α-iron powder. The absorber contained 32 mg/cm2 of powder mixed with boron
Supplementary Material (ESI) for Chemical ScienceThis journal is (c) The Royal Society of Chemistry 2010

S-5
nitride. The absorber was prepared and inserted into the cryostat under dry dinitrogen. The
relative statistical errors associated with the isomer shifts, quadrupole splittings, line widths,
percent areas, and absolute areas measured between 10 to 225 K was ±0.005, ±0.01, ±0.01 mm/s,
0.2 %, and 0.3 (%ε)(mm/s), respectively; these statistical errors are approximately twice as large
between 260 and 295 K. The absolute errors of these parameters were approximately twice the
statistical errors.
Powder Neutron Diffraction Experiments. Neutron powder diffraction data were
collected on the High Resolution Neutron Powder Diffractometer BT-1 at the NIST Center for
Neutron Research (NCNR) with a Ge-(311) monochromator and using in-pile collimation of 15
min of arc, corresponding to a wavelength of 2.0787 Å. Measurements were taken as a function
of deuterium loading at a temperature of 4 K with measurement times of ca. 9 h for the bare
framework and D2 loadings of 4.1, 8.0 D2 molecules per formula unit, and ca. 5 h for all higher
D2 loadings.
All sample transfers were performed in a helium-filled glovebox equipped with water and
oxygen monitors. Initial sample activation was performed in a glass tube with a packless bellows
valve attached. The sample was evacuated using a turbomolecular pump (10-5 Torr) and heated
to 135 °C with a ramp speed of ca. 0.5 °C per minute. After degassing at 135 °C for 16 h, the
sample was cooled and transferred to a cylindrical vanadium can (i.d. 0.95 cm) equipped with a
capillary gas line and a packless valve, and sealed with a lead O-ring. The sample was mounted
onto a sample stick equipped with a stainless-steel gas line with an additional valve for a top-
loading closed-cycle helium refrigerator. The sample was further degassed in situ for ca. 20 min
under high vacuum. During the experiments, a known amount of hydrogen (deuterium) gas was
loaded into the sample (813 mg), which was maintained at a temperature of 60 K until no
pressure drop was observed for at least 1 min. The sample was then cooled down to the base
temperature of 3.5 K over a period of 1 h in order to perform measurements. In all cases, the
outgas pressure reading was zero well before reaching 25 K.
A diffraction pattern was collected for Fe-BTT prior to dosing with D2. Subsequent
Rietveld analysis indicated the existence of extra neutron density close to the Fe2+ ions in the
framework skeleton, as expected due to the presence of residual methanol molecules.
Accordingly, the extra neutron density was modeled using a partial occupancy of methanol O
and C atoms, and this corrected “bare” model was used as a baseline for all subsequent
Supplementary Material (ESI) for Chemical ScienceThis journal is (c) The Royal Society of Chemistry 2010

S-6
measurements involving D2. A significant quantity of nuclear density was observed in a position
approximately 4.23 Å above the chloride ion, which could be modeled as extraframework Fe
atoms with the correct occupancy to fulfill charge balance of the anionic framework.
Neutron scattering diffraction patterns were analyzed using the Rietveld refinement
method. The program EXPGUI incorporating the Rietveld program GSAS5 was used to perform
all refinements. The model of the bare material was refined first, and it was used as the starting
point for subsequent refinements of the D2-loaded samples. Deuterium molecules are treated as
point scatters with double occupancy since they are expected to be quantum mechanically
averaged in the ground state. As mentioned, during the refinement of the model for the bare
material, extra C and O atoms were introduced to account for the scattering intensities from the
residual methanol molecules bound to the intraframework Fe2+ ions. The information on the
extra atoms was obtained from the diffraction pattern of the bare material and was fixed at these
values when analyzing the cases with deuterium molecules loaded. The coordinates of all other
atoms and the Debye-Waller factors were allowed to vary during the refinement of each
deuterium loading case. Based on the structure obtained from the diffraction pattern of the bare
material, the diffraction patterns of the first D2-loaded case (4 D2 molecules/formula unit) was
analyzed by firstly neglecting the D2 molecules. The Fourier difference maps were calculated,
clearly indicating the positions of D2 adsorption sites. Accurate values for the D2 locations and
occupancy numbers were then obtained by Rietveld refinement. For each successive D2 loading,
the Fourier difference map was calculated on the basis of the results of the previous D2 loading
and used to identify new D2 adsorption sites.
Inelastic Neutron Scattering Experiments. Inelastic neutron scattering data were
collected on the Filter Analyzer Neutron Spectrometer (FANS) BT-4 at the NCNR. The same
sample can from the diffraction experiment was used and was cooled in the same manner as the
neutron diffraction experiments.
Low-Pressure Gas Sorption Measurements. Glass sample tubes of a known weight
were loaded with approximately 200 mg of sample, and sealed using a TranSeal. Samples were
degassed at 135 °C for 24 h on a Micromeritics ASAP 2020 analyzer until the outgas rate was no
more than 1 mTorr/min. The degassed sample and sample tube were weighed precisely and then
transferred back to the analyzer (with the TranSeal preventing exposure of the sample to the air
after degassing). The outgas rate was again confirmed to be less than 1 mTorr/min. Adsorption
Supplementary Material (ESI) for Chemical ScienceThis journal is (c) The Royal Society of Chemistry 2010

S-7
isotherms were measured at 77 K in a liquid nitrogen bath for H2 and N2, and at 87 K in a liquid
argon bath for H2.
High-Pressure Gas Sorption Measurements. In a typical measurement, at least 200 mg
of sample was loaded in a sample holder in a glove box under an argon atmosphere. The sample
was evacuated at 130 °C for 10 h under a pressure of less than 10-5 torr. Hydrogen excess
adsorption measurements were performed on an automated Sieverts’ apparatus (PCTPro-2000
from Hy-Energy Scientific Instruments LLC) over a pressure range of 0-100 bar. UHP-grade
hydrogen and helium (99.999% purity) were used for all measurements. Volumetric
measurements at 77 K were carried out by submerging the sample holder in a liquid nitrogen
bath, for which the fill-level was maintained constant throughout the experiment.
The total adsorption, Ctot was calculated using the following relationship;
poreg
poregexctot Vd
VdCC
+
×+=
1100
where Cexc is the excess uptake, dg represents the density of pure H2 gas calculated from an
isothermal equation of state,6 Vpore is the pore volume of the sample. Vpore is readily calculated
from the experimental skeletal density of the sample, dsk, and the crystallographically determined
bulk density of the sample, dbulk, using the expression below;
bulksk
bulkskpore dd
ddV −=
The total volumetric uptake, Cvol, was calculated by;
Cvol = Qads dbulk
where Qads represents the total H2 adsorbed (in mmol/g). Alternatively, the excess volumetric
uptake can be calculated if the excess quantity of H2 is used in place of Qads.
Other Physical Measurements. Powder X-ray diffraction patterns were obtained on a
Bruker D8 Advance diffractometer with a Cu anode (λ = 1.5406 Å), or in the case of the high-
throughput experiments a Bruker D8 Discover with GADDS. Infrared spectra were obtained on a
Perkin-Elmer Spectrum 100 Optica FTIR spectrometer furnished with an attenuated total
reflectance accessory (ATR). Carbon, hydrogen, and nitrogen analyses were obtained from the
Microanalytical Laboratory at the University of California, Berkeley. Thermogravimeteric
analyses (TGA) were performed on a TA Instruments TGA 5000 instrument at a ramp rate of
2 °C/min under a flow of nitrogen.
Supplementary Material (ESI) for Chemical ScienceThis journal is (c) The Royal Society of Chemistry 2010

S-8
References
(1) Dincă, M.; Dailly, A.; Liu, Y.; Brown, C. M.; Neumann, D. A.; Long, J. R. J. Am. Chem.
Soc. 2006, 128, 16876.
(2) Spek, A. L. J. Appl. Crystallogr. 2003, 36, 7.
(3) Accessible Surface Area Calculation Program, website address (August 2009):
http://www.see.ed.ac.uk/~tduren/research/surface_area/.
(4) Rappe, A. K.; Casewit, C. J.; Colwell, K. S.; Goddard, W. A.; Skiff, W. M. J. Am. Chem.
Soc. 1992, 114, 10024.
(5) Larson, A. C.; Von Dreele, R. B. General Structure Analysis System (GSAS), Los Alamos
National Laboratory Report LAUR 86-748 (2000).
(6) Lemmon, E. W.; McLinden, M. O.; Friend, D. G. Thermophysical Properties of Fluid
Systems. In NIST Chemistry WebBook, NIST Standard Reference Database Number 69;
Linstrom, P. J., Mallard, W. G., Eds.; National Institute of Standards and Technology,
Gaithersburg MD; http://webbook.nist.gov (retrieved August 26, 2009).
Supplementary Material (ESI) for Chemical ScienceThis journal is (c) The Royal Society of Chemistry 2010

S-9
Table S1. Crystallographic parameters for the crystal structure of Fe-BTT.
Crystallographic Parameter Observed Value
Formula C12H4Cl0.5Fe2N16O2
FW 533.74
T, K 100(2)
Wavelength, Å 1.54178
Crystal system, space group Cubic, Pm-3m
Z 6
a, Å 18.8235(11)
V, Å3 6669.6(7)
dcalc, g/cm3 0.797
Absorption coefficient, mm-1 5.719
F(000) 1587
Crystal size, mm3 0.10 × 0.10 × 0.10
Theta range for data collection 2.35-65.41
Index range -20 ≤ h ≤ 20, -21 ≤ k ≤ 22, -14 ≤ l ≤ 20
Reflections collected 22659
Independent reflections 1207
Data/restraints/parameters 1207 / 0 / 47
GOF on F2 1.075
Largest diff. peak and hole, e·A-3 0.60 and -0.26
R1, [I>2σ(I)] 3.53
R1(wR2)a, all data 3.72 (9.90)
aR1 = Σ||Fo|-|Fc||/ Σ|Fo|, wR2 = {Σ[w(Fo
2-Fc2)2]/ Σ[w(Fo
2)2]}1/2
Supplementary Material (ESI) for Chemical ScienceThis journal is (c) The Royal Society of Chemistry 2010

S-10
Table S2. Mössbauer Spectral Parameters for 1-DMFa
T, K
δ, mm/sb
ΔEQ, mm/s
Γ, mm/s
Area,c
% Area,
(%ε)(mm/s)Assignment
295 0.45 0.84 0.45 4.75 6.04 [FeIII(DMF)6]3+ 1.28 2.05 0.300(3) 4.27 - [FeII(DMF)6]2+ 1.038(1) 1.772(4) 0.300(3) 90.98 - [(FeII
4Cl)3(BTT)8]3–
277 0.47 0.83 0.45 4.75 7.22 [FeIII(DMF)6]3+ 1.28 2.15 0.37(1) 4.27 - [FeII(DMF)6]2+ 1.046(3) 1.94(2) 0.37(1) 90.98 - [(FeII
4Cl)3(BTT)8]3–
260 0.49 0.82 0.45 4.75 7.78 [FeIII(DMF)6]3+ 1.29 2.25 0.41(1) 4.27 - [FeII(DMF)6]2+ 1.060(2) 2.09(3) 0.41(1) 90.98 - [(FeII
4Cl)3(BTT)8]3–
225 0.51 0.80 0.45 4.75 8.71 [FeIII(DMF)6]3+ 1.29 2.35 0.357(5) 4.27 - [FeII(DMF)6]2+ 1.077(1) 2.29(4) 0.357(5) 90.98 - [(FeII
4Cl)3(BTT)8]3–
155 0.54 0.84 0.45 4.75 10.88 [FeIII(DMF)6]3+ 1.18 2.01 0.336(1) 4.27 - [FeII(DMF)6]2+ 1.113(5) 2.560(5) 0.336(1) 90.98 - [(FeII
4Cl)3(BTT)8]3–
85 0.58 0.88 0.45(3) 4.75 12.84 [FeIII(DMF)6]3+ 1.33 2.72 0.329(5) 4.27 - [FeII(DMF)6]2+ 1.144(2) 2.774(5) 0.329(5) 90.98 - [(FeII
4Cl)3(BTT)8]3–
60 0.65 0.85 0.44(2) 4.75 13.64 [FeIII(DMF)6]3+ 1.35 2.94 0.350(4) 4.27 - [FeII(DMF)6]2+ 1.152(1) 2.812(4) 0.350(4) 90.98 - [(FeII
4Cl)3(BTT)8]3–
10 0.65 0.92 0.43(2) 4.75 14.48 [FeIII(DMF)6]3+ 1.35 2.90 0.353(5) 4.27 - [FeII(DMF)6]2+ 1.158(1) 2.857(6) 0.353(5) 90.98 - [(FeII
4Cl)3(BTT)8]3– aStatistical errors are given and the absence of an error indicates that the parameter was constrained to the value given in the final refinement. The average parameters are given for the [(FeII
4Cl)3(BTT)8]3– anion. bThe isomer shifts are given relative to 295 K α-iron powder. cThe relative areas have been constrained to the values observed at 10 K and have a statistical accuracy of ±0.2 %.
Supplementary Material (ESI) for Chemical ScienceThis journal is (c) The Royal Society of Chemistry 2010

S-11
Table S3. Site-specific D2 occupancies and refinement details for the first four binding sites
within Fe-BTT determined by powder neutron diffraction.
D2 loading (molecules/f.u.)
Site I Site II Site III Site IV Total D2 refined
Rietveld fit parameter
(χ2) Bare
framework 0 0 0 0 0 1.271
4.1 0.459±0.031 0.455±0.038 0 0 4.12 1.154
8.1 0.679±0.021 1.423±0.030 0 0 8.40 1.063
20.4 0.712±0.037 1.872±0.053 1.024±0.036 0.828±0.073 21.0 1.177
32.6 0.852±0.052 2.000±0.0 1.731±0.054 0.588±0.038 33.3 0.961
65.1 0.842±0.037 2.000±0.0 1.956±0.053 1.438±0.039 63.8 1.140
97.7 0.735±0.067 2.000±0.0 1.209±0.048 1.804±0.067 97.6 0.947
Supplementary Material (ESI) for Chemical ScienceThis journal is (c) The Royal Society of Chemistry 2010

S-12
Table S4. Rietveld refinement for an evacuated sample of Fe-BTT (a = 18.8754(2) Å)
x y z Multiplicity Occupancy Uiso(Å2) Fe1 0.13538 0.5 0 12 1 0.01451 C1 0.1516 0.33575 -0.1516 24 1 0.03897 C2 0.18004 0.27115 0.18004 24 1 0.02365 C3 0.24227 0.24227 0.14984 24 1 0.02957 Cl1 0 0.5 0 3 1 0.0075 N1 0.13108 0.42056 0.08167 48 1 0.02142 N2 0.17569 0.36802 0.09165 48 1 0.02718 H1 0.26572 0.26572 0.10595 24 1 0.06904 Fe2 0.27613 0 0 6 0.25 0.04835 O2a 0.24601 0.5 0 12 0.31992 0.02327 C2a 0.3 0.5 0.03524 24 0.15996 0.02327 H2a 0.29245 0.5 0.09581 24 0.15996 0.02327 H2b 0.346 0.45522 0 12 0.31992 0.02327
*Note: Atoms O2a, C2a, H2a, and H2b constitute a methanol molecule in partial occupancy
Supplementary Material (ESI) for Chemical ScienceThis journal is (c) The Royal Society of Chemistry 2010

S-13
Table S5. Rietveld refinement for an sample of Fe-BTT dosed with 4 D2 molecules per formula unit (a = 18.8793(3) Å)
x y z Multiplicity Occupancy Uiso(Å) Fe1 0.13504 0.5 0 12 1 0.01233 C1 0.15002 0.33481 0.15002 24 1 0.01953 C2 0.18 0.2727 -0.18 24 1 0.02541 C3 0.24175 0.24175 0.14967 24 1 0.03236 Cl1 0 0.5 0 3 1 0.00787 N1 0.13112 0.42183 0.08158 48 1 0.01504 N2 0.17533 0.36701 0.09095 48 1 0.02327 H1 0.26697 0.26697 0.10188 24 1 0.04405 Fe2 0.27613 0 0 6 0.25 0.04835 O2a 0.246 0.5 0 12 0.32 0.02136 C2a 0.299 0.5 0.03524 24 0.16 0.02136 H2a 0.29245 0.5 0.09581 24 0.6 0.02136 H2b 0.346 0.45522 0 12 0.32 0.02136 D1 0.25072 0.5 0 12 0.45894 0.17041 D2 0.32171 0 0 6 0.45484 0.37288
*Note: Atoms O2a, C2a, H2a, and H2b constitute a methanol molecule in partial occupancy
Supplementary Material (ESI) for Chemical ScienceThis journal is (c) The Royal Society of Chemistry 2010

S-14
Table S6. Rietveld refinement for an sample of Fe-BTT dosed with 8 D2 molecules per formula unit (a = 18.8815(3) Å)
x y z Multiplicity Occupancy Uiso(Å) Fe1 0.13508 0.5 0 12 1 0.00961 C1 0.14969 0.33502 0.14969 24 1 0.02373 C2 0.18008 0.27143 0.18008 24 1 0.02991 C3 0.24153 0.24153 0.14884 24 1 0.02949 Cl1 0 0.5 0 3 1 0.02225 N1 0.1311 0.42139 0.08153 48 1 0.02188 N2 0.1753 0.36692 0.09133 48 1 0.02608 H1 0.26621 0.26621 0.10504 24 1 0.08243 Fe2 0.27613 0 0 6 0.25 0.04835 O2a 0.246 0.5 0 12 0.32 0.02136 C2a 0.2999 0.5 0.03524 24 0.16 0.02136 H2a 0.29245 0.5 0.09581 24 0.16 0.02136 H2b 0.346 0.45522 0 12 0.32 0.02136 D1 0.25332 0.5 0 12 0.6792 0.11914 D2 0.32067 0 0 6 1.42312 0.13834
*Note: Atoms O2a, C2a, H2a, and H2b constitute a methanol molecule in partial occupancy
Supplementary Material (ESI) for Chemical ScienceThis journal is (c) The Royal Society of Chemistry 2010

S-15
Table S7. Rietveld refinement for an sample of Fe-BTT dosed with 20 D2 molecules per formula unit (a = 18.8819(3) Å)
x y z Multiplicity Occupancy Uiso(Å2) Fe1 0.13527 0.5 0 12 1 0.01551C1 0.15041 0.33544 -0.15041 24 1 0.01131C2 0.18015 0.27202 -0.18015 24 1 0.03383C3 0.24171 0.24171 -0.15161 24 1 0.02958Cl1 0 0.5 0 3 1 0.01098N1 0.13065 0.42222 -0.08142 48 1 0.0187N2 0.17604 0.3678 -0.0913 48 1 0.02613H1 0.26889 0.26889 -0.10276 24 1 0.05369Fe2 0.27613 0 0 6 0.25 0.04835O2a 0.246 0.5 0 12 0.32 0.02136C2a 0.2999 0.5 0.03524 24 0.16 0.02136H2a 0.29245 0.5 0.09581 24 0.16 0.02136H2b 0.346 0.45522 0 12 0.32 0.02136D1 0.25312 0.5 0 12 0.71161 0.14777D2 0.31726 0 0 6 1.87237 0.17869D3 0.5 0.21059 0.21059 12 1.02364 0.07549D4 0.29682 0.29682 0 12 0.82795 0.64098
*Note: Atoms O2a, C2a, H2a, and H2b constitute a methanol molecule in partial occupancy
Supplementary Material (ESI) for Chemical ScienceThis journal is (c) The Royal Society of Chemistry 2010

S-16
Table S8. Rietveld refinement for an sample of Fe-BTT dosed with 32 D2 molecules per formula unit (a = 18.8814(4) Å)
x y z Multiplicity Occupancy Uiso(Å2)
Fe1 0.13532 0.5 0 12 1 0.00951 C1 0.14988 0.33541 -0.14988 24 1 0.02362 C2 0.18232 0.27437 -0.18232 24 1 0.04545 C3 0.2421 0.2421 -0.1508 24 1 0.03559 Cl1 0 0.5 0 3 1 0.01433 N1 0.13046 0.42125 -0.08253 48 1 0.02015 N2 0.17663 0.3678 -0.09064 48 1 0.02422 H1 0.26887 0.26887 -0.10316 24 1 0.03721 Fe2 0.27613 0 0 6 0.25 0.04835 O2a 0.246 0.5 0 12 0.32 0.02136 C2a 0.2999 0.5 0.03524 24 0.16 0.02136 H2a 0.29245 0.5 0.03524 24 0.16 0.02136 H2b 0.346 0.15522 0 12 0.32 0.02136 D1 0.25293 0.5 0 12 0.85207 0.18113 D2 0.32394 0 0 6 2 0.18192 D3 0.5 0.21224 0.21224 12 1.73127 0.13953 D4 0.33396 0.33396 0 12 0.58758 0.05891 D5 0.20693 0.15153 0 24 0.68973 0.27221
*Note: Atoms O2a, C2a, H2a, and H2b constitute a methanol molecule in partial occupancy
Supplementary Material (ESI) for Chemical ScienceThis journal is (c) The Royal Society of Chemistry 2010

S-17
Table S9. Rietveld refinement for an sample of Fe-BTT dosed with 65 D2 molecules per formula unit (a = 18.8830(3) Å)
x y z Multiplicity Occupancy Uiso(Å2) Fe1 0.1362 0.5 0 12 1 0.008 C1 0.15087 0.33755 -0.15087 24 1 0.01248 C2 0.18224 0.27487 -0.18224 24 1 0.01784 C3 0.24145 0.24145 -0.15089 24 1 0.03387 Cl1 0 0.5 0 3 1 0.02041 N1 0.13138 0.42161 -0.08224 48 1 0.01584 N2 0.1765 0.36878 -0.09145 48 1 0.02095 H1 0.26775 0.26775 -0.10528 24 1 0.05029 Fe2 0.27613 0 0 6 0.25 0.5087 O2a 0.246 0.5 0 12 0.32 0.12677 C2a 0.2999 0.5 0.03524 24 0.16 0.12677 H2a 0.29245 0.5 0.03524 24 0.16 0.12677 H2b 0.346 0.15522 0 12 0.32 0.12677 D1 0.25196 0.5 0 12 0.84242 0.07274 D2 0.31808 0 0 6 2 0.27553 D3 0.5 0.21127 0.21134 12 1.9561 0.13768 D4 0.32973 0.32973 0 12 1.43781 0.11457 D5 0.21243 0.14869 0 24 1.1303 0.18157 D6 0.31181 0.31181 0.31181 8 1.37178 0.18077 D7 0.36543 0.36543 0.13605 24 0.9225 0.28724 D8 0.10764 0.10764 0.10764 8 0.56105 0.26638
*Note: Atoms O2a, C2a, H2a, and H2b constitute a methanol molecule in partial occupancy
Supplementary Material (ESI) for Chemical ScienceThis journal is (c) The Royal Society of Chemistry 2010
S-18
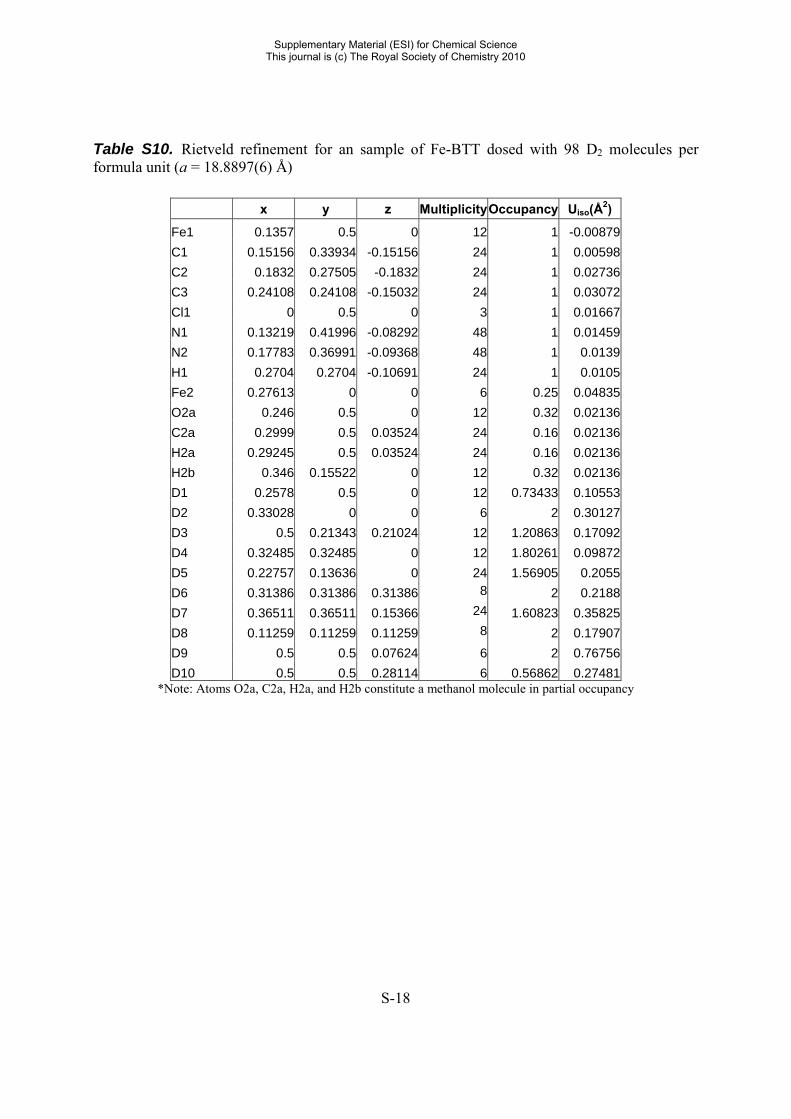
Table S10. Rietveld refinement for an sample of Fe-BTT dosed with 98 D2 molecules per formula unit (a = 18.8897(6) Å)
x y z MultiplicityOccupancy Uiso(Å2)
Fe1 0.1357 0.5 0 12 1 -0.00879 C1 0.15156 0.33934 -0.15156 24 1 0.00598 C2 0.1832 0.27505 -0.1832 24 1 0.02736 C3 0.24108 0.24108 -0.15032 24 1 0.03072 Cl1 0 0.5 0 3 1 0.01667 N1 0.13219 0.41996 -0.08292 48 1 0.01459 N2 0.17783 0.36991 -0.09368 48 1 0.0139 H1 0.2704 0.2704 -0.10691 24 1 0.0105 Fe2 0.27613 0 0 6 0.25 0.04835 O2a 0.246 0.5 0 12 0.32 0.02136 C2a 0.2999 0.5 0.03524 24 0.16 0.02136 H2a 0.29245 0.5 0.03524 24 0.16 0.02136 H2b 0.346 0.15522 0 12 0.32 0.02136 D1 0.2578 0.5 0 12 0.73433 0.10553 D2 0.33028 0 0 6 2 0.30127 D3 0.5 0.21343 0.21024 12 1.20863 0.17092 D4 0.32485 0.32485 0 12 1.80261 0.09872 D5 0.22757 0.13636 0 24 1.56905 0.2055 D6 0.31386 0.31386 0.31386 8 2 0.2188 D7 0.36511 0.36511 0.15366 24 1.60823 0.35825 D8 0.11259 0.11259 0.11259 8 2 0.17907 D9 0.5 0.5 0.07624 6 2 0.76756 D10 0.5 0.5 0.28114 6 0.56862 0.27481
*Note: Atoms O2a, C2a, H2a, and H2b constitute a methanol molecule in partial occupancy
Supplementary Material (ESI) for Chemical ScienceThis journal is (c) The Royal Society of Chemistry 2010

S-19
Table S11. N2 adsorption isotherm for an activated sample of Fe-BTT at 77 K.
P (P/P0) N2 adsorbed (cm3/g)
0.000001446 10.195580.000001295 20.393410.000001812 30.589890.000002885 40.783460.000004267 50.973220.000005952 61.158270.000007811 71.338180.00000978 81.5136
0.000011782 91.682980.000013774 101.84810.000015819 112.00810.000018124 122.16110.00002061 132.309
0.000023517 142.44830.000027062 152.57850.000031406 162.69590.000036612 172.80030.000042619 182.88930.000050098 192.95810.000058788 203.00430.000069548 213.02130.00008269 223.0041
0.000098564 232.94540.000118009 242.83440.000141535 252.6610.00017013 262.4108
0.000204489 272.06860.000245669 281.61750.000294645 291.03490.000353093 300.29570.000422897 309.36840.000507764 318.20970.000608891 326.75190.000730964 334.98010.000877834 342.79590.001165195 352.75180.00154614 362.62020.00205262 372.359
0.002699745 381.94960.003442552 391.54040.004291785 400.99020.005254508 410.37580.006330633 419.58270.007801824 428.9580.010092481 439.00260.012796943 446.64820.016448309 453.40940.021724616 460.0440.027742761 464.93330.03441658 468.94060.04160808 472.3372
0.049202947 475.1152
Supplementary Material (ESI) for Chemical ScienceThis journal is (c) The Royal Society of Chemistry 2010

S-20
Table S11 (continued)
P (P/P0) N2 adsorbed (cm3/g)0.058194011 477.7940.067422589 480.01880.076880262 481.99380.086023067 483.63280.095114156 485.05540.105125296 486.44060.186115677 493.02440.282812298 497.19290.384204925 499.83360.455866907 501.21050.545267753 502.52140.634050708 503.4680.722974192 504.3530.811666546 505.2580.900251682 506.585
Supplementary Material (ESI) for Chemical ScienceThis journal is (c) The Royal Society of Chemistry 2010

S-21
Table S12. H2 adsorption and desorption data in an activated sample of Fe-BTT at low pressure.
T = 77 K T = 87 K
P (Torr) H2 adsorbed
(wt %) P (Torr)H2 adsorbed
(wt %) 0.00295 0.008828 0.01494 0.008716 0.00894 0.035358 0.01701 0.009989 0.0152 0.052885 0.02262 0.013655
0.02749 0.075801 0.02933 0.017806 0.05313 0.099726 0.0333 0.02011 0.09487 0.118668 0.04183 0.024755 0.13504 0.129489 0.0532 0.030263 0.17195 0.136923 0.09889 0.046935 0.27243 0.152015 0.14042 0.057584 0.33401 0.15941 0.18938 0.067147 0.68114 0.191801 0.23904 0.07481 1.10029 0.221739 0.31205 0.083738 1.50959 0.246068 0.71408 0.112508 1.81444 0.262016 1.09024 0.128349 2.11186 0.276198 1.37814 0.137832 2.38966 0.288458 1.81129 0.149859 2.92555 0.309843 2.0955 0.156839 3.95652 0.344728 2.38932 0.163517 9.00305 0.454532 3.11177 0.178597 14.5524 0.530776 3.89975 0.193099
22.07591 0.608635 8.90616 0.262801 25.27345 0.636975 12.73556 0.302595 39.70182 0.746963 19.51694 0.358525 50.07998 0.815507 30.28111 0.425851 69.4456 0.926785 37.79329 0.464137
99.93439 1.075218 52.07027 0.525379 149.3442 1.27073 71.30955 0.593555 200.1667 1.433295 100.5332 0.679943 253.9768 1.575959 153.161 0.808725 305.6611 1.692557 201.4605 0.909475 357.4756 1.794149 251.0142 1.001237 401.3574 1.871006 304.2697 1.089865 450.0386 1.947608 352.0254 1.162611 499.7745 2.018424 401.421 1.232237 551.5566 2.0856 452.0654 1.298 599.7122 2.143083 499.9107 1.356047 650.6822 2.19941 551.4488 1.41479
Supplementary Material (ESI) for Chemical ScienceThis journal is (c) The Royal Society of Chemistry 2010

S-22
(Table S12, continued) T = 77 K T = 87 K
P (Torr) H2 adsorbed
(wt %) P (Torr)H2 adsorbed
(wt %) 701.0056 2.251134 600.6662 1.467351 749.9803 2.297801 652.87 1.520353 800.2315 2.343229 700.0425 1.565403 839.5252 2.377411 750.1134 1.610869 885.4049 2.41552 800.2014 1.653677 747.7538 2.298739 842.9772 1.689818 647.9335 2.19998 889.0294 1.727002 549.2241 2.085804 750.2894 1.614012 500.0032 2.021533 697.3209 1.566582 452.2024 1.953224 597.5927 1.468303 401.2779 1.872625 549.5538 1.41703 349.9391 1.781484 501.4601 1.362272 300.2047 1.681317 452.6935 1.303107 253.9263 1.575183 401.3951 1.236311 201.6061 1.435625 352.6206 1.167212 154.7704 1.286492 300.6978 1.087258 113.8582 1.13043 254.1457 1.00915 48.87784 0.799776 203.6609 0.915201 10.17776 0.462725 153.6637 0.810337 1.19873 0.218296 107.0589 0.69607
54.01701 0.529437 10.42377 0.273748 1.16491 0.124271
Supplementary Material (ESI) for Chemical ScienceThis journal is (c) The Royal Society of Chemistry 2010

S-23
Table S13. Higher-pressure H2 adsorption and desorption data in activated Fe-BTT at 77 K.
Adsorption Desorption
P (bar) Excess Uptake (wt %)
Total Uptake (wt %) P (bar) Excess Uptake
(wt %) Total Uptake
(wt %)0.593 2.08486 2.10722 92.673 2.14493 4.289881.611 2.81774 2.86357 87.434 2.24297 4.266672.724 3.13358 3.20504 82.207 2.35387 4.256633.884 3.37494 3.47309 77.030 2.46230 4.245315.332 3.49222 3.62369 71.721 2.57139 4.231556.788 3.55515 3.72009 66.691 2.69405 4.237878.238 3.63294 3.83119 61.659 2.80114 4.228649.941 3.65360 3.89095 56.626 2.91612 4.22731
11.593 3.66947 3.9447 51.613 3.01010 4.2055313.264 3.67044 3.98397 46.732 3.10670 4.1894814.918 3.65126 4.00268 41.727 3.18090 4.1482616.592 3.63622 4.02596 36.693 3.26044 4.1118218.288 3.60588 4.03439 31.740 3.34907 4.0864219.964 3.57603 4.04285 26.770 3.46021 4.0832121.631 3.54821 4.0531 21.583 3.55340 4.0571923.291 3.52264 4.0654 16.608 3.63203 4.0215424.805 3.49051 4.06777 12.350 3.66555 3.9573026.665 3.45490 4.07453 9.173 3.63386 3.8526928.517 3.40244 4.06425 6.814 3.56636 3.7310730.394 3.37428 4.07877 5.042 3.47324 3.5973132.128 3.34787 4.09175 3.773 3.32223 3.4172134.446 3.31008 4.1066 2.829 3.13772 3.2110436.764 3.25859 4.10767 2.125 2.97308 3.0302939.056 3.20545 4.10647 1.618 2.82837 2.8739741.327 3.17870 4.1311 1.245 2.64708 2.6841243.587 3.14389 4.1474 0.963 2.46379 2.4943845.845 3.10791 4.16239 0.757 2.30176 2.3276348.083 3.06860 4.17359 0.599 2.13598 2.1582549.933 3.02081 4.16749 0.481 1.98739 2.0069652.648 2.96465 4.17247 0.386 1.84556 1.8629555.397 2.92746 4.1971 0.317 1.73065 1.7464658.115 2.87587 4.20657 60.824 2.82063 4.21208 63.513 2.75034 4.20206 66.227 2.69532 4.20777 68.922 2.63486 4.20753 71.640 2.56341 4.19677 74.355 2.50634 4.20023 77.065 2.45351 4.20776
Supplementary Material (ESI) for Chemical ScienceThis journal is (c) The Royal Society of Chemistry 2010

S-24
(Table S13, continued) Adsorption
P (bar) Excess Uptake (wt %)
Total Uptake (wt %)
83.237 2.32387 4.2152886.742 2.26357 4.232790.262 2.16966 4.2167293.824 2.10574 4.23153
Supplementary Material (ESI) for Chemical ScienceThis journal is (c) The Royal Society of Chemistry 2010

S-25
Table S14. Higher-pressure H2 adsorption data in an activated sample of Fe-BTT at 298 K.
P (bar) Excess Uptake (wt %)
Total Uptake (wt %)
2.0898 0.00402 0.023034.14545 0.00926 0.039426.21559 0.011 0.05248.28062 0.01691 0.0695
10.33081 0.02005 0.0837612.38241 0.02828 0.1031114.41603 0.03667 0.1225218.52603 0.05329 0.161422.6187 0.07384 0.20412
26.67186 0.09485 0.2470730.6985 0.11817 0.29217
34.65479 0.13893 0.3343438.56031 0.16605 0.3825742.40003 0.19384 0.4311146.20879 0.21635 0.4741950.01153 0.23115 0.5095253.80813 0.26123 0.560157.55266 0.28027 0.5993361.2852 0.2997 0.63889
64.98153 0.31798 0.6770968.66608 0.33307 0.7120472.33283 0.35577 0.7544975.96991 0.37731 0.7956179.55683 0.40122 0.8388283.12951 0.42069 0.8775186.67039 0.43467 0.9105490.19142 0.46061 0.955493.71891 0.48057 0.9943297.25838 0.50789 1.04066
Supplementary Material (ESI) for Chemical ScienceThis journal is (c) The Royal Society of Chemistry 2010
S-26
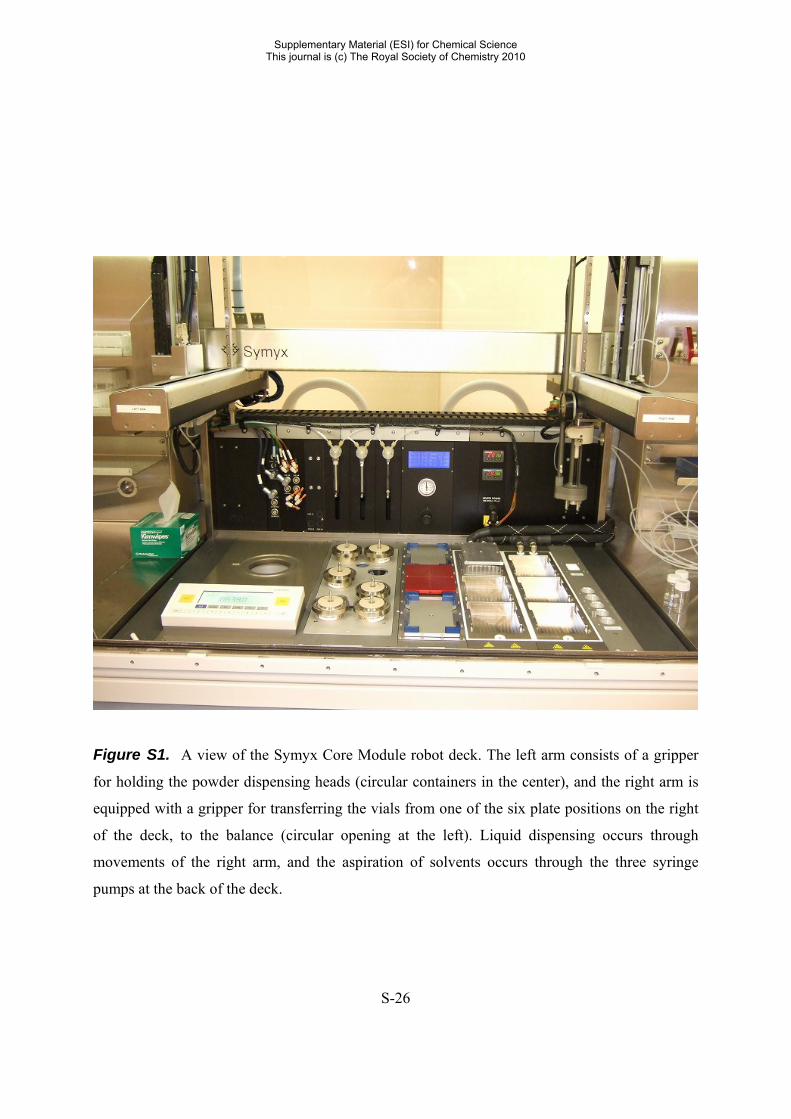
Figure S1. A view of the Symyx Core Module robot deck. The left arm consists of a gripper
for holding the powder dispensing heads (circular containers in the center), and the right arm is
equipped with a gripper for transferring the vials from one of the six plate positions on the right
of the deck, to the balance (circular opening at the left). Liquid dispensing occurs through
movements of the right arm, and the aspiration of solvents occurs through the three syringe
pumps at the back of the deck.
Supplementary Material (ESI) for Chemical ScienceThis journal is (c) The Royal Society of Chemistry 2010

S-27
Figure S2. A view of the custom-designed 96-vial plate loaded with 1 mL vials. The plates are
placed in one of the six plate positions on the robot deck shown in Figure S1, and can be heated,
cooled, or stirred according to the parameters within the experiment protocol.
Supplementary Material (ESI) for Chemical ScienceThis journal is (c) The Royal Society of Chemistry 2010

S-28
Figure S3. The location of the extraframework ions within Fe-BTT as determined by neutron
diffraction. Orange, green, blue, and gray spheres represent Fe, Cl, N, and C atoms, respectively.
Hydrogen atoms have been omitted for clarity. The occupancy of the extraframework ions is
approximately 1/8.
Supplementary Material (ESI) for Chemical ScienceThis journal is (c) The Royal Society of Chemistry 2010
S-29
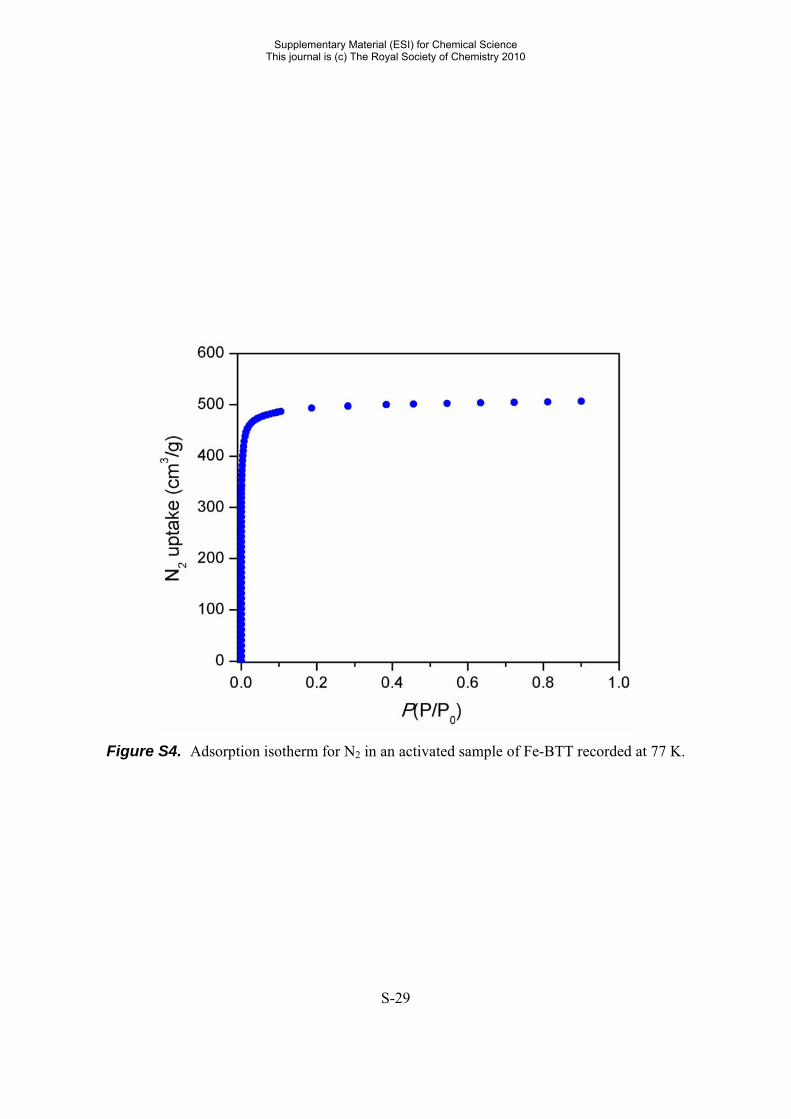
Figure S4. Adsorption isotherm for N2 in an activated sample of Fe-BTT recorded at 77 K.
Supplementary Material (ESI) for Chemical ScienceThis journal is (c) The Royal Society of Chemistry 2010

S-30
Figure S5. A BET plot of the adsorption isotherm for N2 in Fe-BTT at 77 K, where x
represents the quantity (P/P0) and V is the volume of N2 adsorbed. The blue line represents a
linear best fit of the data points. Inset: parameters for the linear best fit and resulting constants
for calculation of the BET surface area.
Supplementary Material (ESI) for Chemical ScienceThis journal is (c) The Royal Society of Chemistry 2010

S-31
Figure S6. Powder X-ray diffraction patterns of Fe-BTT: simulated from the single crystal X-
ray structure (black), of the as-synthesized solvated material (red), and the methanol-exchanged
material (blue).
Supplementary Material (ESI) for Chemical ScienceThis journal is (c) The Royal Society of Chemistry 2010

S-32
Figure S7. Rietveld refinement of neutron powder diffraction data for an evacuated sample of
Fe-BTT. Green lines, crosses, and red lines represent the background, experimental, and
calculated diffraction patterns, respectively. The blue line represents the difference between
experimental and calculated patterns. The final Rietveld fit parameter was χ2 = 1.271.
Supplementary Material (ESI) for Chemical ScienceThis journal is (c) The Royal Society of Chemistry 2010

S-33
Figure S8. Rietveld refinement of neutron powder diffraction data for loading of 4 D2
molecules per formula unit of Fe-BTT. Green lines, crosses, and red lines represent the
background, experimental, and calculated diffraction patterns, respectively. The blue line
represents the difference between experimental and calculated patterns. The final Rietveld fit
parameter was χ2 = 1.154.
Supplementary Material (ESI) for Chemical ScienceThis journal is (c) The Royal Society of Chemistry 2010

S-34
Figure S9. Rietveld refinement of neutron powder diffraction data for loading of 20 D2
molecules per formula unit of Fe-BTT. Green lines, crosses, and red lines represent the
background, experimental, and calculated diffraction patterns, respectively. The blue line
represents the difference between experimental and calculated patterns. The final Rietveld fit
parameter was χ2 = 1.177.
Supplementary Material (ESI) for Chemical ScienceThis journal is (c) The Royal Society of Chemistry 2010

S-35
Figure S10. Rietveld refinement of neutron powder diffraction data for loading of 33 D2
molecules per formula unit of Fe-BTT. Green lines, crosses, and red lines represent the
background, experimental, and calculated diffraction patterns, respectively. The blue line
represents the difference between experimental and calculated patterns. The final Rietveld fit
parameter was χ2 = 0.9606.
Supplementary Material (ESI) for Chemical ScienceThis journal is (c) The Royal Society of Chemistry 2010

S-36
Figure S11. Rietveld refinement of neutron powder diffraction data for loading of 65 D2
molecules per formula unit of Fe-BTT. Green lines, crosses, and red lines represent the
background, experimental, and calculated diffraction patterns, respectively. The blue line
represents the difference between experimental and calculated patterns. The final Rietveld fit
parameter was χ2 = 1.140.
Supplementary Material (ESI) for Chemical ScienceThis journal is (c) The Royal Society of Chemistry 2010

S-37
Figure S12. Rietveld refinement of neutron powder diffraction data for loading of 98 D2
molecules per formula unit of Fe-BTT. Green lines, crosses, and red lines represent the
background, experimental, and calculated diffraction patterns, respectively. The blue line
represents the difference between experimental and calculated patterns. The final Rietveld fit
parameter was χ2 = 0.9473.
Supplementary Material (ESI) for Chemical ScienceThis journal is (c) The Royal Society of Chemistry 2010

S-38
Figure S13. Thermogravimetric analysis of as-synthesized Fe-BTT up to a temperature of
500 °C, as measured using a ramping rate of 2 °C/min.
Supplementary Material (ESI) for Chemical ScienceThis journal is (c) The Royal Society of Chemistry 2010

S-39
Figure S14. Thermogravimetric analysis of methanol-exchanged Fe-BTT up to a temperature
of 550 °C, as measured using a ramping rate of 2 °C/min.
Supplementary Material (ESI) for Chemical ScienceThis journal is (c) The Royal Society of Chemistry 2010

S-40
Figure S15. Fitting of the hydrogen adsorption data recorded at 77 K (blue) and 87 K (red)
using a virial type function. Inset: virial parameters used for the fitting to the data.
a0 = -1429 a1 = 348.5 a2 = -90.95 a3 = 13.46 a4 = 0.9585 a5 = 0.02609 b0 = 0.3872
Supplementary Material (ESI) for Chemical ScienceThis journal is (c) The Royal Society of Chemistry 2010