hydrogen risk assessmentŠcfd model validation and reactor...
TRANSCRIPT

HYDROGEN RISK ASSESSMENT -CFD MODEL VALIDATION AND REACTOR SCALE APPLICATION
D.C. Visser, N.B. Siccama, and E.M.J. Komen Nuclear Research and Consultancy Group (NRG)
Westerduinweg 3, 1755 ZG, Petten, the Netherlands [email protected], [email protected], [email protected]
T.L.J. Keij, and J.G.T te Lintelo
N.V. Elekticiteits-Productiemaatschappij Zuid-Nederland (EPZ) Zeedijk 32, 4454 PM Borssele, the Netherlands
[email protected], [email protected] ABSTRACT Hydrogen can form a combustible gas mixture with air. The production and release of hydrogen into the containment during a severe accident is therefore an important safety issue for water-cooled reactors. Due to its destructive nature, it is difficult or impossible to assess the potential risk of hydrogen experimentally at reactor scale. Reliable computer analyses are, therefore, crucial for this task. Traditionally, so-called Lumped Parameter (LP) codes are being used for analyzing the hydrogen risk during postulated accident scenarios. Computational Fluid Dynamics (CFD) codes are required in certain situations, complementary to LP codes, for a more detailed assessment of the hydrogen risk in the containment and for a conclusion on the optimal design of hydrogen mitigation systems. NRG developed a CFD model for hydrogen risk assessment that makes use of the well-developed basic features of the commercial CFD package ANSYS FLUENT. This general purpose CFD package is complemented by NRG with specific user-defined sub-models required to capture the relevant thermal-hydraulic phenomena in the containment during a severe accident, such as steam condensation and evaporation, as well as the effect of mitigation measures, such as passive autocatalytic recombiners (PAR’s). This paper presents CFD analyses of the hydrogen distribution and mitigation by a PAR. First, the reliability of the developed CFD model is illustrated by a validation exercise, performed for two experiments in a large-scale test facility. Next, an example of the application of the CFD model to a full scale containment is presented in order to demonstrate its practical applicability and highlight the benefits of complementary CFD code analyses. The assessment performed with CFD served as input for an improved hydrogen management at the Borssele nuclear power plant in the Netherlands
KEYWORDS Safety, CFD, Hydrogen, Recombiners.
724NURETH-16, Chicago, IL, August 30-September 4, 2015 724NURETH-16, Chicago, IL, August 30-September 4, 2015

1. INTRODUCTION Hydrogen generated during a severe accident may pose a serious threat to water-cooled nuclear reactors. Once released into the containment atmosphere, hydrogen can form a combustible or explosive mixture with air. Ignition of this flammable mixture will initiate a combustion process that may damage relevant safety systems and can even jeopardize the integrity of the containment wall. In the worst-case, the safety function of the containment can get lost. Safe operation of a nuclear plant requires adequate control of the hydrogen risk. Despite the installation of hydrogen mitigation measures, it has been recognized that the temporary existence of flammable gas clouds cannot be fully excluded during certain postulated accident scenarios. Complementary to lumped parameter code modelling, Computational Fluid Dynamics (CFD) modelling is needed for the detailed assessment of the hydrogen risk in the containment and for the optimal design of hydrogen mitigation systems in order to reduce this risk as far as possible. The CFD model applied by NRG makes use of the well-developed basic features of the commercial CFD package ANSYS FLUENT. This general purpose CFD package is complemented by NRG with specific user-defined sub-models required to capture the relevant thermal-hydraulic phenomena in the containment during a severe accident as well as the effect of mitigation measures such as passive autocatalytic recombiners (PARs). PARs reduce the hydrogen concentration by converting hydrogen into steam and mixing the containment atmosphere by the buoyant flow of the hot exhaust gas. In this paper the method used by NRG to include the effect of PARs in the CFD model is presented and validated against two large-scale experiments performed in the THAI facility. Next, an example of the application of the CFD model to a full scale containment is presented. This example considers the hydrogen release during an intermediate break loss of coolant accident (IB-LOCA) with operating PARs. 2. CFD MODEL The three-dimensional transient CFD calculations are performed with the commercial CFD package ANSYS FLUENT. This general purpose CFD package is complemented with specific ‘user-defined’ sub-models that are required to capture the relevant phenomena during a severe accident as well as the effect of mitigation measures. NRG developed, implemented and validated sub-models for e.g. the condensation/ evaporation on walls and in the atmosphere, conjugate wall heat-transfer, hydrogen combustion and sprays. These sub-models have been employed successfully in several international benchmark exercises already [1-4]. A detailed description of the condensation and combustion sub-models is given in [5,6] and [7,8,9], respectively. In general, it is attempted to follow the guidelines given in the ANSYS Fluent User’s Guide [10] and provided by Casey and Wintergerste [11]. Specific quality guidelines for hydrogen distribution analyses are derived from extensive sensitivity analyses on mesh resolution, near-wall treatment, and turbulence modeling (see [12]). These guidelines are employed here. In the analyses presented in this paper, the heat conduction and heat storage in solid walls as well as the solid structures inside are taken into account. Heat transfer by means of radiation is, however, neglected. Condensation takes place on all the walls that are in contact with the gas mixture inside the vessel. The heat of condensation is transferred to the fluid cell next to the wall. Evaporation from the cold solid walls is not expected and, therefore, neglected. An overview of the general features of the CFD analyses presented in this paper is given in Table I.
725NURETH-16, Chicago, IL, August 30-September 4, 2015 725NURETH-16, Chicago, IL, August 30-September 4, 2015
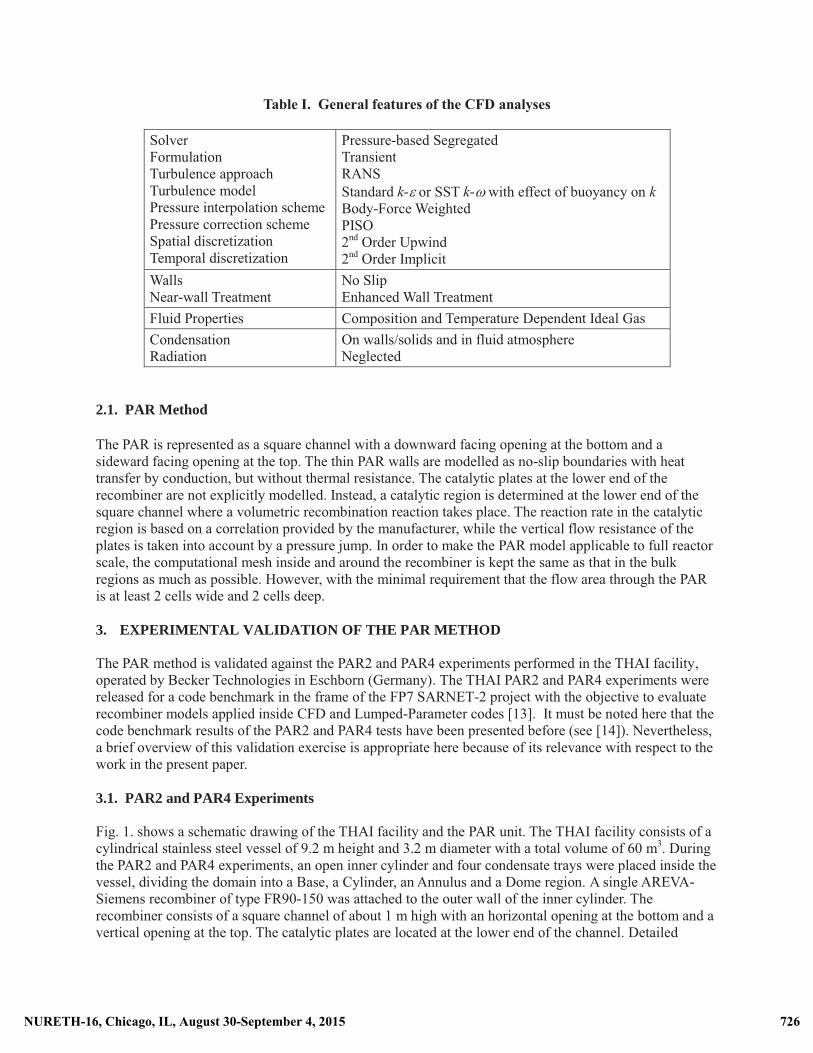
Table I. General features of the CFD analyses
Solver Formulation Turbulence approach Turbulence model Pressure interpolation scheme Pressure correction scheme Spatial discretization Temporal discretization
Pressure-based Segregated Transient RANS Standard k-� or SST k-� with effect of buoyancy on k Body-Force Weighted PISO 2nd Order Upwind 2nd Order Implicit
Walls Near-wall Treatment
No Slip Enhanced Wall Treatment
Fluid Properties Composition and Temperature Dependent Ideal Gas Condensation Radiation
On walls/solids and in fluid atmosphere Neglected
2.1. PAR Method The PAR is represented as a square channel with a downward facing opening at the bottom and a sideward facing opening at the top. The thin PAR walls are modelled as no-slip boundaries with heat transfer by conduction, but without thermal resistance. The catalytic plates at the lower end of the recombiner are not explicitly modelled. Instead, a catalytic region is determined at the lower end of the square channel where a volumetric recombination reaction takes place. The reaction rate in the catalytic region is based on a correlation provided by the manufacturer, while the vertical flow resistance of the plates is taken into account by a pressure jump. In order to make the PAR model applicable to full reactor scale, the computational mesh inside and around the recombiner is kept the same as that in the bulk regions as much as possible. However, with the minimal requirement that the flow area through the PAR is at least 2 cells wide and 2 cells deep. 3. EXPERIMENTAL VALIDATION OF THE PAR METHOD The PAR method is validated against the PAR2 and PAR4 experiments performed in the THAI facility, operated by Becker Technologies in Eschborn (Germany). The THAI PAR2 and PAR4 experiments were released for a code benchmark in the frame of the FP7 SARNET-2 project with the objective to evaluate recombiner models applied inside CFD and Lumped-Parameter codes [13]. It must be noted here that the code benchmark results of the PAR2 and PAR4 tests have been presented before (see [14]). Nevertheless, a brief overview of this validation exercise is appropriate here because of its relevance with respect to the work in the present paper. 3.1. PAR2 and PAR4 Experiments Fig. 1. shows a schematic drawing of the THAI facility and the PAR unit. The THAI facility consists of a cylindrical stainless steel vessel of 9.2 m height and 3.2 m diameter with a total volume of 60 m3. During the PAR2 and PAR4 experiments, an open inner cylinder and four condensate trays were placed inside the vessel, dividing the domain into a Base, a Cylinder, an Annulus and a Dome region. A single AREVA-Siemens recombiner of type FR90-150 was attached to the outer wall of the inner cylinder. The recombiner consists of a square channel of about 1 m high with an horizontal opening at the bottom and a vertical opening at the top. The catalytic plates are located at the lower end of the channel. Detailed
726NURETH-16, Chicago, IL, August 30-September 4, 2015 726NURETH-16, Chicago, IL, August 30-September 4, 2015

specifications on the configuration of the THAI facility, the PAR unit, the instrumentation, and the test conditions of the PAR2 and PAR4 experiments are given in [13].
Figure 1. Schematic drawing of the THAI facility (left) and the PAR unit (right) employed in the THAI PAR2 and PAR4 experiments.
The PAR2 and PAR4 experiments both start with hydrogen injection into an air-filled THAI vessel at 1.5 bar and 20 ºC. The hydrogen is injected at approximately 0.3 g/s and 20 ºC in downward direction in the Base compartment of the THAI vessel (see Fig.1). The hydrogen will spread through the vessel, increasing the hydrogen concentration. At a certain level of the hydrogen concentration, the PAR will start operating and consuming the hydrogen. The PAR2 experiment is stopped after 6.5 hours. In the PAR4 experiment, the first hydrogen injection period is followed subsequently by an air injection and a second hydrogen injection. The PAR4 experiment is stopped after 19 hours. The experimental procedures are shown in detail in Table II.
Table II. Experimental procedure of the THAI PAR2 and PAR4 experiment [13]
PAR2 procedure PAR4 procedure Time [s] Comment Time [s] Comment 0 Start of hydrogen injection 0 Start of hydrogen injection 900-1260 Short interruption of hydrogen injection 1260 Stop of hydrogen injection 2160 Stop of hydrogen injection 9840-11760 Injection of air (to reach 2.5 bar) 23700 End of experiment 12965-14405 Further injection of hydrogen 69060 End of experiment
727NURETH-16, Chicago, IL, August 30-September 4, 2015 727NURETH-16, Chicago, IL, August 30-September 4, 2015
3.2. PAR2 and PAR4 Analyses The transient CFD computations are performed using the standard k-� turbulence model with enhanced wall treatment as implemented in ANSYS-FLUENT. The heat conduction and heat storage in the solid walls of the THAI vessel as well as the solid structures inside are taken into account in the CFD model. A small heat loss from the THAI vessel is taken into account by defining a heat transfer coefficient of 2 W/m2K from the wall to the surrounding. Calculations are performed on a computational mesh of close to 400.000 cells. The cells are refined towards the walls and the hydrogen injection. The mesh inside and around the recombiner is not refined. The bulk mesh, with a typical cell size of ~50 mm, simply continues through the PAR. The PAR domain is set up by 117 cells in total where 3x3 cells are used over the horizontal flow area. A nominal time step size of ~1.0 s is used. During hydrogen injection periods and at the start of PAR operation, a smaller time step size of ~0.2s is used. Please, see [14] for more details on the CFD model applied for these tests. The reaction rate in the catalytic region of the PAR model is based on the recombiner correlation provided by the PAR manufacturer [15]:
)tanh()( 22 cCCbpar HH ������ (1) with, r = recombination rate [g/s]
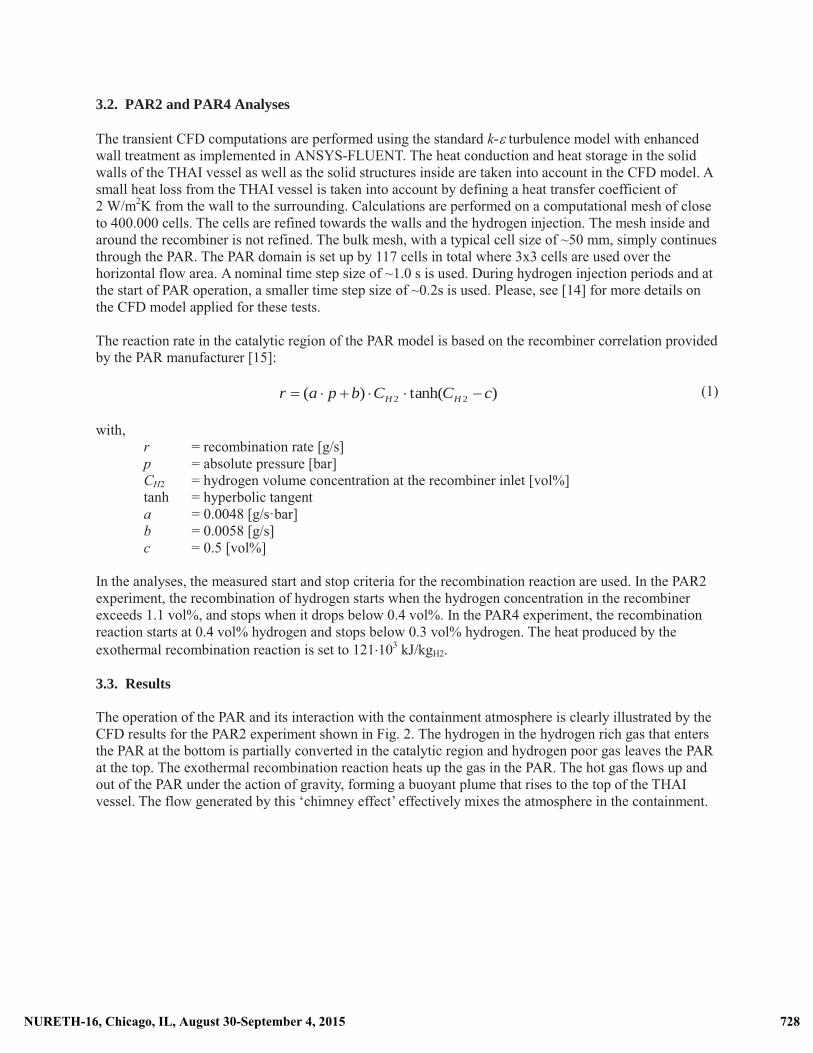
p = absolute pressure [bar] CH2 = hydrogen volume concentration at the recombiner inlet [vol%] tanh = hyperbolic tangent a = 0.0048 [g/s·bar] b = 0.0058 [g/s] c = 0.5 [vol%] In the analyses, the measured start and stop criteria for the recombination reaction are used. In the PAR2 experiment, the recombination of hydrogen starts when the hydrogen concentration in the recombiner exceeds 1.1 vol%, and stops when it drops below 0.4 vol%. In the PAR4 experiment, the recombination reaction starts at 0.4 vol% hydrogen and stops below 0.3 vol% hydrogen. The heat produced by the exothermal recombination reaction is set to 121�103 kJ/kgH2. 3.3. Results The operation of the PAR and its interaction with the containment atmosphere is clearly illustrated by the CFD results for the PAR2 experiment shown in Fig. 2. The hydrogen in the hydrogen rich gas that enters the PAR at the bottom is partially converted in the catalytic region and hydrogen poor gas leaves the PAR at the top. The exothermal recombination reaction heats up the gas in the PAR. The hot gas flows up and out of the PAR under the action of gravity, forming a buoyant plume that rises to the top of the THAI vessel. The flow generated by this ‘chimney effect’ effectively mixes the atmosphere in the containment.
728NURETH-16, Chicago, IL, August 30-September 4, 2015 728NURETH-16, Chicago, IL, August 30-September 4, 2015
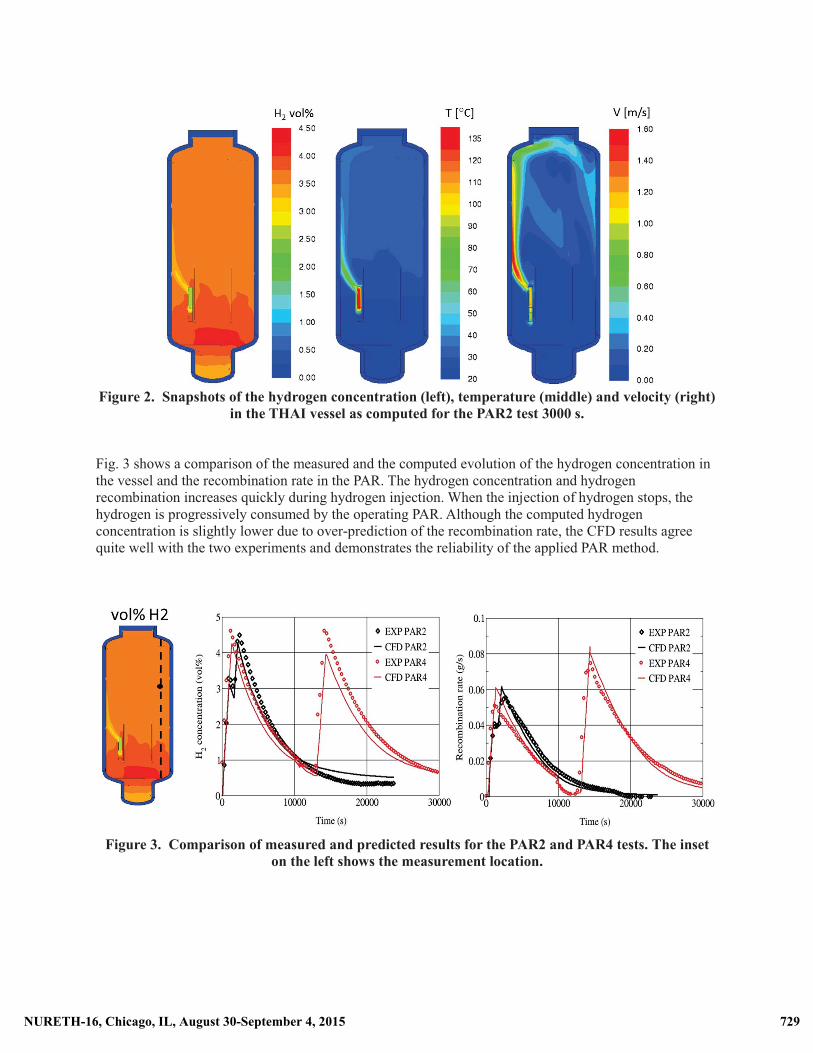
Figure 2. Snapshots of the hydrogen concentration (left), temperature (middle) and velocity (right) in the THAI vessel as computed for the PAR2 test 3000 s.
Fig. 3 shows a comparison of the measured and the computed evolution of the hydrogen concentration in the vessel and the recombination rate in the PAR. The hydrogen concentration and hydrogen recombination increases quickly during hydrogen injection. When the injection of hydrogen stops, the hydrogen is progressively consumed by the operating PAR. Although the computed hydrogen concentration is slightly lower due to over-prediction of the recombination rate, the CFD results agree quite well with the two experiments and demonstrates the reliability of the applied PAR method.
Figure 3. Comparison of measured and predicted results for the PAR2 and PAR4 tests. The inset on the left shows the measurement location.
729NURETH-16, Chicago, IL, August 30-September 4, 2015 729NURETH-16, Chicago, IL, August 30-September 4, 2015

4. REACTOR APPLICATION OF THE CFD MODEL For the Borssele nuclear power plant (NPP), MELCOR LP code analyses have been used for the analyses of a number of postulated severe accident scenarios. The most critical scenarios with respect to the risk of hydrogen have been identified and are analyzed with CFD. These complementary CFD analyses can be used for verification of the MELCOR results and provide more detail that may help to improve safety measures or procedures. In order to demonstrate the current capabilities of CFD, the CFD analysis of an IB-LOCA scenario in the Borssele NPP is presented here as an example. The results of the CFD analysis are shown and discussed below, after a brief description of the Borssele NPP, the considered accident scenario, and the applied CFD model. 4.1. Borssele NPP The Borssele NPP is the only nuclear power plant operational for electricity production in the Netherlands. It is a 1365 MWt pressurized water reactor (PWR) with two loops, each with one primary pump and one steam generator. Currently, the gross capacity is 512 MWe and the net capacity is 485 MWe [16]. The containment consists of a spherical steel shell (containment) with a diameter of 46 m and free volume of about 36000 m3. The steel shell is encapsulated by the concrete reactor building. In order to control the pressure, the containment is equipped with a spray system, air coolers, a filtered recirculation system, and a filtered venting line. A schematic representation of the Borssele containment is shown in Fig. 4.
Figure 4. Schematic representation of the Borssele PWR containment.
The Borssele NPP has in total 22 Siemens/KWU PAR units installed in the containment in order to mitigate the risk of hydrogen during severe accidents. This PAR system is sized and designed for operation during a severe accident. The overall hydrogen recombination capacity is approximately 119 kg/h at 1 bar. In addition, the relief hatches between the installation area and the operation area of the containment can be opened, passively or manually, in order to enhance mixing and reduce the probability of high local hydrogen concentrations.
730NURETH-16, Chicago, IL, August 30-September 4, 2015 730NURETH-16, Chicago, IL, August 30-September 4, 2015
4.2. IB-LOCA Scenario A loss of coolant accident is postulated with a break of 365 cm2 in the safety injection line to one of the hot legs. This IB-LOCA starts when the reactor is at full power and normal, atmospheric conditions exist in the containment. The break is followed by an immediate reactor scram and assuming the following system availability:
- All feed water fails following reactor trip - Safety injection systems not available or not effective because water is lost through the break - Accumulators available, but water of one accumulator is lost directly through the break - Recirculation of water from the sump fails - Reactor coolant pumps are tripped on safety injection signal
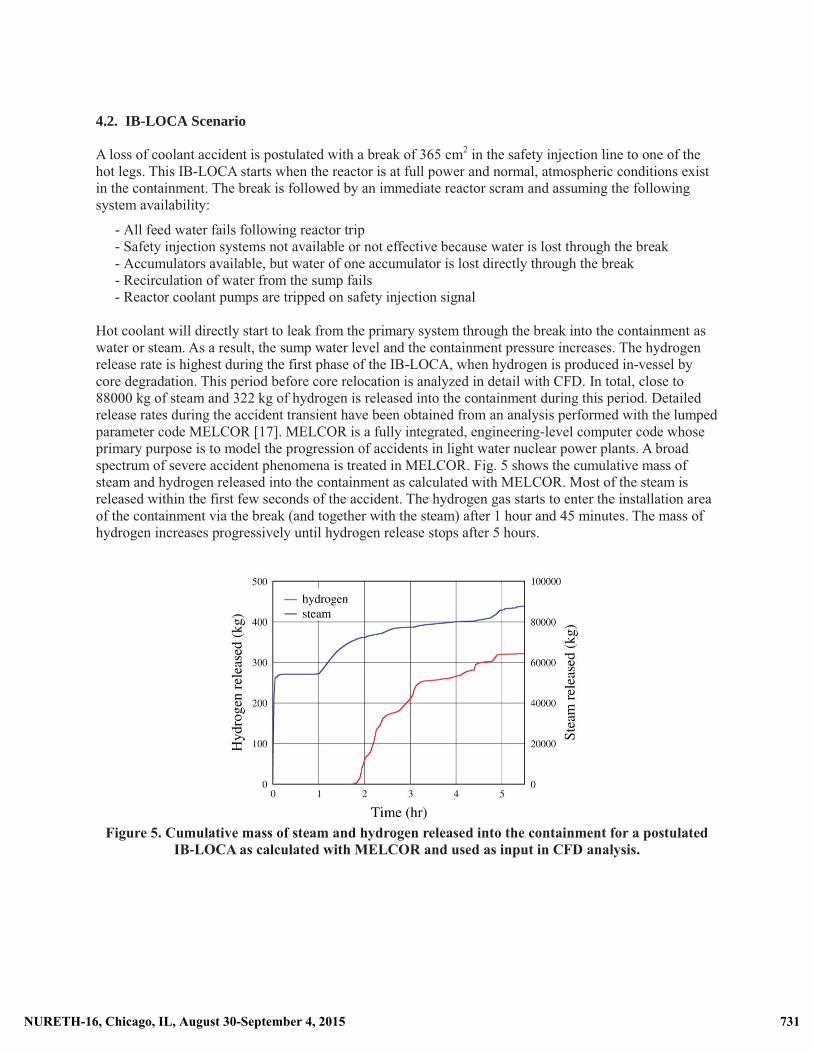
Hot coolant will directly start to leak from the primary system through the break into the containment as water or steam. As a result, the sump water level and the containment pressure increases. The hydrogen release rate is highest during the first phase of the IB-LOCA, when hydrogen is produced in-vessel by core degradation. This period before core relocation is analyzed in detail with CFD. In total, close to 88000 kg of steam and 322 kg of hydrogen is released into the containment during this period. Detailed release rates during the accident transient have been obtained from an analysis performed with the lumped parameter code MELCOR [17]. MELCOR is a fully integrated, engineering-level computer code whose primary purpose is to model the progression of accidents in light water nuclear power plants. A broad spectrum of severe accident phenomena is treated in MELCOR. Fig. 5 shows the cumulative mass of steam and hydrogen released into the containment as calculated with MELCOR. Most of the steam is released within the first few seconds of the accident. The hydrogen gas starts to enter the installation area of the containment via the break (and together with the steam) after 1 hour and 45 minutes. The mass of hydrogen increases progressively until hydrogen release stops after 5 hours.
Figure 5. Cumulative mass of steam and hydrogen released into the containment for a postulated
IB-LOCA as calculated with MELCOR and used as input in CFD analysis.
731NURETH-16, Chicago, IL, August 30-September 4, 2015 731NURETH-16, Chicago, IL, August 30-September 4, 2015

4.3. IB-LOCA Analysis The transient CFD computations are performed using the SST k-� turbulence model with enhanced wall treatment as implemented in ANSYS-FLUENT. The effect of buoyancy on k is implemented by means of a user-defined function (see [12]). Calculations are performed on a computational mesh of close to 5�106 cells with a typical cell size of 100~500 mm. Smaller cells are used at walls, in narrow flow paths and near the break. The recombiners installed in the Borssele containment are manufactured by Siemens and have a similar design as the recombiner used in the validation exercise presented in chapter 3. As described in section 2.1, the PAR units are modeled as a square channel with an opening at the bottom and an opening at the top. The mesh inside and around the 22 recombiners is refined to obtain the minimum of 2 cells along the sides of each PAR opening. Three PAR types of different size and capacity are used in the Borssele NPP. Fig. 6 shows the geometrical model and applied mesh for each type. The PARs of type R1, R3 and R13 consist, respectively, of 10�4�2, 10�11�2 and 14�16�4 cells in total.
PAR type R1 PAR type R3 PAR type R13
Figure 6. Model of the different PAR types installed in the Borssele NPP. The catalytic region is
shown in red. The time dependent flow rates and temperatures of the steam and hydrogen released into the containment in the course of the accident are taken from MELCOR. Heat conduction and heat storage in the (steel shell) containment walls as well as the solid structures inside are taken into account in the CFD model. Also the heat loss from the steel shell wall of the containment to the concrete walls of the reactor building around it is modeled in detail. No effect of heat loss from the reactor building to the surrounding is expected during the analyzed period of the IB-LOCA and, therefore, it is neglected in the calculations. Condensation takes place on all the walls and solid structures in contact with the atmosphere in the containment. Condensation on the sump water is also modeled, assuming a constant surface area of the sump water and using the sump water temperature as calculated by MELCOR. A nominal time step size of 1~10 s is used. A smaller time step size is used during the start of steam or hydrogen injection and at periods with strong changes in injection rate. The transient calculation of 5.5 hours real time took close to 3 weeks computer time on 8 parallel processors.
732NURETH-16, Chicago, IL, August 30-September 4, 2015 732NURETH-16, Chicago, IL, August 30-September 4, 2015

As described in section 2.1, the hydrogen recombination in the catalytic region of a PAR is modeled as a volumetric reaction. The recombination rate for the three PAR types installed in the Borssele NPP is based on the following correlation [18]:
),min()( ,22 satHH CCbpar ���� (2)
with, r = overall recombination rate of PAR unit [g/s]
p = absolute pressure [bar] CH2 = hydrogen volume concentration at the recombiner inlet [vol%] CH2,sat = saturation concentration of hydrogen, equal to 8.0 vol% a = 0.010 g/s·bar (R1), 0.031 g/s·bar (R3), 0.137 g/s·bar (R13) b = 0.012 g/s (R1), 0.037 (R3), 0.167 (R13) The recombiners do not operate when the hydrogen or oxygen concentration is below 2 vol%. The recombination rate increases linearly from 2 vol% to 8 vol% hydrogen. At a concentration of 8 vol% hydrogen, the PARs reach their maximum recombination rate. The heat produced by the recombination reaction is 121�103 kJ/kgH2. Auto-ignition by PARs and hydrogen combustion is not taken into account in the applied CFD model. However, the Shapiro diagram can be used to evaluate whether the calculated gas mixture in the containment is flammable or detonable, and if PAR ignition is likely to occur. 4.4. Results The particular focus of the IB-LOCA analyses with CFD for the Borssele NPP is on the hydrogen distribution and the efficiency of the installed PAR system. Fig. 7 gives a look inside the geometrical model of the Borssele containment. The installation area of the containment, containing the RPV, SGs and pumps, is located inside the concrete (grey) structure. Five out of the 22 PAR units are visible, three in the operation area of the containment at about half the containment height and two on top of the polar crane just below the top of the containment. The streamlines colored with temperature give an impression of the flow through and out of the operating PAR units. The exothermal hydrogen recombination reaction in the catalytic region heats up the gas in the PARs and generates a buoyant flow that rises up out of the top opening of each operating PAR. This so called ‘chimney effect’ contributes to the mixing of the atmosphere in the containment as has been observed also in the validation exercise with a single PAR unit in chapter 3. While hot hydrogen-poor gas leaves the PAR, fresh hydrogen-rich gas is sucked towards the PAR and enters at the lower end.
Figure 7. Geometrical model of the Borssele containment used in the CFD analysis. On the left, the
computational mesh, showing the level of detail in the CFD model . On the right, the streamlines colored with temperature show the chimney effect of the PARs.
733NURETH-16, Chicago, IL, August 30-September 4, 2015 733NURETH-16, Chicago, IL, August 30-September 4, 2015
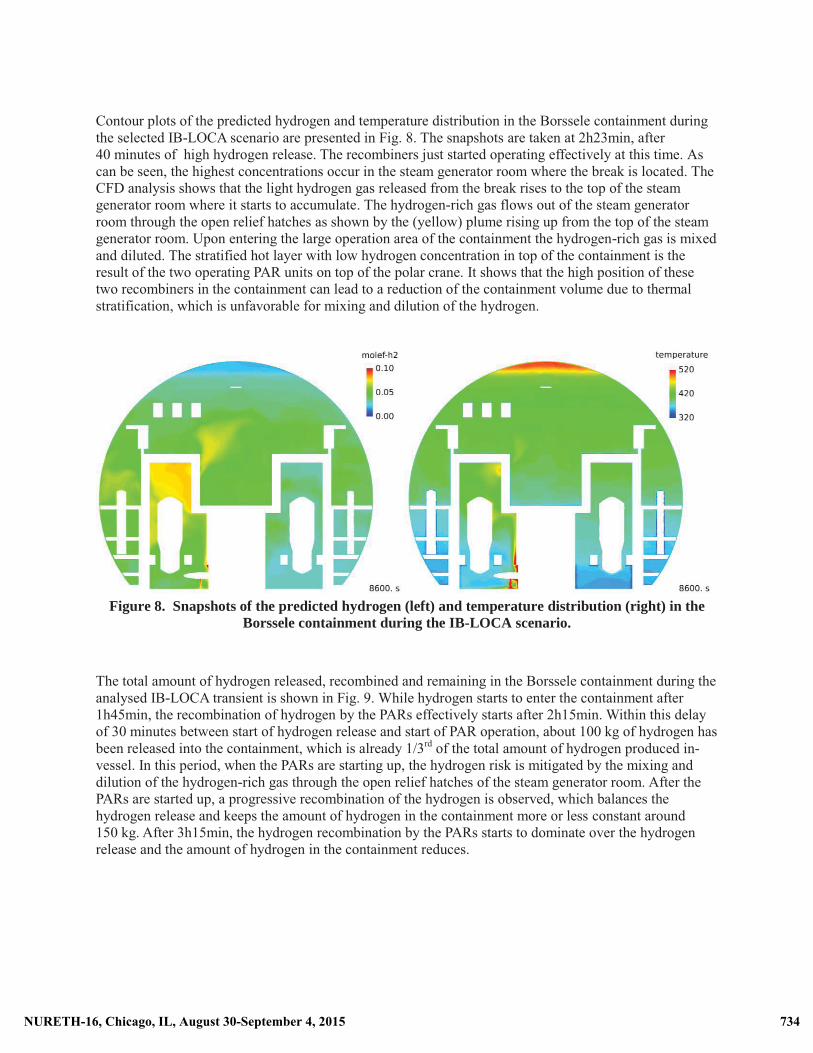
Contour plots of the predicted hydrogen and temperature distribution in the Borssele containment during the selected IB-LOCA scenario are presented in Fig. 8. The snapshots are taken at 2h23min, after 40 minutes of high hydrogen release. The recombiners just started operating effectively at this time. As can be seen, the highest concentrations occur in the steam generator room where the break is located. The CFD analysis shows that the light hydrogen gas released from the break rises to the top of the steam generator room where it starts to accumulate. The hydrogen-rich gas flows out of the steam generator room through the open relief hatches as shown by the (yellow) plume rising up from the top of the steam generator room. Upon entering the large operation area of the containment the hydrogen-rich gas is mixed and diluted. The stratified hot layer with low hydrogen concentration in top of the containment is the result of the two operating PAR units on top of the polar crane. It shows that the high position of these two recombiners in the containment can lead to a reduction of the containment volume due to thermal stratification, which is unfavorable for mixing and dilution of the hydrogen.
Figure 8. Snapshots of the predicted hydrogen (left) and temperature distribution (right) in the
Borssele containment during the IB-LOCA scenario.
The total amount of hydrogen released, recombined and remaining in the Borssele containment during the analysed IB-LOCA transient is shown in Fig. 9. While hydrogen starts to enter the containment after 1h45min, the recombination of hydrogen by the PARs effectively starts after 2h15min. Within this delay of 30 minutes between start of hydrogen release and start of PAR operation, about 100 kg of hydrogen has been released into the containment, which is already 1/3rd of the total amount of hydrogen produced in-vessel. In this period, when the PARs are starting up, the hydrogen risk is mitigated by the mixing and dilution of the hydrogen-rich gas through the open relief hatches of the steam generator room. After the PARs are started up, a progressive recombination of the hydrogen is observed, which balances the hydrogen release and keeps the amount of hydrogen in the containment more or less constant around 150 kg. After 3h15min, the hydrogen recombination by the PARs starts to dominate over the hydrogen release and the amount of hydrogen in the containment reduces.
734NURETH-16, Chicago, IL, August 30-September 4, 2015 734NURETH-16, Chicago, IL, August 30-September 4, 2015
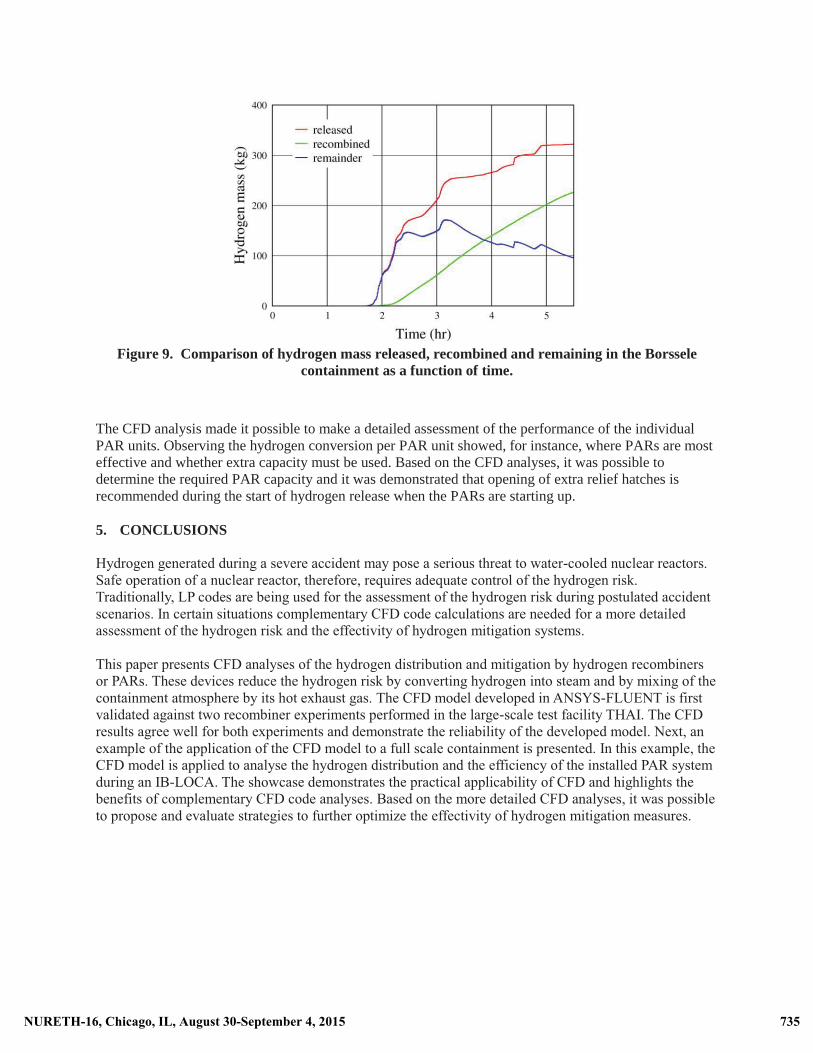
Figure 9. Comparison of hydrogen mass released, recombined and remaining in the Borssele
containment as a function of time.
The CFD analysis made it possible to make a detailed assessment of the performance of the individual PAR units. Observing the hydrogen conversion per PAR unit showed, for instance, where PARs are most effective and whether extra capacity must be used. Based on the CFD analyses, it was possible to determine the required PAR capacity and it was demonstrated that opening of extra relief hatches is recommended during the start of hydrogen release when the PARs are starting up. 5. CONCLUSIONS Hydrogen generated during a severe accident may pose a serious threat to water-cooled nuclear reactors. Safe operation of a nuclear reactor, therefore, requires adequate control of the hydrogen risk. Traditionally, LP codes are being used for the assessment of the hydrogen risk during postulated accident scenarios. In certain situations complementary CFD code calculations are needed for a more detailed assessment of the hydrogen risk and the effectivity of hydrogen mitigation systems. This paper presents CFD analyses of the hydrogen distribution and mitigation by hydrogen recombiners or PARs. These devices reduce the hydrogen risk by converting hydrogen into steam and by mixing of the containment atmosphere by its hot exhaust gas. The CFD model developed in ANSYS-FLUENT is first validated against two recombiner experiments performed in the large-scale test facility THAI. The CFD results agree well for both experiments and demonstrate the reliability of the developed model. Next, an example of the application of the CFD model to a full scale containment is presented. In this example, the CFD model is applied to analyse the hydrogen distribution and the efficiency of the installed PAR system during an IB-LOCA. The showcase demonstrates the practical applicability of CFD and highlights the benefits of complementary CFD code analyses. Based on the more detailed CFD analyses, it was possible to propose and evaluate strategies to further optimize the effectivity of hydrogen mitigation measures.
735NURETH-16, Chicago, IL, August 30-September 4, 2015 735NURETH-16, Chicago, IL, August 30-September 4, 2015

REFERENCES 1. W. Ambrosini et al., “Comparison and Analysis of the Condensation Benchmark Results,” ERMSAR-
2008, Nesseber, Vigo Hotel, Bulgaria (2008). 2. Schwarz, S., et al., “Benchmark on hydrogen distribution in a containment based on the OECD-NEA
THAI HM-2 experiment,” Nuclear Technology 175 (2011). 3. J. Malet et al., “Spray Model Validation on Single Droplet Heat and Mass Transfer for Containment
Applications - SARNET-2 Benchmark,” NURETH-14, Toronto, Ontario, Canada, September 25-30 (2011).
4. J. Malet, et al., “Gas entrainment by one single French PWR spray, SARNET-2 spraybenchmark,” Nuclear Engineering and Design 282, pp. 44-53 (2015).
5. M. Houkema, N.B. Siccama, J.A. Lycklama à Nijeholt, and E.M.J. Komen, “Validation of the CFX4 CFD code for containment thermal-hydraulics,” Nuclear Engineering And Design 238, pp. 590-599 (2008).
6. D.C. Visser, N.B. Siccama, S.T. Jayaraju, E.M.J. Komen, “Application of a CFD based containment model to different large-scale hydrogen distribution experiments,” Nuclear Engineering and Design 278, 491-502 (2014)
7. P. Sathiah, E.M.J. Komen, and D. Roekaerts, “The role of CFD combustion modeling in hydrogen safety management-I: Validation based on small scale experiments,” Nuclear Engineering and Design 248, 93–107 (2012).
8. P. Sathiah, S. van Haren, E.M.J. Komen, and D. Roekaerts, “The role of CFD combustion modeling in hydrogen safety management-II: Validation based on homogeneous hydrogen–air experiments,” Nuclear Engineering and Design 252, 289–302 (2012).
9. P. Sathiah, E.M.J. Komen, and D. Roekaerts, “The role of CFD combustion modeling in hydrogen safety management-III: Validation based on homogeneous hydrogen–air–diluent experiments,” Nuclear Engineering and Design, In Press (2015).
10. ANSYS Fluent 6.3, User’s Guide (2006). 11. M. Casey, and T. Wintergerste, “ERCOFTAC Best Practice Guidelines”, Version 1.0 (2000). 12. D.C. Visser, M. Houkema, N.B. Siccama, and E.M.J. Komen, “Validation of a FLUENT CFD Model
for Hydrogen Distribution in a Containment,” Nuclear Engineering and Design 245, pp. 161-171 (2012).
13. W. Klein-Hessling, “Specification of the THAI PAR-2 and PAR-4 tests,” SARNET2 PAR Benchmark, RS1190-VB 1/2010, GRS, Germany (2010).
14. D.C. Visser, G. Agostinelli, N.B. Siccama, E.M.J. Komen, “Hydrogen Risk Assessment – Hydrogen Distribution and Mitigation,” NURETH-15, Pisa, Italy (2013).
15. W. Klein-Hessling, “Additional information related to the recombiner correlation (AREVA model) of FR90/1-150” (2010).
16. EPZ, “Final Report - Complementary Safety margin Assessment NPP Borssele,” (2011). 17. Sandia National Laboratories, “MELCOR computer code manuals – version 2.1,” NUREG/CR-6119,
(2011). 18. Graf, “Wasserstoffverteilung im Reaktorgebaude nach Primarkreisleckagen und versagender
Notkuhlung,” Siemens report KWU NDS2/98/2001a (1998).
736NURETH-16, Chicago, IL, August 30-September 4, 2015 736NURETH-16, Chicago, IL, August 30-September 4, 2015