hydrogen program overview
TRANSCRIPT

2009 DOE Hydrogen Program and Vehicle Technologies Program
Annual Merit Review and Peer Evaluation MeetingMay 18, 2009
Hydrogen Program OverviewSunita Satyapal
Acting Program Manager

2
•Overview & Challenges•Progress & Accomplishments•A New Direction for the Program

3
Tech
nolo
gy
Bar
rier
sE
cono
mic
&
Inst
itut
iona
l B
arri
ers
Fuel Cell Cost & Durability Targets:
Stationary Systems: $750/kW, 40,000-hr durabilityVehicles: $30 per kW, 5000-hr durability
Safety, Codes & Standards Development
Hydrogen Supply & Delivery Infrastructure
Domestic Manufacturing & Supplier Base
Public Awareness & Acceptance
Hydrogen CostTarget: $2 – 3 /gge
Hydrogen Storage CapacityGreater than 300-mile range, without reducing interior space or compromising performance
Key Challenges
Technology Validation:Technologies must be demonstrated under real-world conditions.
The Program has been working to address a number of key challenges facing the widespread commercialization of hydrogen and fuel cells.
Assisting the growth of early markets will help to overcome many barriers, including achieving significant cost reductions through economies of scale.
Market Transformation

4
The Program is an integrated effort, structured to address all the key challenges and obstacles facing widespread commercialization.
Program Structure
Widespread Commercialization
The DOE Hydrogen Program includes activities within the Offices of Energy Efficiency & Renewable Energy, Fossil Energy, Nuclear Energy, and Science.

5
As stack costs are reduced, balance-of-plant components are responsible for a larger % of costs.
Fuel Cell R&D — Progress
BOP$36/kWStack
$69/kW
BOP$36/kW
Stack$36/kW
We’ve reduced the cost of fuel cells to $73/kW*
• Cost projection validated by independent panel**
• More than 20% reduction in one year
• Nearly 75% reduction since 2002
*Based on projection to high-volume manufacturing (500,000 units/year).
**Panel found $60 – $80/kW to be a “valid estimate”: http://hydrogendoedev.nrel.gov/peer_reviews.html

6
0.0
0.2
0.4
0.6
0.8
1.0
1.2
RESULTS FROM 3M• Single cell operated
with <0.2 g/kW of PGM• Potential to meet
targets for total PGM content in stacks
PGM Total Content — In PEM Fuel Cell Stacks (in the lab)
1.1 g/kW
0.6 g/kW
DOE Targets (for entire stack)
2005 2010 2015
gra
ms /
kW
< 0.2 g/kW
~$3100*
~$1700*
< $600*
* For an 80-kW stack
Reducing Cost: Catalyst research has reduced platinum group metal (PGM) content.
Fuel Cell R&D — AccomplishmentsImproving performance andreducing cost with innovative, low-Pt catalysts
Developed core-shell catalyst with 2.5x higher activity than baseline, and uses less platinum (Brookhaven National Lab)
platinum monolayer
alloy core
Catalyst Mass Activity
Other BNL Pt-Pd-IrCatalysts
Demonstrated MEA with > 7,300-hour durability with cycling, exceeding 5,000-hr target (3M).
DOE Target
Recent BNLCatalyst

7
RECENT ACCOMPLISHMENTSBIO-DERIVED LIQUIDS (UTRC, PNNL):
• Achieved 95% conversion of cellulosic biomass & 74% H2 yield by aqueous phase reforming• Increased H2 yields to more than 92% from vapor phase reforming
ELECTROLYSIS (Giner):• Improved durability (45,000 – 55,000 hrs, projected) • Increased stack efficiency to 72% with improved membrane
HIGH-TEMPERATURE ELECTROLYSIS – Nuclear (INL):• Exceeded expected production rate by more than 10% (achieved peak output of 0.5 kg/hr at
18kWe)HYDROGEN FROM COAL (Eltron, SWRI):
• Demonstrated membranes that meet 2010 targets, at lab-scale
H2 Production R&D —Progress & Accomplishments
We’ve reduced the cost* of hydrogen
from multiple sources.
*projected cost, assuming 1500 kg/day, 500 units/year

8
RECENT ACCOMPLISHMENTSTUBE TRAILERS (Lincoln Composites, LLNL)
• Doubled H2 capacity (from 300kg to 600kg), using new manufacturing technique to enable higher pressures in carbon fiber.
• Demonstrated potential to nearly triple capacity using glass fibers instead of carbon fiber.
DELIVERY ANALYSIS (ANL, LLNL & partners)• Evaluated cryo-pump technology—results show the potential to reduce station
costs by 70%.
(p j y g gy)
$0
$1
$2
$3
$4
$5
$6
COST TARGET: < $1/gge
2005 2010 2015
TUBE-TRAILERS
PIPELINES
2014 milestone
2019 milestone
2020
We’ve reduced the cost of hydrogen delivery* —
~30% reduction in tube trailer costs>10% reduction in pipeline costs
H2 Delivery R&D —Progress & Accomplishments
Projected Cost of Delivering Hydrogen
$ pe
r kg
H2
*modeled cost, based on analysis of state-of-the-art technology

9
H2 Storage R&D — Status & Accomplishments
0
10
20
30
40
50
60
70
0 1 2 3 4 5 6 7 8
Gravimetric Capacity (wt%)
Volu
met
ric C
apac
ity (g
/L)
complexhydride
chemicalhydride
liquid hydrogen
cryocompressed
compressed hydrogen"Learning Demos"
RevisedDOE
systemtargets
700 bar350 bar
C-sorbent
2015
Ultimate
Alane Slurry
MOF-177 (250 bar)
New “ultimate” targets7.5 wt%, 70 g/L
Revised 2015 targets5.5 wt%, 40 g/L
* Alane slurry and MOF—preliminary analysis projections
• Assessed and updated targets as planned (based on real-world experience with vehicles, weight & space in vehicle platform, and needs for market penetration)
• Developed and evaluated more than 200 materials approaches • Launched New Storage Engineering Center of Excellence to address systems
integration and prototype development—efforts coordinated with materials centers
*
*

10
DOE Vehicle/Infrastructure Demonstration (four teams in 50/50 cost-shared projects with DOE
Vehicle Technologies Program)
Validated performance in 140 fuel cell vehiclesand 20 hydrogen stations:More than 1.9 million miles traveled and 90,000 kg hydrogen produced/dispensed (Analysis by NREL)
• EFFICIENCY: 53 – 58% (>2x higher than gasoline internal combustion engines)
• RANGE: ~196 – 254 miles• FUEL CELL SYSTEM DURABILITY:
• Nearly 2,000 hrs (~60,000 miles)
Technology Validation — Accomplishments
Evaluating real-world forklift and bus fleet data (DOD and DOT collaboration)

11
Combined heat, hydrogen, and power systems (CHHP) can:• Produce clean power and fuel for multiple applications• Provide a potential approach to establishing an initial fueling infrastructure
Fuel CellNATURAL GAS or BIOGAS
NATURAL GAS
GRID ELECTRICITY POWER
HEAT
POWERHEAT
HYDROGEN
Generation & Transmission Losses
Baseline System
CHHPSystem
Potential Early Market Application —CHHP Accomplishments
CHHP Project is Underway:Orange County Sanitation District in Fountain Valley, CA—Air Products & FuelCell Energy• System has been designed, fabricated and shop-tested.• Improvements in design have led to higher H2-recovery (from 75% to >85%).• On-site operation and data-collection planned for FY09 – FY10.

12
Systems Analysis — Accomplishments
Systems Analysis continues to provide data on costs & benefits of fuel cell technologies.
Analysis shows potential for 360,000 –675,000 new jobs from growth of hydrogen and fuel cell industries, across 41 industries.
Preliminary analysis shows areas where fuel cells for CHP
can be cost-competitive.
New resources include:• Updated well-to-wheels emissions &
petroleum use results• Employment Study• Analysis of costs of tri-generation of
hydrogen, heat, and power
Employment (% increase from base case)
www.hydrogen.energy.gov/pdfs/epact1820_employment_study.pdf
Region

13
Market TransformationGovernment acquisitions could significantly reduce the cost of fuel cells
through economies of scale, and help to support a growing supplier base.
Source: David Greene, ORNL; K.G. Duleep, Energy and Environmental Analysis, Inc., Bootstrapping a Sustainable North American PEM Fuel Cell Industry: Could a Federal Acquisition Program Make a Difference?, 2008.
Recovery Act funding will deploy
up to 1000 fuel cells, in the private
sector, by 2012.

14
Program Secretarial Officers
Energy Efficiency and Renewable Energy – EERE
Fossil Energy – FENuclear Energy – NE
Science - SC
Secretary of EnergyUnder Secretary
Program Coordination Group*:
Coordinates H2 activities of EERE, FE, NE, SC
DOEProgram Manager
Interagency Working Group
• Staff-level• Coordinates RD&D
Interagency Task Force• High-level• Coordinates Federal
Deployments
Other Federal Agencies Involved in H2 & FC RD&D
and Deployments
DOE Hydrogen Program
• Dept. of Agriculture• Dept. of Commerce• Dept. of Defense• Dept. of Education• Dept. of the Interior• Dept. of Homeland Security• Dept. of Transportation• Environmental Protection
Agency• Executive Office of the
President• General Services
Administration• National Aeronautics and
Space Administration• National Science Foundation• U.S. Postal Service
*Also coordinates codes & standards activities within Dept. of Transportation
Federal Interagency Coordination

15
Market TransformationThe Program is facilitating the adoption of fuel cells across
government and industry.
The Program and DOE are working with the Treasury Department on the “grant in lieu of a tax credit” option for installing and using energy efficient and renewable energy systems—including FUEL CELLS. Final guidance expected ~ July 2009.
RECENT ACCOMPLISHMENTSLeveraging federal collaborations
4 interagency agreements under development• Deployment of up to 100 fuel cells underway• Army Construction Engineering Research Lab,
Federal Aviation Administration, Department of Homeland Security, Office of Naval Research
Developed Investment Tax Credit fact sheet and case studiesIdentifying locations for fuel cells across federal facilities 40 fuel cell forklifts are in operation
at the Defense Logistics Agency, Defense Depot Susquehanna, PA.

16
Independent AssessmentsRecent independent analyses assess technology status, expected costs and
benefits, and effectiveness of the Program.
Estimated Government Cost to Support a Transition to FCVs
• By 2050, a portfolio of technologies—including FCVs—could eliminate petroleum use by light-duty vehicles (LDVs) and reduce CO2 emissions from LDVs to 20% of current levels.
• FCVs could reach 2 million by 2020, 60 million by 2035, and 200 million by 2050.
• Transition cost to Govt: $55B ($40B vehicles, $10B infrastructure, $5B R&D from 2008 – 2023).
• Study is being updated to include impacts of PHEVs
National Academies Study1Independent Assessment of
Fuel Cell System CostNREL convened independent experts
to provide rigorous, unbiased analysis.
• $60 – $80 per kW is a “valid estimation” of the potential manufactured cost for an 80-kW fuel cell system based on 2008 technology, extrapolated for high volumes (500,000 units/yr).
• Validates DOE estimate of $73/kW.
Independent Assessment of Electrolysis Cost
• Preliminary analysis indicates ~$5 – $5.50/gge for H2 from distributed electrolysis.
1Transitions to Alternative Transportation Technologies: A Focus on Hydrogen
www.hydrogen.energy.gov/peer_reviews.html
17
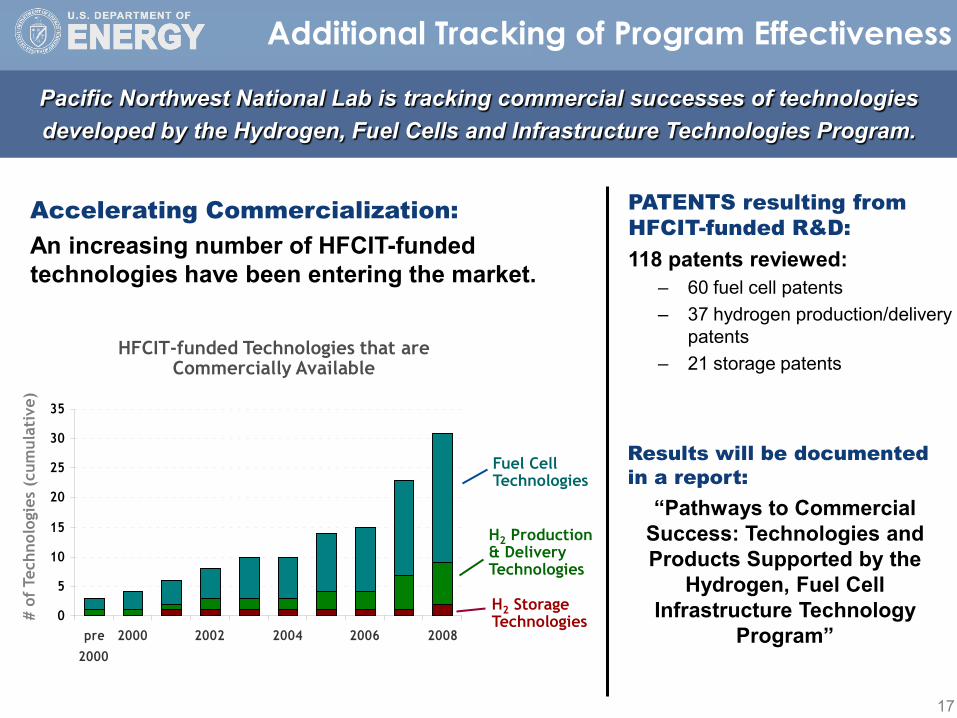
Additional Tracking of Program Effectiveness
PATENTS resulting from HFCIT-funded R&D:118 patents reviewed:
– 60 fuel cell patents– 37 hydrogen production/delivery
patents– 21 storage patents
Accelerating Commercialization:An increasing number of HFCIT-funded technologies have been entering the market.
Results will be documented in a report:
“Pathways to Commercial Success: Technologies and Products Supported by the
Hydrogen, Fuel Cell Infrastructure Technology
Program”
Pacific Northwest National Lab is tracking commercial successes of technologies developed by the Hydrogen, Fuel Cells and Infrastructure Technologies Program.
0
5
10
15
20
25
30
35
pre2000
2000 2002 2004 2006 2008
Fuel Cell Technologies
H2 Production & Delivery Technologies
H2 Storage Technologies
HFCIT-funded Technologies that are Commercially Available
# of
Tec
hnol
ogie
s (c
umul
ativ
e)

18
The new Program is aligned with the Department’s portfolio of technologies for nearer-term impact and improved energy efficiency using multiple fuels.
New Directions — Balancing the Program
Stationary Power/CHP
Transportation
Specialty Vehicles
Coal(with carbon
sequestration)
Renewable Resources
(biomass, wind, solar, etc.)
Propane
Methanol
Nuclear
Fuel Cells
Portable Power
H2
Biogas & Natural Gas
DIVERSE FUELS DIVERSE APPLICATIONS
• Alkaline• Direct Methanol• Molten Carbonate• PEM• Phosphoric Acid• Solid Oxide
Biogas & Natural Gas
Specialty Vehicles
Transportation
Portable Power

19
Fuel Cell Systems R&D
Systems Analysis
Backup Power
Specialty Vehicles
Micro CHP Stationary
Portable Applications
Truck Auxiliary Power Units
Transportation
Data Collection & Analysis
New Program Structure
The Program will refocus on technology-neutral Fuel Cell Systems R&D and Systems Analysis to prioritize research & quantify impacts/benefits.

20
Slide here on the upcoming RFI. To come from Kevin.
New Directions — Input on TargetsRequest for Information (RFI) on Targets for Combined Heat
and Power (CHP) and Auxiliary Power Units (APUs)
• Opportunity for stakeholder and developer input
• Examples of information requested:– Relevance of the proposed targets– Recommendations for testing conditions and protocols– Adequacy of target table explanations and/or need for additional
supporting information– Need for thermal cycling or on/off cycling durability targets– Recommendations for additional targets– Current status compared to targets & potential areas of R&D
RFI to be posted online (www1.eere.energy.gov/hydrogenandfuelcells/)
Responses due June 30, 2009

21
The fuel cell industry has seen growth of more than 50% annually over the past four years. Estimates show about 18,000 new units were shipped worldwide in 2008.
Source: Fuel Cell Today
New Directions — Growing Markets for Fuel Cells
* “Transport” includes specialty vehicles (e.g., forklifts) and auxiliary power units, which currently account for most of the sales in that sector.
** 2008 numbers are preliminary estimates.
Portable
Transport*
Stationary
Large Stationary (>10kW)
10,000
20,000
30,000
40,000
50,000
2004 2005 2006 2007 2008**
Cumulative Shipments Worldwide
2004 2005 2006 2007 2008**
1000
2000
3000
4000
Portable
Transport*
Small Stationary (≤10kW)
North American Shipments

22
Recovery Act Funding for Fuel CellsDOE announced $41.9 million from the American Recovery and Reinvestment Act to fund 13 projects to deploy more than 1,000 fuel cells — to help achieve near term impact and
create jobs in fuel cell manufacturing, installation, maintenance & support service sectors.
COMPANY AWARD
Anheuser-Busch $1.1 M
Delphi Automotive $2.4 M
FedEx Freight East $1.3 M
GENCO $6.1 M
Jadoo Power $1.8 M
MTI MicroFuel Cells $2.4 M
Nuvera Fuel Cells $1.1 M
Plug Power, Inc. (1) $3.4 M
Plug Power, Inc. (2) $2.7 M
PolyFuel, Inc. $2.5 M
ReliOn Inc. $8.6 M
Sprint Comm. $7.3 M
Sysco of Houston $1.2 M
Approximately $72.4 million in cost-share funding from industry participants—for a total of nearly $114.3 million.

23
For more information ...Fuel Cell Program PlanOutlines a coordinated plan for fuel cell activities in the Department of Energy
Replacement for current Posture Plan To be released in 2009
Annual Merit Review ProceedingsIncludes downloadable versions of all presentations at the Annual Merit Review To be released following the Annual Merit Review
www.hydrogen.energy.gov/annual_review08_proceedings.html
Annual Merit Review & Peer Evaluation ReportSummarizes the comments of the Peer Review Panel at the Annual Merit Review and Peer Evaluation Meeting
Next edition to be published in Fall 2009 www.hydrogen.energy.gov/annual_review08_report.html
Annual Progress ReportSummarizes activities and accomplishments within the Program over the preceding year, with reports on individual projects
Next edition to be published in Fall 2009www.hydrogen.energy.gov/annual_progress.html
www.hydrogen.energy.gov www.hydrogenandfuelcells.energy.gov

24
U.S. PARTNERSHIPS• FreedomCAR & Fuel Partnership: Ford, GM, Chrysler, BP, Chevron, ConocoPhillips,
ExxonMobil, Shell, Southern California Edison, DTE Energy• Hydrogen Utility Group: Xcel Energy, Sempra, DTE, Entergy, New York Power Authority,
Sacramento Municipal Utility District, Nebraska Public Power Authority, Southern Cal Edison, Arizona Public Service Company, Southern Company, Connexus Energy, etc.
• State/Local Governments: California Fuel Cell Partnership, California Stationary Fuel Cell Collaborative, co-coordinators of Bi-Monthly Informational Call Series for State and Regional Initiatives with the National Hydrogen Association and the Clean Energy Group
• Industry Associations: US Fuel Cell Council, National Hydrogen Association• Federal Interagency Partnerships: Hydrogen and Fuel Cell Interagency Task Force and
Working Group, Interagency Working Group on Manufacturing, Community of Interest on Hydrogen and Fuel Cell Manufacturing
INTERNATIONAL PARTNERSHIPS
International Partnership for the Hydrogen Economy—partnership among 16 countries and the European Commission
International Energy Agency — Implementing Agreements• Hydrogen Implementing Agreement — 21 countries and the European Commission• Advanced Fuel Cells Implementing Agreement — 19 countries
Acknowledging Partners

25
Thank you

26
Additional Information1- Budgets, Spending, and Participating Organizations

27
Hydrogen & Fuel Cell Budgets: FY04 – FY10
271,258
1,800
269,458
36,509
7,500
25,000*
200,449
FY 2010Request
156,516
555
155,961
0
6,201
4,879
144,881
FY 2004Approp.
122,922
1,800
121,122
36,509**
0
16,400*
68,213
221,704
549
221,155
29,183
8,682
16,518
166,772
FY 2005Approp.
FY 2009Approp.
1,4251,4201,411Department of Transportation (DOT)
276,506266,267231,044DOE TOTAL
FY 2008Approp.
FY 2007Approp.
FY 2006Approp.
24,08821,51321,036Fossil Energy (FE)
206,241189,511153,451EERE Hydrogen/Fuel Cells
36,50936,38832,500Science (SC)
9,66818,85524,057Nuclear Energy (NE)
277,931267,687232,455TOTAL
Funding ($ in thousands)
* Includes funding for R&D plus program direction. Fossil Energy also plans $58M for SECA in FY10.** The Office of Science also plans ~$14M for Biological and Environmental Research in FY10.

28
Budget — EERE Key Activities
EERE Hydrogen and Fuel Cells Budget (in thousands)
63,213000Fuel Cell Systems R&D
$68,2130
0
5,000
0
0
0
0
0
0
0
0
0
FY 2010 FY 2010 requestrequest
$200,449$206,241$189,511Total4,74700Market Transformation
5,0004,8261,928Manufacturing R&D
7,71311,0999,637Systems Analysis
4,200*3,8651,978Education
12,500*15,44213,492Safety, Codes & Standards
3,0002,8963,952Fuel Processor R&D
10,0007,4617,257Distributed Energy Fuel Cell Systems
6,6007,7187,324Transportation Fuel Cell Systems
14,789*29,61239,413Technology Validation
62,70042,34437,100Fuel Cell Stack Component R&D
59,20042,37133,728Hydrogen Storage R&D
10,00038,60733,702Hydrogen Production & Delivery R&D
FY 2009 FY 2009 appropriation
FY 2008 FY 2008 appropriation
FY 2007 FY 2007 appropriationKey Activity
* Under Vehicle Technologies Budget in FY 2009

29
1“National Labs” includes DOE labs as well as other federal labs, such as NIST, JPL, etc.2“Program Management & Crosscutting Activities” include various support activities, such as the Annual Merit Review, required EPACT studies and reports, etc.
FY 2008 Hydrogen Program - Spending Distribution
In FY 2008, $191 million in funding went to competitively selected projects, 76% of a total of $252 million in R&D project funding.
National Labs1 41%
Industry 33%
Universities & Institutes
18%
Program Management & Crosscutting Activities2
Large Businesses: 10%
Small Businesses: 14%
Energy Companies: 2%
Auto Companies: 7%
8%
Total FY08 Budget: $279.1 M

30
Analysis & Testing ANLDTITIAXLANLNIST ORNL
Catalysts & Supports3MANLBASFBNLLANLPNNLUTC Power
Distributed Energy SystemsAcumentricsBlooIntelligent EnergyMaterials & Systems ResearchNanodynamicsPlug PowerUniversity of South CarolinaUTC Power
Fuel ProcessingIntelligent Energy
HardwareGrafTech Int’l, Ltd.ORNLUTC Power
ImpuritiesClemson UniversityLANLUniversity of ConnecticutUniversity of South Carolina
Membranes3MArizona State UniversityArkemaCase Western Reserve U.Clemson UniversityColorado School of MinesFuelCell EnergyGiner Electro SystemsKetteringLBNLPenn State UniversityUniversity of Central FloridaUniversity of Southern MississippiUniversity of TennesseeVanderbilt UniversityVirginia Tech
FY 09 Participating Organizations — Fuel Cells
Portable PowerLilliputian
StackANLCase Western Reserve U.
Transportation SystemsANLBTICumminsDelphiHoneywellIdaTechPNNLSuperprotonics
Water TransportCFD Research Corp.LANLNuvera Fuel CellsRochester Institute of Techn.

31
Hydrogen Delivery
AnalysisANL, NREL, PNNL
PipelinesUniversity of IllinoisNaturalhySECATORNL, SNL, SRNL
CompressionConcepts ETIMohawk InnovativeANL
Storage-RelatedLincoln CompositesLLNL, ORNL, SNL
LiquefactionGas Equipment EngineeringPraxairPrometheus Energy
Renewable Hydrogen Production
Distributed
ANLH2GenVirentNRELOhio StatePNNL
Centralized
BiologicalUC BerkeleyJ. Craig Venter InstituteNREL
Biomass GasificationGTI, UTRCLANL, NETL, NREL
PhotoelectrochemicalUC Santa BarbaraMidwest OptoelectronicsMV SystemsNREL
Solar ThermochemicalUniversity of ColoradoSAICANL, NREL, SNL, SRNL
Crosscutting
AnalysisDTITIAXNREL
ElectrolysisArizona StateAvalenceGinerNREL
Separations Arizona StateBOCHERAMedia & Process TechnologiesORNLPall CorporationSNLSRNL
FY 09 Participating Organizations — Hydrogen Production & Delivery

32
Nuclear Hydrogen Production
Technical Integration Systems Analysis
NREL
SNL
Thermochemical SystemSystem Definition
UNLV
INL
Sulfur-Based System
Clemson University
General Atomics
INL
SNL
SRNL
Alternative Cycles
Penn State
ANL
Electrolytic SystemHTE System
CeramatecMaterials and Systems Research, Inc. (MSRI)ANLINL
System Interface & Supporting SystemsNGNP Interface
UCLAUniversity of WisconsinINLSRNL
Fossil Hydrogen Production
ANLEltron Research, Inc.Media & Process TechnologyNETLPraxairOhio StateREB Research and ConsultingResearch Triangle InstituteSouthwest Research InstituteUniversity of KentuckyUnited Technologies Research CenterWestern Research InstituteWorcester Polytechnic Institute
FY 09 Participating Organizations — Hydrogen Production

Metal Hydride CenterNational Lab:
Sandia-Livermore
Industry:HRL LaboratoriesUTRC
Universities:CalTechStanfordPittsburgh/Ga. TechHawaii/UNBIllinois Ohio StateNevada-Reno Utah
Federal Labs:BNL, JPL, NIST, ORNL, SRNL
Hydrogen Sorption Center
National Lab:NREL
Industry:Air Products
Universities:CalTech Duke U.Texas A&M Michigan North CarolinaPenn StateRice
Federal Labs:ANL, LLNL, NIST, ORNL
Chemical Hydrogen Storage Center
National Labs:Los AlamosPacific Northwest
Industry:Rohm & HaasU.S. Borax
Universities:Penn StateAlabama California-Davis Missouri-ColumbiaPennsylvania OregonWashington
Federal Labs:INL
FY 09 Participating Organizations — Hydrogen Storage
Engineering Storage Center
National Lab:Savannah River
Industry:FordGeneral Motors Lincoln CompositesUTRC
Universities:Oregon State
Federal Labs:JPLLANLNRELPNNL
Industry
Air Products and Chemicals, Inc.; Gas Technology Institute; H2 Technology Consulting LLC; Quantum Technologies; TIAX; UOP; UTRC
Federal LabsANL; SRNL; LANL; LLNL; ORNL; SNL
Universities & InstitutesAlfred U.; Hydrogen Education Foundation; Michigan Tech; Missouri – Columbia; Northwestern; Penn State; Purdue; Southwest Research Institute; SUNY – Syracuse; U. of Arkansas; UC Berkeley; UCLA; UC Santa Barbara; University of Connecticut; UPenn/Drexel
Independent Projects

34
Manufacturing R&DBallard Material Products, Inc.BASFLBNLNIST NRELPNLQuantum TechnologiesRensselaer Polytechnic InstituteUltraCell CorporationWL Gore & Associates
FY 09 Participating Organizations — Technology Validation; Manufacturing R&D; Safety, Codes & Standards
Technology Validation/ Learning Demonstration Teams
Lead: General Motors Corp.
Partner: Shell Hydrogen
Lead: Chevron
Partner: Hyundai-Kia Motor Co.
Additional Team Member: UTC
Lead: Chrysler, Daimler
Partner: BP
Lead: Ford Motor Company
Partner: BP
Data collection and analysis: NREL
Safety, Codes & Standards
LANLLLNLNISTNRELPNNLORNLSNLU.S. Dept. of Transportation

35
State Governments and State-based Organizations
CT Center for Advanced Technology
Ohio Fuel Cell Coalition
SC Hydrogen and Fuel Cell Alliance
VA Dept of Mines, Minerals & Energy
UniversitiesCalifornia State University – LA
Humboldt State University
The Lawrence Hall of Science at UC-Berkeley
Michigan Technological University
University of Central Florida
University of North Dakota
IndustryCarolina Tractor & Equipment Company
The Media Network
Opinion Research Corporation
FY09 Participating Organizations —Education, Systems Analysis, Market Transformation
Education
Federal LabsNREL
ORNL
PNNL
Other OrganizationsAutomotive X Prize
Clean Energy States Alliance
Houston Advanced Research Center
Hydrogen Education Foundation
The National Energy Education Development Project
Technology Transition Corporation
Systems AnalysisANLEnergy & Environmental Analysis, Inc.LLNLNRELORNLPNNLRCF Economic & Financial Consulting, Inc.SNLUC Davis
Market TransformationAnheuser-BuschFedEx Freight EastGENCOJadoo PowerMTI MicroFuel Cells Inc.Nuvera Fuel CellsPolyFuel, Inc.Plug Power, Inc.ReliOn, Inc.Sprint CommSysco of Houston
36
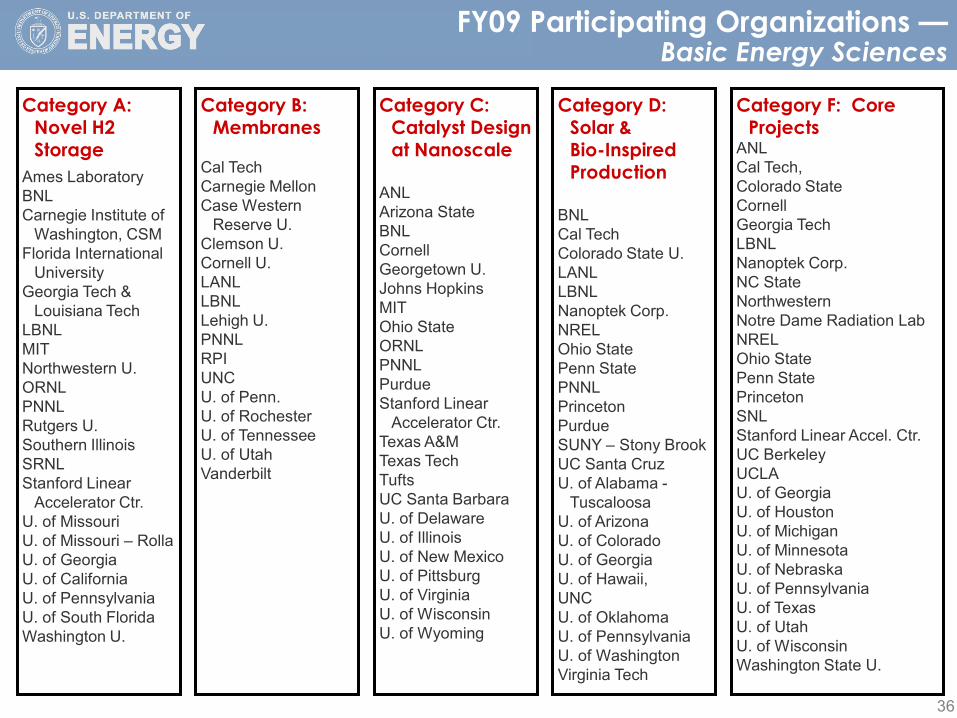
Category A: Novel H2 Storage
Ames LaboratoryBNLCarnegie Institute of
Washington, CSMFlorida International
UniversityGeorgia Tech &
Louisiana TechLBNLMITNorthwestern U.ORNLPNNLRutgers U.Southern IllinoisSRNLStanford Linear
Accelerator Ctr. U. of MissouriU. of Missouri – RollaU. of GeorgiaU. of CaliforniaU. of PennsylvaniaU. of South FloridaWashington U.
Category B: Membranes
Cal TechCarnegie MellonCase Western
Reserve U.Clemson U.Cornell U. LANLLBNLLehigh U.PNNLRPIUNCU. of Penn. U. of RochesterU. of TennesseeU. of UtahVanderbilt
Category C: Catalyst Design at Nanoscale
ANLArizona StateBNLCornellGeorgetown U.Johns Hopkins MITOhio StateORNLPNNLPurdueStanford Linear
Accelerator Ctr.Texas A&M Texas TechTuftsUC Santa BarbaraU. of DelawareU. of IllinoisU. of New MexicoU. of PittsburgU. of VirginiaU. of WisconsinU. of Wyoming
Category D: Solar & Bio-Inspired Production
BNLCal TechColorado State U.LANLLBNLNanoptek Corp.NRELOhio StatePenn StatePNNLPrincetonPurdueSUNY – Stony BrookUC Santa CruzU. of Alabama -
TuscaloosaU. of Arizona U. of ColoradoU. of Georgia U. of Hawaii, UNCU. of OklahomaU. of Pennsylvania U. of WashingtonVirginia Tech
Category F: Core Projects
ANLCal Tech, Colorado StateCornellGeorgia TechLBNLNanoptek Corp. NC StateNorthwesternNotre Dame Radiation Lab NRELOhio StatePenn StatePrincetonSNLStanford Linear Accel. Ctr. UC BerkeleyUCLAU. of GeorgiaU. of HoustonU. of MichiganU. of MinnesotaU. of NebraskaU. of PennsylvaniaU. of TexasU. of UtahU. of WisconsinWashington State U.
FY09 Participating Organizations —Basic Energy Sciences

37
Additional Information2 – Well to Wheels Analysis
and Technology Status

38
Hydrogen and fuel cells are part of DOE’s portfolio of technologies to reduce emissions of greenhouse gases by light-duty vehicles.
Hydrogen Program Record #9002, www.hydrogen.energy.gov/program_records.html
Systems Analysis: Greenhouse Gas Emissions
Today’s Gasoline Vehicle
Well-to-Wheels Greenhouse Gas Emissions(life cycle emissions, based on a projected state of the technologies in 2020)
Conventional Vehicles
Hybrid Electric Vehicles
Plug-in Hybrid Electric Vehicles (40-mile all-electric range)
Fuel Cell Vehicles
Gasoline
Natural Gas
Gasoline
Diesel
Corn Ethanol – E85
Cellulosic Ethanol – E85
Gasoline
Cellulosic Ethanol – E85
H2 from Distributed Natural Gas
H2 from Coal w/Sequestration
H2 from Biomass Gasification
H2 from Central Wind Electrolysis
H2 from Nuclear High-Temp Electrolysis
410
320
250
220
190
<65*
240
<150*
200
<110*
<55*
<40*
50
100 200 300 400
Grams of CO2-equivalent per mile
540
*Net emissions from these pathways will be lower if these figures are adjusted to include:• The displacement of emissions from grid power–generation that will occur when surplus electricity is co-produced with cellulosic ethanol• The displacement of emissions from grid power–generation that may occur if electricity is co-produced with hydrogen in the biomass and
coal pathways, and if surplus wind power is generated in the wind-to-hydrogen pathway• Carbon dioxide sequestration in the biomass-to-hydrogen process

39
Well-to-Wheels Petroleum Energy Use(based on a projected state of the technologies in 2020)
Conventional Vehicles
Hybrid Electric Vehicles
Plug-in Hybrid Electric Vehicles(40-mile all-electric range)
Fuel Cell Vehicles
Gasoline
Natural Gas
Gasoline
Diesel
Corn Ethanol – E85
Cellulosic Ethanol – E85
Gasoline
Cellulosic Ethanol – E85
H2 from Distributed Natural Gas
H2 from Coal w/Sequestration
H2 from Biomass Gasification
H2 from Central Wind Electrolysis
Btu per mile
4550
25
2710
2370
850
860
1530
530
30
25
95
45
15
2000 3000 40001000 5000
Today’s Gasoline Vehicle
6070
H2 from Nuclear High-Temp Electrolysis
Hydrogen and fuel cells are part of DOE’s portfolio of technologies to reduce the use of petroleum by light-duty vehicles.
Hydrogen Program Record #9002, www.hydrogen.energy.gov/program_records.html
Systems Analysis: Petroleum Use

40
Targets and StatusKEY H2
STORAGE TARGETS
350 bar 700 bar Materials-based* Liquid H2
System Gravimetric
Density (TARGET = 5.5 wt%)
2.8 - 3.8% 2.5 - 4.4% 3% 5.1 - 6.5%
System Volumetric
Density (TARGET = 40 g/L)
17 - 18 g/L 18 - 25 g/L 14 - 19 g/L 22 - 36 g/L
System Cost (TARGET =
$2/kWh)~ $15.5/kWh ~$23/kWh ~$15.6/kWh ~$8/kWh**
KEY FUEL CELL (AUTO) TARGETS
Status
Durability (TARGET = 5,000 hrs) 1,977 hrs
Cost (TARGET = $30/kW) $73/kW
Efficiency at 25% Rated Power (TARGET = 60%) 59%
* For modeled adsorbent system. ** Does not include liquefaction cost; 10.1 kg H2 system. Fuel cell and storage costs are projections for 500,000 units/year.
H M/H LM= High (significant challenge) = Medium/High = Medium = Low (minimal challenge)
KEY H2 PRODUCTION & DELIVERY TARGETS
Distr. NGDistr. Bio-
derived Liquids
Distr. Electrolysis
Central Wind
Electrolysis
Central Biomass
Gasification/ Pyrolysis
Solar High-temp. Electrochemical
Cost [TARGET = $2 - 3/gge (delivered) at the pump]
$3/gge $4.4/gge $4.8/gge $5.9/gge @ plant gate
<$2/gge @ plant gate …..
KEY H2 DELIVERY TARGETS Pipeline to Station (350 bar)
Pipeline & Truck to Station
Liquid Truck to Station
Cost [Target < $1/gge, from point of production to point of use] $3/gge $5/gge $3.2/gge

41
Additional Information4 – Program Partnerships

42
• FreedomCAR & Fuel Partnership: Ford, GM, Chrysler, BP, Chevron, ConocoPhillips, ExxonMobil, Shell, Southern California Edison, DTE Energy
• Hydrogen Utility Group: Xcel Energy, Sempra, DTE, Entergy, New York Power Authority, Sacramento Municipal Utility District, Nebraska Public Power Authority, Southern Cal Edison, Arizona Public Service Company, Southern Company, Connexus Energy, etc.
• State/Local Governments: California Fuel Cell Partnership, California Stationary Fuel Cell Collaborative, co-coordinators of Bi-Monthly Informational Call Series for State and Regional Initiatives with the National Hydrogen Association and the Clean Energy Group
• Industry Associations: US Fuel Cell Council, National Hydrogen Association
• Federal Interagency Partnerships: • Hydrogen and Fuel Cell Interagency Task Force and Working Group• Interagency Working Group on Manufacturing• Community of Interest on Hydrogen and Fuel Cell Manufacturing
U.S. Partnerships

43
International Partnership for the Hydrogen Economy
International Energy Agency –Implementing Agreements
International Partnerships
• International project reviewers here at the Annual Merit Review
• Sponsoring Global Student Competition (Germany, 2010)
• Published new Demonstration and Deployment Map on Web site (www.iphe.net)
• Released final report on IEA-IPHE Infrastructure Workshops
• Working on “Hydrogen & Fuel Cells for the 21st Century” — a policy brief and technology status update for IPHE countries
• Advanced Fuel Cell Implementing Agreement extended five years—to 2013
• Hydrogen Implementing Agreement extended five years—to 2014. New tasks include:‒ Market transformation task ‒ R&D task for renewable production of H2
using sunlight

44
Additional Information5 – Recovery Act and
Award Details

45
Recovery Act — Overview
American Recovery & Reinvestment Act
Energy-Related Funding Includes:
• $16.8 B for Energy Efficiency and Renewable Energy• $2.0 B for DOE Office of Science (including $400 M for the Advanced
Research Projects Agency)• $3.4 B for Fossil Energy R&D• $4.5 B for Electricity Delivery & Energy Reliability (Smart Grid)• $6.0 B for Loan Guarantee Program• $5.6 B for GSA (includes high performance green federal buildings
and fleets)• $300 M for DoD Energy research, including fuel cells

46
New Recovery Act ProjectsDeploying Fuel Cells for Specialty Vehicles
Anheuser-Busch(St. Louis, MO) $1.1 million 23 fuel cells in class-1 lift trucks
FedEx Freight East (Harrison, AR)
$1.3 million 35 fuel cells in class-1 lift trucks
GENCO (Pittsburgh, PA)
$6.1 million 156 fuel cells in 6 fleets of class-1 and -3 lift trucks
Nuvera Fuel Cells(Billerica, MA) $1.1 million
Supplement a fuel cell forklift fleet with 10 fuel cell power packs and a hydrogen fueling system
Sysco of Houston(West Houston, TX) $1.2 million 90 fuel cells in class-3 pallet trucks
TOTAL: $10.8 million
Advantages of Fuel Cells for Specialty Vehicles:• Allow for rapid refueling — much faster than changing-out or recharging batteries (refueling with
hydrogen takes about one minute, while battery changes can take 20 – 45 minutes, and recharging can take anywhere from 2 to 16 hours)
• Provide constant power without voltage drop• Eliminate space requirements of batteries & chargers• Can provide substantial cost-savings over battery-powered forklifts (more than 50% reduction in
lifecycle costs for a 3-kW pallet truck)
47
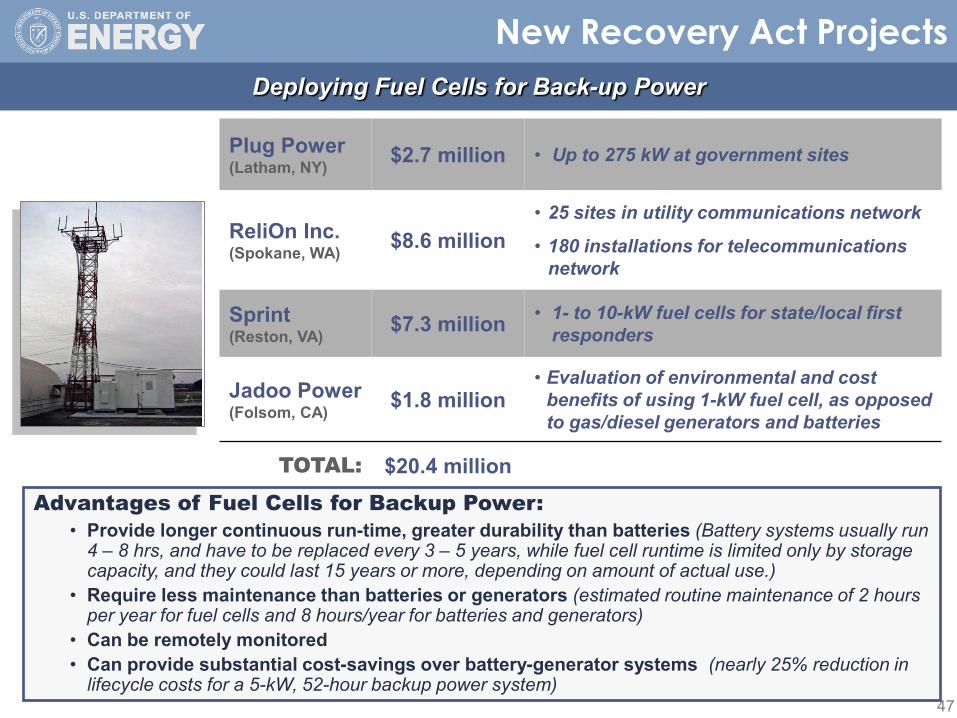
New Recovery Act ProjectsDeploying Fuel Cells for Back-up Power
Advantages of Fuel Cells for Backup Power:• Provide longer continuous run-time, greater durability than batteries (Battery systems usually run
4 – 8 hrs, and have to be replaced every 3 – 5 years, while fuel cell runtime is limited only by storage capacity, and they could last 15 years or more, depending on amount of actual use.)
• Require less maintenance than batteries or generators (estimated routine maintenance of 2 hours per year for fuel cells and 8 hours/year for batteries and generators)
• Can be remotely monitored• Can provide substantial cost-savings over battery-generator systems (nearly 25% reduction in
lifecycle costs for a 5-kW, 52-hour backup power system)
Plug Power (Latham, NY) $2.7 million • Up to 275 kW at government sites
ReliOn Inc.(Spokane, WA) $8.6 million
• 25 sites in utility communications network
• 180 installations for telecommunications network
Sprint(Reston, VA) $7.3 million • 1- to 10-kW fuel cells for state/local first
responders
Jadoo Power(Folsom, CA) $1.8 million
• Evaluation of environmental and cost benefits of using 1-kW fuel cell, as opposed to gas/diesel generators and batteries
TOTAL: $20.4 million

48
New Recovery Act ProjectsDemonstrating PEM Fuel Cells for Residential and Small Commercial CHP
Plug Power, Inc. (Latham, NY)
$3.4 million
5-kW stationary
CHP systems
ADVANTAGES of FUEL CELLS for CHP…
• Up to 85% overall efficiency
• 25 – 35% reduction in emissions from household energy use
• Zero emissions
• Low noise and vibration
• Low O&M requirements, less down-time
– 100x more reliable than the average power supply for data centers—three seconds of down time per year versus an average of five minutes.
• Less variation in efficiency across variable loads
Plug Power’s GenSys Blue, for
residential and small commercial applications

49
New Recovery Act Projects
Deploying Fuel Cells for Portable Power
$4.9 millionTOTAL:
$2.5 million
$2.4 million
• Portable power system for mobile computing
• 1 W consumer electronics power pack
PolyFuel, Inc.(Mountain View, CA)
MTI MicroFuel Cells(Albany, NY)
Delphi Automotive (Troy, MI) $2.4 million • 3 – 5 kW SOFC APU for
heavy-duty class 8 trucks
Deploying Fuel Cells for Auxiliary Power

50
Additional Information6 – Funding Opportunities
and Recent Tax Incentives

51
Some tax credits affecting fuel cells were expanded. Through new financing mechanisms, these credits can help facilitate federal deployments.
Recovery Act Opportunities
TAX CREDITS IN THE RECOVERY ACT
Hydrogen Fueling Facility Credit
Increases the hydrogen fueling credit from 30% or $30,000 to 30% or $200,000.
Grants for Energy Property in Lieu of Tax Credits
Allows facilities with insufficient tax liability to apply for a grant instead of claiming the Investment Tax credit (ITC) or Production Tax credit (PTC). Only entities that pay taxes are eligible.
Manufacturing Credit
Creates 30% credit for investment in property used for manufacturing fuel cells and other technologies
Residential Energy Efficiency Credit
Raises ITC dollar cap for residential fuel cells in joint occupancy dwellings to $3,334/kW.

52
Funding Opportunities (non-Recovery Act)
Loan Guarantee Program• Loan guarantees for renewable energy, energy efficiency, & electricity transmission projects
(up to $10B).
State Energy Program Competitive Activities • Topics are Advanced Building Energy Codes and Utility-Scale Clean Energy Capacity; offered
by EERE’s Weatherization and Intergovernmental Program; closes July 10, 2008 (~$7.5M).
SBIR/STTR• DOE SBIRs:
• Annual solicitations on a wide variety of topics• 2010 Solicitation subtopics to be released in the Fall
• DoD SBIR topic: “Extraction of Atmospheric CO2 and Conversion to Liquid Hydrocarbon Fuel” (The Army is seeking ways to produce fuel from CO2 and water in the atmosphere. Water will be used to provide the hydrogen needed for the conversion process); closes June 17.
Department of Defense• Defense Logistics Agency—two Broad Agency Announcements expected in the next two
months for deployment of material handling equipment (funding TBD by 2010 budget)• Office of Naval Research and DOE to conduct a joint project on hydrogen for renewable
energy storage (funding TBD)
H-Prize• First round ($1 million pilot award, for onboard storage materials) will open in spring 2009—
award expected in September 2010.

53
• Goal: Demonstrate advancement for an on-board storage material exceeding performance targets
• Administering Entity: Pilot administered by Hydrogen Education Foundation, in partnership with SCRA
• Announcement: H-Prize criteria, eligibility requirements and registration procedures announced in the Federal Register Spring, 2009. Registration to submit a proposal must occur within 6 months of Federal Register posting.
• Award: The pilot award of $1 Million Prize expected in September 2010– Administering entity is raising cost share to augments funds for
future prizes
(Opens w/Federal Register Notice)
H-Prize – Energy Independence and Security Act of 2007