hydrogen 21cm cosmology tzu-ching chang (asiaa) ue-li pen, kiyo masui (cita) jeff peterson, kevin...
TRANSCRIPT
Hydrogen 21cm CosmologyHydrogen 21cm Cosmology
Tzu-Ching Chang (ASIAA)
Ue-Li Pen, Kiyo Masui (CITA)Jeff Peterson, Kevin Bandura, Tabitha Voytek, Aravind Natarajan (CMU)Pat McDonald (LBNL)Victor Liao (ASIAA)

The initial condition Cosmic Microwave Background fluctuations of
10-5 at z~1100 (surface of last-scattering)
WMAP

QuickTime™ and a decompressor
are needed to see this picture.

HEDEX

Dark Energy
Dominates the current energy budget of the Universe Causes accelerated expansion Modifies growth of structure Unknown origins Most prosaic “explanation” is a
cosmological constant Well established observationally (e.g. SNe) A sensitive probe - Baryon Acoustic
Oscillation

Baryon Acoustic Oscillations
Sound waves in the photon-baryon plasma in the early universe propagate from density perturbations; they freeze out when universe transited from radiation to matter domination (recombination). Thus they have a
characteristic scale of 100 h-1Mpc (~150 Mpc), corresponding to the sound horizon at recombination at z~1100.
QuickTime™ and aGIF decompressor
are needed to see this picture.
Courtesy of D. Eisenstein

Baryon Acoustic Oscillation
A more subtle feature when superposed on a complex density field
QuickTime™ and aGIF decompressor
are needed to see this picture.

The oscillation peaks and troughs on the CMB power spectrum are obvious

More subtle on the galaxy distribution at late times (z~0.35)
Sloan Digital Sky Survey

It causes a slight peak in the galaxy correlation function (z~0.35)
QuickTime™ and aGIF decompressor
are needed to see this picture.
Eisenstein+ 05

The oscillation peaks and troughs on the large-scale matter power spectrum
Reid+ 10
Why is Baryon Acoustic Oscillation (BAO) interesting? It is a direct demonstration of the gravitational
instability paradigm: a feature we see in the CMB 380,000 years after the Big Bang is also seen in an evolved state in the present-day Universe, 13.6 Gyrs after. The scale of the feature is fixed: it is determined by
the scale of the sound horizon at recombination, therefore by the physics in the early Universe. It is a “standard ruler”, and thus is a direct constraint on the geometry of the Universe. We probe dark energy via its evolution on the
expansion rate of the Universe. BAO and CMB, both standard rules, provide an excellent measurement of dark energy properties.

BAO - great tool for precision cosmology
Komatsu+ 08

BAO Measurements
BAO feature is present in the distribution of large-scale structure Can be quantified by imprints on the
large-scale matter power spectrum Galaxies are tracers of large-scale
structure; traditionally, we need to measure the 3D position of millions of galaxies in a redshift survey (e.g. SDSS) Here we propose an alternative: 21-
cm

21cm Line
Picture from C. Hirata Ground-state spin-flip hyperfine transition of
neutral hydrogen Hydrogen: most abundant element, optically thin
Line transition: Probe 3D structure of the
Universe Can be seen in absorption or emission against
the CMB, depending on the spin temperature: Ts > Tcmb: emission (z < 10) Ts < Tcmb: absorption ( ~15? < z <~ 150) Brightness Temperature:
300

The 21cm universe
Tegmark & Zaldarriaga
08
EOR
LSSSDSS
HI 21cm radiation observable up to z~150
Up to 1016 modes to z~50(Hubble/Jeans)3
• Physics: Lensing, gravity waves, primordial NG, BAO, AP (Pen 04, Loeb & Zaldarriaga 04, Lewis & Challinor 07, etc.)
• Astrophysics: EoR, galaxy formation & evolution• Experiment Now• EoR: GMRT, LOFAR, MWA, PAPER, 21CMA• BAO: GBT, CRT, CHIME

21cm Large-Scale Structure
Large-scale HI temperature fluctuation; CMB-like, in 3D Observed frequency: f = 1420/(1+z) MHz 0.5<z<2.5, HI traces under-lying matter distribution, can be used to measure Baryon Acoustic Oscillations (100 Mpc scale) => dark energy 6<z<10, Epoch of Reionization, ~20-50 Mpc scale, HI shows tomographic history of reionization => astrophysics
Z1 10
LSS; BAO
EORM. White

21cm emission on galaxy scales
Due to small emissivity, HI in emission is difficult to detect.
Previously, HI direct detection at z~0.2 (Verheijen et al 2007), stacking at z~0.3 (Lah et al. 2007); both on galaxy scales.

21cm Intensity Mapping
“ Intensity Mapping” (Chang et al 2008, Wyithe & Loeb 2008): instead of HI associated with galaxies, interested in HI associated with large-scale structure => measure the collective HI emission from a large region, more massive and luminous, without spatially resolving down to galaxy scales.
Measurement of spatially diffused spectral line, in the confusion-limited regime
Brightness temperature fluctuations on the sky: just like CMB temperature field, but in 3D
Low angular resolution redshift survey: economical

21cm Observational Challenges:
Haslam Map at 408 MHz
RFI, Galactic Synchrotron foregrounds > 103 signal HI content, distribution at high-z uncertain

Green Bank Telescope

Green Bank Telescope: 100 meter in diameter; largest steerable single dish
Observed at 670-910 MHz (0.53<z<1.1) at two of the DEEP2 fields 2 x (2 x 0.5) deg2 for ~25 hours
DEEP2 survey: optical redshift survey by the Keck Telescope, ~50,000 redshifts 0.7<z<1.3
Cross-correlation of HI & optical, probing 0.53 < z < 1.1
Spatial resolution: Beam FWHM ~ 15’ => 9 h-1Mpc at z~0.8
Spectral resolution ~ 24 kHz, rebinned to ~500 kHz => 2 h-1Mpc
Resolution element ~ (9 h-1Mpc)3
Observing HI Large-scale Structure at GBT

HI content at z=0.8Cross-correlating GBT HI & DEEP2 optical galaxies
at z ~ 0.7-1.1
GBT HI (after SVD foreground
subtraction)
DEEP2 density
GBT radio continuum
sources + HI
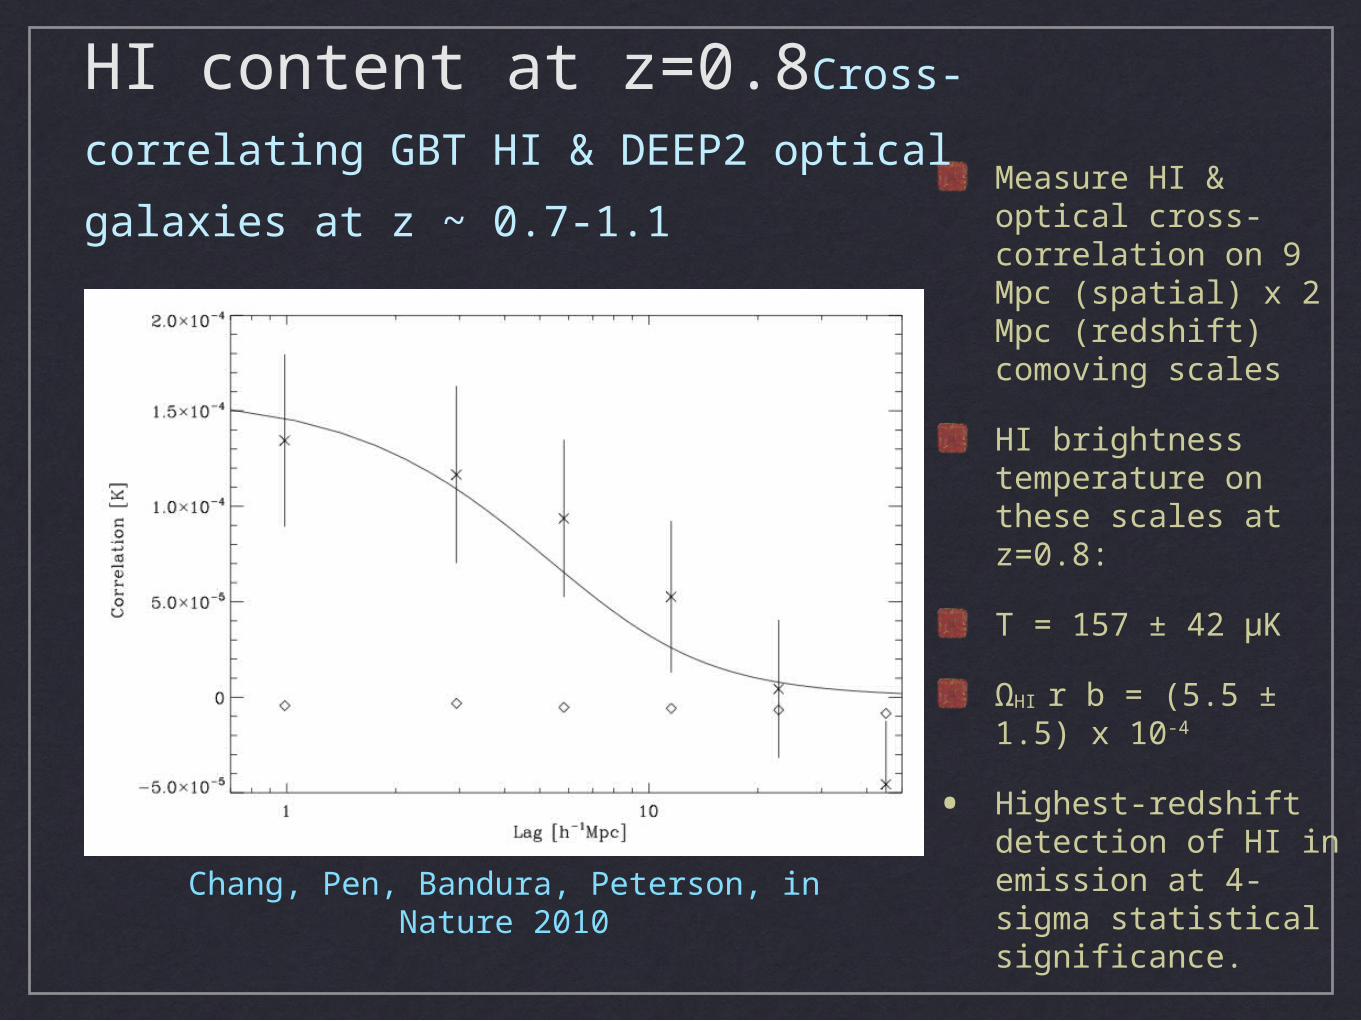
Chang, Pen, Bandura, Peterson, in Nature 2010
Measure HI & optical cross-correlation on 9 Mpc (spatial) x 2 Mpc (redshift) comoving scales
HI brightness temperature on these scales at z=0.8:
T = 157 ± 42 μK
ΩHI r b = (5.5 ± 1.5) x 10-4
• Highest-redshift detection of HI in emission at 4-sigma statistical significance.
HI content at z=0.8Cross-correlating GBT
HI & DEEP2 optical galaxies at z ~ 0.7-1.1

Work in Progress: HI auto-correlation
at z=0.8Auto- & Cross-correlating GBT HI & zCOSMOS galaxies at z
~ 0.5-1.1
GBT radio continuum
sources + HI
GBT HI (after SVD foreground
subtraction)
zCOSMOS density

Next Step: HI Power spectrum at z~1
Masui et al.

HI BAO Experiment Prospects
HI Intensity Mapping Experiment: 40,000m2 collecting area, 100 hrs of observation - competitive to DETF stage III experiment
Chang, Pen, Peterson, McDonald 2008

HI cross-correlation (with DEEP2 optical galaxies): measured at z~0.8: abundant HI at z~1; HI traces large-scale structure
HI auto-correlation at z~0.8: GBT on zCOSMOS field
HI large-scale structure redshift-space distortion: 50 deg, 300 hrs at GBT, observation and data analysis in progress (caution: foreground, calibration issues..)
Looking to build a survey instrument for Baryon Acoustic Oscillation measurement (e.g.,Chang et al. 08, Wyithe & Loeb 08, Seo et al. 10): large collecting area, compact configuration, wide-field survey (~104 m2) covering 0.5<z<2.5 (400-900 MHz, df~0.5 MHz), resolution ~10’ (10 comoving Mpc)
21cm at z~1: current status

Conclusion
BAO is a powerful tool for precision measurement of dark energy properties 21-cm line is a promising large-scale
structure tracer at low redshifts, yielding BAO measurements 21-cm would be a good probe of the
observable universe.