hydro one networks inc. floor, south tower 483 bay street toronto, ontario … · 2017-02-23 ·...
TRANSCRIPT

Hydro One Networks Inc. 7th Floor, South Tower 483 Bay Street Toronto, Ontario M5G 2P5 www.HydroOne.com
Tel: (416) 345-5240 Cell: (416) 903-5240 [email protected]
Oded Hubert Vice President Regulatory Affairs
1
BY COURIER July 20, 2016 Ms. Kirsten Walli Board Secretary Ontario Energy Board Suite 2700, 2300 Yonge Street P.O. Box 2319 Toronto, ON, M4P 1E4 Dear Ms. Walli, EB-2016-0160 – Hydro One Networks Inc.’s 2017 and 2018 Transmission Cost-of-Service Application – Updated Evidence Filing
Attached are two (2) paper copies of updated exhibits for Hydro One Networks Inc.'s Transmission Cost-of-Service Application, which was filed with the Ontario Energy Board (“OEB”) on May 31, 2016.
The evidence has been updated to reflect:
• Decreased pension operating expenses resulting from an updated actuarial valuation report;
• Removal of B2M LP costs that were inadvertently included in the original filing; and
• Lower OEB assessment costs due to an allocation methodology change that was implemented by the OEB.
All changes are numerical in nature, with the exception of the updated actuarial valuation report for the pension plan which is included as a new attachment to Exhibit C1, Tab 4, Schedule 2. The revisions were made as of the date of this letter.
These revisions result in OM&A reductions of $12.7 million in 2017 and $11.0 million in 2018 in comparison to Hydro One’s original filing.
A detailed list of the updated evidence is provided below:

2
Exhibit Tab Sch. Att. Content
A 2 1 Application
A 3 1 Executive Summary
A 7 2 Hydro One Networks Inc. Transmission Pro Forma Statement of Income Bridge Year (2016) and Test Years (2017 and 2018)
C1 1 1 Cost of Service Summary
C1 2 1 Summary of OM&A Expenditures
C1 3 1 Summary of Common Corporate Costs - OM&A
C1 3 3 Common Corporate Functions and Services and Other OM&A
C1 4 2 Pension Costs
C1 4 2 1 Hydro One Inc. Hydro One Pension Plan: Actuarial Valuation as at December 31, 2015 (June 9, 2016)
C1 6 1 Common Corporate Costs, Cost Allocation Methodology
C1 6 1 1 Review of Allocation of Common Corporate Costs (Transmission) - 2015
C2 1 1 Cost of Service
C2 2 1 Comparison of OM&A Expense by Major Category – Historic, Bridge, and Test Years
E1 1 1 Revenue Requirement
E1 2 1 External Revenues
E2 1 1 Calculation of Revenue Requirement
G1 1 1 Cost Allocation and Rate Pool Revenue Requirement
G1 3 1 Network, Line Connection and Transformation Connection Rate Pools
G2 4 4 OM&A Costs by Functional Category
G2 5 1 Detailed Revenue Requirement by Rate Pool
H1 5 1 Bill Impacts
H2 1 2 1 2017 Ontario Transmission Rate Schedules
H2 1 2 2 2018 Ontario Transmission Rate Schedules
H2 1 2 3 2017-2018 Draft Uniform Transmission Rates and Revenue Disbursement Allocators

3
An electronic copy of the updated evidence and complete application has been filed using the Board’s Regulatory Electronic Submission System and will be posted on the Hydro One website. Sincerely, ORIGINAL SIGNED BY ODED HUBERT Oded Hubert

Filed: 2016-05-31 EB-2016-0160 Exhibit A Tab 1 Schedule 1 Page 1 of 9
EXHIBIT LIST 1
Exhibit Tab Schedule Attachment Contents
A Administration
A 1 1 Exhibit List
A 2 1 Application
A 2 1 1 Certification of Evidence
A 3 1 Executive Summary
A 4 1 Compliance with OEB Filing Requirements for Electricity Transmitters
A 4 2 Summary of Board Directives and Undertakings from Previous Proceedings
A 5 1 Corporate Organization Charts
A 5 2 Governance and Control Framework
A 5 2 1 Hydro One Inc. Mandate for the Board of Directors
A 5 2 2 Hydro One Inc. Nominating, Corporate Governance, Public Policy & Regulatory Committee Mandate
A 5 2 3 Hydro One Inc. Audit Committee Mandate
A 5 2 4 Hydro One Inc. Health, Safety, Environment, First Nations and Métis Committee Mandate
A 5 2 5 Hydro One Inc. Human Resources Committee Mandate
A 5 3 Affiliate Service Agreements
A 5 3 1 Agreement between Hydro One Inc., Hydro One Remote Communities Inc., Hydro One Networks Inc. and Hydro One Telecom Inc. (January 1, 2016)
A 5 3 2 Agreement between Hydro One Networks Inc., Hydro One Remote Communities Inc., Hydro One Inc. and Hydro One Telecom Inc. (January 1, 2016)
A 5 3 3 Agreement between Hydro One Telecom Inc. and Hydro One Networks Inc. (January 1, 2015)
A 5 3 4 Agreement between Hydro One Networks Inc. and Hydro One Remote Communities Inc. (January 1, 2016)
A 5 3 5 Agreement between Hydro One Networks Inc., B2M GP Inc., and B2M Limited Partnership by its general partner B2M GP Inc. (December 17, 2014)

Filed: 2016-05-31 EB-2016-0160 Exhibit A Tab 1 Schedule 1 Page 2 of 9
Exhibit Tab Schedule Attachment Contents
A 5 3 6 Agreement between Hydro One Networks Inc. and Hydro One Telecom Inc. (January 1, 2016)
A 5 3 7 Agreement between Hydro One Networks Inc. and Hydro One Remote Communities Inc. (January 1, 2016)
A 5 3 8 Agreement between Hydro One Remote Communities Inc. and Hydro One Networks Inc. (January 1, 2016)
A 6 1 Accounting Information
A 7 1 Hydro One Transmission Financial Statements - Historic Years (2014- 2015)
A 7 1 1 2014 Hydro One Networks Inc. Transmission Business Financial Statements
A 7 1 2 2015 Hydro One Networks Inc. Transmission Business Financial Statements
A 7 2 Hydro One Networks Inc. Transmission Pro Forma Statement of Income Bridge Year (2016) and Test Years (2017 and 2018)
A 8 1 Hydro One Limited – 2015 Annual Report
A 8 1 1 Hydro One Limited – “Powering Up” Annual Report 2015
A 8 2 Hydro One Inc. - Bridge Year (2016) Quarterly Reports
A 8 2 1 Hydro One Inc. Interim Consolidated Statements of Operations and Comprehensive Income
A 8 2 2 Hydro One Inc. Management’s Discussion and Analysis
A 8 3 Reconciliation of Regulatory Financial Results with Audited Financial Statements (2015)
A 8 4 Rating Agency Reports
A 8 4 1 Standard & Poor’s Rating Services Report (September 18, 2015)
A 8 4 2 Moody’s Investor Service Report (November 5, 2015)
A 8 4 3 DBRS Ratings Report (April 12, 2016)
A 8 5 Prospectus for Most Recent Financing
A 8 5 1 Hydro One Inc. Short Form Base Shelf Prospectus (December 14, 2015)
A 9 1 Stakeholder Consultation
A 9 1 1 Stakeholder Consultation Session Materials and Meeting Notes (April 27, 2016)
A 10 1 Draft Issues List
A 11 1 Witness List

Filed: 2016-05-31 EB-2016-0160 Exhibit A Tab 1 Schedule 1 Page 3 of 9
Exhibit Tab Schedule Attachment Contents
A 11 2 Curricula Vitae
A 12 1 Notices, Procedural Orders, Correspondence
B Transmission System Plan, Performance and Reporting
B1 Transmission System Plan
B1 1 1 Transmission System Plan: Introduction
Part One: Summary of Transmission Business
B1 1 2 Hydro One Transmission Business Overview
B1 1 2 1 Asset List - BES Designation
B1 1 2 2 Transmission System Maps
B1 1 3 Transmission Business Performance
B1 1 3 1 Customer Delivery Point Performance Standard
B1 1 3 2 Description of Reliability Measures
Part Two: Hydro One’s Investment Planning Process
B1 2 1 Hydro One's Investment Planning Process: An Overview
B1 2 2 Identifying Customer Needs
B1 2 2 1 Customer Consultation Report: Development of Transmission Investment Plan
B1 2 2 2 Transmission Customer Engagement: Investing for the Future
B1 2 2 3 Online Consultation Tool
B1 2 3 Identifying System Needs: Regional Planning Process
B1 2 3 1 Letter from IESO on Status of Integrated Regional Resource Plans
B1 2 3 2 Integrated Regional Resource Plan - Brant Sub-Region
B1 2 3 3 Regional Infrastructure Plan – Greater Ottawa
B1 2 3 4 Regional Infrastructure Plan – GTA North
B1 2 3 5 Regional Infrastructure Plan – GTA West
B1 2 3 6 Regional Infrastructure Plan – KWCG
B1 2 3 7 Regional Infrastructure Plan – Metro Toronto

Filed: 2016-05-31 EB-2016-0160 Exhibit A Tab 1 Schedule 1 Page 4 of 9
Exhibit Tab Schedule Attachment Contents
B1 2 3 8 Integrated Regional Resource Plan – North of Dryden Sub-Region
B1 2 3 9 Regional Infrastructure Plan – Windsor-Essex
B1 2 3 10 Needs Assessment Report – Peterborough to Kingston
B1 2 3 11 Letter from IESO Initiating Near-Term Transmission Project identified through the Barrie/Innisfil Integrated Regional Resource Planning
B1 2 3 12 Needs Assessment Report – Sudbury/Algoma
B1 2 3 13 Needs Assessment Report – North/East of Sudbury
B1 2 3 14 Needs Assessment Report – Renfrew
B1 2 4 Identifying Asset Needs: Asset Management Approach
B1 2 4 1 Reliability Risk Model
B1 2 5 Identifying Asset Needs: Asset-specific Assessments
B1 2 6 Identifying Asset Needs: Asset Needs Overview
B1 2 7 Developing the Investment Plan
Part Three: Capital Investments
B1 3 1 Summary of Capital Expenditures
B1 3 1 1 Comparison of Net Capital Expenditures by Major Category- Historic, Bridge and Test Years
B1 3 2 Sustaining Capital
B1 3 3 Development Capital
B1 3 4 Operations Capital
B1 3 5 Common Corporate Costs Capital
B1 3 6 Information Technology
B1 3 7 Facilities and Real Estate
B1 3 8 Transport, Work, and Service Equipment
B1 3 9 Common Asset Allocation
B1 3 9 1 Review of Shared Assets Allocation (Transmission) - 2015
B1 3 10 Overhead Capitalization Rate
Filed: 2016-05-31 EB-2016-0160 Exhibit A Tab 1 Schedule 1 Page 5 of 9
Exhibit Tab Schedule Attachment Contents
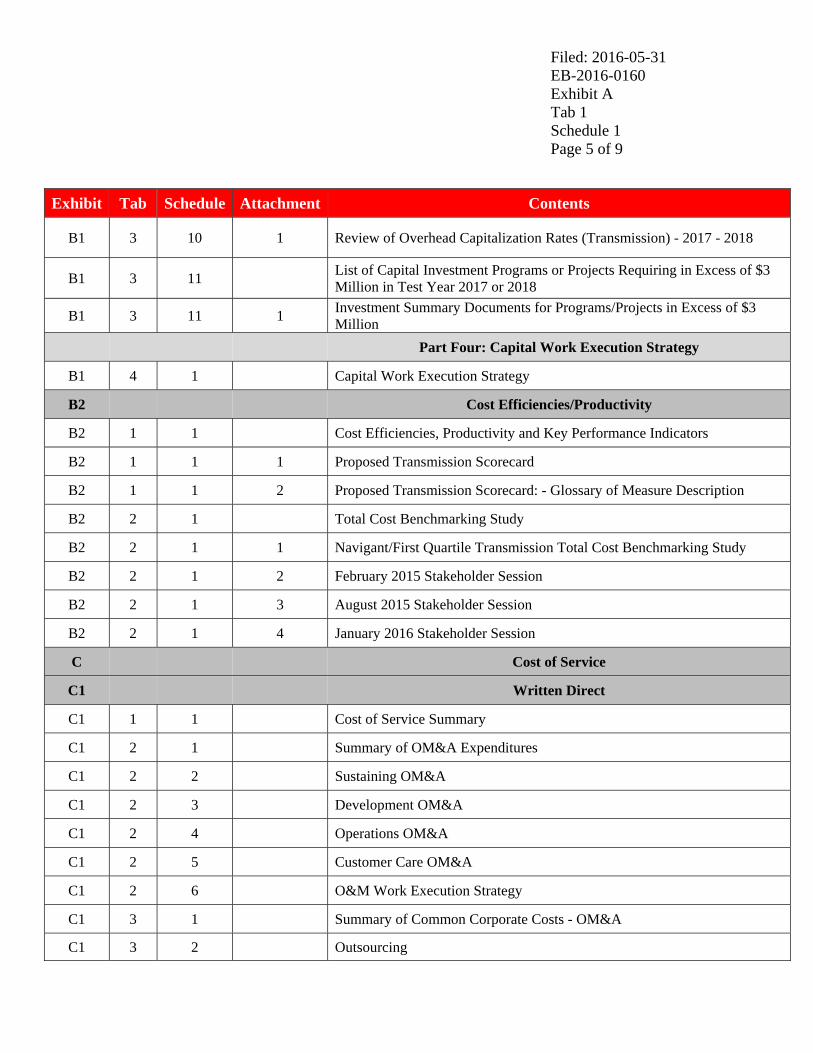
B1 3 10 1 Review of Overhead Capitalization Rates (Transmission) - 2017 - 2018
B1 3 11 List of Capital Investment Programs or Projects Requiring in Excess of $3 Million in Test Year 2017 or 2018
B1 3 11 1 Investment Summary Documents for Programs/Projects in Excess of $3 Million
Part Four: Capital Work Execution Strategy
B1 4 1 Capital Work Execution Strategy
B2 Cost Efficiencies/Productivity
B2 1 1 Cost Efficiencies, Productivity and Key Performance Indicators
B2 1 1 1 Proposed Transmission Scorecard
B2 1 1 2 Proposed Transmission Scorecard: - Glossary of Measure Description
B2 2 1 Total Cost Benchmarking Study
B2 2 1 1 Navigant/First Quartile Transmission Total Cost Benchmarking Study
B2 2 1 2 February 2015 Stakeholder Session
B2 2 1 3 August 2015 Stakeholder Session
B2 2 1 4 January 2016 Stakeholder Session
C Cost of Service
C1 C Written Direct
C1 1 1 Cost of Service Summary
C1 2 1 Summary of OM&A Expenditures
C1 2 2 Sustaining OM&A
C1 2 3 Development OM&A
C1 2 4 Operations OM&A
C1 2 5 Customer Care OM&A
C1 2 6 O&M Work Execution Strategy
C1 3 1 Summary of Common Corporate Costs - OM&A
C1 3 2 Outsourcing

Updated: 2016-07-20 EB-2016-0160 Exhibit A Tab 1 Schedule 1 Page 6 of 9
Exhibit Tab Schedule Attachment Contents
C1 3 3 Common Corporate Functions and Services and Other OM&A
C1 3 4 Common Corporate Costs OM&A – Planning
C1 3 5 Common Corporate Costs OM&A - Information Technology
C1 3 6 Common Corporate Costs OM&A - Cost of Sales - External Work
C1 3 7 Taxes Other Than Income Taxes
C1 4 1 Corporate Staffing and Compensation
C1 4 1 1 Payroll Table 2013 to 2018
C1 4 2 Pension Costs
C1 4 2 1 Hydro One Inc. Hydro One Pension Plan: Actuarial Valuation as at December 31, 2015 (June 9, 2016)
C1 5 1 Costing of Work
C1 6 1 Common Corporate Costs, Cost Allocation Methodology
C1 6 1 1 Review of Allocation of Common Corporate Costs (Transmission) - 2015
C1 7 1 Depreciation and Amortization Expenses
C1 7 1 1 2015 Depreciation Rate Review
C1 8 1 Payments in Lieu of Corporate Income Taxes
C2 Supporting Schedules
C2 1 1 Cost of Service
C2 2 1 Comparison of OM&A Expense by Major Category – Historic, Bridge and Test Years
C2 3 1 Depreciation and Amortization Expenses
C2 4 1 Calculation of Utility Income Taxes
C2 4 1 1 Calculation of Utility Income Taxes –Test Years
C2 4 1 2 Calculation of Capital Cost Allowance – Bridge and Test Years
C2 4 1 3 Calculation of Utility Income Taxes – Historic Years
C2 4 1 4 Calculation of Capital Cost Allowance – Historic Years
C2 4 1 5 Calculation of Apprenticeship and Education Tax Credit - Test Years
C2 4 1 6 Calculation of Apprenticeship and Education Tax Credit – Historic Years

Filed: 2016-05-31 EB-2016-0160 Exhibit A Tab 1 Schedule 1 Page 7 of 9
Exhibit Tab Schedule Attachment Contents
C2 5 1 2015 Hydro One Income Tax Returns
C2 5 1 1 2015 Hydro One Networks Inc. Income Tax Return – For the stub period January 1, 2015 to October 31, 2015
C2 5 1 2 2015 Hydro One Networks Inc. Income Tax Return – For the stub period November 1, 2015 to November 4, 2015
D Rate Base and Cost of Capital
D1 Written Direct
D1 1 1 Rate Base
D1 1 2 In-service Additions
D1 1 3 Economic Evaluation True-Ups
D1 1 4 Working Capital
D1 1 4 1 Navigant - A Determination of the Working Capital Requirements of Hydro One Networks’ Transmission Business
D1 2 1 Materials and Supplies Inventory
D1 3 1 Interest Capitalized
D1 4 1 Cost of Capital
D1 5 1 Cost of Third Party Long-Term Debt
D2 Supporting Schedules
D2 1 1 Statement of Utility Rate Base
D2 2 1 Continuity of Property, Plant and Equipment
D2 2 2 Continuity of Accumulated Depreciation
D2 2 3 Continuity of Property, Plant and Equipment - Construction Work in Progress
D2 3 1 Statement of Working Capital
D2 4 1 Debt and Equity Summary
D2 4 2 Cost of Long-Term Debt Capital
E Revenue Requirement & Load Forecast
E1 Written Direct
E1 1 1 Revenue Requirement E1 2 1 External Revenues

Filed: 2016-05-31 EB-2016-0160 Exhibit A Tab 1 Schedule 1 Page 8 of 9
Exhibit Tab Schedule Attachment Contents
E1 3 1 Business Load Forecast and Methodology
E2 Supporting Schedules
E2 1 1 Calculation of Revenue Requirement
E2 2 1 Load Forecast Data
F Regulatory Assets
F1 Written Direct
F1 1 1 Regulatory Accounts
F1 1 2 Regulatory Accounts Requested
F1 1 3 Planned Disposition of Regulatory Accounts
F2 Supporting Schedules
F2 1 1 Regulatory Accounts for Approval
F2 1 2 Schedule of Annual Recoveries
F2 1 3 Continuity Schedules - Regulatory Accounts
G Cost Allocation
G1 Written Direct
G1 1 1 Cost Allocation and Rate Pool Revenue Requirement
G1 2 1 Description of Cost Allocation Methodology
G1 3 1 Network, Line Connection and Transformation Connection Rate Pools
G2 Supporting Schedules
G2 1 1 List of Transmission Lines by Functional Category
G2 1 2 List of Transmission Stations by Functional Category
G2 2 1 Allocation Factors for Dual Function Lines
G2 3 1 Allocation Factors for Generator Line Connections
G2 3 2 Allocation Factors for Generator Station Connections
G2 4 1 Asset Value by Functional Category
G2 4 2 Depreciation by Functional Category

Filed: 2016-05-31 EB-2016-0160 Exhibit A Tab 1 Schedule 1 Page 9 of 9
Exhibit Tab Schedule Attachment Contents
G2 4 3 Return on Capital and Income Taxes by Functional Category
G2 4 4 OM&A Costs by Functional Category
G2 5 1 Detailed Revenue Requirement by Rate Pool
H Rate Design
H1 Written Direct
H1 1 1 Overview of Uniform Transmission Rates
H1 2 1 Charge Determinants
H1 3 1 Fees for Wholesale Meter Service
H1 4 1 Rates for Export Transmission Service
H1 5 1 Bill Impacts
H2 Supporting Schedules
H2 1 1 Current Ontario Transmission Rate Schedules
H2 1 1 1 2016 Ontario Transmission Rate Schedules
H2 1 1 2 2016 Uniform Transmission Rates and Revenue Disbursement Allocators
H2 1 2 Proposed Ontario Transmission Rate Schedules
H2 1 2 1 2017 Ontario Transmission Rate Schedules
H2 1 2 2 2018 Ontario Transmission Rate Schedules
H2 1 2 3 2017-2018 Draft Uniform Transmission Rates and Revenue Disbursement Allocators
H2 2 1 Current Wholesale Meter Service and Exit Fee Schedule
H2 2 1 1 Current Wholesale Meter Service and Exit Fee Schedule
H2 2 2 Proposed Wholesale Meter Service and Exit Fee Schedule
H2 2 2 1 Proposed Wholesale Meter Service and Exit Fee Schedule

Updated: 2016-07-20 EB-2016-0160 Exhibit A Tab 2 Schedule 1 Page 1 of 6
Witness: Oded Hubert
APPLICATION 1
2
ONTARIO ENERGY BOARD 3
4
IN THE MATTER OF the Ontario Energy Board Act, 1998 (“Act”); 5
6
AND IN THE MATTER OF an Application by Hydro One Networks Inc. for an order or 7
orders made pursuant to section 78 of the Act approving rates for the transmission of 8
electricity. 9
10
APPLICATION 11
12
1. The Applicant is Hydro One Networks Inc. (“Hydro One”), a subsidiary of Hydro 13
One Limited. Hydro One is an Ontario corporation with its head office in Toronto. 14
The Applicant carries on the business, among other things, of owning and operating 15
transmission facilities in Ontario. The transmission business of Hydro One is referred 16
to in this Application as “Hydro One Transmission”. 17
18
2. Hydro One hereby applies to the Ontario Energy Board (the “Board”), pursuant to 19
section 78 of the Ontario Energy Board Act, 1998, for an order or orders approving 20
the revenue requirement, use of certain regulatory accounts and customer rates for the 21
transmission of electricity, to be implemented on January 1, 2017 and for a two-year 22
period ending December 31, 2018. 23
24
3. Hydro One seeks approval of a revenue requirement of $1,606 million and $1,687 25
million for the test years 2017 and 2018, respectively. The applied-for revenue 26
requirements have been developed using a traditional cost-of-service methodology. 27
Recovery of each of these amounts is estimated to increase the total electricity bill for 28

Updated: 2016-07-20 EB-2016-0160 Exhibit A Tab 2 Schedule 1 Page 2 of 6
Witness: Oded Hubert
a medium density R1 (750 kWh) customer by 0.2% in 2017 and 0.3% in 2018 and the 1
total electricity bill for a general service energy (2000 kWh) customer by 0.1% in 2
2017 and 0.2% in 2018 as compared to 2016 and 2017 levels. This bill impact 3
reflects Hydro One’s transmission rates increasing by 3.7% and 5.4% in each of the 4
test years relative to 2016 approved rates and 2017 applied-for rates, respectively. 5
The transmission component of the average total distribution bill is approximately 6
6.8%. These changes take into account a decreased load forecast over the two year 7
rate period 8
9
4. Hydro One also requests that the Board amend the Uniform Transmission Rates to 10
allow for recovery of the proposed revenue requirements for 2017 and 2018, effective 11
January 1st of each year. 12
13
5. Hydro One also seeks rate approval for its Export Transmission Service (“ETS”) rate. 14
The proposed rate is $1.85/MWh for each of the test years, which was approved by 15
the Board in Hydro One’s last transmission revenue requirement application EB-16
2014-0140. 17
18
6. Hydro One seeks approval to continue the following regulatory accounts: 19
a) Excess Export Service Revenue; 20
b) External Secondary Land Use Revenue; 21
c) External Station Maintenance, E&CS Revenue and Other Revenue; 22
d) Tax Rate Changes; 23
e) Rights Payments; 24
f) Pension Cost Differential; 25
g) East West Tie Deferral Account – Incumbent Transmitter; 26
h) Long-Term Transmission Future Corridor Acquisition and Development 27
Account;28

Filed: 2016-05-31 EB-2016-0160 Exhibit A Tab 2 Schedule 1 Page 3 of 6
Witness: Oded Hubert
i) North West Bulk Transmission Line Account; 1
j) Supply to Essex County Transmission Reinforcement (SECTR) Account; 2
k) External Revenue – Partnership Transmission Projects Account; and 3
l) In-Service Capital Additions Variance Account. 4
5
7. Hydro One seeks approval of regulatory assets with a total credit balance of $130.7 6
million as at December 31, 2015. Hydro One seeks approval to refund over a twenty-7
four month period commencing January 1, 2017, regulatory assets with a net credit 8
balance of $95.6 million, reducing the annual revenue requirement. 9
10
8. The evidence filed in support of this Application is generally organized in accordance 11
with the Board’s new Filing Requirements for Electricity Transmission Applications 12
effective February 11, 2016 (the “Filing Requirements”). Specifically, the evidence 13
is organized as follows: 14
Exhibit A: Administrative Documents
Exhibit B: Transmission System Plan, Cost Efficiencies/Productivity (including Performance Scorecard) and Total Cost Benchmarking
Exhibit C: Cost of Service (Operating Costs)
Exhibit D: Rate Base and Cost of Capital
Exhibit E: Revenue Requirement and Load Forecast
Exhibit F: Regulatory Accounts
Exhibit G: Cost Allocation to Uniform Transmission Rate Pools: Charge Determinants
Exhibit H: Rate Design for Uniform Transmission Rates 15
9. In accordance with the Filing Requirements and the Board’s October 18, 2012 Report 16
of the Board, Renewed Regulatory Framework for Electricity Distributors: A 17

Filed: 2016-05-31 EB-2016-0160 Exhibit A Tab 2 Schedule 1 Page 4 of 6
Witness: Oded Hubert
Performance-Based Approach, this Application also incorporates enhanced reporting 1
on customer engagement and a proposed scorecard to measure performance. 2
3
10. The evidence relied on for the relief sought this Application provides a full 4
description of all costs common to the Applicant’s distribution and transmission 5
activities, but the proposed rates are based only upon those costs appropriately 6
allocated to the transmission business. 7
8
11. The written evidence filed with the Board may be amended from time to time prior to 9
the Board’s final decision on the Application. Further, the Applicant may seek 10
meetings with Board staff and intervenors in an attempt to identify and reach 11
agreements to settle issues arising out of this Application. 12
13
12. Subject to any settlement reached with intervenors, it is Hydro One’s preference that 14
the Board hears its Application in an oral hearing. Hydro One believes that an oral 15
hearing is the most expeditious forum to address multiple topics that will be issues in 16
the proceeding. 17
18
13. The persons affected by this Application are the ratepayers of Hydro One’s 19
transmission business. It is impractical to set out their names and addresses because 20
they are too numerous. 21
22
14. Hydro One requests that a copy of all documents filed with the Board by each party to 23
this Application be served on the Applicant and the Applicant’s counsel as follows: 24
25

Filed: 2016-05-31 EB-2016-0160 Exhibit A Tab 2 Schedule 1 Page 5 of 6
Witness: Oded Hubert
a) The Applicant: 1
2
Ms. Erin Henderson 3
Senior Regulatory Coordinator – Regulatory Affairs 4
Hydro One Networks Inc. 5
6
Address for personal service: 8th Floor, South Tower 7
483 Bay Street 8
Toronto, ON M5G 2P5 9
10
Mailing Address: 7th Floor, South Tower 11
483 Bay Street 12
Toronto, ON M5G 2P5 13
14
Telephone: (416) 345-4479 15
Fax: (416) 345-5395 16
Electronic access: [email protected] 17

Filed: 2016-05-31 EB-2016-0160 Exhibit A Tab 2 Schedule 1 Page 6 of 6
Witness: Oded Hubert
b) The Applicant’s counsel: 1
2
Mr. Gordon M. Nettleton 3
McCarthy Tétrault LLP 4
5
Address for personal service: Suite 5300, TD Bank Tower 6
Box 48, 66 Wellington Street West 7
Toronto ON M5K 1E6 8
9
Telephone: (416) 362-1812 10
Fax: (416) 868-0673 11
Electronic access: [email protected] 12
13
DATED at Toronto, Ontario, this 31st day of May, 2016. 14
15
HYDRO ONE NETWORKS INC. 16
By its counsel, 17
18
19
Gordon M. Nettleton 20

Updated: 2016-07-20
EB-2016-0160
Exhibit A
Tab 3
Schedule 1
Page 1 of 25
Witness: Oded Hubert
EXECUTIVE SUMMARY OF APPLICATION 1
2
1. SCOPE OF APPLICATION 3
4
Hydro One Networks Inc. (“Hydro One”) is applying for an Order approving the revenue 5
requirement, cost allocation and rates for Hydro One’s transmission business for years 6
2017 and 2018 (“test years”) under the assigned docket number EB-2016-0160. 7
8
This executive summary addresses the requirements listed in Section 2.3.1 of Chapter 2 9
of the Ontario Energy Board’s (the “Board”) Filing Requirements for Electricity 10
Transmission Applications issued on February 11, 2016. 11
12
In this Application, Hydro One is requesting the Board’s approval of: 13
14
rates revenue requirements of $1,505 million for 2017 and $1,586 million for 2018; 15
charge determinants by rate pools to assist in the development of Uniform 16
Transmission Rates effective January 1, 2017; 17
the performance scorecard proposed in this Application; 18
the continuation of the regulatory accounts discussed in Section 10 of this Exhibit; 19
and 20
the disposition of regulatory accounts with a net credit balance of $95.6 million 21
effective January 1, 2017. 22
23
The requested rates revenue requirements reflect a year-over-year increase of 1.6% for 24
2017 versus 2016 Board-approved levels and 5.4% for 2018 versus 2017. After adjusting 25
for the load forecast, the requested increase in 2017 is 3.7%. The requested increase for 26
2018 is unchanged and remains 5.4%. 27
Updated: 2016-07-20
EB-2016-0160
Exhibit A
Tab 3
Schedule 1
Page 2 of 25
Witness: Oded Hubert
The estimated increase of the total bill for Hydro One general service energy (2000 1
kWh/month) customers is 0.1% in 2017 and 0.2% in 2018. For Hydro One medium 2
density residential (750 kWh/month) customers, the estimated increase is 0.2% in 2017 3
and 0.3% in 2018. The estimated bill impact for transmission connected-customers is 4
0.3% in 2017 and 0.4% in 2018, assuming that transmission represents 8.3% of the 5
average transmission-connected customer’s total bill. 6
7
The applied-for rate increase is likely to be mitigated by anticipated reductions in 8
transmission pension contribution operating expenses, arising from the receipt of an 9
updated actuarial valuation report that was not finalized at the time this Application was 10
filed. The report is expected to be finalized at the end of June 2016. These 11
circumstances are described further in Section 7 of this Exhibit. 12
13
2. OVERVIEW OF HYDRO ONE’S INVESTMENT PLAN 14
15
2.1 Strategic Goals, Values and Objectives 16
17
Hydro One aspires to be a best-in-class, customer-centric, commercial utility. Consistent 18
with its past performance and its new status as a commercial entity, Hydro One remains 19
committed to delivering safe, reliable power, and supporting the sustainable development 20
of the Ontario economy. The company’s core values remain unchanged: 21
22
Maintaining a safe workplace; 23
Caring for customers; 24
Operating as one company; 25
Being people-powered; and 26
Executing with excellence. 27

Updated: 2016-07-20
EB-2016-0160
Exhibit A
Tab 3
Schedule 1
Page 3 of 25
Witness: Oded Hubert
Hydro One’s new executive leadership and Board of Directors are committed to building 1
a stronger performance management culture and are focused on achieving excellence in 2
execution in all aspects of the company’s work. The ability to measure and track 3
performance is essential to this vision, as set out in Exhibit B2, Tab 1, Schedule 1 of this 4
Application and Section 6 of this Exhibit. Hydro One’s commitment to productivity and 5
cost efficiency is further illustrated in Section 7 of this Exhibit, as OM&A expenses are 6
expected to demonstrate a declining trend in the 2016 bridge year and in the 2017 and 7
2018 test years. 8
9
In order to achieve its corporate goals, Hydro One is also in the process of devising new 10
approaches relating to serving its customers, forming its investment plans, and operating 11
and maintaining its assets, while maintaining a strong commitment to safety and the 12
environment. 13
14
The principles of the Board’s Renewed Regulatory Framework for Electricity 15
Distributors (“RRFE”) are consistent and directly aligned with Hydro One's aspirations. 16
Key areas of focus for Hydro One include ensuring that transmission services, capital 17
program execution, and customer operations are more efficient and effective, enhancing 18
the internal performance management culture, and strengthening relationships with key 19
stakeholders. The Transmission System Plan, summarized in Section 4 of this Exhibit, 20
reflects the alignment between Hydro One's values and business objectives with the 21
RRFE, as set out in Exhibit B1, Tab 1, Schedule 2 and in Table 1 below.22
Filed: 2016-05-31
EB-2016-0160
Exhibit A
Tab 3
Schedule 1
Page 4 of 25
Witness: Oded Hubert
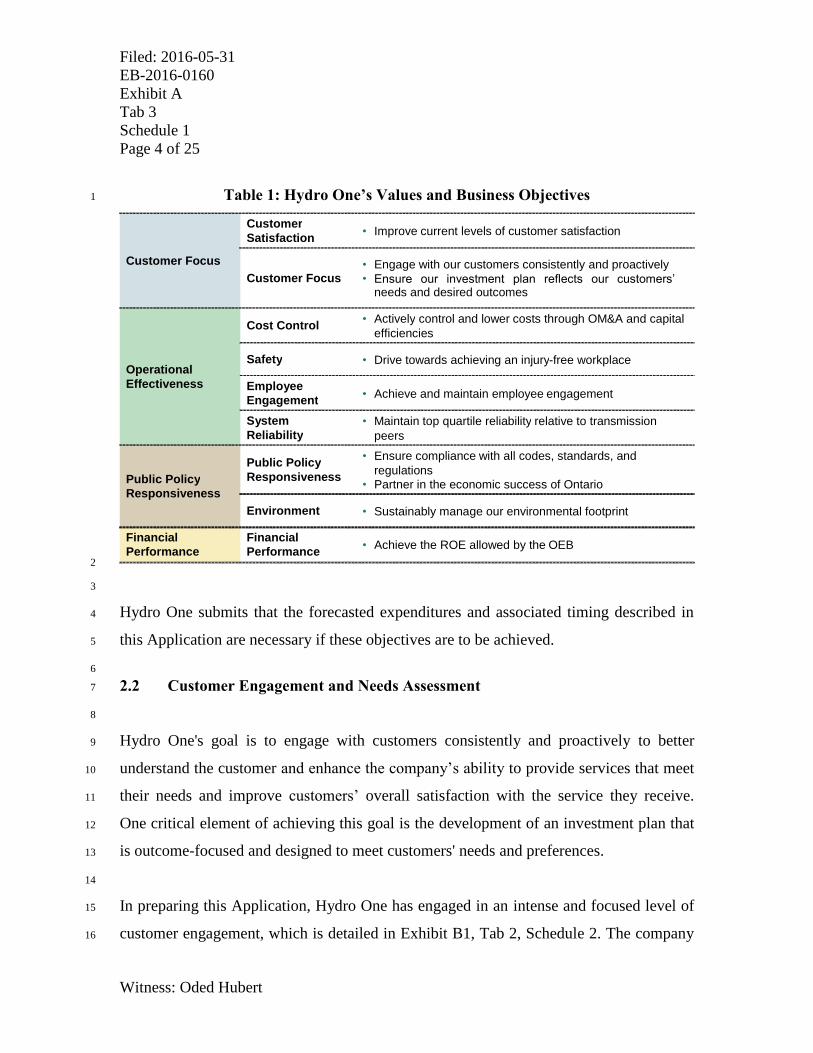
Table 1: Hydro One’s Values and Business Objectives 1
2
3
Hydro One submits that the forecasted expenditures and associated timing described in 4
this Application are necessary if these objectives are to be achieved. 5
6
2.2 Customer Engagement and Needs Assessment 7
8
Hydro One's goal is to engage with customers consistently and proactively to better 9
understand the customer and enhance the company’s ability to provide services that meet 10
their needs and improve customers’ overall satisfaction with the service they receive. 11
One critical element of achieving this goal is the development of an investment plan that 12
is outcome-focused and designed to meet customers' needs and preferences. 13
14
In preparing this Application, Hydro One has engaged in an intense and focused level of 15
customer engagement, which is detailed in Exhibit B1, Tab 2, Schedule 2. The company 16
Customer Focus
Customer Satisfaction • Improve current levels of customer satisfaction
Customer Focus • Engage with our customers consistently and proactively
• Ensure our investment plan reflects our customers’ needs and desired outcomes
Operational Effectiveness
Cost Control • Actively control and lower costs through OM&A and capital efficiencies
Safety • Drive towards achieving an injury - free workplace
Employee Engagement • Achieve and maintain employee engagement
System Reliability
• Maintain top quartile reliability relative to transmission peers
Public Policy Responsiveness
Public Policy Responsiveness
• Ensure compliance with all codes, standards, and regulations
• Partner in the economic success of Ontario
Environment • Sustainably manage our environmental footprint
Financial Performance
Financial Performance • Achieve the ROE allowed by the OEB

Filed: 2016-05-31
EB-2016-0160
Exhibit A
Tab 3
Schedule 1
Page 5 of 25
Witness: Oded Hubert
found the feedback from these sessions to be critical in understanding customer 1
preferences and being better able to identify customer needs. Customers indicated that the 2
consultations were valuable to them in understanding Hydro One's operations and 3
investment process. 4
5
Hydro One expects to continue to engage customers in the future, not only to receive 6
input to consider in the development of future investment plans, but also to receive 7
feedback and communicate key information about the system and investments that have 8
or are likely to impact transmission system reliability risk and actual system performance. 9
10
Based on Hydro One’s customer engagement process, the company believes that any 11
deterioration in current service levels is unacceptable to customers and that the 12
maintenance of current reliability levels is a customer priority. 13
14
2.3 Asset Needs Assessment 15
16
Based on Hydro One’s assessment of its transmission system, a significant portion of its 17
assets have deteriorated to the point where they pose a risk to its business objectives of 18
maintaining current levels of reliability and improving customer satisfaction. Detailed 19
information on Hydro One’s asset needs is provided in Exhibit B1, Tab 2, Schedules 4 to 20
6. 21
22
Hydro One continues to strike a careful balance between: (a) developing the transmission 23
system and building new infrastructure; (b) sustaining existing assets and maintaining the 24
health of the system; and (c) rate impacts on customers. Between 2009 and 2012, Hydro 25
One invested heavily in system development, in order to comply with government 26
policies related to the connection and integration of renewable energy generation and the 27
retirement of coal-fired generation. Since then, system development needs have declined 28

Filed: 2016-05-31
EB-2016-0160
Exhibit A
Tab 3
Schedule 1
Page 6 of 25
Witness: Oded Hubert
while system renewal needs have increased to the point of creating risk to current 1
reliability levels. 2
3
As described in Exhibit B1, Tab 2, Schedule 4, Hydro One has modified its asset 4
management approach to include reliability risk as a leading indicator of future 5
transmission system performance. Hydro One’s approach has been informed by the 6
development of this approach in other jurisdictions. This approach is new for Hydro 7
One, and the company intends to develop the reliability risk approach and refine its 8
application. 9
10
Reliability risk is a metric that is derived using a probabilistic calculation based on asset 11
demographics and the historical relationship between asset age and the occurrence of 12
failure or replacement. Reliability risk is used by Hydro One in its asset management 13
process to gauge the impact of its investments on future transmission system reliability. 14
It also provides a directional indicator to inform the appropriate level and pacing of 15
sustainment investments. The reliability risk model is not used to identify specific asset 16
needs and investments. Instead, these are determined by condition assessments and other 17
asset-specific information, as described in Exhibit B1, Tab 2, Schedule 5. 18
19
Table 2 below reflects the relative change in risk for each critical asset class and for the 20
system as a whole, as a result of 2017 and 2018 investments. With the planned 21
investments, overall reliability risk would improve (i.e. decline) by 2% by 2019. Without 22
the applied-for investments that are reflected in the 2017 and 2018 test years, overall 23
reliability risk would deteriorate by 10%. 24

Filed: 2016-05-31
EB-2016-0160
Exhibit A
Tab 3
Schedule 1
Page 7 of 25
Witness: Oded Hubert
Table 2: Relative Change in Reliability Risk 1
Relative Change in
Risk from Jan. 1, 2017 to Dec.
31, 2018, as per proposed
investment
Relative Change in
Risk from Jan. 1, 2017 to
Dec. 31, 2018, without
investment
% of
Interruption
Duration*
Lines -2% 11% 69%
Transformers -9% 14% 9%
Breakers 1% 17% 6%
Other1 - - 16%
Total*
-2% 10%
* Total is calculated by weighting the change in risk by the asset class' contribution to interruption duration. 2
3
In addition to incorporating customer feedback and new information on system reliability 4
risk, Hydro One also considered and incorporated the results of a total cost benchmarking 5
study into the development of its Transmission System Plan (Exhibit B1, Tabs 1 to 4 of 6
this Application). The study found that Hydro One’s historical capital spending levels 7
were significantly below median in its peer group. For the purposes of developing its 8
investment plan, Hydro One used the total cost benchmarking study as a reference tool to 9
further validate the proposed increases in spending associated with its Transmission 10
System Plan. Based on the results of the report and Hydro One’s investment proposal, 11
the 2017 and 2018 total expenses (capital expenditures and OM&A) will still remain at or 12
below median levels relative to the company’s peer group. 13
1 Represents all other assets; risk is assumed to be flat over the investment planning horizon for these
assets

Updated: 2016-07-20
EB-2016-0160
Exhibit A
Tab 3
Schedule 1
Page 8 of 25
Witness: Oded Hubert
3. FINANCIAL SUMMARY 1
2
3.1 Revenue Requirement 3
4
A comparative profile of the annual rates revenue requirement build-up from 2016, the 5
last Board-approved rate year, to 2018 is provided in Table 3, along with references to 6
the Exhibits in the Application that discuss each cost component. 7
8
Table 3: Revenue Requirement ($ Millions) 9
Comparison of Rates Revenue Requirement
Board -
approved
2016
2017 2018 Exhibit
Reference
OM&A 436.7 413.1 411.2 C2-1-1
Depreciation 397.3 435.7 470.7 C2-3-1
Income Taxes 72.2 81.3 90.4 C2-4-1
Cost of Capital 661.5 676.1 714.9 D2-4-1
Total Revenue Requirement 1,567.6 1,606.3 1,687.2 E2-1-1
Deduct External Revenues (32.2) (28.2) (28.5) E1-2-1
Revenue Requirement less External Revenues 1,535.4 1,578.1 1658.7
Deduct Export Revenue Credit (31.7) (39.2) (40.1) H1-4-1
Deduct Regulatory Accounts Disposition (36.1) (47.8) (47.8) F1-1-3
Add Low Voltage Switch Gear 13.0 14.0 14.7 G1-3-1
Rates Revenue Requirement 1,480.7 1,505.1 1,585.6
Rate Increase Required, excl. Load
1.6% 5.4%
Estimated Load Impact
2.1% 0.0% E1-3-1
Rate Increase Required
3.7% 5.4%
10
The increase in total rates revenue requirement is largely attributable to the impact of rate 11
base growth, as reflected in the increase in depreciation and the return on capital. Higher 12
income taxes and lower external revenues also contribute to the difference. These are 13
partially offset by a lower cost of debt, lower OM&A costs, increased regulatory account 14
disposition, and a higher export revenue credit as described in Exhibit E1, Tab 1, 15
Schedule 1 .16

Filed: 2016-05-31
EB-2016-0160
Exhibit A
Tab 3
Schedule 1
Page 9 of 25
Witness: Oded Hubert
3.2 Budgeting Assumptions 1
2
In developing its investment plan, Hydro One assumed 2.0% annual inflation and cost 3
escalators for construction and OM&A expense growth of 2.3% and 1.3%, respectively, 4
in 2017 and of 2.5% and 1.6% in 2018. These assumptions are explained in further detail 5
in Exhibit B1, Tab 2, Schedule 7. 6
7
3.3 Load Forecast Summary 8
9
Table 4 sets out Hydro One’s 2017-2018 transmission system load forecast, which 10
includes the impact of conservation and demand management and embedded generation. 11
12
Table 4: Hydro One’s 2017-2018 Load Forecast (12-Month Average Peak in MW) 13
Ontario Demand
Hydro One Rate Categories
(Charge Determinants)
Network
Connection
Line
Connection
Transformation
Connection
2017 20,373 20,405 19,741 16,872
2018 20,378 20,410 19,746 16,876
Comparison to Board-approved Forecast for 2016
2017 -2.6% -1.9% -2.1% -2.6%
2018 -2.6% -1.9% -2.1% -2.6%
14
The forecast was developed using the econometric and end-use approaches described in 15
Exhibit E1, Tab 3, Schedule 1. The forecast base year was corrected for abnormal 16
weather conditions, and growth rates were applied to the normalized base year value. 17
Consistent with the IESO’s approach, normal weather data is based on the average 18
weather conditions experienced over the last 31 years. 19

Filed: 2016-05-31
EB-2016-0160
Exhibit A
Tab 3
Schedule 1
Page 10 of 25
Witness: Oded Hubert
4. TRANSMISSION SYSTEM PLAN 1
2
Hydro One’s Transmission System Plan is set out in Exhibit B1, Tabs 1 to 4. 3
4
The proposed five-year capital plan reflects Hydro One's understanding of the 5
investments required to meet the reliability needs, risk tolerance, and power quality needs 6
of its customers. Hydro One expects the plan to result in several key outcomes for Hydro 7
One and its customers: 8
9
Mitigation of risk arising from aging and deteriorating assets; 10
Creation of conditions that enable Hydro One to continue to provide first quartile 11
reliability in a safe manner to its customers; 12
Avoidance of larger capital replacement costs by extending asset life, where feasible; 13
Ensured compliance with regulatory, environmental and reliability standards; and 14
Drive towards an injury-free workplace. 15
16
To achieve these outcomes, Hydro One has shifted the balance of capital investment 17
towards sustainment capital, with a focus on lines investments. The company has also 18
approached the timing and pacing of investments with a long-term view. In its previous 19
transmission revenue requirement application for the 2015-2016 period, the company had 20
put forth a sustainment capital program that began to address the need for higher 21
sustainment investments, by focusing on stations assets in poor condition that were a 22
significant driver of reliability performance. Since its last filing, Hydro One has focused 23
on developing an improved understanding and knowledge of the condition of its 24
transmission system. 25
26
The company has gained additional knowledge through the ongoing testing of critical 27
assets and expansion of the scope of condition assessments, combined with information 28

Filed: 2016-05-31
EB-2016-0160
Exhibit A
Tab 3
Schedule 1
Page 11 of 25
Witness: Oded Hubert
collected about the actual performance (including failures) of individual assets. Hydro 1
One has also been developing a greater understanding of how equipment unavailability, 2
due to condition and demographics, is a leading indicator of future reliability issues, 3
contributing to higher reliability risk. As a result of these efforts, Hydro One is 4
continuing to prioritize asset replacements with a goal of maintaining top quartile 5
reliability and reducing reliability risk on the system. 6
7
Hydro One has relied on maintenance programs to extend the lifespan of assets by 8
addressing asset condition deficiencies, where practical, as a means of deferring large 9
capital expenditures. As a result, many assets are being operated beyond their expected 10
service life.2 Although this approach defers capital investments, it increases maintenance 11
costs and the risk that assets will fail, deteriorate significantly, or become obsolete as 12
spare parts and manufacturer support become unavailable. Recent examples of this 13
manifest risk include equipment failures in 2015 and 2016 at Elgin TS, Horning TS, 14
Bridgman TS, and Frontenac TS. 15
16
As a result of its recent efforts to invest in the sustainment of stations assets, Hydro One 17
has made significant strides in stabilizing the reliability risk from its stations assets. 18
However, lines assets have continued to deteriorate and are now contributing to a larger 19
proportion of the system’s reliability risk. Hydro One expects to transition to placing a 20
greater emphasis on lines-related sustainment investments (beginning in 2018) while 21
maintaining a prudent level of stations investment in order to continue to mitigate risk. 22
23
2 Expected service life: the average time in years that an asset can be expected to operate under normal system
conditions
Filed: 2016-05-31
EB-2016-0160
Exhibit A
Tab 3
Schedule 1
Page 12 of 25
Witness: Oded Hubert
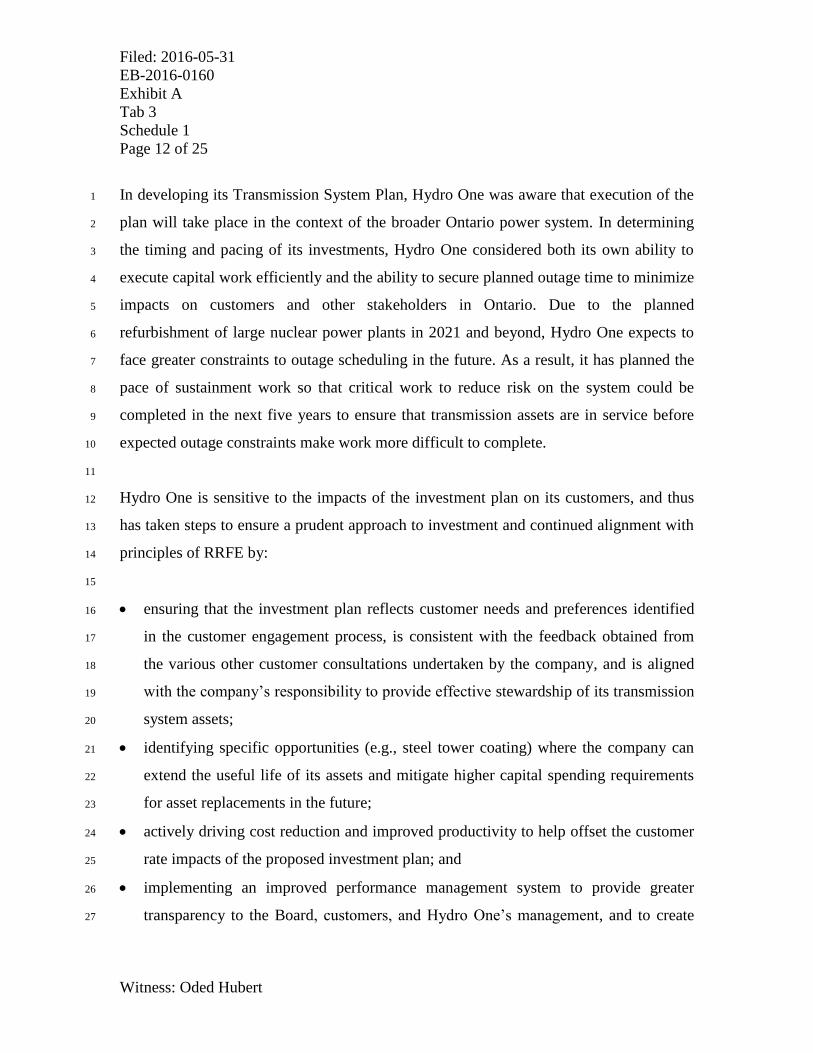
In developing its Transmission System Plan, Hydro One was aware that execution of the 1
plan will take place in the context of the broader Ontario power system. In determining 2
the timing and pacing of its investments, Hydro One considered both its own ability to 3
execute capital work efficiently and the ability to secure planned outage time to minimize 4
impacts on customers and other stakeholders in Ontario. Due to the planned 5
refurbishment of large nuclear power plants in 2021 and beyond, Hydro One expects to 6
face greater constraints to outage scheduling in the future. As a result, it has planned the 7
pace of sustainment work so that critical work to reduce risk on the system could be 8
completed in the next five years to ensure that transmission assets are in service before 9
expected outage constraints make work more difficult to complete. 10
11
Hydro One is sensitive to the impacts of the investment plan on its customers, and thus 12
has taken steps to ensure a prudent approach to investment and continued alignment with 13
principles of RRFE by: 14
15
ensuring that the investment plan reflects customer needs and preferences identified 16
in the customer engagement process, is consistent with the feedback obtained from 17
the various other customer consultations undertaken by the company, and is aligned 18
with the company’s responsibility to provide effective stewardship of its transmission 19
system assets; 20
identifying specific opportunities (e.g., steel tower coating) where the company can 21
extend the useful life of its assets and mitigate higher capital spending requirements 22
for asset replacements in the future; 23
actively driving cost reduction and improved productivity to help offset the customer 24
rate impacts of the proposed investment plan; and 25
implementing an improved performance management system to provide greater 26
transparency to the Board, customers, and Hydro One’s management, and to create 27

Filed: 2016-05-31
EB-2016-0160
Exhibit A
Tab 3
Schedule 1
Page 13 of 25
Witness: Oded Hubert
confidence that targeted work is completed in an efficient manner, while delivering 1
the promised outcomes for Hydro One’s customers. 2
3
As further described in Exhibit B1, Tab 3, Schedule 1, Hydro One’s capital expenditure 4
forecast for 2017 is $1,076 million for 2017 and $1,122 million for 2018. Table 5 5
summarizes the capital investment plan. 6
7
Table 5: Summary of Transmission Capital Budget ($ Millions) 8
Including Capitalized
Overheads and
Interest Capitalized*
Historic Bridge
Year Test Years Forecast
Description 2012 2013 2014 2015 2016 2017 2018 2019 2020 2021
Sustaining 389.3 480.0 621.3 694.3 724.3 776.8 842.1 825.7 915.2 1118.1
Development 329.4 171.7 131.6 166.0 166.0 196.4 170.2 244.0 254.0 258.3
Operations 15.2 17.7 28.4 15.6 30.1 25.4 30.8 58.8 21.1 24.7
Common Corporate
Costs Capital 42.1 49.1 63.4 67.1 83.5 77.6 79.1 79.1 78.2 73.8
Total 776.0 718.5 844.6 943.0 1003.8 1076.1 1122.2 1207.5 1268.6 1474.9
*Includes Allowed Funds Used During Construction. 9
10
A key area of focus for the Transmission System Plan is ensuring that transmission 11
services and capital work execution are more efficient and effective. This is discussed in 12
Exhibit B1, Tab 4, Schedule 1. 13
14
5. RATE BASE 15
16
Exhibit D1, Tab 1, Schedule 1 provides the details of the derivation of the requested rate 17
base figures for the test years. Table 6 summarizes this request. 18
Filed: 2016-05-31
EB-2016-0160
Exhibit A
Tab 3
Schedule 1
Page 14 of 25
Witness: Oded Hubert
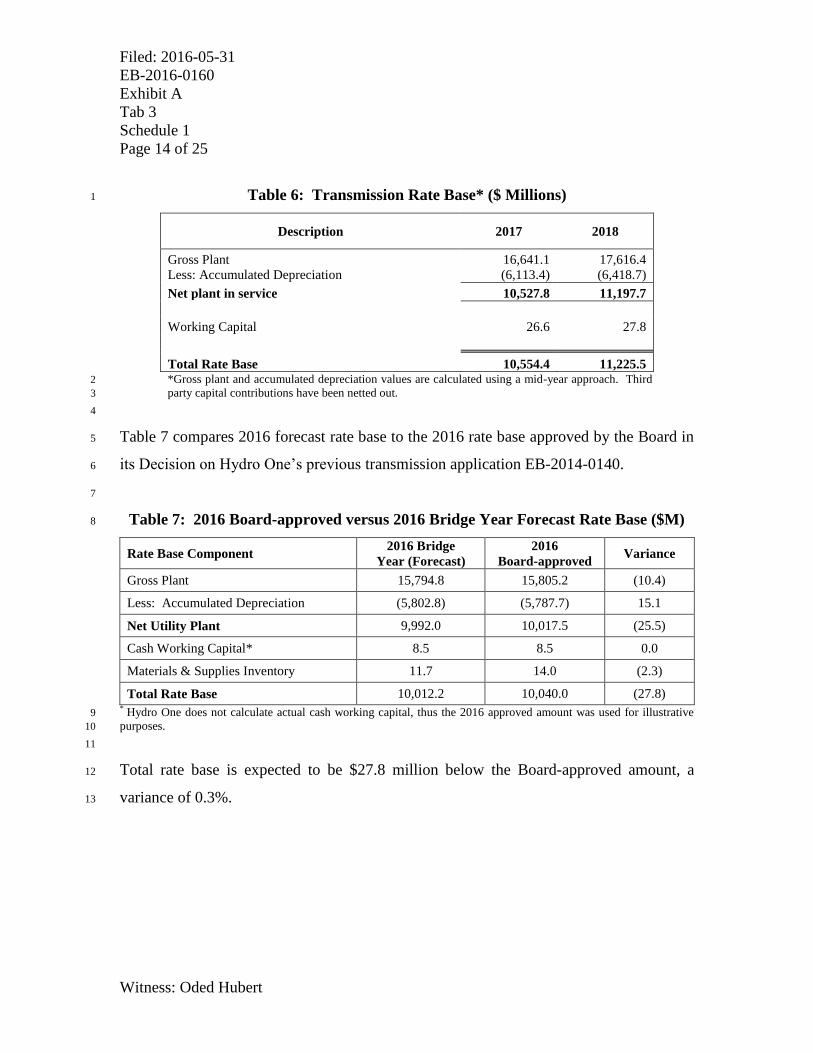
Table 6: Transmission Rate Base* ($ Millions) 1
Description 2017 2018
Gross Plant 16,641.1 17,616.4
Less: Accumulated Depreciation (6,113.4) (6,418.7)
Net plant in service 10,527.8 11,197.7
Working Capital 26.6 27.8
Total Rate Base 10,554.4 11,225.5 *Gross plant and accumulated depreciation values are calculated using a mid-year approach. Third 2
party capital contributions have been netted out. 3
4
Table 7 compares 2016 forecast rate base to the 2016 rate base approved by the Board in 5
its Decision on Hydro One’s previous transmission application EB-2014-0140. 6
7
Table 7: 2016 Board-approved versus 2016 Bridge Year Forecast Rate Base ($M) 8
Rate Base Component 2016 Bridge
Year (Forecast)
2016
Board-approved Variance
Gross Plant 15,794.8 15,805.2 (10.4)
Less: Accumulated Depreciation (5,802.8) (5,787.7) 15.1
Net Utility Plant 9,992.0 10,017.5 (25.5)
Cash Working Capital* 8.5 8.5 0.0
Materials & Supplies Inventory 11.7 14.0 (2.3)
Total Rate Base 10,012.2 10,040.0 (27.8) * Hydro One does not calculate actual cash working capital, thus the 2016 approved amount was used for illustrative 9
purposes. 10
11
Total rate base is expected to be $27.8 million below the Board-approved amount, a 12
variance of 0.3%. 13

Filed: 2016-05-31
EB-2016-0160
Exhibit A
Tab 3
Schedule 1
Page 15 of 25
Witness: Oded Hubert
6. PERFORMANCE AND REPORTING 1
2
Hydro One’s new executive leadership and Board of Directors are committed to building 3
a stronger performance management culture and are focused on achieving excellence in 4
execution in all aspects of the company’s work. The ability to measure and track 5
performance is essential to this vision. 6
7
Two critical elements of the journey towards stronger performance culture are: (i) the 8
development of a scorecard; and (ii) the selection of key performance indicators that 9
measure the drivers of the company’s performance and track productivity improvements. 10
11
Exhibit B2, Tab 1, Schedule 1 discusses the cost efficiencies, productivity improvements 12
and key performance indicators (“KPIs”) that Hydro One is implementing to ensure that 13
its business objectives are aligned with the principles of the RRFE. 14
15
In Exhibit B2, Tab 1, Schedule 1, Hydro One has provided a performance scorecard that 16
will track its performance in areas directly tied to its own business objectives, which are 17
aligned with those of the RRFE. The metrics contained in the scorecard will provide the 18
Board and stakeholders visibility into how the company performs in a variety of areas, 19
including cost control. The proposed scorecard is replicated in Table 8. 20

Filed: 2016-05-31
EB-2016-0160
Exhibit A
Tab 3
Schedule 1
Page 16 of 25
Witness: Oded Hubert
Table 8: Proposed Transmission Scorecard 1
RRFE
Principle Category Metric Definition
Customer
Focus
Service Quality
Satisfaction with Outage Planning Procedures % satisfied in OGCC survey
Customer Delivery Point Performance Standards Outliers
(as % of total delivery points) % of total delivery points designated as outliers
Customer
Satisfaction Overall % satisfied in corporate survey
Transmission customers (Industrial, Generators,
LDC) only
Operational
Effectiveness
Safety # of recordable incidents per 200,000 hours Average # of incidents per 200K hours
System
Reliability
Average. # of sustained interruptions per delivery point T-SAIFI-S
Average # of momentary interruptions per delivery point T-SAIFI-M
Average minutes that power to a delivery point is interrupted T-SAIDI
System unavailability (%) % of system not available for use
Unsupplied energy (minutes) Unsupplied MW-minutes/Peak MW
Asset
Management
In-service additions as % of OEB-approved plan $ ISA as percentage of Planned $ Amounts
Capital expenditures as % of Budget $ Capital expenditures as % of Budgeted $ Capital
expenditures
Cost Control
Total OM&A and Capital expenditures/Gross fixed asset value OM&A and Capital expenditures/ Gross fixed
assets
Sustainment capital /Gross fixed asset value Sustainment Capital expenditures/ Gross fixed
assets
OM&A/Gross fixed asset value OM&A/ Gross fixed assets
Policy Response Renewables % of new connection impact assessments completed on time Total assessments completed within expected
time/Total connections requested

Filed: 2016-05-31
EB-2016-0160
Exhibit A
Tab 3
Schedule 1
Page 17 of 25
Witness: Oded Hubert
Regulatory
Compliance
NERC & NPCC Standards Compliance – High impact issues
# of high impact compliance violations as defined
by NERC/NPCC
NERC & NPCC Standards Compliance – Medium/low impact
issues
# of medium/low impact compliance violations as
defined by NERC/NPCC
Regional
Infrastructure Regional Infrastructure Planning progress - % Deliverables met Total deliverables met/Total deliverables expected
Financial
Performance
Leverage Debt to Equity Ratio Debt (including Short &Long Term)/ Equity
Liquidity Current Ratio (Current Assets/Current Liabilities) Current Assets/Current Liabilities
Profitability Return on Equity (deemed) Included in rates
Return on Equity (achieved) Actual return on equity
1
Updated: 2016-07-20
EB-2016-0160
Exhibit A
Tab 3
Schedule 1
Page 18 of 25
Witness: Oded Hubert
Exhibit B1, Tab 1, Schedule 3 provides Hydro One’s performance data relating to three 1
of its business objectives: safety, customer satisfaction and reliability. 2
3
7. OPERATIONS, MAINTENANCE AND ADMINISTRATION (OM&A) 4
EXPENSE 5
6
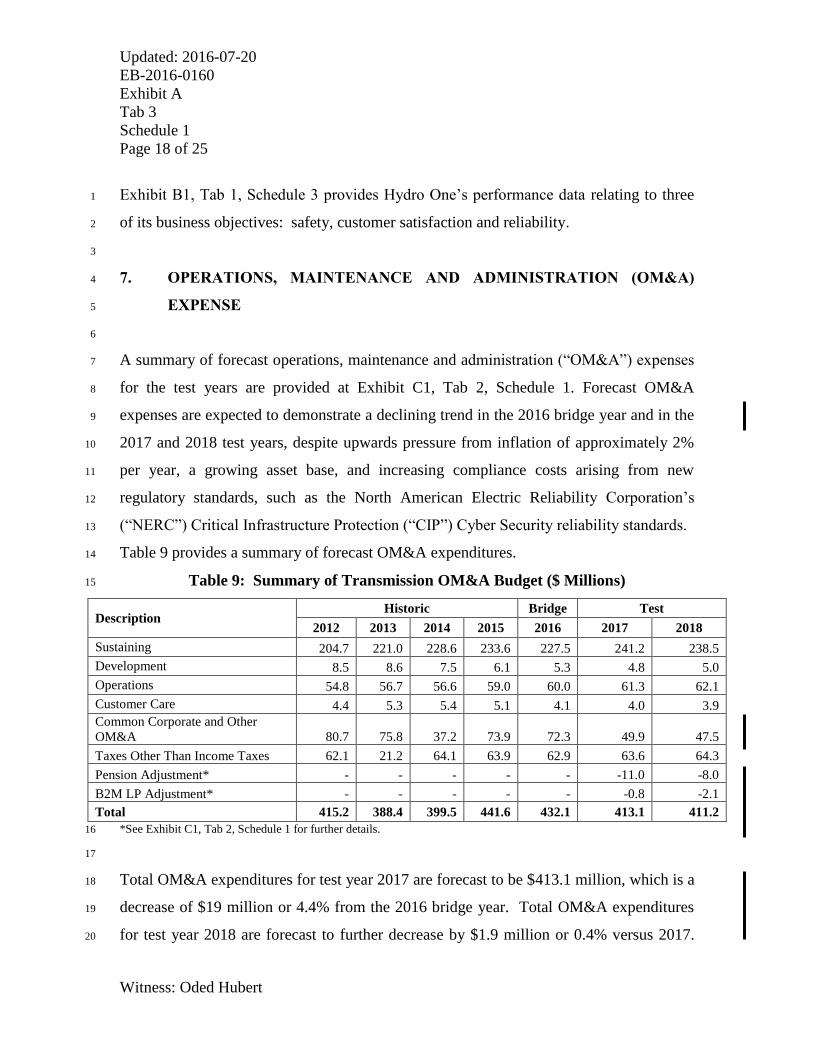
A summary of forecast operations, maintenance and administration (“OM&A”) expenses 7
for the test years are provided at Exhibit C1, Tab 2, Schedule 1. Forecast OM&A 8
expenses are expected to demonstrate a declining trend in the 2016 bridge year and in the 9
2017 and 2018 test years, despite upwards pressure from inflation of approximately 2% 10
per year, a growing asset base, and increasing compliance costs arising from new 11
regulatory standards, such as the North American Electric Reliability Corporation’s 12
(“NERC”) Critical Infrastructure Protection (“CIP”) Cyber Security reliability standards. 13
Table 9 provides a summary of forecast OM&A expenditures. 14
Table 9: Summary of Transmission OM&A Budget ($ Millions) 15
Description Historic Bridge Test
2012 2013 2014 2015 2016 2017 2018
Sustaining 204.7 221.0 228.6 233.6 227.5 241.2 238.5
Development 8.5 8.6 7.5 6.1 5.3 4.8 5.0
Operations 54.8 56.7 56.6 59.0 60.0 61.3 62.1
Customer Care 4.4 5.3 5.4 5.1 4.1 4.0 3.9
Common Corporate and Other
OM&A 80.7 75.8 37.2 73.9 72.3 49.9 47.5
Taxes Other Than Income Taxes 62.1 21.2 64.1 63.9 62.9 63.6 64.3
Pension Adjustment* - - - - - -11.0 -8.0
B2M LP Adjustment* - - - - - -0.8 -2.1
Total 415.2 388.4 399.5 441.6 432.1 413.1 411.2
*See Exhibit C1, Tab 2, Schedule 1 for further details. 16
17
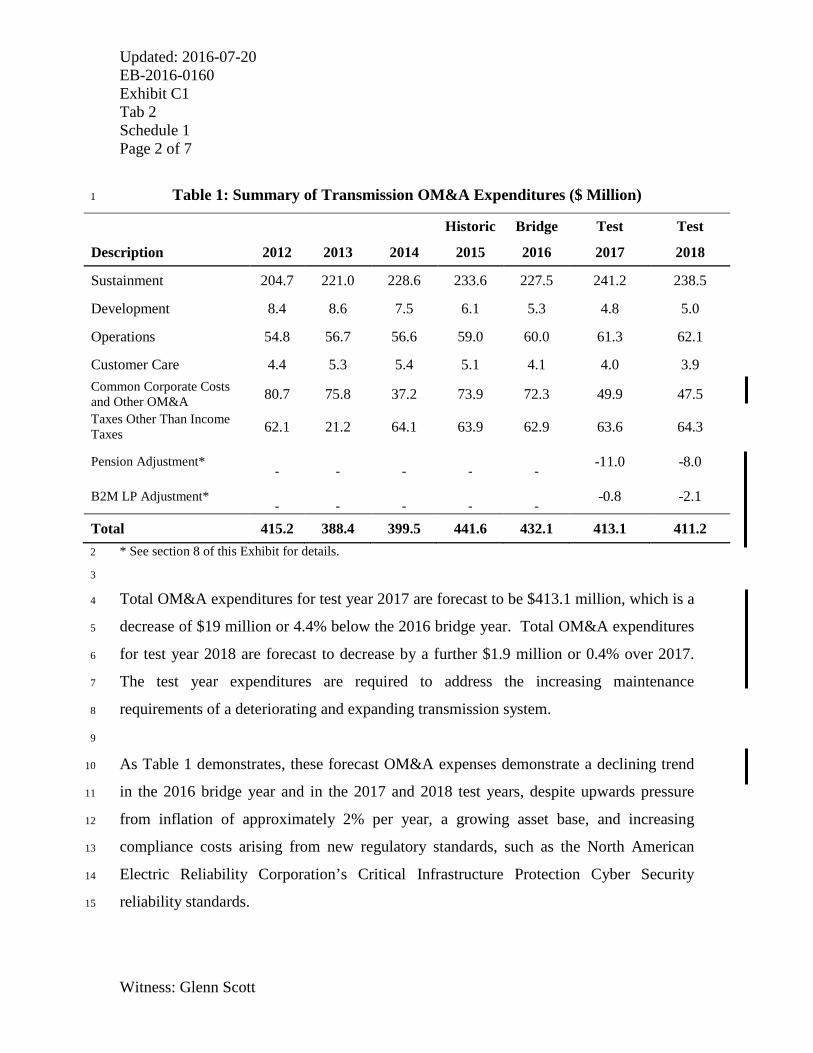
Total OM&A expenditures for test year 2017 are forecast to be $413.1 million, which is a 18
decrease of $19 million or 4.4% from the 2016 bridge year. Total OM&A expenditures 19
for test year 2018 are forecast to further decrease by $1.9 million or 0.4% versus 2017. 20

Filed: 2016-05-31
EB-2016-0160
Exhibit A
Tab 3
Schedule 1
Page 19 of 25
Witness: Oded Hubert
The test year expenditures are required to address the increasing maintenance 1
requirements of a deteriorating, but expanding transmission system. 2
3
Table 10 compares 2016 projected costs to the 2016 OM&A expenditures approved by 4
the Board in its Decision on Hydro One’s previous transmission application in EB-2014-5
0140. 6
7
Table 10: 2016 Board-approved versus 2016 Projected OM&A Expenditures 8
OM&A Categories
2016 Board-
approved
($ Millions)
2016 Projected
($ Millions)
Variance
($ Millions)*
Sustaining 241.1 227.5 -13.6
Development 13.4 5.3 -8.1
Operations 59.1 60.0 0.9
Customer Care 5.5 4.1 -1.4
Common Corporate & Other Costs 71.3 72.3 1.0
Taxes Other Than Income Taxes 67.0 62.9 -4.1
Less settlement reduction -20.0
Exclusion of B2M -0.7
Total OM&A 436.7 432.1 -4.6
*Total Variance is not the sum of changes noted. 9
10
Hydro One’s projected 2016 OM&A costs are $4.6 million lower or 1.1% below Board-11
approved levels. The Board-approved amounts include the $20.0 million reduction 12
negotiated in the EB-2014-0140 settlement agreement. Most areas were meaningfully 13
below target including Sustaining, Development and Taxes Other Than Income Taxes. 14
15
Details of Hydro One’s corporate staffing and compensation are provided at Exhibit C1, 16
Tab 4, Schedule 1. As noted at Exhibit C1, Tab 4, Schedule 2, Hydro One has engaged 17
Willis Towers Watson to prepare an actuarial valuation report relating to Hydro One’s 18

Filed: 2016-05-31
EB-2016-0160
Exhibit A
Tab 3
Schedule 1
Page 20 of 25
Witness: Oded Hubert
defined benefit pension plan as at December 31, 2015. Although the report was not 1
finalized as of the date of filing this Application, Hydro One expects the final valuation to 2
be available at the end of June 2016. In addition to the changes in employee contribution 3
rates, the valuation will also reflect updated investment returns, changes in employee 4
benefits, and updated actuarial assumptions. It is anticipated that the valuation will 5
demonstrate a further reduction in Hydro One’s pension contribution operating expenses. 6
To ensure that Hydro One’s rates for the 2017 and 2018 test years reflect the anticipated 7
reduction in costs, Hydro One will submit an update to this Application to reflect the 8
actual changes shortly after the final valuation is received. 9
10
8. COST OF CAPITAL 11
12
Table 11 summarizes the cost of capital parameters reflected in the Application, details of 13
which can be found at Exhibit D1, Tab 4, Schedule 1. 14
15
Table 11: Cost of Capital 16
Comparison of Cost of Capital
and Rate Base
Board-approved
2016 2017 2018
Exhibit
Reference
Cost of Debt 4.77% 4.48% 4.42% D2-4-2
Cost of Equity 9.19% 9.19% 9.19% D2-4-1
Total Debt ($Millions) 6,024.0 6,332.6 6,735.3
Total Equity ($Millions) 4,016.0 4,221.7 4,490.2
Rate Base ($ Millions) 10,040.0 10,554.3 11,225.5 D2-1-1
Weighted Average Cost of Capital 6.4% 6.3%
17
Hydro One’s deemed capital structure for transmission ratemaking purposes is 60% debt 18
and 40% common equity. The 60% deemed debt component is comprised of 4% short-19
term debt and 56% long-term debt. Hydro One will continue to use the Board’s cost of 20
capital parameters for its deemed short-term debt rate and return on equity, consistent 21
with the Board’s report on cost of capital.22

Updated: 2016-07-20
EB-2016-0160
Exhibit A
Tab 3
Schedule 1
Page 21 of 25
Witness: Oded Hubert
Hydro One’s Application reflects a return on equity of 9.19% for each of the 2017 and 1
2018 test years, based on the cost of capital parameters released by the Board on October 2
15, 2015, for rates effective January 1, 2016. Hydro One will update the return on equity 3
and the cost of short-term debt annually in accordance with the Board’s formulaic 4
approach for the purpose of establishing the final revenue requirements for both 2017 and 5
2018. 6
7
Hydro One also proposes to use and update annually its own actual forecast weighted 8
average long-term debt rate, which is market-determined, consistent with its past Board-9
approved practice (EB-2012-0031, EB-2014-0140) for the purpose of establishing the 10
final revenue requirement for both 2017 and 2018 test years. 11
12
9. COST ALLOCATION AND RATE DESIGN 13
14
Hydro One continues to follow the Board-approved methodology (EB-2014-0140), for 15
allocating its transmission rates revenue requirement into three rate pools, Network, Line 16
Connection, Transformation Connection, as set out in in Exhibits G1, Tab 1, Schedule 1 17
through Exhibit G1, Tab 3, Schedule 1 and summarized in Table 12. 18
19
The rate pools are based on functional categories of assets and their associated costs. 20
Rates revenue requirement is apportioned amongst the rate pools using direct assignment, 21
to the extent possible. 22
23
Table 12: Summary of Rates Revenue Requirement by Rate Pool ($ Millions) 24
Revenue
Requirement
(Year)
Network Line
Connection
Transformation
Connection Total
2017 853.4 214.3 437.1 1,504.7
2018 898.9 226.4 460.0 1,585.3
25

Filed: 2016-05-31
EB-2016-0160
Exhibit A
Tab 3
Schedule 1
Page 22 of 25
Witness: Oded Hubert
10. DEFERRAL AND VARIANCE ACCOUNTS 1
2
Hydro One requests the continuation over the test years of the following regulatory 3
accounts, as described in Exhibit F1, Tab 1, Schedule 1: 4
5
Excess Export Service Revenue; 6
External Secondary Land Use Revenue; 7
External Station Maintenance, E&CS Revenue and Other Revenue; 8
Tax Rate Changes; 9
Rights Payments; 10
Pension Cost Differential; 11
East West Tie Deferral Account – Incumbent Transmitter; 12
Long-Term Transmission Future Corridor Acquisition and Development Account; 13
North West Bulk Transmission Line Account; 14
Supply to Essex County Transmission Reinforcement Account; 15
External Revenue – Partnership Transmission Projects Account; and 16
In-Service Capital Additions Variance Account. 17
18
Hydro One requests the discontinuation of the Local Distribution Company Conservation 19
and Demand Management and Demand Response Variance Account, which was 20
established pursuant to a settlement agreement approved by the Board in proceeding EB-21
2012-0031, as Hydro One has fulfilled its related obligations. 22
23
Hydro One is requesting disposition of the actual audited regulatory account values as at 24
December 31, 2015, plus forecast interest improvement accrued in 2016, on the principal 25
balances as at December 31, 2015 less any amounts approved for disposition in 2016 by 26

Filed: 2016-05-31 EB-2016-0160 Exhibit A Tab 3 Schedule 1 Page 23 of 25
Witness: Oded Hubert
the Board in the EB-2014-0140 rate filing for transmission rate years 2015 and 2016 as 1
described in Exhibit F1, Tab 1, Schedule 3. 2
3
It is expected that new transmission rates will be effective and implemented on January 4
1, 2017 and that disposition of the accounts requested will commence on that date. 5
6
Hydro One's requested reduction to the revenue requirement of $95.6 million over 2017 7
and 2018 is detailed in Table 13. 8
9
Table 13: Transmission Disposition of Regulatory Account Balances ($ Millions) 10
Description
Forecast Balance
as at Dec 31, 2016 ($ Millions)
Excess Export Service Revenue (18.5) External Secondary Land Use Revenue (26.7) External Station Maintenance and E&CS Revenue 0.7 Tax Rate Changes 0.1 Rights Payments (3.0) Pension Cost Differential 6.0 Long-Term Transmission Future Corridor Acquisition and Development 0.6
CDM Variance Account (54.0) External Revenue – Partnership Transmission Projects Account (0.9) Total Regulatory Accounts for Approval (95.6)
11
12

Updated: 2016-07-20
EB-2016-0160
Exhibit A
Tab 3
Schedule 1
Page 24 of 25
Witness: Oded Hubert
10.1 Bill Impacts 1
2
Exhibit H1, Tab 5, Schedule 1 provides the bill impacts that would result from approval 3
of this Application. Table 14 shows the average bill impacts of the proposed changes in 4
transmission revenue requirement and load forecast in 2017 and 2018. 5
6
Table 14: Average Bill Impacts on Transmission and 7
Distribution-Connected Customers 8
2016 2017 2018
Rates Revenue Requirement ($ millions)* 1,480.5 1,504.7 1,585.3
% Increase in Rates RR over prior year 1.6% 5.4%
% Impact of load forecast change 2.1% 0.0%
Net Impact on Average Transmission Rates 3.7% 5.4%
Transmission as a % of Tx-connected customer’s total bill 8.3% 8.3%
Estimated Average Bill impact 0.3% 0.4%
Transmission as a % of Dx -connected customer’s total bill 6.8% 6.8%
Estimated Average Bill Impact 0.3% 0.4% * This amount is net of the $0.3 million in wholesale meter service revenue which accounts for the difference when 9
comparing to the total rates revenue requirement shown in Exhibit E1, Tab 1, Schedule 1. 10
11
The total bill impact for Hydro One medium density residential (R1) customers 12
consuming 350 kWh, 750 kWh and 1800 kWh monthly is determined based on the 13
forecast increase in the customer’s Retail Transmission Service Rates (“RTSR”) as 14
detailed below in Table 15. 15
16

Updated: 2016-07-20
EB-2016-0160
Exhibit A
Tab 3
Schedule 1
Page 25 of 25
Witness: Oded Hubert
Table 15: Medium Density (R1) Residential Customer Bill Impacts 1
Typical R1 Residential Customer
350 kWh 750 kWh 1800 kWh
Total Bill as of Jan 1, 2016* $ 102.95 $ 179.37 $ 379.98
RTSR included in 2016 R1 Customer's Bill $ 4.37 $ 9.36 $ 22.47
Estimated 2017 Monthly RTSR** $ 4.52 $ 9.69 $ 23.26
2017 Increase in Monthly Bill $ 0.15 $ 0.33 $ 0.79
2017 increase as a % of total bill 0.1% 0.2% 0.2%
Estimated 2018 Monthly RTSR** $ 4.75 $ 10.18 $ 24.44
2018 Increase in Monthly Bill $ 0.23 $ 0.49 $ 1.18
2018 increase as a % of total bill 0.2% 0.3% 0.3% * Total bill including HST, based on time-of-use RPP commodity pricing and 2016 distribution rates approved per 2
Distribution Rate Order EB-2015-0079. 3 ** The impact on RTSR is assumed to be the net impact on average transmission rates, adjusted for Hydro One's 4
revenue disbursement allocator per approved 2016 UTRs per EB-2015-0311. 5
6
The total bill impact for a typical Hydro One general service energy less than 50 kW 7
(“GSe < 50 kW”) customer consuming 1000 kWh, 2000 kWh and 15,000 kWh monthly 8
is determined based on the forecast increase in the customer’s RTSR as detailed below in 9
Table 16. 10
11
Table 16: Typical General Service Energy less than 50 kW 12
(GSe < 50 kW) Customer Bill Impacts 13
GSe Customer Monthly Bill
1,000 kWh 2,000 kWh 15,000 kWh
Total Bill as of Jan 1, 2016* $ 262.79 $ 492.00 $ 3,471.80
RTSR included in 2016 GSe Customer's Bill $ 10.19 $ 20.39 $ 152.89
Estimated 2017 Monthly RTSR**
$ 10.55 $ 21.11 $ 158.29
2017 increase in Monthly Bill $ 0.36 $ 0.72 $ 5.40
2017 increase as a % of total bill 0.1% 0.1% 0.2%
Estimated 2018 Monthly RTSR**
$ 11.09 $ 22.18 $ 166.32
2018 increase in Monthly Bill $ 0.53 $ 1.07 $ 8.02
2018 increase as a % of total bill 0.2% 0.2% 0.2% * Total bill including HST, based on time-of-use RPP commodity pricing and 2016 distribution rates approved per 14
Distribution Rate Order EB-2015-0079. 15 ** The impact on RTSR is assumed to be the net impact on average transmission rates, adjusted for Hydro One's 16
revenue disbursement allocator per approved 2016 UTRs per EB-2015-0311. 17

Updated: 2016-07-20 EB-2016-0160 Exhibit A Tab 7 Schedule 2 Page 1 of 1
Witness: Samir Chhelavda
HYDRO ONE NETWORKS INC. TRANSMISSION PRO FORMA 1
STATEMENT OF INCOME BRIDGE YEAR (2016) AND TEST 2
YEARS (2017 AND 2018) 3
Line No.
Particulars
2016
2017
2018
(a)
(b)
(c)
Revenues
1
Retail power & energy
1,505
1,581
1,661 2
Commodity flow-through
-
-
-
3
LV
-
-
- 4
Other
28
28
28
5
1,533
1,609
1,689
Costs
6
OM&A
436
419
415 7
Cost of power
-
-
-
8
Depreciation
387
436
471 9
Capital tax
-
-
-
10
823
854
885
11
Earnings before interest and income tax
710
755
804
12
Interest expense
228
238
250
13
Earnings before income tax
482
516
554
14
Income tax
69
81
91
15
Net income
413
435
463 4

Updated: 2016-07-20 EB-2016-0160 Exhibit C1 Tab 1 Schedule 1 Page 1 of 4
Witness: Glenn Scott
COST OF SERVICE SUMMARY1
2
1. INTRODUCTION 3
4
This exhibit presents an overview of Hydro One Transmission’s Cost of Service. As 5
summarized in Exhibit C2, Tab 1, Schedule 1, the Cost of Service includes OM&A 6
expenses, Depreciation and Amortization and Income Taxes, for which the overall costs 7
for 2017 and 2018 are shown in Table 1 below: 8
9
Table 1: Costs of Service ($ Millions) 10
Description Test Year
2017 2018
OM&A 413.1
411.2
Depreciation and Amortization 435.7 470.7
Income Taxes 81.3 90.4
Total Cost of Service 930.1
972.3
11
12
13
2. KEY ELEMENTS OF THE COST OF SERVICE 14
15
Hydro One Transmission’s forecast cost of service has been developed consistent with 16
corporate strategic goals to sustain a safe and reliable transmission system, as noted in 17
Exhibit B1, Tab 1, Schedule 2. The Company's planning process is described in detail in 18
Exhibit B1, Tab 2, Schedule 1. 19

Updated: 2016-07-20 EB-2016-0160 Exhibit C1 Tab 1 Schedule 1 Page 2 of 4
Witness: Glenn Scott
2.1 Operation, Maintenance and Administrative Expenses (OM&A) 1
2
Total OM&A expenses for the 2017 test year are $413.1 million and for 2018 are $411.2 3
million. 4
5
Hydro One Transmission plans and organizes its OM&A expenses on the basis of the 6
various work programs and functions performed by the Company. These work programs 7
primarily address necessary improvements in infrastructure. Exhibits in support of 8
OM&A costs have been prepared by function, and appear within the submitted evidence 9
as follows in Table 2: 10
11
Table 2: OM&A Expenditures by Function 12
Particulars 2017 Total Cost ($ million)
2018 Total Cost ($ million) Reference
Sustaining 241.2 238.5 Exhibit C1, Tab 2, Sch 2 Development 4.8 5.0 Exhibit C1, Tab 2, Sch 3 Operations 61.3 62.1 Exhibit C1, Tab 2, Sch 4 Customer Care 4.0 3.9 Exhibit C1, Tab 2, Sch 5 Shared Services 49.9 47.5 Exhibit C1, Tab 3, Sch 1 Taxes other than Income Taxes 63.6 64.3 Exhibit C1, Tab 3, Sch 7
Updated Pension Expense -11.0 -8.0 Exhibit C1, Tab 4 Sch 2
Remove B2M Expenses -0.8 -2.1
Total OM&A Expenditures 413.1 411.2 Exhibit C1, Tab 2, Sch 1
13
14
2.2 Depreciation and Amortization Expense 15
16
The Company is proposing to recover $424.0 million in depreciation and amortization 17
expense in 2017 and $460.6 million in 2018. Hydro One Transmission's evidence 18
regarding the depreciation study and its impact on depreciation expense is filed at Exhibit 19
C1, Tab 7, Schedule 1. 20
Filed: 2016-05-31 EB-2016-0160 Exhibit C1 Tab 1 Schedule 1 Page 3 of 4
Witness: Glenn Scott
1
2.3 Income Taxes 2
As a result of the Electricity Act, 1998, Hydro One Transmission has been required to pay 3
proxy taxes from 1999 to the time it ceased to be exempt from income tax under the 4
Income Tax Act (Canada). Thereafter, Hydro One Transmission has been required to pay 5
income tax under the Income Tax Act (Canada) and the Taxation Act, 2007 (Ontario). 6
Evidence outlining the calculation of Income Taxes of $81.3 million for 2017 and $90.4 7
million for 2018 appears in Exhibit C2, Tab 4, Schedule 1, Attachment 1. 8
9
3. KEY COMPONENTS IN THE BUILD-UP OF COST OF SERVICE 10
11
Key components in the build-up of Cost of Service are: 12
13
• resourcing, 14
• costing of work, 15
• out-sourced functions, and 16
• corporate cost allocation. 17
18
Each of these components is discussed below. 19
20
3.1 Resourcing 21
22
Labour costs are charged to OM&A and Capital work programs. The evidence contained 23
at Exhibit C1, Tab 4 Schedule 1 presents total staff levels and costs incurred by the 24
Company. 25

Filed: 2016-05-31 EB-2016-0160 Exhibit C1 Tab 1 Schedule 1 Page 4 of 4
Witness: Glenn Scott
3.2 Costing of Work 1
2
OM&A and Capital work programs are comprised primarily of costs relating to labour, 3
materials and equipment. Exhibit C1, Tab 5, Schedule 1 provides a schedule that 4
explains how costs flow to work programs. 5
6
3.3 Outsourcing 7
8
As a strategy to reduce costs, improve efficiency and to improve focus on its primary 9
operations, Hydro One has outsourcing arrangements with Inergi LP and Brookfield 10
Asset Management. Evidence concerning these arrangements can be found in Exhibit 11
C1, Tab 3, Schedule 2. 12
13
3.4 Corporate Cost Allocation 14
15
Hydro One Networks Inc. provides common services to its Transmission and Distribution 16
businesses and to other Hydro One subsidiaries on a centralized basis, as this serves as 17
the most economic approach. The costs of these services and assets are assigned to 18
business units on the basis of cost causation. These costs and assets are directly assigned 19
where it is possible to do so. All other costs and assets are allocated based on cost 20
drivers, direct benefits or other methods as appropriate. Exhibit C1, Tab 6 Schedule 1 21
describes these allocation methods, as well as the derivation of the overhead 22
capitalization rate, which determines the assignment of overhead costs to capital 23
expenditures. 24
Filed: 2016-05-31 EB-2016-0160 Exhibit C1 Tab 2 Schedule 1 Page 1 of 7
Witness: Glenn Scott
SUMMARY OF OM&A EXPENDITURES 1
2
1. SUMMARY OF OM&A EXPENDITURES 3
4
This Exhibit provides an overview of Hydro One Transmission’s OM&A expenditures 5
over the 2012 to 2018 period. 6
7
Hydro One Transmission’s OM&A programs represent the work required to meet public 8
and employee safety objectives, maintain transmission reliability at targeted performance 9
levels, and to comply with regulatory requirements (such as those specified within the 10
Transmission System Code), environmental requirements and government direction. The 11
forecast OM&A expenditures result from the investment planning process described in 12
Exhibit B1, Tab 2, Schedule 7. 13
14
Hydro One Transmission’s OM&A budget is grouped into the following investment 15
categories: Sustainment, Development, Operations, Customer Care, Common Corporate 16
and Taxes Other than Income Taxes. Table 1 provides a summary of Hydro One 17
Transmission’s OM&A expenditures for the historical, bridge and test years. 18
19
Updated: 2016-07-20 EB-2016-0160 Exhibit C1 Tab 2 Schedule 1 Page 2 of 7
Witness: Glenn Scott
Table 1: Summary of Transmission OM&A Expenditures ($ Million) 1
Historic Bridge Test Test
Description 2012 2013 2014 2015 2016 2017 2018
Sustainment 204.7 221.0 228.6 233.6 227.5 241.2 238.5
Development 8.4 8.6 7.5 6.1 5.3 4.8 5.0
Operations 54.8 56.7 56.6 59.0 60.0 61.3 62.1
Customer Care 4.4 5.3 5.4 5.1 4.1 4.0 3.9 Common Corporate Costs and Other OM&A 80.7 75.8 37.2 73.9 72.3 49.9 47.5
Taxes Other Than Income Taxes 62.1 21.2 64.1 63.9 62.9 63.6 64.3
Pension Adjustment* - - - - - -11.0 -8.0
B2M LP Adjustment* - - - - - -0.8 -2.1
Total 415.2 388.4 399.5 441.6 432.1 413.1 411.2 * See section 8 of this Exhibit for details. 2
3
Total OM&A expenditures for test year 2017 are forecast to be $413.1 million, which is a 4
decrease of $19 million or 4.4% below the 2016 bridge year. Total OM&A expenditures 5
for test year 2018 are forecast to decrease by a further $1.9 million or 0.4% over 2017. 6
The test year expenditures are required to address the increasing maintenance 7
requirements of a deteriorating and expanding transmission system. 8
9
As Table 1 demonstrates, these forecast OM&A expenses demonstrate a declining trend 10
in the 2016 bridge year and in the 2017 and 2018 test years, despite upwards pressure 11
from inflation of approximately 2% per year, a growing asset base, and increasing 12
compliance costs arising from new regulatory standards, such as the North American 13
Electric Reliability Corporation’s Critical Infrastructure Protection Cyber Security 14
reliability standards. 15

Filed: 2016-05-31 EB-2016-0160 Exhibit C1 Tab 2 Schedule 1 Page 3 of 7
Witness: Glenn Scott
2. SUSTAINMENT 1
2
The Sustainment OM&A budget represents investments required to maintain existing 3
transmission lines and stations facilities so that they will continue to function as 4
originally designed. The proposed investments are intended to ensure that the overall 5
reliability of the system is maintained, customer commitments are achieved, and all 6
legislative, regulatory, environmental and safety requirements are met. Details are 7
provided at Exhibit C1, Tab 2, Schedule 2. 8
9
3. DEVELOPMENT 10
11
Development OM&A expenditures consist of costs associated with developing technical 12
standards, solutions, and expertise for the benefit of Hydro One’s customers and 13
Hydro One’s business success. Development OM&A activities are described in detail in 14
Exhibit C1, Tab 2, Schedule 3. 15
16
4. OPERATIONS 17
18
Operations OM&A costs reflect the annual expenditures required to perform the central 19
transmission Operations function from Hydro One's Ontario Grid Control Centre. The 20
transmission Operations function is concerned with the real-time operation of Hydro One 21
Transmission’s system equipment, including the monitoring, control, detection and 22
response to equipment operational issues. Details of the expenditures under this program 23
are filed at Exhibit C1, Tab 2, Schedule 4. 24
25
Filed: 2016-05-31 EB-2016-0160 Exhibit C1 Tab 2 Schedule 1 Page 4 of 7
Witness: Glenn Scott
5. CUSTOMER CARE OM&A 1
2
Hydro One Transmission’s Customer Service OM&A investments fund work activities 3
required to develop, implement and monitor the company’s plans to positively influence 4
customer relationships and ensure affordability and overall value for the products and 5
services offered to them. These work activities will enable Hydro One to foster a 6
relationship based on transparency and trust. Details of the expenditures under this 7
program are filed at Exhibit C1, Tab 2, Schedule 5. 8
9
6. COMMON CORPORATE COSTS AND OTHER OM&A 10
11
The Common Corporate and other OM&A expenditures include costs associated with: 12
common corporate functions and services (“CCFS”), asset management planning, 13
information technology, and cost of sales for external work. 14
15
CCFS includes the following functions and services: corporate management, finance, 16
human resources, corporate relations, general counsel and corporate secretariat, 17
regulatory affairs, security management, internal audit, and real estate and facilities. 18
Other OM&A expenses include an environmental provision, indirect depreciation and 19
other costs. Asset management planning services include system investment and asset 20
stewardship functions. IT activities include providing and managing computer systems 21
(for example, hardware and software) and IT infrastructure. 22
23
Details of these activities and associated costs are provided in Exhibit C1, Tab 3, 24
Schedules 1 to 6. 25
26
Updated: 2016-07-20 EB-2016-0160 Exhibit C1 Tab 2 Schedule 1 Page 5 of 7
Witness: Glenn Scott
7. TAXES OTHER THAN INCOME TAXES 1
2
These expenses consist of property and proxy taxes, and indemnity payments to the 3
Province. Details of these expenditures are provided in Exhibit C1, Tab 3, Schedule 7. 4
5
8. PENSION AND B2M LP ADJUSTMENTS 6
7
Hydro One received an updated actuarial valuation report dated June 9, 2016, which is 8
provided as Attachment 1 to Exhibit C1, Tab 4, Schedule 2. The report outlined changes 9
in the financial position of Hydro One’s pension plan as of December 31, 2015 since its 10
last valuation of December 13, 2013. As a result of the updated valuation, the plan’s 11
operating expenses have decreased. Further details are set out in Exhibit C1, Tab 4, 12
Schedule 2. Hydro One has reflected this change in the “Pension Adjustment” line in 13
Table 1, reducing test year cost forecasts from those originally filed. 14
15
The “B2M LP Adjustment” line in Table 1 reflects adjustments for B2M LP costs that 16
were inadvertently included at the time of filing this Application. 17
18
9. COMPARISON OF OM&A COSTS TO BOARD-APPROVED 19
20
Table 2 compares Hydro One Transmission’s actual costs in 2015 to the 2015 OM&A 21
expenditures approved by the Board in its Decision on Hydro One’s previous 22
transmission application (EB-2014-0140). 23
24

Filed: 2016-05-31 EB-2016-0160 Exhibit C1 Tab 2 Schedule 1 Page 6 of 7
Witness: Glenn Scott
Table 2: 2015 Board-approved versus 2015 Actual OM&A Expenditures 1
OM&A Categories 2015 Board-
approved ($ Million)
2015 Actual ($ Million)
Variance ($ Million)
Sustainment 238.7 233.6 -5.1 Development 12.9 6.1 -6.8 Operations 58.5 59.0 0.5 Customer Care 5.5 5.1 -0.4 Common Corporate & Other Costs 70.2 73.9 3.7 Taxes Other than Income Taxes 66.3 63.9 -2.4 Less settlement reduction -20.0
Exclusion of B2M -0.9 Total OM&A 431.1 441.6 10.5
*Total variance is not the sum of changes noted. 2
3
Hydro One Transmission’s actual 2015 OM&A costs were $10.5 million or 2.4% above 4
Board-approved levels. This difference is explained, in part, by the OM&A reduction 5
prescribed by the settlement agreement (the “2015-2016 Settlement Agreement”) that 6
was accepted by the Board in proceeding EB-2014-0140. Most items were otherwise on 7
or below target. Common Corporate costs increased by 5.3%, but this increase was offset 8
by decreases in Sustainment (2.1%), Development (52.7%) and Taxes Other than Income 9
Tax (3.6%). 10
11
Table 3 compares 2016 projected costs to the 2016 OM&A expenditures approved by the 12
Board in its Decision in proceeding EB-2014-0140. 13
14

Filed: 2016-05-31 EB-2016-0160 Exhibit C1 Tab 2 Schedule 1 Page 7 of 7
Witness: Glenn Scott
1
Table 3: 2016 Board-approved versus 2016 Projected OM&A Expenditures 2
OM&A Categories 2016 Board-
approved ($ Million)
2016 Projected ($ Million)
Variance ($ Million)*
Sustainment 241.1 227.5 -13.6 Development 13.4 5.3 -8.1 Operations 59.1 60.0 0.9 Customer Care 5.5 4.1 -1.4 Common Corporate & Other Costs 71.3 72.3 1.0 Taxes other than Income Taxes 67.0 62.9 -4.1 Less settlement reduction -20.0 Exclusion of B2M -0.7 Total OM&A 436.7 432.1 -4.6
*Total variance is not the sum of changes noted. 3
4
Hydro One Transmission’s projected 2016 OM&A costs are $4.6 million or 1.1% below 5
the Board-approved level, which includes the $20.0 million reduction negotiated in the 6
2015-2016 Settlement Agreement. Otherwise, most spending areas are meaningfully 7
below target including Sustainment (5.6%), Development (60.4%) and Taxes other than 8
Income Tax (6.1%). 9

Filed: 2016-05-31 EB-2016-0160 Exhibit C1 Tab 3 Schedule 1 Page 1 of 2
Witness: Glenn Scott
SUMMARY OF COMMON CORPORATE COSTS - OM&A 1
2
Hydro One Common Corporate OM&A costs are comprised of common corporate 3
functions and services (“CCFS”), asset management planning services, information 4
technology (“IT”), cost of sales to external parties and other OM&A. 5
6
CCFS includes corporate management, finance, human resources, corporate 7
communications, legal, regulatory affairs, corporate security, internal audit and real 8
estate. Asset management planning includes system investment activities and asset 9
stewardship planning and strategies. IT activities include providing and managing 10
computer systems and installing enterprise IT systems. Other OM&A includes the 11
capitalized overhead credit, the environmental provision credit, indirect depreciation and 12
other costs. 13
14
Hydro One utilizes a centralized shared services model to deliver its common services to 15
its transmission and distribution businesses and to its affiliated companies as described in 16
Exhibit A, Tab 5, Schedule 3. Many organizations have adopted a common corporate 17
cost model as an effective method of delivering common services to multiple subsidiaries 18
and/or multiple business units. Hydro One adopted this model in 1999. 19
20
Table 1 summarizes the Hydro One Transmission’s portion of the Common Corporate 21
OM&A Costs over the historic, bridge and test years. 22

Updated: 2016-07-20 EB-2016-0160 Exhibit C1 Tab 3 Schedule 1 Page 2 of 2
Witness: Glenn Scott
Table 1: Summary of Common Corporate OM&A Costs 2012-2018 ($Millions) 1
2
Since 2009, Hydro One has applied a cost allocation methodology developed by Black 3
and Veatch Corporation which utilizes a breakdown of activities and drivers. In 2015, 4
Hydro One commissioned Black and Veatch Corporation to update the methodology to 5
allocate common costs among the business entities using the common services, as 6
discussed in Exhibit C1, Tab 6, Schedule 1. Other OM&A costs are discussed in Exhibit 7
C1, Tab 3, Schedule 3. 8
Historic Bridge Test Test Description 2012 2013 2014 2015 2016 2017 2018 Asset Management 32.3 31.8 32.6 31.0 36.6 36.5 35.8 Common Corporate Functions & Services 80.5 87.7 93.1 95.7 98.9 98.3 97.6
Information Technology 60.7 61.1 55.2 55.1 61.4 59.8 57.6 Cost of Sales 11.4 13.9 11.1 8.8 5.0 5.0 5.0 Other OM&A -104.2 -118.6 -154.8 -116.8 -129.6 -149.7 -148.5 Total 80.7 75.8 37.2 73.9 72.3 49.9 47.5

Filed: 2016-05-31 EB-2016-0160 Exhibit C1 Tab 3 Schedule 3 Page 1 of 26
Witness: Glenn Scott
COMMON CORPORATE FUNCTIONS AND SERVICES AND 1
OTHER OM&A 2
3
1. OVERVIEW 4
5
Hydro One has identified certain functions that provide common services to all business 6
units. It was determined that these functions could be shared effectively by all business 7
units, avoiding costly and unnecessary duplication. These functions are referred to as 8
“common corporate functions and services” (“CCFS”). 9
10
This Exhibit discusses CCFS costs and other OM&A expenses, which are comprised of 11
credits associated with capitalized overhead, environmental provisions, indirect 12
depreciation and other costs. 13
14
2. COMMON CORPORATE FUNCTIONS AND SERVICES 15
16
CCFS is comprised of the following functions and services: corporate management, 17
finance, human resources, corporate relations, general counsel and corporate secretariat, 18
regulatory affairs, security management, internal audit, and real estate and facilities. 19
20
For comparison purposes, Table 1 presents the total CCFS costs between 2012 and 2018 21
as well as amounts allocated to Hydro One Transmission in the test years. 22

Updated: 2016-07-20 EB-2016-0160 Exhibit C1 Tab 3 Schedule 3 Page 2 of 26
Witness: Glenn Scott
Table 1: CCFS Costs ($ Millions) 1
Description
Historic Years Bridge Year Test Years TX Allocation
2012 2013 2014 2015 2016 2017 2018 2017 2018 Corporate Management 5.0 4.9 5.5 5.4 11.1 22.3 22.1 7.2 7.1
Finance 35.2 41.9 41.0 40.4 42.2 41.0 38.6 21.9 19.4
People and Culture 9.9 11.1 13.1 13.9 16.0 14.8 14.2 7.6 7.3
Corporate Relations 11.3 15.0 19.6 17.4 17.5 17.3 19.4 8.7 9.9
General Counsel and Secretariat 8.8 9.6 9.3 9.3 10.5 10.4 10.5 5.5 5.6
Regulatory Affairs 20.6 20.6 23.1 24.4 25.8 25.4 25.9 9.6 9.8 Security Management 3.1 3.4 3.5 4.2 5.1 4.7 4.8 2.2 2.3
Internal Audit 3.5 3.4 4.0 4.3 6.0 6.3 6.4 3.3 3.4 Real Estate and Facilities 54.6 54.1 53.6 60.0 60.1 59.6 60.7 32.2 32.7
Total CCF&S Costs 152.0 164.0 172.8 179.4 194.2 201.8 202.7 98.3 97.6
2
Total CCFS costs increase by $23.3 million from 2015 to 2018 primarily due to the 3
following factors: 4
• higher Corporate Management costs due to increases in compensation; 5
• higher Internal Audit costs resulting from making rotational staff permanent and an 6
increased staffing requirement to address an expanding work program; 7
• higher Regulatory Affairs costs reflecting an aggressive regulatory agenda and, 8
beginning in 2015, the inclusion of business performance management costs 9
previously included in Finance costs; and 10
• higher General Counsel and Corporate Secretariat costs to address an increasing 11
workload and greater complexity in the company’s legal matters. 12
13

Filed: 2016-05-31 EB-2016-0160 Exhibit C1 Tab 3 Schedule 3 Page 3 of 26
Witness: Glenn Scott
2.1 Corporate Management 1
2
Table 2 provides an overview of Hydro One’s Corporate Management costs over the 3
2012-2018 period. 4
5
Table 2: Corporate Management Costs ($ Millions) 6
Description
Historic Years Bridge Year Test Years TX Allocation
2012 2013 2014 2015 2016 2017 2018 2017 2018 Corporate Management 5.0 4.9 5.5 5.4 11.1 22.3 22.1 7.2 7.1
7
“Corporate Management” represents those functions responsible for providing overall 8
strategic direction to Hydro One. Corporate Management costs relate to the Board of 9
Directors, the Chief Executive Officer, the Treasurer, the Chief Financial Officer 10
(“CFO”) and the General Counsel and Corporate Secretariat as advisors to the Board of 11
Directors and corporate officers on overall strategic matters. 12
13
Included in the total Corporate Management costs are expenses related to Hydro One’s 14
investor relations and corporate development functions. There has been no allocation of 15
these expenses to Hydro One Transmission. 16
17
The allocation of Corporate Management costs between Hydro One’s distribution and 18
transmission businesses is determined by the common cost allocation methodology 19
described in Exhibit C1, Tab 6, Schedule 1. The allocation of these costs between Hydro 20
One and its affiliates is governed by affiliate service level agreements described in 21
Exhibit A, Tab 5, Schedule 3. There is no service level agreement with Hydro One 22
Limited. 23
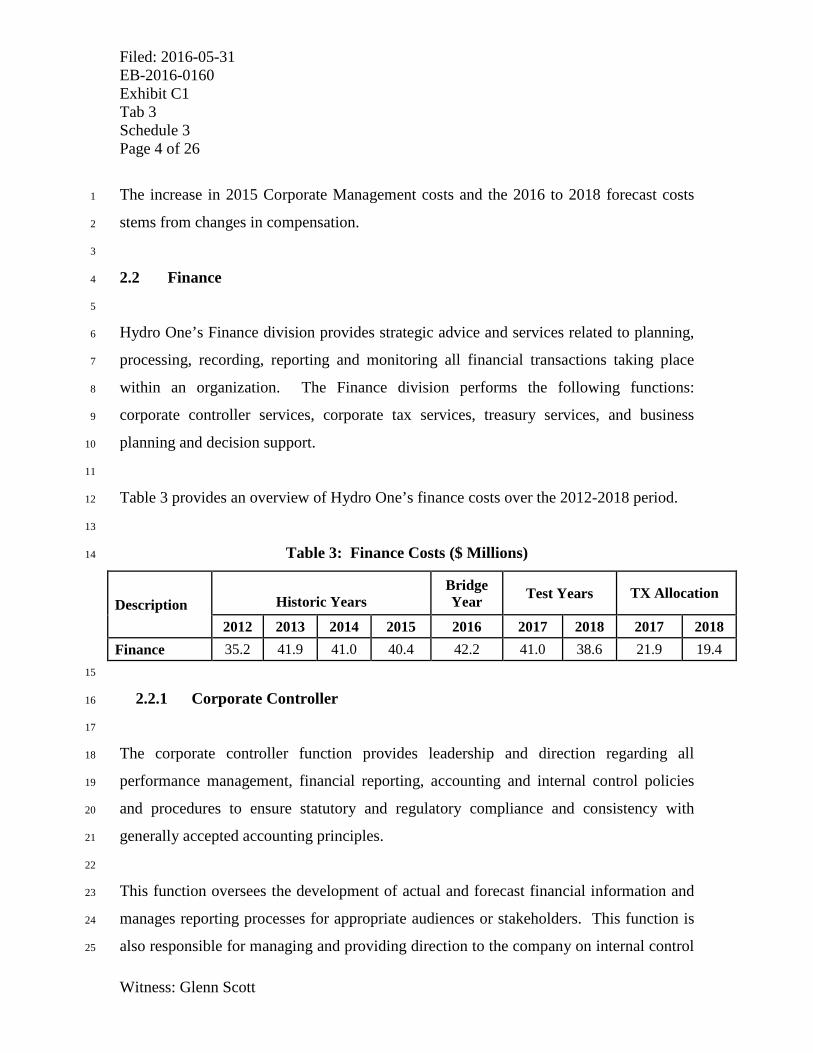
Filed: 2016-05-31 EB-2016-0160 Exhibit C1 Tab 3 Schedule 3 Page 4 of 26
Witness: Glenn Scott
The increase in 2015 Corporate Management costs and the 2016 to 2018 forecast costs 1
stems from changes in compensation. 2
3
2.2 Finance 4
5
Hydro One’s Finance division provides strategic advice and services related to planning, 6
processing, recording, reporting and monitoring all financial transactions taking place 7
within an organization. The Finance division performs the following functions: 8
corporate controller services, corporate tax services, treasury services, and business 9
planning and decision support. 10
11
Table 3 provides an overview of Hydro One’s finance costs over the 2012-2018 period. 12
13
Table 3: Finance Costs ($ Millions) 14
Description
Historic Years Bridge Year Test Years TX Allocation
2012 2013 2014 2015 2016 2017 2018 2017 2018 Finance 35.2 41.9 41.0 40.4 42.2 41.0 38.6 21.9 19.4
15
2.2.1 Corporate Controller 16
17
The corporate controller function provides leadership and direction regarding all 18
performance management, financial reporting, accounting and internal control policies 19
and procedures to ensure statutory and regulatory compliance and consistency with 20
generally accepted accounting principles. 21
22
This function oversees the development of actual and forecast financial information and 23
manages reporting processes for appropriate audiences or stakeholders. This function is 24
also responsible for managing and providing direction to the company on internal control 25
Filed: 2016-05-31 EB-2016-0160 Exhibit C1 Tab 3 Schedule 3 Page 5 of 26
Witness: Glenn Scott
matters, employing measures such as “organization authority registers” and financial 1
policies and procedures. It also provides leadership on compliance with Ontario 2
securities laws, including Bill 198, and the Multi-Jurisdictional Disclosure System rules 3
for a foreign-issuer registered with the U.S. Securities Exchange Commission. 4
5
Many routine financial services are outsourced to Inergi LP as described in Exhibit C1, 6
Tab 3, Schedule 2, such as accounts payable, accounts receivable, fixed asset accounting, 7
general accounting, planning budgeting and reporting and pension support, human 8
resources pay services and a number of administrative services. The costs of these 9
outsourced services comprise a major portion of the corporate controller costs. 10
11
Also included in corporate controller costs are costs associated with the Chief Risk 12
Officer’s department and the company’s business planning and decision support function. 13
The Chief Risk Officer’s department is accountable for performing internal risk 14
assessments to ensure the company is appropriately addressing risks. The business 15
planning and decision support function is responsible for: 16
• establishing and leading the annual business planning and budgeting processes; 17
• performing business case reviews, business valuations, transaction support; 18
• developing and maintaining financial models; and 19
• providing analytical support for a variety of financial planning and reporting 20
processes. 21
22
In 2015, business performance support services moved from the corporate controller 23
function to the company’s Regulatory Affairs division. These services support the 24
development of business strategies by conducting studies on corporate performance in 25

Filed: 2016-05-31 EB-2016-0160 Exhibit C1 Tab 3 Schedule 3 Page 6 of 26
Witness: Glenn Scott
areas such as reliability, work program performance, productivity and cost savings 1
management. See section 2.6.4 of this Exhibit for more information on this function. 2
3
The forecasted corporate controller costs are $33.2 million in 2017 and $30.8 million in 4
2018. The amounts allocated to Hydro One Transmission are $17.8 million in 2017 and 5
$15.4 million in 2018. 6
7
2.2.2 Corporate Tax 8
9
Corporate tax services manage the tax affairs (namely, compliance, audits and planning) 10
for each taxable entity within the Hydro One group of companies. This includes matters 11
related to corporate income taxes, harmonized sales tax, debt retirement charge, payroll 12
and non-resident withholding tax, and the employer health tax. Corporate tax services 13
ensure that internal and external tax compliance requirements are met. Moreover, tax 14
consulting services are provided to other departments with respect to mergers and 15
acquisitions activities, payroll tax, taxable benefits, agreements, financing, and all 16
transactions and information about tax costs for regulatory purposes. 17
18
The costs associated with corporate tax services are $3.1 million in 2017 and $2.8 million 19
in 2018, with $1.5 million being charged to Hydro One Transmission in 2017 and $1.3 20
million in 2018. 21
22

Filed: 2016-05-31 EB-2016-0160 Exhibit C1 Tab 3 Schedule 3 Page 7 of 26
Witness: Glenn Scott
2.2.3 Treasury 1
2
Treasury costs are associated with the following activities: 3
• executing on borrowing plans and issuing commercial paper and long-term debt; 4
• ensuring compliance with securities regulations, banks and debt covenants; 5
• managing the company’s daily liquidity position, control cash and manage the 6
company’s bank accounts; 7
• settling all transactions and manage the relationship with creditors; and 8
• communicating with debt investors, banks and credit rating agencies. 9
10
A portion of the treasury budget is recovered through the cost of long-term debt, as stated 11
in Exhibit D1, Tab 5, Schedule 1. 12
13
Included in treasury costs are expenses for the negotiation and purchase of insurance 14
policies, and claims management and settlement. In 2017 and 2018, these expenses are 15
forecast to be $4.5 million and $4.8 million, respectively. These expenses cover 16
premiums paid for corporate shared services insurance coverage and the cost to self-17
insure against liability exposures that are either not covered by insurance policies or fall 18
below the specified deductibles. 19
20
Table 4 shows the premiums for all of Hydro One Inc.’s insurance policies and the cost 21
of self-insurance for the 2012-2018 period. Self-insurance costs for the 2017 and 2018 22
period reflect the company’s risk exposures, its long-term history of claims, the 23
deductible on the liability policies, and liability payments to third parties. The main 24
contributor to self-insurance costs are claims by third parties which can fluctuate from 25
year to year. 26

Filed: 2016-05-31 EB-2016-0160 Exhibit C1 Tab 3 Schedule 3 Page 8 of 26
Witness: Glenn Scott
Table 4: Hydro One Inc. Insurance Costs ($ Millions) 1
Description 2012 2013 2014 2015 2016 2017 2018
Premiums paid for Corporate Functions and Services Insurance Policies *
1.3 1.4 1.5 1.6 2.5 2.7 2.8
Self-insurance Cost 1.3 1.5 2.9 1.2 1.9 1.9 1.9
Total 2.6 2.8 4.4 2.9 4.3 4.5 4.8 *The cost of other insurance coverage that applies to only certain lines of business is captured and reported by the lines of business 2 where the coverage is applicable. 3 4
Hydro One Transmission accounts for $2.6 million of the treasury budget for 2017 and 5
$2.7 million of the budget for 2018. 6
7
2.3 People and Culture 8
9
The “People and Culture” organization ensures that Hydro One has the policies, systems 10
and programs to attract, manage, engage and retain a high performing workforce to 11
execute business strategy. The organization provides human resources consulting, 12
leadership development and recruiting, diversity and resourcing programs, compensation 13
and benefits services, and labour relations services. 14
15
Table 5 provides an overview of the People and Culture organization’s costs over the 16
2012-2018 period. 17
18
Table 5: People and Culture Costs ($ Millions) 19
Description
Historic Years Bridge Year Test Years TX Allocation
2012 2013 2014 2015 2016 2017 2018 2017 2018 People & Culture 9.9 11.1 13.1 13.9 16.0 14.8 14.2 7.6 7.3
20

Filed: 2016-05-31 EB-2016-0160 Exhibit C1 Tab 3 Schedule 3 Page 9 of 26
Witness: Glenn Scott
The People and Culture organization performs multiple functions, which are described in 1
this section. 2
3
2.3.1 Human Resources Operations 4
5
Hydro One’s human resources function provides advice and guidance to managers, 6
supervisors, and employees on a myriad of issues related to human resources policies and 7
procedures, collective agreement administration, staffing and other large initiatives that 8
impact staff. 9
10
2.3.2 Talent Management 11
12
The talent management function recommends and administers policy in areas related to 13
external hiring and leadership development. This function manages all of Hydro One’s 14
management/leadership development activities, including the assessment of high-15
potential succession candidates and miscellaneous specialized one-off hiring initiatives, 16
as required. The talent management function also manages Hydro One’s principal 17
cyclical hiring and on-boarding processes, Hydro One’s new grad training and 18
development program, and the company’s diversity plan. 19
20
2.3.3 Compensation and Benefits 21
22
The compensation and benefits function manages compensation, benefits, reporting and 23
master data for all Hydro One’s employees and pensioners by ensuring the accurate 24
application, record-keeping and security of such information. This function provides 25
regular, strategic reports to senior management on topics such as retirement 26
demographics, headcount, overtime, and data for OEB submissions. This function 27
facilitates the company’s participation in industry-wide compensation, benefit and 28

Filed: 2016-05-31 EB-2016-0160 Exhibit C1 Tab 3 Schedule 3 Page 10 of 26
Witness: Glenn Scott
pension surveys. It also administers Hydro One’s pension plan for approximately 7,100 1
pensioners and the benefits program for all employee groups. 2
3
2.3.4 Labour Relations 4
5
The labour relations function provides advice, guidance and training to managers 6
regarding collective agreements and labour legislation and manages the grievance and 7
arbitration process. The company is a party to 24 collective agreements and a number of 8
mid-term agreements and letters of understanding. The labour relations function 9
negotiates and administers all such agreements and letters of understanding. 10
11
2.4 Corporate Relations 12
13
Table 6 provides an overview of Hydro One’s Corporate Communications costs over the 14
2012-2018 period. 15
16
Table 6: Corporate Communications Costs ($ Millions) 17
Description
Historic Years Bridge Year Test Years TX Allocation
2012 2013 2014 2015 2016 2017 2018 2017 2018 Corporate Communications Total
11.3 15.0 19.6 17.4 17.5 17.3 19.4 8.7 9.9
18
Corporate Communications costs include expenses associated with Hydro One’s First 19
Nations and Métis relations function, outsourcing services function, and Hydro One’s 20
corporate communications and external relations function. 21
22
Filed: 2016-05-31 EB-2016-0160 Exhibit C1 Tab 3 Schedule 3 Page 11 of 26
Witness: Glenn Scott
2.4.1 First Nations and Métis 1
2
Hydro One owns and maintains assets on reserve lands and within the traditional 3
territories of First Nations and Métis peoples. Building relationships with First Nations 4
and Métis communities based upon trust, confidence, and accountability is vital to 5
achieving Hydro One’s business objectives. 6
7
The First Nations and Métis Relations function is accountable for: 8
• supporting and sustaining long-term relationship-building and negotiations with First 9
Nations and Métis communities impacted by the growth of Hydro One core work 10
programs; 11
• developing and maintaining key relationships with government officials as well as 12
representatives of key businesses including but not limited to other energy 13
companies; 14
• supporting procurement opportunities for qualified First Nations and Métis 15
businesses; 16
• providing engagement services on projects and/or initiatives that potentially affect the 17
First Nations and Métis peoples and communities; 18
• providing leadership and advice within the company in the building of knowledge and 19
awareness of First Nations and Métis historic and contemporary issues; and 20
• together with the People and Culture organization, developing initiatives to enhance 21
the level of aboriginal employment at Hydro One. 22
23
First Nations and Métis Relations forecast costs are $4.5 million in 2017 and in 2018. 24
The amounts allocated to Hydro One Transmission are $2.6 million annually for 2017 25
and 2018. 26
27

Filed: 2016-05-31 EB-2016-0160 Exhibit C1 Tab 3 Schedule 3 Page 12 of 26
Witness: Glenn Scott
2.4.2 Outsourcing Services 1
2
The outsourcing services function manages the contractual relationship with the 3
company’s key outsourcing partner in a manner that fosters collaboration and optimizes 4
value and minimizes risk by ensuring that contracted services are delivered. This 5
function is responsible for managing the design, development, and implementation of 6
new service delivery agreements with Hydro One’s suppliers. 7
8
The outsourcing services’ costs are $2.0 million in 2017 and $4.0 million in 2018. The 9
amounts allocated to Hydro One Transmission are $0.7 million in 2017 and $1.8 million 10
for 2018. The increase in 2018 includes anticipated costs associated with retendering 11
Hydro One’s biggest outsourcing arrangement. 12
13
2.4.3 Corporate Relations 14
15
The corporate relations function ensures that Hydro One builds the strategic relationships 16
required to advance its business objectives and presents a single, positive brand internally 17
and externally. It is accountable for corporate reputation, executive support, customer and 18
employee communications, media relations, community investment, web 19
communications and corporate brand identity. The corporate relations function is also 20
accountable for supporting the company’s relationships with the government and its key 21
stakeholders. This function leads a “public affairs group” which supports Hydro One’s 22
public consultation obligations and community relations programs. This group targets 23
improvements in customer communications regarding power outages while increasing 24
customer education and engagement efforts and research to support improved customer 25
communication. 26
27

Filed: 2016-05-31 EB-2016-0160 Exhibit C1 Tab 3 Schedule 3 Page 13 of 26
Witness: Glenn Scott
Costs associated with the corporate relations function are $10.8 million in 2017 and $10.9 1
million in 2018. The amounts allocated to Hydro One Transmission are $5.4 million and 2
$5.5 million in 2017 and 2018. 3
4
2.5 General Counsel and Corporate Secretariat 5
6
Table 7 provides an overview of the Hydro One’s General Counsel and Corporate 7
Secretariat costs over the 2012-2018 period. 8
9
Table 7: General Counsel and Corporate Secretariat Costs ($ Millions) 10
Description
Historic Years Bridge Year Test Years TX Allocation
2012 2013 2014 2015 2016 2017 2018 2017 2018 General Counsel and Corporate Secretariat 8.8 9.6 9.3 9.3 10.5 10.4 10.5 5.5 5.6
11
The General Counsel and Corporate Secretariat group provides legal advice and direction 12
to Hydro One and its affiliates, as well as overall guidance in the areas of corporate 13
structure, governance, business ethics and the business code of conduct. It performs the 14
following primary functions: 15
• ensuring compliance with law and providing legal services relating to all of Hydro 16
One’s activities, including the company’s major borrowing and financing initiatives, 17
regulatory matters, litigation, transmission and distribution operations, employer-18
related activities, corporate governance-related matters, and health, safety and 19
environment activities; 20
• providing corporate secretariat services, which includes supporting the Chair of the 21
Board of Directors, the Board of Directors and its committees and advising on a 22

Filed: 2016-05-31 EB-2016-0160 Exhibit C1 Tab 3 Schedule 3 Page 14 of 26
Witness: Glenn Scott
variety of board-related matters, such as best practices and emerging trends and issues 1
in the area of corporate governance; and 2
• providing advice and direction with regard to Hydro One’s Code of Conduct, 3
ensuring appropriate actions are taken to resolve known or suspected violations. 4
5
The level of required legal and corporate secretarial services is driven by capital and 6
OM&A activities and increasing regulatory and legislative oversight. Most legal work is 7
performed in-house. External legal services are retained when in-house expertise is not 8
available or when the workload exceeds the capacity of the internal legal group. 9
10
Hydro One’s General Counsel and Corporate Secretariat costs are $10.4 million in 2017 11
and $10.5 million in 2018. The portion allocated to Hydro One Transmission is $5.5 12
million in 2017 and $5.6 million in 2018. The increase over historical years is 13
attributable to a heightened complexity in Hydro One’s legal matters and a greater 14
volume of work related to procurement, work programs, land acquisition, litigation, and 15
securities compliance. 16
17
2.6 Regulatory Affairs 18
19
Hydro One’s Regulatory Affairs division manages the company’s relationships with 20
regulatory bodies such as the OEB, the IESO, and the National Energy Board. It is 21
responsible for developing regulatory strategy and coordinating submissions to these 22
organizations and participating in regulatory initiatives. 23
24
Table 8 provides an overview of the Hydro One’s Regulatory Affairs costs over the 2012-25
2018 period. 26
27

Updated: 2016-07-20 EB-2016-0160 Exhibit C1 Tab 3 Schedule 3 Page 15 of 26
Witness: Glenn Scott
Table 8: Regulatory Affairs Costs ($ Millions) 1
Description
Historic Years Bridge Year Test Years TX Allocation
2012 2013 2014 2015 2016 2017 2018 2017 2018 Regulatory Affairs 7.4 7.6 8.1 8.7 9.5 10.2 10.0 4.5 4.5 OEB/NEB Costs 13.2 13.1 15.0 15.6 16.3 15.2 15.9 5.1 5.3 Total 20.6 20.6 23.1 24.4 25.8 25.4 25.9 9.6 9.8
2
The Regulatory Affairs division performs compliance, applications, pricing and load 3
forecasting, and business performance management functions. These functions are 4
described in this section. 5
6
The increase in Regulatory Affairs’ costs in 2015 and 2016 is primarily attributable to the 7
inclusion of the business performance management costs previously included in Finance 8
costs. (This transition is discussed in in section 2.6.4.) Technology-centric productivity 9
initiatives are expected to decrease costs slightly in the test years, but this decrease is 10
offset by increased staffing needs related to an aggressive regulatory agenda. 11
12
2.6.1 Compliance 13
14
The regulatory compliance function ensures Hydro One’s compliance with the 15
regulations and policies of the OEB, the IESO, and the National Energy Board as they 16
apply to Hydro One’s distribution and transmission businesses. 17
18
Filed: 2016-05-31 EB-2016-0160 Exhibit C1 Tab 3 Schedule 3 Page 16 of 26
Witness: Glenn Scott
2.6.2 Applications 1
2
The applications function coordinates, prepares and processes regulatory applications and 3
provides support to witnesses in regulatory proceedings and business support staff. 4
These services are provided for a wide range of regulatory applications, including 5
distribution and transmission revenue requirement applications, transmission leave–to-6
construct applications, and applications related to mergers, acquisitions, amalgamations, 7
divestitures and area and system supply planning. 8
9
2.6.3 Pricing and Load Forecasting 10
11
This function provides pricing and cost allocation analysis and support for rate 12
applications. This work entails developing rates for transmission and distribution tariffs 13
and supporting the preparation and defense of rate proposals. The function also assists 14
with the implementation of approved transmission and distribution rates. 15
16
The load forecasting and load data management functions are included within the 17
Regulatory Affairs group. Load forecasts are developed to enable system planning and 18
financial planning which underlie Hydro One's financial forecasts. The load forecast 19
function provides load forecast data including the capture of conservation and demand 20
management impacts. Load forecast staff supports the company’s business units and the 21
IESO with forecasting analysis and evaluation, covering matters such as time of use, 22
bypass and embedded generation. This function also provides analytical support for 23
conservation and demand management projects and provides load research analysis. 24
25
Filed: 2016-05-31 EB-2016-0160 Exhibit C1 Tab 3 Schedule 3 Page 17 of 26
Witness: Glenn Scott
2.6.4 Performance Management 1
2
In May 2015, the business performance management function moved to the Regulatory 3
Affairs division from the Finance division. This function collects and analyzes data 4
related to the performance of the company and its operations. It provides management 5
with information related to corporate and regulatory scorecards, customer delivery point 6
performance standards, benchmarking and other metrics related to reliability and 7
performance. This function also prepares quarterly and annual reports required under the 8
OEB’s Reporting and Record-keeping Requirements. 9
10
2.6.5 Ontario Energy Board (OEB) / National Energy Board (NEB) Costs 11
12
The OEB/NEB costs also include the external costs associated with applications filed 13
with regulatory bodies. Specifically, these costs stem from the provision of notice, 14
stakeholder and consultation activities, provision of expert studies and witnesses, 15
hearing-related expenses, intervenor cost awards, and miscellaneous items like printing 16
and shipping. Over the test period, Hydro One anticipates filing two major revenue 17
requirement applications, several facility applications, as well as filings related to real 18
estate and regional planning efforts. 19
20
For this Application, Hydro One has estimated a total cost of $1.3 million, attributing 21
$300,000 to external consultants, $400,000 to the OEB for time spent and notice fees, and 22
$600,000 for intervenor costs. 23
24
The OEB/NEB costs also include Hydro One’s share of the OEB’s costs, including 25
expenses related to the OEB’s quarterly assessments, proceedings and intervenor cost 26
awards, and regulatory license assessments. 27

Filed: 2016-05-31 EB-2016-0160 Exhibit C1 Tab 3 Schedule 3 Page 18 of 26
Witness: Glenn Scott
Under the Ontario Energy Board Act, 1998, the OEB is required to recover all of its 1
annual operating costs. Almost all of its costs are recovered from gas and electricity 2
distributors and electricity transmitters. A small fraction of OEB costs are recovered 3
from the IESO and Ontario Power Generation and from licensing fees and penalties. 4
OEB costs that are subject to recovery include expenses related to staff, office space, 5
administration and overheads. These costs are allocated to one of five categories: 6
electricity distribution, electricity transmission, gas distribution, IESO, and Ontario 7
Power Generation. Hydro One's share of OEB costs is derived from the allocations to 8
electricity distribution and transmission. 9
10
2.7 Security Management 11
12
Table 9 provides an overview of the Hydro One’s Security Management costs over the 13
2012-2018 period. 14
15
Table 9: Security Costs ($ Millions) 16
Description
Historic Years Bridge Year Test Years TX Allocation
2012 2013 2014 2015 2016 2017 2018 2017 2018 Security Management 3.1 3.4 3.5 4.2 5.1 4.7 4.8 2.2 2.3
17
The Security Management function exists to enable Hydro One’s success primarily in the 18
protection of assets (including people, property and information), development and 19
maintenance of business continuity and emergency preparedness and response plans and 20
to assist in the reliable delivery of electricity. Security Management adds value by 21
providing advice, coordination, and investigative, technical and intelligence gathering 22
expertise and services to Hydro One staff. This supports the reliable delivery of 23
electricity, the protection of Hydro One’s assets, and the resumption of business in the 24

Filed: 2016-05-31 EB-2016-0160 Exhibit C1 Tab 3 Schedule 3 Page 19 of 26
Witness: Glenn Scott
event of an all-hazards (i.e. natural, technological or human-caused) incident. Effective 1
asset protection and recovery can be the primary differentiating factor between success 2
and failure for Hydro One’s business objectives. This is achieved by effective corporate 3
security policies, directives, guidelines and services, which can significantly enhance 4
productivity and safety. 5
6
Incidents of copper theft have dropped, in part, due to adding security protection systems 7
at heavily targeted transmission sites. However, more organized criminal incidents have 8
occurred in relation to metal thefts, primarily targeting stations that have not benefited 9
from increased capital expenditures for protection systems. Although the total number of 10
incidents has dropped, the average loss per incident is increasing due to the sophistication 11
and organization of these crime groups. These crimes take longer to investigate, and 12
prevention methods and strategies are often very complex and costly. 13
14
Security Management costs are forecasted to be $4.7 million in 2017 and $4.8 million in 15
2018. The amounts allocated to Hydro One Transmission are $2.2 million in 2017 and 16
$2.3 million in 2018. 17
18
2.8 Internal Audit & Risk Management 19
20
Table 10 provides an overview of the Hydro One’s Internal Audit and Risk Management 21
costs over the 2012-2018 period. 22
23

Filed: 2016-05-31 EB-2016-0160 Exhibit C1 Tab 3 Schedule 3 Page 20 of 26
Witness: Glenn Scott
Table 10: Internal Audit and Risk Management Costs ($ Millions) 1
Description
Historic Years Bridge Year Test Years TX Allocation
2012 2013 2014 2015 2016 2017 2018 2017 2018 Internal Audit & Risk Management
3.5 3.4 4.0 4.3 6.0 6.3 6.4 3.3 3.4
2
The Internal Audit group reports on a functional basis to the Audit Committee of the 3
Board of Directors and administratively to the CFO. It provides independent and 4
objective assurance and consulting services designed to add value to and improve Hydro 5
One’s operations. The group’s mandate is to provide independent assurance to 6
management of the company and to the Board of Directors that internal controls are 7
designed and operating effectively in areas of material business risk, both financial and 8
non-financial, and to follow-up and report on timeliness and effectiveness of management 9
actions to address findings from past audits. 10
11
The Internal Audit group helps Hydro One accomplish its objectives by bringing a 12
systematic and disciplined approach to evaluating and improving the effectiveness of risk 13
management, internal control and governance processes. 14
15
The cost increase in the bridge and test years is the result of two factors. First, rotational 16
resources were made permanent. Costs associated with rotational resources were 17
attributed to the resource’s originating department. Once made permanent, these 18
resource costs were reflected fully in Internal Audit costs. Second, there is an increased 19
need for improved Internal Audit capability and capacity due to more stringent 20
governance needs. 21
22
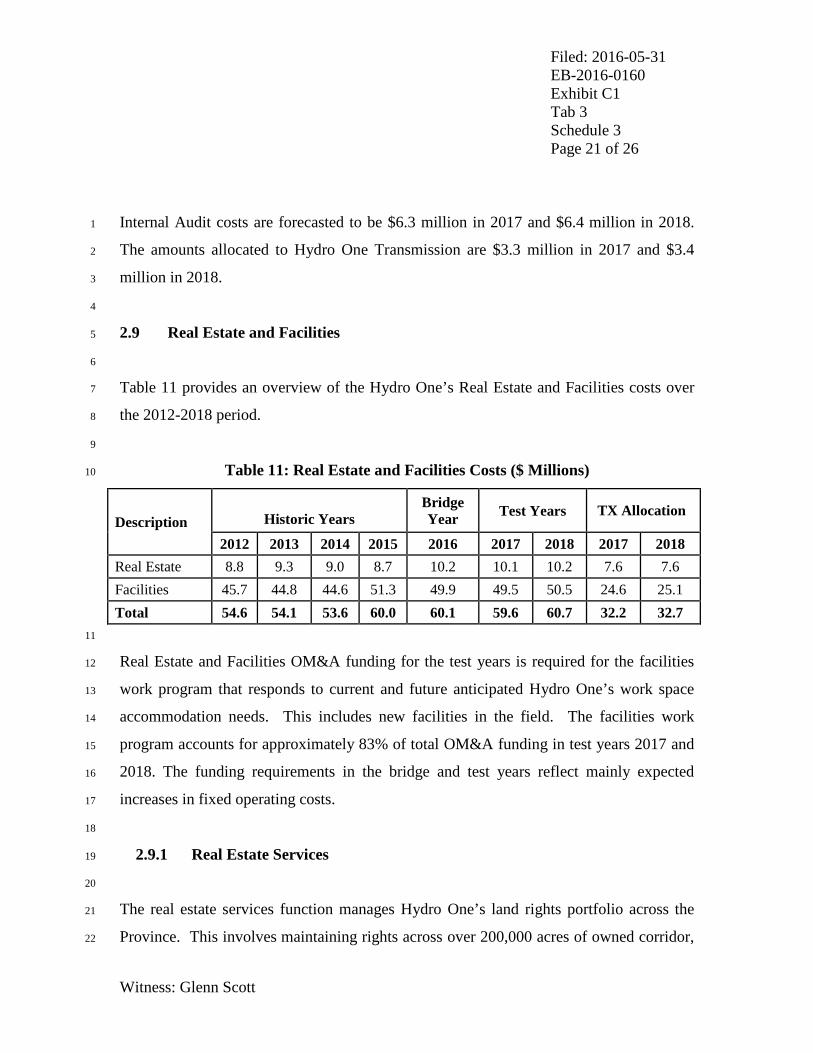
Filed: 2016-05-31 EB-2016-0160 Exhibit C1 Tab 3 Schedule 3 Page 21 of 26
Witness: Glenn Scott
Internal Audit costs are forecasted to be $6.3 million in 2017 and $6.4 million in 2018. 1
The amounts allocated to Hydro One Transmission are $3.3 million in 2017 and $3.4 2
million in 2018. 3
4
2.9 Real Estate and Facilities 5
6
Table 11 provides an overview of the Hydro One’s Real Estate and Facilities costs over 7
the 2012-2018 period. 8
9
Table 11: Real Estate and Facilities Costs ($ Millions) 10
Description
Historic Years Bridge Year Test Years TX Allocation
2012 2013 2014 2015 2016 2017 2018 2017 2018 Real Estate 8.8 9.3 9.0 8.7 10.2 10.1 10.2 7.6 7.6 Facilities 45.7 44.8 44.6 51.3 49.9 49.5 50.5 24.6 25.1 Total 54.6 54.1 53.6 60.0 60.1 59.6 60.7 32.2 32.7 11
Real Estate and Facilities OM&A funding for the test years is required for the facilities 12
work program that responds to current and future anticipated Hydro One’s work space 13
accommodation needs. This includes new facilities in the field. The facilities work 14
program accounts for approximately 83% of total OM&A funding in test years 2017 and 15
2018. The funding requirements in the bridge and test years reflect mainly expected 16
increases in fixed operating costs. 17
18
2.9.1 Real Estate Services 19
20
The real estate services function manages Hydro One’s land rights portfolio across the 21
Province. This involves maintaining rights across over 200,000 acres of owned corridor, 22

Filed: 2016-05-31 EB-2016-0160 Exhibit C1 Tab 3 Schedule 3 Page 22 of 26
Witness: Glenn Scott
easement and “statutory right” properties and acquiring any new rights needed to ensure 1
the safe and reliable operation of the transmission and distribution system. In addition, 2
this function oversees the management of Hydro One’s rights associated with distribution 3
and transmission lands, stations and other property. 4
5
The real estate services function’s key work activities include: 6
• managing the acquisition of new real estate rights, which supports the company’s 7
distribution and transmission development and reinforcement project initiatives 8
across the province including those designed to accommodate renewable power 9
sources on the grid; 10
• managing the provincial secondary land use program on behalf of Ministry of 11
Infrastructure/ Infrastructure Ontario (leasing transmission corridor lands to external 12
parties); 13
• managing easement, other rights agreements on public/private sector, railway and 14
other lands; 15
• managing First Nations land use permit settlements on reserve lands; 16
• managing about 500,000 unregistered, low-voltage, real estate rights agreements; 17
• providing specialized real estate service activities including managing property tax 18
payments to municipalities, appealing property tax assessments, and providing 19
employee relocation services; and 20
• maintaining geographic information system – property record database. 21
22
More specific support is provided on a selected project basis. This includes provision of 23
land ownership information, damage claim settlement, road access and other rights 24
acquisitions. Specialized real estate services are provided as necessary. This includes 25
assessment appeals, payment of property taxes on lands/buildings, and employee 26
relocation services as appropriate. 27
28

Filed: 2016-05-31 EB-2016-0160 Exhibit C1 Tab 3 Schedule 3 Page 23 of 26
Witness: Glenn Scott
2.9.2 Facilities 1
2
The facilities work program addresses all aspects of company work space requirements. 3
This involves managing company-owned facilities and a portfolio of leased facilities as 4
well as overseeing the construction of new facilities. The work program focuses on 5
providing and maintaining in compliance with laws and applicable codes: (a) storage and 6
garage facilities that meet business requirements, and (b) employee workspace at sites 7
across the province including head office, administrative and service centres, the OGCC, 8
and other work locations (for example, the London Call Centre). 9
10
This facilities function is accountable for: 11
• the management of 50 contract lease agreements for workspace rented from other 12
parties, including renewals and contractual obligations undertaken regarding 13
payment of rent, operating expenses and taxes; 14
• the coordination of activities related to the ongoing management, operation, 15
maintenance and inspection of 90 administrative/service centres, OGCC; 16
• managing support services for head office space, such as the provision of office 17
supplies, coordinating office moves and providing tenant services; and 18
• developing accommodation strategies and acquiring new employee/trades 19
workspace in line with operational requirements. 20
21
Facilities expenses include, but are not limited to, leasing costs, contract management 22
costs for head office, as well as costs for administrative facilities, service centres, and 23
other work locations (for example, the London Call Centre). A significant portion of the 24
facilities’ workload needs are met using outsourcing partners, such as Brookfield Global 25
Integrated Solutions, as described in Exhibit C1, Tab 3, Schedule 2. Facilities costs are 26
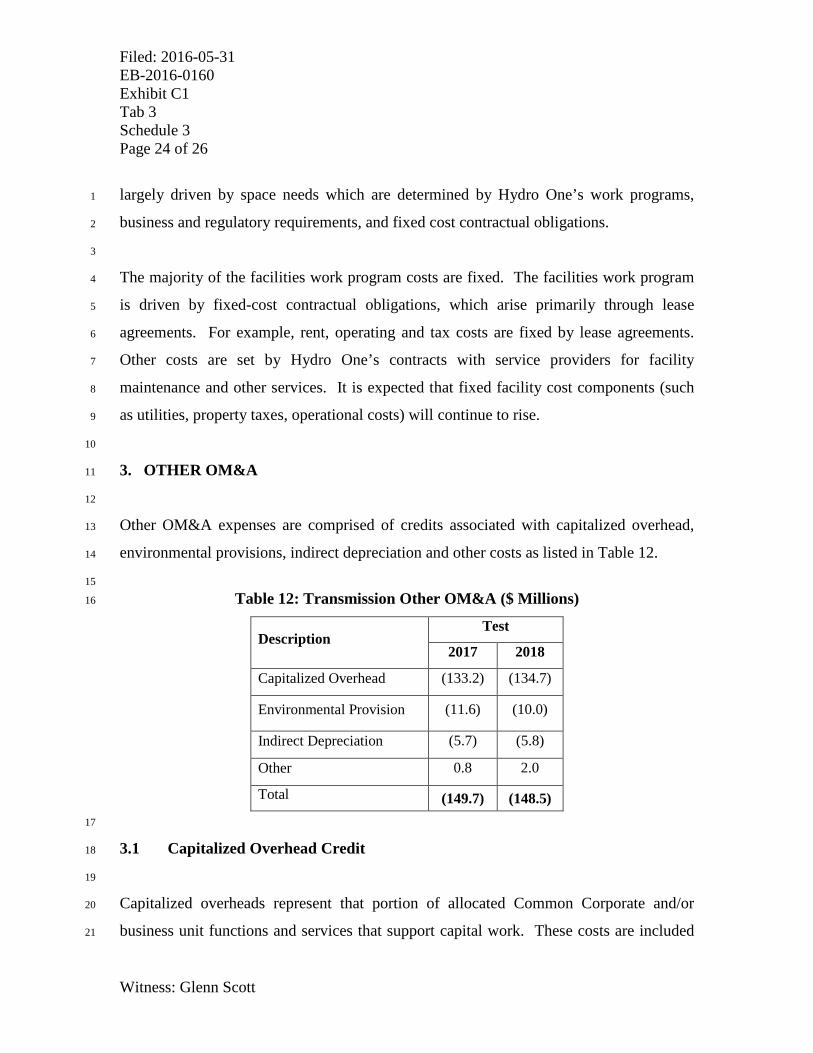
Filed: 2016-05-31 EB-2016-0160 Exhibit C1 Tab 3 Schedule 3 Page 24 of 26
Witness: Glenn Scott
largely driven by space needs which are determined by Hydro One’s work programs, 1
business and regulatory requirements, and fixed cost contractual obligations. 2
3
The majority of the facilities work program costs are fixed. The facilities work program 4
is driven by fixed-cost contractual obligations, which arise primarily through lease 5
agreements. For example, rent, operating and tax costs are fixed by lease agreements. 6
Other costs are set by Hydro One’s contracts with service providers for facility 7
maintenance and other services. It is expected that fixed facility cost components (such 8
as utilities, property taxes, operational costs) will continue to rise. 9
10
3. OTHER OM&A 11
12
Other OM&A expenses are comprised of credits associated with capitalized overhead, 13
environmental provisions, indirect depreciation and other costs as listed in Table 12. 14
15
Table 12: Transmission Other OM&A ($ Millions) 16
Description Test
2017 2018
Capitalized Overhead (133.2) (134.7)
Environmental Provision (11.6) (10.0)
Indirect Depreciation (5.7) (5.8)
Other 0.8 2.0
Total (149.7) (148.5) 17
3.1 Capitalized Overhead Credit 18
19
Capitalized overheads represent that portion of allocated Common Corporate and/or 20
business unit functions and services that support capital work. These costs are included 21

Filed: 2016-05-31 EB-2016-0160 Exhibit C1 Tab 3 Schedule 3 Page 25 of 26
Witness: Glenn Scott
in Common Corporate services and in the lines of businesses. OM&A expenses are thus 1
reduced by the capitalized amounts. 2
3
Capitalized OM&A costs are charged to capital work based on a capital overhead rate 4
derived from the allocation and capitalization studies performed by Black & Veatch, as 5
described in Exhibit B1, Tab 3, Schedules 9 and 10. 6
7
3.2 Environmental Provision 8
9
In 2001, Hydro One first recognized a liability on its balance sheet for the present value 10
of the future estimated environmental expenditures needed to manage the risks associated 11
with two legacy environmental issues inherited from Ontario Hydro. These risks 12
pertained to polychlorinated biphenyls and two chemically contaminated lands. Future 13
expenditures are required to inspect, test and remediate the contamination. 14
Environmental work is initially recognized in the Sustainment OM&A work program. 15
The amount is then removed from OM&A as the costs are charged to the balance sheet 16
provision. As well, the offsetting environmental regulatory asset is amortized based on 17
the pattern of expenditure. The resultant impact on revenue requirement of this 18
environmental work is nil, since the amortization expense is grouped with “Depreciation 19
and Amortization” on the operating statement. 20
21
3.3 Indirect Depreciation 22
23
Transportation and Work Equipment (“TWE”) charges in the OM&A work programs 24
include depreciation expense associated with the asset being used. For accounting 25
classification purposes, it is necessary to remove this depreciation amount from OM&A 26
work programs and appropriately charge it as a depreciation expense. The credit 27
Filed: 2016-05-31 EB-2016-0160 Exhibit C1 Tab 3 Schedule 3 Page 26 of 26
Witness: Glenn Scott
increases in the test years due to the expanded use of TWE in the larger Sustainment, 1
Development and Operations work programs. 2
3
3.4 Other Costs 4
5
These costs represent material unexpected or non-recurring expenses. For example, they 6
include items such as adjustments to provisions, vacation reserves, Gregorian or fiscal 7
adjustments and inventory adjustments. For this Application, also included in these costs 8
is the OM&A component of the Employee Share Ownership Program, the Long Term 9
Incentive Program and the union share grants described in Exhibit C1, Tab 4, Schedule 1. 10

Updated: 2016-07-20
EB-2016-0160
Exhibit C1
Tab 4
Schedule 2
Page 1 of 4
Witness: Samir Chhelavda
PENSION COSTS 1
2
1. INTRODUCTION 3
4
Hydro One Networks Inc. (“Hydro One Networks”) is a participant in the Hydro One 5
Pension Plan (“the Plan”). The Plan is a contributory, defined-benefit pension plan whose 6
members comprise represented employees of the Power Workers Union (“PWU”), the 7
Society of Energy Professionals (“Society”), non-represented Management (“MCP”) 8
employees, pensioners who were employees, and pensioners who are beneficiaries of 9
employees or pensioners. 10
11
The Plan covers Hydro One and its subsidiaries, except Haldimand Hydro and 12
Woodstock Hydro. The Plan does not segregate assets in a separate account for individual 13
subsidiaries, nor is the accrual cost of the benefit plans allocated to, or funded separately 14
by, entities within the consolidated group. Accordingly, for Hydro One Networks, the 15
Plan is accounted for as a defined contribution plan and no deferred pension asset or 16
liability is recorded on Hydro One Networks’ financial statements. 17
18
The Board has previously allowed cash payments related to pension obligations to be 19
recorded in rates (RP-1998-0001). As well, in April 2006, the OEB in its Decision with 20
Reasons, approved full recovery of Distribution pension costs included in OM&A (RP-21
2005-0020/EB-2005-0378). Pension costs were similarly approved for Transmission 22
pension costs (EB-2006-0501, EB-2008-0272, EB-2010-0002, EB-2012-0031 and EB-23
2014-0140); this treatment was continued in Hydro One Distribution’s last cost of service 24
application as well (EB-2013-0416). 25
26
The Hydro One pension cost allocated to Hydro One Networks is based on the ratio of 27
base pensionable earnings for Hydro One Networks’ staff, as compared to the total base 28

Updated: 2016-07-20
EB-2016-0160
Exhibit C1
Tab 4
Schedule 2
Page 2 of 4
pensionable earnings for all of Hydro One employees. The method of allocation of the 1
pension cost is consistent among all shared services costs, for operating and capital costs, 2
and is consistent with the methodology reviewed during RP-2005-0020/EB-2005-0378, 3
EB-2006-0501, EB-2007-0681 and EB-2008-0272, EB-2009-0096, EB-2010-0002, EB-4
2012-0031 and EB-2014-0140. 5
6
In 2014 and 2015, actual contributions were $174 million and $177 million, respectively. 7
For the Transmission business, the annual charges sought for recovery through rates for 8
the test years 2017 and 2018 are provided in the Transmission column in table below: 9
10
Table 1: Cash Pension Cost (millions, Updated) 11
2017 Cash pension cost (millions)
Pension
Costs
Transmission Distribution Other Total
OM&A $M 18 27 6 52
Capital $M 33 27
59
$M 51 54 6 111
12
2018 Cash pension cost (millions)
Pension
Costs
Transmission Distribution Other Total
OM&A $M 18 26 6 50
Capital $M 32 31
63
$M 50 57 6 113
13

Updated: 2016-07-20
EB-2016-0160
Exhibit C1
Tab 4
Schedule 2
Page 3 of 4
Witness: Samir Chhelavda
2. ACTUARIAL CALCULATION 1
2
The most recent actuarial valuation for the Plan was as at December 31, 2013. In June 3
2014, Hydro One filed this actuarial valuation with the Financial Services Commission of 4
Ontario (FSCO). 5
6
As described in Exhibit C1, Tab 4, Schedule 1, the employee contribution rate to the 7
pension plan has increased and Hydro One engaged Willis Towers Watson to provide an 8
estimate of the resultant savings to the company. These savings are reflected in cash 9
pension costs provided in the table above, as well as the pension expense that is included 10
in Hydro One’s operating and capital expenses provided in this application for the test 11
years 2017 and 2018. 12
13
Hydro One also engaged Willis Towers Watson to prepare an actuarial valuation as at 14
December 31, 2015, which was finalized in June 2016 and subsequently filed with FSCO. 15
The report is provided as Attachment 1 to this Exhibit. In addition to the recently 16
negotiated changes in employee contribution rates, the valuation also reflects updated 17
investment returns, negotiated changes in employee benefits, and refreshed actuarial 18
assumptions. As anticipated, the valuation demonstrates a further reduction in 19
transmission pension contribution operating expenses of approximately $11 million in 20
2017 and $8 million in 2018. 21
22
23
Actual contribution requirements in 2017 and 2018 may differ depending on the level of 24
base pension earnings used to compute the monthly contribution. The difference between 25
the estimated and actual pension costs will be tracked in a variance account (see Exhibit 26
F1, Tab 1, Schedule 1). 27
Filed: 2016-05-31
EB-2016-0160
Exhibit C1
Tab 4
Schedule 2
Page 4 of 4
3. PENSION PLAN GOVERNANCE AND PERFORMANCE 1
2
Hydro One is the Plan sponsor and administers the pension assets and obligations of the 3
Plan. As of December 31, 2015, the Plan had a reported net asset value of $6,746 million 4
and about 13,064 members. About 42% of the Plan’s members are active. The remaining 5
Plan members are inactive, either retired, beneficiaries of retirees, former employees 6
eligible for a deferred pension or members on long-term disability. 7
8
The Fund has consistently outperformed the benchmark made up of passive market 9
indices. In the period from June 29, 2001 (the Fund’s inception) to December 31, 2015, 10
the Fund returned 7.14% annualized while the Fund’s target benchmark is 6.92%, thus 11
outperforming its target benchmark return by 0.22%. The fund’s investments are divided 12
into asset classes and each asset class has a corresponding market index (i.e. Canadian 13
Equities market index is the S&P/TSX). The actual performance of each asset class is 14
then measured against this market index (policy benchmark). The Fund’s policy 15
benchmark is a calculated weighted average benchmark based on the Fund’s strategic 16
asset mix. 17
This document is being fi led with the Financial Services Commission of Ontario and the Canada Revenue Agency as required
by statute and contains confidential financial information regarding the plan, the plan sponsor, and the plan members.
Therefore, pursuant to subsection 20(1)(b) of the Access to Information Act (Canada), or a corresponding provision under any
comparable federal or provincial legislation, a government institution shall not disclose this document to any party as a result
of a request under the Access to Information Act (Canada) or other applicable legislation.
HYDRO ONE INC.
HYDRO ONE PENSION PLAN
Actuarial Valuation as at December 31, 2015
June 9, 2016
Registration Number: 1059104
Filed: 2016-07-20 EB-2016-0160 Exhibit C1-4-2 Attachment 1 Page 1 of 71


Hydro One Inc. Hydro One Pension Plan Actuarial Valuation as at December 31, 2015 1
http://natct.internal.towerswatson.com/clients/601835/HydroOne2016RETGeneral/Documents/Hydro One 12.31.2015 RPP Valuation VAL.doc
Table of Contents
Introduction ............................................................................................................................................. 1
Section 1: Going Concern Financial Position ..................................................................................... 4
1.1 Statement of Financial Position ............................................................................................... 4 1.2 Reconciliation of Financial Position ......................................................................................... 5 1.3 Reconciliation of Prior Year Credit Balance ............................................................................ 7
Section 2: Solvency and Hypothetical Windup Financial Position ................................................... 8
2.1 Statement of Solvency Financial Position................................................................................ 8 2.2 Hypothetical Windup Financial Position................................................................................... 9 2.3 Solvency Incremental Cost ....................................................................................................10 2.4 Determination of the Statutory Solvency Excess (Statutory Solvency Deficiency) ...............11
Section 3: Contribution Requirements ...............................................................................................13
3.1 Contributions for Current Service (Ensuing Year) .................................................................13 3.2 Contributions for Past Service ...............................................................................................14 3.3 Estimated Minimum Employer Contribution (Ensuing Year) .................................................15 3.4 Estimated Maximum Employer Contribution (Ensuing Year) ................................................16 3.5 Timing of Contributions ..........................................................................................................17 3.6 Other Statutory Contributions ................................................................................................17 3.7 Future Contribution Levels .....................................................................................................17
Section 4: Actuarial Certification and Opinion ..................................................................................18
4.1 Actuarial Certification .............................................................................................................18 4.2 Actuarial Opinion ....................................................................................................................20
Appendix A: Significant Terms of Engagement .............................................................................. A-1
Appendix B: Assets ............................................................................................................................ B-1
Appendix C: Actuarial Basis − Going Concern Valuation .............................................................. C-1
Appendix D: Actuarial Basis − Solvency and Hypothetical Windup Valuations .......................... D-1
Appendix E: Membership Data ......................................................................................................... E-1
Appendix F: Summary of Plan Provisions ....................................................................................... F-1
Appendix G: PBGF Assessment, Transfer Ratio and Solvency Ratio ..........................................G-1
Appendix H: Certificate of the Plan Administrator ......................................................................... H-1
Appendix I: Actuarial Information Summary .................................................................................... I-1


Hydro One Inc. Hydro One Pension Plan Actuarial Valuation as at December 31, 2015 1
http://natct.internal.towerswatson.com/clients/601835/HydroOne2016RETGeneral/Documents/Hydro One 12.31.2015 RPP Valuation VAL.doc
Introduction
Purpose
This report with respect to the Hydro One Pension Plan has been prepared for Hydro One Inc., the plan administrator, and presents the results of the actuarial valuation of the plan as at December 31, 2015.
The principal purposes of the report are:
l to present information on the financial position of the plan on both going concern and solvency bases;
l to review the hypothetical windup status of the plan;
l to provide the basis for employer contributions; and
l to provide certain additional information required for the administration of the plan.
This report outlines the changes in the plan’s financial situation since the previous actuarial valuation at December 31, 2013, provides the information and the actuarial opinion required by the Pension Benefits Act (Ontario) and Regulation thereto and provides the information required to maintain plan registration under the Income Tax Act (Canada) and Regulations thereto.
This report summarizes the results of the actuarial valuation and contains an actuarial opinion as an integral part of the report. Supporting detailed information on the significant terms of engagement, assets, actuarial basis, membership data and plan provisions is contained in the Appendices.
The information contained in this report was prepared for Hydro One Inc., for its internal use and for filing with the Financial Services Commission of Ontario and the Canada Revenue Agency, in connection with the actuarial valuation of the plan prepared by Towers Watson Canada Inc. (“Willis Towers Watson”). This report is not intended, nor necessarily suitable, for other parties or for other purposes. Furthermore, some results in this report are based on assumptions mandated by legislation. These results may not be appropriate for purposes other than those for which they were prepared. Further distribution of all or part of this report to other parties (except where such distribution is required by applicable legislation or except in accordance with our written agreement with Hydro One Inc.) or other use of this report is expressly prohibited without Willis Towers Watson's prior written consent. Willis Towers Watson is available to provide additional information with respect to this report to the above-mentioned intended users upon request.

Hydro One Inc. Hydro One Pension Plan
2 Actuarial Valuation as at December 31, 2015
Willis Towers Watson Confidential
Significant Events Since Previous Actuarial Valuation
Actuarial Basis
Since the previous actuarial valuation, the assumptions used in the solvency and hypothetical windup valuations have been updated to reflect market conditions at the actuarial valuation date as outlined in Appendix D. In addition, there have been changes to the going concern actuarial basis, as outlined in Appendix C.
Plan Provisions
This actuarial valuation reflects the plan provisions as at December 31, 2015 and does not make any provision for the possibility that a change or action (retroactive or otherwise) may be imposed by order of a regulatory body or a court as we were not aware of any definitive events that would require such change or action at the time this actuarial valuation was completed.
Since the previous valuation, there have been changes to the plan provisions as follows:
l Management employees who were not eligible to elect to become a member of the plan by September 30, 2015 are no longer eligible to join the plan.
l Employee contribution rates were changed as outlined in Appendix F.
l Effective January 1, 2018, a temporary bridge benefit has been added for Society represented employees hired on or after November 17, 2005 as outlined in Appendix F.
These changes had no material impact on the valuation results at December 31, 2015.
Legislative and Actuarial Standards Updates
Since the previous actuarial valuation, the Standards of Practice for Pension Commuted Values published by the Canadian Institute of Actuaries effective February 1, 2011 were revised, effective February 1, 2014, to provide for updates to the mortality assumption as promulgated from time to time by the Actuarial Standards Board (ASB). On December 4, 2014 and April 27, 2015, the ASB proposed to promulgate the use of the mortality rates underlying the 2014 Canadian Pensioners Mortality Table (CPM2014) combined with the mortality improvement scale CPM Improvement Scale B (CPM-B) for calculations, effective October 1, 2015. The updated mortality rates have been reflected for purposes of the solvency and hypothetical windup valuations.

Hydro One Inc.
Hydro One Pension Plan
Actuarial Valuation as at December 31, 2015 3
http://natct.internal.towerswatson.com/clients/601835/HydroOne2016RETGeneral/Documents/Hydro One
12.31.2015 RPP Valuation VAL.doc
Subsequent Events
We completed this actuarial valuation on June 9, 2016.
To the best of our knowledge and on the basis of our discussions with Hydro One Inc., no events
which would have a material financial effect on the actuarial valuation occurred between the actuarial
valuation date and the date this actuarial valuation was completed.

Hydro One Inc. Hydro One Pension Plan
4 Actuarial Valuation as at December 31, 2015
Willis Towers Watson Confidential
Section 1: Going Concern Financial Position
1.1 Statement of Financial Position
(dollar amounts in thousands) December 31, 2015 December 31, 2013 Going Concern Value of Assets $ 6,071,094 $ 5,204,378 Actuarial Liability Active and disabled members $ 2,208,495 $ 2,161,286 Retired members and beneficiaries 3,860,866 3,676,923 Terminated vested members 39,400 33,623 Total $ 6,108,761 $ 5,871,832 Additional voluntary contribution 20 19 Total Actuarial Liability $ 6,108,781 $ 5,871,851 Actuarial Surplus (Unfunded Actuarial Liability) $ (37,687 ) $ (667,473 ) Prior Year Credit Balance (48,000 ) (48,000 ) Actuarial Surplus (Unfunded Actuarial Liability) After Prior Year Credit Balance $ (85,687 ) $ (715,473 )
Comments:
l The financial position of the plan on a going concern basis is determined by comparing the going concern value of assets to the actuarial liability and is a reflection of the assets available for the benefits accrued in respect of credited service prior to the actuarial valuation date assuming the plan continues indefinitely.
l The prior year credit balance is employer contributions made prior to the actuarial valuation date that are in excess of the minimum required and are set aside as a reserve for application towards future contribution requirements.
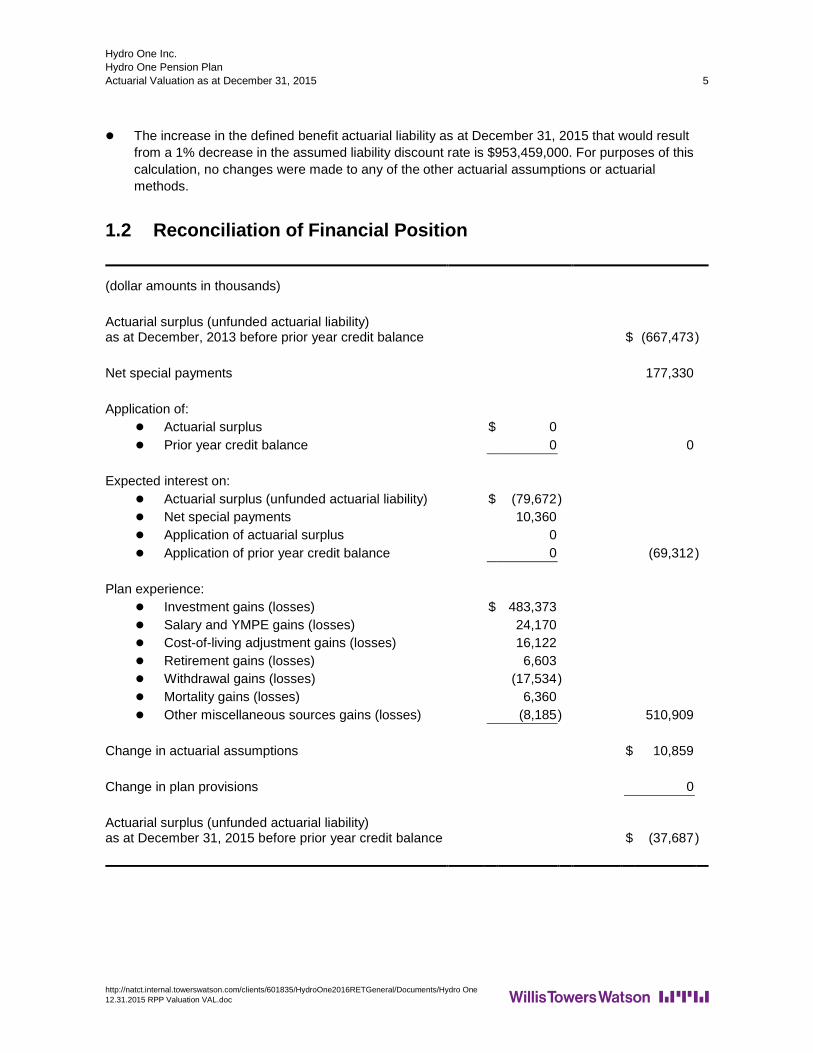
Hydro One Inc. Hydro One Pension Plan Actuarial Valuation as at December 31, 2015 5
http://natct.internal.towerswatson.com/clients/601835/HydroOne2016RETGeneral/Documents/Hydro One 12.31.2015 RPP Valuation VAL.doc
l The increase in the defined benefit actuarial liability as at December 31, 2015 that would result from a 1% decrease in the assumed liability discount rate is $953,459,000. For purposes of this calculation, no changes were made to any of the other actuarial assumptions or actuarial methods.
1.2 Reconciliation of Financial Position
(dollar amounts in thousands) Actuarial surplus (unfunded actuarial liability) as at December, 2013 before prior year credit balance $ (667,473 ) Net special payments 177,330 Application of:
l Actuarial surplus $ 0 l Prior year credit balance 0 0
Expected interest on:
l Actuarial surplus (unfunded actuarial liability) $ (79,672 ) l Net special payments 10,360 l Application of actuarial surplus 0 l Application of prior year credit balance 0 (69,312 )
Plan experience:
l Investment gains (losses) $ 483,373 l Salary and YMPE gains (losses) 24,170 l Cost-of-living adjustment gains (losses) 16,122 l Retirement gains (losses) 6,603 l Withdrawal gains (losses) (17,534 ) l Mortality gains (losses) 6,360 l Other miscellaneous sources gains (losses) (8,185 ) 510,909
Change in actuarial assumptions $ 10,859 Change in plan provisions 0 Actuarial surplus (unfunded actuarial liability) as at December 31, 2015 before prior year credit balance $ (37,687 )

Hydro One Inc. Hydro One Pension Plan
6 Actuarial Valuation as at December 31, 2015
Willis Towers Watson Confidential
Comment:
l Actual contributions do not include amounts which were reported as outstanding contributions at the current actuarial valuation date (nor any applicable interest on such outstanding amounts) but include amounts reported as outstanding contributions at the previous actuarial valuation date and contributed prior to the current actuarial valuation date.
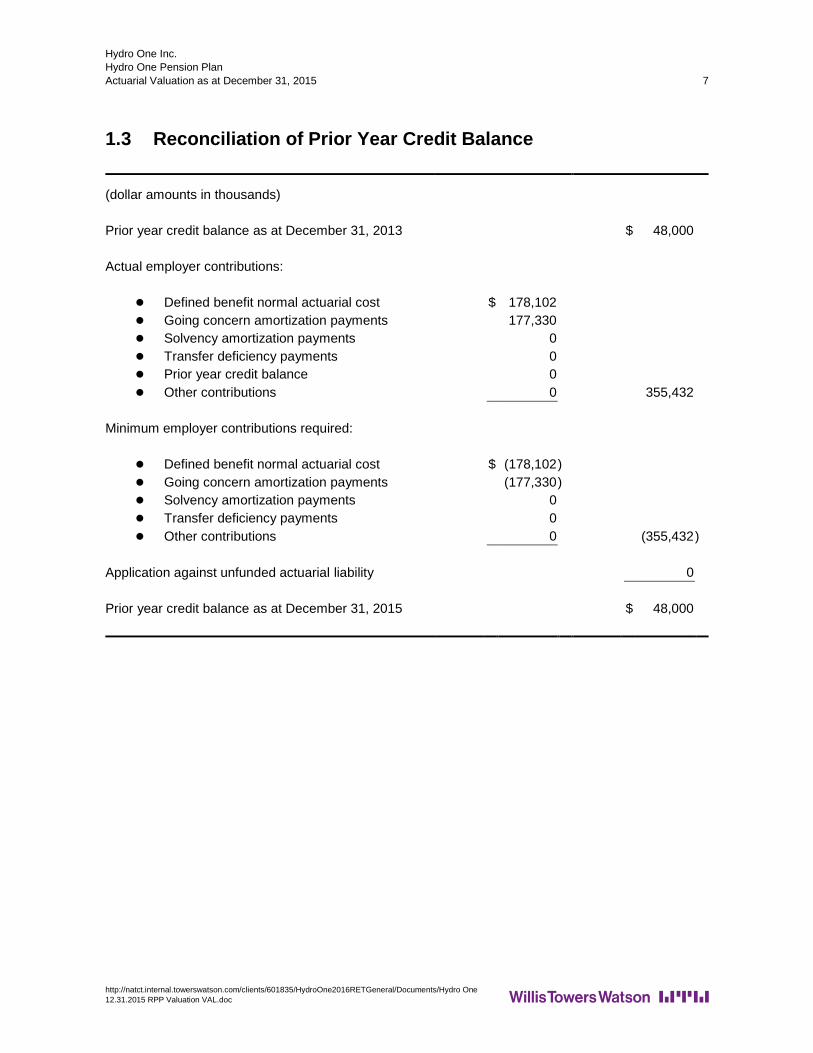
Hydro One Inc. Hydro One Pension Plan Actuarial Valuation as at December 31, 2015 7
http://natct.internal.towerswatson.com/clients/601835/HydroOne2016RETGeneral/Documents/Hydro One 12.31.2015 RPP Valuation VAL.doc
1.3 Reconciliation of Prior Year Credit Balance
(dollar amounts in thousands) Prior year credit balance as at December 31, 2013 $ 48,000 Actual employer contributions:
l Defined benefit normal actuarial cost $ 178,102 l Going concern amortization payments 177,330 l Solvency amortization payments 0 l Transfer deficiency payments 0 l Prior year credit balance 0 l Other contributions 0 355,432
Minimum employer contributions required:
l Defined benefit normal actuarial cost $ (178,102 ) l Going concern amortization payments (177,330 ) l Solvency amortization payments 0 l Transfer deficiency payments 0 l Other contributions 0 (355,432 )
Application against unfunded actuarial liability 0 Prior year credit balance as at December 31, 2015 $ 48,000
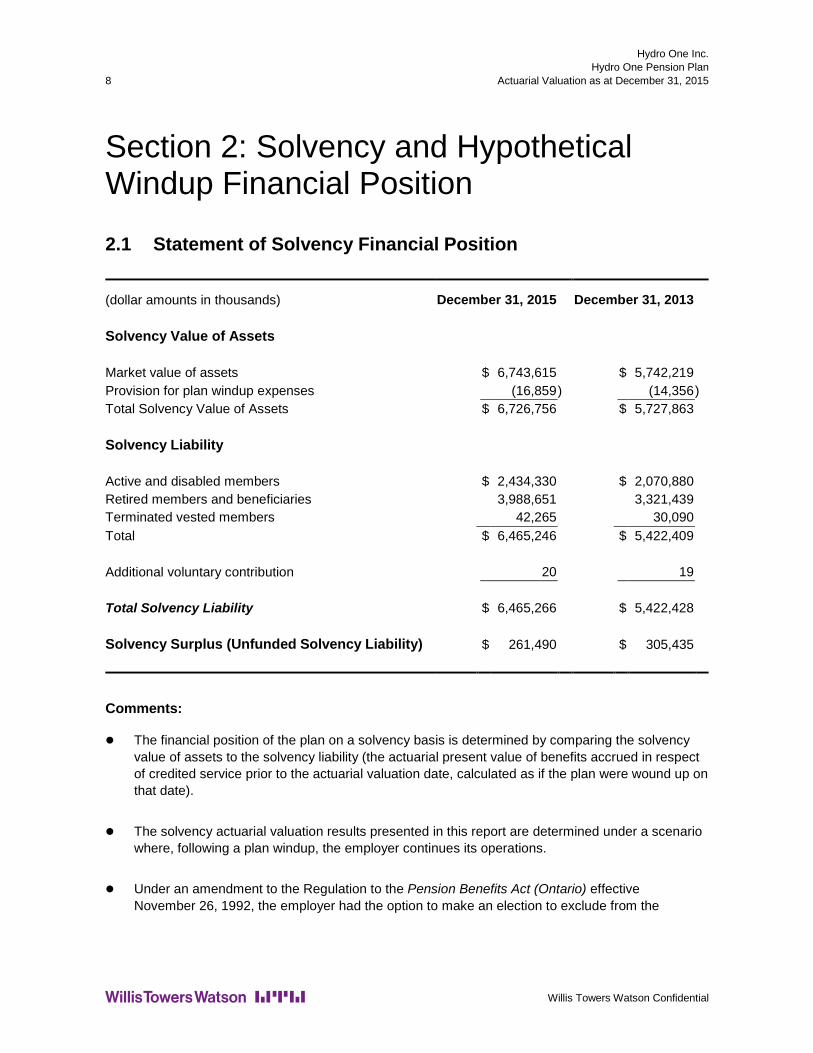
Hydro One Inc. Hydro One Pension Plan
8 Actuarial Valuation as at December 31, 2015
Willis Towers Watson Confidential
Section 2: Solvency and Hypothetical Windup Financial Position
2.1 Statement of Solvency Financial Position
(dollar amounts in thousands) December 31, 2015 December 31, 2013 Solvency Value of Assets Market value of assets $ 6,743,615 $ 5,742,219 Provision for plan windup expenses (16,859 ) (14,356 ) Total Solvency Value of Assets $ 6,726,756 $ 5,727,863 Solvency Liability Active and disabled members $ 2,434,330 $ 2,070,880 Retired members and beneficiaries 3,988,651 3,321,439 Terminated vested members 42,265 30,090 Total $ 6,465,246 $ 5,422,409 Additional voluntary contribution 20 19 Total Solvency Liability $ 6,465,266 $ 5,422,428 Solvency Surplus (Unfunded Solvency Liability) $ 261,490 $ 305,435
Comments:
l The financial position of the plan on a solvency basis is determined by comparing the solvency value of assets to the solvency liability (the actuarial present value of benefits accrued in respect of credited service prior to the actuarial valuation date, calculated as if the plan were wound up on that date).
l The solvency actuarial valuation results presented in this report are determined under a scenario where, following a plan windup, the employer continues its operations.
l Under an amendment to the Regulation to the Pension Benefits Act (Ontario) effective November 26, 1992, the employer had the option to make an election to exclude from the

Hydro One Inc. Hydro One Pension Plan Actuarial Valuation as at December 31, 2015 9
http://natct.internal.towerswatson.com/clients/601835/HydroOne2016RETGeneral/Documents/Hydro One 12.31.2015 RPP Valuation VAL.doc
solvency liability any benefits relating to plant closure and permanent layoff. This plan does not have any such benefits.
l In addition, the Regulation permits certain benefits to be excluded from the solvency liability, without requiring the employer to make an election. Pursuant to the directions from the plan administrator, the value of benefits attributable to future indexation of benefits have been excluded from the solvency valuation. The full defined benefit hypothetical windup liability, taking into account the benefits excluded under the Regulation, is $9,545,090,000 as at December 31, 2015.
l The increase in the defined benefit solvency liability as at December 31, 2015 that would result from a 1% decrease in the assumed liability discount rate is $937,161,000. For purposes of this calculation, no changes were made to any of the other actuarial assumptions or actuarial methods.
2.2 Hypothetical Windup Financial Position
The hypothetical windup valuation results presented in this report are determined under the same scenario used for the solvency valuation.
If the plan were to be wound up on the actuarial valuation date, the hypothetical windup value of assets would be equal to the solvency value of assets. As permitted by the Regulation to the Pension Benefits Act (Ontario), the employer has elected to exclude certain benefits from the solvency liability. The full hypothetical windup liability, taking into account all of the benefits excluded under the Regulation, is $9,545,090,000 as at December 31, 2015. Consequently, the hypothetical windup surplus (unfunded hypothetical windup liability) as at the actuarial valuation date is $(2,818,334,000).
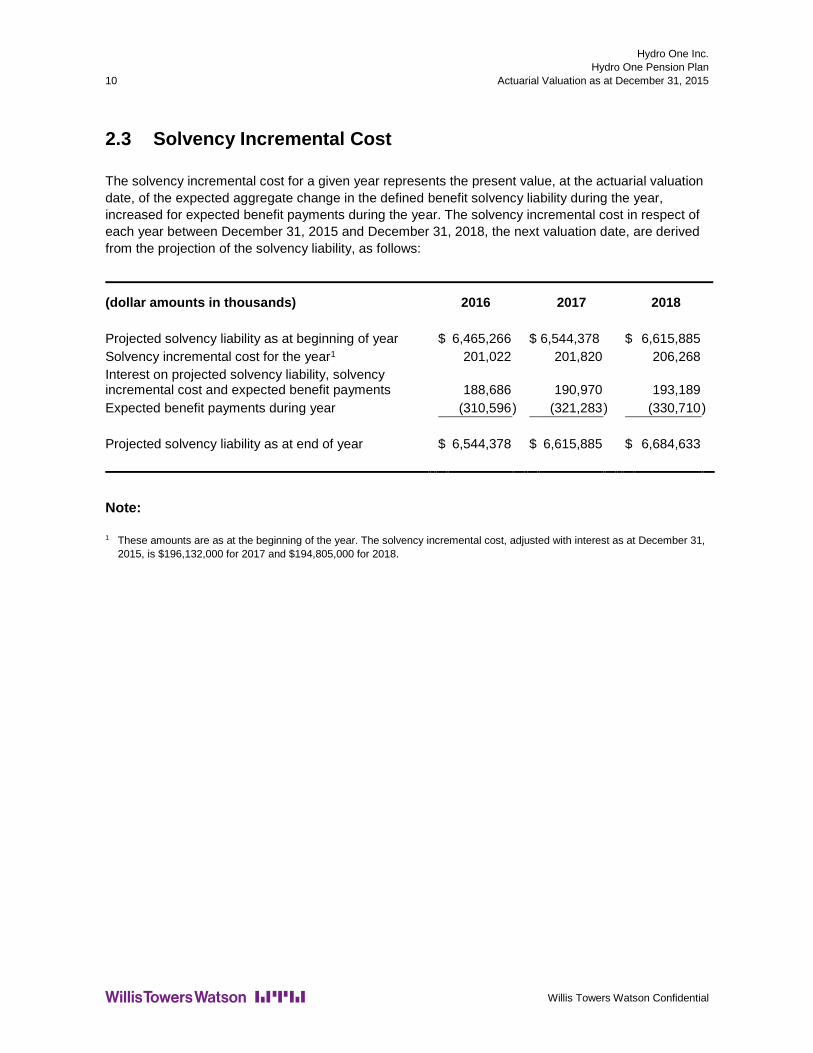
Hydro One Inc. Hydro One Pension Plan
10 Actuarial Valuation as at December 31, 2015
Willis Towers Watson Confidential
2.3 Solvency Incremental Cost
The solvency incremental cost for a given year represents the present value, at the actuarial valuation date, of the expected aggregate change in the defined benefit solvency liability during the year, increased for expected benefit payments during the year. The solvency incremental cost in respect of each year between December 31, 2015 and December 31, 2018, the next valuation date, are derived from the projection of the solvency liability, as follows:
(dollar amounts in thousands) 2016 2017 2018 Projected solvency liability as at beginning of year $ 6,465,266 $ 6,544,378 $ 6,615,885 Solvency incremental cost for the year1 201,022 201,820 206,268 Interest on projected solvency liability, solvency incremental cost and expected benefit payments 188,686
190,970 193,189
Expected benefit payments during year (310,596 ) (321,283 ) (330,710 ) Projected solvency liability as at end of year $ 6,544,378 $ 6,615,885 $ 6,684,633
Note:
1 These amounts are as at the beginning of the year. The solvency incremental cost, adjusted with interest as at December 31, 2015, is $196,132,000 for 2017 and $194,805,000 for 2018.
Hydro One Inc. Hydro One Pension Plan Actuarial Valuation as at December 31, 2015 11
http://natct.internal.towerswatson.com/clients/601835/HydroOne2016RETGeneral/Documents/Hydro One 12.31.2015 RPP Valuation VAL.doc
2.4 Determination of the Statutory Solvency Excess (Statutory Solvency Deficiency)
The minimum funding requirements under the Regulation to the Pension Benefits Act (Ontario) are based on the statutory solvency excess (statutory solvency deficiency) as at the actuarial valuation date. In calculating the statutory solvency excess (statutory solvency deficiency), various adjustments can be made to the solvency financial position including:
l recognition of the present value of existing amortization payments, including any going concern amortization payments established at the actuarial valuation date, due to be paid within the periods prescribed by the Regulation;
l smoothing of the asset value by use of an averaging technique;
l adjustment to the solvency liability by use of an averaging technique in determining the discount rate used to value the liabilities; and
l removal of any prior year credit balance from the asset value.
To the extent that there exists a statutory solvency deficiency, after taking account of these adjustments, additional amortization payments must be made. If there is no statutory solvency deficiency, the statutory solvency excess may be used to reduce the period of any existing solvency amortization payments.
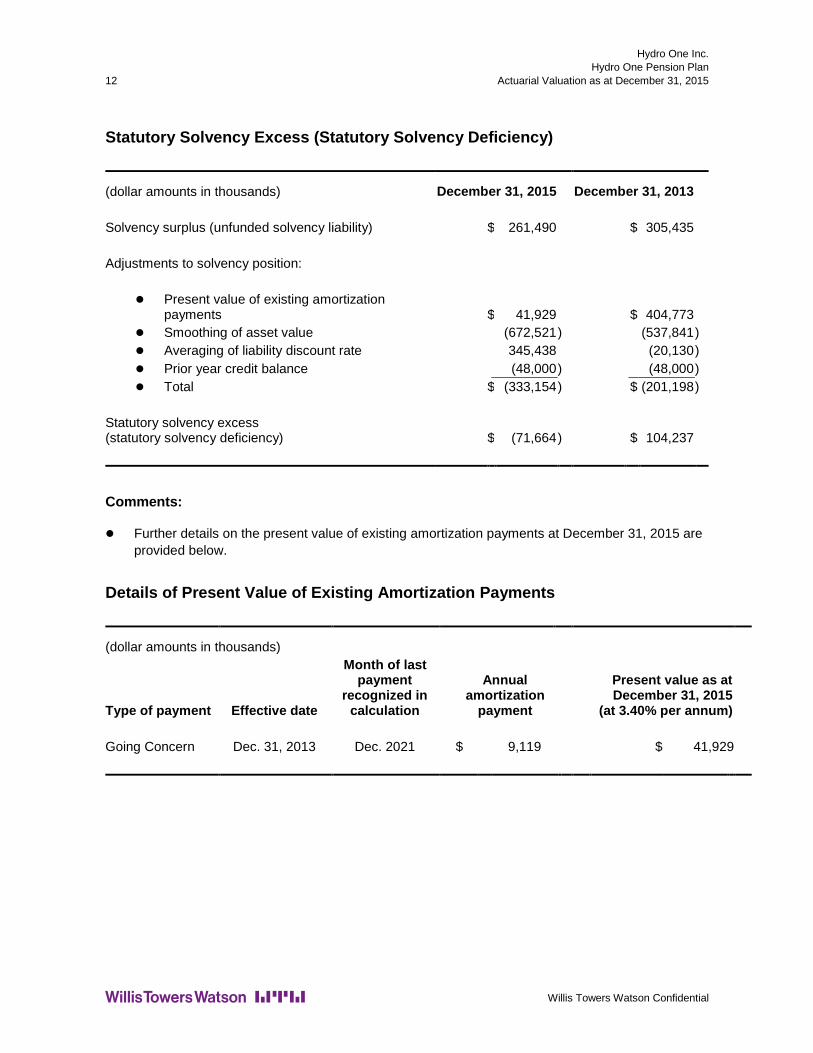
Hydro One Inc. Hydro One Pension Plan
12 Actuarial Valuation as at December 31, 2015
Willis Towers Watson Confidential
Statutory Solvency Excess (Statutory Solvency Deficiency)
(dollar amounts in thousands) December 31, 2015 December 31, 2013 Solvency surplus (unfunded solvency liability) $ 261,490 $ 305,435 Adjustments to solvency position:
l Present value of existing amortization payments $ 41,929 $ 404,773
l Smoothing of asset value (672,521 ) (537,841 ) l Averaging of liability discount rate 345,438 (20,130 ) l Prior year credit balance (48,000 ) (48,000 ) l Total $ (333,154 ) $ (201,198 )
Statutory solvency excess (statutory solvency deficiency) $ (71,664 ) $ 104,237
Comments:
l Further details on the present value of existing amortization payments at December 31, 2015 are provided below.
Details of Present Value of Existing Amortization Payments
(dollar amounts in thousands)
Type of payment Effective date
Month of last payment
recognized in calculation
Annual amortization
payment
Present value as at December 31, 2015
(at 3.40% per annum)
Going Concern Dec. 31, 2013 Dec. 2021 $ 9,119 $ 41,929
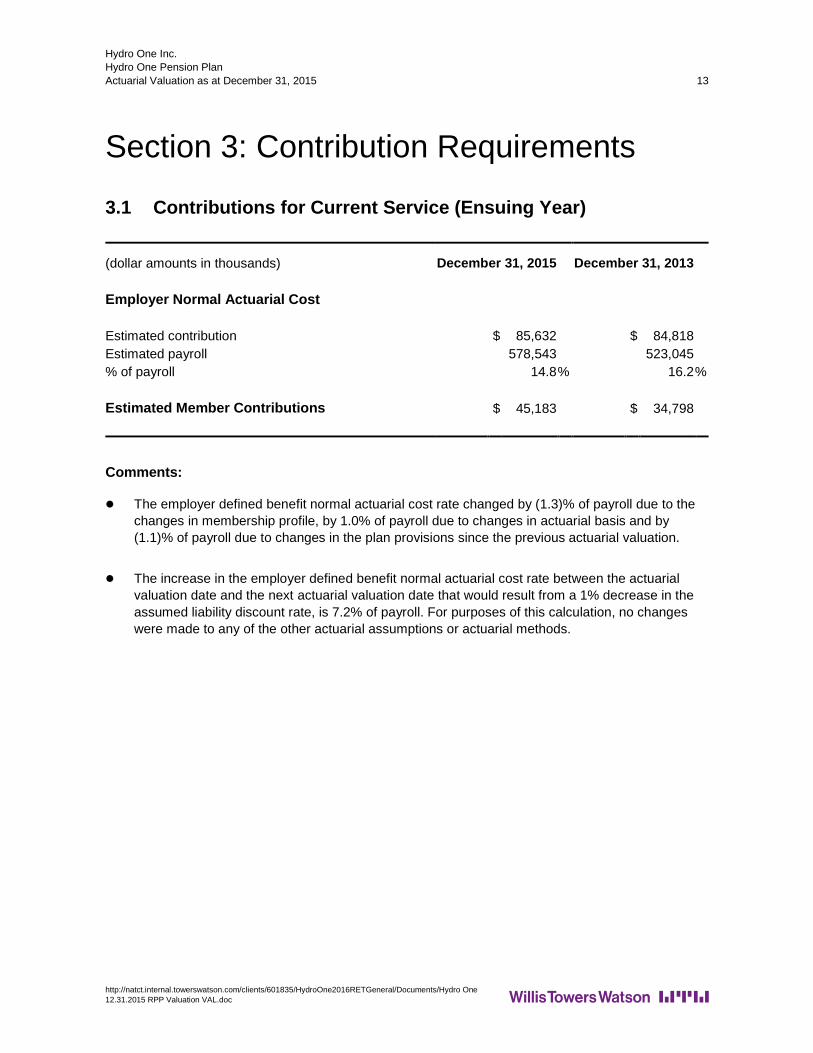
Hydro One Inc. Hydro One Pension Plan Actuarial Valuation as at December 31, 2015 13
http://natct.internal.towerswatson.com/clients/601835/HydroOne2016RETGeneral/Documents/Hydro One 12.31.2015 RPP Valuation VAL.doc
Section 3: Contribution Requirements
3.1 Contributions for Current Service (Ensuing Year)
(dollar amounts in thousands) December 31, 2015 December 31, 2013 Employer Normal Actuarial Cost Estimated contribution $ 85,632 $ 84,818 Estimated payroll 578,543 523,045 % of payroll 14.8 % 16.2 % Estimated Member Contributions $ 45,183 $ 34,798
Comments:
l The employer defined benefit normal actuarial cost rate changed by (1.3)% of payroll due to the changes in membership profile, by 1.0% of payroll due to changes in actuarial basis and by (1.1)% of payroll due to changes in the plan provisions since the previous actuarial valuation.
l The increase in the employer defined benefit normal actuarial cost rate between the actuarial valuation date and the next actuarial valuation date that would result from a 1% decrease in the assumed liability discount rate, is 7.2% of payroll. For purposes of this calculation, no changes were made to any of the other actuarial assumptions or actuarial methods.

Hydro One Inc. Hydro One Pension Plan
14 Actuarial Valuation as at December 31, 2015
Willis Towers Watson Confidential
3.2 Contributions for Past Service
Going Concern Amortization Payments
The unfunded actuarial liability, adjusted for the prior year credit balance, is $85,687,000. The going concern amortization payments from the previous actuarial valuation have been eliminated or reduced such that the present value of the remaining payment schedule is equal to the unfunded actuarial liability. The unfunded actuarial liability must be liquidated by employer amortization payments at least equal to the amounts, payable monthly in arrears, and for the periods set forth below in order to comply with the Regulation to the Pension Benefits Act (Ontario).
(dollar amounts in thousands)
Effective date Month of
last payment
Annual amortization
payment
Present value as at December 31, 2015
(at 5.40% per annum) Dec. 31, 2013 Dec. 2028 $ 9,119 $ 85,687
Solvency Amortization Payments
The statutory solvency deficiency revealed at this actuarial valuation is $71,664,000. This statutory solvency deficiency must be liquidated by employer amortization payments at least equal to the amounts, payable monthly in arrears, and for the periods set forth below in order to comply with the Regulation to the Pension Benefits Act (Ontario).
(dollar amounts in thousands)
Effective date Month of
last payment
Annual amortization
payment
Present value as at December 31, 2015
(at 3.40% per annum) Dec. 31, 2015 Dec. 2020 $ 15,586 $ 71,664
The employer may establish a letter of credit in order to cover all of or a portion of the above amortization payments, to the extent the letter(s) of credit does not exceed 15% of the solvency liabilities.

Hydro One Inc. Hydro One Pension Plan Actuarial Valuation as at December 31, 2015 15
http://natct.internal.towerswatson.com/clients/601835/HydroOne2016RETGeneral/Documents/Hydro One 12.31.2015 RPP Valuation VAL.doc
3.3 Estimated Minimum Employer Contribution (Ensuing Year)
(dollar amounts in thousands) December 31, 2015 December 31, 2013 Employer Normal Actuarial Cost $ 85,632 $ 84,818 Amortization Payments Going concern $ 9,119 $ 88,665 Solvency 15,586 0 Total $ 24,705 $ 88,665 Estimated Minimum Employer Contribution1 $ 110,337 $ 173,483
Note:
1 Prior to any application of the prior year credit balance.
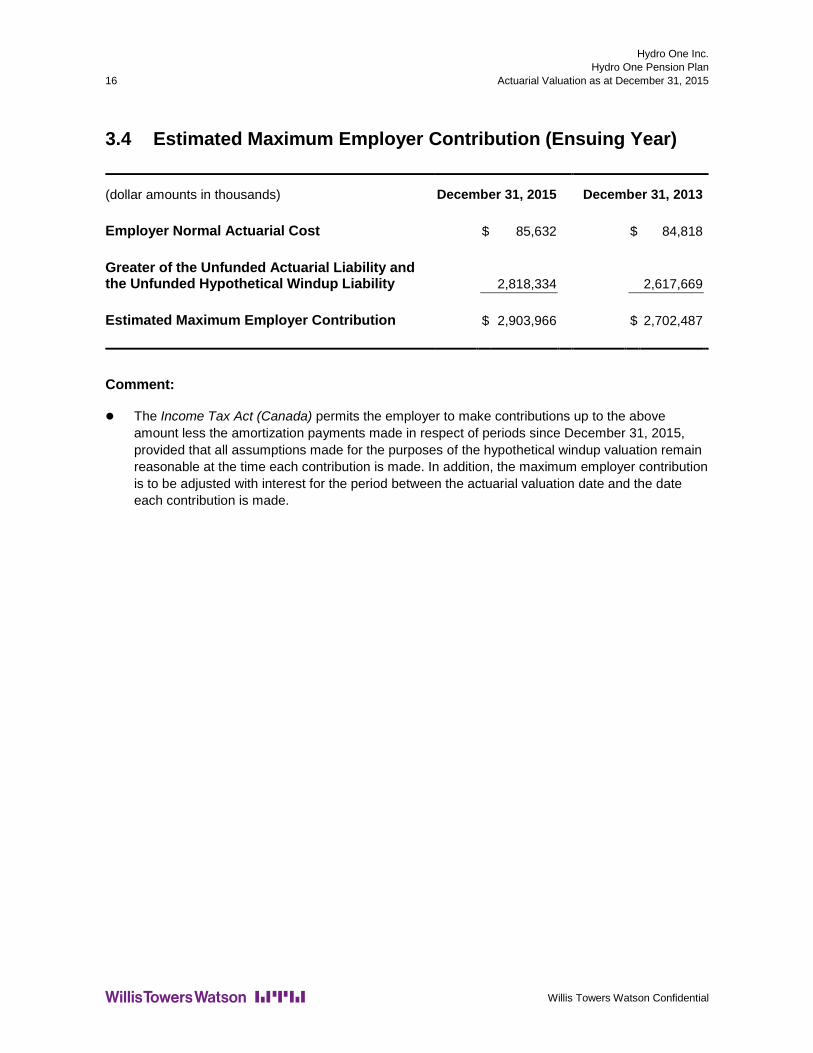
Hydro One Inc. Hydro One Pension Plan
16 Actuarial Valuation as at December 31, 2015
Willis Towers Watson Confidential
3.4 Estimated Maximum Employer Contribution (Ensuing Year)
(dollar amounts in thousands) December 31, 2015 December 31, 2013 Employer Normal Actuarial Cost $ 85,632 $ 84,818 Greater of the Unfunded Actuarial Liability and the Unfunded Hypothetical Windup Liability 2,818,334 2,617,669 Estimated Maximum Employer Contribution $ 2,903,966 $ 2,702,487
Comment:
l The Income Tax Act (Canada) permits the employer to make contributions up to the above amount less the amortization payments made in respect of periods since December 31, 2015, provided that all assumptions made for the purposes of the hypothetical windup valuation remain reasonable at the time each contribution is made. In addition, the maximum employer contribution is to be adjusted with interest for the period between the actuarial valuation date and the date each contribution is made.

Hydro One Inc. Hydro One Pension Plan Actuarial Valuation as at December 31, 2015 17
http://natct.internal.towerswatson.com/clients/601835/HydroOne2016RETGeneral/Documents/Hydro One 12.31.2015 RPP Valuation VAL.doc
3.5 Timing of Contributions
To satisfy the requirements of Ontario pension legislation, the employer normal actuarial cost must be paid monthly and within 30 days of the month to which it pertains while the amortization payments must also be paid monthly but within the period to which they are applicable. Members' contributions must be remitted to the fund monthly and within 30 days of the month to which they pertain.
In addition, within 60 days after this report is filed with the Financial Services Commission of Ontario, the employer must make a special contribution equal to the excess, if any, of:
l the amount of employer contributions (employer normal actuarial cost and amortization payments) that should have been paid after December 31, 2015 according to the minimum contribution requirements revealed by this report (determined with regard to any reported prior year credit balance available to meet these minimum contribution requirements), over
l the actual amount of employer contributions made in respect of periods after December 31, 2015.
Interest must be added to this excess, with such interest determined by reference to the going concern discount rate for payments in respect of employer normal actuarial cost or going concern amortization payments and the solvency discount rate for payments in respect of solvency amortization payments.
To satisfy the requirements of the Income Tax Act (Canada), employer contributions that are remitted to the plan in the taxation year or within 120 days after the end of such taxation year are deductible in such taxation year provided they were made to fund benefits in respect of periods preceding the end of the taxation year.
3.6 Other Statutory Contributions
Additional contributions may be required in respect of the transfer values for members who terminate employment or active plan membership. Where applicable, such additional contributions must be remitted before the related transfer value may be paid in full to the terminated member. Details are provided in Appendix G.
3.7 Future Contribution Levels
Future contribution levels may change as a result of future changes in the actuarial methods and assumptions, the membership data, the plan provisions and the legislative rules, or as a result of future experience gains or losses, none of which have been anticipated at this time. Emerging experience, differing from the assumptions, will result in gains or losses that will be revealed in future actuarial valuations.

Hydro One Inc. Hydro One Pension Plan
18 Actuarial Valuation as at December 31, 2015
Willis Towers Watson Confidential
Section 4: Actuarial Certification and Opinion
4.1 Actuarial Certification
Based on the results of these actuarial valuations, we hereby certify that, in our opinion, as at December 31, 2015:
l The plan has a prior year credit balance of $48,000,000. The employer may use this prior year credit balance to meet the future contribution requirements of the plan.
l The actuarial surplus (unfunded actuarial liability), determined by comparing the actuarial liability, the measure of obligations of the plan on a going concern basis, to the going concern value of assets, is $(37,687,000).
l The unfunded actuarial liability, adjusted for the prior year credit balance, is $85,687,000 and must be liquidated by employer amortization payments at least equal to the amounts and for the periods set forth in Section 3 in order to comply with the Regulation to the Pension Benefits Act (Ontario).
l The solvency surplus (unfunded solvency liability), determined by comparing the solvency liability, as defined in the Regulation to the Pension Benefits Act (Ontario), to the solvency value of assets, is $261,490,000.
l The statutory solvency excess (statutory solvency deficiency) revealed at this actuarial valuation is $(71,664,000). This statutory solvency deficiency must be liquidated by employer amortization payments at least equal to the amounts and for the periods set forth in Section 3 in order to comply with the Regulation to the Pension Benefits Act (Ontario).
l The hypothetical windup surplus (unfunded hypothetical windup liability), determined by comparing the hypothetical windup liability, the measure of the obligations of the plan on a hypothetical windup basis including the value of any potential obligations that may have been excluded for purposes of the solvency valuation, to the hypothetical windup value of assets, is $(2,818,334,000).
l The excess actuarial surplus, pursuant to section 147.2(2) of the Income Tax Act (Canada), is $0.
l The rule for computing the employer defined benefit normal actuarial cost is outlined in the table below. Based on the plan membership used for this actuarial valuation (assuming no new

Hydro One Inc. Hydro One Pension Plan Actuarial Valuation as at December 31, 2015 19
http://natct.internal.towerswatson.com/clients/601835/HydroOne2016RETGeneral/Documents/Hydro One 12.31.2015 RPP Valuation VAL.doc
entrants) and the scheduled increases in the employee contribution rates disclosed in the summary of plan provisions, the normal actuarial cost for the next three years is estimated to be:
(dollar amounts in thousands) 2016 2017 2018 Estimated employer normal actuarial cost $ 85,632 79,932 77,446 Estimated payroll 578,543 564,507 554,853 % of payroll 14.8 % 14.2 % 14.0 % Estimated member contributions $ 45,183 47,870 49,267
The employer is required to make normal actuarial cost contributions to the plan in accordance with the above rule until the effective date of the next actuarial opinion.
l The maximum employer contributions permissible under the Income Tax Act (Canada) are described in Section 3.
l The transfer ratio, as defined in the Regulation to the Pension Benefits Act (Ontario), is 0.70. The solvency ratio, defined as the ratio of the solvency value of assets prior to deduction of the provision for plan windup expenses to the solvency liabilities, is not less than 1.00.
l The assessment base determined for the Pension Benefits Guarantee Fund (PBGF) is $0. The PBGF liabilities are $6,465,246,000. Additional liabilities for excluded plant closure benefits, in accordance with section 37(4)(a)(ii) of the Regulation to the Pension Benefits Act (Ontario), are $0.
l In accordance with the Regulation to the Pension Benefits Act (Ontario), the next actuarial valuation should be performed with an effective date not later than December 31, 2018. The basis for employer contributions presented in this report is effective until the next actuarial opinion is filed.
Hydro One Inc.
Hydro One Pension Plan
20 Actuarial Valuation as at December 31, 2015
Willis Towers Watson Confidential
4.2 Actuarial Opinion
In our opinion:
the membership data on which the actuarial valuations are based are sufficient and reliable for
the purposes of the going concern, solvency and hypothetical windup valuations,
the assumptions are appropriate for the purposes of the going concern, solvency and hypothetical
windup valuations, and
the methods employed in the actuarial valuations are appropriate for the purposes of the going
concern, solvency and hypothetical windup valuations.
This report has been prepared, and our opinion has been given, in accordance with accepted actuarial
practice in Canada. The actuarial valuations have been conducted in accordance with our
understanding of the funding and solvency standards prescribed by the Pension Benefits Act (Ontario)
and Regulation thereto, and in accordance with our understanding of the requirements of the Income
Tax Act (Canada) and Regulations thereto. This actuarial opinion forms an integral part of the report.
The results presented in this report have been developed using a particular set of actuarial
assumptions. Other results could have been developed by selecting different actuarial assumptions.
The results presented in this report are reasonable actuarial results based on actuarial assumptions
reflecting our expectation of future events.
Towers Watson Canada Inc.
David Kenny
Fellow of the Canadian Institute of Actuaries
Suzanne Jacques
Fellow of the Canadian Institute of Actuaries
Toronto, Ontario
June 9, 2016

Hydro One Inc. Hydro One Pension Plan Actuarial Valuation as at December 31, 2015 A–1
http://natct.internal.towerswatson.com/clients/601835/HydroOne2016RETGeneral/Documents/Hydro One 12.31.2015 RPP Valuation APP.doc
Appendix A: Significant Terms of Engagement For purposes of preparing this actuarial valuation report, the plan administrator has directed that:
l The actuarial valuation is to be prepared as at December 31, 2015.
l For purposes of the going concern valuation, the terms of engagement require the use of the margins for adverse deviations mentioned in Appendix C.
l For purposes of determining the going concern liability discount rate, the target asset class distribution is to be established in accordance with the investment policy dated November 12, 2015, which is the most up to date version. There are no expectations that this asset class distribution will be modified in the future.
l For purposes of determining the going concern financial position of the plan, the going concern value of assets is to be determined using the averaging technique described in the Asset Valuation Method section in Appendix C.
l For purposes of determining the solvency liabilities of the plan, the value of benefits arising from future indexation are to be excluded, as permitted by the Regulation to the Pension Benefits Act (Ontario), without requiring an election from the employer.
l For purposes of determining the statutory solvency financial position of the plan, the asset value and liability discount rates are to be determined using the averaging techniques described in the Asset Valuation Method and Rationale for Actuarial Assumptions sections in Appendix D.
l Since to the best of the knowledge of the plan administrator, there is no partial plan windup with an effective date prior to the date of this actuarial valuation, involving members employed in Ontario, not yet completed where the partial windup portion of the plan is in a surplus position on the date of this actuarial valuation, this report is to be prepared on the basis that there will be no retroactive changes to previously filed partial windup reports, if any, and neither the applicable pension regulator nor the plan sponsor will order/declare any partial plan windup with an effective date prior to the actuarial valuation date.
l The solvency and hypothetical windup valuation results presented in this report are to be determined under a scenario where the employer continues to operate and certain expenses are paid from the pension fund (consistent with past practice) while the employer pays other plan expenses.
Hydro One Inc. Hydro One Pension Plan
A–2 Actuarial Valuation as at December 31, 2015
Willis Towers Watson Confidential
l This report is to be prepared on the basis that the employer is entitled to apply the actuarial surplus, if any, revealed in an actuarial valuation report to meet its contribution requirements under the plan while the plan remains a going concern, to the extent permitted by applicable pension legislation. (This report does not address the disposition of any surplus assets remaining in the event of plan windup.) If an applicable pension regulator or other entity with jurisdiction directs otherwise, certain financial measures contained in this report, including contribution requirements, may be affected.
Should these directions from the plan administrator be amended or withdrawn, Willis Towers Watson reserves the right to amend or withdraw this report.

Hydro One Inc. Hydro One Pension Plan Actuarial Valuation as at December 31, 2015 B–1
http://natct.internal.towerswatson.com/clients/601835/HydroOne2016RETGeneral/Documents/Hydro One 12.31.2015 RPP Valuation APP.doc
Appendix B: Assets
Statement of Market Value
(dollar amounts in thousands) December 31, 2015 December 31, 2013 Total assets $ 6,745,869 $ 5,743,450 Net additional outstanding amounts: l Contributions receivable $ 0 $ 0 l Benefits payable (2,254 ) (1,231 ) l Investment income receivable 0 0 l Total net outstanding amounts $ (2,254 ) $ (1,231 ) Total $ 6,743,615 $ 5,742,219
Comments:
l The invested assets are held by CIBC Mellon under account OHSG10000000.
l The data relating to the invested assets are based on the financial statements issued by KPMG. The data relating to net outstanding amounts were furnished by Hydro One Inc. All such data have been relied upon by Willis Towers Watson following tests of reasonableness with respect to contributions, benefit payments and investment income. However, Willis Towers Watson has not independently audited or verified these data.

Hydro One Inc. Hydro One Pension Plan
B–2 Actuarial Valuation as at December 31, 2015
Willis Towers Watson Confidential
Asset Class Distribution
The following table shows the target asset allocation stipulated by the plan’s defined benefit component investment policy in respect of various major asset classes and the actual asset allocation as at December 31, 2015.
Target asset allocation 1
Asset allocation as at December 31, 2015 2
Canadian equities 12 % 12 % Foreign equities 38 % 47 % Bonds and debentures 33 % 34 % Real estate and infrastructure 10 % 1 % Cash and short-term investments 2 % 4 % Private Equities 5 % 2 % Total 100 % 100 %
Notes:
1 This information was obtained from the investment policy in effect for the plan as at December 31, 2015. The target asset allocation is expected to remain in effect indefinitely and there are no expectations that the allocation will change in the future.
2 This information was obtained from Hydro One Inc. All such data have been relied upon by Willis Towers Watson and compared against the target asset allocation to assess reasonableness. However, Willis Towers Watson has not independently audited or verified these data.

Hydro One Inc. Hydro One Pension Plan Actuarial Valuation as at December 31, 2015 B–3
http://natct.internal.towerswatson.com/clients/601835/HydroOne2016RETGeneral/Documents/Hydro One 12.31.2015 RPP Valuation APP.doc
Reconciliation of Assets
(dollar amounts in thousands) Assets as at December 31, 2013 $ 5,743,450 Receipts: l Contributions:
– Employer normal actuarial cost $ 178,102 – Employer amortization payments 177,330 – Employer transfer deficiency payments 0 – Members' current service contributions 74,173 – Past service contributions 842 – Reciprocal transfers 267 – Provision for non-investment expenses 0 $ 430,714
l Investment return, net of investment expenses 1,283,944 l Total receipts $ 1,714,658 Disbursements: l Benefit payments:
– Pension payments $ (579,658 ) – Lump sum settlements (75,173 ) – Other benefit payments 0 $ (654,831 )
l Non-investment expenses (57,408 ) l Total disbursements $ (712,239 ) Assets as at December 31, 2015 $ 6,745,869
Comments:
l This reconciliation is based on the financial statements issued by KPMG. All such data have been relied upon by Willis Towers Watson following tests of reasonableness with respect to contributions, benefit payments and investment income. However, Willis Towers Watson has not independently audited or verified these data.
l The rate of return earned on the market value of assets, net of all expenses, from December 31, 2013 to December 31, 2015 is approximately 10.4% per annum.
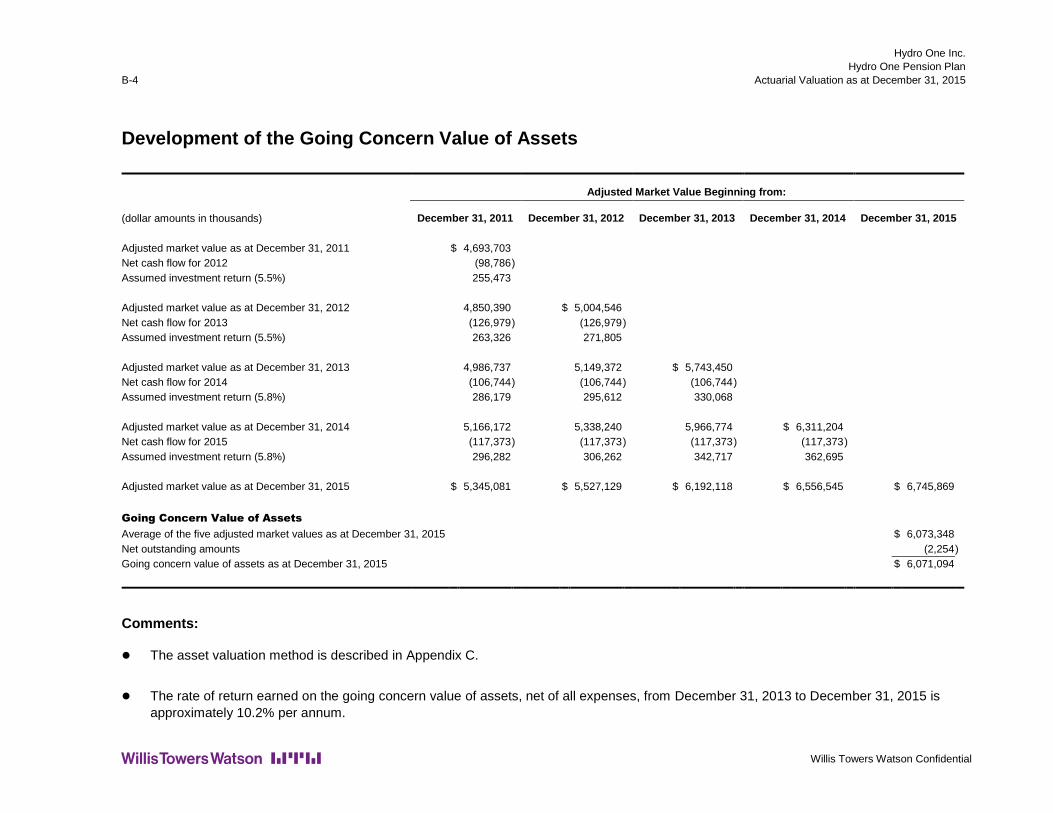
Hydro One Inc. Hydro One Pension Plan
B-4 Actuarial Valuation as at December 31, 2015
Willis Towers Watson Confidential
Development of the Going Concern Value of Assets
Adjusted Market Value Beginning from:
(dollar amounts in thousands) December 31, 2011 December 31, 2012 December 31, 2013 December 31, 2014 December 31, 2015 Adjusted market value as at December 31, 2011 $ 4,693,703 Net cash flow for 2012 (98,786 ) Assumed investment return (5.5%) 255,473 Adjusted market value as at December 31, 2012 4,850,390 $ 5,004,546 Net cash flow for 2013 (126,979 ) (126,979 ) Assumed investment return (5.5%) 263,326 271,805 Adjusted market value as at December 31, 2013 4,986,737 5,149,372 $ 5,743,450 Net cash flow for 2014 (106,744 ) (106,744 ) (106,744 ) Assumed investment return (5.8%) 286,179 295,612 330,068 Adjusted market value as at December 31, 2014 5,166,172 5,338,240 5,966,774 $ 6,311,204 Net cash flow for 2015 (117,373 ) (117,373 ) (117,373 ) (117,373 ) Assumed investment return (5.8%) 296,282 306,262 342,717 362,695 Adjusted market value as at December 31, 2015 $ 5,345,081 $ 5,527,129 $ 6,192,118 $ 6,556,545 $ 6,745,869 Going Concern Value of Assets Average of the five adjusted market values as at December 31, 2015 $ 6,073,348 Net outstanding amounts (2,254 ) Going concern value of assets as at December 31, 2015 $ 6,071,094
Comments:
l The asset valuation method is described in Appendix C.
l The rate of return earned on the going concern value of assets, net of all expenses, from December 31, 2013 to December 31, 2015 is approximately 10.2% per annum.

Hydro One Inc. Hydro One Pension Plan Actuarial Valuation as at December 31, 2015 C-1
http://natct.internal.towerswatson.com/clients/601835/HydroOne2016RETGeneral/Documents/Hydro One 12.31.2015 RPP Valuation APP.doc
Appendix C: Actuarial Basis − Going Concern Valuation
Methods
Asset Valuation Method
The going concern value of assets was calculated as the average of the market value of assets at the valuation date and the four previous years' adjusted market values. To obtain these adjusted market values, the market values at December 31 of each of the four preceding years were accumulated to the valuation date with net cash flow (i.e., contributions less benefit payments) and assumed investment return. Net cash flow was assumed to occur uniformly throughout each year. Assumed investment return for a year was calculated assuming that each year, the assets earned interest at the going concern discount rate in effect for that year. Finally, this 5-year average of adjusted market values was then adjusted for net additional outstanding amounts.
The objective of the asset valuation method is to produce a smoother pattern of going-concern surplus (deficit) and hence a smoother pattern of contributions, consistent with the long-term nature of a going concern valuation.
Such smoothing is achieved by use of an averaging process which systematically recognizes investment returns different from expectations over a five-year period, with 20% recognized at the valuation date and the remainder at a rate of 20% per year. This method will be expected to average periods of outperformance with periods of underperformance.
The expected return of the going concern discount rate has been selected to equal the expected return on the assets over long periods of time, with a margin for adverse deviations. As such, it is anticipated that, on average, the asset valuation method will tend to produce a result that is somewhat less than the market value of assets.
Actuarial Cost Method
The actuarial liability and the normal actuarial cost were calculated using the projected unit credit cost method.
Prospective benefits were calculated for each active and disabled member according to the plan provisions and actuarial assumptions. The actuarial liability was calculated as the actuarial present value of the member's prospective benefits accrued for credited service to date (the benefit accrual

Hydro One Inc. Hydro One Pension Plan
C-2 Actuarial Valuation as at December 31, 2015
Willis Towers Watson Confidential
method). The calculation of the actuarial present value of the member's prospective benefits reflects additional entitlements which may arise due to the application of the 50% employer cost-sharing rule, and is at least equal to the member's contributions with interest.
The actuarial liability for retired members and beneficiaries and terminated vested members was calculated as the actuarial present value of their respective benefits.
The employer normal cost for each active and disabled member was determined as the excess of the total normal cost over the member’s required contributions. The normal actuarial cost for each active and disabled member was calculated as the actuarial present value of the member's prospective benefits accruing in respect of credited service in the ensuing year, but not less than the member's required contributions. The employer normal actuarial cost for each active and disabled member was determined as the excess of the total normal actuarial cost over the member's required contributions. The normal actuarial cost rate determined by the projected unit credit cost method will be stable over time if the demographic characteristics of the active and disabled members remain stable from actuarial valuation to actuarial valuation. All other things being equal, a population of active and disabled members whose average age increases (decreases) between actuarial valuations will result in an increasing (decreasing) normal actuarial cost rate.
Additional Voluntary Contributions
For the purposes of the going concern valuation, the determination of the actuarial liability for the additional voluntary contributions does not involve the use of an actuarial cost method, nor does it involve actuarial assumptions. By definition, the actuarial liability under the additional voluntary contributions corresponds with the market value of the members' additional voluntary contribution accounts at the actuarial valuation date.

Hydro One Inc. Hydro One Pension Plan Actuarial Valuation as at December 31, 2015 C-3
http://natct.internal.towerswatson.com/clients/601835/HydroOne2016RETGeneral/Documents/Hydro One 12.31.2015 RPP Valuation APP.doc
Actuarial Assumptions
December 31, 2015 December 31, 2013 Economic Assumptions (per annum)
Liability discount rate 5.40% 5.80% Rate of salary increase 2.50% plus merit (see table 1) 2.75% plus merit (see table 1) Escalation of YMPE under Canada/Québec Pension Plan 1
3.00% 3.25%
Escalation of Income Tax Act (Canada) maximum pension limitation 2
3.00% 3.25%
Rate of inflation 2.00% 2.25% Interest on members' contributions
2.00% Same
Demographic Assumptions Mortality 95% of the 2014 Private Sector
Canadian Pensioners' Mortality Table, projected generationally using Scale CPM-B
Public Sector Canadian Pensioners’ Mortality Table, projected generationally using Scale CPM-B, not adjusted for pension size
Withdrawal Service-related rates (see Table 2a)
Age-related rates (see Table 2b)
Retirement/pension commencement
Age and service related rates (see Table 3a)
Age and service related rates (see Table 3b)
Disability rates Age-related rates (see Table 4) Same
Other Percentage of members with eligible spouses at pension commencement and electing joint and survivor pension form
90% Same
Years male spouse older than female spouse
3 4
Provision for non-investment expenses
None; return on plan assets is net of all expenses
Same

Hydro One Inc. Hydro One Pension Plan
C-4 Actuarial Valuation as at December 31, 2015
Willis Towers Watson Confidential
Notes:
1 The YMPE of $54,900 for 2016 is the starting value for the YMPE projection as at the current actuarial valuation and is indexed starting in 2016.
2 The Income Tax Act (Canada) maximum pension limit of $2,890 per year of service in 2016 is the starting value for maximum pension limit projection as at the current valuation and is indexed starting in 2016.
Table 1 Salary Increases due to Movement within the Salary Structure
Age First 4 Years of
Employment Subsequent
Years
under 25 7.0% 1.0% 25 – 29 3.0% 1.0% 30 – 34 3.5% 1.5% 35 – 39 3.5% 1.5% 40 – 44 3.5% 2.0% 45 – 49 3.5% 1.5% 50 – 54 2.0% 1.5% 55 – 59 2.0% 1.5%
60 & over 2.0% 0.0%
Table 2a Current Withdrawal Rates
Service (years) Male & Female
Under 20 0.01 20 and over 0.00
Table 2b Sample Prior Withdrawal Rates
Age Male Female
15 to 25 0.04 0.05 30 to 35 0.02 0.04 40 to 50 0.01 0.03 over 55 0.00 0.00

Hydro One Inc. Hydro One Pension Plan Actuarial Valuation as at December 31, 2015 C-5
http://natct.internal.towerswatson.com/clients/601835/HydroOne2016RETGeneral/Documents/Hydro One 12.31.2015 RPP Valuation APP.doc
Table 3a Current Retirement Rates
Eligible for Unreduced Retirement Not Eligible for Unreduced Retirement Age
Based on points (82 or 85)
35 years of service and over
under 55 0.10 0.30 0.00 55 to 59 0.15 0.30 0.05 60 to 64 0.12 0.30 0.07
65 0.50 0.30 0.20 66 to 69 0.25 0.30 0.15
70 and over 1.00 1.00 1.00
Table 3b Prior Retirement Rates
Not Eligible for Unreduced Retirement
Age Eligible for Unreduced
Retirement Male Female
under 55 0.15 0.00 0.00 55 to 60 0.25 0.02 0.05 61 to 64 0.25 0.07 0.10
65 1.00 1.00 1.00
Table 4 Disability Rates
Age Male and Female
under 30 0% 30 to 35 0.105% 35 to 40 0.110% 40 to 45 0.115% 45 to 50 0.120% 50 to 55 0.295% 55 to 59 1.000%
60 and above 1.878%

Hydro One Inc. Hydro One Pension Plan
C-6 Actuarial Valuation as at December 31, 2015
Willis Towers Watson Confidential
Rationale for Actuarial Assumptions
The rationale for the material actuarial assumptions used in the going concern valuation is summarized below.
The going concern assumptions do not include margins for adverse deviations, except as noted below.
Liability discount rate
Actuarial valuation economic assumptions used for establishing the liability discount rate have been developed based on Willis Towers Watson’s capital market model. The capital market model simulates economic variables (e.g. inflation and yields) and asset class returns, with the assumptions being developed through both the analysis of historical rates and returns, and the application of econometric theory. In modeling inflation and bond yields, current conditions and long term expectations are used and the serial correlation inherent in these parameters is recognized.
Our long term nominal rate of return assumption was determined using the expected long term asset mix for the plan, which is consistent with the target mix found in the investment policy in effect for the plan as at the actuarial valuation date.
Based on Willis Towers Watson’s capital market model, a best estimate long term gross nominal rate of return as of December 31, 2015 of 6.05%. The following adjustments were subsequently made before selecting the discount rate assumption:
l Best estimate long term nominal rate of return before adjustments 6.05 % l Adjustment for investment expenses paid by the plan
(excluding active management fees) (0.04 ) l Adjustment for non-investment expenses paid by the plan (0.10 ) l Best estimate long term nominal rate of return after adjustments 5.91 %
In the selection of the discount rate, we have assumed that additional returns associated with employing an active investment management strategy would equal the additional expenses associated with employing such strategy. Consequently, we have disregarded any potential additional returns.
After allowing for a 0.54% margin for adverse deviations, we established the discount rate assumption for the plan as 5.40% (rate is rounded to the nearest 10 basis points).
Hydro One Inc. Hydro One Pension Plan Actuarial Valuation as at December 31, 2015 C-7
http://natct.internal.towerswatson.com/clients/601835/HydroOne2016RETGeneral/Documents/Hydro One 12.31.2015 RPP Valuation APP.doc
Rate of salary increase and service
The assumption reflects an assumed rate of inflation of 2.00% per annum, plus an allowance of 0.50% per annum for the effect of real economic growth and productivity gains in the economy. In addition, an allowance has been made for individual employee merit and promotion based on a scale which varies by age and service as shown in this Appendix C. The merit/promotion assumption is based on discussions with Hydro One Inc. management concerning their future expectations.
Escalation of YMPE under Canada/Québec Pension Plan
The YMPE is indexed annually based on increases in the Industrial Aggregate Wage index for Canada. The assumption reflects an assumed rate of inflation of 2.00% per annum, plus an allowance of 1.00% per annum for the effect of real economic growth and productivity gains in the economy.
Escalation of Income Tax Act (Canada) maximum pension limitation
The maximum pension limitation under the Income Tax Act (Canada) is scheduled to be indexed annually based on assumed increases in the Industrial Aggregate Wage index. The assumption reflects an assumed rate of inflation of 2.00% per annum, plus an allowance of 1.00% per annum for the effect of real economic growth and productivity gains in the economy.
Rate of inflation
The assumption reflects an estimate of future rates of inflation considering economic and financial market conditions at the actuarial valuation date. For the current valuation, the assumed inflation rate is 2.00% per annum. This assumption has been updated since the last actuarial valuation (2.25% per annum) to reflect current long term expectation.
Mortality
The 2014 Private Sector Canadian Pensioners' Mortality Table (CPM2014Priv) is based on a mortality experience study for calendar years 1999 to 2008 conducted by the Canadian Institute of Actuaries on a sample of Canadian registered pension plans. The CPM2014Priv table allows for adjustments to the mortality rates based on pension size and/or industry classification. Improvement Scale B (CPM-B) is a two-dimensional scale developed by the Canadian Institute of Actuaries based primarily on the mortality experience of pensioners under the Canada Pension Plan (CPP) and the Québec Pension Plan (QPP) up to 2007 as well as the assumptions used in the 26th CPP Actuarial Report.
Base mortality rates from the CPM2014Priv table, with a multiplier of 95% based on the plan's actual mortality experience are considered reasonable for the actuarial valuation of the plan. Applying improvement scale CPM-B generationally provides an allowance for improvements in mortality after 2014 and is considered reasonable for projecting mortality experience into the future.

Hydro One Inc. Hydro One Pension Plan
C-8 Actuarial Valuation as at December 31, 2015
Willis Towers Watson Confidential
At the previous actuarial valuation, the 2014 Public Sector Canadian Pensioners' Mortality Table projected generationally using CPM-B was used. The mortality table was changed as a result of a review of the actual historical mortality of plan members over the period 2007-2015.
Withdrawal
The rates of withdrawal were developed based on a review of plan experience for the years 2007 to 2015 and an assessment of future expectations.
The rates of withdrawal at the last actuarial valuation were developed based on a review of plan experience, performed by Mercer (Canada) Limited, for the years 2000 to 2006.
Percentage of involuntary terminations of employment
No allowance has been made for involuntary terminations of employment on the basis that the impact of including such an assumption and valuing statutory grow-in rights would not have a material impact on the actuarial valuation results.
Disability incidence/recovery
The rates of disability incidence/recovery are based on a prior assessment performed by Mercer (Canada) Limited. The use of a different assumption would not have a material impact on the actuarial valuation results.
Retirement from active membership
The rates of retirement were developed based on a review of plan experience for the years 2007 to 2015 and an assessment of future expectations. All members are assumed to commence their pension at their retirement date.
The rates of retirement at the last actuarial valuation were developed based on a review of plan experience, performed by Mercer (Canada) Limited, for the years 2000 to 2006.
Pension commencement after termination of employment
All terminated members are assumed to commence their pension at the age that produces the highest liability value based on the plan’s subsidized early retirement reductions applicable to terminated members commencing their pension prior to normal retirement age.

Hydro One Inc. Hydro One Pension Plan Actuarial Valuation as at December 31, 2015 C-9
http://natct.internal.towerswatson.com/clients/601835/HydroOne2016RETGeneral/Documents/Hydro One 12.31.2015 RPP Valuation APP.doc
Percentage of members with eligible spouses at pension commencement and electing joint and survivor pension form
When provided, the actual data for the spouse and form of payment were used for retired members. For other members, the assumed percentage of members with a spouse is based on the percentages for the general population and an assessment of future expectations for members of the plan.
Years male spouse older than female spouse
When provided, the actual data for the spouse were used for retired members. For other members, the assumption is based on surveys of the age difference in the general population, a review of plan data for the years 2006 to 2015, and an assessment of future expectations for members of the plan.
This assumption has been updated from 4 years at the last valuation to 3 years at the current valuation.
Provision for non-investment expenses
The liability discount rate is net of all expenses. The assumed level of expenses reflected in the liability discount rate is based on recent experience of the plan and an assessment of future expectations.


Hydro One Inc. Hydro One Pension Plan Actuarial Valuation as at December 31, 2015 D-1
http://natct.internal.towerswatson.com/clients/601835/HydroOne2016RETGeneral/Documents/Hydro One 12.31.2015 RPP Valuation APP.doc
Appendix D: Actuarial Basis − Solvency and Hypothetical Windup Valuations
Methods
Asset Valuation Method
The market value of assets, adjusted for net outstanding amounts, has been used for the solvency and hypothetical windup valuations. The resulting value has been reduced by a provision for plan windup expenses.
The adjustment in respect of the smoothing of solvency assets for purposes of determining the statutory solvency deficiency was calculated as the difference between the actuarial value of assets used for the going concern valuation and the market value of assets.
Liability Calculation Method
The solvency and hypothetical windup liabilities were calculated using the traditional unit credit cost method.
The solvency and hypothetical windup liabilities for active and disabled members were calculated as the actuarial present value of all benefits accrued up to the actuarial valuation date. This calculation reflects additional entitlements which may arise due to the application of the 50% employer cost-sharing rule, and is at least equal to the member's contributions with interest.
The solvency and hypothetical windup liabilities for retired members and beneficiaries and terminated vested members were calculated as the actuarial present value of their respective benefits.
Other Considerations
The solvency and hypothetical windup valuations have been prepared on a hypothetical basis. In the event of an actual plan windup, the plan assets may have to be allocated between various classes of plan members or beneficiaries as required by applicable pension legislation. Such potential allocation has not been performed as part of these solvency and hypothetical windup valuations.

Hydro One Inc. Hydro One Pension Plan
D-2 Actuarial Valuation as at December 31, 2015
Willis Towers Watson Confidential
Additional Voluntary Contribution
For the purposes of the solvency and hypothetical windup valuations, the determination of the liability for the additional voluntary contributions does not involve the use of a liability calculation method, nor does it involve actuarial assumptions. By definition, the solvency and hypothetical windup liability under the additional voluntary contributions corresponds with the market value of the members' additional voluntary contribution accounts at the actuarial valuation date.

Hydro One Inc. Hydro One Pension Plan Actuarial Valuation as at December 31, 2015 D-3
http://natct.internal.towerswatson.com/clients/601835/HydroOne2016RETGeneral/Documents/Hydro One 12.31.2015 RPP Valuation APP.doc
Solvency Incremental Cost Actuarial Method
The solvency incremental cost for a given year represents the present value, at the actuarial valuation date, of the expected aggregate change in the defined benefit solvency liability during the year, increased for expected benefit payments during the year.
The solvency incremental cost reflects expected decrements and related changes in membership status, accrual of service, any expected changes in benefits, entitlements, members' contributions, pension formula or increases in the maximum pension limits, and projected pensionable earnings during the year.
The solvency incremental cost has been calculated for each year until the next actuarial valuation date as the projected solvency liability at the end of the year, minus the solvency liability at the beginning of the year, increased for expected benefit payments during the year. Each of these amounts is discounted to the actuarial valuation date using the projected solvency liability discount rate.
The method used to calculate the projected solvency liabilities at each projection year is the same as used in the solvency valuation.
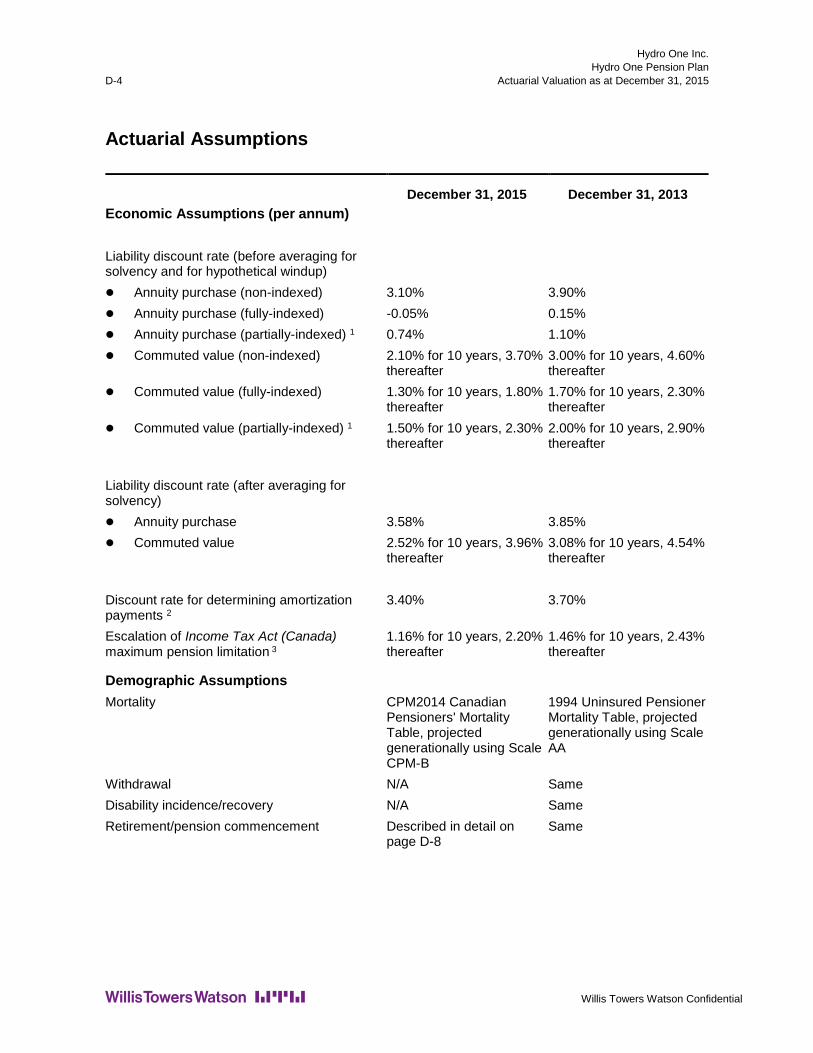
Hydro One Inc. Hydro One Pension Plan
D-4 Actuarial Valuation as at December 31, 2015
Willis Towers Watson Confidential
Actuarial Assumptions
December 31, 2015 December 31, 2013 Economic Assumptions (per annum) Liability discount rate (before averaging for solvency and for hypothetical windup)
l Annuity purchase (non-indexed) 3.10% 3.90% l Annuity purchase (fully-indexed) -0.05% 0.15% l Annuity purchase (partially-indexed) 1 0.74% 1.10% l Commuted value (non-indexed) 2.10% for 10 years, 3.70%
thereafter 3.00% for 10 years, 4.60% thereafter
l Commuted value (fully-indexed) 1.30% for 10 years, 1.80% thereafter
1.70% for 10 years, 2.30% thereafter
l Commuted value (partially-indexed) 1 1.50% for 10 years, 2.30% thereafter
2.00% for 10 years, 2.90% thereafter
Liability discount rate (after averaging for solvency)
l Annuity purchase 3.58% 3.85% l Commuted value 2.52% for 10 years, 3.96%
thereafter 3.08% for 10 years, 4.54% thereafter
Discount rate for determining amortization payments 2
3.40% 3.70%
Escalation of Income Tax Act (Canada) maximum pension limitation 3
1.16% for 10 years, 2.20% thereafter
1.46% for 10 years, 2.43% thereafter
Demographic Assumptions Mortality CPM2014 Canadian
Pensioners' Mortality Table, projected generationally using Scale CPM-B
1994 Uninsured Pensioner Mortality Table, projected generationally using Scale AA
Withdrawal N/A Same Disability incidence/recovery N/A Same Retirement/pension commencement Described in detail on
page D-8 Same
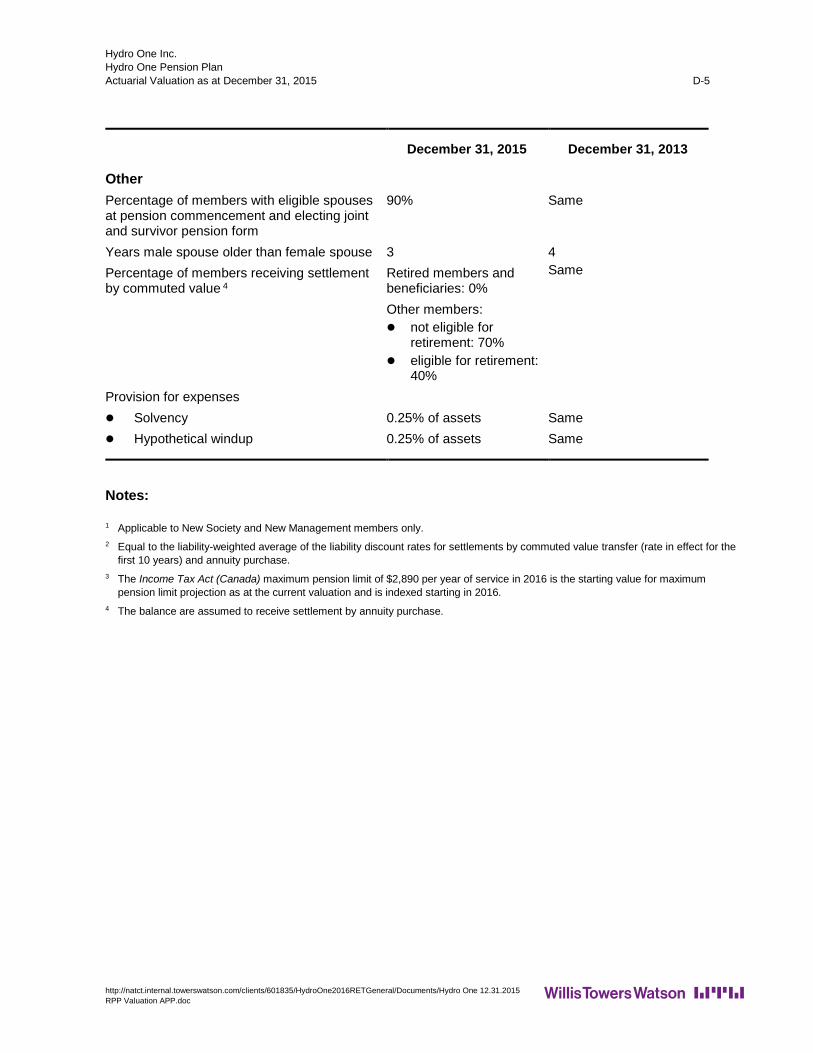
Hydro One Inc. Hydro One Pension Plan Actuarial Valuation as at December 31, 2015 D-5
http://natct.internal.towerswatson.com/clients/601835/HydroOne2016RETGeneral/Documents/Hydro One 12.31.2015 RPP Valuation APP.doc
December 31, 2015 December 31, 2013
Other Percentage of members with eligible spouses at pension commencement and electing joint and survivor pension form
90% Same
Years male spouse older than female spouse 3 4 Percentage of members receiving settlement by commuted value 4
Retired members and beneficiaries: 0% Other members: l not eligible for
retirement: 70% l eligible for retirement:
40%
Same
Provision for expenses l Solvency 0.25% of assets Same l Hypothetical windup 0.25% of assets Same
Notes:
1 Applicable to New Society and New Management members only. 2 Equal to the liability-weighted average of the liability discount rates for settlements by commuted value transfer (rate in effect for the
first 10 years) and annuity purchase. 3 The Income Tax Act (Canada) maximum pension limit of $2,890 per year of service in 2016 is the starting value for maximum
pension limit projection as at the current valuation and is indexed starting in 2016. 4 The balance are assumed to receive settlement by annuity purchase.

Hydro One Inc. Hydro One Pension Plan
D-6 Actuarial Valuation as at December 31, 2015
Willis Towers Watson Confidential
Rationale for Actuarial Assumptions
The rationale for the material actuarial assumptions used in the solvency and hypothetical windup valuations is summarized below.
The actuarial assumptions used in the solvency and hypothetical windup valuations do not include margins for adverse deviations.
Liability discount rate
Discount Rates for Solvency (before averaging) and Hypothetical Windup
In the event of a plan windup, it is expected that a portion of the liabilities will be settled by a group annuity purchase and the balance of the liabilities will be settled by commuted value transfers.
For the calculation of the portion of the solvency and hypothetical windup liabilities relating to the benefits that are expected to be settled by a group annuity purchase, the liability discount rate corresponds to an approximation of the annuity purchase rates as at the actuarial valuation date following application of the relevant guidance on assumptions for solvency and hypothetical windup valuations issued by the Canadian Institute of Actuaries’ Committee on Pension Plan Financial Reporting. The guidance provides that the approximation of the annuity purchase rate varies in accordance with the duration of the liabilities for non-indexed benefits assumed to be settled by group annuity. The duration of the liabilities assumed to be settled through the purchase of non-indexed annuities is 11.8.
For the calculation of the portion of the solvency and hypothetical windup liabilities relating to the benefits that are expected to be settled by commuted value transfers, the liability discount rates have been determined in accordance with the Standards of Practice for Pension Commuted Values in effect at the valuation date. For this actuarial valuation, the December 2015 rates have been used.
Discount Rates for Solvency (after averaging)
l The average discount rates for calculation of the statutory solvency deficiency are based on the following: Benefits that are expected to be settled by a group annuity purchase:
The average of the annualized approximate annuity purchase rates at December 31, 2015 and the four previous year-ends 1, determined as follows:
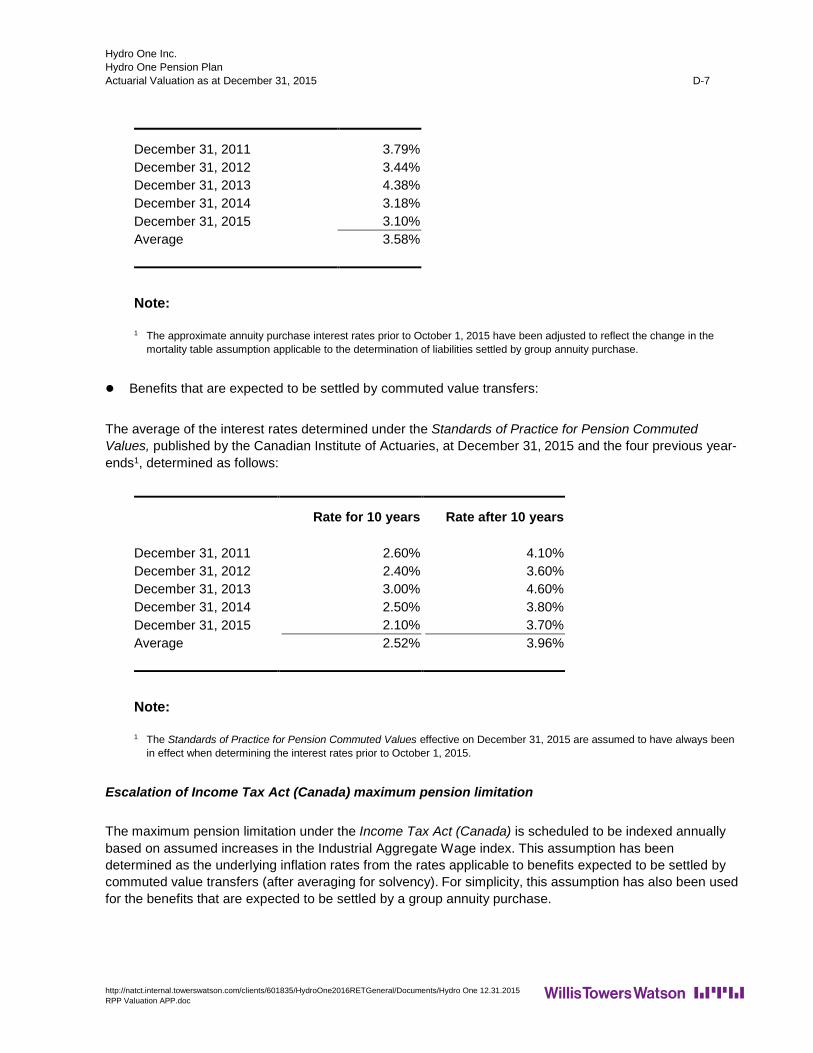
Hydro One Inc. Hydro One Pension Plan Actuarial Valuation as at December 31, 2015 D-7
http://natct.internal.towerswatson.com/clients/601835/HydroOne2016RETGeneral/Documents/Hydro One 12.31.2015 RPP Valuation APP.doc
December 31, 2011 3.79% December 31, 2012 3.44% December 31, 2013 4.38% December 31, 2014 3.18% December 31, 2015 3.10% Average 3.58%
Note:
1 The approximate annuity purchase interest rates prior to October 1, 2015 have been adjusted to reflect the change in the mortality table assumption applicable to the determination of liabilities settled by group annuity purchase.
l Benefits that are expected to be settled by commuted value transfers:
The average of the interest rates determined under the Standards of Practice for Pension Commuted Values, published by the Canadian Institute of Actuaries, at December 31, 2015 and the four previous year-ends1, determined as follows:
Rate for 10 years Rate after 10 years December 31, 2011 2.60% 4.10% December 31, 2012 2.40% 3.60% December 31, 2013 3.00% 4.60% December 31, 2014 2.50% 3.80% December 31, 2015 2.10% 3.70% Average 2.52% 3.96%
Note:
1 The Standards of Practice for Pension Commuted Values effective on December 31, 2015 are assumed to have always been in effect when determining the interest rates prior to October 1, 2015.
Escalation of Income Tax Act (Canada) maximum pension limitation
The maximum pension limitation under the Income Tax Act (Canada) is scheduled to be indexed annually based on assumed increases in the Industrial Aggregate Wage index. This assumption has been determined as the underlying inflation rates from the rates applicable to benefits expected to be settled by commuted value transfers (after averaging for solvency). For simplicity, this assumption has also been used for the benefits that are expected to be settled by a group annuity purchase.
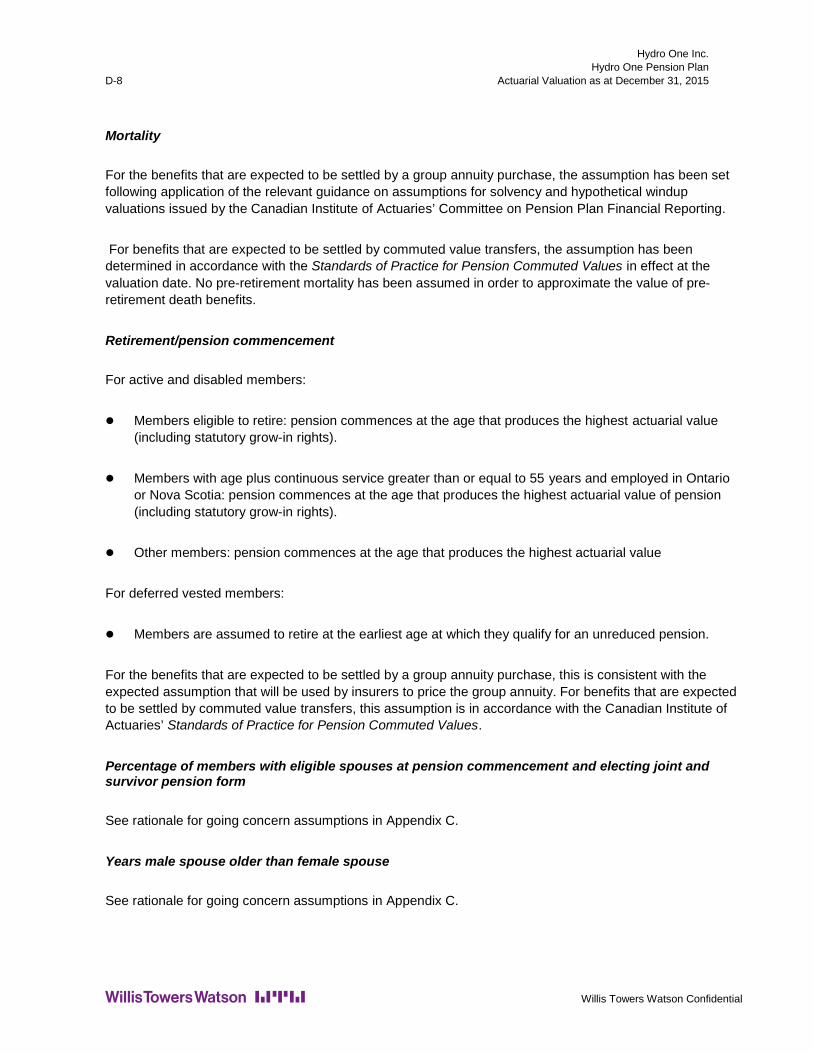
Hydro One Inc. Hydro One Pension Plan
D-8 Actuarial Valuation as at December 31, 2015
Willis Towers Watson Confidential
Mortality
For the benefits that are expected to be settled by a group annuity purchase, the assumption has been set following application of the relevant guidance on assumptions for solvency and hypothetical windup valuations issued by the Canadian Institute of Actuaries’ Committee on Pension Plan Financial Reporting.
For benefits that are expected to be settled by commuted value transfers, the assumption has been determined in accordance with the Standards of Practice for Pension Commuted Values in effect at the valuation date. No pre-retirement mortality has been assumed in order to approximate the value of pre-retirement death benefits.
Retirement/pension commencement
For active and disabled members:
l Members eligible to retire: pension commences at the age that produces the highest actuarial value (including statutory grow-in rights).
l Members with age plus continuous service greater than or equal to 55 years and employed in Ontario or Nova Scotia: pension commences at the age that produces the highest actuarial value of pension (including statutory grow-in rights).
l Other members: pension commences at the age that produces the highest actuarial value
For deferred vested members:
l Members are assumed to retire at the earliest age at which they qualify for an unreduced pension.
For the benefits that are expected to be settled by a group annuity purchase, this is consistent with the expected assumption that will be used by insurers to price the group annuity. For benefits that are expected to be settled by commuted value transfers, this assumption is in accordance with the Canadian Institute of Actuaries’ Standards of Practice for Pension Commuted Values.
Percentage of members with eligible spouses at pension commencement and electing joint and survivor pension form
See rationale for going concern assumptions in Appendix C.
Years male spouse older than female spouse
See rationale for going concern assumptions in Appendix C.

Hydro One Inc. Hydro One Pension Plan Actuarial Valuation as at December 31, 2015 D-9
http://natct.internal.towerswatson.com/clients/601835/HydroOne2016RETGeneral/Documents/Hydro One 12.31.2015 RPP Valuation APP.doc
Percentage of members receiving settlement by commuted value transfer
This assumption has been determined by considering the benefit provisions of the plan, legislative requirements to offer specific settlement options to various classes of members, and, in particular, the options to be provided to members upon plan windup.
The assumption also reflects the expectation that members further from retirement are more likely to elect to settle their pension benefit by a commuted value transfer, while members closer to retirement are more likely to elect to settle their pension benefit through a group annuity purchase where this option is available.
Provision for expenses
Allowance was made for normal administrative, actuarial, legal and other costs which would be incurred if the plan were to be wound up (excluding costs relating to the resolution of surplus or deficit issues). The actuarial valuation is premised on a scenario in which the employer continues to operate after the windup date. In establishing the allowance for plan windup costs, certain administrative costs were assumed to be paid from the pension fund (consistent with past practice) while other costs were assumed to be borne directly by the employer.
Hydro One Inc. Hydro One Pension Plan
D-10 Actuarial Valuation as at December 31, 2015
Willis Towers Watson Confidential
Solvency Incremental Cost Actuarial Assumptions
Demographic and Benefit Projection Actuarial Assumptions
Except as noted below, the projected population, benefits and members' contributions valued in the solvency liability projection are based on the demographic and benefit projection assumptions used for the going concern valuation described in Appendix C.
New entrants
An allowance has been made for new entrants for the Post-Society and PWU groups only, between the current actuarial valuation date and next actuarial valuation date. The new entrants profile is assumed to be similar to the profile of average new entrants in the plan over the years 2008-2012. We have assumed no new entrants under the management group as new management employees are not entitled to join this plan. Membership in the PWU and Society groups is assumed to remain stable over the projection period.
Solvency Liability Projection Actuarial Assumptions
The solvency liability projections for purposes of calculating the solvency incremental cost are based on the assumptions used for the solvency valuation described previously.

Hydro One Inc. Hydro One Pension Plan Actuarial Valuation as at December 31, 2015 E-1
http://natct.internal.towerswatson.com/clients/601835/HydroOne2016RETGeneral/Documents/Hydro One 12.31.2015 RPP Valuation APP.doc
Appendix E: Membership Data
Summary of Membership Data
Active members
December 31, 2015 December 31, 2013 l Number 5,355 5,360 l Average age 44.1 44.1 l Average credited service 13.3 13.5 l Annual payroll $ 543,523,888 $ 512,892,395 l Average salary $ 101,498 $ 95,689 l Accumulated contributions with interest $ 367,013,623 $ 344,471,267
Disabled Members
December 31, 2015 December 31, 2013 l Number 131 127 l Average age 54.9 55.4 l Average credited service 23.4 24.3 l Annual payroll $ 11,169,636 $ 10,152,527 l Average salary $ 85,264 $ 79,941 l Accumulated contributions with interest $ 9,230,244 $ 9,175,783
Comment:
l The following distribution relates to active and disabled members. The following meanings have been assigned to age, credited service and earnings:

Hydro One Inc. Hydro One Pension Plan
E-2 Actuarial Valuation as at December 31, 2015
Willis Towers Watson Confidential
The following distribution relates to active and disabled members. The following meanings have been assigned to age, credited service and earnings:
l Age Age as at December 31, 2015
l Credited Service Credited service as at December 31, 2015
l Earnings Annual rate of earnings as at December 31, 2015
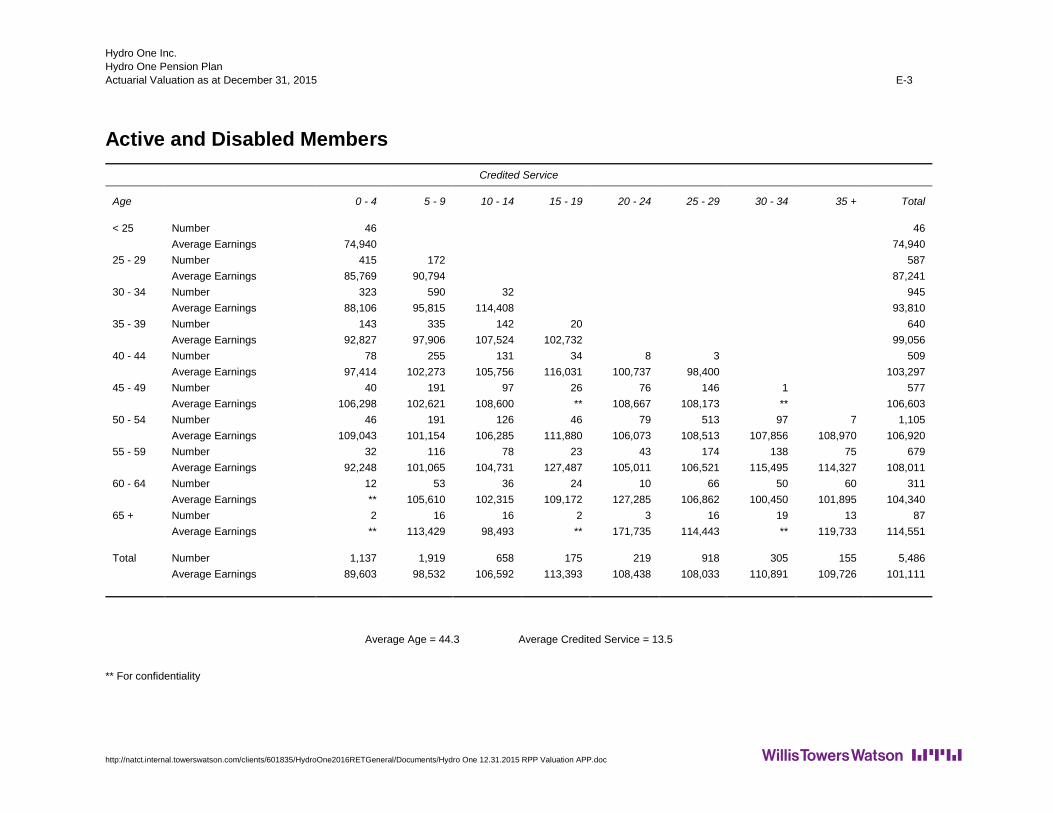
Hydro One Inc. Hydro One Pension Plan Actuarial Valuation as at December 31, 2015 E-3
http://natct.internal.towerswatson.com/clients/601835/HydroOne2016RETGeneral/Documents/Hydro One 12.31.2015 RPP Valuation APP.doc
Active and Disabled Members
Credited Service
Age 0 - 4 5 - 9 10 - 14 15 - 19 20 - 24 25 - 29 30 - 34 35 + Total
< 25 Number 46 46 Average Earnings 74,940 74,940
25 - 29 Number 415 172 587 Average Earnings 85,769 90,794 87,241
30 - 34 Number 323 590 32 945 Average Earnings 88,106 95,815 114,408 93,810
35 - 39 Number 143 335 142 20 640 Average Earnings 92,827 97,906 107,524 102,732 99,056
40 - 44 Number 78 255 131 34 8 3 509 Average Earnings 97,414 102,273 105,756 116,031 100,737 98,400 103,297
45 - 49 Number 40 191 97 26 76 146 1 577 Average Earnings 106,298 102,621 108,600 ** 108,667 108,173 ** 106,603
50 - 54 Number 46 191 126 46 79 513 97 7 1,105 Average Earnings 109,043 101,154 106,285 111,880 106,073 108,513 107,856 108,970 106,920
55 - 59 Number 32 116 78 23 43 174 138 75 679 Average Earnings 92,248 101,065 104,731 127,487 105,011 106,521 115,495 114,327 108,011
60 - 64 Number 12 53 36 24 10 66 50 60 311 Average Earnings ** 105,610 102,315 109,172 127,285 106,862 100,450 101,895 104,340
65 + Number 2 16 16 2 3 16 19 13 87 Average Earnings ** 113,429 98,493 ** 171,735 114,443 ** 119,733 114,551
Total Number 1,137 1,919 658 175 219 918 305 155 5,486 Average Earnings 89,603 98,532 106,592 113,393 108,438 108,033 110,891 109,726 101,111
Average Age = 44.3 Average Credited Service = 13.5 ** For confidentiality

Hydro One Inc. Hydro One Pension Plan
Actuarial Valuation as at December 31, 2015 E–4
Willis Towers Watson Confidential
Retired members
December 31, 2015 December 31, 2013 l Number 5,502 5,445 l Average age 71.5 71.1 l Total annual pension $ 240,389,865 $ 215,558,746 l Average annual pension1 $ 43,691 $ 39,588 l Total temporary annual pension $ 24,642,237 $ 25,163,484
Beneficiaries and survivors
December 31, 2015 December 31, 2013 l Number 1,777 1,793 l Average age 80.4 79.9 l Total annual pension $ 44,098,256 $ 41,483,088 l Average annual pension $ 24,816 $ 23,136 l Total temporary annual pension $ 460,627 $ 487,347
Terminated vested members
December 31, 2015 December 31, 2013 l Number 294 292 l Average age 53.5 53.2 l Total annual pension2 $ 2,872,957 $ 2,543,201 l Average annual pension $ 9,772 $ 8,710
Notes:
1 Excluding temporary annual pension. 2 Prior to application of Income Tax Act maximum pension limits.
Hydro One Inc. Hydro One Pension Plan Actuarial Valuation as at December 31, 2015 E-5
http://natct.internal.towerswatson.com/clients/601835/HydroOne2016RETGeneral/Documents/Hydro One 12.31.2015 RPP Valuation APP.doc
Review of Membership Data
The membership data were supplied by Hydro One Inc.’s third-party administrator, Morneau Shepell, as at December 31, 2015.
The membership data have been relied upon by Willis Towers Watson following tests for reasonableness and found to be sufficient and reliable for the purposes of the actuarial valuation. Elements of the data review included the following:
l ensuring that the data were intelligible (i.e., that an appropriate number of records was obtained, that the appropriate data fields were provided and that the data fields contained valid information);
l preparation and review of membership reconciliations to ascertain whether the complete membership of the plan appeared to be accounted for;
l preparation and review of age and service distributions for active and disabled member for reasonableness;
l review of consistency of individual data items and statistical summaries between the current actuarial valuation and the previous actuarial valuation;
l review of reasonableness of individual data items, statistical summaries and changes in such information since the previous actuarial valuation date; and
l comparison of the membership data and the plan’s financial statements for consistency.
However, the tests conducted as part of the membership data review may not have captured certain deficiencies in the data. We have also relied on the certification of the plan administrator as to the quality of the data.

Hydro One Inc. Hydro One Pension Plan
Actuarial Valuation as at December 31, 2015 E–6
Willis Towers Watson Confidential
Membership Reconciliation
Actives Disabled Terminated
vested Retired
Beneficiaries and
survivors Total As at December 31, 2013 5,360 127 292 5,445 1,793 13,017 l New entrants
(including re-employed) 485 0 0 0 0 485 l From disabled 6 (6 ) 0 0 0 0 l To disabled (34 ) 34 0 0 0 0 l Terminated (with lump sum
payment) (71 ) (2) (8 ) 0 0 (81 ) l Termination (with vested
pension entitlement) (34 ) 0 34 0 0 0 l Retirement (349 ) (18 ) (22 ) 389 0 0 l Deceased
(without beneficiary)1 0 0 0 (148 ) (215 ) (363 ) l Deceased (with beneficiary) (7 ) (4 ) 0 (184 ) 195 0 l New ex-spouse 0 0 0 0 4 4 l Data corrections (1 ) 0 (2 ) 0 0 (3 ) l Net change (5 ) 4 2 57 (16 ) 42 As at December 31, 2015 5,355 131 294 5,502 1,777 13,059 1 Includes pensioners whose guarantee period has expired.
Hydro One Inc. Hydro One Pension Plan Actuarial Valuation as at December 31, 2015 F–1
HTTP://NATCT.INTERNAL.TOWERSWATSON.COM/CLIENTS/601835/HYDROONE2016RETGENERAL/DOCUMENTS/HYDRO ONE 12.31.2015 RPP VALUATION APP.DOC
Appendix F: Summary of Plan Provisions The following is an outline of the principal features of the plan which are of financial significance to valuing the plan benefits. This summary is based on the most recently restated plan document as at January 1, 2000 and amendments up to and including the valuation date, as provided by Hydro One Inc., and does not make any provisions for the possibility that a change or action (retroactive or otherwise) could be imposed by order of a regulatory body or a court. It is not a complete description of the plan terms and should not be relied upon for administration or interpretation of benefits. For a detailed description of the benefits, please refer to the plan document.
Membership
The following categories of employees are members of the Pension Plan:
a) All regular employees (see Note 1a and Note 1b);
b) Employees for whom the Office and Professional Employees International Union was the bargaining agent prior to July 30, 1982;
c) Continuing construction employees who were members admitted to the Ontario Electricity Financial Corporation Pension Plan and its predecessors;
d) Employees who became continuing construction clerical employees after July 29,1982 and before August 8, 1984;
e) Employees who have completed three months of continuous employment as a probationary employee (see Note 1a and Note 1b).
Note 1a: Management employees hired on or after January 1, 2004 and Society represented employees hired on or after November 17, 2005 are eligible after completing three months of continuous employment but are not required to join the Pension Plan.
Note 1b: Management employees who were not eligible to elect to become a member of the Pension Plan on or after September 30, 2015 are no longer eligible to join the Pension Plan.
Any other employee who has completed twenty-four months of continuous employment and who has at least 700 hours of employment or earnings of 35% of the Year’s Maximum Pensionable Earnings (“YMPE”), as defined under the Canada Pension Plan in each of the two previous consecutive calendar years, may elect to become a member of the Pension Plan.

Hydro One Inc. Hydro One Pension Plan
F–2 Actuarial Valuation as at December 31, 2015
Willis Towers Watson Confidential
Normal Retirement Date
a) Female members whose continuous employment commenced prior to January 1, 1976: The first day of the month when she in fact retires, coincident with or next following the attainment of age 60 or any subsequent month up to the month coincident with or next following her 65th birthday.
b) All other members: The first day of the month coincident with or next following the attainment of age 65.
Amount of Accrued Pension
Life Pension
a) 2% of the member’s “high three-year average” (see Note 5) for each year of credited service, subject to a maximum of 35 years (see Note 2).
Note 2: For Management employees hired on or after January 1, 2004, and Society represented employees hired on or after November 17, 2005 the reference to “high three-year average” is changed to “high five-year average” for pensionable service while a Management or Society-represented employee.
LESS
b) 0.625% of the member’s “high five-year average” up to the “average YMPE” (see Note 5) for each year of credited service included in (a) above subsequent to December 31, 1965, subject to a maximum of 35 years – see Note 3.
Note 3: Effective July 1, 2001, for members of the PWU, and effective January 1, 2004, for Society represented members hired before November 17, 2005; the factor is reduced from 0.625% to 0.50%.
Bridge Pension (see Note 4)
0.625% of the member’s “high five-year average” up to the “average YMPE” (see Note 5) for each year of credited service included in (a) above, subject to a maximum of 30 years, multiplied by 35, and divided by 30. This is generally payable until age 65.
The bridge benefit is reduced for early retirement in accordance with the same early retirement reduction provision applicable to the early retirement life pension described below.
Note 4: For Management employees hired on or after January 1, 2004 and Society represented employees hired on or after November 17, 2005, no bridge pension is payable for pensionable service

Hydro One Inc. Hydro One Pension Plan Actuarial Valuation as at December 31, 2015 F–3
HTTP://NATCT.INTERNAL.TOWERSWATSON.COM/CLIENTS/601835/HYDROONE2016RETGENERAL/DOCUMENTS/HYDRO ONE 12.31.2015 RPP VALUATION APP.DOC
while a Management or Society-represented employee. Effective January 1, 2018, Society represented employees hired on or after November 17, 2005 will be entitled to a bridge benefit equal to 0.625% up to the average YMPE for each year of service from January 1, 2018 onward while the member is earning a benefit under the basic formula.
Note 5: “High three-year average”/ “high five-year average” is the average of the member’s base annual earnings plus bonuses up to a set percentage during the 36/60 consecutive months when the base earnings were highest. For earnings after 1999, the percentage of bonus under the performance achievement plan included in pensionable earnings is 50%. The “average YMPE” is the average of the YMPE’s during the 60 consecutive months when the base earnings were highest.
Early Retirement
Age Plus Service (See Note 7)
A member may retire prior to the normal retirement date without any reduction in the accrued pension, if the sum of the member’s age and years of continuous employment is equal to or greater than 82 or the member has 35 years of continuous employment, whichever occurs first (see Note 6).
Note 6: For Management employees hired on or after January 1, 2004 and Society represented employees hired on or after November 17, 2005, retirement without reduction is available when the sum of the employee’s age and years of pensionable service is equal to or greater than 85 or the employee has 35 years of pensionable service, whichever occurs first.
25 or More Years of Continuous Employment (see Note 7)
A member who does not qualify for the early retirement provisions above who is at least age 55 and has 25 or more years of continuous employment may retire prior to age 60, in which case the member’s accrued pension is reduced by 3% for each year by which early retirement precedes age 60. These reductions also apply to members who elected a deferred pension when they left the Pension Plan and had 25 or more years of continuous employment.
Female Members with More Than 15 Years or Other Members with 15 or More Years but Less than 25 Years of Continuous Employment (see Note 7)
A female member whose continuous employment commenced prior to 1976 with at least 15 years of continuous employment, or any other member with 15 or more years but less than 25 years of continuous employment, who does not qualify for any of the previously mentioned early retirement provisions, may retire within 10 years of normal retirement date. In such a case the member’s accrued pension is reduced by 2% for each year up to five years and 3% for each additional year by which the early retirement date precedes the member’s normal retirement date.

Hydro One Inc. Hydro One Pension Plan
F–4 Actuarial Valuation as at December 31, 2015
Willis Towers Watson Confidential
These reductions apply with respect to a female member whose employment commenced prior to 1976 and who has a deferred pension and at least 25 years of continuous employment at retirement. For any other members who have a deferred vested pension and have fewer than 25 years of continuous employment and are at least age 55 when they request that the pension payments begin, the deferred vested pension will be actuarially reduced (unless the member was eligible for an unreduced early retirement provision in effect when the member terminated active employment).
Other Members
A member, who does not qualify under any of the previously mentioned early retirement provisions, may retire within 10 years of normal retirement date. If the retirement occurred prior to July 1, 2012, the member is also required to have at least two years of Pension Plan membership. In such a case, the pension is the actuarial equivalent of the member’s deferred pension provided that the reduction shall not be less than the minimum early retirement reduction required under the Income Tax Act (Canada).
Terminated Members with Deferred Pensions
A terminated member with a deferred pension may retire under any of the previously mentioned provisions for early retirement without reduction provided that such provision was in effect on the date of termination. In addition, if the member’s employment is terminated on or after July 1, 2012, the member may be eligible for grow-in benefits under the Pension Benefits Act (Ontario) (“PBA”), resulting in the member being entitled to early retirement benefits under the Pension Plan that the member would not otherwise be eligible to receive on the date of termination.
Note 7: For Management employees hired on or after January 1, 2004 and Society represented employees hired on or after November 17, 2005 all references to “continuous employment” are to be replaced with “pensionable service” for service while a Management or Society-represented employee.
Postponed Retirement
Members who work past their normal retirement date shall continue to accrue benefits until December 1st of the calendar year they reach age 71 (or the Income Tax Act age limit, if different), they reach the 35 year service limit, or they terminate employment, whichever occurs first. If a member reaches 35 years of service and ceases contributions to the Pension Plan, service after 35 years is not counted in the calculation of the member’s pension, but the pension is calculated using the member’s base earnings up to the date of postponed retirement. If the member works past age 71, the member’s pension will commence to be paid not later than December 1st of the year in which the member turns age 71.
Pension Increases
Pension increases of 100% (see Note 8) of the increase in the Consumer Product Index (“CPI”) (Ontario), for the 12-month period ending in June of the previous year , will be given every January 1

Hydro One Inc. Hydro One Pension Plan Actuarial Valuation as at December 31, 2015 F–5
HTTP://NATCT.INTERNAL.TOWERSWATSON.COM/CLIENTS/601835/HYDROONE2016RETGENERAL/DOCUMENTS/HYDRO ONE 12.31.2015 RPP VALUATION APP.DOC
to pensioners, beneficiaries and terminated employees with deferred pensions to an annual maximum of 8% each year after 1999. Any excess will be carried forward to use in future years up to the 8% limit.
Note 8: For Management employees hired on or after January 1, 2004 and Society represented employees hired on or after November 17, 2005, pension increases of 75% CPI (Ontario) for the 12-month period ending in June of the previous year will be given every January 1, to an annual maximum increase of 5%, with no carry forward.
Disability
A totally disabled employee receives benefits from an income replacement plan and ceases to contribute to the Pension Fund, but continues to accrue credited service. For this member, the base annual earnings for pension purposes are deemed to be increased by the same percentage increases described for pensions above.
Employee Contributions
Members, not represented by the Society or PWU, contribute at the following rates until they complete 35 years of credited service:
On and after April 1, 2015,
i. 6.25% of base annual earnings up to the YMPE; and
ii. 8.25% of base annual earnings in excess of the YMPE;
up to the limits established by the Income Tax Act.
Members represented by the Society hired on or after November 17, 2005 contribute at the following rates until they complete 35 years of credited service (see Note 9):
Up to and including March 31, 2016,
i. 6.50% of base annual earnings up to the YMPE; and
ii. 8.50% of base annual earnings in excess of the YMPE;
On and after April 1, 2016,
i. 7.00% of base annual earnings up to the YMPE; and
ii. 9.00% of base annual earnings in excess of the YMPE;
On and after April 1, 2017,
i. 7.75% of base annual earnings up to the YMPE; and
ii. 9.75% of base annual earnings in excess of the YMPE;
On and after April 1, 2018
i. 8.25% of base annual earnings up to the YMPE; and

Hydro One Inc. Hydro One Pension Plan
F–6 Actuarial Valuation as at December 31, 2015
Willis Towers Watson Confidential
ii. 10.75% of base annual earnings in excess of the YMPE;
up to the limits established by the Income Tax Act.
Members represented by the Society hired before November 17, 2005 contribute at the following rates until they complete 35 years of credited service (see Note 9):
Up to and including March 31, 2016,
iii. 6.50% of base annual earnings up to the YMPE; and
iv. 8.50% of base annual earnings in excess of the YMPE;
On and after April 1, 2016,
iii. 7.00% of base annual earnings up to the YMPE; and
iv. 9.00% of base annual earnings in excess of the YMPE;
On and after April 1, 2017,
iii. 7.75% of base annual earnings up to the YMPE; and
iv. 9.75% of base annual earnings in excess of the YMPE;
On and after April 1, 2018
iii. 8.75% of base annual earnings up to the YMPE; and
iv. 11.25% of base annual earnings in excess of the YMPE;
up to the limits established by the Income Tax Act.
Note 9: For Society represented members hired before November 17, 2005, contributions increase by 0.5% in the event that after January 1, 2004 a valuation report reveals that the solvency assets are lower than 106% of the solvency liabilities. Effective April 1, 2018 this clause is no longer applicable.
Members represented by the PWU contribute at the following rates until they complete 35 years of credited service:
Up to and including March 31, 2016,
i. 7.25% of base annual earnings up to the YMPE; and
ii. 9.25% of base annual earnings in excess of the YMPE;
On and after April 1, 2016,
i. 8.25% of base annual earnings up to the YMPE; and
ii. 10.25% of base annual earnings in excess of the YMPE;
On and after April 1, 2017,
i. 8.75% of base annual earnings up to the YMPE; and
ii. 11.25% of base annual earnings in excess of the YMPE;
up to the limits established by the Income Tax Act.

Hydro One Inc. Hydro One Pension Plan Actuarial Valuation as at December 31, 2015 F–7
HTTP://NATCT.INTERNAL.TOWERSWATSON.COM/CLIENTS/601835/HYDROONE2016RETGENERAL/DOCUMENTS/HYDRO ONE 12.31.2015 RPP VALUATION APP.DOC
Death Before Retirement
No Surviving Spouse or Eligible Dependent Children
Fewer than two years of Pension Plan membership (Deaths prior to July 1, 2012)
The member’s beneficiary or estate receives a cash refund of the member’s contributions plus interest.
Two or more years of Pension Plan membership
The beneficiary or estate will receive the following:
• For pre-1987 service: a cash refund of the member’s contributions plus interest.
• For post-1986 service: a lump sum equal to the commuted value of the member’s pension earned since 1986, plus a refund of any excess contributions.
For deaths occurring on or after July 1, 2012, the beneficiary or estate will be entitled to the death benefits described above regardless of the member’s length of service.
Surviving Spouse (see Note 10)
Fewer than two years of Pension Plan membership and less than 10 years of continuous employment
The beneficiary or estate receives a cash refund of the member’s contributions plus interest.
Fewer than two years of Pension Plan membership and more than 10 years of continuous employment
The surviving spouse receives an immediate pension of 66.67% of the member’s accrued pension earned to the date of death.
More than two years of Pension Plan membership, but less than 10 years of continuous employment
For pre-1987 service: The beneficiary or estate receives a cash refund of the member’s contributions plus interest.
For post-1986 service:
• The beneficiary or estate receives a refund of any excess member contributions; and
• The surviving spouse chooses either:
a. a lump-sum payment equal to the commuted value of the pension earned after 1986, or
b. an immediate or deferred pension with a commuted value equal to pension earned after 1986.
More than two years of Pension Plan membership, and more than 10 years of continuous employment
For pre-1987 service: The surviving spouse receives an immediate pension of 66.67% of the member’s accrued pension earned prior to 1987.
For post-1986 service:
• The beneficiary or estate receives a refund of any excess member contributions; and
• The surviving spouse chooses either:

Hydro One Inc. Hydro One Pension Plan
F–8 Actuarial Valuation as at December 31, 2015
Willis Towers Watson Confidential
a. a lump-sum payment equal to the commuted value of the pension earned after 1986, or
b. an immediate or deferred pension with a commuted value equal to pension earned after 1986. The immediate pension will not be less than 66.67% of the pension earned after 1986.
Note 10: For deaths occurring on or after July 1, 2012, the surviving spouse’s entitlement to death benefits for post-1986 service shall be determined without reference to whether the member had more or less than two years of Pension Plan membership. In addition, for deaths occurring on or after July 1, 2012, if the surviving spouse is entitled to the death benefits in respect of the member’s post-1986 service, the surviving spouse is also entitled to an amount equal to the member’s contributions, with interest, in respect of pre-1987 service, rather than the designated beneficiary or estate.
Dependent Children, No Surviving Spouse
If the member completed 10 years of continuous employment, the survivor’s pension is payable to the surviving spouse until death or, if there is no eligible spouse, to the dependent children until age 18 (longer if disabled or in full-time attendance at a school or university). The total benefits paid are subject to a minimum of the member’s contributions with interest. A payment of the commuted value of the member’s deferred pension less the commuted value of the pension payable to any dependent children is made to the beneficiary or estate.
Death After Retirement
A survivor’s pension, being an amount equal to 66.67% of the pension to which the member would have been entitled, is payable on death after retirement to the surviving spouse, subject to other options chosen at the time of retirement. If the survivor spouse subsequently dies and is survived by the dependent children, or the member does not have a surviving spouse and is survived only by dependent children, the 66.67% survivor pension is split among the dependent children and is payable to age 18 (longer if disabled or in full-time attendance at a school or university).
If the member does not have a surviving spouse at retirement, the normal form of pension is a pension payable for life with a guarantee of 60 payments.
Optional forms of pension are available on an actuarially equivalent basis.
Termination of Employment (see Note 12)
Less Than One Year of Pension Plan Membership
A cash refund of the member’s contributions plus interest.
More Than One Year But Fewer Than Two Years of Pension Plan Membership

Hydro One Inc. Hydro One Pension Plan Actuarial Valuation as at December 31, 2015 F–9
HTTP://NATCT.INTERNAL.TOWERSWATSON.COM/CLIENTS/601835/HYDROONE2016RETGENERAL/DOCUMENTS/HYDRO ONE 12.31.2015 RPP VALUATION APP.DOC
The member is entitled to elect a cash refund of the member’s contributions plus interest, or may leave the earned pension benefit in the Pension Plan to be paid upon retirement.
More Than Two Years but fewer than 10 Years of Pension Plan Membership and, either under Age 45, or Fewer Than 10 Years of Continuous Employment
For pre-1987 service: the member is entitled to a cash refund of the member’s contributions plus interest, or may leave all of the earned pension benefit in the Pension Plan until retirement.
For post-1986 service: the member is entitled to leave all of the earned pension benefit in the Pension Plan until retirement; or to transfer (see Note 11) the commuted value of the earned pension.
More Than Two Years but fewer than 10 Years of Pension Plan Membership, and Age 45 or Older with More Than 10 Years of Continuous Employment
For pre-1987 service: the member is entitled to leave all of the earned pension benefit in the Pension Plan until retirement; or to transfer (see Note 11) 75% of the commuted value of the pension and receive a refund of 25% of the commuted value of your earned pension; or to leave 75% of the earned pension benefit in the Pension Plan until retirement, and receive a refund of 25% of the commuted value of the earned pension.
For post-1986 service: the member is entitled to leave all of the earned pension benefit in the Pension Plan until retirement; or to transfer (see Note 11) the commuted value of the earned pension.
More Than 10 Years of Pension Plan Membership, But Younger Than Age 45
For service from 1965 to 1986: the member is entitled to a cash refund of the member’s contributions plus interest; or to leave all of the earned pension benefit in the Pension Plan until retirement; or to leave 75% of the earned pension benefit in the Pension Plan until retirement and receive a refund of 25% of the commuted value of the earned pension.
For post-1986 service: the member is entitled to leave all of the earned pension benefit in the Pension Plan until retirement; or to transfer (see Note 11) the commuted value of the earned pension.
More than 10 Years of Pension Plan Membership and Age 45 or Older
For pre-1965 service: the member is entitled to a cash refund of the member’s contributions plus interest; or to leave all of the earned pension benefit in the Pension Plan until retirement; or to leave 75% of the earned pension benefit in the Pension Plan until retirement and receive a refund of 25% of the commuted value.

Hydro One Inc. Hydro One Pension Plan
F–10 Actuarial Valuation as at December 31, 2015
Willis Towers Watson Confidential
For service from 1965 to 1986: the member is entitled to leave all of the earned pension benefit in the Pension Plan until retirement; or to leave 75% of the earned pension benefit in the Pension Plan until retirement and receive a refund of 25% of the commuted value; or to transfer (see Note 11) the greater of the commuted value of 75% of the earned pension or the member’s contributions with interest and receive a refund of 25% of the commuted value of the earned pension.
For post 1986 service: the member is entitled to leave all of the earned pension benefit in the Pension Plan until retirement; or to transfer the commuted value of the earned pension.
If a member is terminated on or after July 1, 2012, the member may be eligible for grow-in benefits under the PBA, which could result in the member being entitled to early retirement benefits under the Pension Plan that the member would not otherwise be eligible to receive on the date of termination. If grow-in benefits apply, this may affect the value of the benefits the member is entitled to receive on termination of employment or retirement.
Note 11: Amounts must be transferred to a pension fund related to another pension plan, a prescribed retirement savings arrangement, or a life annuity which does not commence before the earliest date on which the member would have been entitled to retire.
Note 12: In respect of terminations occurring on or after July 1, 2012, a member is entitled to the earned pension benefits for all service regardless of length of Pension Plan membership, continuous employment or age.
Excess Contributions
Upon the earliest of termination of employment, death or retirement, the amount by which the member’s post-1986 contributions with interest exceed 50% of the commuted value of the vested deferred pension accrued after 1986 is refunded to the member (or to the spouse, beneficiary or estate, as applicable in the case of death before retirement).
Upon termination of employment, if a member who has attained age 45 and completed 10 or more years of continuous employment elects to fully divest the pension accrued prior to 1987, the member is entitled to receive the amount by which the contributions with interest made after 1964 but prior to 1987 exceeds the commuted value of the pension accrued after 1964 but prior to 1987. (See Note 13)
Note 13: For terminations occurring on or after July 1, 2012, entitlement to excess contributions in respect of pre-1987 service shall be determined without reference to age or years of continuous employment.
Maximum Benefits
The benefits in respect of continuous employment after 1991 are limited to the maximum allowable under the Income Tax Act (Canada).

Hydro One Inc. Hydro One Pension Plan Actuarial Valuation as at December 31, 2015 G–1
http://natct.internal.towerswatson.com/clients/601835/HydroOne2016RETGeneral/Documents/Hydro One 12.31.2015 RPP Valuation APP.doc
Appendix G: PBGF Assessment, Transfer Ratio and Solvency Ratio
PBGF Assessment
(dollar amounts in thousands) December 31, 2015 PBGF Assessment Solvency liability: l Total $ 6,465,246 l Ontario PBGF liability 6,465,246 l Ontario additional PBGF liability 0 Solvency value of assets: l Total $ 6,743,595 l Ontario PBGF assets 6,743,595 PBGF assessment base $ 0 Plan membership (including inactive members): l Total 13,059 l Ontario 13,059
Comments:
l The solvency value of assets reflects net outstanding amounts. The solvency value of assets is prior to deduction of a provision for plan windup expenses.
l For the purposes of calculating the PBGF assessment base, the solvency value of assets and the solvency liability exclude the additional voluntary contribution provision.
l The Ontario PBGF liability used for purposes of calculating the PBGF assessment excludes the Ontario additional PBGF liability.
l As specified in the Regulation to the Pension Benefits Act (Ontario), the additional PBGF liability is the additional solvency liability for plant closure and permanent layoff benefits excluded for those Ontario members who are immediately eligible for the benefit at the actuarial valuation date, if any.

Hydro One Inc. Hydro One Pension Plan
G–2 Actuarial Valuation as at December 31, 2015
Willis Towers Watson Confidential
Transfer Ratio and Solvency Ratio
(dollar amounts in thousands) December 31, 2015 Transfer Ratio Solvency value of assets $ 6,743,615 Lesser of estimated employer contributions for the period until the next actuarial valuation and prior year credit balance $ 48,000 Hypothetical windup liability $ 9,545,090 Transfer ratio 0.70 Solvency Ratio Solvency value of assets $ 6,743,615 Solvency liability $ 6,465,266 Solvency ratio Not less than 1.00
Comments:
l The solvency value of assets reflects net outstanding amounts. The solvency value of assets is prior to deduction of a provision for plan windup expenses.
l As the transfer ratio is less than 1.00, transfer deficiencies must be paid over a maximum period of five years unless the cumulative transfer deficiencies are within the limits prescribed by the Regulation to the Pension Benefits Act (Ontario) or the employer remits additional contributions in respect of the transfer deficiencies. Pursuant to Regulations 19(4) or 19(5) to the Pension Benefits Act (Ontario), approval of the Superintendent will be required to make commuted value transfers if there has been a significant decline in the transfer ratio after the actuarial valuation date.
l Based on the solvency ratio defined as the ratio of solvency value of assets to solvency liabilities, the next actuarial valuation of the plan is due with an effective date not later than December 31, 2018.


Hydro One Inc. Hydro One Pension Plan Actuarial Valuation as at December 31, 2015 I–1
http://natct.internal.towerswatson.com/clients/601835/HydroOne2016RETGeneral/Documents/Hydro One 12.31.2015 RPP Valuation APP.doc
Appendix I: Actuarial Information Summary

Filed: 2016-05-31 EB-2016-0160 Exhibit C1 Tab 6 Schedule 1 Page 1 of 4
Witness: Glenn Scott
COMMON CORPORATE COSTS, COST ALLOCATION 1
METHODOLOGY 2
3
Allocation of Common Corporate Costs to Hydro One’s Distribution and Transmission 4
businesses and to each Hydro One affiliate is based on clearly articulated shared 5
functions and services and an established cost allocation approach based on cost causality 6
principles. 7
8
The Common Corporate Costs OM&A programs include the provision of Corporate 9
Common Functions and Services (“CCF&S”), Customer Service, Planning, Information 10
Technology, and Operating Programs to support the Hydro One Networks’ Distribution 11
and Transmission businesses. CCF&S are described fully in Exhibit C1, Tab 3, Schedule 12
3 and include Corporate Management, Finance, Human Resources, Corporate 13
Communications & Services, General Counsel & Secretariat, Regulatory Affairs, 14
Corporate Security, Internal Audit and Real Estate & Facilities. 15
16
1. ALLOCATION METHODOLOGY 17
18
Since 2004, in connection with each cost of service application, Hydro One has 19
commissioned a study by Black and Veatch (B&V) to recommend a best practice 20
methodology to allocate common corporate costs among the business entities using the 21
common services. The adopted methodology represents the industry’s best practices, 22
identifying appropriate cost drivers to reflect cost causality and benefits received. The 23
2015 report on this study is provided as Attachment 1 to this exhibit. 24
25
As part of the 2015 study, the cost drivers used to allocate the common corporate costs in 26
EB-2014-0140 were updated to incorporate current information. 27
28

Filed: 2016-05-31 EB-2016-0160 Exhibit C1 Tab 6 Schedule 1 Page 2 of 4
Witness: Glenn Scott
A time study was conducted within Hydro One’s Planning, Operating and Customer 1
Service groups. The time study for these groups spanned a four week period. 2
3
Hydro One accepted the results of the 2015 B&V study as providing a reasonable and 4
equitable approach to the assignment of common corporate costs among the business 5
entities using the common services. This methodology was based on the R. J. Rudden 6
Associates (Rudden) Study that the Board accepted in the Distribution rate decision RP-7
2005-0020/EB-2005-0378. 8
9
2. 2017-2018 ALLOCATED AMOUNTS 10
11
The following Tables 1 to 2 provide the annual allocation of 2017-2018 CCF&S costs, 12
respectively to all business units. 13
14

Updated: 2016-07-20 EB-2016-0160 Exhibit C1 Tab 6 Schedule 1 Page 3 of 4
Witness: Glenn Scott
Table 1: Allocation of 2017 CCF&S Costs ($ Millions) 1
Description Total Transmission Distribution Hydro One Telecom
Hydro One
Remotes
Hydro One Inc.
Corporate Management 22.3 7.2 6.8 0.1 0.1 8.1
Finance 41.0 21.9 17.9 0.9 0.3 0.1 Human Resources 14.8 7.6 6.8 0.2 0.1 0.0
Corporate Communications & Services
17.3 8.7 8.5 0.0 0.1 0.0
General Counsel & Secretariat 10.4 5.5 4.4 0.1 0.3 0.1
Regulatory Affairs 25.4 9.6 15.0 0.0 0.1 0.8
Corporate Security 4.7 2.2 2.5 0.0 0.0 0.0
Internal Audit 6.3 3.3 2.8 0.1 0.1 0.0 Real Estate & Facilities 59.6 32.2 27.3 0.0 0.0 0.0
Total CCF&S Costs 201.8 98.3 92.0 1.4 1.1 9.1
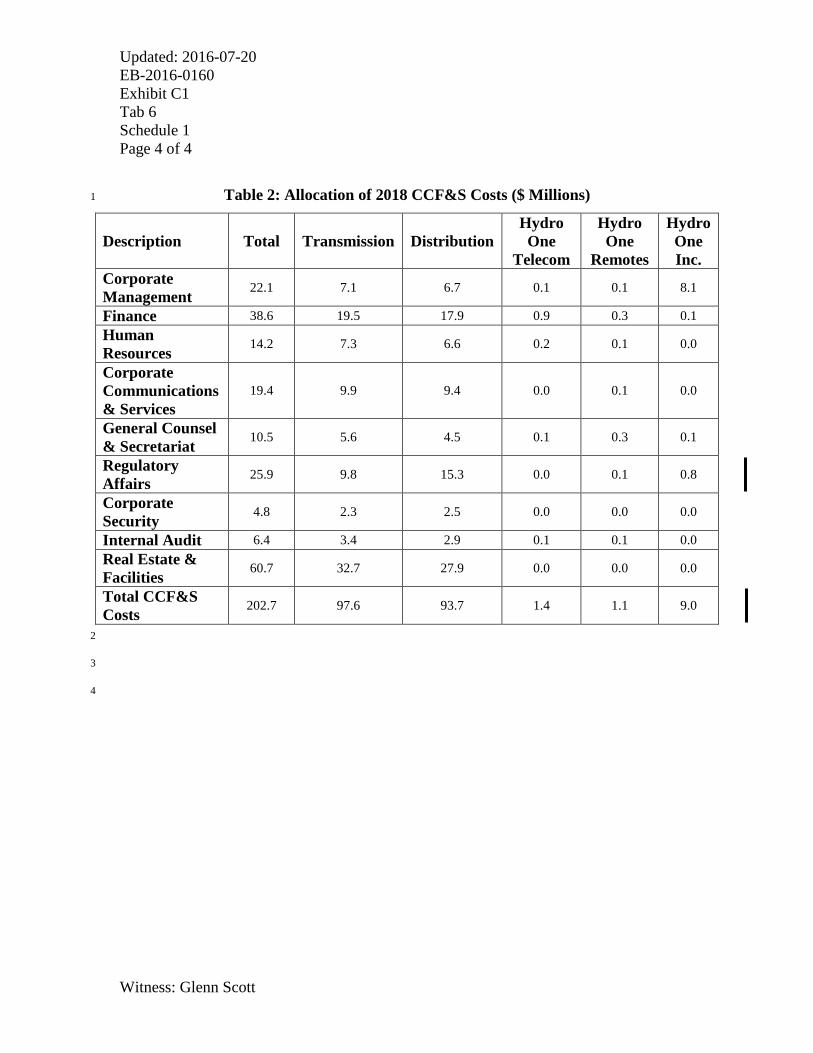
Updated: 2016-07-20 EB-2016-0160 Exhibit C1 Tab 6 Schedule 1 Page 4 of 4
Witness: Glenn Scott
Table 2: Allocation of 2018 CCF&S Costs ($ Millions) 1
Description Total Transmission Distribution Hydro One
Telecom
Hydro One
Remotes
Hydro One Inc.
Corporate Management 22.1 7.1 6.7 0.1 0.1 8.1
Finance 38.6 19.5 17.9 0.9 0.3 0.1 Human Resources 14.2 7.3 6.6 0.2 0.1 0.0
Corporate Communications & Services
19.4 9.9 9.4 0.0 0.1 0.0
General Counsel & Secretariat 10.5 5.6 4.5 0.1 0.3 0.1
Regulatory Affairs 25.9 9.8 15.3 0.0 0.1 0.8
Corporate Security 4.8 2.3 2.5 0.0 0.0 0.0
Internal Audit 6.4 3.4 2.9 0.1 0.1 0.0 Real Estate & Facilities 60.7 32.7 27.9 0.0 0.0 0.0
Total CCF&S Costs 202.7 97.6 93.7 1.4 1.1 9.0
2
3
4

REVIEW OF ALLOCATION OF COMMON CORPORATE COSTS (TRANSMISSION) – 2015 BLACK & VEATCH PROJECT NO. 188588
PREPARED FOR
Hydro One Networks Inc.
4 MAY 2016
®
®
©Black & Veatch Holding Company 2016. A
ll rights reserved.
Updated: 2016-07-20 EB-2016-0160 Exhibit C1-6-1 Attachment 1 Page 1 of 23

Hydro One Networks Inc. | COMMON CORPORATE COSTS (TRANSMISSION) ‐ 2015
BLACK & VEATCH 1
Table of Contents TableofContents........................................................................................................1
I. Summary...............................................................................................................2
A. Background...................................................................................................................2
B. HydroOneOrganization.........................................................................................3
C. FunctionsAndServicesInCommonCorporateCosts.................................3
D. Black&Veatch’sAssignment................................................................................4
E. OverviewOfMethodology......................................................................................5
F. ScopeOfWork.............................................................................................................6
G. ConclusionsAndResults.........................................................................................6
II. StatementofApproach....................................................................................8
A. EvaluateCostAllocationMethodology.............................................................8
B. ReviewApplicationOfCostAllocationMethodology..................................8
C. PrinciplesOfCostallocation..................................................................................9
D. CostDrivers..................................................................................................................9
E. TypesofCostDrivers...............................................................................................9
III. EvaluateCostAllocationMethodology....................................................10
IV. ReviewApplicationofMethodologytoBP2017‐2018......................11
V. 2015TimeStudy..............................................................................................15
List of Tables Table1‐HistoryofBlack&Veatch’sCostAllocationReviewsforHydroOne...2
Table2–HydroOneBusinessUnits.....................................................................................3
Table3‐FunctionsandServicesinCommonCorporateCosts.................................4
Table4‐DistributionofAnnualCommonCorporateCosts.......................................7
Table5‐DirectAssignmentsandCostDriversforCommonCorporateCosts.13
List of Exhibits Exhibit A‐ Functions and Services in Common Corporate Costs Exhibit B‐ Types of Cost Drivers

Hydro One Networks Inc. | COMMON CORPORATE COSTS (TRANSMISSION) ‐ 2015
BLACK & VEATCH | Summary 2
I. Summary
A. BACKGROUND
Black&VeatchCanadaCompany(“Black&Veatch”)ispleasedtosubmittoHydroOneNetworksInc.(“HydroOne”)thisReportwhichdescribesourReviewofAllocationofCommonCorporateCosts(Transmission)‐2015(“2015Review”).
In2004,Black&VeatchwasengagedbyHydroOnetorecommendabestpracticemethodologytodistributeCommonCorporateCoststoHydroOneanditssubsidiariesandpartnership(identifiedinTable2).CommonCorporateCostsarethecoststoprovidecertainfunctionsandservices(identifiedinTable3),includingthoseperformedbyInergiLP,toHydroOneanditssubsidiariesandpartnership.Black&Veatchrecommended,HydroOneadopted,andtheOntarioEnergyBoard(“OEB”)accepted,amethodologytodistributethosecosts,asdescribedinourReportonCommonCorporateCostsMethodologyReviewdatedMay20,2005(“2005CommonCostsReport”).
TheOEB‐acceptedmethodologyhasbeenappliedtoHydroOne’sBusinessPlans,andreviewedbyBlack&Veatchwithsubsequentreportsissued,asfollows:
Table 1 ‐ History of Black & Veatch’s Cost Allocation Reviews for Hydro One
BLACK & VEATCH
REVIEW
BUSINESS
PLAN
BLACK & VEATCH REPORT
2006 Review BP 2007‐2011
Report on Implementation of Common Corporate Costs Methodologydated May 31, 2006
2008 Review BP 2009‐2013
Report on Implementation of Common Corporate Costs Methodologydated September 10, 2008
2009 Review BP 2010‐2014
Report on Shared Services Costs Methodology dated June 29, 2009
2010 Review Updated BP 2010‐2014
Report on Shared Services Costs Methodology – 2011 dated February 26, 2010
2012 Review BP 2012‐2016
Review of Shared Services Cost Allocation (Transmission) – 2012 dated February 1, 2012
2013 Review BP 2014‐2019
Review of Allocation of Common Corporate Costs (Distribution) – 2013dated September 19, 2013
2014 Review BP 2014‐2019
Review of Allocation of Common Corporate Costs (Transmission) – 2014dated March 17, 2014
TheOEB‐acceptedmethodologytodistributetheCommonCorporateCostshasbeenappliedbyHydroOnetoitsBusinessPlanfor2017‐2018(“BP2017‐2018”)data.ThisReportdescribesthe“2015Review”thatBlack&Veatchperformed,atHydroOne’srequest,ofHydroOne’sapplicationofthemethodologytoitsBP2017‐2018inconnectionwithits2017‐2018Transmissionratesapplication,andpresentsBlack&Veatch’sconclusions.

Hydro One Networks Inc. | COMMON CORPORATE COSTS (TRANSMISSION) ‐ 2015
BLACK & VEATCH | Summary 3
B. HYDRO ONE ORGANIZATION
HydroOneInc.operatesthroughthewholly‐ownedsubsidiariesandpartnershiplistedinTable2.TheOEBregulates,separately,thebusinessunitsidentifiedassuchinTable2.Eachregulatedbusinessisrequiredtoaccountseparatelyforitsassets,revenuesandcosts,forbothregulatoryandfinancialaccountingpurposes.
Table 2 – Hydro One Business Units
SUBSIDIARY BUSINESS
UNIT REGULATED DESCRIPTION
Hydro One
Networks Inc.
Distribution Yes
Owns and operates a distribution system which spans
approximately 75% of Ontario and serves approximately
1.3 million customers.
Transmission Yes Owns and operates substantially all of Ontario’s
electricity transmission system.
Hydro One
Remote
Communities Inc
Remotes Yes
Owns, operates, maintains and constructs generation and
distribution assets used to supply of electricity to remote
communities in northern Ontario.
Hydro One
Telecom Inc. Telecom No
Sells high bandwidth telecommunication services to
carriers, Internet service providers, and large public and
private sector organizations.
Hydro One Inc. Holding Yes Subsidiary of Hydro One Ltd. Acts as the holding
company of Hydro One’s rate regulated businesses.
Hydro One Ltd. Holding No
Public company that owns Hydro One Inc. for the
transmission and distribution rate regulated businesses
and Hydro One Telecom Inc. for non‐regulated business
activity. Hydro One Ltd. is owned by public shareholders
as well as the Province of Ontario.
B2M Limited
Partnership
B2M
Transmission
Line
Yes
Continuous transmission line between the Bruce Nuclear
Power Development and Hydro One’s Milton Switching
station.
C. FUNCTIONS AND SERVICES IN COMMON CORPORATE COSTS
HydroOneprovidesthefunctionsandservicesidentifiedinTable3,tothebusinessesidentifiedinTable2.ExhibitAfurtherdescribesthefunctionsandservicesprovided.TheBP2017‐2018includes2017CommonCorporateCoststotalingapproximately$325millionincurredtoperformtherelevantfunctionsandservices;andtheannualtotalCommonCorporateCostsarepresentedinTable4.
Approximately37%oftheCommonCorporateCostsareincurredunderanoutsourcingarrangementwithInergiLP(“Inergi”).CommonCorporateCostsincludesthecostincludedinBP2017‐2018forsustainmentactivitiesoutsourcedtoInergiservicespertainingto

Hydro One Networks Inc. | COMMON CORPORATE COSTS (TRANSMISSION) ‐ 2015
BLACK & VEATCH | Summary 4
infrastructure/datacentresupportservices,applicationmanagementservices,disasterrecoveryservices,end‐userservices,desk‐sidemanagementservicesandservicemanagement.
Table 3 ‐ Functions and Services in Common Corporate Costs
Hydro One Inc. Corporate Office
President/CEO Office Chair CFO’s Office Treasurer's Office Board of Directors Corporate Secretariat General Counsel – VP Pension Cost Donations Ombudsman Office
Investor Relations
Shared Services
Real Estate Value Growth
CFO’s Office
Treasury Corporate Controller Taxation Regulatory Affairs Business Planning & Decision Support
Operations
Distribution Asset Management (Note 1)
Planning and Optimization (Note 1)
Reliability, Strategies, and Compliance (Note 1)
System Planning (Note 1)
Network Connections and Development (Note 1)
Network Operations (Note 1) Transmission Asset Management (Note 1)
VP Planning (Note 1) EVP Office – Operations (Note 1) Outsourcing Services Strategic Services
Customer and Corporate Relations
Customer Care Services (Note 1)
Customer Strategy and Conservation (Note 1)
Customer Program Delivery (Note 1)
Key Account Management (Note 1)
VP Customer Service (Note 1) Meter to Bill (Note 1)
Corporate Affairs First Nations and Métis Relations Bad Debt and Goodwill SVP Customer and Corporate Relations
Information Services
Corporate Projects Information Technology
Security Operations
Inergi LP (outsourced services)
Finance Human Resources ‐ Pay Services
Accounts Payable
People and Culture General Counsel & Secretariat
Audit VP Chief Risk Officer
Note 1‐ Department participated in 2015 Time Study; see Section V.
D. BLACK & VEATCH’S ASSIGNMENT
Forthe2015Review,ourassignmentwasto:
a. EvaluatewhethertheexistingCommonCorporateCostAllocationMethodologycontinuestobeappropriateforHydroOne,andidentifychangesthatarenecessaryordesirable.

Hydro One Networks Inc. | COMMON CORPORATE COSTS (TRANSMISSION) ‐ 2015
BLACK & VEATCH | Summary 5
b. ReviewHydroOne’sapplicationoftheOEB‐acceptedCommonCorporateCostAllocationMethodologytotheBP2017‐2018,inconnectionwithits2017‐2018Transmissionratesapplication.
TheorganizationpresentedinTable3reflectsthecreationofnewdepartments,realignmentofdepartmentsamonggroups,andrealignmentoffunctionsamongdepartments,thatHydroOnebelieveswillallowittoserveitscustomersmosteffectivelyandefficiently,basedonthecurrentbusinessandregulatoryenvironment.
TheCommonCorporateCostsModelforBP2017‐2018reflectstheseorganizationalchanges.Black&Veatchreviewedthecostdriverforeachactivitytodetermineitscontinuedapplicability,andwherenecessary,thedevelopmentofthecostdriverwasupdatedtoreflecttheorganizationalchanges.
Concurrentlywiththis2015Review,Black&VeatchreviewedandissuedreportsonHydroOne’sOverheadCapitalizationRatemethodology,CommonAssetsallocationandAllocationofCommonCorporateCoststotheBruce‐to‐Milton(B2M)LimitedPartnership.
E. OVERVIEW OF METHODOLOGY
TheBlack&VeatchmethodologyforallocatingthecostsofHydroOne’sCommonCorporateCostswasdesignedtoaddressthefollowingconsiderations:
CompliancewithOEBprecedentincludingDocketRP‐2002‐0133(InTheMatterOfTheOntarioEnergyBoardAct,1998)
CompliancewithrelevantprovisionsoftheAffiliateRelationshipsCodeforElectricityDistributorsandTransmitters(“Code”)
Costincurrence‐Arethecostsneededtoperformservicesrequiredbythebusinessunits?
Costallocation‐Arecostsappropriatelyallocatedamongbusinessunits,basedontheapplicationofcostdrivers/allocationfactorssupportedbyprinciplesofcausality?
Cost/benefit‐Dobenefitsreceivedequalorexceedthecost?
AnoverviewoftheBlack&Veatchcostallocationmethodologyisdescribedbelow:
IdentifythefunctionsandservicesincludedinCommonCorporateCosts.
Identifyactivitiesthatareperformedtoprovidethosefunctionsandservices.
Basedontimeand/orcoststudies,distributetheannualdepartmentalcostsintheBP2017‐2018amongtheactivitiesperformedbythatdepartmentinprovidingthefunctionsandservices.
Distributethecostofeachactivityamongthebusinessunitsbasedondirectassignmentwhenpossible,andbasedoncostdriverswhendirectassignmentisnotpossible.

Hydro One Networks Inc. | COMMON CORPORATE COSTS (TRANSMISSION) ‐ 2015
BLACK & VEATCH | Summary 6
TheguidingprincipleusedbytheBlack&Veatchmethodologytoassigncostdriversiscostcausation.
Acostdriverisaformulaforsharingthecostofanactivityamongthosewhocausethecosttobeincurred.CostdriversarediscussedinSectionD.ThedifferenttypesofcostdriversaredescribedinExhibitB.
F. SCOPE OF WORK
ConsistentwithBlack&Veatch’sstandardpracticeforconsultingassignments,wereliedonthegenuinenessandcompletenessofalldocumentspresentedtousbyHydroOne,andweacceptedfactualstatementsmadetousbyHydroOne(e.g.,headcount,budgetedamounts)subjectonlytotheiroverallreasonablenessandfactualaccuracy,butwithoutourindependentconfirmation.AlldollaramountsinthisReportarestatedinCanadiandollars.
G. CONCLUSIONS AND RESULTS
Black&VeatchbelievesthatHydroOne’scurrentcostallocationmethodologycontinuestobeappropriateforHydroOnebecauseitachievesthepurposesforwhichitwasdesigned(todistributecostsinamannerthatisconsistentwithOEBprecedentandregulatorypractice)andpromotestransparencyandefficiency.
Basedonourreview,Black&VeatchconcludesthattheresultsofHydroOne’sapplicationoftheBlack&VeatchCommonCorporateCostAllocationMethodologytoitsBP2017‐2018datareflectsacostcausation‐baseddistributionoftheCommonCorporateCostsandconformstotheOEB‐acceptedmethodology.Theannualresultsforyears2017‐2018areshowninTable4.
Black&VeatchalsonotesthatHydroOnemanagementbelievesthattheexistingmethodologyisappropriateforthecompany,thecostallocationprocessreceivesstrongsupportfromHydroOnemanagementandiswellintegratedintothebudgetingprocessandtheCommonCorporateCostsModelisupdatedperiodicallytoreflectcurrentinformation.
Table4presentstheresultsofHydroOne’sdistributionoftheCommonCorporateCostsinBP2017‐2018,annuallyfor2017‐2018,amongitsDistribution,TransmissionandOtherbusinesses.

Hydro One Networks Inc. | COMMON CORPORATE COSTS (TRANSMISSION) ‐ 2015
BLACK & VEATCH | Summary 7
Table 4 ‐ Distribution of Annual Common Corporate Costs
Business 2017 2018
($ Millions) $ $
Transmission $ 163 $ 162
Distribution $ 150 $ 150
Other $ 12 $ 12
Total $ 325 $ 324
(% of Total) % %
Transmission 50% 50%
Distribution 46% 46%
Other 4% 4%
Total 100% 100%

Hydro One Networks Inc. | COMMON CORPORATE COSTS (TRANSMISSION) ‐ 2015
BLACK & VEATCH | Statement of Approach 8
II. Statement of Approach
ThissectionpresentstheapproachesusedbyBlack&VeatchtoevaluatewhethertheexistingCommonCorporateCostAllocationMethodologycontinuestobeappropriateforHydroOne,andtoreviewHydroOne’sapplicationofthemethodologytotheBP2017‐2018costsofprovidingthefunctionsandservicesincludedinCommonCorporateCosts.
A. EVALUATE COST ALLOCATION METHODOLOGY
TheCommonCorporateCostAllocationMethodologywasfirstappliedtoHydroOne’sBusinessPlan2006‐10.HydroOnerequestedthatBlack&Veatchevaluatewhetherthemethodologyisstillappropriate,andwhatchanges,ifany,couldbeconsidered.Black&Veatch’sapproachisdiscussedindetailinSectionIII.
B. REVIEW APPLICATION OF COST ALLOCATION METHODOLOGY
Inpreparingthe2015Review,Black&Veatchperformedthefollowingtasks:
Task1. ReviewedHydroOne’scurrentorganizationalstructureandidentifieddepartmentsthatperformthefunctionsandservicesincludedinCommonCorporateCosts.
Task2. IdentifiedtheactivitiesperformedbyeachdepartmentinordertoprovidethefunctionsandservicesidentifiedinTask1.
Task3. DeterminedtheCommonCorporateCostsinBP2017‐2018toperformthefunctionsandservicesinTask1.
Task4. IdentifiedthebusinessunitsthatusethefunctionsandservicesincludedinCommonCorporateCosts.
Task5. DistributedCommonCorporateCosts(timeforlabourresourcesandcostfornon‐labourandInergiresources)reflectedinBP2017‐2018fordepartmentsidentifiedinTask1,amongtheactivitiesidentifiedinTask2.
Task6. Directlyassignedactivitycoststobusinessunitswhereadirectrelationshipexists.
Task7. ForactivitieswherelessthanalloftheBP2017‐2018costsweredirectlyassignedtobusinessunitsinTask6,assignedacostdriverthatreflectscostcausation.
Task8. Populatedthecostdrivers.
Task9. Reviewedthe2015TimeStudy.
Task10. ComputedtotalCommonCorporateCostsallocatedtoeachbusinessunit.
Task11. Performedanalyticalreviewofresults.
Task12. ReviewedtheCommonCorporateCostsusedtoperformthecomputations.

Hydro One Networks Inc. | COMMON CORPORATE COSTS (TRANSMISSION) ‐ 2015
BLACK & VEATCH | Statement of Approach 9
C. PRINCIPLES OF COST ALLOCATION
Therearetwomethodstoallocateordistributesharedcostsamongautility’sbusinessunits–DirectAssignmentandAllocation.DirectAssignmentisusedwhenitcanbereasonablydeterminedthatalloraportionofanactivityisperformedforaparticularbusinessunit.DirectAssignmentiscompletedthroughtheuseoftimestudiesortimesurveys;whereparticipantseitherfilloutadailytimesheetorprovideanindicationofhowtheirtimeisspentthroughouttheyear.Approximately75%ofCommonCorporateCostintheBP2017‐2018wasassigneddirectlytooneormoreofHydroOne’sbusinessunits.
Allocationisusedwhenmorethanonebusinessunitusesanactivity,buttheportionsoftheactivitythateachusescannotbedirectlyestablishedthroughatimestudyortimesurvey.Inthiscase,acostdrivermustbeassignedtodistributethecostsoftheactivity.Acostdriverisaformulaforsharingthecostofanactivityamongthoseentitiesthatcausethecosttobeincurred.TheprinciplesusedbyBlack&VeatchtoassigncostdriversarediscussedinSectionII.Dbelow.
D. COST DRIVERS
Asstatedabove,acostdriverisaformulaforsharingthecostofanactivityamongthoseentitiesthatcausethecosttobeincurred.TheguidingprinciplethatBlack&Veatchusesinassigningcostdriversiscostcausation.Costcausationmeansthatthereisacausalrelationshipbetweenthecostdriverandthecostsincurredinperformingtheactivity.Insomecases,costcausationcannotbeeasilyimplementedorestablished,inwhichcaseselectingcostdriversbasedonbenefitsreceivedisafairalternativetreatment.
Otherfactorsconsideredinassigningcostdriversinclude:
Practicality–Thecostdrivershouldbeunderstandable,obtainableatreasonablecost,andobjectivelyverifiableintheinitialyearaswellasinsubsequentyears.
Stability–Costdrivervaluesshouldbereasonablystablefromyeartoyear.Whenestimatesareused,thecostdrivershouldbeabletobeestimatedwithreasonableaccuracy,andestimatesshouldbeunbiased.
Materiality–Whenchoosingbetweencostdrivers,smalldifferencescanoftenbeignoredinfavorofPracticalityandStability(seeabove).
E. TYPES OF COST DRIVERS
CostdriverscanbeclassifiedasExternalorInternal.Externaldriversarebasedondatathatareexternaltothecostallocationprocess,suchasphysicalunitsorfinancialamounts.
Internaldriversarebasedonvaluescomputedasanintegralpartofthecostallocationprocess.Forexample,thecostofasupervisor’ssalarymightbeallocatedinthesameproportionasthesalariesofthepeoplebeingsupervised,andthecostofgeneraldepartmentalexpensesmightbeallocatedinthesameproportionasthespecificallyassigneddepartmentalactivities.ExhibitBfurtherdescribesthedifferenttypesofcostdrivers.

Hydro One Networks Inc. | COMMON CORPORATE COSTS (TRANSMISSION) ‐ 2015
BLACK & VEATCH | Evaluate Cost Allocation Methodology 10
III. Evaluate Cost Allocation Methodology
TheCommonCorporateCostAllocationMethodologywasfirstappliedtoHydroOne’sBP2006‐10.Black&Veatchhasalsoreviewedtheapplicationofthemethodologytosubsequentbusinessplans,aslistedinSectionI.A.Thepurposeofthisportionofthe2015Reviewwastoevaluateifthemethodologyisstillappropriate,includingreviewingchangesthatwererecommendedinthepast.
BasedonourdiscussionswithHydroOnepersonnelandreviewoftheCommonCorporateCostsModel,Black&VeatchdeterminedthatthecostallocationmethodologycontinuestobeappropriateforHydroOnebecause:
Itmeetsbestpracticessinceitdistributescostsbasedoncostcausation,includingtheuseofdirectassignmentwhenpossible,andthenthroughtheuseofcostdrivers.
IthasbeenacceptedbytheOEB.
IthasthesupportofHydroOnemanagement,andisunderstoodandacceptedbytheHydroOnebusinessunits.
Itallowsthebusinessunitstodeterminepreciselywhatamountstheyarechargedbydepartmentandbyactivitywithinthedepartment;thistransparencyprovidesabasisforunderstandingthenatureofthechargesandvalueoftheservicesreceived.
Itiswell‐integratedwithHydroOne’sannualBusinessPlanningprocessandproducesreasonablystableresultsovertime.
ItaccommodateschangesinHydroOne’sorganization,andtheCommonCorporateCostsModelcanbeadaptedeasilytoreflectthosechanges.
Black&VeatchbelievesthatthecurrentcostallocationmethodologycontinuestobeappropriateforHydroOne,becauseitachievesthepurposesforwhichitwasdesigned(todistributecostsinamannerthatisconsistentwithOEBprecedentandregulatorypractice),andpromotestransparencyandefficiency.
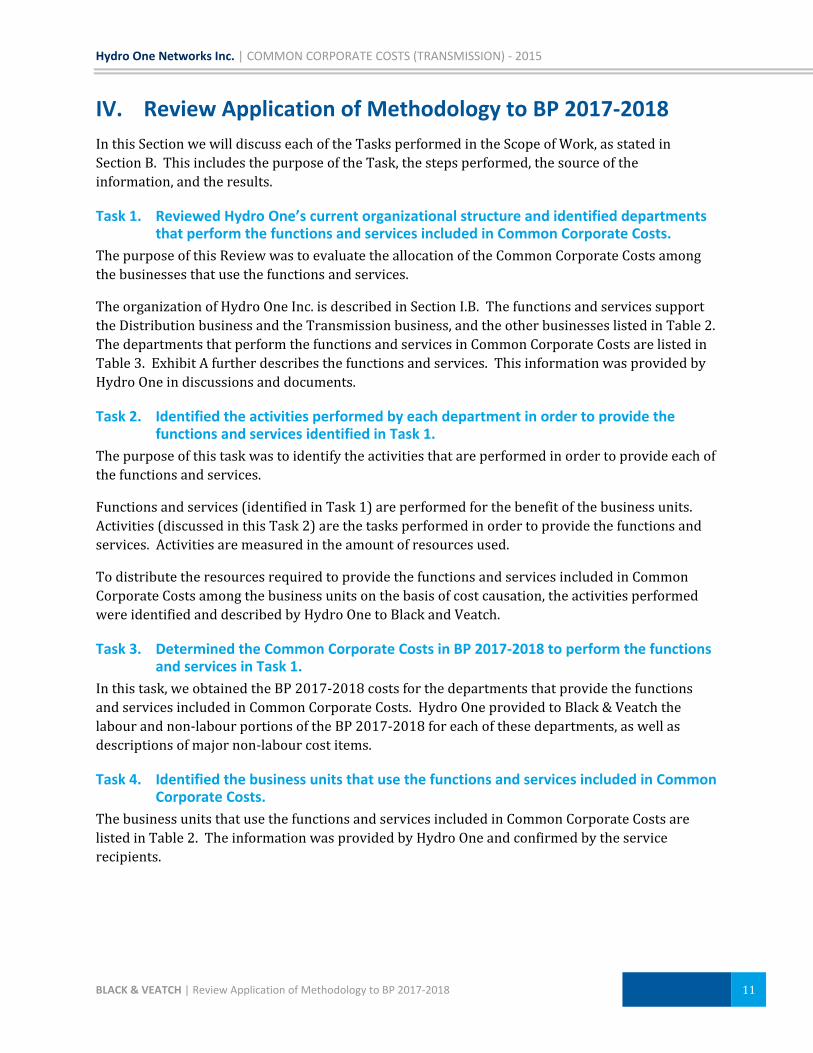
Hydro One Networks Inc. | COMMON CORPORATE COSTS (TRANSMISSION) ‐ 2015
BLACK & VEATCH | Review Application of Methodology to BP 2017‐2018 11
IV. Review Application of Methodology to BP 2017‐2018
InthisSectionwewilldiscusseachoftheTasksperformedintheScopeofWork,asstatedinSectionB.ThisincludesthepurposeoftheTask,thestepsperformed,thesourceoftheinformation,andtheresults.
Task 1. Reviewed Hydro One’s current organizational structure and identified departments that perform the functions and services included in Common Corporate Costs.
ThepurposeofthisReviewwastoevaluatetheallocationoftheCommonCorporateCostsamongthebusinessesthatusethefunctionsandservices.
TheorganizationofHydroOneInc.isdescribedinSectionI.B.ThefunctionsandservicessupporttheDistributionbusinessandtheTransmissionbusiness,andtheotherbusinesseslistedinTable2.ThedepartmentsthatperformthefunctionsandservicesinCommonCorporateCostsarelistedinTable3.ExhibitAfurtherdescribesthefunctionsandservices.ThisinformationwasprovidedbyHydroOneindiscussionsanddocuments.
Task 2. Identified the activities performed by each department in order to provide the functions and services identified in Task 1.
Thepurposeofthistaskwastoidentifytheactivitiesthatareperformedinordertoprovideeachofthefunctionsandservices.
Functionsandservices(identifiedinTask1)areperformedforthebenefitofthebusinessunits.Activities(discussedinthisTask2)arethetasksperformedinordertoprovidethefunctionsandservices.Activitiesaremeasuredintheamountofresourcesused.
TodistributetheresourcesrequiredtoprovidethefunctionsandservicesincludedinCommonCorporateCostsamongthebusinessunitsonthebasisofcostcausation,theactivitiesperformedwereidentifiedanddescribedbyHydroOnetoBlackandVeatch.
Task 3. Determined the Common Corporate Costs in BP 2017‐2018 to perform the functions and services in Task 1.
Inthistask,weobtainedtheBP2017‐2018costsforthedepartmentsthatprovidethefunctionsandservicesincludedinCommonCorporateCosts.HydroOneprovidedtoBlack&Veatchthelabourandnon‐labourportionsoftheBP2017‐2018foreachofthesedepartments,aswellasdescriptionsofmajornon‐labourcostitems.
Task 4. Identified the business units that use the functions and services included in Common Corporate Costs.
ThebusinessunitsthatusethefunctionsandservicesincludedinCommonCorporateCostsarelistedinTable2.TheinformationwasprovidedbyHydroOneandconfirmedbytheservicerecipients.
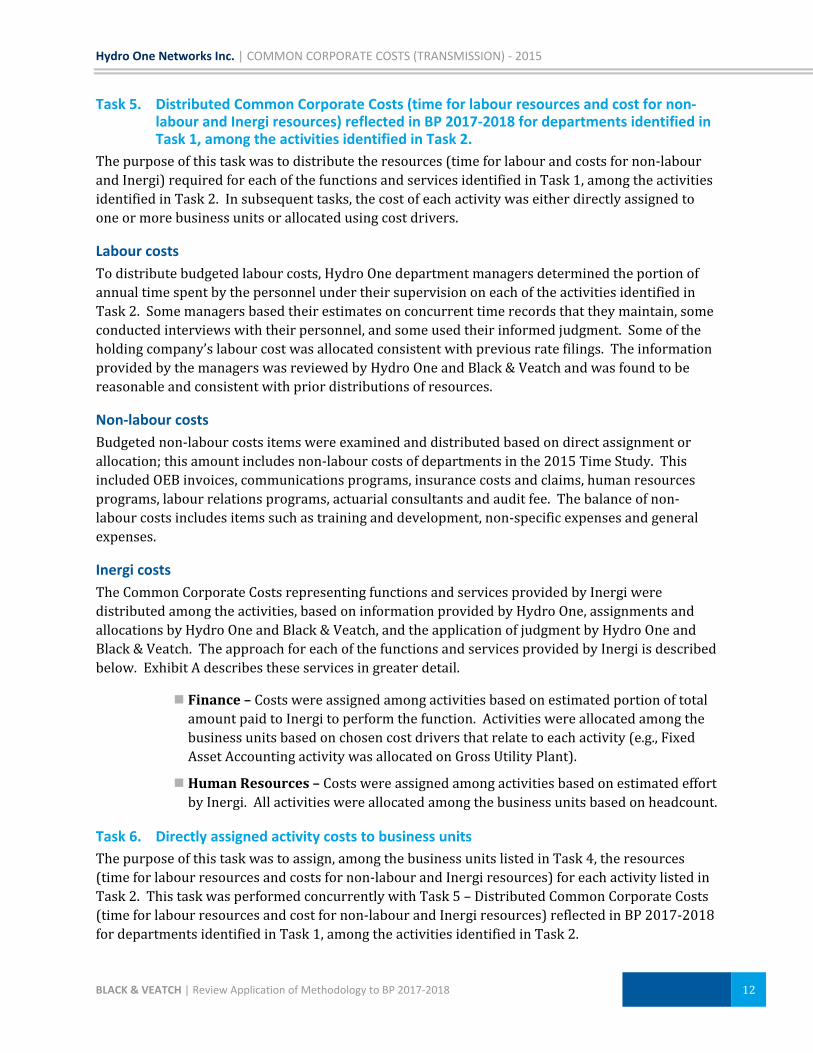
Hydro One Networks Inc. | COMMON CORPORATE COSTS (TRANSMISSION) ‐ 2015
BLACK & VEATCH | Review Application of Methodology to BP 2017‐2018 12
Task 5. Distributed Common Corporate Costs (time for labour resources and cost for non‐labour and Inergi resources) reflected in BP 2017‐2018 for departments identified in Task 1, among the activities identified in Task 2.
Thepurposeofthistaskwastodistributetheresources(timeforlabourandcostsfornon‐labourandInergi)requiredforeachofthefunctionsandservicesidentifiedinTask1,amongtheactivitiesidentifiedinTask2.Insubsequenttasks,thecostofeachactivitywaseitherdirectlyassignedtooneormorebusinessunitsorallocatedusingcostdrivers.
Labour costs
Todistributebudgetedlabourcosts,HydroOnedepartmentmanagersdeterminedtheportionofannualtimespentbythepersonnelundertheirsupervisiononeachoftheactivitiesidentifiedinTask2.Somemanagersbasedtheirestimatesonconcurrenttimerecordsthattheymaintain,someconductedinterviewswiththeirpersonnel,andsomeusedtheirinformedjudgment.Someoftheholdingcompany’slabourcostwasallocatedconsistentwithpreviousratefilings.TheinformationprovidedbythemanagerswasreviewedbyHydroOneandBlack&Veatchandwasfoundtobereasonableandconsistentwithpriordistributionsofresources.
Non‐labour costs
Budgetednon‐labourcostsitemswereexaminedanddistributedbasedondirectassignmentorallocation;thisamountincludesnon‐labourcostsofdepartmentsinthe2015TimeStudy.ThisincludedOEBinvoices,communicationsprograms,insurancecostsandclaims,humanresourcesprograms,labourrelationsprograms,actuarialconsultantsandauditfee.Thebalanceofnon‐labourcostsincludesitemssuchastraininganddevelopment,non‐specificexpensesandgeneralexpenses.
Inergi costs
TheCommonCorporateCostsrepresentingfunctionsandservicesprovidedbyInergiweredistributedamongtheactivities,basedoninformationprovidedbyHydroOne,assignmentsandallocationsbyHydroOneandBlack&Veatch,andtheapplicationofjudgmentbyHydroOneandBlack&Veatch.TheapproachforeachofthefunctionsandservicesprovidedbyInergiisdescribedbelow.ExhibitAdescribestheseservicesingreaterdetail.
Finance–CostswereassignedamongactivitiesbasedonestimatedportionoftotalamountpaidtoInergitoperformthefunction.Activitieswereallocatedamongthebusinessunitsbasedonchosencostdriversthatrelatetoeachactivity(e.g.,FixedAssetAccountingactivitywasallocatedonGrossUtilityPlant).
HumanResources–CostswereassignedamongactivitiesbasedonestimatedeffortbyInergi.Allactivitieswereallocatedamongthebusinessunitsbasedonheadcount.
Task 6. Directly assigned activity costs to business units
Thepurposeofthistaskwastoassign,amongthebusinessunitslistedinTask4,theresources(timeforlabourresourcesandcostsfornon‐labourandInergiresources)foreachactivitylistedinTask2.ThistaskwasperformedconcurrentlywithTask5–DistributedCommonCorporateCosts(timeforlabourresourcesandcostfornon‐labourandInergiresources)reflectedinBP2017‐2018fordepartmentsidentifiedinTask1,amongtheactivitiesidentifiedinTask2.

Hydro One Networks Inc. | COMMON CORPORATE COSTS (TRANSMISSION) ‐ 2015
BLACK & VEATCH | Review Application of Methodology to BP 2017‐2018 13
FortheactivitieslistedinTask2,HydroOne’sdepartmentalmanagersdistributedtheresourcecostsamongoneormorebusinessunits,basedonthebusinessunitsthatcausedthecoststobeincurred.Whenpossible,alloraportionofcostswereassignedtoaspecificbusinessunit.
Task 7. Any portion of an activity that was not assigned to a specific business unit due to its generalized nature was allocated among business units using cost drivers, as described in Task 7. Assigned cost drivers
Asdiscussedabove,thecostsofactivitiesweredirectlyassignedtobusinessunitswhenpossible.ThepurposeofthistaskwastoselectcostdriversfortheportionofcostswhichwerenotdirectlyassignedinTask6.
TheprinciplesthatBlack&VeatchusedtoassigncostdriversarediscussedinSectionII.D‐CostDrivers.Black&Veatchselectedcostdriversbasedonapplyingtheprinciplesdiscussedabove,itsexperienceinperformingcostallocationstudies,consultationswithHydroOneastothenatureofeachactivity,andindustrypracticesandregulatoryrequirements.
SectionII.ETypesofCostDriversdescribesthetypesofcostdrivers.
Table5summarizesthedirectassignmentsandtypesofcostsdriversusedtodistributetheCommonCorporateCostsamongthebusinessunits.AmountsincludetheInergicharges.
Table 5 ‐ Direct Assignments and Cost Drivers for Common Corporate Costs
Task 8. Populated cost drivers
Thepurposeofthistaskwastodeterminethevaluesofeachcostdriverthatareattributabletoeachbusinessunitinordertodistributethecostsofeachactivityamongthebusinessunits.ThesupportinginformationwasprovidedbyHydroOne.
Task 9. Reviewed 2015 Time Study
ThisTaskisdiscussedinSectionV.
Task 10. Computed total common corporate costs for each business unit
Thepurposeofthistaskwastodistributethetotalcostofeachactivityamongthebusinessunits.TheamountdistributedwasthesumoftheamountsdirectlyassignedinTask6,andallocationsbasedonthecostdriversidentifiedinTask7.
Forallocationsbasedonthecostdrivers,theamountallocatedtoeachbusinessunitwascomputedbymultiplyingtheactivitycosttobeallocatedbythecostdrivervalueforthebusinessunit.
TYPE 2017 2018
(% of Total) % %
Direct Assignment 62.07% 61.18%
Physical 9.78% 9.87%
Financial 22.59% 23.04%
Internal 5.56% 5.91%
Total 100.00% 100.00%
Hydro One Networks Inc. | COMMON CORPORATE COSTS (TRANSMISSION) ‐ 2015
BLACK & VEATCH | Review Application of Methodology to BP 2017‐2018 14
Task 11. Performed analytical review
ThepurposeofthistaskwastocomparetheresultsofthedistributionoftheBP2017‐2018CommonCorporateCostsamongthebusinessunitstotheresultsintheprevious2014Review,andtounderstandthedifferences.
TheproportionsofthetotalcostdistributedtoeachbusinessunithavebeenreasonablysimilarovertimeanddifferencesareexplainedbyadditionsandremovalofdepartmentsfromtheCommonCorporateCosts(i.e.,the2015ReviewincludedBadDebtandGoodwillwhichis100%Distribution,forthefirsttime),changesinallocationsoftime,changesinallocatorvaluesandchangesindepartmentalfunctionsandactivities.
Task 12. Reviewed Common Corporate Costs Model
ThepurposeofthistaskwastoreviewtheCommonCorporateCostsModelthatHydroOnehasdevelopedforallocatingtheCommonCorporateCosts,todetermineifitproperlyreflectsandmodelstheOEB‐approvedcostallocationmethodologyforthosecostsincludedintheBP2017‐2018.
Black&VeatchfirstreviewedCommonCorporateCostsModelinconnectionwithour2008Review,andhasreviewedthemodelforeachofthesubsequentreviewsperformed,includingthis2015Review.Themodelisupdatedperiodicallytoreflectorganizationalchanges;BusinessPlancosts;additionstoanddeletionsofdepartmentalactivities;timeandcostdistributionsamongactivities;assignmentsofallocators;andcostdrivervalues.
TheCommonCorporateCostsdistributesdepartmentalcostsamongactivities(Task6)andthendistributesthecostofeachactivitybasedondirectassignmentsorcostdrivers(Task10).
BasedonBlack&Veatch’sreview,theCommonCorporateCostsproperlyimplementstheOEB‐acceptedmethodologyfordistributingthecostsofcorporatefunctionsandservicesintheBP2017‐2018,andcontinuestoproduceacause‐basedallocationofcosts.

Hydro One Networks Inc. | COMMON CORPORATE COSTS (TRANSMISSION) ‐ 2015
BLACK & VEATCH | 2015 Time Study 15
V. 2015 Time Study
HydroOneemployeesrepresentingapproximately$115millionofannuallabourcostsparticipatedinatimestudyforthefour‐weekperiodendingJune12,2015(“2015TimeStudy”).
Thedepartmentsthatparticipatedinthe2015TimeStudyareidentifiedinTable3(designatedbyNote1nexttothedepartmentname).TheresponsibilitiesofthesedepartmentsareincludedinExhibitA.
Thepersonnelinthesedepartmentsareabletodeterminewithreasonableaccuracy,onacurrentbasis,thetimetheyspendonDistributionOperationsandMaintenance,DistributionCapitalProjects,TransmissionOperationsandMaintenanceandTransmissionCapitalProjectsbecausetheprogramsandprojectsonwhichtheyworkareclearlydefined.
Aproperlyperformedtimestudymeasurescostcausationandiswidelyacceptedasabasisforassigningcosts.HydroOnepersonneladministeredthe2015TimeStudyusingthesamedesignandcommunicationmaterialdesignedbyBlack&Veatchandutilizedinthetimestudythatoccurredin2013.Black&Veatch’sresponsibilitiesincludedreviewingtimestudyresultsandtheconsolidationoftheresults,andconfirmingthecompletenessofthetimestudyanditsconsistencywiththestudydesign.ThemethodologywasthesameasusedinpriortimestudiesconductedbyBlack&VeatchforHydroOne.
Itwasnotpracticaltoperformafull‐yearstudy,butwebelievetheresultsforafour‐weekperiodarerepresentativeofthefull‐year.Tosupportthisjudgment,Black&VeatchreviewedthepreviousHydroOnetimestudies,whichwerecompletedatdifferenttimesduringtheyear,andfoundthattheresultswerereasonablysimilartothe2015TimeStudyresults.
Black&Veatchfoundthatthe2015TimeStudywasappropriatelydesignedandcompleted,theresultswerecorrectlycompiled,andthemethodologywasthesameasforpriorHydroOnetimestudiesperformedinconnectionwithBlack&Veatch’spreviouscostallocationreviews.Therefore,Black&Veatchconcludedthatthe2015TimeStudyresultswereaproperbasisforassigningthecostsofthedepartmentsincludedinthestudybetweenHydroOne’sDistributionandTransmissionbusinessunits.

Hydro One Networks Inc. | COMMON CORPORATE COSTS (TRANSMISSION) ‐ 2015
BLACK & VEATCH | Exhibit A A‐1
Exhibit A: Functions and Services in Common Corporate Costs
FUNCTIONS AND SERVICES DESCRIPTION
Hydro One Inc. Corporate Office (HOI)
President / CEO Office
Leadership of the staff of the Corporation to ensure that their culture
and behaviours lead to achievement of its strategic objectives. Develop
and update strategy and establishes performance targets to assess
progress towards the goals and objectives defined by the strategy.
Chair Strategic direction, implementation and results for Hydro One Inc. and
for each subsidiary.
CFO’s Office
Provide Hydro One and subsidiaries with strategic review and approval
for all financial and investment decisions. Review policies and
procedures, treasury operations and tax planning, financial control and
reporting.
Treasurer’s Office Debt and equity issuance, capital structure management and oversight
of Finance‐ Treasury function.
Board of Directors Strategic direction, implementation and results for Hydro One Inc. and
for each subsidiary.
Corporate Secretariat
Provide direction and analysis in areas of: Board and Committee(s);
Office of Chair and Board members; Code of Business Conduct;
Community Citizenship; Freedom of Information and Privacy, Corporate
Archives, Corporate Records, Corporate Secretariat.
General Counsel‐ VP Oversee and support Law, Regulatory and Corporate Secretariat General
Counsel functions.
Pension Cost Pension fund contributions.
Donations
Includes donations to support injury prevention, corporate donations
(e.g. Salvation Army), energy education, United Way and local
community causes. Costs are directly assigned to Shareholder only.
Ombudsman Office
The Ombudsman Office commenced activity following the Initial Public
Offering, in order to address complaints escalated from the Customer
Service . Prior to that, the Province of Ontario’s Ombudsman had
authority to investigate issues related to Hydro One customers.
Investor Relations
Investor Relations commenced activity following the Initial Public
Offering, in order to communicate with Shareholders and potential
investors and address their concerns.
Shared Services
Real Estate
Manage and acquire rights of way and easements; manage property
taxes; manage SLU revenue programs; manage Employee Relocation
Program.
Value Growth
Seeks ways to leverage Hydro One’s core competencies to increase
overall value and drive down average cost to serve. Costs are directly
assigned to Shareholder only.
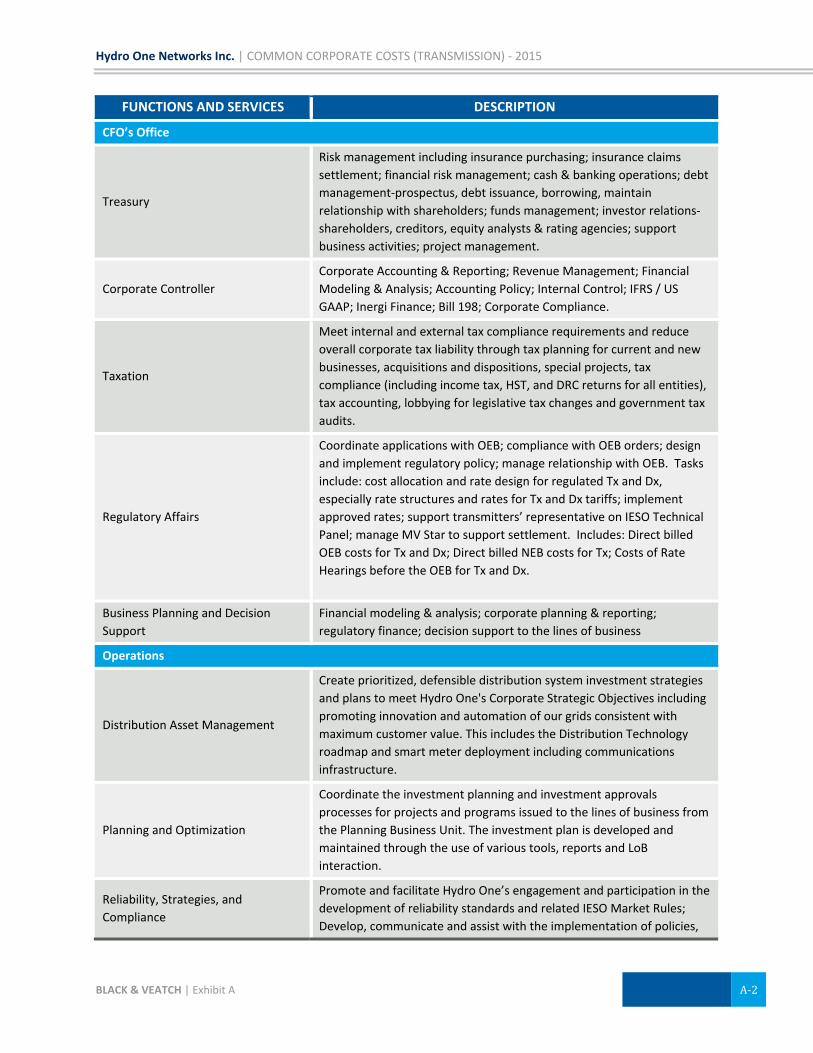
Hydro One Networks Inc. | COMMON CORPORATE COSTS (TRANSMISSION) ‐ 2015
BLACK & VEATCH | Exhibit A A‐2
FUNCTIONS AND SERVICES DESCRIPTION
CFO’s Office
Treasury
Risk management including insurance purchasing; insurance claims
settlement; financial risk management; cash & banking operations; debt
management‐prospectus, debt issuance, borrowing, maintain
relationship with shareholders; funds management; investor relations‐
shareholders, creditors, equity analysts & rating agencies; support
business activities; project management.
Corporate Controller
Corporate Accounting & Reporting; Revenue Management; Financial
Modeling & Analysis; Accounting Policy; Internal Control; IFRS / US
GAAP; Inergi Finance; Bill 198; Corporate Compliance.
Taxation
Meet internal and external tax compliance requirements and reduce
overall corporate tax liability through tax planning for current and new
businesses, acquisitions and dispositions, special projects, tax
compliance (including income tax, HST, and DRC returns for all entities),
tax accounting, lobbying for legislative tax changes and government tax
audits.
Regulatory Affairs
Coordinate applications with OEB; compliance with OEB orders; design
and implement regulatory policy; manage relationship with OEB. Tasks
include: cost allocation and rate design for regulated Tx and Dx,
especially rate structures and rates for Tx and Dx tariffs; implement
approved rates; support transmitters’ representative on IESO Technical
Panel; manage MV Star to support settlement. Includes: Direct billed
OEB costs for Tx and Dx; Direct billed NEB costs for Tx; Costs of Rate
Hearings before the OEB for Tx and Dx.
Business Planning and Decision
Support
Financial modeling & analysis; corporate planning & reporting;
regulatory finance; decision support to the lines of business
Operations
Distribution Asset Management
Create prioritized, defensible distribution system investment strategies
and plans to meet Hydro One's Corporate Strategic Objectives including
promoting innovation and automation of our grids consistent with
maximum customer value. This includes the Distribution Technology
roadmap and smart meter deployment including communications
infrastructure.
Planning and Optimization
Coordinate the investment planning and investment approvals
processes for projects and programs issued to the lines of business from
the Planning Business Unit. The investment plan is developed and
maintained through the use of various tools, reports and LoB
interaction.
Reliability, Strategies, and
Compliance
Promote and facilitate Hydro One’s engagement and participation in the
development of reliability standards and related IESO Market Rules;
Develop, communicate and assist with the implementation of policies,
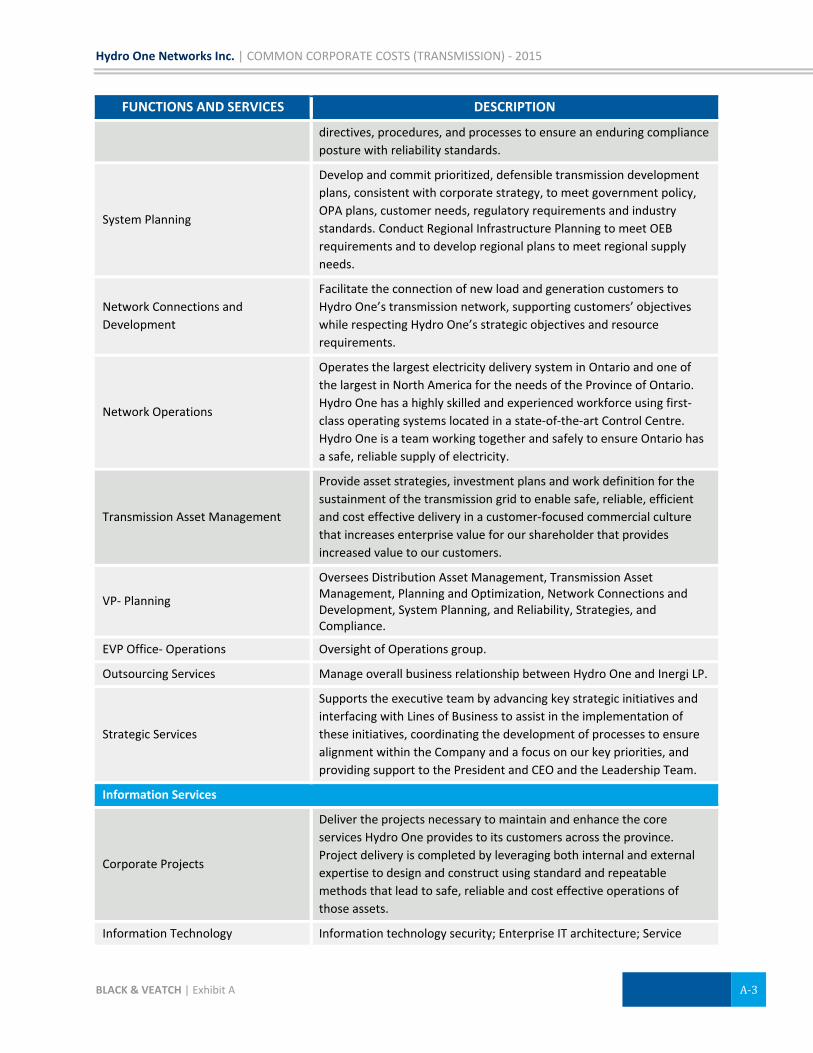
Hydro One Networks Inc. | COMMON CORPORATE COSTS (TRANSMISSION) ‐ 2015
BLACK & VEATCH | Exhibit A A‐3
FUNCTIONS AND SERVICES DESCRIPTION
directives, procedures, and processes to ensure an enduring compliance
posture with reliability standards.
System Planning
Develop and commit prioritized, defensible transmission development
plans, consistent with corporate strategy, to meet government policy,
OPA plans, customer needs, regulatory requirements and industry
standards. Conduct Regional Infrastructure Planning to meet OEB
requirements and to develop regional plans to meet regional supply
needs.
Network Connections and
Development
Facilitate the connection of new load and generation customers to
Hydro One’s transmission network, supporting customers’ objectives
while respecting Hydro One’s strategic objectives and resource
requirements.
Network Operations
Operates the largest electricity delivery system in Ontario and one of
the largest in North America for the needs of the Province of Ontario.
Hydro One has a highly skilled and experienced workforce using first‐
class operating systems located in a state‐of‐the‐art Control Centre.
Hydro One is a team working together and safely to ensure Ontario has
a safe, reliable supply of electricity.
Transmission Asset Management
Provide asset strategies, investment plans and work definition for the
sustainment of the transmission grid to enable safe, reliable, efficient
and cost effective delivery in a customer‐focused commercial culture
that increases enterprise value for our shareholder that provides
increased value to our customers.
VP‐ Planning
Oversees Distribution Asset Management, Transmission Asset Management, Planning and Optimization, Network Connections and Development, System Planning, and Reliability, Strategies, and Compliance.
EVP Office‐ Operations Oversight of Operations group.
Outsourcing Services Manage overall business relationship between Hydro One and Inergi LP.
Strategic Services
Supports the executive team by advancing key strategic initiatives and
interfacing with Lines of Business to assist in the implementation of
these initiatives, coordinating the development of processes to ensure
alignment within the Company and a focus on our key priorities, and
providing support to the President and CEO and the Leadership Team.
Information Services
Corporate Projects
Deliver the projects necessary to maintain and enhance the core
services Hydro One provides to its customers across the province.
Project delivery is completed by leveraging both internal and external
expertise to design and construct using standard and repeatable
methods that lead to safe, reliable and cost effective operations of
those assets.
Information Technology Information technology security; Enterprise IT architecture; Service

Hydro One Networks Inc. | COMMON CORPORATE COSTS (TRANSMISSION) ‐ 2015
BLACK & VEATCH | Exhibit A A‐4
FUNCTIONS AND SERVICES DESCRIPTION
delivery; Technology services; Governance of IT architecture, Business
analysis and information management, Project management; Inergi &
Telecom services management. Applications; Compliance security; Data
services; Information services; IT operations; System architecture.
Security Operations
Incident reporting and security awareness; Threat intelligence
gathering; Physical security and asset threat and risk assessments;
Investigations; Theft of electricity consultation and detection;
Workplace violence prevention and response; Contract security
procurement assistance; Overall security and asset protection advice;
Security infrastructure Capital and OM&A investment planning and
project management.
Customer & Corporate Relations
Customer Care Services
Service the approximately 1.1 million distribution customers. Improve
customer satisfaction through strategic system and process
enhancements, effective services contracting, proactive communications
and quality programs. Service programs include meter reading, billing,
settlements, customer contact handling and collections. Project work
includes regulatory compliance initiatives and service enhancements.
Customer Strategy and
Conservation
Design and deliver energy conservation and demand management
incentive based programs; Leverage Smart Grid investments to provide
customer enablement of new technologies for energy management; Co‐
ordinate Greener Choices program; Provide input to Corporate Strategic
Plan and develop recommendations on emerging strategic opportunities.
Customer Program Delivery
Supports Customer Service and Corporate Relations with five year
business plans and the associated three year Dx Rate Filings with the
OEB. Includes the Credit & Collections team is focused on reducing
arrears and bad debt for both active and final‐billed accounts, while
working with customers on a variety of payment options to increase
customer choice and provide more payment flexibility. Also included is
the new Conservation and Demand Management team that delivers
province‐wide programs in order to meet multi‐year targets aimed at
reducing energy peaks and the overall consumption on the electricity
grid.
Key Account Management
Manage relationships with Hydro One's large customers including over
90 Transmission‐connected Industrials, 79 LDCs and 33 Transmission‐
connected Generators, representing almost 70% of Hydro One's
revenues. Includes Operating Support; Account Executives; Contract
Management; and Customer Programs.
VP Customer Service
Oversees Customer Service group, which has overall accountability for
relationship, affordability and value proposition for products and services
provided to customers. Includes bill management, major accounts and
value‐added services (e.g. conservation). Customer Service also
responsible for Advanced Distribution System Project and Smart Meters.
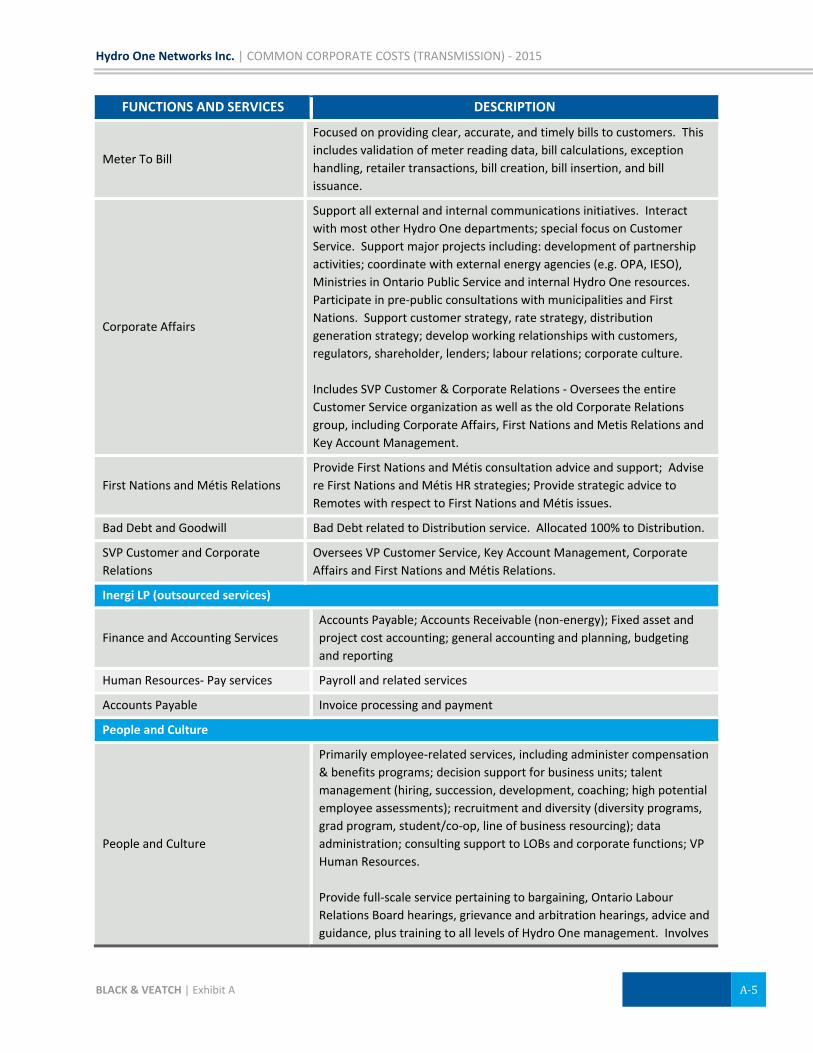
Hydro One Networks Inc. | COMMON CORPORATE COSTS (TRANSMISSION) ‐ 2015
BLACK & VEATCH | Exhibit A A‐5
FUNCTIONS AND SERVICES DESCRIPTION
Meter To Bill
Focused on providing clear, accurate, and timely bills to customers. This
includes validation of meter reading data, bill calculations, exception
handling, retailer transactions, bill creation, bill insertion, and bill
issuance.
Corporate Affairs
Support all external and internal communications initiatives. Interact
with most other Hydro One departments; special focus on Customer
Service. Support major projects including: development of partnership
activities; coordinate with external energy agencies (e.g. OPA, IESO),
Ministries in Ontario Public Service and internal Hydro One resources.
Participate in pre‐public consultations with municipalities and First
Nations. Support customer strategy, rate strategy, distribution
generation strategy; develop working relationships with customers,
regulators, shareholder, lenders; labour relations; corporate culture.
Includes SVP Customer & Corporate Relations ‐ Oversees the entire
Customer Service organization as well as the old Corporate Relations
group, including Corporate Affairs, First Nations and Metis Relations and
Key Account Management.
First Nations and Métis Relations
Provide First Nations and Métis consultation advice and support; Advise
re First Nations and Métis HR strategies; Provide strategic advice to
Remotes with respect to First Nations and Métis issues.
Bad Debt and Goodwill Bad Debt related to Distribution service. Allocated 100% to Distribution.
SVP Customer and Corporate
Relations
Oversees VP Customer Service, Key Account Management, Corporate
Affairs and First Nations and Métis Relations.
Inergi LP (outsourced services)
Finance and Accounting Services
Accounts Payable; Accounts Receivable (non‐energy); Fixed asset and
project cost accounting; general accounting and planning, budgeting
and reporting
Human Resources‐ Pay services Payroll and related services
Accounts Payable Invoice processing and payment
People and Culture
People and Culture
Primarily employee‐related services, including administer compensation
& benefits programs; decision support for business units; talent
management (hiring, succession, development, coaching; high potential
employee assessments); recruitment and diversity (diversity programs,
grad program, student/co‐op, line of business resourcing); data
administration; consulting support to LOBs and corporate functions; VP
Human Resources.
Provide full‐scale service pertaining to bargaining, Ontario Labour
Relations Board hearings, grievance and arbitration hearings, advice and
guidance, plus training to all levels of Hydro One management. Involves

Hydro One Networks Inc. | COMMON CORPORATE COSTS (TRANSMISSION) ‐ 2015
BLACK & VEATCH | Exhibit A A‐6
FUNCTIONS AND SERVICES DESCRIPTION
interaction with 21 unions and 24 collective agreements.
Audit
Audit
Provides assurance that internal controls continue to operate
effectively, identification and recommendations for areas where
controls can break down or need improvement to meet corporate
objectives. This includes the VP Chief Risk Officer.
General Counsel & Secretariat
General Counsel & Secretariat
Provides legal advice to all business units, acting as an internal “law
firm” for the Corporation on most aspects of law affecting it, and is also
well acquainted with day‐ to‐day requirements of the Corporation.
Telecom Services
Telecom Services
Provides telecommunications infrastructure across the Province,
including both voice and data. Links staff and business applications at
Trinity, Richview TS, Markham and London Call Centers, Mill Creek data
centre, 125 field offices (400 total sites including stations) and
customers via Call Centres and Web sites.
VP Chief Risk Officer
VP Chief Risk Officer
The VP Chief Risk Office group creates an enterprise‐wide
comprehensive and uniform approach to anticipate, identify, prioritize,
measure, treat and report on key business risks impacting our
organization. It puts in place the policies, common processes,
competencies, accountabilities, reporting and enabling technology to
execute that approach successfully.
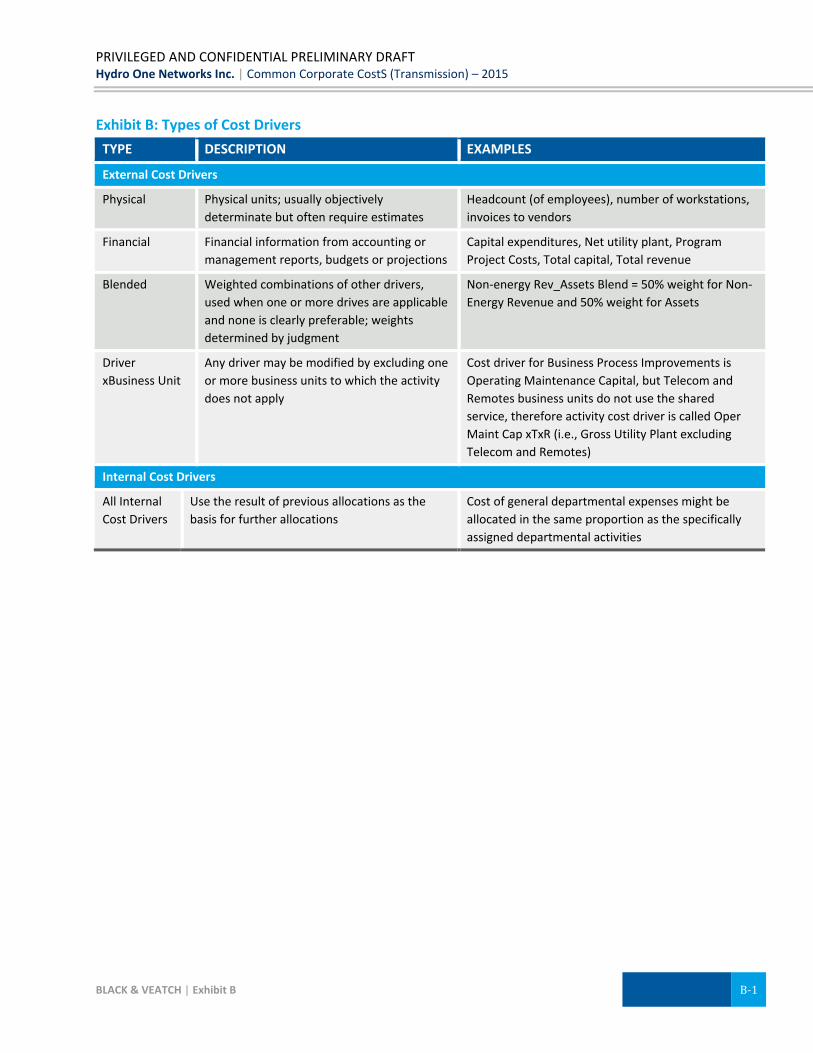
PRIVILEGED AND CONFIDENTIAL PRELIMINARY DRAFT Hydro One Networks Inc. | Common Corporate CostS (Transmission) – 2015
BLACK & VEATCH | Exhibit B B‐1
Exhibit B: Types of Cost Drivers
TYPE DESCRIPTION EXAMPLES
External Cost Drivers
Physical Physical units; usually objectively
determinate but often require estimates
Headcount (of employees), number of workstations,
invoices to vendors
Financial Financial information from accounting or
management reports, budgets or projections
Capital expenditures, Net utility plant, Program
Project Costs, Total capital, Total revenue
Blended Weighted combinations of other drivers,
used when one or more drives are applicable
and none is clearly preferable; weights
determined by judgment
Non‐energy Rev_Assets Blend = 50% weight for Non‐
Energy Revenue and 50% weight for Assets
Driver
xBusiness Unit
Any driver may be modified by excluding one
or more business units to which the activity
does not apply
Cost driver for Business Process Improvements is
Operating Maintenance Capital, but Telecom and
Remotes business units do not use the shared
service, therefore activity cost driver is called Oper
Maint Cap xTxR (i.e., Gross Utility Plant excluding
Telecom and Remotes)
Internal Cost Drivers
All Internal
Cost Drivers
Use the result of previous allocations as the
basis for further allocations
Cost of general departmental expenses might be
allocated in the same proportion as the specifically
assigned departmental activities
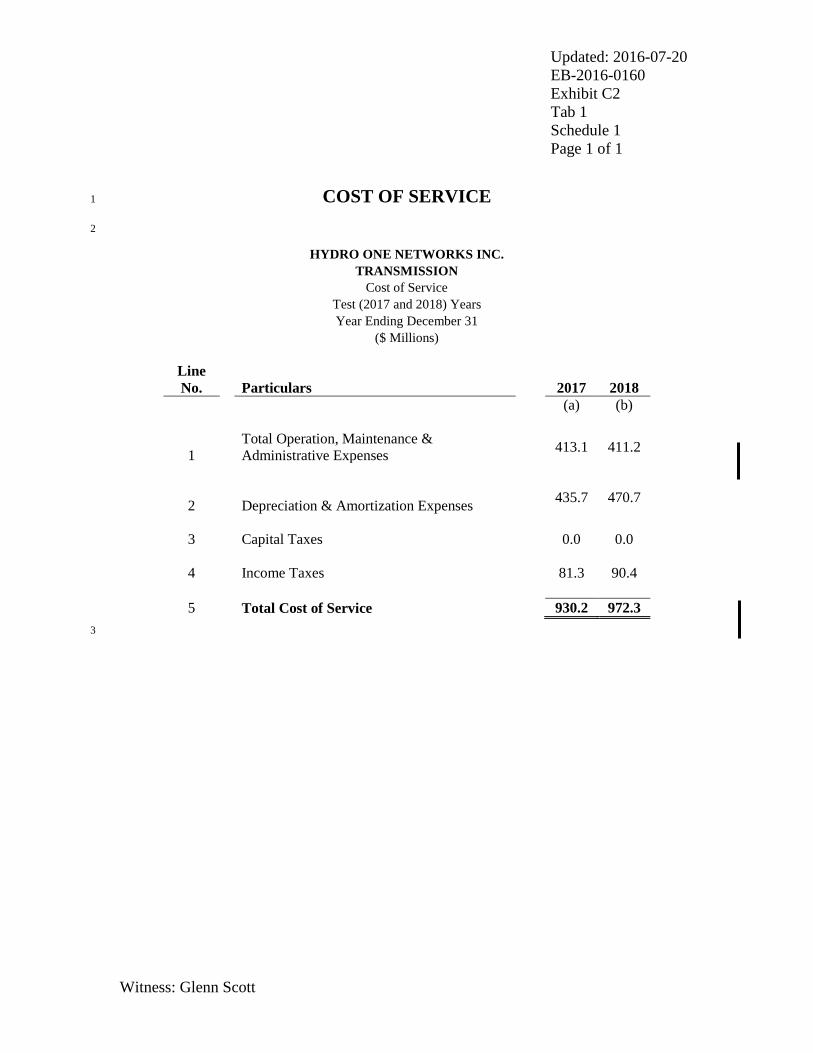
Updated: 2016-07-20 EB-2016-0160 Exhibit C2 Tab 1 Schedule 1 Page 1 of 1
Witness: Glenn Scott
COST OF SERVICE 1
2
HYDRO ONE NETWORKS INC. TRANSMISSION
Cost of Service Test (2017 and 2018) Years Year Ending December 31
($ Millions)
Line No.
Particulars
2017 2018
(a) (b)
1
Total Operation, Maintenance & Administrative Expenses
413.1 411.2
2
Depreciation & Amortization Expenses
435.7 470.7
3
Capital Taxes 0.0 0.0
4
Income Taxes 81.3 90.4
5
Total Cost of Service 930.2 972.3
3

Filed: 2016-05-31 EB-2016-0160 Exhibit C2 Tab 2 Schedule 1 Page 1 of 2
Witness: Glenn Scott
COMPARISON OF OM&A EXPENSE BY MAJOR CATEGORY– HISTORIC, BRIDGE AND TEST YEARS 1
Transmission OM&A ($millions) 2012 2013 2014 2015 2016 2017 2018 Sustaining OM&A Transmission Stations Land Assessment and Remediation 1.9 3.1 3.1 3.6 3.0 2.2 1.2 Environment Management 11.3 11.9 10.7 9.8 10.4 18.4 18.0 Power Equipment 55.7 60.2 61.4 64.5 54.3 60.0 57.0 Ancillary System Maintenance 10.1 10.1 10.0 9.2 10.8 11.2 11.2 Protection, Control, Monitoring, Metering and Telecommunications
44.9 49.4 52.1 63.9 61.2 60.9 62.0
Site Infrastructure Maintenance 22.7 25.2 24.5 24.0 25.1 25.7 25.3 Total Transmission Stations OM&A 146.5 159.9 161.9 175.0 164.8 178.5 174.8 Transmission Lines Rights of Way 27.1 31.1 35.5 32.6 35.8 33.8 34.8 Overhead Lines 17.9 15.7 17.6 15.9 18.0 20.9 20.8 Underground Cables 3.6 3.6 4.0 4.1 5.0 5.1 5.2 Total Transmission Lines OM&A 48.6 50.4 57.1 52.6 58.8 59.8 60.8
Engineering & Environmental Support 9.5 10.7 9.6 6.0 4.0 2.9 2.9
Total Sustaining OM&A 204.7 221.0 228.6 233.6 227.5 241.2 238.5 Development OM&A Technical Standards 2.5 3.1 3.3 2.8 3.0 2.5 2.6

Updated: 2016-07-20 EB-2016-0160 Exhibit C2 Tab 2 Schedule 1 Page 2 of 2
Witness: Glenn Scott
Transmission OM&A ($millions) 2012 2013 2014 2015 2016 2017 2018 Research Development and Demonstration 0.0 0.0 0.0 0.0 2.1 2.1 2.2 Customer Power Quality 0.0 0.0 0.0 0.0 0.2 0.2 0.2 Technology Studies 3.5 3.2 2.8 3.0 0.0 0.0 0.0 Smart Grid 2.4 2.2 1.4 0.3 0.0 0.0 0.0 Total Development OM&A 8.4 8.6 7.5 6.1 5.3 4.8 5.0 Operations OM&A Operations Contracts 21.4 21.3 20.9 22.4 22.9 23.6 24.3 Environmental, Health and Safety 1.3 1.5 1.1 1.1 1.6 1.9 1.8 Operators 32.1 33.9 34.6 35.5 35.5 35.9 36.1 Total Operations OM&A 54.8 56.7 56.6 59.0 60.0 61.3 62.1 Customer Service OM&A 4.4 5.3 5.4 5.1 4.1 4.0 3.9 OM&A Common Corporate Costs and Other Costs Asset Management 32.3 31.8 32.6 31.0 36.6 36.5 35.8 Common Corporate Functions & Services 80.5 87.7 93.1 95.7 98.9 98.3 97.6 Information Technology (including Cornerstone) 60.7 61.1 55.2 55.1 61.4 59.8 57.6 Cost of Sales 11.4 13.9 11.1 8.8 5.0 5.0 5.0 Other -104.2 -118.6 -154.8 -116.8 -129.6 -149.7 -148.5 Total OM&A Common Corporate Costs and Other Costs 80.7 75.8 37.2 73.9 72.3 49.9 47.5 Property Taxes & Rights Payments 62.1 21.2 64.1 63.9 62.9 63.6 64.3 Pension Adjustment - - - - - -11.0 -8.0 B2M LP Adjustment - - - - - -0.8 -2.1 Total Transmission OM&A 415.1 388.4 399.5 441.6 432.1 413.1 411.2
1

Updated: 2016-07-20
EB-2016-0160
Exhibit E1
Tab 1
Schedule 1
Page 1 of 6
Witness: Glenn Scott
REVENUE REQUIREMENT1
2
1. SUMMARY OF REVENUE REQUIREMENT 3
4
Hydro One Transmission has followed standard regulatory practice in the calculation of 5
revenue requirement as follows: 6
7
Table 1: Revenue Requirement ($ Millions) 8
Particulars 2017 2018 Reference
OM&A 413.1 411.2 C1, Tab 2, Schedule 1
Depreciation & Amortization 435.7 470.7 C2, Tab 3, Schedule 1
Income Taxes 81.3 90.4 C1, Tab 8, Schedule 1
Cost of Capital1
676.1 714.9 D1, Tab 4, Schedule 1
Total Revenue Requirement 1,606.3 1,687.2 E2, Tab 1, Schedule 1
1 Includes Interest Capitalized recovery on the Niagara Reinforcement Project (2017 - $5 million and 2018 - $5 9
million). 10
11
The resultant revenue requirement of $1,606.3 million for 2017 and $1,687.2 million for 12
2018 are the amounts required by Hydro One Transmission to safely address customer 13
service and system reliability needs at the lowest practical cost. 14
15
2. CALCULATION OF REVENUE REQUIREMENT 16
17
The details of the OM&A and Depreciation components of the revenue requirement are 18
as follows: 19
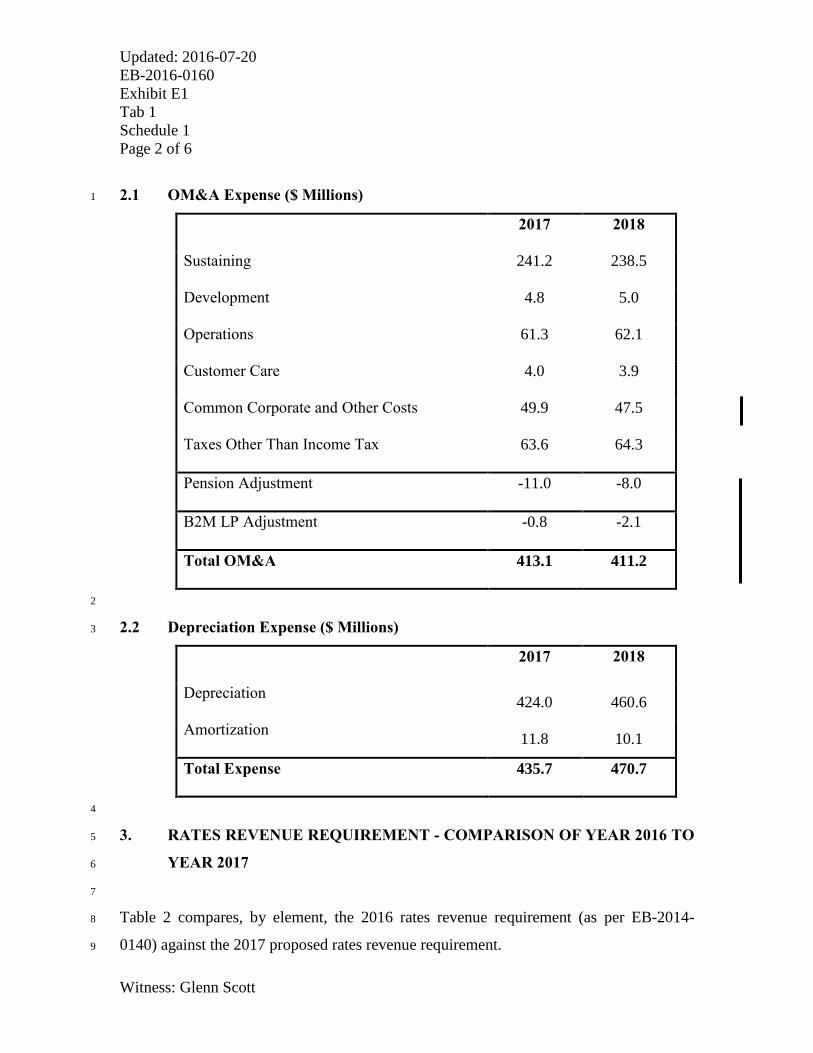
Updated: 2016-07-20
EB-2016-0160
Exhibit E1
Tab 1
Schedule 1
Page 2 of 6
Witness: Glenn Scott
2.1 OM&A Expense ($ Millions) 1
2017 2018
Sustaining 241.2 238.5
Development 4.8 5.0
Operations 61.3 62.1
Customer Care 4.0 3.9
Common Corporate and Other Costs 49.9 47.5
Taxes Other Than Income Tax 63.6 64.3
Pension Adjustment -11.0 -8.0
B2M LP Adjustment -0.8 -2.1
Total OM&A 413.1 411.2
2
2.2 Depreciation Expense ($ Millions) 3
2017 2018
Depreciation 424.0 460.6
Amortization 11.8 10.1
Total Expense 435.7 470.7
4
3. RATES REVENUE REQUIREMENT - COMPARISON OF YEAR 2016 TO 5
YEAR 2017 6
7
Table 2 compares, by element, the 2016 rates revenue requirement (as per EB-2014-8
0140) against the 2017 proposed rates revenue requirement. 9

Updated: 2016-07-20
EB-2016-0160
Exhibit E1
Tab 1
Schedule 1
Page 3 of 6
Witness: Glenn Scott
Table 2: Comparison of Rates Revenue Requirements: 1
Board Approved 2016 vs. 2017 ($Millions) 2
Line
no. Description Year 2016 Year 2017 Difference
1 OM&A 436.7 413.1 (23.6)
2 Depreciation 397.3 435.7 38.5
3 Income Taxes 72.2 81.3 9.1
4 Cost of Capital 1 661.5 676.1 14.6
5 Total Revenue Requirement 1,567.7 1,606.3 38.6
Deduct External Revenues 2 (32.2) (28.2) 4.0
6 Revenue Requirement less
External Revenues 1,535.4 1,578.1 42.7
Deduct Export Revenue Credit 3 (31.7) (39.2) (7.5)
7 Deduct Regulatory Accounts
Disposition 4
(36.1) (47.8) (11.7)
8 Add Low Voltage Switch Gear 5 13.0 14.0 1.0
9 Rates Revenue Requirement 1,480.7 1,505.1 24.4
1 Includes recovery of Interest Capitalized on the Niagara Reinforcement Project. 3
2 External revenues addressed in Exhibit E1, Tab 2, Schedule 1. 4
3 Export revenue is addressed in Exhibit H1, Tab 4, Schedule 1. 5
4 See Exhibit F1, Tab 1, Schedule 3 for further details. 6
5 Low Voltage Switch Gear is addressed in Exhibit G1, Tab 3, Schedule 1. 7
8
There are a number of key operational and financial factors contributing to the increased 9
rates revenue requirement that have an impact across the cost components in Table 2. 10
The increase in total rates revenue requirement is largely attributable to the impact of rate 11
base growth reflected in the increase in depreciation and the return on capital. Also 12
contributing to the difference is higher income taxes, and lower external revenues. These 13
increases were partially offset by a lower cost of debt, lower OM&A, increased 14
regulatory account disposition, and a higher export revenue credit. 15

Updated: 2016-07-20
EB-2016-0160
Exhibit E1
Tab 1
Schedule 1
Page 4 of 6
Witness: Glenn Scott
Table 3 illustrates the value of the key impacts on the increase in the rates revenue 1
requirement. 2
Table 3: Components of Change to Rates Revenue Requirement 20161 vs. 2017 3
Description Amount ($M)
Decrease in OM&A (23.6)
Rate Base Growth 70.7
Decrease in Cost of Debt (17.7)
No Change in Cost of Equity -
Tax - timing differences and other 9.1
External Revenue 4.0
Increase in Export Revenue Credit (7.5)
Increase in Regulatory Accounts Disposition (11.6)
Increase in Low Voltage Switch Gear 1.0
Total Change 24.4
4
4. RATES REVENUE REQUIREMENT - COMPARISON OF YEAR 2017 TO 5
YEAR 2018 6
7
Table 4 compares, by element, the 2017 rates revenue requirement against the 2018 rates 8
revenue requirement. 9
1 2014 Amounts as per Hydro One Transmission’s 2014 Revenue Requirement and Charge Determinants for EB-2012-
0031 and EB-2011-0268.
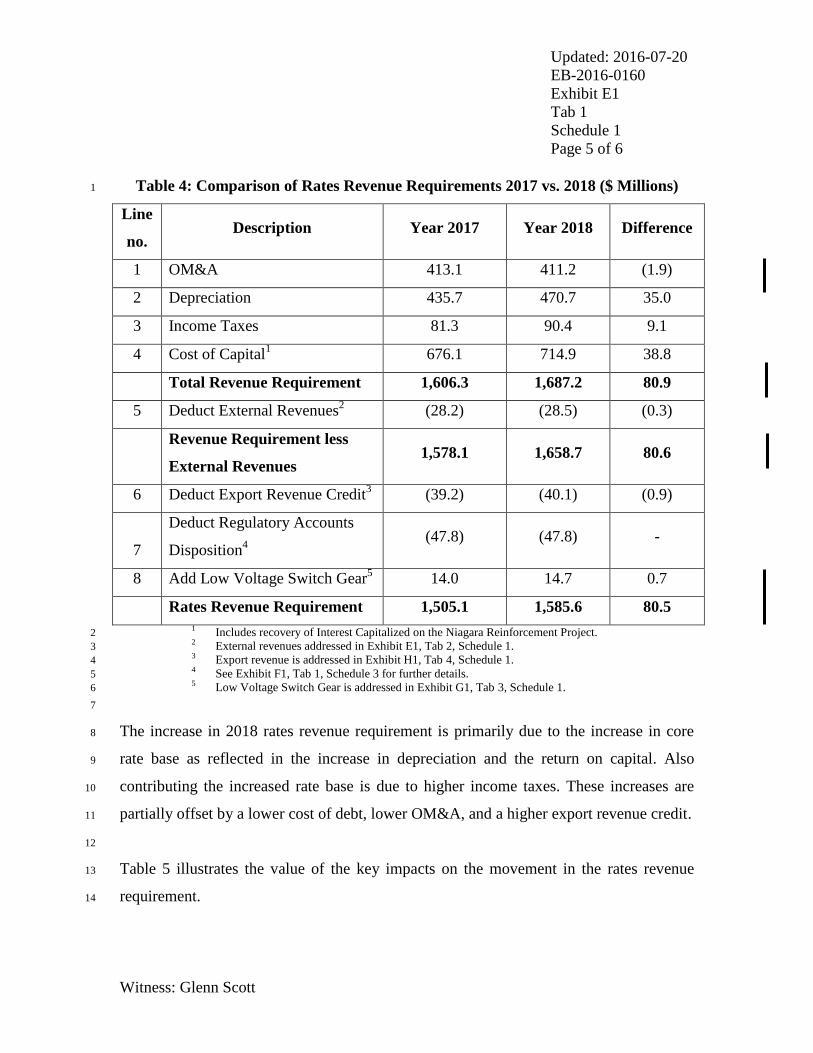
Updated: 2016-07-20
EB-2016-0160
Exhibit E1
Tab 1
Schedule 1
Page 5 of 6
Witness: Glenn Scott
Table 4: Comparison of Rates Revenue Requirements 2017 vs. 2018 ($ Millions) 1
Line
no. Description Year 2017 Year 2018 Difference
1 OM&A 413.1 411.2 (1.9)
2 Depreciation 435.7 470.7 35.0
3 Income Taxes 81.3 90.4 9.1
4 Cost of Capital1 676.1 714.9 38.8
Total Revenue Requirement 1,606.3 1,687.2 80.9
5 Deduct External Revenues2 (28.2) (28.5) (0.3)
Revenue Requirement less
External Revenues 1,578.1 1,658.7 80.6
6 Deduct Export Revenue Credit3 (39.2) (40.1) (0.9)
7
Deduct Regulatory Accounts
Disposition4
(47.8) (47.8) -
8 Add Low Voltage Switch Gear5 14.0 14.7 0.7
Rates Revenue Requirement 1,505.1 1,585.6 80.5
1 Includes recovery of Interest Capitalized on the Niagara Reinforcement Project. 2 2 External revenues addressed in Exhibit E1, Tab 2, Schedule 1. 3 3 Export revenue is addressed in Exhibit H1, Tab 4, Schedule 1. 4 4 See Exhibit F1, Tab 1, Schedule 3 for further details. 5 5 Low Voltage Switch Gear is addressed in Exhibit G1, Tab 3, Schedule 1. 6
7
The increase in 2018 rates revenue requirement is primarily due to the increase in core 8
rate base as reflected in the increase in depreciation and the return on capital. Also 9
contributing the increased rate base is due to higher income taxes. These increases are 10
partially offset by a lower cost of debt, lower OM&A, and a higher export revenue credit. 11
12
Table 5 illustrates the value of the key impacts on the movement in the rates revenue 13
requirement. 14

Updated: 2016-07-20
EB-2016-0160
Exhibit E1
Tab 1
Schedule 1
Page 6 of 6
Witness: Glenn Scott
Table 5: Components of Change to Rates Revenue Requirement 2017 vs. 2018 1
Description Amount ($M)
Decrease in OM&A (1.9)
Rate Base Growth 77.5
Decrease in Cost of Debt (3.7)
No Change in Cost of Equity -
Tax - timing differences and other 9.1
External Revenue (0.3)
Increase in Export Revenue Credit (0.9)
No Change in Regulatory Accounts
Disposition -
Increase in Low Voltage Switch Gear 0.7
Other -
Total change 80.5
1 Net of External Revenue 2
3
Exhibit G1, Tab 1, Schedule 1 provides information on how the rates revenue 4
requirements will be recovered through rates. 5

Updated: 2016-07-20 EB-2016-0160 Exhibit E1 Tab 2 Schedule 1 Page 1 of 5
Witness: Glenn Scott
EXTERNAL REVENUES 1
2
1. INTRODUCTION 3
4
This Exhibit describes Hydro One’s work and associated external revenues that are used 5
to calculate rates revenue requirement as detailed in Exhibit E, Tab 1, Schedule 1. 6
7
Hydro One’s strategy is to focus on core work, while continuing to be responsive to 8
external customer work requests where Hydro One has available resources and/or assets 9
to accommodate the request. 10
11
External revenues earned through the provision of services to third parties are forecast to 12
be $28.2 million in 2017 and $28.5 million in 2018 and account for approximately 1.8% 13
and 1.7% of Hydro One Transmission revenues for 2017 and 2018 respectively. These 14
external revenues are used to offset the revenue requirement from Hydro One 15
Transmission tariffs and thereby reduce the required revenue to be collected from 16
transmission ratepayers. 17
18
2. COSTING AND PRICING 19
20
The costing of external work is determined on the basis of cost causality, with estimates 21
calculated in the same way as internal work estimates, using the standard labour rates, 22
equipment rates, material surcharge, and overhead rates. (See Exhibit C1, Tab 5, 23
Schedule 1 for a description of costing of work.) An appropriate margin is added to 24
cover, at a minimum, market level pricing in order to ensure there is an overall benefit for 25
the transmission ratepayers. The costs associated with external work are described in 26
more detail in Exhibit C1, Tab 3, Schedule 6. 27

Filed: 2016-05-31 EB-2016-0160 Exhibit E1 Tab 2 Schedule 1 Page 2 of 5
Witness: Glenn Scott
3. DESCRIPTION 1
2
Table 1 details Hydro One Transmission’s external revenues for the period 2012 to 2018. 3
4
Table 1: External Revenues ($ Millions) 5
$M 2012 Historic
2013 Historic
2014 Historic
2015 Historic
2016 Bridge
2017 Test
2018 Test
Secondary Land Use
22.0 21.1 19.1 31.6 15.2 15.4 15.6
Station Maintenance 13.9 12.6 14.7 9.5 5.2 5.3 5.3
Engineering & Construction 2.3 2.2 0.1 0.4 0.0 0.0 0.0
Other External Revenues 3.8 10.7 10.5 12.8 7.4 7.5 7.6
Totals 42.0 46.6 44.4 54.3 27.9 28.2 28.5 6
3.1 Secondary Land Use 7
8
Hydro One manages the Provincial Secondary Land Use Program (“PSLUP”) on behalf 9
of the Province, to whom Hydro One’s transmission corridor lands were transferred 10
under Bill 58 on December 31, 2002. The program focuses on licensing and leasing the 11
transmission corridor lands to external parties for “secondary” land use purposes that are 12
compatible with Hydro One Transmission’s primary business operations. Typical uses 13
include parking lots, municipal roadways, parks and trails, agricultural areas, water mains 14
and other municipal infrastructure occupations, as well as public transit parking lots and 15
station operations. The PSLUP revenue stream is generated by charging land rentals to 16
external parties for new license and lease occupations and subsequent agreement 17
renewals, as well as lump sum consideration for easements granted (e.g., water mains) 18
and operational land sales completed (e.g., roadway). 19
Filed: 2016-05-31 EB-2016-0160 Exhibit E1 Tab 2 Schedule 1 Page 3 of 5
Witness: Glenn Scott
Under Bill 58 provisions (An Act to amend certain statutes in relation to the energy 1
sector, c.1, S.O. 2002) and subsequently negotiated arrangements, all expiring corridor 2
PSLUP agreements were transferred to the Province as of December 31, 2002. 3
Remaining unexpired corridor agreements and associated revenue streams are retained by 4
Hydro One until such time as these agreements expire. Upon expiration, the previously 5
retained agreements and revenue streams by Hydro One are then also transferred to the 6
Province under the PSLUP. 7
8
Notwithstanding this transfer, Hydro One has provided front-line delivery services for the 9
PSLUP on behalf of the Province since 2002. As of April 1, 2015, Hydro One was 10
granted the right under agreement to continue delivery of the program through March 31, 11
2020. The arrangements set out in the agreement include Hydro One’s retention of 12
PSLUP revenues for unexpired agreements until their expiry, as well as a results-based 13
compensation model involving the sharing of revenues between Hydro One and the 14
Province for new PSLUP agreements and for renewals of expired agreements which were 15
previously transferred to the Province. Hydro One also manages a small portion of 16
secondary land use revenue that does not fall under current PSLUP arrangements. 17
18
As a result, responsibility for the management and re-negotiation (as required) of all 19
existing secondary land use agreements (including those previously transferred to the 20
Province under the corridor land transfer arrangements) now rests with Hydro One. 21
Hydro One will continue promoting and negotiating all new secondary land use business 22
opportunities, where these are consistent with Hydro One Transmission’s short and 23
longer-term operational requirements. 24
25
The secondary land use revenue levels were $31.6 million in 2015. They are forecasted 26
to drop to $15.2 million in 2016 and stabilize during the test years. Historical figures in 27

Filed: 2016-05-31 EB-2016-0160 Exhibit E1 Tab 2 Schedule 1 Page 4 of 5
Witness: Glenn Scott
years 2013 to 2015 are higher due to unbudgeted one-time transactions involving 1
easement grants (e.g. water mains) and operational land sales (e.g. roadways). 2
3
3.2 Station Maintenance 4
5
Revenues from external work in the station services segment include specialized 6
activities similar to those performed internally for Hydro One Transmission. These 7
activities include repairing electrical equipment (such as transformers, breakers and 8
switches), specialty machining (spindles), protective relay installation, maintenance and 9
calibration, coordinating services to reconnect modified systems to the network, as well 10
as providing meter services and emergency services. Customers seek out station services 11
skills resident within Hydro One, requiring highly specialized staff able to perform work 12
on a variety of high voltage equipment in a variety of work settings (such as nuclear 13
environments). Work is performed according to commercially negotiated contracts 14
which reflect market level pricing. 15
16
Hydro One provides support to the external market place in areas which are related to 17
Hydro One Transmission. This work is primarily tied to support Ontario’s key 18
generation suppliers: Bruce Power LLP, Ontario Power Generation Inc. and Siemens 19
Westinghouse Inc. in support of Ontario Power Generation Inc. 20
21
As can be seen in Table 1, this segment of external revenue is expected to decrease in 22
2016 through to 2018, primarily due to a lower volume of work from major customers. 23

Filed: 2016-05-31 EB-2016-0160 Exhibit E1 Tab 2 Schedule 1 Page 5 of 5
Witness: Glenn Scott
3.3 Engineering and Construction 1
2
Hydro One’s engineering and construction activities focus on internal work supporting 3
the growing Hydro One Transmission work program, while striving to reduce external 4
work to a minimal level. This segment of external revenue was derived from upgrading 5
revenue meters at various sites pursuant to IESO requirements. This work was completed 6
in 2015. 7
8
3.4 Other External Revenues 9
10
“Other” external revenues set out in Table 1 include revenues from providing 11
telecommunications services to Ontario Hydro successor companies (such as lease of 12
fiber), revenues from special transmission planning studies, customer shortfall payments 13
(e.g. true-ups, temporary bypass), and other miscellaneous external revenues. These 14
include a transfer price charge to Hydro One Telecom Inc. and Hydro One Remote 15
Communities Inc. as described in Exhibit B1, Tab 3, Schedule 9. In 2017 and 2018, 16
forecasted revenues include $4.0 million each year for the lease of idle transmission lines. 17
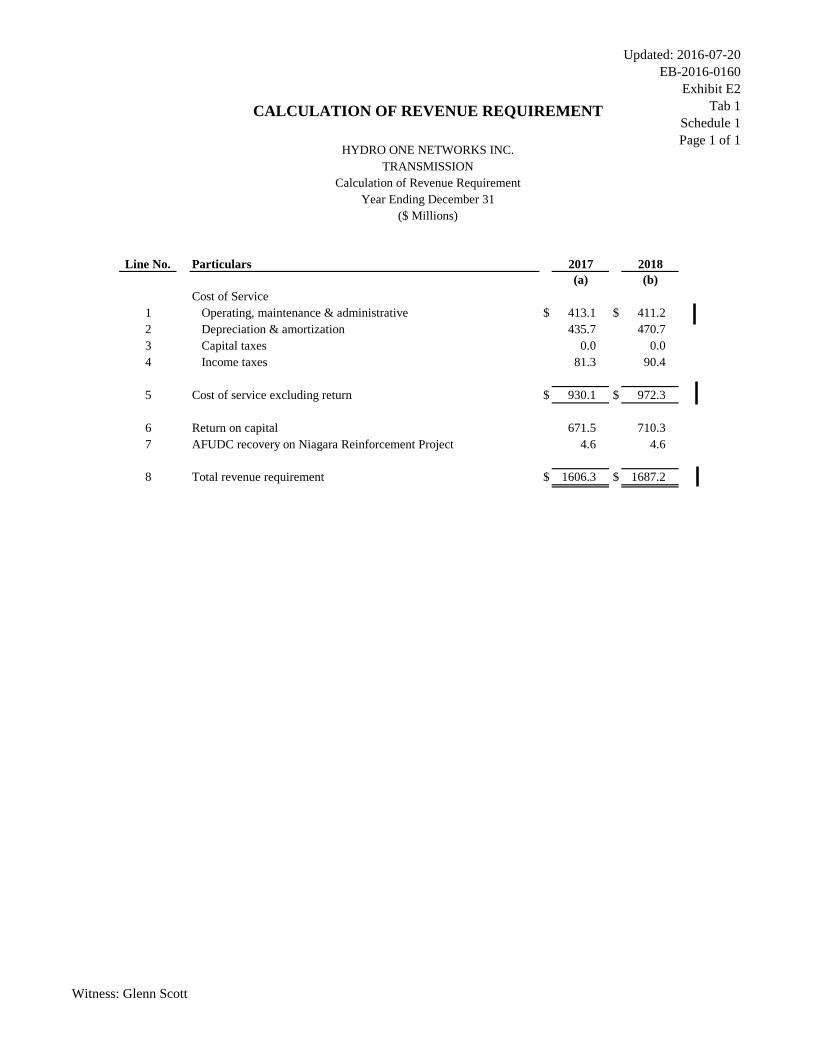
Updated: 2016-07-20EB-2016-0160
Exhibit E2Tab 1
Schedule 1Page 1 of 1
Witness: Glenn Scott
Line No. Particulars 2017 2018(a) (b)
Cost of Service1 Operating, maintenance & administrative $ 413.1 $ 411.2 2 Depreciation & amortization 435.7 470.7 3 Capital taxes 0.0 0.0 4 Income taxes 81.3 90.4
5 Cost of service excluding return $ 930.1 $ 972.3
6 Return on capital 671.5 710.3 7 AFUDC recovery on Niagara Reinforcement Project 4.6 4.6
8 Total revenue requirement $ 1606.3 $ 1687.2
CALCULATION OF REVENUE REQUIREMENT
($ Millions)
HYDRO ONE NETWORKS INC.TRANSMISSION
Calculation of Revenue RequirementYear Ending December 31
Filed: 2016-05-31 EB-2016-0160 Exhibit G1 Tab 1 Schedule 1 Page 1 of 2
Witness: Henry Andre
COST ALLOCATION AND RATE POOL REVENUE 1
REQUIREMENT 2
3
1. INTRODUCTION 4
5
The purpose of Exhibit G1 is to describe the process followed by Hydro One to allocate 6
the transmission rates revenue requirement into rate pools. 7
8
This schedule sets the context for cost allocation in this Application and provides Hydro 9
One’s transmission rates revenue requirement input that is used to determine the Uniform 10
Transmission Rates (“UTR”). 11
12
The remaining schedules of Exhibit G1 provide further explanation on: 13
• the cost allocation methodology to functional categories (refer to Exhibit G1, Tab 2, 14
Schedule 1), and 15
• the aggregation of functional categories into the Network, Line Connection and 16
Transformation Connection rate pools (refer to Exhibit G1, Tab 3, Schedule 1). 17
18
2. SUMMARY 19
20
In Hydro One’s 2015/2016 Transmission Rate Application (EB-2014-0140), the Board 21
approved Hydro One’s methodology to allocate the transmission rates revenue 22
requirement into four rate pools: Network, Line Connection, Transformation Connection 23
and Wholesale Meter. Given that Wholesale Meters now account for less than 0.1% of 24
the revenue requirement, this Application proposes to simplify the allocation process by 25
eliminating the Wholesale Meter rate pool and allocating the rates revenue requirement 26
into the three remaining rate pools: Network, Line Connection and Transformation 27

Updated: 2016-07-20 EB-2016-0160 Exhibit G1 Tab 1 Schedule 1 Page 2 of 2
Witness: Henry Andre
Connection. The basis and details of this proposal are outlined further in Exhibit G1, Tab 1
2, Schedule 1, and Exhibit H1, Tab 3, Schedule 1. 2
3
Other than the change related to Wholesale Meters, the cost allocation methodology has 4
not changed from what was approved by the Board in the Decision and Rate Order in 5
Proceeding EB-2014-0140. 6
7
Table 1 below summarizes the allocation of Hydro One’s transmission rates revenue 8
requirement into the proposed rate pools. This summary of rate pool revenue 9
requirement represents Hydro One Transmission’s input into the determination of the 10
provincial 2017 and 2018 UTRs. The UTRs are collected by the Independent Electricity 11
System Operator (“IESO”) from market participants who are defined transmission 12
customers in Ontario. 13
14
Table 1: Summary of Rates Revenue Requirement by Rate Pool 15
($Millions) 16
Year Network Line Connection
Transformation Connection Total*
2017 853.4 214.3 437.1 1504.7 2018 898.9 226.4 460.0 1585.3
17 *This amount is net of the $0.3million in WMS revenue which accounts for the difference when 18 comparing to the total rates revenue requirement shown in Exhibit E1, Tab 1, Schedule 1. 19

Filed: 2016-05-31 EB-2016-0160 Exhibit G1 Tab 3 Schedule 1 Page 1 of 8
Witness: Henry Andre
NETWORK, LINE CONNECTION AND TRANSFORMATION 1
CONNECTION RATE POOLS 2
3
1. INTRODUCTION 4
5
This exhibit describes the activities to determine the transmission rates revenue 6
requirement for the Network, Line Connection, and Transformation Connection rate 7
pools, and provides a summary of the associated asset value and rates revenue 8
requirement. A detailed account of the 2017 and 2018 transmission rates revenue 9
requirement by rate pool is provided in Exhibit G2, Tab 5, Schedule 1. 10
11
2. ALLOCATION OF REVENUE REQUIREMENT TO RATE POOLS 12
13
The allocation of the transmission rates revenue requirement to the rate pools is 14
summarized in Figure 1. This process is the same as was presented in Hydro One’s 15
2015/2016 Transmission Rate Application approved by the Board in Proceeding EB-16
2014-0140. 17
18
Figure 1: Schematic Outlining the Allocation of Revenue Requirement to Rate Pools 19
20 1 The term “Assigned” refers to a value that is designated to a particular Functional Category or Rate Pool (e.g. Export Revenues are 21
directly assigned to the Network Rate Pool) 22 2 The term “Allocated” indicates that a parameter(s) is used to calculate the proportion of the values that are designated to more than 23
one Functional Category or Rate Pool (e.g. load forecast data is applied to the value of Dual Function Line assets to determine the 24 proportion of its value that is allocated to the Network Functional Category and to the Line Connection Functional Category) 25

Filed: 2016-05-31 EB-2016-0160 Exhibit G1 Tab 3 Schedule 1 Page 2 of 8
Witness: Henry Andre
As illustrated in Figure 1, once the allocation of revenue requirement components into the 1
functional categories is completed, as described in Exhibit G1, Tab 2, Schedule 1, then 2
the next steps include: 3
4
1. Mapping of allocated transmission costs from the functional categories to the 5
assigned rate pools; and 6
2. Assignment and allocation of the rates revenue requirement offset components 7
such as: Export Transmission Service (“ETS”) revenue credit and associated 8
variance accounts, regulatory assets (if applicable), the Low Voltage Switchgear 9
(“LVSG”) credit, Wholesale Meter Service (“WMS”) revenue and other external 10
revenues into the rate pools. 11
12
These two steps are discussed further in Section 2.1 and Section 2.2 respectively. 13
14
2.1 Mapping of Functional Category to Rate Pool 15
16
The allocated transmission costs that are derived using the cost allocation methodology 17
described in Exhibit G1, Tab 2, Schedule 1, are aggregated from the functional categories 18
to the three rate pools: Network, Line Connection, and Transformation Connection; as 19
shown in Table 1 and described below. 20
21
Table 1: Functional Category to Rate Pool Mapping 22
Functional Category Rate Pool Network Network Network Portion of DFL Network Line Connection Line Connection Line Connection Portion of DFL Line Connection Transformation Connection Transformation Connection Generation Line Connection Network Generation Transformation Connection Network Common and Other Prorate to Network, Line and Transformation

Filed: 2016-05-31 EB-2016-0160 Exhibit G1 Tab 3 Schedule 1 Page 3 of 8
Witness: Henry Andre
Network, Line Connection, and Transformation Connection Assets 1
The financial values associated with the Network, Line Connection, and Transformation 2
Connection functional categories are directly assigned to the Network, Line Connection, 3
and Transformation Connection rate pools respectively. This is also applicable to the 4
portions of Dual Function Line (“DFL”) assets that are allocated to the Network and Line 5
Connection functional categories. 6
7
Generation Line and Transformation Connection Assets 8
The financial values associated with the Generator Line and Transformation Connection 9
functional categories are assigned to the Network rate pool, based on the Board Decision 10
under Proceeding RP-1999-0044; which states that generators do not pay transmission 11
service charges with respect to transmission connection facilities used to transfer 12
electricity from the generating station to the network. This approach is considered fair 13
and equitable, since generators connected to the transmission system enhance and 14
contribute to the electricity market for all load customers. This aligns with the cost 15
allocation to the Network rate pool where costs are recovered through Network rates 16
applicable to all load customers, while the costs for Connection rate pools are recovered 17
only from load customers that utilize those connections. 18
19
Common and Other Assets 20
The financial values associated with the functional categories “Common” and “Other” 21
are allocated to the Network, Line Connection and Transformation Connection rate pools 22
in proportion to the corresponding amounts of financial values that are already assigned 23
to those rate pools by revenue requirement component (i.e. “Common” and “Other” 24
OM&A costs are allocated to the rate pools based on the relative share of OM&A costs 25
already assigned to the rate pools). 26

Updated: 2016-07-20 EB-2016-0160 Exhibit G1 Tab 3 Schedule 1 Page 4 of 8
Witness: Henry Andre
2.2 Allocation of Rates Revenue Requirement Offsets 1
2
Hydro One Transmission’s revenue requirement to be recovered through rates includes 3
amounts in addition to the fixed asset depreciation costs, return on capital, income taxes, 4
and OM&A costs, allocated above. These costs are discussed in Exhibit E1, Tab 1, 5
Schedule 1 and are generically defined for the purpose of this exhibit as “Rates Revenue 6
Requirement Offsets”. 7
8
Table 2 below identifies the Rates Revenue Requirement Offset items, the total revenues 9
to be collected and the allocators used to divide these costs among the three rate pools. 10
Allocation of the items in Table 2 is done on the same basis as under Proceeding EB-11
2014-0140. 12
13
Table 2: Rates Revenue Requirement Offsets 14
($Millions) 15
Items Rates Revenue Requirement Allocator 2017 2018
Regulatory Assets (38.6) (38.6) Prorated based on the amounts of financial values that are already assigned to those functional categories
Export Transmission Service Revenue Variance (9.2) (9.2) Direct Assignment to Networks
Export Transmission Service Revenue (39.2) (40.1) Direct Assignment to Networks
External Revenues (28.2) (28.5) Prorated based on the amounts of financial values that are already assigned to those functional categories
Wholesale Meter Service Revenue (0.3) (0.3) Direct Assignment to Transformation
Connection Funding for Low Voltage Switchgear Compensation 14.0 14.7 Direct Assignment to Transformation
Connection 16

Updated: 2016-07-20 EB-2016-0160 Exhibit G1 Tab 3 Schedule 1 Page 5 of 8
Witness: Henry Andre
3. SUMMARY OF ASSET VALUE AND REVENUE REQUIREMENT FOR 1
RATE POOLS 2
3
This section provides the annual mid-year net book value and rates revenue requirement 4
for each of the three rate pools: Network, Line Connection, and Transformation 5
Connection, derived using the methodology described above in Section 2. 6
7
3.1 Network Rate Pool 8
9
Transmission facilities that are used for the benefit of all customers, or have been 10
approved by the Board as being for the benefit of all customers in the province, are 11
included in the Network rate pool. The mid-year net book value and rates revenue 12
requirement for the Network rate pool are provided in Table 3. 13
14
The rates revenue requirement for the Network rate pool includes an offset of $39.2 15
million and $40.1 million in export transmission service revenue forecast to be collected 16
in 2017 and 2018, respectively, as discussed in Exhibit H1, Tab 4, Schedule 1, as well as 17
an offset of $9.2 million in export transmission service variance in each year, as 18
discussed in Exhibit F1, Tab 1, Schedule 1. 19
20
Table 3: Network Rate Pool 21
($Millions) 22
Year Net Book Value
Rates Revenue Requirement
2017 6,229.8 853.4 2018 6,612.6 898.9
23

Updated: 2016-07-20 EB-2016-0160 Exhibit G1 Tab 3 Schedule 1 Page 6 of 8
Witness: Henry Andre
3.2 Line Connection Rate Pool 1
2
Transmission facilities that are used to provide a connection to a load supply point(s) for 3
one or more customers are included in the Line Connection rate pool. The mid-year net 4
book value and rates revenue requirement for the Line Connection rate pool are provided 5
in Table 4. 6
7
Table 4: Line Connection Rate Pool 8
($Millions) 9
Year Net Book Value
Rates Revenue Requirement
2017 1,554.2 214.3 2018 1,649.2 226.4
10
11
3.3 Transformation Connection Rate Pool 12
13
Transmission facilities that are used to step-down voltage from the transmission level to 14
the distribution level (i.e. from above 50 kV to below 50 kV) are included in the 15
Transformation Connection rate pool. The mid-year net book value and rates revenue 16
requirement for the Transformation Connection rate pool are provided in Table 5. 17
18
The rates revenue requirement for the Transformation Connection rate pool includes: the 19
LVSG compensation amount of $14.0 million and $14.7 million to be collected in 2017 20
and 2018, respectively (as outlined below), as well as an offset of $0.3 million in WMS 21
revenue forecast to be collected in each year, as discussed in Exhibit H1, Tab 3, Schedule 22
1. 23

Updated: 2016-07-20 EB-2016-0160 Exhibit G1 Tab 3 Schedule 1 Page 7 of 8
Witness: Henry Andre
Table 5: Transformation Connection Rate Pool 1
($Millions) 2
Year Net Book Value
Rates Revenue Requirement
2017 2,743.7 437.1 2018 2,936.0 460.0
3
4
Low Voltage Switchgear Compensation 5
As first approved by the Board in Proceeding EB-2006-0051, the revenue requirement for 6
the Transformation Connection pool also includes an amount that is payable by Hydro 7
One Transmission to Toronto Hydro-Electric System Inc. and Hydro Ottawa Inc. as 8
compensation for LVSG equipment that those utilities own, operate and maintain within 9
the transformation stations owned by Hydro One. The compensation amount is based on 10
the LVSG as a proportion of the total transformation station costs, including OM&A and 11
capital-related charges, incurred by Hydro One. 12
13
The estimate of the cost of providing low voltage switchgear service, and the 14
methodology used to calculate the annual LVSG compensation payable to each utility, 15
was most recently approved in Proceeding EB-2014-0140. The average low voltage 16
switchgear service costs continue to comprise 19.0% of Hydro One Transmission’s total 17
station costs. 18
19
The LVSG compensation is based on the forecast of each eligible utility’s total monthly 20
non-coincident peak demand supplied from all Hydro One Transmission transformer 21
stations in which the utilities own the LVSG facilities, multiplied by the LVSG 22
proportion of Hydro One Transmission’s Transformation Connection rate. 23
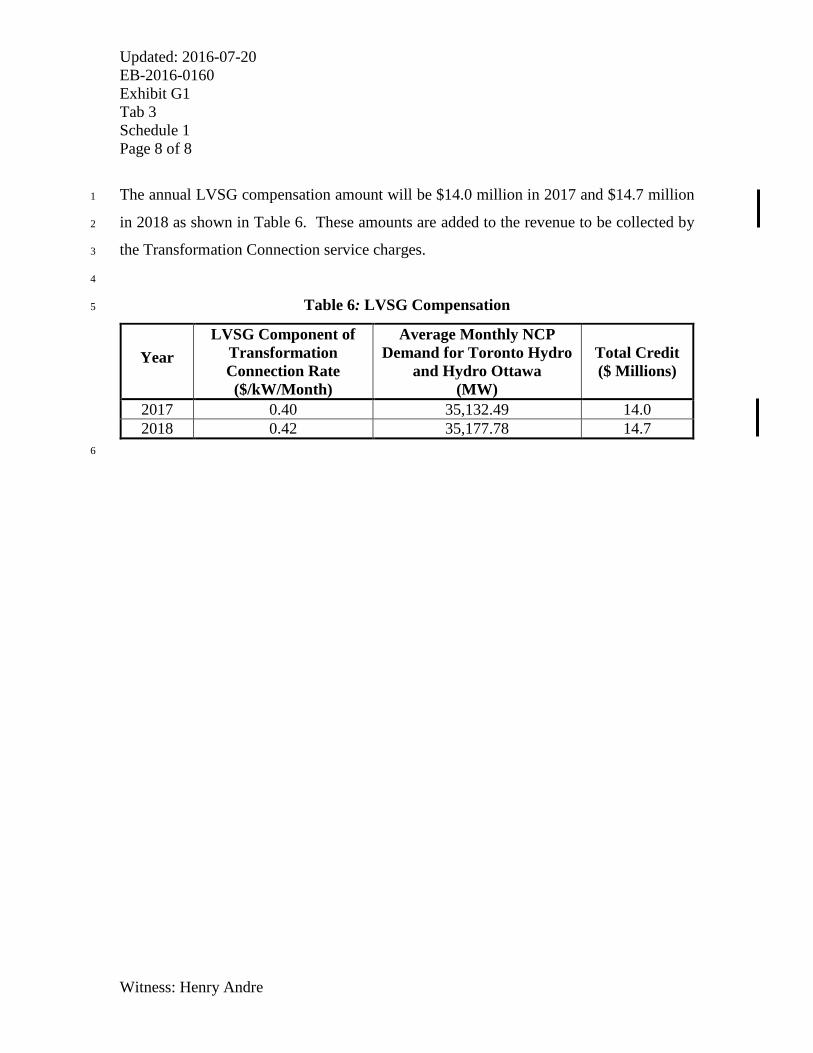
Updated: 2016-07-20 EB-2016-0160 Exhibit G1 Tab 3 Schedule 1 Page 8 of 8
Witness: Henry Andre
The annual LVSG compensation amount will be $14.0 million in 2017 and $14.7 million 1
in 2018 as shown in Table 6. These amounts are added to the revenue to be collected by 2
the Transformation Connection service charges. 3
4
Table 6: LVSG Compensation 5
Year LVSG Component of
Transformation Connection Rate ($/kW/Month)
Average Monthly NCP Demand for Toronto Hydro
and Hydro Ottawa (MW)
Total Credit ($ Millions)
2017 0.40 35,132.49 14.0 2018 0.42 35,177.78 14.7
6

Update: 2016-07-20 EB-2016-0160 Exhibit G2 Tab 4 Schedule 4 Page 1 of 1
Witness: Henry Andre
OM&A COSTS BY FUNCTIONAL CATEGORY 1
(Excludes Property Tax and Rights)2
3
Functional Category
OM&A ($ Millions)
2017 2018 Network 98.7 97.8 Line Connection 20.9 21.0 Transformation Connection 60.0 58.9 Network - Dual Function Line 15.3 15.6 Line Connection - Dual Function Line 3.2 3.3 Generation Line Connection 3.6 3.5 Generation Transformation Connection 1.9 1.9 Common 137.9 136.8 Other Assets 8.0 8.1
TOTAL 349.5 346.9 4
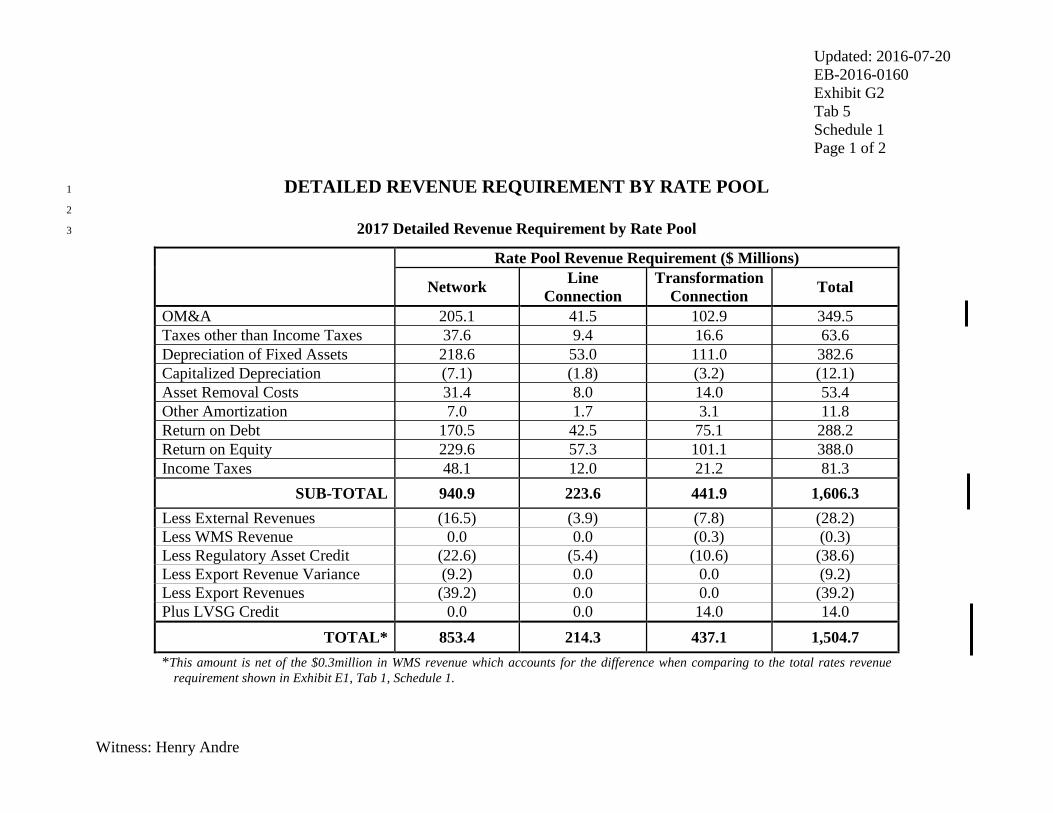
Updated: 2016-07-20 EB-2016-0160 Exhibit G2 Tab 5 Schedule 1 Page 1 of 2
Witness: Henry Andre
DETAILED REVENUE REQUIREMENT BY RATE POOL 1
2
2017 Detailed Revenue Requirement by Rate Pool 3
Rate Pool Revenue Requirement ($ Millions)
Network Line Connection
Transformation Connection Total
OM&A 205.1 41.5 102.9 349.5 Taxes other than Income Taxes 37.6 9.4 16.6 63.6 Depreciation of Fixed Assets 218.6 53.0 111.0 382.6 Capitalized Depreciation (7.1) (1.8) (3.2) (12.1) Asset Removal Costs 31.4 8.0 14.0 53.4 Other Amortization 7.0 1.7 3.1 11.8 Return on Debt 170.5 42.5 75.1 288.2 Return on Equity 229.6 57.3 101.1 388.0 Income Taxes 48.1 12.0 21.2 81.3
SUB-TOTAL 940.9 223.6 441.9 1,606.3 Less External Revenues (16.5) (3.9) (7.8) (28.2) Less WMS Revenue 0.0 0.0 (0.3) (0.3) Less Regulatory Asset Credit (22.6) (5.4) (10.6) (38.6) Less Export Revenue Variance (9.2) 0.0 0.0 (9.2) Less Export Revenues (39.2) 0.0 0.0 (39.2) Plus LVSG Credit 0.0 0.0 14.0 14.0
TOTAL* 853.4 214.3 437.1 1,504.7 *This amount is net of the $0.3million in WMS revenue which accounts for the difference when comparing to the total rates revenue
requirement shown in Exhibit E1, Tab 1, Schedule 1.

Updated: 2016-07-20 EB-2016-0160 Exhibit G2 Tab 5 Schedule 1 Page 2 of 2
Witness: Henry Andre
2018 Detailed Revenue Requirement by Rate Pool 1
Rate Pool Revenue Requirement ($ Millions)
Network Line Connection Transformation Connection Total
OM&A 204.1 41.7 101.1 346.9 Taxes other than Income Taxes 38.0 9.5 16.9 64.3 Depreciation of Fixed Assets 230.7 56.1 117.3 404.1 Capitalized Depreciation (7.5) (1.9) (3.4) (12.8) Asset Removal Costs 40.6 10.3 18.3 69.2 Other Amortization 6.0 1.5 2.7 10.1 Return on Debt 178.5 44.5 79.3 302.2 Return on Equity 243.7 60.8 108.2 412.6 Income Taxes 53.4 13.3 23.7 90.4
SUB-TOTAL 987.4 235.8 464.0 1,687.2 Less External Revenues (16.7) (4.0) (7.8) (28.5) Less WMS Revenue 0.0 0.0 (0.3) (0.3) Less Regulatory Asset Credit (22.6) (5.4) (10.6) (38.6) Less Export Revenue Variance (9.2) 0.0 0.0 (9.2) Less Export Revenues (40.1) 0.0 0.0 (40.1) Plus LVSG Credit 0.0 0.0 14.7 14.7
TOTAL* 898.9 226.4 460.0 1,585.3 * This amount is net of the $0.3million in WMS revenue which accounts for the difference when comparing to the total rates revenue
requirement shown in Exhibit E1, Tab 1, Schedule 1. 2

Filed: 2016-05-31 EB-2016-0160 Exhibit H1 Tab 5 Schedule 1 Page 1 of 3
Witness: Henry Andre
BILL IMPACTS 1
2
The impact of transmission rates on a customer’s total bill varies between transmission-3
connected and distribution-connected customers. For the purpose of determining the 4
impact of proposed changes to transmission rates on an average customer’s bill the same 5
approach used in the EB-2014-0140, EB-2012-0031 and EB-2010-0002 transmission rate 6
applications has been adopted. 7
8
Table 1 below shows the estimated average transmission cost as a percentage of the total 9
bill for a transmission and a distribution-connected customer. 10
11
Table 1: Transmission Cost as a Percentage of Total Bill 12
Bill Component ¢/kWh Source Commodity 10.14 IESO Monthly Market Report December 2015 Wholesale Market Service Charges 0.39 IESO Monthly Market Report December 2015 Wholesale Transmission Charges 1.02 IESO Monthly Market Report December 2015 Debt Retirement Charge 0.70 IESO Monthly Market Report December 2015 Distribution Service Charges 2.85 2014 Yearbook of Electricity Distributors
Total Cost 15.10
Transmission as Percentage of Total Cost for Dx-connected customers 6.8%
Transmission as Percentage of Total Cost for Tx-connected customers 8.3% 13
The figures from Table 1 have been applied to the proposed increase in transmission 14
revenue requirement in 2017 and 2018 to establish average bill impacts as shown in 15
Table 2. 16

Updated: 2016-07-20 EB-2016-0160 Exhibit H1 Tab 5 Schedule 1 Page 2 of 3
Witness: Henry Andre
Table 2: Average Bill Impacts on Transmission and 1
Distribution-connected Customers 2
2016 2017 2018
Rates Revenue Requirement ($ millions) 1 1,480.5 1,504.7 1,585.3 % Increase in Rates RR over prior year 1.6% 5.4% % Impact of load forecast change 2.1% 0.0%
Net Impact on Average Transmission Rates 3.7% 5.4%
Transmission as a % of Tx-connected customer’s Total Bill 8.3% 8.3% Estimated Average Bill impact 0.3% 0.4%
Transmission as a % of Dx -connected customer’s Total Bill 6.8% 6.8% Estimated Average Bill Impact 0.3% 0.4%
1 This amount is net of the $0.3million in WMS revenue which accounts for the difference when comparing 3 to the total rates revenue requirement shown in Exhibit E1, Tab 1, Schedule 1. 4
5
The total bill impact for a typical Hydro One medium density residential (R1) customer 6
consuming 350 kWh, 750 kWh and 1800 kWh monthly is determined based on the 7
forecast increase in the customer’s Retail Transmission Service Rates (“RTSR”) as 8
detailed below in Table 3. 9
10
Table 3: Typical Medium Density (R1) Residential Customer Bill Impacts 11
Typical R1 Residential Customer 350 kWh 750 kWh 1800 kWh Total Bill as of Jan 1, 20161 $ 102.95 $ 179.37 $ 379.98 RTSR included in 2016 R1 Customer's Bill $ 4.37 $ 9.36 $ 22.47 Estimated 2017 Monthly RTSR2 $ 4.52 $ 9.69 $ 23.26 2017 increase in Monthly Bill $ 0.15 $ 0.33 $ 0.79
2017 increase as a % of total bill 0.1% 0.2% 0.2% Estimated 2018 Monthly RTSR2 $ 4.75 $ 10.18 $ 24.44 2018 increase in Monthly Bill $ 0.23 $ 0.49 $ 1.18
2018 increase as a % of total bill 0.2% 0.3% 0.3% 1 Total bill including HST, based on time-of-use RPP commodity pricing and 2016 distribution rates 12
approved per Distribution Rate Order EB-2015-0079. 13 2 The impact on RTSR is assumed to be the net impact on average transmission rates, as per Table 2, 14
adjusted for Hydro One's revenue disbursement allocator per approved 2016 UTRs per EB-2015-0311. 15
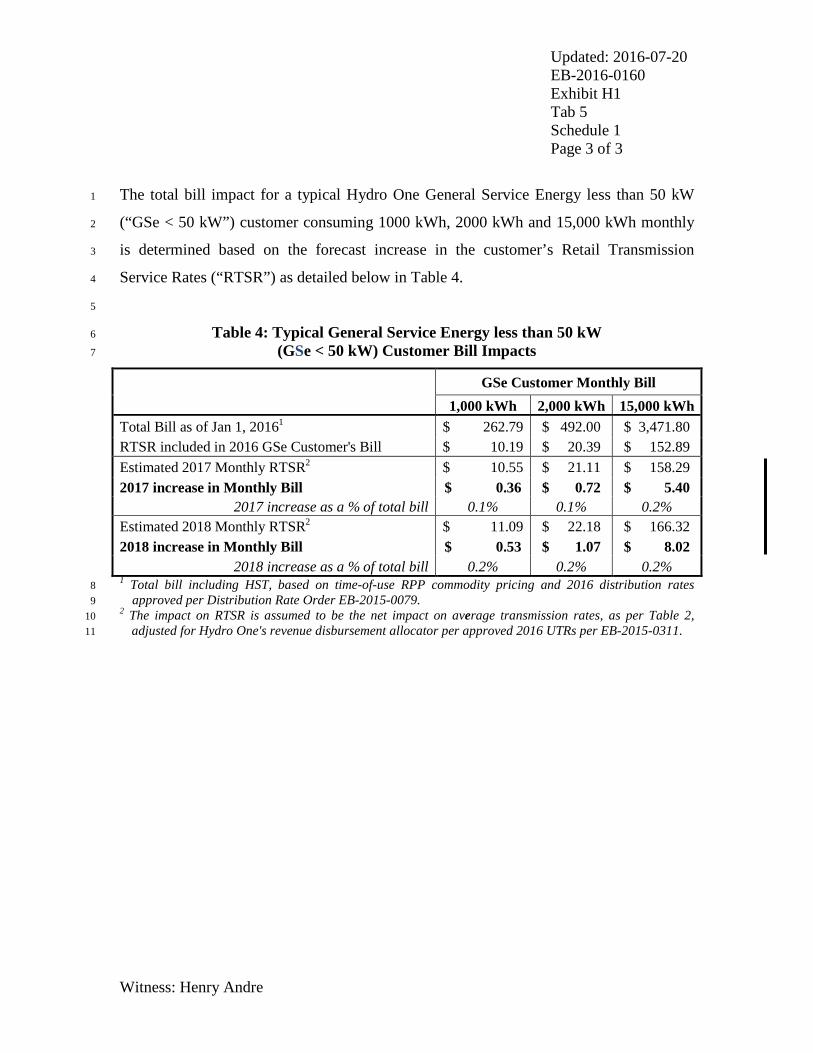
Updated: 2016-07-20 EB-2016-0160 Exhibit H1 Tab 5 Schedule 1 Page 3 of 3
Witness: Henry Andre
The total bill impact for a typical Hydro One General Service Energy less than 50 kW 1
(“GSe < 50 kW”) customer consuming 1000 kWh, 2000 kWh and 15,000 kWh monthly 2
is determined based on the forecast increase in the customer’s Retail Transmission 3
Service Rates (“RTSR”) as detailed below in Table 4. 4
5
Table 4: Typical General Service Energy less than 50 kW 6
(GSe < 50 kW) Customer Bill Impacts 7
GSe Customer Monthly Bill 1,000 kWh 2,000 kWh 15,000 kWh Total Bill as of Jan 1, 20161 $ 262.79 $ 492.00 $ 3,471.80 RTSR included in 2016 GSe Customer's Bill $ 10.19 $ 20.39 $ 152.89 Estimated 2017 Monthly RTSR2 $ 10.55 $ 21.11 $ 158.29 2017 increase in Monthly Bill $ 0.36 $ 0.72 $ 5.40
2017 increase as a % of total bill 0.1% 0.1% 0.2% Estimated 2018 Monthly RTSR2 $ 11.09 $ 22.18 $ 166.32 2018 increase in Monthly Bill $ 0.53 $ 1.07 $ 8.02
2018 increase as a % of total bill 0.2% 0.2% 0.2% 1 Total bill including HST, based on time-of-use RPP commodity pricing and 2016 distribution rates 8
approved per Distribution Rate Order EB-2015-0079. 9 2 The impact on RTSR is assumed to be the net impact on average transmission rates, as per Table 2, 10
adjusted for Hydro One's revenue disbursement allocator per approved 2016 UTRs per EB-2015-0311. 11

TRANSMISSION RATE SCHEDULES
EFFECTIVE DATE: BOARD ORDER: REPLACING BOARD ORDER: Page 1 of 6 January 1, 2017 EB-201X-XXXX EB-2015-0311 Ontario Uniform Transmission January 14, 2016 Rate Schedule
2017 ONTARIO UNIFORM TRANSMISSION RATE SCHEDULES
EB-201X-XXXX
The rate schedules contained herein shall be effective January 1, 2017
Issued: Month, Year Ontario Energy Board
Updated: 2016-07-20 EB-2016-0160 Exhibit H2-1-2 Attachment 1 Page 1 of 6

TRANSMISSION RATE SCHEDULES
EFFECTIVE DATE: BOARD ORDER: REPLACING BOARD ORDER: Page 2 of 6 January 1, 2017 EB-201X-XXXX EB-2015-0311 Ontario Uniform Transmission January 14, 2016 Rate Schedule
TERMS AND CONDITIONS (A) APPLICABILITY The rate schedules contained herein pertain to the transmission service applicable to: •The provision of Provincial Transmission Service (PTS) to the Transmission Customers who are defined as the entities that withdraw electricity directly from the transmission system in the province of Ontario. •The provision of Export Transmission Service (ETS) to electricity market participants that export electricity to points outside Ontario utilizing the transmission system in the province of Ontario. The Rate Schedule ETS applies to the wholesale market participants who utilize the Export Service in accordance with the Market Rules of the Ontario Electricity Market, referred to hereafter as Market Rules. These rate schedules do not apply to the distribution services provided by any distributors in Ontario, nor to the purchase of energy, hourly uplift, ancillary services or any other charges that may be applicable in electricity markets administered by the Independent Electricity System Operator (IESO) of Ontario.
(B) TRANSMISSION SYSTEM CODE The transmission service provided under these rate schedules is in accordance with the Transmission System Code (Code) issued by the Ontario Energy Board (OEB). The Code sets out the requirements, standards, terms and conditions of the transmitter’s obligation to offer to connect to, and maintain the operation of, the transmission system. The Code also sets out the requirements, standards, terms and conditions under which a Transmission Customer may connect to, and remain connected to, the transmission system. The Code stipulates that a transmitter shall connect new customers, and continue to offer transmission services to existing customers, subject to a Connection Agreement between the customer and a transmitter. (C) TRANSMISSION DELIVERY POINT The Transmission Delivery Point is defined as the transformation station, owned by a transmission company or by the Transmission Customer, which steps down the voltage from above 50 kV to below 50 kV and which connects the customer to the transmission system. The demand registered by two or more meters at any one delivery point shall be aggregated for the purpose of assessing transmission charges at that delivery point if the corresponding distribution feeders from that delivery point, or the plants taking power from that delivery point, are owned by the same entity within the meaning of
Ontario’s Business Corporations Act. The billing demand supplied from the transmission system shall be adjusted for losses, as appropriate, to the Transmission Point of Settlement, which shall be the high voltage side of the transformer that steps down the voltage from above 50 kV to below 50 kV.
(D) TRANSMISSION SERVICE POOLS The transmission facilities owned by the licenced transmission companies are categorized into three functional pools. The transmission lines that are used for the common benefit of all customers are categorized as Network Lines and the corresponding terminating facilities are Network Stations. These facilities make up the Network Pool. The transformation station facilities that step down the voltage from above 50 kV to below 50 kV are categorized as the Transformation Connection Pool. Other electrical facilities (i.e. that are neither Network nor Transformation) are categorized as the Line Connection Pool. All PTS customers incur charges based on the Network Service Rate (PTS-N) of Rate Schedule PTS. The PTS customers that utilize transformation connection assets owned by a licenced transmission company also incur charges based on the Transformation Connection Service Rate (PTS-T). The customer demand supplied from a transmission delivery point will not incur transformation connection service charges if a customer fully owns all transformation connection assets associated with that transmission delivery point. The PTS customers utilize lines owned by a licenced transmission company to connect to Network Station(s) also incur charges based on the Line Connection Service Rate (PTS- L). The customer demand supplied from a transmission delivery point will not incur line connection service charges if a customer fully owns all line connection assets connecting that delivery point to a Network Station. Similarly, the customer demand will not incur line connection service charges for demand at a transmission delivery point located at a Network Station. (E) MARKET RULES The IESO will provide transmission service utilizing the facilities owned by the licenced transmission companies in Ontario in accordance with the Market Rules. The Market Rules and appropriate Market Manuals define the procedures and processes under which the transmission service is provided in real or operating time (on an hourly basis) as well as service billing and settlement processes for transmission service charges based on rate schedules contained herein.

TRANSMISSION RATE SCHEDULES
EFFECTIVE DATE: BOARD ORDER: REPLACING BOARD ORDER: Page 3 of 6 January 1, 2017 EB-201X-XXXX EB-2015-0311 Ontario Uniform Transmission January 14, 2016 Rate Schedule
(F) METERING REQUIREMENTS In accordance with Market Rules and the Transmission System Code, the transmission service charges payable by Transmission Customers shall be collected by the IESO. The IESO will utilize Registered Wholesale Meters and a Metering Registry in order to calculate the monthly transmission service charges payable by the Transmission Customers. Every Transmission Customer shall ensure that each metering installation in respect of which the customer has an obligation to pay transmission service charges arising from the Rate Schedule PTS shall satisfy the Wholesale Metering requirements and associated obligations specified in Chapter 6 of the Market Rules, including the appendices therein, whether or not the subject meter installation is required for settlement purposes in the IESO-administered energy market. A meter installation required for the settlement of charges in the IESO-administered that energy market may be used for the settlement of transmission service charges. The Transmission Customer shall provide to the IESO data required to maintain the information for the Registered Wholesale Meters and the Metering Registry pertaining to the metering installations with respect to which the Transmission Customers have an obligation to pay transmission charges in accordance with Rate Schedule PTS. The Metering Registry for metering installations required for the calculation of transmission charges shall be maintained in accordance with Chapter 6 of the Market Rules. The Transmission Customers, or Transmission Customer Agents if designated by the Transmission Customers, associated with each Transmission Delivery Point will be identified as Metered Market Participants within the IESO’s Metering Registry. The metering data recorded in the Metering Registry shall be used as the basis for the calculation of transmission charges on the settlement statement for the Transmission Customers identified as the Metered Market Participants for each Transmission Delivery Point. The Metering Registry for metering installations required for calculation of transmission charges shall also indicate whether or not the demand associated with specific Transmission Delivery Point(s) to which a Transmission Customer is connected attracts Line and/or Transformation Connection Service Charges. This information shall be consistent with the Connection Agreement between the Transmission Customer and the licenced Transmission Company that connects the customer to the IESO-Controlled Grid.
(G) EMBEDDED GENERATION The Transmission Customers shall ensure conformance of Registered Wholesale Meters in accordance with Chapter 6 of Market Rules, including Metering Registry obligations, with respect to metering installations for embedded generation that is located behind the metering installation that measures the net demand taken from the transmission system if (a) the required approvals for such generation are obtained after October 30, 1998; and (b) the generator unit rating is 2 MW or higher for renewable generation and 1 MW or higher for non- renewable generation; and (c) the Transmission Delivery Point through which the generator is connected to the transmission system attracts Line or Transformation Connection Service charges. These terms and conditions also apply to the incremental capacity associated with any refurbishments approved after October 30, 1998, to a generator unit that was connected through an eligible Transmission Delivery Point on or prior to October 30, 1998 and the approved incremental capacity is 2 MW or higher for renewable generation and 1 MW or higher for non-renewable generation. The term renewable generation refers to a facility that generates electricity from the following sources: wind, solar, Biomass, Bio-oil, Bio-gas, landfill gas, or water. Accordingly, the distributors that are Transmission Customers shall ensure that connection agreements between them and the generators, load customers, and embedded distributors connected to their distribution system have provisions requiring the Transmission Customer to satisfy the requirements for Registered Wholesale Meters and Metering Registry for such embedded generation even if the subject embedded generator(s) do not participate in the IESO-administered energy markets. (H) EMBEDDED CONNECTION POINT In accordance with Chapter 6 of the Market Rules, the IESO may permit a Metered Market Participant, as defined in the Market Rules, to register a metering installation that is located at the embedded connection point for the purpose of recording transactions in the IESO-administered markets. (The Market Rules define an embedded connection point as a point of connection between load or generation facility and distribution system). In special situations, a metering installation at the embedded connection point that is used to settle energy market charges may also be used to settle transmission service charges, if there is no metering installation at the point of connection of a

TRANSMISSION RATE SCHEDULES
EFFECTIVE DATE: BOARD ORDER: REPLACING BOARD ORDER: Page 4 of 6 January 1, 2017 EB-201X-XXXX EB-2015-0311 Ontario Uniform Transmission January 14, 2016 Rate Schedule
distribution feeder to the Transmission Delivery Point. In above situations: •The Transmission Customer may utilize the metering installation at the embedded connection point, including all embedded generation and load connected to that point, to satisfy the requirements described in Section (F) above provided that the same metering installation is also used to satisfy the requirement for energy transactions in the IESO- administered market. •The Transmission Customer shall provide the Metering Registry information for the metering installation at the embedded connection point, including all embedded generation and load connected to that point, in accordance with the requirements described in Section (F) above so that the IESO can calculate the monthly transmission service charges payable by the Transmission Customer.

TRANSMISSION RATE SCHEDULES
EFFECTIVE DATE: BOARD ORDER: REPLACING BOARD ORDER: Page 5 of 6 January 1, 2017 EB-201X-XXXX EB-2015-0311 Ontario Uniform Transmission January 14, 2016 Rate Schedule
RATE SCHEDULE: (PTS) PROVINCIAL TRANSMISSION RATES
APPLICABILITY: The Provincial Transmission Service (PTS) is applicable to all Transmission Customers in Ontario who own facilities that are directly connected to the transmission system in Ontario and that withdraw electricity from this system.
Monthly Rate ($ per kW) Network Service Rate (PTS-N): 3.68
$ Per kW of Network Billing Demand 1,2
Line Connection Service Rate (PTS-L): 0.92
$ Per kW of Line Connection Billing Demand 1,3
Transformation Connection Service Rate (PTS-T): 2.22
$ Per kW of Transformation Connection Billing Demand 1,3,4
The rates quoted above shall be subject to adjustments with the approval of the Ontario Energy Board.
Notes: 1 The demand (MW) for the purpose of this rate schedule is measured as the energy consumed during the clock hour, on a “Per Transmission Delivery Point” basis. The billing demand supplied from the transmission system shall be adjusted for losses, as appropriate, to the Transmission Point of Settlement, which shall be the high voltage side of the transformer that steps down the voltage from above 50 kV to below 50 kV at the Transmission Delivery Point.
2. The Network Service Billing Demand is defined as the higher of (a) customer coincident peak demand (MW) in the hour of the month when the total hourly demand of all PTS customers is highest for the month, and (b) 85 % of the customer peak demand in any hour during the peak period 7 AM to 7 PM (local time) on weekdays, excluding the holidays as defined by IESO. The peak period hours will be between 0700 hours to 1900 hours Eastern Standard Time during winter (i.e. during standard time) and 0600 hours to 1800 hours Eastern Standard Time during summer (i.e. during daylight savings time), in conformance with the meter time standard used by the IMO settlement systems.
3. The Billing Demand for Line and Transformation Connection Services is defined as the Non-Coincident Peak demand (MW) in any hour of the month. The customer demand in any hour is the sum of (a) the loss-adjusted demand supplied from the transmission system plus (b) the demand that is supplied by an embedded generator unit for which the required government approvals are obtained after October 30, 1998 and which have installed capacity of 2MW or more for renewable generation and 1 MW or higher for non-renewable generation, on the demand supplied by the incremental capacity associated with a refurbishment approved after October 30, 1998, to a generator unit that existed on or prior to October 30, 1998.. The term renewable generation refers to a facility that generates electricity from the following sources: wind, solar, Biomass, Bio-oil, Bio-gas, landfill gas, or water. The demand supplied by embedded generation will not be adjusted for losses.
4. The Transformation Connection rate includes recovery for OEB approved Low Voltage Switchgear compensation for Toronto Hydro Electric System Limited and Hydro Ottawa Limited.
TERMS AND CONDITIONS OF SERVICE: The attached Terms and Conditions pertaining to the Transmission Rate Schedules, the relevant provisions of the Transmission System Code, in particular the Connection Agreement as per Appendix 1 of the Transmission System Code, and the Market Rules for the Ontario Electricity Market shall apply, as contemplated therein, to services provided under this Rate Schedule.

TRANSMISSION RATE SCHEDULES
EFFECTIVE DATE: BOARD ORDER: REPLACING BOARD ORDER: Page 6 of 6 January 1, 2017 EB-201X-XXXX EB-2015-0311 Ontario Uniform Transmission January 14, 2016 Rate Schedule
RATE SCHEDULE: (ETS) EXPORT TRANSMISSION SERVICE
APPLICABILITY: The Export Transmission Service is applicable for the use of the transmission system in Ontario to deliver electrical energy to locations external to the Province of Ontario, irrespective of whether this energy is supplied from generating sources within or outside Ontario.
Hourly Rate Export Transmission Service Rate (ETS): $1.85 / MWh
The ETS rate shall be applied to the export transactions in the Interchange Schedule Data as per the Market Rules for Ontario’s Electricity Market. The ETS rate shall be subject to adjustments with the approval of the Ontario Energy Board. TERMS AND CONDITIONS OF SERVICE: The attached Terms and Conditions pertaining to the Transmission Rate Schedules, the relevant provisions of the Transmission System Code and the Market Rules for the Ontario Electricity Market shall apply, as contemplated therein, to service provided under this Rate Schedule.
TRANSMISSION RATE SCHEDULES
EFFECTIVE DATE: BOARD ORDER: REPLACING BOARD ORDER: Page 1 of 6 January 1, 2018 EB-201Y-YYYY EB-201X-XXXX Ontario Uniform Transmission Month Day, Year Rate Schedule
2018 ONTARIO UNIFORM TRANSMISSION RATE SCHEDULES
EB-201Y-YYYY
The rate schedules contained herein shall be effective January 1, 2018
Issued: Month, Year Ontario Energy Board
Updated: 2016-07-20 EB-2016-0160 Exhibit H2-1-2 Attachment 2 Page 1 of 6

TRANSMISSION RATE SCHEDULES
EFFECTIVE DATE: BOARD ORDER: REPLACING BOARD ORDER: Page 2 of 6 January 1, 2018 EB-201Y-YYYY EB-201X-XXXX Ontario Uniform Transmission Month Day, Year Rate Schedule
TERMS AND CONDITIONS (A) APPLICABILITY The rate schedules contained herein pertain to the transmission service applicable to: •The provision of Provincial Transmission Service (PTS) to the Transmission Customers who are defined as the entities that withdraw electricity directly from the transmission system in the province of Ontario. •The provision of Export Transmission Service (ETS) to electricity market participants that export electricity to points outside Ontario utilizing the transmission system in the province of Ontario. The Rate Schedule ETS applies to the wholesale market participants who utilize the Export Service in accordance with the Market Rules of the Ontario Electricity Market, referred to hereafter as Market Rules. These rate schedules do not apply to the distribution services provided by any distributors in Ontario, nor to the purchase of energy, hourly uplift, ancillary services or any other charges that may be applicable in electricity markets administered by the Independent Electricity System Operator (IESO) of Ontario.
(B) TRANSMISSION SYSTEM CODE The transmission service provided under these rate schedules is in accordance with the Transmission System Code (Code) issued by the Ontario Energy Board (OEB). The Code sets out the requirements, standards, terms and conditions of the transmitter’s obligation to offer to connect to, and maintain the operation of, the transmission system. The Code also sets out the requirements, standards, terms and conditions under which a Transmission Customer may connect to, and remain connected to, the transmission system. The Code stipulates that a transmitter shall connect new customers, and continue to offer transmission services to existing customers, subject to a Connection Agreement between the customer and a transmitter. (C) TRANSMISSION DELIVERY POINT The Transmission Delivery Point is defined as the transformation station, owned by a transmission company or by the Transmission Customer, which steps down the voltage from above 50 kV to below 50 kV and which connects the customer to the transmission system. The demand registered by two or more meters at any one delivery point shall be aggregated for the purpose of assessing transmission charges at that delivery point if the corresponding distribution feeders from that delivery point, or the plants taking power from that delivery point, are owned by the same entity within the meaning of
Ontario’s Business Corporations Act. The billing demand supplied from the transmission system shall be adjusted for losses, as appropriate, to the Transmission Point of Settlement, which shall be the high voltage side of the transformer that steps down the voltage from above 50 kV to below 50 kV.
(D) TRANSMISSION SERVICE POOLS The transmission facilities owned by the licenced transmission companies are categorized into three functional pools. The transmission lines that are used for the common benefit of all customers are categorized as Network Lines and the corresponding terminating facilities are Network Stations. These facilities make up the Network Pool. The transformation station facilities that step down the voltage from above 50 kV to below 50 kV are categorized as the Transformation Connection Pool. Other electrical facilities (i.e. that are neither Network nor Transformation) are categorized as the Line Connection Pool. All PTS customers incur charges based on the Network Service Rate (PTS-N) of Rate Schedule PTS. The PTS customers that utilize transformation connection assets owned by a licenced transmission company also incur charges based on the Transformation Connection Service Rate (PTS-T). The customer demand supplied from a transmission delivery point will not incur transformation connection service charges if a customer fully owns all transformation connection assets associated with that transmission delivery point. The PTS customers utilize lines owned by a licenced transmission company to connect to Network Station(s) also incur charges based on the Line Connection Service Rate (PTS- L). The customer demand supplied from a transmission delivery point will not incur line connection service charges if a customer fully owns all line connection assets connecting that delivery point to a Network Station. Similarly, the customer demand will not incur line connection service charges for demand at a transmission delivery point located at a Network Station. (E) MARKET RULES The IESO will provide transmission service utilizing the facilities owned by the licenced transmission companies in Ontario in accordance with the Market Rules. The Market Rules and appropriate Market Manuals define the procedures and processes under which the transmission service is provided in real or operating time (on an hourly basis) as well as service billing and settlement processes for transmission service charges based on rate schedules contained herein.
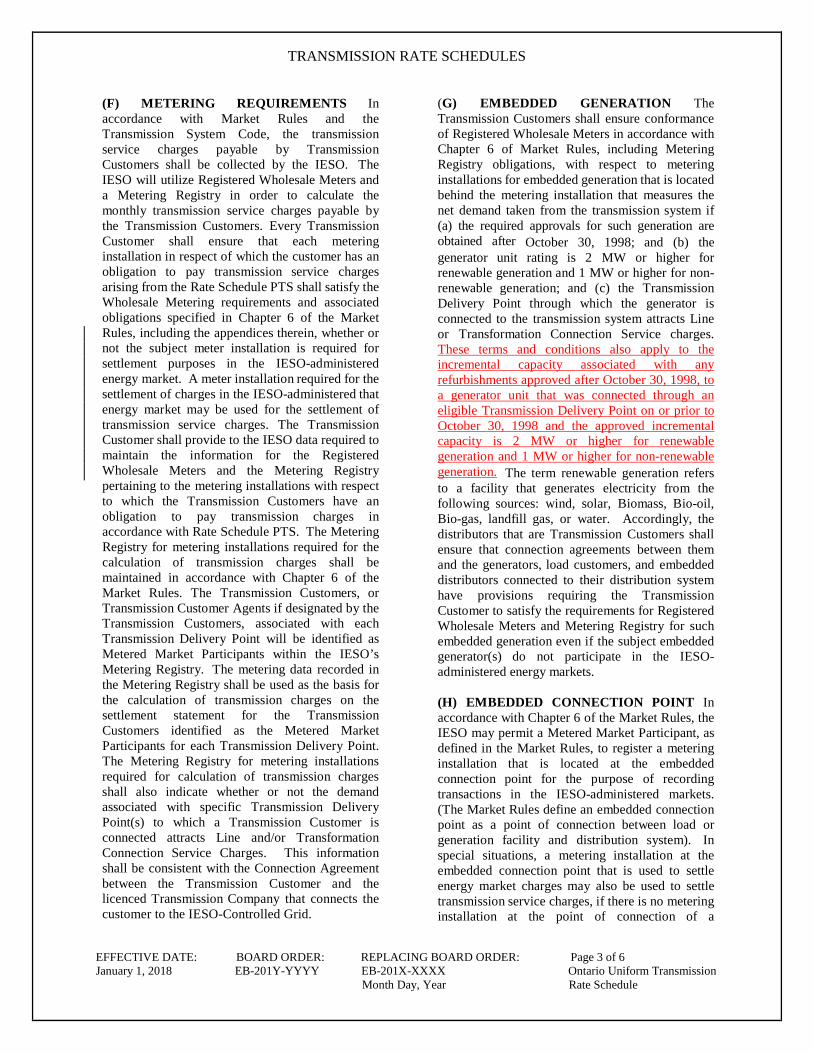
TRANSMISSION RATE SCHEDULES
EFFECTIVE DATE: BOARD ORDER: REPLACING BOARD ORDER: Page 3 of 6 January 1, 2018 EB-201Y-YYYY EB-201X-XXXX Ontario Uniform Transmission Month Day, Year Rate Schedule
(F) METERING REQUIREMENTS In accordance with Market Rules and the Transmission System Code, the transmission service charges payable by Transmission Customers shall be collected by the IESO. The IESO will utilize Registered Wholesale Meters and a Metering Registry in order to calculate the monthly transmission service charges payable by the Transmission Customers. Every Transmission Customer shall ensure that each metering installation in respect of which the customer has an obligation to pay transmission service charges arising from the Rate Schedule PTS shall satisfy the Wholesale Metering requirements and associated obligations specified in Chapter 6 of the Market Rules, including the appendices therein, whether or not the subject meter installation is required for settlement purposes in the IESO-administered energy market. A meter installation required for the settlement of charges in the IESO-administered that energy market may be used for the settlement of transmission service charges. The Transmission Customer shall provide to the IESO data required to maintain the information for the Registered Wholesale Meters and the Metering Registry pertaining to the metering installations with respect to which the Transmission Customers have an obligation to pay transmission charges in accordance with Rate Schedule PTS. The Metering Registry for metering installations required for the calculation of transmission charges shall be maintained in accordance with Chapter 6 of the Market Rules. The Transmission Customers, or Transmission Customer Agents if designated by the Transmission Customers, associated with each Transmission Delivery Point will be identified as Metered Market Participants within the IESO’s Metering Registry. The metering data recorded in the Metering Registry shall be used as the basis for the calculation of transmission charges on the settlement statement for the Transmission Customers identified as the Metered Market Participants for each Transmission Delivery Point. The Metering Registry for metering installations required for calculation of transmission charges shall also indicate whether or not the demand associated with specific Transmission Delivery Point(s) to which a Transmission Customer is connected attracts Line and/or Transformation Connection Service Charges. This information shall be consistent with the Connection Agreement between the Transmission Customer and the licenced Transmission Company that connects the customer to the IESO-Controlled Grid.
(G) EMBEDDED GENERATION The Transmission Customers shall ensure conformance of Registered Wholesale Meters in accordance with Chapter 6 of Market Rules, including Metering Registry obligations, with respect to metering installations for embedded generation that is located behind the metering installation that measures the net demand taken from the transmission system if (a) the required approvals for such generation are obtained after October 30, 1998; and (b) the generator unit rating is 2 MW or higher for renewable generation and 1 MW or higher for non- renewable generation; and (c) the Transmission Delivery Point through which the generator is connected to the transmission system attracts Line or Transformation Connection Service charges. These terms and conditions also apply to the incremental capacity associated with any refurbishments approved after October 30, 1998, to a generator unit that was connected through an eligible Transmission Delivery Point on or prior to October 30, 1998 and the approved incremental capacity is 2 MW or higher for renewable generation and 1 MW or higher for non-renewable generation. The term renewable generation refers to a facility that generates electricity from the following sources: wind, solar, Biomass, Bio-oil, Bio-gas, landfill gas, or water. Accordingly, the distributors that are Transmission Customers shall ensure that connection agreements between them and the generators, load customers, and embedded distributors connected to their distribution system have provisions requiring the Transmission Customer to satisfy the requirements for Registered Wholesale Meters and Metering Registry for such embedded generation even if the subject embedded generator(s) do not participate in the IESO-administered energy markets. (H) EMBEDDED CONNECTION POINT In accordance with Chapter 6 of the Market Rules, the IESO may permit a Metered Market Participant, as defined in the Market Rules, to register a metering installation that is located at the embedded connection point for the purpose of recording transactions in the IESO-administered markets. (The Market Rules define an embedded connection point as a point of connection between load or generation facility and distribution system). In special situations, a metering installation at the embedded connection point that is used to settle energy market charges may also be used to settle transmission service charges, if there is no metering installation at the point of connection of a

TRANSMISSION RATE SCHEDULES
EFFECTIVE DATE: BOARD ORDER: REPLACING BOARD ORDER: Page 4 of 6 January 1, 2018 EB-201Y-YYYY EB-201X-XXXX Ontario Uniform Transmission Month Day, Year Rate Schedule
distribution feeder to the Transmission Delivery Point. In above situations: •The Transmission Customer may utilize the metering installation at the embedded connection point, including all embedded generation and load connected to that point, to satisfy the requirements described in Section (F) above provided that the same metering installation is also used to satisfy the requirement for energy transactions in the IESO- administered market. •The Transmission Customer shall provide the Metering Registry information for the metering installation at the embedded connection point, including all embedded generation and load connected to that point, in accordance with the requirements described in Section (F) above so that the IESO can calculate the monthly transmission service charges payable by the Transmission Customer.

TRANSMISSION RATE SCHEDULES
EFFECTIVE DATE: BOARD ORDER: REPLACING BOARD ORDER: Page 5 of 6 January 1, 2018 EB-201Y-YYYY EB-201X-XXXX Ontario Uniform Transmission Month Day, Year Rate Schedule
RATE SCHEDULE: (PTS) PROVINCIAL TRANSMISSION RATES
APPLICABILITY: The Provincial Transmission Service (PTS) is applicable to all Transmission Customers in Ontario who own facilities that are directly connected to the transmission system in Ontario and that withdraw electricity from this system.
Monthly Rate ($ per kW) Network Service Rate (PTS-N): 3.86
$ Per kW of Network Billing Demand 1,2
Line Connection Service Rate (PTS-L): 0.97
$ Per kW of Line Connection Billing Demand 1,3
Transformation Connection Service Rate (PTS-T): 2.33
$ Per kW of Transformation Connection Billing Demand 1,3,4
The rates quoted above shall be subject to adjustments with the approval of the Ontario Energy Board.
Notes: 1 The demand (MW) for the purpose of this rate schedule is measured as the energy consumed during the clock hour, on a “Per Transmission Delivery Point” basis. The billing demand supplied from the transmission system shall be adjusted for losses, as appropriate, to the Transmission Point of Settlement, which shall be the high voltage side of the transformer that steps down the voltage from above 50 kV to below 50 kV at the Transmission Delivery Point.
2. The Network Service Billing Demand is defined as the higher of (a) customer coincident peak demand (MW) in the hour of the month when the total hourly demand of all PTS customers is highest for the month, and (b) 85 % of the customer peak demand in any hour during the peak period 7 AM to 7 PM (local time) on weekdays, excluding the holidays as defined by IESO. The peak period hours will be between 0700 hours to 1900 hours Eastern Standard Time during winter (i.e. during standard time) and 0600 hours to 1800 hours Eastern Standard Time during summer (i.e. during daylight savings time), in conformance with the meter time standard used by the IMO settlement systems.
3. The Billing Demand for Line and Transformation Connection Services is defined as the Non-Coincident Peak demand (MW) in any hour of the month. The customer demand in any hour is the sum of (a) the loss-adjusted demand supplied from the transmission system plus (b) the demand that is supplied by an embedded generator unit for which the required government approvals are obtained after October 30, 1998 and which have installed capacity of 2MW or more for renewable generation and 1 MW or higher for non-renewable generation, on the demand supplied by the incremental capacity associated with a refurbishment approved after October 30, 1998, to a generator unit that existed on or prior to October 30, 1998.. The term renewable generation refers to a facility that generates electricity from the following sources: wind, solar, Biomass, Bio-oil, Bio-gas, landfill gas, or water. The demand supplied by embedded generation will not be adjusted for losses.
4. The Transformation Connection rate includes recovery for OEB approved Low Voltage Switchgear compensation for Toronto Hydro Electric System Limited and Hydro Ottawa Limited.
TERMS AND CONDITIONS OF SERVICE: The attached Terms and Conditions pertaining to the Transmission Rate Schedules, the relevant provisions of the Transmission System Code, in particular the Connection Agreement as per Appendix 1 of the Transmission System Code, and the Market Rules for the Ontario Electricity Market shall apply, as contemplated therein, to services provided under this Rate Schedule.

TRANSMISSION RATE SCHEDULES
EFFECTIVE DATE: BOARD ORDER: REPLACING BOARD ORDER: Page 6 of 6 January 1, 2018 EB-201Y-YYYY EB-201X-XXXX Ontario Uniform Transmission Month Day, Year Rate Schedule
RATE SCHEDULE: (ETS) EXPORT TRANSMISSION SERVICE
APPLICABILITY: The Export Transmission Service is applicable for the use of the transmission system in Ontario to deliver electrical energy to locations external to the Province of Ontario, irrespective of whether this energy is supplied from generating sources within or outside Ontario.
Hourly Rate Export Transmission Service Rate (ETS): $1.85 / MWh
The ETS rate shall be applied to the export transactions in the Interchange Schedule Data as per the Market Rules for Ontario’s Electricity Market. The ETS rate shall be subject to adjustments with the approval of the Ontario Energy Board. TERMS AND CONDITIONS OF SERVICE: The attached Terms and Conditions pertaining to the Transmission Rate Schedules, the relevant provisions of the Transmission System Code and the Market Rules for the Ontario Electricity Market shall apply, as contemplated therein, to service provided under this Rate Schedule.

Updated: 2016-07-20 EB-2016-0160 Exhibit H2-1-2 Attachment 3 Page 1 of 2
2017 Draft Uniform Transmission Rates and Revenue Disbursement Allocators 1
(Effective for period January 1, 2017 to December 31, 2017) 2
3
Network Line Connection
Transformation Connection Total
FNEI $3,588,261 $900,913 $1,837,915 $6,327,089CNPI $2,528,224 $634,767 $1,294,962 $4,457,953GLPT $23,006,025 $5,776,176 $11,783,735 $40,565,936H1N $853,356,393 $214,254,171 $437,090,979 $1,504,701,543
B2MLP $32,965,146 $0 $0 $32,965,146All Transmitters $915,444,049 $221,566,027 $452,007,591 $1,589,017,667
Network Line Connection
Transformation Connection
FNEI 187.120 213.460 76.190CNPI 522.894 549.258 549.258GLPT 3,498.236 2,734.624 635.252H1N 244,865.656 236,890.824 202,461.050
B2MLP 0.000 0.000 0.000All Transmitters 249,073.906 240,388.166 203,721.750
Network Line Connection
Transformation Connection
Uniform Transmission Rates ($/kW-Month) 3.68 0.92 2.22
FNEI Allocation Factor 0.00392 0.00407 0.00407CNPI Allocation Factor 0.00276 0.00286 0.00286GLPT Allocation Factor 0.02513 0.02607 0.02607H1N Allocation Factor 0.93218 0.96700 0.96700
B2MLP Allocation Factor 0.03601 0.00000 0.00000Total of Allocation Factors 1.00000 1.00000 1.00000
* The sum of 12 monthly charge determinants for the year
Note 6: Calculated data in shaded cells.
Note 1: FNEI Rates Revenue Requirement and Charge Determinants per Board Decision and Order on EB-2009-0387 dated December 9, 2010. Set as Interim on December 29, 2015 under EB-2015-0368.Note 2: CNPI Rates Revenue Requirement and Charge Determinants per OEB Decision EB-2014-0204 dated June 25, 2015 and 2016 order under EB-2015-0354, issued January 14, 2016.Note 3: GLPT Rates Revenue Requirement and Charge Determinants per OEB Decision EB-2014-0238, issued December 18, 2014 and 2016 order under EB-2015-0337, issued January 14, 2016.Note 4: H1N Rates Revenue Requirement and Charge Determinants as proposed in application EB-2016-0160.Note 5: B2M LP 2016 Revenue Requirement per Board Decision and Order EB-2015-0026 dated December 29, 2015. 2016 Rate Order approved on January 14, 2016.
TransmitterRevenue Requirement ($)
TransmitterTotal Annual Charge Determinants (MW)*
TransmitterUniform Rates and Revenue Allocators

Updated: 2016-07-20 EB-2016-0160 Exhibit H2-1-2 Attachment 3 Page 2 of 2
2018 Draft Uniform Transmission Rates and Revenue Disbursement Allocators 1
(Effective for period January 1, 2018 to December 31, 2018) 2
3
Network Line Connection
Transformation Connection Total
FNEI $3,587,559 $903,548 $1,835,982 $6,327,089CNPI $2,527,729 $636,624 $1,293,600 $4,457,953GLPT $23,001,523 $5,793,073 $11,771,340 $40,565,936H1N $898,899,737 $226,393,327 $460,024,073 $1,585,317,138
B2MLP $32,965,146 $0 $0 $32,965,146All Transmitters $960,981,695 $233,726,572 $474,924,995 $1,669,633,262
Network Line Connection
Transformation Connection
FNEI 187.120 213.460 76.190CNPI 522.894 549.258 549.258GLPT 3,498.236 2,734.624 635.252H1N 244,924.157 236,948.242 202,510.123
B2MLP 0.000 0.000 0.000All Transmitters 249,132.407 240,445.584 203,770.823
Network Line Connection
Transformation Connection
Uniform Transmission Rates ($/kW-Month) 3.86 0.97 2.33
FNEI Allocation Factor 0.00373 0.00387 0.00387CNPI Allocation Factor 0.00263 0.00272 0.00272GLPT Allocation Factor 0.02394 0.02479 0.02479H1N Allocation Factor 0.93540 0.96862 0.96862
B2MLP Allocation Factor 0.03430 0.00000 0.00000Total of Allocation Factors 1.00000 1.00000 1.00000
* The sum of 12 monthly charge determinants for the year
Note 6: Calculated data in shaded cells.
TransmitterRevenue Requirement ($)
TransmitterTotal Annual Charge Determinants (MW)*
TransmitterUniform Rates and Revenue Allocators
Note 1: FNEI Rates Revenue Requirement and Charge Determinants per Board Decision and Order on EB-2009-0387 dated December 9, 2010. Set as Interim on December 29, 2015 under EB-2015-0368.Note 2: CNPI Rates Revenue Requirement and Charge Determinants per OEB Decision EB-2014-0204 dated June 25, 2015 and 2016 order under EB-2015-0354, issued January 14, 2016.Note 3: GLPT Rates Revenue Requirement and Charge Determinants per OEB Decision EB-2014-0238, issued December 18, 2014 and 2016 order under EB-2015-0337, issued January 14, 2016.Note 4: H1N Rates Revenue Requirement and Charge Determinants as proposed in application EB-2016-0160.Note 5: B2M LP 2016 Revenue Requirement per Board Decision and Order EB-2015-0026 dated December 29, 2015. 2016 Rate Order approved on January 14, 2016.