hydro – a leading integrated aluminium and energy company
TRANSCRIPT

(1)
Stefan Solberg, Head of Investor RelationsHandelsbanken Nordic Basic Industry Seminar March 12, 2010
Hydro – a leading integrated aluminium and energy company
(2)
Certain statements contained in this announcement constitute “forward-looking information” within the meaning of Section 27A of the US Securities Act of 1933, as amended, and Section 21E of the US Securities Exchange Act of 1934, as amended. In order to utilize the “safe harbors” within these provisions, we are providing the following cautionary statement.
Certain statements included within this announcement contain (and oral communications made by us or on our behalf may contain) forward-looking information, including, without limitation, those relating to (a) forecasts, projections and estimates, (b) statements of management’s plans, objectives and strategies for Hydro, such as planned expansions, investments or other projects, (c) targeted production volumes and costs, capacities or rates, start-up costs, cost reductions and profit objectives, (d) various expectations about future developments in Hydro’s markets, particularly prices, supply and demand and competition, (e) results of operations, (f) margins, (g) growth rates, (h) risk management, as well as (i) statements preceded by “expected”, “scheduled”, “targeted”, “planned”, “proposed”, “intended” or similar statements.
Although we believe that the expectations reflected in such forward-looking statements are reasonable, these forward-looking statements are based on a number of assumptions and forecasts that, by their nature, involve risk and uncertainty. Various factors could cause our actual results to differ materially from those projected in a forward-looking statement or affect the extent to which a particular projection is realized. Factors that could cause these differences include, but are not limited to: our continued ability to reposition and restructure our upstream and downstream Aluminium business; changes in availability and cost of energy and raw materials; global supply and demand for aluminium and aluminium products; world economic growth, including rates of inflation and industrial production; changes in the relative value of currencies and the value of commodity contracts; trends in Hydro’s key markets and competition; and legislative, regulatory and political factors. For a detailed description of factors that could cause our results to differ materially from those expressed or impliedby such statements, please refer to the risk factors specified under “Risk review – Risk factors” on page 134 of our Annual Report 2006 (including Form 20-F) and subsequent filings on Form 6-K with the US Securities and Exchange Commission.
No assurance can be given that such expectations will prove to have been correct. Hydro disclaims any obligation to update or revise any forward-looking statements, whether as a result of new information, future events or otherwise.
Cautionary note in relation to certain forward-looking statements

(3)
Hydro’s value proposition
• Leading integrated aluminium and energy company with global reach and attractive positions across the value chain
• Upstream cost position to be improved by the world-class Qatalum smelter
• Strong operational performance and cost focus
• Financial discipline
• Leading core technology and products
• Long-term prospects foraluminium remain encouraging
(4)
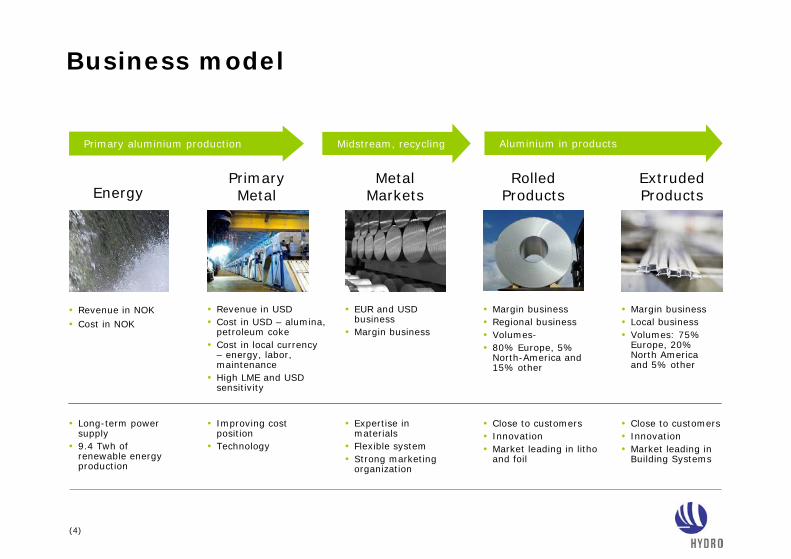
Business model
EnergyPrimary Metal
Rolled Products
Metal Markets
Extruded Products
• Revenue in NOK• Cost in NOK
• Long-term power supply
• 9.4 Twh of renewable energy production
• Revenue in USD• Cost in USD – alumina,
petroleum coke• Cost in local currency
– energy, labor, maintenance
• High LME and USD sensitivity
• Improving cost position
• Technology
• EUR and USD business
• Margin business
• Expertise in materials
• Flexible system• Strong marketing
organization
• Margin business• Regional business• Volumes-• 80% Europe, 5%
North-America and 15% other
• Close to customers• Innovation• Market leading in litho
and foil
• Margin business• Local business• Volumes: 75%
Europe, 20% North America and 5% other
• Close to customers• Innovation• Market leading in
Building Systems
Aluminium in productsPrimary aluminium production Midstream, recycling
(5)
0
1 000
2 000
3 000
4 000
5 000
6 000
7 000
Q1 08 Q2 08 Q3 08 Q4 08 Q1 09 Q2 09 Q3 09 Q4 09
LME IAI Nymex/TOCOM/Japan
Source: CRU/Hydro
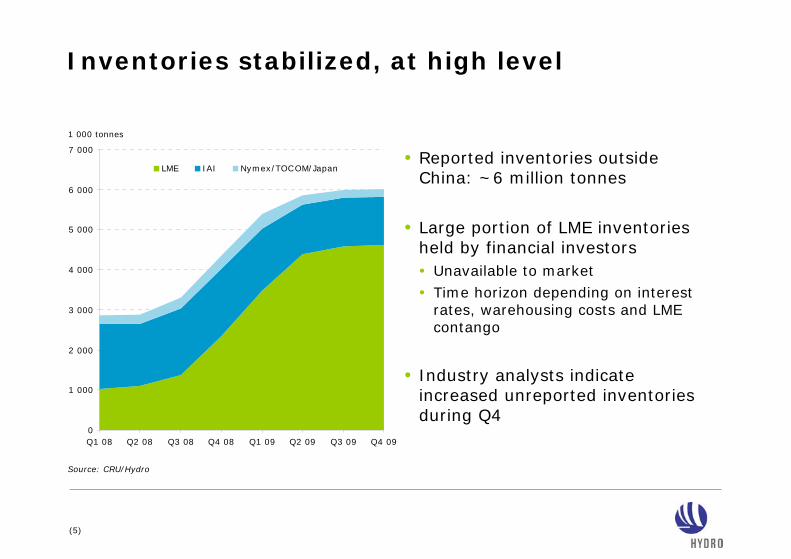
Inventories stabilized, at high level
1 000 tonnes
• Reported inventories outside China: ~6 million tonnes
• Large portion of LME inventories held by financial investors• Unavailable to market• Time horizon depending on interest
rates, warehousing costs and LME contango
• Industry analysts indicate increased unreported inventories during Q4
(6)
(350)(300)(250)(200)(150)(100)(50)
050
100
150200250300350400450500550600
Primary / alloyed Semis Fabricated Scrap Total
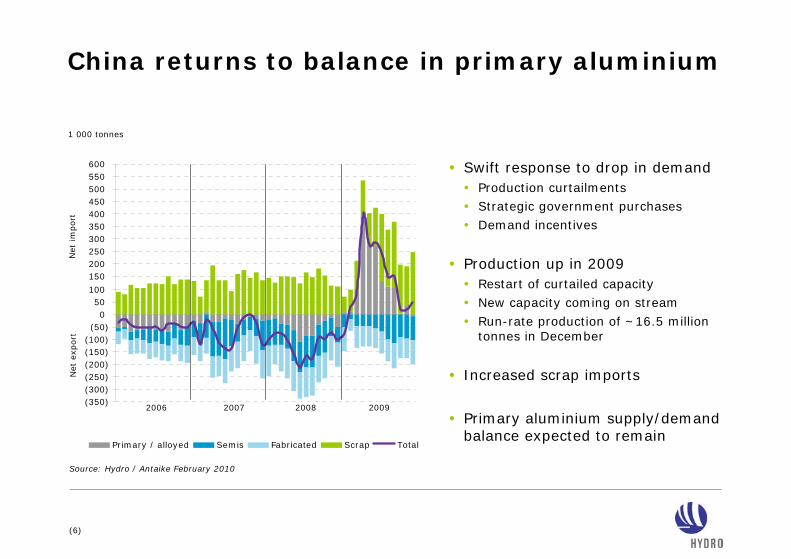
China returns to balance in primary aluminium
• Swift response to drop in demand• Production curtailments• Strategic government purchases• Demand incentives
• Production up in 2009• Restart of curtailed capacity• New capacity coming on stream• Run-rate production of ~16.5 million
tonnes in December
• Increased scrap imports
• Primary aluminium supply/demand balance expected to remain
Source: Hydro / Antaike February 2010
1 000 tonnes
Net
im
port
Net
exp
ort
2006 2007 2008 2009
(7)
0
2 000
4 000
6 000
8 000
10 000
12 000
14 000
16 000
18 000
20 000
22 000
24 000
26 000
28 000
30 000
Dec-07
Feb-08
Apr-08
Jun-08
Aug-08
Oct-08
Dec-08
Feb-09
Apr-09
Jun-09
Aug-09
Oct-09
Dec-09
Consumption Production
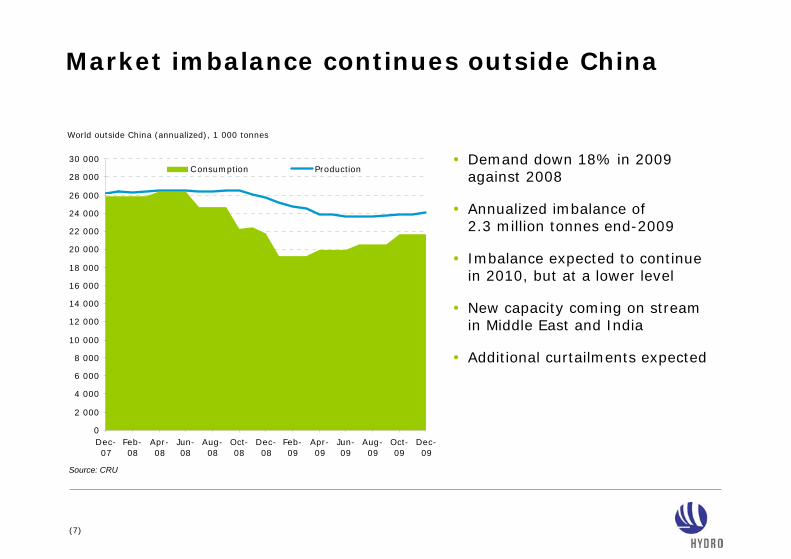
Market imbalance continues outside China
Source: CRU
World outside China (annualized), 1 000 tonnes
• Demand down 18% in 2009 against 2008
• Annualized imbalance of 2.3 million tonnes end-2009
• Imbalance expected to continue in 2010, but at a lower level
• New capacity coming on stream in Middle East and India
• Additional curtailments expected

(8)
Stable volumes
3%
-2%
-11%
5%9%
4%
RolledProducts
ExtrusionEurasia
BuildingSystems
ExtrusionAmericas
AutomotiveStructures
PrecisionTubing
Hydro’s downstream sales Q4 2009 vs Q3 2009
-7%
2%0%
-2%
Sheet ingot Extrusion ingot Foundry alloys Standard ingot
Hydro’s upstream sales Q4 2009 vs Q3 2009
2%
-18%
Q4 09 vs Q3 09 Acc 09 vs Acc 08
Total downstream sales
-17%
-2%
Q4 09 vs Q3 09 Acc 09 vs Acc 08
Total upstream sales
Seasonal decline offset by restocking in Q4 2009

(9)
Positive trend in underlying EBIT
389
554
-44
-211
-31
138192
421
Q1 2008 Q2 2008 Q3 2008 Q4 2008 Q1 2009 Q2 2009 Q3 2009 Q4 2009
Downstream (1
1 722
1 236984
17
-458 -558 -442
1 358
Q1 2008 Q2 2008 Q3 2008 Q4 2008 Q1 2009 Q2 2009 Q3 2009 Q4 2009
Upstream (2
1) Rolled Products and Extruded Products excluding Automotive Structures2) Energy, Primary Metal and Metal Markets
In NOK million
In NOK million
(10)
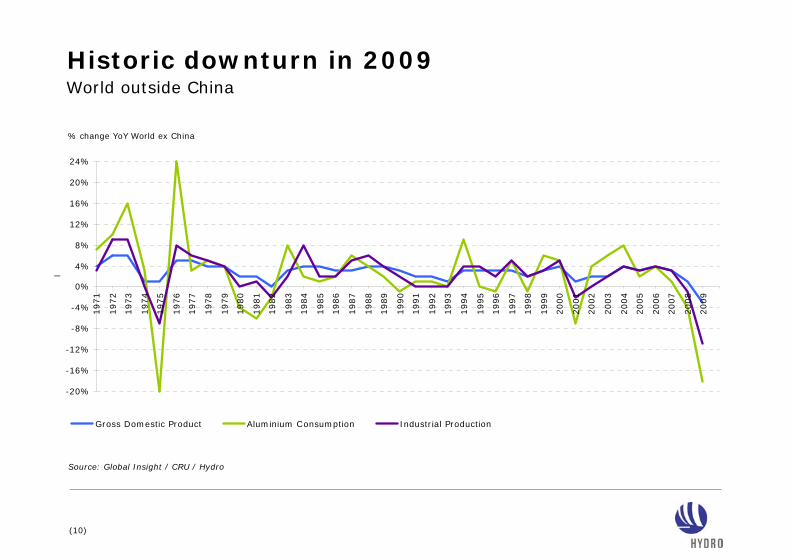
Historic downturn in 2009
-20%
-16%
-12%
-8%
-4%
0%
4%
8%
12%
16%
20%
24%
1971
1972
1973
1974
1975
1976
1977
1978
1979
1980
1981
1982
1983
1984
1985
1986
1987
1988
1989
1990
1991
1992
1993
1994
1995
1996
1997
1998
1999
2000
2001
2002
2003
2004
2005
2006
2007
2008
2009
Gross Domestic Product Aluminium Consumption Industrial Production
Source: Global Insight / CRU / Hydro
World outside China
% change YoY World ex China
(11)
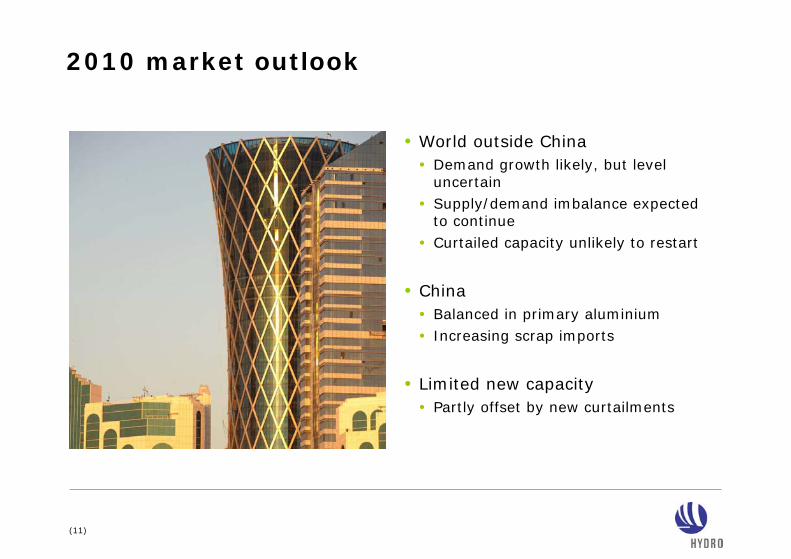
2010 market outlook
• World outside China• Demand growth likely, but level
uncertain• Supply/demand imbalance expected
to continue• Curtailed capacity unlikely to restart
• China• Balanced in primary aluminium• Increasing scrap imports
• Limited new capacity• Partly offset by new curtailments

(12)
Solid measures executed in 2009
• Operating capital reduced by NOK 5.8 billion• Capital expenditure plans cut by 50%• Manning reduced by 4 500• Redesigned and reduced staff and support functions
Hydro
ExtrudedProducts
RolledProducts
MetalMarkets
PrimaryMetal
• Cash costs reduced significantly• Primary aluminium production curtailed by 26%• Alumina production curtailed by 22%
• Utilized flexible remelt system to quicklyrespond to demand changes
• Significant cost savings and manning reductions• Inasa rolling mill divested
• Significant cost savings and manning reductions• Automotive Structures divested• Decision to close Adrian precision tubing plant

(13)
Further upstream improvements necessary
Calculation based on stable assumptions for LME, currencies, rawmaterial prices etc. Includes only fully consolidated smelters.
Ambitious plan to cut cost by 100 USD/tonne
0%
10%
20%
30%
40%
50%
60%
70%
80%
90%
100%
2010E 2011E 2012E
• Accelerate operational performance in Primary Metal production system• Improved current efficiency• Reduced power consumption• Reduced anode consumption
• Reduce fixed cost
• Lean operations
(14)
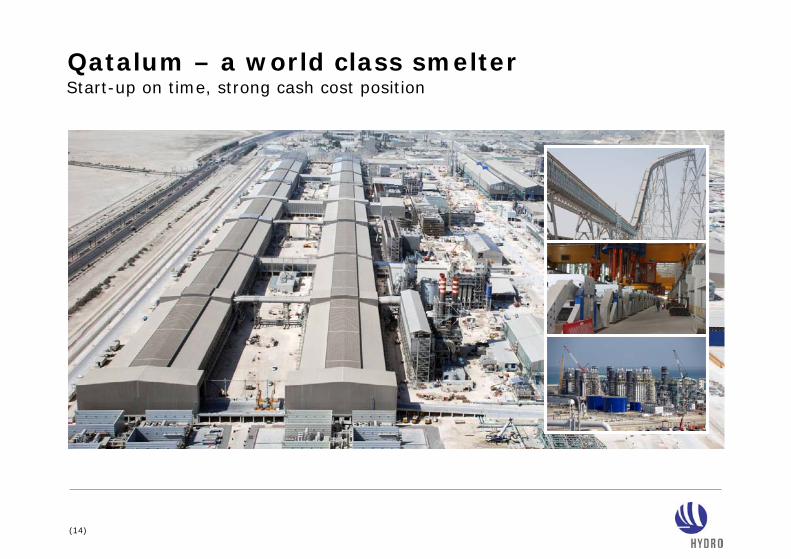
Qatalum – a world class smelterStart-up on time, strong cash cost position
(15)
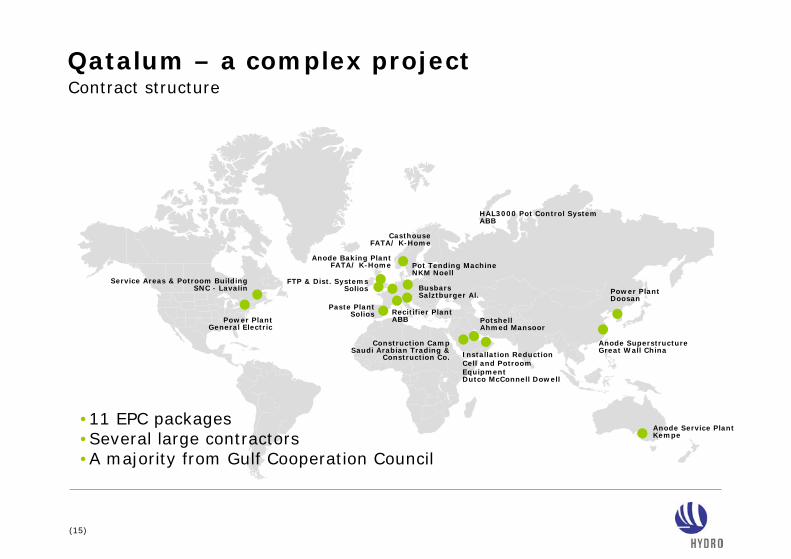
Qatalum – a complex project
Anode Service PlantKempe
Anode SuperstructureGreat Wall China
Power PlantDoosan
Construction CampSaudi Arabian Trading &
Construction Co.
PotshellAhmed Mansoor
Installation ReductionCell and Potroom EquipmentDutco McConnell Dowell
Power PlantGeneral Electric
Service Areas & Potroom BuildingSNC - Lavalin
CasthouseFATA/ K-Home
Anode Baking PlantFATA/ K-Home
Contract structure
BusbarsSalztburger Al.
Paste PlantSolios Recitifier Plant
ABB
HAL3000 Pot Control SystemABB
Pot Tending MachineNKM Noell
FTP & Dist. SystemsSolios
•11 EPC packages•Several large contractors•A majority from Gulf Cooperation Council

(16)
Qatalum – a complex projectContract structure - Safety
•84 million work hours•More than 20 000 workers at peak•LTI-rate 0.4•TRI-rate 2.9
(17)
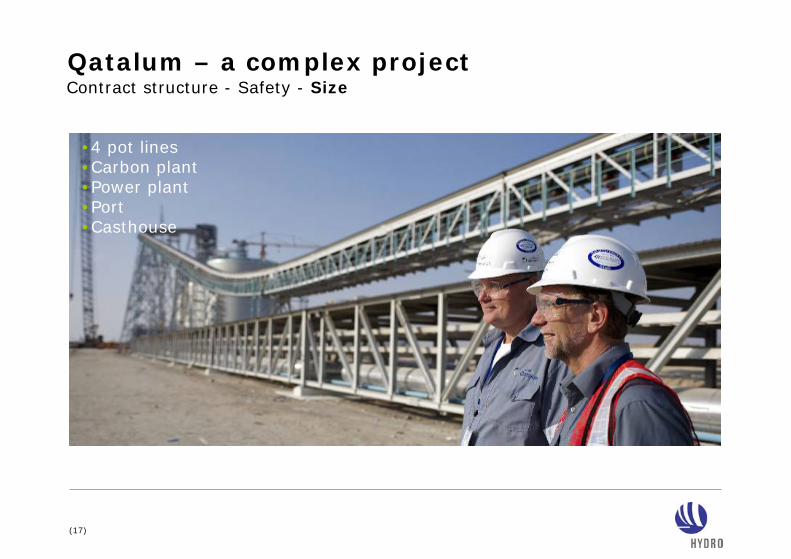
Qatalum – a complex projectContract structure - Safety - Size
•4 pot lines•Carbon plant•Power plant•Port•Casthouse
(18)
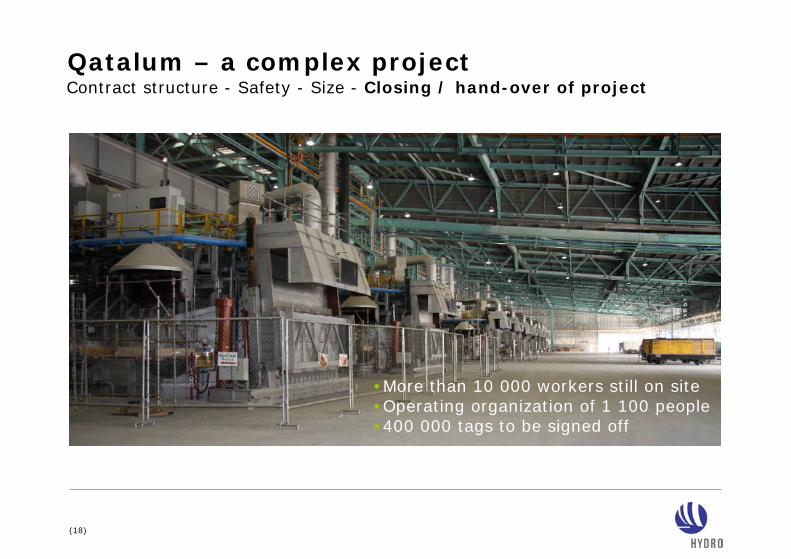
Qatalum – a complex projectContract structure - Safety - Size - Closing / hand-over of project
•More than 10 000 workers still on site•Operating organization of 1 100 people•400 000 tags to be signed off
(19)
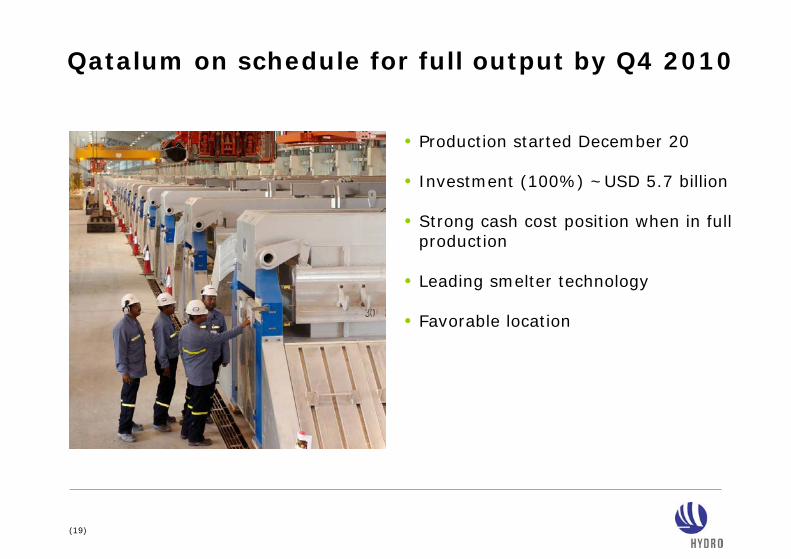
• Production started December 20
• Investment (100%) ~USD 5.7 billion
• Strong cash cost position when in full production
• Leading smelter technology
• Favorable location
Qatalum on schedule for full output by Q4 2010

(20)
US South East
US MidwestSouthern Europe/ Mediterranean JapanSouth
Korea
Thailand
Malaysia/SEAsia
ChinaQatar
IstambulLivorno/ Gaeta
BarcelonaSouthern Europe/ MediterraneanLisboa
GCC
India
Planned routes
North America
Hydro‘s metalsourcing system
NorwegianSystem
FromAustralia
Izmir
Qatalum target markets
Taiwan
Total 340 000 tonnes: 75% products & 25% standard ingotGlobal metal sales from Qatalum in 2010
(21)
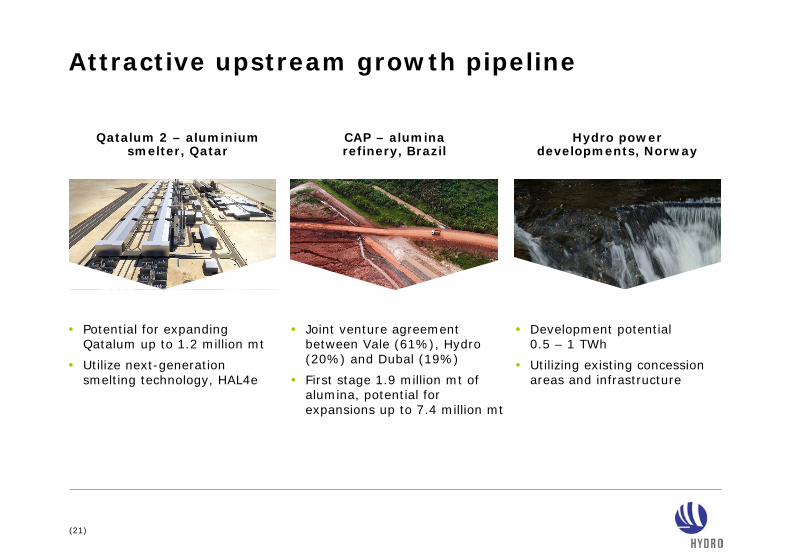
Attractive upstream growth pipeline
• Potential for expanding Qatalum up to 1.2 million mt
• Utilize next-generation smelting technology, HAL4e
• Development potential 0.5 – 1 TWh
• Utilizing existing concession areas and infrastructure
• Joint venture agreement between Vale (61%), Hydro (20%) and Dubal (19%)
• First stage 1.9 million mt of alumina, potential for expansions up to 7.4 million mt
Qatalum 2 – aluminium smelter, Qatar
CAP – alumina refinery, Brazil
Hydro power developments, Norway

(22)
Aiming for the next leap in primary technology
• 13.3 kWh/kg• 1.6 tonne CO2/tonne aluminium• Low diffuse emissions
• 12.8 kWh/kg• 1.5 tonne CO2/tonne aluminium• Benchmark GHG• Prepared for CO2 concentration
• Significantly lower kWh/kg• 0 tonne CO2/tonne aluminium• Simpler CO2 capture• New materials and cell design
HAL 300 HAL4eFuture technology vision
Next-generation
smelter

(23)
Capital expenditures
2008 2009E 2010E
Debt-financed investments in joint ventures (upstream)Investments QatalumOtherSustaining capex
NOK billion
~5.3*
~10.2
12.2
* Excluding net operating capital in Qatalum
• ~80% of 2009-2010 investments upstream
• Sustaining capex ~NOK 2.5-3 billion annually
• Qatalum• Project financed 1H 2009• Mainly equity financed 2H 2009• Equity contributions mainly from
partners in 2010
• Additional prospects not included• Holsbru power development• Selective growth in Extrusion and
Building Systems
(24)
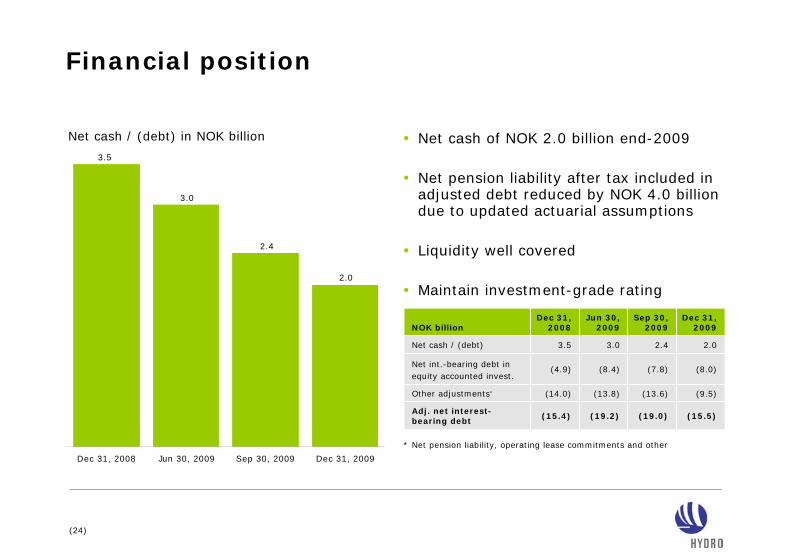
Financial position
• Net cash of NOK 2.0 billion end-2009
• Net pension liability after tax included in adjusted debt reduced by NOK 4.0 billion due to updated actuarial assumptions
• Liquidity well covered
• Maintain investment-grade rating2.0
2.4
3.0
3.5
Dec 31, 2008 Jun 30, 2009 Sep 30, 2009 Dec 31, 2009
Net cash / (debt) in NOK billion
(19.0)
(13.6)
(7.8)
2.4
Sep 30,2009
(8.0)(8.4)(4.9)Net int.-bearing debt in equity accounted invest.
(15.4)
(14.0)
3.5
Dec 31, 2008
(9.5)(13.8)Other adjustments*
(15.5)(19.2)Adj. net interest-bearing debt
3.0
Jun 30, 2009
2.0Net cash / (debt)
NOK billionDec 31,
2009
* Net pension liability, operating lease commitments and other

(25)
• Solid operations
• Reposition upstream business
• Qatalum ramp-up
• Stay close to markets
• Financial flexibility
• Proactive corrective measures
Priorities in 2010